Facilitating User-System Interaction: The GAIA Interaction Agent
Upload
khangminh22Category
view
0download
0
Marketing material for professional investors or advisers only.
19–23 October
Schroders Investment Conference
David Meyer
Founder and Portfolio Manager Contour Asset Management
Schroder GAIA Contour Tech Equity

Key differentiators, in summary
2
Unique approach, strong track record
Past performance is not a guide to future performance and may not be repeated. The value of investments and the income from them may go down as well as up and investors may not get back the amounts originally invested.Source: Contour, as at 30 September 2020. ¹Beta of peers chart provided by Morgan Stanley. ²’S&P 500’ = S&P 500 Net Total Return Index (Ticker: SPXNTR), this index is net of withholding tax.Correlation of Contour net monthly historical returns relate to the Contour tech equity long short strategy ‘Contour’ since inception and used for indicative purposes only. From 01 January 2018 onwards Schroder GAIA Contour Tech Equity C Acc USD has been used. Performance is shown net of fees, NAV to NAV. Year-to-date correlation based upon daily performance. Inception-to-date is based uponmonthly performance.
Beta (October 2010 – June 2020)¹
Low correlation to S&P 500²
0
0.1
0.2
0.3
0.4
0.5
0.6
0.7
Fund
4
Fund
8
Fund
5
Fund
2
Fund
1
Fund
7
Fund
6
Cont
our
Fund
3
Year-to-date Inception-to-date
Contour correlation to S&P 500 -0.01 0.15
Keen focus on alpha generation, with significant alpha contribution on both the long and short sides of the portfolio since inception
Low correlation, low net exposure and low beta compared to many peers – strive to perform in any market condition
Aim to invest in more idiosyncratic and under-owned names –not reliant on FANG stocks
Style agnostic rather than solely dependent on growth outperformance
Sector specialist advantage – dedicated resources, expertise
Historically stable anchor investor in Brummer & Partners

Portfolio Manager
3
David Meyer, CFAPrincipal and Portfolio Manager
21 years investment experience
Source: Contour, as at 30 September 2020.
1998 1999 2000 2001 2002 2003 2004 2005 2006 2007 2008 2009 2010 2011 2012 2013 2014 2015 2016 2017 2018 2019 2020
Northwestern University B.A. in Economics
Morgan Stanley Investment Management Brummer & Partners Contour Asset Management
Equity Analyst Covered software, IT services, and IT hardware companies
Technology Analyst (2004)Covered software and IT services for the Zenit Fund
Portfolio Manager (2005)Transitioned to the Manticore Fund (now solely managed by Contour), Long/Short TMT
Principal and Portfolio ManagerOctober 2010 – Present
Prior to the inception of Contour in 2010, David Meyer joined Brummer & Partners in 2004 as a technology analyst covering software and information technology ('IT'). In 2005, David became a senior member of the investment team managing the Manticore strategy, which is now solely managed by Contour. Before joining Brummer & Partners, David was an equity analyst within Morgan Stanley’s Investment Management Group from 1998 to 2004, where he was responsible for covering software, IT services, and IT hardware companies. David holds a B.A. in Economics from Northwestern University. Outside of the office, David is an avid skier and tennis player. He lives in Connecticut with his wife and their two children.

Organisational structure
4
Source: Contour, as at 30 September 2020.
David Meyer, CFAPrincipal and Portfolio Manager
Jennifer Brokaw
Director of Marketing
Michael Doody
Director of Operations
Alpa Rana, CPA
CFO and CCO
Joshua GoldbergHead Trader
Michael Tabaksblat
Trader
Trading Business Management
Director of Marketing
Tom Cahill
SoftwareRobotics/
AutomationMedia Video Games
Internet
Networking/CloudHardware
DatacentreSemis/Components
Mit ShahSector Head
Brian ThackraySector HeadSector Head
David ReisonSector HeadRyan Fiftal
Investment Management
AnalystTodd Cohen
AnalystSaaheb Sidana
Payments Horizontal coverage
VanessaHernandez
Office Manager
Patrick Murphy
Controller

Is now the time to invest in TMT?
5
Tech relative performance continues, but should also provide opportunities to identify the overvalued, crowded and more vulnerable companies
Source: Contour, Bloomberg. ND Index = NASDAQ 100 Index. SPX Index = S&P 500 Index.
3.5
3.0
2.5
2.0
1.5
1.0
0.5
0.01990 1992 1994 1996 1998 2000 2002 2004 2006 2008 2010 2012 20142012 2014 2016 2018 2020
ND Index/SPX Index

Contour tech equity long/short strategy track record
6
Performance since inception – keeping up with strong US market with lower net exposure, lower volatility
$1.8bnStrategy AUM
224.5%Cumulative composite net return since inception
12.5%Annualised net return since inception
+8.5%Average net exposure since GAIA fund inception
12.3%Annualised volatility since inception
-50%
0%
50%
100%
150%
200%
250%
300%
Sep 2010 Sep 2011 Sep 2012 Sep 2013 Sep 2014 Sep 2015 Sep 2016 Sep 2017 Sep 2018 Sep 2019 Sep 2020
Schroder GAIA Contour Tech Equity Strategy S&P 500 Net Total Return Index
Past performance is not a guide to future performance and may not be repeated. The value of investments and the income from them may go down as well as up and investors may not get back the amounts originally invested.Source: Schroders, as at 30 September 2020. Contour net monthly historical returns relate to the Contour tech equity long short strategy ‘Contour’ since inception and used for indicative purposes only. There may be differences between this fund and Schroder GAIA Contour Tech Equity. Schroder GAIA Contour Tech Equity may not hold the same positions in the same concentration and may at times under or over perform the Contour tech equity long short strategy. From 01 January 2018 onwards Schroder GAIA Contour Tech Equity C Acc USD has been used. Performance is shown net of fees, NAV to NAV. S&P 500 Net Total Return Index (Ticker: SPXNTR) is used, this index is net of withholding tax.

-35%
-30%
-25%
-20%
-15%
-10%
-5%
0%
5%
10%
15%
20%
25%
30%
Dec 2019 Jan 2020 Feb 2020 Mar 2020 Apr 2020 May 2020 Jun 2020 Jul 2020 Aug 2020 Sep 2020
Schroder GAIA Contour Tech Equity S&P 500 Net Total Return Index
Contour tech equity long short strategy
7
Positive year to date returns with low correlation to the US market
Past performance is not a guide to future performance and may not be repeated. The value of investments and the income from them may go down as well as up and investors may not get back the amounts originally invested.Source: Contour, as at 30 September 2020. Schroder GAIA Contour Tech Equity C Acc USD has been used. Performance is shown net of fees, NAV to NAV. ‘S&P500’ = S&P 500 Net Total Return Index (Ticker: SPXNTR) is used, this index is net of withholding tax. Correlation of Contour net monthly historical returns relate to the Contour tech equity long short strategy ‘Contour’ since inception and used for indicative purposes only year-to-date correlation based upon daily performance. Inception-to-date is based upon monthly performance.
+5.1%
Year-to-date Inception-to-date
Contour correlation to S&P 500 -0.01 0.15
+25.9%

Alpha/beta return since inception
8
Contour tech equity long short strategy alpha vs. beta (S&P 500 Net Total Return Index) return generation
Strong alpha generation since inception
-150%
-50%
50%
150%
250%
350%
450%
Oct 2010 Oct 2011 Oct 2012 Oct 2013 Oct 2014 Oct 2015 Oct 2016 Oct 2017 Oct 2018 Oct 2019
ITD Fund Alpha Rtrn ITD Fund Beta Rtrn
>89% of performance created is alpha
Past performance is not a guide to future performance and may not be repeated. The value of investments and the income from them may go down as well as up and investors may not get back the amounts originally invested.Source: Schroders, as at 30 September 2020. Chart uses inception to date realised beta. Contour net monthly historical returns relate to the Contour tech equity long short strategy ‘Contour’ since inception and used for indicative purposes only. There may be differences between this fund and Schroder GAIA Contour Tech Equity. Schroder GAIA Contour Tech Equity may not hold the same positions in the same concentration and may at times under or over perform the Contour tech equity long short strategy. From 01 January 2018 onwards Schroder GAIA Contour Tech Equity strategy has been used based on gross contribution to performance and have not applied any fees. S&P 500 Net Total Return Index (Ticker: SPXNTR) is used, this index is net of withholding tax.

-20%
-10%
0%
10%
20%
30%
40%
50%
2011 2012 2013 2014 2015 2016 2017 2018 2019 2020
Strong alpha generation since inception
9
Alpha generation vs. the S&P 500
Contour tech equity long short strategy alpha by year
Past performance is not a guide to future performance and may not be repeated. The value of investments and the income from them may go down as well as up and investors may not get back the amounts originally invested.Source: Schroders, as at 30 September 2020. Chart uses inception to date realised beta. S&P 500 = S&P 500 Net Total Return Index (Ticker: SPXNTR). Contour tech equity long short strategy ‘Contour’ since 2011 and used for indicative purposes only. There may be differences between this fund and Schroder GAIA Contour Tech Equity. Schroder GAIA Contour Tech Equity may not hold the same positions in the same concentration and may at times under or over perform the Contour tech equity long short strategy. From 01 January 2018 onwards Schroder GAIA Contour Tech Equity strategy has been used based on gross contribution to performance and have not applied any fees. Please note that 2010 is excluded as it was a stub year (3 months). 2010 generated negative total alpha and long alpha, and modestly positive short alpha. S&P Net Total Return: Underlying dividends are treated in the same manner as the fund: paid net of taxes for a fairer investor comparison.

Return in different market environments
10
Average monthly return – Contour vs. S&P 500 Net Total Return Index (sorted worst to best by S&P 500)
Performance during worst to best S&P 500 Net Total Return Index months
Past performance is not a guide to future performance and may not be repeated. The value of investments and the income from them may go down as well as up and investors may not get back the amounts originally invested.Source: Contour as at 30 September 2020. Contour net monthly historical returns relate to the Contour tech equity long short strategy ‘Contour’ since inception and used for indicative purposes only. There may be differences between this fund and Schroder GAIA Contour Tech Equity. Schroder GAIA Contour Tech Equity may not hold the same positions in the same concentration and may at times under or over perform the Contour tech equity long short strategy. From 01 January 2018 onwards Schroder GAIA Contour Tech Equity C Acc USD has been used. Performance is shown net of fees, NAV to NAV. S&P Net Total Return Index (Ticker: SPXNTR).
0.6%
-0.1%
0.5%
2.3% 1.9%
-4.5%
-0.2%
1.5%
2.8%
5.7%
-6%
-4%
-2%
0%
2%
4%
6%
8%
20% worst months Quintile 2 Quintile 3 Quintile 4 20% best months
Contour S&P 500 Net Total Return Index

-300%
-250%
-200%
-150%
-100%
-50%
0%
50%
100%
150%
200%
250%
300%
Oct
201
0
Jan
2011
Apr 2
011
Jul 2
011
Oct
201
1
Jan
2012
Apr 2
012
Jul 2
012
Oct
201
2
Jan
2013
Apr 2
013
Jul 2
013
Oct
201
3
Jan
2014
Apr 2
014
Jul 2
014
Oct
201
4
Jan
2015
Apr 2
015
Jul 2
015
Oct
201
5
Jan
2016
Apr 2
016
Jul 2
016
Oct
201
6
Jan
2017
Apr 2
017
Jul 2
017
Oct
201
7
Jan
2018
Apr 2
018
Jul 2
018
Oct
201
8
Jan
2019
Apr 2
019
Jul 2
019
Oct
201
9
Jan
2020
Apr 2
020
Jul 2
020
Gross Long Gross Short Net Gross
Historical exposure
11
Consistent portfolio construction over time
Source: Contour, Schroders as at 30 September 2020. Please note historic exposures shown are for the Contour tech equity long short strategy ‘Contour’ since inception and used for indicative purposes only. There may be differences between this fund and Schroder GAIA Contour Tech Equity. From 01 January 2018 onwards Schroder GAIA Contour Tech Equity exposures are shown.
Schroder GAIA Contour Tech Equity

Risk factors
12
Source: Schroders, as at 30 September 2020. S&P 500 = S&P 500 Net Total Return Index (Ticker: SPXNTR). Contour ate to the Contour tech equity long short strategy ‘Contour’ since inception and used for indicative purposes only. There may be differences between this fund and Schroder GAIA Contour Tech Equity. Schroder GAIA Contour Tech Equity may not hold the same positions in the same concentration and may at times under or over perform the Contour tech equity long short strategy. From 01 January 2018 onwards Schroder GAIA Contour Tech Equity strategy has been used based on gross contribution to performance and have not applied any fees.
Third party data is owned or licensed by the data provider and may not be reproduced or extracted and used for any other purpose without the data provider's consent. Third party data is provided without any warranties of any kind. The data provider and issuer of the document shall have no liability in connection with the third party data. The Prospectus and/or www.schroders.com contains additional disclaimers which apply to the third party data.Past performance is not a guide to future performance and may not be repeated. The value of investments and the income from them may go down as well as up and investors may not get back the amounts originally invested.
Risk considerationsCounterparty risk: the fund may have contractual agreements with counterparties. If a counterparty is unable to fulfil their obligations, the sum that they owe to the fund may be lost in part or in whole. Currency risk: the fund may lose value as a result of movements in foreign exchange rates. Derivatives risk – efficient portfolio management and investment purposes: derivatives may be used to manage the portfolio efficiently. A derivative may not perform as expected, may create losses greater than the cost of the derivative and may result in losses to the fund. The fund may also materially invest in derivatives including using short selling and leverage techniques with the aim of making a return. When the value of an asset changes, the value of a derivative based on that asset may change to a much greater extent. This may result in greater losses than investing in the underlying asset.Higher volatility risk: the price of this fund may be volatile as it may take higher risks in search of higher rewards.IBOR risk: the transition of the financial markets away from the use of interbank offered rates (IBORs) to alternative reference rates may impact the valuation of certain holdings and disrupt liquidity in certain instruments. This may impact the investment performance of the fund. Liquidity risk: in difficult market conditions, the fund may not be able to sell a security for full value or at all. This could affect performance and could cause the fund to defer or suspend redemptions of its shares. Market risk: the value of investments can go up and down and an investor may not get back the amount initially invested. Operational risk: operational processes, including those related to the safekeeping of assets, may fail. This may result in losses to the fund. Performance risk: Investment objectives express an intended result but there is no guarantee that such a result will be achieved. Depending on market conditions and the macro economic environment, investment objectives may become more difficult to achieve.Performance risk: investment objectives express an intended result but there is no guarantee that such a result will be achieved. Depending on market conditions and the macro economic environment, investment objectives may become more difficult to achieve.
Q3 2019 – Q3 2020 Q3 2018 – Q3 2019 Q3 2017 – Q3 2018 Q3 2016 – Q3 2017 Q3 2015 – Q3 2016
Schroder GAIA Contour Tech Equity 26.5% -7.0% – – –
Contour Tech Equity long short strategy 26.5% -7.0% 8.5% 32.0% 11.8%
S&P 500 Net Total Return 14.5% 3.6% 17.2% 17.9% 14.7%
0%
2,000%
4,000%
6,000%
8,000%
10,000%
12,000%
14,000%
16,000%
18,000%
20,000%
2004
2005
2006
2007
2008
2009
2010
2011
2012
2013
2014
2015
2016
2017
2018
2019
AMZN % Change GOOGL % Change NFLX % Change AAPL % Change CRM % Change
Why long short? Why lower net?
13
While the market has seen outsized returns in tech top performers…
Past performance is not a guide to future performance and may not be repeated. The value of investments and the income from them may go down as well as up and investors may not get back the amounts originally invested. For illustrative purposes only and should not be viewed as a recommendation to buy or sell.Source: Bloomberg, as at 31 March 2020.
+16,596% Netflix
+11,117% Apple
+4,719% CRM+4,854% Amazon
+2,631% Google

Why long short? Why lower net?
14
…there have been significant losers as well
Past performance is not a guide to future performance and may not be repeated. The value of investments and the income from them may go down as well as up and investors may not get back the amounts originally invested. For illustrative purposes only and should not be viewed as a recommendation to buy or sell.Source: Bloomberg, as at 31 March 2020.
-100%
-80%
-60%
-40%
-20%
00%
20%
40%
60%
80%
100%
2001 2003 2005 2007 2009 2011 2013 2015 2017 2019
Nokia % Change Kodak % Change MNI % Change
-99.9% McClatchy
-85.9% Nokia-99.9% Kodak

Why tech as a sector?
15
Top five US market caps in Tech vs. Financials over time (green names have remained in the top five)
Disruption in the tech sector has led to notable shifts in market leadership, creating alpha generative opportunities
Source: Contour as at 30 September 2020. For illustrative purposes only and should not be viewed as a recommendation to buy or sell.
2005 2019
Tech
1 Microsoft Apple
2 IBM Microsoft
3 Intel Alphabet
4 Cisco Amazon
5 Dell Facebook
Financials
1 Citigroup Berkshire Hathaway
2 Bank of America JPMorgan Chase
3 American International Group Bank of America
4 JPMorgan Chase Wells Fargo
5 Wells Fargo Citigroup

Investment framework
16
Research centric approach to generate alpha, incorporating top-down and bottom-up analysis
Source: Contour.
Top-down
Bottom-up
Evolving trends in technology include:– Artificial intelligence/machine learning– Software as a service– Migration of on-premise workloads to the public cloud– E-commerce– Shift from physical to digital video games– Digitisation of payments– Shift from analog to digital advertising– OTT content and new content distribution formats
Investment opportunities typically fall into one of three categories:– Projected winners and losers resulting from thematic
long term trends– Determining whether technological innovation brings a
growth opportunity or a structural risk to a company– Asset value vs. operational value mismatches– The market’s myopic focus on short-term vs. analysing
long-term value– Product cycle misunderstandings– Declining margins seen as a red flag when deeper
analysis reveals a forward-looking company investing in a promising technology

Process: idea generation
17
Top down approach to identity sector themes affecting multiple segments
Source: Contour.
Exchange information and ideas daily among Portfolio Manager and analysts covering different corners of the TMT space
Vet themes with industry contacts and management teams (both public and private)
Interact directly with consumer technologies/devices
Study history of technological innovation/trends to identify patterns, place new trends in perspective
– Attend industry conferences and analyst firm events
– Leverage industry analyst data, including engaging consultants such as Gartner, IDC, GFK and data providers suck as Yipit
– Conduct in-depth interviews with industry analysts and private company executives/contacts
– Consume publicly available content (blogs, books, 10-K/Q)
Examples: – Introduction of new smartphone user
authentication technology impacts smartphone component suppliers
– Digital downloads and microtransactions enable an evolution of video game business models
– Smartphone applications, artificial intelligence and natural language processing enable the digitisation of human-based processes
Identification Research Conclusion

Portfolio construction guidelines
18
Aims to limit downside risk and generate alpha in all market conditions
Number of positions
Investment horizon
Position sizing
Gross and net exposure
Investment universe
Concentration
– 50–100 positions
– Typically 20–30 long positions
– Typically 30–50 short positions
– Generally 6–24 months
– Maximum position 10% at market (Cayman fund operates with a 12% position maximum)
– Gross exposure: 150% to 250%
– Net exposure: -25% to +25%
– Global (predominantly US)
– Equity and related derivative instruments
– Top ten longs typically 50–60% of NAV
– Top ten shorts 30–40% of NAV (shorts are single name)

Regional exposure
19
North America:
85% Europe: 7%
Asia: 8%
Global Investment Universe¹Over $14 trillion
Over 800 names
Source: Contour, Schroders as at 30 September 2020. ¹Universe as defined by Contour. Excludes tech market caps under $1bn and excludes European telecom stocks. Please note that the countries highlighted broadly indicate regions rather than the specific countries where investments are made. For illustrative purposes only.
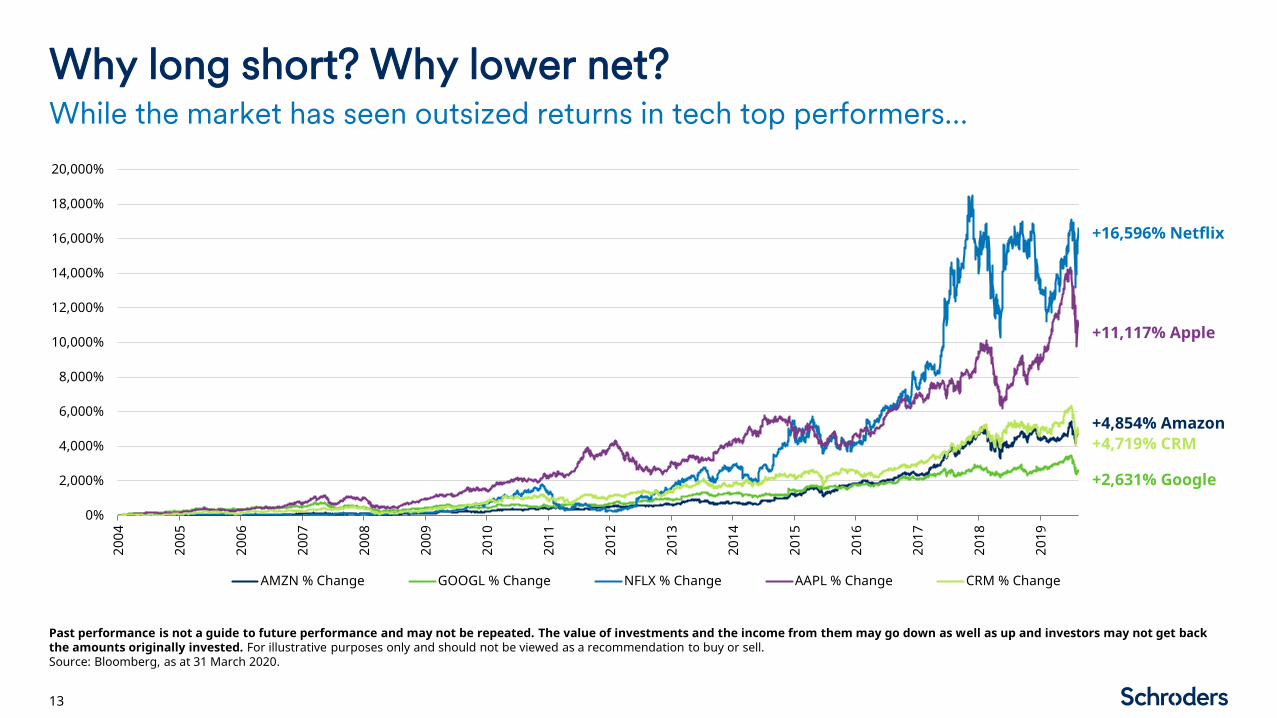
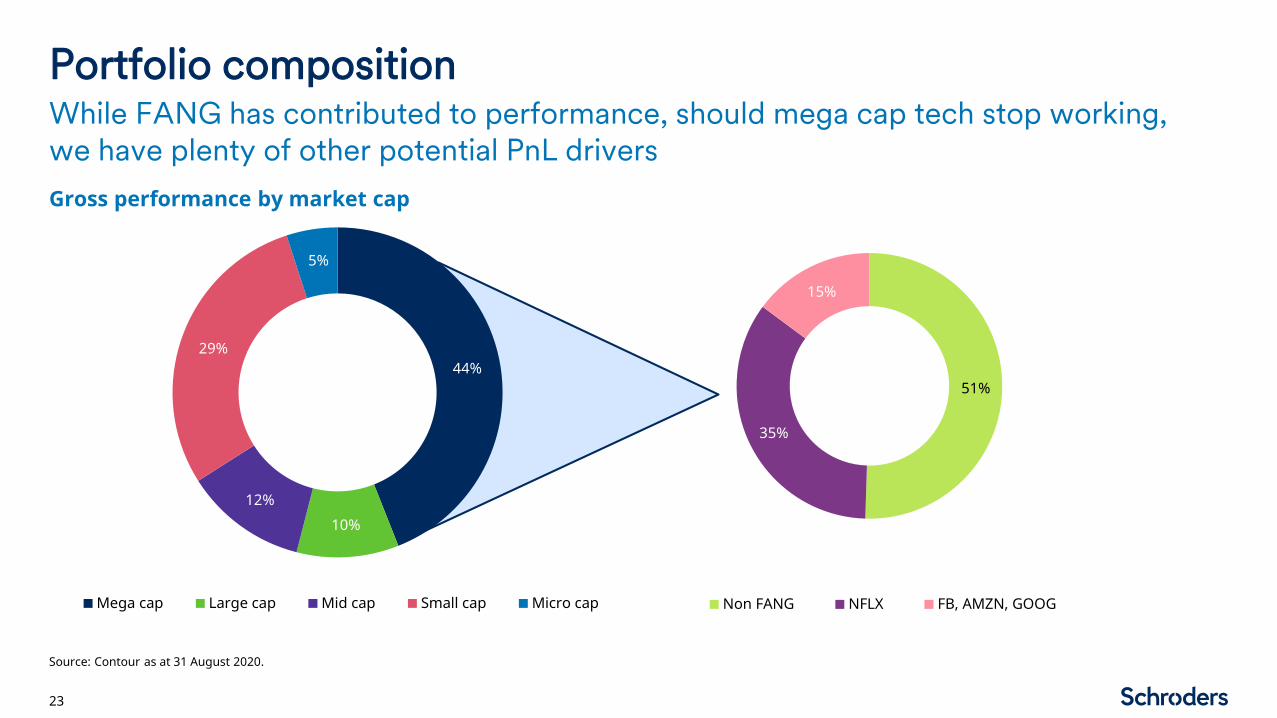
Sustainability of performance
20
Fund sub-sector attribution – broad range contributing to performance and varying by year
Past performance is not a guide to future performance and may not be repeated. The value of investments and the income from them may go down as well as up and investors may not get back the amounts originally invested. For illustrative purposes only and should not be viewed as a recommendation to buy or sell.Source: Schroders, Contour as at 30 September 2020. Netflix is included in Media. Sectors defined by Contour. Sector performance is gross of fees and expenses.
2013 2014 2015 2016 2017 2018 2019 2020 YTD
Internet26%
Software7%
Video Game Software4%
Semis8%
Internet14%
Tech Components4%
Software6%
Internet12%
Telecom10%
Tech Components2%
Internet3%
Software7%
Semis10%
Business Services3%
Video Game Software6%
Media11%
Media8%
Video Game Software0%
Semis3%
Video Game Software1%
Video Game Software8%
Other2%
Media5%
Semis5%
Software5%
Cable and Satellite0%
Media3%
Internet1%
Media5%
Video Game Software2%
Enterprise1%
Software5%
Cable and Satellite3%
Business Services/Fintech -1%
Telecom1%
Tech Components1%
Consumer Electronics3%
IT Services2%
Tech Components-1%
Fin Tech5%
Semis0%
Semis-1%
Tech Components1%
Consumer Electronics-1%
Software3%
Media1%
Fin Tech-1%
Video Game Software2%
Video Game Software-1%
IT Services-1%
Business Services/Fintech -1%
Enterprise-2%
IT Services1%
Fin Tech-1%
Semis-1%
Printing2%
Tech Components-1%
Media-1%
IT Services -1%
Business Services/Fintech -2%
Enterprise1%
Semis-3%
Other-2%
Business Services-2%
IT Services-2%
Internet-3%
Cable and Satellite-1%
Comm. Equipment-2%
Business Services/Fintech -1%
Enterprise-5%
Business Services-3%
Tech Components-3%
Business Services/Fintech -3%
Telecom-5%
Software-2%
Telecom-2%
Printing-2%
Software-7%
IT Services-4%
IT Services-8%

Diversity of performance
21
Top ten winners by year – range of sectors, styles and groups
Past performance is not a guide to future performance and may not be repeated. The value of investments and the income from them may go down as well as up and investors may not get back the amounts originally invested.Longs by ticker, shorts by subsector (bold), as defined by Contour. Individual name performance is gross of fees and expenses. The holdings identified do not represent all of the securities purchased or sold for the Contour strategy. For illustrative purposes only and should not be viewed as a recommendation to buy or sell.Source: Schroders, Contour as at 30 September 2020.
2011 2012 2013 2014 2015 2016 2017 2018 2019 2020 YTD
1 Comm equipment AAPL NFLX Education NFLX NVDA MRVL AMZN ZNGA Z
2 Media EBAY TMUS CNQR TMUS MRVL IAC Tech Components MRVL NUAN
3 Consumer Electronics LNKD YELP AVGO Tech
Components DWRE W NFLX ELLI HFGG
4 MA STX P FTNT Internet SYMC 7974 W QRVO GRUB
5 Education RAX LNKD TEMN EA GRUB AVGO Other NLOK AMZN
6 Comm equipment AZPN PCLN AAPL AVGO AVGO NFLX WDAY HFGG WDAY
7 IT Services Internet Z Telecom ATVI SHOP SHOP BusinessServices EA NFLX
8 MSTR Comm Equipment FB Internet SNDK PCLN ZNGA 9697 Z NLOK
9 RNOW Hardware XRO Video GameSoftware Enterprise EA GRUB IT Services DIS MRVL
10 AZPN JNPR 9984 FFIV AMZN HPE AMZN IAC FIVN PYPL

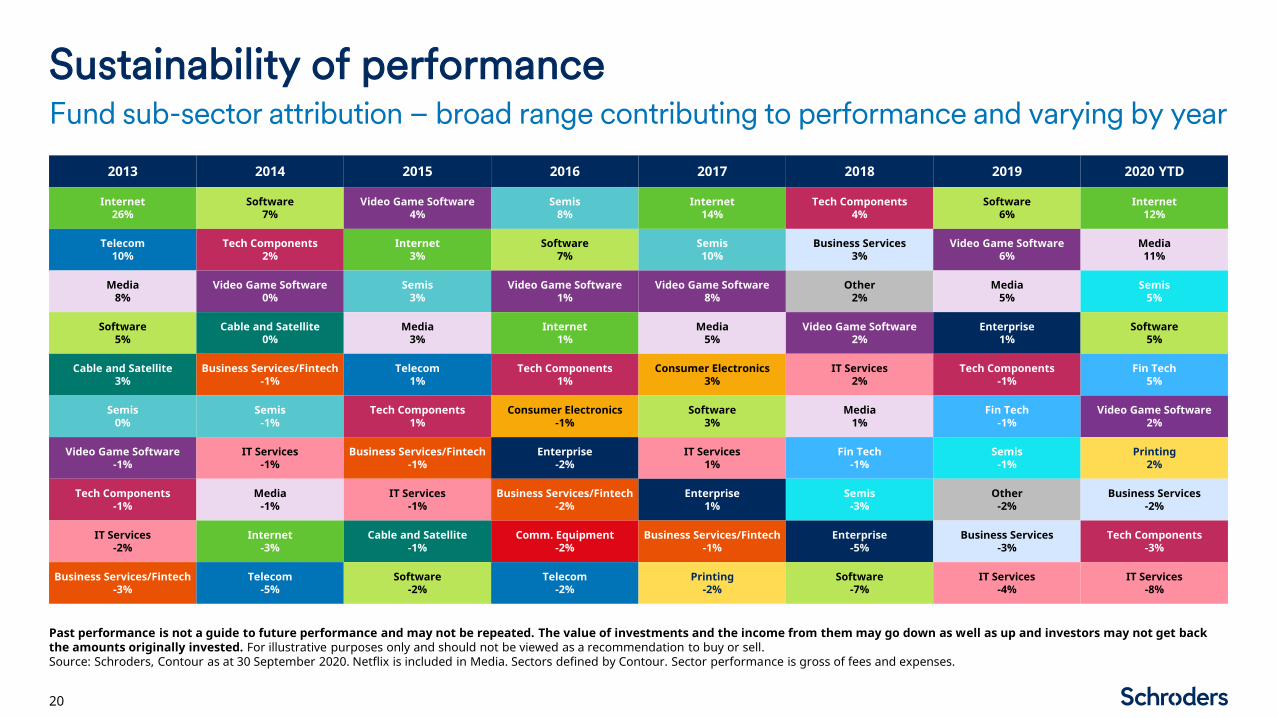
Portfolio composition
22
The portfolio contains a mix of both idiosyncratic thematic (though fundamental/ bottom-up) ideas
Source: Contour 31 August 2020.
Top 10 portfolio longs Thematic Idiosyncratic
Zillow
Nuance Communications
Workday
HelloFresh
NortonLifeLock
PayPal
Comcast
Trimble
Qorvo
New Relic
Portfolio composition
23
Gross performance by market cap
While FANG has contributed to performance, should mega cap tech stop working, we have plenty of other potential PnL drivers
Source: Contour as at 31 August 2020.
44%
10%12%
29%
5%
Mega cap Large cap Mid cap Small cap Micro cap
51%
35%
15%
Non FANG NFLX FB, AMZN, GOOG

Opportunity set
24
Consumer behaviour
Whether the pandemic fades quickly or slowly, behavioural changes will likely prove long lasting
Source: Contour as at 30 September 2020.
Corporate behaviour
Acceleration of retail shopping ecommerceTransformation of TV/entertainment online content consumptionAdaptation of restaurants online food delivery
Fixed cost structures variable cost structurePeople based processes digitisationOffice based culture work from home flexibility

Opportunity set – portfolio ‘theme’: change
25
We are drawn to companies that have experienced some kind of change – acquisition, divestiture, new management team – creating what is essentially a new, less well-understood company
Source: Contour, as at 30 September 2020. These names represent a subset of Contour’s long book. References to securities are for illustrative purposes only and not a recommendation to buy and/or sell.

Potential investor concerns
26
Source: Contour, as at 30 September 2020. These names represent a subset of Contour’s long book.
Potential investor concerns
Market bubble and elevated
valuations
Value rotationUS election
Regulatory environment

Appendix

Historical performance
28
Monthly net return since inception (after management and performance fees)
Past performance is not a guide to future performance and may not be repeated. The value of investments and the income from them may go down as well as up and investors may not get back the amounts originally invested.Source: Schroders, as at 30 September 2020. Contour net monthly historical returns relate to the Contour tech equity long short strategy 'Contour' since inception and used for indicative purposes only. There may be differences between this fund and Schroder GAIA Contour Tech Equity. Schroder GAIA Contour Tech Equity may not hold the same positions in the same concentration and may at times under or over perform the Contour tech equity long short strategy. From 01 Jan 2018 onwards Schroder GAIA Contour Tech Equity C Acc USD has been used. Performance is shown net of fees, NAV to NAV. ¹Index refers to the S&P 500 Net Total Return Index. S&P Net Total Return: underlying dividends are treated in the same manner as the fund: paid net of taxes for a fairer investor comparison.
Jan Feb Mar Apr May Jun Jul Aug Sep Oct Nov Dec YTD Index1
2020 1.4% 5.1% 3.5% 0.6% 5.2% 3.5% 1.7% 2.9% -0.3% 25.9% 5.1%
2019 1.2% 4.5% -1.7% 2.3% -0.5% 0.0% 2.0% 0.2% -1.1% -2.5% 2.1% 0.9% 7.3% 30.7%
2018 3.9% 2.1% -1.4% -2.0% 7.1% -2.5% 0.5% 0.0% 0.5% -10.3% -4.1% 1.2% -5.9% -4.9%
2017 5.8% 1.7% 3.8% 3.0% 9.6% -1.6% 2.9% 6.2% -1.6% 4.8% 1.4% -5.6% 34.0% 21.1%
2016 -0.1% -10.9% 0.0% -1.0% 3.8% 4.6% 3.6% 3.5% 3.2% 0.6% -1.2% -0.5% 4.7% 11.2%
2015 -1.3% 4.4% -0.3% -5.4% 8.8% 2.2% 1.5% -4.1% -1.7% -0.5% 0.6% 5.5% 9.4% 0.7%
2014 3.6% 1.8% -6.4% -7.3% 1.5% 0.4% -1.3% 3.3% -0.5% -4.5% -2.8% 4.7% -8.2% 13.0%
2013 6.6% 1.7% 0.1% -1.0% 4.3% 3.9% 2.4% 4.2% 6.0% 0.4% 1.9% 4.1% 40.1% 31.5%
2012 -0.2% 8.4% 2.4% -5.1% 0.1% -2.2% 3.8% 5.3% 0.5% -2.8% -1.4% -0.5% 7.6% 15.2%
2011 3.5% 4.5% -4.7% 5.9% -1.5% 1.2% 2.5% 2.0% 4.1% 3.6% -2.3% 1.2% 21.2% 1.5%
2010 0.7% -0.6% -0.9% -0.8% 10.6%

Contour tech equity long/short strategy
29
Performance attribution
Past performance is not a guide to future performance and may not be repeated. The value of investments and the income from them may go down as well as up and investors may not get back the amounts originally invested.Source: Schroders, Contour as at 30 September 2020. 'Contour' returns are related to the Contour tech equity long short strategy (Manticore fund) since inception, from 01 January 2018 Schroder GAIA Contour Tech Equity C Acc USD has been used, this is for indicative purposes only. For illustrative purposes only and should not be viewed as a recommendation to buy or sell. S&P Net Total Return: underlying dividends are treated in the same manner as the fund: paid net of taxes for a fairer investor comparison.
Schroder GAIA Contour Tech Equity
Contour – since launch
224.5% 240.6%
0%
100%
200%
300%
Contour S&P 500 Net Total Return Index
Since inception – net performance
25.9%5.1%
49.4%
-17.8%-30%
0%
30%
60%
Schroder GAIAContour Tech
Equity
S&P 500 Net TotalReturn Index
Long Equity Short Equity
YTD 2020 net performance YTD 2020 gross performance
Top 5 contributors 2020 by issuer Sector Gross contribution
Zillow Internet 8.4%
Nuance Communications Software 6.6%
HelloFresh Internet 4.8%
GrubHub Internet 3.8%
Amazon Internet 3.0%
Top 5 detractors 2020 by issuer Sector Gross contribution
Undisclosed Short Internet -4.8%
Undisclosed Short IT Services -4.7%
Undisclosed Short IT Services -3.7%
Undisclosed Short Software -3.2%
Xerox Printing -2.6%

Schroder GAIA Contour Tech Equity
30
Snapshot of exposures as at 30 September 2020
Source: Schroders as at 30 September 2020. Sectors and regions listed are for illustrative purposes only and should not be viewed as a recommendation to buy or sell.
Geographic exposure Sector exposure
Exposure analysis
Gross long equity 137.9%
Gross short equity -121.1%
Total gross exposure 259.1%
Total net exposure 16.8%
-200% -100% 0% 100% 200% -40% -20% 0% 20% 40% 60%
IT Services
Tech Components
Printing
Enterprise
Consumer Electronics
Video Game Software
Business Services
Fin Tech
Semis
Media
Internet
Software
Short Long
Americas
Europe
Asia

Schroder GAIA Contour Tech Equity
31
Top 10 long positions
Portfolio positioning
Source: Contour, as at 30 September 2020. Securities and sectors shown are for illustration purposes only and should not be considered a recommendation to buy or sell.
Top 5 short positionsCompany Sector % of NAV
Nuance Communications Software 9.2%
Zillow Internet 9.0%
HelloFresh Internet 8.2%
Workday Software 7.7%
NortonLifeLock Software 5.5%
PayPal Fin Tech 5.0%
Qorvo Semis 4.9%
News Corporation Media 4.8%
RingCentral Software 4.4%
Disney Media 4.4%
Sector % of NAV
Media -4.5%
Internet -4.0%
IT Services -4.0%
Software -3.9%
Media -3.6%

Schroder GAIA Contour Tech Equity
32
Key fund information
Source: Schroders as at 30 September 2020. Initial charge: percentages are stated with reference to the total subscription amount, which represents A shares 3.09% and C shares 1.01% of the net asset value per share. Investment management fee: percentages are stated with reference to the net asset value of the fund or the net asset value per share, as may be appropriate. The ongoing charges figure is as at 30 June 2020 and may vary from year to year. Please note ongoing charges include the above stated investment management fee.
Key features
Investment focus TMT sector-focused global equity long/short
Launch date 20 December 2017
Dealing frequency/cut-off Weekly on each Wednesday (or the next business day if a Wednesday is not a business day) and last business day of the month
Deal cut-off 13.00 Luxembourg time three business days preceding a dealing day
Settlement Three business days following a dealing day
NAV publication Daily on T + 1
Base currency USD
Available share classes (including ISIN)
A Acc USDLU1725199209
A Acc EUR HedgedLU1725200650
A Acc CHF HedgedLU1725202193
C Acc GBP HedgedLU1725201468
C Acc USD LU1725199621
C Acc EUR HedgedLU1725200817
C Acc CHF HedgedLU1725202359
Fund registration The fund is registered in the following jurisdictions: Austria, Belgium, Bulgaria, Denmark, Finland, France, Germany, Greece, Iceland, Ireland, Italy, Korea, Luxembourg, The Netherlands, Norway, Portugal, Singapore, Spain, Sweden, Switzerland, UAE and the UK
Share classes A C
Minimum initial subscription/minimum holding $10,000 $10,000
Initial charge Up to 3% Up to 1%
Investment management fee 2.00% 1.25%
Ongoing charge 2.42% 1.67%
Performance fee 20% subject to a High Water Mark 20% subject to a High Water Mark

Investment team biographies
33
Source: Contour, as at 30 September 2020.
Ryan FiftalSector Head
Brian ThackraySector Head
Mit ShahSector Head
David ReisonSector Head
Joshua GoldbergHead Trader
Michael TabaksblatTrader
Todd Cohen, CFAAnalyst
Saaheb SidanaAnalyst
Ryan Fiftal joined Contour in April 2017. Before joining Contour, he spent nine years at Morgan Stanley, most recently as an Executive Director in equity research covering U.S. Media/Cable/Satellite as part of a #1 II-ranked team. Prior to Morgan Stanley, Mr. Fiftal was an Associate at Oliver Wyman (formerly Mercer Management Consulting). Mr. Fiftal received a B.A. in Physics and Philosophy from Yale University and an MBA from the Stern School of Business at New York University.
Todd Cohen joined Contour Asset Management in January 2020. Before joining Contour, he was a Senior Vice President at Wolfe Research covering Payments, Processors and IT Services on the #1 II-ranked team. Prior to that, Mr. Cohen spent four years at Barclays as an equity research analyst covering the same sectors. Mr. Cohen graduated with a B.S. in Finance from the Kelley School of Business at Indiana University.
Joshua Goldberg joined Contour in August 2010. Before joining Contour, he served as the head trader for an event-driven fund within JANA Partners, LLC., from 2005 to 2010. Beginning in 2002, Mr. Goldberg was employed at Bear, Stearns & Co. Inc. as an equity derivatives trader and quantitative analyst. Mr. Goldberg graduated with a B.S. in Finance from Bentley College.
David Reison joined Contour in May 2014. Before joining Contour, he was an Investment Banking Analyst at Keefe, Bruyette & Woods in the Diversified Finance Group. Mr. Reison graduated with a BA in Economics and History from Williams College.
Mit Shah joined Contour in July 2012. From 2009 to 2012 he worked at Sanford C. Bernstein, where he was a member of the II-ranked #1 research team covering IT hardware companies. From 2000–2007, Mr. Shah held software engineering and management roles at Opsware, Inc. in Sunnyvale, California. Mr. Shah received an M.S. in Electrical Engineering from Stanford University and an MBA from The Wharton School of Business of the University of Pennsylvania.
Saaheb Sidana joined Contour Asset Management in February 2020. Before joining Contour, he was a Private Equity Associate at Insignia Capital Group and prior to that an Investment Banking Analyst in Mergers & Acquisition at Greenhill & Company. Mr. Sidana graduated with a BA in History and a concentration in Economics and Financial Markets from Dartmouth College.
Michael Tabaksblat joined Contour in March 2014. Before joining Contour, he served as an analyst at PAMLI Capital Management. Prior to PAMLI, he was an assistant trader for Ionic Capital Management, a relative value multi-strategy fund, from 2007 to 2012. Mr. Tabaksblat graduated with a B.A. in Pre Med and History, Minor in Business from the Macaulay/CUNY Honors College at Queens College.
Brian Thackray joined Contour in February 2018. Before joining Contour, he was a Sector Head at Blackrock, where he spent four years leading coverage of the information technology sector for their U.S. Growth funds. Prior to Blackrock, Mr. Thackray was a senior investment analyst at Citadel focused on the tech, media and telecom sector. From 2004–2011, Mr. Thackray was a senior equity analyst at Deutsche Bank following four years at Credit Suisse in an equity research and institutional sales capacity. Mr. Thackray graduated with a B.S. in Business Administration (concentration in Finance) and a B.S. in Economics from the University of Richmond.

Important note
It should be noted that the data provided herein is applicable to the Manticore Fund (Cayman) Ltd. ('Contour tech equity long short strategy') and is used for indicative purposes only. While the Schroder GAIA Contour Tech Equity fund will be managed in line with the Contour tech equity long short strategy, there will be differences between the funds, most notably as a result of compliance with the UCITS 5/10/40 rule. Schroder GAIA Contour Tech Equity may not hold the same positions in the same concentration and may at times under or over perform the Contour tech equity long short strategy. Based on a backward looking, pro forma analysis, we believe that at times, larger positions will need to be scaled down, creating some degree of tracking error in performance. Contour will employ pre-set rules to operationally lower exposures to comply with the 5/10/40 rule. Please contact Schroders for information on these rules and a detailed, illustrative analysis of backward looking differences in exposure and resultant tracking error. Past performance is not a guide to future performance and may not be repeated.
34
Important information (1 of 2) – European audience
Schroder GAIA
This presentation does not constitute an offer to anyone, or a solicitation by anyone, to subscribe for shares of Schroder GAIA (the 'Company'). Nothing in this presentation should be construed as advice and is therefore not a recommendation to buy or sell shares.
Subscriptions for shares of the Company can only be made on the basis of its latest Key Investor Information Document and prospectus, together with the latest audited annual report (and subsequent unaudited semi-annual report, if published), copies of which can be obtained, free of charge, from Schroder Investment Management (Europe) S.A.
An investment in the Company entails risks, which are fully described in the prospectus.
Past performance is not a reliable indicator of future results, prices of shares and the income from them may fall as well as rise and investors may not get the amount originally invested.
The authors have expressed their own views and opinions in this presentation and these may change.
Schroders will be a data controller in respect of your personal data. For information on how Schroders might process your personal data, please view our Privacy Policy available at www.schroders.com/en/privacy-policy or on request should you not have access to this webpage.
United Kingdom: Schroders will be a data controller in respect of your personal data. For information on how Schroders might process your personal data, please view our Privacy Policy available at www.schroders.com/en/privacy-policy or on request should you not have access to this webpage. Issued by Schroder Investment Management Limited, 1 London Wall Place, London EC2Y 5AU. Registered Number 1893220 England. Authorised and regulated by the Financial Conduct Authority.
European Union/European Economic Area: this presentation is issued by Schroder Investment Management (Europe) S.A., 5, rue Höhenhof, L-1736 Senningerberg, Luxembourg. Registered No. B 37.799.
France: the Company is created under Luxembourg law and is complying with the Directive 2009/65/CE (UCITS). The Company and some of its compartment have been authorised for distribution in France by the AMF.
35

Important information (2 of 2) – European audience
Austria: Further fund-specific information can be obtained from the key investor information in the current version and the current Sales Prospectus, which are available free of charge in paper form in German from the Austrian Paying Agent (Raiffeisen Bank International AG, Am Stadtpark 9, A-1030 Vienna, Austria) and in German from Schroder Investment Management (Europe) S.A., German Branch, Taunustor 1, D-60310 Frankfurt am Main [information agent only]). In addition, a current version of the key investor information is available at www.schroders.at. Investments in the Company are associated with risks that are described in more detail in the key investor information and the Sales Prospectus.
Germany: Further fund-specific information can be obtained from the key investor information in the current version and the current Sales Prospectus, which are available free of charge in paper form in German from the Paying and Information Agents in Germany (UBS Deutschland AG, OpernTurm, Bockenheimer Landstraße 2–4, D-60306 Frankfurt am Main and Schroder Investment Management (Europe) S.A., German Branch, Taunustor 1, D-60310 Frankfurt am Main [information agent only]). In addition, a current version of the key investor information is available at www.schroders.de. Investments in the Company are associated with risks that are described in more detail in the key investor information and the Sales Prospectus.
Greece: UCITS funds do not have a guaranteed performance and previous performance does not guarantee the future performance. OI OΣΕΚΑ ΔΕΝ ΕΧΟΥΝ ΕΓΓΥΗΜΕΝΗ ΑΠΟΔΟΣΗ ΚΑΙ ΟΙ ΠΡΟΗΓΟΥΜΕΝΕΣ ΑΠΟΔΟΣΕΙΣ ΔΕΝ ΔΙΑΣΦΑΛΙΖΟΥΝ ΤΙΣ ΜΕΛΛΟΝΤΙΚΕΣ.
Switzerland: The Schroder GAIA ('Company') is an open-ended investment company organised as a 'société anonyme' under the laws of the Grand Duchy of Luxembourg and qualifies as a Société d’Investissement à Capital Variable ('SICAV') and as an alternative investment fund within the meaning of article 1 (39) of the 2013 Law. The prospectus and the key investor information document(s) for Switzerland, the articles of association, the annual and semi-annual reports can be obtained, free of charge, at the offices of the Swiss representative, Schroder Investment Management (Switzerland) AG, Central 2, CH-8001 Zurich and the Swiss paying agent, Schroder & Co. Bank AG, Central 2, CH-8001 Zurich, both authorised and regulated by the Swiss Financial Market Supervisory Authority FINMA.
Please note not all funds are registered in all jurisdictionsFor Russian Qualified Investors only: None of the sub-funds mentioned in the conference agenda are registered in Russia
36

Important information (1 of 1) – Singapore audience
The information in this presentation (the ‘Presentation’) is only for institutional investors based in Singapore.
Potential investors should be aware that such investments involve market risk and should be regarded as long-term investments.
Derivatives carry a high degree of risk and should only be considered by sophisticated investors.
Investors may wish to seek advice from a financial adviser before purchasing units of any Fund. In the event that the investor chooses not to seek advice from a financial adviser, he should consider whether the Fund in question is suitable for him. Investors should read the prospectus, available from Schroder Investment Management (Singapore) Ltd or its distributors, before deciding to subscribe for or purchase units in any Fund. Funds may carry a sales charge of up to 5%.
This Presentation has not been reviewed by the Monetary Authority of Singapore.
Schroder Investment Management (Singapore) Ltd 138 Market Street #23–01 CapitaGreen Singapore 048946 Telephone: +65 6534 4288 Fax: +65 6536 6626 Registration No.: 199201080H
37

Important information (1 of 1)– UAE audience
Schroder Investment Management Limited (Dubai Branch) is located in the Office 506, Level 5, Precinct Building 5, DIFC, Dubai, PO Box 506612 United Arab Emirates and is regulated by the Dubai Financial Services Authority (DFSA).
This document is not subject to any form of regulation or approval by the DFSA. The DFSA has no responsibility for reviewing or verifying any Prospectus or other documents in connection with this Fund. Accordingly, the DFSA has not approved any associated documents nor taken any steps to verify the information set out in the Prospectus for the fund, and has no responsibility for it. This document is intended to be for information purposes only and it is not intended as promotional material in any respect. This document is intended for professional investors only as defined by the DFSA rules which can be accessed from their website www.dfsa.ae
The Units to which this document relates may be illiquid and/or subject to restrictions on their resale. Prospective purchasers should conduct their own due diligence on the Units. If you do not understand the contents of this document, you should consult an authorized financial advisor.
The Securities and Commodities Authority assumes no liability for the accuracy of the information set out in this document, nor for the failure of any persons engaged in the investment fund in performing their duties and responsibilities. The relevant parties whose names are listed in the relevant documents shall assume such liability, each according to their respective roles and duties. If you do not understand the contents of this document, you should consult an authorized financial advisor.The Fund/s are only being offered to a limited number of Qualified investors in the UAE as per Article 2 clause 3 of the SCA decision 3 R/M of 2017.
38

Important information (1 of 1) – Israel audience
Note regarding the Marketing material for Qualified Clients or Sophisticated Investors only.
This communication has been prepared by certain personnel of Schroder Investment Management (Europe) S.A (Registered No. B 37.799) or its subsidiaries or affiliates (collectively, "SIM"). Such personnel are not licensed by the Israeli Securities Authority. Such personnel may provide investment marketing, to the extent permitted and in accordance with the Regulation of Investment Advice, Investment Marketing and Investment Portfolio Management Law, 1995 (the "Investment Advice Law"). This communication is directed at persons (i) who are Sophisticated Investors (ii) Qualified Clients ("Lakoach Kashir") as such term is defined in the Investment Advice Law; and (iii) other persons to whom it may otherwise lawfully be communicated. No other person should act on the contents or access the products or transactions discussed in this communication. In particular, this communication is not intended for retail clients and SIM will not make such products or transactions available to retail clients.
39
Copyright © 2022 FDOKUMEN