
School Violence - Law Enforcement Executive Forum
163
T e n t r a i n i n e m g a n c d t n f o r S a E n d w a a r L d s s i B o o n a i l r l I d E t e x e c u t i v e n s t i t u I Law Enforcement Executive School Violence Vol. 12, No. 4 • December 2012
-
Upload
khangminh22 -
Category
Documents
-
view
3 -
download
0
Transcript of School Violence - Law Enforcement Executive Forum

Tent raininem
g anc d
t
nf
or S
a
E
nd
w a
a r
L
ds
si B
o o
n a
i l r
lI d
E texecutive nstituI
Law Enforcement Executive
School Violence
Vol. 12, No. 4 • December 2012

Law Enforcement Executive Forum Illinois Law Enforcement Training and Standards Board Executive Institute
Western Illinois University 1 University Circle
Macomb, IL 61455-1390www.ILETSBEI.com
Senior EditorThomas J. Jurkanin, PhD
EditorsVladimir A. Sergevnin, PhD, and Susan C. Nichols, MS Ed.
Associate EditorsJennifer M. Allen, PhD
Department of Political Science and Criminal Justice, North Georgia College and State UniversityBarry Anderson, JD
Professor, School of Law Enforcement and Justice Administration, Western Illinois UniversityTony A. Barringer, EdD
Division of Justice Studies, Florida Gulf Coast UniversityMichael J. Bolton, PhD
Chair, Department of Criminal Justice and Sociology, Marymount UniversityBecky K. da Cruz
Criminal Justice and Law and Society, Armstrong Atlantic State UniversityJose de Arimateia da Cruz
Political Science and Comparative Politics, Armstrong Atlantic State UniversityLarry Hoover, PhD
Director, Police Research Center, Sam Houston State UniversityWilliam Lewinski, PhD
Director, Force Science Research Center, Minnesota State UniversityHyeyoung Lim, PhD
Assistant Professor, School of Law Enforcement and Justice Administration, Western Illinois UniversityWilliam McCamey, PhD
Professor, School of Law Enforcement and Justice Administration, Western Illinois UniversityStephen A. Morreale, DPA
School of Public Policy and Administration/Criminal Justice, Walden UniversityGregory Boyce Morrison
Department of Criminal Justice and Criminology, Ball State UniversityDeborah W. Newman, JD, EdD
Professor and Chair, Department of Criminal Justice, Middle Tennessee State UniversityMichael J. Palmiotto
Professor, Criminal Justice, Wichita State UniversityWayne Schmidt, LL.M., JD
Director, Americans for Effective Law EnforcementAaron Thompson, PhD
Department of Sociology, Eastern Kentucky UniversityBrian N. Williams, PhD
School of Public and International Affairs, University of Georgia

LawEnforcementExecutiveForum•2012•12(4)
Editorial ProductionDocument and Publication Services, Western Illinois University, Macomb, Illinois
The Law Enforcement Executive Forum is published online four times per year by the Illinois Law Enforcement Training and Standards Board Executive Institute located at Western Illinois University in Macomb, Illinois.
ISSN 1552-9908
No part of this publication may be reproduced without written permission of the publisher.
DisclaimerReasonable effort has been made to make the articles herein accurate and consistent. Please address questions about individual articles to their respective author(s).

Law Enforcement Executive Forum • 2012 • 12(4)
Table of Contents
Editorial ................................................................................................................................................ iThomas J. Jurkanin
What If? Preparing Schools and Communities for the Unthinkable ....................................... 1Ronald D. Stephens
Neighborhood Disorganization, Exposure to Violence in School, and Behavioral Health in a Population of Juvenile Justice-Involved Youth .................................................... 8Fredrick ButcherJeff M. KretschmarDaniel J. FlanneryMark I. Singer
School Safety: An Assessment of School Resource Officer Programs from the Perspective of School Personnel ............................................................................................. 22James P. Koch
Analysis of Crisis Management Planning in Illinois Public Schools ...................................... 50Patrick Mark Twomey
When, What, and Where Is the First Line of Defense Against Anti-Social Behaviors? ....... 54Barry S. McCraryChristine J. AndersonBonny M. Mhlanga
CrimePolicing and the Mentally Ill: A Review of the Literature ......................................................... 64
Michael P. Brown
Can Cops Prevent Murder? Causes and Remedies for Homicide in the City of Chicago ...................................................................................................................... 74Arthur J. Lurigio
Proceed with Caution: Police Use of GIS for Crime Hotspot Analysis ................................... 83MoonSun KimMelchor C. de Guzman
Use of ForceToward Taser™ Regulation: A Content Analysis of Print Media on Taser™-Related
Deaths ................................................................................................................................................. 95Lee M. WadeKelly Ann Cheeseman

LawEnforcementExecutiveForum•2012•12(4)
CorrectionsThe Alternatives to Detention for Federal Detainees: The Criminal Justice Action
Research Project ................................................................................................................................ 107Danielle T. Harrington
Implementation of Alternative Delivery of Annual Training for Corrections Officers ....... 121Sherry L. Hunter
International Are Judges Under Stress? A Case of Slovenia in the Contemporary Crime Society ............. 139
Peter UmekMonica GuzmanJerneja ŠifrerBojan Dobovšek
Materials/publications are available through the Illinois Law Enforcement Training and Standards Board Executive Institute.
Law Enforcement Executive Forum • 2012 • 12(4) i
Editorial
The Newtown Tragedy*As one young teacher told her 15 elementary students when locked down and secluded behind the door of the class bathroom, under attack by a gun-wielding insane offender, “The bad guys are out there now, but the good guys are coming.” Imagine students, too young to understand what was going on, and consider the wisdom and courage of the teacher, a “mother-like” protector just 29 years of age. And, finally, con-sider the faith and respect that this teacher’s statement connotes for law enforcement officials.
The concept of “Good vs. Evil” is well understood by most people. We know that there are terrorist killers whose motives are related to political and religious ideology; we know that there are psy-chotics and evil men and women who kill for the pleasure of killing—such as serial killers; we know that there are those who kill because of jealousies related to marital, family, and interpersonal rela-tionships; we know that there are those who kill to gain financial advantage; and we know that there are those who kill because they are involved in the culture of gang violence. What we understand least of all is the killing of children, and in this case, 20 children—an unfathomable, tragic event.
Let us never forget the baby-faced innocence of the 6- to 7-year-old children who were deprived of their chance to live. These children, accustomed to a lifestyle of play and pretend, were abruptly introduced to the reality and evil of life; but these victims were not given the opportunity to under-stand the demise of their life. Even if they would have been told of their fate the day before they died, they would not have had the intellectual capacity to understand the concept of dying. And, so, they faded away on the morning of Friday, December 14, 2012, with no concept as to why. And the reality is that even mature and intelligent adults and highly trained mental health profes-sionals are at a loss to explain the mayhem.
It is a fact that Adam Lanza, the person respon-sible for killing 26 people—six administrators and teachers, and 20 elementary school children—was a disturbed loner. Was he evil, was he dis-turbed, or both? Was he living in reality or was he
delusional? Do we define this person as a monster or as a person who was suffering unimaginable mental torment? These are the crucial questions that remain unanswered. As we say goodbye to the victims, the whole world grieves.
Is it possible to better understand loners like Lanza and the factors that led them to kill? Is it possible to better secure our schools? Is it possible to imple-ment gun-control policies that would mitigate or prevent future attacks? Is it possible to better pro-tect our children? These are discussions that will take place in the months to come.
Public policy and political action related to gun control has been stymied by a broad interpretation of the Second Amendment regarding the “right to bear arms.” Will the Newtown tragedy represent a “tipping-point” for political action in the form of further control of gun ownership in America?
President Obama and many political leaders are now calling for expedited federal legislation to ban the sale of military-assault weapons and high-capacity ammunition clips. This is a limited response, which I am not sure will be effective. First, it will be difficult to overcome the power and political influence ($$$$) of the Pro-Gun Advocacy Groups; and second, public opinion regarding enhanced federal restriction on gun ownership is split. This has always been, and will remain, a highly controversial public policy issue.
What is more important is for government at all levels to focus on the broader issue of violence and murder in America. It is not disputed that the Newtown incident was tragic and, as a result, received around-the-clock international news coverage.
However, what is not widely understood by the majority of American citizens, political leaders, and/or the media is that this type of violence, and the resulting injury and death, occurs every day in America and has not been addressed in a respon-sible manner at the local, state, or national levels. I am referring to the gang violence that exists in every major American city on a daily basis. We have a national health epidemic of young, primarily minor-ity youth killing each other (as well as innocent

ii Law Enforcement Executive Forum • 2012 • 12(4)
victims), with the number of casualties mounting to thousands of deaths per year. This problem has not been a focus of extensive public policy debate.
In the wake of the Sandy Hook Elementary School massacre, Senator Joe Lieberman proposed the estab-lishment of a national commission to study violence in America. This is a good idea. Complacency regard-ing national violence is partially responsible for the events that occurred in this quiet Connecticut town.
How do we respond to the epidemic of violence that permeates our society? This is a complicated, multi-faceted issue that can only be solved through focused research, deliberation, partnership, and strong gov-ernment leadership. The national commission pro-posed by Senator Lieberman is a good starting point.
Returning to the narrower issue, there are many solutions for impacting a reduction in school shoot-ings. The following are three recommendations, admittedly limited in scope but offered as a begin-ning agenda, to be expanded upon, based upon further discussion, consideration, and analysis:
1. Environmental Design 1 – All schools need to implement secure procedures for school entry. This should include the use of sign-in, monitoring, and scanning procedures such as CCTV (closed-circuit television) monitors in the schools and the use of biometric technolo-gies. (Biometric technologies involve iris, facial recognition, and fingerprint scans to identify individuals who are approved for access to the building; these technologies are currently being employed with success in the fight against terrorism.)
2. Environmental Design 2 – One of the most impor-tant considerations in securing schools has to do with egress. Most all school classrooms are environmentally confined, meaning there is only one way out—usually through a door leading into the hallway. This has to change. School classrooms must be designed to have an emergency exit door to the school yard, locked from the outside but available with a push bar to exit. It is well-recognized that the best chance for survival in “active shooting” incidents is to “run”—get out. In no case should we allow the perpetrators to control the environment and movement.
3. Armed School Employees – This recommendation may be a matter of controversy, but I contend that it is absolutely necessary. It should be man-dated by each state legislature that at least two school officials must be authorized, trained, and required to possess a firearm in connection with their official duties. It should also be required that one of the two firearm-licensed officials be on school property grounds during the time students are on school property. We cannot leave school officials unarmed and unable to defend themselves, their staffs, and their stu-dents. As we learned in the Newtown tragedy, the school principal and school psychologist confronted the offender without the advantage of weaponry, and both died as a result. What if they would have been armed? Sometimes, as the minutes and seconds count down, we cannot wait for the police to respond. Just as we train civilians to be police officers, capable of using deadly force, we can train capable “school guardians” with the same set of skills and capabilities.
The recommendations cited above are not intended to be the end-all solutions to school violence. What I am proposing here is transforming “soft targets” into “hard targets.”
I did not address issues of mental illness, primarily because I do not believe that we can predict with any level of accuracy who will act out at any given time. That being said, we must ensure that mental health services are fully available for those who are in need; at the current time, this is not the case in many communities.
School violence and the broader issue of violence in America must take center stage in public policy discussions to be addressed at the local, state, and federal levels. This issue is not simply a problem related to guns and crime; rather, it is a national epidemic of violence, with too many young people dying too soon.
Thomas J. Jurkanin, PhD Senior Editor
*The opinions expressed in this Editorial solely repre-sent the views of the author and are not intended to rep-resent the views of the Law Enforcement Executive Forum or associated entities or agencies.

Law Enforcement Executive Forum • 2012 • 12(4) 1
What If? Preparing Schools and Communities for the UnthinkableRonald D. Stephens, EdD, Executive Director, The National School Safety Center,
Westlake Village, CA
What If?Now, more than ever, Americans are aware of the real threat posed by school crises. School crisis planning, preparation, and response is not a new process for most school communi-ties; many have spent months and years forg-ing critical partnerships, collaborating, plan-ning, and problem solving with the goal of providing safe and effective schools. Many schools have already developed viable crisis response plans.
The present call for readiness compels admin-istrators, resource officers, and their school communities to update existing safe school plans. In light of recent violence and increased vulnerability, it is imperative for schools without a crisis response plan to create one, while those institutions that have a crisis plan should review and enhance their programs. Are we prepared? Are we ready?
Recent catastrophes have taught us several important lessons about school emergency preparedness:
•
•
•
•
•
The likelihood of violent attacks isincalculable.The outcome of natural disasters isunpredictable.Wehavenotyetbeguntocomprehendtheforms that future terrorist acts or school violence may take.In some situations, even the best crisisresponse plan may be tested beyond its scope.Actions taken during the first few min-utes will determine the course of events to follow.
Why Prepare?There are two types of school administrators: (1) those who have faced a crisis and (2) those who are about to. School communities and their law enforcement and education partners cannot predict if, when, where, or how schools will become targets of terrorism; when an act of school violence may strike again; or when a natural calamity may befall them. What they can do is to anticipate and prepare. An effec-tive response to a crisis will help preclude a series of successive crises, including insulat-ing the school district from potential liability for their failure to plan or prepare for a crisis. Parents expect their children to remain safe when they send them to school. When a crisis happens, litigation almost certainly follows.
Taking Stock NowDo you have a safe school plan? Do you have a crisis plan? When is the last time you con-ducted a school safety site assessment? Taking stock of assets and liabilities is a critical step to promoting school safety and homeland readiness. This step presents schools with the opportunities to
••••
•
examineandacceptvulnerabilities.takestockofschoolassets.identifypotentialrisks/liabilities.implementstrategiestoreduceriskormiti-gate harm.identify resources that could be used forcrisis prevention and response.
Mapping Assets and HazardsUsing the checklist below, periodically update your school map to identify existing school

2 Law Enforcement Executive Forum • 2012 • 12(4)
assets and hazards. Reassess evacuation routes and open-assembly areas, and revise plans for conducting emergency response activities:
•
•
•
•
Obtainamapoftheschool,schoolgrounds,and the immediate vicinity. (Some schools use a footprint map and an aerial photo-graph as a means of providing a complete overview of the school and surrounding community.)Markthelocationandidentifyneighboringcommercial or civic facilities, municipal agencies, parks and recreational facilities, churches, and other schools.Markthelocationofthefollowing:•
••
••
•••
Campusaccesspoints,gates,fences,andparking lotsAllclassrooms,hallways,andclosetsOffices, libraries, multipurpose rooms,auditoriums, and cafeteriasOtherspecialactivityroomsorlocationsOpenfields,walkways,gatheringareas,and outdoor facilitiesRestroomsHeatingplantWindows, and interior and exterior doors
Locatethefollowingitemsonthemap:• Mainshut-offvalvesforwaterandgas••••
•
••••••
MasterelectricalbreakerHeatingandairconditioningequipmentStovesChemical storage and gas lines in science laboratoriesHazardous materials used for buildingand grounds maintenanceEmergencylightingunitsFireextinguishersFirstaidequipmentOutsidewaterfaucetsandhosesOverheadpowerlinesUndergroundgaslines
Source: Adapted from Federal Emergency Management Agency (FEMA) (2005).
Assessing School ThreatsIncidents of school crime and violence typi-cally do not happen randomly without notice.
School safety experts, including studies by the U.S. Secret Service, found that prior to their attack, shooters had told others about their plan. They engaged in behaviors that caused others to be concerned. These students had dif-ficulties focusing due to personal or family fail-ure; many had contemplated suicide, felt bul-lied or persecuted, and had access to weapons. The incidents were rarely sudden or impulsive. Other students were involved in some capacity.
Despite prompt law enforcement response, most shootings were stopped by school offi-cials. School officials cannot be expected to read a crystal ball when it comes to risks, but they are expected to take reasonable mea-sures to prevent, prepare, and respond to a crisis. When school officials work closely with mental health professionals, law enforcers, and youth service professionals, it gives them an edge in developing an effective assessment and response to rumors and other threats of violence.
Information sharing among school safety partners is critical to the threat assessment process. When a threat occurs, every school should have the ability to do the following:
•
•
••
•
Activatea formalprotocol for respondingto the threat.
Collect and analyze data about the threatand the perpetrator.
Assesstheseriousnessofthethreat. Access school and community resources
for response or treatment. Share and document vital information
with law enforcement, the juvenile justice and correction systems, and mental health professionals.
Additionally, it is recommended that schools have follow-up procedures to make cer-tain that the threat has been appropriately addressed. This particular recommendation is based on lessons learned from the Columbine High School shooting incident. Some school officials at Columbine stated that they had communicated with law enforcers regarding the troubled youth prior to their attack but had

Law Enforcement Executive Forum • 2012 • 12(4) 3
not followed up to confirm that their concerns were being adequately addressed. School offi-cials were not talking with law enforcement, and law enforcement was not talking with the school. In addition, law enforcement failed to follow up on information given to the prose-cutor’s office. Subsequently, further investiga-tion was not done. Each agency was respon-sible for continuing the investigative process. Because of these assumptions, important pre-cursors to coming events were lost. The ulti-mate goal of information sharing and collabo-ration is to generate the ability to evaluate the threat level and identify a course of action and a timeline for response.
The Nature of CrisisCrises come in many forms; they are caused by nature, technology, or human beings. Regard-less of the cause, all crises share four common characteristics:
1. Rapid onset2. Uncertainty and unpredictability3. A lack of the ability to control4. Imminent and possible severe loss
Questioning is part of pre-planning for crises and can also be very helpful in the debriefing process. In the aftermath of a crisis, school communities typically search for answers to several questions: What happened? Why did it happen? and Could we have prevented this?
Taking the time to act now can save lives, minimize harm to students and staff, dimin-ish loss of property, improve the manage-ment of problems as they arise, prevent a series of successive crises, and deter liability. Webster’s Ninth Collegiate Dictionary defines crisis as “an unstable or crucial time or state of affairs in which a decision change is impend-ing, especially one with a distinct outcome.” School and community leaders should ask the following questions: What emergencies could possibly happen? What can we do now to pre-vent them? What could we do now to reduce harm? How should we prepare? What actions will we take? and What will we do to recover?
The Federal Emergency Management Agency (FEMA) focuses on these questions by iden-tifying four interconnected phases of crisis management: (1) Mitigation/Prevention – taking actions that can reduce or remove risk to people and property; (2) Preparedness – increasing the capacity to be ready to respond to disasters and incidents of all kinds, focusing on plan-ning for the worst-case scenario; (3) Response – the actions taken in the midst of a crisis; and (4) Recovery – restoring confidence, order, and operation.
Focus on Drill and PracticeIn determining whether a school is ready or not for the unexpected, it is imperative to focus on drill and practice. School crisis response plans must be more than words on paper that the staff needs to read and memorize. They must become viable response options that are thor-oughly trained and tested. Drills, for example, are commonly used to provide training with new equipment, to develop or test new poli-cies or procedures, or to practice and maintain current skills.
The process of developing crisis response plans and practicing related drills in the school setting helps create the anticipation of what must be done during an actual crisis event. In particular, the drill and practice of crisis response procedures yields opportuni-ties to free time and energy to focus on the critical thinking and problem solving needed during a real crisis.
Taking StockEqually important in assessing risks is the need for schools to take stock of the assets, knowledge, talents, and skills that exist within the school community that can counter potential threats. School safety specialists, law enforcers, emergency responders, the military, government agencies, and mental health pro-fessionals must work together to develop crit-ical guidance, practices, and resources appro-priate to the culture and setting of our schools.

4 Law Enforcement Executive Forum • 2012 • 12(4)
When schools, law enforcement, and otheragencies adhere to rigid structures and sys-tems, there is very little flexibility to adapt to the fast-paced changes occurring in today’sworld. A willingness to adapt and becomemore responsive leads to structures evolving to meet unpredictable challenges.
The following are questions every lawenforcement/school partnership should askin order to be prepared and ready for any kind of crisis: What if we got together? What if we learn from the experience? What if we talk it over? What if we face the reality? What if we create a plan? What if we find partners early? What if we assign responsibility? and What if we consider consequences?
Effective crisis prevention and crisis prepa-ration is one of the most critical strategiesthat supports effective crisis managementand response. It has been said that successhappens when opportunity and preparation meet. In many ways, effective crisis manage-ment and response happens when the school’s prevention and preparation activities, includ-ing the drill and practice, have tempered and prepared them to execute well-thought-outplans.
Crisis ManagementCrisis management refers to the actions taken to exert control over the events of a crisis to minimize losses. Responding to a crisis involves making good decisions under the severe pressures of time and uncertainty. Effective crisis management is a product of prior planning, partnership building, prob-lem solving, and practice. Managing a crisis involves a set of critical skills that are some-what difficult to acquire. The opportunity to learn firsthand about managing a crisis situa-tion is limited for two primary reasons:
1. Crisis events are rare—They do not happen every day, every month, or even once a year.
2. No two crisis events are the same.
Some schools have learned about managing a crisis by having been through one. Other schools have gained experience vicariously by learning from schools that have faced crises.
Community Partnerships and PlanningCommunity partnerships are essential. While schools are perceived as primarily consumers of emergency services during a crisis, a school can serve as a critical community resource for different operations. The school and the community’s effectiveness depend on asking the following difficult questions: Do I know the culture, the wants, and the needs of my community? Am I willing to share power and resources? Am I committed to partnership activities? Am I ready to think creatively and in nontraditional ways? and Can I make my school more responsive to community needs?
A school’s ability to survive on its own without depleting limited community crisis resources will significantly contribute to the commu-nity’s ability to respond and recover from a major disaster. The case for self-reliance is an important element of responsible crisis planning and management. For instance, consider taking a staff inventory of commu-nity resources—that is, identify all school personnel who are first aid and CPR trained. Determine who is a professional nurse or who may have medical training from the military or prior professional emergency response experience.
In one case, a school district with which I was working had a principal who had served as the commanding officer of a U.S. Army chemical and biological weapons unit in Desert Storm, yet that individual had never been asked to review or coordinate any aspects of the school district’s crisis plan. What a great opportunity was missed by the school district by not capi-talizing on this unique talent that was right before them. In other words, there may be sig-nificant resources available within the school and community. Other districts with which I have worked have recruited fire fighters who are Emergency Medical Training (EMT)
Law Enforcement Executive Forum • 2012 • 12(4) 5
certified to work during their off-duty hours with campus safety—another great commu-nity resource.
Incident CommandIn order to protect students and staff, schools must accept the responsibility to prepare for crisis events of all kinds. Law enforcement partnerships and community policing can help. In the process of making crisis plans real and operational, schools help to secure their homeland from disasters and acts of terrorism through creating their own self-reliant and cooperative plans with local first responders. Every school should have a mutual operat-ing/crisis response agreement with local first responders so that each entity understands its own roles, responsibilities, and duties in the midst of a crisis. The MOU (Memorandum of Understanding) should also include an inci-dent command structure so that communities will know who is in charge and how the orga-nizational components will work together.
The major functional areas of an Incident Command System (ICS) focus on five key points:
1. Command – What are we going to do?2. Operations – How will we do it?3. Planning – What do we need to know?4. Logistics – What will it take?5. Finance – What will it cost?
Identifying the structure for the Emergency Operations Center (EOC) and knowing who the Crisis Response Team (CRT) members are is critical. Every school staff member should have a role on the CRT. In fact, some states, such as California, have legally designated every employee as a crisis team member.
Terrorism in Our Own BackyardContrasting the outcomes of readiness and preparation against the outcomes of indiffer-ence or denial provides new motivation for school communities to stand prepared. While a U.S. school has not been the target of an
international terror attack, our schools have experienced terrorism. In connection with the 9/11 attacks, there were nine schools within “Ground Zero.” Because of effective prior planning in New York City, they were able to evacuate all of the children without the loss of any lives. The explosive events at Columbine High School in 1999, Red Lake High School in 2005, Virginia Tech in 2007, and Northern Illinois University in 2008, along with other violent events at schools and in America’s workplaces have created a sense of terror for a nation that has watched in disbelief.
Today, the threats of terrorism, both domestic and foreign, have created a new standard of “normal.” If these unthinkable incidents have taught us anything, they have emphasized the need for readiness, uniform protocols, stan-dard terminology, a system of unified com-mand, and an effective emergency communi-cations network. Here are some of the steps that schools can take right now:
Before a Crisis
•••••
•
Planforrecovery.Identifyrolesandresponsibilities.Conducttraining.Screen/selectserviceproviders.Select the model for your crisis interven-tion team.Assembletheteam.
After a Crisis
•
••
•••
••
Return to routine activity as quickly aspossible.Keeppeopleinformed.Focusontherecoveryofpeopleaswellasbuildings.Assessemotionalneeds.Providestressmanagementactivities.Conductdailydebriefingsforthoseassist-ing in recovery.Takeasmuchtimeasneeded.Rememberanniversariesofcrises.
Source: Action steps adapted from The Office of Safe and Drug-Free Schools (2007).

6 Law Enforcement Executive Forum • 2012 • 12(4)
Schools are learning to find a balance between pretending that such events will not happen and allowing the potential threats to dominate and paralyze their lives. In response to what’s considered normal, a critical set of questions challenges every school: What are the risks? What is most likely? What do we need to know and be able to do? Who can help? Do we have a plan? Are we ready? and Are we prepared to be self-reliant?
Making Homeland Security Real for SchoolsHomeland security and violence prevention are about providing freedom from fear, anxi-ety, danger, and doubt for individuals, com-munities, and schools across the country. The school has many important roles in homeland security, but it is primarily responsible for the safety of students and staff. The school’s key roles and responsibilities revolve around the following kinds of activities:
••
•
•
•
•
•
RecognizingthethreatofterrorismPreparing the school to deal with the on-going threat of terrorismAssessing potential risks and identifyingassets for responseWorking within state and federal antiter-rorism directivesDeveloping specific response strategies,partnerships, and programsDelivering appropriate training for theschool community Standingreadytoappropriatelycontributeto a community’s disaster response
ConclusionMoving forward and positioning schools for the challenges of the 21st century is impera-tive. Building on the foundation of existing school crisis plans and partnerships is a good place to start. Building on these important foundations brings to life the relationships, best practices, technologies, and approaches that have consistently served schools well in challenging times. Schools and communities must prepare for the All-Hazards approach:
to be ready for anything human caused or for natural disasters, including chemical, biologi-cal, and radiological risks.
In realizing that the “world is watching,” it is important for schools to develop effective media plans and to pre-designate a spokes-person and media plan. Consider having a special area for the media that is away from the crime scene, allowing law enforcement to do their job while the media is attempting to do theirs.
Creating and maintaining safe schools is an ongoing challenge that requires a compre-hensive and systematic approach to school safety that includes quality crisis prevention planning, effective crisis preparation, respon-sible crisis management, and creative crisis recovery and support for victims. School crisis response plans must be more than words on paper that offer a planning process. They must become a set of viable response options that are internalized through training and testing. Most experts believe that it is the “process” of developing, refining, and practicing the plan and not the written plan itself that prepares schools and communities to respond to crises.
While school officials cannot and should not promise to guarantee the safety and security of all children, schools and communities can take effective steps to promote the safety and success of all children and the professionals who serve them by creating reasonable and effective crisis prevention and response plans. America’s children are depending upon us, and they deserve nothing less!
ReferencesFederal Emergency Management Agency
(FEMA), Emergency Management Insti-tute, Multi-Hazard Emergency Planning for Schools. (2005). Preparing for hazard identifi-cation. Retrieved from http://Istrng3.fema.gov/Courses/IS362/assets/MPSo104180.pdf.

Law Enforcement Executive Forum • 2012 • 12(4) 7
The Office of Safe and Drug-Free Schools, U.Department of Education. (2007, JanuaryPractical information on crisis planning: A guifor schools and communities. Washington, DU.S. Department of Education. RetrieveOctober 25, 2012, from www2.ed.govadmins/lead/safety/emergencyplancrisisplanning.pdf.
Dr. Ronald D. Stephens, a top expert witness and trial consultant in his field, was named executive director of The National School Safety Center in 1985. In this capacity, Dr. Stephens has served as consultant and frequent speaker for school districts, law enforcement agen-cies, and professional organizationsworldwide.
Dr. Stephens also presents schoolsafety and keynote addresses for local, regional, and national conferences and workshops. He is a leading provider of on-site, individualized technical assis-tance to school districts and communi-ties facing significant safe school crises and challenges. He has conducted more than 1,000 school safety site assessments nationwide.
Dr. Stephens has worked with school dis-tricts and communities in the aftermath of crises and related litigation, includ-ing work with major school shooting incidents such as Columbine; Red Lake, Minnesota; Paducah, Kentucky; Pearl, Mississippi; Bethel, Alaska; Edinboro,Pennsylvania; New Orleans; Los Angeles; New York; and a host of others.
Dr. Stephens holds a California teach-ing credential, administrative creden-tial, and a certificate in school business management. His experience includes service as a teacher, assistant super-intendent, and school board member. His administrative experience includes serving as chief school business officer
S. ).
de C: d //
and as vice president of Pepperdine University in Malibu, California.
Dr. Stephens received his Bachelor of Sci-ence in Business Administration and his MBA both from Pepperdine University. He received his EdD from the University of Southern California.

8 Law Enforcement Executive Forum • 2012 • 12(4)
Neighborhood Disorganization, Exposure to Violence in School, and Behavioral Health in a Population of Juvenile Justice-Involved YouthFredrick Butcher, PhDJeff M. Kretschmar, PhDDaniel J. Flannery, PhDMark I. Singer, PhDThe Begun Center for Violence Prevention Research and Education,
Mandel School of Applied Social Sciences, Case Western Reserve University
The prevalence of school violence and its impact on adolescent mental health and behavior has been a topic of concern for school administra-tors and law enforcement personnel. Although rates of youth violence have generally declined over the past few decades, nearly half (46.3%) of a national sample of children and adoles-cents were victims of an assault in the past year (Finkelhor, Turner, Ormrod, Hamby, & Kracke, 2009). Children and adolescents spend much of their time in schools, and research has found that exposure to violence either directly as a victim or indirectly as a witness at school is widely reported (Flannery, Wester, & Singer, 2004; Mrug & Windle, 2010; O’Keefe, 1997). In addi-tion, the majority of incidents that elicit police interventions in schools have been acts of physi-cal violence (Jefferis, Dogutas, Butcher, Davis, & Flannery, 2008). The impact of such widespread exposure to violence in schools has been stud-ied extensively in a variety of community and clinical samples, yet the influence of neighbor-hood factors on exposure to school violence and its impact on youth remains understudied.
Social DisorganizationWhen examining the behavior of individu-als, it is important to look at the effect ofenvironmental factors as well as of risk andprotective factors at the individual level. Gen-erally, social disorganization theory positsthat disorganization in a neighborhood con-tributes to the prevalence of violence anddelinquent behaviors through factors that
contribute to the breakdown of formal and informal social controls (Sampson & Groves, 1989). Sampson and Groves (1989) defined neighborhood disorganization as the combi-nation of low economic status, ethnic hetero-geneity, residential mobility, family disrup-tion, and urbanization. Subsequent studies have focused on similar conceptualizations of neighborhood disorganization (Brody et al., 2001; Chung & Steinberg, 2006; De Coster, Heimer, & Wittrock, 2006; Kawachi, Kennedy, & Wilkinson, 1999; Martínez, Rosenfeld, & Mares, 2008; Sampson, Raudenbush, & Earls, 1997). Previous tests of social disorganization theory have found that neighborhood factors are important in explaining the prevalence of crime and delinquency (e.g., Sampson & Groves, 1989).
Although studies in this area of research have often focused on the effects of neighborhood level violence, measured by rates of juvenile violence at the city or neighborhood level (e.g., Kawachi et al., 1999; Sampson & Groves, 1989), others have focused on multilevel models that predict individual level behavior from neighborhood level variables. Previous studies have found that neighborhood level disorganization and disadvantage were asso-ciated with an increase in the prevalence of exposure to violence (Chauhan, Reppucci, & Turkheimer, 2009; Gibson, Morris, & Beaver, 2009); mental health issues, including depres-sion and anxiety (Stockdale et al., 2007; Xue, Levanthal, Brooks-Gunn, & Earls, 2005); and

Law Enforcement Executive Forum • 2012 • 12(4) 9
delinquent behaviors (Chung & Steinberg, 2006; De Coster et al., 2006).
Exposure to ViolenceResearch has shown that exposure to school violence as either a victim or witness can lead to a variety of behavioral and mental health issues (Flannery et al., 2004; O’Keefe, 1997; Seals & Young, 2003). Seventh and 8th graders who reported being victims of bullying were more likely to show symptoms of depression than those who were not victims of bully-ing (Seals & Young, 2003). A geographically diverse sample of children in 3rd through 12th grades reported high levels of both witnessing and being victims of school violence, which in turn was positively and significantly related to trauma symptoms (Flannery et al., 2004). Chil-dren spend a significant amount of their time in schools, and social interactions in schools can be quite important to a child’s develop-ment. Studies have found that exposure to violence has a profound effect on symptoms of anger (Song, Singer, & Anglin, 1998) and post-traumatic stress (Buka, Stichick, Birdthistle, & Earls, 2001). In fact, Mrug, Loosier, and Windle (2008) found that in comparison with the neighborhood and the home setting, expo-sure to violence in schools was the strongest predictor of internalizing problems.
Researchers have generally found that expo-sure to violence in schools is a significant contributing factor for violent and aggres-sive behaviors (Flannery et al., 2004; Nansel, Overpeck, Haynie, Ruan, & Scheidt, 2003; Singer, Anglin, Song, & Lunghofer, 1995; Song et al., 1998). Among children in 3rd through 12th grades, witnessing and being victimized by school violence were positively related to self-reported violent and aggressive behavior (Flannery et al., 2004). Nansel et al. (2003) found that both victims and perpetra-tors of bullying behavior were more likely than others to commit violent and aggressive behaviors. These findings would indicate that being exposed to violence in schools has a pro-found effect on the behavior of an individual.
Studying the effect of exposure to violence may be particularly important for youth in a juvenile justice setting. Juvenile justice-involved youth report high levels of trauma exposure such as exposure to violence (Abram et al., 2004; Ford, Hartman, Hawke, & Chapman, 2008). Expo-sure to violence in this population is associated with internalizing problems (Ford et al., 2008) and delinquency (Chauhan et al., 2009).
Gender Differences in the Prevalence and Effect of School Violence ExposureGenerally, a larger proportion of males report being victimized in schools in comparison with females (Nickerson & Slater, 2009; Singer et al., 1999). Physical acts of bullying are also more likely to involve males as both the per-petrator and the victim (Carbone-Lopez, Esbensen, & Brick, 2010). Males and females, however, report similar levels of witnessing school violence. Singer et al. (1999) found that 80.8% of males and 77.2% of females in a cen-tral city sample reported witnessing an assault at school. Self-report data on a school sample of youth showed that exposure to violence in schools was related to internalizing problems, particularly among girls (Mrug et al., 2008). Generally, males who are exposed to vio-lence are more likely to exhibit externalizing behaviors, while females who are exposed to violence are more likely to exhibit internal-izing behaviors (Herrenkohl, Sousa, Tajima, Herrenkohl, & Moylan, 2008). Although there are slight gender differences, Chauhan et al. (2009) found a model predicting recidivism from neighborhood disorganization and expo-sure to violence appropriately fit their data of females involved in the juvenile justice system. This seems to suggest that exposure to violence is a key factor in predicting internalizing and externalizing problems in both gender groups.
The Present StudyAlthough the link between exposure to school violence as a risk factor for internalizing and externalizing problems has been studied exten-sively, relatively little is known about the

10 Law Enforcement Executive Forum • 2012 • 12(4)
impact of neighborhood factors. Chauhan et al. (2009) tested a structural equation model that specified pathways from neighborhood disad-vantage and exposure to violence to criminal recidivism in a population of juvenile justice-involved girls. Their data indicated a direct path-way between neighborhood disadvantage and criminal recidivism. The current study expands upon their model by specifically examining exposure to violence in schools and including indicators of neighborhood disorganization as well as disadvantage. In addition, the current analysis builds upon their work by introducing symptoms of trauma as possible outcomes of exposure to violence in schools. Figure 1 shows the conceptual model to be tested in the data and analysis sections. The present analysis will test the following hypotheses:
H1 – Children living in neighborhoods with higher levels of disorganization
will be exposed to higher levels of vio-lence in schools (Paths A and B).
H2 – Higher levels of exposure to school violence will be associated with higher levels of anger (Paths D and G).
H3 – Higher levels of exposure to school violence will be associated with higher levels of posttraumatic stress (Paths C and F).
H4 – Higher levels of exposure to school violence will be associated with arrests for violent offenses (Paths E and H).
H5 – The relationship between neighbor-hood disorganization, exposure to school violence, trauma symptoms, and violent arrests will be invariant for gender.
Figure 1. Conceptual Model
H
GF
E
D
C
B
A
Neighborhood Disorganization
Witness Violence in
School
Victim of Violence in
School
Anger
Posttraumatic Stress
Violent Offenses
PUB
POV
VAC
FHH
UNE
REN
EDU
VIC 1 VIC 2 VIC 3
WIT 1 WIT 2 WIT 3
In the interest of space, specified covariance between exposure to violence variables and trauma symptom variables are not shown. PUB = percentage of families receiving public assistance; POV = percentage of families below the poverty level; FHH = percentage of female-headed households with children under 18; UNE = percentage of residents unemployed; VAC = percentage of vacant housing units; REN = percentage of renter-occupied housing units; EDU = percentage of residents with less than a high school degree; WIT 1 = witness a threat; WIT 2 = witness slapped, hit, or punched; WIT 3 = witness a beating; VIC 1 = victim of threat; VIC 2 = victim slapped, hit, or punched; VIC 3 = victim of a beating.
In the interest of space, specified covariance between exposure to violence variables and trauma symptom variables not shown. PUB = Percentage of families receiving public assistance, POV = percentage of families below the poverty level, FHH = percentage of female headed households with children under 18, UNE = percentage of residents unemployed, VAC = percentage of vacant housing units, REN = percentage of renter occupied housing units, EDU = percentage of residents with less than a high school degree, WIT 1 = Witness a threat, WIT 2 = Witness slapped, hit, or punched, WIT 3 = Witness a beating, VIC 1 = Victim of threat, VIC 2 = Victim slapped, hit, or punched, VIC 3 = Victim of a beating
Figure 1. Conceptual Model

Law Enforcement Executive Forum • 2012 • 12(4) 11
Data and Methods
Sample
Data for the present analysis are derived from the Behavioral Health Juvenile Justice Initia-tive (BHJJ), a multi-county juvenile justice diversion program in Ohio. Youth ages 10 to 18 years old were assessed for a variety of mental and behavioral health problems at intake. To be targeted for entry into BHJJ, the juvenile must meet several criteria, including a mental health diagnosis, history of substance use, a history of violent or criminal activity, exposure to vio-lence and trauma, and/or a charge or adjudi-cation for a delinquent offense, among others. Youth entered into the program are diverted from the juvenile justice system into commu-nity-based mental health facilities and pro-vided with the necessary treatment to reduce their risk for further behavioral problems.
For the 2009 evaluation period, a total of 1,029 youth (48.3% male and 51.7% female) were entered into the program. A little over half (56.5%) were enrolled in urban counties, while the rest (43.5%) were enrolled in rural counties. In terms of the racial makeup of the sample, there were 657 Caucasians (64.5%), 284 African Americans (27.9%), and 78 of the youth were members of other races (7.7%). The average age of the youth in the sample was 15.56 years.
Measures
Neighborhood Disorganization
The latent construct neighborhood disorganiza-tion is hypothesized to be made up of seven observed measures: (1) percentage of house-holds receiving public assistance, (2) percent-age of families below the poverty level, (3) per-centage of female-headed households with children under 18 years old, (4) percentage of residents unemployed, (5) percentage of vacant housing units, (6) percentage of renter-occu-pied housing units, and (7) percentage of resi-dents whose education level is less than a high school graduate. All seven observed measures
were taken from the 2000 U.S. Census at the zip code level. Zip codes for the current residence of each BHJJ youth were collected at intake for each of the participating counties.
Although it is common practice to use multi-level models in neighborhood research (e.g., Brody et al., 2001; Gibson et al., 2009), the available data are not suitable for a multilevel approach. Specifically, multilevel analyses with group sizes of five or less significantly inflate standard errors when estimating between-group effects and thus increase the risk for Type II errors (Theall et al., 2011). At the zip code level, the BHJJ sample con-sists of 121 zip codes with five or less indi-viduals (70.3%) and, therefore, the multilevel approach will not be taken and neighborhood variables will be treated as individual level variables. There is some precedence for exam-ining neighborhood level variables with simi-lar methodological issues as individual level characteristics (e.g., Chauhan et al., 2009).
Recent Exposure to Violence
To measure the level of exposure to violence among BHJJ youth, data on the Recent Expo-sure to Violence Scale (REVS) were collected at intake and discharge from the program (Singer et al., 1995). The original scale mea-sures witnessing and victimization in three different settings—(1) home, (2) school, and (3) neighborhood—and has demonstrated good psychometric properties (Van Dulmen, Belliston, Flannery, & Singer, 2008). For the purposes of this analysis, only the school items were examined. To measure witness-ing violence, three separate items were used: (1) witnessing a threat; (2) witnessing someone being slapped, hit, or punched; and (3) wit-nessing someone beaten up while at school. Variables measuring how frequently the respondent had experienced violent victim-ization was measured as threatened; slapped, hit, or punched; and beaten and were sepa-rated at school. Youth were asked whether each of these types of exposure to violence occurred “Never,” “Sometimes,” “Often,” or “Almost every day” in the past year. Scores

12 Law Enforcement Executive Forum • 2012 • 12(4)
for each item ranged between “0” (Never) and “3” (Almost every day). The REVS has been used to measure location-specific exposure to violence in a number of studies (e.g., Flannery et al., 2004; Singer et al., 1995). However, the psychometric properties of the REVS as an abbreviated two-factor measure of witness-ing violence and victimization at school are unknown. Therefore, the REVS items are con-ceptualized as latent variables.
Trauma Symptoms
Several scales from the Trauma Symptom Checklist for Children (TSCC) were used to measure internalizing problems. The TSCC consists of subscales measuring anger, anxi-ety, depression, dissociation, posttraumatic stress disorder, and sexual concerns (Briere, 1996). The subscales are intended for use as both a summed scale and as a T-score where cutoff scores for clinical and subclinical levels of trauma are established based on gender and age. Previous tests of the TSCC have estab-lished good psychometric properties of the TSCC subscales (Briere, 1996; Lanktree et al., 2008). For the purposes of this analysis, the subscales for anger and posttraumatic stress are included in the model as endogenous and observed variables. The anger subscale consists of both angry behaviors such as yelling, argu-ing, and fighting, and other forms of anger. Posttraumatic stress consists of thoughts and remembering past traumatic events (Briere, 1996). The TSCC is a self-report measure designed for children between 7 and 16 years old; however, the TSCC can be administered to children up to the age of 17, although the language is geared toward younger children (Briere, 1996). Since the sample size would have been significantly reduced, TSCC data for 17-year-olds were retained (n = 171). The TSCC consists of 54 Likert scale items for which responses were scored “Never,” “Some-times,” “Lots of times,” and “Almost all of the time.” The TSCC includes two validity scales that measure the minimization of symptoms (underresponding) and the exaggeration of symptoms (hyperresponding). For BHJJ youth at intake, there were 139 (14.7% of those who
completed the TSCC) underresponders and 10 (1.1% of those who completed the TSCC) hyper-responders, and these were removed from any of the analyses involving TSCC measures.
Violent Offenses
In addition to the self-report data, juvenile court data were collected for BHJJ youth. Each of the participating counties provided juvenile court histories for the youth, includ-ing all charges and the dispositions for each youth. For the purposes of this analysis, the total number of violent offenses at 12 months prior to intake will be measured as an endog-enous variable. This particular timeframewas chosen for a number of reasons. First, the REVS was designed to measure the amount of violence a child is exposed to in the last 12 months. Therefore, the outcome variable coin-cides with the violence exposure being mea-sured. Second, increasing the amount of time prior to intake allows for higher variability in the sample. Finally, it was important to select the timeframe prior to intake into the BHJJ program to avoid any treatment effects that may affect the results of the model.
Analysis Plan
Descriptive statistics for all observed variables in the conceptual model are presented in Table 1. The sample started with 1,029 youth; however, once underresponders and hyperresponders were excluded from the samples, a final sample of 866 was retained. While the data in Table 1 for neighborhood disorganization, exposure to violence, and violent offenses variables reflect all available data, only the respondents who were not identified as either underresponders or hyperresponders are included in the TSCC variables. Missing data were handled using the maximum likelihood imputation method using LISREL 8.8 (Jöreskog & Sörbom, 2006).
To test the hypotheses listed in the preceding sections, structural equation modeling was con-ducted using AMOS 7 software (Arbuckle, 2006). Structural equation modeling is an appropriate technique to model complex causal structures

Law Enforcement Executive Forum • 2012 • 12(4) 13
where there are multiple independent and depen-dent variables (Iacobucci, Saldanha, & Deng, 2007). Results of the model will be presented in two stages: (1) the overall configural model and (2) the group comparison model. Prior to examining the structural models, a measurement model was examined to ascertain the reliability and validity of the latent variables included in the structural models.
In assessing the fit of the measurement and structural models, several indices will be examined. The most commonly utilized test in structural equation modeling is the χ2 where a nonsignificant value indicates adequate fit. However, researchers have argued that the χ2 test is too rigorous given its sensitivity to sample size. Alternative model fit indices com-monly used in the literature (e.g., Van Dulmen et al., 2008) include a χ2/DF test, standardized root mean square residual (SRMR), compara-tive fit index (CFI), and the root mean square error of approximation (RMSEA). Although there is no consensus, particularly given its sensitivity to sample size, a χ2/DF of less than 5.0 can be considered an adequate fit (Marsh & Hocevar, 1985). Cutoff values for the remain-ing fit indices presented in the following anal-yses include SRMR less than 0.08, a CFI value
above 0.95, and a RMSEA less than 0.06 (Hu & Bentler, 1999). A CFI value above 0.90 was initially established as a cutoff point (Bentler, 1992), and this criterion has also been used to indicate an adequate fit in some recent stud-ies (e.g., Owens & Shippee, 2009; Van Dulmen et al., 2008). In addition to these suggested cutoff values, the CFI is an incremental value that can be used to compare competing models, where a ΔCFI of greater than 0.01 indicates a significant change (Cheung & Rensvold, 2002). However, these values are not absolute and provide guidelines for rejecting a pro-posed model based on statistical tests. Equally important are the theoretical justifications for selecting one model over another.
The default estimation method in struc-tural equation modeling software, including AMOS, is the maximum likelihood method. One assumption, however, is that the data are univariate and multivariate normal. Prior to evaluating the structural equation models, a test on the normality of the data revealed that the data are multivariate non-normal. There-fore, the Asymptomatically Distribution-Free (ADF) estimation method was selected as an alternative. The ADF estimation method has been shown to be reliable provided that
Table 1. Descriptive Statistics for Observed Variables in the Model
N Range Mean (SD)
Neighborhood Disorganization Public assistance Poverty Female-headed household Unemployment rate Vacant housing units Renter-occupied housing Less than high school diplomaWitness Violence in School Witness threat Witness slapped, hit, or punched Witnessed someone beaten up Victim of Violence in School Threatened Slapped, hit, or punched Beaten upAngerPosttraumatic StressViolent Offenses
992992992992992992992
940932938
943943938866866933
0-21.300-52.60
1.80-33.800-21.80
2.10-37.206.90-89.102.20-54.90
0-30-30-3
0-30-30-30-270-260-6
3.77 (SD = 3.05)10.13 (SD = 7.68)8.72 (SD = 4.54)5.41 (SD = 3.25)9.50 (SD = 7.71)
35.27 (SD = 14.45)19.09 (SD = 8.40)
0.85 (SD = 0.93)0.87 (SD = 0.85)0.79 (SD = 0.84)
0.48 (SD = 0.71)0.36 (SD = 0.61)0.09 (SD = 0.34)9.42 (SD = 5.39)7.46 (SD = 5.20)0.49 (SD = 0.92)

14 Law Enforcement Executive Forum • 2012 • 12(4)
the sample size is 10 times greater than the number of estimated parameters (Raykov & Marcoulides, 2000). The number of param-eters estimated in the hypothesized model is 41 with a sample size of 866. Thus, the use of ADF as an estimation method is justified.
ResultsThe frequency of exposure to violence in school among BHJJ youth are presented in Table 2. A majority of both males and females report having witnessed violence in school at least sometimes in the past year. Of the three items measuring witnessing violence in school, the most frequently reported item was witnessing someone slapped, hit, or punched in school for both males (65.4%) and females (69.0%). A smaller percentage of youth report having been a victim of violence at school at least sometimes in the past year; however, almost half of the males (45.5%) and half of the females (43.6%) reported having been threatened. The most infrequently reported item was being beaten up at school in the past year for both males (7.8%) and females (8.6%).
Independent samples t-tests were conducted to explore gender differences on the vari-ables of interest (see Table 2). Females in the BHJJ sample were residing in significantly more disorganized neighborhoods than males (t[979] = 3.31, p < 0.01). Males reported sig-nificantly higher levels of victimization at school (t[943.02] = -2.07, p < 0.05). In addi-tion, females reported higher levels of trauma symptoms for both the anger (t[778.39] = 4.71, p < 0.01) and posttraumatic stress (t[780] = 8.72, p < 0.01) subscales. In comparison with females, males in the BHJJ sample had signifi-cantly more violent arrests at intake (t[923] = -3.29, p < 0.01). Small effect sizes were found for neighborhood disorganization, the REVS measures, anger, and violent arrests, while a moderate effect size was found for the post-traumatic stress subscale. Further exploration of our data showed that about one in three (34.1%) youth who scored in the clinical or subclinical range of anger scored within the clinical or subclinical range of posttraumatic stress. Conversely, 43.6% of youth scoring within the clinical or subclinical range of post-traumatic stress scored within the clinical or subclinical range of anger.
Table 2. Frequency of Exposure to Violence at School by Gender
Male (n = 437) Female (n = 429)
Witness Violence in School Witness threat 63.8% 63.6% Witness slapped, hit, or punched 65.4% 69.0% Witnessed someone beaten up 59.7% 65.5%Victim of Violence in School Threatened 45.5% 43.6% Slapped, hit, or punched 34.8% 25.9% Beaten up 7.8% 8.6%
Table 3. Independent Samples t-Tests for All Included Measures by Gender
Female Male t d
Neighborhood Disorganization ξ 85.90 (SD = 37.81) 78.62 (SD = 32.60) 3.24** 0.21REVS - Victim at School 0.85 (SD = 1.26) 1.02 (SD = 1.30) -2.07* 0.13REVS - Witness at School ξ 2.55 (SD = 2.30) 2.46 (SD = 2.17) 0.62 0.04TSCC – Anger 10.40 (SD = 5.53) 8.54 (SD = 5.57) 4.71** 0.34TSCC - Posttraumatic Stress ξ 9.11 (SD = 5.61) 5.88 (SD = 4.74) 8.66** 0.64Violent Arrests ξ 0.39 (SD = 0.78) 0.59 (SD = 1.04) -3.26** 0.23
** p < 0.01, * p < 0.05; ξ – equal variances were not assumed after Levene’s test was violated. Means reported here are for summed scales of the neighborhood disorganization, REVS, and TSCC measures.
Law Enforcement Executive Forum • 2012 • 12(4) 15
Given that the seven zip code level variables that make up the neighborhood disorganiza-tion scale have not previously been tested, an exploratory factor analysis on a random sample of 25% of the BHJJ youth was conducted. Six of the seven variables loaded onto one compo-nent; however, percentage of vacant housing units loaded onto a second component. Given that the percentage of vacant housing units does not measure a separate domain from the percentage of renter-occupied housing, it was removed from the neighborhood disorga-nization measure. The measurement models showed adequate fit (χ2/DF = 2.49, CFI = 0.94, SRMR = 0.05, RMSEA = 0.04) with high aver-age factor loadings for two of the constructs: (1) neighborhood disorganization (0.87) and (2) witnessing violence in school (0.81). How-ever, for the victimization in school construct, the factor loading for the observed variable victimized by a beating was low (0.30). This may in fact be due to the low percentage of youth who reported having been beaten up at school in the past year. However, the removal of the item cannot be justified theoretically; and given that items with factor loadings at 0.30 have been retained in other studies (e.g., Van Dulmen et al., 2008), the item was included in the structural models.
Configural Model
To establish the baseline structural model for the combined sample, the hypothesized model presented in Figure 1 was evaluated for model fit. The hypothesized model fit the data well (χ2/DF = 2.49, CFI = 0.92, SRMR = 0.05, RMSEA = 0.04). Pathways were tested in an iterative process wherein competing models with pathways from neighborhood disorga-nization and pathways to trauma symptoms and violent offenses were removed individu-ally and evaluated for model fit. When path-ways from exposure to violence to violent offenses were removed (Paths E and H), the resulting model was a significantly better fit to the data (DCFI = 0.01; χ2/DF = 2.47, CFI = 0.93, SRMR = 0.05, RMSEA = 0.04). Therefore, this alternative model was retained. Figure 2
presents unstandardized regression estimates for the retained model.
Although it was hypothesized that neighbor-hood disorganization would be positively associated with violence in schools, this was not the case. One significant pathway was found from neighborhood disorganization to exposure to violence in schools. Higher levels of neighborhood disorganization were asso-ciated with slightly lower levels of violent victimization in school (β = -0.16, p < 0.05). Several pathways leading from exposure to violence to trauma symptoms were signifi-cant. Higher levels of victimization in school were associated with anger (β = 0.26, p < 0.05) and posttraumatic stress (β = 0.31, p < 0.05). Further, higher levels of witnessing violence in school were associated with anger (β = 0.17, p < 0.05) but not with posttraumatic stress.
Multiple-Group Analysis
Multiple-group analyses were conducted to test for gender invariance in the configural model. We were particularly interested in the comparison between the unconstrained model, where residuals, factor loadings, and path estimates were estimated freely across groups, and a model where path estimates were constrained equally across groups. No statistically significant difference was found between the two models (χ2[13] = 20.14). The resulting model where path estimates were constrained across gender groups fit the data adequately (χ2/DF = 2.14, CFI = 0.90, SRMR = 0.04, RMSEA = 0.04). This suggests that path estimates in the configural model did not sig-nificantly differ across gender groups.
DiscussionThe purpose of the current study was to test the associations between neighborhood dis-organization, exposure to violence in schools, violent offending, and trauma in a popula-tion of juvenile justice-involved youth. We proposed a structural equation model with pathways specified from neighborhood disor-ganization to exposure to violence in schools,

16 Law Enforcement Executive Forum • 2012 • 12(4)
which then led to outcome measures of anger, posttraumatic stress, and violent offending.
We first proposed a direct association between neighborhood disorganization and exposure to violence in schools. The data did not support this hypothesis. Chauhan et al. (2009) also did not find a significant direct pathway between neighborhood disadvantage and exposure to violence. We measured disorganization in the neighborhood beyond the disadvantage construct presented in Chauhan et al. In fact, a small but significant negative effect was found between neighborhood disorganization and violent victimization in school. This find-ing would indicate that children residing in less disorganized neighborhoods were report-ing higher levels of exposure to violence in homes and schools. This seemingly contra-dictory finding may in fact be indicative of a
desensitizing effect found in previous studies (e.g., Farrell & Bruce, 1997; Slovak, Carlson, & Helm, 2007) wherein the observed effects of exposure to violence may have been dimin-ished among individuals frequently exposed to violence. Individuals exposed to high levels of violence in neighborhoods and particularly serious forms of violence may underreport their exposure in other locations. Although the expectation from social disorganization theory is that violence is prevalent in disorga-nized neighborhoods, these data suggest that youth report relatively high levels of expo-sure to violence in schools across disparate neighborhoods.
Second, we proposed associations between exposure to violence and outcomes of vio-lent offending and symptoms of trauma in Hypotheses 2, 3, and 4. Hypotheses 2 and 3
Figure 2. Structural Model – Combined Data
0.31*
0.26*
0.05
0.17*
-0.16*
0.05
0.24*0.56*0.68a
0.83*0.90*0.72a
0.96*
0.97*
0.89*
0.90*
0.69*
0.82a
Neighborhood Disorganization
Witness Violence in
School
Victim of Violence in
School
Anger
Posttraumatic Stress
PUB
POV
FHH
UNE
REN
EDU
VIC 1 VIC 2 VIC 3
WIT 1 WIT 2 WIT 3
Note: *p < 0.05; a Regression weight constrained to 1. In the interest of space, specified covariance between exposure to violence variables and trauma symptom variables not shown. Standardized regression weights are shown. PUB = percentage of families receiving public assistance; POV = percentage of families below the poverty level; FHH = percentage of female-headed households with children under 18; UNE = percentage of residents unemployed; VAC = percentage of vacant housing units; REN = percentage of renter-occupied housing units; EDU = percentage of residents with less than a high school degree; WIT 1 = witness a threat; WIT 2 = witness slapped, hit, or punched; WIT 3 = witness a beating; VIC 1 = victim of threat; VIC 2 = victim slapped, hit, or punched; and VIC 3 = victim of a beating.
Note: *p < .05 a Regression weight constrained to 1. In the interest of space, specified covariance between exposure to violence variables and trauma symptom variables not shown. Standardized regression weights shown. PUB = Percentage of families receiving public assistance, POV = percentage of families below the poverty level, FHH = percentage of female headed households with children under 18, UNE = percentage of residents unemployed, VAC = percentage of vacant housing units, REN = percentage of renter occupied housing units, EDU = percentage of residents with less than a high school degree, WIT 1 = Witness a threat, WIT 2 = Witness slapped, hit, or punched, WIT 3 = Witness a beating, VIC 1 = Victim of threat, VIC 2 = Victim slapped, hit, or punched, VIC 3 = Victim of a beating
Figure 2. Structural Model – Combined Data
Law Enforcement Executive Forum • 2012 • 12(4) 17
were supported by the data. The final config-ural model showed significant pathways from violent victimization and witnessing violence in school to anger. The data also showed a sig-nificant pathway from violent victimization in school to posttraumatic stress. In comparison with witnessing violence in school, pathways from violent victimization in school to symp-toms of trauma showed stronger associations. Previous studies have also found these rela-tionships in community samples of youth (Singer et al., 1995; Song et al., 1998). Hypoth-esis 4 was not tested as violent offending was removed from the model during the model specification process due to poor model fit.
The third hypothesis that the structural model will be invariant by gender was supported by the data. For this population of juvenile jus-tice-involved youth, although the prevalence of exposure to violence in schools was simi-lar across both genders, there were significant differences for the summed scale scores at the bivariate level. In addition, there were signifi-cant bivariate gender differences for the TSCC subscales as well as in the violent offending variable. However, this did not translate into gender differentiated pathways in the struc-tural model. This finding would suggest that gender does not moderate the relationships between neighborhood disorganization, expo-sure to violence in schools, and symptoms of trauma.
Limitations
Several limitations to this study are of note. In ascribing neighborhood level values to youth in the BHJJ program, the only avail-able data for the youth were at the zip code level. Although there is some precedent for using zip code level data (e.g., Geronimus & Bound, 1998), zip code level data are not as precise in estimating neighborhood level attri-butes as Census tracts are. Census tracts are often used in neighborhood research (e.g., Osgood & Chambers, 2000) since they are designed to group neighborhoods according to socioeconomic conditions as well as other demographic variables. Unlike Census tracts,
zip codes are not controlled for differences in demographics.
One notable finding of this study was that removing violent arrests improved the over-all model significantly. Court records for BHJJ youth were used as a measure for vio-lent behavior since self-report data for violent behavior were not available. Two limitations of the violent arrests variable and juvenile court data in general are of note. There are a mul-titude of issues at the local and county level that affect the number and nature of charges that are attributed to a youth. Although adju-dication data were also available, these data are also susceptible to similar limitations. Ulti-mately, juvenile court data are not intended to be used to be analyzed at the aggregate level. However, self-reported violent behavior data were not available for BHJJ youth.
In addition, the sample itself may have been a shortcoming in assessing a model that predicts violent offending. The sample was made up of juvenile justice youth who were at risk for fur-ther offending and in need of treatment. Some of the criteria for entry into the BHJJ program included a pattern of delinquent behaviors and exposure to trauma. Variability in violent offending for such a population may be lim-ited since all of the youth in the sample were at risk for offending.
In addition to limitations with the data itself, there is a time order issue with using violent arrests at intake. For the present analysis, the time period of interest was the 12 months lead-ing up to intake into the BHJJ program. Recent exposure to violence was measured as expo-sure to violence in the last 12 months, while the TSCC asked youth about their symptoms at the time of intake. This is problematic since arrests could have taken place prior to being exposed to violence and the symptoms of trauma. Although juvenile court data were available for the 12-month period follow-ing intake into the program, the analysis did not focus on outcomes of the BHJJ program. Since recidivism is ultimately affected in large part by the treatment that the youth received

18 Law Enforcement Executive Forum • 2012 • 12(4)
during their time in the program, this measure was not appropriate for the research questions being addressed.
Implications for Practice
With these limitations in mind, the current study has further reinforced the findings of many researchers that a large proportion of children are exposed to violence in schools (e.g., Flannery et al., 2004). Furthermore, we found that exposure to violence in schools is quite prevalent regardless of contextual fac-tors at the neighborhood level. Previous stud-ies have focused on school violence exposure in children in urban populations (Milam, Furr-Holden, & Leaf, 2010). However, the data suggest that exposure to violence at school is problematic across neighborhoods, and the consequences of such exposure are manifested by students, regardless of gender, in both urban and rural settings.
Additionally, violence exposure in school is a predictor of both anger and posttraumatic stress. An exploratory analysis of our data revealed that youth often have co-occurring problems of anger and posttraumatic stress. This finding has practical implications for law enforcement personnel regarding their response to youth showing symptoms of anger. Researchers have consistently found relationships between anger and aggression in youth involved with the justice system (e.g., Cornell, Peterson, & Richards, 1999). Youth with high levels of posttraumatic stress may become defensive and aggressive toward fig-ures of authority (Ko et al., 2008). Thus, police responses to acts of aggression and violence in school-aged youth must be sensitive to the possibility of underlying posttraumatic stress.
Building on these policy recommendations, future research should focus on the interplay between trauma and aggression in children exposed to violence in different contextual set-tings. This paper did not address the impor-tance of contextual factors at the neighborhood level in explaining exposure to violence in the neighborhood, homes, and more serious
types of violence exposure such as knife and gun violence. Although the data here did not suggest a pathway from neighborhood disor-ganization to exposure to violence in school, it may be the case that children who are exposed to serious acts of violence are desensitized to smaller forms of violence. Future research should focus on structural models that take into account the various locations in which children are exposed to violence.
ReferencesAbram, K. M., Teplin, L. A., Charles, D. R.,
Longworth, S. L., McClelland, G. M., & Dulcan, M. K. (2004). Posttraumatic stress disorder and trauma in youth in juvenile detention. Archives of General Psychiatry, 61(4), 403-410.
Arbuckle, J. L. (2006). Amos (Version 7.0) [Computer Software]. Chicago: SPSS.
Bentler, P. M. (1992). On the fit of models to covariances and methodology to the Bulletin. Psychological Bulletin, 112(3), 400-404.
Briere, J. (1996). Trauma Symptom Checklist for Children (TSCC) professional manual. Odessa, FL: Psychological Assessment Resources.
Brody, G. H., Ge, X., Conger, R., Gibbons, F. X., Murry, V. M., Gerrard, M., & Simons, R. L. (2001). The influence of neighborhood dis-advantage, collective socialization, and par-enting on African American children’s affili-ation with deviant peers. Child Development, 72(4), 1231-1246.
Buka, S. L., Stichick, T. L., Birdthistle, I., & Earls, F. J. (2010). Youth exposure to vio-lence: Prevalence, risks, and consequences. American Journal of Orthopsychiatry, 71(3), 298-310.
Carbone-Lopez, K., Esbensen, F., & Brick, B. T. (2010). Correlates and consequences of peer victimization: Gender differences in direct and indirect forms of bullying. Youth Violence and Juvenile Justice, 8(4), 332-350.

Law Enforcement Executive Forum • 2012 • 12(4) 19
Chauhan, P., Reppucci, N. D., & Turkheimer, E. N. (2009). Racial differences in the associa-tions of neighborhood disadvantage, expo-sure to violence, and criminal recidivism among female juvenile offenders. Behavioral Sciences and the Law, 27(4), 531-552.
Cheung, G. W., & Rensvold, R. B. (2002). Eval-uating goodness-of-fit indexes for testing measurement invariance. Structural Equation Modeling: A Multidisciplinary Journal, 9(2), 233-255.
Chung, H. L., & Steinberg, L. (2006). Relations between neighborhood factors, parenting behaviors, peer deviance, and delinquency among serious juvenile offenders. Develop-mental Psychology, 42(2), 319-331.
Cornell, D. G., Peterson, C. S., & Richards, H. (1999). Anger as a predictor of aggres-sion among incarcerated adolescents. Journal of Consulting and Clinical Psychology, 67(1), 108-115.
De Coster, S., Heimer, K., & Wittrock, S. M. (2006). Neighborhood disadvantage, social capital, street context, and youth violence. Sociological Quarterly, 47(4), 723-753.
Farrell, A. D., & Bruce, S. E. (1997). Impact of exposure to community violence on vio-lent behavior and emotional distress among urban adolescents. Journal of Clinical Child Psychology, 26(1), 2-14.
Finkelhor, D., Turner, H., Ormrod, R., Hamby, S., & Kracke, K. (2009). Children’s exposure to violence: A comprehensive national survey. Retrieved November 29, 2012, from https://www.ncjrs.gov/pdffiles1/ojjdp/227744.pdf.
Flannery, D. J., Wester, K. L., & Singer, M. I. (2004). Impact of exposure to violence in school on child and adolescent mental health and behavior. Journal of Community Psychol-ogy, 32(5), 559-573.
Ford, J. D., Hartman, J. K., Hawke, J., & Chapman, J. F. (2008). Traumatic victimization,
posttraumatic stress disorder, suicidal ide-ation, and substance abuse risk among juve-nile justice-involved youth. Journal of Child & Adolescent Trauma, 1(1), 75-92.
Geronimus, A. T., & Bound, J. (1998). Use of census-based aggregate variables to proxy for socioeconomic group: Evidence from national samples. American Journal of Epide-miology, 148(5), 475-486.
Gibson, C. L., Morris, S. Z., & Beaver, K. M. (2009). Secondary exposure to violence during childhood and adolescence: Does neighborhood context matter? Justice Quar-terly, 26(1), 30-57.
Herrenkohl, T. I., Sousa, C., Tajima, E. A., Herrenkohl, R. C., & Moylan, C. A. (2008). Intersection of child abuse and children’s exposure to domestic violence. Trauma, Vio-lence, & Abuse, 9(2), 84-99.
Hu, L., & Bentler, P. M. (1999). Cutoff criteria for fit indexes in covariance structure analy-sis: Conventional criteria versus new alter-natives. Structural Equation Modeling: A Mul-tidisciplinary Journal, 6(1), 1-55.
Iacobucci, D., Saldanha, N., & Deng, X. (2007). A meditation on mediation: Evidence that structural equations models perform better than regressions. Journal of Consumer Psychol-ogy, 17(2), 140-154.
Jefferis, E., Dogutas, C., Butcher, F., Davis, M. S., & Flannery, D. J. (2008). Research note: Temporal variations in school-associated, nonfatal violence. Law Enforcement Executive Forum, 8(6), 95-105.
Jöreskog, K. G., & Sörbom, D. (2006). LISREL 8.80 for Windows [Computer Software]. Lincolnwood, IL: Scientific Software Inter-national, Inc.
Kawachi, I., Kennedy, B. P., & Wilkinson, R. G. (1999). Crime: Social disorganization and relative deprivation. Social Science & Medi-cine, 48, 719-731.

20 Law Enforcement Executive Forum • 2012 • 12(4)
Ko, S. J., Ford, J. D., Kassam-Adams, N., Berkowitz, S. J., Wilson, C., Wong, M., . . . Layne, C. M. (2008). Creating trauma-informed systems. Professional Psychology: Research and Practice, 39(4), 396-404.
Lanktree, C. B., Gilbert, A. M., Briere, J., Taylor, N., Chen, K., Maida, C. A., & Saltzman, W. T. (2008). Multi-informant assessment of mal-treated children: Convergent and discrimi-nant validity of the TSCC and TSCYC. Child Abuse and Neglect, 32, 621-625.
Marsh, H. W., & Hocevar, D. (1985). Applica-tion of confirmatory factor analysis to the study of self-concept: First and higher order factor models and their invariance across groups. Psychological Bulletin, 97(3), 562-582.
Martínez, R., Rosenfeld, R., & Mares, D. (2008). Social disorganization, drug market activ-ity, and neighborhood violent crime. Urban Affairs Review, 43(6), 846-874.
Milam, A. J., Furr-Holden, C. D. M., & Leaf, P. J. (2010). Perceived school and neighbor-hood safety, neighborhood violence and aca-demic achievement in urban school children. Urban Review, 42(5), 458-467.
Mrug, S., Loosier, P. S., & Windle, M. (2008). Violence exposure across multiple contexts: Individual and joint effects on adjustment. American Journal of Orthopsychiatry, 78(1), 70-84.
Mrug, S., & Windle, M. (2010). Prospective effects of violence exposure across multiple contexts on early adolescents’ internalizing and externalizing problems. Journal of Child Psychology and Psychiatry, 51(8), 953-961.
Nansel, T. R., Overpeck, M. D., Haynie, D. L., Ruan, J., & Scheidt, P. C. (2003). Relation-ships between bullying and violence among U.S. youth. Archives of Pediatrics & Adolescent Medicine, 157(4), 348-353.
Nickerson, A. B., & Slater, E. D. (2009). School and community violence and victimization
as predictors of adolescent suicidal behavior. School Psychology Review, 38(2), 218-232.
O’Keefe, M. (1997). Adolescents’ exposure to community and school violence: Prevalence and behavioral correlates. Journal of Adoles-cent Health, 20(5), 368-376.
Osgood, D. W., & Chambers, J. M. (2000). Social disorganization outside the metrop-olis: An analysis of rural youth violence. Criminology, 38(1), 81-116.
Owens, T. J., & Shippee, N. D. (2009). Depressed mood and drinking occasions across high school: Comparing the recipro-cal causal structures of a panel of boys and girls. Journal of Adolescence, 32, 763-780.
Raykov, T., & Marcoulides, G. A. (2000). A first course in structural equation modeling. Mahwah, NJ: Lawrence Erlbaum Associates.
Sampson, R. J., & Groves, W. (1989). Commu-nity structure and crime: Testing social-dis-organization theory. The American Journal of Sociology, 94(4), 774-802.
Sampson, R. J., Raudenbush, S. W., & Earls, F. (1997). Neighborhoods and violent crime: A multilevel study of collective efficacy. Science, 15(277), 918-924.
Seals, D., & Young, J. (2003). Bullying and vic-timization: Prevalence and relationship to gender, grade level, ethnicity, self-esteem, and depression. Adolescence, 38(152), 735-747.
Singer, M. I., Anglin, T., Song, L., & Lunghofer, L. (1995). Adolescents’ exposure to violence and associated symptoms of psychological trauma. JAMA: Journal of the American Medi-cal Association, 273(6), 477-482.
Singer, M. I., Miller, D. B., Guo, S., Flannery, D. J., Frierson, T., & Slovak, K. (1999). Contributors to violent behavior among elementary and middle school children. Pediatrics, 104(4), 878-884.

Law Enforcement Executive Forum • 2012 • 12(4) 21
Slovak, K., Carlson, K., & Helm, L. (2007). The influence of family violence on youth atti-tudes. Child and Adolescent Social Work Jour-nal, 24(1), 77-99.
Song, L., Singer, M., & Anglin, T. (1998). Vio-lence exposure and emotional trauma as contributors to adolescents’ violent behav-iors. Archives of Pediatrics & Adolescent Medi-cine, 152(6), 531-536.
Stockdale, S. E., Wells, K. B., Tang, L., Belin, T. R., Zhang, L., & Sherbourne, C. D. (2007). The importance of social context: Neigh-borhood stressors, stress-buffering mecha-nisms, and alcohol, drug, and mental health disorders. Social Science & Medicine, 65(9), 1867-1881.
Theall, K. P., Scribner, R., Broyles, S., Yu, Q., Chotalia, J., Simonsen, N., . . . Carlin, B. P. (2011). Impact of small group size on neigh-borhood influences in multilevel models. Journal of Epidemiology and Community Health, 65, 688-695.
Van Dulmen, M. H. M., Belliston, L. M., Flannery, D. J., & Singer, M. (2008). Confir-matory factor analysis of the recent exposure to violence scale. Children & Schools, 30(2), 93-102.
Xue, Y., Leventhal, T., Brooks-Gunn, J., & Earls, F. J. (2005). Neighborhood residence and mental health problems of 5- to 11-year-olds. Archives of General Psychiatry, 62, 554-563.
Contact Information Fredrick Butcher The Begun Center for Violence Prevention Research and Education Mandel School of Applied Social Sciences Case Western Reserve University 11402 Bellflower Road Cleveland, OH 44106-7167 (216) 368-0370 E-mail: [email protected]

22 Law Enforcement Executive Forum • 2012 • 12(4)
School Safety: An Assessment of School Resource Officer Programs from the Perspective of School PersonnelJames P. Koch, Lewis University
IntroductionSchools have traditionally been viewed as safe havens for children. However, the safety of America’s students has come under intense scrutiny, mostly due to several outbreaks of highly publicized acts of school violence. The news media’s portrayal of school trag-edies, such as the massacre at Columbine High School in 1999, have triggered society’s fears of victimization and the realization that school violence can occur anywhere at any time. While such events are rare occurrences, these events have ensured that school safety will remain an important national issue.
School administrators continue to struggle to provide students with a safe learning environ-ment. The School Resource Officer (SRO) pro-gram was developed in part to help alleviate fears about school violence. The practice of plac-ing full-time, sworn police officers in schools as their permanent work assignment repre-sents one of the most significant responses to the problem of school violence. Police officers are being assigned to an increasing number of the nation’s schools (VanCleave, 2008). School-based policing has become one of the fastest growing areas of law enforcement (National Association of School Resource Officers, 2010). School-based police officers have been called by many names, but School Resource Officer is the most common. For purposes of continuity, school-based police officers will be referred to as School Resource Officers (SROs) for the remainder of this document.
The purpose of this study was to evaluate the SRO program from the perspective of school personnel, specifically administrators,
teachers, counselors, social workers, and sup-port staff. This study focuses on the opinions of the staff at a suburban community high school district which employs an SRO at each of its two high schools.
The insertion of police officers into the school system is a relatively new practice, and the support of school employees is critical to estab-lishing the partnership necessary to maintain a safe learning environment. A review of the literature indicates that very little is known about school personnel’s perceptions of the SRO program. Previous research has focused on the perceptions of police administrators, school administrators, and individual SROs, and very little research has included the per-ceptions of regular school personnel.
While the focus of this study is the SRO pro-gram, the aim of this study is to gain a greater understanding about school personnel’s atti-tudes about the SRO program and its poten-tial impact on their perceptions of school safety. This information is essential to learn-ing whether or not the SRO program has an impact on school safety, defining that impact, and deciding whether the program is worth continuing.
In order to help fill in the gap in the available research, this study used quantitative research methods to analyze the perceptions of school personnel in regard to the SRO program. This study analyzed data gathered from school personnel in a suburban community high school district with a well-established SRO program in an attempt to determine whether school personnel feel that SROs are a valuable addition to the learning environment. This

Law Enforcement Executive Forum • 2012 • 12(4) 23
study also seeks to identify how demographic characteristics relate to school personnel’s perception of the SRO program.
Since nearly all school employees interact in one way or another with the SRO, their opin-ions can provide policymakers with impor-tant information about how best to maintain a safe learning environment (Jackson, 2002). As stated by Johnson (1999), “Society has a vested interest, opportunity, and obligation to create, monitor, improve, and evaluate school-based prevention programs” (p. 173).
Literature Review
School Violence
In the late 1990s, it seemed as if an epidemic of violence had hit America’s schools. It appeared as if students were arming themselves with guns and bombs and heading to school to kill their teachers and classmates instead of heading to school with books in their hands (Egan, 1998). The aftermath of these incidents also gave rise to several alarming government publications, such as the Federal Bureau of Investigation’s publication, The School Shooter: A Threat Assessment Perspective (O’Toole, 1999), and the U.S. Department of Education’s (2000) publication, Safeguarding Our Children: An Action Guide. The government appeared to be panicking right along with the general public to come up with answers, and as a result, the U.S. Department of Justice opened its wallet with hopes of making our nation’s schools safe once again (Keiger, 2002).
Kids killing kids is nothing new in America, but high-profile incidents such as the Columbine High School, Virginia Tech, and Northern Illinois University school shootings have forced the public to consider the horrific consequences of bullying and school violence. These incidents have also left educators wondering whether it is possible to return our nation’s schools to the safe havens they once were. While it is not exactly clear whether violence in American schools is actually getting worse, it makes sense that the public perceives that it is due
to the overwhelming amount of news media coverage that school violence incidents receive (Joong & Ridler, 2006).
The tragedy at Columbine High School put schools across the country on high alert for hit lists made by troubled students (Juvonen, 2001; Toppo, 2009). In the wake of Columbine, school districts nationwide have re-exam-ined their procedures for keeping students safe. According to Toppo and Elias (2009), Columbine launched the school safety move-ment, as well as the school safety research industry. After Columbine, schools began locking their doors and limiting building access, installing security cameras, utilizing mass emergency notification call systems, and requiring visitors to be screened and to wear identification badges.
Since Columbine, and with each new incident of school violence, schools experience increas-ing concerns about school crisis management issues. The growing presence of weapons, gangs, and other disruptions continue to plague schools nationwide. All of these things add up to a growing concern that America’s schools are not the safe havens they once were, and school violence has forever altered the school climate. Today, both teachers and students express concern that they no longer feel safe in America’s schools (Schreck, Miller, & Gibson, 2003)
History of the School Resource Officer (SRO) Program
Contrary to popular belief, SRO programs were not created solely as a response to inci-dents such as the massacre at Columbine High School. While the exact origin of school-based police officers is difficult to ascertain, the first SRO program is commonly agreed to have begun during the 1950s in Flint, Michigan, well before the series of high-profile shoot-ings in the 1990s (Center for the Prevention of School Violence, 2001). This marked the first time in the nation’s history that police officers were placed in schools as their per-manent work assignment (Sherling, 1998).

24 Law Enforcement Executive Forum • 2012 • 12(4)
The mission of the program was simply to improve the relationship between the police and the community’s youth. These school-based police officers served as law-related teachers and counselors to students. The pro-gram was regarded as highly successful and would serve as a model for future programs across the country (McNicholas, 2008).
A Florida police chief is often credited with coining the term School Resource Officer some-time during the 1960s (McDaniel, 2001, p. 4). The SRO program was expanded during the 1960s and 1970s in Florida (Girouard, 2001), but it would take another 20 years before the program caught on elsewhere (Uchida, 2002). These early SRO programs focused on the pre-vention of criminal activity, particularly those offenses that youth were more likely to par-ticipate in such as drug abuse, sexual activity, and underage drinking (Alderson, 1980).
Most early SRO programs were decentralized and very informal efforts (Johnson, 1999). These early programs consisted of little inter-action with students and staff and very little information-sharing or reciprocal reporting. SROs also were not always assigned to a par-ticular school on a full-time basis. Oftentimes SROs were responsible for many schools, and their interactions consisted of random walk-throughs of the schools for which they were responsible. SRO programs lacked centraliza-tion until the 1990s when national attention became focused on school safety (Johnson, 1999). The Columbine High School shooting in particular became a major force behind spending public money on police officers in public schools (Keiger, 2002).
The SRO program was dramatically bol-stered by President Clinton’s $60 million in funding to support the Department of Jus-tice, Office of Community Oriented Policing Services, or COPS in Schools program. This funding resulted in the addition of 452 offi-cers in schools (Juvonen, 2001). Funding for the program continued, and nearly tripled, under President Bush (Gray, 2003). According to the U.S. Department of Justice, the Office of
Community Oriented Policing Services (2005) has awarded more than $753 million to more than 3,000 law enforcement agencies to fund over 6,500 SROs.
Today, SRO programs are widely utilized. The National Association of School Resource Offi-cers (NASRO) reports that variations of the SRO program are in place nationwide (May, Cordner, & Fessel, 2004). Evidence of this can be found in the number of officers who attend NASRO’s yearly conference (McDaniel, 2001). Curtis Lavarello, the executive director of NASRO, reports there are now approximately 14,000 SROs working in schools across the country (Keiger, 2002).
In 1997, the Center for the Prevention of School Violence surveyed attendees, representing 35 states, at NASRO’s annual conference. The survey indicated SROs are most often assigned to high schools; a majority of SROs provide coverage to one particular school; the majority of SROs are veteran officers who volunteer for the SRO assignment; SROs most often are certified or sworn police or sheriff’s department officers; and SROs most often wear their uniforms and carry a firearm while performing their roles (McDaniel, 2001).
Expectations of the SRO Program
Parents and students have come to accept the position of SRO as part of public education. Many parents expressed the belief that their children were safer in schools that had SROs. I feel the program has helped the image of law enforcement in my community.
–SRO, Carroll County Sheriff’s Office
Johnson (1999) states, “the overall goal of the SRO program is to provide a safe school environment conducive to learning” (p. 179). According to Johnson, success of the SRO pro-gram relies on the SRO’s ability to (1) reduce the prevalence of weapons, drugs, and gang-related activities; (2) monitor students’ movements; (3) maintain a secure school

Law Enforcement Executive Forum • 2012 • 12(4) 25
environment; (4) provide support to school administrators, teachers, and staff; (5) provide counseling services to students; and (6) be highly mobile, visible, and flexible (p. 179).
One of the most important jobs of the SRO is to ensure the safety and security of the school’s students and staff. The SRO is tasked with identifying deficiencies within school policies and safety procedures and with help-ing develop policies that address criminal activity and school safety (U.S. Department of Justice, Office of Community Oriented Polic-ing Services, 2005). The SRO cannot fulfill these tasks without being able to communi-cate effectively with the school administra-tion, staff, and students (McNicholas, 2008). According to Benigni (2004), “when educa-tors and police personnel share their knowl-edge and expertise, students are best served, education is enhanced, and communities are strengthened” (p. 46).
According to VanCleave (2008), the effective-ness of the SRO program relies heavily upon the school and police administrators’ deci-sions about how the SRO will be utilized. Interagency cooperation is a must because SRO programs cannot function properly with-out shared control between the law enforce-ment agency and the school.
Crime Prevention and Improving the Image of Law Enforcement
A major area of concern for police depart-ments and schools is measuring the perfor-mance of SRO programs. Research pertaining to the effectiveness of SRO programs usually focuses on whether the program decreases the number of crimes in schools and whether the program improves the public’s perception of the police (McDevitt & Panniello, 2005). Exist-ing research points to the successes of SRO programs in positively impacting students, school staff members, and school administra-tors, in addition to reducing school violence, dropout rates, and disciplinary problems, and creating role models for students (Center for the Prevention of School Violence, 2001;
Johnson, 1999; May, Fessel, & Means, 2004; Scheffer, 1987, as cited in Gulen, 2010).
According to Finn (2006), there are four main benefits of SRO programs: (1) they reduce the workload of patrol officers; (2) they improve the image of police officers among young people; (3) they promote better working rela-tionships with schools; and (4) they enhance the police department’s reputation in the com-munity. SROs are said to prevent problems which would otherwise result in the police being called simply because students rec-ognize they can be arrested for wrongdoing (Finn, 2006).
School-based police officer programs have been described as the most effective type of school violence prevention program (Youth Violence in Connecticut Schools, 1999, as cited in Benigni, 2004). Existing research sug-gests that the mere presence of a police offi-cer has deterrent value. The SRO’s presence in schools is said to provide a sense of secu-rity for parents, staff members, and students (Forrest, 2010). According to the National Institute of Justice (NIJ) (1999), the officer’s police vehicle parked on campus also has deterrent value. Johnson (1999) suggested that the SRO’s police car serves as a reminder to outsiders that there is a police officer in the school building.
Critics argue that the SRO is not going to be able to prevent the majority of school violence incidents without being in the right place at the right time. Greenberg argued that there was an SRO on duty at Columbine High School on the day of the shootings (Keiger, 2002). The Governor of the State of Colorado, Bill Owens, appears to agree with Greenberg. In Owens’ (2001) report on the Columbine High School shootings, he refers to the SRO program as a failure because the SRO was unable to stop Klebold and Harris before they could commit their crimes.

26 Law Enforcement Executive Forum • 2012 • 12(4)
Perceptions of School Safety and the SRO Program
Feeling unsafe is not conducive to learning or teaching (Joong & Ridler, 2006). Columbine, Virginia Tech, and the Northern Illinois Uni-versity shootings have left a lasting impres-sion on school personnel (Keiger, 2002). Paul Vance, Superintendent of the Montgomery School District, stated, “I never thought in my career I would recommend electronic cameras in schools, but we’ve never had anything like this before in America” (Schulte, 1999, p. 1).
In the spring of 2000, the Virginia Depart-ment of Criminal Justice Services (DCJS) sur-veyed school staff members on the topic of school safety. The overwhelming majority of staff members surveyed reported feeling safe at school. A very small percentage (14%) of school staff members surveyed were fearful of being victimized. The staff members who were concerned about being victimized were more afraid of intruders than students, gang members, or parents (Virginia DCJS, 2001). The Virginia DCJS survey also revealed that 99% of the responding staff members supported having an SRO assigned to their school. The Virginia DCJS’s research also revealed that support for SROs increases as the degree of staff interaction with the SRO increases.
One study evaluating SRO programs exam-ined SROs in nine high schools in New Hamp-shire (Humphrey & Huey, 2001, as cited in Uchida, 2002). The findings revealed that the majority (74%) of teachers who reported feel-ing unsafe prior to the SRO program’s incep-tion reported feeling safe one year after the SRO program was in place. The teachers sur-veyed indicated that the SRO program made their schools better places to learn.
Criticism for the SRO program comes from a small proportion of school personnel.Johnson’s (1999) study revealed that some school teachers and administrators felt that SROs should be more visible in the school and in classrooms. May et al. (2004) asked school principals to identify the “single most
negative” aspect of the SRO program (p. 88). Most of the principals (57.4%) indicated there were no negative aspects of the SRO program. However, a small percentage (14.9%) of the principals indicated that the SRO program made their school appear unsafe.
According to Kupchik and Monahan (2006), the use of SROs demonstrates society’s accep-tance of crime as a social fact and encourages students to expect a police presence in their everyday lives. Despite the vast approval of the SRO program by school administrators, the opposition believes the program conflicts with the educational culture (VanCleave, 2008).
Personal Characteristics of School Resource Officers
According to Gulen (2010), the personal characteristics of SROs and how the officer is viewed by students are significant factors in determining whether the program will be a success or failure. Gulen believes that suc-cess is measured in terms of whether the SRO is viewed as a role model to students and is able to collaborate with students to pre-vent criminal activity. This collaboration also helps SROs clarify misconceptions that stu-dents might have about the police. Finn and McDevitt (2005) indicated that the SRO’s per-sonality and experience may also be the most important factors in determining the SRO’s priorities within the school.
A study by Lambert and McGinty (2002, as cited in Gulen, 2000) indicated significant dif-ferences exist between what school adminis-trators and SROs deem as important personal characteristics, skills, and job tasks. May et al. (2004) examined the traits identified by school principals as necessary for an SRO to be effec-tive. Communication skills was identified by school principals as the most important trait of an effective SRO. According to Gulen (2010), the only flaw in Lambert and McGinty’s study was that it did not indicate the seriousness of the differences between school administra-tors and SROs or whether these differences affected the SRO program’s success.

Law Enforcement Executive Forum • 2012 • 12(4) 27
Obstacles to the SRO Program
Despite the many successes of the SRO pro-gram, there are many obstacles that hinder the success of the program. The first obstacle liesin proving whether SROs are really needed.According to the National Education Associa-tion, the Justice Department’s National Crimi-nal Justice Reference Service, and the Surgeon General, the majority of America’s schools are relatively safe places (Keiger, 2002). Schoolsand law enforcement agencies must convince the community that placement of an SRO in a school does not mean the school is unsafe.
The collaboration between SROs and schoolsis considered to be the single most trouble-some area in establishing productive relation-ships due to the inherent differences between the cultures of schools and law enforcement(Finn, McDevitt, Lassiter, Shively, & Rich,2005, as cited in Gulen, 2010). Fundamentaldifferences exist between these two systems in terms of goals, strategies, and methods. Theschool culture is referred to as open and com-plex, consisting of various social relationshipnetworks. This is entirely different from thedominant closed culture of policing (Jackson,2002). According to VanCleave (2008), prob-lems are inevitable when forcing the twodiverse systems to merge.
One of the largest obstacles facing SRO pro-grams today involves funding. On September 6, 2000, the Department of Justice announced that $68 million in grants would be awarded to hire 599 SROs in 280 communities across the nation. Congress later appropriated an additional$5 million in 2000 and $3 million in 2001 to assist in training the new SROs (Girouard, 2001). Due to the availability of grants, the SRO programgrew rapidly nationwide (Minor, Fox, & Wells,2002).
Now that most of the federal funding hasrun out, police departments are encouragingschool districts to contribute financial sup-port for the SRO program. According to Finn(2006), police departments cite three mainpoints when encouraging school districts to
contribute funds: SRO programs (1) improve school safety, (2) increase the perception of school safety, and (3) provide a quick response time for emergency situations.
A lack of funding is the primary reason for termination of SRO programs. SRO programs today are typically funded fully or in part by school districts. Some SRO programs are par-tially funded by local civic organizations and charities as well as local and national busi-nesses (Finn, 2006). Huffman’s (1995) survey showed that schools funded 71% of the SRO program’s costs, while Gulen’s (2010) survey revealed that this rate had since dropped to 44%. As stated by Gulen, “A successful pro-gram can only be achieved through con-tinuous funding and a healthy collaboration between communities, school administrators, staff, school resource officers, and agencies” (p. 7). According to Finn (2006), “schools often can find the money if they value the program enough” (p. 6). The safety of students must not be hindered by financial matters.
Hypotheses
The researcher makes the following assumptions:
•
•
•
Thenewsmedia’scoverageofhighprofileincidents of school violence has substan-tially impacted the school climate. School violence incidents, such as the tragedy at Columbine High School, have resulted in school personnel being more concerned for their safety and therefore more supportive of the SRO program.
Newer or younger school employees willbe more concerned about their safety than older, more experienced school employees because younger people are more accus-tomed to school violence.
School-based police officer programs aregenerally the same across the country. While not all school-based police officer programs are specifically referred to as School Resource Officer programs, the majority of these programs are performing similar functions. This study assumes the

28 Law Enforcement Executive Forum • 2012 • 12(4)
differences in the programs make it diffi-cult to assess the program’s effectiveness.
•
•
•
•
•
•
•
•
•
SROprogramssufferfromalackofclearlydefined responsibilities, which results in school employees’ confusion about the role of the SRO.
Establishing productive relationships between the SRO and school personnel is a problem area for SRO programs due mostly to the fundamen-tal differences between the law enforcement and school cultures.
TheSROprogram improves school safetyby lessening school employees’ concerns about their safety.
Whileitisdifficulttomeasureprevention,school personnel will view the SRO’s pres-ence at school as a deterrent to criminal activity and violence.
Most school employees perceive the SROas more than simply a law enforcer at the school. School employees will be more likely to refer to the SRO program as a pro-active or prevention-based program rather than an arrest-focused and reactionary type of program.
SRO programs can improve the image oflaw enforcement officers in general and can help law enforcement officers be recog-nized as professionals.
Interaction with students is an importantaspect of the SRO program. School employ-ees support the SRO’s interactions and involvement with students, especially in educating students about the legal system.
The individual characteristics of the SROare important factors in determiningwhether the program will be a success or failure. Intelligence and a good personal-ity are key factors in the success of the SRO program and in gaining the acceptance of school personnel.
MostSROprogramswereinitiallyfundedby federal grant money. However, grant money is not infinite, so funding the SRO program may eventually become problem-atic. Once federal funding runs out, shared funding arrangements are the most logical solution. While most school personnel may not know how SRO programs are funded, they will agree that the costs of the program
should be shared among the school and law enforcement agency.
MethodologyThe primary purpose of this study was to examine the SRO program from the perspec-tive of school personnel. This study examined school personnel’s perceptions of the SRO pro-gram in order to determine whether the SRO prevents criminal activity at school, reduces school personnel’s fear of school violence, increases school personnel’s perceptions of school safety, acts as a deterrent to criminal activity, increases students’ knowledge of the legal system, and improves the image of law enforcement officers. This section discusses the research design, the target population, inclusion and exclusion criteria, the survey instrument, data collection and analysis meth-ods, and ethical considerations.
Research Design
A review of the literature has revealed that the opinions of the people most likely to interact with the SRO, school employees, have been ignored. Existing research relies heavily on the perceptions of SROs and school adminis-trators, and research pertaining to the percep-tions of teachers is limited. In order to address this deficiency, a quantitative research study was conducted. The quantitative research method allowed for statistical analysis by quantifying the data gathered (Patten, 2009). This research method allowed the researcher to measure school personnel’s perceptions about school safety and the SRO program, and it allowed the researcher to easily reduce the data produced to numbers (Patten, 2009).
The decision to utilize quantitative over quali-tative research methodology was influenced by the objective of this study and the size of the target population (Bernard, 2000, as cited in VanCleave, 2008). This study could not achieve its purpose without accessing as many school employees as possible. The size of the research population was approximately 400 school employees. The data were collected

Law Enforcement Executive Forum • 2012 • 12(4) 29
over a 10-day period. The quantitative research method allowed the researcher to gather data from a fairly large research population in the short amount of time allotted to this research study (Patten, 2009). The quantitative research method was also chosen because the researcher believed that school personnel might be more willing to participate in the study and respond honestly to survey questions than they would utilizing a qualitative research method.
This research study was descriptive by design as it was not the intention of the researcher to change behaviors or conditions but rather to measure the data as they are. The study was conducted using a nonrandom sample of school personnel. Access was a critical factor in this research study. The researcher spe-cifically selected this population because the researcher has experience working with these schools and is familiar with the communities. The researcher believes that these relation-ships have contributed toward both schools’ administrators allowing their employees to be part of this study, therefore creating a conve-nience sample (VanCleave, 2008). This sample was also large enough to provide reliable and valid data pertaining to a well-established SRO program (VanCleave, 2008).
Description of the Target Population
The target population in this study consisted of school personnel employed by a suburban community high school district during the 2010-2011 academic school year. For purposes of this research study, school personnel refers to all of the school district’s employees falling into one of the following categories: admin-istrator, teacher, counselor, social worker, or support staff. Approximately 400 of the com-munity high school district’s employees were afforded the opportunity to participate in the study. The location of the study has not been disclosed for reasons of confidentiality.
The community high school district which served as the target population for this research study serves an enrollment of more than 3,000 students. The school district is
comprised of several communities and unin-corporated areas with a total population of approximately 60,000 people. The district has been recognized for its many academic and extracurricular achievements locally, state-wide, and nationally.
The SRO program at the target community high school district has been in place for more than 12 years. An SRO is currently assigned to each of the district’s two high schools. Both SROs are sworn police officers with their local police departments and work at their assigned high school on a full-time basis. The SROs have both participated in train-ing provided by NASRO and have attended NASRO’s annual school safety training con-ferences. The SROs’ duties are consistent with NASRO’s triad concept. As stated in the lit-erature review, the triad concept involves law enforcement, counseling, and teaching.
Inclusion Criteria
In regard to researcher’s inclusion criteria for this study, the survey participants were expected to be employees of the target com-munity high school district serving in one of the following types of roles: administrator, teacher, counselor, social worker, or support staff. The participants were expected to be familiar with the English language for pur-poses of comprehending the survey instru-ment. The participants also were expected to be familiar with the use of a computer, their employer-provided e-mail account, and the Internet for purposes of locating the survey instrument.
Exclusion Criteria
In regard to the exclusion criteria for this study, the study did not include maintenance or janitorial staff; buildings and grounds staff; cafeteria workers; athletic trainers; or coaches who were not also employed by the school district as an administrator, teacher, coun-selor, social worker, or support staff.

30 Law Enforcement Executive Forum • 2012 • 12(4)
Instrumentation
A five-part, 27-item survey instrument, enti-tled Assessment of School Resource Officer (SRO) Programs, was developed to collect data for this study. The survey was created and imple-mented using a Web-based tool for the creation of online surveys called SurveyMonkey (www.surveymonkey.com). SurveyMonkey allows users to design surveys, collect responses, and analyze the data collected. For purposes of this research project, the researcher utilized the website to collect information regarding school personnel’s perceptions of the SRO program at two high schools belonging to a suburban community high school district.
The survey was designed to measure the per-ceptions of school personnel pertaining to school safety and their school district’s SRO program. The questions contained in thesurvey were based upon what the researcher discovered during a review of the literature. A copy of the survey can be found in the Appendix.
The survey was divided into five sections. The first section of the survey focused on demographic characteristics such as gender, race, age, marital status, whether or not the respondent has children, the respondent’s role at their institution, and how many years the respondent has served in their current capacity. This section utilized a nominal scale of measurement in which the research asked respondents to name their status (Patten, 2009). Demographic information is important because it provides readers with informa-tion about the types of individuals who make up the sample for the study, and it is useful during the analysis and interpretation of the study’s results (Patten, 2009). For example, the perceptions of school personnel on the SRO program could be impacted by their years of experience.
The second section of the survey contained two dichotomous questions pertaining to the respondents’ perceptions of school safety.This section utilized a nominal scale of
measurement as well, asking respondents to respond using either Yes or No.
The third section of the survey contained an attitude-type instrument studying agreement which consisted of 16 statements attempting to identify respondents’ opinions about the SRO program. This section utilized a 5-point Likert-type attitude scale to record responses ranging from Strongly disagree to Strongly agree with the particular statements about each respondent’s SRO program. The Likert-type attitude scale was chosen because the researcher believed that it would be familiar to most of the respondents.
The fourth section of the survey asked respon-dents to identify two characteristics that best describe their particular SRO. This section utilized a nominal scale of measurement, and the responses included characteristic descrip-tions ranging from intelligent to useless. This section focused on the respondents’ personal opinions of their individual SRO. This ques-tion was included to determine whether cer-tain types of school personnel characterize the SRO differently than others.
The survey’s fifth and final section asked respondents to identify how SRO programs should be funded. The researcher assumed that most respondents do not know how SRO programs are funded. Funding is very important, especially at the time in which this research study was completed, as agencies struggle to balance budgets. This section also utilized a nominal scale of measurement.
The survey instrument was tested for reli-ability prior to it being distributed to school personnel. Problems with the survey were corrected before it was distributed to the respondents. These procedures did not affect the survey’s validity.
Data Collection Methods
The data for this study were collected during November 2010, using the Web-based survey provider SurveyMonkey. Prior to beginning
Law Enforcement Executive Forum • 2012 • 12(4) 31
this research study, and in accordancewith ethical considerations in research, the researcher obtained access to the participants by first obtaining the permission of the admin-istrators at both of the target school district’s two high schools. The researcher met with the administrators from both schools where potential respondents would be surveyed to discuss the research project and answer any questions and address any concerns about the study. The researcher was granted permission by both administrators to distribute surveys to the school district’s personnel. The surveys were distributed to all of the school district’s employees falling under the following catego-ries: administrator, teacher, counselor, social worker, and support staff.
The method for distributing the surveys involved the researcher sending an e-mail to the assistant principal at each high school which contained a hyperlink to the survey. A hyperlink is defined as a graphic or text contained in an Internet document that can connect the reader to another Internet web-page or document (wiseGEEK, 2010). For purposes of this research study, the hyper-link (www.surveymonkey.com/s/YL89DJX) contained in the researcher’s e-mail allowed potential respondents with direct access to the survey. After receiving the hyperlink from the researcher, the assistant principals at both high schools forwarded the hyperlink to all of the targeted employees at the high school via the employees’ school district-provided e-mail address. The surveys were distributed to approximately 400 school employees in total, and the potential respondents were pro-vided 10 days to complete the survey.
The researcher followed Human Safety Proce-dures in the collection of all data. These proce-dures included informed consent, confidenti-ality, and protection of subjects from harm. In accordance with these procedures, the survey began with a cover letter which advised the potential respondent of the purpose of the survey, advised the potential respondent that they could withdraw from the survey at any time, and advised the potential respondent
that their personal information would not be collected and their identities would remain confidential.
The researcher believes that the survey’s appearance is important to obtain an accept-able return rate. This belief factored into the researcher’s choice to utilize SurveyMonkey to create and distribute the survey. The researcher utilized a standard, easy-to-read, font and intended to make the survey more visually appealing by using an orange-colored theme which is consistent with the season in which the survey was distributed. Care was also taken to provide adequate space between survey items and sections to avoid confusion.
The researcher acknowledges several limi-tations of this type of research study. For example, the number of respondents may vary depending on the availability of school personnel. This study assumed that school personnel check their school district-provided e-mail accounts regularly and have access to the Internet in order to complete the survey. Since this survey was only open for 10 days, the response timeframe may have affected the response rate. Some people also may have refused to be surveyed simply because the survey was not work-related.
Data Analysis Methods
Once the data were collected, the next chal-lenge was to identify significant findings. The researcher utilized SurveyMonkey to col-lect and analyze the results of the survey. SurveyMonkey allowed the researcher to ana-lyze the survey data within its Analyze section. This section contained a Response Summary, which presented the data in a bar graph pre-sentation and allowed the researcher to check the total response count, percentages, respon-dent count, and response averages. Also, as a professional subscriber to the website, the researcher was able to perform a deeper analysis through the use of filtering and cross tabulating the data (SurveyMonkey, 1999).

32 Law Enforcement Executive Forum • 2012 • 12(4)
Discussion of FindingsThe purpose of this study was to examine school personnel’s perceptions of the SRO program. The last section provided a detailed description of the methods used to obtain data. This section will be dedicated to present-ing the data obtained.
Demographic Data
Approximately 400 surveys were distributed to a research population consisting of school administrators, teachers, counselors, social workers, and support staff employed by a sub-urban community high school district which employs two SROs. At the end of the 10-day collection period, the researcher received 164 total completed surveys out of 177 started sur-veys. Since 177 surveys were started out of the 400 distributed, this equated to a return rate of 44.3%, which indicates a significant return rate.
The demographic characteristics of the school personnel who provided data for this study are presented in Table 1. A majority (69.1%) of the school personnel asked to participate were female, and a large proportion (97.7%) of the total respondents were Caucasian. A majority (58.2%) of the respondents were between 40 and 59 years of age. Most (75.3%) of the respondents were married, and a large number (73.4%) had children. Teachers repre-sented 44.3% of the survey respondents, while support staff members represented 35.8% of the respondents. The survey respondents reported a wide range of experience serving in their current capacities. Very few (15.3%) of the respondents had less than three years of experience, and the greatest number (22.7%) of respondents had more than 15 years of experience serving in their current capacity.
School Personnel’s Responses Regarding Concerns for Safety at School
School personnel were asked two ques-tions related to concerns about their safety at school. The majority (61.9%) of school
personnel indicated they were not concerned about their own safety at school. However, a significant percentage (38.1%) of respondents reported being concerned about their safety at school. School personnel were then asked to gauge the impact of school shootings, such as the tragedy at Columbine High School, on concerns for safety at school. The overwhelm-ing majority (97.7%) of school personnel reported that school shootings have caused school personnel to be more concerned about their safety at school.
Table 1. Demographic Statistics of the Sample
Response Count
%
Gender Male FemaleRace Caucasian Asian African American Latino/Hispanic Native AmericanAge 21-29 30-39 40-49 50-59 60+Marital Status Single/Never married Married Separated Divorced WidowedChildren Yes NoOccupation Administrator Teacher Counselor Social worker Support staffYears Serving in Current Capacity < 3 years 3-5 years 6-10 years 11-15 years 15+ years
54121
172 0 2 1 1
22 33 51 51 18
24131 3 14 2
127 46
20 78 10 5 63
27 36 37 36 40
30.969.1
97.70.01.10.60.6
12.618.929.129.110.3
13.875.31.78.01.1
73.426.6
11.444.35.72.8
35.8
15.320.521.020.522.7

Law Enforcement Executive Forum • 2012 • 12(4) 33
By filtering and cross tabulating the responses,it was revealed that school administra-tors were most likely to report a concern fortheir safety at school, with 60% respondingthat they were concerned about their safety.Administrators who were concerned abouttheir safety were most often married (83.3%),between 40 and 59 years of age (83.4%), andhad children (81.8%). In contrast, social work-ers were the least likely to report a concern fortheir safety at school, with 100% of the socialworkers reporting not being concerned aboutthis issue.
Teachers made up the largest group of respon-dents with 44.3% of the total sample. Whilethe majority of teachers (71.8%) reportedthey were not concerned about their safety atschool, those teachers who were concernedabout their safety were most likely to bebetween 40 and 49 years of age (52.4%), havemore than 15 years of experience (54.5%), andwere most likely to be married (76.2%) andhave children (76.2%).
An interesting finding resulted from filter-ing and cross tabulating responses. It wasdiscovered that teachers with less than threeyears of experience reported the least concernfor their safety. Ten out of 11 teachers (90.9%)reported not being concerned about their safetyat school. The majority (63.6%) of these teach-ers were also between 21 and 29 years of age.
School Personnel’s Support of the SRO Program
In the third section of the survey, school personnel were asked whether they sup-port having an SRO assigned to their school and whether they would like to see the SRO
program continue in the future at their school. These data are presented in Table 2.
Nearly all (97.6%) of the school personnel sur-veyed indicated a strong support of the SRO program at their school, and 97.6% also indi-cated they would like to see the program con-tinue in the future.
By filtering and cross tabulating the data, it was revealed that social workers looked upon the SRO program most favorably, with all (100%) of the social workers responding they strongly agree with the statement I support having an SRO assigned to my school.
Only three respondents indicated they do not support having an SRO assigned to their school. All three of these respondents were female.
School Personnel’s Responses Regarding the SRO’s Role
The SRO program at the location where school personnel were surveyed followed the triad model of law enforcement, counseling, and educating. In order to gauge school per-sonnel’s perception of the SRO’s role, school personnel were asked whether they under-stood the SRO’s role. School personnel were also asked whether they would describe the SRO’s role as reactionary and arrest-focused. The response results are presented in Table 3.
The majority (81.8%) of school person-nel reported having an understanding of the SRO’s role at their school. The majority (77.4%) of school personnel also indicated that the SRO’s role is something other than reac-tionary and arrest-focused.
Table 2. School Personnel’s Support for the SRO Program
Strongly Strongly Response Disagree Disagree Neutral Agree Agree Count
I support having an SRO assigned to 1.2% (2) 0.6% (1) 0.6% (1) 12.9% (22) 84.7% (144) 170my school.I would like to see the SRO program 0.6% (1) 0.6% (1) 1.2% (2) 22.5% (38) 75.1% (127) 169continue.
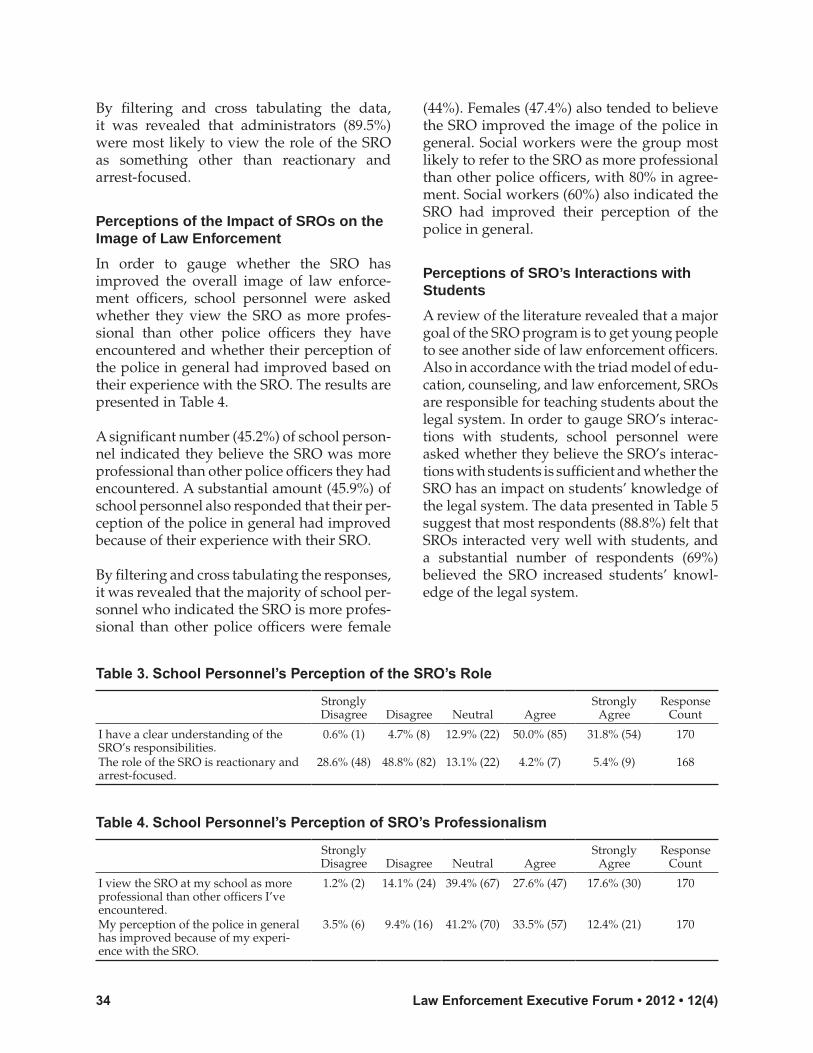
34 Law Enforcement Executive Forum • 2012 • 12(4)
By filtering and cross tabulating the data, it was revealed that administrators (89.5%) were most likely to view the role of the SRO as something other than reactionary and arrest-focused.
Perceptions of the Impact of SROs on the Image of Law Enforcement
In order to gauge whether the SRO hasimproved the overall image of law enforce-ment officers, school personnel were asked whether they view the SRO as more profes-sional than other police officers they have encountered and whether their perception of the police in general had improved based on their experience with the SRO. The results are presented in Table 4.
A significant number (45.2%) of school person-nel indicated they believe the SRO was more professional than other police officers they had encountered. A substantial amount (45.9%) of school personnel also responded that their per-ception of the police in general had improved because of their experience with their SRO.
By filtering and cross tabulating the responses, it was revealed that the majority of school per-sonnel who indicated the SRO is more profes-sional than other police officers were female
(44%). Females (47.4%) also tended to believe the SRO improved the image of the police in general. Social workers were the group most likely to refer to the SRO as more professional than other police officers, with 80% in agree-ment. Social workers (60%) also indicated the SRO had improved their perception of the police in general.
Perceptions of SRO’s Interactions with Students
A review of the literature revealed that a major goal of the SRO program is to get young people to see another side of law enforcement officers. Also in accordance with the triad model of edu-cation, counseling, and law enforcement, SROs are responsible for teaching students about the legal system. In order to gauge SRO’s interac-tions with students, school personnel were asked whether they believe the SRO’s interac-tions with students is sufficient and whether the SRO has an impact on students’ knowledge of the legal system. The data presented in Table 5 suggest that most respondents (88.8%) felt that SROs interacted very well with students, and a substantial number of respondents (69%) believed the SRO increased students’ knowl-edge of the legal system.
Table 3. School Personnel’s Perception of the SRO’s Role
Strongly Strongly Response Disagree Disagree Neutral Agree Agree Count
I have a clear understanding of the 0.6% (1) 4.7% (8) 12.9% (22) 50.0% (85) 31.8% (54) 170SRO’s responsibilities.The role of the SRO is reactionary and 28.6% (48) 48.8% (82) 13.1% (22) 4.2% (7) 5.4% (9) 168arrest-focused.
Table 4. School Personnel’s Perception of SRO’s Professionalism
Strongly Strongly Response Disagree Disagree Neutral Agree Agree Count
I view the SRO at my school as more 1.2% (2) 14.1% (24) 39.4% (67) 27.6% (47) 17.6% (30) 170professional than other officers I’ve encountered.My perception of the police in general 3.5% (6) 9.4% (16) 41.2% (70) 33.5% (57) 12.4% (21) 170has improved because of my experi-ence with the SRO.

Law Enforcement Executive Forum • 2012 • 12(4) 35
By filtering and cross tabulating the responses, it was revealed that counselors (90%) responded most favorably about SROs’ interactions with students. Counselors (80%) also indicated that SROs increased students’ knowledge of the legal system. This data reflect the SROs satis-factorily performing the law-related education component of the triad model.
Perceptions of the Impact of SROs on Police/Community Relations
A review of the literature revealed another important aspect of the SRO program which involves bridging the gap between the police and the community. The SRO program, in accor-dance with the community policing philoso-phy, seeks to improve the relationship between law enforcement and the community. For this reason, school personnel were asked whether they believe the SRO improves collaboration between their school and the police depart-ment. The majority (77.1%) of school person-nel perceived the SRO program to be improv-ing collaboration between the school and the police department. Only two employees indicated that the SRO had not improved col-laboration between these agencies. A crosstab-ulating analysis of the responses revealed these responses came from female teachers.
Perceptions of the SRO’s Visibility and Availability
Based on a review of the literature, high vis-ibility and maintaining availability for staff and students should be a high priority of SROs who follow the triad model. In order to measure this component of the program, school personnel were asked their opinion about the SRO’s availability and visibility in
the school. The results presented in Table 6 suggest a large proportion of school person-nel (85.9%) believe the SRO’s availability is adequate to their needs.
By filtering and cross tabulating the responses, it was revealed that those who disagreed either simply or strongly with the SRO’s avail-ability were female (100%), were more likely to be teachers (60%), and most responded that they did not have a clear understanding of the SRO’s role at their school (40%). The school personnel who did not view the SRO’s avail-ability as adequate all (100%) responded that the SRO had not improved their perception of the police. These respondents were also most likely to look upon other aspects of the SRO program negatively. For example, 60% of these respondents did not believe the SRO increased students’ knowledge of the legal system.
The data listed in Table 6 suggest that a great majority (90.4%) of school personnel are happy with the SRO’s visibility at their school. While only three respondents (1.8%) indicated the SRO’s visibility is not sufficient at their school, a cross tabulation of these responses indicated that those respondents were all females (100%) who also responded that they were not con-cerned about their safety at school (100%). All three (100%) of the school personnel who pro-vided these responses also indicated they did not have a clear understanding of the SRO’s role at their school.
Perceptions of the Preventative Role of the SRO
A review of the literature revealed that the SRO program is based upon the commu-nity policing strategy, which focuses more
Table 5. School Personnel’s Perceptions of the SRO’s Interactions with Students
Strongly Strongly Response Disagree Disagree Neutral Agree Agree Count
The SRO’s involvement with students 0.0% (0) 1.2% (2) 10.1% (17) 43.8% (74) 45.0% (76) 169is good.The SRO increases student knowledge 1.2% (2) 5.4% (9) 24.4% (41) 46.4% (78) 22.6% (38) 168of the legal system.

36 Law Enforcement Executive Forum • 2012 • 12(4)
heavily upon prevention-based functions of law enforcement. This is a departure from a long history of the police serving a more reac-tionary or response-oriented role in commu-nities. In order to determine whether SROs are accomplishing this facet of community policing, school personnel were asked four questions related to whether they believe the SRO’s presence has had an impact at their school. The results are presented in Table 7.
A review of the literature indicated the SRO’s presence alone acts as a deterrent to crime. The results listed in Table 7 appear to support this information, with the majority of school personnel (83.3%) indicating the SRO’s pres-ence on campus deters crime. Not only did school personnel report that the SRO acts as a deterrent to crime, but most (65.1%) school personnel also believe the SRO prevents crime from occurring at school.
As mentioned earlier, nearly all (97.7%) of the school personnel reported that highly pub-licized incidents of school violence, such as the tragedy at Columbine High School, have caused them to be more concerned about their safety at school. The research presented in Table 7 suggests that the SRO’s presence on
campus has a substantial impact on making school personnel feel less concerned about a major event, such as a school shooting, occurring at their school. The data reflect that a large proportion of school personnel (75.4%) indicated the SRO’s presence at their school makes them feel safe, and a significant number of respondents (43.5%) also indicated that the SRO has reduced their concerns about a shooting occurring at their school.
By cross tabulating the responses, it was revealed that out of the respondents who indi-cated they were concerned for their safety at school, 85.4% of those respondents indicated the SRO’s presence at their school made them feel safer.
Perceptions of Whether the Success of the SRO is Dependent Upon the Individual
In order to examine whether characteristics of an individual SRO impact the success or failure of the SRO program, school personnel were asked whether they believe the success of the SRO program is dependent upon the individual SRO. The responses clearly indi-cate that school personnel believe the success of the SRO program is dependent upon the
Table 7. School Personnel’s Perception of the Preventative Role of the SRO
Strongly Strongly Response Disagree Disagree Neutral Agree Agree Count
The SRO’s presence on campus acts as 0.0% (0) 1.8% (3) 14.9% (25) 57.1% (96) 26.2% (44) 168a deterrent to crime.The SRO’s presence on campus makes 0.0% (0) 4.2% (7) 20.4% (34) 49.7% (83) 25.7% (43) 167me feel safe at school.The SRO’s presence has reduced my 1.8% (3) 17.6% (30) 37.1% (63) 27.6% (47) 15.9% (27) 170fear of a shooting.The SRO prevents criminal activity at 0.6% (1) 10.7% (18) 23.7% (40) 52.7% (89) 12.4% (21) 169school.
Table 6. School Personnel’s Perception of the SRO’s Availability and Visibility
Strongly Strongly Response Disagree Disagree Neutral Agree Agree Count
The SRO is available to school 1.2% (2) 1.8% (3) 11.2% (19) 39.4% (67) 46.5% (79) 170employees.The SRO’s visibility in my school is 0.0% (0) 1.8% (3) 7.8% (13) 40.7% (68) 49.7% (83) 167good.

Law Enforcement Executive Forum • 2012 • 12(4) 37
individual SRO. Nearly all of the respondents (89.9%) indicated the characteristics of the individual SRO are critical to the program’s success.
A cross tabulation of the responses revealed that administrators (100%) most stronglybelieved the success of the SRO program is dependent upon the individual SRO. A large percentage of teachers (92%) also strongly believed the success of the SRO programdepends on the individual SRO.
School Personnel’s Descriptions of the Individual Characteristics of Their SRO
As indicated in the last section, school person-nel overwhelmingly agree that the success of the SRO program is dependent upon charac-teristics of the individual SRO. In section four of the survey, the researcher sought to iden-tify how school personnel characterize their SRO. School personnel were asked to identify two characteristics which best describe their
SRO. The results of this section are presented in Figure 1.
An analysis of the data indicated that school personnel most often categorized their SRO as personable (54.7%) and intelligent (48.8%). A significant proportion of school personnel (43.5%) described their SRO as someone who solves problems, and 33.5% of the respondents described the SRO as fair. Only two respon-dents, representing 1.2% of the total respon-dents, described their SRO as useless, and only one respondent described the SRO as hostile.
An interesting result of the data, revealed by filtering the responses, indicated that admin-istrators, social workers, and support staff all chose the word intelligent as their first choice to describe their SRO. For counselors, intelligent came in second to personable. Teachers were less likely to refer to the SRO as intelligent. This may be due to lingering biases against the law enforcement officers as described ear-lier. Teachers most often described the SRO as
Figure 1. Please Choose Two Characteristics that Best Describe Your School’s SRO
SCHOOL PERSONNEL ASSESSMENT OF SRO PROGRAMS
18
Figure 8
An analysis of the data indicated that school personnel most often categorized their SRO as personable (54.7%) and intelligent (48.8%). A significant proportion of school personnel (43.5%) described their SRO as someone who solves problems, and 33.5% of the respondents described the SRO as fair. Only two respondents, representing 1.2% of the total respondents, described their SRO as useless, and only one respondent described the SRO as hostile. An interesting result of the data, revealed by filtering the responses, indicated that administrators, social workers, and support staff all chose the word intelligent as their first choice to describe their SRO. For counselors, intelligent came in second to personable. Teachers were less likely to refer to the SRO as intelligent. This may be due to lingering biases against the law enforcement officers as described in Chapter 2. Teachers most often described the SRO as personable (60.5%) and fair (40.8%). Teachers third choice was evenly split between someone
who solves problems and intelligent. School Personnel's Perceptions of How SRO Programs Should be Funded
A review of the literature revealed how finding funding can be problematic for the SRO program, especially once federal funding runs out. In the fifth and final section of the survey, school personnel were asked how they believe the SRO program should be funded. An analysis of the results revealed an overwhelming majority of school personnel (85.5%) believe the costs associated with the SRO program should be split between the school district and the law enforcement agency in which the SRO is employed.

38 Law Enforcement Executive Forum • 2012 • 12(4)
personable (60.5%) and fair (40.8%). Teachers’ third choice was evenly split between someone who solves problems and intelligent.
School Personnel’s Perceptions of How SRO Programs Should Be Funded
A review of the literature revealed how finding funding can be problematic for the SRO pro-gram, especially once federal funding runs out. In the fifth and final section of the survey, school personnel were asked how they believe the SRO program should be funded. An analysis of the results revealed that an overwhelming major-ity of school personnel (85.5%) believe the costs associated with the SRO program should be split between the school district and the law enforce-ment agency in which the SRO is employed.
Discussion and ConclusionThis study has extended the existing body of knowledge pertaining to SRO programs by including the opinions of those most often ignored. This study has also extended theexisting body of knowledge pertaining to SRO programs by examining how demographicvariables influence how school personnelrespond to survey items. The knowledgegained from this study may help provide a better overall picture of how SRO programs impact the school as a whole.
While this study filled a void in research per-taining to the SRO program, it is not with-out limitations. Ideally, an assessment of the SRO program would not only include school personnel but also students and SROs as par-ticipants. Unfortunately, this researcher was unable to include students in this study.
Limitations of the Study
This study is subject to the following addi-tional limitations:
• Thisstudywaslimitedtotwohighschoolsbelonging to the same suburban commu-nity high school district. A well-established SRO was in place at both high schools.
•
•
•
•
•
Thefocusofthisstudywasonesuburbancommunity high school district’s SRO pro-gram with no comparison to other SRO programs outside of the district.Thedatacollectedwerenotgeneratedfromrandomly selected samples of SRO pro-grams. The results, therefore, do not reflect SRO programs or school staff opinions in general. By its design and nature, this study and its findings may not be generalized to other populations. Two SROs serve the school district which served as the target for this study. As a result, the data collected may reflect more on the individual characteristics of the officers themselves rather than on the program itself.Theremaybeaproblemwithschooladmin-istrators being entirely forthcoming. School officials have a tendency to avoid offering negative data relating to school programs to avoid projecting a negative image on their schools.Optimally, an evaluation of an SRO pro-gram’s efficacy would include student per-ceptions of the program. This study is lim-ited to school personnel only.
The researcher acknowledges several addi-tional limitations which may have had an impact on the significance of the results of this study. The size of the research population is one of those factors. This study was limited to two high schools belonging to the same sub-urban community high school district. The researcher would have preferred to have had a research population which consisted of a greater number of schools, and included both rural and urban areas. The researcher would have also preferred to have had a more diverse population. This study’s sample population consisted of 97.7% Caucasian respondents. Replication of this study should include a wider range of schools with well-established SRO programs in place. By studying a wider range of schools, it would be possible to deter-mine whether the results obtained from this study are consistent. This would also allow researchers to more fully understand the issues that affect school personnel’s percep-tions of safety and the SRO program.

Law Enforcement Executive Forum • 2012 • 12(4) 39
Conclusion
This study demonstrates how SROs can con-tribute toward promoting and maintaining a safer learning environment. This studyalso demonstrated how the SRO program can benefit law enforcement agencies bybridging the gap between law enforcement and the community and by improving the image of law enforcement through the SRO’s professionalism.
The school personnel surveyed providedoverwhelmingly positive assessments ofthe SRO program at place in their commu-nity high school district. While not everyone indicated their support for the SRO program at the school district, there remains an over-whelming support for the program and its continuation.
The data collected from 177 returned surveys revealed that the majority of school personnel view the SRO program as a valuable addi-tion to the learning environment. The fol-lowing additional conclusions were drawn from the data collected: (1) the SRO program is viewed as more than just reactionary and arrest-focused; (2) the SRO is viewed as a pro-fessional and improves the image of police officers in general; (3) the SRO has positive interactions with students and increases stu-dent knowledge of the legal system; (4) the SRO improves communication and collabora-tion between the school district and the police department; (5) the SRO maintains high vis-ibility at the school; (6) the SRO’s presence is believed to deter criminal activity at the school; and (7) the SRO makes school person-nel feel safe and less concerned about a school violence incident occurring on campus.
This study was guided by 12 assumptions. The researcher assumed that high profile incidents of school violence have substan-tially impacted the school environment and have caused school personnel to be more con-cerned about their safety at school and, there-fore, more supportive of the SRO program. This assumption has been proven by the data
presented in “The Discussion of Findings” section. Nearly all of the school personnel sur-veyed indicated that high profile incidents of school violence, such as the tragedy at Colum-bine High School, have caused school person-nel to be more concerned about their safety.
The researcher assumed newer or younger school employees would be more concerned about their safety than older, more experi-enced school employees because younger people are more accustomed to school vio-lence. The data presented in the results sec-tion do not support this assumption. Con-trary to the researcher’s assumption, school personnel between the ages of 21 and 29 over-whelmingly reported not being concerned about their safety at school. School person-nel with five years of experience or less were actually most likely to report not being con-cerned about their safety at school. In actual-ity, school personnel between the ages of 40 and 59, and those with 15 years of experience or more, were more likely to report being con-cerned for their safety. School administrators were the group most likely to report being concerned about their safety.
The researcher assumed that school-based police officer programs are generally the same across the country. A review of the literature presented indicated that most schools and law enforcement agencies’ school-based police officer programs are similar and are classified as SRO programs. The school district studied refers to its school-based police officers as SROs. The SROs assigned to the school dis-trict’s two high schools follow the triad model of law enforcement, counseling, and educat-ing. However, the researcher was unable to prove or disprove the assumption because this study was limited to one school district.
The researcher assumed that SRO programs suffer from a lack of clearly defined respon-sibilities, which results in school employees’ confusion about the role of the SRO in their school. This assumption was disproven by the findings presented. The majority of school personnel surveyed indicated they have a
40 Law Enforcement Executive Forum • 2012 • 12(4)
clear understanding of the responsibilities of the SRO at their school. Although the major-ity of school employees surveyed in this study indicated an understanding of the SRO’s role at their school, the small percentage of school personnel who responded that they do not understand the SRO’s role should not be ignored.
The “Literature Review” section included a discussion pertaining to the problems which can result from the lack of a clearly defined role for SRO programs. It is not known how the school district studied provides its employees with information pertaining to the responsibilities of the SRO. However, this may be something which deserves attention. Clarifying the role of the SRO could benefit those school employees who indicated they did not fully understand the SRO’s role, and it may result in greater support for the SRO program as a whole.
The researcher assumed that establishing pro-ductive relationships between the SRO and school employees can be problematic due to the fundamental differences which exist between the police and school cultures. A review of the literature discussed the prob-lems which may result from a clash of conflict-ing cultures. A review of the data presented in the “Discussion of Findings” section does not suggest that the school district studied is experiencing any such problems. Therefore, this assumption was not proven.
The researcher also assumed that the SRO program improves school safety by lessening school employees’ concerns about their safety. This assumption was proven by the data gen-erated in the “Discussion of Findings” sec-tion. The majority of school personnel sur-veyed indicated the SRO makes them feel safer at school. A significant number of school employees also indicated that the SRO’s pres-ence at school has made them less concerned about a major incident, such as a school shoot-ing, occurring on campus. These findings are consistent with existing research such as the
findings reported by Humphrey and Huey discussed in the “Literature Review” section.
Another assumption was that school employ-ees would view the SRO as a deterrent to criminal activity and violence. In the “Liter-ature Review” section, Johnson (1999) indi-cated that preventing school-related problems was one of the primary reasons police officers were placed into schools. The findings pre-sented in the “Discussion of Findings” sec-tion prove the researcher’s assumption and are also consistent with existing research. An overwhelming majority of school person-nel surveyed believe the SRO’s presence on campus serves as a deterrent to crime, and a substantial majority believe the SRO prevents criminal activity from occurring at school.
The researcher then assumed that most school employees would perceive the SRO as more than someone who simply responds to prob-lems and arrests students who violate the law. The results presented in the “Discussion of Findings” section prove this assumption. A review of the literature indicated that SRO programs involve a combination of preventa-tive and reactionary duties (Trump, 2001). The results of this study are consistent with exist-ing research. A substantial majority of school personnel surveyed indicated the SRO’s role is more than just responding to problems and making arrests.
A further assumption of the researcher was that SRO programs improve the image of law enforcement officers in general and help law enforcement officers to be recognized as pro-fessionals. This assumption was proven by the results presented in the “Discussion of Find-ings” section. The results are also consistent with a review of the literature, which indicated that SROs can improve the police department’s reputation in the community (Finn, 2006). Nearly half of the school personnel surveyed believed the SRO was more professional than other police officers they encountered. Nearly half also reported that their perception of the police in general had improved because of their experience with their SRO.

Law Enforcement Executive Forum • 2012 • 12(4) 41
The researcher also assumed school person-nel would approve of the SRO’s involvement with students. A review of the literature indi-cated the importance of the SRO’s interac-tions with students, and teaching students about the legal system is a component of the triad model. This assumption was proven by the data. An overwhelming majority of school employees approved of the SRO’s interactions with students. The majority of school employ-ees also believed the SRO increased students’ knowledge of the legal system.
The idea that school employees would view the individual characteristics of SROs as criti-cal to the success of the program was also an assumption of the researcher as well as that school personnel would view specific charac-teristics, such as intelligence and personality, as the most important characteristics for SROs to possess. Both of the researcher’s assumptions were proven by the results presented herein. An overwhelming majority of school employ-ees indicated the success of the SRO program is dependent on the individual SRO. School employees were also most likely to describe their SRO as intelligent and personable. This assumption is considered to be proven because the SRO program was overwhelmingly sup-ported by school personnel, and the researcher further assumed that these traits were partially responsible for the success of the program.
The researcher also assumed school person-nel would view shared funding arrangements between schools and law enforcement agen-cies as the most logical solution to funding SRO programs once federal funding runs out. A review of the literature presented indicated that shared funding arrangements are typical. The data presented proved the researcher’s assumption. An overwhelming majority of school employees suggested the costs associ-ated with funding SRO programs should be split between the school district and the police department.
In addition to the aforementioned assump-tions, the researcher anticipated there would be differences in school personnel’s responses
based upon demographic factors such as age, gender, and years of experience. The results presented generally reflect a lack of disparity in these anticipated differences, and they do not support the researcher’s assumption.
Recommendations
The evidence presented in this study indi-cated that school personnel view the SRO as an effective means of improving school safety. However, further research is necessary to measure the actual impact of the SRO on crim-inal activity occurring on school campuses. This requires schools to keep track of criminal activity on school campuses and the interven-tions which may have resulted in prevent-ing criminal activity. This information could provide law enforcement administrators and school officials with further evidence of the SRO program’s benefits and may be useful in securing necessary funding for the program.
This study asked school personnel to choose characteristics that best describe their SRO. This study did not include a question about what characteristics are most desired in an SRO. Replication of this study should include a question pertaining to what attributes school personnel consider to be most important.
The researcher recommends that the SRO’s responsibilities need to be clearly defined in order to avoid confusion among all involved parties (i.e., law enforcement, school employ-ees, students, and the community). Law enforcement agencies and schools must work together to ensure that the SRO’s responsibili-ties are clearly defined and understood.
Another recommendation is that schools and law enforcement agencies work together in recruiting and selecting SROs. A review of the literature and the results of this study indicate that the SRO program requires a specific type of person. This person must be a good fit for the school climate.
The researcher also recommends that SROs maximize positive interactions with students.

42 Law Enforcement Executive Forum • 2012 • 12(4)
Not only is this a key component of the triad model, but it also assists SROs in gaining stu-dents’ trust.
Finally, the researcher recommends that SRO programs undergo frequent evaluation. Pro-gram evaluation allows for identification of problem areas and improvement.
ReferencesAlderson, J. (1980). Police and education.
Oxford Review of Education, 6(3), 227-230.
Benigni, M. D. (2004, January). When cops go to school. Principal Leadership, pp. 43-46.
Bernard, H. (2000). Social research meth-ods: Qualitative and quantitative approaches. Thousand Oaks, CA: Sage.
Center for the Prevention of School Violence. (2001). The effectiveness of school resource officers (Research Brief). Raleigh: Center for the Prevention of School Violence, North Carolina Department of Juvenile Jus-tice and Delinquency Prevention. Retrieved November 5, 2012, from www.ncdjjdp.org/cpsv/pdf_files/brief4.pdf.
Egan, T. (1998, June 14). Where rampages begin: A special report. From adolescent angst to shooting up schools. The New York Times, p. 1.
Finn, P. (2006). School resource officer pro-grams: Finding the funding, reaping the benefits. FBI Law Enforcement Bulletin, 1-7.
Finn, P., & McDevitt, J. (2005). National assess-ment of school resource officer programs: Final project report. Washington, DC: Abt Associ-ates, Inc.
Finn, P., McDevitt, J., Lassiter, W., Shively, M., & Rich, T. (2005). Case studies of 19 school resource officer (SRO) programs (NCJ 209271). Washington, DC: U.S. Department of Justice.
Forrest, W. J. (2010). SRO programs – Successful community policing. Retrieved November 5, 2012, from www.njasro.org/testimony_2.html.
Girouard, C. (2001). School resource officer training program. Office of Juvenile Justice and Delinquency Prevention Fact Sheet (#05), 1-2.
Gray, C. (2003, October 1). Pascrell announces COPS grants for City of Passaic and Prospect Park. Retrieved November 5, 2012, from http://pascrell.house.gov/list/press/nj08_pascrell/pr_031001_cops.shtml.
Gulen, E. (2010). School resource officer pro-grams. TELEMASP Bulletin, 17(2).
Huffman, D. (1995). School resource officer program. TELEMASP Bulletin, 7(2), 1-7.
Humphrey, J., & Huey, M. (2001). School resource officer evaluation: Executive summary. Concord: New Hampshire Department of Justice.
Jackson, A. (2002). Police-school resource offi-cers’ and students’ perception of the police and offending. Policing, 25, 631-651.
Johnson, I. (1999). School violence: The effec-tiveness of a school resource officer program in a southern city. Journal of Criminal Justice, 27(2), 173-192.
Joong, P., & Ridler, O. (2006). Teachers’ and students’ perceptions of school violence and prevention. Brock Education, 15(2), 65-83.
Juvonen, J. (2001). School violence: Prevalence, fears, and prevention. Retrieved November 5, 2012, from www.rand.org/pubs/issue_papers/IP219/index2.html.
Keiger, D. (2002, September). An unneces-sary force? John Hopkins Magazine, 54(4). Retrieved October 30, 2012, from www.jhu.edu/jhumag/0902web/police.html.
Kupchik, A., & Monahan, T. (2006, November). The New American School: Preparation for

Law Enforcement Executive Forum • 2012 • 12(4) 43
post-industrial discipline. British Journal of Sociology of Education, 27(5), 617-631.
Lambert, D. R., & McGinty, D. (2002). Law enforcement officers in schools: Setting pri-orities. Journal of Educational Administration, 40(3), 253-273.
May, D. C., Cordner, G., & Fessel, S. D. (2004). School resource officers as community police officers: Fact or fiction. Law Enforcement Exec-utive Forum, 4(6), 173-189.
May, C. D., Fessel, S. D., & Means, S. (2004). Predictors of principals’ perceptions of school resource officers’ effectiveness in Kentucky. American Journal of Criminal Jus-tice, 29(1), 75-93.
McDaniel, J. (2001). School resource officers: What we know, what we think we know, what we need to know. Raleigh: Center for the Preven-tion of School Violence, The North Carolina Department of Juvenile Justice and Delin-quency Prevention.
McDevitt, J., & Panniello, J. (2005). National assessment of school resource officer programs: Survey of students in three large new SRO pro-grams. Boston: Northeastern University.
McNicholas, C. F. (2008). School resource secu-rity officers: Public protection officers for public schools. Retrieved December 1, 2012, from www.ifpo.org/articlebank/school_officers.html.
Minor, K. I., Fox, J. W., & Wells, J. B. (2002). An analysis of interagency communication pat-terns surrounding incidents of school crime. Journal of School Violence, 1(4), 81-100.
National Institute of Justice (NIJ). (1999). The appropriate and effective use of security technolo-gies in U.S. schools. Washington, DC: NIJ.
O’Toole, M. E. (1999). The school shooter: A threat assessment perspective. Quantico: Federal Bureau of Investigation, National Center for the Analy-sis of Violent Crime.
Owens, B. (2001). The report of Governor Bill Owens: Columbine review commission. Denver: State of Colorado.
Patten, M. L. (2009). Understanding research methods (7th ed.). Glendale, CA: Pyrczak Publishing.
Scheffer, M. W. (1987). Policing from the school-house: Police-school liaison and resource offi-cer programs: A case study. Springfield, IL: Charles C. Thomas.
Schreck, C., Miller, J. M., & Gibson, C. L. (2003). Trouble in the school yard: A study of the risk factors of victimization at school. Crime and Delinquency, 49, 460-484.
Schulte, B. (1999, July 12). After Littleton, Montgomery Schools rethink safety. The Washington Post.
Sherling, K. (1998). National Association of School Resource Officers: Basic course manual. San Diego: NASRO, Inc.
SurveyMonkey. (1999). SurveyMonkey user manual: Customer guide for account naviga-tion, survey creation, distribution, & analysis. Retrieved November 5, 2012, from www.surveymonkey.com.
Toppo, G. (2009, April 13). 10 years later: The real story behind Columbine. Retrieved November 5, 2012, from www.usatoday.com/news/nation/2009-04-13-columbine-myths_N.htm?csp=DailyBriefing.
Toppo, G., & Elias, M. (2009, April 13). Lessons from Columbine: More security, outreach in schools. USA TODAY, pp. 1-3.
Trump, K. S. (2001). 2001 NASRO school resource officer survey. Cleveland, OH: National School Safety and Security Services.
Uchida, C. D. (2002). Measuring the performance of school resource officers. Silver Spring, MD: 21st Century Solutions Inc.
44 Law Enforcement Executive Forum • 2012 • 12(4)
U.S. Department of Education. (2000). Safeguard-ing our children: An action guide. Washington, DC: U.S. Department of Education. Retrieved October 30, 2012, from www2.ed.gov/admins/lead/safety/actguide/action_guide.pdf.
U.S. Department of Justice, Office of Com-munity Oriented Policing Services. (2005, August 10). COPS in schools: The COPS commitment to school safety. COPS Fact Sheet, 1-2.
VanCleave, J. A. (2008). School resource officers: What high school teachers consider to be the most important tasks. Minneapolis: Capella University.
Virginia Department of Criminal Justice Ser-vices (DCJS). (2001). Second annual evaluation of DCJS funded school resource officer programs. Richmond: Virginia DCJS.
wiseGEEK. (2010). What is a hyperlink? Retrieved November 5, 2012, from www.wisegeek.com/what-is-a-hyperlink.htm.
Youth violence in Connecticut schools. (1999, May). The Connecticut Association of Schools Bulletin, 73(8), 43-47.
Contact Information [email protected]
Law Enforcement Executive Forum • 2012 • 12(4) 45
Appendix. Assessment of School Resource Officer Programs Survey
SCHOOL PERSONNEL ASSESSMENT OF SRO PROGRAMS
31

46 Law Enforcement Executive Forum • 2012 • 12(4)
SCHOOL PERSONNEL ASSESSMENT OF SRO PROGRAMS
32

Law Enforcement Executive Forum • 2012 • 12(4) 47
SCHOOL PERSONNEL ASSESSMENT OF SRO PROGRAMS
33

48 Law Enforcement Executive Forum • 2012 • 12(4)
SCHOOL PERSONNEL ASSESSMENT OF SRO PROGRAMS
34

Law Enforcement Executive Forum • 2012 • 12(4) 49
SCHOOL PERSONNEL ASSESSMENT OF SRO PROGRAMS
35

50 Law Enforcement Executive Forum • 2012 • 12(4)
Analysis of Crisis Management Planning in Illinois Public SchoolsPatrick Mark Twomey, EdD, Superintendent of Schools, Havana School District #126
Are All Crisis Plans Created Equal?The serenity that existed when our schools were considered safe havens for our children disappeared with the screams at Columbine High School on April 20, 1999, and the dust clouds in New York City on September 11, 2001. Violence and the potential threats that exist today were inconceivable just 15 years ago. Shootings in our schools today are more common than one might think. In fact, they have become so common that the American public, including those in the educationalarena, have become desensitized to them.Since 1996, more than 35 violent events involv-ing shooters have taken place in American K-12 public schools in which more than 50 students have lost their lives and countless others have been seriously wounded.
In addition to the shock of school shootings and other serious crimes, schools must plan for other events that cause the loss of life and property. Schools must address natural disas-ters such as hurricanes, tornadoes, and floods. This year alone, hurricanes and tornadoes have disrupted school districts throughout the United States and have caused untold damage to buildings as well as affecting the emotional state of school officials, teachers, and the families they serve.
In 2009, I concluded a study titled, Analysis of Crisis Management Planning in Illinois Public Schools. The study focused on the readiness level of Illinois school districts to react to a real crisis and the preparation necessary to have a comprehensive crisis management plan in place. With so much attention being given to the recent tragic events in our nation’s schools, it is necessary to explore the readiness level
of our schools and to secure the mortar walls where our children spend their days.
The present study was designed to examine the readiness level of small, medium-sized, and large K-12 public school districts in Illinois as delineated by the comprehensive-ness of their crisis management plans and the operational practice of those plans. The components were analyzed using Pearson’s Correlation to determine the relationship of number of students. A crisis management assessment instrument was used to rate the critical components that must be in all school district plans as identified by Homeland Secu-rity. The study collected crisis plans via mail and/or made a site visit to 30 K-12 school dis-tricts and hand-scored their crisis plans. The list of schools was generated from the Illinois State Board of Education website using the 2007 Fall Housing Report. Ten schools were randomly selected from small school districts with a student population < 1,200, ten from medium-sized school districts with a student population 1,201 to 3,000, and ten from large school districts with a student population of > 3,000. Each crisis management plan was evaluated using the Comprehensive Crisis Plan Assessment Instrument designed specifi-cally for the study. Components of the assess-ment instrument included mitigation/preven-tion, preparedness, response, and recovery.
Mitigation and prevention are the steps taken and the programs put into place to prevent serious incidents from occurring and/or to reduce their effects on the organization (The Office of Safe and Drug-Free Schools, 2007). The large school districts scored higher over-all in the mitigation and prevention category of crisis planning with 70% scoring above the median score of 4.0, compared to 50% of the

Law Enforcement Executive Forum • 2012 • 12(4) 51
medium-sized and 40% of the small school districts. When comparing plans among school districts, it appeared as though the small school districts in general have a less formalized approach to crisis planning. This might explain why 50% of the small school districts did not utilize a safety audit for plan-ning purposes.
Preparedness focuses on the process of plan-ning for the worst-case scenario (The Office of Safe and Drug-Free Schools, 2007). This is the most complex part of crisis management planning for schools because they must use an all or multi-hazards approach to identify all the potential dangers that exist in their particular school district. The results indicate that the large school districts are considerably more prepared than the other two groups. The large schools districts scored higher overall in the preparedness category of crisis planning with 90% scoring above the median score of 13, compared to 50% of the medium-sized and 30% of the small school districts. Using a less formalized approach to crisis management planning may again be a factor here. Only 30% of the small school districts used any form of the National Incident Management System as recommended by Homeland Security as com-pared to 80% of the medium-sized and 100% of the large school districts.
Response involves actions and planning of the steps to take during an actual crisis (The Office of Safe and Drug-Free Schools, 2007). The medium-sized and large school districts scored higher overall in the preparedness category of crisis planning with 60% of the medium-sized school districts scoring above the median score of 4.0 compared to 50% of the large school districts and 20% of the small school districts.
Much of a school district’s ability to respond efficiently is directly tied to its ability to com-municate with first responders. The medium-sized districts’ plans excelled in this area as 100% showed evidence of completing a detailed plan component for communicat-ing with first responders. Eighty percent of
large school districts’ plans showed evidence of communicating with first responders as compared to 60% of the small school districts’ plans. The large school districts may have trouble completing this task efficiently due to their size and the complexity that adds; while the small school districts have an access issue, both in terms of distance from first responders and communications tools available.
Recovery is the process of getting the organiza-tion, in terms of teaching and learning, back to its normal operation as soon as possible (The Office of Safe and Drug-Free Schools, 2007). The large and medium-sized school districts scored higher overall in the recovery category of crisis planning with 60% each scoring above the median score of 6.5 compared to 30% of the small school districts. Seventy percent of small school districts’ plans had not addressed the emotional stability of their students and staff after an event had occurred. The area of recovery that seems to be neglected in most plans is a general debriefing that would allow problems to be identified, therefore improv-ing the crisis management plan.
A pattern appears when analyzing the total readiness score data from the Comprehensive Crisis Plan Assessment Instrument. The small school districts’ plans received the lowest scores in every category of mitigation/pre-vention, preparedness, response, and recov-ery. They were followed by the medium-sized districts which received the next lowest scores with the exception of the response category in which they outscored the large school districts with a total score of 48 as compared to 46. The large school districts’ plans received the high-est score in every other category. Although this pattern was prevalent, it is not absolute.
The U.S. Congress investigated the increase in school violence in 1975, resulting in the Bayh Report. The Bayh Report concluded that schools were experiencing a substan-tial increase of weapons, homicides, rapes, and attempted rapes within the schoolhouse walls. Since the Bayh Report, the U.S. has seen an increase of public awareness concerning
52 Law Enforcement Executive Forum • 2012 • 12(4)
the dangers facing students, teachers, and administrators in our schools and the need for crisis plans (Crews & Counts, 1997).
On August 16, 2005, the Governor of Illinois signed House Bill 2693, creating the new School Safety Drill Act. This new law set clear, minimum requirements and standards for school emergency planning. The new law also required school districts to work closely with their local emergency first responder agencies in conducting annual reviews of the school’s Emergency and Crisis Response Plan. Currently, there is no central reporting mechanism in the State of Illinois in terms of plan completeness and functionality. How-ever, individual schools must submit a form to their Regional Office of Education verifying crisis plan review on an annual basis.
Increased awareness and new laws still are not the answer to safer schools for all children. School crisis management planning efforts continue to fall short of expected results and have in place a system that creates a false sense of security. The research clearly indicates that rural and small school districts simply do not have the resources necessary to develop such comprehensive plans.
The need for a more systematic approach to crisis management planning is evident, especially among the small school districts. This study confirmed the assertions of Green (2006) that rural schools are less prepared than their counterparts and that available time is a determining factor. At the conclusion of the study, I recommended the creation of the U.S. Rural School Safety Project. The project, as a pilot program, would identify all small school districts (1,200 students or less) in the State of Illinois or perhaps Region V of the U.S. Department of Education, which would also include Indiana, Michigan, Minnesota, Ohio, and Wisconsin. Once schools are identified, they would be sent a complete detailed crisis management plan that is flexible enough to be changed to meet their individual needs. These plans would be far different from the templates that exist currently on most states’
websites. The crisis plans would have a step-by-step guide for the district to quickly per-sonalize the plan to fit their particular needs. After the plans had been received and enough time had passed for all school districts to com-plete their personalization, an annual train-ing schedule would be created. This annual schedule would help ensure that the small school districts that have fewer resources are given up-to-date information concerning the plan itself and a better understanding of current threats. Development and support of research that identifies best practices related to preparedness and the creation of compre-hensive crisis planning must become a prior-ity (U.S. Department of Education, 2003). It is in this spirit that I hope and pray for the safety of all our children.
BibliographyReferences marked with an asterisk indicate stud-ies or articles included in the meta-analysis. The in-text citations to studies selected for meta-analy-sis are not preceded by asterisks.
Crews, G. A., & Counts, M. R. (1997). The evo-lution of school disturbance in America: Colonial times to modern day. Westport, CT: Praeger.
Green, D. (2006). School crisis plans in the state of Illinois (Doctoral Dissertation, Illinois State University, 2006). UMI No. 3233934.
Jefferson County, Colorado Sheriff’s Department. (1999). Columbine High School report (CNN.com In-depth Specials). Littleton: Jefferson County, Colorado Sheriff’s Department.
*Johnson, W. Y., & Matcznski, T. J. (1993, August). Crisis control. The American School Board Journal, 33-34.
*Lichtenstein, R., Schonfeld, D., & Kline, M. (1994, November). School crisis response: Expecting the unexpected. Educational Lead-ership, 52(3), 79-83.

Law Enforcement Executive Forum • 2012 • 12(4) 53
*Lukaszewski, J. E. (1987, November). Check-list: Autonomy of a crisis response. Public Relations Journal, 43(11), 45-47.
The Office of Safe and Drug-Free Schools, U.S. Department of Education. (2007, January). Practical information on crisis planning: A guide for schools and communities. Washington, DC: The Office of Safe and Drug-Free Schools, U.S. Department of Education.
School’s emergency plans lag. GAO: Most schools not ready for disasters. (2007, July). eSchool News, 10(7), 1.
*Thompson, R. (1990, February). Strategies for crisis management in schools. Bulletin (National Association of Secondary School Principals), 74(523), 54-58.
Twomey, P. M. (2009). Analysis of crisis manage-ment planning in Illinois public schools (Doctoral Dissertation, Western Illinois University, 2009). UMI No. 3355825
U.S. Department of Education, Office of Safe and Drug Free Schools. (2003). Practical information on crisis planning: A guide for schools and com-munities. Washington, DC: U.S. Department of Education, Office of Safe and Drug Free Schools.
Dr. Patrick Mark Twomey has been involved with district-level crisis man-agement planning for more than 14 years. During that time, he has experi-enced and studied the need for crisis management planning in K-12 public schools.
He began his career in education as a teacher at Edison School in Macomb, Illinois. He went on to be an assistant principal at Ingersoll in Canton, Illinois, and then at Macomb Jr./Sr. High School in Macomb. He was principal for Macomb Jr./Sr. High School in 2006-2007 before taking his current position as Superintendent of Schools at Havana School District #126.
Dr. Twomey earned his Bachelor of Science in Elementary Education (1997), his EdS in Educational Administration (2004), and his EdD with a focus on education reform (2009) from Western Illinois University in Macomb.
Dr. Twomey is a pioneer of flipping schools as he is the first superintendent in the country to drive the flipping class-rooms educational model change in an entire high school. He believes “flip-ping” is a transformational model that will greatly impact how content is deliv-ered and school is taught in the U.S. in the very near future.
54 Law Enforcement Executive Forum • 2012 • 12(4)
When, What, and Where Is the First Line of Defense Against Anti-Social Behaviors?Barry S. McCrary, EdD, Assistant Professor, School of Law Enforcement and Justice
Administration, Western Illinois UniversityChristine J. Anderson, PhD, Assistant Professor, Department of Curriculum and
Instruction, Western Illinois UniversityBonny M. Mhlanga, PhD, Associate Professor, School of Law Enforcement and Justice
Administration, Western Illinois University
IntroductionThe drive for this research design is to explore the current challenges in meeting the educational and social developmental needs of youth in the juvenile justice system. This research explores strategies for addressing such challenges by providing insight from the various disciplines. Current policy and practice in the education and juvenile justice systems appear to be ineffective in decreasing the number of offenders. Further complicating agency services, these offenders consist of a disproportionate number of indi-viduals who require federally mandated special education services (Katsiyannis & Murry, 2000). Although individuals under 18 in adult correc-tional facilities represent only 1% of the popu-lation, the number of students with truancy or behavior problems that involve the juvenile justice system and recidivism is ever increas-ing (Brazzell, Crayton, Mukamal, Solomon, & Lindahl, 2009; Cuellar & Piehl, 2012; Katsiyannis & Murry, 2000). In 2006, 2.2 million juveniles were arrested in the United States, with over 134,000 youth incarcerated in juvenile correctional facili-ties (Quinn, Rutherford, Leone, Osher, & Poirer, 2005; Zhang, Hsu, Katsiyannis, Barrett, & Ju, 2011). Researchers suggest a shift in policy to facilitate support in the form of early screening and supplemental services for students deter-mined to have a high risk of abuse and neglect or who manifest characteristics such as poor impulse control, irritability, suggestibility, and inability to anticipate consequences (Alltucker, Bullis, Close, & Yovanoff, 2006; Brazzell et al., 2009; Quinn et al., 2005). Yet, research is scarce. Evidence supports the effectiveness of services
that encourage academic achievement; and regu-lar attendance and success in school contribute to reducing juvenile delinquency. Communities and schools may strengthen protective factors with positive behavioral strategies and through the establishment of a safe learning environment (Christle, Jolivette, & Nelson, 2005; Katsiyannis & Murry, 2000; Zhang et al., 2011). Conversely, systems that do not prevent academic failure will continue to foster behavior problems that frequently lead to harsh discipline practices thereby increasing the risk for court involvement (Christle et al., 2005; Zhang et al., 2011).
Previously, law enforcement, educators and community members have demanded a “zero tolerance” disciplinary policy and practice even though substantial evidence validates that sus-pension and expulsion may only exacerbate the problem (Christle et al., 2005; Cuellar & Piehl, 2012; Richart, Brooks, & Soler, 2003; Tuzzolo & Hewitt, 2006). Research confirms the correlation between academic failure and court involve-ment among youth; however, removing stu-dents from school instead of offering therapeu-tic strategies and academic interventions is not a solution for student success or cost effectiveness (Christle et al., 2005; Tuzzolo & Hewitt, 2006). For example, the costs of one high-risk juvenile offender with four years in the system followed by 10 years of adult criminality is estimated to cost between $1.7 to 2.3 million (Alltucker et al., 2006). Tuzzolo and Hewitt (2006) reported three ways the school-to-prison pipeline negatively impacts students: (1) criminalization of petty offenses, (2) expulsion and suspension, and (3) disproportionate representation on students

Law Enforcement Executive Forum • 2012 • 12(4) 55
of color. Suspensions and expulsions haveproven to be counterproductive (Richart et al., 2003). Unfortunately, suspension, expulsion,dropout, and disability are not fairly distributed; African-American youth are overrepresented(Drakeford & Staples, 2006; Richart et al., 2003). This overrepresentation of minorities within the juvenile justice system parallels a similar over-representation of minorities requiring specialeducation services (Drakeford & Staples, 2006).
Youth with disabilities in correctional facilities present a challenge to the juvenile justice andeducation systems (Katsiyannis & Murry, 2000; Zhang et al., 2011). The rates of students with disabilities in the juvenile justice system range from single digits to over 90%, with the larg-est categorical representation within two dis-abilities: (1) specific learning disabilities (SLD) and (2) emotional behavioral disorders (EBD) at 47.7 and 38.6%, respectively (Quinn et al., 2005; Zhang et al., 2011). The original intention ofspecial education was to provide treatment and rehabilitation for individuals who demonstrated adverse effects in their academic achievement(Drakeford & Staples, 2006). These students are particularly at risk for a path leading to prison as they commonly experience high-risk factors such as school failure, retention, and learn-ing and behavior problems—a fact that Quinn et al. (2005) stated has led to the juvenile justice system being considered the “default system”post high school. For example, a strong con-nection exists between the severity of the court decision and the disability (Schwable, Hatcher, & Maschi, 2009); this is partly due to the inad-equate social-cognitive development prevalent in students with disabilities, these students are more at risk for criminal behavior (Quinn et al., 2005).
In addition to mental health needs, incarcerated youth generally display significant academicdeficits, performing between the 5th- and9th-grade levels, whereas 62.4% of the nonin-carcerated youth involved with juvenile jus-tice experience academic difficulties (Brown,Riley, Walrath, Leaf, & Valdez, 2008; Bullis & Yovanoff, 2005). Generally, delinquent youthexperience more educational deficiencies
compared to their nondelinquent counterparts (Wang, Blomberg, & Li, 2005). Compounding difficulties for rehabilitation and employment, individuals with disabilities often receive sub-standard educational services in correctional facilities (Leone & Cutting, 2004; Zhang et al., 2011). The best educational practices include a continuum of services, differentiated instruc-tion, transition services, and effective class-room management (Robinson & Rapport, 1999; Wang et al., 2005). Although academic rigor must be stressed to overcome the educa-tional deficits, successful programs must also facilitate the development of positive relation-ships (Atkins, Bullis, & Todis, 2005; Malmgren & Leone, 2000; Zabel & Nigrol, 2007).
The factors that influence recidivism, disability, and discipline problems are similar: age of first referral, absence of father, special education status, ethnicity, drug use, and adverse family experiences; in fact, poverty more than ethnic-ity may be associated with rates of neglect and familial incarceration (Barrett, Katsiyannis, & Zhang, 2010; Christle et al., 2005; Malmgren & Meisel, 2002). Although not as important as a stable home, the school relationships and support systems also play a dominant role in child development (Baltodano, Platt, & Roberts, 2005; Christle et al., 2005). Baltodano et al. (2005) recommend expanding programs that facilitate more intensive treatment such as mentoring, substance abuse counseling, aca-demic remediation, vocational training, and life skills. Successful programs must be flexible and offer relevant instruction that engages the learners and are developed through the collab-orative effort of agencies and social programs involved in delivering services (Drakeford & Staples, 2006; Katsiyannis & Murry, 2000). Alternative education services exist only after the individual becomes involved with the juvenile justice system; however, communities and schools might benefit from early inter-vention and prevention strategies to avoid the high rates of incarceration among at-risk youth (Atkins et al., 2005; Quinn et al., 2005).
The most neglected aspect of education and treatment for at-risk youth is commonly

56 Law Enforcement Executive Forum • 2012 • 12(4)
identified as transition (Baltodano, Mathur, & Rutherford, 2005). Alternative educational programs promote inquiry and examination from multiple perspectives of the different fields that serve youth involved with juve-nile justice (Atkins et al., 2005). Obviously high attrition rates in schools weaken the ability of school programs to prepare youth in either employment skills or the develop-ment of personal and social attributes (Risler & O’Rourke, 2009). The goal of job placement for juvenile offenders is further complicated by the unique services required by the vari-ous subgroups exiting correctional facilities; these include young women, gang members, and those with special education disabilities (Bullis & Yovanoff, 2005). A review of the cur-rent practices relating to transition services, community support, and employment train-ing acknowledged the importance of multi-agency collaboration and integrated services (Katsiyannis & Murry, 2000).
Early intervention is necessary to address the growing concern with delinquency preven-tion. Successful programs follow developmen-tal principles and focus on multiple systems addressing children manifesting antisocial behavior at 3 to 5 years old (Bartol & Bartol, 2009). Although one study found no relation-ship between preschool reading performance and delinquency, attention problems and fail-ure to learn to read have serious later con-sequences for individuals (Maguin, Loeber, & LeMahieu, 1993). Bartol and Bartol (2009) state that primary prevention involves strate-gies implemented by the family, school, and community with a focus on the public school agency system identified as the entry point and therefore in the best screening position.
In summary, the existing prevention efforts are failing in keeping at-risk youth in school where they need to learn the necessary skills and develop the personal and social attributes needed for job placement (Quinn et al., 2005; Zabel & Nigro, 2007). Successful integra-tion into the community after incarceration must prepare offenders to achieve economic independence through effective transitional
programs (Zabel & Nigro, 2007). The education system either in a correctional facility or alter-native program may be the last opportunity for successful preparation into society (Risler & O’Rourke, 2009). In fact, according to Katsiyannis and Murry (2000), “In order to pro-vide best practices for young offenders (with or without a disability) at least two areas must be targeted for change—the systemic operation and instructional procedures” (p. 82).
Commonly, at least five critical groups are involved in the development of effective dis-ciplinary procedures: (1) parents and stu-dents, (2) principals and site-based councils, (3) local school superintendents and school boards, (4) state departments, and (5) juvenile justice system personnel (Richart et al., 2003). Researchers recommend collaboration between educational, mental health, social services, and juvenile justice at the local and state levels as well as at institutions of higher education, in effect wraparound services (Bartol & Bartol, 2009; Larson & Turner, 2002; Mallet, 2009; Mann & Reynolds, 2006; Moeser, 2003; Muller, 2005; Stenhjem, 2005). The awareness of risk factors and the development of protective fac-tors require the collaboration and coordination of multiple agencies for early intervention and effective treatment (Ko et al., 2008). The pri-mary goal of the collaborative agencies might be the development of safe places for at-risk youth (Richart et al., 2003). Following Hurri-cane Katrina, a study in New Orleans posted suggestions for at-risk youth: offer prevention and intervention programs, train personnel to interact with youth, fund guidance therapeutic workers, establish school discipline commit-tees, expand teacher professional development, collect data, decrease harsh punishment, and develop positive behavioral systems (Tuzzolo & Hewitt, 2006). Community partners should be aware that collaboration requires three critical elements: (1) common goals, (2) shared responsibility, and (3) working together to achieve goals (Stenhjem, 2005). Presently, no single federal organization promotes such col-laboration, yet evidence supports a holistic approach, acknowledging a correlation that congruent planning process yields greater

Law Enforcement Executive Forum • 2012 • 12(4) 57
benefits and outcomes for students (Kohler & Reese, 2008). The bottom line as stated by Brown et al. (2008) is that “The future of this overlooked population of youth is unlikely to improve without concerted effort of both the juvenile justice and education systems” (p. 71).
Need for Research
A review of the various perspectives and con-necting disciplines that frequently work together to identify those challenges or gaps within the current system will be explored. As a result of the findings and recommendations, new strate-gies for improving the overall treatment to meet the social developmental needs will be pre-sented. Hence, the intent is to strengthen collab-orative services, encourage proactive methods, and implement effective early interventions.
MethodologyThis research is a quantitative and qualitativeresearch study. General questions were askedof participants in a focus group setting to exam-ine the current processes by which variousdisciplines address antisocial and delinquentbehaviors. The questions were as follows:
•
•
Pleaseexplainanddiscussfromyourfieldof study, perspective, or routine job activi-ties the top reason or factors that propelyouth and or adults to display antisocial,irresponsible, or arrestable behaviors.
Pleaseexplainanddiscussfromyourfieldof study, perspective, or routine job activi-ties ways to address, restore, or provideservices that redirect youth and or adultstoward pro-social, responsible and healthybehaviors.
Instruments
The insights of participants in a focus group were captured through the facilitation of focus groups with open discussions on the aforementioned questions. Also, a survey was given to the participants in the audience to rank the order of issue importance.
Sample Selection and Size
The participants who were asked to participate in this research were a juvenile court judge, an assistant warden, the president of the NAACP, the Assistant Vice President for Academic Affairs, a Law Enforcement and Justice Admin-istration (LEJA) professor and ex-state’s attor-ney, a Health Sciences professor, a professor of Social Work, and a professor of Sociology. There were eight participants. There were no contributors who did not volunteer to partici-pate in the focus groups. Also, the participants had prior knowledge of the questions being asked during the focus group. The number of years of experience in this field for these par-ticipants ranged from two to 25 years.
Emphasize Issues Relating to Interactions with Subjects and Subjects’ Rights
All participants in this project agreed to par-ticipate on a voluntary basis. As facilitators of the focus group, we structured the research method in a way to ensure that participants were under no obligation to participate or respond to questions that could compromise their opinion. There were two structured questions, and the discussions took on a life of their own.
ResultsThe purpose of this research project was to determine if the insights of human service workers could improve the identification and process of developing antisocial behaviors and also if they could collaborate to correct those behaviors for successful functioning after intercessions.
Introduction to Focus Group
As an introduction to the forum, we offered several questions to keep in mind throughout the discussion. Some of those questions were as follows: How does a young, innocent child end up in the criminal justice system? What is the process of being entered into that system? How did some children end up in college

58 Law Enforcement Executive Forum • 2012 • 12(4)
while others ended up in detention centers? What causes some students to drop out of col-lege? and What are the differences in the life-styles and upbringings of all of these people? Students were asked to pay specific attention to the panelists as they explored different topics regarding antisocial behaviors in terms of their specific disciplines and fields of study.
The researchers explained how juvenile delin-quency is a concern of many disciplines. We also explained the importance of multiple professionals discussing their ideas in order to help discover the causes of delinquency. The authors explained that there was not a better place to start a discussion than on a college campus, where there are many experts in var-ious disciplines. The authors then explained that learning disabilities are absolutely detri-mental to individuals and, in turn, can be the cause for delinquency. Undiagnosed learn-ing disabilities can go unnoticed far too long, many times resulting in a student failing in school. This failure can then continue on into life, ultimately ending in crime and jail. A fur-ther problem stemming from learning disabil-ities is that they progress in correctional insti-tutions. A person with a learning disability can easily find himself stuck in a correctional setting with no escape.
Responses to Focus Group
The panel consisted of a sociologist, the Assis-tant Vice President for Academic Affairs at WIU, an assistant warden, a judge, the presi-dent of Macomb’s NAACP, a Health Sciences professor, a Social Work professor, a LEJA faculty member and ex-state’s attorney (pros-ecutor), and a professor from the Sociology department. These are some of the responses to the question “Please explain and discuss from your field of study, perspective, or rou-tine job activities the top reason or factors that propel youth and or adults to display antiso-cial, irresponsible, or arrestable behaviors”:
• The professor from the Sociology depart-ment at WIU offered that a sociologist would explain antisocial behaviors through
the “anomie theory.” In the anomie theory, an individual is unable to achieve societal goals through legitimate means. As a con-sequence of this, they turn to illegitimate, or illegal, means of achieving these short-term goals. These individuals feel power-less and do not understand proper behav-iors and social norms.
•
•
TheAssistantVicePresidentforAcademicAffairs at WIU explained that social norms can differ depending on the individual. He repeatedly asked, “Who is a social norm for?” He explained that people are per-forming to a script. Everybody is raised in a unique situation and environment that is specific to them. They have been engrained to live their lives according to this personal script. Moving from their home environ-ment to the college environment can cause them to briefly stray from this script, which results in academic failure. Or the indi-vidual can do everything in their power to hold up to the script that has been guiding their life for so long. This too can lead to poor academic results, causing the student to terminate his status at the university.
The assistant warden at a correctionalprison in Illinois claimed that all antiso-cial behaviors begin at home. There are multiple risk factors that have an immedi-ate influence on the behaviors of a child or adolescent. We discussed all of these risk factors in the first unit of class in the prison, ranging from single parenting, poverty, substance abuse, neglect, etc.
These are highlighted example of three indi-viduals’ insights into antisocial behavior.
The following are data from the commu-nity forum focus group; these were the two questions asked along with a summary of the main points from each panelist:

Law Enforcement Executive Forum • 2012 • 12(4) 59
Q1: Can you explain and discuss from your field of study, perspective, or rou-tine job activities the top reason or fac-tors that propel youth or adults to display antisocial, irresponsible, or arrestable behaviors?
•
•
•
•
•
Sociology Professor – Social norms do not reflect reality. Everyone getting a job is a norm, but there are no jobs. The people are not being socialized properly as a result of not being able to find a job, or they are being socialized within a negative envi-ronment. If there are no jobs, people lose opportunities. They begin to develop anti-social norms. These changes are occurring more and more due to the transformation of the ghetto and from having factories along with other jobs moving elsewhere. These changes brought an increase of drugs, vio-lence, and gangs in the 1980s.
Assistant Vice President for Academic Affairs – Social norms need to be defined as to whom the norm is for. People perform to a script written by their own environment whether or not they believe the script. Norms trans-fer and conflict between former and cur-rent environments.
Assistant Warden – It all begins at home. Risk factors at early onset in life predict behavior. General factors: single parent, substance abuse, poverty, etc. Missed link in early life. Risk factors continue to grow as life progresses.
Judge – Reasons: issue is family or lack thereof; most from single-parent families with at least one parent in correctional facility, minimal/no parental involvement, abusive or neglectful environment, and emotional behavior disorders and peers.
Health Sciences Professor – Psychosocial health—spiritual, emotional, and social health—offenders generally have an imbal-ance of one or a couple of these categories. They generally don’t value other people, diversity, etc.
•
•
•
Social Work Professor – Unrelated mental health needs; lack of social capitol in our communities/atmosphere. Positive, respect-ful atmosphere. Feeling that there is no reason to respect each other—social capitol.
Prosecutor – Kids who have no plans/future. Abusive and neglectful point of view. Social services remove them and, under law, return them at a designated time to attempt to rebuild family. Future always short-term.
NAACP President – The behavior comes from the environment.
Q2: Please explain and discuss from your field of study, perspective, or routine job activities ways to address, restore, or pro-vide services that redirect youth and or adults toward pro-social, responsible, and healthy behaviors.
•
•
•
•
NAACP President – Identify problem. Has to deliver positive environment; practice what you preach. This is for kids express-ing antisocial behaviors in a positive environment.
Prosecutor – 13 to 15 year olds. Show them that they have positive attributes—math skills, etc. Punishment should be paired with positive attribute identification.
Social Work Professor – Make the system fit the individual rather than vice versa. Pre-vention is our best measure. Use multisys-temic approach. They have strengths; give them guidance on how to put them to use. Give them a picture of their future. Help the families—the families need support. Social capitol: what can we do to help the families. Jobs: once they’ve got a record, teach them how to talk about it.
Health Sciences Professor – Mom and best friend are two most important influen-tial people in a person’s life. Social learn-ing theory dictates that we learn from the people in our lives.

60 Law Enforcement Executive Forum • 2012 • 12(4)
•
•
•
•
Judge – School is important. Teacher notic-ing the kids who don’t get affection at home hugs them. K-2nd grade teachers can best identify problematic behavior earliest. Produce a risk factor checklist for teachers. Family interaction therapy. 90% of college offenses committed are alcohol-related. Not just college kids; alcohol large factor in criminal behavior.
Assistant Warden – Parents should take more active role. Mandate parents to be more responsible. Focus on alternatives before they end up in a correctional system.
Assistant Vice President for Academic Affairs – Faculty need to be advocates for students via mentoring programs. Look for private or federal money for programming and mentoring. Focus on getting the student to the services they need. We absolutely don’t want them to drop out of school. Guide them toward their own responsibilities—not going home to take care of the kids for mom because it’s a nice thing.
Sociology Professor – Individual behav-iors vary according to context. Neces-sity invokes deviant behavior (steal to eat). Expansion of cocaine and drugs. Commercial ghettos transforming into hyper ghettos—poor people living closely together. No economic security. Schools and sewers disintegrate. Only sense of power attainable was through crime. Rebuild community for poor people. Less crime when extreme penalties are enforced (like in European countries). Our rights can also influence crime—innocent until proven guilty leaves chance to get away with it.
There were two issues conveyed to the panel regarding the roles that parental and extended family support and religion, church, and spirituality play in helping to prevent juvenile antisocial behavior. The audience participants were asked to indicate their opinion on the importance of the two issues by completing a survey instrument prior to the discussion of the issues by the panel and
the same instrument again after the panel discussion. The aim was to try to discover whether or not participants’ views were sub-sequently influenced by the panel discussion. The results showed that, overwhelmingly, the majority of the participants felt that parental and extended family support was the most important factor in helping to prevent juve-nile antisocial behavior, at 89.2 and 86.5% of the sample pre and post the panel discus-sion, respectively. On the question of religion, church, and spirituality, a lesser majority of the audience participants felt that such senti-ments were only somewhat important in help-ing to prevent juvenile antisocial behavior at 54.1 and 45.9% of the sample pre and post the panel discussion, respectively. Overall, these results indicate that the audience participants only marginally changed their original views on the importance of these issues in helping to prevent juvenile antisocial behavior to a less favorable one following the panel discus-sion. In this regard, the audience participants’ responses reflected their actual belief of the extent to which parental and extended family support and religion, church, and spiritual-ity issues impact the prevention of juvenile antisocial behavior.
ConclusionThe motivation for this research was to explore the current challenges in meeting the educational and social developmental needs of youth and the strategies for addressing such challenges by providing insight from the various disciplines. After a review of the vari-ous perspectives and connecting disciplines that frequently work together, we should be able to recommend new strategies for improv-ing the overall treatment to meet the social developmental needs for youth. Hence, the intent of this research was to strengthen col-laborative services and efforts and to encour-age proactive methods to implement effective early interventions.

Law Enforcement Executive Forum • 2012 • 12(4) 61
ReferencesAlltucker, K. W., Bullis, M., Close, D., &
Yovanoff, P. (2006). Different pathways to juvenile delinquency: Characteristics of early and late starters in a sample of previ-ously incarcerated youth. Journal of Child and Family Studies, 15(4), 479-492.
Atkins, T., Bullis, M., & Todis, B. (2005). Con-verging and diverging service delivery sys-tems in alternate education programs for disabled and non-disabled youth involved in the juvenile justice system. The Journal of Correctional Education, 56(3), 253-285.
Baltodano, H. M., Mathur, S. R., & Rutherford, R. B. (2005). Transition of incarcerated youth with disabilities across systems and into adulthood. Exceptionality, 13(2), 103-124.
Baltodano, H. M., Platt, D., & Roberts, C. W. (2005, December). Transition from secure care to the community: Significant issues for youth in detention. The Journal of Correctional Education, 56(4), 372-388.
Barrett, D. E., Katsiyannis, A., & Zhang, D. (2010). Predictors of offense severity, adjudi-cation, incarceration, and repeat referrals for juvenile offenders: A multicohort replication study. Remedial and Special Education, 31(4), 261-275.
Bartol, C., & Bartol, A. (2009). Juvenile delin-quency and antisocial behavior: A development perspective (3rd ed.). Upper Saddle River, NJ: Pearson/Prentice Hall.
Brazzell, D., Crayton, A., Mukamal, D. A., Solomon, A. L., & Lindahl, N. (2009). From the classroom to the community: Exploring the role of education during incarceration and reen-try. New York: The Urban Institute.
Brown, J. D., Riley, A. W., Walrath, C. M., Leaf, P. J., & Valdez, C. (2008). Academic achieve-ment and school functioning among nonin-carcerated youth involved with the juvenile
justice system. Journal of Education for Stu-dents Placed at Risk, 13, 59-78.
Bullis, M., & Yovanoff, P. (2005). More alike than different? Comparison of formerly incarcerated youth with and without dis-abilities. Journal of Child and Family Studies, 14(1), 127-139.
Christle, C. A., Jolivette, K., & Nelson, C. M. (2005). Breaking the school to prison pipe-line: Identifying school risk and protective factors for youth delinquency. Exceptionality, 13(2), 69-88.
Cuellar, A. E., & Piehl, A. M. (2012). Interac-tions between schools and juvenile justice. Models for Change: Systems Reform in Juve-nile Justice. Retrieved November 29, 2012, from www.modelsforchange.net/about/research/cuellar-piehl.html.
Drakeford, W., & Staples, J. M. (2006). Minor-ity confinement in the juvenile justice system: Legal, social, and racial factors. Teaching Exceptional Children, 39(1), 52-58.
Katsiyannis, A., & Murry, F. (2000). Young offenders with disabilities: Legal require-ments and reform considerations. Journal of Child and Family Studies, 9(1), 75-86.
Ko, S. J., Kassam-Adams, N., Wilson, C., Ford, J. D., Berkowitz, S. J., Wong, M., . . . Layne, C. M. (2008). Creating trauma-informed systems: Child welfare, education, first responders, health care, juvenile justice. Professional Psychology: Research and Practice, 39(4), 396-404.
Kohler, P., & Reese, J. (2008). Jedi: A new path-way to success for our forgotten youth. Edu-cation, 128(3), 507-514.
Larson, K. A., & Turner, K. D. (2002). Best practices for serving court involved youth with learning, attention and behavioral disabilities. Washington, DC: Office of Juvenile Justice and Delinquency Prevention.

62 Law Enforcement Executive Forum • 2012 • 12(4)
Leone, P. E., & Cutting, C. A. (2004). Appro-priate education, juvenile corrections, and no child left behind. Behavioral Disorders, 29, 260-265.
Maguin, E., Loeber, R., & LeMahieu, P. G. (1993). Does the relationship between poor reading and delinquency hold for males of different ages and ethnic groups? Journal of Emotional and Behavioral Disorders, 1(2), 88-100.
Mallet, C. A. (2009). Disparate juvenile court outcomes for disabled delinquent youth: A social work call to action. Child and Adoles-cence Social Work Journal, 26, 197-207.
Malmgren, K. W., & Leone, P. E. (2000). Effects of a short-term auxiliary reading program on the reading skills of incarcerated youth. Education and Treatment of Children, 23(3), 239-247.
Malmgren, K. W., & Meisel, S. M. (2002). Characteristics and service trajectories of youth with serious emotional disturbance in multiple service systems. Journal of Child and Family Studies, 11(2), 217-229.
Mann, E. A., & Reynolds, A. J. (2006). Early intervention and juvenile delinquency pre-vention: Evidence from the Chicago longi-tudinal study. National Association of Social Workers, 30(3), 153-167.
Moeser, J. (2003) Prevention strategies related to delinquency and youth violence. Wisconsin Prevention Network, 1-5.
Muller, E. (2005). The juvenile justice system and youths with disabilities. inForum, 1-13.
Quinn, M. M., Rutherford, R. B., Leone, P. E., Osher, D. M., & Poirer, J. M. (2005). Youth with disabilities in juvenile corrections: A national survey. Exceptional Children, 71(3), 339-345.
Richart, D., Brooks, K., & Soler, M. (2003). Unintended consequences: The impact of “zero
tolerance” and other exclusionary policies on Kentucky students. Washington, DC: Building Blocks for Youth.
Risler, E., & O’Rourke, T. (2009). Thinking exit at entry: Exploring outcomes of Georgia’s juvenile justice educational programs. The Journal of Correctional Education, 60(3), 225-239.
Robinson, T. R., & Rapport, M. J. K. (1999). Providing special education in the juvenile justice system. Remedial and Special Educa-tion, 20(1), 19-26.
Schwable, C. S., Hatcher, S. S., & Maschi, T. (2009). The effects of treatment needs and prior social services use on juvenile court decision making. National Association of Social Workers, 33(1), 31-40.
Stenhjem, P. (2005). Youth with disabilities in the juvenile justice system: Prevention and intervention strategies. Examining Current Challenges in Secondary Education and Transi-tion, 4(1), 1-5.
Tuzzolo, E., & Hewitt, D. T. (2006). Rebuilding inequity: The re-emergence of the school-to-prison pipeline in New Orleans. The High School Journal, 59-68.
Wang, X., Blomberg, T. G., & Li, S. D. (2005). Comparison of the educational deficiencies of delinquent and nondelinquent students. Evaluation Review, 29(4), 291-312.
Zabel, R., & Nigro, F. (2007). Occupational interests and aptitudes of juvenile offenders: Influence of special education experience and gender. The Journal of Correctional Educa-tion, 58(4), 337-355.
Zhang, D., Hsu, H., Katsiyannis, A., Barrett, D., & Ju, S. (2011). Adolescents with disabilities in the juvenile justice system: Patterns of recidivism. Exceptional Children, 77, 283-298.

Law Enforcement Executive Forum • 2012 • 12(4) 63
Barry S. McCrary, EdD, is currently an assistant professor at Western Illi-nois University. He has over 20 years of experience in both training and in the academic setting. He began his work in the field of juvenile justice and has held numerous positions in this field. Dr. McCrary has worked for the Allegh-eny County Juvenile Court, Commu-nity Intensive Supervision Program,in Pittsburgh, Pennsylvania, where he was responsible for counseling, design-ing, implementing, and monitoringa progressive treatment program. Dr. McCrary is also the founder of a non-profit organization entitled Maleness to Manhood Inc., which is a mentoring program for inner-city youth. In addi-tion to his work for Juvenile Court, Dr. McCrary has worked as a counselor, consultant, therapist, and crisis interven-tion specialist for various organizations. Additionally, he is highly experienced in the field of social science, administration of justice, and educational leadership.
Christine J. Anderson, PhD, has 15 years of teaching experience in the public schools providing instruction to at-risk populations. She received a Bachelor of Arts from Charleston Southern Univer-sity, a Master of Arts from the University of South Florida, and her doctorate from the University of Iowa. Dr. Anderson is certified and has taught in five states. At the university level, she has been an instructor at Arizona State Univer-sity and the University of Iowa, and currently teaches graduate courses on the Quad Cities campus in the Department of Curriculum and Instruction at Western Illinois University. Her research interests include the benefits of art for individu-als with disabilities; technology, specifi-cally as it relates to teacher preparation and training; and effective academic and behavioral interventions for individuals with behavior disorders and for the pop-ulation identified as juvenile offenders.
Bonny M. Mhlanga, PhD, is currently an associate professor in the School of Law Enforcement and Justice Administration (LEJA) at Western Illinois University and has been a LEJA graduate faculty member since 2005. Dr. Mhlanga received his PhD (1993, published in 1997) and his Master of Science degrees from the University of Surrey in the United Kingdom. Prior to joining the faculty at WIU, he worked as a senior research officer in the Research, Development and Statistics Directorate of the UK Home Office, as a post-doctoral research fellow in the Department of Criminology and Criminal Justice at Hull University, and as a research fellow in the Department of Law at Brunel University. He has also worked as a juvenile justice practitioner. He is serving as an Editorial Board Member for the Western Journal of Criminal Justice and for the African Journal of Criminology and Justice Studies.

64 Law Enforcement Executive Forum • 2012 • 12(4)
Policing and the Mentally Ill: A Review of the LiteratureMichael P. Brown, PhD, Professor of Criminal Justice and Criminology,
Ball State University, Muncie, Indiana
IntroductionA review of the literature reveals that, without exception, police and mental health profes-sionals agree that the complexities of police officer encounters with the mentally ill pose one of the most pressing problems facing the justice system today. Police calls involving the mentally ill are time-consuming, multi-faceted, and potentially have adverse con-sequences for the mentally ill person, the community, and for the entire justice system (Decuir & Lamb, 1996; Hails & Borum, 2003). The purposes of this article are to integrate the most salient issues related to police encoun-ters with the mentally ill and, within the context of the current recession, advocate for evidence-based practice. This review of the literature examines the availability of mental health resources, the extent to which the men-tally ill are impacting the justice system, the role of police officers when they encounter the mentally ill, and specialized police responses to the mentally ill. This article concludes with a series of recommendations.
The Availability of Mental Health Resources
A Brief History
Prior to the 1960s, it was customary for the severely mentally ill to be housed in asylums. There are a variety of interrelated reasons for this, and chief among them are (1) a general fear of the mentally ill by the public; (2) psy-chiatry was still in its infancy, and misun-derstandings and misconceptions abounded about the mentally ill among mental health professionals; and, consequently; and (3) it was considered prudent to provide mental
health services to the severely mentally ill within asylums (Grob, 1992).
By the early 1960s, at least two medical-related developments converged to change the way the severely mentally ill received treatment. First, pharmaceutical research brought about advances in the use of psychotropic medica-tions with the mentally ill, resulting in fewer placements in asylums and the widespread use of community mental health services (Grob, 1992). Second, psychiatry gained legiti-macy in the medical profession. That is, while psychiatry was initially considered a profes-sion practiced primarily within mental health institutions, improved therapeutic modalities brought psychiatry into community mental health as well (Grob, 1992).
These advances could not have come at a better time. Asylums were overcrowded and cost-prohibitive. In 1963, during the Kennedy Administration, the Community Mental Health Act (CMHA) was passed into law (Frank & Glied, 2006). The intention of the CMHA was to decrease the number of mentally ill per-sons placed in asylums by creating community mental health centers which would provide mental health services in the community in order to help the mentally ill live fulfilling lives. The mentally ill would have access to housing, psychiatric services, and, perhaps most impor-tantly, medications that would help stabilize their illnesses. It was thought that these ser-vices would allow the mentally ill to live pro-ductively in society. Only the most severe cases would require institutional placement.
The deinstitutionalization of many of the severely mentally ill began in earnest fol-lowing the passage of the CMHA. But these

Law Enforcement Executive Forum • 2012 • 12(4) 65
patients were released before federal funds were fully distributed to establish community mental health centers (Frank & Glied, 2006). It took until 1965 to fund a full spectrum of com-munity mental health services as it was con-ceived by the CMHA of 1963 (Gronfein, 1985). The lack of coordination resulted in increased homelessness, and many of the mentally ill did not receive needed treatment. As might be expected, researchers reported an increase in the number of mentally ill who were incarcer-ated at that time (Raphael, 2000). Most of the behaviors that resulted in jail and prison terms were disturbances of the peace or a variety of nonviolent crimes.
Even the Great Society Initiatives of the Johnson Administration (i.e., Medicare, Medicaid, and Social Security Insurance) did not resolve the problems faced by those released from asylums (Frank & Glied, 2006). For many, their symptoms were too severe for them to comprehend what they needed to do to live successfully “on the outside.” Even more common was the problem that many of them did not take their medications as prescribed. Many of the mentally ill simply moved from the asylum to the community only to be reinstitutionalized in jails and prisons because of their aberrant behaviors (Frank & Glied, 2006). Deinstitutionalization continued through the decade of the 1970s, and the prom-ises of federal programs to support the mentally ill were not realized (Harcourt, 2011).
The CMHA was very successful at reducing the number of patients in mental health hos-pitals. For instance, it resulted in a 59% reduc-tion of the mentally ill in county and state mental health hospitals from 1965 to 1975; and there was another 29% reduction in patients housed in mental health hospitals from 1975 to 1980 (Gronfein, 1985).
The Current State of Mental Health Services
The National Institute of Mental Health (Honberg, Kimball, Diehl, Usher, & Fitzpatrick, 2011) reports that about 6% or one in 17 people today live with serious mental illness, including schizophrenia, bipolar disorder, and depression.
While these numbers may have once sounded the alarm to provide more services to those with mental illness, the worst recession since the Great Depression has caused most states to cut substantial portions out of their mental health budgets. These cuts are far-reaching and include reductions in community- and hospital-based psychiatric care, housing for the mentally ill, and pharmaceutical therapies. Twenty-eight states and the District of Columbia made cuts to their mental health budgets from 2009 to 2012 (Honberg et al., 2011) (see Table 1). Many states made rather deep cuts to their budgets such as Alaska, which cut 35% (or $48 million) from its mental health budget; South Carolina and Arizona, which cut about 23% (or $41 million and $108 million, respectively); and Washington, DC, and Nevada, which cut 19% ($44 million) and 17% ($39 million), respec-tively. The National Alliance on Mental Illness (NAMI) reported that prior to the recession, about half of those suffering from severe mental illness did not receive mental health services in the previous year (Honberg et al., 2011; Kessler et al., 2005), and it is reasonable to assume that with major cuts to mental health services that even fewer people will have the opportunity to avail themselves of the services they need in order to have a quality life.
Budget cuts for resources designated to pay for such things as prescriptions, crisis services, housing, workforce development, and acute and interim inpatient care may have the larg-est impact on the frequency with which police officers encounter the mentally ill. Addition-ally, states are downsizing their professional workforces, including psychiatrists, psychol-ogists, and social workers. While services and personnel are being cut, Honberg et al. (2011) report that there has been an increase in the demand for such things as crisis services, emergency psychiatric screening services, and inpatient psychiatric care.
Twenty-two states increased their mental health budgets from 2009 to 2012 (Honberg et al., 2011) (see Table 2). The states with the most substan-tial increases to their budgets are North Dakota, which added 48% (or $24 million) to its mental

66 Law Enforcement Executive Forum • 2012 • 12(4)
health budget; Oregon and Georgia, which added 21% ($63 million) and 22% ($86.1 mil-lion), respectively; and West Virginia and Maine, which added about 11% ($16.4 million and $10.7 million, respectively) to their mental health budgets. Rhode Island added 10.6% ($9.3 million) to its budget for mental health services, while the other states added less than 9% to their budgets.
The Extent to Which the Mentally Ill Are Impacting the Justice SystemIt is difficult to know exactly how many calls involving mentally ill persons (also known as emotionally disturbed persons or EDPs) that police respond to in the line of duty. Accord-ing to New York Police Department Chief Robert Gianelli, NYPD responded to 87,000 EDP calls in 2007, and that did not include
calls that were not initially classified as EDPs (Irwin, 2008). But using NYPD data as a mea-suring stick for other communities is problem-atic. A national survey conducted in the late 1990s is a more objective measure of the prob-lem. Unfortunately, it was conducted nearly 20 years ago—in between the two periods of deinstitutionalization described earlier—and the degree to which it reflects police–men-tally ill person encounters today is unknown. Notwithstanding, this study surveyed law enforcement agencies that served 100,000 resi-dents or more and found that 7% of all official police–citizen encounters involved the men-tally ill (Deane, Steadman, Borum, Veysey, & Morrissey, 1999). An earlier study found that upwards of 10% of police–citizen encounters involved the mentally ill (Janik, 1992).
Table 1. State Mental Health Budget Cuts FY2009-2012
State
FY2009 (Millions)
FY2012 (Millions)
Change (Millions)
Percent Change
South Carolina Alabama Alaska Illinois Nevada District of Columbia California Idaho Kansas Mississippi Virginia Massachusetts Colorado Missouri Utah Oklahoma Montana New York Ohio Hawaii Delaware Indiana New Hampshire North Carolina Pennsylvania Nebraska Louisiana Washington Kentucky
$187.3 $100.3 $125.6 $590.7 $175.5 $212.4
$3,612.8 $57.1
$115.4 $262.5 $424.3 $685.4 $124.7 $310.7 $91.4
$194.5 $65.0
$3,775.4 $511.9 $181.4 $78.6
$249.9 $104.0 $615.3 $723.2 $108.7 $415.6 $444.4 $177.2
$113.7 $64.2 $84.7
$403.7 $126.2 $161.6
$2,848.0 $46.9
$101.1 $235.3 $386.6 $629.8 $115.0 $289.5 $85.3
$183.1 $61.2
$3,570.5 $485.9 $172.7 $76.0
$245.6 $102.7 $608.0 $717.2 $108.2 $414.1 $443.1 $177.1
-$73.6 -$36.1 -$40.9
-$187.0 -$49.3 -$50.8
-$764.8 -$10.2 -$14.3 -$27.2 -$37.7 -$55.6 -$9.7
-$21.2 -$6.1
-$11.4 -$3.8
-$204.9 -$26.0 -$8.7 -$2.6 -$4.3 -$1.3 -$7.3 -$6.0 -$0.5 -$1.5 -$1.3 -$0.1
-39.3-36.0-32.6-31.7-28.1-23.9-21.2-17.9-12.4-10.4-8.9-8.1-7.8-6.8-6.7-5.9-5.8-5.4-5.1-4.8-3.3-1.7-1.3-1.2-0.8-0.5-0.4-0.3-0.1

Law Enforcement Executive Forum • 2012 • 12(4) 67
More recently, researchers have assessed the extent to which the mentally ill are housed in correctional institutions. Although it is an imperfect measure of police–mentally ill person encounters, it is an insightful mea-sure of the extent to which those encounters end in incarceration. Research shows that the mentally ill are significantly more likely to be arrested and formally processed than those without a known mental illness (Teplin, 2000). And since police officers serve as gatekeep-ers to the justice system, it is not surprising that many of the police–mentally ill person encounters end in arrest and often result in incarceration. It is, after all, widely accepted that the severely mentally ill tend to come into contact with law enforcement at a higher rate, and they are detained in prisons and jails at a higher rate than those who do not suffer from severe mental illnesses (Wettstein, 1998).
The extent to which jail and prison inmates suffer from mental illnesses has only recently become an area of research interest. For exam-ple, a recent study of jail inmates revealed that about 14.5% of male inmates and 30% of
female inmates suffered from serious mental illness (Steadman, Osher, Robbins, Case, & Samuels, 2009). Additionally, according to a 2006 Bureau of Justice Statistics report (James & Glaze, 2006), 64% (or 479,900) jail inmates, an estimated 56% (or 705,600) of state prison inmates, and 45% (or 78,000) of federal prison inmates had a recent history of mental illness or symptoms of a mental health problem. Of these inmates, 54% of jail inmates and 43% of prison inmates had symptoms of mania; 30% of jail inmates and 23% of prison inmates suf-fered from symptoms of major depression; and 24% of jail inmates and 15% of prison inmates reported symptoms that matched a variety of psychotic disorders.
While reducing the number of persons placed in mental health facilities may have initially resulted in reduced state expenditures, many states are now reporting additional expenses associated with the incarceration of the men-tally ill. According to the NAMI (n.d.), it costs about $9 billion annually to house the mentally ill in our nation’s jails and prisons. The State of Connecticut reported that the costs associated
Table 2. State Mental Health Budget Increases FY2009-2012
State
FY2009 (Millions)
FY2012 (Millions)
Change (Millions)
Percent Change
South Dakota Vermont Florida Maryland Arkansas Iowa Michigan Texas New Jersey Wisconsin Arizona Connecticut Tennessee New Mexico Minnesota Wyoming Rhode Island West Virginia Maine Oregon Georgia North Dakota
$45.4 $152.1 $573.3 $653.4 $71.4
$201.8 $1,173.3
$924.3 $811.5 $418.7 $492.8 $676.0 $164.3 $98.4
$191.3 $52.7 $87.7
$142.9 $69.6
$301.6 $393.9 $49.9
$45.5 $153.6 $580.9 $665.1 $73.3
$208.2 $1,222.9
$964.1 $849.6 $438.4 $520.5 $715.3 $174.0 $104.8 $204.4 $57.4 $97.0
$159.3 $80.3
$364.6 $480.0 $73.9
$0.1 $1.5 $7.6
$11.7 $1.9 $6.4
$49.6 $39.8 $38.1 $19.7 $27.7 $39.3 $9.7 $6.4
$13.1 $4.7 $9.3
$16.4 $10.7 $63.0 $86.1 $24.0
0.21.01.31.82.73.24.24.34.74.75.65.85.96.56.88.9
10.611.515.420.921.948.1
68 Law Enforcement Executive Forum • 2012 • 12(4)
with incarcerating the mentally ill are twice that for housing other inmates (Phaneuf, 2012). Frustrated over the costs incurred for incarcerating the mentally ill, the Governor of Connecticut, Dannel Malloy, stated that the prison system has become the de facto alter-native to mental hospitals (Phaneuf, 2012). The Oklahoma Department of Corrections reported that it spent more than $8 million in 2011 on inmate mental health services (Marx, 2012). And in the State of Illinois, one in every 10 prisoners in the Tamms super-max prison receives psychotropic drugs at the annual cost of about $27 million (Marx, 2012). Additional costs were incurred for correctional staff train-ing to effectively work with and manage men-tally ill prisoners.
The Complex Role of Police Officers When They Encounter the Mentally IllPolice officers are considered the first-responders to crisis events, and many of these crises involve the mentally ill (Vermette, Pinals, & Applebaum, 2005). In all crises, the police attempt to reestablish order and pro-tect the public welfare. When mentally ill per-sons are involved, police officers must also be sensitive to the needs of the individual in crisis (Finn & Sullivan, 1989; Teplin, 2000). A large observational study conducted by Teplin (1984a) found police encounters with the mentally ill resulted in hospitalization in 11.8% of cases; arrests comprised 16.5% of all police–mentally ill person encounters; and in the vast majority of cases (71.8%), police offi-cers found an informal solution to the matter to which they were called.
Previous research has not criticized the deci-sion by police officers to informally handle police encounters with the mentally ill; how-ever, criticism is leveled at the use of arrest (which occurs in one in every six encounters) and the infrequency of the hospital option (which occurs in one in every nine encoun-ters). Many researchers have asserted that in the absence of adequate training about mental illness and not understanding the local mental
health system, police officers are sometimes inclined to initiate arrest and place the accused in jail when a more appropriate response to the event may be a referral to a mental health provider (Bonovitz & Bonovitz, 1981; Clark, Ricketts, & McHugo, 1999; Dupont & Cochran, 2000; Monahan & Steadman, 1983). But research indicates that suspects exhibiting signs of mental illness are more likely to be arrested than those who do not exhibit those behaviors (Teplin, 1984b). Forty-seven percent of police encounters with the mentally ill end in arrest compared with just 28% of encoun-ters when the suspect does not exhibit symp-toms of mental illness. But the arrest decision appears to be far more complex than just the behavior of the suspect.
Police officers often feel unprepared and unsupported when dealing with the mentally ill. These feelings are not the result of misun-derstanding their legal responsibilities. On the contrary, police officers understand that they are legally empowered “to initiate a psychi-atric emergency apprehension whenever the person is either dangerous to self or others or is unable to provide for basic physical needs so as to protect him/herself from serious harm” (Teplin, 2000, p. 9). Feeling unprepared and unsupported are rooted in the subjective—that is, trying to decide how best to intervene in a crisis. In other words, while the law legiti-mizes police intervention, police officers exer-cise vast discretion when deciding on the best course of action in crisis situations. Police offi-cers can (1) transport the mentally ill person to a mental hospital for assessment and per-haps treatment; (2) arrest the person and place them temporarily in the local jail; or (3) try to resolve the situation informally (Teplin, 2000). These decisions are impacted by such things as community resources, the policies and pro-cedures of mental health hospitals and pro-grams, police training, the behavior of the mentally ill person, departmental policies and priorities, and the officer’s understanding of mental illness.
Personal opinion and prior experiences deal-ing with the mentally ill may also impact
Law Enforcement Executive Forum • 2012 • 12(4) 69
police decisionmaking. For instance, research has found that officers who perceive that hos-pitals mishandled cases may be more inclined to use other options in the future (Green, 1997). And, in his seminal study on police decisionmaking with the mentally ill, Bittner (1967) found that police officers tended to bring suspects to the mental hospitals for psy-chiatric assessments when they believe that mental illness was clearly present.
Perceptions of dangerousness also play a part in arrest decisions. The public expects the police to act in ways that will protect them. What the public fears most is random and senseless violence, and the public associates such conduct with the mentally ill (Marzuk, 1996). For example, Pescosolido et al. (1996) found that 60.9% of the public believes that schizophrenics would act violently toward others, and a third of the public believes that those suffering from major depression are potentially violent. When the public feels most vulnerable—such as after a well-publi-cized event with a known mentally ill assail-ant (like the Gabrielle Giffords attack)—the public expects the mentally ill to be isolated from the public. An arrest is an expedient way to create social distance from the mentally ill, and social distance brings about a sense of safety and security (e.g., see Angermeyer & Matschinger, 1995).
Perceptions of dangerousness also exist among police officers, and those perceptions may also influence the decision to arrest. For instance, a recent survey of 2,400 senior law enforcement officers were asked, “In your esti-mation, what percentage of people who have injured or killed police officers in the line of duty were experiencing mental illness at the time of the incident?” Nearly 67% of respon-dents reported that they believed that at least two in every five officers killed or injured in the line of duty were attacked by someone experiencing a psychotic episode (Biasotti, 2011).
Specialized Police Responses to the Mentally IllThere have been two generations of responses to the call for more appropriate interventions to crises involving the mentally ill. The first generation is perhaps best characterized as an educational approach in which police depart-ments emphasized the need for training (Hails & Borum, 2003). These training programs increased the knowledge police officers had about mental illness, including the identifica-tion of mental illness symptoms (Godschalx, 1984; Janus, Bess, Cadden, & Greenwald, 1980). While this training was widespread—with 88% of law enforcement agencies report-ing that they offered an educational approach to training (Deane et al., 1999)—it did not alter decisionmaking in police officer–mentally ill suspect encounters (Borum, 2000) and, there-fore, had little effect on reducing the number of cases involving the mentally ill that were pro-cessed through formal justice system channels.
The second generation of police response to the mentally ill is characterized by more spe-cialized programming. That is, while most departments provided general education about mentally ill suspects during the first generation, less than half of them provided specialized training to select individuals (Deane et al., 1999). It is the specialized pro-grams that research supports as having the most promise.
According to Deane et al. (1999), second gen-eration responses tend to take three forms. First, there are specialized police response pro-grams that involve training selected police offi-cers who are first-order responders in mental health crisis situations. As part of their duties as law enforcement officers, they serve as liai-sons with the mental health system. Second, there are specialized mental health response pro-grams that involve mental health professionals who are employed by police departments to respond in person and/or through telephone communication to consult with police officers when they are confronted by crisis situations involving the mentally ill. Third, there are
70 Law Enforcement Executive Forum • 2012 • 12(4)
specialized mental health partnership programs. These programs consist of mental health crisis teams comprised of mental health profession-als who operate as part of the community mental health system. They are independent of but work cooperatively with police officers to bring about more desirable outcomes when the mentally ill are in crisis.
A survey conducted soon after the start of the current recession suggests that the economic downturn may have taken its toll on special-ized mental health training for police offi-cers. There are fewer specialized mental health partnership programs in existence today than in the past (Hails & Borum, 2003). This may mean that again the approach law enforce-ment agencies are taking is to provide mental health education to all police officers in lieu of also providing specialized programming. If that is true, it is particularly troubling since the same survey reported that, on average, recruits are given about six hours of education and training related to the mentally ill, which is substantially less than the 16 hours that are recommended by the model curriculum developed by the Police Executive Research Forum (PERF) (1997).
There is one type of program that is seeing growth and increased popularity—specialized police response programs. More specifically, it appears that a Crisis Intervention Team (CIT) Model (a type of specialized police response) is becoming more popular among law enforce-ment professionals (Hails & Borum, 2003). In general, these responses involve forging part-nerships with law enforcement agencies and mental health professionals. The CIT Model, for example, provides specialized training to certain patrol officers on issues related to mental illness and the mental health system within their community. The idea behind the CIT Model is to provide training to patrol offi-cers so that they might be better able to dees-calate crisis events involving the mentally ill, reduce the number of mentally ill who are arrested and processed through formal jus-tice system channels, and help the mentally ill and their families facilitate a medical response
to crisis events (Teller, Munetz, Gil, & Ritter, 2006). Evaluations of the CIT Model tend to suggest that CIT partnerships are working as planned. That is, a medical response to crisis events involving the mentally ill are more likely when police officers receive specialized training, work with mental health profession-als, and involve families in the decisionmak-ing process (Teller et al., 2006). Interestingly, there may be another reason for why the CIT Model is successful. It appears that the CIT Model appeals to many constituencies. To the police, CIT training helps to keep the commu-nity and the officer safer; to mental health pro-fessionals, CIT training reduces the number of arrests and increases the number of mentally ill who are processed medically instead of through the justice system; and spouses, chil-dren, and parents of the mentally ill are more likely to call the police because they are more knowledgeable and understanding of their situations, and they are perceived to be more inclined to help facilitate a medical response in crisis situations (Teller et al., 2006).
Recommendations and ConclusionThe recession has had an impact on policing practices. Positions are not being filled, and programs are being cut. Issues related to polic-ing and the mentally ill have been front and center for nearly five decades. Cuts to institu-tional and community mental health budgets make training programs for police–mentally ill person encounters more relevant and point to the need for ongoing efforts that improve outcomes. A number of best practices rose to the top of this literature review:
• Best Practice #1 – Additional training for all police officers is a must. An educated police force is a more effective and service-oriented force, responsive to the needs of the public it serves. PERF (1997) recom-mends 16 hours of training related to the mentally ill. The national average is about a third of the number of hours recommended by PERF. Priority should be given to this type of training given the continued move to deinstitutionalize the mentally ill.

Law Enforcement Executive Forum • 2012 • 12(4) 71
•
•
Best Practice #2 – Misdemeanor offenses committed by the mentally ill should be treated differently than more serious criminal law violations committed by the mentally ill (see Teplin, 2000). Mental health courts are recognized as an effective alternative for the mentally ill, especially for minor offenses. It has been found to reduce recidivism and violent crime (e.g., see McNiel & Binder, 2007). Law enforce-ment officials should engage other justice system professionals, such as the prosecu-tors, judges, and community corrections officials, to create a comprehensive, cost-effective justice system response for the mentally ill.
Best Practice #3 – Current research sug-gests CIT programs are the most effective law enforcement approach to respond to the mentally ill. More communities should select officers who are interested in and have the aptitude for working with the mentally ill and then initiate a CIT pro-gram. CIT saves money and time—not only for policing, but for the entire justice system.
ReferencesAngermeyer, M. C., & Matschinger, H. (1995).
Violent attacks on public figures by per-sons suffering from psychiatric disorders. European Archive of Psychiatry and Clinical Neuroscience, 245(3), 159-164.
Biasotti, M. C. (2011). The impact of mental illness on law enforcement resources. Arlington, VA: Treatment Advocacy Center, Naval Postgradu-ate School, Center for Homeland Defense and Security. Retrieved November 7, 2012, from www.treatmentadvocacycenter.org/storage/documents/The_Impact_of_Mental_Illness_on_Law_Enforcement_Resources__TAC.pdf.
Bittner, E. (1967). Police discretion in emer-gency apprehension of persons with mental illnesses. Social Problems, 14, 278-292.
Bonovitz, J. C., & Bonovitz, J. S. (1981). Diver-sion of the mentally-ill into the criminal-justice-system—The police intervention per-spective. American Journal of Psychiatry, 138,973-976.
Borum, R. (2000). Improving high risk encoun-ters between people with mental illness andpolice. Journal of the American Academy ofPsychiatry and the Law, 28, 332-337.
Clark, R., Ricketts, S., & McHugo, G. (1999).Legal system involvement and costs for per-sons in treatment for severe mental illnessand substance abuse disorders. PsychiatricServices, 50, 641-647.
Deane, M. W., Steadman, H. J., Borum, R.,Veysey, B. M., & Morrissey, J. P. (1999).Emerging partnerships between mentalhealth and law enforcement. Psychiatric Ser-vices, 50(1), 99-101.
Decuir, W., Jr., & Lamb, R. (1996, October).Police response to the dangerously mentallyill. The Police Chief, 99-106.
Dupont, R., & Cochran, S. (2000). Policeresponse to mental health emergencies: Bar-riers to change. Journal of the American Acad-emy of Psychiatry and the Law, 28, 338-344.
Finn, P., & Sullivan, M. (1989). Police han-dling of the mentally ill: Sharing responsibil-ity with the mental health system. Journal ofCriminal Justice, 17, 1-14.
Frank, R. G., & Glied, S. A. (2006). Betterbut not well: Mental health policy in theUnited States since 1950. Baltimore, MD: TheJohns Hopkins University Press.
Godschalx, S. (1984). Effect of a mental healtheducation program upon police officers.Research in Nursing and Health, 7, 111-117.
Green, T. M. (1997). Police as frontline mentalhealth workers: The decision to arrest orrefer to mental health agencies. InternationalJournal of Law and Psychiatry, 20, 469-486.

72 Law Enforcement Executive Forum • 2012 • 12(4)
Grob, G. N. (1992). Mental health policy in America: Myths and realities. Health Affairs, 11(3), 7-22.
Gronfein, W. (1985). Incentives and interven-tions in mental health policy: A comparison of Medicaid and community mental health programs. Journal of Health and Social Behav-ior, 26(3), 192-206.
Hails, J., & Borum, R. (2003). Police training and specialized approaches to respond to people with mental illness. Crime & Delin-quency, 49(1), 52-61.
Harcourt, B. E. (2011). Reducing mass incarcera-tion: Lessons from the deinstitutionalization of mental hospitals in the 1960s (University of Chicago Law & Economics, Olin Working Paper No. 542; University of Chicago, Public Law Working Paper No. 335). http://dx.doi.org/10.2139/ssrn.1748796
Honberg, R., Kimball, A., Diehl, S., Usher, L., & Fitzpatrick, M. (2011). State mentalhealth cuts: The continuing crisis. Arlington, VA: National Alliance on Mental Illness. Retrieved November 7, 2012, from www.nami.org/Template.cfm?Section=state_ budget_cuts_report.
Irwin, D. (2008, March 6-March 12). Tough questions for NYPD regarding treatment of mentally ill. The New York Amsterdam News, p. 30.
James, D. J., & Glaze, L. E. (2006). Mental health problems of prison and jail inmates. Washington, DC: Bureau of Justice Statistics, U.S. Department of Justice, Office of Justice Programs. Retrieved November 7, 2012, from http://bjs.ojp.usdoj.gov/content/pub/pdf/mhppji.pdf.
Janik, J. (1992). Dealing with mentally ill offenders. FBI Law Enforcement Bulletin, 61, 22-26.
Janus, S., Bess, B., Cadden, J., & Greenwald, H. (1980). Training police officers to distinguish
mental illness. American Journal of Psychiatry, 137, 228-229.
Kessler, R. C., Delmar, O., Frank, R. G., Olfson, M., Pincus, H. A., Walters, E. E., . . . Zaslavsky, A. M. (2005). Prevalence and treatment of mental disorders: 1990 to 2003. New England Journal of Medicine, 352(24), 2515-2523.
Marx, G. (2012, January 26). Illinois isolates most dangerous inmates in “super-max” prison. Chicago Tribune.
Marzuk, P. M. (1996). Violence, crime, and mental illness. How strong a link? Archive of General Psychiatry, 53(6), 481-486.
McNiel, D. E., & Binder, R. L. (2007). Effec-tiveness of a mental health court in reducing criminal recidivism and violence. American Journal of Psychiatry, 164, 1395-1403.
Monahan, J., & Steadman, H. (1983). Crime and mental disorders: An epidemiological approach. In M. Tonry & N. Morris (Eds.), Crime and justice: An annual review of research (Vol. 4, pp. 145-190). Chicago: University of Chicago Press.
National Alliance on Mental Illness (NAMI). (n.d.). Spending money in all the wrong places: Jails and prisons. Retrieved November 7, 2012, from www.nami.org/Template.cfm?Section=Fact_Sheets&Template=/ContentManagement/ContentDisplay.cfm&ContentID=14593.
Pescosolido, B. A., Martin, J. K., Link, B. G., Kikuzawa, S., Burgos, G., Swindle, R., & Phelan, J. (1996). Americans’ views of mental health and illness at century end: Continuity and change (Public Report on the MacArthur Mental Health Module, 1996 General Social Survey). Bloomington and New York: The Indiana Consortium of Mental Health Services Research, Indiana University and The Joseph P. Mailman School of Public Health, Columbia University. Retrieved November 7, 2012, from www.indiana.edu/~icmhsr/docs/Americans%27%20Views%20of%20Mental%20Health.pdf.

Law Enforcement Executive Forum • 2012 • 12(4) 73
Phaneuf, K. (2012). State pays high price for incarcerating mentally ill. The Connecticut Mirror. Retrieved December 4, 2012, from http://ctmirror.org/story/15199/state-pays-high-price-incarcerating-large-numbers-mentally-ill.
Police Executive Research Forum (PERF). (1997). The police response to people with mental illness: Trainers guide. Washington, DC: PERF. Retrieved November 7, 2012, from www.ptb.state.il.us/resources/mentalillness/Mpoliceresponse.pdf.
Raphael, S. (2000). The deinstitutionalization of the mentally ill and growth in the U.S. prison population: 1971 to 1996. Berkeley: Goldman School of Public Policy, University of California at Berkeley.
Steadman, H. J., Osher, F. C., Robbins, P. C., Case, B., & Samuels, S. (2009). Prevalence of serious mental illness among jail inmates. Psychiatric Services, 60(6), 761-765.
Teller, J. L., Munetz, M. R., Gil, K. M., & Ritter, C. (2006). Crisis Intervention Team train-ing for police officers responding to mental disturbance calls. Psychiatric Services, 57(2), 232-237.
Teplin, L. A. (1984a). Managing disorder: Police handling of the persons with mental illnesses. In L. Teplin (Ed.), Mental health and criminal justice (pp. 157-175). Beverly Hills, CA: Sage.
Teplin, L. A. (1984b). Criminalizing mental disorder: The comparative arrest rate of the mentally ill. American Psychiatrist, 39(7), 794-803.
Teplin, L. A. (2000, July). Keeping the peace: Police discretion and mentally ill persons. National Institute of Justice Journal, 8-15.
Vermette, H. S., Pinals, D. A., & Applebaum, P. S. (2005). Mental health training for law enforcement professionals. Journal of the
American Academy of Psychiatry and the Law, 33, 42-46.
Wettstein, R. M. (1998). Treatment of offenders with mental disorders. New York: The Guilford Press.
Michael P. Brown, PhD, is a professor of Criminal Justice and Criminology at Ball State University in Muncie, Indiana. He earned his doctor ate at Western Michigan University. Dr. Brown has published research on policing, com -munity corrections, juvenile justice, and undergraduate teaching and learning. His primary areas of specialization ar e community corrections, juvenile justice, and comparative justice systems.

74 Law Enforcement Executive Forum • 2012 • 12(4)
Can Cops Prevent Murder? Causes and Remedies for Homicide in the City of ChicagoArthur J. Lurigio, Department of Psychology, Department of Criminal Justice and
Criminology, College of Arts and Sciences, Loyola University Chicago
Five common beliefs about homicide in the City of Chicago will be examined herein along with promising remedies for the problem. These beliefs are subjected to the “truth-o-meter,” basing assessments primarily on research or statistical evidence. Various strategies are pre-sented that are likely to make the City safer. The first belief is that Chicago is a highly dangerous city, which is only half true. The number and rate of homicides in Chicago are undoubtedly worth serious consideration and a genuine cause for alarm. Indeed, the number of homicides in the first six months of 2012 (more than 250) outpaced the previous year’s total by 38%. At the end of July, the number grew to 327, which was 28% higher than last year’s total at that time (Gorner, 2012a). By the third week of August, the City had expe-rienced 40 homicides in that month alone—70% more than those recorded in August 2011 (Gorner, 2012b). Hence, the City might once again be headed for the dubious distinction of the murder capital of the United States in terms of the total number of homicides. The number of murders and other violent crimes in Chicago is already higher than in other large cities such as New York, London, Paris, and Sydney; in addition, those numbers are higher in the U.S. than in other developed nations such as the United Kingdom, the countries of Europe, and Japan (Zimring, 2012).
Notwithstanding 2012’s sobering homicidestatistics, when placed in a broader context, the rates of violence in Chicago also have been lower than those in other cities in the U.S. and in the world and are far lower than those in the City’s past. A sample of American cities with recently higher homicide ratesthan Chicago’s includes St. Louis, Newark, Gary, Philadelphia, New Orleans, Detroit,
Flint, and Baltimore (Federal Bureau of Inves-tigation [FBI], 2010). In 2011, Chicago was not even ranked among the 50 most violent cities in the world based on homicide rates (United Nations Office on Drugs and Crime, 2011). When Chicago lost the bid for the Olympic Games, pundits opined that percep-tions of Chicago as a dangerous place made the Olympic Committee members skittish about selecting the City. Instead, they chose Rio de Janeiro for the 2016 Games—a city that, in 2008, had a murder rate nearly two times higher than Chicago’s (Barrionuevo, 2009).
Since the 1990s, the number and rate of homi-cides in the City have actually been steadily declining. From 1990 to 1999, Chicago’s murder rate fell 47%; and from 2000 to 2009, it fell 26% (Zimring, 2012). Based on Chicago Police Department (CPD) data, the high-est number of homicides ever recorded in Chicago was 970 in 1974, resulting in a rate of 29 per 100,000; meanwhile, the highest rate of homicides ever recorded in Chicago occurred in 1992, when the rate was 34 per 100,000 (943 homicides occurred). Since 2004, the number of homicides in the City has exceeded 500 only once (in 2008) and has averaged about 460 annually. If the City reaches the 500 mark again in 2012, the homicide rate will still be half of what it was 20 years ago. In 2004, the homicide total was equivalent to that reported in 1967 (Alderden & Lavery, 2005); in 2010, the homicide total was equal to the number recorded in 1965 (United Press International, 2011).
In light of these data, residents of the City should be feeling safer compared to residents of 10 and 20 years ago. However, people do not evaluate their risk for violence in the present

Law Enforcement Executive Forum • 2012 • 12(4) 75
in a comparative analysis with bygone years. People’s attitudes and perceptions are rarely swayed by statistics; rather, their fears and frustrations are stoked by disturbing media images of homicide victims, especially mur-dered youth (Katz, 2012). The worst are those of little children, such as 7-year-old Heaven Sutton, who was killed by a stray bullet from the gun of a gang member shooting wildly in the streets (Smith, 2012). Furthermore, peo-ple’s expectations for safety are continually shifting with the conditions in their immediate surroundings. Each occurrence of homicide in a neighborhood elevates residents’ perceived risk and fear in a process known as vicarious victimization, while undermining their sense of collective efficacy to improve the commu-nity (Shippee, 2012). Lower levels of collec-tive efficacy are associated with higher levels of crime (Sampson, Raudenbush, & Earls, 1997). Murders also can result in an exodus of residents and a decline in home and busi-ness investments in those neighborhoods. Residents with economic, social, and political capital are more inclined to move from dan-gerous communities than from safe communi-ties (Cullen & Levitt, 1999).
Although most neighborhoods in the City expe-rience homicides, murder is concentrated in only a handful of districts (e.g., South Chicago, Gresham, Englewood, Chicago Lawn, Ogden, and Harrison)—adjacent areas (also referred to by the author as the murder corridor) that suffer from a passel of other problems such as intergenerational poverty, gang infestation, and single-parent households as well as exces-sively high rates of crime, housing foreclosures, and unemployment (Bogira, 2012). Common to these areas are also higher-than-average rates of people with communicable diseases and edu-cational deficits (e.g., high school dropouts). In fact, the territories of the City controlled by the largest street gangs are also those with the high-est presence of homicides, social disorder, and economic blight (Bernstein & Isackson, 2012; Moser, 2012). These problems can be character-ized en bloc as the “syndrome of troubled com-munities,” in which residents live in a cloud of fear, isolation, despair, and hopelessness. In
2010, the six districts listed above accounted for 52% of all of the City’s murders. That year, eight police districts had five or fewer homi-cides and four had more than five but fewer than 10. A graph of the City’s homicides would produce a bimodal distribution: a cluster of dangerous neighborhoods and a cluster of safe neighborhoods, with only a couple of districts in between (Austin, Morgan Park, and Grand Central) (CPD, 2011).
The second belief is that the police should be solely responsible for lowering the City’s murder rate. This belief is mostly false. Home to 2.7 million people, Chicago occupies nearly 260 square miles and is divided into 77 com-munity areas and 25 police districts. The CPD currently employs approximately 12,500 offi-cers, down from 13,700 just a few years ago (Chicago Justice Project, 2012a). Officers work in shifts; have days off; and pursue other off-the-street duties and assignments in places such as courts, headquarters, and station-houses. Each year, many police officers retire or are on medical leave. Hence, the public cannot realistically demand a “cop on every corner,” especially during the current period of fiscal retrenchment, which has forced a freeze in police hiring. Nevertheless, most residents of Chicago would contend that the police are largely responsible for lowering the homicide rate. People’s outrage is expressed in protests by residents, alderpersons, and community organizers, who clamor for law enforcement interventions to address the vio-lence problem.
The mayor and the police superintendent encourage the notion of police supremacy in murder prevention efforts whenever they appear at a news conference to field ques-tions about the latest shooting of a child or to expound on different policing programs and interventions following another bloody week-end in the City. Citizens would, understand-ably, be incensed if their leaders did or said nothing about the wanton loss of life. Prob-lem-focused, data-driven policing (COMP-STAT) in Chicago, New York, Los Angeles, and other large cities has indeed fostered steady

76 Law Enforcement Executive Forum • 2012 • 12(4)
declines in crime and violence during the last two decades (Willis, Mastrofski, & Weisburd, 2003). Law enforcement techniques have become increasingly expansive and sophisti-cated. The use of computer technology to map crime and guide the police in deployment and patrol decisions can make neighborhoods safer. Yet despite such advances, the police alone are limited in their ability to prevent crimes, particularly homicides.
Policing will always be a mostly reactive enter-prise. We do not expect firefighters to prevent fires or paramedics to prevent heart attacks. Yet nearly every day, the residents of the City and its major newspapers are critical of the mayor and police superintendent each time another young person’s life is senselessly and needlessly cut short by homicide. Each one is a tragedy, producing grief-stricken families, eroding the social fabric in the community, and reducing confidence in the CPD.
Homicide is one of the most common metrics applied in evaluating the aggregate perfor-mance of police departments. Similar to other crimes, homicides are caused by a complexity of factors. In general, murder is more difficult to prevent than common street crimes such as burglary, vandalism, robbery, and automobile theft. Street crimes tend to occur in discern-ible patterns; they are committed by repeat offenders using well-known modus operandi. In contrast, homicides have fewer common factors (Santos, 2013). Affect-laden (i.e., full of emotion) homicides often occur suddenly and are perpetrated indoors; these are virtu-ally impossible for the police to prevent but are easier to solve because they involve a spouse, partner, family member, or neighbor as the victim or offender, who usually leaves behind an abundance of forensic evidence. In contrast, planned or purposeful homicides (i.e., instrumental homicides) are perpetrated to accomplish a goal (Anderson, 2000). They are easier to prevent because the police can gather information while the murder is in the planning stage or when conflicts are brewing. Unfortunately, these types of murders rarely
come to the attention of the police before their occurrence.
The third belief is that gang members fuel the City’s murder rate. This belief is true. Gang-related homicides are more likely to be instrumental than affective, especially those that involve drug-selling gang members who shoot one another to gain hegemony over outdoor drug-selling markets. Gang-related homicides can also be instrumental in enhanc-ing a gang’s reputation or in expanding its sphere of influence or turf. According to CPD statistics, gang-related homicides account for 60% of the City’s murders that have a known motive. Many occur outdoors (77%) and can sometimes be predicted using street intelligence that suggests future flashpoints between factions within a gang or between rival gangs with simmering tensions (CPD, 2012). Gang-related homicides are theoreti-cally more preventable than affective or inti-mate partner killings, but they are more dif-ficult to solve because they involve strangers (both as victims and offenders) as well as eyewitnesses who are unwilling or unable to provide reliable testimony about what happened in the flash of a drive-by shooting (Heinzmann, 2012). The low clearance rate of these homicides can embolden the perpetra-tors and others in the community to commit future violent offenses (Alderden & Lavery, 2007).The warmest winter and spring in the City’s history paved the way for more street interactions among gang members earlier in 2012, resulting in more homicides during those months (Heinzmann, Gorner, & Coen, 2012).
Chicago gangs have become more combative owing to the weakening of supra-gang affili-ations (Folks and People Nations) and the incarceration of senior gang members. More loosely connected local gang allegiances and fewer mature leaders to keep the younger, more violent members in check are a perfect recipe for escalating shootings. The City’s razing of public housing developments—for-merly the strongholds for the most powerful and largest gangs in Chicago—forced gang

Law Enforcement Executive Forum • 2012 • 12(4) 77
members out of the narrow boundaries of the high-rises and into unfamiliar neighbor-hoods, where they were confronted by rival gangs or rival factions within the same gang (Heinzmann & Gorner, 2012).
The fourth belief is that murders are predict-able and specifiable. This belief is mostly false. The decision to grab a gun and pull the trigger frequently emanates from a series of unforeseeable events. Even in instances of instrumental violence, an episode that culmi-nates in death can arise from serendipitous circumstances and spontaneous altercations. Other random factors can turn a shooting into a homicide. The trajectory and caliber of the bullet, where it enters the body and how it tracks after entry, the size and body com-position of the victim, and the proximity of the shooting to the nearest trauma center all play a role in the homicide equation. In some years, these factors have favored the shoot-ing victims; in other years, they have not. The number of homicides has decreased or increased accordingly.
Except in cases of self-defense, murder is never a proportionate response to the provo-cation. What “insult” and how much drug-selling profits justify taking a life? Is a street corner worth the life of someone’s father, brother, or son? The answer is obvious to a rational person. Young men whose brains are injured or sensitized by repeated exposure to violence (kindling) develop low impulse con-trol (poorly formed executive function) and short time horizons (living in the moment and being dismissive or oblivious to the conse-quences of their actions) (e.g., Miczek et al., 2007). The antisocial rituals and sentiments of the gang culture promise shooters enhanced self-esteem, self-worth, and empowerment as well as increased standing and prestige in the gang. The killers gain ephemeral worth in their lives through the utter devaluation of the lives of others. In truth, the shooters are spurred by fatalism, fear, hopelessness, apathy, and despair; those beguiled by the false allure of the gang invariably become vic-tims themselves or prison inmates.
The fifth belief is that the ready availability of handguns contributes to the high homi-cide rates in Chicago and other urban areas plagued by violent crime. This belief is mostly true. Handguns are employed in 80% of the homicides in the City (CPD, 2012). They are lightweight and easy to carry and con-ceal. They are successful at inflicting mortal wounds, sometimes resulting in instanta-neous death. Handguns are, by far, the best weapon for committing murders in public places. Victim resistance is nearly impossi-ble; the shooting incident lasts mere seconds; and the offender can be far removed from the scene both during and after the shooting incident. Knives, baseball bats, brass knuck-les, fists, and feet are not as lethal as guns and take more time and skill to administer. Thus, in general, fewer guns probably equates to fewer homicides.
However, this conclusion is not always accu-rate. Chicago’s homicide rates soared during the years in which the City’s handgun ordi-nance was enforced. Indeed, gun owner-ship in the U.S. has been increasing while the homicide rate has been declining (Miller, 2012). Most people own guns for sport or self-protection, not the perpetration of felonies. Gun buy-back programs, such as the ones recently implemented in Chicago, cause no harm, but research suggests that their impact on homicide is nugatory (Kleck, 1997). The residents who turn in their weapons for cash are usually law-abiding citizens who want a few extra dollars in their pockets and one fewer dust-collecting item in their kitchen drawer (Rosenfeld, 1995; Welford, Pepper, & Petrie, 2004).
Murder in Chicago reached a critical point more than 40 years ago. The homicide rate has besmirched the City’s image and has the potential to drive away residents and busi-nesses as well as to keep away future invest-ments that can grow the City’s infrastructure and tax base. The fact that the City remains immersed after all these years in a homicide crisis betokens the need for a paradigm shift. The CPD can no longer bear the full onus for

78 Law Enforcement Executive Forum • 2012 • 12(4)
making the City safer. Instead, police officers must be an integral component in collec-tive and sustained efforts to lower the City’s homicide rate. The City should begin view-ing violence as a public health and social problem as well as a criminal justice problem. Most useful are multipronged strategies that tackle the complex pathogenesis of homicidal behavior, which is a symptom of a highly dis-tressed individual living in a highly distressed community.
The root causes of violence can be addressed most effectively through neighborhood revi-talization efforts on all fronts: social, political, and economic. City, state, and federal gov-ernments should launch plans for the instau-ration of communities in which crime and violence are highest. These plans require long-term business investments, concerted clean-up efforts, and the encouragement of home ownership. Stable communities are safe com-munities. As indicated in the original Chicago Alternative Policing Strategy (CAPS) Model, the police should leverage city services to board up abandoned properties, remove graffiti, beautify empty lots, and tow away abandoned vehicles. Such efforts to reduce physical disorder and encourage greater com-munity solidarity are correlated with crime and violence (Skogan, 1990). At a more micro-level, two-parent households must be encour-aged. Research conducted by the Heritage Foundation and the Manhattan Institute sug-gests that social problems, including crime and violence, have increased with the grow-ing absence of fathers from the home, leaving a void in young men’s lives that is often filled by gang membership (Heritage Foundation, 2012; MacDonald, 2012). Beginning in junior high school, churches, families, and schools should inculcate in young people the impor-tance of responsible parenting, especially fatherhood.
The CPD should return to other defining ele-ments of the CAPS prototype. The first ele-ment is the long-term assignment of police officers to the same beats. The CPD should permanently place more officers in the murder
corridor. Conducting drug sweeps, saturation patrols, and gang audits are useful and should be continued, but their effects are short lived. Mayor Emmanuel’s careful husbandry of City finances is absolutely necessary and highly commendable. The recent announcement on police hiring is welcomed, but those hires will only offset retirements and maintain the cur-rent level of person power (Main, 2012b).
The citizens of Chicago are likely to support the hiring of the critical mass of new police officers necessary to make neighborhoods truly safer; in other words, they would prob-ably be amenable to budgetary restructuring, even the imposition of new taxes, in order to achieve that end. The New York Miracle—substantial reductions in all categories of seri-ous crime in the past 20 years—was fostered by the city’s hiring of 8,000 new police offi-cers (Zimring, 2012). On the other hand, citi-zens and police union officials should realize that an increase in the size of the police force appears to be limited in its effects on homi-cide and is largely associated with reductions in street crimes such as theft of and from auto-mobiles (Klick & Tabarrok, 2005). Since 1993, the homicide rate in Chicago has been fall-ing steadily overall whereas the number of police officers has remained relatively stable (Chicago Justice Project, 2012a). Furthermore, the per capita size of the CPD is larger than that of the police departments of the other four largest cities in the United States (Chicago Justice Project, 2012b).
The correlation between the number of police officers and homicides in a jurisdiction is low, but a police presence is not inconsequential. Classic research in law enforcement shows that the visibility of police officers on the streets affects perceptions of safety, which are related to citizens’ satisfaction with the police and their use of public streets and thorough-fares. In turn, these factors can create safer and more orderly neighborhoods (Cordner, 2010). Nonetheless, the optimal size of the police force is unknown and most assuredly varies from city to city and from one time to another. What the police do on the ground and where
Law Enforcement Executive Forum • 2012 • 12(4) 79
they do it is as or more important than the size of the police department. The careful deploy-ment of police resources and the implemen-tation of innovative strategies tailored to the needs of the community are instrumental in creating a safer environment.
The second element is the resumption of beat meetings, particularly where the risk for homi-cide is greatest. Beat meetings underscore the importance of police–citizen partnerships in the co-production of neighborhood safety. Through the establishment of closer and more trusting relationships with police officers, more residents could be enlisted in solving gang-related shootings and homicides, which have a low clearance rate (Richardson & Kosa, 2001). In conjunction with beat meetings, the most violent districts should establish anti-homicide task forces consisting of police offi-cers; church, city, and school officials; commu-nity organizers; and academic experts. These task forces should meet with the mayor and police superintendent on a monthly basis to discuss the latest data on shootings and the district-specific measures that have been adopted to enhance safety. The task forces could draw on the expertise of the Homicide Research Working Group, which consists of university professors and researchers from around the world who have been studying all aspects of murder, including homicide prevention and investigation. These experts can provide district-specific, evidence-based plans for reducing the number of homicides (Homicide Research Working Group, 2012).
As an important step in the collaborative process, the City should be applauded for its willingness to cooperate with the Cease Fire Program, which employs former gang mem-bers as violence interrupters. These individu-als are best positioned to gather information about impending gang-related homicides and broker face-saving solutions to avoid recriminatory gang warfare and the per-petuating cycle of murder (Gorner, Mack, & Huppke, 2012). Violence interrupters can also teach young men better conflict-resolution skills. Studies have shown that the Cease Fire
Program is a promising approach for vio-lence reduction (Skogan, Hartnett, Bump, & Dubois, 2009).
Another key to reducing homicides is to con-fiscate the guns from the criminals who use them as instruments of death. Their weap-ons are rarely owned legally. In fact, many offenders are prohibited from gun ownership because they have a felony record or are on mandatory supervised release from prison or on probation. The City’s street criminals own guns to prey on residents or to protect them-selves from other street criminals or rival gang members. They buy guns from unscrupulous gun sellers or traffickers or through straw pur-chases in which the true owners’ identities are hidden (Main, 2012a). To aggressively remove weapons from the hands of these individu-als, the CPD should reestablish its gun spe-cialty unit. In addition, using the Racketeer Influenced and Corrupt Organization (RICO) statute to hold gang leaders accountable for every gang-related murder committed under their reign is another useful law enforcement tool that could compel the gang leaders to control shooters within their ranks (Wheatley, 2008).
Finally, the CPD must eradicate—not simply disrupt—the City’s open-air drug markets. The New York Police Department shut down the city’s expansive outdoor drug markets, thereby ending the systemic violence stem-ming from conflicts over these places of illicit business. In New York, outdoor drug sales were driven indoors, where conflicts between rival sellers were minimized or precluded altogether (Zimring, 2012). A positive byprod-uct of closing down the open-air drug markets is the increased inconvenience of making pur-chases. The ramps of the Eisenhower Express-way on the Chicago’s West Side will no longer provide easy ingress and egress for subur-banites to buy heroin, cocaine, and marijuana from street gang members.
In conclusion, homicides end lives senselessly, damaging families and communities for gen-erations. The complexity of the problem

80 Law Enforcement Executive Forum • 2012 • 12(4)
calls for a multifarious solution. Police, resi-dents, and community leaders must work in tandem to create orderly environments in which shooting is never considered an option for dealing with conflicts while cultivating an atmosphere of community solidarity and support. The City needs more police engaging in more “gangs-drugs-guns” policing in the districts where the risk of becoming another horrific homicide statistic is greatest. The ben-efits of reducing homicides will devolve to all residents in helping to ensure that Chicago retains its status as a world-class city.
ReferencesAlderden, M. A., & Lavery, T. A. (2005). 2004
murder analysis. Chicago: Chicago PoliceDepartment, Research and DevelopmentDivision.
Alderden, M. A., & Lavery, T. A. (2007). Pre-dicting homicide clearances in Chicago:Investigating disparities in predictors across different types of homicide. Homicide Studies, 11, 115-132.
Anderson, C. A. (2000). Violence and aggres-sion. In A. E. Kazdin (Ed.), Encyclopedia of psy-chology (Vol. 8, pp. 162-169). New York and Washington, DC: Oxford University Pressand the American Psychological Association.
Barrionuevo, A. (2009, October 20). Violence in the newest Olympic city rattles Brazil. New York Times, A6.
Bernstein, D., & Isackson, N. (2012, January). Gangs and politicians in Chicago: Anunholy alliance. Chicago Magazine. Retrieved November 7, 2012, from chicagomag.com/Chicago-Magazine/January-2012/Gangs-and-Politicians-An-Unholy-Alliance.
Bogira, S. (2012, July 26). Concentrated pov-erty and homicide in Chicago. The Reader. Retrieved November 7, 2012, from chicago reader.com/Bleader/archives/2012/07/26.
Chicago Justice Project. (2012a). Chicago homicides and police personnel. Retrieved November 7, 2012, from chicagojustice.org/blog/chicago-homicides-police-personnel.
Chicago Justice Project. (2012b). Police staff-ing in America’s five largest cities. Retrieved November 7, 2012, from chicagojustice.org/blog/police-staffing-in-america2019s-5-largest-cities.
Chicago Police Department (CPD). (2011). Chicago Police Department, 2010 annual report: A year in review. Chicago: CPD.
CPD. (2012). Chicago murder analysis. Chicago: CPD.
Cordner, G. (2012). Reducing fear of crime: Strat-egies for police. Washington, DC: Office of Community Oriented Policing Services.
Cullen, J. B., & Levitt, S. D. (1999). Crime, urban flight, and the consequences for cities. The Review of Economics and Statistics, 81, 159-169.
Federal Bureau of Investigation (FBI). (2010). Uniform crime reports: Crime in the United States 2010. Washington, DC: FBI.
Gorner, J. (2012a, August 14). Cease Fire begins partnership with city, after delay. Chicago Tribune, 7.
Gorner, J. (2012b, August 21). Killings tie 2012 single-day record. Chicago Tribune, 7.
Gorner, J., Mack, K., & Huppke, R. W. (2012, June 27). City enlists Cease Fire amid spike in slayings. Chicago Tribune, 1, 12.
Heinzmann, D. (2012, August 12). Unsolved shootings dog police. Chicago Tribune, 1, 9.
Heinzmann, D., & Gorner, J. (2012, June 16). Keeping lid on weekend violence. Chicago Tribune, 1, 2.

Law Enforcement Executive Forum • 2012 • 12(4) 81
Heinzmann, D., Gorner, J., & Coen, J. (2012, June 18). Battling a deadly tide: Homicide rate rises as city’s top cop backs strategy, others miss task force. Chicago Tribune, 1, 10.
Heritage Foundation. (2012). Marriage andfamily as deterrence from delinquency, violence, and crime. Retrieved November 7, 2012, from familyfacts.org/briefs/26.
Homicide Research Working Group. (2012).Homicide Research Working Group: An inter-disciplinary and international organization. Retrieved November 7, 2012, from homicide-workinggroup.cos.ucf.edu/brief.php.
Katz, M. (2012, June 27). The impact of vio-lence. Chicago Tribune, 25.
Kleck, G. (1997). Targeting guns: Firearms and their control. New York: Aldine De Gruyter.
Klick, J., & Tabarrok, A. (2005). Using terror alert levels to estimate the effect of police on crime. Journal of Law and Economics, 48, 267-280.
MacDonald, H. (2012, April 18). The value of a mom and a dad. New York Times, 6.
Main, F. (2012a, August 26). Chicago gangs don’t have to go far to buy guns. Chicago Sun-Times, 12.
Main, F. (2012b, July 3). McCarthy says he plans to hire 450 to 500 Chicago police offi-cers. Chicago Sun-Times, 8.
Miczek, K. A., de Almeida, R. M., Kravitz, E. A., Rissman, E. F., de Boar, S. F., & Raine, A. (2007). Neurobiology of escalated aggres-sion and violence. The Journal of Neuroscience, 27, 11803-11806.
Miller, E. (2012, June 18). Gun ownership up, crime down. Washington Times, 7.
Moser, W. (2012). Chicago gang territory vs. 2011 homicides. Chicago Magazine. Retrieved
November 7, 2012, from chicagomag.com/Chicago-Magazine/The-312/December-2011.
Richardson, D. A., & Kosa, R. (2001). An exam-ination of homicide clearance rates: Founda-tion for the development of a homicide clearance model. Washington, DC: Police Executive Research Forum.
Rosenfeld, R. (1995). Gun buy-backs: Crime control or community mobilization. In M. Plotkin (Ed.), Under fire: Gun buy-backs, exchanges, and amnesty programs (pp. 1-28). Washington, DC: Police Executive Research Forum.
Sampson, R., Raudenbush, S., & Earls, F. (1997). Neighborhoods and violent crime: A multilevel study of collective efficacy. Science, 277, 918-924.
Santos, R. B. (2013). Crime analysis with crime mapping. Thousand Oaks, CA: Sage.
Shippee, N. D. (2012). Victimization, fear of crime, and perceived risk: Testing a vulner-ability model of personal control. Sociological Perspectives, 55, 117-140.
Skogan W. G. (1990). Disorder and decline: Crime and the spiral of urban decay in American neighborhoods. New York: Free Press.
Skogan, W. G., Hartnett, S. M., Bump, N., & Dubois, J. (2009). Evaluation of Cease Fire Chicago. Washington, DC: U.S. Department of Justice.
Smith, M. (2012, July 6). Mourners say good-bye to Heaven Sutton. Chicago Tribune, 8.
United Nations Office on Drugs and Crime. (2011). 2011 global study on homicides. New York: United Nations Office on Drugs and Crime.
United Press International. (2011, January 2). Murder rate falls in Chicago. Retrieved November 7, 2012, from upi.com/Top_News/US/2011/01/02.

82 Law Enforcement Executive Forum • 2012 • 12(4)
Welford, C. F., Pepper, J. V., & Petrie, C. V. (Eds.). (2004). Firearms and violence. Washington, DC: National Academies Press.
Wheatley, J. (2008). The flexibility of RICO and its use on street gangs engaging in organized crime in the United States. Policing: A Journal of Policy and Practice, 2, 82-91.
Willis, J. J., Mastrofski, S. D., & Weisburd, D. (2003). COMPSTAT in practice: An in-depth analysis of three cities. Washington, DC: Police Foundation.
Zimring, F. (2012). The city that became safe. New York: Oxford University Press.
Author’s NoteThis article is based on an op-ed piece that I wrote for Crain’s Chicago Business. I thank Ann Dwyer for her comments on earlier drafts of the manuscript. Correspondence regarding the current article should be directed to the following address:
Dr. Arthur J. Lurigio College of Arts and Sciences Dean’s Office Loyola University Chicago Sullivan Center Room 235 1033 W. Sheridan Road Chicago, IL 60660

Law Enforcement Executive Forum • 2012 • 12(4) 83
Proceed with Caution: Police Use of GIS for Crime Hotspot AnalysisMoonSun Kim, Assistant Professor of Criminal JusticeMelchor C. de Guzman, Associate Professor of Criminal JusticeThe College at Brockport, State University of New York
IntroductionCrime hotspot analysis was introduced as a major concept for policing crime fighting by Sherman and Weisburd in 1995. Due to the approach’s solid logic and simplicity, commu-nity members, policymakers, and law enforce-ment have begun to embrace hotspot policing as a viable tool for crime reduction (Kochel, 2011). Adding a boost to its popularity are strings of research that have shown empiri-cal support for its crime reducing benefits (see Braga, 2005; Eck, Chaney, Cameron, Leitner, & Wilson, 2005; Sherman & Weisburd, 1995).
The introduction of GIS (Geographic Infor-mation Systems) has ushered in a new level of sophistication as well as simplicity in the identification of hot spots (Murray, McGuffog, Western, & Mullins, 2001). It has been shown in several studies that GIS has become the technology of choice among police depart-ments (Ratcliffe, 2004). Even abroad, many police departments have adopted GIS tools for crime analysis known as crime mapping (Weir & Bangs, 2007). The attraction of GIS is that not only has it reduced the tedious inter-pretation of crime data, but it also has dem-onstrated the visual impact of such hot spots. Thus, this convenience and visual appeal have made the GIS a favorite tool and, sometimes, it has become the benchmark that defines the efficiency, effectiveness, and prestige of police organizations (Ratcliffe, 2004).
Despite this promise of the GIS for efficient identification of hot spots and the consequent deployment decisions, the technology should be used with caution. Like any other tech-nology, crime hotspot analysis using GIS is
susceptible to the data inputs and the parame-ters used in the analysis, which could produce misleading results and, consequently, errone-ous decisions unless adequately handled by the researcher/analyst.
In this article, ways in which GIS users can better handle crime information to derive hot spots are demonstrated and critical con-siderations for identifying the best hotspot locations and coverage are presented. Raising issues in hotspot analysis, different simula-tions demonstrating why police departments should exercise due caution in using GIS are presented. This study has practical impor-tance for police departments that employ the technology. This research uses many exam-ples of crime hotspot analysis and could serve as a guide to police departments on how to appropriately use the technology to maximize its benefits as well as to avoid costly deci-sions due to the misidentification of crime hot spots. The misidentification of hot spots and the accompanying police action would have the potential not only to limit crime control but also to cause tension between the police and the public (Kochel, 2011). Any aggres-sive police action that is applied in the wrong spot may be interpreted as unnecessary and oppressive, and it may exacerbate growing tensions between the police and the citizens subjected to such aggressive police action. Thus, a noble intention could produce a bad result due to wrong information. The purpose of this study is to alert users of the technology to be more prudent in their use of the GIS as a guide for action.

84 Law Enforcement Executive Forum • 2012 • 12(4)
Hot Spots and GIS ApplicationsIt is well known that crime in a geographic area is not randomly distributed. Many theories in crime and criminal justice have observed that crime has been concentrated in a certain part of the area (e.g., see Cohen & Felson [1979] for routine activity theory, Clarke [1980] for situational crime prevention theory, Brantingham & Brantingham [1984] for crime pattern theory, Shaw & McKay [1942] for social disorganization theory, and Wilson & Kelling [1982] for broken windows theory). Findings in the research have implied that there are crime hot spots. Crime hot spots refer to specific locations or small areas where an unusual amount of criminal activity occurs (Eck et al., 2005). Crime hotspot analysis tries to capture this notion of crime concentration by utilizing GIS and spatial data analysis software. Most computer software can cal-culate the distribution of crime and generate hot spots when the concentration is observed beyond certain statistical parameters such as proximity between/among crime locations and density within an area. Therefore, the out-comes of crime hotspot analysis usually visu-alize the places where the concentrations are not random nor by chance.
The quality of crime hotspot analysis can be affected by the data source and recording practices (Ratcliffe, 2004). For instance, the poor data input such as inconsistent forms of address entry and the frequent use of aliases for the locations might lower geocoding/address matching rates, which, in turn, affects crime hotspot analysis negatively. An out-dated base map (e.g., street map) which does not include new geographic information, of course, could miss some crime events during geocoding, which, in turn, could mislead the crime hotspot analysis. These data challenges, however, can be easily overcome by the researcher/analyst if she or he cleans the data and pays more attention to the base maps. After overcoming the data challenges, or even with the perfect datasets, however, there are several considerations to keep in mind for performing the best crime hotspot analysis,
which otherwise could mislead the findings. The following sections will demonstrate four major considerations for properly utilizing crime hotspot analysis as a tool for effective and efficient crime control.
Methods and DataTo address the issues in crime hotspot analysis and to provide illustration maps, we used one-year crime data, including violent crimes and illegal drug crimes extracted from a city police department. All data were cleaned and geo-coded before our crime hotspot analyses. Two mapping and geospatial data analysis pro-grams were utilized: (1) ESRI’s ArcGIS Desktop for overall mapping purposes (Environmental Systems Research Institute [ESRI], 2011) and (2) CrimeStat III for advanced hotspot analy-ses (Levine, 2010). Both programs are very sophisticated and powerful tools for conduct-ing crime hotspot analyses and visualization of crime distribution. In this story, however, we try to minimize the use of complicated formulas and technical terminologies so that major issues are addressed with almost jar-gon-free common language and real examples of crime in a city.
Consideration 1: The Selection of Crime Hotspot Analysis Methods (Which Crime Hotspot Analysis Could Be the Best?)
The first question a researcher/analyst would ask in a crime hotspot analysis is whether the analysis needs to identify exact hot points or hot areas. For the representation of incident/crime points (e.g., addresses, business loca-tions, and intersections), a pin map approach has been used for a long time, and most practi-tioners and law enforcement officers might be already familiar with the pin map which visu-alizes the locations of incidents over the sur-face, say over the jurisdiction (see Figure 1A). However, this pin map cannot show how many incidents are in a certain location because mul-tiple incidents on the address are overlapped and shown as one point in the map, which means the readers can see only one point

Law Enforcement Executive Forum • 2012 • 12(4) 85
regardless of the number of crimes at that spe-cific address.
In order to overcome the limitation of a regu-lar pin map, researchers/analysts can adopt a point map with graduated symbols (see Figure 1B). This method not only presents visuals for the exact locations of criminal activ-ities but also provides representations for the volumes/the numbers of a specific criminal activity at the location. Since this approach captures the repeated incidents in a location, it is also called a “repeated location” analysis. For instance, practitioners could detect exact hot locations such as drug houses, bars, corner stores, ATMs, or robbery locations where a criminal activity is detected more than certain numbers of times. Depending on the purpose of crime analysis and practical resources in the police department, for instance, the researcher/
analyst/decisionmakers can detect any crime hotspot locations (e.g., five most active drug selling addresses; 20 moderate to very frequent robbery locations) for intervention.
What if someone needs to know the most dan-gerous areas in a city? Which areas of the city need more police attention/patrol to reduce a certain criminal activity such as an aggravated assault, drug transactions, and gang-related issues? For answering these questions, the researchers/analysts would rather identify the areas of interest (e.g., police zone, census block group, neighborhoods, among others) than the exact points or addresses. There are different analytical maps which can visual-ize the areas of crime concentrations. One of the most widely used area maps in prac-tice is a choropleth map (see Figure 1C) which visualizes areas with different colors using
Figure 1A. Pin Map Showing the Exact Location of Crime
9
Figure 1A. Pin map showing the exact location of crime

86 Law Enforcement Executive Forum • 2012 • 12(4)
the statistics of criminal incidents within areas (e.g., number of incidents, means, or standard deviations). On the map, in general, the darker the colors, the more criminal incidents or more features of interest (e.g., more violent crimes, more drug activities, more poverty) there are. Since the statistics in this choropleth map are calculated and aggregated within the estab-lished boundaries, the map can easily com-pare the relative intensity of criminal activi-ties with other areas (e.g., police zones, census tracts, ZIP, and neighborhoods). Researchers/analysts can use different numbers of classi-fications with various classification methods using natural break, equal interval, quantile, or standard deviation. The use of a choropleth map is powerful in identifying and compar-ing crime hotspot areas within a jurisdiction. Using the established boundaries as analytical
units can provide an intuitive visualization of the distribution of criminal activities with the well-known boundaries. However, the chal-lenge is that the occurrences of criminal activi-ties are not always congruent with an artifi-cially defined geographic boundary. Rather, a similar criminal activity is actively committed across the geographic boundary. For instance, a drug hotspot area can be defined over two census tracts. Crime concentration is also pos-sible only in a partial area of the units such as a police zone, ZIP, or census tract. With the cho-ropleth map, however, it is not easy to show any variations of criminal intensity within an established boundary since the whole cover-age area within the boundary has the same value.
Figure 1B. Point Map with Graduate Symbols Showing Exact Locations and Numbers of Crime
10
Figure 1B. Point map with a graduate symbol showing exact locations and numbers of crime

Law Enforcement Executive Forum • 2012 • 12(4) 87
To minimize the issues of a choropleth map due to the use of the existing/established boundaries, other approaches can be utilized in the crime hotspot analysis. One method is to create an ellipsis map (see Figure 1D) which identifies crime hotspot areas, but, unlike the choropleth map, it defines hotspot areas that are not limited to established boundar-ies. Among many approaches to creating the ellipsis maps are the NNH (Nearest Neigh-bor Hierarchical Special Clustering Method) and the STAC (Spatial Temporal Analysis of Crime) Model. Using these approaches, the researcher/analyst can easily adjust the size, numbers, or even locations of hot spots by using different parameters.
A kernel density map (see Figure 1E) is another useful method for detecting crime hotspot areas. Unlike previous methods, however, the
kernel density map can detect and visualize crime on a continuous surface which repre-sents the distribution of criminal activities more realistically. Further, the kernel density map also provides the centers of crime hotspot areas and their surrounding areas. Since the map generates hot spots over the surface without being restricted by any boundaries, these crime hotspot areas are not congruent with any established boundaries.
To sum, the method the researcher/analyst needs to use is based on the purpose of the analysis. For instance, if someone needs the exact hot spots, a pin map with graduated symbols could be the best choice. If a police chief wants to deploy more police officers into the police beats with higher crime rates, a choropleth map showing different crime rates by police beat could be a useful method. If a
Figure 1C. Choropleth Map Visualizing Intensity of Crime by Geographical Boundary
11
Figure 1C. Choropleth map visualizing intensity of crime by geographical boundary
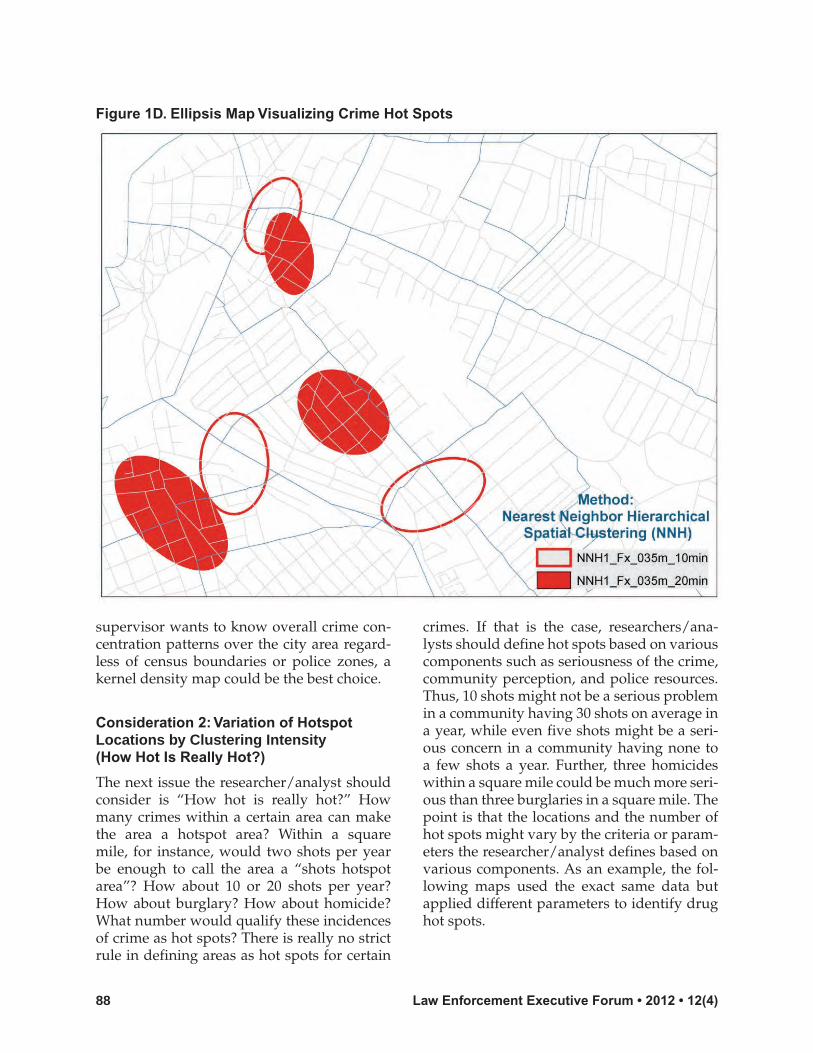
88 Law Enforcement Executive Forum • 2012 • 12(4)
supervisor wants to know overall crime con-centration patterns over the city area regard-less of census boundaries or police zones, a kernel density map could be the best choice.
Consideration 2: Variation of Hotspot Locations by Clustering Intensity (How Hot Is Really Hot?)
The next issue the researcher/analyst should consider is “How hot is really hot?” How many crimes within a certain area can make the area a hotspot area? Within a square mile, for instance, would two shots per year be enough to call the area a “shots hotspot area”? How about 10 or 20 shots per year? How about burglary? How about homicide? What number would qualify these incidences of crime as hot spots? There is really no strict rule in defining areas as hot spots for certain
crimes. If that is the case, researchers/ana-lysts should define hot spots based on various components such as seriousness of the crime, community perception, and police resources. Thus, 10 shots might not be a serious problem in a community having 30 shots on average in a year, while even five shots might be a seri-ous concern in a community having none to a few shots a year. Further, three homicides within a square mile could be much more seri-ous than three burglaries in a square mile. The point is that the locations and the number of hot spots might vary by the criteria or param-eters the researcher/analyst defines based on various components. As an example, the fol-lowing maps used the exact same data but applied different parameters to identify drug hot spots.
Figure 1D. Ellipsis Map Visualizing Crime Hot Spots
12
Figure 1D. Ellipsis map visualizing crime hotspots

Law Enforcement Executive Forum • 2012 • 12(4) 89
By utilizing the NNH, Figure 2A uses conser-vative parameters which require a very high density to identify hot spots, while Figure 2B uses less restricted criteria that require a relatively lower density than Figure 2A. As shown on the maps, the first map identifies only three really hot areas as hot spots while the second map identifies seven areas asdrug hot spots. Figure 2C shows a compari-son between two maps in which we realize the different numbers of hot spots and differ-ent locations of drug hot spots. That is, if the analyst applies stricter criteria to identify the hot spots, there would be a smaller number of crime hot spots, though they could be hotter. So how hot is really hot? The decision needs a judgment call based on some inputs from the police, the community, and the researcher/analyst.
Consideration 3: Variation of Hotspot Locations by Coverage Size (How Big the Hot Spots Could Be?)
Another question the researcher/analyst might consider is how big the hot spots should be. For instance, does the size of a drug hot spot encompass two to three street blocks or 20 to 30 street blocks? Is it reasonable to define about five street blocks as a violent crime hotspot area or only one street block or 20 street blocks or more than 100 street blocks?
The researcher/analyst can define the differ-ent sizes of crime hotspot areas which have different coverage areas by applying different analytical parameters in crime hotspot analy-sis. The following examples show the varia-tion of hotspot locations and coverage sizes based on different parameters. Using the
Figure 1E. Kernel Density Analysis Map Visualizing Crime Distributions
13
Figure 1E. Kernel density analysis map visualizing crime distributions

90 Law Enforcement Executive Forum • 2012 • 12(4)
Figure 2. Drug Hotspot Maps with Different Intensities
2A
2B
2C
14
Figure 2. Drug Hotspot Maps with Different Intensities
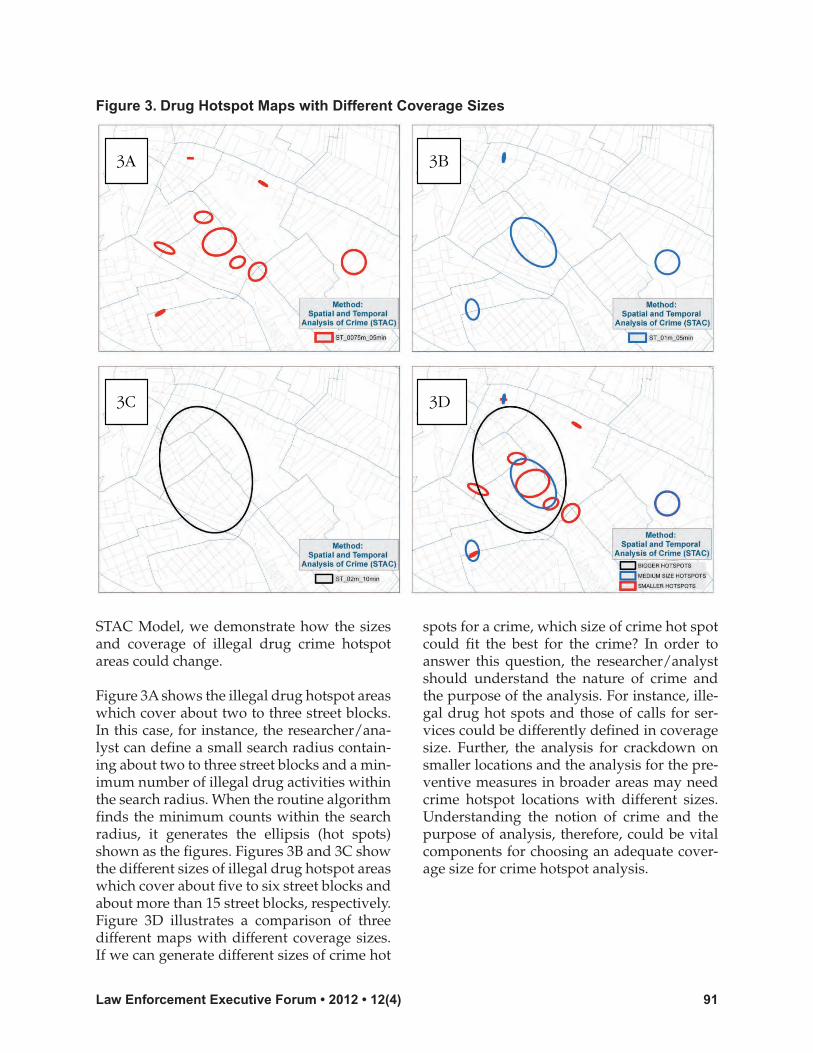
Law Enforcement Executive Forum • 2012 • 12(4) 91
STAC Model, we demonstrate how the sizes and coverage of illegal drug crime hotspot areas could change.
Figure 3A shows the illegal drug hotspot areas which cover about two to three street blocks. In this case, for instance, the researcher/ana-lyst can define a small search radius contain-ing about two to three street blocks and a min-imum number of illegal drug activities within the search radius. When the routine algorithm finds the minimum counts within the search radius, it generates the ellipsis (hot spots) shown as the figures. Figures 3B and 3C show the different sizes of illegal drug hotspot areas which cover about five to six street blocks and about more than 15 street blocks, respectively. Figure 3D illustrates a comparison of three different maps with different coverage sizes. If we can generate different sizes of crime hot
spots for a crime, which size of crime hot spot could fit the best for the crime? In order to answer this question, the researcher/analyst should understand the nature of crime and the purpose of the analysis. For instance, ille-gal drug hot spots and those of calls for ser-vices could be differently defined in coverage size. Further, the analysis for crackdown on smaller locations and the analysis for the pre-ventive measures in broader areas may need crime hotspot locations with different sizes. Understanding the notion of crime and the purpose of analysis, therefore, could be vital components for choosing an adequate cover-age size for crime hotspot analysis.
Figure 3. Drug Hotspot Maps with Different Coverage Sizes
3A
3C
3B
3D
15
Figure 3. Drug Hotspot Maps with Different Coverage Sizes

92 Law Enforcement Executive Forum • 2012 • 12(4)
Consideration 4: Dynamic Feature of Crime Hot Spots (Does the Time of Day Matter?)
Crime hot spots are not static. That is, the locations and intensity of crime hot spots are changing by time of day, by day of week, by month, and by season. For instance, a park area is safe in daytime, but the place might be dangerous at night. A business district is occupied with lots of people in daytime, but it turns into a ghost town at night. Summer months usually experience more violent crime than winter months. The point is, when the researchers/analysts conduct any hotspot analysis, it is a good idea to reflect on these dynamics. The following maps illustrate the examples of how the hotspot locations and intensities of violent crimes change by differ-ent police shift.
Figures 4A, 4B, and 4C show the distribu-tions of violent crime density for the midnight shift (midnight to 8:00 am), day shift (8:00 am to 4:00 pm), and evening shift (4:00 pm to mid-night), respectively. The first factor we can observe is that the locations of violent crime hot spots are not the same for a whole day. The second factor we can see is that certain areas get hotter while the other areas get cooler as time changes. In these maps, for instance, violent crimes in the city are highly concen-trated in two areas, with their maximum den-sity between 4:00 pm to midnight. In contrast, however, the patterns of violent crime in day-time are different. Many violent crimes are committed in several scattered hotspot areas throughout the city, and two of the hottest spots at nighttime are not the hottest areas in daytime. To provide a better illustration,
Figure 4. Violent Crime Hot Spots by Time of Day
4A
4C
4B
4D
16
Figure 4. Violent Crime Hotspots by Time of the Day
Law Enforcement Executive Forum • 2012 • 12(4) 93
we generated Figure 4D using the NNH. As shown on the map, some areas are always vio-lent crime areas, while the other areas are only hot during certain times of the day. Therefore, with the understanding of the dynamics of crime hot spots by time, the researcher/ana-lyst can minimize the errors of rough analy-ses, and the practitioners can better deploy their limited resources into the right places at the right times.
ConclusionCrime hotspot analysis is a great tool to under-stand/visualize problem locations in terms of“where,” “what,” “how,” and “when.” Con-ducting valid and reliable crime hotspot analy-ses requires that researchers/analysts consider the following issues: selection of an adequatehotspot analysis model, considerations ofhotspot intensity, coverage size of hotspotareas, and dynamic feature of hot spots.
Researchers/analysts play an important role.Outputs of hotspot analyses are sensitive tothe methods and parameters researchers/ana-lysts set up in the model. Researchers/ana-lysts, therefore, should have a concrete under-standing of different analytical approaches.Further, the understanding of the nature ofvarious crimes and criminological theories isa valuable source for decisionmaking. Knowl-edge of the research site(s), police department, and community is another big advantage forconducting valid and reliable crime hotspotanalysis. These are all challenges of whichresearchers/analysts should be aware.
The last but most important consideration isthat the crime hotspot analysis and its out-come will affect community relations as wellas the effectiveness of crime control. Kochel(2011) has cautioned users of GIS about thesocial implications of making decisions about police aggressiveness without consideringthe context in which those areas respond topolice strategies. The identification of hotspots through an automated tool such as theGIS does not fully consider the socio-political realities of those areas. The context of policing
is not something that a technological advance can easily address. Thus, human intelligence and human assessment of situations are still paramount considerations in addressing hot spots.
ReferencesBraga, A. (2005). Hot spots policing and crime
prevention: A systematic review of random-ized control trials. Journal of Experimental Criminology, 1, 317-342.
Brantingham, P. J., & Brantingham, P. L. (1984). Patterns in crime. New York: Macmillan.
Clarke, R. V. G. (1980). “Situational” crime prevention: Theory and practice. British Jour-nal of Criminology, 20(2), 136-147.
Cohen, L., & Felson, M. (1979). Social change and crime rate trends: A routine activity approach. American Sociological Review, 44, 588-605.
Eck, J., Chaney, S., Cameron, J., Leitner, M., & Wilson, R. (2005). Mapping crime: Understand-ing hot spots. Washington, DC: National Insti-tute of Justice.
Environmental Systems Research Institute (ESRI). (2011). ArcGIS desktop: Release 10. Redlands, CA: ESRI.
Kochel, T. R. (2011). Constructing hot spots policing: Unexamined consequences for dis-advantaged populations and for police legit-imacy. Criminal Justice Policy Review, 22(3), 350-374.
Levine, N. (2010). CrimeStat: A spatial statistics program for the analysis of crime incident loca-tions (v. 3.3). Houston, TX, and Washington, DC: Ned Levine & Associates and the National Institute of Justice.
Murray, A. T., McGuffog, I., Western, J. S., & Mullins, P. (2001). Exploratory spatial data analysis techniques for examining urban

94 Law Enforcement Executive Forum • 2012 • 12(4)
crime. British Journal of Criminology, 41, 309-329.
Ratcliffe, J. H. (2004). The hotspot matrix: A framework for the spatio-temporal targeting of crime reduction. Police Practice & Research, 5(1), 5-23.
Shaw, C. R., & McKay, H. D. (1942). Juvenile delinquency in urban areas. Chicago: Univer-sity of Chicago Press.
Sherman, L., & Weisburd, D. (1995). General deterrent effects of police patrol in crime “hot spots”: A randomized control trial. Jus-tice Quarterly, 12, 625-648.
Weir, R., & Bangs, M. (2007). The use of Geographic Information Systems by crime ana-lysts in England and Wales. London: Home Office.
Wilson, J. Q., & Kelling, G. L. (1982, March). The police and neighborhood safety: Broken windows. Atlantic Monthly, 29-38.
MoonSun Kim is an assistant profes-sor of Criminal Justice at The College at Brockport, State University of New York. He earned his PhD from the School of Criminal Justice, University at Albany, SUNY. He has been involved in vari-ous research projects for local and state law enforcement agencies by utilizing advanced statistics and geospatial data analyses. His current research interests center on police intervention research, community policing, and terrorism. Dr. Kim may be contacted through e-mail at [email protected] or by phone at (585) 395-2915.
Dr. Melchor C. de Guzman is an asso-ciate professor of Criminal Justice at the College of Brockport at the State Univer-sity of New York. He earned his doctor-ate degree in Criminal Justice from the University of Cincinnati. His research includes the examination of citizen
participation in the control of the police. He also investigates organizational and environmental factors that influence police behavior. His most recent research includes the utilization of websites by police departments in the delivery of police services and the role of the police in homeland security. Dr. de Guzman may be contacted through e-mail at [email protected] or by phone at (585) 395-5785.
Law Enforcement Executive Forum • 2012 • 12(4) 95
Toward Taser™ Regulation: A Content Analysis of Print Media on Taser™-Related DeathsLee M. Wade, PhD, Middle Tennessee State UniversityKelly Ann Cheeseman, PhD, Messiah College
IntroductionThe adoption of new technologies in lawenforcement toward less-than-lethal weapons has been the focus of government and pri-vate businesses. As with any new technology imported into police work, the Taser™ has rad-ically changed police operations over the last decade. Research into less-than-lethal technol-ogies has indicated a tendency for problems to emerge in law enforcement as new weapons are widely released (Adams & Jennison, 2007; Alpert & Dunham, 2005; Smith, Kaminski, Rojek, Alpert, & Mathis, 2007).
From widespread dispersal problems in law enforcement, the Taser™ has been the subject of considerable debate, civil litigation, and public misunderstanding (Smith et al., 2007). Regardless, law enforcement agencies con-tinue to utilize this less-than-lethal weapon in their arsenal of tools to control individuals subject to use-of-force measures. The Taser™ has seemingly found a permanent, yet uncer-tain place in the standard use-of-force model for law enforcement.
As a popular tool in police coercion, theTaser™ is subject to individual department policy guidelines and is not strictly regulated. The increase in usage has had unintended consequences in situations wherein medical examiners have attributed unexpected deaths to the Taser™. As such, some groups like Amnesty International have called for a mor-atorium on its usage, while others (American Civil Liberties Union [ACLU], International Association of Chiefs of Police [IACP], and the Police Executive Research Forum [PERF]) have pushed for regulation or standardization of policies across law enforcement. Furthermore,
the public confidence in law enforcement for utilizing this measure has waned, and politi-cians have responded by trying to enact legis-lation to mend the controversy.
We theorize that a connection between poli-cymakers and powerbrokers via printed news media would lead toward the regulation of the Taser™ in law enforcement. The media has tremendous influence on public percep-tion and understanding of law enforcement procedures and most recently in the employ-ment of Tasers™ in use-of-force situations (Ready et al., 2008). However, it is important to understand how social change via pow-erbrokers can impact the public through the content of the media (Barranco & Wisler, 1999; Earl, Martin, McCarthy, & Soule, 2004; Johnson & Cintron, 1996). To make the con-nection, this paper will build from the back-ground on how the Taser™ was implemented into law enforcement practices and the theo-retical background of news media as a tool to create social change.
Background on Taser™ and CEDsConducted energy devices (CEDs), first devel-oped by NASA scientist Jack Cover, were first used by law enforcement in the late 1970s. The most well-known and used brand of CED is the Taser™. Taser International claims vari-ous models of Taser™ have been sold to over 11,000 law enforcement agencies, and the use reduces the chance of injury to officers while helping avoid deadly force situations (Taser International, 2010; Vilke & Chan, 2007).
The Advanced Taser M26™ emerged in 1999 and was marketed as the first device to use neuromuscular incapacitation technology. In

96 Law Enforcement Executive Forum • 2012 • 12(4)
2001, Taser International began trading pub-licly on the NASDAQ. The Taser X26™ was released in 2003 and became the most widely used CED in law enforcement. The Taser X26™ is a more compact version of the Advanced Taser M26™, which resembles a firearm with less-than-lethal yellow markings. The Taser X26™ uses a cartridge at the end of the device, which contains compressed nitrogen to deploy two probes with insulated conductive wires at a maximum length of 35 feet. Electrical pulses are transmitted through the wires and into the body, disrupting motor functions of the ner-vous system. Energy from the device is able to penetrate up to two inches of clothing. When employed, the device can create an open circuit of voltage between the Taser™ and the subject connected with wires. Taser International spec-ifies that the peak voltage of energy transferred is 50,000 volts, but a peak load of 1,200 volts is delivered into the body. The total energy output is 7 watts or .36 joules per pulse (Taser International, 2010).
Although police are asked to perform duties that are deemed by most hazardous, they are only permitted a small margin of error in wielding this power against citizens. Police officers have the authority to escalate use of force by coercive measures ranging from offi-cer presence to verbal orders to deadly force. To judge if use-of-force measures are justified, the incident must be evaluated on its reason-ableness and necessity in effecting an arrest or other police procedure (Alpert & Smith, 1994; Garner, Maxwell, & Heraux, 2002). Law enforcement policy dictates the reasonable-ness of how police use-of-force measures are employed against citizens. There are varying policies throughout agencies in the United States, but most conform to the following example:
Police officers shall use only that force that is reasonably necessary to effec-tively bring an incident under control, while protecting the lives of the officer or another. Police officers are authorized to use department-approved, non-deadly
force techniques and issued equipment for resolution of incidents, as follows:a. To protect themselves or another from
physical harm; orb. To restrain or subdue a resistant indi-
vidual; or to bring an un-lawful situa-tion safely and effectively under con-trol. (Alpert & Smith, 1994, p. 487)
Researchers have attempted to aggregate data on use-of-force incidents and judge this pro-cess in the criminal justice context. Alpert and Dunham (2005) note that the irony of police scholarship is that scholars who conduct numerous studies on police coercive force have not developed a strong understanding of the elements of this concept. However, recent scholarly research sheds a light on what was once a closed and limited area of law enforce-ment. The body of literature emphasizes and outlines the pertinent issues regarding police use of force toward potential problems and recommendations for policymakers.
The popularity of CEDs (primarily the Taser™) has been widespread among law enforcement agencies over the last decade. Consequently, these agencies have had to update their policies on the use of Tasers™. In predicting policy issues with the popular-ity of Tasers™ in police departments, Adams and Jennison (2007) assert that police will use a Taser™ as a weapon of choice because it can be deployed at a distance, which results in fewer “hands-on” situations and lower risks of injury to the officer. However, the ease of use of a Taser™ is related to an increased fre-quency of use by officers. The authors theorize that new technology involves the “s-curve” of process. This process involves low rates of use as officers become comfortable with the use of a Taser™, then rapid increase in use, which will plateau after unintended problems arise. Adams and Jennison contend that Taser™ use will quickly rise to be the most utilized less-than-lethal device by law enforcement, and they caution that an increased frequency of improper usage (without proper policy and training) will erode law enforcement/com-munity confidence.

Law Enforcement Executive Forum • 2012 • 12(4) 97
Tasers™ were evaluated concerning their efficiency to determine if their use decreased officer or suspect injury (Smith et al., 2007). The researchers used data from use-of-force incidents from two different law enforcement agencies over the span of four years. Using binary logistic regression, the research evalu-ated odds/ratios concerning officer injuries and suspect injuries with various less-than-lethal weapons or use of force. The findings indicated that when soft hand tactics were used, this level of force increased the chance of injury to the officer by 160%. With one police department in the study, Tasers™ nei-ther increased nor decreased the chance of injury to the officer. However, in the larger police department evaluated, Tasers™ were associated with a 68% decrease in the odds of police officers having an injury. There is an indication for the need for further research into the correlates of injury outcomes related to Tasers™. However, Smith et al. imply that new technologies in use of force (e.g., Taser™) and older ones (e.g., OC spray) show effec-tiveness in reducing future incidents of injury to the officer.
Vilke and Chan (2007) conducted a review of cases and literature concerning Tasers™ and medical health risks. The primary con-cern with CEDs was with the assertion that a Taser™ shock would cause some form of cardiac dysrhythmia—more specifically ven-tricular fibrillation. The literature indicates the threshold for ventricular fibrillation in humans is a shock of approximately 50 mil-liamps for more than two seconds. Accord-ing to Taser International, the average shock from a Taser X26™ is 2.1 milliamps over a 0.00004 second pulse (Taser International, 2010; Vilke & Chan, 2008). The review indi-cated an unclear connection between the Taser™ and sudden deaths, but it suggested further research on those who had underly-ing health issues, which increased the risk for sudden deaths.
Patterns and trends in case law have helped define policy toward Taser™ usage (Smith et al., 2007). In their study, Smith et al.
analyzed 53 court decisions regarding the civil liability issues associated with Tasers™. Just as the frequency of use in new less-than-lethal technologies increases, so to do the civil claims against officers, law enforcement agen-cies, and municipal/county governments. In the analysis, most of the civil cases resulted in summary judgment either due to lack of evi-dence of unconstitutional actions or uncon-stitutional policies concerning Taser™ usage. Further, courts granted summary judgment if individuals showed evidence of resisting arrest during the incident. In a few cases, judges ruled that policies were unconstitu-tional or there were factual issues concerning reasonableness of force used with the Taser™. The implication is that agencies and officers should have continual training updates on both Taser™ legal issues and how to discern and articulate threats from physically and verbally resistant subjects before employment of the device.
Judicial action can influence some sections of regulation but not in its entirety. Admin-istrative law and agency policy can affect law enforcement procedures, but indepen-dent regulation and collection of data can mediate controversy, especially as related to deaths in custody (Pelfrey & Covington, 2007; Thompson & Lee, 2004; White, 2003).
Theoretical BackgroundThe theoretical framework for this paper is guided by the influence of those in power who construct and control deviance (in this case, the unregulated misuse of a Taser™) via print media (Johnson & Cintron, 1996; Pfuhl & Henry, 1993). Those in power include the owners of media, government officials, scien-tists and researchers, and nongovernmental organizations. Those who wish to enact social change can influence the media and influence the process of regulation or social movement (Earl et al., 2004; Johnson & Cintron, 1996). These powerbrokers, together, can create social change toward a certain goal in com-peting political climates (Ferrell, 1997). By assigning meaning toward the media content

98 Law Enforcement Executive Forum • 2012 • 12(4)
of Taser™ in law enforcement, powerbrokersboth for and against Taser™ regulation, canshape public understanding and governmentpolicy (Johnson & Cintron, 1996; Ready et al.,2008).
The news media is a source for both the mani-fest and latent content that will be interpretedby the public. There has been substantialresearch into news media and public inter-pretation of events (Berg, 2009). The elementsof content can portray the substance of socialcommunication. Latent content can containsymbolism with some interpretation of mean-ing, and the reader can make inferences basedon the deep meaning associated with theirsubjective interpretation. Further, latent con-tent can contain biases within symbols, lan-guage, and interpretation of facts. Manifestcontent contains what Berg (2009) describesas the “surface structure” (p. 343), which isstated in words. In content analysis, a suc-cessful strategy combines the analysis of bothlatent and manifest content to report frequen-cies or descriptives, which can give a holisticexamination and direction of the data over along period of time (Babbie, 2007; Berg, 2009).
Newspaper Data and Social Movement
Bias in newspaper content is a permanent ele-ment, and it may seem that validity through content analysis and interpretation may be difficult to attain. However, newspaper arti-cles can be the gateway to engaging in social movement, and the information presented is held by those who control the machina-tions of the newspaper (Barranco & Wisler, 1999). Those in control of media companies have contributed toward bias in covering major events and social change by maintain-ing either a political bias or agenda. Rupert Murdoch, chairman and CEO of News Cor-poration, which owns the Wall Street Journal, Washington Post, and the Fox Broadcasting Company, has indicated that contemporary media sources have bias and agendas (Kalb, 2010). Although their research focused on newspaper coverage of public protests, Oliver and Myers (1999) indicated that political bias
and more liberal focused newspapers willcover social conflicts. Further, they contendthat three factors affect whether news media will cover a topic: (1) the political predispo-sition of the newspaper owners or reporters, (2) standard journalistic procedures on cover-ing a controversial topic, and (3) the overall value of the news to be reported in an article.
To analyze content in print media, strate-gies have emerged to empirically control for bias, especially in conflict or social change.Snyder and Kelly (1977) contend that events or social issues where conflict exists contain two sections of bias: (1) the bias of what spe-cific events are actually covered and (2) the bias of the content of the event covered. The authors suggest operationalization and clearly defining media content with intensity scores over conflict reporting from the news media to establish validity. To limit reporting biasand methodological issues surrounding thisfactor, Earl et al. (2004) suggest triangulation as an effective strategy, which is to followSnyder and Kelly (1977) and Oliver and Myers (1999) in the collation of several newspaper sources, but also to vary one’s search database to corroborate the reporting of the event. An example from this research is the nationwide reporting of the Sean Bell shooting incident (November 25, 2006) and its subsequent effect on Taser™ policy by the New York PoliceDepartment (NYPD) police commissionerRaymond Kelly. A search of newspaper articles on reporting the same incident can be used to detect bias and record the variation of both the manifest and latent content (Earl et al., 2004). A final strategy indicated by all three articles (Earl et al., 2004; Oliver & Myers, 1999; Snyder & Kelly, 1977) uses police department incident reports for confirmation of critical incidents.
Ready et al. (2008) conducted both a qualitative and quantitative analysis of Taser™ incidents reported by both NYPD police reports and news media. The authors also note conflicting per-spectives on the use of Taser™, its employment by law enforcement, and the circumstances of the incident by news media. From their analy-sis, the authors compared news articles from

Law Enforcement Executive Forum • 2012 • 12(4) 99
LexisNexis and the New York Times with actual NYPD incident reports where a Taser™ was used. Ready et al. (2008) indicate “substantial differences exist among national news reports, regional reports, and police records in regard to the percentage of suspects described as emo-tionally disturbed/mentally ill” (p. 159). The authors further indicated a “substantial differ-ence” concerning Taser™ use and deaths. The impact of the news media on the public per-ception of law enforcement and Taser™ use can be both critical and be controlled by police, especially when highly publicized (Jenks & Costelloe, 2007; Ready et al., 2008).
MethodologyThis qualitative study uses content analysis of both manifest and latent content of news arti-cles. More specifically, the print media con-cerning the controversy of unintended deaths as a result of Taser™ use by law enforcement. This research focuses qualitatively on the fol-lowing questions:
•
•
•
R1 – “What variances exist between latent and manifest content in news articles con-cerning Taser™ use and death?”R2 – “Are there differences in the biases of different newspapers?”R3 – “Who are the powerbrokers involved in Taser™ regulation, and what content is communicated to the public?”
Utilizing various databases (ProQuest, News-Bank, and LexisNexis), a search of news arti-cles from the top four circulated newspapers was conducted concerning law enforcement Taser™ use and related deaths. According to the Audit Bureau of Circulations (2010), the top four circulated newspapers are the Wall Street Journal, USA Today, New York Times, and Los Angeles Times. Ready et al. (2008) uti-lized the keyword “Taser™“ in their search of the New York Times of which 34.8% of the arti-cles had content concerning Taser™-related deaths. This research departs from Ready et al. and focuses on Taser™-related deaths in law enforcement incidents reported by the news media. The key words used in the search
were “law enforcement/police,” “Taser™,” and “death from 2005 to 2010.” According to the news media content, 2005 is the year that Taser International stock plummeted approxi-mately 80% in combination with a rise in news reports of Taser™-related deaths. To capture this rise in media reporting, public scrutiny, and political conflict, the research window was limited from 2005 to 2010, which also supplements the time period of the Ready et al. study (2002-2005).
After unrelated articles were eliminated, a final sample of articles (n = 49) were examined for latent and manifest content. For latent con-tent from each news source, a rating was given to each article on the researcher’s interpreta-tion of the overall disposition of the article. Similar to the “banning” content from Johnson and Cintron (1996), the article was rated con-cerning “pro-Taser™” content, neutral (regu-lation), or anti-Taser™ content in an ordinal ranking from 1 to 5. For example, an article with an overall tone toward keeping Taser™ policies without regulation was rated with a “5,” an article that supported Taser™ use but under strict regulation was rated “3,” and an anti-Taser™ article was rated with a “1.”
The manifest content was identified by the powerbrokers into four groups, along with their respective number of words quoted in each article from the sample. The frequency of each group represented in the article was tabulated (see Table 5): nongovernment orga-nizations (e.g., Amnesty International), gov-ernment officials (e.g., a police spokesman), sci-entists (e.g., medical examiners, researchers), and a spokesperson from Taser International.
FindingsTable 1 is a summary of the latent content from the sample of New York Times articles (n = 26). The mean score of latent content was 2.56. The main powerbrokers featured in the articles were NYPD police commissioner Raymond Kelly, Amnesty International, and Taser International. Some of the articles fea-tured Associated Press reports on research

100 Law Enforcement Executive Forum • 2012 • 12(4)
findings between Tasers™ and health risks. Articles concerning major incidents thatoccurred in New York City were the changes in policy for increased use of Taser™ after the Sean Bell shooting incident and the suicide by one law enforcement officer implicated in an improper use of the Taser™ that resulted in one accidental death. Articles from the New York Times accounted for almost half of
the total articles in the study and receive the second lowest mean score for latent content.
Table 2 summarizes the sample of articles from USA Today (n = 8). Articles from this source represented the highest mean score for content (3.56)—most favorable to Taser™ but also for regulation of the device.
Table 1. Latent Content – New York Times
Source Date Title of Article Rating
New York Times 5/13/20055/14/20055/29/20057/28/20057/29/20058/27/20059/2/2005
9/28/200510/19/200512/14/20051/10/20065/25/20061/9/2007
11/16/200711/23/200711/27/200712/13/2007
6/11/20086/15/20086/24/20089/25/20089/26/20082/26/20094/28/200912/9/20091/5/2010
Taser Official Taken Off Study of Stun GunsStudy Says Tasers Don’t Cause Heart Rhythm DisturbancesZap with Stun Gun Ends Crane StandoffMan Dies After Being Shocked with Taser in CellTaser Gun Death Is Part of National PatternCoroner Rules Cocaine, Not Taser, Killed PrisonerDoctors Blame Taser Stun Gun for FibrillationInquiry into Taser Upgraded, Giving S.E.C. Subpoena PowerPolice Group Urges Limit on Taser UseS.E.C. Decides Not to Act Against Taser on Safety StatementsInjury Lawsuit Against Taser Is DismissedThe Safety of Tasers Is Questioned AgainBrooklyn Man, 38, Dies After Jolt from Police TaserAfter a Death, Use of Taser in Canada Is DebatedCanada: Man Dies After Shock from TaserHamden: Lawsuit Over Death in CustodyCanada: Mounties Urged to Restrict Taser UseTasered Man DiesTasers Getting More Prominent Role in Crime Fighting in CityThe Police and TasersNaked Man Dies in Brooklyn After Police Use a Taser GunUse of Taser Broke Rules, Police SuggestCity Is Sued in Fatal Use of a TaserFormer Net Williams Tasered by the PoliceCanada: A Taser Death Is Re-examinedTasers and Liability
3 & 34 & 45 & 42 & 21 & 14 & 41 & 12 & 23 & 34 & 45 & 42 & 24 & 31 & 11 & 22 & 13 & 32 & 24 & 43 & 32 & 21 & 12 & 23 & 33 & 22 & 3
Mean = 2.56
Table 2. Latent Content – USA Today
Source Date Title of Article Rating
USA Today 5/13/2005 Adviser is removed from Stun-Gun Study 3 & 36/3/2005 Schools Restrict Use of Tasers—Districts Asking When Stun Guns Are 2 & 2
Appropriate2/20/2006 Doctors: Tasers Can Be Safe—Within Limits; ER Coalition Urges Oversight 5 & 46/14/2006 Justice Dept. Looks into Deaths of People Subdued by Stun Guns 3 & 21/8/2007 Taser Sells Small Version for Wider Use—Some Police Raise Safety Question 4 & 4
5/18/2007 Stungun Program in Miami Cuts Risk 5 & 55/16/2008 Officials Seek Safeguards for Stun Guns 5 & 4
10/21/2009 Taser Advises Police Not to Aim at Chest, Acknowledge Heart Risk 3 & 3Mean = 3.56

Law Enforcement Executive Forum • 2012 • 12(4) 101
Table 3 summarizes the smallest sample (n = 5) of articles of content from the Wall Street Journal. The researcher expected a pro-Taser™–nonregulation bias due to the conservative reputation of the paper, but the mean score of latent content was 2.70; how-ever, the bias of reporting could be evident in the lack of articles published concerning this controversial issue.
Table 4 summarizes the latent content of articles from the Los Angeles Times (n = 10). Similar to the New York Times, the latent con-tent receives a lower mean score (2.55), and the majority of articles focused on national Taser™ incidents or local incidents involv-ing deaths attributed to Taser™ use from law enforcement.
Table 5 is the summary table of manifest content from powerbroker groups that were quoted in the sample of articles. Individuals from each group are enumerated with their respective quotes. The researcher interpreted each quote and assigned it membership to categories from the continuum of Taser™
regulation: pro-Taser™, regulation/neutral,and anti-Taser™ usage. Pro-Taser™ quotes had the highest frequency by powerbrokers (56.3%), regulation/neutral quotes werethe second most frequent (22.9%), and anti-Taser™ quotes were least represented in the articles (20.8%).
Limitations and ConclusionThis research is limited by investigator infer-ence toward Taser™ use and regulation. Fur-thermore, this analysis departed from a broad search of Taser™ articles in an attempt to focus on the zenith of controversy for this topic. Several articles not related to unintended death were not examined and may have con-tent related to powerbroker conflict on regula-tion. Thirdly, this analysis captured editorials, which are not primarily objective reporting. Although the researchers deemed that the content communicated to the public could be influential in editorial format, the bias of each article effected the mean score of each latent analysis. Finally, contemporary print media is slowly diminishing in the U.S. and shifting
Table 3. Latent Content – Wall Street Journal
Source Date Title of Article Rating
Wall Street Journal 3/25/2005 Arrested Development: A Stun-Gun Maker Struggles 2 & 212/14/2005 Taser Is Cleared by SEC But It Faces More Hurdles 3 & 32/23/2006 Taser International Inc.: Quarterly Profit Plunges 98% as Sales Fall 3 & 26/15/2006 U.S. to Review Deaths of Suspects Subdued with Electric Stun Guns 4 & 4
12/14/2007 Making a Case for Police Use of Stun Guns 2 & 2Mean = 2.70
Table 4. Latent Content – Los Angeles Times
Source Date Title of Article Rating
Los Angeles Times 5/24/2005 Man Shot with Taser by Tustin Police Dies 4 & 38/3/2005 5 San Jose Officers on Leave After Man Dies in Tussle 2 & 28/7/2005 Spate of Deaths Prompts Stun Gun Criticism 1 & 1
8/27/2005 Autopsy Says Taser Not a Factor in Man’s Death 4 & 48/9/2006 Stun Gun Shooting Ends in Death 3 & 4
5/26/2007 Simi Valley Man Subdued by Police Taser Dies Days Later 3 & 39/11/2007 Death of Man Subdued by Taser Is Probed 3 & 3
11/21/2007 Shocked to Death 1 & 17/20/2008 Taser Death in Troubled Town 1 & 210/3/2008 N.Y. Officer who Gave Taser Order Commits Suicide 3 & 3
Mean = 2.55

102 Law Enforcement Executive Forum • 2012 • 12(4)
toward online articles. This research was con-ducted from major newspapers that publish both online and in print, but the amount of online articles could be misrepresented in this sample. Further research into printed news media should triangulate toward online pro-duction as well as the printed article.
As the literature body indicates, news cover-age influences public perspectives on con-troversial topics (Earl et al., 2004; Johnson & Cintron, 1996; Ready et al., 2008). As Taser International came under the scrutiny of the public and media in 2005, the political climate seemingly leaned toward regulation of Taser™ usage by law enforcement. Although medi-cal research, academics, medical examiners, and government officials could not agree on a direct link between deaths and Tasers™, some entities maintained a conflict dispute either for continued use (e.g., Taser International) and a
moratorium on Tasers™ (e.g., Amnesty Inter-national). There still remains several groups that wield considerable political power (see Appendix) that are pushing toward regulative policies on Taser™ usage by law enforcement. For example, the Police Executive Research Foundation (PERF) has recommended the need for regulation, and ACLU lawyers have mentioned that some recommendations or policies suggested by PERF and the IACP have civil liability ramifications for law enforce-ment. Furthermore, in some states, politicians (i.e., city councilmen, attorney generals, and representatives) have attempted to gain politi-cal capital by pushing for statewide policies on Taser™ usage. Political posturing over Taser™ policy seems to be apparent and ongoing, and the powerbrokers engage in this conflict in con-temporary news media outlets. If regulation is a necessary middle ground toward public con-fidence in law enforcement, the conflict over
Table 5. Manifest Content
Powerbroker
# of Words # of Words # of Words
Pro-Taser™ Regulation/Neutral Anti-Taser™
GovernmentPolice ChiefGovernment spokesmanGovernment officialOfficerCity CouncilmanSchool SuperintendentDepartment of JusticeU.S. Attorney GeneralTotal
ScientistsPhysiciansAcademicsTotal
Nongovernment OrganizationsAmnesty InternationalPERFNIJIACPACLUTotalTaser InternationalTotal
19500
1400
170
100
9715
112
0282100
49335335
160
150000
2556
4760
107
0150
30358000
00
340
35800
77
02525
1060
1200
11800
SubtotalTotal words% per category
5961,05856.30%
2431,05822.90%
2201,05820.80%

Law Enforcement Executive Forum • 2012 • 12(4) 103
knowledge concerning Taser™ technologyshould be balanced by objective research com-municated by the news medium and accepted by stakeholders and policymakers.
We emphasize that administrators in lawenforcement and corrections who primarily utilize the Taser™ in their arsenal of CEDs should remain cognizant of the intent of pow-erbrokers to use media sources to effect policy (see Appendix). As stakeholders, the public has a vested interest in knowing that their concerns are heard by policymakers and administrators. The public perception toward their investment is often reported by news media sources. Many administrators can gain public support by pro-actively making regulative policy changes that would safeguard citizens and officers without effecting their agency’s mission.
ReferencesAdams, K., & Jennison, V. (2007). What we
do not know about police use of Tasers™. Policing, 30(3), 447-465.
Alpert, G. P., & Dunham, R. G. (2005). Under-standing police use of force: Officers, sus-pects, and reciprocity. American Journal of Sociology, 110(6), 1814-1816.
Alpert, G. P., & Smith, W. C. (1994). How rea-sonable is the reasonable man? Police and excessive force. Journal of Criminal Law & Criminology, 85(2), 481-501.
Audit Bureau of Circulations. (2010).Homepage. Accessed April 5, 2010, from www.accessabc.com.
Babbie, E. (2007). The practice of social research (11th ed.). Belmont, CA: Wadsworth.
Barranco, J., & Wisler, D. (1999). Validity and systematicity of newspaper data in event analysis. European Sociological Review, 15(3), 301-322.
Berg, B. L. (2009). Qualitative research methods for the social sciences (7th ed.). Boston: Allyn & Bacon.
Earl, J., Martin, A., McCarthy, J. D., & Soule, S. A. (2004). The use of newspaper data in the study of collective action. Annual Review of Sociology, 30, 65-80.
Ferrell, J. (1997). Criminological verstehen: Inside the immediacy of crime. Justice Quar-terly, 14(1), 3-23.
Garner, J. H., Maxwell, C. D., & Heraux, C. G. (2002). Characteristics associated with the prevalence and severity of force used by the police. Justice Quarterly, 19(4), 705.
Jenks, D., & Costelloe, M. (2007). It’s not whether you win or lose, it’s how you place the blame: Police agencies politicking about crime rates. Paper presented at the annual meet-ing of the American Society of Criminology, Atlanta, GA.
Johnson, W. W., & Cintron, M. (1996). The emerging war on tobacco: A content analysis of “banning” in America. Journal of Crime and Justice, 19(2), 31-48.
Kalb, M. (2010, April 6). Rupert Murdoch: The making of a modern media mogul. The Kalb Report [Video series]. Washington, DC: National Press Club, George Washington University, Global Media Institute/C-SPAN. Available at www.c-spanvideo.org/program/292871-1.
Oliver, P. E., & Myers, D. J. (1999). How events enter the public sphere: Conflict, location, and sponsorship in local newspaper cover-age of public events. American Journal of Soci-ology, 105(1), 38-87.
Pelfrey, W. V., & Covington, M. W. (2007). Deaths in custody: The utility of data collected from county coroners. Criminal Jus-tice Studies, 20(1), 65-78.
Pfhul, E. H., & Henry, S. (1993). The deviance process. New York: Aldine de Gruyter.

104 Law Enforcement Executive Forum • 2012 • 12(4)
Ready, J., White, M. D., & Fisher, C. (2008). Shock value: A comparative analysis of news reports and official police records on TASER deployments. Policing: An International Jour-nal of Police Strategies & Management, 31(1), 148-170.
Smith, M. R., Kaminski, R. J., Rojek, J., Alpert, G. P., & Mathis, J. (2007). The impact of con-ducted energy devices and other types of force and resistance on officer and suspect injuries. Policing, 30(3), 423-446.
Snyder, D., & Kelly, W. R. (1977). Conflict intensity, media sensitivity and the valid-ity of newspaper data. American Sociological Review, 42(1), 105-123.
Taser International. (2010). Homepage. Accessed April 21, 2010, from www.taser.com.
Thompson, B. L., & Lee, J. D. (2004). Who cares if police become violent? Explain-ing approval of police use of force using a national sample. Sociological Inquiry, 74(3), 381-410.
Vilke, G. M., & Chan, T. C. (2007). Less lethal technology: Medical issues. Policing: An International Journal of Police Strategies & Management, 30(3), 341-357.
White, M. D. (2003). Examining the impact of external influences on police use of deadly force over time. Evaluation Review, 27(1), 50-78.
Lee M. Wade, PhD, is an assistant profes-sor in the Criminal Justice department at Middle Tennessee State University. Lee is a former police officer with ten years of experience from the state of Georgia. He also has worked for the Mississippi Statistical Analysis Center. His teach-ing and research interests involve use of force, police pursuits, and police train-ing and management.
Kelly Ann Cheeseman, PhD, is an asso-ciate professor of Criminal Justice at Messiah College. She received her doc-torate at Sam Houston State University and worked in corrections for eight years with the Texas Department of Criminal Justice and the Federal Bureau of Prisons. Kelly has published numer-ous research articles on prison and cor-rectional officers and is a co-author of the book, The Death Penalty: Constitu-tional Issues, Commentaries and Case Briefs (2nd ed.). She also serves as the Vice-Chair of the Corrections section of the Academy of Criminal Justice Sciences (ACJS).

Law Enforcement Executive Forum • 2012 • 12(4) 105
Appendix. Sample of Various “Powerbroker” Quotes
Scientists
“Deaths usually occurred in people who areusing cocaine, who have underlying car-diac problems, or who suffer from ‘exciteddelirium.’”
“Despite a scarcity of research on peopleunder the influence of drugs, doctors in this field could still reasonably make a determina-tion that a Taser did not play a role in a death.”
“If Mr. Thomas did not die immediately after being shocked, as the police have said was the case, then it is less likely that the Taser played a role.”
“[T]he teenager would have died if he had not . . . received immediate care. An electrocardio-gram or heart rhythm test, administered to the teenager, proved that he suffered fibrillation.”
“Police officers should be aware that Taserscan cause fibrillation, even though the risksmay be small.”
“‘By contrast, a cardiac defibrillator oper-ates with 360 joules per pulse on average,’Mr. Tuttle said. ‘The Taser pulses stimulatethe motor nerves, impairing communicationbetween the brain and the muscles and essen-tially incapacitating the person,’ he said.”
Government Officials
“Tasers had not been identified as the cause of any fatalities in New York.”
“‘Electric weapons like Tasers should remain in use,’ he said, ‘because they give officers a way to handle difficult or potentially violent suspects without resorting to deadly force.’”
“[Y]esterday . . . S.E.C. enforcement officials . . . told the company that they had completed the investigation and had decided against taking action against the company.”
“We have to be careful; we have to be conser-vative in our deployment of these devices.”
“It lasts up to five seconds. And then you’re fine; you’re good to go.”
“My first take is that while I’m sure there are no experts out there on how to handle a crazy naked man with a weapon on top of a ledge, I’m also sure this wasn’t the right way . . . .”
“‘There is no reason to do anything different for now,’ he said. ‘We’ll let the research answer the questions.’”
Nongovernment Organizations/ Interest Groups
“More than 100 people have died in circum-stances related to the use of Tasers.”
“And although studies have not shown what role the devices might have played in those deaths, ‘extreme caution’ is in order.”
“[T]he devices, if used appropriately, are low-risk compared with other options, such as guns and batons or police dogs.”
“If you are not recording Taser discharges, you are not requiring responsibility.”
“These deaths raise a question in our mind that should be examined.”
“‘The fact that the government is doing this is an important acknowledgement that there is a serious problem,’ said Dalia Hashad, director of Amnesty’s USA program. ‘People are dying needlessly. It’s important that the federal gov-ernment is taking this responsibility.’”
“It may represent a viable way to improve outcomes in many use-of-force incidents, whether particular less-lethal weapons are used or not.”
“‘We do not advocate for a complete ban on Taser,’ Schlosberg said. ‘We think that Tasers

106 Law Enforcement Executive Forum • 2012 • 12(4)
should only be used as an alternative to deadly force.’”
Taser International
“The maker of Taser stun guns is advising police officers to avoid shooting suspects in the chest with the 50,000-volt weapon, saying that it could pose an extremely low risk of an ‘adverse cardiac event.’”
“De La Riva said, ‘The decision to use a Taser is left to the officer. It is intended to prevent serious bodily harm to the suspect or the officer.’”
“‘As we know, in-custody deaths are part of policing,’ Taser spokesman Steve Tuttle said when asked about the Justice Department review. ‘The more we can study and under-stand the circumstances that lead to in-cus-tody deaths, the more opportunities there are to develop law enforcement tactics and proce-dures that will help prevent these unfortunate events in the future.’”
“No one has better field results in reducing injuries to both officers and suspects than Taser International.”

Law Enforcement Executive Forum • 2012 • 12(4) 107
The Alternatives to Detention for Federal Detainees: The Criminal Justice Action Research ProjectDanielle T. Harrington, MSCJA, Federal Employee
IntroductionOn August 6, 2009, the Obama Administra-tion acknowledged that the federal detention system, with 32,000 detention beds in as many as 350 different facilities, was sprawling and too punitive in nature for detainees in civil pro-ceedings. On October 6, 2009, a federal agency released an unprecedented report assessing the status of the federal detention system, which included recommendations for reform (Detention Watch Network, 2010b). Although the agency has acknowledged that the system needs revamping, this researcher believes that alternatives to detention are not effective when seeking a more conventional means of dealing with federal detainees. The researcher will explore the alternatives to detention that currently exist as well as other alternatives that are being used in other countries.
Description of the Problem
The issue is that Alternatives to Detention(ATDs) are less effective when they involve federal detainees. Currently, a federal agency manages three ATD supervision/monitoringprograms, including (1) the Intensive Supervi-sion Appearance Program (ISAP), (2) Enhanced Supervision/Reporting (ESR), and (3) the Elec-tronic Monitoring (EM).
ISAP, the most restrictive and costly of the three strategies, began in 2004 and has acapacity for 6,000 federal detainees daily. This program is provided by a vendor on con-tract with the federal agency and has served approximately 13,000 participants (Schriro,2009).
The ESR program began in December 2007. It has a capacity for 7,000 federal detainees daily.
This program is less restrictive, less costly, and is provided by contract staff. More than 14,000 federal detainees have been served since itsinception (Schriro, 2009).
The EM program also began in December 2007 and has a capacity for 5,000 federal detainees daily. This program is the least restrictive, least costly, and is operated by the federal agency and about 250 federal agency employees.Approximately 12,000 federal detainees have participated since the EM program started(Schriro, 2009).
These alternatives offer a more cost-effective way of handling federal detainees, but these may not always ensure the ultimate goal of the programs and that is to ensure that released detainees appear at their scheduled courtappearances. The hypothesis is that alterna-tives to detention are not effective when deal-ing with federal detainees. The research ques-tions that will be used to prove or disprove this theory are as follow:
••
Whatalternativestodetentionexist?Wouldthesealternativesbeeffective?
History and Background of the Problem
The American prison system was set up to rehabilitate prisoners, so they can meld back into society as productive citizens. Instead, factors such as high crime rate and, of course, mandatory sentences have caused an increase in overcrowding of our jails. This also has caused an increase in the budget deficit. Where is the rehabilitation that once was used? Reha-bilitation has all but disappeared in the prison system today. As a result of a congressional mandate, the federal agency created the ATD program in fiscal year 2002.

108 Law Enforcement Executive Forum • 2012 • 12(4)
The ATD program was developed to provide an appropriate level of supervision during pro-ceedings to ensure compliance with a judge’s order for federal detainees whose detention is not required by statute, who present a low risk of flight, and who pose no danger to the com-munity. These detainees would otherwise be housed in a detention facility at agency expense.
Importance of the Project
The determination of the effectiveness of the ATD program is important because the fed-eral agency detains about 23,000 persons every day, a number that includes federal detain-ees who pose a threat to community safety or national security and those otherwise required to be detained (Pena, 2006). Limited detention capacity and an increasing detainee population have sparked national efforts over the past sev-eral years to integrate into the federal agency’s general practices the use of various alterna-tives to detention (Pena, 2006). Alternatives to detention offer the prospect of a considerable cost savings. The cost of detention is currently approximately $100 per day per individual, while the most expensive ATD costs approxi-mately $14 per day per individual (National Immigrant Justice Center, 2010). If the ATD program is indeed ineffective, perhaps the focus should be on expanding the agency’s bed space. During fiscal years (FY) 2003,2008, and 2009, there was an increase in fund-ing for more bed space (Krikorian, 2009). The FY2010 budget did not allow for an increase in bed space and yet the administration spent $1.77 billion on custody operations compared to $69.9 million on ATD programs (Krikorian, 2009). This leaves the federal agency in a pre-dicament: alternatives that do not appear to be working, no extra bed space, and an incredible amount of money being spent on both.
Definition of Terms
The following terminology is unique to this research project:
• Detainee – A person held in custody (Merriam-Webster Dictionary, 2010)
•
•
•
•
Fiscal Year – An accounting period of 12 months (Merriam-Webster Dictionary, 2010)Intensive Supervision Appearance Program (ISAP) – Monitors participating subjects using the following methods: telephonic reporting (TR), radio frequency (RF), global positioning systems (GPS), and unan-nounced home visitsEnhanced Supervision/Reporting (ESR) – Contractor-operated program that uses the same monitoring methods as ISAPElectronic Monitoring (EM) – Operated by the federal agency and is available to sub-jects residing in locations not covered by ISAP or ESR contracts; uses TR, RF, and GPS technologies
Literature ReviewFederal detainees enrolled in the ATD pro-grams are expected to comply with a range of measures, including checking in by phone, wearing ankle monitors, and obeying a curfew. The programs are designed to improve court appearance rates for nonviolent offenders. On average, nearly one in five federal detainees who went through an intensive monitoring program absconded while under supervision during the past five years. A majority of fed-eral detainees who promise to appear for their court dates are simply deceiving the federal authorities (Carroll, 2009). Alternatives do appear to provide a cost-effective way of man-aging federal detainees, but their effectiveness is something to be considered.
Telephonic Reporting
Telephonic reporting is a call-in system uti-lizing voice recognition. This supervision tool may be used as an added condition of release from detention or for supplementing in-person reporting requirements (Lee, 2005). TR is available nationwide and may be used to increase the levels of reporting while under supervision to include reporting daily, weekly, or monthly as appropriate. This method of reporting is beneficial for the participant as well as the officer because it frequently

Law Enforcement Executive Forum • 2012 • 12(4) 109
decreases in-person reporting requirements (Lee, 2005).
Radio Frequency
The radio frequency monitoring program is similar to the GPS program and is used pri-marily for home curfew supervision. This pro-gram has a specific worksheet that determines eligibility for placement into the RF program. RF monitoring is primarily focused on federal detainees who are being considered for release from detention (Lee, 2005). An RF transmitter attached to the subject’s ankle with a tamper-proof strap sends the monitoring company information about the subject’s whereabouts. If the subject is not at home at the stipulated times, an alert message is relayed to the moni-toring company and authorities are notified. The authorities will take appropriate action if the subject is found in violation of the moni-toring restrictions (Orange County Grand Jury, 2010).
Global Positioning Systems
Until recently, GPS monitoring systems that were designed to track offenders were heavy, weighing at least five pounds and required recharging daily. Great strides forward in the development of GPS technologies in the last five years has resulted in the adoption of GPS monitoring in a growing number of state jurisdictions. Global positioning monitor-ing has been particularly favored as a means of social control when the offender has been convicted of child sexual offences (Howard, 2006). In the State of Florida, as well as others, GPS monitoring is now imposed on offenders for life, even after they have served their time, in a number of jurisdictions (Howard, 2006).
Global positioning monitoring can be han-dled in an active or passive mode. In the first instance, the offender wears a tracking device that offers continuous pinpointing of the offender’s whereabouts 24 hours a day. The device can also be programmed so that spe-cific location parameters can be defined from which the offender is precluded from entering
such as school areas or playgrounds. Should the subject do so, the breach instantly triggers an alarm at the monitoring station (Howard, 2006). A passive mode consists of recording the subject’s movements during the day which is then periodically downloaded to the tracking station and assessed. Breaches are then identi-fied, although of course, only after the breach has occurred (Howard, 2006).
The GPS monitoring program requires the subject to wear an electronic bracelet attached to the ankle with a tamper-proof strap. The subject’s movements are monitored 24 hours a day through a signal relayed by the bracelet to a GPS satellite, which downloads the infor-mation to the monitoring company’s com-puter. This allows the subject to attend school or work and also alerts the authorities when the subject is in an area deemed off-limits. The authorities will take appropriate action if the subject is found in violation of the monitor-ing restrictions. GPS allows for the continu-ous ability to track an offender’s movement around the clock (Howard, 2006).
Electronic Monitoring
The first electronic monitoring (EM) device was developed in the mid-1960s by Harvard psychologist Robert K. Schwitzgebel who felt that his invention could provide a humane and inexpensive alternative to custody for many people involved in the justice pro-cess. Doctor Schwitzgebel’s Machine, as it was called, consisted of a battery pack and a transmitter capable of emitting a signal to a receiver within a quarter-mile range. Although Dr. Schwitzgebel patented the device in 1969, the actual practice of electroni-cally monitoring offenders did not start until the 1980s (Howard, 2006). Judge Jack Love of Albuquerque, New Mexico, was the first to sentence an offender to house arrest using EM technology in 1983 (Howard, 2006). The use of EM grew rapidly in the U.S., and by 1988, there were 2,300 offenders in 32 states who were being electronically monitored (Howard, 2006). Ten years later, the use of EM devices had skyrocketed: in January of 1998,

110 Law Enforcement Executive Forum • 2012 • 12(4)
over 95,000 EM devices were in use (Howard, 2000).
There are two basic types of EM equipment: (1) continuously signaling and (2) programmed contact (Howard, 2000). Continuously signal-ing, or active systems, have three essential parts: (1) a transmitter, (2) a receiver/dialer, and (3) a central computer (Howard, 2000). The transmitter is strapped to the offender and broadcasts a coded signal over a telephone line at regular intervals. The receiver/dialer picks up signals from the offender’s transmitter and reports to a central computer when the signals stop and start. The computer compares any signal interruptions with the offender’s curfew schedule and alerts authorities to unauthorized absences (Howard, 2006).
In a programmed contact or passive system, a computer is programmed to call the offender at random or at specific times, and then it reports on the results of the calls. Programmed contact devices are referred to as passive since the offender’s presence at home is only noted when the computer calls. When a call is placed to his or her residence or place of work, an offender may verify his or her presence in a number of ways. Some offenders may wear a device strapped to their wrist that is inserted into a verifier box connected to the telephone to verify that the offender is present when the computer calls (Howard, 2000).
Some programmed contact systems use voice verification technology that analyzes the offender’s voice when he or she answers a call. The voice print recorded at the time of the call is matched to a print recorded when the offender entered the program. Other systems may require the offender to wear a pager and call a specified number when the pager beeps. Caller-ID technology establishes whether the offender is at an approved location (e.g., home, work, school, etc.) at a specific time (Howard, 2000).
The use of GPS and EM systems for offender monitoring has become increasingly popular in Canada and around the world such as in
the United Kingdom, New Zealand, and The Netherlands, and these systems are being intro-duced and used at various degrees of inten-sity in other nations as well (e.g., Australia) (Howard, 2006). EM verifies the location of an offender at a set time (usually at home or at a workplace). While these EM devices could be used to track an offender’s movement, they are simply meant to confirm whether or not the individual is at an approved place at specific times (Howard, 2000).
Unannounced Home Visits
During an unannounced home visit, the offi-cer goes to the house or apartment where the subject is supposed to be living and checks on the subject. During these home visits, officers look at the general conditions of the home and for signs of drug or alcohol use. They ensure there are no guns or illegal weapons in the residence, or other signs of illegal activi-ties. These visits can occur on any day of the week and at any time of the day and are usu-ally done every two to eight weeks depending upon case status.
Other Release Options
The Secretary of State has the authority to parole federal detainees who are not subject to mandatory detention. Most federal detainees are not eligible for parole. Parole is permitted for detainees with serious medical conditions, pregnant women, juveniles who will be wit-nesses, and detainees whose continued deten-tion is not in the public interest. In general, parole is available on a case-by-case basis for urgent humanitarian reasons or significant public benefit (Siskin, 2004).
Detainees not subject to mandatory detention may also be released on bonds of a minimum of $1,500. The arresting officer determines the amount of the bond, and the judge has the authority to change that amount. To be released on bond, the detainee must prove that he or she is not a threat to people or prop-erty, will appear at all future court proceed-ings, and will comply with any conditions of
Law Enforcement Executive Forum • 2012 • 12(4) 111
release. Once a case is complete and condi-tions fulfilled, the federal agency will return the bond money to the obligor (NationalImmigrant Justice Center, 2010).
An order of supervision is the lowest level of supervision that requires the subject to report periodically to a federal officer. An order of supervision is also an order to meet other requirements such as obtaining advance per-mission to travel out of state and keeping fed-eral officers advised of any address changes (National Immigrant Justice Center, 2010).
ATD Requirements
There are many policy issues surround-ing federal detention requirements. Recent legislation increased the number of federal detainees subject to mandatory detention and raised concerns about the justness of manda-tory detention (Siskin, 2004). Additionally, the increase in the number of mandatory detain-ees has raised concerns about the amount of detention space available to house federal detainees. Some contend that decisions on which detainees to release from detention and when to release them from detention may be based on the amount of detention space, not on the merits of individual cases (Siskin, 2004).
The federal agency is currently in the pilot stage of developing a risk and custody clas-sification instrument. The risk assessment tool would include a series of questions aimed at determining whether an individual can be released into the community while his or her court case is pending, or instead, whether the individual presents a flight risk or a threat to public safety. The tool allows federal agency officials to make informed custody determi-nations by comparing an inventory of factors such as age, gender, ties to the community, family circumstances, case status, criminal history, medical conditions, and other vul-nerabilities that would place an individual at heightened risk in a detention facility such as medical and mental health issues, pregnancy, or past trauma (Detention Watch Network, 2010a).
What Other Countries Are Doing with ATD
In Canada, government policy requires that officers consider alternatives to detention for the elderly and those who are pregnant, sick, handicapped, and mentally ill (Lutheran Immigration and Refugee Service, 2009). Those detained have the right to counsel or legal aid and are subject to a means- and merit-based test. At detention hearings, which are held within 48 hours of detention, an inde-pendent adjudicator will determine on a case-by-case basis what, if any, conditions or bail may be placed upon release of the detainee (Lutheran Immigration and Refugee Service, 2009). Bail is an optional requirement placed upon detained subjects. The Canadian gov-ernment funds a unique bail program run by a nonprofit organization, the Toronto Bail Program (TBP), to provide the necessary bond for an indigent detainee and to subsequently supervise him or her until a determination has been made on his or her case. Supervi-sion requirements of the TBP are rigorous and may include twice-weekly or more reporting requirements and unannounced home visits. The TBP has a 90% compliance rate. The pro-gram costs $3 per day compared to $134 per day for incarceration (National Immigrant Justice Center, 2010).
Canada has implemented various commu-nity-based supervision programs with high compliance rates. The Faithful Companions of Jesus (FCJ) Refugee Centre provides housing for women and children without a program of supervision; FCJ has a 99.9% compliance rate (National Immigrant Justice Center, 2010). When detainees are homeless but required to provide an address upon release, they may be placed in a temporary shelter program such as the Matthew House, which does not super-vise residents or impose curfews. Over a five-year period, 300 subjects in proceedings were housed there and three absconded (National Immigrant Justice Center, 2010). A similar homeless shelter, the Sojourn House, took in 3,600 subjects over a six-year period with two absconding (National Immigrant Justice Center, 2010).

112 Law Enforcement Executive Forum • 2012 • 12(4)
In Sweden, regional housing centers, essen-tially apartments, are provided as an alterna-tive to detention (Lutheran Immigration and Refugee Service, 2009). Sweden’s integrated approach to detention and reception has been aided by the implementation of the caseworker system which has helped bureaucratic deci-sionmakers make detention decisions. A case-worker is assigned to each subject, and his or her primary role is to provide social service and medical referrals, inform the subjects of their rights, explain the court process, and assess risk of flight (Lutheran Immigration and Refu-gee Service, 2009). Additional legal orientation is provided after an order is issued (Lutheran Immigration and Refugee Service, 2009).
Currently, Australia operates a range of alterna-tives to detention or alternative forms of deten-tion programs. Many of these programs rely upon case management to facilitate enforce-ment of program requirements (LutheranImmigration and Refugee Service, 2009). One version is a less restrictive detention which pro-vides greater comforts and freedom of move-ment than jail-like detention but still imposes significant restrictions on liberty. Residents do not have the freedom to leave the site unaccom-panied, though they may be regularly escorted off-site to buy groceries and attend to other daily living needs (Lutheran Immigration and Refugee Service, 2009).
Australia also operates a community residen-tial model that allows participants to reside in the community with the freedom to come and go as they please. These programs impose conditions that generally include sleeping at a specified address each night, regular report-ing, and refraining from work or any formal course of study. Participants receive a basic living allowance and are provided accommo-dations (Lutheran Immigration and Refugee Service, 2009).
Australian authorities notify the Australian Red Cross before they release someone from detention. A Red Cross caseworker then visits the detention center; assesses the individual; and develops a case plan based on the client’s
housing options, income, health, education, and access to community support. A govern-ment caseworker acts as a liaison between the Red Cross and the federal department to monitor the individual’s ongoing develop-ment. Some people may be allowed to live independently but may be restricted to a des-ignated residence and subject to visits by offi-cials. Red Cross caseworkers respond to health and welfare needs as well (National Immigrant Justice Center, 2010).
Another Australian program, the Commu-nity Care Pilot (CCP), used an early interven-tion model which provided welfare and legal assistance to participants. The CCP oversaw and supported cases until a final determina-tion was made as to court status. Since March 2006, 560 people have received a final deter-mination in the CCP program of which 7% absconded (Lutheran Immigration and Refu-gee Service, 2009).
The Australian pilot project, Status Resolution Trial, offered early intervention assistance to those with no health or welfare concerns. Since July 2007, 22 of the 426 program participants have absconded (Lutheran Immigration and Refugee Service, 2009). The Lutheran Immi-gration and Refugee Service (2009) stated, “It has been demonstrated that a case manage-ment approach, together with health and wel-fare support and independent detainee infor-mation and counseling is critical in resolving the cases of vulnerable individuals and fami-lies swiftly” (p. 5).
Synthesis of Theories, Concepts, and Practices
The literature review revealed through the synthesis of the theories, concepts, and prac-tices of alternatives to detention programs that a general set of constructs, such as the following, existed in programs that were effi-cient and effective:
• Telephonic Reporting – This is a call-in system that uses voice recognition as a means to monitor a subject.

Law Enforcement Executive Forum • 2012 • 12(4) 113
•
•
•
•
•
•
•
Radio Frequency – This monitoring program uses an ankle strap equipped with a radio frequency transmitter to primarily super-vise home curfews.Global Positioning System – This is a moni-toring program that uses an electronic ankle bracelet that monitors a subject’s movements 24 hours a day through a signal relayed by the bracelet to a GPS satellite.Electronic Monitoring – This electronic mon-itoring device is used to confirm whether or not the subject is at an approved place at specific times.Unannounced Home Visits – These home visits were made by the monitoring offi-cer to ensure the subject was living at the address at which he or she claimed to be living.Other Release Options – These consisted of different programs such as parole, bonds, and order of supervision.ATD Requirements – These are the laws gov-erning who should be detained and who can be released.What Other Countries Are Doing with ATD – This was an evaluation of the ATD pro-grams that are offered by Canada, Sweden, and Australia.
Literature Review Summary
With respect to the different alternatives to detention that are available, the literature review explained the programs thoroughly but failed to provide any statistical data that would clarify the effectiveness of these pro-grams in the U.S. With respect to GPS and EM, both programs are widely used across the U.S. and their popularity appears to be spreading to other countries as well. The programs cur-rently used by the federal agency and other agencies are acceptable means to providing a cost-effective alternative to detention, but their effectiveness is yet to be determined.
Methodology and Procedures
Data Collection Plan
The data collection plan examined the deten-tion issue through secondary research and empirical analysis of the opinions of a popu-lation of federal officers currently working in a federal agency. The plan included the researcher following a specific series of steps:
1. Review, analysis, and synthesis of the hypothesis, problem statement, research questions, relevant literature, and vali-dated methods to examine the issue.
2. Research, design, and development of the instrumentation, a data collection instru-ment as described below.
3. Research site cooperation and assistance was gained through work with the federal agency director.
4. Research methodology, instrument, and approval were gained through the Keuka College Institutional Review Board for continuance of the research project prior to moving forward.
5. The data collection instruments were dis-seminated and collected by the researcher following the protocols mandated in the Keuka College Institutional Review Board approval of the research project.
6. Data entry and analysis of the opinion-based information using descriptive sta-tistical analysis of the population (e.g., mean, median, mode, standard deviation, and range), examining the information and drawing conclusions from the sta-tistical measures of central tendency and dispersion rates of the research popula-tion’s responses.
Description of the Methodology
The research methodology consisted of a population or group analyses of federal offi-cers assigned to a local federal agency. This research population consisted of 30 federal officers (100% of the available population at the local agency) who varied in time in assign-ment from one to 20 years of service, with the

114 Law Enforcement Executive Forum • 2012 • 12(4)
majority of the respondents having at least two years of field service. The Intra-Group Analysis used data that were limited to the entire group. Information, opinions, and cor-relations were drawn based on the categories and variables of one research population in the local federal agency.
Data Collection Instrument
The researcher developed the data collection instrument and utilized questions that were linked to the hypothesis, main research ques-tions, and literature in order to explore the topic within the affected organization. The data collection instrument included no demo-graphic questions, 24 quantitatively based questions using a standard Likert scale to mea-sure individual opinion-based data, as well as three qualitative questions to provide the respondents with an opportunity to offer indi-vidual opinions regarding the issue explored.
The instrument was divided into three sepa-rate and distinct constructs as follows:
1. Existing Alternative to Detention Programs – Inclusive of Questions 1 to 13
2. Alternative to Detention Requirements – Inclusive of Questions 14 to 17
3. Alternative to Detention Programs in Other Countries – Inclusive of Questions 18 to 24
Limitations of the Data Collection Plan
As with any research, there were certain limitations to this data collection plan. For example, (1) the study of one local office may not have generalizable implications to the population as a whole, (2) the study of those who may have little experience working with alternatives to detention programs may not provide an accurate picture of the entire spectrum of alternatives to detention that are available and their effectiveness, and (3) the inability to receive permission in order to dis-tribute the surveys would hinder the entire research project.
ResultsThe literature revealed two constructs that were examined in the context of alternatives to detention and their effectiveness. Overall, the results of this study revealed that alterna-tives to detention are not effective nor sup-ported by federal officers when dealing with federal detainees.
Summary of Results
The researcher distributed approximately 45 data collection instruments to the total popu-lation of federal officers and their supervisors assigned to the local office. Of the distributed data collection instruments, 39 were returned with an overall 87% return rate. This presented a significant return rate for the population and, thus, the descriptive statistical analyses that follows has very high confidence levels. The summative results are condensed into the following two research questions that were formed into constructs:
Research Question 1: What Alternatives to Deten-tion Exist? The researcher chose to compare the available alternatives found in the lit-erature with the best way to manage these alternatives based on the opinions of the fed-eral officers. The highest scored alternative according to the survey results were unan-nounced home visits with a cumulative score of 3.37 (neutral). The officers were clearly neu-tral on the idea of unannounced home visits but were well in agreement when asked who should conduct the home visits. With a mean of 4.46 (agree), the officers nearly strongly agreed that unannounced home visits should be conducted by a federal officer.
The lowest scored alternative according to the survey results were for other release options with a cumulative score of 2.58 (neutral). The survey participants revealed a mean of 2.00 (disagree) when specifically asked if $1,500 bond is adequate to ensure the federal detain-ee’s appearance in court. The survey partici-pants clearly disagreed that $1,500 for a bond is adequate to ensure a detainee’s appearance

Law Enforcement Executive Forum • 2012 • 12(4) 115
in court. The next lowest mean was 2.08 (dis-agree) when officers were asked if orders of recognizance should be used more frequently for those in court proceedings. The overall cumulative score for this research question was 3.00 (neutral). Clearly, the federal offi-cers who were surveyed did not feel strongly about the alternatives to detention that pres-ently exist.
Research Question 2: Would These Alternatives Be Effective? This research question focused on requirements of alternatives to detention as well as alternatives that are currently being used in other countries. The overall cumula-tive score for this question was 2.18 (disagree). Survey respondents agreed (3.97 mean) that the decision to release a detainee should be based strictly on the merits of the case. The respondents also agreed (3.97 mean) that a risk and custody classification instrument would be beneficial for making decisions on which detainees to release as an alternative to detention.
The lowest means were evident when refer-ring to alternatives that other countries are currently using. At best, there was a neutral stance (2.97 mean) when it came to a central-ized bail program that would post the bond and monitor the detainee until the case is decided. The surveyed officers clearly dis-agreed (1.28 mean) with providing detain-ees with welfare and legal assistance while they were released from detention such as providing work rights, rent assistance, medi-cal benefits, and counseling (1.33 mean). The researcher accepts the hypothesis based on the overall disagreement with the other possible alternatives offered in Research Question 2.
Statistical Analysis of Findings
Null Hypothesis – The null hypothesis con-sisted of the theory that alternatives to deten-tion are effective when dealing with federal detainees, ensuring that all program enrollees are present for their hearing.
Research Question 1/Construct A: Telephonic Reporting – The researcher examined the preferences of the research population to determine the most preferred or amenable preferences for management of this type of alternative. That series of questions is included in the data collection instrument. The mean for Construct A is 2.87 (neutral).
Research Question 1/Construct B: Radio Fre-quency – The researcher examined the prefer-ences of the research population to determine the most preferred or amenable preferences for management of this type of alternative. That series of questions is included in the data collection instrument. The mean for Con-struct B is 3.18 (neutral).
Research Question 1/Construct C: Global Posi-tioning – The researcher examined the prefer-ences of the research population to determine the most preferred or amenable preferences for management of this type of alternative. That series of questions is included in the data collection instrument. The mean for Con-struct C is 3.19 (neutral)
Research Question 1/Construct D: Electronic Moni-toring – The researcher examined the prefer-ences of the research population to determine the most preferred or amenable preferences for management of this type of alternative. That series of questions is included in the data col-lection instrument. The mean for Construct D is 3.00 (neutral).
Research Question 1/Construct E: Home and Office Visits – The researcher examined the prefer-ences of the research population to determine the most preferred or amenable preferences for management of this type of alternative. That series of questions is included in the data collection instrument. The mean for Con-struct E is 3.37 (neutral).
Research Question 1/Construct F: Other Release Options – The researcher examined the prefer-ences of the research population to determine the most preferred or amenable preferences for management of this type of alternative.

116 Law Enforcement Executive Forum • 2012 • 12(4)
That series of questions is included in the data collection instrument. The mean for Con-struct F is 2.58 (neutral).
Research Question 2/Construct A: Alternative to Detention Requirements – The researcher exam-ined the preferences of the research popula-tion to determine the most preferred or ame-nable preferences for management of this type of alternative. That series of questions is included in the data collection instrument. The mean for Construct A is 2.55 (neutral).
Research Question 2/Construct B: Alternatives to Detention in Other Countries – The researcher examined the preferences of the research pop-ulation to determine the most preferred or amenable preferences for management of this type of alternative. That series of questions is included in the data collection instrument. The mean for Construct B is 1.77 (disagree).
Summary of Data Analysis
The data analysis revealed results from ques-tioning respondents about alternatives to detention as it relates to federal detainees. The survey grouped questions into those
measuring how the research population feltabout the alternatives to detention that arefrequently used by the agency as well as other alternatives such as those being used in other countries.
The first 13 questions in the survey measured the research population’s preferred methodof how the present alternatives should beconducted. The current alternatives werefound to be at the neutral level for telephonic reporting, radio frequency, global position-ing systems, electronic monitoring and home visits, while other release options, such asparole, bonds, and orders of recognizance,were near the disagree level (2.58 - neutral).The survey population felt strongly aboutGPS compared to RF and EM, but the home and office visits rated at the highest neutrallevel of all alternatives (3.37).
Respondents were asked 11 additional ques-tions about other alternatives that may beeffective for use with federal detainees. Theanalysis showed an overall disagreementwith the effectiveness of other alternatives(2.18). When asked about requirements of the present alternatives to detention program,
Figure 1. Existing Alternatives to Detention Analysis (n = 39)
© dth 2012
23
Research Question 1 / Construct E: Home and Office Visits. The researcher examined the
preferences of the research population to determine the most preferred or amenable preferences
for management of this type of alternative. That series of questions is included in the data
collection instrument and numbered 9 – 10 in Appendix B. The mean for Construct E is 3.37
(neutral).
Research Question 1 / Construct F: Other Release Options. The researcher examined the
preferences of the research population to determine the most preferred or amenable preferences
for management of this type of alternative. That series of questions is included in the data
collection instrument and numbered 11 – 13 in Appendix B. The mean for Construct F is 2.58
(neutral).
Figure 1: Existing Alternatives to Detention Analysis (n=39)
Research Question 2 / Construct A: Alternative to Detention Requirements. The
researcher examined the preferences of the research population to determine the most preferred

Law Enforcement Executive Forum • 2012 • 12(4) 117
the survey respondents responded neutrally(2.55). Specifically, the respondents disagreed with basing the decision to release a subjectstrictly on detention space (1.69) as well asfewer detainees should be subject to manda-tory detention (1.97). The respondents werein full agreement with basing the decision to release a detainee strictly on the merits of the case (3.97).
Overall, the data analysis indicated thatrespondents are not receptive to alternativesto detention for federal detainees. The totalpopulation did not agree with the alternatives currently being used by the federal agency,and the respondents certainly disagreed with the other alternatives currently being used by other countries to deal with federal detainees. To the researcher’s surprise, the data analysis revealed mostly neutral results, and federalofficers rarely agreed on any of the alterna-tives that were offered. There is insufficientevidence to prove or disprove the hypothesis that alternatives to detention are not effective when dealing with federal detainees. Thus, the
researcher has neither accepted nor rejected the hypothesis and neither accepts nor rejects the null hypothesis that would indicate that alternatives to detention are effective when dealing with federal detainees.
ConclusionThis study revealed that there was little pub-lished research on the topic of alternatives to detention. Recommendations include further research in order to determine the effective-ness of alternatives to detention and federal detainees.
Discussion
The results of this study have allowed the researcher to understand in greater depth the various alternatives to detention that are available and currently being used by the federal agency as well as the effectiveness of these alternatives.
Figure 2. Effectiveness of Other Alternatives Analysis (n = 39)
© dth 2012
24
or amenable preferences for management of this type of alternative. That series of questions is
included in the data collection instrument and numbered 14 – 17 in Appendix B. The mean for
construct A is 2.55 (neutral).
Research Question 2 / Construct B: Alternatives to Detention in Other Countries. The
researcher examined the preferences of the research population to determine the most preferred
or amenable preferences for management of this type of alternative. That series of questions is
included in the data collection instrument and numbered 18 – 24 in Appendix B. The mean for
Construct B is 1.77 (disagree).
Figure 2: Effectiveness of Other Alternatives Analysis (n=39)
Summary of Data Analysis
The data analysis revealed results from questioning respondents about alternatives to
detention as it relates to federal detainees. The survey grouped questions into those measuring

118 Law Enforcement Executive Forum • 2012 • 12(4)
Research Question 1: What Alternatives to Detention Exist? The researcher chose to com-pare the available alternatives found in the literature with the best way to manage these alternatives based on the opinions of the fed-eral officers. There was adequate literature on the alternatives that exist but little to no litera-ture or research relating to federal agencies’ use of these alternatives.
The survey revealed mostly neutral results when comparing the various alternatives to detention. The federal officers only agreed that unannounced home visits should be con-ducted by a federal officer. The overwhelming neutral results leave the researcher with little information with which to move forward. The respondents’ lack of support and no obvious opposition for the programs make it difficult to determine whether or not these alterna-tives to detention programs are a current and viable alternate source for dealing with fed-eral detainees.
Research Question 2: Would These Alternatives Be Effective? This research question focused on the requirements of alternatives to detention as well as alternatives that are currently being used by other countries. The overall cumu-lative score was at the disagreement level of 2.18. The only neutral response was the idea of a centralized bail program that would post bond and monitor the detainee until the case is decided. All other responses were clearly at the disagreement level. The survey revealed obvious discontent for the alternatives that other countries are currently using. This leaves the researcher with few alternatives to suggest.
Conclusions
The researcher has been able to draw conclu-sions from this research in regards to alterna-tives to detention used by the federal agency as well as alternatives that are currently being used by other countries. These conclusions are based on a problem statement, a review of cur-rent literature on the subject, data collection
instruments, and analyzing such data to draw conclusions:
Research Question 1: What Alternatives to Detention Exist? As prior research indicates, the existing programs that are being used nation-wide are similar to those being used by the federal agency. There is not enough evidence to conclude whether or not these alternatives are working for the federal agency by ensur-ing the detainees are present for their hearing. The research does conclude that the federal officers do not support or agree with the pro-grams currently being used. Perhaps more jail space is needed instead of trying to keep track of federal detainees using electronic devices. More research will have to be conducted in order to draw any major conclusions on the current alternatives to detention being used by the federal agency and their effectiveness.
Research Question 2: Would These Alternatives Be Effective? There is little to no available research to indicate whether or not the current alter-natives are effective. The research indicates that federal officers agree that the decision to release a subject should be strictly based on the merits of the case, which is not how the decision to release a subject is currently being made. There was little agreement on the other alternatives being used in other countries. The responses to Research Question 2 indicate once again a lack of support for alternatives to detention regardless of what country is using the alternatives and the manner in which the alternatives are being used. More research will have to be conducted in order to draw any major conclusions on the effectiveness of alternatives to detention.
Project Improvement Plan and Recommendations
Research Question 1: What Alternatives to Deten-tion Exist? When asking respondents about their thoughts on current alternatives to detention programs being used by the fed-eral agency, the highest responses came from GPS and home and office visits. These pro-grams are two of the most commonly used

Law Enforcement Executive Forum • 2012 • 12(4) 119
programs, and while their responses were not overwhelmingly positive, it is recommended that these programs continue to be used. More research should be conducted to ensure that these programs are the most effective pro-grams that should be used when dealing with federal detainees.
Research Question 2: Would These Alternatives Be Effective? This research question evaluated the current requirements for the alternatives to detention programs to determine whether or not these programs are effective. Overall the respondents were not in agreement with the way programs are being managed and were in complete disagreement when alternative programs from other countries were intro-duced. The program requirements as well as a risk and classification instrument need to be reviewed and implemented to ensure total understanding and cooperation from the officers who are utilizing these programs on a daily basis. The overall disagreement with the way these programs are utilized leaves the researcher believing that the majority of the federal officers in the local district do not believe in the programs they are using. The researcher recommends additional research into these programs and education for the officers.
Recommendations for Further Research
Future research in the area of alternatives to detention would be beneficial to law enforce-ment agencies and departments across the nation. An expanded population, including other agencies and departments, would be beneficial to understanding the overall opin-ions of federal officers and others who use the programs on a regular basis. Future research should be extended to other districts within the federal agency as well as other agencies that use the alternatives, including county sheriffs, town and village police agencies, state police, and other federal agencies. Addi-tional research would be beneficial to study data from the entire federal population, not just the local district. Agency-wide research may be accomplished by agency headquarters
handing out data collection instruments to all federal officers nationwide via e-mail. Expand-ing the questions and making them more spe-cific, with more opportunity for officers to clarify their responses, would benefit future studies. Expanding the survey and allowing for more choices on the Likert ranking scale also would benefit future studies. Compar-ing current federal alternatives to those alter-natives being used in other countries would be beneficial to gain additional insight to the success or failures of alternatives being used around the world. Expanding the suggestion area or comment area could help improve data collection instruments and possibly gain ideas for new alternatives to detention that would ensure compliance and attendance to federal hearings all while being cost effective. The most conclusive research would be gained by conducting a study in which a large group of federal subjects on an ATD are tracked over a year’s time or more. The results would reveal a much clearer picture into the effectiveness of alternatives to detention.
ReferencesCarroll, S. (2009). Flaws found in options for
immigrant detention. Retrieved November 12, 2012, from www.chron.com/disp/story.mpl/special/immigration/6675443.html.
Detention Watch Network. (2010a). Commu-nity-based alternatives to immigration detention. Retrieved November 12, 2012, from www.detentionwatchnetwork.org/sites/detention watchnetwork.org/files/DWN%20ATD%20Report%20FINAL_08-25-2010.pdf.
Detention Watch Network. (2010b). Year one report card: Human rights and the Obama administration’s immigration detention reforms. Retrieved November 12, 2012, from www.detentionwatchnetwork.org/sites/detention watchnetwork.org/files/ICE%20report%20card%20FULL%20FINAL%202010%2010%2006.pdf.

120 Law Enforcement Executive Forum • 2012 • 12(4)
Howard, J. (2000). Electronic monitoring. Retrieved December 6, 2012, from www.johnhoward.ab.ca/pub/A3.htm.
Howard, J. (2006). Electronic (radio frequency) and GPS monitored community based supervision programs. Retrieved November 12, 2012, from www.johnhoward.ab.ca/pub/pdf/monitor update.pdf.
Krikorian, M. (2009). Center for immigration studies: Moving toward more effective immi-gration detention management. Retrieved November 12, 2012, from www.cis.org/node/1629.
Lee, W. (2005). Alternatives to detention programs enrollment guidance. Retrieved November 12, 2012, from www.ice.gov/doclib/foia/dro_policy_memos/dropolicymemoeligibility fordroisapandemdprograms.pdf.
Lutheran Immigration and Refugee Ser-vice. (2009). Alternatives to detention pro-grams, an international perspective. Retrieved November 12, 2012, from http://idcoalition.org/wp-content/uploads/2009/06/comparative-atd-models.doc.
Merriam-Webster, Inc. (2010). Merriam-Webster dictionary. Springfield, MA: Merriam-Webster, Inc.
National Immigrant Justice Center. (2010). Immigration and Customs Enforcement’s detention reforms need more alternatives, fewer jails. Retrieved November 12, 2012, from www.immigrantjustice.org/resources policy/nijcpolicybrief/nijcpolicybrief.html.
Orange County Grand Jury. (2010). Is the juve-nile detention alternatives initiative working? Retrieved November 12, 2012, from www.ocgrandjury.org/pdfs/juvdetentionalt/juv-detention-report.pdf.
Pena, R. (2006). American Bar Association com-mission on immigration: Report to the House of Delegates. Retrieved November 12, 2012,
from http://new.abanet.org/immigration/publicdocuments/107e_detention.pdf.
Schriro, D. (2009). Immigration detention overview and recommendations. Retrieved December 6, 2012, from www.ice.gov/doclib/about/offices/odpp/pdf/ice-detention-rpt.pdf.
Siskin, A. (2004). Immigration-related deten-tion: Current legislative issues. Retrieved November 12, 2012, from www.fas.org/irp/crs/RL32369.pdf.
Danielle T. Harrington graduated from Wayland Baptist University in March 2004 with a Bachelor of Science in Criminal Justice. She earned her Master of Science in Criminal Justice Administration from Keuka College in May 2012. She began her career in the U.S. Air Force in September 1994 as an Information Manager stationed at Travis Air Force Base in California. In 1996, Ms. Harrington was transferred to Luke Air Force Base, Arizona, where she was hand-chosen to work in the Protocol Office, reporting directly to the base commander. In December 2001, Ms. Harrington left the Air Force to pursue other interests.

Law Enforcement Executive Forum • 2012 • 12(4) 121
Implementation of Alternative Delivery of Annual Training for Corrections OfficersSherry L. Hunter, MS, Federal Agent, Department of Homeland Security
IntroductionIn order to comply with human subject research requirements and protect the confidentiality of the facility and participants involved, pseudonyms were created for the correctional facility and the contract corrections firm that manages it.
ABC Correctional (ABC) is a private contract corrections and security firm that operates all detention services at XYZ correctional facil-ity (XYZ), an over 600-bed medium security facility owned by the federal government. Currently, there are over 200 ABC employ-ees working at XYZ. The formal system of annual training for officers currently in effect takes place for one work week each year, with employees being relieved of their duty posts for one week to attend refresher training. With the exception of defensive tactics, all training is instructor-led and classroom-based. Offi-cers are trained in the use of defensive tactics, deadly force, handcuffing, and escort proce-dures. Prevention of sexual harassment, evac-uation routes, report writing, and key control, among other duty-related topics, are aspects also included in their training. This research examined the development of alternate train-ing delivery methods for annual inservice training as a way to accommodate different learning styles and to deliver knowledge and skills more efficiently. All defensive tactics portions of the training are conducted in a hands-on format in a gymnasium environ-ment teaching psychomotor skills; however, the remainder of the training is conducted in a classroom environment led by an instructor who is a fellow officer.
The deficit with such a training format is not that the information is not relevant but, rather, that the necessary knowledge and skills are
delivered in an inefficient manner that pre-vents knowledge capture, retention, and application. ABC’s current method of train-ing is primarily focused on an instructor-led, lecture-based classroom environment that is subject-centered. Research supports that not all individuals learn in the same way or even at the same rate (Christensen, 2008). While one officer may indeed learn best from pas-sively listening to a teacher about key control, he may not absorb information at the same level by having to lead a small group in a case study about an insubordinate prisoner, with the teacher acting only as facilitator. Another officer may require a hands-on experience to truly gain a skill such as handcuffing or escort procedures, but he or she may not retain the needed proficiency if escort procedures were taught in an online format outside of the class-room environment. The issue then is whether or not the current classroom training is effec-tively reaching all 200-plus officers. Alterna-tives to the current teacher-led format must be incorporated in order to cover as many of the varying methods of learning as there are within the ranks of ABC officers.
Studies of learning in the workplace reveal that the attention span of individuals in a training environment is extremely short. Therefore, a format of instruction that lasts eight hours a day for a full week will necessarily exceed the officers’ attention for the duration of the training program. This directly correlates to the effectiveness of the training (Christensen, 2008). Officers who lose interest and cannot remain attentive are unable to retain the skills necessary for the job. Also at issue in regards to the weeklong format is the concept that those in training need time to process the informa-tion they have just learned. Having one block of instruction right after the other does not

122 Law Enforcement Executive Forum • 2012 • 12(4)
allow officers time to absorb what they have been taught. The format certainly does not allow them to apply what they have learned while on the job either. In a typical day, a PowerPoint© presentation would be given on key control, evacuation routes, blood-borne pathogens, and the use-of-force policy, with handcuffing techniques in the afternoon. Ide-ally, officers would see the presentation on evacuation routes and then immediately be able to incorporate a real walkthrough and evacuation drill—not directly move on to the next topic. The duration of each block of instruction and the amount of time between each block needs to be incorporated into a delivery plan for annual training that factors in the attention span and information process-ing of the officers.
The hypothesis for this research study was that an alternative delivery method to the cur-rent annual training program at XYZ would prove more viable for addressing the mul-titude of ABC officer learning styles. Based upon the hypothesis, the researcher devel-oped two major research questions:
1. What alternatives to the current training program exist based on individual learning styles of the current staff?
2. What is the best delivery methodology for those alternatives at XYZ for the current staff?
The research questions were directly related to the hypothesis because the present deliv-ery method presumes that all officers learn best in a classroom environment in a tradi-tional training setting. This researcher was required to first establish that assumption as incorrect by exploring the ABC employees’ learning preferences as well as to discover to which alternatives to the training program they would respond best. The second research question was required for this researcher to determine delivery methodology for the alter-natives provided in Research Question 1.
The history of the problem is that ABC has not implemented a multifaceted approach
to conducting its annual refresher training. Contemporary learning studies have proven that individuals acquire knowledge and skills by different means and methods, and many organizations have taken this research into account when designing training programs (Blanchard, 2010). Differentiated instruction and Train-the-Trainer programs are a sam-pling of commonplace learning concepts and formats implemented in both the corpo-rate world as well as in the education field (Merrill, 2008). Differentiated instruction, or varying teaching methods, is relied upon in classrooms for students of all ages, and Train-the-Trainer formats in which fellow employ-ees learn to train their peers are increasingly popular in the corporate world. ABC’s current program is one dimensional, however, with its core focus on passive listening and usage of the same PowerPoint© presentations year after year. Blocks of instructions and topics are identical to those taught the year prior, with-out any variation or contemporary revision. Many segments of instruction are broader than they are in-depth as well. Basic descrip-tions are given, and specific scenarios and/or simulations involving fire evacuations, key control, or prisoner riots are never utilized.
The background of the problem is largely eco-nomical in nature. In general, training is cost prohibitive due to overtime pay; therefore, the current structure in place is designed to work within an officer’s normal workweek. This creates no additional financial burden on ABC. Also, in order for ABC to maintain its contract with XYZ to operate the facility, cer-tain requirements must be met. Forty hours of annual training is the standard set by XYZ for ABC officers. The current training program of one solid week of instruction is indeed the simplest way for ABC to meet that standard, but it is not the most effective.
The need for proficient and properly trained corrections officers is of the utmost impor-tance, both for the prisoners in custody and the officers themselves. ABC employees are responsible for the safety and security of incarcerated individuals; they have the ability

Law Enforcement Executive Forum • 2012 • 12(4) 123
to use deadly force should the need arise and any lack of judgment in this area will be of sig-nificant legal liability for the employee and the company. Organization and proper reporting of incidents ensure the facility operates in an efficient and safe manner. All these aspects of the corrections officer position are covered in annual training, but this training needs to be delivered in a manner that ensures the maxi-mum absorption by the majority of officers. In the field of corrections, mistakes cannot only be costly, but deadly. Effective training is the only way to prevent them.
Literature ReviewThe actual manner of how individuals learn is a complex and multilayered developmen-tal process. Similarly, the manner in which one person approaches a learning situation or task may be completely different from the next person, all of which have an impact on performance and the successful achievement of learning outcomes (Cassidy, 2004). As such, countless styles and theories have been cre-ated as a means to understanding the process. Educators, trainers, and anyone who is in a position to instruct needs to be privy to the multitude of learning styles that exist as well as the specific ones applicable to their particu-lar group of students in order to effectively deliver knowledge and skills. Ascertain-ing learning style is the main component to determining successful instruction. Successful instruction will then lead to a proficient and competent workforce in any organization.
Learning Styles
Just as no two individuals are alike, neither are the methods by which they perceive either their environment or information in it. This concept is relatively contemporary, however. In traditional learning environments, intelli-gence was thought of as linear and measur-able by IQ tests. If one were to score poorly on such a test, then it meant he or she was simply not as smart as an individual that scored well (Abdallah, 2008). Research over the last century has proven otherwise. The idea that humans
have a wide variety of cognitive abilities and, thus, are able to absorb knowledge differ-ently, can best be summed up by the Multiple Intelligences (MI) Theory championed by Howard Gardner in the late 20th century. MI revolves around the concept that individuals have strengths and weaknesses in intellectual ability; and because one person may excel in a particular task over another does not imply greater intelligence, it simply can imply a dif-ferent grasp of the knowledge (McKethan, Rabinowitz, & Kernodle, 2010). MI incorpo-rates a series of eight ways to process knowl-edge or intelligences: (1) spatial, (2) linguistic, (3) logical-mathematical, (4) bodily-kines-thetic, (5) musical, (6) interpersonal, (7) intra-personal, and (8) naturalistic (Gardner, 1983). A spatial learner perceives visual information and learns by creating mental images whereas a linguistic learner uses language as a means of remembering information. These individuals use spoken and written words as well as read-ing to absorb information. Powers of observa-tion and deduction, as well as the capacity to analyze problems logically, are components of those who have a logical-mathematical intel-ligence. A bodily-kinesthetic approach to learn-ing encompasses using one’s body to problem solve or carry out a skill via movement. Those who communicate and understand through sound are indicative of a musical intelligence. This learning style is structurally parallel to linguistic intelligence in its use of language. Interpersonal learners prefer direct interaction with others as these individuals can recognize, perceive, and cooperate with the desires and intentions of others. Inversely, intrapersonal intelligence incorporates self-reflection and the capacity to understand oneself as a means of learning. Lastly, those who can recognize, categorize, and draw upon features within their environment are deemed to be natural-istic learners (McKethan et al., 2010; Yesil & Korkmaz, 2010).
Yesil and Korkmaz (2010) stated these learn-ing styles are the main variables that influ-ence learning and, thus, are the basic compo-nents to providing instruction and delivering training. Moran, Kornhaber, and Gardner

124 Law Enforcement Executive Forum • 2012 • 12(4)
(2006) stated the learning styles are not an edu-cational policy but, rather, an explanation of how the human mind processes information. If information is to be taught effectively, each student’s method of learning, or intelligence, must first be factored in. Only by matching the teaching style and delivery method to the way in which an individual processes knowledge can successful learning take place. MI repre-sents a complete shift away from the one size fits all mentality of a more traditional teaching approach.
Alternatives for Training
The concept that there are multiple intelli-gences and multiple ways to absorb a partic-ular skillset, along with the rapid growth of technology, has led to a variety of classroom alternatives becoming available to students. Similar to learning styles, it is often not just one type of training that an individual prefers but a blend of types depending on the topic. The following are some training alternatives.
Lecture
The lecture format represents the most tradi-tional form of delivering knowledge to learn-ers. A lecture traditionally follows a layout of an introduction and purpose, followed by the logically sequenced lessons to be learned, and concluded by reiterating the key points of the topic. A lecture format works best for the general understanding of a topic. Utilizing this format, individuals can absorb knowl-edge if it is a limited amount of material given over a short period of time (Blanchard, 2010; McKethan et al., 2010). Communication within the lecture may be one way, from the instruc-tor who talks to the learner who passively listens and takes notes, or it may be interac-tive, with the students and teacher actively engaged in discussion throughout the presen-tation. Fay (1988) asserts an interactive lecture layout is more desirable because it will allow learners to become more motivated and inter-ested when given the chance to participate.
Subject Matter Experts
The use of subject matter experts (SMEs) in training environments is a popular choice in today’s development efforts. SMEs are true specialists on the matter they are teaching. They are completely familiar with the ins and outs of their field as well as the current research surrounding it (Blanchard, 2010). Additionally, according to Christensen (2008), SMEs need to be excellent instructors. When it comes to training others, it is not enough for a person to be an expert; he or she must also be able to effectively deliver that knowledge. Learners often prefer to know they are being taught by an expert as it lends credibility to the topic at hand (Trautman & Klein, 1993). The downside of using SMEs in any training environment is the prohibitive cost, particu-larly if a wide range of topics are required.
E-Learning
Web-based training, or e-learning, has become more and more prevalent in the training envi-ronments of today’s workforce because of the rapid development of technology. Any com-bination of text, video, audio, chat rooms, or interactive assessments can be utilized through access to either an organization’s intranet or the internet (Moller, Forshay, & Huett, 2008). Allowing employees to take Web-based classes at their own pace will reduce the amount of time spent learning and may reduce the boredom and daydream-ing that can often occur in a long classroom session. If the learner controls his or her own progress, the need to sit through an entire two-hour block of instruction may be reduced. Costs associated with travel to a training site are also avoided. E-learning has the potential to provide complete instructional consistency to all those who utilize it as well. The issue of various instructors emphasizing one con-cept over another is eliminated. Web-based training can also provide a safe environment to learn hazardous tasks through simulations and scenarios (Welsh, Wanberg, Brown, & Simmering, 2003).

Law Enforcement Executive Forum • 2012 • 12(4) 125
E-learning has two main negative side effects. Group discussions on the topic and the abil-ity of the instructor to monitor, facilitate, or provide reinforcement are absent. The learner is forced to absorb the knowledge and skills being taught without any interaction or feed-back. Also, in simulated scenarios, the human element is lacking (Moller et al., 2008). Atti-tudes and emotions, of particular importance to the field of law enforcement and in dealing with others on a regular basis, are not present. For some scenarios, face-to-face instructionand interaction just works best.
Case Study
An ideal way to simulate a strategic decision-making situation faced by an individual or anorganization is through the case study. Accord-ing to Einsiedel (1995), case studies usuallyinvolve trainees being given key elements toan issue and then being asked to respond to aset of questions or objectives. A case study canbe simple with a single problem, or it can belong and complex with a multitude of obsta-cles. They can require a solution to the issuebased on the learner’s current knowledge andexperience, or they may require further infor-mation gathering beyond what was providedin the synopsis. Case studies can and shouldinvolve both real and hypothetical problemsfaced by the organization in question.
More importantly, with case studies, theinstructor takes on the role of facilitator, focus-ing not on incorrect responses but, rather, onthe appropriate use of concepts and principles to discover applicable solutions (Einsiedel,1995). Case studies can be either learner-cen-tered or instructor-based; since the majority ofcase studies in law enforcement are individu-alized, the student necessarily finds him- orherself striving to cooperate and reach a group consensus. The problem-solving nature of thecase study forces individuals to think criti-cally, communicate persuasively, and appre-ciate opposing viewpoints while reachingagreement (Fay, 1988). The case study methodin a training environment most closely paral-lels what an individual will face while on the
job; hence, it represents an extremely viable training alternative.
Role Playing
Role playing is a common training alternative in that it gets learners out of the classroom environment and usually revolves around the simulation of a single event or situation; it also represents a safe and controlled method of instruction. Trainees are given a general description of a situation, their roles, the prob-lem involved, and then are required to act the scenarios out. One or more group members role play, while the rest observe. These indi-viduals will then analyze the interaction and highlight the negative and positive points. Through instructor and group critique, train-ees are able to not only develop insight into their own actions and behaviors in a given situation, but they can gain skills and knowl-edge while observing other’s actions in the same circumstances (Wohlking & Weiner, 1981). Role playing is geared primarily toward communication skills, interpersonal skills, and conflict resolution. It also helps develop a trainee’s attitudes toward situations they may face. Significantly, role play fosters real-time decisionmaking as well, a skill utilized on a daily basis.
The drawbacks to role playing include the incapability or hesitancy by some individuals to publicly and negatively critique a fellow employee, particularly in a group setting. Also, by having to stop after each scenario so that the group can analyze the outcome, a sense of continuity is lost and the scenarios may seem artificial (Blanchard, 2010). Despite these, role playing represents the greatest array of real-world interactions that train-ees may face when no longer in a training environment.
Delivery Plan for Training
If learning is a complex process of responses to variables within an individual’s environment, then training can be considered a system-atic process designed to meet those learning

126 Law Enforcement Executive Forum • 2012 • 12(4)
objectives. The notion that individuals learn in a multitude of ways, and even prefer dif-ferent methods of being taught, has led to the creation of multiple training programs and formats, particularly as they relate to the corporate and professional workforce. For instructors, it is not enough to simply teach material, they must be able to recognize the applicable learning styles of the individuals in the group they are trying to instruct in order to appropriately match the teaching style and type of instruction given.
Differentiated Instruction
Differentiated instruction represents a prime example of an alternate teaching style. The probability that every individual in a par-ticular group of learners has the same learn-ing style is nonexistent; therefore, instruction must be differentiated, or spread out, among a variety of teaching styles to meet every-one’s needs. Huebner (2010) stated that with differentiated instruction the teacher meets the learners’ styles and levels rather than expecting the learner to adjust to the teach-er’s method of instruction. Once a learner’s experiences, interests, and level of commit-ment are appropriately assessed, the instruc-tor can then modify the content of the mate-rial taught, the process of how they learn it, and the demonstrated mastery of the mate-rial. Differentiated instruction is the antith-esis of a one size fits all mentality in regards to instruction. In that sense, differentiated instruction is a form of the MI Theory itself (Levy, 2008). Some aspects of implement-ing differentiated instruction include using assessments throughout the teaching process. A check on knowledge should be done prior to and during instruction as a way to extend learning rather than to just measure it at the end of a topic (Hall, Strangman, & Meyer, 2009). No block of instruction should have a single structure or activity to it either. Tasks need to be varied with instruction time. A bal-ance between teacher-assigned and student-selected topics should be reached as well to achieve a well-adjusted classroom environ-ment where learners have choices.
Train-the-Trainer
The Train-the-Trainer concept is a delivery method of training that consists of send-ing one or two people from an organization through training so that they may in turn teach the remainder of individuals in a group who require instruction in a particular area. The method was developed as a direct response to the expense and time it takes to train all indi-viduals within an organization (Olson, 1995). Train-the-Trainer is extremely effective for cut-ting the costs associated with hiring an outside individual or agency to conduct training, and whatever skill or knowledge is learned by a few can then be leveraged to apply to the rest. According to Merrill (2008), the downside of the Train-the-Trainer method is that the qual-ity of instruction once applied to the remain-der of the group may be poor. An individual may successfully complete training but may be unable to recognize learning styles and/or have little teaching ability themselves. When it comes time to train others, the necessary skills and knowledge may not be conveyed in the best manner.
A review of the history of training conducted specifically in the field of law enforcement and corrections revealed a tendency to follow a traditional teacher-led approach to learning. A lecture or presentation is usually followed by a test to demonstrate aptitude and adher-ence to the standards (Hundersmarck, 2009). Reliance on training films was and is still prev-alent. Core curricula predominantly focus on standard topics that include defensive tactics, firearms, report writing, and ethics to name a few (Birzer, 1999). While these are paramount topics to cover, officers, particularly correc-tions officers, spend the majority of their time interacting with prisoners. Traditional law enforcement training has been and still is very much a command style of teaching then that is subject-based with an emphasis on mastery of skills.
The ideal scenario for training within law enforcement would incorporate an officer’s past experiences for more of a problem-solving

Law Enforcement Executive Forum • 2012 • 12(4) 127
approach to learning. Instead of classroom instruction on the mechanics of police work, critical thinking skills and a self-directed, learner-centered approach must be promoted to deal with the current realities of the profes-sion (Hundersmarck, 2009).
The concept of varying intelligences and cogni-tion has replaced the behavior-based approach to learning that dominated the field of educa-tion and training of times past; MI Theory is now generally accepted in the field of educa-tion and in research relating to how individu-als learn. Training alternatives and delivery methodology have equally grown then in proportion to the idea that different people learn in different ways. The authoritarian and strict knowledge approach to the traditional learning of the past was concerned more with delivering knowledge and skills than with understanding a learner’s experiences and preferences. Finally, with both learning and training, researchers comprehend that it is more about the process than the content. Most organizations now realize that knowledge is an asset that needs to be managed cleverly. In regards to the past, present, and future of workplace training, specifically law enforce-ment training, the literature review supported the use of alternative methods of presenting topics as well as alternative implementation plans other than the traditional instructor-led classroom format. An informed instruc-tor, one who understands learning styles, can make the difference between an individual forgetting what he or she was taught the moment he or she walks out of the classroom to actually having a grasp of a topic or skill-set. The literature supports the hypothesis of this paper that an alternative to a teacher-led manner of instruction may be more effective when an individual’s learning style is taken into account. Individuals today, especially in corrections, are problem solvers and trouble-shooters with mandatory interpersonal skills; as such, they need to be trained accordingly.
The literature has led to a series of three constructs that directly relate to the identi-fied organizational issue. In examining the
contemporary literature, three areas of exami-nation were identified as key to answering the question posed in the hypothesis of this research project:
1. Learning Styles – The need to examine the preferred learning preferences of ABC employees
2. Alternatives to Training – The need to exam-ine the preferred alternatives to the instruc-tor-led classroom approach to annual training
3. Delivery of Training – The need to match learning styles with alternatives to create a viable training program
The constructs were identified based on the foundational and stable assumptions of learn-ing in general and Gardner’s MI Theory. Both Constructs 1 and 2 were combined under Research Question 1 and were necessary to determine what, if any, changes needed to be made to the current training structure in place based on preferences. Learning styles and alternatives of training must then be matched in order to develop the best model for deliv-ery of training in a method that suits the offi-cers employed by ABC.
MethodologyAnnual training for ABC officers is proficient; however, the issue remains whether or not the current delivery method in place for this training is effective and sufficiently delivering the knowledge and skills necessary. Alterna-tives to the delivery method that match the officers’ varying learning styles may prove more beneficial.
The research methodology consisted of a cross-sectional analysis of corrections officers employed by ABC who worked at the XYZ correctional facility. The research population consisted of 75 corrections officers (31% of the available population employed at XYZ). Infor-mation and opinions were drawn based on the categories and variables of this representative subset via a data collection instrument. The goal of such quantitative and qualitative data

128 Law Enforcement Executive Forum • 2012 • 12(4)
collection was to discover correlations and the prevalence of specific factors in relation to trends discovered in the literature review.
This researcher developed the data collection instrument and utilized questions that were linked to the hypothesis, two main research questions, and literature in order to explore the topic within the affected organization. The data collection instrument included 25 quantitatively based questions using a stan-dard Likert scale to measure individual opin-ion-based data, as well as three qualitatively based questions to provide the respondent with an opportunity to offer individual opin-ions regarding the issue explored. No demo-graphic information was collected due to the small subset of the available population that was utilized. The instrument was divided into two separate and distinct constructs as follows:
1. Learning styles based on Gardner’s MI Theory and alternatives to training
2. Alternative training implementation
As with any research, there were certain limi-tations to this data collection plan. For exam-ple, (1) using a cross-sectional analysis rather than a population or group analysis may not have provided an accurate picture of the entire spectrum of learning styles or teaching meth-ods within ABC; (2) since no demographic information was collected, an accurate pic-ture of learning preferences between older, more experienced participants and those new to the field may not have been provided; and (3) the use of descriptive statistics as opposed to inferential statistics offered an excellent starting point when developing alternatives to delivery of training at XYZ, but they may not be statistically generalizable throughout the profession of corrections as a whole.
ResultsThe outcome clearly paralleled the research and literature review regarding learningstyles and training delivery methodologies. Overwhelmingly, the results supported the
hypothesis that annual refresher training for ABC Correctional does not necessarily accom-modate the variety of ways officers learn nor deliver the required knowledge and skills in the correct format.
Response Rates and Population Analyses
With part-time employees, the total ABC offi-cer population fluctuated between 230 and 250. The researcher distributed 75 data col-lection instruments to a subset of the ABC staff during the day shift. That subset of 75 represented approximately 31% of the entire ABC officer population. Of the 75 instruments distributed, a total of 40 were returned (a 53% return rate). No demographic information was collected in the instrument.
Reliability of the Measures
Since a high return rate was enjoyed, cumula-tive statistics are generalizable for the entire population; however, since the 53% return rate was for the subset and not the entire ABC staff, the results may only be representative of the limited population examined and may not be reproducible for implications to the entire population.
The hypothesis was that annual refresher training for ABC corrections officers in its current format does not take into account the variety of ways individuals learn and fails to deliver the necessary knowledge and skills in an efficient manner. Two research questions were asked in order to test the hypothesis. The results are delineated as follows:
Statistical Results of Research Question 1: Learning Styles and Training Alternatives – The researcher examined the preferred learn-ing styles and alternatives to annual train-ing of the research population to determine the most amenable preferences of knowledge acquisition. The literature review revealed a body of research that identified with the concept that individuals learn best in a vari-ety of ways. In the analysis of the hypothesis for this research project, learning styles were

Law Enforcement Executive Forum • 2012 • 12(4) 129
identified utilizing the eight constructs of Gardner’s MI Theory. This was to ascertain whether or not individuals truly learn out-side of a traditional, teacher-led classroom environment, which is the current format for ABC annual training. Also, a finite number of training alternatives was provided within the data collection instrument. These were identi-fied from the literature review and within the scope of available ABC resources. The oppor-tunity existed for the respondents to list any additional alternatives in the qualitative data portion of the data collection instrument.
With the exception of three learning styles, the majority of constructs of MI Theory all rated mean scores at the agree level. Construct A, spatial learning, enjoyed a moderate agree level (4.13). Linguistic learning, Construct B, garnered a similar agree level (4.05) as did Construct D, bodily-kinesthetic learning style at an agree level of 3.96. Constructs E and F dealt with musical learning and interpersonal learning, respectively. They both represented the highest and the lowest while still being at the agree level, with Construct E at an agree level of 3.68 and Construct F at agree level of 4.23.
Three of the eight constructs presented them-selves at the mean neutral level. They were Construct C, logical-mathematical learning, at the neutral level of 3.38; Construct G, intra-personal learning, at the neutral level of 3.30; and with the lowest neutral response of all the learning styles (3.15), Construct H, natu-ralistic learning. Many individuals learn and develop skills through a logical-mathemati-cal approach, so Construct C, with a neutral rating, postures an interesting anomaly. The conclusion can be reasoned because the ques-tions of Construct C dealt with report writing following a prisoner incident and whether or not further investigative action was required beyond what an officer witnessed. While in any given situation an individual can gener-ally be assumed to have used deductive and logical reasoning to reach a conclusion; in regards to XYZ report writing, ABC officers are necessarily only required to write what they
themselves witnessed. They are not required to use deductive reasoning in report writing. This most readily explained the irregularity of the Construct C rating at the neutral level. Question 5 within Construct C also appreci-ated the highest standard deviation (1.43) as further proof to the odd nature of the question posed. The analysis of Research Question 1 is depicted in Figure 1 in the Appendix.
In regards to available training alternatives, options in the data collection instrument also encompassed in Research Question 1 included lecture, SMEs, e-learning, case study, and role playing questions. Except for one, these all enjoyed a mean score at the agree level. The question dealing with lecture appreciated a mean of agree at 3.63, while SMEs garnered the highest level of agreement at 4.48. The question involving case study acquired a mean of agree level at 4.08, while role play-ing fared similar at an agree level of 4.35. Only e-learning collected a neutral mean (3.40). Interestingly, the lecture format is the current methodology for delivering training at XYZ, yet it rated at the agree level (3.63), inferring that it is an acceptable modality for meeting the various learning styles of the respondents.
Also, the alternative with the highest rate of agreement, SMEs at the mean agree level of 4.48, represents the substitute that is the most costly to organizations, while e-learning has the potential to reduce costs and save agencies time and money, more so than any other cur-rent alternative to classroom instruction. That option scored the lowest with a neutral level of 3.40. Officers do not have the desire to take Web-based classes, whether that be during the work day or at home at their leisure. The anal-ysis is depicted in Figure 2 in the Appendix.
Statistical Results of Research Question 2: Deliv-ery Plan for Training – The researcher exam-ined the interest levels of different delivery plans to determine the integration capability of the alternatives to training encompassed in Research Question 1. For delivery, it was assumed that there were no limits, finan-cially or otherwise, to the possibilities for plan

130 Law Enforcement Executive Forum • 2012 • 12(4)
implementation by ABC. All three delivery plan options rated cumulatively at the agree level (3.76). Construct A dealt with differen-tiated instruction and enjoyed the highestmean (4.02). Construct B dealt with the imple-mentation of a Train-the-Trainer program and reaped a very low agree (3.53). Construct C, which dealt with an alternate time frame for conducting training, garnered an agree (3.72).
Construct B responses represented a signifi-cant contradiction, not only within the con-struct itself but against Research Question 1 as well. When asked whether certain courses would best be taught by a professional third party, an SME rather than a fellow officer who was trained to teach, the officers had a neu-tral response (3.03). This topic also received a standard deviation of 1.25. Officers were not receptive to being taught by a fellow officer. However, respondents strongly agreed (4.28) that they should have the opportunity tobecome a trainer themselves if they wanted. Officers preferred to not be taught by a fellow officer but yet felt they should have the oppor-tunity to fill that role. Since the data from Research Question 1 showed a high interest in the use of SMEs as an alternative to training, it is contradictory that, when implemented as a delivery plan, the use dropped to a near neutral rating. The analysis of Research Ques-tion 2 is depicted in Figure 3 in the Appendix.
The data analysis revealed predominantlyconsistent and corroborating results fromrespondents about their annual refresher train-ing. The first series of questions in the collec-tion instrument measured the research popu-lation’s preferred learning styles. This was included to determine whether or not a tradi-tional classroom environment was best suited to the individual officers. Of the eight learning styles delineated by MI Theory, spatial, lin-guistic, bodily-kinesthetic, musical, and inter-personal all rated at the agree level. Logical-mathematical, intrapersonal, and naturalistic learning styles rated at the neutral level. The most prevalent type of learning style favored by the respondents was interpersonal learning
at 4.23, while the least preferred style was nat-uralistic at a neutral level of 3.15.
The first series of questions also explored alternatives to the current format of a one-week, 40-hour classroom training session. Lecture, SMEs, case study, and role playing all rated at the agree level with SMEs rating as the greatest preference among all respondents with 4.48. Only e-learning rated at the neutral level with 3.40. The data are interesting since a thorough literature review revealed that e-learning was the up and coming modality for delivering training among agencies and organizations nationwide (Welsh et al., 2003).
Respondents were then asked their opinion on training delivery plans if implemented at the XYZ. The analysis showed agreement on all three delivery plans to include differenti-ated instruction, a Train-the-Trainer program, and an alternate time frame and format for the annual training. Differentiated instruc-tion, that which attempts to reach the great-est number of learners and accommodate the greatest number of learning styles, rated highest at the agree level with 4.02. A Train-the-Trainer program garnered the lowest mean, although still at the agree level, with 3.53. These data correlate with the high agree response garnered from Research Question 1 related to SMEs. Individuals who preferred to be taught by an SME would necessarily not want a fellow officer to teach them in a Train-the-Trainer program.
Overall, the data analysis indicated that respondents were very receptive to a change in their current training program. While no single question garnered a strongly agree response, the overwhelming majority were at the agree level. The current modality of train-ing, a one-week, 40-hour session that is pre-dominantly instructor-led, is not the preferred method of receiving the required knowledge, skills, and abilities necessary to be a profi-cient corrections officer at the XYZ. With the exception of two anomalies—(1) e-learning as an alternative to the classroom environ-ment, which the literature strongly supports,

Law Enforcement Executive Forum • 2012 • 12(4) 131
and (2) of wanting to be taught by a profes-sional SME as an alternative while still having the ability to become a trainer themselves as a delivery method, officers made it apparent that they would like to be taught in a way that meets their differing learning styles and offers challenges and rewards delivered in a way that cannot be matched by the traditional classroom instructor-led style.
Since the statistical data supported the litera-ture review, the broader implications are that a change to current training programs can and should be accomplished beyond just the XYZ facility. The statistics go beyond law enforce-ment agencies as well and can be incorpo-rated in any number of organizations. The notion that people learn in a variety of styles and need to be taught in a variety of ways is not specific to ABC employees but, rather, is a universal concept.
Discussion, Conclusions, and RecommendationsBased upon the culmination of the hypothesis as measured against the contemporary litera-ture findings and the results of the opinion-based data collected from the research popu-lation, the researcher found there was strong support for alternative methods of training as well as substitute modalities for delivering it. The hypothesis was that annual refresher training for ABC corrections officers in its current format does not take into account the variety of ways individuals learn and fails to deliver the necessary knowledge and skills in an efficient manner. Two research questions were asked in order to test the hypothesis. The results are delineated in the following subsections.
Testing Results of Research Question 1
The current format for ABC annual training consists of a predominantly lecture-based and instructor-led classroom approach. However, literature in the field of instructing and train-ing highlights the fact that not all individu-als learn best in a classroom environment or
even by an instructor-led approach. The field of multiple intelligences and varied styles of learning and acquiring skills is vast. This led to the creation of the first portion of the hypoth-esis that training was not in the proper format to meet the learning styles of all employees. An instructor-led approach could not be the best method to effectively reach everyone. Research Question 1, which encompassed alternatives to the current training program based on individual learning styles, was then developed using MI Theory to determine what other options besides the current format were feasible.
The analysis indicated that spatial, linguistic, bodily-kinesthetic, musical, and interpersonal learning all rated at an agree level. These methods of learning included alternatives to the classroom environment such as conduct-ing a walk-through of facility evacuation routes as opposed to simply viewing a map of them, or participating in a hands-on use-of-force model as opposed to it being described by an instructor. ABC officers also preferred interpersonal learning and case studies at a strong agree level (4.23) as a substitute to the instructor doing all the teaching. Only three constructs out of eight were at the neutral level. They included logical-mathematical, intrapersonal, and naturalistic learning. Ques-tions within each of these constructs related to working alone. Working and training outdoors ranked the lowest with a neutral response of 3.15 for naturalistic learning. Of significance, no alternatives to the traditional classroom environment rated at a disagree level, proving that individuals do have a multitude of ways in which they prefer to learn and be taught. This also serves to illustrate that the same PowerPoint© presentations given by an instruc-tor in a classroom environment year after year are not in proper alignment with the learn-ing preferences of the research population. As such, the statistical results from Research Question 1 form evidence-based support for the research question itself as well as for the first portion of the hypothesis.
132 Law Enforcement Executive Forum • 2012 • 12(4)
Testing Results of Research Question 2
Annual training is currently delivered in a 40-hour, weeklong program. ABC officers are required to leave their assigned posts for one week each year to satisfy the minimum requirements for training. The second por-tion of the hypothesis regarding the delivery method of the required knowledge and skills was established out of this current format. Similar to the literature on multiple learning styles, evidence has shown that individuals learn best when training is provided in a vari-ety of ways as opposed to an all-classroom environment. Research Question 2, which deals with alternative delivery methods for training based upon the preferred learning styles from Research Question 1, was then created.
The researcher found that all three delivery methods other than classroom-based instruc-tion, including differentiated instruction, Train-the-Trainer, and alternative time frames, rated at an agree level; particularly highest was differentiated instruction at a mean agree level of 4.02. ABC officers felt training should be broken up throughout the year as opposed to one solid week of instruction. Significantly, the need for instructors to check and assess how well an individual is grasping the skills throughout a block of instruction rather than just at the end rated at a high mean of agree (4.15). Such a training delivery method is a cornerstone to differentiated instruction. A one size fits all traditional classroom environ-ment will not suffice. As such, the statistical results from Research Question 2 form evi-dence-based support for the research ques-tion itself as well as the second portion of the hypothesis concerning delivery methods of training.
Testing Results of the Main Hypothesis
The statistical results from both Research Questions 1 and 2 supported both components of the hypothesis. Officers are getting trained; however, it is not in a manner which best meets all of the research population’s learning
styles. Officers want to learn hands-on; they want to be placed in real-time scenarios that they may face on the job; and, importantly, some can gain the necessary skillset best by getting out of a lecture-based classroom envi-ronment. The statistical evidence proves the current method of training does not take into account the varied ways in which individuals learn. Nor does the current method of deliv-ery convey the required training proficiently or effectively. The statistical evidence from Research Question 2 verifies that ABC officers would like the opportunity to apply what they have learned prior to being placed in the real environment; they would like the opportunity to be taught by SMEs or to role play rather than view the same PowerPoint© presentations year after year.
The null hypothesis was that annual train-ing for ABC officers in its current design of a 40-hour, weeklong lecture-based classroom environment is an acceptable and proficient method to effectively deliver training. This was rejected. The statistical data for alterna-tive learning styles and delivery methods were predominantly at the agree level, illus-trating that ABC officers desire something more than what the current training environ-ment is providing. The complete lack of a sta-tistical result of disagree on any alternative offered suggests that ABC officers are not sat-isfied with the current training format.
A corrections officer faces challenges that the average corporate white collar employee will never face. The safety and security of pris-oners, property, and fellow officers rest in the capabilities of each and every individual entrusted with that position. Real-time deci-sionmaking skills and communication are a must for any officer, and when placed in a dif-ficult position, all he or she will have to rely on is the training he or she has received. It is not enough that ABC meets the minimum standards required to maintain their con-tract at XYZ. The implications of this action research project are monumental in illustrat-ing the need for adaptation of training, both in

Law Enforcement Executive Forum • 2012 • 12(4) 133
style and delivery method. The current format is simply outdated and insufficient.
The project improvement plan and recom-mendations include a series of steps that ABC should consider for improving training:
1. Complete employee surveys to determine the preferred learning styles of each offi-cer so as to better identify strengths and weaknesses.
2. Conduct training by groups, according to learning style, so that the greatest number of officers are being instructed in the format that best meets their learning styles.
3. Implement new and varied training cur-riculum with alternative scenarios as opposed to relying on the same PowerPoint© presentations year after year. Conduct real-time fire drills, medical emergencies, and riots within the housing units whenever possible.
4. Conduct hands-on training and invest in SMEs whenever possible.
5. Change the design of training from a one-week format to four hour blocks of instruc-tion that occur all year long.
The recommendations for future research include the continued examination of this topic utilizing all employees of ABC Cor-rectional at XYZ, not just a percentage of the population. This will allow for a more thor-ough gauge of learning styles to confirm or refute the findings of the study. It is critical during training to reach the greatest number of students possible. More research should be conducted into how to effectively break up training into groups based on learning styles. It is ineffective to teach a group of officers an evacuation route by showing them a map of the facility if they are not visual learners. It is insufficient to teach a group of officers the use-of-force policy by scenario-based dem-onstration if they are not hands-on learners. Additionally, the results garnered from the research can and should be applied across the entire field of corrections. If training is all an officer has, then training should be the
paramount objective in order to produce a competent, proficient, and safe workforce.
ReferencesAbdallah, M. M. (2008, September). Multiple
ways to be smart: Gardner’s theory of mul-tiple intelligences and its educational impli-cations in English teaching and oral commu-nication [Online submission]. Retrieved November 14, 2012, from www.eric.ed.gov/PDFS/ED502634.pdf.
Birzer, M. L. (1999, July). Police training in the 21st century. FBI Law Enforcement Bulletin, 68(7), 16-19.
Blanchard, P. N. (2010). Training delivery methods. Encyclopedia of Business (2nd ed.). Retrieved November 14, 2012, from www.referenceforbusiness.com/management/Tr-Z/Training-Delivery-Methods.html.
Cassidy, S. (2004, August). Learning styles: An overview of theories, models, and measures. Educational Psychology, 24(4), 419-444.
Christensen, C. (2008). How do people learn? What organizations should do to create better train-ing programs based on modern learning theory. Los Angeles: Christensen Associates, Inc. Retrieved November 13, 2012 from www.scribd.com/doc/9386125/How-Do-People-Learn.
Einsiedel, A. A. (1995, August). Case studies: Indispensable tools for trainers. Training and Development, 49(8), 50-54.
Fay, J. (1988). Approaches to criminal justice train-ing (2nd ed.). Athens: Carl Vinson Institute of Government, The University of Georgia.
Gardner, H. (1983). Frames of mind: The theory of multiple intelligences. New York: Basic Books.
Hall, T., Strangman, N., & Meyer, A. (2009). Dif-ferentiated instruction and implications for UDL implementation: Effective classroom practices report. Wakefield, MA: National Center on Accessing the General Curriculum. Retrieved

134 Law Enforcement Executive Forum • 2012 • 12(4)
November 14, 2012, from http://aim.cast.org/learn/historyarchive/backgroundpapers/differentiated_instruction_udl.
Huebner, T. A. (2010, February). Differentiated instruction. Educational Leadership, 67(5), 79-81. Retrieved November 14, 2012, from http://web.ebscohost.com.library.keuka.edu/ehost/pdfviewer/pdfviewer?hid=8&sid=21ccfc3e-b8ea-491a-8af7-3229779fb41b%40sessionmgr4&vid=33.
Hundersmarck, S. (2009, August). Police recruit training: Facilitating learning between the academy and field training. FBI Law Enforcement Bulletin, 78(8), 26-31. Retrieved November 14, 2012, from www2.fbi.gov/publications/leb/2009/august2009/police_recruit.htm.
Levy, H. M. (2008, March/April). Meeting the needs of all students through differenti-ated instruction: Helping every child reach and exceed standards. Clearing House, 81(4), 161-164. Retrieved November 14, 2012, from http://web.ebscohost.com.library.keuka.edu/ehost/pdfviewer/pdfviewer?vid=4&hid=122&sid=022ac2e0-79d0-42f2-8917-5f0fef996 ded%40sessionmgr104.
McKethan, R., Rabinowitz, E., & Kernodle, M. (2010, Fall). Multiple intelligences in vir-tual and skill instructional learning envi-ronments. Physical Educator, 67(3), 156-168. Retrieved November 14, 2012, from http://web.ebscohost.com.library.keuka.edu/ehost/detail?hid=108&sid=21ccfc3e-b8ea-491a-8af7-3229779fb41b%40sessionmgr4& vid=25&bdata=JnNpdGU9ZWhvc3QtbGl2ZQ%3d%3d#db=aph&AN=55232790.
Merrill, S. (2008, June). Training the trainer: 101. T + D, 62(6), 28-31. Retrieved November 14, 2012, from http://web.ebscohost.com.library.keuka.edu/ehost/pdfviewer/pdfviewer?hid=104&sid=4307cd76-24d9-4934-82a2-c553cb63123c%40sessionmgr15&vid=6.
Moller, L., Forshay, W. R., & Huett, J. (2008, May). The evolution of distance education: Implica-tions for instructional design on the poten-tial of the Web. Tech Trends: Linking Research and Practice to Improve Learning, 52(3), 70-75. Retrieved November 14, 2012, from http://web.ebscohost.com.library.keuka.edu/ehost/pdfviewer/pdfviewer?hid=9&sid=21ccfc3e-b8ea-491a-8af7-3229779fb41b%40sessionmgr4&vid=15.
Moran, S., Kornhaber, M., & Gardner, H. (2006, September). Orchestrating multiple intelligences. Educational Leadership, 64(1), 22-27. Retrieved November 14, 2012, from http://web.ebscohost.com.library.keuka.edu/ehost/detail?hid=108&sid=21ccfc3e-b8ea-491a-8af7-3229779fb41b%40sessionmgr4&vid=23&bdata=JnNpdGU9ZWhvc3Q tbGl2ZQ%3d%3d#db=aph&AN=22288318.
Olson, D. (1995). Train the trainer. Portland, OR: Cunningham & Cunningham, Inc. Retrieved November 14, 2012, from http://c2.com/cgi/wiki/changes.cgi?TrainTheTrainer.
Trautman, S., & Klein, K. (1993, July). Ask an expert. Training and Development, 47(7), 45-47.
Welsh, E. T., Wanberg, C. R., Brown, K. G., & Simmering, M. J. (2003, December). E-learn-ing: Emerging uses, empirical results and future uses. International Journal of Training and Development, 7(4), 245-258. Retrieved November 14, 2012, from http://web.ebscohost.com.library.keuka.edu/ehost/pdfviewer/pdfviewer?hid=9&sid=21ccfc3e-b8ea-491a-8af7-3229779fb41b%40sessionmgr4&vid=20.
Wohlking, W., & Weiner, H. (1981, June). Struc-tured and spontaneous role-playing. Train-ing and Development Journal, 35(6), 111-119.
Yesil, R., & Korkmaz, O. (2010, Fall). Reliabil-ity and validity of the multiple intelligence perception scale. Education, 131(1), 8-32.
Law Enforcement Executive Forum • 2012 • 12(4) 135
Sherry L. Hunter, MS, is a law enforce-ment officer working in a correctional facility. She has served in various posi-tions within the organization for over nine years, including as a unit officer, a transport officer, and as a member of the Intelligence Team. She is also an adjunct faculty member at Bryant and Stratton College. She served eight years in the U.S. Army Reserves. She has earned a Bachelor of Arts degree in History from the University at Buffalo and a Master of Science degree in Criminal Justice Administration from Keuka College.

136 Law Enforcement Executive Forum • 2012 • 12(4)
Appendix
Figure 1. Learning Styles
33
Figure 1: Learning Styles

Law Enforcement Executive Forum • 2012 • 12(4) 137
Figure 2. Alternatives to Training
34
Figure 2: Alternatives to training

138 Law Enforcement Executive Forum • 2012 • 12(4)
Figure 3. Delivery Plan for Training32
Figure 3: Delivery Plan for Training
Sherry L. Hunter, M.S.
Keuka College
Sherry L. Hunter, M.S. is a law enforcement officer working in a correctional facility. She has
served in various positions within the organization for over nine years, to include unit officer,
transport officer, and as a member of the Intelligence Team. She is also an adjunct faculty
member at Bryant and Stratton College. She served eight years in the United States Army
Reserves, and also possesses a Master of Science Degree in Criminal Justice Administration
from Keuka College as well as a Bachelor of Arts Degree in History from the University at
Buffalo. Agent Hunter may be reached at [email protected].
Contact Information
Sherry L. Hunter, M.S.
Keuka College
4895 Schurr Road
Clarence, New York 14031
Phone: (716) 432-1578
Email: [email protected]

Law Enforcement Executive Forum • 2012 • 12(4) 139
Are Judges Under Stress? A Case of Slovenia in the Contemporary Crime SocietyPeter Umek, PhD, Professor, Criminal Psychology, Faculty of Criminal Justice and
Security, University of Maribor, SloveniaMonica Guzman, Graduate Studies, Department of Criminology and Criminal Justice,
Weber State University, Ogden, UTJerneja Šifrer, Assistant Lecturer, Methodology and Statistics, Faculty of Criminal Justice
and Security, University of Maribor, SloveniaBojan Dobovšek, PhD, Vice Dean and Associate Professor, Criminal Investigation,
Faculty of Criminal Justice and Security, University of Maribor, Slovenia
IntroductionIt is common for those working in courtrooms to experience very high levels of stress, espe-cially judges given that they constantly make life-changing decisions and judgments. This stress directly and indirectly impacts many people in courtrooms and societies. The types of stressors they experience are more specific to the nature of their work as well as to other similar occupations (e.g., doctors and police officers). Due to public perceptions about these positions, judges may be reluctant to seek help from experts such as psychologists and or psychiatrists because they are expected to make sound judgments on a daily basis. Furthermore, they often worry whether or not they may be declared incompetent for work if they decide to seek professional help. Poten-tial side effects associated with stress may result in higher sensitivity and susceptibility to various psychological, behavioural, and physical problems.
Stress is an unavoidable consequence of this type of work. Because relations with people and the environment are changing (physically and socially), it is imperative for individu-als to maintain a healthy equilibrium. Some people are not always successful at balanc-ing high levels of stress. If there is a differ-ence between aptness and requirements, the balance in a human being is disrupted and harmful stress becomes dominant (Lazarus & Folkman, 1984).
Behavioural psychologist Richard Lazarus conducted well-known research within the area of psychological stress. His model is still utilized in many studies (Lazarus & Folkman, 1984). According to Lazarus, stress is not only a stimulus or response, it is primarily a process in which humans have an active role and can influence the effect of stressors with specific behavioural, cognitive, and emotional strate-gies. According to this model, we can explain why the same stressful situations affect indi-viduals more than others. In addition, the model provides a clear understanding of why someone in conflict situations remains calm, while in other situations tension significantly increases. The effect of stress largely depends on the judgment about the environmental and internal requirements and whether or not it exceeds an individual’s capacity to handle it. Lazarus (2007) assigned special roles to feel-ings that triggered stressful responses. He found that appropriate stress responses failed to occur when individuals did not realize that something was threatening them, therefore causing unhealthy or inappropriate adjust-ments to a dangerous situation. For example, a person may not know of a disease he or she has since it does not cause any pain.
Alojz Ihan (2004), a renowned immunolo-gist, defined stress as a full body reaction or an autonomic response to danger or threaten-ing situations. Threats of a social nature are prevailing, and failure to eliminate stressful situations prolongs them, creating irregular

140 Law Enforcement Executive Forum • 2012 • 12(4)
metabolic functioning and disturbing the psychophysical balance. An autonomous response clings, failing to resolve the stress-ful social situation. This imbalance raises a number of emotional states that are trying to restore balance within the body. In many cases, these neurotic adjustments contribute to repetitions of stressful reactions, which can be problematic in numerous ways. Some problems can be emotional (e.g., anxiety, con-cerns, fears, and/or obsessions), behavioural (e.g., eating disorders, misconduct, and/or compulsive behaviours), or addictive (e.g., frequent smoking; consumption of caffeine; and/or intake of alcohol, drugs, or other psy-choactive substances). Unresolved stress can often lead to depression that serves as a type of protection from the constant stress that is not being resolved constructively. These stressors may have distressing consequences in terms of judicial work, but they are not well-known.
There is a lack of research on stress among judges. Most of it has been conducted in the United States and some in Australia. It is believed that the causes of stress mentioned in foreign research cannot be fully correlated to Slovenia or Europe, even though most stress-ors are quite similar and comparable to the job functions of judges throughout the world. However, it is important to mention Slovenia’s descriptions are organized differently. There-fore, it is imperative to understand how simi-lar these stressors are and to what extent.
Based on previous research (Chamberlain & Miller, 2008; Miller & Richardson, 2006), a model was created dealing with the causes and consequences associated with stress among judges. The model assumes that judges are more often exposed to secondary stress. Signs of secondary stress are particularly found in those who deal with individuals who have experienced severe trauma (e.g., medical per-sonnel, police officers, counselors, therapists, and others). The following items are related to secondary stress: workplace burnout or job burnout (work-related burnout), exhaus-tion as a result of compassion (compassion fatigue), and vicarious trauma (vicarious
traumatisation). Furthermore, terms overlap to a large extent and can be used as an alter-native. This may lead to work burnout, which in turn has an impact on job performance.
Typically, people are able to successfully deal with burdens whether it is on their own or through social support (with help of others). However, stressors can be impetuous or long lasting, resulting in a decrease of human func-tioning marking the beginnings of exhaus-tion. When one is unable to cope with every-day pressures, stress reaction constantly takes place on extremely high levels to where there is a continuous state of alarm or panic. These accumulating harmful effects often occur without notice. Consequently, this drains energy for a constructive resolution of vari-ous situations. This state is called burnout. As a result, mental or physical problems and disturbances break out, changing a person’s health and some behaviours (Schafer, 1996).
According to Maslach and Leiter (2002), burn-out is defined as a set of signs of physical and mental exhaustion, leading to the develop-ment of negative perceptions about oneself; negative attitude towards work, colleagues, or customers; and the loss of feelings of respon-sibility or motivation. Moreover, workplace burnout is especially prevalent in employees in occupations that require them to deal with people such as psychotherapists, teachers, doctors and nurses, clerks, police officers, and judges. Judicial work is difficult and prob-ably does not take place in ideal conditions. Maslach and Leiter believe the causes of burn-out are associated with a presence of conflicts, overload (especially overload of responsibil-ity), perception of inequality, and inadequate distribution of work. Also, in judicial work, other factors contribute to burnout such as an idealization of law and frequent exposure to traumatic cases.
Judges are required to make trustworthy deci-sions on a daily basis, and these decisions have important consequences for all parties in trial proceedings. Continually, they are faced with problems caused by plaintiffs and defendants.

Law Enforcement Executive Forum • 2012 • 12(4) 141
Sometimes they are involved in varying types of conflicts that can be both internal and exter-nal, the former when they disagree with the legal definitions, and the latter can be caused by trial participants (Chamberlain & Miller, 2008, 2009). As a result, judges can experi-ence physical and emotional symptoms that are typical for burnout, including headaches, high blood pressure, insomnia, despair (loss of illusions), and depression. Additionally, other negative factors may occur such as pes-simistic views about themselves and a nega-tive attitude towards others (e.g., colleagues, customers, and family members).
Exhaustion as a result of compassion mani-fests as an emotional disability from offering help to a mentally or physically traumatized individual. This concept arose in examining the problems of nurses, but later was applied more generally and is now known as second-ary traumatic stress disorder. The signs for it are the same for posttraumatic stress disorder (PTSD). Signs that are most characteristic for secondary traumatic stress disorder are forced thoughts and ideas, sleep disorders, edginess, shirking responsibility, the need for alcohol, or a lack of interest in work. The formation of secondary traumatic stress disorder among judges depends primarily on the emotional investment in the judicial process. Thus, the judges may sympathize with victims, victim’s families, or with the accused. The last happens rarely but occurs given that they are forced to declare long-term imprisonment for law vio-lators. It is assumed that judges who are more empathic are highly susceptible to secondary traumatic stress disorder (Figley, 1993).
The concept of replacement trauma is intended to clarify the changes in psychotherapists who characterise themselves with their clients’ troubles. It is assumed that vicarious trauma negatively affects psychological develop-ment, adaptation, and self-perception. Judges may also experience symptoms that are typi-cal of replacement trauma. This is particularly true for judges of family court who are aware that their decisions may strongly impact the lives of families.
Zimmerman (2000), an American clinical psy-chologist, was among the first who began studying the stress of judicial work. He acknowledged and emphasized that the lone-liness and social isolation of judges (who do not share their problems with others due to the nature of their work) lead to feelings of threat, concerns for their own safety, and con-cern for the security of their family. Also, there is an increase of threats and violence towards judges. Furthermore, they are overloaded with work because it is extremely challenging and quite burdensome. Judicial work is intel-lectually laborious (i.e., running the trial and making rulings) and emotionally challeng-ing, especially in traumatic cases (e.g., crimes against children or violent crimes). Other emotional burdens are induced through a need for behavioural self-control. Judges are expected to always be in control—to maintain calm no matter how they experience or per-ceive situations.
Other expectations that judges may experi-ence as distress or negative stress may include issues pertaining to weak legislation, changes in legislation, conflict in values, political pres-sure, media and public pressure, incompe-tent staff, conflicts with defenders and pros-ecutors, long-lasting trials, work interruption, insufficient feedback, organization of work, working conditions, new technologies, the salary system, and other judicial-specific prob-lems. Then there is the everyday stress like middle-aged crisis, children leaving home, self-esteem problems, and, most importantly, health problems.
Long-lasting (chronic) influence of stress can lead to various undesirable changes cogni-tively, emotionally, physically, and behav-iourally. Specifically, the signs or symptoms that are warning the external or internal influ-ences are unpleasant, and something must be done in order to return to and maintain a healthy state (in the broadest sense). Some common signs of stress include a restless heart, shortness of breath, digestive disorders, muscle tension, restlessness, heat waves, an eating disorder, concerns, a troubled mind,

142 Law Enforcement Executive Forum • 2012 • 12(4)
dejection, anxiety, effervescence, anger, dis-satisfaction, feelings of guilt, lack of interest in people, the abandonment of work, lack of abil-ity to think clearly, feeling distracted, forgetful-ness, lack of creativity, inconsistency, excessive criticism, and unhealthy habits (Ihan, 2004).
If symptoms are unconsciously or consciously ignored, the problems may develop into dis-eases. The most common diseases associated with stress are coronary artery disease (lead-ing to heart attacks), high blood pressure, migraines, digestive disorders, ulcers, neck and back pains, diabetes, cancer, allergies, colds and flu, sleep problems, increased smok-ing, increased alcohol consumption, anxiety, phobias, and depression. Nevertheless, schol-ars have found ways to prevent judicial stress.
Stress is a complex problem and must be addressed. The first and probably most impor-tant step in alleviating stress is recognizing its existence. Therefore, it is necessary to find the causes of the problem, which can be done individually or with the help of experts. The next step is taking proper measures, although there is no specific remedy. Much has been written about what helps combat stress, but those activities should be adapted according to the needs of the individual. Ihan (2004) listed the following measures against stress: healthy and balanced diet, regular physical activity (in which we take pleasure), relaxation and calmly breathing, knowledge of stress and our responses to stressful situations, an open and positive attitude towards oneself or others within the world, being reconciled with situations that cannot be changed, time man-agement, saying no when something is asked from us, and trusting in others. It is important to acknowledge that stress increases when unresolved, and the consequences of stress are dependent upon an individual’s charac-teristics. The key is also timely awareness of stress and realizing positive steps for preserv-ing one’s health.
Various authors (e.g., Miller, Flores, & Dolezilek, 2007) believe that the judicial system can provide the following methods for coping with stress:
disburdening conversation process (debriefing), intervention before trials, and combined inter-vention. The disburdening conversation process stresses the importance of conversation after the trial (also in various stages of the process) regarding their experiences. Judges may speak of their emotional experiences and thoughts about safe environments, thus reducing the negative impacts of the trial. The method is used for inter-vention in crisis situations with victims of crime, people who suffer the consequences of natural disasters, and related trauma. Well-experienced and specially trained judges can conduct the debriefing process.
Intervention before the trial includes activities that prepare judges to handle the stress that can be experienced in the process of a trial. Judges are informed of the potential stress effects, are warned about stress signs, and are taught coping techniques. This can be done through written papers and video presenta-tions. The most effective strategies are work-shops where judges can exchange experiences. We believe that anti-stress training should be an integral part of judge seminars, while also utilizing combined intervention strategies.
Combined intervention strategies are primar-ily intended for members of a jury, but they could potentially be used for judges. Before the trial, judges receive written information regarding stress, stress reactions, and pos-sible techniques of coping with stress. If the pressure on the judge is very extensive (e.g., various threats, public pressure, difficult deci-sions), judges may find some help (or may be advised to do so) with a proper expert or qualified judge consultant. The judge also may seek help after trial.
One important element of stress prevention is to provide security in courts and to ensure judges are safe. It is clear that this cannot be fully achieved, but it needs to be a priority. Environmental preventions can address inap-propriate court locations, unsuitable judicial buildings, and most often a lack of resources designated for safety precautions. In any case, the judicial system should promote a culture
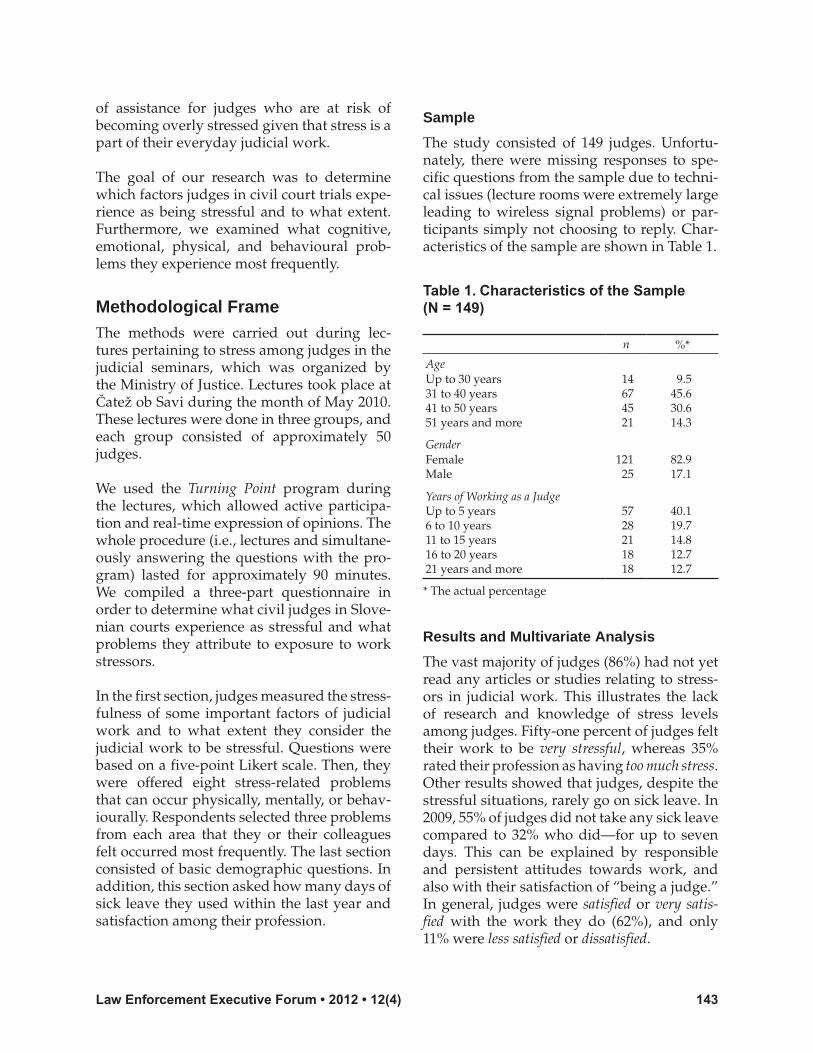
Law Enforcement Executive Forum • 2012 • 12(4) 143
of assistance for judges who are at risk of becoming overly stressed given that stress is a part of their everyday judicial work.
The goal of our research was to determine which factors judges in civil court trials expe-rience as being stressful and to what extent. Furthermore, we examined what cognitive, emotional, physical, and behavioural prob-lems they experience most frequently.
Methodological FrameThe methods were carried out during lec-tures pertaining to stress among judges in the judicial seminars, which was organized by the Ministry of Justice. Lectures took place at Čatež ob Savi during the month of May 2010. These lectures were done in three groups, and each group consisted of approximately 50 judges.
We used the Turning Point program during the lectures, which allowed active participa-tion and real-time expression of opinions. The whole procedure (i.e., lectures and simultane-ously answering the questions with the pro-gram) lasted for approximately 90 minutes. We compiled a three-part questionnaire in order to determine what civil judges in Slove-nian courts experience as stressful and what problems they attribute to exposure to work stressors.
In the first section, judges measured the stress-fulness of some important factors of judicial work and to what extent they consider the judicial work to be stressful. Questions were based on a five-point Likert scale. Then, they were offered eight stress-related problems that can occur physically, mentally, or behav-iourally. Respondents selected three problems from each area that they or their colleagues felt occurred most frequently. The last section consisted of basic demographic questions. In addition, this section asked how many days of sick leave they used within the last year and satisfaction among their profession.
Sample
The study consisted of 149 judges. Unfortu-nately, there were missing responses to spe-cific questions from the sample due to techni-cal issues (lecture rooms were extremely large leading to wireless signal problems) or par-ticipants simply not choosing to reply. Char-acteristics of the sample are shown in Table 1.
Table 1. Characteristics of the Sample (N = 149)
n %*
AgeUp to 30 years31 to 40 years41 to 50 years51 years and more
GenderFemaleMale
Years of Working as a Judge Up to 5 years6 to 10 years11 to 15 years16 to 20 years21 years and more
14674521
12125
5728211818
9.545.630.614.3
82.917.1
40.119.714.812.712.7
* The actual percentage
Results and Multivariate Analysis
The vast majority of judges (86%) had not yet read any articles or studies relating to stress-ors in judicial work. This illustrates the lack of research and knowledge of stress levels among judges. Fifty-one percent of judges felt their work to be very stressful, whereas 35% rated their profession as having too much stress. Other results showed that judges, despite the stressful situations, rarely go on sick leave. In 2009, 55% of judges did not take any sick leave compared to 32% who did—for up to seven days. This can be explained by responsible and persistent attitudes towards work, and also with their satisfaction of “being a judge.” In general, judges were satisfied or very satis-fied with the work they do (62%), and only 11% were less satisfied or dissatisfied.

144 Law Enforcement Executive Forum • 2012 • 12(4)
Judges were asked to rate stress as to what extent they are experiencing it in terms of atti-tude towards media, the general public, and politically. Sixty-five percent of judges experi-ence the attitude of the media as stressful. It is important to note that this may not reflect the
attitudes pertaining to criminal proceedings in that the pressure of media could potentially be higher. The attitude of the general public is con-sidered stressful by 67% of judges, while 50% experienced stress as derived from political atti-tudes. These findings are similar to the results of foreign research. The judges probably expe-rienced pressure of populism in the profession, resulting in excitement, tension, and anger—all of which can have some impact on work.
Judges evaluated their relationships with colleagues, lawyers, and witnesses as being unproblematic (nonstressful). Trials are also unproblematic, but there was a significant dif-ference if they heard a traumatic case. Almost 60% of judges experience that as being stress-ful. Consequently, this was an effect of second-ary stress, in which the consequences were dependent on judges emotional input in the process. Interestingly, roughly the same per-centage of judges evaluated decisions when passing judgments as stressful (35%) com-pared to the 32% of judges who felt this kind of decisionmaking process to be stress-free.
Decisions of higher courts evaluating a judge’s first-level decisions is perceived as
Figure 1. Stressfulness of Judicial Work (N = 149)
6
* The actual percentage.
Results and multivariate analysis
The vast majority of judges (86%) had not yet read any article or studies relating to
stressors in judicial work. This illustrates the lack of research and knowledge of stress levels
among judges. Fifty one percent of judges felt their work to be very stressful, where as 35%
rated their profession as too much stressful. Other results showed that judges, despite the
stressful situations rarely go on sick leave. In 2009, Fifty-five percent of judges did not take
any sick leave compared to 32% who did-for up to 7 days. This can be explained by
responsible and persistent attitudes towards work, and also with satisfaction of “being a
judge”. In general, judges ware satisfied or very satisfied with the work they do (62%) and
only 11% were less satisfied or dissatisfied.
Figure I: Stressfulness of judicial work (n = 149)
Judges were asked to rate stress to what extent they are experiencing it in terms of
attitude towards media, the general public, and politically. Sixty-five percent of judges
experience attitude of the media as stressful. It is important to note that this may not reflect
the attitudes pertaining to criminal proceedings in that the pressure of media could potentially
be higher. Their attitude of the general public is being experienced stressful by 67% of
judges, while 50% experienced stress deranged from the attitude of politics. These findings
Figure 2. Stressfulness of Workload (n = 140)
7
are similar to the results of foreign research. The judges probably experienced pressure of
populism in the profession, resulting in excitement, tension, and anger-all of which can have
some impact on work.
In an unproblematic (non-stressful) context, judges evaluated their relationships with
colleagues, lawyers, and witnesses. Trials are also unproblematic, but there was a significant
difference if they heard a traumatic case. Almost 60% of judges experience that as being
stressful. Consequently, this was an effect of secondary stress, in which the consequences
were dependent on judge’s emotional input in the process. Interestingly, roughly the same
percentage of judge’s evaluated decisions when passing judgments as stressful (35%)
compared to the 32% of judges who felt this kind of decision making process to be stress-free.
Decisions of higher instances on judge’s decisions on the first level, judges on first
level experience as stressful in 53%. The legislation is experienced as stressful or stress-free
at relatively the same percentage (34% - 38%). Amendments to the legislation are seen or are
perceived as burdensome by 62% of judges.
The assessment of their workload showed that they experienced it to be stressful in
78% and as non-stressful in only 7%, reflecting the increase of judicial workload.
Figure II. Stressfulness of workload (n = 140)
Judges do not consider the lack of respect and (sense of) threat as problematic. Work
conditions are also non-problematic. However, they are dissatisfied with distribution of labour
and court management. Sixty-two percent of judges consider salary as a stress related factor
and 20% feel this it is not an issue.
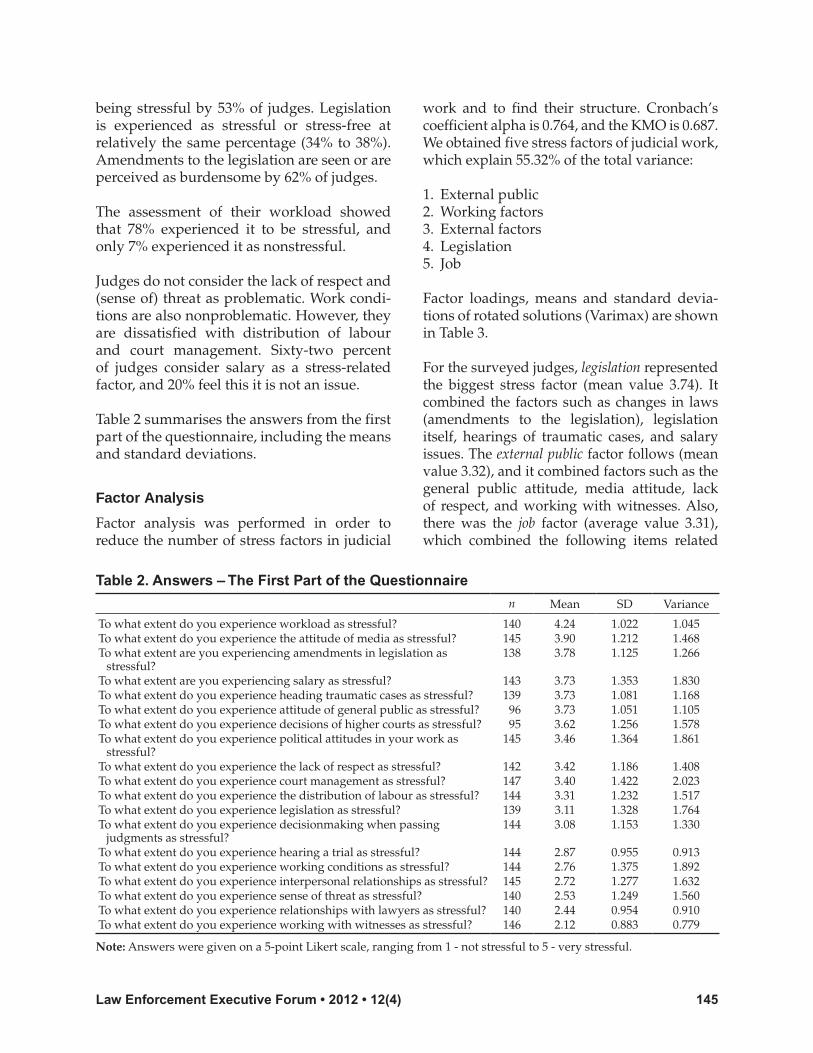
Law Enforcement Executive Forum • 2012 • 12(4) 145
being stressful by 53% of judges. Legislation is experienced as stressful or stress-free at relatively the same percentage (34% to 38%). Amendments to the legislation are seen or are perceived as burdensome by 62% of judges.
The assessment of their workload showed that 78% experienced it to be stressful, and only 7% experienced it as nonstressful.
Judges do not consider the lack of respect and (sense of) threat as problematic. Work condi-tions are also nonproblematic. However, they are dissatisfied with distribution of labour and court management. Sixty-two percentof judges consider salary as a stress-related factor, and 20% feel this it is not an issue.
Table 2 summarises the answers from the first part of the questionnaire, including the means and standard deviations.
Factor Analysis
Factor analysis was performed in order to reduce the number of stress factors in judicial
work and to find their structure. Cronbach’s coefficient alpha is 0.764, and the KMO is 0.687. We obtained five stress factors of judicial work, which explain 55.32% of the total variance:
1. External public2. Working factors3. External factors4. Legislation5. Job
Factor loadings, means and standard devia-tions of rotated solutions (Varimax) are shown in Table 3.
For the surveyed judges, legislation represented the biggest stress factor (mean value 3.74). It combined the factors such as changes in laws (amendments to the legislation), legislation itself, hearings of traumatic cases, and salary issues. The external public factor follows (mean value 3.32), and it combined factors such as the general public attitude, media attitude, lack of respect, and working with witnesses. Also, there was the job factor (average value 3.31), which combined the following items related
Table 2. Answers – The First Part of the Questionnaire
n Mean SD Variance
To what extent do you experience workload as stressful?To what extent do you experience the attitude of media as stressful?To what extent are you experiencing amendments in legislation as
stressful?To what extent are you experiencing salary as stressful?To what extent do you experience heading traumatic cases as stressful?To what extent do you experience attitude of general public as stressful?To what extent do you experience decisions of higher courts as stressful?To what extent do you experience political attitudes in your work as
stressful?To what extent do you experience the lack of respect as stressful?To what extent do you experience court management as stressful?To what extent do you experience the distribution of labour as stressful?To what extent do you experience legislation as stressful?To what extent do you experience decisionmaking when passing
judgments as stressful?To what extent do you experience hearing a trial as stressful? To what extent do you experience working conditions as stressful?To what extent do you experience interpersonal relationships as stressful?To what extent do you experience sense of threat as stressful?To what extent do you experience relationships with lawyers as stressful?To what extent do you experience working with witnesses as stressful?
140145138
143139 96 95145
142147144139144
144144145140140146
4.243.903.78
3.733.733.733.623.46
3.423.403.313.113.08
2.872.762.722.532.442.12
1.0221.2121.125
1.3531.0811.0511.2561.364
1.1861.4221.2321.3281.153
0.9551.3751.2771.2490.9540.883
1.0451.4681.266
1.8301.1681.1051.5781.861
1.4082.0231.5171.7641.330
0.9131.8921.6321.5600.9100.779
Note: Answers were given on a 5-point Likert scale, ranging from 1 - not stressful to 5 - very stressful.

146 Law Enforcement Executive Forum • 2012 • 12(4)
to decisionmaking: in passing judgments, rela-tionships with lawyers, and workload. Working factors (mean value 3.15) combined those items such as working conditions, management of courts, and distribution of labour. External fac-tors (mean value 3.01) were used to generalize the factors that come “from outside” and have some influence on the judicial work such as decisions of higher courts, interference of poli-tics, feeling threatened, and actual hearings.
Table 4 shows the strength of relationships among factors.
Statistically significant (α = 0.01) are positive correlations between the factors external factors and external public (r = 0.435), job and working factors (r = 0.413), legislation and general public (r = 0.350), and job and external factors (r = 0.307).
Discriminant Analysis
Using discriminant analysis, we tried to deter-mine whether there were any statistically sig-nificant differences between certain variables such as reading an article or study about stress, gender, years of working as a judge, age, sickness,
Table 3. Factor Loadings, Means, and Standard Deviations of Judicial Work Stress Factors
Factor Loadings
Means
Standard Deviations
External Public To what extent do you experience the attitude of general public as stressful? To what extent do you experience the attitude of media as stressful?To what extent do you experience the lack of respect as stressful?To what extent do you experience working with witnesses as stressful?
Working FactorsTo what extent do you experience working conditions as stressful?To what extent do you experience court management as stressful?To what extent do you experience distribution of labour as stressful?
External FactorsTo what extent do you experience decisions of higher instances as stressful?To what extent do you experience political attitudes as stressful?To what extent do you experience sense of threat as stressful?To what extent do you experience hearing a trial as stressful?
LegislationTo what extent do you experience amendments to the legislation as stressful?To what extent do you experience legislation as stressful?To what extent do you experience heading a traumatic case as stressful?To what extent do you experience salary as stressful?
JobTo what extent do you experience decisionmaking when passing
judgments as stressful?To what extent do you experience relationships with lawyers as stressful?To what extent do you experience workload as stressful?
0.7460.6780.6470.520
0.7670.7330.667
0.7280.6590.5860.523
0.7620.732
-0.5320.520
0.786
0.5360.392
3323.753.903.432.28
3.152.743.383.29
3.013.493.112.522.88
3.473.763.123.263.72
3.313.14
2.564.24
0.7941.1521.2091.1900.920
1.0671.3631.4351.243
0.8111.2661.3491.2420.927
0.7031.1331.3281.3051.350
0.7621.136
1.1141.017
Table 4. Pearson Coefficients of the Correlations Between Factors (r)
External Public Working Factors External Factors Legislation
External publicWorking factorsExternal factorsLegislationJob
--0.180 *
0.435 **
0.350 **
0.236 **
--0.233 **
0.0840.413 **
--0.280 **
0.307 **
--0.176 *
* Correlation is statistically significant at α = 0.05.** Correlation is statistically significant at α = 0.01.

Law Enforcement Executive Forum • 2012 • 12(4) 147
and job satisfaction. Specifically, we wanted to know whether those who have already read an article or study about stress experienced their job as being more or less stressful. Of the surveyed judges, only 21 had read an arti-cle or study about the stress experienced by judges. Discriminant analysis also showed no statistically significant differences at any factor.
In addition, we examined whether other fac-tors (e.g., years of working as a judge, age, and sick leave) had any influence on the sense of stress. Discriminant analysis showed no sta-tistically significant differences in these cases.
In regards to gender, there was a statistically significant difference in the job factor (F = 10.273). Female judges experience decisionmak-ing when passing judgments, relationships with lawyers, and workload as more stressful com-pared to male judges. Therefore, female judges experienced their work as much more stress-ful than do male judges. The average value of the job factor for female judges was 3.37, with a standard deviation of 0.771; and for male judges, 3.21 and 0.661, respectively.
Also, a statistically significant difference was verified in their satisfaction with work. Fif-teen judges were dissatisfied with their work, while 91 were satisfied and 37 undecided. Average values (M), standard deviations (SD), and F values are shown in Table 5.
Table 5 shows the following:
• Statistically Significant Differences in Working Factors – The more satisfied with the work, the less stressful judges perceive work factors.
•
•
Statistically Significant Differences in Terms of External Factors – The undecided perceive the greatest stressfulness from external factors.Statistically Significant Differences in the Legislation – The undecided perceive the greatest stress from the legislation.
Regression Analysis
Through regression analysis, we tried to determine if any of the predictors such as external public, working factors, external factors, legislation, job, gender, age, years of working as a judge, and sick leave can be used to predict stressfulness of judicial work. In the survey, only two responded that the judicial work is not stressful, and 19 of them believed that judicial work is somewhat stressful; but for the majority (128), judicial work is very or too much stressful. Results of regression analysis are shown in Table 6.
Table 6. Results of Regression Analysis – Stressfulness of Judicial Work
Beta t p
(Constant) 8.788 0.000External public 0.173 1.788 0.076Working factors -0.080 -0.946 0.346External factors 0.095 1.041 0.300Legislation -0.086 -0.968 0.335Job 0.347 3.825 0.000Gender -0.215 -2.644 0.009Age 0.093 0.790 0.431Years of working as a judge -0.151 -1.282 0.202Sick leave -0.160 -1.920 0.057
Table 6 shows that the variables job and gender are statistically significant in predicting
Table 5. Results of Discriminant Analysis in Terms of Satisfaction with the Work
Dissatisfied Undecided Satisfied
F M SD M SD M SD
External public Working factorsExternal factorsLegislationJob
3.343.522.853.313.72
0.6771.1490.9200.5970.776
3.603.413.353.773.37
0.5290.9150.6320.6630.569
3.252.992.903.353.23
0.8461.0800.8230.7010.823
2.733.22 *4.62 *5.57 *2.85
* Statistically significant difference

148 Law Enforcement Executive Forum • 2012 • 12(4)
stressfulness of judicial work (p < 0.05). Thebiggest positive impact was the job variable, wherein judges with a higher perception ofstress in decisionmaking, relationship withlawyers, and workload were more likely toperceive judicial work as stressful. The gender variable had a negative impact in which women had a value of 1 and men 2, which concludes that female judges perceive the judicial work as more stressful than male judges. This was also verified using discriminant analysis.
In the second part, responding judges selected three problems from the cognitive, physical, and behavioural fields in which their opinions are most frequently experienced by them or by their colleagues.
Dissatisfaction and tension are the most common problems experienced in the emo-tional field. Both can affect relationships with clients, colleagues, and even with family members, which may lead to new problems.
The most notable signs of stress in the cogni-tive field were the sense of inefficiency and feeling tired and or fatigued.
What stood out the most in the physical and behavioural stress signs were insomnia, head-aches, and general muscle tension. Symptoms of excessive alcohol consumption, and analge-sics or sedatives are appearing in only 2 to 3% of responses. It is important to note that in some foreign studies, the authors point to alcoholism as an occurring problem of judicial stress.
Figure 3. Emotional Signs of Stress
5.8%
6.5%
9.9%
10.3%
12.0%
13.2%
20.9%
21.4%
.0% 5.0% 10.0% 15.0% 20.0% 25.0%
Lack of self-esteem
Depression
Anxiety
The feeling of helplessness and
despair
Excessive sensitivity
Anger
Tension
Dissatisfaction
despair
FIGURE:
5%
7.38%
8.33%
9.29%
10.24%
12.62%
22.14%
25%
Failure to complete tasks
Problem to concentrate
Problems with attention
Indecisiveness
Forgetfulness
The feeling of overburdening
Feeling tired
Ineffectiveness
0% 5% 10% 15% 20% 25% 30%
FIGURE:
5.8%
6.5%
9.9%
10.3%
12.0%
13.2%
20.9%
21.4%
.0% 5.0% 10.0% 15.0% 20.0% 25.0%
Lack of self-esteem
Depression
Anxiety
The feeling of helplessness and
Excessive sensitivity
Anger
Tension
Dissatisfaction
5%
7.38%
8.33%
9.29%
10.24%
12.62%
22.14%
25%
Failure to complete tasks
Problem to concentrate
Problems with attention
Indecisiveness
Forgetfulness
The feeling of overburdening
Feeling tired
Ineffectiveness
0% 5% 10% 15% 20% 25% 30%

Law Enforcement Executive Forum • 2012 • 12(4) 149
Figure 5. Behavioural and Physical Signs of Stress
2.49%
2.99%
5.74%
9.23%
13.22%
17.96%
23.19%
25.19%
0.00% 5.00% 10.00% 15.00% 20.00% 25.00% 30.00%
Excessive alcohol consumption
Excessive consumption of analgesics or
sedatives
High blood pressure
Excessive consumption of nicotine and
caffeine
Eating problems
General muscle tension
Headache
Insomnia
Figure 4. Cognitive Stress Signs
5%
7.38%
8.33%
9.29%
10.24%
12.62%
22.14%
25%
Failure to complete tasks
Problem to concentrate
Problems with attention
Indecisiveness
Forgetfulness
The feeling of overburdening
Feeling tired
Ineffectiveness
0% 5% 10% 15% 20% 25% 30%
FIGURE:
5.8%
6.5%
9.9%
10.3%
12.0%
13.2%
20.9%
21.4%
.0% 5.0% 10.0% 15.0% 20.0% 25.0%
Lack of self-esteem
Depression
Anxiety
The feeling of helplessness and
despair
Excessive sensitivity
Anger
Tension
Dissatisfaction
Judges of higher courts believe that most stress is caused by the following factors per-taining to work:
••
•
ThestressoftheworkitselfAttitude of media, general public, andpoliticsHearingtraumaticcases

150 Law Enforcement Executive Forum • 2012 • 12(4)
••••
DecisionsofhigherinstancesChanges/amendmentsinlegislationExcessiveburdenofwork/workloadSalary
Among the emotional stress signs judges most frequently chose were dissatisfaction and ten-sion whereas inefficiency and feeling tired were most frequently chosen among cognitive stress signs. The most frequently chosen in the physical and behavioural areas were the problems of insomnia, headache, and general muscle tension.
DiscussionThe results showed that a majority of judges evaluate their work as stressful and that some stress factors are specific and typical for judi-cial work. Interestingly, these stressors are mainly external and not directly associated with their work, with the exception of heading traumatic cases. Further analyses showed there was some distinction in perception of stress between female and male judges, wherein female judges perceived their work as more stressful—in a general view. The more judges are satisfied with their work, the less stressful they experience working factors to be. Regres-sion showed that if decisionmaking, relation-ships with lawyers, and workload are perceived as stressful, judicial work would be perceived as stressful as well.
In their paper, Miller et al. (2007) indicate the number of actions that could reduce the stress-fulness of judicial work or at least mitigate the consequences of stress. Above all, they believe it would be necessary to change attitudes towards anti-stress measures that shouldbecome an integral part of judicial work. Judges and others responsible in the judicial system should be aware that stress could influence many aspects of their work and pri-vate life. This is why judges should accept and encourage various forms of anti-stress mea-sures (e.g., lectures, workshops, counseling). Despite their position, judges who decide the fate of others are no less immune to the effects of stress.
Judicial processes are undoubtedly complex and arduous. Therefore, it should be encour-aged to resolve some processes through other means such as arbitration or mediation. Men-toring for young judges should be introduced given that mentors can be very helpful in assisting and preparing others for trials. This would minimize work stress.
Having better strategies pertaining to time management is also a recommendation to reduce stress. Judges should be able to have some anti-stress activities (e.g., recreation and hobbies) during workload days. Such activi-ties provide relaxation and allow higher work efficiency.
Judges should be trained in self-defence, and the best possible security (protection of the courts) should be ensured.
Even though the Ministry of Justice already conducts training programs and improve-ment seminars (which include lessons on self-defence, protection of courts, and the causes and consequences of stress), these programs should be upgraded and introduced as a systematic approach to the stress prevention training of judges and others in the judicial system.
ReferencesChamberlain, J., & Miller, M. C. (2008). Stress
in the courtroom: Call for research. Psychia-try, Psychology and Law, 15(2), 237-250.
Chamberlain, J., & Miller, M. C. (2009). Evi-dence of secondary traumatic stress, safety concerns, and burnout among a homoge-neous group of judges in a single jurisdic-tion. The Journal of the American Academy of Psychiatry and the Law, 37(2), 214-224.
Figley, C. R. (1993). Coping with stressors on the home front. Journal of Social Issues, 49(4), 51-71.

Law Enforcement Executive Forum • 2012 • 12(4) 151
Ihan, A. (2004). Do odpornosti z glavo [Achiev-ing better immune system with knowledge]. Ljubljana, Slovenia: Mladinska Knjiga.
Lazarus, R. S. (2007). Stress and emotion: A new synthesis. In A. Monat, R. S. Lazarus, & G. Reevy (Eds.), The prayer handbook on stress and coping (pp. 289-308). Westport, CT: Praeger.
Lazarus, R. S., & Folkman, S. (1984). Stress, appraisal, and coping. New York: Springer.
Maslach, C., & Leiter, M. P. (2002). Resnica o izgorevanju na delovnem mestu [The truth about burnout]. Ljubljana, Slovenia: Educy.
Miller, M. K., Flores, D. M., & Dolezilek, A. N. (2007). Addressing the problem of court-room stress. Judicature, 91(2), 60-69.
Miller, M. K., & Richardson, J. T. (2006). A model of causes and effects of judicial stress. The Judges Journal, 45, 20-30.
Schafer, W. (1996). Stress management for well-ness. Fort Worth, TX: Harcourt Brace College Publishers.
Zimmerman, I. M. (2000). Isolation in the judi-cial career. Court Review, 36(4), 4-6.
Peter Umek has a Doctor of Science (PhD) from the Faculty of Arts, Uni-versity of Ljubljana in Slovenia. He is a professor of Investigative Psychology, University of Maribor in Slovenia.
Monica N. Guzman has a Master of Science in Criminal Justice from Weber State University in Ogden, Utah. She has given several international lec-tures on the topic of Corruption, was part of the American Society of Crimi-nology–Student Affairs, and is a certi-fied Victim Outreach Specialist for the Defense-Victim Outreach Program in the United States.
Jerneja Šifrer is an assistant lecturer and researcher for statistics and methodol-ogy in criminal justice at the Faculty of Criminal Justice and Security, University of Maribor in Slovenia.
Bojan Dobovšek has a Doctor of Science (PhD) from the Faculty of Social Science, University of Ljubljana in Slovenia. He is an associate professor of Criminal Inves-tigation, and he is a Vice Dean at the Fac-ulty of Criminal Justice, University of Maribor in Slovenia.

152 Law Enforcement Executive Forum • 2012 • 12(4)

Law Enforcement Executive Forum • 2012 • 12(4) 153
Guidelines for Preparing Manuscripts
There are virtually no restrictions on subject matter as long as the material pertains, in the opinion of the editor, to law enforcement-related areas. Manuscripts should be word processed and double-spaced. A résumé or vita from the author(s) must accompany sub-missions. Book reviews and research notes will be considered for publication. No sub-mission will be published until recommended by referees, who will review blind copies.
Final manuscripts must be submitted on CD readable on Macintosh or IBM (and true compatible) computers. Please specify word processing program used when submitting the CD (e.g., Word 2007, WordPerfect 12, and so on). Also, an RTF (Rich Text Format) ver-sion would be most helpful. Disks will not be returned. Figures and line drawings must be submitted in camera-ready form.
Send three hard-copy manuscripts, vitae(s), and a CD to . . .
Vladimir A. Sergevnin, PhD, Editor ILETSBEI Law Enforcement Executive Forum Editorial Office 1 University Circle Macomb, IL 61455-1390 (309) 298-2276; cell (217) 801-2810; fax (309) 298-2642
The journal follows the Publication Manual of the American Psychological Association (most recent edition) for the most part with a few variations. Please refer to References sections in past issues for examples. Webster’s Third New International Dictionary (3rd ed.) (2002) is the standard reference for spelling. Contribu-tors are responsible for obtaining permission from copyright owners if they use an illus-tration, table, or lengthy quote that has been published elsewhere. Contributors should write to both the publisher and author of such material requesting nonexclusive world rights in all languages for use in the article and in all future editions of it.

154 Law Enforcement Executive Forum • 2012 • 12(4)
Monographs Available Through the Illinois Law Enforcement Training and Standards
Board Executive Institute!
Chicago Police: An Inside View – The Story of Superintendent Terry Hillard
Authors: Thomas J. Jurkanin, PhD, with Terry G. Hillard
In macro-style, this book examines crime, criminal activity, and police response in the City of Chicago, which has a long history of and association with crime. This book will give the reader an inside view of the Chicago Police Department so that a better understanding might be gained of police operations not only in Chicago but in other major city police agencies.
Critical Issues in Police Discipline
Authors: Lewis G. Bender, Thomas J. Jurkanin, Vladimir A. Sergevnin, and Jerry L. Dowling
This book examines the problem of police discipline from the collectiveperspective of professional law enforcement leaders. It offers the reader practical, not theoretical, solutions in dealing with problem employees and misconduct incidents. It reflects the experience and dedication of a highly experienced group of Illinois police chiefs and sheriffs.
To order, call (309) 298-2646 or visit our website at www.ILETSBEI.com.

Illinois Law Enforcement Training and Standards Board Executive Institute
Law Enforcement Executive ForumBack Issues Available ($15.00 each includes shipping) No. OrderedRacial Profiling: Special Edition – July 2001 Recruitment – August 2001 Retention – December 2001 Terrorism – March 2002 Police Ethics – July 2002 The Impact of Emerging Science and Technology on Law Enforcement Agencies – August 2002 Police Training – November 2002 Police Management and Leadership – February 2003 Use of Force – May 2003 Police-Medical Collaborations: Dealing with Mental Health – July 2003 Law Enforcement Response to Methamphetamine – September 2003 Legal Self-Defense for Law Enforcement Administrators – November 2003 Police Pursuits – January 2004 Personnel Administration: Psychological Landmines – March 2004 Training the Police Trainer – May 2004 Community Policing – July 2004 Patrol Resource Allocation – September 2004 Special Edition – October 2004 Internal Affairs Investigations – November 2004 Law Enforcement Agency Accreditation – January 2005 Law Enforcement Unions – March 2005 Generational Conflict and Diversity – May 2005 Undercover Policing – July 2005 Public Relations, Media and Political Affairs – September 2005 Homeland Security – November 2005 Racial Profiling: Special Edition – January 2006 Best Practices in Recruitment and Retention – February 2006 Gangs, Drugs, and Violence Prevention – March 2006 Mental Health – May 2006 Integrity-Based Policing – July 2006 Police Resource Management: Patrol, Investigation, Scheduling – September 2006 Interagency Cooperation – November 2006 Critical Issues in Police Civil Liability – January 2007 Special Edition – February 2007 Police Officer Safety – March 2007 Police Administration – May 2007 Financial Management and Police Administration – July 2007 Police Training: Investigations – September 2007 Community Policing: Immigration – November 2007 FBI: 100 Years of Cooperation: Special Edition – January 2008 The Challenges of Assisting Special Populations – March 2008 New Wave of Crime and Police Response – May 2008 Less Lethal Use of Force – July 2008 School and Workplace Violence – September 2008 Juvenile Justice – December 2008 Leadership – March 2009 Organized Crime – June 2009 Police Best Practices – October 2009 Financial Crisis and Law Enforcement – December 2009 Police Training Technologies – March 2010 Critical Legal Issues in Law Enforcement – May 2010 Police Management – September 2010 Anti-Terrorism Enforcement and Leadership – December 2010 Managing Diverse Population – March 2011 Police Administration – May 2011 Implementing Fitness Standards for Police Recruits: A Case Study – September 2011 Cyber Bullying – December 2011 Human Trafficking – March 2012 Police Personnel: Environment, Training, Education, and New Technologies – June 2012 Dealing with Special Populations – October 2012 Total Ordered
_____________________________________________________________________________________________________________________________________________________________________________________________________________________________________________________________________________________________________________________________________________________________________________________________________________________________________________________________________________________________________________________________________________________________________
See reverse side of this page for Ordering Information.For more Information, please visit our website at www.ILETSBEI.com.

Illinois Law Enforcement Training and Standards Board Executive Institute
Law Enforcement Executive Forum
Ordering Information
Payment can be made by check, money order, or credit card (MasterCard, Visa, or Discover). No CODs are accepted. Orders may be faxed to (309) 298-2642 or mailed to . . .
ILETSBEI • 1 University Circle • Macomb, IL 61455-1390
For further information, contact the Illinois Law Enforcement Training and Standards Board Executive Institute at (309) 298-2646.
Shipping Information
First Middle Initial Last
Address
City State Zip
Telephone Fax
Credit Card Information
Name on Credit Card ___________________________________________________ MC Visa Discover
Card Number ___________________________________________________ Expiration Date _________________
Signature ______________________________________________________________________________________
www.ILETSBEI.com