SCHOOL OF GRADUATE STUDIES COLLEGE OF NATURAL ...
95
SCHOOL OF GRADUATE STUDIES COLLEGE OF NATURAL AND COMPUTATIONAL SCIENCES DEPARTMENT OF BIOLOGY ASSESSMENTS OF SOLID WASTE GENERATION RATE, COMPOSITION AND ITS MANAGEMENT: THE CASE OF HAGERSELAM TOWN IN HULA WOREDA, SIDAMA ZONE, SNNPR ETHIOPIA BY: ENDALE ESHINE ALAKAEEHK/006/08 A THESIS SUBMITTED TO THE HAWASSA UNIVERSITY SCHOOL OF GRADUATE STUDIES NATURAL AND COMPUTATIONAL SCIENCES DEPARTMENT OF BIOLOGY IN PARTIAL FULLIFILLIMENT OF MASTERS DEGREE IN ECOTOXICOLOGY AND ENVIRONMENTAL HEALTH (IN BIOLOGY) SEPTEMBER, 2019 HAWASSA, ETHIOPIA
-
Upload
khangminh22 -
Category
Documents
-
view
0 -
download
0
Transcript of SCHOOL OF GRADUATE STUDIES COLLEGE OF NATURAL ...
SCHOOL OF GRADUATE STUDIES
COLLEGE OF NATURAL AND COMPUTATIONAL SCIENCES
DEPARTMENT OF BIOLOGY
ASSESSMENTS OF SOLID WASTE GENERATION RATE, COMPOSITION
AND ITS MANAGEMENT: THE CASE OF HAGERSELAM TOWN IN HULA
WOREDA, SIDAMA ZONE, SNNPR ETHIOPIA
BY:
ENDALE ESHINE ALAKAEEHK/006/08
A THESIS SUBMITTED TO THE HAWASSA UNIVERSITY SCHOOL OF GRADUATE
STUDIES NATURAL AND COMPUTATIONAL SCIENCES DEPARTMENT OF BIOLOGY IN
PARTIAL FULLIFILLIMENT OF MASTERS DEGREE IN ECOTOXICOLOGY AND
ENVIRONMENTAL HEALTH (IN BIOLOGY)
SEPTEMBER, 2019
HAWASSA, ETHIOPIA
SCHOOL OF GRADUATE STUDIES
DEPARTMENT OF BIOLOGY
ASSESSMENTS OF SOLID WASTE GENERATION RATE, COMPOSITION
AND ITS MANAGEMENT: THE CASE OF HAGERSELAM TOWN IN
HULA WOREDA, SIDAMA ZONE, SNNPR ETHIOPIA
BY
ENDALE ESHINE ALAKA EEHK/006/08
A THESIS SUBMITTED TO THE HAWASSA UNIVERSITY SCHOOL OF GRADUATE
STUDIES NATURAL AND COMPUTATIONAL SCIENCES DEPARTMENT OF
BIOLOGY IN PARTIAL FULLIFILLIMENT OF MASTERS DEGREE IN
ECOTOXICOLOGY AND ENVIRONMENTAL HEALTH
ADVISOR: DR. SOLOMON SORSA
CO- ADVISOR: DR. ELIAS DADEBO
SEPTEMBER, 2019
HAWASSA, ETHIOPIA
HAWASSA UNIVERSITY
SCHOOL OF GRADUATE STUDIES
NATURAL AND COMPUTATIONAL SCIENCES
DEPARTMENT OF BIOLOGY
ADVISORS’ APPROVAL SHEET -1
This is to certify that the thesis entitled „ASSESSMENTS OF SOLID WASTE
GENERATION RATE, COMPOSITION AND ITS MANAGEMENT THE CASE OF
HAGERSELAM TOWN IN HULA WOREDA, SIDAMA ZONE, SNNPR ETHIOPIA‟
submitted in partial fulfillment of the requirements for MSc. degree with Specialization:
Ecotoxicology and Environmental Health, Graduate Program of School of Graduate Studies,
and has been carried out by Mr. Endale EshineAlakaID.NoEEHK/006/08, under our
supervision. Therefore, we recommended that the student has fulfilled the requirements and
hence hereby can submit the thesis to the Department.
----------------------------------------------------- ------------------------------ ------------------
Name of major advisor Signature Date
----------------------------------------------------- ------------------------------ ------------------
Name of co- advisor Signature Date
HAWASSA UNIVERSITY
SCHOOL OF GRADUATE STUDIES
Examiner’s approval sheet-2
As a member of examining board of the final thesis presentation, we certify that we have read
and evaluated this thesis prepared by EndaleEshine entitled: „‟ ASSESSMENT OF SOLID
WASTE GENERATION RATE, COMPOSITION AND ITS MANAGEMET IN
HAGERESELAM TOWN IN HULA WOREDA, SIDAMA ZONE, SNNPR ETHIOPIA „and
recommended that it can be accepted as the partial fulfillment of the requirements for the
Degree of Master of Science in Biology (Specialization: Ecotoxicology and Environmental
Health).
Approved by Board of Examiners
Major advisor Signature Date
_____________________________ _________________ ______________
Co-adviser Signature Date
_____________________________ _________________ ______________
Internal examiner Signature Date
_____________________________ _________________ ______________
External examiner Signature Date
_____________________________ _________________ ______________
Chairperson Signature Date
_____________________________ _________________ ______________
i
Declaration
I hereby declare that this MSc. thesis which I submitted to Hawassa University is my original
work and has not been presented for the award of degree to any other University; and all sources
of materials used for the thesis have been duly acknowledged.
EndaleEshine ______________________ ___________________________
Signature Date
ii
ACKNOWLEDGEMENTS
The successful completion of this work came about as a result of a many contribution made by
several people; without whom the work would not have been materialized. I therefore, would like
to express my profound gratitude to the following people.
First I would like to thank Dr. Solomon Sorsa, my major advisor &Dr. Elias Dadebo , my co-
advisorfor their valuable and tireless efforts in supporting and guiding me on this M.Sc. study.
I also express my gratitude to FajulaTuke for his assistance with his camera to take photo. My
appreciation further goes to Mr. BuniLalego, mayorof Hagereselamtown,for giving me important
comments and suggestions. I would like to thank my wife AmarechGimbo for her moral support
during the study.
Last but not least , I would like to thankHawassa university Biology department for giving me the
opportunity to learn.
iii
Contents
Declration…………………………..……………………………………………………………………..i
ACKNOWLEDGMENTS…………………………………………………….…………….………........iiii
Table of contents…………………………………………………………………………..…………......iii
List of tables……………………………………………………………..……………………..…….....v
List of figures………………………………………………………………………..….…………..…....v
List of acronyms/abbreviations/…………………………………………………………………………vvii
ABSTRACT…………………………………………………………………………………………....viii
1. INRTODUCTION……………………………………………………………………………….….....1
1.1 .Background to the study…………………………………………………………………………......1
1.2 .Statement of problem……………………………………………………………………………..…3
1.3 .Objectives of the study………………………………………………………………………………4
1.4 .Research questions………………………………………………………………………………......5
1.5 .Significance of the study……………………………………………………………………………5
1.6 .Delimitation (scope) of the study………………………………………………………………… ..5
1.7 .Limitations of the study……………………………………………………………………………...6
2. REVIEWLITERATURE…………………………………………..………………………..……........7
2.1 .Conceptual frame work…………………………………………………………………….………...7
2.2. Solid waste concept……………………………………………………………………………….....8
2.3 .Sources and types of solid waste……………………………………………………………….........8
2.4. Characteristics of solid waste………………………………………………………………………..9
2.5 .Solid waste managements…………………………………………………………………………..10
2.6. Solid waste management processes……………………………………………………..…….........12
2.7. Early practices of solid waste management…………………………………………………..…….16
2.8. Contemporary methods of managing solid waste………………………………………….….........16
2.9. Problems of managing solid waste in Ethiopia…………………………………………….……….22
3. MATERIALS AND METHODS……………..…………………………..………...………………...25
3.1. Description of study area………………………………………………………………………......26
3.2.Study design………………………………….……………………………………………….…….28
3.3 .Sampling methods…………………………………………………………………………..….........30
3.3.1 .Methods of data collection……………………….…………………………..…………….…....29
3.3.2. Sample size determination……………………..……..……………….………...….……….…......30
3.3.3. Sampling Procedure ………………………………………………………………………….…...31
3.4 . Data collection tools…………………..………………………………………………………..…...32
iv
3.5 .Data analysis …………… ……………………………………………………………..……….33
3.6 Ethical considration…...................................................................................................................33
4. RESULTS AND DISCUSSION………………………………………………………...………..34
4.1. socio- demographic characteristics of respondents……………………………………………..34
4.2 Solid waste generation rate …………………………….……………………………………….35
4.3 Physical composition of solid waste in Hagerselam town……………...……………………….37
4.3.1 Physical composition of household solid waste………………………………………….……37
4.3.2 Physical composition of commercial solid waste……………….……………………………..37
4.3.3 Physical composition of institutional solid waste……………………………….……………..37
4.3.4 Municipal solid waste composition……………………………………………………………38
4.4 Sources of solid waste in Hagerselam town………………………...…………………………...38
4.5 Current waste management practices……………………………………………………………40
4.5.1 Solid waste collection ,storage and sorting of solid waste…………………………………….40
4.5.1.1 Solid waste collection services ………………………………………...……………………40
4.5.1.2. Solid waste collection and transportation practices ……………………………….………..41
4.5.1.3. Handling of solid waste at household levels and town level ................................................42
4.5.1.4 Waste reuse and composting practices………………………………………………………………………..……45
4.5.1.5 Primary responsibility of solid waste handling and disposal in house level…………………….….46
4.5.2 Availability of sacks and container for waste storage…………………...……………..…….46
4.5.3 Capacity of waste management institutions….…………………………….………………….47
4.5.4 Regularity of waste collection……………………………………………..…………………..48
4.5.5 Secondary waste collection…………………………………………………………………………………………………………….….49
4.6 Solid waste transportation and disposal…………………………………………………...…….50
4.6.1 Solid waste transportation………………………………………………………………….…50
4.6.2.Solid waste disposal practice……………………………………………………….………..50
4.7 Public awareness and attitudes about SWM practices……………………………………….…51
4.8 Problems of solid waste management and sanitation in Hagerselam town…………………….53
5 CONCLUSIONS &RECOMMENDATIONS……………………………………………………57
5.1 Conclusion …………………………………………..…………………………...……………..57
5.2Recommendations…………………………………………………………...……….…………58
REFERANCES……………………………………………………………………………………..59
Appendices…………………………………………………………………….………………...…64

v
LIST OF TABLES
Table2.1. Sources of Solid waste generation……………………....................................................9
Tables2.2.Bio-degradableand non-biodegradable solid waste…………….………………...........10
Table2.3. Advantages and disadvantages of incineration...................................................……... 21
Table3.1.Primary data collection process…………………….…………….……….…………….29
Tables3.2.Systematic sampling procedure......................................................................................31
Table 4.1. The socio- demographic characteristics of respondents …………………….............35
Table 4.2.Solid waste generation rate of HHs in Hagerselam town ………...……………...........36
Table4.3.Physical composition of solid waste residential HHs, commercial and institution
sectors……………………………………………………………23………………………………..
38
Table4.4. Average physical composition of municipal solid waste sampled from disposal
site...................................................................................................................................................38
Table4.5. Mode and number of times to waste collection per in a week……................................41
Table 4.6. Primary solid waste collection services delivered to HHs by municipality and private
collectors……………………………………………………………………….............................41
Table 4.7 Solid waste reduction methods practice in Hagereselam town at HH and
municipalitylevels SW
reductionmethod…………………………………………………..………………..…43
Table 4.8 Community SW storage site handling practice at HH level and town levelKIs…….....43
Table 4.9 Available and required containers in Hagereselam town, 2019………………………..47
Table 4.10 Displays the equipment used for storing and collecting waste by the two institutions.48
Table 4.11 Summarizes the mode and number of times waste was collected in a week in the
Selected areas of study in the municipal………………………………………………………....49
Table 4.12 Waste transportation services delivered to HHs in Hagerselam town in 2019………50.
Table 4.13 Solid waste disposal practices of HHs and municipality…………............................51
Table 4.14 Public awareness and attitudes responses of HHs to Solid waste management in
Hagereselam town, 2019………………………………………………………………………….52
Table 4.15.Problem related to SWM and their level of difficulty..................................................55
vi
LIST OF FIGURES
Figure2.1. Work of Solid waste management process .........................................................…...7
Figure 2.2: Waste management hierarchies................................................................................17
Figure3.1. Map of study area………………………..................................................................27
Figure 4.1.Sources of solid waste in Hagereselam town.......................…................................40
Figure4.2. Household solid waste on site storage containers and its usage by percent……..…45
Figure4.3 Responsibility of solid waste handling and disposal in house level…………...........46
vii
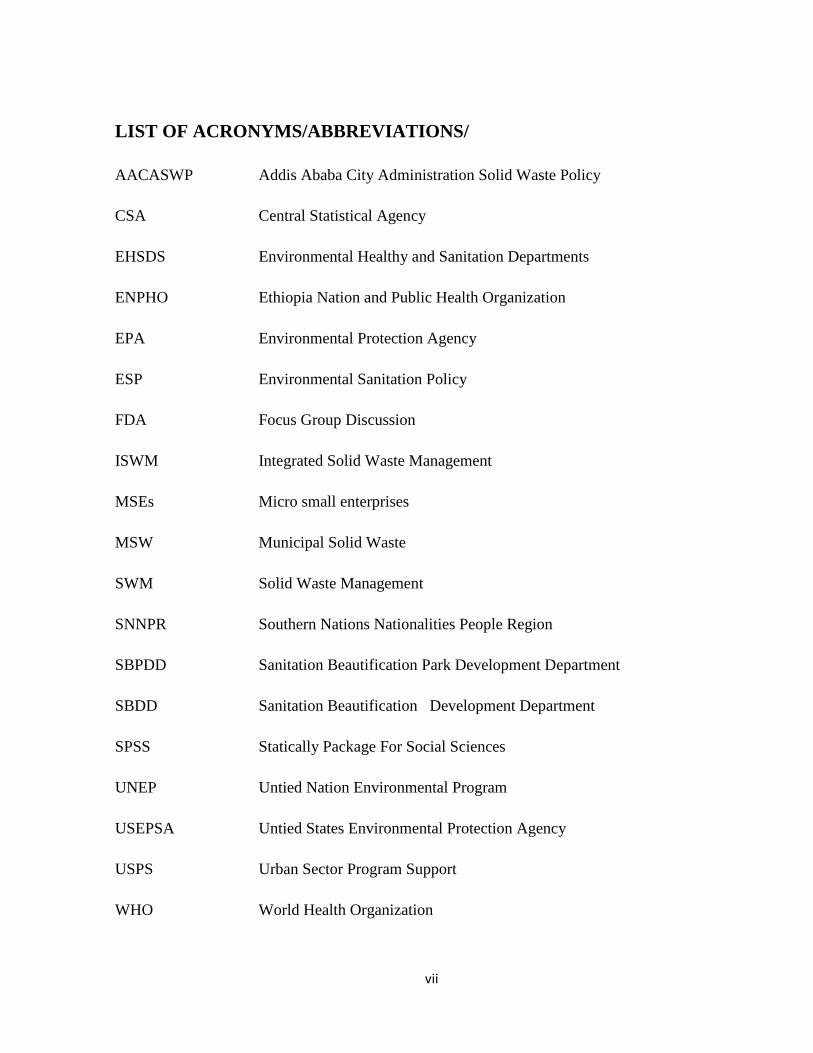
LIST OF ACRONYMS/ABBREVIATIONS/
AACASWP Addis Ababa City Administration Solid Waste Policy
CSA Central Statistical Agency
EHSDS Environmental Healthy and Sanitation Departments
ENPHO Ethiopia Nation and Public Health Organization
EPA Environmental Protection Agency
ESP Environmental Sanitation Policy
FDA Focus Group Discussion
ISWM Integrated Solid Waste Management
MSEs Micro small enterprises
MSW Municipal Solid Waste
SWM Solid Waste Management
SNNPR Southern Nations Nationalities People Region
SBPDD Sanitation Beautification Park Development Department
SBDD Sanitation Beautification Development Department
SPSS Statically Package For Social Sciences
UNEP Untied Nation Environmental Program
USEPSA Untied States Environmental Protection Agency
USPS Urban Sector Program Support
WHO World Health Organization
viii
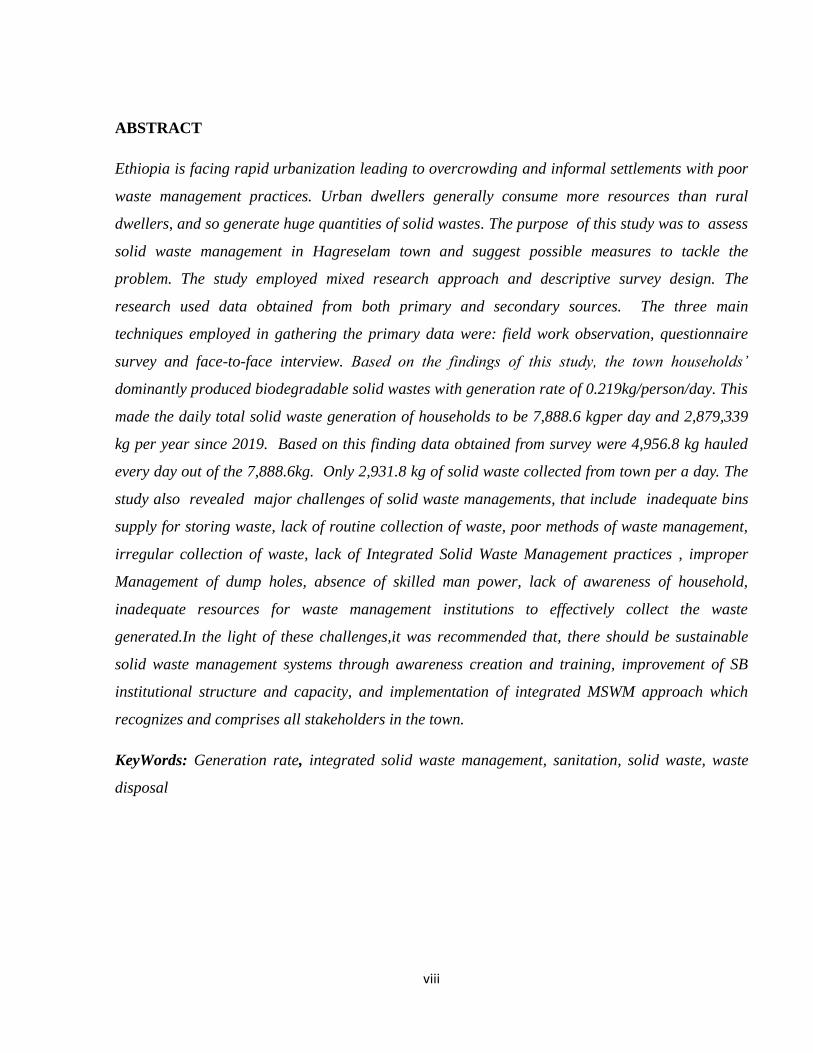
ABSTRACT
Ethiopia is facing rapid urbanization leading to overcrowding and informal settlements with poor
waste management practices. Urban dwellers generally consume more resources than rural
dwellers, and so generate huge quantities of solid wastes. The purpose of this study was to assess
solid waste management in Hagreselam town and suggest possible measures to tackle the
problem. The study employed mixed research approach and descriptive survey design. The
research used data obtained from both primary and secondary sources. The three main
techniques employed in gathering the primary data were: field work observation, questionnaire
survey and face-to-face interview. Based on the findings of this study, the town households’
dominantly produced biodegradable solid wastes with generation rate of 0.219kg/person/day. This
made the daily total solid waste generation of households to be 7,888.6 kgper day and 2,879,339
kg per year since 2019. Based on this finding data obtained from survey were 4,956.8 kg hauled
every day out of the 7,888.6kg. Only 2,931.8 kg of solid waste collected from town per a day. The
study also revealed major challenges of solid waste managements, that include inadequate bins
supply for storing waste, lack of routine collection of waste, poor methods of waste management,
irregular collection of waste, lack of Integrated Solid Waste Management practices , improper
Management of dump holes, absence of skilled man power, lack of awareness of household,
inadequate resources for waste management institutions to effectively collect the waste
generated.In the light of these challenges,it was recommended that, there should be sustainable
solid waste management systems through awareness creation and training, improvement of SB
institutional structure and capacity, and implementation of integrated MSWM approach which
recognizes and comprises all stakeholders in the town.
KeyWords: Generation rate, integrated solid waste management, sanitation, solid waste, waste
disposal
1
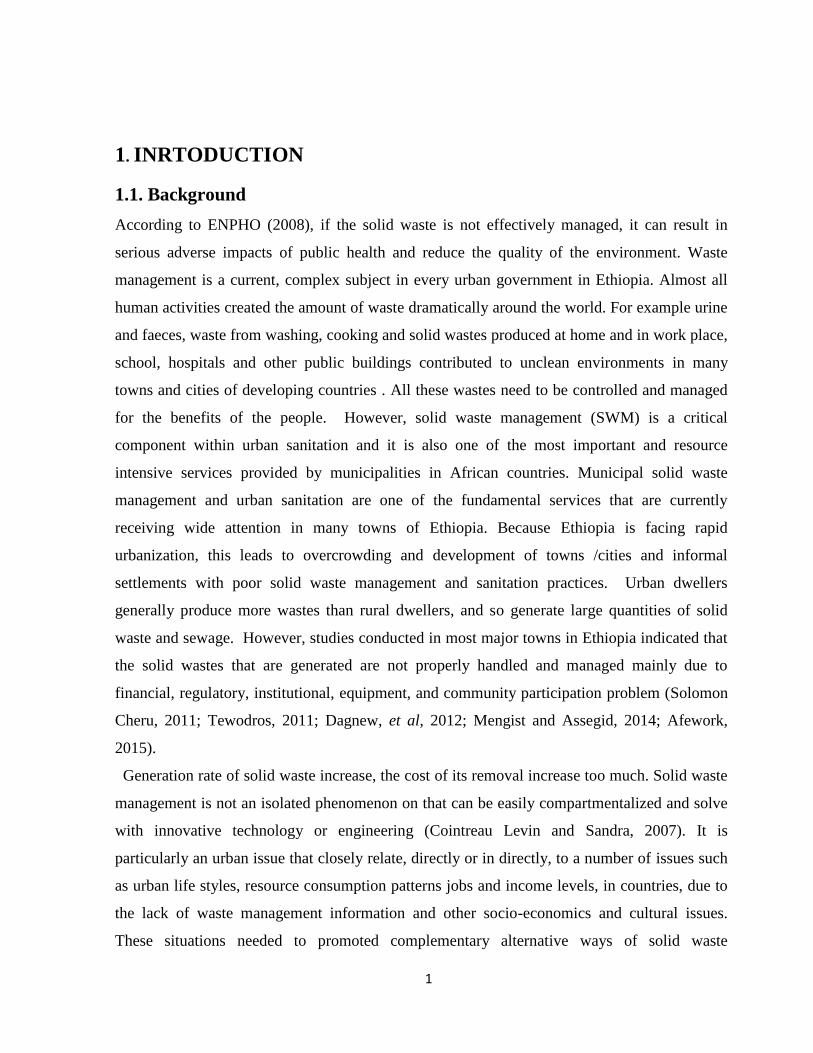
1. INRTODUCTION
1.1. Background
According to ENPHO (2008), if the solid waste is not effectively managed, it can result in
serious adverse impacts of public health and reduce the quality of the environment. Waste
management is a current, complex subject in every urban government in Ethiopia. Almost all
human activities created the amount of waste dramatically around the world. For example urine
and faeces, waste from washing, cooking and solid wastes produced at home and in work place,
school, hospitals and other public buildings contributed to unclean environments in many
towns and cities of developing countries . All these wastes need to be controlled and managed
for the benefits of the people. However, solid waste management (SWM) is a critical
component within urban sanitation and it is also one of the most important and resource
intensive services provided by municipalities in African countries. Municipal solid waste
management and urban sanitation are one of the fundamental services that are currently
receiving wide attention in many towns of Ethiopia. Because Ethiopia is facing rapid
urbanization, this leads to overcrowding and development of towns /cities and informal
settlements with poor solid waste management and sanitation practices. Urban dwellers
generally produce more wastes than rural dwellers, and so generate large quantities of solid
waste and sewage. However, studies conducted in most major towns in Ethiopia indicated that
the solid wastes that are generated are not properly handled and managed mainly due to
financial, regulatory, institutional, equipment, and community participation problem (Solomon
Cheru, 2011; Tewodros, 2011; Dagnew, et al, 2012; Mengist and Assegid, 2014; Afework,
2015).
Generation rate of solid waste increase, the cost of its removal increase too much. Solid waste
management is not an isolated phenomenon on that can be easily compartmentalized and solve
with innovative technology or engineering (Cointreau Levin and Sandra, 2007). It is
particularly an urban issue that closely relate, directly or in directly, to a number of issues such
as urban life styles, resource consumption patterns jobs and income levels, in countries, due to
the lack of waste management information and other socio-economics and cultural issues.
These situations needed to promoted complementary alternative ways of solid waste
2
managements in town/cities. Community participated to manage garbage in sustainable manner
in town. In the lower income a country, like Ethiopia, an estimated 30% to50% solid waste is
produced in urban area is left uncollected. Some viral and other infectious disease are
associated with waste and also served as habitat formation for breeding insects and mosquitoes.
The major solid waste management processes start at solid waste production, storage and
followed by solid waste collection, transferring and transportation. Over the last few years,
Ethiopia many micro and small enterprise have been set up to carry out waste per-collection
service
AbebeTegegn, (2006). Receiving payment either from the respective beneficiaries or
municipalities to collect waste and transport to the municipal waste containers, and help to fill
the created gaps in collecting and transporting wastes. The enterprises represented a good
starting point for building private sectors participation and realizing the associated benefits.
The rapid and constant growth of urban population has led to dramatic increases in urban waste
generation, with crucial socio-economic and environmental impact. Basically, municipalities
are giving references only on the collection of the waste and dumping it, while the principle of
3R‟s (wastes reduction, reuse, and recycle) are not prioritized by the municipalities for
sustainable solid waste management and urban sanitation. Increasing public awareness to the
necessity of clean environment for good health, at both local and national governments are
facing public pressure to the proper management of the municipal wastes (Solomon Cheru
2011). The solid waste management and sanitation proclamation, give emphasis of its essential
in community participation in order to prevent adverse effects and to enhance the benefit
resulted from the solid waste. Like other cities of developing countries implementation of the
proclamation most of the town in Ethiopia is suffered from the adverse effects of the plastic
materials like water bottle after their use.
Solid waste is any discarded materials which come from domestic, commercial, institutional
industrial…etc. arising from human activities which has no value to the people who possess it.
Waste disposal become problematic with the rise of towns and cities where large numbers of
people started to live together in relatively small areas in pursuit of livelihoods (Shafiul and
Mansoor, 2003). While population densities in urbanized areas and large per capital waste
generation increased, the available land for waste disposal decreased proportionality. Disparity
between rapid urban population growth and sanitation were infrastructure provision .Those
disparity is been worse by the big challenges of poor sanitation and solid waste management
practices. Poor urban sanitation and solid waste management was rapidly deteriorating

3
ecosystem of transforming cities in the countries. An urban solid waste management and
sanitation service in Ethiopia cites/towns are not good. From Ethiopia Sidama Zone town of
SNNPR, Hagerselam is one of the town by which proper provision of solid waste services is
unsatisfactory and incomplete. In Hagerselam town still now, people practices illegal dumping
of waste on open spaces, in gullies, river courses and roadsides is considered as routine task of
residents. The efforts made by municipality to change such kinds of situation in town are also
insufficient. These practices have to the extent resulted in serious problem of Environmental
health, financial impacts often affected the most vulnerable group. Therefore, in order to reduce
this situation and achieve efficient of the SWM system and sanitation of town, needed detail
study of the existing condition of SWM and sanitation services was required in Hagerselam
town 2018.
1.2 .Statements of problem
One of the social problems that have received considerable attention in recent years is the
problem of solid waste management and urban sanitation services. However, the problem
affects most groups of people, some group of people more vulnerable than others. Among the
many groups of people who are vulnerable to this sever:-
Problem was poor solid waste management services.
Poor awareness of community about environmental sanitation
Major factors that contributed to increased solid waste in developing country were:- Poor
community participation, lack of service quality,rapid population growth and rapid urbanization
outstripping service capacity, commercial activities, socio economic status of households and
lack of equipment. As a result solid waste management and sanitation has been a big challenge
to both developed and developing countries all over the world. An urban solid waste
management and sanitation in Ethiopia Sidama Zone town of SNNPR, Hagerselam is one of
the towns by which proper provision of solid waste services is unsatisfactory and incomplete.
Urban waste management has been a challenge for municipalities and urban governments.
Hagerselam town was characterized by rapid population growth caused by natural migration
from rural to urban. According to 1999 national census report, the town had 6787 total
population and while according to Hula municipal recent data in 2018 shows estimate total
population reached 36021.because people migrated from rural to urban. Such rapid growth of
population together with rapid development of town which have produced increased generation
rate of solid waste in town and poor urban sanitation in order to turn it induced greater
infrastructural towns in turn it, institutional set up and lack of community participation for its
4
management and urban sanitation. But, the town sanitation, beautification part development
department (SBPDD) which runs the urban sanitation and solid waste management. This
activities run by only one donkey powered cart for solid waste collection, transport and
disposal. In addition to this, there were no public waste storage containers and road side
dustbins, so that it highly suffers from storage of SWM infrastructures and face unmatched
burdens of collection, transportation and disposal of solid waste. Furthermore, SBPDD is
surrounding by different institutional constraints such as lack of sufficient skilled manpower,
weak finance and equipment, weak regulation and collecting mechanisms and insignificant
movement for public awareness creation in Hagereselam town. This limitation causes to
deterioration and reduces the quality of the town environment and also reinforces incorrect
disposal habits to the people. Most of the solid waste that is generates in the town remain
uncollected and simply dump in open area, roadsides, river courses, and gullies. Based on this
limitation, this study was important to population awareness on solid waste management and
sanitation to assess the effectiveness of existing solid waste management, urban sanitation and
arrangement in Hagerselam town. In order to reduce this situation and achieve efficient urban
solid waste management and sanitation system of the town needed detail studied of the existing
conditions of SWM services is required Hagerselam town in 2019. Most HHs used open
dumping site in town. This is widely practices in many developing countries and has hazardous
effect on health and the environment. The environmental sanitation conditions of the town have
become more serious problem from time to time and suffocation disturbed around town. This
activities increased immediate crisis to the peoplein the town. So that urgent needed of
efficient SWM on one hand and steady growth of solid waste management and urban sanitation
problem on the other side are still the main features of this town. Detailed study of the overall
condition of SWM and urban sanitation services should be the first move required for reducing
this gap even as indicated by sanitation, beautification and park development department of
Hagereselam town. Therefore, this study would focus on examining current status of SWM
and urban sanitation in Hagereselam town
1.3. Objectives of study
1.3.1. General Objective
To investigate the solid waste generation rate, composition and its management in
Hagereselam town.
1.3.2 Specific Objectives
To determine waste generation rate and composition of solid waste in Hagereselam town
5
To identify sources of solid waste in town.
To evaluate solid waste management practices methods in Hagereselam town
To describe the challenges of solid waste management and sanitation in town
1.4. Research question
1. How many kg of solid waste is generated per day from study areas?
2 What are major physical components of waste generated in the area?
3. What are sources of solid waste in Hagereselam town?
4. What arethe challenges of solid waste management and sanitation in the town?
1.5. Significance of study
Solid waste management and urban sanitation has become a major challenge in Hula district
special Hagereselam town in recent times. This deserves not only the attention of the municipal
and SBPDD but also concerns of corporate organizations and individuals to find a lasting
solution to the problem. This is because; vital human resources could be lost through poor
waste solid managements and sanitation. These will affect beautification, productivity and
quality in the town. The study therefore, intends to explore appropriate strategies and
recommendation in clearing solid waste in all segments in the town in a sustainable manner.
Despite the immensity of the problem before no research conduct on urban sanitation and solid
waste management have been carries out in Hagereselam town. The study would be serving as
a reference point to the other Hula District areas and municipalities and SBPDD as far as
sanitation and solid waste management are concern. In these cases, it would be given them in-
depth understanding of what are the problems of sanitation and solid waste management and
the strategies to tackle the problems. Additionally, the study would be contributed to existing
body of knowledge on solid waste management and also stimulates further research on the
subject in other Hula District towns and municipalities.
1.6. Delimitation (Scope) of Study
Both qualitative and quantitative techniques are used for data analysis. Geographically, the
study area cover Hagereselam town sidama zone, southern Ethiopia. Hagereselam town was
selected because it is a growing city just like other Southern towns such as Hawassa, Yirgalem
and AletaWondo, and was facing a bigger problem of managing its solid waste effectively.
Contextually, the study focuses on domestic solid waste management and urban sanitation. This
is because most of time solid wastes basically coming from households, shop and construction.
If a solid waste dumping open area, road side in the town, it reduces the quality of
Environment. Estimate about 85% of solid waste generate in Hagereselam townmostly

6
comesfrom domestic sources (municipal report, 2016). Basically, this study following mixed
research approach and descriptive research design.
1.7. Limitations of the Study
Researcher may face the following short-coming while conducting the research trains. There
is may be absence of capacity building activities, less clarity on recorded document and
keeping activities of solid waste, lack of reference materials and other related documents in the
area, lack of budget and time. Large sample size may obstacle to gather enough and appropriate
data.
7
2. REVIEW LITERATURE
2.1. Conceptual frame work
Chapter explores literature on solid waste management and urban sanitation in the country. It
examined the key concepts, methods and problems of waste management and sanitation in
Ethiopia cities/towns. According to Ethiopia city administration research report states on
assessment of solid waste management and sanitation is one of the highly expanding and
rapidly growing cities of Ethiopia (UNEP, 2010a;Chinasho, 2015). With the current annual
population growth rate of 6.6%continuing, the city population would double in 11years (UNEP,
2010b; Christian et al .2014; Fenta, 2017,).Therefore, the need for adequate solid waste
management is unquestionable (Meketeet al., 2009). According to UNEP (2010a), one of the
challenges that Ethiopian cities /towns such as Bihar Dar ,Addis Ababa, Jijidga, Gonder,
Hawassa and other have much problems of sanitation and waste management. In generally
solid waste management in particular. As much as 98.8 tons of solid waste is daily produced in
the city of Bihar Dar; however, the city municipalities collect and dispose only 58% of this
amount of waste.According toFikreYesus, 2011 reported that small proportions of the urban
dwellers are served and large quantity of solid waste is left uncollected, from which, concluded
that the problem of solid waste management cannot be solved only by efforts of municipal
government. Ethiopia is facing rapid urbanization leading to overcrowding and development of
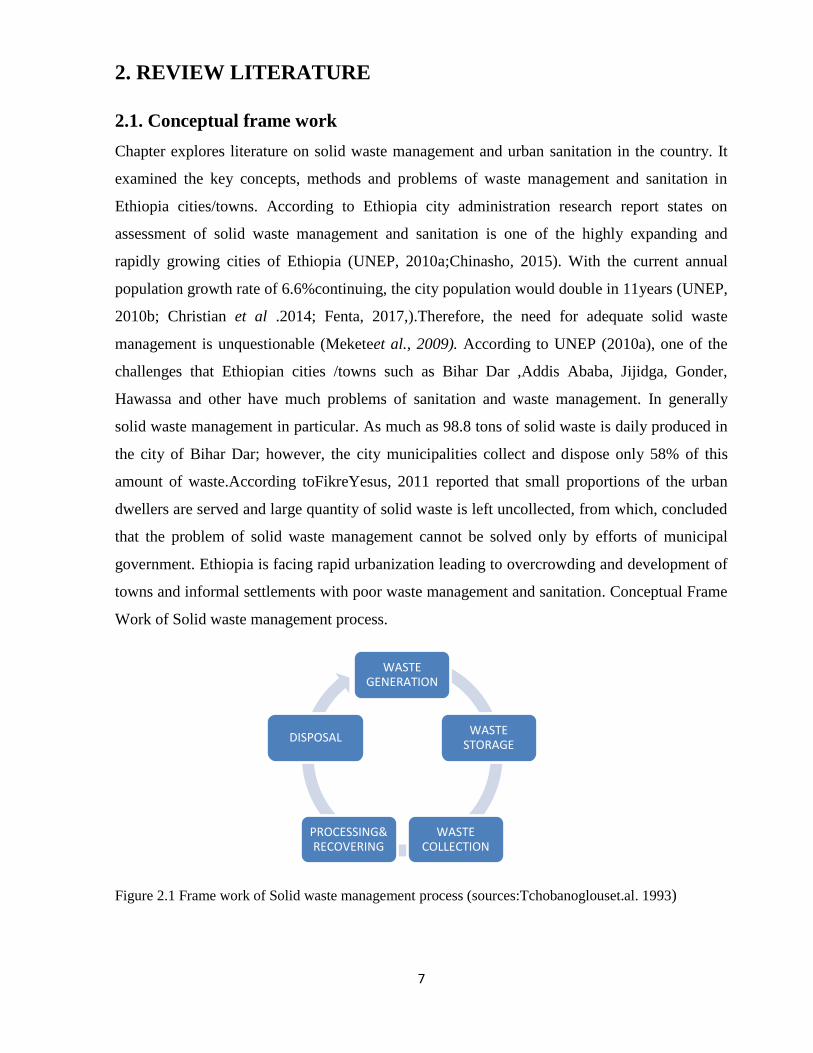
towns and informal settlements with poor waste management and sanitation. Conceptual Frame
Work of Solid waste management process.
Figure 2.1 Frame work of Solid waste management process (sources:Tchobanoglouset.al. 1993)
WASTE GENERATION
WASTE STORAGE
WASTE COLLECTION
PROCESSING& RECOVERING
DISPOSAL
8
2.2. Solid Waste Concept
Solid waste technically, is any solid materials disposed of as no longer useful in common usage
the tern has somewhat more limited meaning of solid materials thrown out by householders.
Those materials referred to by engineers as municipal solid waste. Solid waste can be classified
into two based on their effect such as hazardous and non -hazardous waste. It is defined as any
garbage, refuse, sludge from a waste treatment plant, water treatment plant, or air pollution
control facility and other discarded material, including solid, liquid, semi liquid or contained
gaseous material resulting from industrial, commercial, mining and agricultural operations and
from community activities, but didn‟t included solid or dissolved materials in domestic sewage
(Benny j. 2005).Solid wastes are wastes arise from human and animal activities, including the
heterogeneous mass of garbage from the urban community as well as more homogeneous
accumulation comprising of countless different materials such as food wastes, packaging
materials such as paper, metals, plastic, glass, construction wastes, pathological wastes and
hazardous wastes. Rapid growths of population and urbanization in Ethiopia cities/towns have
led to the generation of enormous quantities of solid wastes and consequently environmental
degradation.
2.3 .Sources and types of solid waste
In Ethiopia solid waste generated from various place. In these sources there are diverse types of
solid wastes. In order to categorize what exactly municipal solid waste constitutes, there have
been different attempt suffocate ionization based on numerous classification criteria. Some
those criteria are source from which solid waste emanates, and nature of solid wastes
components. On the basis of the nature of items that constitute solid wastes, it can be classified
in to organic or inorganic, combustible or non- combustible and putrescible or non- putrescible.
its respect to sources from which solid wastes emanates, (Martin, 2000) categorized municipal
solid waste as households (residential) refuse, institutional wastes, street sweeping, commercial
area wastes as well as construction and demolition places. SWM also contain various amounts
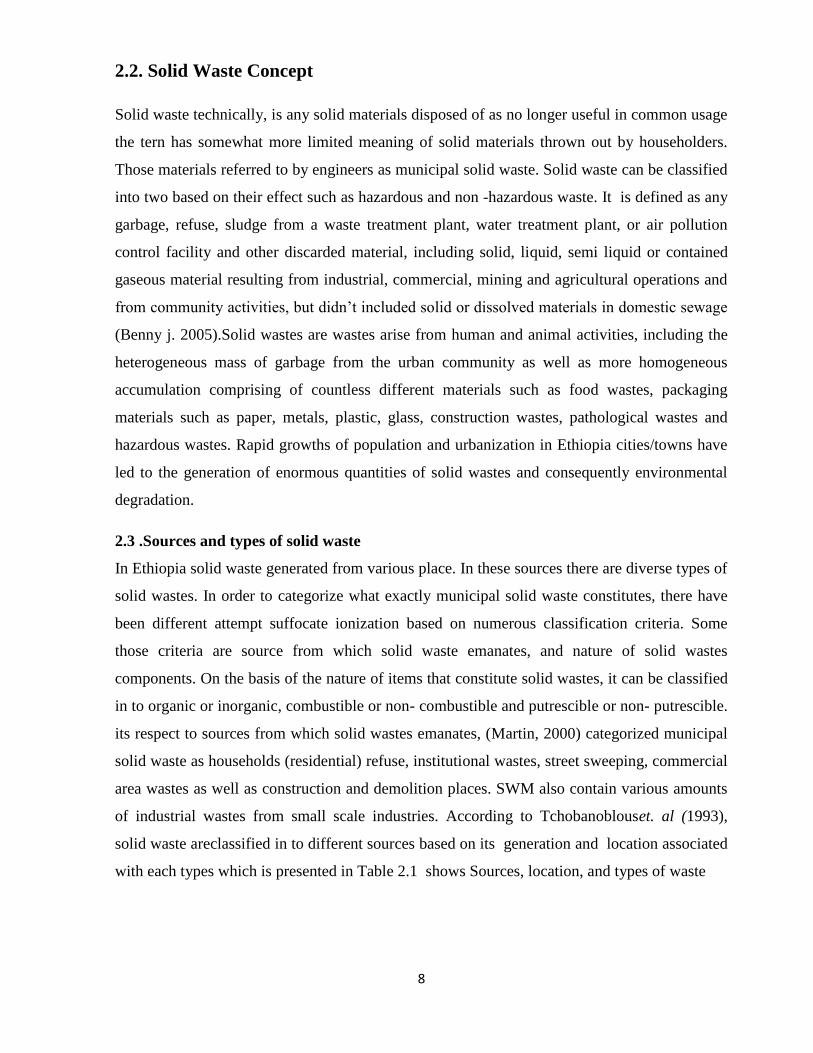
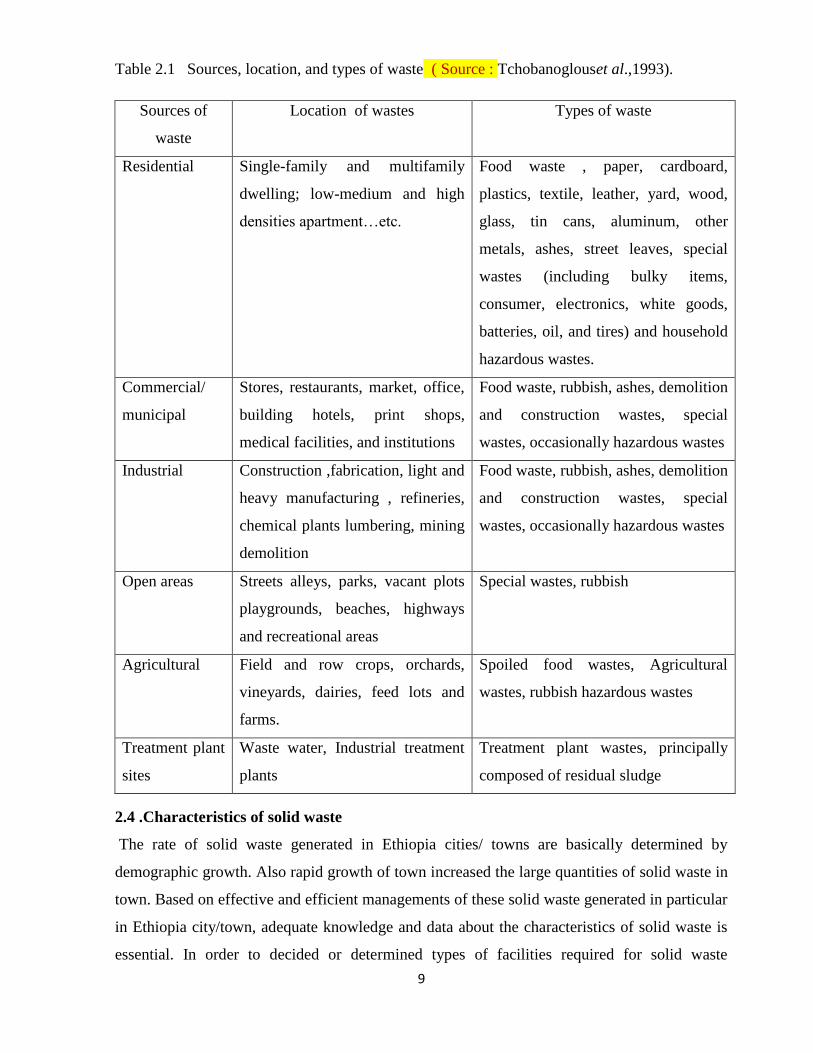
of industrial wastes from small scale industries. According to Tchobanoblouset. al (1993),
solid waste areclassified in to different sources based on its generation and location associated
with each types which is presented in Table 2.1 shows Sources, location, and types of waste
9
Table 2.1 Sources, location, and types of waste ( Source : Tchobanoglouset al.,1993).
Sources of
waste
Location of wastes Types of waste
Residential Single-family and multifamily
dwelling; low-medium and high
densities apartment…etc.
Food waste , paper, cardboard,
plastics, textile, leather, yard, wood,
glass, tin cans, aluminum, other
metals, ashes, street leaves, special
wastes (including bulky items,
consumer, electronics, white goods,
batteries, oil, and tires) and household
hazardous wastes.
Commercial/
municipal
Stores, restaurants, market, office,
building hotels, print shops,
medical facilities, and institutions
Food waste, rubbish, ashes, demolition
and construction wastes, special
wastes, occasionally hazardous wastes
Industrial Construction ,fabrication, light and
heavy manufacturing , refineries,
chemical plants lumbering, mining
demolition
Food waste, rubbish, ashes, demolition
and construction wastes, special
wastes, occasionally hazardous wastes
Open areas Streets alleys, parks, vacant plots
playgrounds, beaches, highways
and recreational areas
Special wastes, rubbish
Agricultural Field and row crops, orchards,
vineyards, dairies, feed lots and
farms.
Spoiled food wastes, Agricultural
wastes, rubbish hazardous wastes
Treatment plant
sites
Waste water, Industrial treatment
plants
Treatment plant wastes, principally
composed of residual sludge
2.4 .Characteristics of solid waste
The rate of solid waste generated in Ethiopia cities/ towns are basically determined by
demographic growth. Also rapid growth of town increased the large quantities of solid waste in
town. Based on effective and efficient managements of these solid waste generated in particular
in Ethiopia city/town, adequate knowledge and data about the characteristics of solid waste is
essential. In order to decided or determined types of facilities required for solid waste
10
management ,best disposal options and projecting future needed requires precise information
about quantities, compositions, densities, moisture content and calorific value of solid waste
produced in Ethiopia city (Rushbrook 1999 in G/Tsadkan 2002). Through all the above
characteristics are important, for this study the researcher emphasize only on municipal SWM
practices with due to attention also given to the role community participation. Solid waste
generation rate: refers to the “amount of waste disposed during a given period of time and the
quantification of it involves different methods: by measurement at the point of generation,
through used of vehicle survey and by examination of records at the disposal facility”(UNEP
2009; cited in Zebenay 2010). Waste is more easily recognized than defined. Something can
become waste when it was no longer useful to the owner or it was used and failed to fulfill its
purpose (Gourlay, 1992 cited by Freduah, 2004). There are basically two types of wastes
namely solid and liquid wastes. But for the purpose of study, the focus was on solid waste
management and urban sanitation. The term solid waste has been defined differently by various
authors. Solid waste was any materials that arise from human and animal activities that are
normally discarded as useless or unwanted (Tchobanoglouset al., 1993). According to Zerbock
(2003), solid waste includes non-hazardous industrial, commercial and domestic waste
including house holding organic trash, street sweeping, and instructional garbage and
construction wastes. Urban sanitation in Ethiopia June/2011 FMOH Urban population is
projected to triple from 15.2million in 2012 to 42.3 million in 2037 new attractions are
industrial park opening up of universities and other modern establishments tourism and market
opportunity pollution due to weak managements of waste and poor hygiene practices was a
common features for all size of Ethiopian towns. Major sources of solid waste generated from
home, GebrieKassa, (2009).Managements of domestic solid waste in operational analysis and
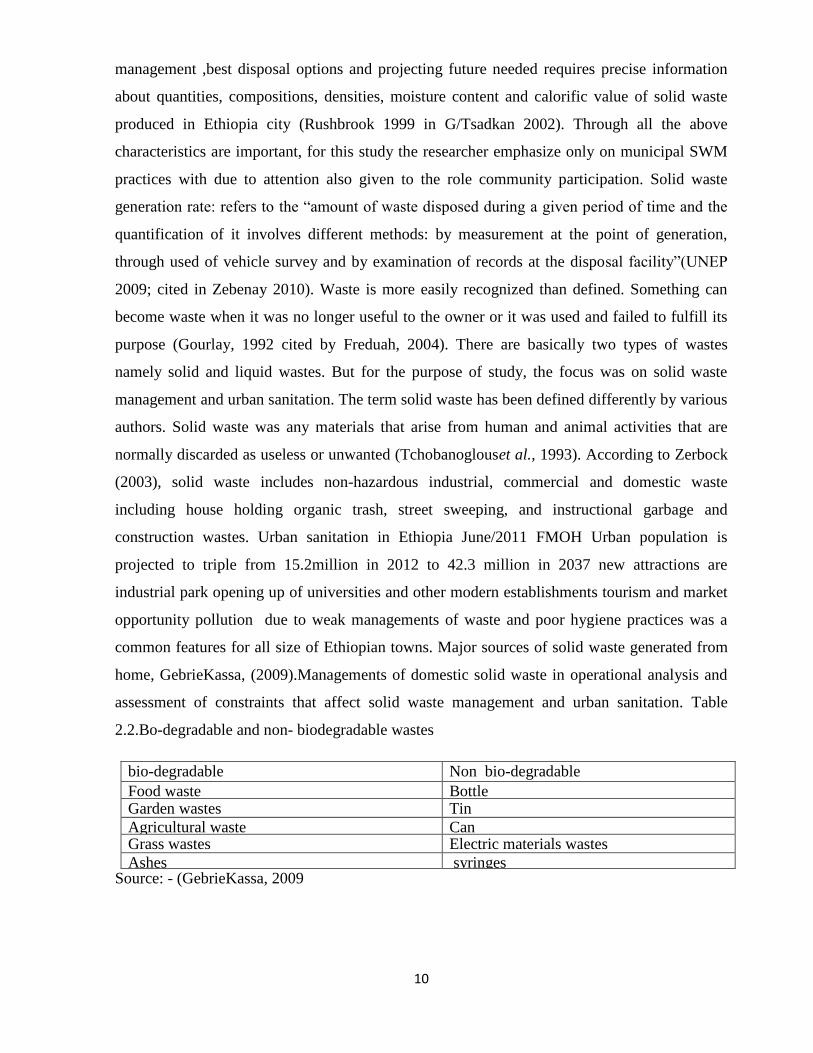
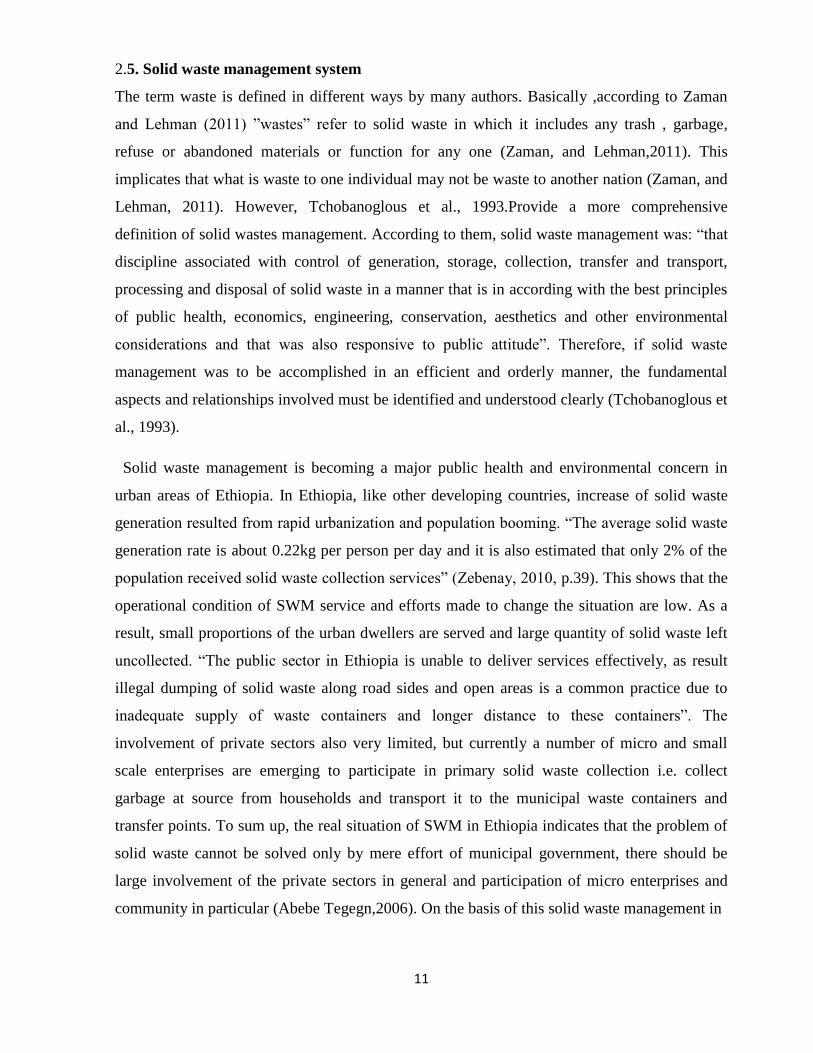
assessment of constraints that affect solid waste management and urban sanitation. Table
2.2.Bo-degradable and non- biodegradable wastes
bio-degradable Non bio-degradable
Food waste Bottle Garden wastes Tin
Agricultural waste Can Grass wastes Electric materials wastes
Ashes syringes Source: - (GebrieKassa, 2009
11
2.5. Solid waste management system
The term waste is defined in different ways by many authors. Basically ,according to Zaman
and Lehman (2011) ”wastes” refer to solid waste in which it includes any trash , garbage,
refuse or abandoned materials or function for any one (Zaman, and Lehman,2011). This
implicates that what is waste to one individual may not be waste to another nation (Zaman, and
Lehman, 2011). However, Tchobanoglous et al., 1993.Provide a more comprehensive
definition of solid wastes management. According to them, solid waste management was: “that
discipline associated with control of generation, storage, collection, transfer and transport,
processing and disposal of solid waste in a manner that is in according with the best principles
of public health, economics, engineering, conservation, aesthetics and other environmental
considerations and that was also responsive to public attitude”. Therefore, if solid waste
management was to be accomplished in an efficient and orderly manner, the fundamental
aspects and relationships involved must be identified and understood clearly (Tchobanoglous et
al., 1993).
Solid waste management is becoming a major public health and environmental concern in
urban areas of Ethiopia. In Ethiopia, like other developing countries, increase of solid waste
generation resulted from rapid urbanization and population booming. “The average solid waste
generation rate is about 0.22kg per person per day and it is also estimated that only 2% of the
population received solid waste collection services” (Zebenay, 2010, p.39). This shows that the
operational condition of SWM service and efforts made to change the situation are low. As a
result, small proportions of the urban dwellers are served and large quantity of solid waste left
uncollected. “The public sector in Ethiopia is unable to deliver services effectively, as result
illegal dumping of solid waste along road sides and open areas is a common practice due to
inadequate supply of waste containers and longer distance to these containers”. The
involvement of private sectors also very limited, but currently a number of micro and small
scale enterprises are emerging to participate in primary solid waste collection i.e. collect
garbage at source from households and transport it to the municipal waste containers and
transfer points. To sum up, the real situation of SWM in Ethiopia indicates that the problem of
solid waste cannot be solved only by mere effort of municipal government, there should be
large involvement of the private sectors in general and participation of micro enterprises and
community in particular (Abebe Tegegn,2006). On the basis of this solid waste management in
12
Ethiopia city/town incorporates the following: source separation, storage, collection,
transportation, and disposal of solid waste in an environmentally sustainable manner. Solid
waste management system encompasses all the activities ranging from the point of generation
of Disposal. Classifying these activities would helped to identified and understood the
problems associated with solid waste management system and urban sanitation give proper
responses to improve the service.
The functional element in solid waste management includes wastes generation, waste
collection, and waste transportation, waste processing and recycling and finally disposal. An
understood of the rate of generation would help those who administrate waste management to
identify the type and number of containers, collection methods and frequency of disposal of the
waste. In addition, it also helped to identify the sources and types of solid waste and the factors
that influence them. The activities of waste generation are highly dependent upon the individual
preferences. Thus, to avoid, minimize, or sort out waste materials as its sources required, active
participation of the waste generating households, commercial and industrial companies, and
their employees (Harrison, 1996). The processing of solid wastes especially at their sources
many involved reducing the volume of the solid waste that was ready for collection and
disposal, altering physical form of the solid wastes to reduce the size of the individual items &
recovering usable materials from solid wastes. Waste generators or private firms many carried
out such kinds of process. Next solid waste collection services could be provided by different
agents. It could be provided by the municipality, private companies under contract or private
enterprises. Even through each of the these agencies has certain pros and cons, the wastes
collection service in an Ethiopia city could be performed either by the three agencies
simultaneously, by two of them or by only one agency (Hagerty, 1973 international city
manager Association,1957).
2.6 .Solid waste management processes
The key elements in solid waste management processes includes: - waste generation, storage,
collection, transfer &transport, processing and recovery and final disposal. This means that
when waste is generated it was first stored in either dustbin or skips. It was then collected and
finally disposed of in landfill. Also, when waste was collected it could be transferred from
small collection equipment like the tricycle to bigger truck for final disposal on the other hand;
waste collected can be processes recovered materials to be reused.
13
2.6.1. Solid waste generation
In case of our country, there are rapid growths of solid waste generation in Ethiopia cities/town.
Waste generation encompasses those activities in which materials are identified as a longer
being of value and were either thrown away or gathered together for disposal (Momob and
Oladebeye, 2010). According to (UNEP, 1996).The total amount of municipal solid waste
(MSW) generated globally reached 2.2 billon tones, representing a 7% annual increase since
2003. It is further estimated that between 2007 and 2011, global generation of (UNEP, 1996).
The program also said that, as per, WHO estimations, the total health care waste per person per
year in most low income countries, was anywhere from 0.6kg to 3kg. That was not
withstanding, the cause of this increased should have enumerated by the organization and
therefore, hasn‟t exhausted the issue on discussion. It was accepted that solid waste generation
was increasing at a faster rate globally as indicated by UNEP and was confirmed by (Solomon
et al., 2011).The rate of solid waste generated in a Ethiopia town is basically determined by
demographic growth per in a years.
2.6.2 .Storage
Techobanoglouset al.,(1977), explain storage to mean where solid wastes were stored before it
was collected. It could be in a skip or dustbins and not thrown a ways in discriminately.
According to them, storage is primary importance because of the aesthetic consideration.
2.6.3 .Collection
Collection involved the process of picking up of wastes from collection points, loading them in
to vehicle, and transporting it to processing facilities, transfer stations or disposal site. In most
municipal solid waste management systems, cost of collection accounts a significant portion of
total cost. Collection is structurally similar in developing and developed countries, but there
were important technical and institutional differences in implementation. In most case,
industrialized countries have more efficiency and effectiveness than developing ones in
participation, and demographic and social factors relevant to collection. In developing
countries, collection often involves a face to transaction between generator and collector. The
level of service is low, and generators often have to bring their wastes long distances and place
it in containers, (UNEP, 1996). As a result many collection activities in developing countries
carried out by in formal sectors (UNEP, 1996). In general, there are four basic methods of
collection described by (Techobanoglouset al., 1993).
Community bins-they are replaced in convenient locations where community members
carried waste throw it in. this methods was comparatively cheaper than other methods, and
14
most widely adapted it is important that bins are covered, aesthetic attended regularly kept
clean, easily to handle, and separate bins are provided.
Curbsides collection home owner is responsible for replacing containers to be emptied at
the curb on collection day and for returning empty containers to their storage location until
the next collection.
Block collection- collection vehicles arrived at particular places or asset day and time to
collect waste from households. Household hold bring their waste containers and empty
directly into the vehicle. This methods required higher home owner cooperation and
scheduled service for home owner collaboration.
Door to door collection waste is placed at door step a set time when waste collectors arrive.
In this method, collector of waste has responsibility to collect waste separately. This
method is very convenient for households, however required homeowner cooperation.
2.6.4. Transfer and transport
Transfer and transport involves two steps: (1) of transfer of wastes from the smaller collection
vehicle to the larger transport equipment and (2) the subsequent transport of the waste, usually
over long distances to the final disposal sites (Felix, 2010). These activities were associated
with transfer of wastes from public storages facilities to collection vehicle and the subsequent
transport of wastes to disposal sites. Transfer refers to movement of wastes or wastes or
materials from primary collection vehicle to a secondary, larger and more efficient transport
vehicle. When location of final disposal site was at a long distance from points of collection,
transfer stations may be used. With respect to transfer stations, “there are two basic mode of
operation: direct discharge and storage discharge. In storage discharge refuse was first emptied
from collection trucks into a storage pit or to a large plat form. While indirect discharge station,
each refuse truck empties directly in to larger transport vehicles” (Meenakshi, 2005).
Transportation on the other hand covers all types of vehicles under operation to transport solid
waste from it generation point to transfer station and then to treatment or disposal site. “All
vehicles in operation were considered including manually driven small carts mechanically
driven sophisticated transportation vehicle, and special vehicles for hazardous, bulky, and
recyclable wastes generally, a properly design transfer & transportation system highly reduces
cost of collection “(Ibid,2005).
15
2.6.5 Processing and Recovery
This functional element included all techniques, equipment and facilities used both to improve
the efficiency of other functional elements and to recover usable materials, conversion
products, produce energy, and compost from solid wastes. In addition it also provided several
advantages. First, it can serve to reduce total volume and weight of waste materials that
requires collection &final disposal volume reduction also helps to conserve land resources
since land was the ultimate sink for most waste materials. On other side, it also reduced total
transportation cost of waste to its final disposal site (Uriarte and Filemon, 2008). Solid waste
processing and recovery has been carried out beginning from separation and processing of
waste at the source. But separations of mixed waste usually occur at materials recovery
facilities, transfer stations, combustion facilities and disposal sites. It often includes separation
bulky items, separation of waste components by size using screens, manual separation of waste
components, and separation ferrous metals. Then they enter in small and large scale industries
for recovery activities. For examples, organic fraction of SWM can be transformed by a variety
of biological and thermal processes. The most commonly used biological transformation
process is aerobic composting and, the most commonly used thermal transformation process
was incineration (Uriarte and Filemon, 2008). The element of processing and recovery includes
all the technology, equipment, and facilities used both to improve the Efficiency of other
functional elements and to recover usable materials, conversion products or energy from solid
wastes. In the recovery, separation operation have been devised to recover valuable resources
from the mixed solid wastes delivered to transfer stations or solid waste processing plants
(Tchobanoblouset al, 1977).
2.6.6 Disposal
Disposal is final functional elements in solid waste management and sanitation system.
Disposal activities are associated with final dumping of solid waste directly to a landfill site.
Today disposal of waste by land filling or land spreading is ultimate fate of all solid wastes
weather they were residential wastes or materials from materials recovery facilities. However,
in most developed countries this method was officially banned allowing only sanitary landfill
for final disposal. Because sanitary landfills is not a dump it is an engineered facility used for
disposing of solid waste on land without creating nuisances or hazards to public health and
environment (Solomon Cheru, 2011).“ Though it is the most common technology around the
world, conventional and environmental unfriendly methods such as open burning, open
16
dumping and non-sanitary landfill can still be used as disposal method‟‟(Solomon Cheru,
2011).
2.7 Early practices of solid waste management
According Techobanoglous et al. (1993), the most commonly recognized methods for the final
disposal of solid waste were: dumping on land, canyons and mining pit(digging hole), dumping
in water, ploughing in to the soil, feeding to hogs(Asama)and reduction and incineration. Some
of these unwholesome practices of solid waste identified during the early disposal practices still
exist in cities, towns and villages today. Indiscriminate dumping on opened land and dumping
in gutters (boh) particularly were clearly evident in towns and cities, while dumping in water
specially people living in coastal towns was common place. Burning of dumps is also common
in per-urban and rural communities in Ethiopia and in many other less developed countries. A
study carried out in Ado-Akiti in Nigeria by Momoh and Oladebeye (2010) showed that, the
method of solid waste disposal include dumping of waste in gutters, drains, by roadside,
unauthorized dumping site and stream channels during raining season and burning of wastes on
unapproved dumping sites during the dry season. This has gone to confirm that the practices of
solid waste disposal in the 1950s still exist today and study area is not an exception. People
dumping waste anywhere may because they have not dustbins for then to store their waste for
collection. Having assessed how solid waste was disposed in the early days, the next section
discusses the contemporary methods of managing solid waste.
2.8. Contemporary methods of managing solid waste.
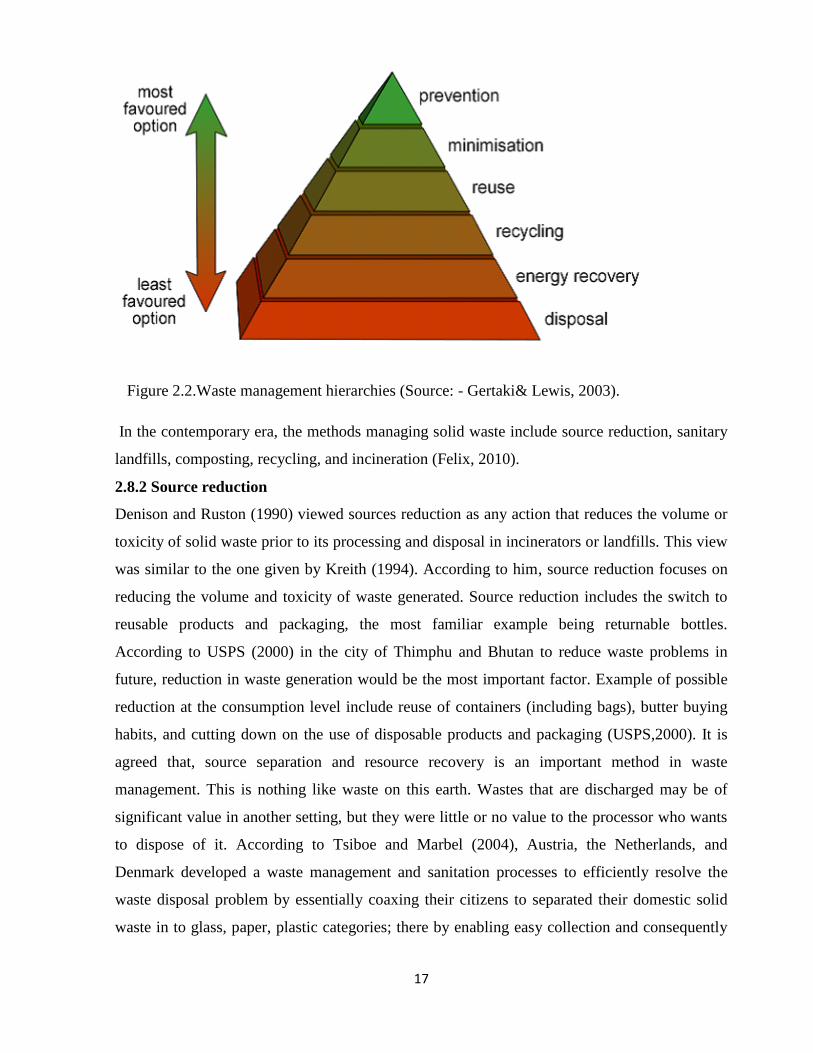
2.8.1. The concept of waste management hierarchy
Waste Management Hierarchy is best described by the “3Rs” denoting reduce, reuse, recover
and eventually followed by unavoidable its final disposal to the landfill (Gert Saki &Lewis.,
2003). The best way to protect the environment isn‟t to generate waste in the first place (the
pipe control approach focusing on sources reduction). This is the contemporary approach
prevention (Briliante& Frank., 2009). Based on this statements “prevention is better than cure”
17
Figure 2.2.Waste management hierarchies (Source: - Gertaki& Lewis, 2003).
In the contemporary era, the methods managing solid waste include source reduction, sanitary
landfills, composting, recycling, and incineration (Felix, 2010).
2.8.2 Source reduction
Denison and Ruston (1990) viewed sources reduction as any action that reduces the volume or
toxicity of solid waste prior to its processing and disposal in incinerators or landfills. This view
was similar to the one given by Kreith (1994). According to him, source reduction focuses on
reducing the volume and toxicity of waste generated. Source reduction includes the switch to
reusable products and packaging, the most familiar example being returnable bottles.
According to USPS (2000) in the city of Thimphu and Bhutan to reduce waste problems in
future, reduction in waste generation would be the most important factor. Example of possible
reduction at the consumption level include reuse of containers (including bags), butter buying
habits, and cutting down on the use of disposable products and packaging (USPS,2000). It is
agreed that, source separation and resource recovery is an important method in waste
management. This is nothing like waste on this earth. Wastes that are discharged may be of
significant value in another setting, but they were little or no value to the processor who wants
to dispose of it. According to Tsiboe and Marbel (2004), Austria, the Netherlands, and
Denmark developed a waste management and sanitation processes to efficiently resolve the
waste disposal problem by essentially coaxing their citizens to separated their domestic solid
waste in to glass, paper, plastic categories; there by enabling easy collection and consequently
18
reuse. As suggested by the three authors, one way of effectively managing solid waste is to
minimize solid waste generation through source reduction.
2.8.3 Sanitary landfill
Sanitary land filling included confining the waste, compacting it and covering with solid. It not
only prevents burning of garbage but also helps in reclamation of land for valuable use (center
for Environment and development, 2003). The placement of solid waste in landfills was the
oldest and definitely the most prevent form of ultimate waste disposal (Zerbock, 2003). He
further argued that argued that “land fills”are nothing more than open, sometimes controlled
dumps. According to him the difference between landfills and dumps is the level of
engineering, planning, and administration involved. Open dumps are characterized by the lack
of engineering measures, no leachate management, no consideration of landfill gas
management, & few, if any operational measures such as registration of users, control of the
number of “tipping fronts” or compaction of waste (Zerbock,2003). Furthermore, landfills are
one form of waste management that nobody wants but everybody needs (Kreith, 1994).
According to him, there are simply no combinations of wastes management‟s techniques that
do not require land filling to make them work. Of the basic management options of solid waste,
landfills are the only management techniques that are both necessary and sufficient. According
to Kreith (1994)-, some waste are simply not recyclable, many recyclable waste eventually
reach a point where their intrinsic value was completely dissipated and they no longer can be
recovered, and recycling itself produces residuals. He further highlighted that the technology
and operation of modern landfill could assured the protection of human health and the
environment.
2.8.4. Recycling
It is an important way of collecting solid waste materials and turning them in to useful products
that can be solid in the market place. Such materials could be reprocessed in two ways: primary
and secondary. Primary recycling is a process in which original waste materials is made back in
to the same materials for example, newspapers recycled to make newsprint. In secondary
recycling, waste materials are made in to different products that may or may not be recyclable
for instance, cardboard from waste newspapers (Miller, 2007).Recycling is both environmental
and economic issue. Many peoples are motivated to recycle because of environmental concern.
i.e it reduces pollution, it also save energy, space and resources, helps to protect biodiversity
and reduce litter. Economically, it could be save money for items like paper, metals and some
plastics, and generally it is important part of economy. However, there are also some critics
19
forwarded on cycling dominantly on economic aspect of its benefits. Economists say that
recycling does not make sense if it is costs more to recycle materials than to send them to a
landfill or incineration. They also forwarded that recycling was often not needed to save
landfill space because many areas are not running out of it (Miller, 2007). Kreith (1994) has
also added that, recycling is the most positively perceived and doable of all the waste
management options. According to him recycling would return raw materials to market by
separating reusable products from the rest of the municipal waste stream. The benefits of
recycling are many, he added. It saves precious finite resources, lessens the needed for mining
of virgin materials which lowers the environmental impact for mining and processing. Having
proposed recycling by different authors as the best option to manage solid waste in modern
time; they have forgotten about the cost component which is key to successful implementation
of any recycling project.
2.8.5. Composition of solid waste
According to international journal of scientific& technology research volume 4 issues assessing
the current status of solid waste management of Ethiopia (Mohammed Gedefaw, 2015).States
that urban solid wastes can be segmented into two major components called biodegradable and
non-biodegradable. The biodegradable components of urban solid waste constitutes organic
wastes such as food waste, garden waste and agricultural waste which undergo biological
degradation under controlled conditions and can be turned into compost or organic fertilizer.
While non -biodegradable wastes include inorganic materials which can‟t be decomposed and
degraded (cited by Solomon Cheru, 2011). From our own observations in disposal site, illegally
dumping areas and in residential areas, physical composition of municipal solid waste is also
composed from both biodegradable and non-biodegradable components. The construction and
demolition waste that is generated during the course of repair, construction, and destruction
activities constituting sands, soil stones, nails, cement concrete and wood are also observed in
the town. This is due to high construction activities of the town and such wastes are not stored
by wastes generator within their compound rather they deposited just outside in streets,
roadside and open areas. Different types of medical wastes such as syringes, gloves, glucose
materials etc. from hospitals, clinics, and other health care establishment are also detected in
different disposal areas of the town. But such wastes should be managed carefully and
separately from the above types of solid wastes because of its hazardous health impacts
(source: solid waste consists of many different materials. some can burn, some cannot burn.
Some can be recycled, some cannot recycle. Therefore, a detailed understanding of the
20
composition of solid waste would be indicated the management methods that would be used.
Solid waste is composed of combustibles and non–combustibles materials. A combustible
material includes paper, plastics, yards debris, and food waste, wood, textiles, disposable
diaper, and other organics. Non- combustibles also include glass, metal, bones, leather and
aluminum (Denison and Ruston 1990; Kreith1994;Zerbock, 2003). Having understood the
concept of solid wastes, source, types and components of solid waste, this leads the discussion
on solid waste management in the next section.
Compositing process uses microorganisms to degrade the organic content of waste aerobic
compositing processed at a higher rate and converts the heterogeneous organic waste materials
into homogenous and stable humus (Center for Environment and Development 2003
UNEP(1996) has also defined composting as a biological decomposition of biodegradable
solid waste under controlled predominantly aerobic conditions to state that was sufficiently
stable for nuisance-free storage and handling and is satisfactorily matured for safe use in
agriculture. According to the UNEP (1996), Composting is option that, with few exceptions,
best fits within the limited resources available in developing countries. A characteristic that
renders composting especially suitable is its adaptability to a broad range of situations.
According to Zerbock (2003), a low-technology approach to waste reduction is composting. He
further says that in developing countries, the average city‟s municipal waste stream is over 50
per cent organic material. It is a process of allowing biological decomposition of solid organic
materials by bacteria, fungi, worms, insects, and other organisms in to a soil for transforming
large quantities of organic materials to compost (humus like materials). “The organic materials
produced by composting can be added to soil to supply plant nutrients such as nitrogen,
phosphorus, potassium, iron, sulfur, and calcium, slow soil erosion, make clay soils more
porous or increase water holding capacity of sandy soils” (Enger and Smith, 2008).
There are three scales at which composting has been implemented; residential level,
decentralized community level, and centralized and large scale municipality level. The larger
the undertaking the more capital investment is required. Most developing countries which have
found success with composting revealed that composting works best when implemented at
household level, with some project doing well at community level as well. At municipal level
financial commitment required to maintain equipment has resulted in wide spread failures
(Zerbock, 2003). Generally, composting has many advantages; first it would reduce amount of
waste requiring ultimate disposal and extending the life of landfills. When it done correctly, the
end result becomes a useful product, capable of being used at household or farm level to
21
augment soil nutrient levels and increase organic matter in the soil, increasing soil stability. If
the product has high enough quality and markets exist, it can be sold. Environmentally, process
of composting is preferable than landfill processes. In a landfill, bacteria break down organics
an aerobically (in absence of oxygen) and resulted in release of methane gas. However, in
composting organic matter is decomposed using an aerobic process and produces no methane
by product (Zerbock, 2003). Contrary to the above benefits, composting has the distinction of
being failed waste management system. In cities of developing countries, most large mixed
waste compost plants have failed or operate at less than 30% of capacity. The problems most
often cited for such failures include: high operation and management costs, high transportation
costs, poor quality of product as a result of lack of sorting (especially plastic and glass
fragments), poor understanding of composting process, and high competition from chemical
fertilizers (which are often subsidized) (UNEP, 1996).
2.8.6. Incineration
According to the Center for Environment and Development (2003) incineration is a controlled
combustible waste to gas and reducing it to residue of non- combustible ingredients. According
to the center, during incineration, moisture in the solid waste gets vaporized combustible
portion gets oxidized and vaporized. CO2, water vapor, ashes and non-combustible residue are
the end products of incineration. Incinerators have the capacity to reduce the volume of waste
drastically, up to nine fold than any other methods (Kreith, 1994). According to him
incineration can also recover useful energy either in the form of steam or electricity. He
however, recognized that the main constraints of incineration are high cost of operation,
relatively high degree of sophistication needed to operate them safely and economically as well
as the tendency to pollute the environment through emissions of carbon dioxide. The following
Table 2.3. Advantages and Disadvantages of incineration
Advantages Disadvantages
• Requires minimum land and be
operated in
• many weather condition produces
stable odor free residue can generate
electricity
• effective way for hazardous waste
management
• Expensive to build and operate specially for
developing countries
• High energy requirement
• Requires skilled personal and conditions
maintenance
• Emission of gaseous pollutants not carried out
properly out properly, incineration results of air
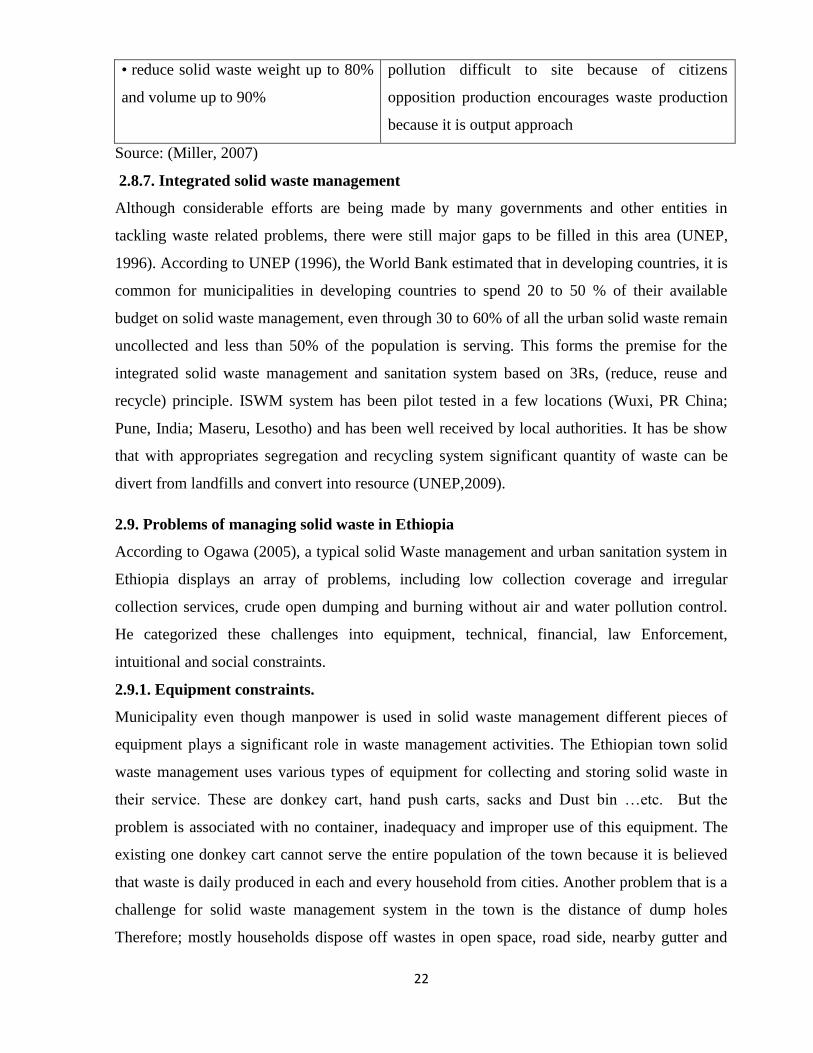
22
• reduce solid waste weight up to 80%
and volume up to 90%
pollution difficult to site because of citizens
opposition production encourages waste production
because it is output approach
Source: (Miller, 2007)
2.8.7. Integrated solid waste management
Although considerable efforts are being made by many governments and other entities in
tackling waste related problems, there were still major gaps to be filled in this area (UNEP,
1996). According to UNEP (1996), the World Bank estimated that in developing countries, it is
common for municipalities in developing countries to spend 20 to 50 % of their available
budget on solid waste management, even through 30 to 60% of all the urban solid waste remain
uncollected and less than 50% of the population is serving. This forms the premise for the
integrated solid waste management and sanitation system based on 3Rs, (reduce, reuse and
recycle) principle. ISWM system has been pilot tested in a few locations (Wuxi, PR China;
Pune, India; Maseru, Lesotho) and has been well received by local authorities. It has be show
that with appropriates segregation and recycling system significant quantity of waste can be
divert from landfills and convert into resource (UNEP,2009).
2.9. Problems of managing solid waste in Ethiopia
According to Ogawa (2005), a typical solid Waste management and urban sanitation system in
Ethiopia displays an array of problems, including low collection coverage and irregular
collection services, crude open dumping and burning without air and water pollution control.
He categorized these challenges into equipment, technical, financial, law Enforcement,
intuitional and social constraints.
2.9.1. Equipment constraints.
Municipality even though manpower is used in solid waste management different pieces of
equipment plays a significant role in waste management activities. The Ethiopian town solid
waste management uses various types of equipment for collecting and storing solid waste in
their service. These are donkey cart, hand push carts, sacks and Dust bin …etc. But the
problem is associated with no container, inadequacy and improper use of this equipment. The
existing one donkey cart cannot serve the entire population of the town because it is believed
that waste is daily produced in each and every household from cities. Another problem that is a
challenge for solid waste management system in the town is the distance of dump holes
Therefore; mostly households dispose off wastes in open space, road side, nearby gutter and
23
other places. Another serious problem that affected the solid waste management system is the
problem of vehicles.
2.9.2.Human and technical constraints
According to human and technical factors of Ethiopia town human resources for management
are scarce in some cases and officials without technical training in waste management are
assigned to handle the complex issues involved, and the basis on which they receive technical
assistance can, therefore, be limited. It is true that urban services like waste management need
well-organized, trained and skilled manpower. Besides, the service that is to be performed
needs proportionate number of service providers. The number of workers to perform such a
huge task is not compatible with the jobs. Moreover, the payment system of the workers of the
solid waste management is another problem that greatly affects the working condition of the
towns. Therefore, social factors have a direct impact in constraining solid waste management
system because the social status of waste management workers is generally low. According to
Ogawa (2005), in most Ethiopia cities/towns, there are inadequate human resources at both the
national and local levels with technical expertise necessary for solid waste management and
urban sanitation planning and operation. Many officers in charge of solid waste management,
particularly at the local level, have little or no technical background or training in engineering
or management
2.9.3. Financial Constraints
Ogawa (2005) intimated that, solid waste management is given very low priority in Ethiopia
countries, except capital and large cities (like Addis Ababa, Hawassa… etc.). As a result, very
limited funds are provided to the solid waste management sector by the governments, and the
level of services required for protection of public health and the environment are not attained.
The problem is acute at the local government level where the local taxation system is
inadequately developed and, therefore, the financial basis of local government can be
supplemented by the collection of user service charges. However users‟ ability to pay for the
services is very limited in poorer in Ethiopia country, and their willingness to pay for the
services which are irregular and ineffective
2.9.4. Law enforcement
An important aspect that can play a significant role in the process of waste management is the
issue of bye-law. Of course, the most of Ethiopian cities/ towns hasn‟t the legal service which
is responsible for the enforcement of rules and regulations through different mechanisms. The
municipality hasn‟t given continuous education on solid waste management to the residents of
24
town. The Addis Ababa City Administration Charter Proclamation No 311/2003 Article 24
states that those persons assigned to enforce the rule should impartially and honestly work in
unison. The response obtained from the SBDD showed that another constraint that affects the
performance of solid waste management in town is lack of co-ordination between the SBDD
and the MSEs. From the survey the answer gained from the SBDD with regard to solid waste
management indicated that those MSEs working in the town do not properly discharge their
responsibility as there is a loop hole in the work between the two bodies. Therefore, this
affected the management system and created negative impact on the performance of waste
management and particularly with drivers revealed that one of the major factors that greatly
affected solid waste management system is the problem of waste dumping site. This handicap
is not the problem of only the town but the problem of city as a whole.
2.9.5. Institutional constraints
It indicated that, lack of Institutional coordination with each other in order to solid waste
management system in Ethiopia. Several agencies level is usually involved at least partially in
solid waste management. He however, indicate that, there are often no clear roles or functions
of various national agencies defined in relation to solid waste management and also no single
agency or committee designated to coordinated their projects and activities. The lack of
coordination among the relevant agencies often result in different agencies becoming the
national counterpart to different external support agencies for different solid waste management
collaborative projects without being aware of what other national agencies are doing. This
leads to duplication of efforts, wasting of resources, and un sustainability of overall solid waste
management programmers‟. The lack of effective legislation for solid waste management,
which is a norm in most developing countries, is partially responsible for the roles /functions of
the relevant national agencies not being clearly defined and the lack of coordination among
them (Ogawa,2005). According to him legislation (public health act local government act,
environment protection act) related to solid waste management in developing countries is
usually fragmented. Zurbrug (2009) further added that, solid waste collection schemes of cities
in the developing world generally serve only a limited part of the urban population. However, if
organized properly their activities could be effective in waste management system. Such an
opportunistic approach was required for sustainable development of solid waste management
programs in Ethiopia‟s countries (Ogawa, 2002).

25
2.9.6 Social awareness and attitude
Lack of Public awareness and attitudes to waste could affect the whole solid waste
management system. All steps in solid waste management starting from household waste
storages, to waste segregation, recycling, collection frequency, willingness to pay for waste
management and sanitation services, and opposition to sitting of waste treatment and disposal
facilities depend on public awareness and participation. Lack of community participation has a
negative bearing on waste management. In addition to this, there is improper use of public
holes deliberately or unknowingly by some households. Furthermore, there is lack of taking
initiatives on the part of some households to participate in sanitary campaigns that are
organized by the kebeles and NGOs. Finally, most households in Ethiopia do not have
awareness of solid waste management and its impact on the environment. So, these and other
related factors have affected the solid waste management system in cities/ town and some of
these factors need immediate responses. Therefore, to bring a better solid waste management
service, residents in the town should have a concern on the management of the service so that
the community at large can benefit from the service.
26
3. MATERIALS AND METHOD
3.1 Description of study area
Hagerselam is Amharic word meaning “land of peace”. Naming Hagreselam literally means “a
land of peace” the name was given at its early establishment by DejazmachBalchaSafo in 1909,
as a sign of expressing his hope of maintaining peace and security of the region. It is name of
town, which located in Sidama Zone Hula district, Southern Ethiopia. The town is about 103
years old. It is located about 95km south of Hawassa which is a capital city of southern region
and 365 km far from Addis Ababa,the capital city of Ethiopia. This town has an elevation
between 2,759 and 2,829 above sea level. It shares common boundaries with Wiramakebele to
the north, Witabonokebele to the west, Odolakebele to the south, east-south to Bochesakebele
and Dara district to the east. The Hagreselam town occupies approximately 577.116 hectares.
According to 1999 national census repot population Hagerselam town had 6787 While recent
municipal data in2018 total population reached thirty six thousand twenty one (36,021).
Despite of its old age, the town has poor SWM and urban sanitation services provision which is
negatively affecting the community health and environmental quality.
According to the traditional thermal zone classification of Ethiopia, based on altitude,
Hagereselam town lies within the Dega zone where the altitude is between 2300 and 3000
m.a.s.l and the temperature is between 13°C and 16°C. Hagereselam has one continuous rainfall
season that extends March and October. Its total annual rainfall is about 1,276.5mm. The
months of April, May, June, July, August and September have got moderate rainfall
concentration, whereas the month of October has high rainfall concentration. December is a
month with small rainfall. January, February and November are relatively dry months
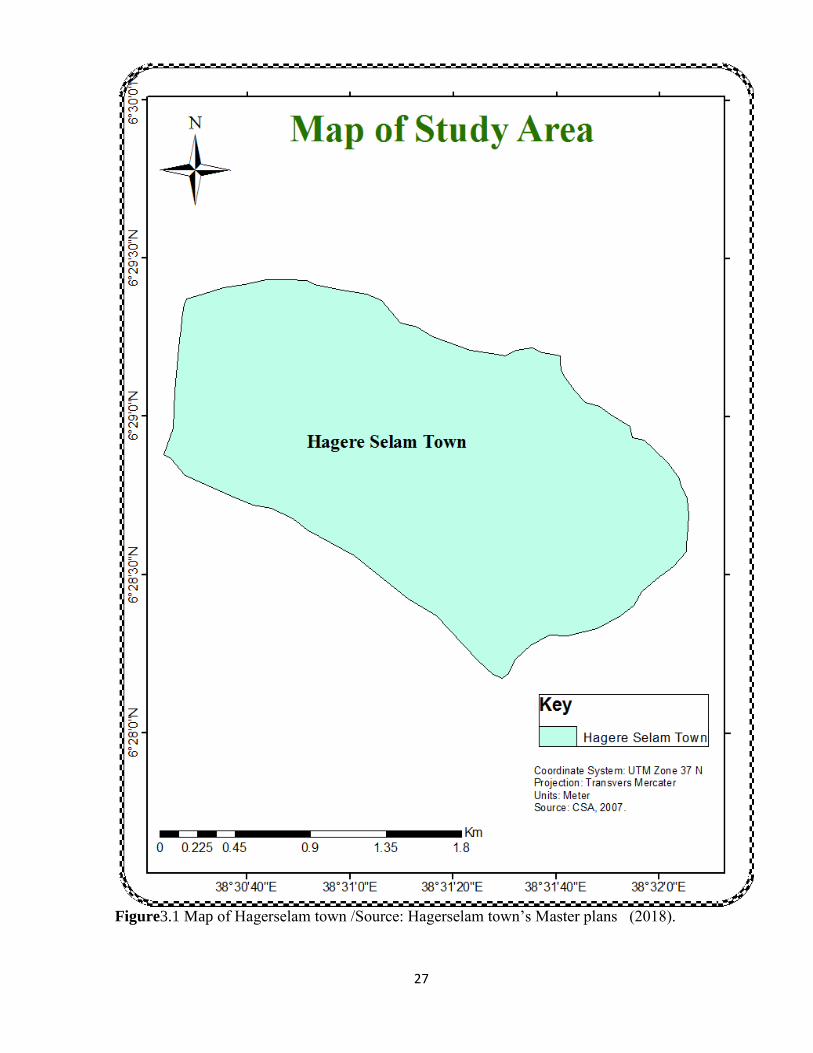
27
Figure3.1 Map of Hagerselam town /Source: Hagerselam town‟s Master plans (2018).
28
3.2. Study design
Cross-sectional descriptive survey design and both qualitative and quantitative methods were
used in the study. Researcher used largely quantitative and qualitative approaches. The
quantitative study method was used to collect data on demographic characteristic of the
respondents; SWM practices and the efficiency and effective of SWM system in the town.
Qualitative methods employed was observation that was used to observe and record waste
management practices collection transfer or transportation, disposal…etc.) of the municipality
in the town. The study employed a multistage sampling and systematic random sampling to
identify or select the study site and HHs and purposive sampling technique to select key
informants (KIs). Primary data is important to collect through preliminary field investigation,
questionnaires survey, face to face interviews and focus group discussions. There was further
discussing in the sub-sections below. The participants for this study would be woreda sanitation
teams, municipal workers, local community, and other households in the town.
3.3. Sampling methods
Waste management and sanitations in Hagerselam town: Data collected from the study areas in
the Hagerselam town through preliminary field investigation, questionnaire survey, face to face
interview and FGD in all 341 (HHs) respondents and 25 (KIs) were surveyed and interview
were carried 14 key respondents including municipality of Hagerselam town, SBDD& MSEs,
EP and land administration bureau, Hula District and Finance Economic Development office
and 18 people to focus group discussion. Data were collected on the following issues:-SW
generation rates per a day , percentage composition of waste, sources of solid waste, waste
collection methods, disposal sites of household, cost involved in managing solid waste and
related Problems of solid waste management and sanitation in Hagerselam town
Formula for solid waste generation rate by person per unit time
GR= Wt. of solid waste (g)
Population *duration (day)
Researchers took 10 (ten) households and we gave them three sacks to each villages and it was
stored in sacks for a week and average was taken to get low-income, medium-income and high-
income total production of wastes per week. The beneficiaries of the doo-to-door collection
paid a monthly charge of 50 birr to ten (10) sacks waste.
Determination of physical composition and measuring households‟ waste generation
Households were selected systematic random sampling methods for instance 7th
from each
ordered lists and collects generation rate of solid waste or measured for seven consecutive days.
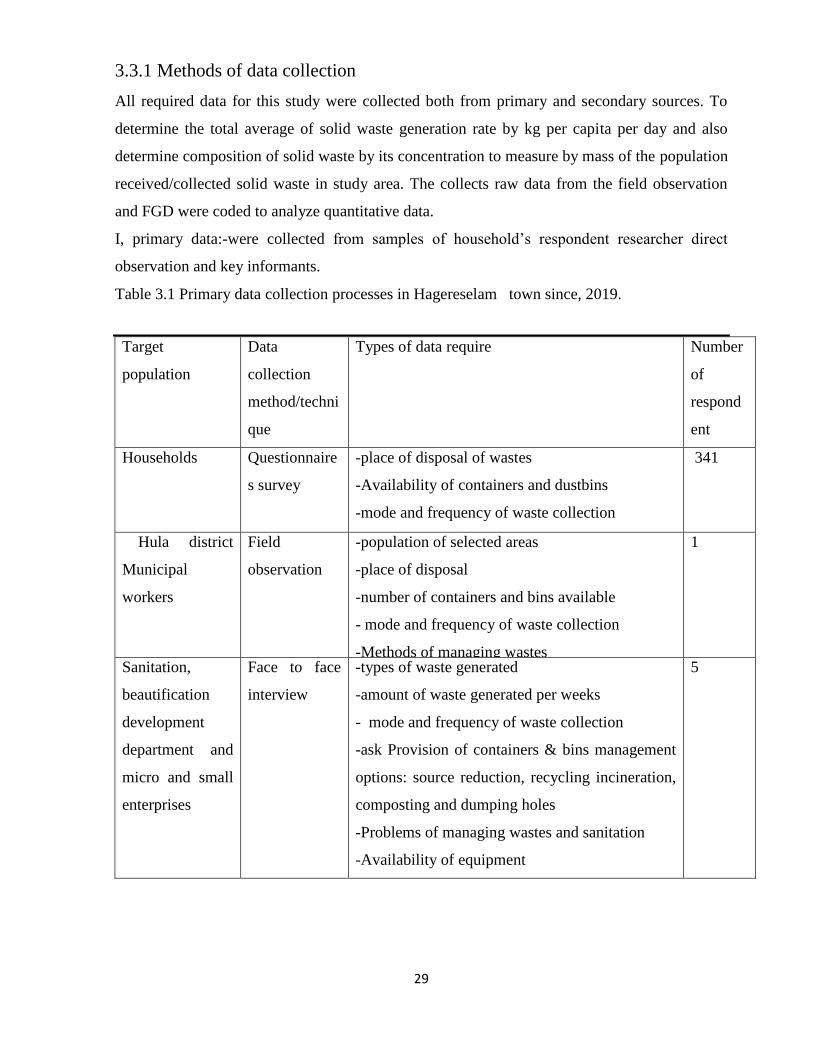
29
3.3.1 Methods of data collection
All required data for this study were collected both from primary and secondary sources. To
determine the total average of solid waste generation rate by kg per capita per day and also
determine composition of solid waste by its concentration to measure by mass of the population
received/collected solid waste in study area. The collects raw data from the field observation
and FGD were coded to analyze quantitative data.
I, primary data:-were collected from samples of household‟s respondent researcher direct
observation and key informants.
Table 3.1 Primary data collection processes in Hagereselam town since, 2019.
Target
population
Data
collection
method/techni
que
Types of data require Number
of
respond
ent
Households Questionnaire
s survey
-place of disposal of wastes
-Availability of containers and dustbins
-mode and frequency of waste collection
-cost of payment for collection
341
Hula district
Municipal
workers
Field
observation
-population of selected areas
-place of disposal
-number of containers and bins available
- mode and frequency of waste collection
-Methods of managing wastes
-Problems of managing wastes and sanitation
1
Sanitation,
beautification
development
department and
micro and small
enterprises
Face to face
interview
-types of waste generated
-amount of waste generated per weeks
- mode and frequency of waste collection
-ask Provision of containers & bins management
options: source reduction, recycling incineration,
composting and dumping holes
-Problems of managing wastes and sanitation
-Availability of equipment
5

30
Hula woreda
finance and
economic
development
offices and
environmental
protection and
land
administration
bureau
Face to face
interview
-amount of spent on waste collection in month
amount of equipment spent on waste management
- Problems of managing wastes and sanitation
1
Households,
SBDD,MSEs
and Municipal
workers
FGD -Solid waste management system
-Types and components of wastes
-Amounts of waste produced per weeks
-Problems of managing wastes and sanitation
-cost of payment for collection
18
II, Secondary data
Similarly, Secondary data gathered from Hula District, Hagerselam municipal and finance
office report, unpublished and documented data of the relevant organization was conducted.
3.3.2. Sample size determination
A total number of 2320 households obtained from Hagerselam municipal population data were
used in present study. This represents the sample frame of the questionnaire survey.
Furthermore, the mathematical method was used to determine the sample size for the survey
developed by Yamane (1967). The following procedure was useful to sample size
determination.
Formula n = N
1+N (e)
2
Where n=sample size, N=sample frame, e=margin of error at 95 percent confidence level. This
case margin error equals 5%, i.e. 0.05
n = 2320
1+2320(0.05)2
= 341
Therefore, the sample size for survey was three hundred forty one (341) HHs and 25 key
informants (KIs). This was to ensure that the sample mean was closer to the population mean.
It is however important to note that the sample size depends on financial resource and the
stipulate period of the study. In the light of this, the distribution of the sample size in the study
area was considered critical to the study.
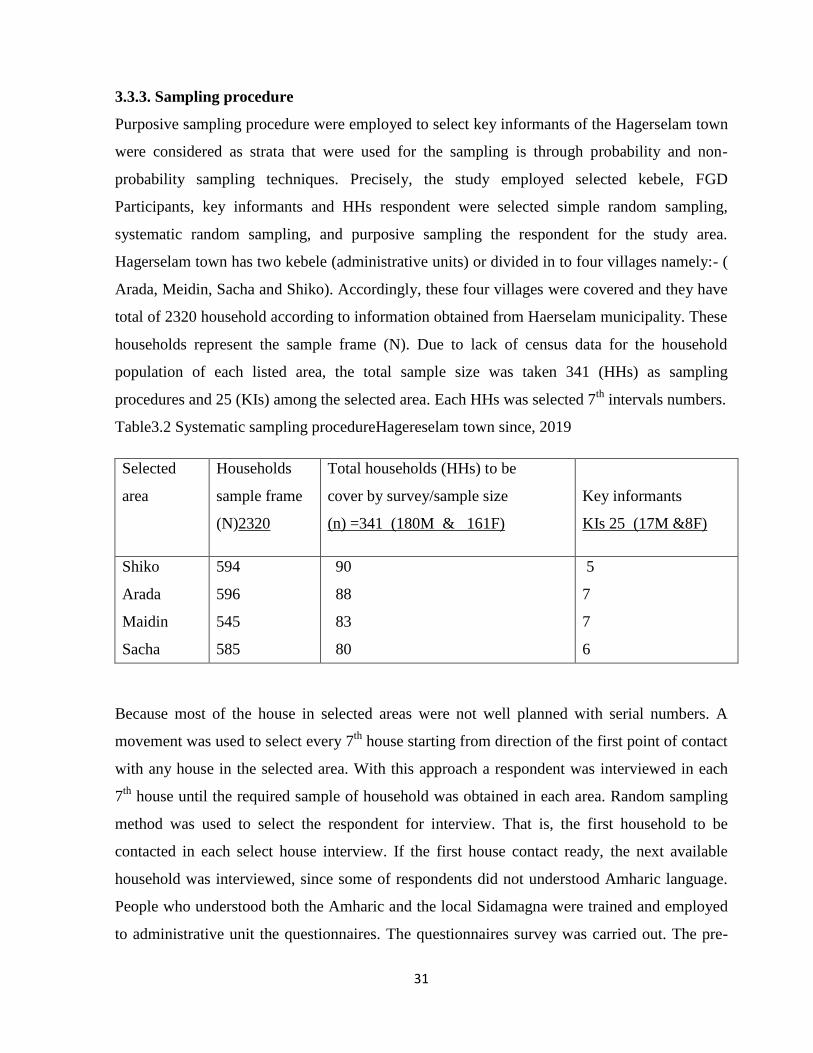
31
3.3.3. Sampling procedure
Purposive sampling procedure were employed to select key informants of the Hagerselam town
were considered as strata that were used for the sampling is through probability and non-
probability sampling techniques. Precisely, the study employed selected kebele, FGD
Participants, key informants and HHs respondent were selected simple random sampling,
systematic random sampling, and purposive sampling the respondent for the study area.
Hagerselam town has two kebele (administrative units) or divided in to four villages namely:- (
Arada, Meidin, Sacha and Shiko). Accordingly, these four villages were covered and they have
total of 2320 household according to information obtained from Haerselam municipality. These
households represent the sample frame (N). Due to lack of census data for the household
population of each listed area, the total sample size was taken 341 (HHs) as sampling
procedures and 25 (KIs) among the selected area. Each HHs was selected 7th
intervals numbers.
Table3.2 Systematic sampling procedureHagereselam town since, 2019
Selected
area
Households
sample frame
(N)2320
Total households (HHs) to be
cover by survey/sample size
(n) =341 (180M & 161F)
Key informants
KIs 25 (17M &8F)
Shiko
Arada
Maidin
Sacha
Sacha
594
596
545
585
585
90
88
83
80
80
5
7
7
6
6
Because most of the house in selected areas were not well planned with serial numbers. A
movement was used to select every 7th
house starting from direction of the first point of contact
with any house in the selected area. With this approach a respondent was interviewed in each
7th
house until the required sample of household was obtained in each area. Random sampling
method was used to select the respondent for interview. That is, the first household to be
contacted in each select house interview. If the first house contact ready, the next available
household was interviewed, since some of respondents did not understood Amharic language.
People who understood both the Amharic and the local Sidamagna were trained and employed
to administrative unit the questionnaires. The questionnaires survey was carried out. The pre-
32
testing gives the opportunity for certain pertinent issues which could not be holding initially to
be including in the final questionnaires. The questionnaires survey was carrying out before the
interview because certain new issue came up during the survey which could not be capture in
the questionnaires survey.
3.4. Data collection tools
An instrument which helps to collect primary data from sources generates during this study
through; questionnaires, field observation, face to face interview and focus group discussion.
I Questionnaires:-Semi-structured questionnaires with closed and open –ended interview
question were used and the interview was carried out by researchers in the house of households.
Also to collect data from key informants a structured individual questionnaire was used collect
to and self-administrated back to the researchers.to ensure data quality, all the questionnaires
were prepared in English language and back translation was made by independent person. Pre-
test of questionnaires was also conducted and problems in the content of the questionnaires.
The target populations for questionnaire are households. Data collects were on the following
variables: sources of solid waste, types of solid waste, place of disposal, availability of
containers, and mode of collection. The questionnaire contain background information of the
garbage, tackled items of solid waste management or challenges of public health, and influence
other community ecosystem and environmental pollution. .
II Observation: - observation data collected by using checklist and it was collected by the
researchers at household level and on different sites at field in the town. It involved watching
and recording what people say and do and household level it included onsite handling and
collection of solid wastes , storing, transportation, disposal…etc. in field observation was made
to look into waste management practice along the road drainage channels, municipality dustbin,
business area, open area, grinding area, and market place. During a field observation, data may
take directly revolved around the town to form of pictures, or figurative where solid waste in
dump holes, Provision of containers & bins management option.
III Face to face interview:-It is used to collect qualitative data from the following key
stakeholders as far as solid waste management is concerned in the study area. During this way
of data collected from Hula district Municipal workers, Sanitation, beautification development
department and micro and small enterprises, Hula woreda finance and economic development
offices and environmental protection and land administration bureau.
33
IV Focus Group Discussion:-The item in the focus group discussion comprised of close-ended
& open-ended structural questions and helps to collect qualitative types of data. The key
stakeholders of FGD included 4 people from Households, 5 peoples from SBDD&M SEs, 4
people from Municipal workers, 2 people from health and 3 people from kebele (administrative
units) leader. Three focus group discussions were carried out and six people are participating in
each focus group discussion. This time necessary data of FGD are solid waste management
system, problems of managing wastes and sanitation and cost of payment for collection During
FGD useful materials are short note book, pen and tape recorder in order to collected original
data sources.
3.5. Data analysis
Statistical analysis of data was carried out using SPSS version 20.0 statistical package
program. The collected raw data were recorded, organized and summarized in simple
descriptive statistics method and frequency, standard deviation, means, and percentage
descriptive statistical tools to describe the findings. One –way ANOVA was performed to
assess whether there is a significant difference in response of households with respect to some
selected demographic variable. The recorded observation and focus group discussion data was
put in order, reduced, classified, and summarized for ease of interpretation and organized to
drawing conclusions separately and in connection to findings from quantitative study. The
qualitative data will be obtained through interview, FGD and direct observation of
environment. The collected raw data will be organized through key informants and both data
interpreting under blowing to key informants.
3.6. Ethical considerations
Ethical clearance was obtained from theHawassa University before entering the study area to
collect data, local authorities and community leaders were briefed about the objective of the
study. Respondents participated in the study was voluntary and each respondent was asked to
give verbal consent to participate and each household was assured that the information
provided will be kept confidential.
34
4. RESULTS AND DISCUSSIONS
4.1. Socio- demographic characteristics of respondents
Five items have been used to gather information on the demographic characteristics of the
sample respondents. These are sex, age, and level of education, occupation, and income. Table
4.1 shows the Socio -demographic characteristics of the study respondents. A total of 341
household heads were included in the study and among them 180 (52.8 %) were males and
161(47.2 %) were females. Majority 45.75% of the respondents was within age group of 26-35
year category, followed by those the age group 15-25 (27.57 %) of the respondents‟ belong to
age group of 36-46 (19.35 %) and the remaining belong to those greater than or equals to ≥46
age group (7.33%). As the educational status of HHs participants reveal, most ( 42.23%) of the
respondent were first Degree, Diploma level 35.19% then primary, secondary, none subjects
attended (illiterate), and second degree 11.44, 10.56,2.64 and 0.59 percent of respectively.
Majority (41.64%) of respondents earns monthly income ranging between 2001-5000 ETB,
followed by those who obtained 5001-8000ETB per month (21.70%). The remaining 10.26%,
9.38%, 9.09%, 7.33% and 0.59%, earn between less than500, 1501-2000, 501-1000, 1001-1500
per month, respectively. Only 0.96% respondents earn a monthly income of more than
8,001ETB
A total 25 key informants were interviewed in Hagereselam town. Among them 17 (68%) were
male and 8(32%) were females. They participatedindividual in the independent interview. As
regards to the age categories of the respondents, the majority 72% respondents was falls within
age group of 26-35 year category .followed by those the age group 15-25 (24 %) and
remaining of the respondents falls belong to age group of 36-46 (4 %). KIs respondents most
40% of the respondents secondary32% of 1st degree and remaining 28% of diploma level In the
term of income distribution KIs participants mostly earn monthly income 80% ranging between
2001-5000 ETB and remaining 20% earn less than500ETB.
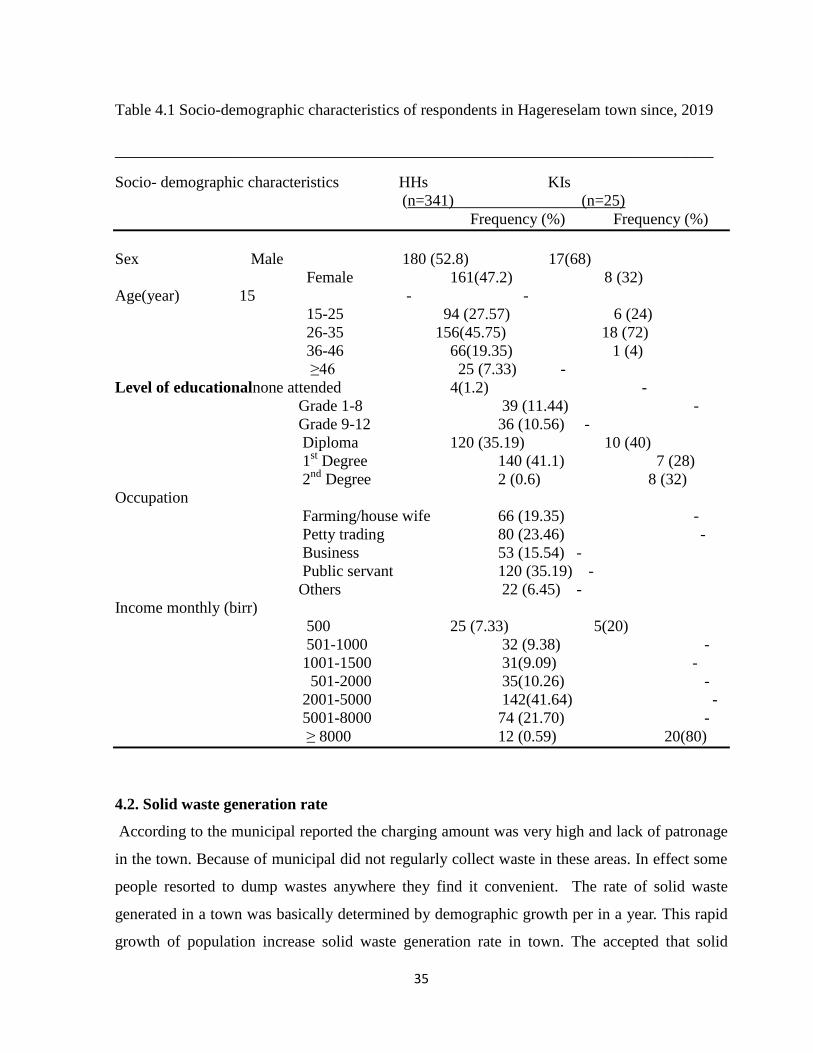
35
Table 4.1 Socio-demographic characteristics of respondents in Hagereselam town since, 2019
___________________________________________________________________________
Socio- demographic characteristics HHs KIs
(n=341) (n=25)
Frequency (%) Frequency (%)
Sex Male 180 (52.8) 17(68)
Female 161(47.2) 8 (32)
Age(year) 15 - -
15-25 94 (27.57) 6 (24)
26-35 156(45.75) 18 (72)
36-46 66(19.35) 1 (4)
≥46 25 (7.33) -
Level of educationalnone attended 4(1.2) -
Grade 1-8 39 (11.44) -
Grade 9-12 36 (10.56) -
Diploma 120 (35.19) 10 (40)
1st Degree 140 (41.1) 7 (28)
2nd
Degree 2 (0.6) 8 (32)
Occupation
Farming/house wife 66 (19.35) -
Petty trading 80 (23.46) -
Business 53 (15.54) -
Public servant 120 (35.19) -
Others 22 (6.45) -
Income monthly (birr)
500 25 (7.33) 5(20)
501-1000 32 (9.38) -
1001-1500 31(9.09) -
501-2000 35(10.26) -
2001-5000 142(41.64) -
5001-8000 74 (21.70) -
≥ 8000 12 (0.59) 20(80)
4.2. Solid waste generation rate
According to the municipal reported the charging amount was very high and lack of patronage
in the town. Because of municipal did not regularly collect waste in these areas. In effect some
people resorted to dump wastes anywhere they find it convenient. The rate of solid waste
generated in a town was basically determined by demographic growth per in a year. This rapid
growth of population increase solid waste generation rate in town. The accepted that solid
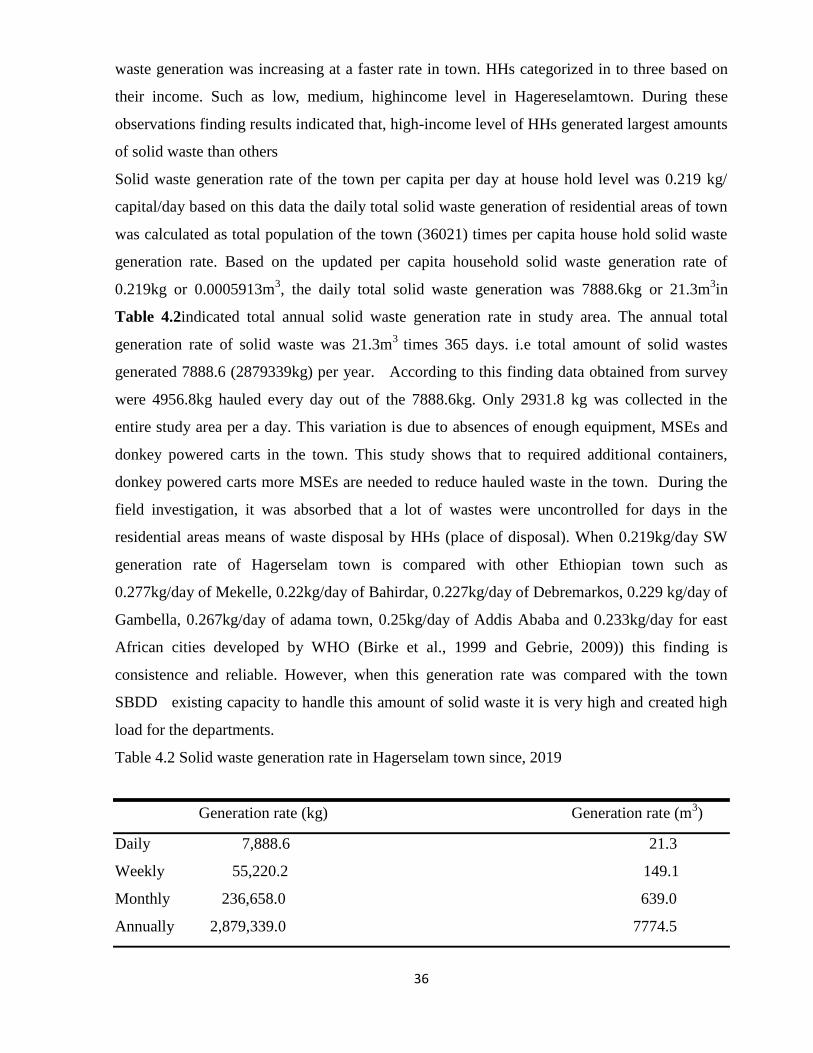
36
waste generation was increasing at a faster rate in town. HHs categorized in to three based on
their income. Such as low, medium, highincome level in Hagereselamtown. During these
observations finding results indicated that, high-income level of HHs generated largest amounts
of solid waste than others
Solid waste generation rate of the town per capita per day at house hold level was 0.219 kg/
capital/day based on this data the daily total solid waste generation of residential areas of town
was calculated as total population of the town (36021) times per capita house hold solid waste
generation rate. Based on the updated per capita household solid waste generation rate of
0.219kg or 0.0005913m3, the daily total solid waste generation was 7888.6kg or 21.3m
3in
Table 4.2indicated total annual solid waste generation rate in study area. The annual total
generation rate of solid waste was 21.3m3
times 365 days. i.e total amount of solid wastes
generated 7888.6 (2879339kg) per year. According to this finding data obtained from survey
were 4956.8kg hauled every day out of the 7888.6kg. Only 2931.8 kg was collected in the
entire study area per a day. This variation is due to absences of enough equipment, MSEs and
donkey powered carts in the town. This study shows that to required additional containers,
donkey powered carts more MSEs are needed to reduce hauled waste in the town. During the
field investigation, it was absorbed that a lot of wastes were uncontrolled for days in the
residential areas means of waste disposal by HHs (place of disposal). When 0.219kg/day SW
generation rate of Hagerselam town is compared with other Ethiopian town such as
0.277kg/day of Mekelle, 0.22kg/day of Bahirdar, 0.227kg/day of Debremarkos, 0.229 kg/day of
Gambella, 0.267kg/day of adama town, 0.25kg/day of Addis Ababa and 0.233kg/day for east
African cities developed by WHO (Birke et al., 1999 and Gebrie, 2009)) this finding is
consistence and reliable. However, when this generation rate was compared with the town
SBDD existing capacity to handle this amount of solid waste it is very high and created high
load for the departments.
Table 4.2 Solid waste generation rate in Hagerselam town since, 2019
Generation rate (kg) Generation rate (m3)
Daily 7,888.6 21.3
Weekly 55,220.2 149.1
Monthly 236,658.0 639.0
Annually 2,879,339.0 7774.5
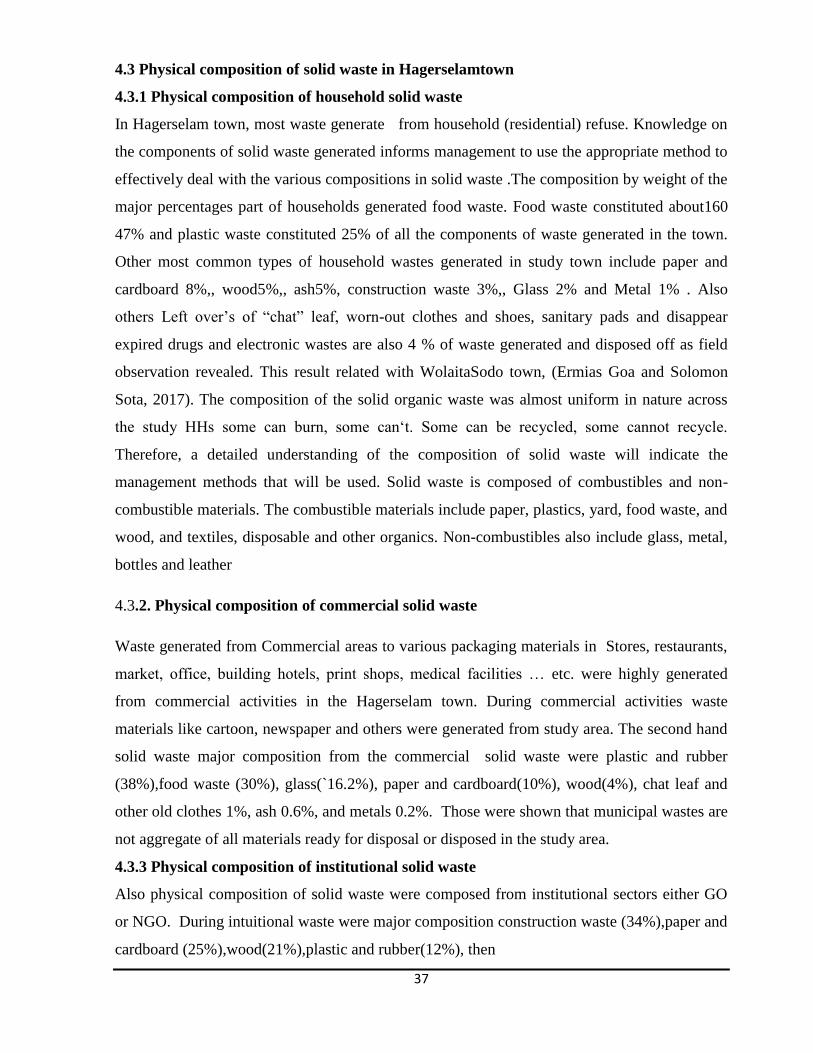
37
4.3 Physical composition of solid waste in Hagerselamtown
4.3.1 Physical composition of household solid waste
In Hagerselam town, most waste generate from household (residential) refuse. Knowledge on
the components of solid waste generated informs management to use the appropriate method to
effectively deal with the various compositions in solid waste .The composition by weight of the
major percentages part of households generated food waste. Food waste constituted about160
47% and plastic waste constituted 25% of all the components of waste generated in the town.
Other most common types of household wastes generated in study town include paper and
cardboard 8%,, wood5%,, ash5%, construction waste 3%,, Glass 2% and Metal 1% . Also
others Left over‟s of “chat” leaf, worn-out clothes and shoes, sanitary pads and disappear
expired drugs and electronic wastes are also 4 % of waste generated and disposed off as field
observation revealed. This result related with WolaitaSodo town, (Ermias Goa and Solomon
Sota, 2017). The composition of the solid organic waste was almost uniform in nature across
the study HHs some can burn, some can„t. Some can be recycled, some cannot recycle.
Therefore, a detailed understanding of the composition of solid waste will indicate the
management methods that will be used. Solid waste is composed of combustibles and non-
combustible materials. The combustible materials include paper, plastics, yard, food waste, and
wood, and textiles, disposable and other organics. Non-combustibles also include glass, metal,
bottles and leather
4.3.2. Physical composition of commercial solid waste
Waste generated from Commercial areas to various packaging materials in Stores, restaurants,
market, office, building hotels, print shops, medical facilities … etc. were highly generated
from commercial activities in the Hagerselam town. During commercial activities waste
materials like cartoon, newspaper and others were generated from study area. The second hand
solid waste major composition from the commercial solid waste were plastic and rubber
(38%),food waste (30%), glass(`16.2%), paper and cardboard(10%), wood(4%), chat leaf and
other old clothes 1%, ash 0.6%, and metals 0.2%. Those were shown that municipal wastes are
not aggregate of all materials ready for disposal or disposed in the study area.
4.3.3 Physical composition of institutional solid waste
Also physical composition of solid waste were composed from institutional sectors either GO
or NGO. During intuitional waste were major composition construction waste (34%),paper and
cardboard (25%),wood(21%),plastic and rubber(12%), then
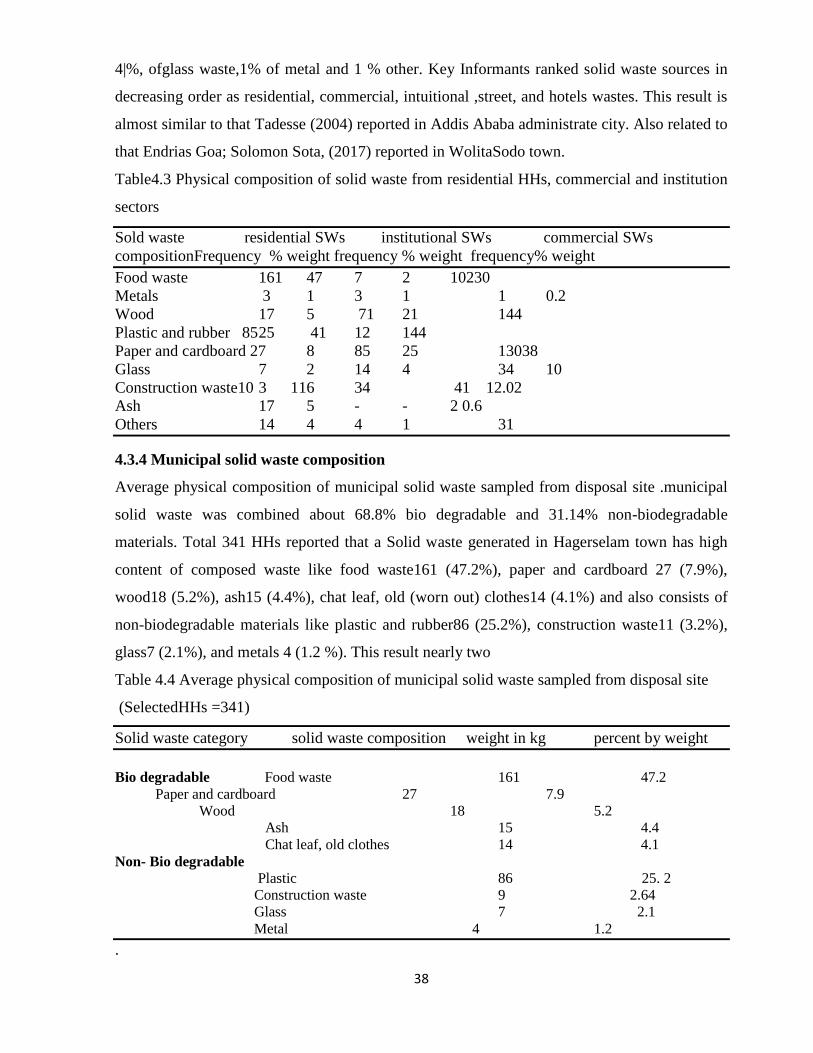
38
4|%, ofglass waste,1% of metal and 1 % other. Key Informants ranked solid waste sources in
decreasing order as residential, commercial, intuitional ,street, and hotels wastes. This result is
almost similar to that Tadesse (2004) reported in Addis Ababa administrate city. Also related to
that Endrias Goa; Solomon Sota, (2017) reported in WolitaSodo town.
Table4.3 Physical composition of solid waste from residential HHs, commercial and institution
sectors
Sold waste residential SWs institutional SWs commercial SWs
compositionFrequency % weight frequency % weight frequency% weight
Food waste 161 47 7 2 10230
Metals 3 1 3 1 1 0.2
Wood 17 5 71 21 144
Plastic and rubber 85 25 41 12 144
Paper and cardboard 27 8 85 25 13038
Glass 7 2 14 4 34 10
Construction waste10 3 116 34 41 12.02
Ash 17 5 - - 2 0.6
Others 14 4 4 1 31
4.3.4 Municipal solid waste composition
Average physical composition of municipal solid waste sampled from disposal site .municipal
solid waste was combined about 68.8% bio degradable and 31.14% non-biodegradable
materials. Total 341 HHs reported that a Solid waste generated in Hagerselam town has high
content of composed waste like food waste161 (47.2%), paper and cardboard 27 (7.9%),
wood18 (5.2%), ash15 (4.4%), chat leaf, old (worn out) clothes14 (4.1%) and also consists of
non-biodegradable materials like plastic and rubber86 (25.2%), construction waste11 (3.2%),
glass7 (2.1%), and metals 4 (1.2 %). This result nearly two
Table 4.4 Average physical composition of municipal solid waste sampled from disposal site
(SelectedHHs =341)
Solid waste category solid waste composition weight in kg percent by weight
Bio degradable Food waste 161 47.2
Paper and cardboard 27 7.9
Wood 18 5.2
Ash 15 4.4
Chat leaf, old clothes 14 4.1
Non- Bio degradable
Plastic 86 25. 2
Construction waste 9 2.64
Glass 7 2.1
Metal 4 1.2
.
39
4.4 Sources of solid waste in Hagerselam town
Municipal solid waste contains highly heterogeneous mass of discarded materials from urban
residential, commercial, institutional, and street sweeping. Figure 4.1 presented that the share
(45%) of solid waste of Hagereselam town is generated from residential areas. Even if huge
amount of solid waste of the town is generated from this sources. The major sources of solid
waste in Hagereselam town were residential commercial 26% and 17% institutional and others
places12%. From the survey 26.5% of the respondents indicated that, waste was collected
directly from their yards (door-to-door) while 95.3% indicated waste was in collected
communal dump sites. This reported source is almost related to Gonder town (AbebeTegegne,
2006); Mohammed Gedefaw, 2015). In Hagerselam town, they have been different attempt
suffocate ionization waste produced in area based on numerous of classification criteria. Most
waste generated from residential place: - from single-family and multifamily dwelling; low-
medium and high densities apartment...etc. throw many types of waste like food waste, plastics,
paper, cardboard, textile, yard, wood, glass, metals, ashes, street leaves, and household
hazardous wastes. Also waste generated from commercial areas to packaging various materials
Stores, restaurants, market, office, building hotels, print shops, medical facilities, and
institutions. Such as food waste, plastics, paper, glass, bottle, plaster, textile…etc. Also open
areas streets sweeping waste likes parks, vacant plots playgrounds, beaches, highways and
recreational areas special wastes, rubbish spoiled food wastes are major problem in the
Hagerselam town.

40
Figure 4.1 Sources of solid waste fromHagereselam town since, 2019.
4.5 Current waste management practices
4.5.1 Solid waste collection, storage and sorting of solid waste
4.5.1.1 Solid waste collection services
The average number of times that waste was collected in residential areas except Maidin
waste was collected once in a week. Therefore, a lot of waste was generated in this area. In the
Maidin residential areas, waste was collected two times a week. This is because these areas
were supposed to demand door-to-door collection in the town. As a result, households did find
it prudent to communal collect waste from these residential areas. This is because MSEs felt the
people in the Maidin were capable of paying for the door-to-door collection. But on other area
respondents also gave a contrary view according to them, door-to-door services were not
practice. Additionally, though indicated by MSEs waste was collected at least once in the
residential areas. In areas like Secha, Arada and Shiko, Communal collection takes place. This
resulted in respondents dumping their waste at unapproved sites and in some cases back yard.
resdential
commercial
instutional
others
12%
45%
17%
26%%
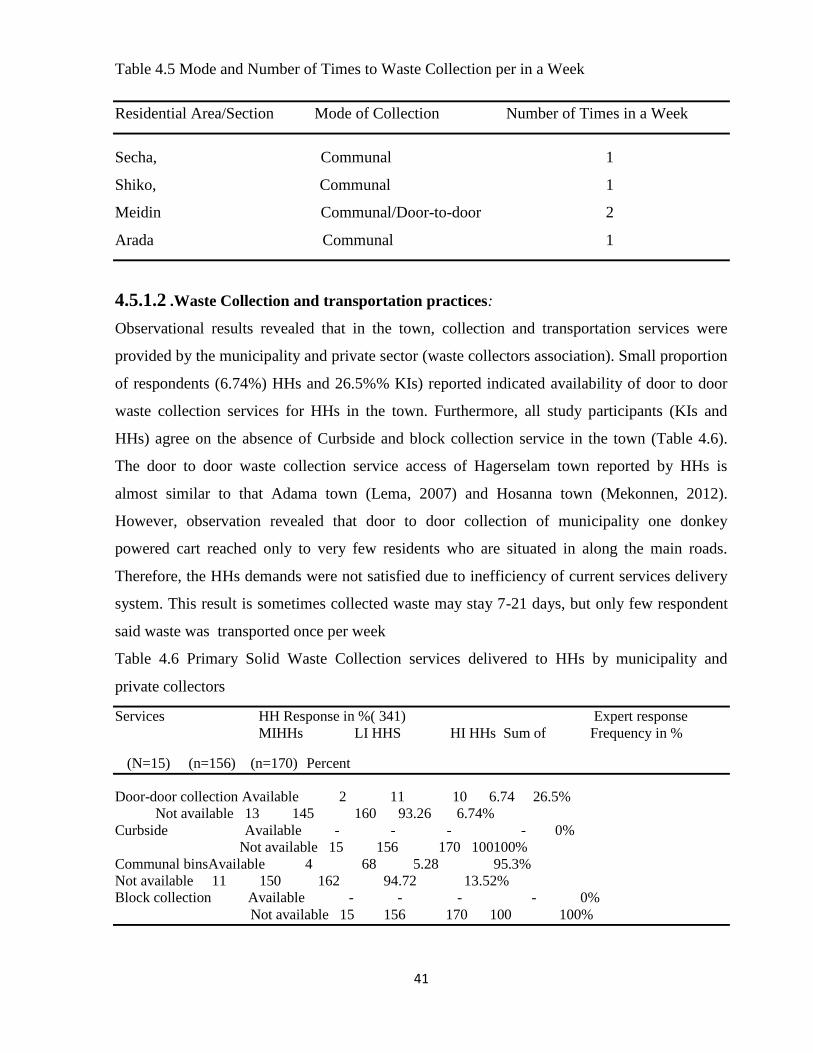
41
Table 4.5 Mode and Number of Times to Waste Collection per in a Week
Residential Area/Section Mode of Collection Number of Times in a Week
Secha, Communal 1
Shiko, Communal 1
Meidin Communal/Door-to-door 2
Arada Communal 1
4.5.1.2 .Waste Collection and transportation practices:
Observational results revealed that in the town, collection and transportation services were
provided by the municipality and private sector (waste collectors association). Small proportion
of respondents (6.74%) HHs and 26.5%% KIs) reported indicated availability of door to door
waste collection services for HHs in the town. Furthermore, all study participants (KIs and
HHs) agree on the absence of Curbside and block collection service in the town (Table 4.6).
The door to door waste collection service access of Hagerselam town reported by HHs is
almost similar to that Adama town (Lema, 2007) and Hosanna town (Mekonnen, 2012).
However, observation revealed that door to door collection of municipality one donkey
powered cart reached only to very few residents who are situated in along the main roads.
Therefore, the HHs demands were not satisfied due to inefficiency of current services delivery
system. This result is sometimes collected waste may stay 7-21 days, but only few respondent
said waste was transported once per week
Table 4.6 Primary Solid Waste Collection services delivered to HHs by municipality and
private collectors
Services HH Response in %( 341) Expert response
MIHHs LI HHS HI HHs Sum of Frequency in %
(N=15) (n=156) (n=170) Percent
Door-door collection Available 2 11 10 6.74 26.5%
Not available 13 145 160 93.26 6.74%
Curbside Available - - - - 0%
Not available 15 156 170 100100%
Communal binsAvailable 4 68 5.28 95.3%
Not available 11 150 162 94.72 13.52%
Block collection Available - - - - 0%
Not available 15 156 170 100 100%
42
4.5.1.3. Handling of solid waste at HHs level and town level
The entire study participants (both KIs and HHs) reported that the number of collection
containers located in the town was not enough to collect the generated SW (Table 4.7) this
result indicated that Solid waste reduction methods practice in Hagereselam town at HH and
municipalityResults of the present study revealed that only 17.7% of HHs practiced SW sorting
and KIs reported theabsence of such practices at municipality level of Hagereselam town. This
is consistent with finding of Adama town (Lema, 2007; Mengist and Assegid, 2014); Hosanna
town (Mekonnen, 2012); Hawassa city (Dereje, 2009); Addis Ababa (Nigatuet al., 2011) and
Jimma town (Melaku, 2008); Mekele city (Dagnewet al., 2012).Observation of HHs confirmed
that only SWs that can be sold, exchanged and, to limited extent, organic wastes are separated.
Types of items observe to be sorted by HHs include worn out clothes; old shoes;metals, tin and
cans; plastics glasses, bottles, and some electronic wastes.Forty one percent of HHs practiced
direct reuse of SWs at home levelbut all KIs reported the absence of such practice at
municipality leveland no such program was planned and/or lead (Table 4.7). This indicate100%
of the HHs in Hagerselam town not exercising waste reuse at homelevel and this is in line with
the finding of the study in Adama town(Lema, 2007). All respondents (HHs and KIs) reported
the absent ofonsite grinding and shredding practice. This is expected tohinder participation of
HHs on SW volume reduction practice for Vegetable growing. Observation of HHs confirmed
that only SWs that can be sold, exchanged and, to limited extent, organic wastes are separated.
Types of items observe to be sorted by HHs include worn out clothes; old shoes; metals, tin and
cans; plastics glasses, bottles, and some electronic wastes. Forty percent of HHs practiced
direct reuse of SWs at home level but all KIs reported the absence of such practice at
municipality level and no such program was planned and/or lead
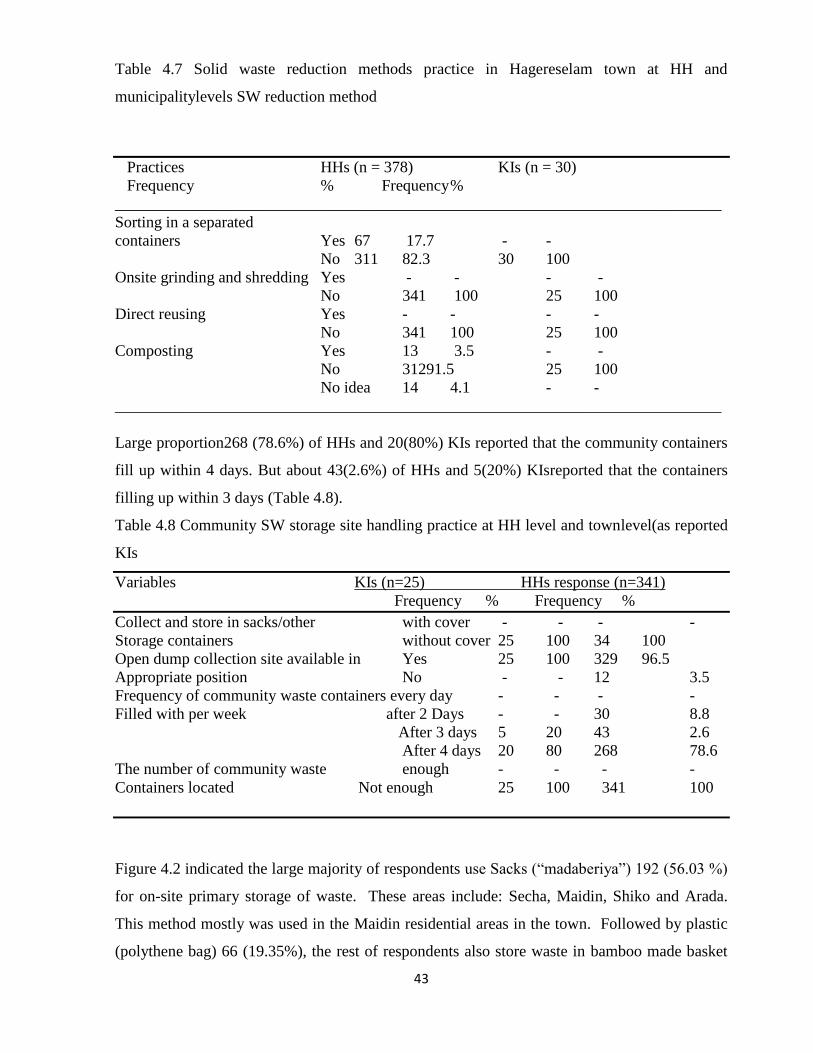
43
Table 4.7 Solid waste reduction methods practice in Hagereselam town at HH and
municipalitylevels SW reduction method
Practices HHs (n = 378) KIs (n = 30)
Frequency % Frequency %
____________________________________________________________________________
Sorting in a separated
containers Yes 67 17.7 - -
No 311 82.3 30 100
Onsite grinding and shredding Yes - - - -
No 341 100 25 100
Direct reusing Yes - - - -
No 341 100 25 100
Composting Yes 13 3.5 - -
No 31291.5 25 100
No idea 14 4.1 - -
____________________________________________________________________________
Large proportion268 (78.6%) of HHs and 20(80%) KIs reported that the community containers
fill up within 4 days. But about 43(2.6%) of HHs and 5(20%) KIsreported that the containers
filling up within 3 days (Table 4.8).
Table 4.8 Community SW storage site handling practice at HH level and townlevel(as reported
KIs
Variables KIs (n=25) HHs response (n=341)
Frequency % Frequency %
Collect and store in sacks/other with cover - - - -
Storage containers without cover 25 100 34 100
Open dump collection site available in Yes 25 100 329 96.5
Appropriate position No - - 12 3.5
Frequency of community waste containers every day - - - -
Filled with per week after 2 Days - - 30 8.8
After 3 days 5 20 43 2.6
After 4 days 20 80 268 78.6
The number of community waste enough - - - -
Containers located Not enough 25 100 341 100
Figure 4.2 indicated the large majority of respondents use Sacks (“madaberiya”) 192 (56.03 %)
for on-site primary storage of waste. These areas include: Secha, Maidin, Shiko and Arada.
This method mostly was used in the Maidin residential areas in the town. Followed by plastic
(polythene bag) 66 (19.35%), the rest of respondents also store waste in bamboo made basket
44
45 (13.20%), old bucket container23 (6.74%) and others 15 (4.4%). The Shiko residential areas
Most of HHs dump their waste nearby gutter, open spaces, and in pits. These methods of
waste disposal also happened in the market areas as observed during field work. This resulted
in littering and heaping of waste thereby making the environmental pollution. Therefore, the
possibility of outbreak of cholera and other environmental related diseases is high if such
practice continues. According to Kumet al. (2005).A key aspect of effective waste management
is proper waste storage on the premises where the waste is generated. The survey (Figure 4.2)
and observational results of the present study showed that for primary on-site storage of SW,
HHs use different types of containers, which is expected to be for different reasons as described
by Techobanglouset al. (1993). Large majority (56.03%) of the HHs used synthetic sacs and
this is expected to be due to easily availability in the market, the lowest cost, suitability for
holding large volume of solid wastes, and low frequency and spatial coverage of door to door
solid waste collection service of the town. As described by Solomon Cheru (2011), plastic bag
and basket use might be because of their frequent but low generation of waste and economic
power to utilize replicable storage materials. Some of those who do not use containers were
observed to store the waste in private pit in their compound and might be due to availability of
space in their compound and households need to prepare composite/fertilizer for vegetable
growing. About 100% of the HHs reported the community containers without cover, and this is
different from the of Hosanna town (Mekonnen, 2012). In another way, our study showed
that 100% of HHs use containers without cover which also indicates a poor onsite handling
practice of SWs in Hagereselam. Such poor handling practice may cause multiplication of flies
and vermin that can transmit diseases, and also impact public and environmental health.
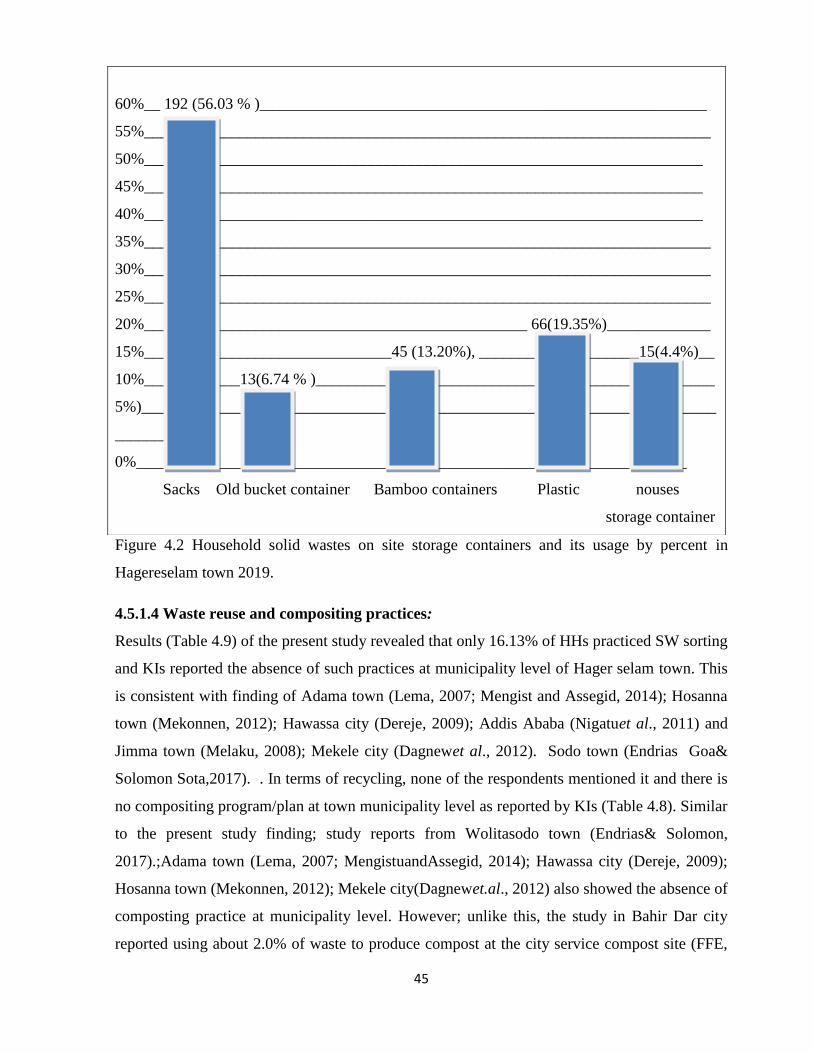
45
Figure 4.2 Household solid wastes on site storage containers and its usage by percent in
Hagereselam town 2019.
4.5.1.4 Waste reuse and compositing practices:
Results (Table 4.9) of the present study revealed that only 16.13% of HHs practiced SW sorting
and KIs reported the absence of such practices at municipality level of Hager selam town. This
is consistent with finding of Adama town (Lema, 2007; Mengist and Assegid, 2014); Hosanna
town (Mekonnen, 2012); Hawassa city (Dereje, 2009); Addis Ababa (Nigatuet al., 2011) and
Jimma town (Melaku, 2008); Mekele city (Dagnewet al., 2012). Sodo town (Endrias Goa&
Solomon Sota,2017). . In terms of recycling, none of the respondents mentioned it and there is
no compositing program/plan at town municipality level as reported by KIs (Table 4.8). Similar
to the present study finding; study reports from Wolitasodo town (Endrias& Solomon,
2017).;Adama town (Lema, 2007; MengistuandAssegid, 2014); Hawassa city (Dereje, 2009);
Hosanna town (Mekonnen, 2012); Mekele city(Dagnewet.al., 2012) also showed the absence of
composting practice at municipality level. However; unlike this, the study in Bahir Dar city
reported using about 2.0% of waste to produce compost at the city service compost site (FFE,
60%__ 192 (56.03 % )________________________________________________________
55%_______________________________________________________________________
50%______________________________________________________________________
45%______________________________________________________________________
40%______________________________________________________________________
35%_______________________________________________________________________
30%_______________________________________________________________________
25%_______________________________________________________________________
20%________________________________________________ 66(19.35%)_____________
15%_______________________________45 (13.20%), ____________________15(4.4%)__
10%____________13(6.74 % )__________________________________________________
5%)________________________________________________________________________
__________
0%_____________________________________________________________________
Sacks Old bucket container Bamboo containers Plastic nouses
storage container
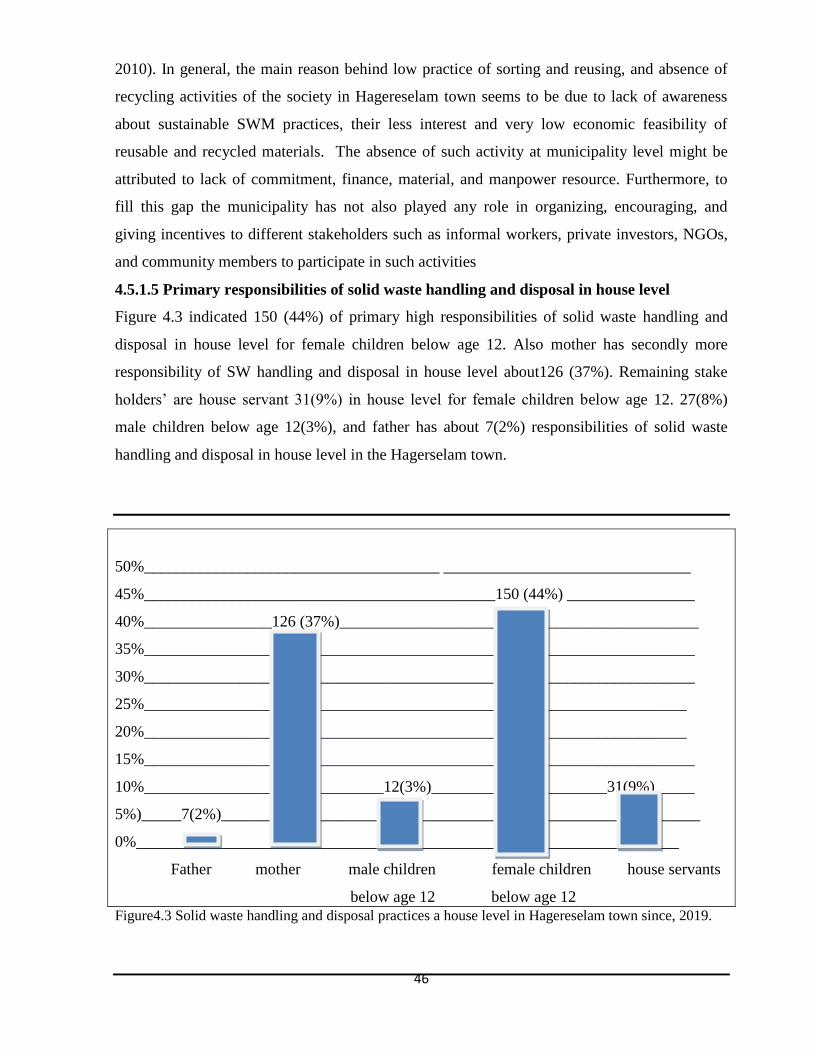
46
2010). In general, the main reason behind low practice of sorting and reusing, and absence of
recycling activities of the society in Hagereselam town seems to be due to lack of awareness
about sustainable SWM practices, their less interest and very low economic feasibility of
reusable and recycled materials. The absence of such activity at municipality level might be
attributed to lack of commitment, finance, material, and manpower resource. Furthermore, to
fill this gap the municipality has not also played any role in organizing, encouraging, and
giving incentives to different stakeholders such as informal workers, private investors, NGOs,
and community members to participate in such activities
4.5.1.5 Primary responsibilities of solid waste handling and disposal in house level
Figure 4.3 indicated 150 (44%) of primary high responsibilities of solid waste handling and
disposal in house level for female children below age 12. Also mother has secondly more
responsibility of SW handling and disposal in house level about126 (37%). Remaining stake
holders‟ are house servant 31(9%) in house level for female children below age 12. 27(8%)
male children below age 12(3%), and father has about 7(2%) responsibilities of solid waste
handling and disposal in house level in the Hagerselam town.
Figure4.3 Solid waste handling and disposal practices a house level in Hagereselam town since, 2019.
50%_____________________________________ _______________________________
45%____________________________________________150 (44%) ________________
40%________________126 (37%)_____________________________________________
35%_____________________________________________________________________
30%_____________________________________________________________________
25%____________________________________________________________________
20%____________________________________________________________________
15%_____________________________________________________________________
10%______________________________12(3%)______________________31(9%)_____
5%)_____7(2%)____________________________________________________________
0%____________________________________________________________________
Father mother male children female children house servants
below age 12 below age 12

47
4.5.2 Availability of Sacks and Container for Waste Storage
An interview with the mayor of Hagereselam town revealed that lack of sacks and container
was major problem in the town. The municipality of the town unable to supply sacks and from
table 4.9 is remarkable gap between the number of the sacks and containers available and
required to serve the households. The problem is more serious if one considers number of
available and required to serve the households living in Secha, shiko and Arada. This means
that number of sacks available to serve the needy households far from adequate. To fill the
existing gap, an additional of 2180 sacks has to be provided. As information obtained from the
town‟s municipality indicate, 38 containers are required to effectively manage the residential
wastes, but none is exited in study area. This means that lot of households did not use sacks for
storing their waste. In these areas there no bins were used and hence the areas lack cleanness.
Residential areas, wastes were dumped indiscriminately and disposed together at the same
place containers to areas it served. Table 4.9 below shows the selected areas, estimated
population, number of sacks and containers available as well as the number required for storing
wastes.
Table 4.9 Available and required containers in Hagereselam town, 2019
Residential Estimated NO of sacks NO of sacks NO of container NO of
containers
Area/ household‟s available required available required
____________________________________________________________________________
Secha, 585 7 598 - 10
Shiko, 594 20 535 - 8
Meidin 545 136 637 - 10
Arada 596 32 605 - 10
Total 2320 195 2375 - 38
4.5.3. Capacity of waste management institutions
An understanding of the capacities of SBDD and the MSEs will enable conclusions to be drawn
regarding their weakness. This section assesses the weakness of the SBDD and Micro small
enterprises. In terms of equipment and technical staffing, an interview with the SBDD and
Micro small enterprises, revealed the equipment base of the two waste management institutions
in the Hagereselam town
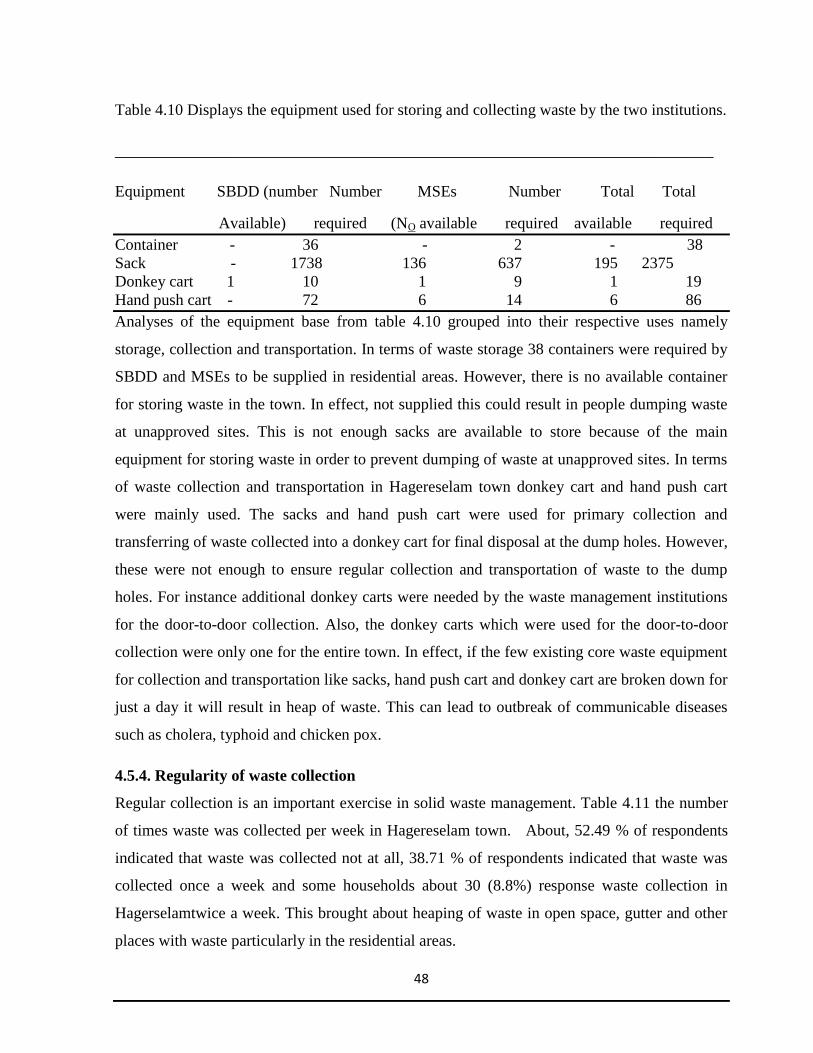
48
Table 4.10 Displays the equipment used for storing and collecting waste by the two institutions.
___________________________________________________________________________
Equipment SBDD (number Number MSEs Number Total Total
Available) required (NO available required available required
Container - 36 - 2 - 38
Sack - 1738 136 637 195 2375
Donkey cart 1 10 1 9 1 19
Hand push cart - 72 6 14 6 86
Analyses of the equipment base from table 4.10 grouped into their respective uses namely
storage, collection and transportation. In terms of waste storage 38 containers were required by
SBDD and MSEs to be supplied in residential areas. However, there is no available container
for storing waste in the town. In effect, not supplied this could result in people dumping waste
at unapproved sites. This is not enough sacks are available to store because of the main
equipment for storing waste in order to prevent dumping of waste at unapproved sites. In terms
of waste collection and transportation in Hagereselam town donkey cart and hand push cart
were mainly used. The sacks and hand push cart were used for primary collection and
transferring of waste collected into a donkey cart for final disposal at the dump holes. However,
these were not enough to ensure regular collection and transportation of waste to the dump
holes. For instance additional donkey carts were needed by the waste management institutions
for the door-to-door collection. Also, the donkey carts which were used for the door-to-door
collection were only one for the entire town. In effect, if the few existing core waste equipment
for collection and transportation like sacks, hand push cart and donkey cart are broken down for
just a day it will result in heap of waste. This can lead to outbreak of communicable diseases
such as cholera, typhoid and chicken pox.
4.5.4. Regularity of waste collection
Regular collection is an important exercise in solid waste management. Table 4.11 the number
of times waste was collected per week in Hagereselam town. About, 52.49 % of respondents
indicated that waste was collected not at all, 38.71 % of respondents indicated that waste was
collected once a week and some households about 30 (8.8%) response waste collection in
Hagerselamtwice a week. This brought about heaping of waste in open space, gutter and other
places with waste particularly in the residential areas.
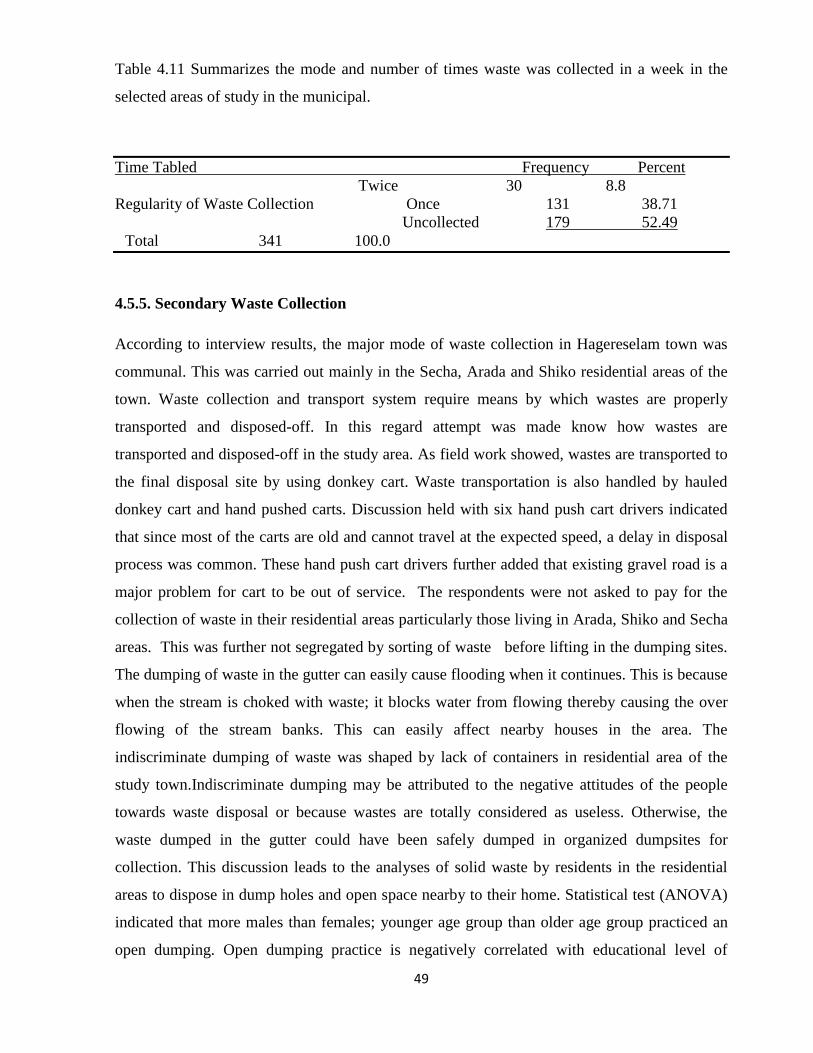
49
Table 4.11 Summarizes the mode and number of times waste was collected in a week in the
selected areas of study in the municipal.
Time Tabled Frequency Percent
Twice 30 8.8
Regularity of Waste Collection Once 131 38.71
Uncollected 179 52.49
Total 341 100.0
4.5.5. Secondary Waste Collection
According to interview results, the major mode of waste collection in Hagereselam town was
communal. This was carried out mainly in the Secha, Arada and Shiko residential areas of the
town. Waste collection and transport system require means by which wastes are properly
transported and disposed-off. In this regard attempt was made know how wastes are
transported and disposed-off in the study area. As field work showed, wastes are transported to
the final disposal site by using donkey cart. Waste transportation is also handled by hauled
donkey cart and hand pushed carts. Discussion held with six hand push cart drivers indicated
that since most of the carts are old and cannot travel at the expected speed, a delay in disposal
process was common. These hand push cart drivers further added that existing gravel road is a
major problem for cart to be out of service. The respondents were not asked to pay for the
collection of waste in their residential areas particularly those living in Arada, Shiko and Secha
areas. This was further not segregated by sorting of waste before lifting in the dumping sites.
The dumping of waste in the gutter can easily cause flooding when it continues. This is because
when the stream is choked with waste; it blocks water from flowing thereby causing the over
flowing of the stream banks. This can easily affect nearby houses in the area. The
indiscriminate dumping of waste was shaped by lack of containers in residential area of the
study town.Indiscriminate dumping may be attributed to the negative attitudes of the people
towards waste disposal or because wastes are totally considered as useless. Otherwise, the
waste dumped in the gutter could have been safely dumped in organized dumpsites for
collection. This discussion leads to the analyses of solid waste by residents in the residential
areas to dispose in dump holes and open space nearby to their home. Statistical test (ANOVA)
indicated that more males than females; younger age group than older age group practiced an
open dumping. Open dumping practice is negatively correlated with educational level of
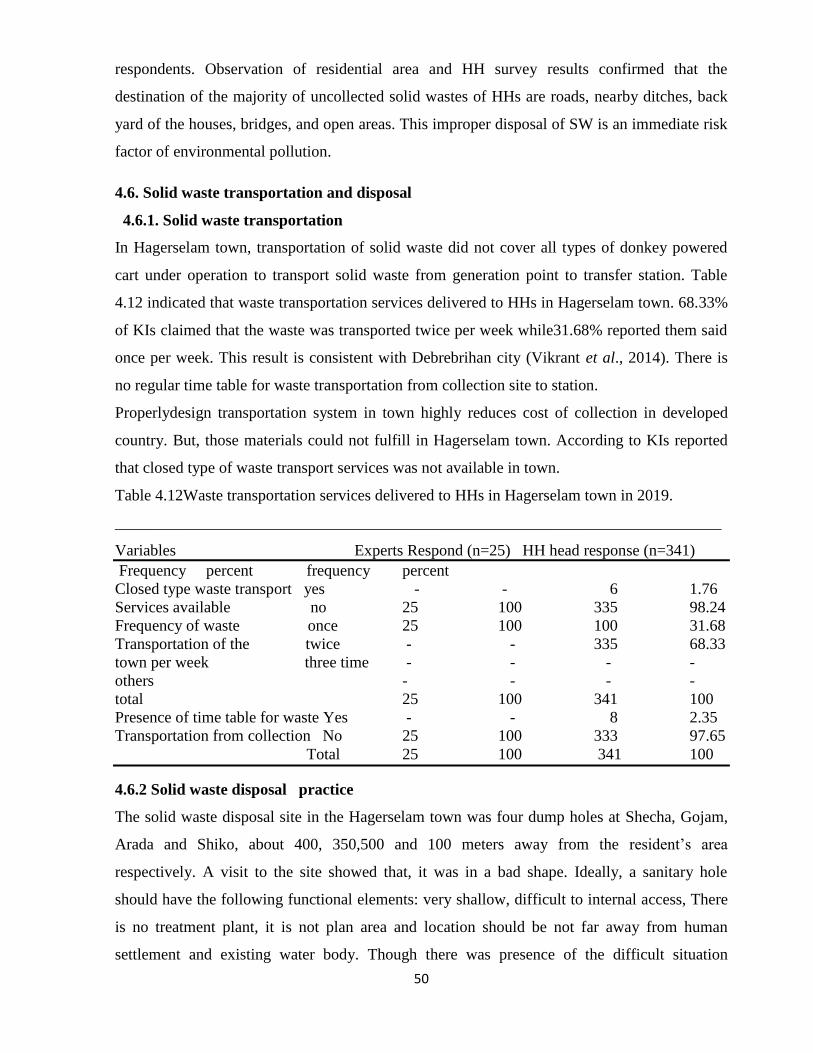
50
respondents. Observation of residential area and HH survey results confirmed that the
destination of the majority of uncollected solid wastes of HHs are roads, nearby ditches, back
yard of the houses, bridges, and open areas. This improper disposal of SW is an immediate risk
factor of environmental pollution.
4.6. Solid waste transportation and disposal
4.6.1. Solid waste transportation
In Hagerselam town, transportation of solid waste did not cover all types of donkey powered
cart under operation to transport solid waste from generation point to transfer station. Table
4.12 indicated that waste transportation services delivered to HHs in Hagerselam town. 68.33%
of KIs claimed that the waste was transported twice per week while31.68% reported them said
once per week. This result is consistent with Debrebrihan city (Vikrant et al., 2014). There is
no regular time table for waste transportation from collection site to station.
Properlydesign transportation system in town highly reduces cost of collection in developed
country. But, those materials could not fulfill in Hagerselam town. According to KIs reported
that closed type of waste transport services was not available in town.
Table 4.12Waste transportation services delivered to HHs in Hagerselam town in 2019.
____________________________________________________________________________
Variables Experts Respond (n=25) HH head response (n=341)
Frequency percent frequency percent
Closed type waste transport yes - - 6 1.76
Services available no 25 100 335 98.24
Frequency of waste once 25 100 100 31.68
Transportation of the twice - - 335 68.33
town per week three time - - - -
others - - - -
total 25 100 341 100
Presence of time table for waste Yes - - 8 2.35
Transportation from collection No 25 100 333 97.65
Total 25 100 341 100
4.6.2 Solid waste disposal practice
The solid waste disposal site in the Hagerselam town was four dump holes at Shecha, Gojam,
Arada and Shiko, about 400, 350,500 and 100 meters away from the resident‟s area
respectively. A visit to the site showed that, it was in a bad shape. Ideally, a sanitary hole
should have the following functional elements: very shallow, difficult to internal access, There
is no treatment plant, it is not plan area and location should be not far away from human
settlement and existing water body. Though there was presence of the difficult situation
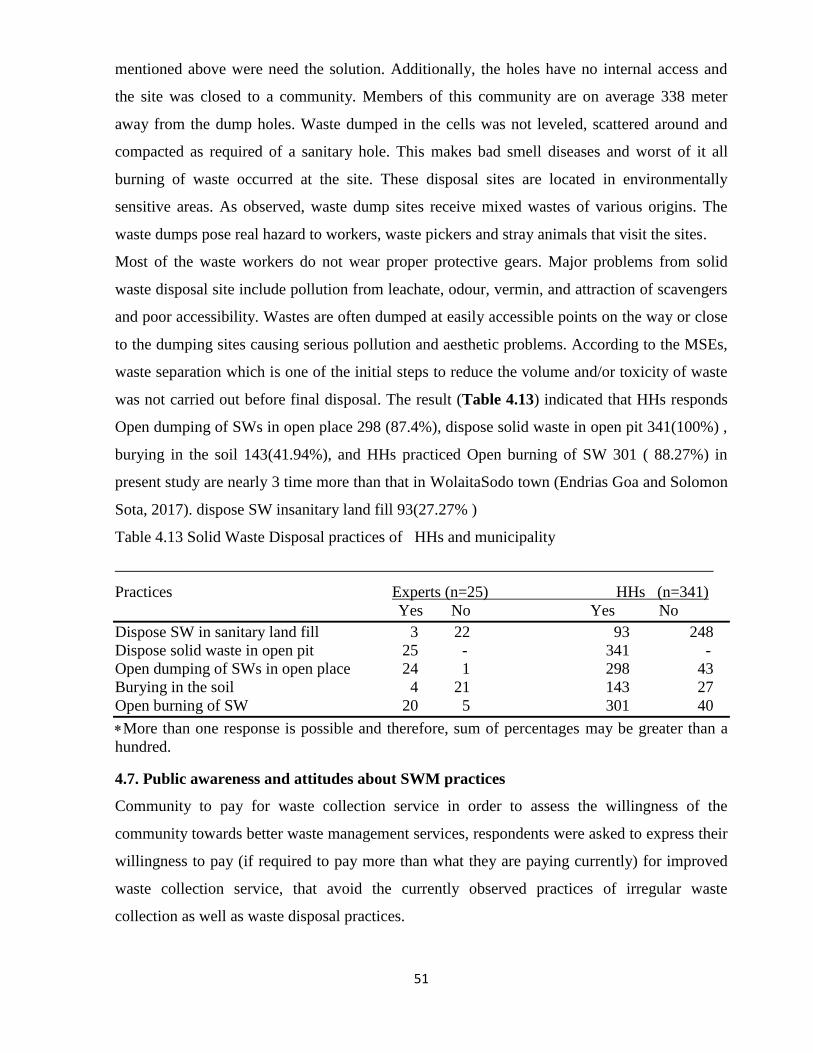
51
mentioned above were need the solution. Additionally, the holes have no internal access and
the site was closed to a community. Members of this community are on average 338 meter
away from the dump holes. Waste dumped in the cells was not leveled, scattered around and
compacted as required of a sanitary hole. This makes bad smell diseases and worst of it all
burning of waste occurred at the site. These disposal sites are located in environmentally
sensitive areas. As observed, waste dump sites receive mixed wastes of various origins. The
waste dumps pose real hazard to workers, waste pickers and stray animals that visit the sites.
Most of the waste workers do not wear proper protective gears. Major problems from solid
waste disposal site include pollution from leachate, odour, vermin, and attraction of scavengers
and poor accessibility. Wastes are often dumped at easily accessible points on the way or close
to the dumping sites causing serious pollution and aesthetic problems. According to the MSEs,
waste separation which is one of the initial steps to reduce the volume and/or toxicity of waste
was not carried out before final disposal. The result (Table 4.13) indicated that HHs responds
Open dumping of SWs in open place 298 (87.4%), dispose solid waste in open pit 341(100%) ,
burying in the soil 143(41.94%), and HHs practiced Open burning of SW 301 ( 88.27%) in
present study are nearly 3 time more than that in WolaitaSodo town (Endrias Goa and Solomon
Sota, 2017). dispose SW insanitary land fill 93(27.27% )
Table 4.13 Solid Waste Disposal practices of HHs and municipality
___________________________________________________________________________
Practices Experts (n=25) HHs (n=341)
Yes No Yes No
Dispose SW in sanitary land fill 3 22 93 248
Dispose solid waste in open pit 25 - 341 -
Open dumping of SWs in open place 24 1 298 43
Burying in the soil 4 21 143 27
Open burning of SW 20 5 301 40
More than one response is possible and therefore, sum of percentages may be greater than a
hundred.
4.7. Public awareness and attitudes about SWM practices
Community to pay for waste collection service in order to assess the willingness of the
community towards better waste management services, respondents were asked to express their
willingness to pay (if required to pay more than what they are paying currently) for improved
waste collection service, that avoid the currently observed practices of irregular waste
collection as well as waste disposal practices.
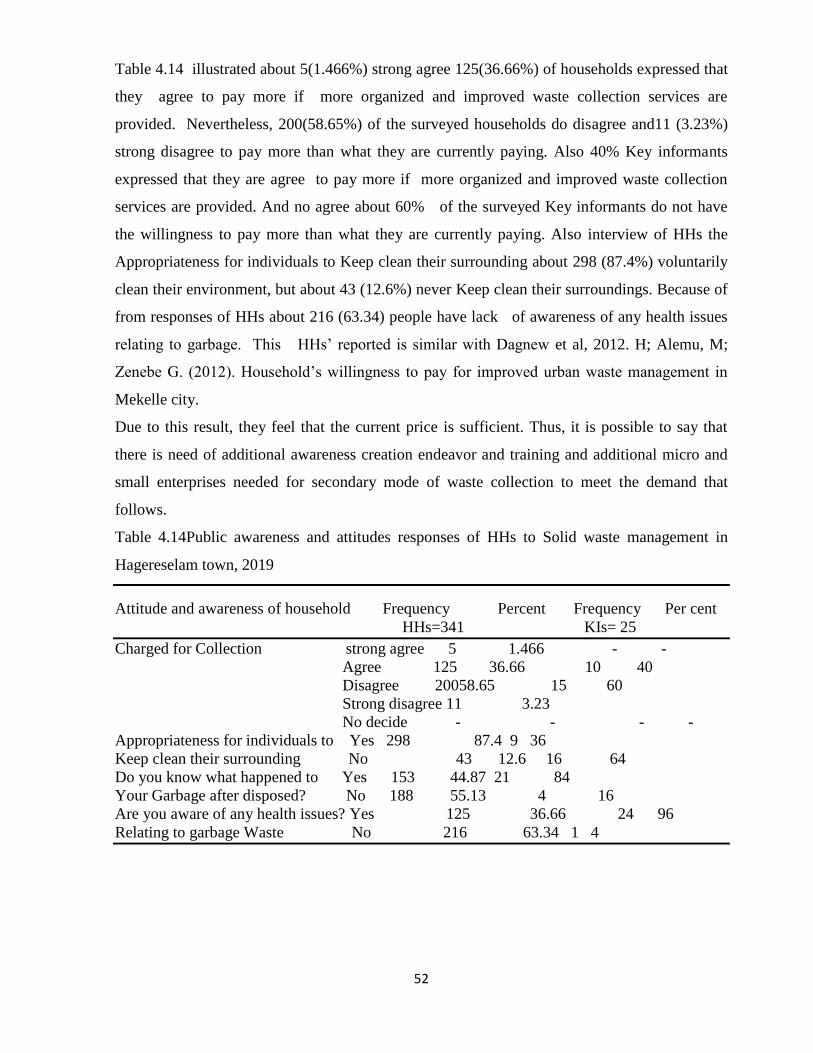
52
Table 4.14 illustrated about 5(1.466%) strong agree 125(36.66%) of households expressed that
they agree to pay more if more organized and improved waste collection services are
provided. Nevertheless, 200(58.65%) of the surveyed households do disagree and11 (3.23%)
strong disagree to pay more than what they are currently paying. Also 40% Key informants
expressed that they are agree to pay more if more organized and improved waste collection
services are provided. And no agree about 60% of the surveyed Key informants do not have
the willingness to pay more than what they are currently paying. Also interview of HHs the
Appropriateness for individuals to Keep clean their surrounding about 298 (87.4%) voluntarily
clean their environment, but about 43 (12.6%) never Keep clean their surroundings. Because of
from responses of HHs about 216 (63.34) people have lack of awareness of any health issues
relating to garbage. This HHs‟ reported is similar with Dagnew et al, 2012. H; Alemu, M;
Zenebe G. (2012). Household‟s willingness to pay for improved urban waste management in
Mekelle city.
Due to this result, they feel that the current price is sufficient. Thus, it is possible to say that
there is need of additional awareness creation endeavor and training and additional micro and
small enterprises needed for secondary mode of waste collection to meet the demand that
follows.
Table 4.14Public awareness and attitudes responses of HHs to Solid waste management in
Hagereselam town, 2019
Attitude and awareness of household Frequency Percent Frequency Per cent
HHs=341 KIs= 25
Charged for Collection strong agree 5 1.466 - -
Agree 125 36.66 10 40
Disagree 20058.65 15 60
Strong disagree 11 3.23
No decide - - - -
Appropriateness for individuals to Yes 298 87.4 9 36
Keep clean their surrounding No 43 12.6 16 64
Do you know what happened to Yes 153 44.87 21 84
Your Garbage after disposed? No 188 55.13 4 16
Are you aware of any health issues? Yes 125 36.66 24 96
Relating to garbage Waste No 216 63.34 1 4
53
4.8. Problems of solid waste management and sanitation in Hagerselam town
A. Equipment
An interview with Municipality even though manpower is used in solid waste management,
different pieces of equipment plays a significant role in waste management activities. The
Hagereselam town solid waste management department uses three types of equipment for this
service. These are donkey cart, hand push carts and sacks. But the problem is associated with
no container, inadequacy and improper use of this equipment. The existing one donkey cart
cannot serve the entire population of the town because it is believed that waste is daily
produced in each and every household. Another problem that is a challenge for solid waste
management system in the town is the distance of dump holes. MSEs in each kebele are not
evenly distributed. MSEs is working only Maidin. Three areas of them disadvantaged
compared to Maidin. In relation to this what the researcher, argues is that the containers are
needed for collection of wastes. Therefore, mostly households dispose off wastes in open space,
road side, nearby gutter and other places.Solid waste management system problem was
seriously that affected the human health.
B. Law Enforcement
An interview with SBDD important aspect that can play a significant role in the process of
waste management is the issue of bye-law. Of course, the town hasn‟t the legal service which is
responsible for the enforcement of rules and regulations through different mechanisms. The
municipality hasn‟t given continuous education on solid waste management to the residents of
town. The Addis Ababa City Administration Charter Proclamation No 311/2003 Article 24
states that those persons assigned to enforce the rule should impartially and honestly work in
unversed. The response obtained from the SBDD showed that another constraint that affects the
performance of solid waste management in town is lack of co-ordination between the SBDD
and the MSEs. From the survey the answer gained from the SBDD with regard to solid waste
management indicated that those MSEs working in the town do not properly discharge their
responsibility as there is a loophole in the work between the two bodies. Therefore, this
affected the management system and created negative impact on the performance of waste
management. The interview held with the SBDD, MSEs and particularly with drivers revealed
that one of the major factors that greatly affected solid waste management system is the

54
problem of waste dumping site. This handicap is not the problem of only the town but the
problem of city as a whole.
C. Cost of managing waste
An interview with Hula district finance and economic office amount of 12,000 birr was spent
on solid waste by the SBDD. This amounted to 1,000 birr in a month. Out of this 80 per cent
for purchase of donkey cart and hand push carts and 20 per cent for other administrative duties.
However, this amount was given to the SBDD was not enough to manage solid waste in the
town and this cause poor management of solid waste. An interview with the mayor of town
showed that an amount of 12,000 birr was spent to solid waste management in 2017
D. Human and technical factors
According to interview of about human and technical factors of Hagereselam town human
resources for management are scarce in some cases and officials without technical training in
waste management are assigned to handle the complex issues involved, and the basis on which
they receive technical assistance can, therefore, be limited. It is true that urban services like
waste management need well-organized, trained and skilled manpower. Besides, the service
that is to be performed needs proportionate number of service providers. Man power of the
Solid Waste management in Hagereselam town. There are about 14 employees under the
SBDD in Hagereselam town except 2 of the workers, the remaining 12 workers are directly
involved in the provision of solid waste management service. To begin with there is no
promotion in the level of workers even if they have improved their educational level or are hard
working. The only thing that workers will get when they are found to be hard working is a
moral incentive. Moreover, the payment system of the workers of the solid waste management
is another problem that greatly affects the working condition of the employees. The salary scale
of the employees shows that the range is between 300 up to 420 birr. This situation has
aggravated the desperation of the workers. Therefore, social factors have a direct impact in
constraining solid waste management system because the social status of SW workers is
generally low.
E. Community participation
According to focus group discussion finding, lack of community participation has a negative
bearing on waste management. This could be seen as follows. First of all, the community in
Hagereselam town does not have a concern in solid waste management. Most households do
not have awareness of solid waste management and its impact on the environment. So, these
and other related factors have affected the solid waste management system in Hagereselamtown
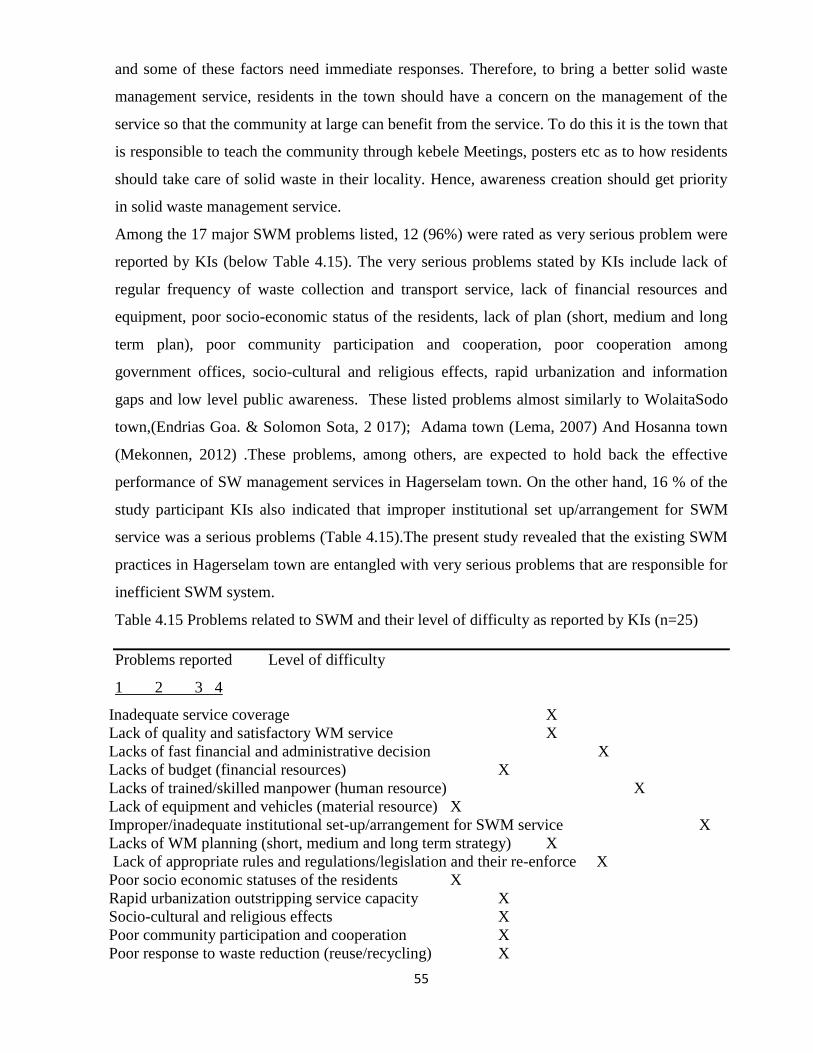
55
and some of these factors need immediate responses. Therefore, to bring a better solid waste
management service, residents in the town should have a concern on the management of the
service so that the community at large can benefit from the service. To do this it is the town that
is responsible to teach the community through kebele Meetings, posters etc as to how residents
should take care of solid waste in their locality. Hence, awareness creation should get priority
in solid waste management service.
Among the 17 major SWM problems listed, 12 (96%) were rated as very serious problem were
reported by KIs (below Table 4.15). The very serious problems stated by KIs include lack of
regular frequency of waste collection and transport service, lack of financial resources and
equipment, poor socio-economic status of the residents, lack of plan (short, medium and long
term plan), poor community participation and cooperation, poor cooperation among
government offices, socio-cultural and religious effects, rapid urbanization and information
gaps and low level public awareness. These listed problems almost similarly to WolaitaSodo
town,(Endrias Goa. & Solomon Sota, 2 017); Adama town (Lema, 2007) And Hosanna town
(Mekonnen, 2012) .These problems, among others, are expected to hold back the effective
performance of SW management services in Hagerselam town. On the other hand, 16 % of the
study participant KIs also indicated that improper institutional set up/arrangement for SWM
service was a serious problems (Table 4.15).The present study revealed that the existing SWM
practices in Hagerselam town are entangled with very serious problems that are responsible for
inefficient SWM system.
Table 4.15 Problems related to SWM and their level of difficulty as reported by KIs (n=25)
Problems reported Level of difficulty
1 2 3 4
Inadequate service coverage X
Lack of quality and satisfactory WM service X
Lacks of fast financial and administrative decision X
Lacks of budget (financial resources) X
Lacks of trained/skilled manpower (human resource) X
Lack of equipment and vehicles (material resource) X
Improper/inadequate institutional set-up/arrangement for SWM service X
Lacks of WM planning (short, medium and long term strategy) X
Lack of appropriate rules and regulations/legislation and their re-enforce X
Poor socio economic statuses of the residents X
Rapid urbanization outstripping service capacity X
Socio-cultural and religious effects X
Poor community participation and cooperation X
Poor response to waste reduction (reuse/recycling) X
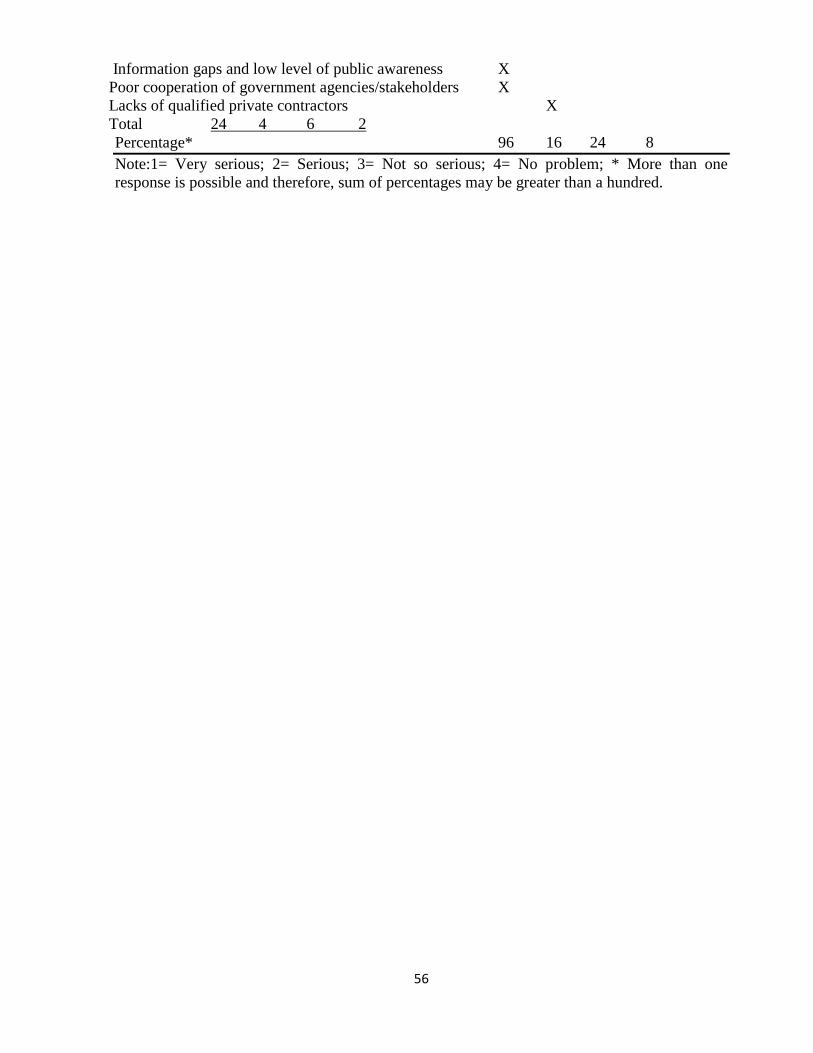
56
Information gaps and low level of public awareness X
Poor cooperation of government agencies/stakeholders X
Lacks of qualified private contractors X
Total 24 4 6 2
Percentage* 96 16 24 8
Note:1= Very serious; 2= Serious; 3= Not so serious; 4= No problem; * More than one
response is possible and therefore, sum of percentages may be greater than a hundred.
57
5. CONCLUSIONS AND RECOMMENDATIONS
5.1. Conclusion
From the present finding SW produced from an individual household was 0.219kg
(0.0005613m3) per day and wastes generated in the study area were 7888.6kg(21.3m
3) per
day and total wastes generated 2879339.0 kg(7774.5m3
) per years. According to data
obtained from survey 4956.8kh were hauled every day out of the 7888.6kg. Only 2931.8 kg
was collected in the entire study area per day. This is due to absence of enough equipment,
MSEs and donkey carts in the town. This survey shows that additional containers, donkey
powered carts and more MSEs are needed to reduce hauled waste. During the field
investigation it was observed that a lot of wastes were uncollected for days in the residential
areas. Majorcomposition was food waste about 47% and plastic constituted 25%. With regard
to major sources of solidwaste were from residential about 45%, commercial 26%, institutional
17% sectors and 12% other sources. On other hand, the collection was irregular. The study was
also meant to analyze how the waste collected was final disposed off. It can therefore be said
that waste collected was finally disposed in the dump holes. However, the dump hole was in a
poor state. Furthermore, the study intended assessing the capacity of waste management
institutions particularly in terms of physical resources to ineffectively manage waste in the
town. The challenges of SWM in town were lack of community participation, absences of main
equipment used for waste storage and collection and skilled man power to ensure effective
waste collection, disposal and sanitation.
Therefore, all the objectives set were achieved and with regard to the main objective of the
study it can be concluded that the following are indeed the key factors affecting effective waste
management in Hagereselam town. These include inadequate bins supply for storing waste; no
container; lack of regular collection of waste, poor methods of waste management and
inadequate resources for waste management institutions to effectively collect the waste
generation.
Finally, the present finding clearly indicated that the SWM system in Hagerselam town is very
weak and needs improvement. Therefore, the town administration/ municipality must work
hard to make SWM system more efficient to improve the services, raise public awareness to
increase their participation in practices, increase stakeholders‟ involvement and enforce SWM
regulations, laws, etc., Moreover, there is a need to have well organized management that
functions within an adequate institutional arrangement, skilled manpower and financial
58
resources. Furthermore, the town municipality must develop an appropriate SW management
plan and implement to properly manage the SW generated in Hagereselam town.
5.2. Recommendations
Based on the findings of the study, the following measures are recommended for efficient and
effective management of solid waste in Hagereselam town. These are discussed below.
Adequate containers and bins should be provided by MSEs, in collaboration with the
SBDD and Hagereselam town for residents in the town for waste storage.
There should be regularity of waste collection by MSEs, particularly in highly populated
areas like Arada, Maidin, and Shiko to avoid heaping of waste on road side and be regular
monitoring of waste collection by the sanitation and beautification development
department.
The Integrated Solid Waste Management (ISWM) should be adopted to ensure effective
solid waste management in the area. Households should be encouraged by SBDD and
MSEs to separate the waste generated into their various components before final disposal.
Waste can be disaggregated into plastic, metals, wood, bottles and food waste. In this case
rubber, bottles, metals can be reused; plastics like polythene bags and empty water sachets
can also be recycled. The rest like food waste can be composted for manure.
The dump holes site should be properly managed to avoid heaping of waste
The Environmental Protection Agency which is the regulatory authority on sanitation
should ensure routine monitoring of management of the dump holes site. The dump holes
site should also be relocated because of its negative environmental impact on the lives of
people in a nearby community.
The waste management institutions should be adequately resourced by the Hagereselam
town to ensure efficient and effective waste management in the area. The Municipality
should liaise with other corporate bodies like the NGOs to pull financial resources to
support the institutions in charge of managing waste especially the MSEs.
Generally, these above recommendations given are well taken and implemented at all
institutions-governments such as municipality, Hula district, sanitations beautification
development departments, households and non-governmental organizations
59
REFERANCES
Afewerk, B. (2015). Household generation rate and composition analyses in Adamatown.MSc
thesis, Haramaya University, Ethiopia.
Abebe Tegegn, 2006. The Involvement of Micro and Small Enterprises in Solid Waste
management Service in Addis Ababa: The case of Bole and Arada sub-cities, Ethiopia.
Addis Ababa City Administration Solid Waste Policy (AACASWP), 2003. Participation in
Solid Waste Management: Environmental Protection Bureau.
Benny. j, 2005. Solid wastes are wastes arise from human and animal activities
Blanche, M. ; Durrheim, K. and Painter, D. (2006). Researcher in practice (2nd
Ed),Cape Town,
Utc Press.
Birke et al., 1999 ; Gebrie Kassa,2009. Managements of domestic solid waste in Bahirdar town,
operational analysis and assessment of constraints that affect solid waste management.
(Briliante & Frank, 2009). suggested that contemporary approach of prevention waste
Bryman, A. (2004). Social Research Methods (2nd
Edition).Oxford: University Press.
Center of Environmental and Development(CED),2003. Study of the Attitude and Perception
of Community towards Solid Waste Management: A case study of Thirovanathapuran
city phase II. Submitted to Kerala research program local level Development.
Central Statistic Authority (CSA), hagerselam Branch. (2014). The 1999 Population
projection of Hagerselamtown, 2013/14 Statistical Abstract, hagerselam, Ethiopia.
Cointreau Levin and Sandra, 2007. Solid waste management is not an isolated phenomenon on
that can be easily compartmentalized and solve with innovative technology or
engineering.
Dagnew et al. 2011; Alemu Zenebe,(2012). Households‟ willingness to pay for improvedurban
waste management in Mekelle city.Environment for Development, Discussion
PaperSeries April, 2012, EfD DP 12-06.
Dereje, D. (2009). Household solid waste generation rate, composition and content analysis for
disposal and resource recovery in two selected kebeles of Hawassa town. MSc thesis,
Addis Ababa University, Addis Ababa, Ethiopia, Current Solid Waste Management
Practices….. 1104.
Denison, R.A. and Ruston, J.(1990). Recycling and Incineration.Island Press, Washington D.C.
ENPHO). (2007). Solid waste management in Nepal. 110/25 Adarsa Marga-1, Thapagaon, New
Baneshwor, Kathmandu, Nepal. (Accessed date: 25 September 2012).
60
Endrias, Goa and Solomon Sota. (2017).Generation rate and physical composition of solid
waste inWolaita Sodo town, Southern Ethiopia; Ethiopian J. Environmental studies and
Management, 10 (3): 415 – 42. Environment and Public Health Organization
Environmental Development Agency (ENDA). (2006). Living Healthily in a Clean and Green
City. Habitat International Coalition Case Study. Barcelona, Spain.
Enger and smith, (2008) the organic materials produced by composting can be added to soil to
supply plant nutrients such as nitrogen phosphorous ,potassium iron, sulphur, and
calcium slow soil erosion, make clay soil more porous.
Felix, P. (2010). Solid Waste Management in Ghana: The Case of Table Metropolitan Area.
Fikre Yesus, 2011 small proportions of the urban dwellers are served and large quantity of solid
waste is left uncollected
Forum for Environment (FFE). (2010). Assessment of the solid waste management system of
Bahir Dartown and the gaps identified for the developmentof an ISWM plan. In
Ethiopian EnvironmentReview. Addis Ababa
Freduah, G. (2004). Problems of Solid Waste Management in Nima, Accra.University of
Ghana, Legon.
Gebrie Kassa.(2009). Management of Domestic Solid Waste in BahirdarTown, Operational
Analysis and Assessment of Constraints that Affect Solid Waste Management.MA
Thesis, School of Graduate Studies, Addis Ababa University, Addis Ababa, Ethiopia.
Gertsaki , J.& Lewis, H., 2003. Sustainability and the Waste Management Hierarchy.
A discussion paper on the waste management hierarchy and its relationship to sustainability.
Hagere-Selam Town Municipal Office Magazine (2015).SNNPR in Ethiopia.
Hagerty, D.J., Pavoni, J.L., and Heer, John E., Jr.. (1973). Solid Waste Management.Van
Nostrand Reinhold Company; New York.
Harrison, Roy M.(1996). Pollution: Causes, Effects and Control. (ed.).Royal society
Chemistry,Uk
Hula District Finance and Economic Development Office Magazine, (2015).
Ibid,2005. He reported that all vehicles in operation were considered including manually
driven small carts mechanically driven sophisticated transportation vehicle, and special
vehicles for hazardous, bulky, and recyclable wastes generally, a properly design
transfer & transportation system highly reduces cost of collection “.
Kreith, F. (1994).Handbook of Solid Waste Management. McGraw Hill, USA.
61
Kum, V., Harnpornchail, N; Sharp, A. (2005).Improving waste management in Phnom Penh
city: Strategic approach.WasteManagement25:101-109.
Lema, A. (2007). Household solid waste generation rate and composition analysis in two
selectedkebeles of Adama town, MSc thesis, School ofGraduate Studies, Addis Ababa
University, AddisAbaba, Ethiopia,
(Martin, 2000). he classified the sources of solid wastes emanate categorized municipal solid
waste as households (residential) refuse, institutional wastes, street sweeping,
commercial area wastes as well as construction and demolition places.
Melaku, T. (2008).Household solid waste generation rate and physical composition analysis, in
Jimmatown, Ethiopia.
Mekete et al., 2009. Adequate solid waste managments in unquestionable.
Mengist, H; Assegid, A. (2014). Solid waste management in Adama, Ethiopia: Aspects
andchallenges. International Journal ofEnvironmental, Chemical,
Ecological,Geological and Geophysical Engineering 8 (9):670-67.
Mekonnen, A. (2012). Development of solid waste management strategy for Hossana town.
MA thesis, Addis Ababa University, Addis Ababa, Ethiopia.
Meenakship, P. (2005). Elements of Environmental Science and Engineering, Prentice Hall of
India Private Limited, India.
Mohammed Gedefaw, (09, September 2015 issue 2277-8616,28 international journals of
scientific and technology research volume 4, assessing current status of solid waste
management of Gonder town, Ethiopia
Miller G. (2007). Living in the Environment. 5th Eddition, International Student Edition, USA.
Momoh J.J and Oladebeye D.H.(2010). Assessment of Awareness, Attitude and Willingness
of People to Participate in Household Solid Waste Recycling Programme. Journal of
Applied Sciences in Environmental Sanitation.vol.5, №,1,pp.93 – 105, __2010.
Oladebeye and Momoh (2010) . Showed that, the method of solid waste disposal include
dumping of waste in gutters, drains, by roadside, unauthorized dumping site Ado-Akiti
in Nigeria.
Ogawa, H. (2002, (2005).). Sustainable Solid Waste Management in Developing Countries,
Western Pacific Regional Environmental Health Center(EHC), Kuala Lumpur,
Malaysia. Retreved from http://www.gdrc.org/waste/swm-fogawa1.htm.
62
Rush brook, 1999 and G/Tsadkan ,2002). Determined types of facilities required for solid
waste management ,best disposal options and projecting future needed requires precise
information about calorific value of solid waste produced in Ethiopia city
Shafiul, A. A. and Mansoor, A. (2003). Partinerships for Solid Waste Management in
Developing Countries: Linking theories to realities in the Institute of Development
Engineering, Waste and Development Center(WEDC). Loughborough University, U.K.
Solomon Cheru, (2011). Assessment of municipal solid waste management service in Dessie
town. MA thesis, Addis Ababa University, Addis Ababa, Ethiopia.
Tchobanoblous et al (1993), classified the types of solid waste in relation to the sources and
generation facilities and activities
Tsiboe, I.A. and Marbell, E. (2004).A look at Urban Waste Disposal Problems in Accra,
Roskilde University, Denmark.
United Nations Environmental Program (UNEP).(2009). Developing integrated solid waste
management plan: training manual for assessment of current waste management system
and gaps therein, Volume 2,
UNEP (2010a), one problems of sanitation and waste management challenges of developing countries
UNEP Technical Publication 6, Nov. 1996. Retrieved from
http://www.unep.or.jp/ietc/estdir/pub/msw.wage page accessed, august 18.
Uriate J. and Filemon A, (2008). Solid Waste Management and Practices
USPS. (2000). Solid Waste Management Plan for Thimphu City, Bhutan, Draft Version, April
2000. Bhutan: Urban Sector Programme Support Secretariat.
Vikrant et. al and Solomon F, Sharma HR. (2014). Municipal solid waste management in
DebreBerhan City of Ethiopia. Urban Management andClimate Change Department,
Ethiopian Civil Service University, Addis Ababa, Ethiopia Vol. 4,
Yamane,( 1967). Sampling Techniques, 3rd edition, Wiley Series in Productivity and Applied Mathematical
Statistics. New York, USA
Yohanis birhanu 1,*,Genemo berisa, 2015; 3(5): 153-1682 Department of chemistry jigiga
university,Department of Geography jigiga university, Somalia regional states, Ethiopia
Zaman, A. &Lehman, S., 2011.Challenges and Opportunities in Transforming a City into a
“Zero Waste City.
Zebenay Kassa.(2010). The Challenge of Solid Waste Management in Urban Areas. The Case
of Debre markos Town. MA thesis School of Graduate Studies, Addis Ababa
University,Addis Ababa, Ethiopia
63
Zerbock, O. (2003). Urban Solid Waste Management: Waste Reduction in Developing Nations.
(www.cee.mtu.edu). Accesssed on 18 thJuly,2009.
Zurbrugg, C. (2009). Solid Waste Management in Developing Countries.(www.sanicon.net).
Accessed on 18 th July, 2009.
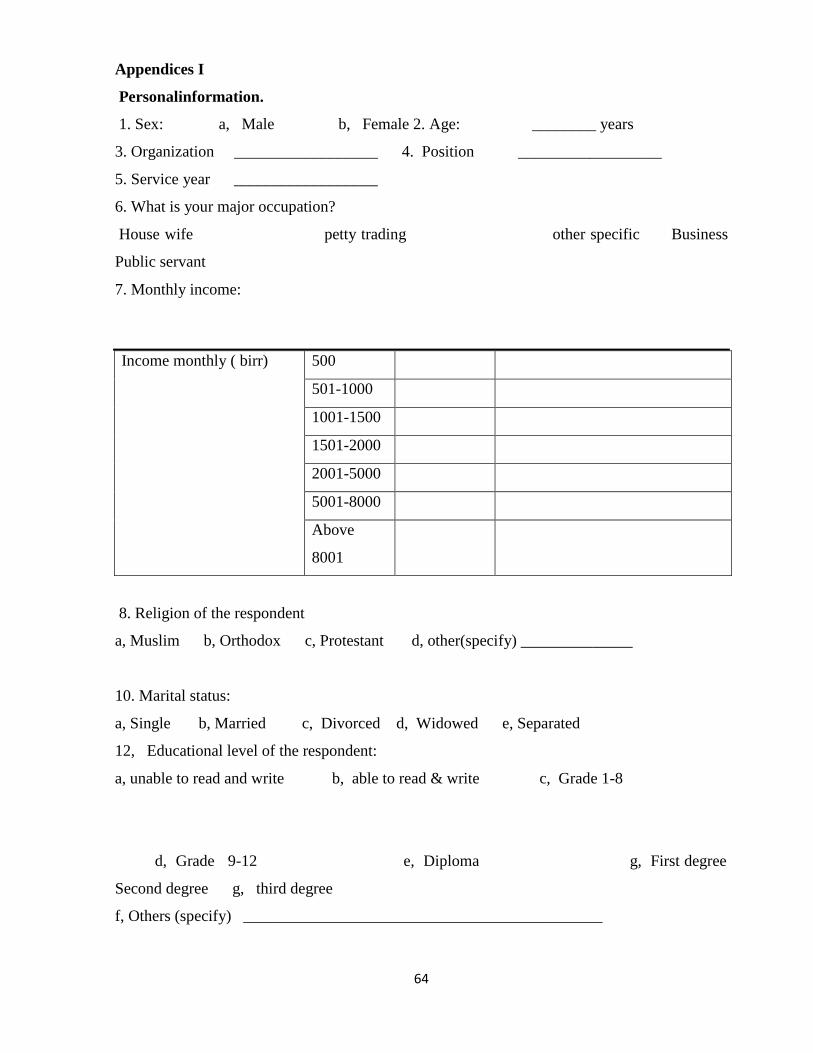
64
Appendices I
Personalinformation.
1. Sex: a, Male b, Female 2. Age: ________ years
3. Organization __________________ 4. Position __________________
5. Service year __________________
6. What is your major occupation?
House wife petty trading other specific Business
Public servant
7. Monthly income:
Income monthly ( birr)
500
501-1000
1001-1500
1501-2000
2001-5000
5001-8000
Above
8001
8. Religion of the respondent
a, Muslim b, Orthodox c, Protestant d, other(specify) ______________
10. Marital status:
a, Single b, Married c, Divorced d, Widowed e, Separated
12, Educational level of the respondent:
a, unable to read and write b, able to read & write c, Grade 1-8
d, Grade 9-12 e, Diploma g, First degree
Second degree g, third degree
f, Others (specify) _____________________________________________
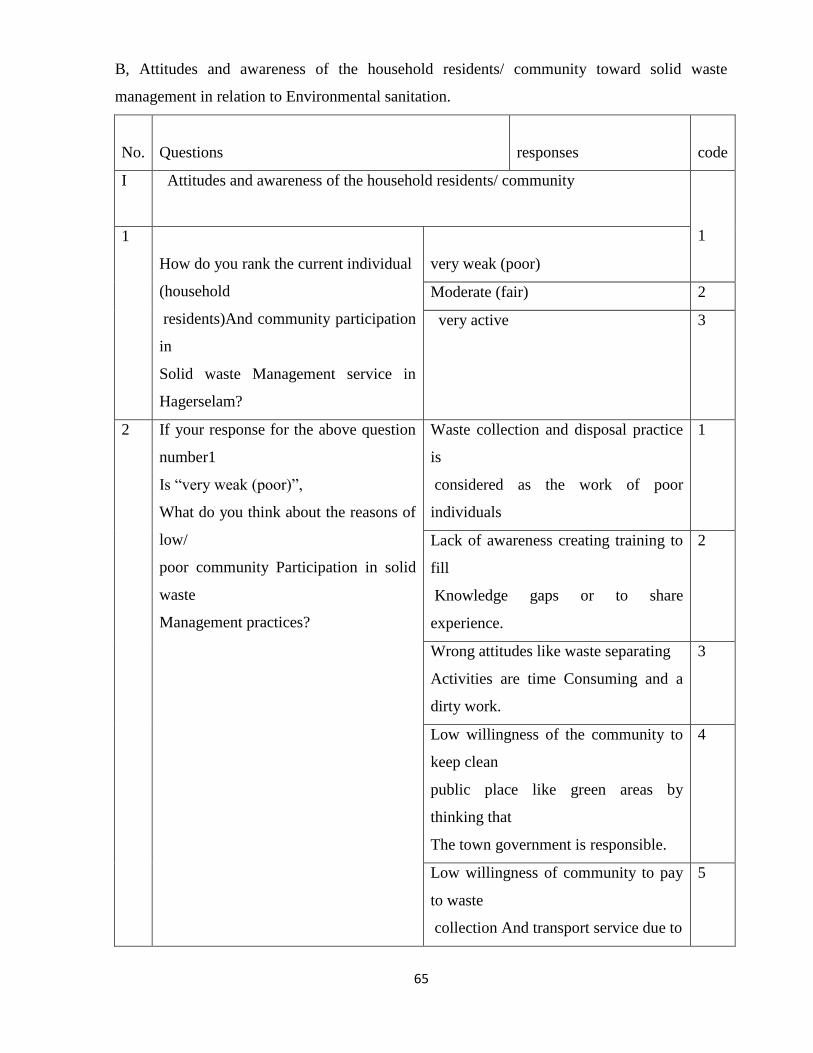
65
B, Attitudes and awareness of the household residents/ community toward solid waste
management in relation to Environmental sanitation.
No.
Questions
responses
code
I
Attitudes and awareness of the household residents/ community
1 1
How do you rank the current individual
(household
residents)And community participation
in
Solid waste Management service in
Hagerselam?
very weak (poor)
Moderate (fair) 2
very active 3
2
If your response for the above question
number1
Is “very weak (poor)”,
What do you think about the reasons of
low/
poor community Participation in solid
waste
Management practices?
Waste collection and disposal practice
is
considered as the work of poor
individuals
1
Lack of awareness creating training to
fill
Knowledge gaps or to share
experience.
2
Wrong attitudes like waste separating
Activities are time Consuming and a
dirty work.
3
Low willingness of the community to
keep clean
public place like green areas by
thinking that
The town government is responsible.
4
Low willingness of community to pay
to waste
collection And transport service due to
5
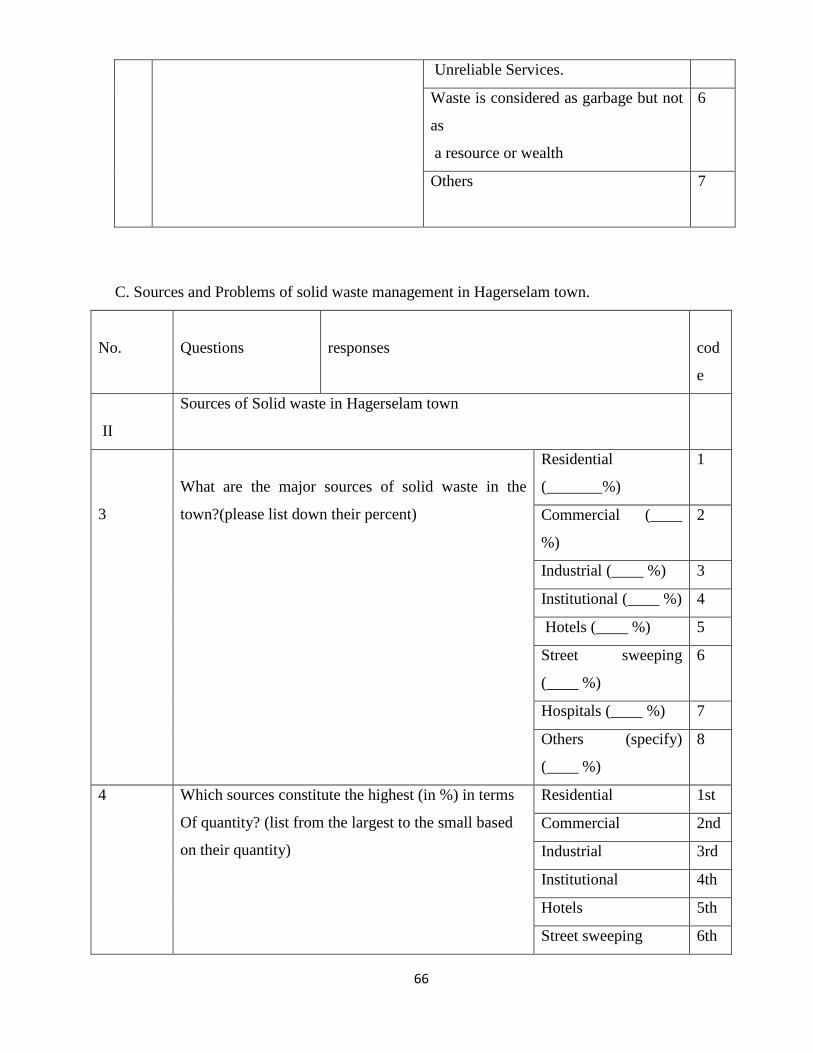
66
Unreliable Services.
Waste is considered as garbage but not
as
a resource or wealth
6
Others
7
C. Sources and Problems of solid waste management in Hagerselam town.
No.
Questions
responses
cod
e
II
Sources of Solid waste in Hagerselam town
3
What are the major sources of solid waste in the
town?(please list down their percent)
Residential
(_______%)
1
Commercial (____
%)
2
Industrial (____ %) 3
Institutional (____ %) 4
Hotels (____ %) 5
Street sweeping
(____ %)
6
Hospitals (____ %) 7
Others (specify)
(____ %)
8
4 Which sources constitute the highest (in %) in terms
Of quantity? (list from the largest to the small based
on their quantity)
Residential 1st
Commercial 2nd
Industrial 3rd
Institutional 4th
Hotels 5th
Street sweeping 6th
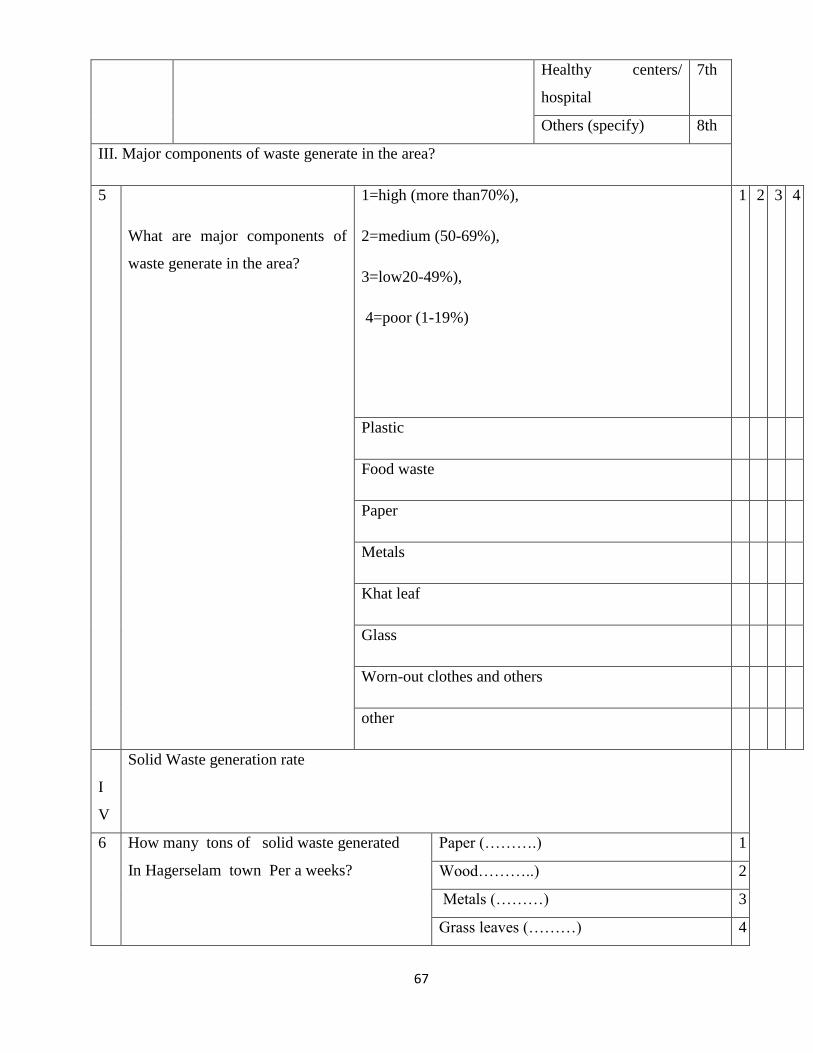
67
Healthy centers/
hospital
7th
Others (specify) 8th
III. Major components of waste generate in the area?
5
What are major components of
waste generate in the area?
1=high (more than70%),
2=medium (50-69%),
3=low20-49%),
4=poor (1-19%)
1
2
3
4
Plastic
Food waste
Paper
Metals
Khat leaf
Glass
Worn-out clothes and others
other
I
V
Solid Waste generation rate
6
How many tons of solid waste generated
In Hagerselam town Per a weeks?
Paper (……….) 1
Wood………..) 2
Metals (………) 3
Grass leaves (………) 4
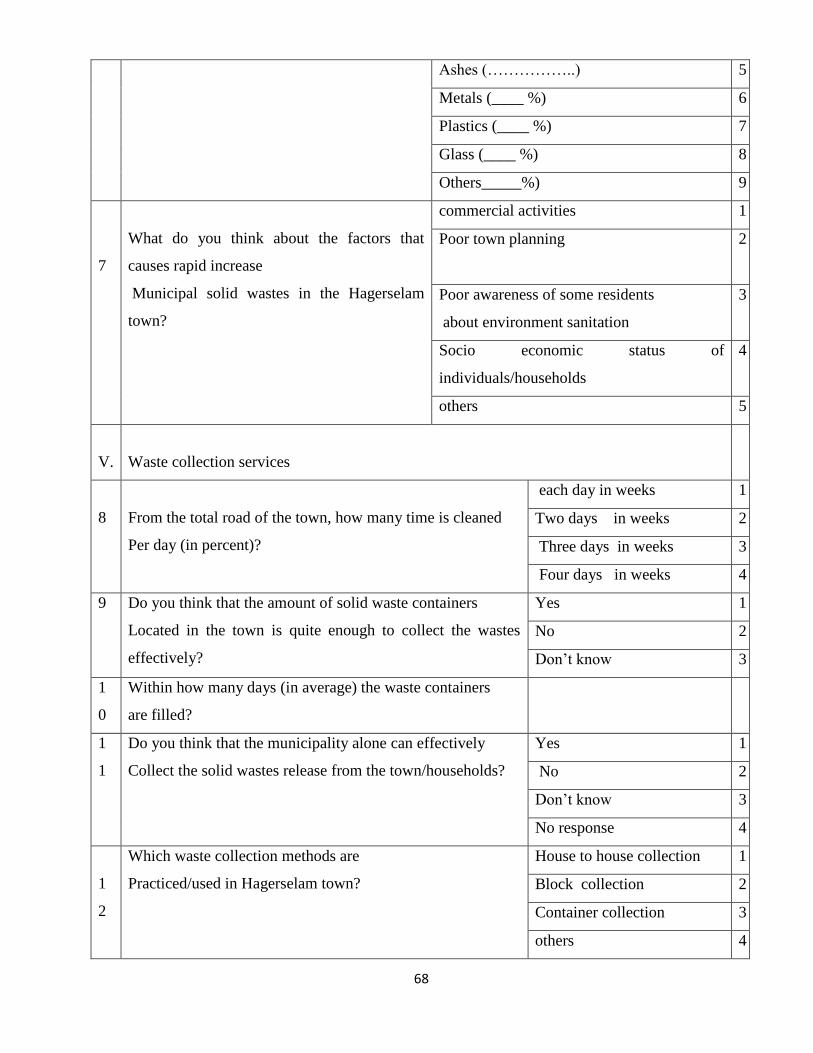
68
Ashes (……………..) 5
Metals (____ %) 6
Plastics (____ %) 7
Glass (____ %) 8
Others_____%) 9
7
What do you think about the factors that
causes rapid increase
Municipal solid wastes in the Hagerselam
town?
commercial activities 1
Poor town planning
2
Poor awareness of some residents
about environment sanitation
3
Socio economic status of
individuals/households
4
others 5
V.
Waste collection services
8
From the total road of the town, how many time is cleaned
Per day (in percent)?
each day in weeks 1
Two days in weeks 2
Three days in weeks 3
Four days in weeks 4
9 Do you think that the amount of solid waste containers
Located in the town is quite enough to collect the wastes
effectively?
Yes 1
No 2
Don‟t know 3
1
0
Within how many days (in average) the waste containers
are filled?
1
1
Do you think that the municipality alone can effectively
Collect the solid wastes release from the town/households?
Yes 1
No 2
Don‟t know 3
No response 4
1
2
Which waste collection methods are
Practiced/used in Hagerselam town?
House to house collection 1
Block collection 2
Container collection 3
others 4
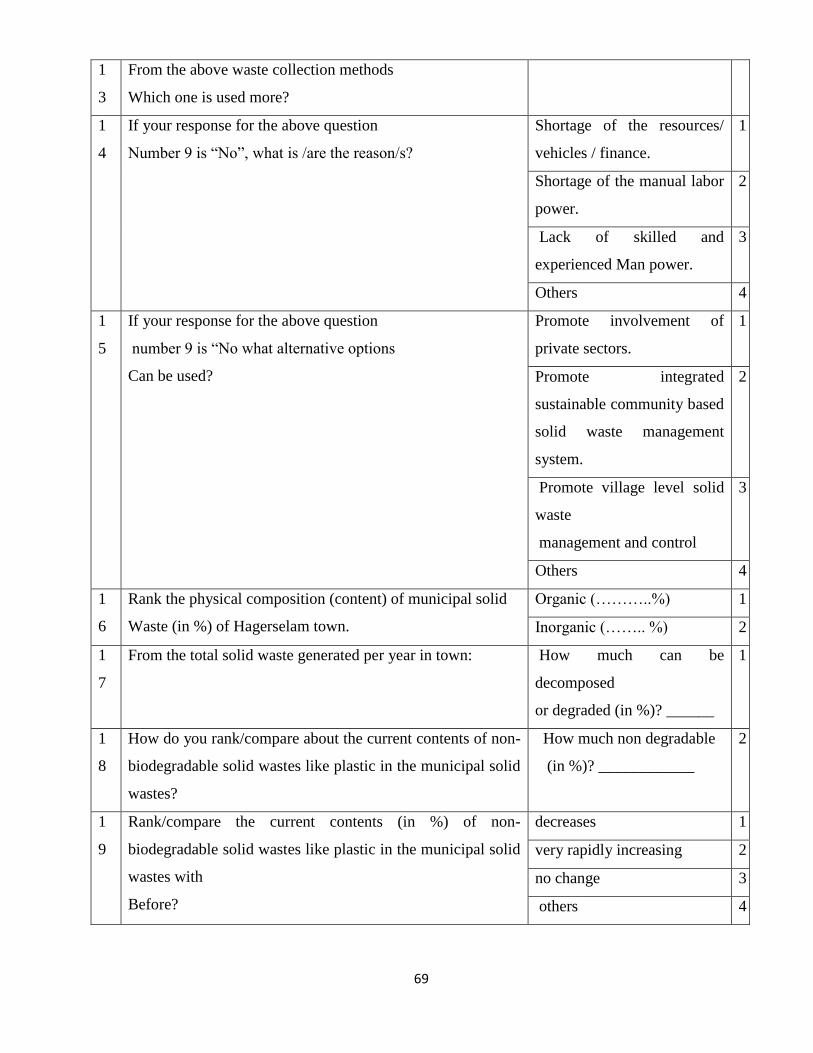
69
1
3
From the above waste collection methods
Which one is used more?
1
4
If your response for the above question
Number 9 is “No”, what is /are the reason/s?
Shortage of the resources/
vehicles / finance.
1
Shortage of the manual labor
power.
2
Lack of skilled and
experienced Man power.
3
Others 4
1
5
If your response for the above question
number 9 is “No what alternative options
Can be used?
Promote involvement of
private sectors.
1
Promote integrated
sustainable community based
solid waste management
system.
2
Promote village level solid
waste
management and control
3
Others 4
1
6
Rank the physical composition (content) of municipal solid
Waste (in %) of Hagerselam town.
Organic (………..%) 1
Inorganic (…….. %) 2
1
7
From the total solid waste generated per year in town:
How much can be
decomposed
or degraded (in %)? ______
1
1
8
How do you rank/compare about the current contents of non-
biodegradable solid wastes like plastic in the municipal solid
wastes?
How much non degradable
(in %)? ____________
2
1
9
Rank/compare the current contents (in %) of non-
biodegradable solid wastes like plastic in the municipal solid
wastes with
Before?
decreases 1
very rapidly increasing 2
no change 3
others 4

70
VI. Waste transport methods and cost
Questions Responses C
o
de
20 Tell the waste transporting methods used to
transfer the collected solid waste from the primary
Site to the final disposal site of the town?
Open type(transport using open
vehicles)
1
Closed type(transport using closed
vehicles)
2
others 3
21 How many vehicles are involved in the waste
Transport activities?
22 Does the municipality have a definite time schedule to
transport solid waste? .If “Yes”, how many times
per week?
Once 1
Twice 2
Three times 3
Each day 4
Don‟t know 5
Others 6
23 Do you think that the cost/ budget allocated to
Collect and transport the solid waste is quite
enough? If “No”, what is/are the reason/s?
More budgets are located to other
service.
1
shortage of budgets 2
Others
3
VII. Waste reduction(3R) methods
24 Is there any waste reuse practices lead by the town
Administration?
Yes 1
No 2
25
If your response is “yes” for the above question
no.5, which one?
Composting 1
Biogas release as alternative
energy source
2
Making charcoal like
“briquette”
3

71
From organic solid wastes
Reusing plastics
4
Other 5
VII. Waste collection and disposal equipment (indicate the number available and the
number ofneeded)
26 Equipments Number
available
Number of Require
Hand push cart
Donkey powered cart
sacks
dustbins
Eye glass
Uniform and full clothes
baskets
others
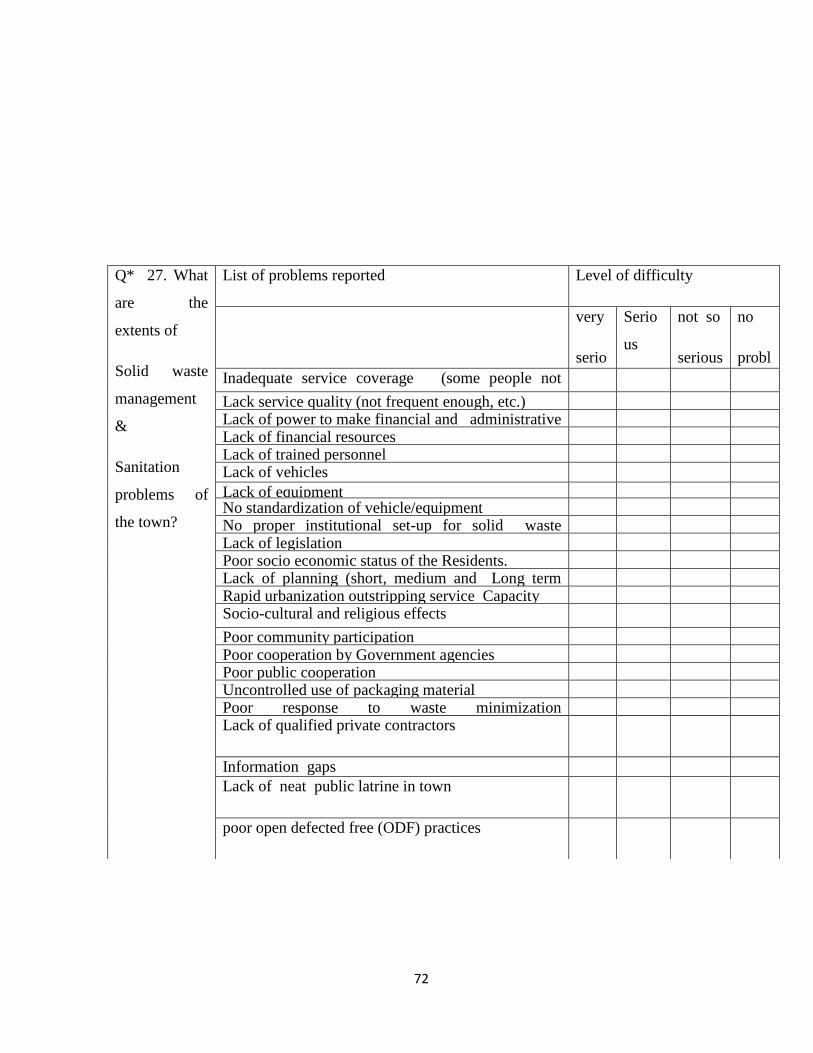
72
Q* 27. What
are the
extents of
Solid waste
management
&
Sanitation
problems of
the town?
List of problems reported Level of difficulty
very
serio
us(1)
Serio
us
(2)
not so
serious
(3)
no
probl
em(4
)
Inadequate service coverage (some people not
given service)
Lack service quality (not frequent enough, etc.) Lack of power to make financial and administrative
decision
Lack of financial resources Lack of trained personnel Lack of vehicles
Lack of equipment No standardization of vehicle/equipment No proper institutional set-up for solid waste
management service
Lack of legislation Poor socio economic status of the Residents. Lack of planning (short, medium and Long term
plan)
Rapid urbanization outstripping service Capacity Socio-cultural and religious effects
Poor community participation Poor cooperation by Government agencies Poor public cooperation Uncontrolled use of packaging material Poor response to waste minimization
(reuse/recycling)
Lack of qualified private contractors
Information gaps
Lack of neat public latrine in town
poor open defected free (ODF) practices
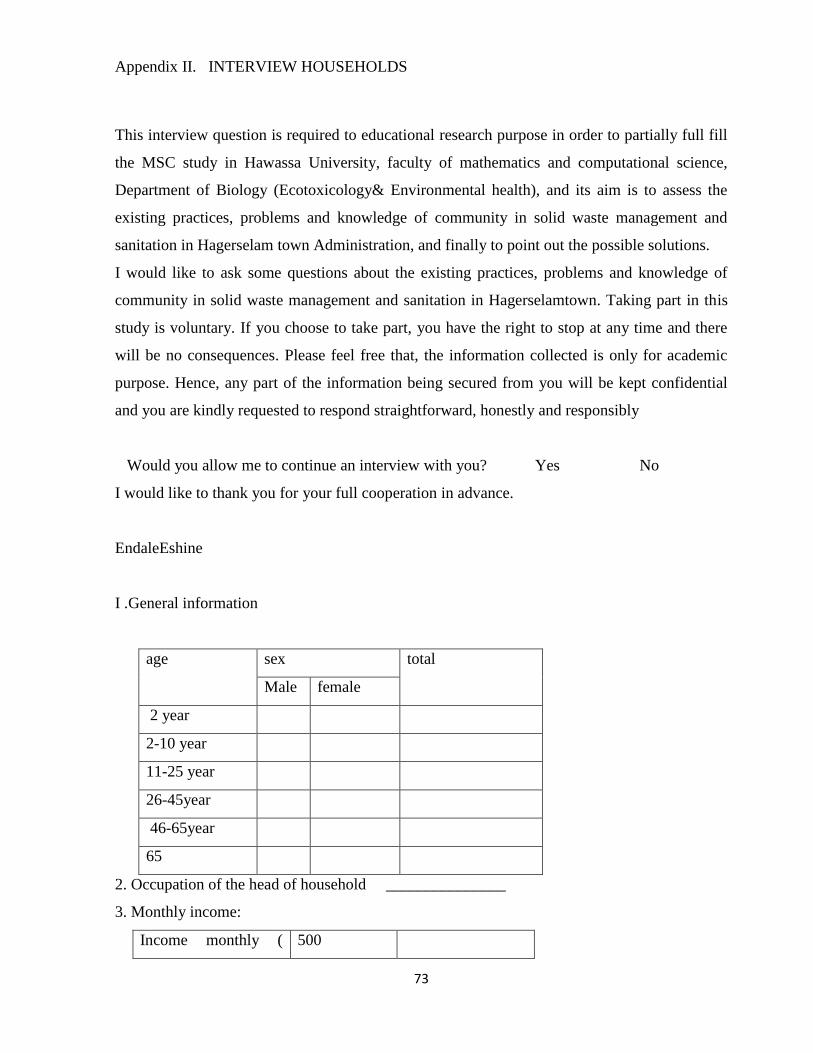
73
Appendix II. INTERVIEW HOUSEHOLDS
This interview question is required to educational research purpose in order to partially full fill
the MSC study in Hawassa University, faculty of mathematics and computational science,
Department of Biology (Ecotoxicology& Environmental health), and its aim is to assess the
existing practices, problems and knowledge of community in solid waste management and
sanitation in Hagerselam town Administration, and finally to point out the possible solutions.
I would like to ask some questions about the existing practices, problems and knowledge of
community in solid waste management and sanitation in Hagerselamtown. Taking part in this
study is voluntary. If you choose to take part, you have the right to stop at any time and there
will be no consequences. Please feel free that, the information collected is only for academic
purpose. Hence, any part of the information being secured from you will be kept confidential
and you are kindly requested to respond straightforward, honestly and responsibly
Would you allow me to continue an interview with you? Yes No
I would like to thank you for your full cooperation in advance.
EndaleEshine
I .General information
age sex total
Male female
2 year
2-10 year
11-25 year
26-45year
46-65year
65
2. Occupation of the head of household _______________
3. Monthly income:
Income monthly ( 500
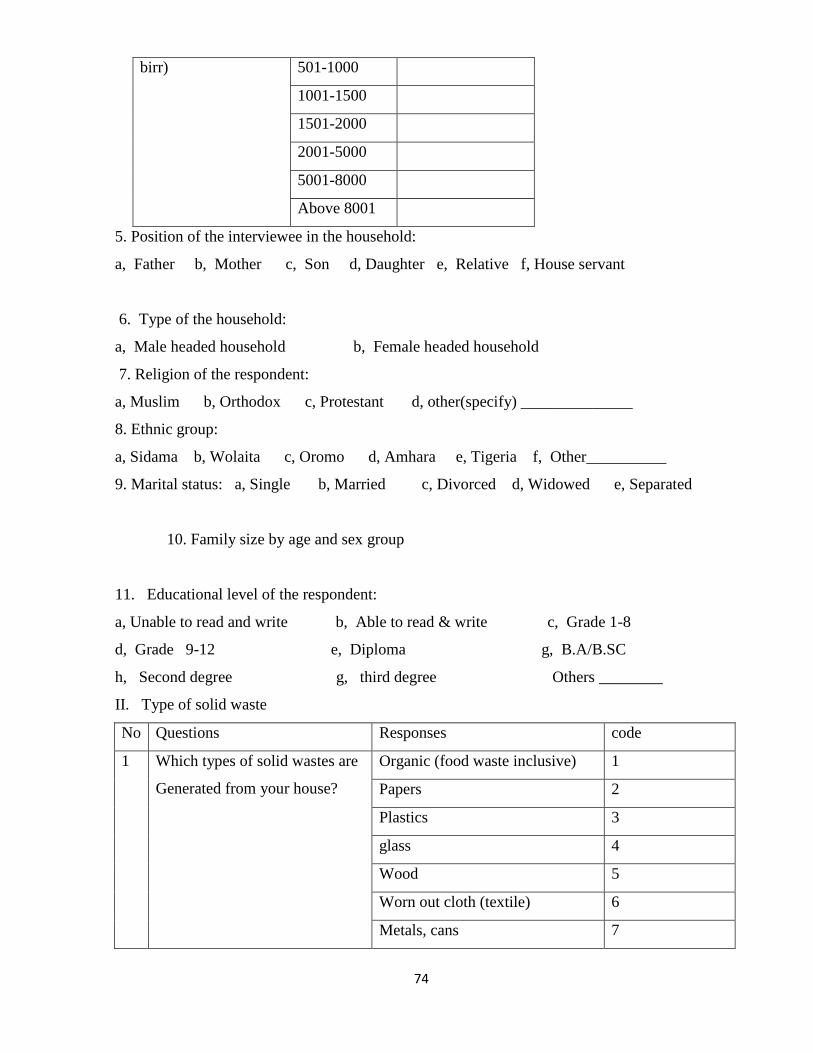
74
birr)
501-1000
1001-1500
1501-2000
2001-5000
5001-8000
Above 8001
5. Position of the interviewee in the household:
a, Father b, Mother c, Son d, Daughter e, Relative f, House servant
6. Type of the household:
a, Male headed household b, Female headed household
7. Religion of the respondent:
a, Muslim b, Orthodox c, Protestant d, other(specify) ______________
8. Ethnic group:
a, Sidama b, Wolaita c, Oromo d, Amhara e, Tigeria f, Other__________
9. Marital status: a, Single b, Married c, Divorced d, Widowed e, Separated
10. Family size by age and sex group
11. Educational level of the respondent:
a, Unable to read and write b, Able to read & write c, Grade 1-8
d, Grade 9-12 e, Diploma g, B.A/B.SC
h, Second degree g, third degree Others ________
II. Type of solid waste
No Questions Responses code
1 Which types of solid wastes are
Generated from your house?
Organic (food waste inclusive) 1
Papers 2
Plastics 3
glass 4
Wood 5
Worn out cloth (textile) 6
Metals, cans 7
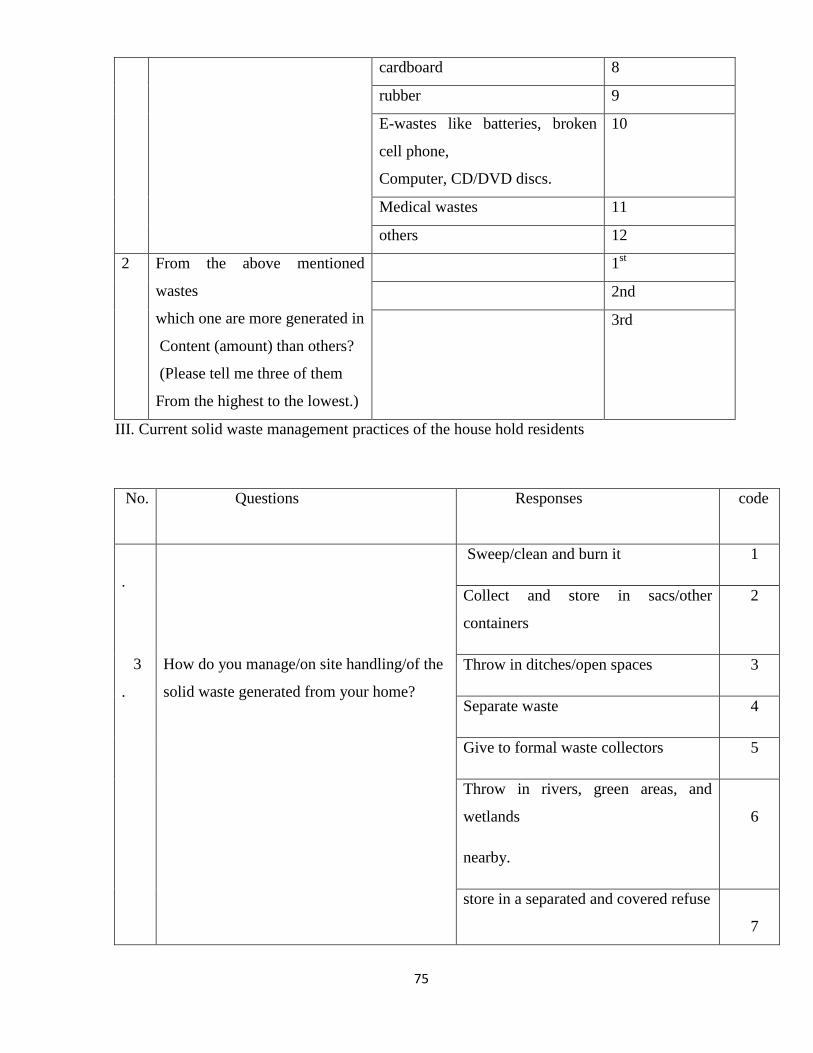
75
cardboard 8
rubber 9
E-wastes like batteries, broken
cell phone,
Computer, CD/DVD discs.
10
Medical wastes 11
others 12
2 From the above mentioned
wastes
which one are more generated in
Content (amount) than others?
(Please tell me three of them
From the highest to the lowest.)
1st
2nd
3rd
III. Current solid waste management practices of the house hold residents
No.
Questions
Responses code
.
3
.
How do you manage/on site handling/of the
solid waste generated from your home?
Sweep/clean and burn it 1
Collect and store in sacs/other
containers
2
Throw in ditches/open spaces 3
Separate waste 4
Give to formal waste collectors 5
Throw in rivers, green areas, and
wetlands
nearby.
6
store in a separated and covered refuse
7
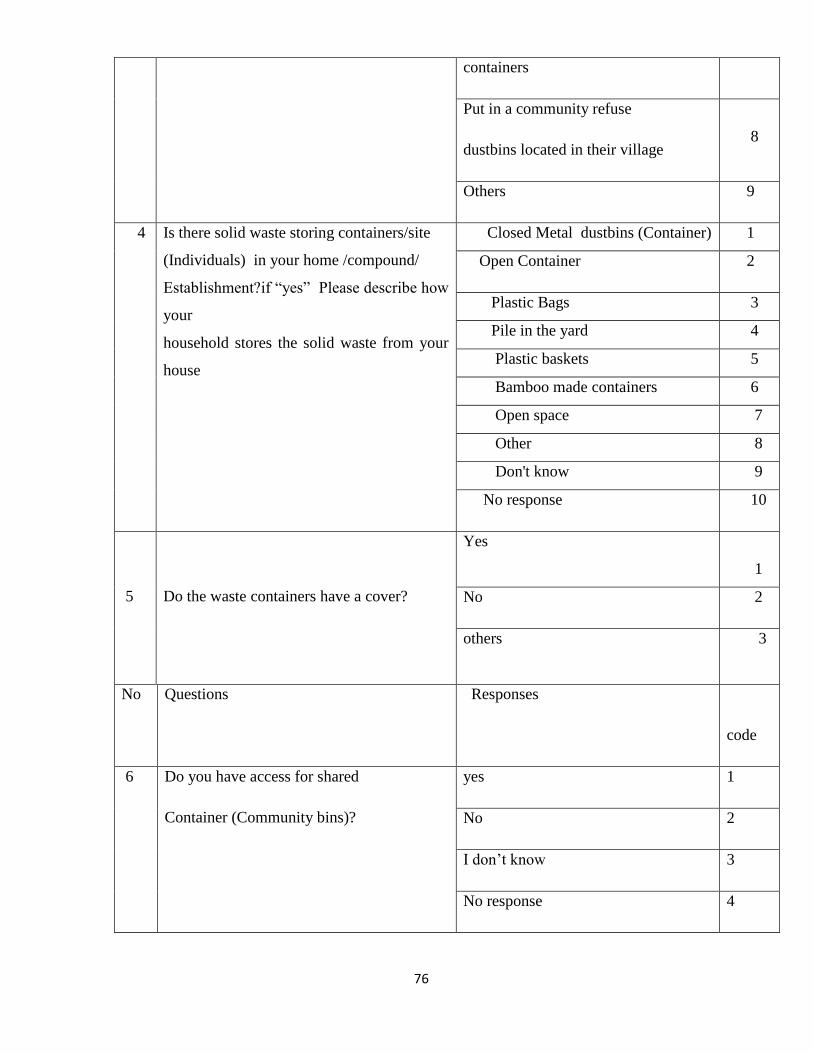
76
containers
Put in a community refuse
dustbins located in their village
8
Others 9
4
Is there solid waste storing containers/site
(Individuals) in your home /compound/
Establishment?if “yes” Please describe how
your
household stores the solid waste from your
house
Closed Metal dustbins (Container) 1
Open Container 2
Plastic Bags 3
Pile in the yard 4
Plastic baskets 5
Bamboo made containers 6
Open space 7
Other 8
Don't know 9
No response 10
5
Do the waste containers have a cover?
Yes
1
No 2
others 3
No
Questions
Responses
code
6
Do you have access for shared
Container (Community bins)?
yes 1
No 2
I don‟t know 3
No response 4
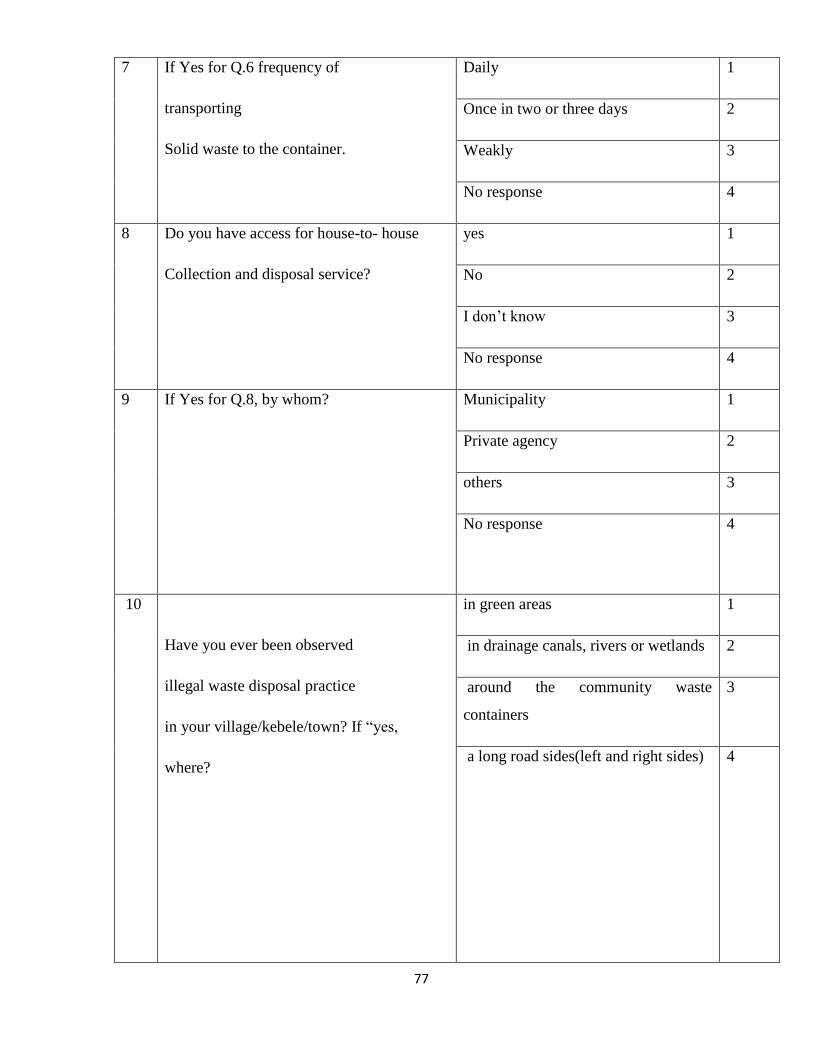
77
7
If Yes for Q.6 frequency of
transporting
Solid waste to the container.
Daily 1
Once in two or three days 2
Weakly 3
No response 4
8 Do you have access for house-to- house
Collection and disposal service?
yes 1
No 2
I don‟t know 3
No response 4
9 If Yes for Q.8, by whom?
Municipality 1
Private agency 2
others 3
No response 4
10
Have you ever been observed
illegal waste disposal practice
in your village/kebele/town? If “yes,
where?
in green areas 1
in drainage canals, rivers or wetlands 2
around the community waste
containers
3
a long road sides(left and right sides) 4
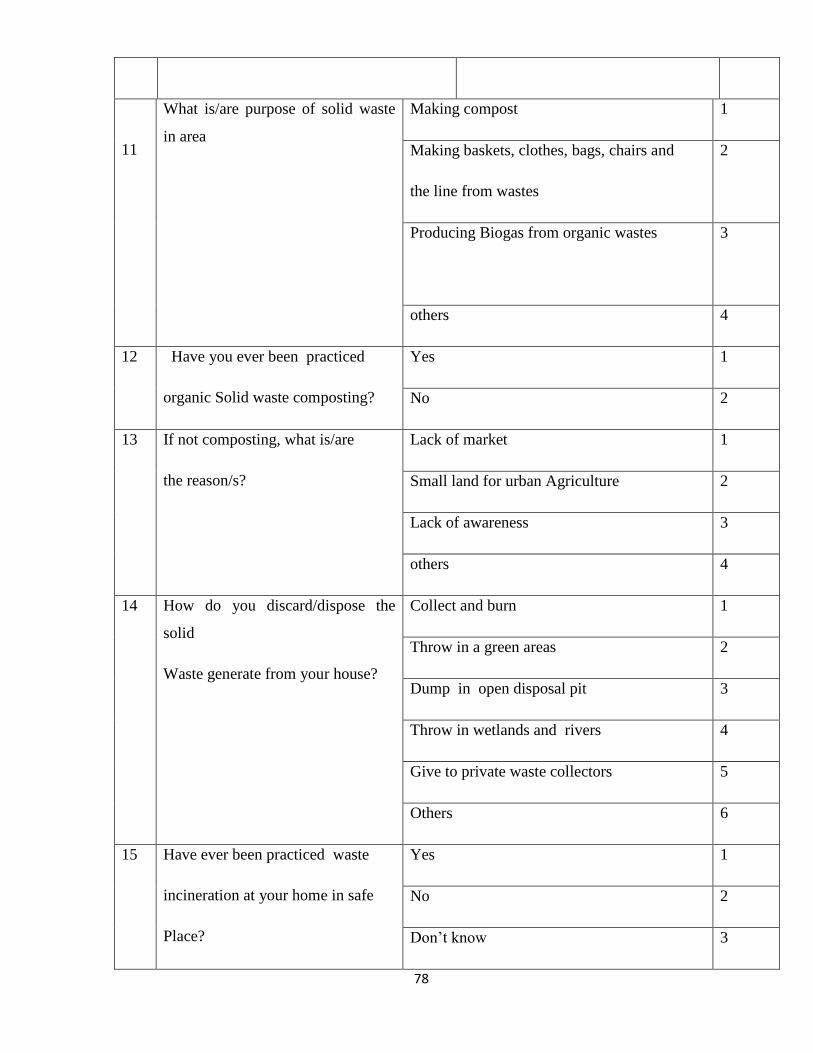
78
11
What is/are purpose of solid waste
in area
Making compost 1
Making baskets, clothes, bags, chairs and
the line from wastes
2
Producing Biogas from organic wastes 3
others 4
12
Have you ever been practiced
organic Solid waste composting?
Yes 1
No 2
13
If not composting, what is/are
the reason/s?
Lack of market 1
Small land for urban Agriculture 2
Lack of awareness 3
others 4
14
How do you discard/dispose the
solid
Waste generate from your house?
Collect and burn 1
Throw in a green areas 2
Dump in open disposal pit 3
Throw in wetlands and rivers 4
Give to private waste collectors 5
Others 6
15
Have ever been practiced waste
incineration at your home in safe
Place?
Yes 1
No 2
Don‟t know 3
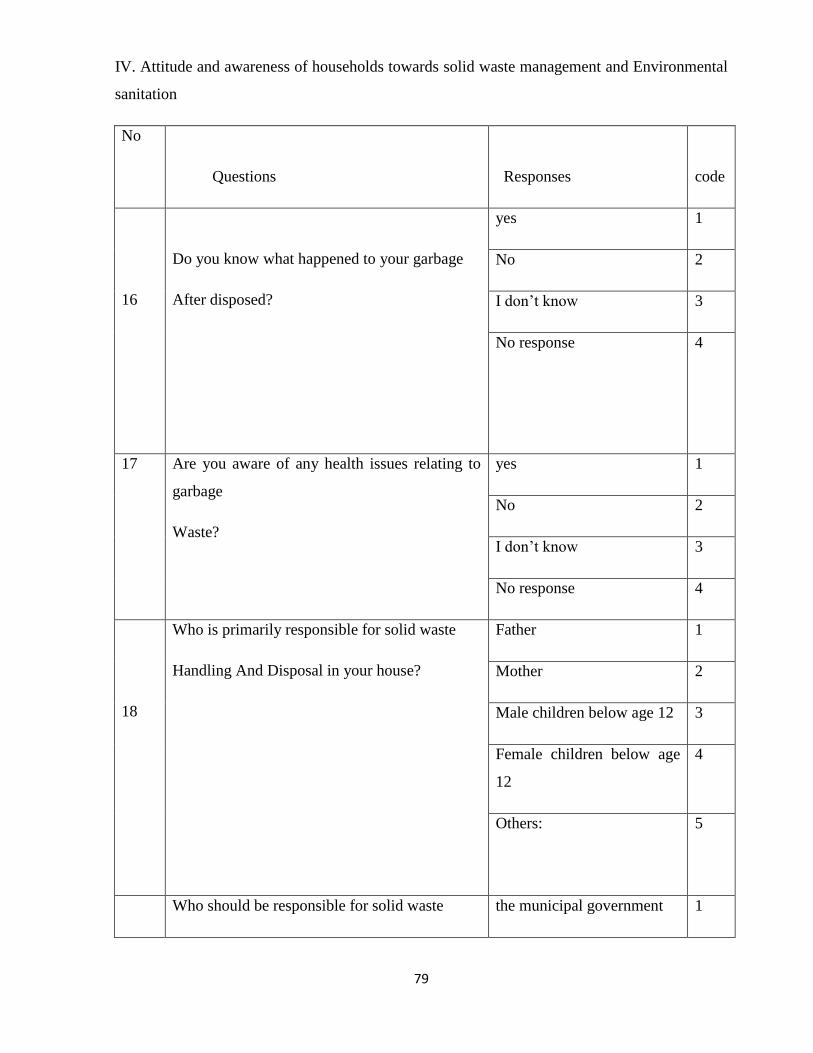
79
IV. Attitude and awareness of households towards solid waste management and Environmental
sanitation
No
Questions
Responses
code
16
Do you know what happened to your garbage
After disposed?
yes 1
No 2
I don‟t know 3
No response 4
17
Are you aware of any health issues relating to
garbage
Waste?
yes 1
No 2
I don‟t know 3
No response 4
18
Who is primarily responsible for solid waste
Handling And Disposal in your house?
Father 1
Mother 2
Male children below age 12 3
Female children below age
12
4
Others: 5
Who should be responsible for solid waste the municipal government 1
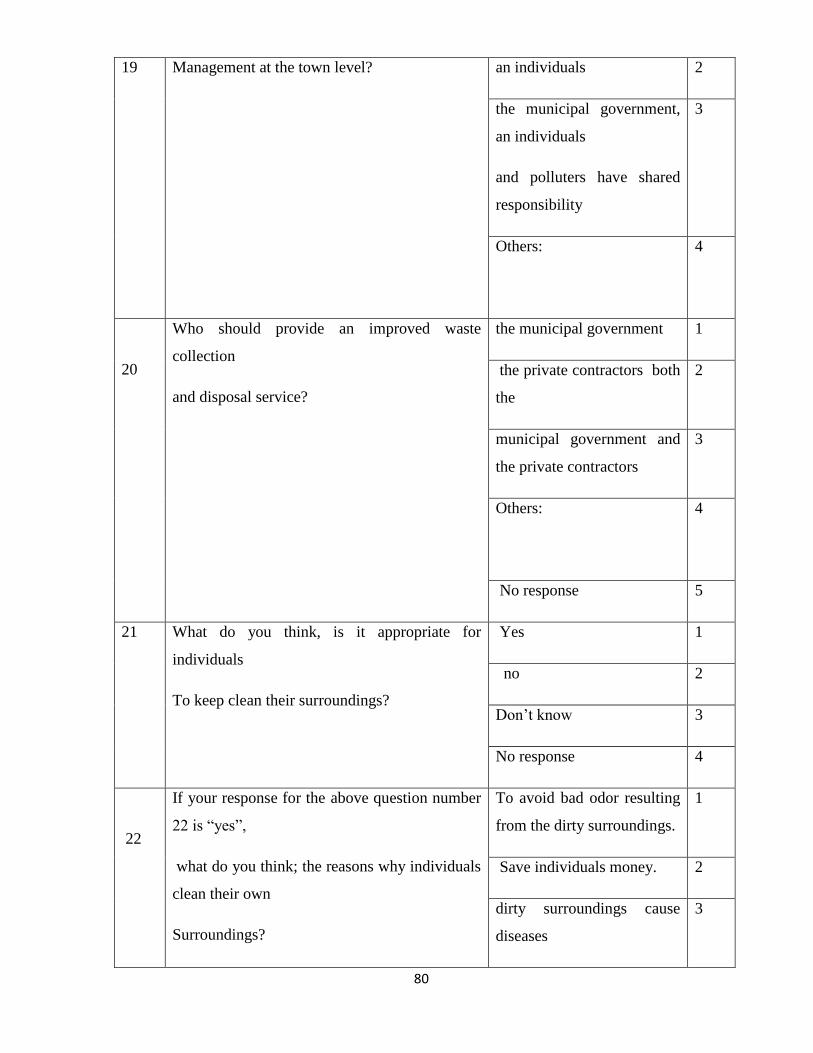
80
19 Management at the town level? an individuals 2
the municipal government,
an individuals
and polluters have shared
responsibility
3
Others:
4
20
Who should provide an improved waste
collection
and disposal service?
the municipal government 1
the private contractors both
the
2
municipal government and
the private contractors
3
Others:
4
No response 5
21
What do you think, is it appropriate for
individuals
To keep clean their surroundings?
Yes 1
no 2
Don‟t know 3
No response 4
22
If your response for the above question number
22 is “yes”,
what do you think; the reasons why individuals
clean their own
Surroundings?
To avoid bad odor resulting
from the dirty surroundings.
1
Save individuals money. 2
dirty surroundings cause
diseases
3
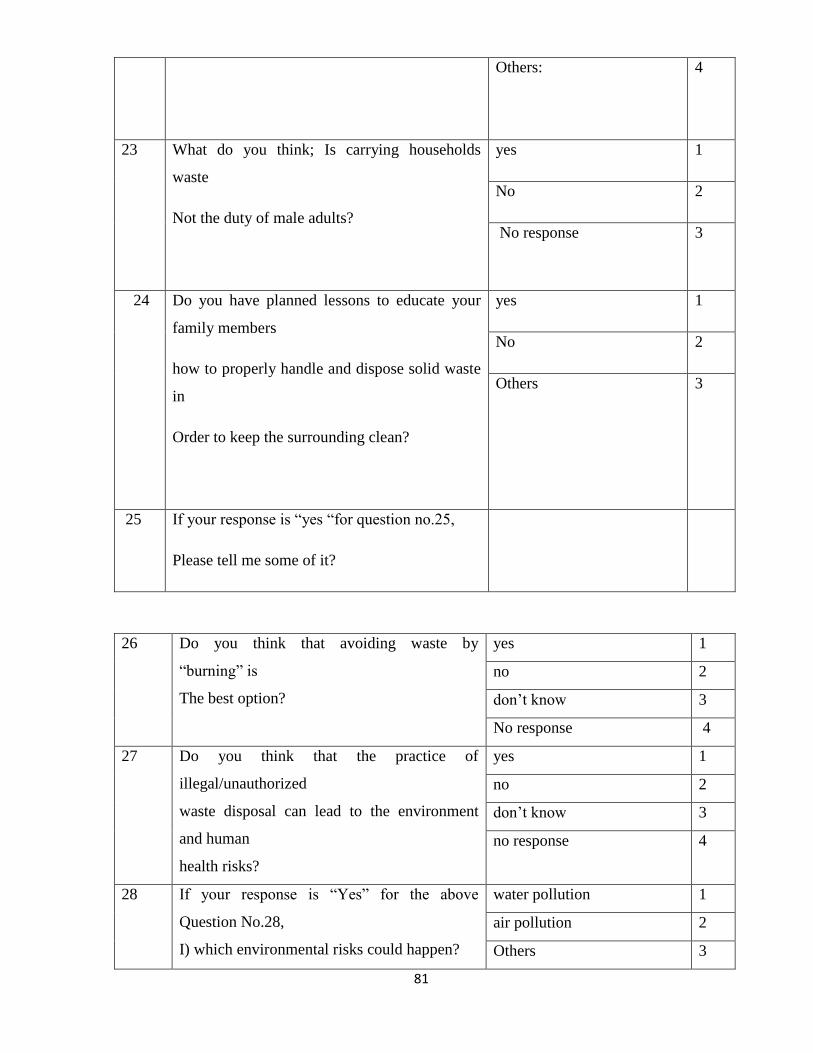
81
Others:
4
23
What do you think; Is carrying households
waste
Not the duty of male adults?
yes 1
No 2
No response 3
24 Do you have planned lessons to educate your
family members
how to properly handle and dispose solid waste
in
Order to keep the surrounding clean?
yes 1
No 2
Others 3
25 If your response is “yes “for question no.25,
Please tell me some of it?
26 Do you think that avoiding waste by
“burning” is
The best option?
yes 1
no 2
don‟t know 3
No response 4
27
Do you think that the practice of
illegal/unauthorized
waste disposal can lead to the environment
and human
health risks?
yes 1
no 2
don‟t know 3
no response 4
28
If your response is “Yes” for the above
Question No.28,
I) which environmental risks could happen?
water pollution 1
air pollution 2
Others 3
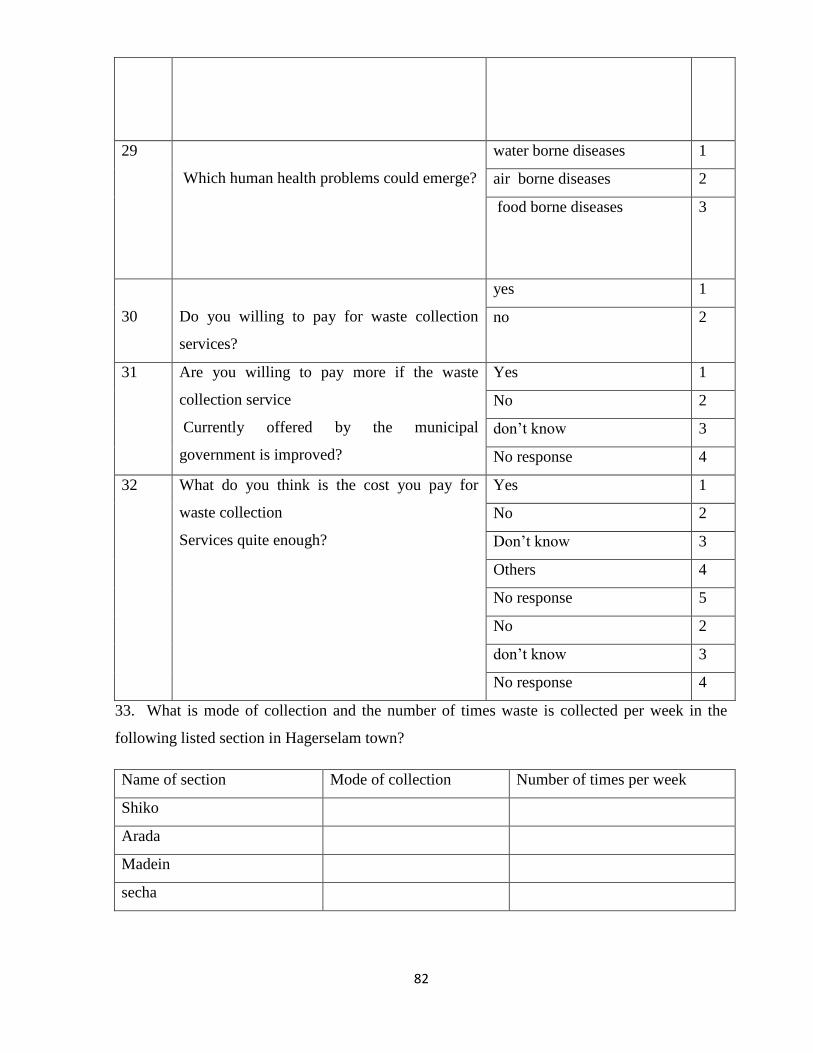
82
29
Which human health problems could emerge?
water borne diseases 1
air borne diseases 2
food borne diseases 3
30
Do you willing to pay for waste collection
services?
yes 1
no 2
31 Are you willing to pay more if the waste
collection service
Currently offered by the municipal
government is improved?
Yes 1
No 2
don‟t know 3
No response 4
32 What do you think is the cost you pay for
waste collection
Services quite enough?
Yes 1
No 2
Don‟t know 3
Others 4
No response 5
No 2
don‟t know 3
No response 4
33. What is mode of collection and the number of times waste is collected per week in the
following listed section in Hagerselam town?
Name of section Mode of collection Number of times per week
Shiko
Arada
Madein
secha
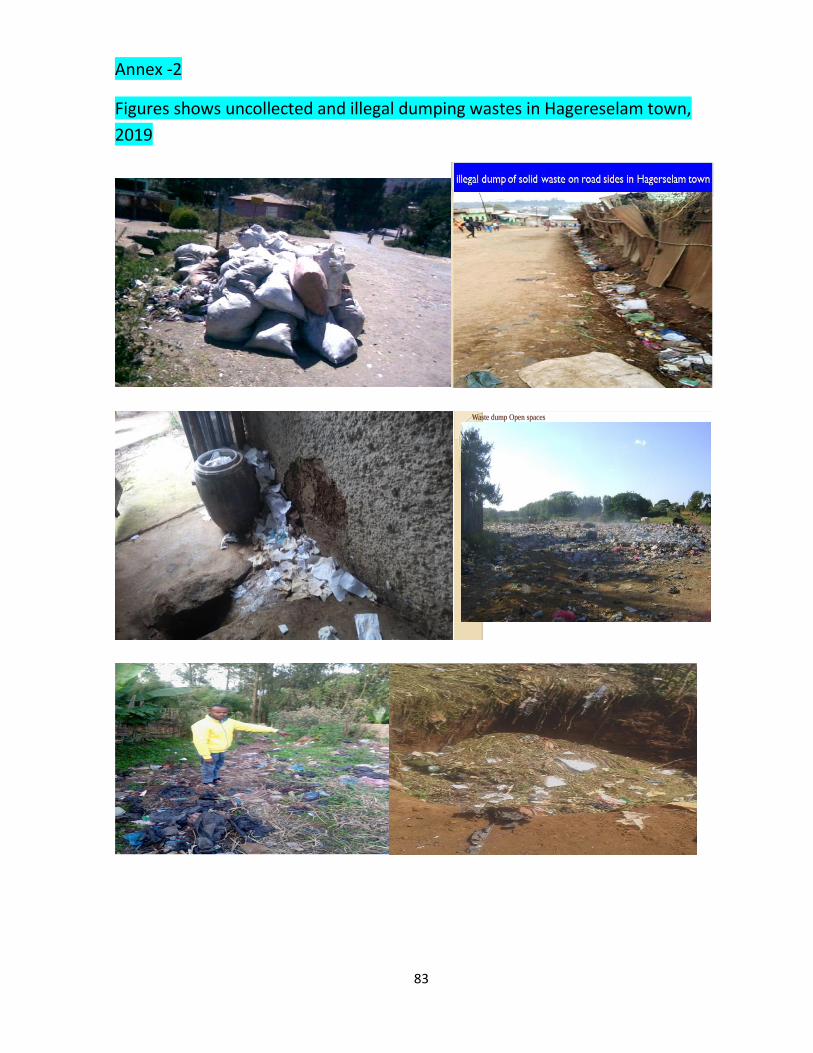
83
Annex -2
Figures shows uncollected and illegal dumping wastes in Hagereselam town,
2019
Waste dump Open spaces