All About Priorities: No School Choice under the Presence of Bad Schools
GRIPS Policy Information Center Discussion Paper : 08-02
School Choice between Public and Private Primary Schools under the Free
Primary Education Policy in Rural Kenya
June 2008
Mikiko NishimuraA and Takashi YamanoB,C
A Graduate School of International Cooperation Studies, Kobe University, Japan B Foundation for Advanced Studies on International Development, Japan
C National Graduate Research Institute for Policy Studies, Japan
Abstract The elimination of school fees from public primary education under the Free Primary Education (FPE) Policy in Kenya in 2003 has increased enrollment by 22 percent in the first year alone. Some experts, however, suggest that the FPE has reduced the quality of education in public schools and increased the number of students who transfer from public to private schools. To obtain a better understanding of the school choice in Kenya, we estimate the school choice between public and private primary schools and track primary school children over a period of three years to identify the factors associated with school transfers. We find that the proportion of children attending private schools indeed increased from 4.8 to 12.2 percent, especially among children in relatively wealthy households, from 2004 to 2007. We also find that the school quality, measured by the Kenya Certificate of Primary Education exam score at the school level, has a positive impact on the choice of private schools. Regarding school transfers, we not only find transfers from public to private schools but also between public schools. The children in relatively wealthy households have a higher probability of transferring to private schools than children in poorer households. Maintaining the quality of education among public primary schools under the FPE Policy is an urgent policy agenda for the Kenyan government as well as other governments that have adopted free primary education policies in order to enhance the equity of the entire education system. Keywords: free primary education, school choice, Africa, Kenya Corresponding Author: Mikiko Nishimura Email: [email protected] Address: 2-1 Rokkodai, Nada-ku, Kobe 657-8501, Japan Acknowledgement: Support for the data collection used in this paper is provided by the 21st Century Center of Excellency project at National Graduate Institute for Policy Studies (GRIPS). The authors thank for valuable comments from Naoko Shinkai, Takeshi Sakurai, and the participants of the 2007 Hakone Conference, the 2007 Fall TEA Seminar, and the 2007 Annual Meeting of Japan Society for International Development.

GRIPS Policy Information Center Discussion Paper : 08-02
1
1. Introduction
The Universal Primary Education (UPE) policy in the form of fee abolition has become popular in many countries in sub-Saharan Africa (SSA) for achieving Education for All (EFA) since the mid-1990s (Avenstrup et al, 2004; UNESCO, 2008). Despite its recent rapid expansion, the UPE policy has a long history in SSA. The existing literature indicates that previous attempts to achieve UPE in SSA faced problems in its supply-driven policies, unclear mechanisms, and reduced quality of education (Allison, 1983; Bray, 1986; Prince, 1997; Sifuna, 2007). Past experience in developing countries such as Nigeria and Kenya also shows that the UPE policy implementation was prone to being affected by economic crises (Obasi, 2000; Sifuna, 2007). The current UPE policy lacks analytical studies on its impacts and challenges beyond school enrollment (Nishimura, et al., 2008).
Theoretically, fee abolition reduces the private cost of education, which results in
relatively greater freedom to choose a school to obtain a higher private rate of return to education. Nonetheless, if such a policy sacrifices the quality of education, then the overall productivity of the educated person could decline and subsequently reduce the rate of return to education. Such a phenomenon could be manifested as pupils’ behaviors such as dropouts and school transfers. In fact, a decline of internal efficiency of education has already become evident in some countries under the system of fee abolition (e.g. Nishimura et al., 2007). There are only a few studies, however, that have estimated the impacts of school quality on school choice between public and private primary schools in developing countries (Alderman et al., 2001; Carnoy and McEwan, 2001; Glick and Sahn, 2006). Furthermore, there are no studies, as far as we know, that estimate the impacts of the school quality on school progress and transfers by using individual level panel data in developing countries.
Therefore, we estimate the determinants of school choice, progress, and transfers
under the free primary education (FPE) policy in rural Kenya and discuss how fee abolition of public schools alone cannot tackle equity in access to the quality of education in the overall education system. We examine the determining factors of both the supply and demand sides of education on pupils’ school choice and transfers, by using individual panel data and school census data. First, we estimate the school choice model with options of enrollment in public primary schools, enrollment in private primary schools, and non-enrollment. As a proxy for school quality, we use the average score of the 2005 Kenya Certificate of Primary Education (KCPE) exam, which is a primary leaving examination that determines whether a pupil can complete a primary cycle and become eligible for entry into secondary school. Then we estimate the determinants of school transfers over a period of three years between the panel surveys. We find that children in relatively wealthy households have a higher probability of attending private primary schools and transferring between schools than children in poorer households. We discuss the policy implications from our findings at the end of the paper.
In the next section, we discuss the school choice arguments and describe the FPE
policy in Kenya. Section 3 explains the school quality data and household and individual panel data and the estimation methods used in this paper. The results are discussed in Section 4, followed by the conclusions in Section 5.
GRIPS Policy Information Center Discussion Paper : 08-02
2
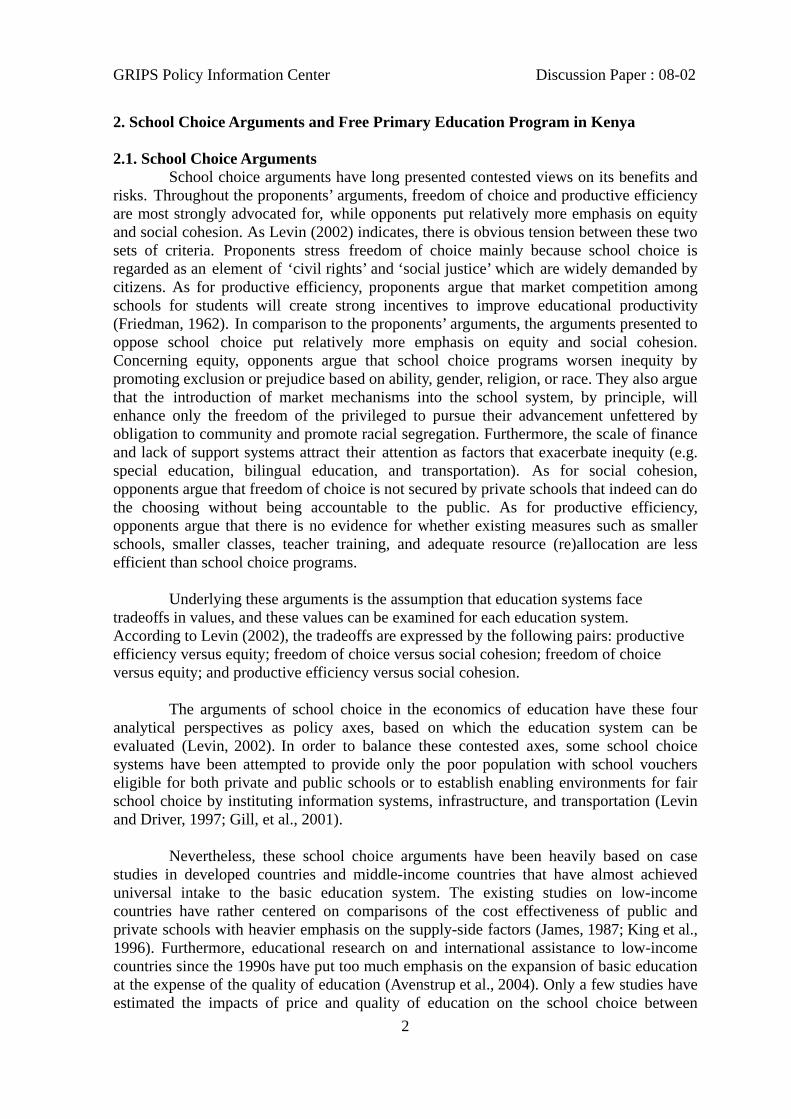
2. School Choice Arguments and Free Primary Education Program in Kenya 2.1. School Choice Arguments School choice arguments have long presented contested views on its benefits and risks. Throughout the proponents’ arguments, freedom of choice and productive efficiency are most strongly advocated for, while opponents put relatively more emphasis on equity and social cohesion. As Levin (2002) indicates, there is obvious tension between these two sets of criteria. Proponents stress freedom of choice mainly because school choice is regarded as an element of ‘civil rights’ and ‘social justice’ which are widely demanded by citizens. As for productive efficiency, proponents argue that market competition among schools for students will create strong incentives to improve educational productivity (Friedman, 1962). In comparison to the proponents’ arguments, the arguments presented to oppose school choice put relatively more emphasis on equity and social cohesion. Concerning equity, opponents argue that school choice programs worsen inequity by promoting exclusion or prejudice based on ability, gender, religion, or race. They also argue that the introduction of market mechanisms into the school system, by principle, will enhance only the freedom of the privileged to pursue their advancement unfettered by obligation to community and promote racial segregation. Furthermore, the scale of finance and lack of support systems attract their attention as factors that exacerbate inequity (e.g. special education, bilingual education, and transportation). As for social cohesion, opponents argue that freedom of choice is not secured by private schools that indeed can do the choosing without being accountable to the public. As for productive efficiency, opponents argue that there is no evidence for whether existing measures such as smaller schools, smaller classes, teacher training, and adequate resource (re)allocation are less efficient than school choice programs.
Underlying these arguments is the assumption that education systems face tradeoffs in values, and these values can be examined for each education system. According to Levin (2002), the tradeoffs are expressed by the following pairs: productive efficiency versus equity; freedom of choice versus social cohesion; freedom of choice versus equity; and productive efficiency versus social cohesion.
The arguments of school choice in the economics of education have these four
analytical perspectives as policy axes, based on which the education system can be evaluated (Levin, 2002). In order to balance these contested axes, some school choice systems have been attempted to provide only the poor population with school vouchers eligible for both private and public schools or to establish enabling environments for fair school choice by instituting information systems, infrastructure, and transportation (Levin and Driver, 1997; Gill, et al., 2001).
Nevertheless, these school choice arguments have been heavily based on case
studies in developed countries and middle-income countries that have almost achieved universal intake to the basic education system. The existing studies on low-income countries have rather centered on comparisons of the cost effectiveness of public and private schools with heavier emphasis on the supply-side factors (James, 1987; King et al., 1996). Furthermore, educational research on and international assistance to low-income countries since the 1990s have put too much emphasis on the expansion of basic education at the expense of the quality of education (Avenstrup et al., 2004). Only a few studies have estimated the impacts of price and quality of education on the school choice between

GRIPS Policy Information Center Discussion Paper : 08-02
3
public and private school alternatives (Alderman, et al., 2001; Glick and Sahn, 2006). While the case of the FPE policy in Kenya presents how fee abolition is able to
provide parents and pupils with freedom of choice among public schools, it may also reveal if the quality of education at the public schools is good enough to keep pupils from different socio-economic backgrounds in the public school system. In other words, if the quality of education at the public schools deteriorates under the FPE policy, the equity of the overall education system would suffer because those who are unable to obtain high quality education at private schools have no choice to obtain high quality education. 2.2. The Free Primary Education Program in Kenya
Since independence in 1963, the Government of Kenya (GOK) has regarded education as one of the crucial factors for national development and committed itself to providing universal primary education (UPE). It was in the 1970s that this commitment took the form of free primary education (FPE) for the first time; in 1974, FPE was partially implemented to cover children in Standards 1 to 4 and then extended to Standards 5 to 7 in 19781. This initiative brought a dramatic increase in primary school enrollments, and the gross enrollment rate (GER) increased from 47 percent in 1963 to 115 percent in 1980.
The oil crisis in the 1970s and the proceeding economic recessions in the 1980s,
however, forced the government to launch structural adjustment programs (SAPs), along with support from the World Bank and IMF. The government introduced a cost sharing policy in 1989 as part of the SAPs, and suspended the FPE policy. Under this policy, the government was to train and employ teachers while communities were to construct physical facilities and to ensure their maintenance. Tuition, examination fees, the cost of textbooks, and other activities were to become responsibility of parents. This policy change resulted in a drop in enrollment by approximately 20% between 1989 and 1995 due to the inability of parents to bear the economic burden of education (Sifuna, 2007).
Economic performance remained very poor from the early 1990s until the early
2000s due to weak macroeconomic management, slow progress in structural reforms, and failure to address governance issues (Sifuna, et al., 2007). Because of these failures, coupled with the political turmoil stemming from the 1992 and 1997 elections, Kenya lost credibility in the international community and experienced a fall of international aid back to the level before 1980. As a result, the education system almost collapsed, and the quality of education suffered in ill-equipped school facilities.
In December 2002, the domination of one political party, which had ruled the
country since independence, came to an end. Being confronted with the enormous challenge of reconstructing the economy, the new government quickly embarked on strengthening its poverty reduction efforts, and addressing the governance and economic management issues. The government has emphasized the importance of education, recognizing the close links between poverty alleviation, economic growth, and human development. The FPE policy implemented in January 2003 was one of the political campaign pledges. School fees have been abolished, and the government now bears the education costs calculated on a per pupil
1 Primary education in Kenya then was 7 years in 1978, which was changed to the current system of 8 years.
GRIPS Policy Information Center Discussion Paper : 08-02
4
cost basis. The Kenya Education Sector Support Program (ESSP), a five-year investment program, aims at “delivering quality equitable education and training to all Kenyans” as guided by the broad principles stipulated in the Economic Recovery Strategy (ERS), Millennium Development Goals (MDGs), and EFA (Ministry of Education, 2005). Unlike many other countries such as Uganda, Kenya’s education system is not decentralized to the district level and the per-pupil capitation grant is transferred directly from the Ministry of Education to schools to purchase textbooks and run schools under the FPE program. The enrollment jumped by 22% in the first year of FPE implementation alone. The net enrollment rate rose from 64% to 76% between 1999 and 2004.
In many sub-Saharan African countries, including Kenya, there is a primary
school leaving examination that determines whether a pupil can complete a primary cycle and become eligible for entry into a secondary school. Thus, even if the FPE program enables a pupil to stay in primary school, a pupil may not obtain a primary education certificate unless she or he passes the Kenya Certificate of Primary Education (KCPE) exam.2 The score a pupil obtains on the KCPE will ultimately determine the kind of secondary school s/he can attend. Known as a country with strong aspiration for education, Kenya witnesses pupils who transfer schools or repeat classes in order to obtain high scores on the KCPE in their final grade (Sawamura, 2006). To prepare for the KCPE exam at a low cost, some pupils even stay in a public school during the lower grades, and then transfer to a private school that charges substantial fees in the upper grades.
In education systems that have clear learning outcomes publicized by a uniform
examination, standards for school choice tend to be uniform and explicit. In pre-FPE Kenya, public schools used to charge different fees, and these fees were positively correlated with KCPE exam scores (Lloyd et al., 2000). The FPE program prohibits public schools from charging fees, and parents are now able to send their children to literally any public school they like within a possible range of commuting. Under these circumstances, good-performing public schools have experienced a massive inflow of pupils. As a result, many parents have expressed their worries about the declining quality of education in crowded schools, and some parents subsequently transferred their children from public to private schools. In fact, the number of private primary schools increased by approximately 38 percent in the first three years of FPE implementation, from 1,441 in 2002 to 1,985 in 2005, while that of public schools rose only by 1.6 percent from 17,589 in 2002 to 17,864 in 2005 (Central Bureau of Statistics, 2006).
After four years of FPE implementation, however, there has been no empirical
study examining the dynamics of schooling in Kenya. Whereas the FPE program has expanded public school choice, less attention has been paid to the quality assurance and equity of the education system. If the system exacerbates disparity in the quality of education between public and private schools, the expansion of educational access by the poor will not contribute to equity in the overall education system. Freedom of choice given may be limited to the extent that poor population may not have substantial school choice in essence and may rather activate a function of education to reproduce inequality. The FPE in Kenya may test the given freedom of choice and its relation to the contrasting value of
2 The KCPE exam covers English, Swahili, Mathematics, Science, and Geography.
GRIPS Policy Information Center Discussion Paper : 08-02
5
equity. 3. Key Research Questions, Data and Methodology 3.1. Key Research Questions
This study takes advantage of a panel data set from recent rural household surveys and the Education Management Information System (EMIS) data to examine the dynamics of schooling behavior. Because we have data on mean KCPE scores as well as other basic data for all registered primary schools in Kenya, and because the household surveys have asked the name of the school for each child in the households, we can match the child data with the school data. We can also track the same child from 2004 to 2007 and examine whether each child was promoted smoothly, repeats, or drops out of school. Taking advantage of this to be able to examine the dynamics of schooling for different socio-economic groups, we ask the following questions:
1. What factors determine pupils’ school choice between public and private primary schools under the FPE program? 2. What factors determine pupils’ school transfers under the FPE program?
By answering these questions, we believe that we can obtain better assessments of the FPE policies in terms of freedom of choice and equity, not only for Kenya but also for other countries that have adopted the UPE policy recently, such as Ghana and Mozambique, or those that are planning to adopt it. 3.2. Data
The data used in this article come from two sources, household panel data and school census data. First, we use the household panel data collected in 2004 and 2007 in rural Kenya as part of the Research on Poverty, Environment, and Agricultural Technology (RePEAT) project, which was conducted by Tegemeo Institute, the Foundation for Advanced Studies on International Development, and National Graduate Research Institute for Policy Studies (Yamano et al., 2004). The 2004 and 2007 RePEAT surveys cover central and western parts of Kenya. We use data from 718 households, in which we find 1,248 children aged 6 to 15 in 2004 and 1,138 children aged 6 to 15 in 2007. To compare the educational quality of public and private schools, we use the school census data that come from EMIS, which covers the 2006 information, of the Ministry of Education in Kenya. Although ideally we would like to obtain the same EMIS data set from 2004 to match the panel structure of the household and child data, we are unable to obtain such data. The EMIS data include the number of qualified teachers, number of pupils, number of classrooms, and mean KCPE scores for each public and private school in Kenya.
Note that the KCPE scores come from the 2005 KCPE exam. Eighth-grade pupils
took the 2005 KCPE exam. Those pupils in the eighth grade mostly spent primary school years from 1997 to 2005, which is before the introduction of the FPE. Thus, we believe that the 2005 KCPE exam is a good indicator to measure the school quality at the time of the 2004 RePEAT survey. Unfortunately, we do not have access to the KCPE scores from other years to examine the trends of score changes in each school.
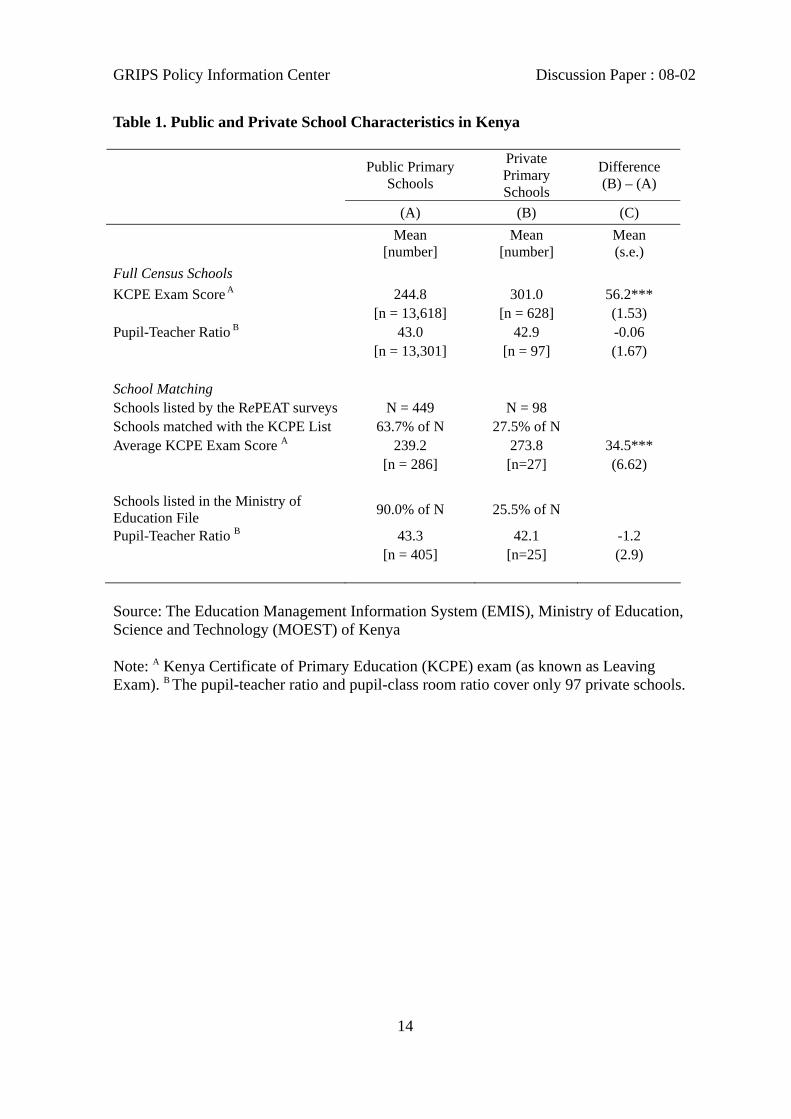
Table 1 presents the mean KCPE scores and pupil-teacher ratios of public and
private primary schools in Kenya for all the sample schools and a sub-sample that are located in communities where the RePEAT surveys were conducted. The average KCPE
GRIPS Policy Information Center Discussion Paper : 08-02
6
score of the 13,618 public schools is 244.8 points, while it is 301.0 points for the 628 private schools. There is no significant difference in the average pupil-teacher ratios between the 13,301 public and 97 private schools. Note that there are only 97 private schools with the pupil-teacher ratio data. Because of this, it is not a good indicator to measure the education quality of private schools. Thus, in the following analyses, we do not use the pupil-teacher ratio. Nevertheless, it is interesting to note that among the public schools, the average number of pupils per qualified teacher is 43.0, while it is 42.9 in private schools. Thus, it seems that the pupil-teacher ratio does not explain the difference in the KCPE exam scores. The lack of correlation between the test score and the pupil-teacher ratio is consistent with recent studies on school quality (surveyed in Glewwe, 2002). This is partly due to poor quality in data and correlations between unobserved school characteristics and school quality variables, such as the pupil-teacher ratio.
Next, we select schools that match with the list of schools named in the RePEAT
surveys. In the RePEAT surveys, respondents were asked to identify schools which their children attended in 2004 and 2007. By matching the names with the ones in the EMIS data, we match about 64 percent of the public schools in the RePEAT data with the KCPE exam data, while only matching about 28 percent of the private schools in the RePEAT with the KCPE exam data. There are several reasons why we are unable to match schools in the RePEAT and KCPE data. First, not all public and private primary schools participate in the KCPE exam. Some public and private schools only offer lower grades, mostly from first to fifth grades. Some schools, such as community schools, may have upper level grades but may not be registered by the Ministry of Education to participate in the KCPE. Second, after the introduction of FPE, many new schools have been established. They may not have eighth grade students yet. Third, it is possible that the names listed in the RePEAT data are misspelled. Although we have closely examined the names in the RePEAT data and the KCPE list to identify misspellings, there may remain some schools that are listed in both data sets but not matched because of the misspellings. Finally, the school census data do not capture a significant proportion of the private schools. In the following analyses, we make an assumption that those non-matched schools are newly created schools or non-registered schools that do not participate in the KCPE. We will return to this point later.
Based on the discussion on the EMIS data, we stratify public and private schools
into two groups: those with the KCPE data and those without. We consider the public schools matched with the KCPE data as established public and private schools, while the ones which are not matched as new or non-registered public and private schools. We present the proportions of children attending each type of school in Table 2. From 2004 to 2007, the proportion of children attending private schools (both with and without the KCPE scores) increased from 4.7 to 12.2 percent. A large increase is observed among private schools that are not matched with the KCPE scores: the proportion of children attending such schools increased from 2.5 to 8.9 percent. Among private schools with the KCPE scores, the increase was only from 2.3 to 3.3 percent. Correspondingly, we find a large decline among public schools with the KCPE data, from 57.1 to 49.2 percent. Thus, we find a large shift of students from public schools with KCPE data (established public schools) to private schools without KCPE data (new or non-registered private schools).
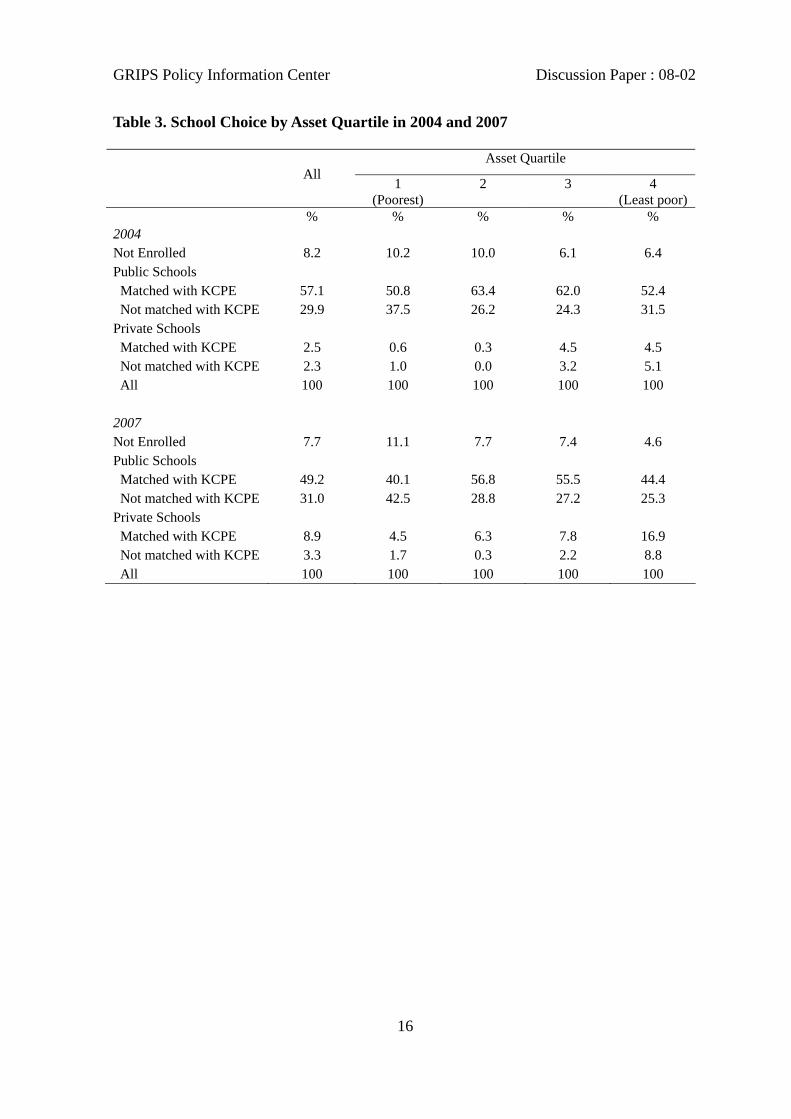
To examine the relationship between school choice and wealth, we stratify the
sample by the per capita asset value quartile. In Table 3, we find that the proportion of
GRIPS Policy Information Center Discussion Paper : 08-02
7
private school children is higher in richer quartiles. For instance, in 2004, the proportion of children attending private primary schools (both with and without KCPE data) is less than 2 percent in the lowest and second lowest quartiles, but it is higher in the third and highest asset quartiles. The proportions of children attending private schools increase in all quartiles in 2007, especially for private schools with no KCPE data. It is 4.5, 6.3, 7.8, and 16.9 percent in the quartiles, from the lowest to the highest respectively, up from 0.6, 0.3, 4.5, and 4.5 percent, respectively, in 2004. Although not as drastic, the proportions of children attending private schools without the KCPE data also increased from 2004 to 2007. Thus, in 2007, about one quarter of the children in the highest asset quartile are attending private primary schools.
Because we have the individual level panel data, we can track children from 2004 to 2007. In particular, we focus on children who are in public primary schools in 2004 and present the proportions in five categories: dropped out, graduated, remained in the same school, transferred to a public school, and transfer to a private school. In Table 4, we find that about 3 percent of the children who were in public primary schools in 2004 transferred to private schools by 2007. More interestingly, about 11 percent of them transferred to public schools. Because there are no school fees for public schools, parents may find it easy to transfer their children to a public school if the school quality is poor or if there are problems in the current public school. More than half of the children in public schools in 2004 remain in the same school, while 27 percent of them graduated from the schools and 4 percent of them dropped out. 3.3. Methodology: Determinants of Public vs. Private School Choice
Although the above descriptive statistics are informative, we need to control for various factors to measure the patterns and schooling under the FPE program. Thus, in the following section, we estimate the determinants of the school choice and school transfers. Following previous studies on school choice (such as Gertler et al., 1987; Glewwe and Gartler, 1990; Alderman et al., 2001; Glick and Sahn, 2006), we assume that parents derive utility from the human capital of their children, which is a function of their schooling, and from the consumption of other goods and services. Faced with the options of enrollment in public school, enrollment in private school, and non-enrollment, parents choose the alternative that brings the highest utility. Define Yi as the household income and Pij as the costs to the household of choosing schooling option j (inclusive of fees and other direct expenses as well as the value of the forgone household or enterprise production of the child if j is chosen). Also let Sij be the increment to the child’s human capital associated with a year’s enrollment in this school alternative. Then, a simple form of parents’ utility could be written as: ijijiijij ePYfaSaV +−+= )(10 , (1) where eij is a random disturbance term, and f (.) is a function of the household expenditure net of schooling. The increase in human capital Sij is expected to vary across school options primarily because the quality of the alternatives may differ. Since this change is not directly observed, a0Sij is replaced by a reduced form equation for the utility from human capital: ijijjij nXQSa ++= δτ0 , (2) where Qj is a vector of school quality variables, and Xj is a vector of observed household

GRIPS Policy Information Center Discussion Paper : 08-02
8
and individual characteristics. Many of these factors affect utility both through the production of human capital and through the direct effects of preferences for schooling or human capital. Substituting (2) into (1) yields: ijijiijjij PYfaXQV εδτ +−++= )(1 , (3) where ijijij ne +=ε . The household chooses the schooling option j that yields the highest utility. For the purpose of this study, we simplify (3): ijijjijijjij PYXQV εβαδτ +−++= . (4)
Based on this equation, we estimate the following Multinomial Logit (MNL) model with restrictions:
ijijijjjji YXPQjC εαδβτ +++−== )Pr( , (5)
where Ci is a school choice: non-enrollment (j = 0), public primary school matched with KCPE scores (j =1), public primary school not matched with KCPE scores (j =2), private primary school matched with KCPE scores (j =3), and private primary school not matched with KCPE scores (j = 4); Qj is the KCPE scores of option j; Pj is a set of the schooling cost of option j; Xi is a set of child and household characteristics; and Yj is the household income. Note that, because we have the KCPE scores matched at the school level for the two groups, j =1 and 3, we set the group of children in public schools matched with the KCPE scores, j =1, as the base group and compare them with the children who attend private schools matched with the KCPE scores. If parents value the school quality of the private schools, we should find a positive coefficient on the KCPE scores.
Next, we estimate the school progress and transfer model. The dependent variable, Ti, takes 0 if child i stays in the same school, 1 if child i drops out, 2 if child i graduates, 3 if child i transfers to a public school, and 4 if child i transfers to a private school. We estimate the following MNL model:
ijijijjjji YXPQjT εαδβτ +++−== )Pr( , (6)
where the variables are as defined before.
We estimate these models for boys and girls separately because parents’ preferences and opportunity costs of children could be different for boys and girls. We then present the results in the marginal changes in the probability of each outcome category evaluated at the mean values of the continuous independent variables and evaluated for a change when the dummy variables change from zero to one. 3.4. Variables
The dependent variables are defined as in the previous sub-section. The child characteristics, Xij, include age, its squared term (to consider the possible non-linearity of the relation between age and internal efficiency), and orphan status. The issue of AIDS orphans is widely recognized in Kenya (Yamano and Jayne, 2005; Evans and Miguel, 2007). Orphans are targeted in such services as the provision of school meals. The parent characteristics include the years of parental education. For the household characteristics we include the age and gender of household head, and also include the socio-economic status of the household, including the number of men and women in the household and the value

GRIPS Policy Information Center Discussion Paper : 08-02
9
of asset holdings in logs. Finally, as a proxy for the quality of education at school j, we include the average KCPE score at the school level. 4. Results Determinants of School Choice
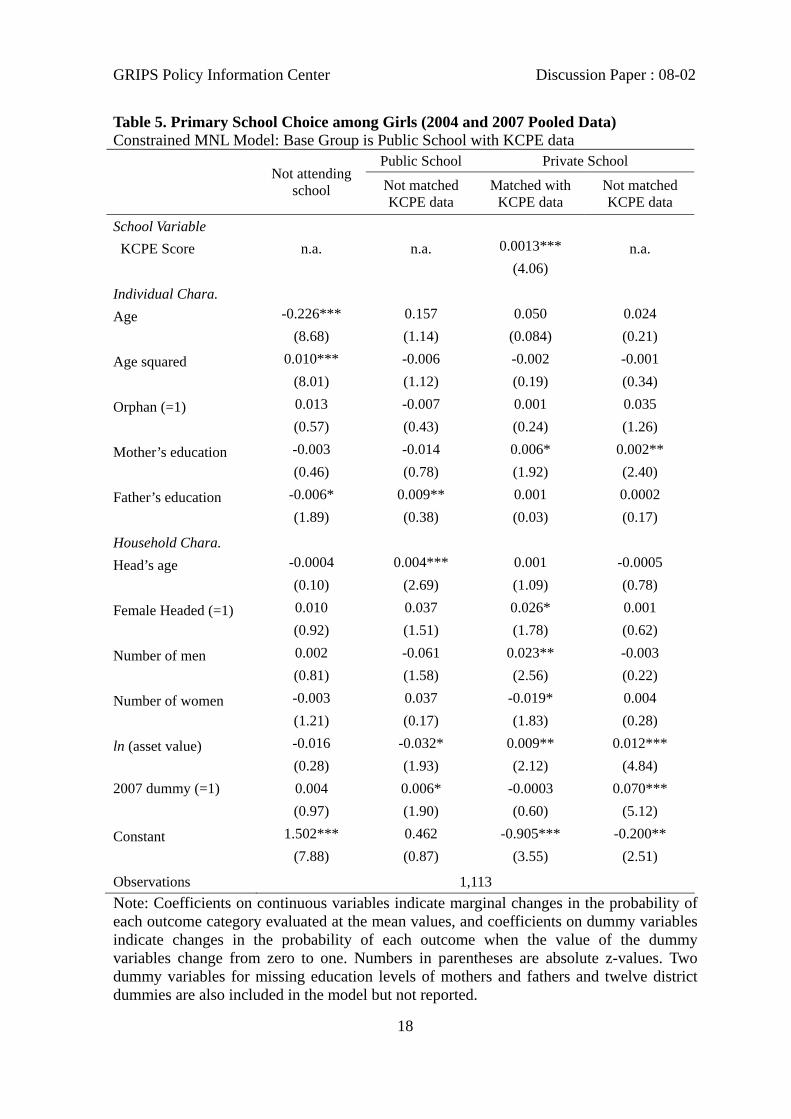
First, we present the results from the MNL model on the school choice of girls in Table 5. The base group is the group of children who attend public schools matched with the KCPE scores at the school level. We find that the KCPE score has a positive coefficient on the selection of private schools matched with the KCPE scores. The magnitude of the coefficient indicates that an additional 10-point increase in the KCPE scores increases the probability of attending the private schools matched with the KCPE scores by 1.3 percentage points. Because we find that the proportion of girls attending such schools is 3.7 percent, an additional 10-point increase brings the percentage to 5 percent. This result suggests that more parents and children will choose private schools over public schools if the KCPE scores of public schools declines in the future and the gap in the KCPE scores widens between public and private schools.
We also find that girls from wealthier households, measured by the household assets,
are more likely to attend private schools, both matched with and without the KCPE scores, than girls from less wealthier households. For instance, a simple simulation suggests that the probability of attending a private school without the KCPE score increases from 3 to 7 percent if the asset value level increases from the 25th to 75th percentile levels.3 The same change will increase the probability of attending the private schools matched with the KCPE scores from 2 to 3 percent. As a result, the probability of attending a private school, of any type, doubles from 5 to 10 percent when the asset value increases from the 25th to 75th percentage level.
According to the results, educated mothers seem to prefer sending their daughters to
private schools. As the mother’s completed highest grade increases by one year, the probability of attending the private schools increases by 0.6 and 0.2 percentage point for schools with and without the KCPE scores, respectively. The education level of fathers increases the probability of attending public schools without matching the KCPE score for girls. Fathers may prefer sending their daughters to public schools than to private schools.
Finally, regarding the 2007 dummy variable, the results indicate that the probability of
attending the private schools without matching the KCPE score increased by 7 percent, but not the private schools matched with the KCPE score. This confirms our observation that those schools that do not match with the KCPE schools are likely to be new schools. We also find a 0.6 percent higher probability of attending the public schools not matched with the KCPE scores. This also suggests that many of them are likely to be new schools.
For boys, we also find a positive coefficient on the KCPE score. The magnitude is
similar to the one for girls: an additional 10-point increase in the KCPE score increases the probability of attending the private schools matched with the KCPE score by 1.4 percentage points. Boys from wealthier households also attend private schools more than
3 We conduct a simple simulation by predicting the probabilities when we change the log of the asset value from the 25th to 75th values.
GRIPS Policy Information Center Discussion Paper : 08-02
10
boys from less wealthier households. A simple simulation suggests that the probability of a boy from the 25th percentile of asset value attending a private school matched with the KCPE score is about 1 percent, while it increases to 4 percent for a boy from the 75th percentile. It also suggests that the probability increases from 3 to 6 percent if the asset value changes from the 25th to 75th percentile for the private school not matched with the KCPE score. Combined, these results indicate that the probability of attending private schools increases from 4 to 10 percent if the asset value increases from the 25th to 75th percentile level for boys.
According to the estimated coefficient of the 2007 dummy, the probability of
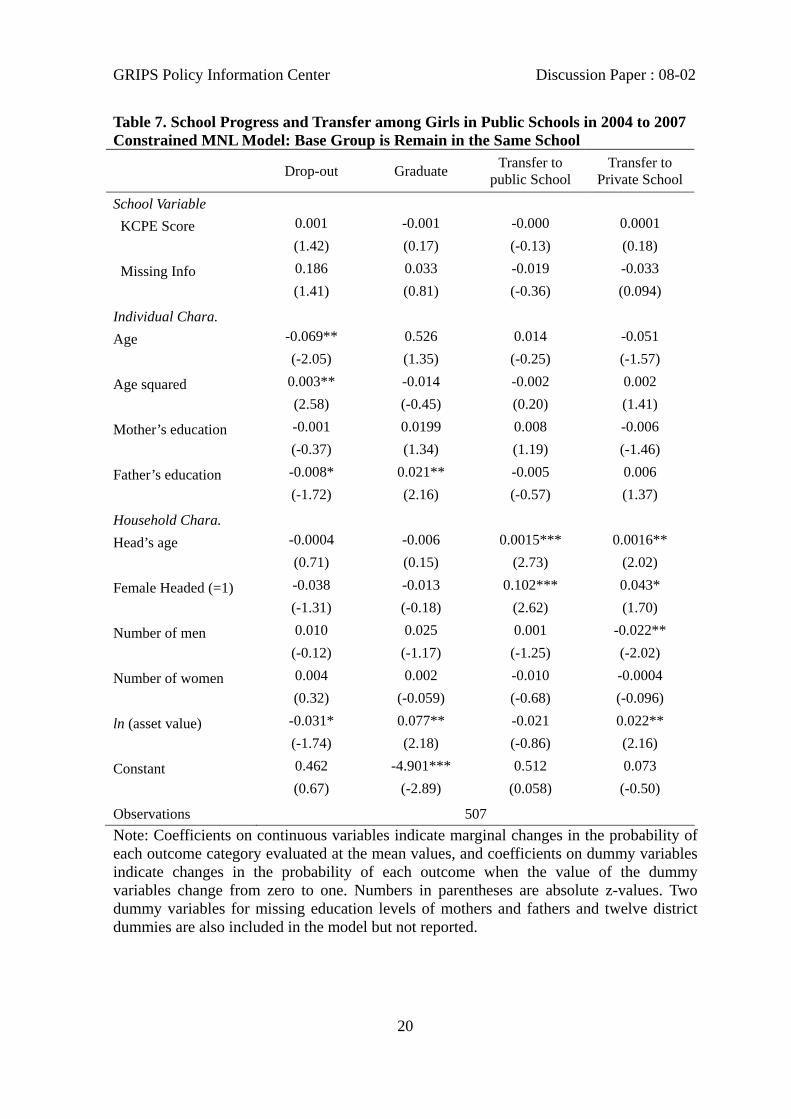
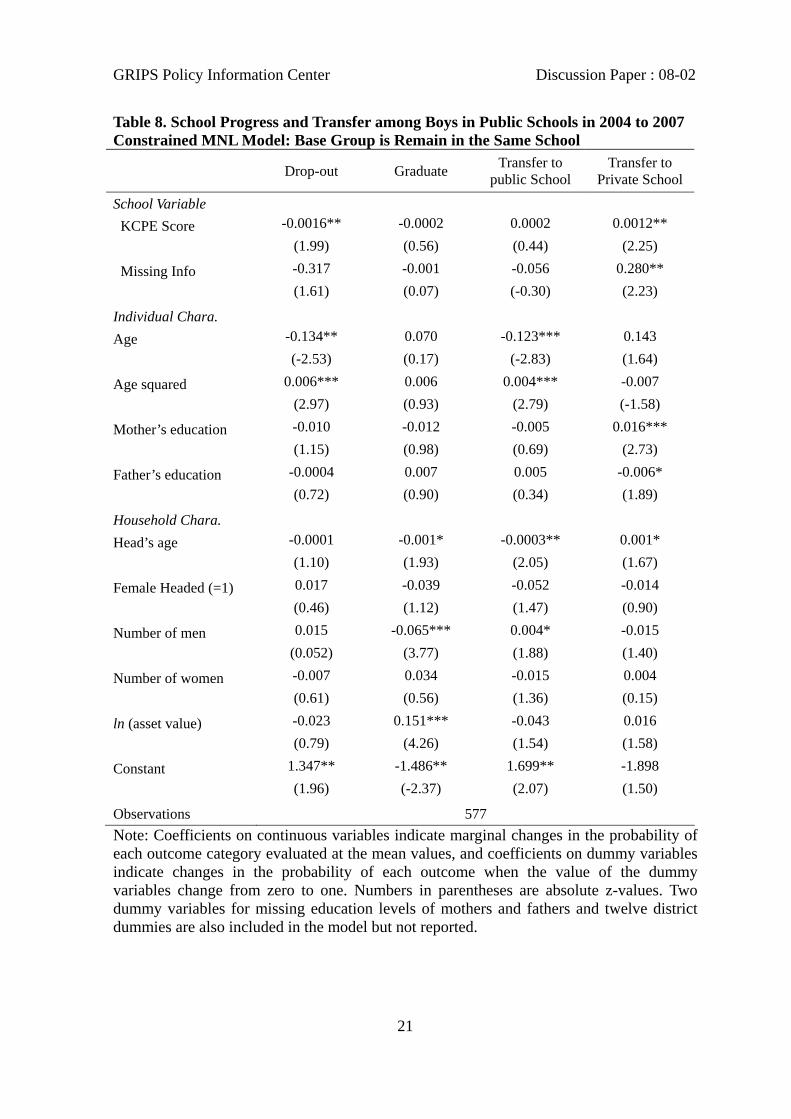
attending private schools has increased in 2007 by 10.3 percentage points: 7 points for the private schools matched with the KCPE score and 3.3 points for the private schools not matched with the KCPE score. Determinants of School Progress and Transfer To understand school transfers from public primary schools, we select girls and boys aged 6 to 15 in the 2004 survey who were attending public schools in the 2004 survey and who appear in both the 2004 and 2007 surveys, resulting in a sample that includes 507 girls and 577 boys. The results in Tables 7 and 8 indicate that the KCPE score matters for dropouts and school transfers to a private school among boys, but not among girls. If the KCPE score is higher by 10 points, then the probability of dropping out is lower by 1.6 points, and the probability of transfers to private schools is higher by 1.2 points. The second observation seems to contradict with our expectation that the poor school quality in public schools induces boys to transfer to private schools. It is also possible, however, that boys in better public schools are more motivated than boys in poor public schools and seek an even better education at private schools. It is interesting to note that in the case of girls, the KCPE score is not statistically significant to explain transfers to private schools. This implies that the transfer mechanism is different by gender.
Regarding the education levels of the parents, we find that educated mothers want to transfer their boys to private schools. This result is consistent with the result in the school choice analysis that educated mothers choose private schools for their children. On the other hand, the father’s education level has a negative impact on the transfer to private schools. Educated fathers may prefer keeping their boys in public schools than transferring them to private schools. Turning to household wealth, we find that girls from wealthier households are more likely to transfer to private schools than girls from less wealthy households. Among boys we find a similar positive coefficient but it is not statistically significant. Together with the results on the KCPE score, it can be said that parents tend to transfer boys to private schools on merit-based motivation (i.e. to gain a higher KCPE score to seek admission to good- performing secondary schools) while transferring girls to private schools is more a matter of affordability of the households. In addition, girls are more disadvantaged in transferring to a private school when there are more men in the household. This may be because when elder brothers are in secondary schools or above, less priority will be given to girls’ schooling. The question is whether there is fair school choice among boys in schools with low KCPE scores and poor girls in general. 5. Conclusion
Since the introduction of the FPE policy in 2003 in Kenya, the enrollment increased by 22 percent in the first year alone. From 2004, one year after the introduction of FPE, to
GRIPS Policy Information Center Discussion Paper : 08-02
11
2007, we find that children are choosing private schools more in 2007 than in 2004. Because the cost of education is lower at public than private schools, the cost does not explain the increased enrollment in private schools. The quality of education at public schools may have deteriorated because of the increased enrollment in public schools after FPE. As a result, families who are able to pay for high school fees chose private schools for their children. As such, if the FPE policy continues to induce the wealthy to send their children to private schools, the overall equity of primary education becomes questionable.
Our results also show that wealthier families tend to react to the quality of education,
as measured by KCPE scores, while poorer pupils stay in schools regardless of the quality. We also find that once girls stay in a certain public school, the quality of education of that particular school is no longer a determinant for the second school choice, be it dropping out, transferring to another public school, or transferring to a private school. It is now only socio-economic backgrounds that determine transfers to private schools. This implies that only wealthy parents and those with private schools available within a commutable distance would be able to decide to exit from the public school system. Boys, in contrast, seem more to drop out or transfer to a private school based on the learning environment of schools. The gender difference in school choice dynamics implies that girls are more prone to be disadvantaged in merit-based school choice.
If school choice made available by fee abolition led to transfer of wealthy pupils to
private schools, two major international goals, access to quality of education and poverty alleviation, may face unintended outcomes. In this sense, it is imperative to examine the effectiveness of the free primary education policy from the perspective of access to quality education rather than simply from that of educational expansion. In reality, school choice is practiced even in low-income countries that have not necessarily realized universal access to primary education. The free primary education policy has expanded the right of school choice with intentions to ensure equal access to quality education for all children. Thus, to examine which groups have more access to quality education under the free primary education program is essential for evaluating the contested axis of freedom of choice and equity in the current policy. This study has modestly showed that wealthy families utilize the actual school choice more than poor families, and the choice is more open for boys than for girls. Since exit to private schools is not available free of charge, the only policy option that increases the fairness of the entire education system will be to improve the quality of public schools.
GRIPS Policy Information Center Discussion Paper : 08-02
12
References Alderman, H., Orazem, P., and Paterno, E. (2001). School Quality, School Cost, and the
Public/Private School Choices of Low-income households in Pakistan. The Journal of Human Resources, 36 (2): 304-326.
Allison, C. (1983). Constraints to UPE: More that a question of supply? International Journal of Educational Development, 3(3): 263-276.
Avenstrup, R., Liang, X., and Nellemann, S. (2004). Kenya, Lesotho, Malawi and Uganda: universal primary education and poverty reduction. A paper presented at the Scaling up Poverty Reduction; A Global Learning Process and Conference in Shanghai, May 25–27, 2004.
Bray, M. (1986). If UPE is the answer, what is the question? A comment on weakness in the rationale for universal primary education in less developed countries. International Journal of Educational Development, 6(3): 147-158.
Carnoy, M., and McEwan, P. J. (2001). Privatization through Vouchers in Developing Countries: The Case of Chile and Columbia. In Levin, H. M. (Ed.), Privatizing Education, 151-177. Westview Publishers.
Central Bureau of Statistics (2006). Economic Survey 2006. Nairobi: Government of Kenya. Evans, D.K., and Miguel, E. (2007). Orphans and Schooling in Africa: A Longitudinal
Analysis. Demography, 44 (1): 35-57. Friedman, M. (1962). The Role of Government in Education. In Capitalism and Freedom,
85-107. Chicago: University of Chicago Press. Gartler, P., Locay, L., and Sanderson, W. (1987). Are User Fees Regressive? The Welfare
Implications of Health Care Financing Proposals in Peru. Journal of Econometrics, 36: 67-88.
Gill, B. P., Timpane, P. M., Ross, K. E., and Brewer, D. J. (2001). Rhetoric Versus Reality: What we Know and What We Need to Know About Vouchers and Charter Schools. Santa Monica, California: RAND.
Glewwe, P. (2002). Schools and Skills in Developing Countries: Education Policies and Socioeconomic Outcomes. Journal of Economic Literature, 40(2): 436-482.
Glewwe, P., and Gartler, P. (1990). The Willingness to Pay for Education in Developing Countries: Evidence from Rural Peru. Journal of Public Economics, 42: 251-275.
Glick, P., and Sahn, D. (2006). The Demand for Primary Schooling in Madagascar: Price, Quality, and the Choice between Public and Private Providers. Journal of Development Economics, 79: 118-145.
James, E. (1987). The Public/Private Division of Responsibility for Education. Economics of Education Review, 6(1): 1-14.
King, E., James, E., and Suryadi, A. (1996). Finance, Management, and Costs of Public and Private Schools in Indonesia. Economics of Education Review, 15(4): 387-398.
Levin, H. (2002). A Comprehensive Framework for Evaluating Educational Vouchers. Educational Evaluation and Policy Analysis, 24(3): 159-174.
Levin, H. M. and Driver, C. (1997). Costs of an Educational Voucher System. Education Economics, 5: 303-311.
Lloyd, C. B., Mensch, B. S., and Clark, H. (2000). The Effects of Primary School Quality on School Dropout among Kenyan Girls and Boys. Comparative Education Review, 44(2): 113-147.
Ministry of Education, Science and Technology. (2005). Kenya Education Sector Support Programme (2005-2010). Nairobi: Ministry of Education, Science and Technology: Government of Kenya.
Nishimura, M., Yamano, T. and Sasaoka, Y. (2007). Internal Efficiency under the Universal
GRIPS Policy Information Center Discussion Paper : 08-02
13
Primary Education Policy in Rural Uganda. Journal of International Development Studies, 16(1): 69-81.
Nishimura, M., Yamano, T. and Sasaoka, Y. (2008). Impacts of the universal primary education policy on educational attainment and private costs in rural Uganda. International Journal of Educational Development, 28(2): 161-175.
Obasi, E.(2000). The impact of economic recession on UPE in Nigeria. International Journal of Educational Development, 20(3): 189-207.
Prince, A. (1997). Quality of Learning in Nigeria’s Universal Primary Education Scheme-1976-1986. Urban Review, 29: 189-203.
Sasaoka, Y, and Nishimura, M. (2007). Educational Decentralization in Low-Income Countries: Contradiction with Universal Education Policy. Journal of International Development Studies, 16(2): 21-33. (In Japanese).
Sawamura, N. (2006). Exam-centred School Education: Actual Conditions of Primary Education in Kenya. Journal of International Cooperation in Education, 9(2): 97-111. (In Japanese).
Sifuna, D. N. (2007). The Challenge of Increasing Access and Improving Quality: An Analysis of Universal Primary Education Interventions in Kenya and Tanzania since the 1970s. International Review of Education, 53: 687-699.
Sifuna, D. N., Sawamura, N., and Nimura, N. (2007). The Case of Kenya. In Nishimura, eds, Country Status Report for the International Cooperation Initiative on A Comparative Analysis on Universal Primary Education Policy and Administrative and Financial Systems in Sub-Saharan Africa. Kobe: Kobe University.
UNESCO. (2008). Education for All Global Monitoring Report 2008. Paris: UNESCO. Yamano, T., and Jayne, T.S. (2005). Working-Age Adult Mortality and Primary School
Attendance in Rural Kenya. Economic Development and Cultural Change, 53: 619-54. Yamano, T., Otsuka, K., Place, F., Kijima, Y., and Nyoro, J. (2005). The 2004 RePEAT
Survey in Kenya (First Wave): Results. GRIPS Development Database No.1, National Graduate Institute of Policy Studies, Tokyo.
GRIPS Policy Information Center Discussion Paper : 08-02
14
Table 1. Public and Private School Characteristics in Kenya
Public Primary Schools
Private Primary Schools
Difference (B) – (A)
(A) (B) (C)
Mean [number]
Mean [number]
Mean (s.e.)
Full Census Schools KCPE Exam Score A 244.8 301.0 56.2***
[n = 13,618] [n = 628] (1.53) Pupil-Teacher Ratio B 43.0 42.9 -0.06
[n = 13,301] [n = 97] (1.67) School Matching Schools listed by the RePEAT surveys N = 449 N = 98 Schools matched with the KCPE List 63.7% of N 27.5% of N Average KCPE Exam Score A 239.2 273.8 34.5*** [n = 286] [n=27] (6.62) Schools listed in the Ministry of Education File 90.0% of N 25.5% of N
Pupil-Teacher Ratio B 43.3 42.1 -1.2 [n = 405] [n=25] (2.9) Source: The Education Management Information System (EMIS), Ministry of Education, Science and Technology (MOEST) of Kenya Note: A Kenya Certificate of Primary Education (KCPE) exam (as known as Leaving Exam). B The pupil-teacher ratio and pupil-class room ratio cover only 97 private schools.

GRIPS Policy Information Center Discussion Paper : 08-02
15
Table 2. School Choice of Children aged 6 to 15 in 2004 and 2007 in rural Kenya
Public School Private School
All Not
enrolled Matched with KCPE
Not Matched
with KCPE
Matched with KCPE
Not Matched
with KCPE
(A) (B) (C) (D) (E) (F) Number
(%)
Girls 2004 650 55 379 189 12 15 (100) (8.5) (58.3) (29.1) (1.9) (2.5) 2007 592 49 291 180 22 50 (100) (8.3) (49.2) (30.4) (3.7) (8.5) Boys 2004 598 47 334 184 17 16 (100) (7.9) (55.9) (30.8) (2.8) (2.7) 2007 547 39 269 173 15 51 (100) (7.1) (49.2) (31.6) (2.7) (9.3) Note: Public and private schools that are not matched with the KCPE scores are likely to be newly established schools after FPE and do not yet have eighth graders to participate in the KCPE exam.
GRIPS Policy Information Center Discussion Paper : 08-02
16
Table 3. School Choice by Asset Quartile in 2004 and 2007
Asset Quartile
All
1 (Poorest)
2
3
4 (Least poor)
% % % % % 2004 Not Enrolled 8.2 10.2 10.0 6.1 6.4 Public Schools
Matched with KCPE 57.1 50.8 63.4 62.0 52.4 Not matched with KCPE 29.9 37.5 26.2 24.3 31.5
Private Schools Matched with KCPE 2.5 0.6 0.3 4.5 4.5 Not matched with KCPE 2.3 1.0 0.0 3.2 5.1
All 100 100 100 100 100 2007 Not Enrolled 7.7 11.1 7.7 7.4 4.6 Public Schools
Matched with KCPE 49.2 40.1 56.8 55.5 44.4 Not matched with KCPE 31.0 42.5 28.8 27.2 25.3
Private Schools Matched with KCPE 8.9 4.5 6.3 7.8 16.9 Not matched with KCPE 3.3 1.7 0.3 2.2 8.8
All 100 100 100 100 100

GRIPS Policy Information Center Discussion Paper : 08-02
17
Table 4. School Progress of Children in Public School in 2004
All Drop-out A Graduate Remain in the same school
Transfer to Public School
Transfer to Private School
Number (%) Girls 575 16 142 334 68 15 (100) (2.8) (24.7) (58.1) (11.8) (2.6) Boys 508 24 145 275 49 15 (100) (4.7) (28.5) (54.1) (9.7) (3.0) All 1,083 40 287 609 117 30 (100) (3.7) (26.5) (56.2) (10.8) (2.8) Note: A Drop-out is defined as a child who was attending a public primary school in 2004 but not attending any school in 2007, although her or his highest grade obtained is less than eight.
GRIPS Policy Information Center Discussion Paper : 08-02
18
Table 5. Primary School Choice among Girls (2004 and 2007 Pooled Data) Constrained MNL Model: Base Group is Public School with KCPE data
Public School Private School Not attending
school Not matched KCPE data
Matched with KCPE data
Not matched KCPE data
School Variable KCPE Score n.a. n.a. 0.0013*** n.a. (4.06) Individual Chara. Age -0.226*** 0.157 0.050 0.024
(8.68) (1.14) (0.084) (0.21)
Age squared 0.010*** -0.006 -0.002 -0.001
(8.01) (1.12) (0.19) (0.34)
Orphan (=1) 0.013 -0.007 0.001 0.035
(0.57) (0.43) (0.24) (1.26)
Mother’s education -0.003 -0.014 0.006* 0.002**
(0.46) (0.78) (1.92) (2.40)
Father’s education -0.006* 0.009** 0.001 0.0002
(1.89) (0.38) (0.03) (0.17)
Household Chara. Head’s age -0.0004 0.004*** 0.001 -0.0005
(0.10) (2.69) (1.09) (0.78)
Female Headed (=1) 0.010 0.037 0.026* 0.001
(0.92) (1.51) (1.78) (0.62)
Number of men 0.002 -0.061 0.023** -0.003
(0.81) (1.58) (2.56) (0.22)
Number of women -0.003 0.037 -0.019* 0.004
(1.21) (0.17) (1.83) (0.28)
ln (asset value) -0.016 -0.032* 0.009** 0.012***
(0.28) (1.93) (2.12) (4.84) 2007 dummy (=1) 0.004 0.006* -0.0003 0.070***
(0.97) (1.90) (0.60) (5.12)
Constant 1.502*** 0.462 -0.905*** -0.200**
(7.88) (0.87) (3.55) (2.51)
Observations 1,113 Note: Coefficients on continuous variables indicate marginal changes in the probability of each outcome category evaluated at the mean values, and coefficients on dummy variables indicate changes in the probability of each outcome when the value of the dummy variables change from zero to one. Numbers in parentheses are absolute z-values. Two dummy variables for missing education levels of mothers and fathers and twelve district dummies are also included in the model but not reported.

GRIPS Policy Information Center Discussion Paper : 08-02
19
Table 6. Primary School Choice among Boys (2004 and 2007 Pooled Data) Constrained MNL Model: Base Group is Public School with KCPE data
Public School Private School Not attending
school Not matched KCPE data
Matched with KCPE data
Not matched KCPE data
School Variable KCPE Score n.a. n.a. 0.0014*** n.a. (4.79) Individual Chara. Age -0.185*** 0.157 0.009 0.017
(-7.84) (1.22) (1.02) (0.52)
Age squared 0.128*** 0.015 0.031 0.006
(6.98) (1.24) (0.97) (0.28)
Orphan (=1) 0.034 -0.064 -0.002 0.023
(0.87) (1.09) (0.15) (0.48)
Mother’s education -0.015*** -0.005 0.003 0.005***
(3.05) (0.34) (0.99) (3.21)
Father’s education -0.008*** -0.003** 0.0013 0.001
(3.24) (2.00) (0.31) (0.12)
Household Chara.
Head’s age -0.001 0.005*** 0.0003 -0.0001
(1.15) (3.01) (0.55) (0.01)
Female Headed (=1) 0.009 -0.061 0.025 0.010
(0.18) (1.38) (1.25) (0.32)
Number of men 0.014 -0.049*** -0.002 -0.001
(0.22) (3.96) (0.96) (1.31)
Number of women 0.002 0.003 -0.005 -0.001
(0.59) (1.14) (0.95) (0.92)
ln (asset value) -0.045 -0.055* 0.045*** 0.007***
(1.24) (1.80) (5.68) (3.76) 2007 dummy (=1) -0.001 0.005** 0.033*** 0.070***
(0.90) (2.39) (3.86) (5.61)
Constant 1.703*** 0.756 -0.969*** -0.155**
(8.10) (1.43) (4.25) (1.98)
Observations 1,191 Note: Coefficients on continuous variables indicate marginal changes in the probability of each outcome category evaluated at the mean values, and coefficients on dummy variables indicate changes in the probability of each outcome when the value of the dummy variables change from zero to one. Numbers in parentheses are absolute z-values. Two dummy variables for missing education levels of mothers and fathers and twelve district dummies are also included in the model but not reported.
GRIPS Policy Information Center Discussion Paper : 08-02
20
Table 7. School Progress and Transfer among Girls in Public Schools in 2004 to 2007 Constrained MNL Model: Base Group is Remain in the Same School
Drop-out Graduate Transfer to public School
Transfer to Private School
School Variable KCPE Score 0.001 -0.001 -0.000 0.0001
(1.42) (0.17) (-0.13) (0.18)
Missing Info 0.186 0.033 -0.019 -0.033
(1.41) (0.81) (-0.36) (0.094)
Individual Chara. Age -0.069** 0.526 0.014 -0.051
(-2.05) (1.35) (-0.25) (-1.57)
Age squared 0.003** -0.014 -0.002 0.002
(2.58) (-0.45) (0.20) (1.41)
Mother’s education -0.001 0.0199 0.008 -0.006
(-0.37) (1.34) (1.19) (-1.46)
Father’s education -0.008* 0.021** -0.005 0.006
(-1.72) (2.16) (-0.57) (1.37)
Household Chara. Head’s age -0.0004 -0.006 0.0015*** 0.0016**
(0.71) (0.15) (2.73) (2.02)
Female Headed (=1) -0.038 -0.013 0.102*** 0.043*
(-1.31) (-0.18) (2.62) (1.70)
Number of men 0.010 0.025 0.001 -0.022**
(-0.12) (-1.17) (-1.25) (-2.02)
Number of women 0.004 0.002 -0.010 -0.0004
(0.32) (-0.059) (-0.68) (-0.096)
ln (asset value) -0.031* 0.077** -0.021 0.022**
(-1.74) (2.18) (-0.86) (2.16)
Constant 0.462 -4.901*** 0.512 0.073
(0.67) (-2.89) (0.058) (-0.50)
Observations 507 Note: Coefficients on continuous variables indicate marginal changes in the probability of each outcome category evaluated at the mean values, and coefficients on dummy variables indicate changes in the probability of each outcome when the value of the dummy variables change from zero to one. Numbers in parentheses are absolute z-values. Two dummy variables for missing education levels of mothers and fathers and twelve district dummies are also included in the model but not reported.
GRIPS Policy Information Center Discussion Paper : 08-02
21
Table 8. School Progress and Transfer among Boys in Public Schools in 2004 to 2007 Constrained MNL Model: Base Group is Remain in the Same School
Drop-out Graduate Transfer to public School
Transfer to Private School
School Variable KCPE Score -0.0016** -0.0002 0.0002 0.0012**
(1.99) (0.56) (0.44) (2.25)
Missing Info -0.317 -0.001 -0.056 0.280**
(1.61) (0.07) (-0.30) (2.23)
Individual Chara. Age -0.134** 0.070 -0.123*** 0.143
(-2.53) (0.17) (-2.83) (1.64)
Age squared 0.006*** 0.006 0.004*** -0.007
(2.97) (0.93) (2.79) (-1.58)
Mother’s education -0.010 -0.012 -0.005 0.016***
(1.15) (0.98) (0.69) (2.73)
Father’s education -0.0004 0.007 0.005 -0.006*
(0.72) (0.90) (0.34) (1.89)
Household Chara. Head’s age -0.0001 -0.001* -0.0003** 0.001*
(1.10) (1.93) (2.05) (1.67)
Female Headed (=1) 0.017 -0.039 -0.052 -0.014
(0.46) (1.12) (1.47) (0.90)
Number of men 0.015 -0.065*** 0.004* -0.015
(0.052) (3.77) (1.88) (1.40)
Number of women -0.007 0.034 -0.015 0.004
(0.61) (0.56) (1.36) (0.15)
ln (asset value) -0.023 0.151*** -0.043 0.016
(0.79) (4.26) (1.54) (1.58)
Constant 1.347** -1.486** 1.699** -1.898
(1.96) (-2.37) (2.07) (1.50)
Observations 577 Note: Coefficients on continuous variables indicate marginal changes in the probability of each outcome category evaluated at the mean values, and coefficients on dummy variables indicate changes in the probability of each outcome when the value of the dummy variables change from zero to one. Numbers in parentheses are absolute z-values. Two dummy variables for missing education levels of mothers and fathers and twelve district dummies are also included in the model but not reported.
Copyright © 2022 FDOKUMEN