Scaling New Heights - Reliance Nippon Life Insurance
376
ANNUAL REPORT 2019 Scaling New Heights
-
Upload
khangminh22 -
Category
Documents
-
view
0 -
download
0
Transcript of Scaling New Heights - Reliance Nippon Life Insurance

ANNUAL REPORT2019
Scaling New Heights

1
Contents
Statutory Reports
FinancialStatements
Strategic Report1
2
3
01
02
03
04
05
06
07
08
09
AT A GLANCE ........................................................................02
MESSAGE FROM PRESIDENT, NIPPON LIFE ...........................04
MESSAGE FROM EXECUTIVE DIRECTOR, RELIANCE CAPITAL ................................................................06
MESSAGE FROM CEO, RELIANCE NIPPON LIFE .....................08
MEMBERS OF THE EXECUTIVE COUNCIL .............................. 10
CORPORATE INFORMATION ................................................. 12
EVOLVING TECH AGILITY ...................................................... 14
EMPOWERING OUR PEOPLE ................................................. 16
MANAGEMENT DISCUSSION & ANALYSIS ........................... 18
BOARD’S REPORT .................................................................34
CORPORATE GOVERNANCE .................................................56
MANAGEMENT’S REPORT .................................................... 70
INDEPENDENT AUDITORS’ REPORT ...................................... 75
FINANCIAL STATEMENTS .......................................................82
01
01
02
02
03

Delivering Transformation and ProgressOver the past three years, we embarked on a journey of business transformation, implementing various initiatives to accelerate growth and strengthen our balance sheet. Year after year, we delivered tangible progress and have continued on the path of consistent and sustainable business performance. We are now positioned to reap the benefits of our strengthened financial and operational performance — in spite of industry headwinds — and have crossed the inflection point for achieving quality growth.
In Fiscal 2019, we were able to deliver better-than-industry KPIs across multiple business parameters. We aimed to achieve significantly superior levels of agency and employee productivity, and a superior mix of guaranteed products. By digitally enabling our business processes we focused on transforming the Company to be more customer-centric and cost efficient.
This financial year, we encouraged a strong ownership and entrepreneurship zeal amongst our people, driving deeper individual contributions and elevated productivity at every stage of our value chain.
With the strength of our products and people, we have crossed over into the phase for scaling our growth through embracing technology to serve more customers, better. Building on the strengths of our "direct to customer model” — which is unique to the industry — we have been able to reduce variability in our service delivery. We believe that our journey has been one of the sharpest turnaround stories in the industry, and we look towards the next phase of the road ahead.
Going forward, we aim to cross many more milestones to foster sustained value creation for all our stakeholders. Now, more than ever, we are confident in our ability to execute our vision of becoming the most respected life insurance company in the country.
78%13th month persistency rate – FY2019

2
Annual Report 2018-19
Established In 2006, Reliance Nippon Life Insurance Company Is One Of The Leading Private Sector Life Insurance Companies In India In Terms Of Individual WRP (Weighted Received Premium) And New Business WRP.
At a Glance
Wide distribution network across India…
+720 Offices
+55,000 Active Advisors

2.6 Million Policies in Force (Approx.)
` 76,000 + Crore Sum Assured
` 4,358 Crore in Total Premium
` 332 Crore in New Business Achieved Profit (NBAP) – increased by 15%
` 3,582 Crore Embedded Value – increased by 11%
` 20,281 Crore in Assets Under Management – increased by 6%
` 3,291 Crore in Renewal Premium – increased by 4.3%
` 876 Crore in Individual WRP – increased by 21%
13th Month Persistency (%)
NBAP Margin increased (` in Crore)
65%
198
72.2
0%28
9
77.6
0%33
2
FY17
FY17
FY18
FY18
FY19
FY19
STRA
TEG
IC R
EPO
RT /
STA
TUTO
RY R
EPO
RTS
/ F
INA
NCI
ALS
STA
TEM
ENTS
3

4
Annual Report 2018-19
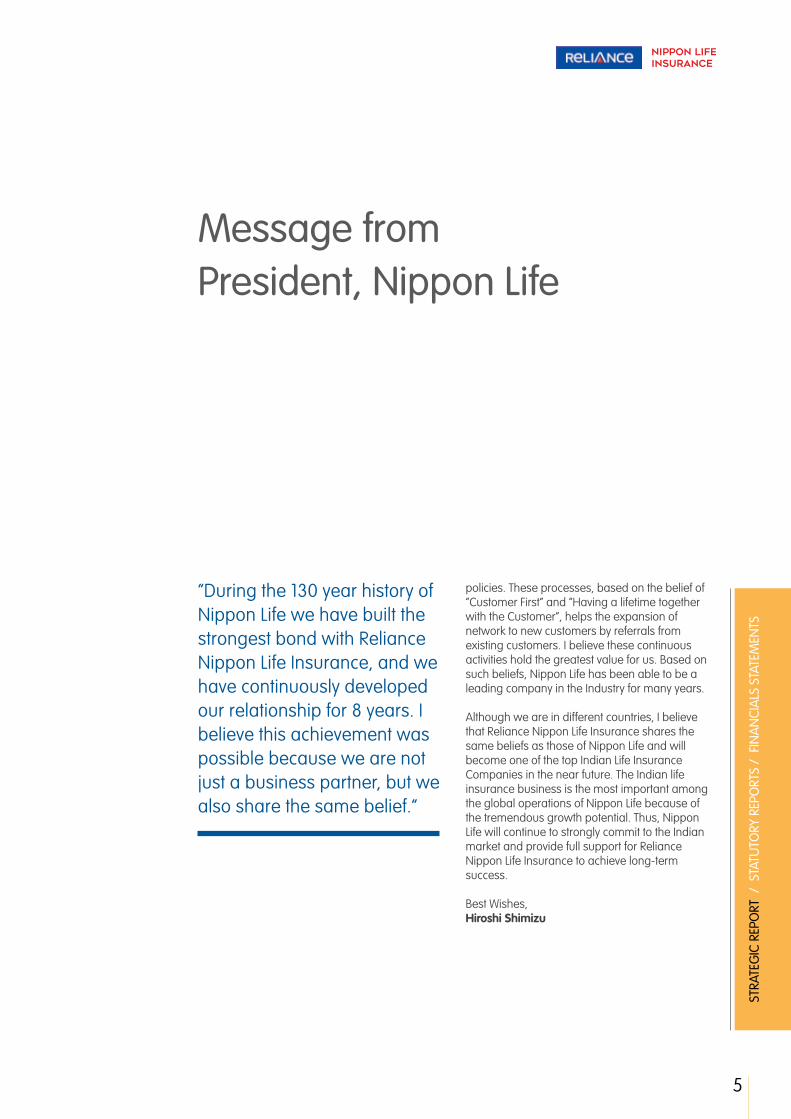
Hiroshi Shimizu President, Nippon Life
Dear Friends,
Since Nippon Life’s first investment in Reliance Life Insurance in 2011, both companies have been learning and elevating each other in various areas by actively exchanging personnel from the top management to working level and by sharing experiences of both success and failure. Such developments, led to the additional investment in 2016. Symbolising our strong and solid relationship, the Company’s name has been changed to ‘Reliance Nippon Life Insurance Company’. During the long history of Nippon Life we have built the strongest bond with Reliance Nippon Life Insurance, and we have continuously developed our relationship for 8 years. I believe this achievement was possible because we are not just a business partner, but we also share the same belief.
In July 2018, Nippon Life entered the 130th year in business. Having Conviction, Sincerity and Endeavour as the basis of Fundamental Management Principles, we have always considered the customer’s benefit as the highest priority and managed our business from a long-term perspective. On a daily basis, our sales representatives visit customers to establish trust rather than to make proposals of insurance
5
STRA
TEG
IC R
EPO
RT /
STA
TUTO
RY R
EPO
RTS
/ F
INA
NCI
ALS
STA
TEM
ENTS
Message from President, Nippon Life
policies. These processes, based on the belief of “Customer First” and “Having a lifetime together with the Customer”, helps the expansion of network to new customers by referrals from existing customers. I believe these continuous activities hold the greatest value for us. Based on such beliefs, Nippon Life has been able to be a leading company in the Industry for many years.
Although we are in different countries, I believe that Reliance Nippon Life Insurance shares the same beliefs as those of Nippon Life and will become one of the top Indian Life Insurance Companies in the near future. The Indian life insurance business is the most important among the global operations of Nippon Life because of the tremendous growth potential. Thus, Nippon Life will continue to strongly commit to the Indian market and provide full support for Reliance Nippon Life Insurance to achieve long-term success.
Best Wishes,Hiroshi Shimizu
“During the 130 year history of Nippon Life we have built the strongest bond with Reliance Nippon Life Insurance, and we have continuously developed our relationship for 8 years. I believe this achievement was possible because we are not just a business partner, but we also share the same belief.”

6
Annual Report 2018-19
Dear Shareholders,
The Indian economy continued to remain the world’s fastest growing large economy, despite challenges on many fronts. Last year we witnessed a synchronised global growth deceleration, but easy policy stances by the fiscal and monetary authorities in several countries tried to cushion the pace of this slowdown. In spite of this, India has continued on its transformational growth journey. The economy is becoming increasingly open to new-age opportunities, and it is exciting to witness the economic formalisation and digitisation trends that will impact consumers and entrepreneurs in the years to come.
As a result of the healthy performance of the Indian economy, the share of life insurance premiums in the Gross Domestic Savings (GDS) of the households sector has increased. The growing contribution of the insurance industry from the household GDS has been ploughed back into the economy, generating higher growth.
As one of India’s leading financial services companies in the private sector, Reliance Nippon Life Insurance Company has proven to be a key value creator for Reliance Capital. With over ` 20,821 Crore of Assets Under Management, a workforce of over 11,500 employees servicing over one Crore customers, Reliance Nippon Life Insurance is well poised for growth.
Anmol AmbaniExecutive Director, Reliance Capital

7
STRA
TEG
IC R
EPO
RT /
STA
TUTO
RY R
EPO
RTS
/ F
INA
NCI
ALS
STA
TEM
ENTS
Message from Executive Director, Reliance Capital
Since 2011, our commendable partnership with Nippon Life has yielded excellent synergies for the company’s success. With similar values and beliefs, we have built a partnership based on integrity and mutual respect. Together, we have shared ideas and experiences, establishing a nationwide footprint of over 720+ offices; over 1.3 Crore policies issued since inception; and an AUM of over ` 20,281 Crore as of March 31, 2019.
Your company is blessed with a formidable pedigree, with decades of experience in protecting life, and providing financial independence to individuals. We continue to make industry-leading investments into strengthening our distribution capabilities, helping us provide training to our sales team and delivering meaningful products and services that meet the life-cycle needs of our customers.
We started on our business transformation journey in FY2017 by implementing various initiatives to accelerate growth and strengthen our balance sheet. Building on the strengths of our all women ‘Direct-To-Customer Model’ — which is unique to the industry — we have been able to significantly improve our persistency rate. We believe that our journey has been one of the sharpest turnaround stories in the industry, and we look towards the next phase of the road ahead with optimism.
Going forward, we aim to cross many more milestones to foster sustained value creation for all our stakeholders. Now, more than ever, we are confident in our ability to execute our vision of becoming the most respected and prevailing life insurance company in the Country.
Best Wishes, Anmol Ambani
+1.3 Crore policies issued since inception
8
Annual Report 2018-19
Dear Shareholders,
The Indian life insurance industry has evolved rapidly over the last decade. A competitive market, and regulatory initiatives focused on encouraging high-quality products that meet the needs of the customer, have laid the foundation for future growth.
Lower levels of penetration, favourable demography and government initiatives aimed to bolster financial inclusion, raise financial literacy and increase domestic savings as a result of rising per capita incomes, are expected to support the growth of the insurance sector. With continuous efforts to be more transparent, encouraging the simplification of insurance products and services, these measures will play a key role in increasing the penetration of life insurance in India.
Reliance Nippon Life Insurance remains a key participant in this space and shall continue to support the needs of an aspiring population.
Our Performance during FY2019The Company achieved robust performance in FY2019 due to its consistent customer centric strategy, strong leadership, industry leading digital initiatives and the committed efforts of our employees. The financial year gone by was a landmark year for us, as we were able to deliver better-than-industry performance across multiple business parameters. This has strengthened our belief that our hard work and sustained efforts to provide financial protection to millions of customers have been appreciated.
Ashish Vohra Executive Director & CEO, Reliance Nippon Life
17% Growth in New Business Premium FY2019
9
STRA
TEG
IC R
EPO
RT /
STA
TUTO
RY R
EPO
RTS
/ F
INA
NCI
ALS
STA
TEM
ENTS
Led by the digitally empowered process enhancements towards customer engagement, we are pleased to report a significant improvement in our profitability and persistency in FY2019. The New Business Achieved Profit (NBAP) increased by 15% at ` 332 Crore in FY2019. Our 13th month persistency rate rose from 72% in the previous year to 78% in March 2019, while the average ticket size improved by 16% to ~ ` 40,500 During the year, we also successfully scaled up our distribution tie-up with Bank of Maharashtra, and gained access to over 1500 branches, in addition to our network of 720+ offices with 55,000+ active advisors across India.
The Road Ahead As the digital economy is flourishing, we are also progressing with our technological innovations and growing our presence in multi-channel platforms. We have used technology to offer greater convenience to our customers and improve the overall experience of purchasing a life insurance policy.
Along with the digitalization of consumer facing operations, we continue to invest in the automation of our internal processes to improve coverage within our micro-market together with weaving efficiency, risk management, cost optimization into our operations. Towards our commitment to accelerate growth, we reinvest and re-deploy financial and human capital in revenue accretive initiatives.
We will continue to focus on meeting the diverse needs of our customers and create a sustainable value for all our stakeholders. We believe our
strategies will enable us to deliver superior customer experience and allow us to create significant value for all stakeholders. We will continue to tread on the path of profitable growth and emerge as market leaders.
Going forward, we aim to further enhance our reach through digitally augmented, non-traditional ways that include digitalized and cost-efficient journeys. Our continued focus on digital transformation across distribution, customer service and operations will continue to be the mainstay of our strategy going forward. We are sure that our initiatives in creating a tech-led performance enhancement will help improve the qualitative vectors of our products and services ultimately driving franchise value. We will continue to set high performance bars and work hard to keep pushing the boundaries of what we are able to achieve.
We see a positive road ahead, and believe that with the right strategies in place, we are poised for continued growth and success that will create significant value for our customers, shareholders, distributors and employees alike.
As we embark on this journey of consistent growth, I would like to express my gratitude to all our stakeholders for their continuous support and encouragement.
With best wishes, Ashish Vohra
Message from CEO, Reliance Nippon Life

10
Annual Report 2018-19
Members of the Executive Council
PRERAK PARMARChief Distribution Officer
SRINIVAS LADWAChief Human Resources Officer
ASHISH VOHRAExecutive Director & CEO
S.V. SUNDER KRISHNANChief Risk Officer
AKHILESH GUPTAChief Investments Officer
11
STRA
TEG
IC R
EPO
RT /
STA
TUTO
RY R
EPO
RTS
/ F
INA
NCI
ALS
STA
TEM
ENTS
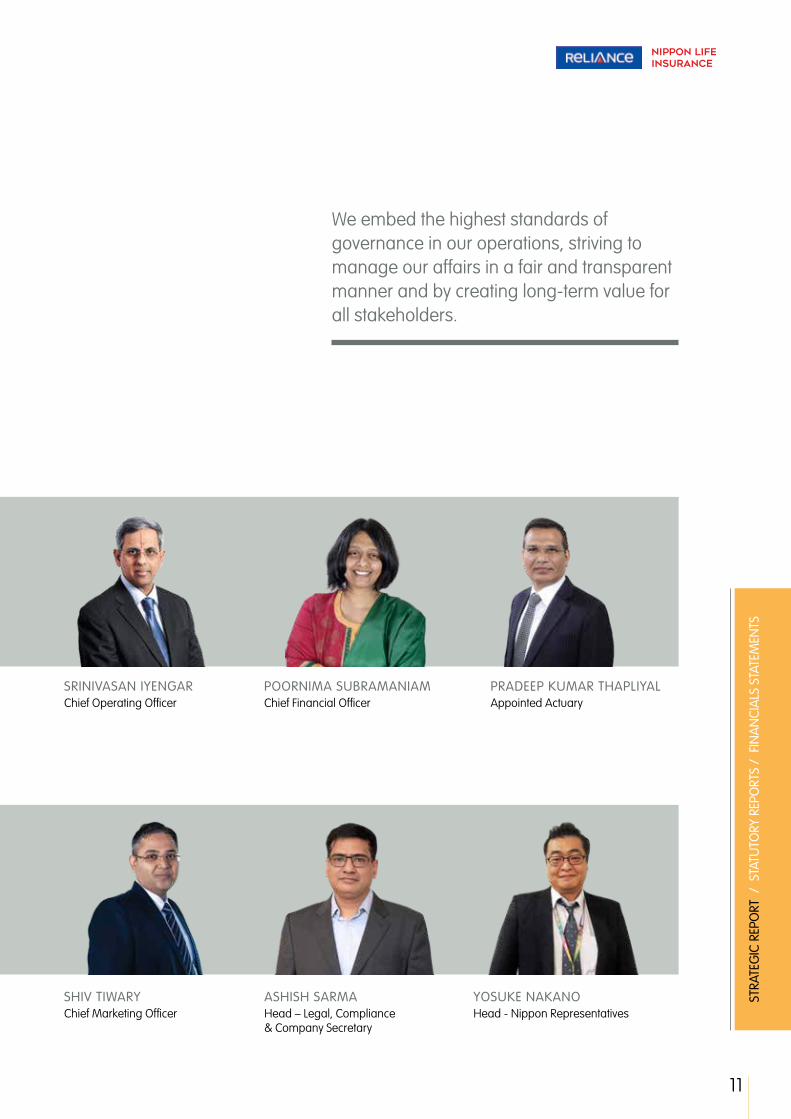
POORNIMA SUBRAMANIAMChief Financial Officer
SRINIVASAN IYENGARChief Operating Officer
YOSUKE NAKANOHead - Nippon Representatives
SHIV TIWARYChief Marketing Officer
PRADEEP KUMAR THAPLIYALAppointed Actuary
We embed the highest standards of governance in our operations, striving to manage our affairs in a fair and transparent manner and by creating long-term value for all stakeholders.
ASHISH SARMAHead – Legal, Compliance & Company Secretary

Corporate Information
Board of Directors of the Company:1. Shri. Santosh B. Nayar
2. Shri. Rajendra Chitale
3. Ms. Renu Challu
4. Prof. Indira J. Parikh
5. Shri. Gautam Doshi
6. Shri. Amit Bapna
7. Shri. Minoru Kimura
8. Shri. Tomohiro Yao
9. Shri. Ashish Vohra
Board Committees 1. Board Audit and Compliance Committee
2. Board Risk Management Committee
3. Board Asset Liability Management Committee
4. Board Investment Committee
5. Board Policyholders’ Protection Committee
6. Board With Profits Committee
7. Board Corporate Social Responsibility Committee
8. Board Nomination and Remuneration Committee
9. Board Share Transfer and Allotment Committee
Management Team: 1. Ashish Vohra, Chief Executive Officer
2. Prerak Parmar, Chief Distribution Officer
3. Srinivasan Iyengar, Chief Operating Officer
4. Poornima Subramanian, Chief Finance Officer
5. Pradeep K Thapliyal, Appointed Actuary
6. Srinivas Ladwa, Chief Human Resources Officer
7. Akhilesh Gupta, Chief Investment Officer
8. S V Sunder Krishnan, Chief Risk Officer
9. Shiv Tiwary, Chief Marketing Officer
10. Ashish Sarma, Head – Legal, Compliance & Company Secretary
11. Yosuke Nakano, Head - Nippon Representatives
Annual Report 2018-19
12
Company Secretary:Shri. Ashish Sarma
Statutory Auditors:M/s Pathak H.D. & AssociatesChartered Accountants
M/s Singhi & Co.Chartered Accountants
Internal Auditors:“Ernst and Young LLP”Chartered Accountants
Bankers: HDFC BankICICI BankStandard Chartered BankState Bank of IndiaDeutsche BankYes Bank
Registered Office:H Block, 1st Floor,Dhirubhai Ambani Knowledge City,Kopar Khairane,Navi Mumbai – 400 710
Corporate Office:Reliance Centre, 5th floor, Off Western Express Highway,Santacruz East, Mumbai, Mumbai-City district, Maharashtra-400055
13
STRA
TEG
IC R
EPO
RT /
STA
TUTO
RY R
EPO
RTS
/ F
INA
NCI
ALS
STA
TEM
ENTS

Evolving Tech AgilityThe advancement in technology is playing an important role in grooming the processes of modern age businesses, where industries and organisations are moving from being offline to adopting digital mediums of operations. The impact of technology on different segments of businesses is expected to be path breaking.
To this end, we have moved towards digitising processes that have deep impact on top line and bottom-line value creation, in addition to enhancing customer experience. Moreover, we have also invested in digital innovations across sales processes, employee training, business operations, risk assessment and customer engagement.
We believe that the implementation of digital tools induces agility and cutting-edge advantages, while building an efficient, process led organisation and creating customer delight in every interaction. Our people are now using their devices to upload documents, use mobile apps for sales and making payments and get reminders and updates for their insurance policies.
Digital transformations revolve around becoming future ready, and making the organisation proficient in delivering sustainable returns. Going forward, we intend to make sizeable investments in upgrading operating platforms and IT infrastructure to emerge as a completely digitalised organisation.
Our new Website with New Features and Service Bot
Augmented PIRV Model
Enhanced Super Express
Income Planner ToolQR Code Based Tool
Annual Report 2018-19
14
Key Digital Initiatives

15
STRA
TEG
IC R
EPO
RT /
STA
TUTO
RY R
EPO
RTS
/ F
INA
NCI
ALS
STA
TEM
ENTS

Annual Report 2018-19
16
Empowering our PeopleHuman resource plays a vital role in the development of an organisation, making it an invaluable asset for its success. Human capital is one of the key drivers of corporate success and sustained competitive advantage. Since it is a business or industry specified function, we believe that it is necessary for it to evolve to the same degree as the industry does.
We see our employees as capital value, rather than a resource that can be replaced. This enables us to be a more flexible and forward-looking, with a mobile workforce that will contribute towards business success.
RNLIC, being one of the largest employers in the Life Insurance industry (with a total employee base of over 11,500) a very significant proportion of our business is people led, and the majority of business origination is led by customer advisory. To achieve the multi-faceted objectives of improving motivation, skill and knowledge level of employees, we have taken numerous human capital initiatives through the year.
Key Initiative Taken During the Year:Digi30We have scaled up the reach of our globally acclaimed digital training platform developed using the Workplace platform of Facebook. This training platform has now been scaled up to cover every channel and locations in the country with necessary customisation for channel specific requirement
Hire2JoinDigitally enabled onboarding system that allows for a seamless employee onboarding across all locations in the country. This paperless system not only enhances onboarding experience for new employees but also ensures business-readiness of employees from the first day of joining
LEAP A Branch Manager Capability Development program – This program was launched with the objective of developing leadership skills in Branch Managers to elevate their impact on business, build a focused and motivated team and improve the quality of customer relationships.
Enhanced Employee Engagement Initiatives This year we have focused on engaging deeper with our people, which not only drives productivity and retention, but also helps us build further from grounds-up ideas originating from the vast knowledge and experience repository of our employees. New employee engagement initiatives include enhanced employee newsletter, collective celebration of employee successes, enhanced HR query platform and Idea Express Tool.
AarambhBranch Manager in the key position which represents RNLIC to the customer, distributors and employees in a location. Aarambh program was launched as a 6-day boot camp for all newly hired branch managers to undergo training and get certified. The program equips the branch manager to hire, engage and build his employee, distributor and customer base consistently as per the RNLIC values and processes leveraging the digital tools provided by the company.
With rapid transformation underway in the Insurance industry, the challenges HR functions are expected to face have increased and calls for rapid involvement. There is a need for creating new models and strategies, to adapt and evolve to such changes by the HR.

+11500 Employee Base (FY 2019)
Human capital is one of the key drivers of corporate success and sustained competitive advantage.
STRA
TEG
IC R
EPO
RT /
STA
TUTO
RY R
EPO
RTS
/ F
INA
NCI
ALS
STA
TEM
ENTS
17
18
Annual Report 2018-19
Economic OverviewThe global economy witnessed strong growth in 2017, and the momentum continued in 2018 with a growth rate of 3.6%. However, global economic growth is expected to ease moderately to 3.2% in 2019, before edging up to 3.4% in 2020, as per OECD. Persistent moderation in China, owing to financial tightening amidst rising shadow banking and local government debt, and trade conflicts with the US had a dampening effect on the overall emerging markets’ and developing economies’ performance.
Indian EconomyIndia’s GDP growth is expected to grow by 7.2% (RBI projection) in FY2020, after decreasing sharply from 8.2% in FY2017 to 7.1% in FY2018 and then to 7.0% in FY2019. However, several factors are critical towards driving this growth. First, public spending in rural areas, and an increase in the average disposable income of households, are expected to augur well for an increase in private consumption. Second, credit flows are expected to improve and bolster economic activity as the level of nonperforming advances (NPAs) on banks’ balance sheets declines and stressed assets see resolutions. Lastly, improving capacity utilisation, tailwinds from lower oil prices and benefits of any interest rate cuts are likely to support economic activity.
However, a few risks continue to persist. The slowdown in the global economy and the trade war rhetoric could continue to impact India’s export growth prospects. Moreover, the lack of private participation in fuelling a new investment cycle shifts the burden completely to government spending, which has a lower multiplier for the overall economy.
Headline CPI inflation has declined sharply since mid-2018, driven by the sustained fall in food inflation, the waning away of the direct impact of house rent allowances for central government employees, and more recently, by a sharp fall in fuel inflation. Owing to that the average CPI inflation for FY2019 stood at 3.43% compared to 3.58% in FY2018.
The domestic financial market showed divergent movements in the first half of 2018-19. Money markets experienced liquidity swings while government securities and foreign exchange markets were impacted by global spillovers. In the credit market, bank lending gained traction amidst liquidity tightening seen in the debt markets.
The Indian economy witnessed the introduction of multiple big-ticket reform measures such as the recapitalisation of public sector banks; the adoption of a new GST (Goods and Services Tax) regime; and the introduction of the National Company Law Tribunal (NCLT) and Insolvency and Bankruptcy Code (IBC) for the effective and efficient resolution of NPAs.
Despite challenges, the economic outlook for India remains positive for the second term of the Modi-led BJP government, with a GDP growth forecast averaging 7% per year during the 2019 to 2023 period.
Life Insurance Sector OverviewAccording to Swiss Re Institute 2019 report, the global direct premiums crossed US$ 5 trillion mark for the first time in 2018. The global direct premiums accounted for 6.1% of the global GDP (Gross Domestic Product) in 2018. The insurance sector in 2018 grew in line global economic growth with real GDP up by 3.2%.
Growth in life premium in 2018 was nearly double the historic average, thanks to the robust economic growth, rising incomes and increased risk awareness. According to Swiss Re Institute Report 2019, Emerging Markets is expected to be an engine of growth in global direct premium in 2019-20 for both Life (8.7%) and Non-Life segment (7.0%). The momentum in Life premium growth is expected to be strong owing to shift towards protection type products and low interest rates, whereas the Non-Life premium growth is expected to be on a strong footing due introduction of government-backed universal health and crop insurance schemes, well supported by urbanisation and pipeline of huge infrastructure projects. The emerging market premium will rise from 21% in 2018 to 34% in 2029 due to increased emerging markets premium outgrowing the GDP.
Management Discussion and Analysis

19
STRA
TEG
IC R
EPO
RT /
STA
TUTO
RY R
EPO
RTS
/ F
INA
NCI
ALS
STA
TEM
ENTS
Despite challenges, the economic outlook for India remains positive, with a GDP growth forecast averaging 7% per year during the 2019 to 2023 period.
Real Premium Growth in 2018E, versus average 2008-17 and 2019-20F
E: Estimated; F: ForecastedSource: Swiss Re Institute 2019
Life Non-Life Total
0.8%
0.7% 1.
2%
8.7%
0.2% 0.
6%2.
9%
1.9%
1.1%
1.8%
7.1% 7.
7%7.
0%
3.0%
2.2% 3.
0%
1.3%
0.1%
1.5% 2.
1%7.
9%7.
9%
1.5%
1.2%
2.9%
-2.0
%
8.1%
2018E
2008-17
2019-20F
Advanced Emerging World Advanced Emerging World Advanced Emerging World

20
Annual Report 2018-19
Life Insurance Penetration in IndiaThe insurance industry in India is going through a paradigm shift. The key factors driving this shift are growing awareness, accessibility, affordability, regulatory reforms and economic growth. During FY2019, the Indian Life insurance industry grew by 10.73% Year on Year (Y-o-Y) to ` 2,14,672.86 crores. The sum assured grew by 11.63% Y-o-Y to ` 43,33,541.65 crores in FY2019. However, the Number of Policies (NOP) grew by 1.73% Y-o-Y to 2.86 crores.
Performance of Indian Life Insurance Industry in FY2019
Particulars FY2019 FY2018 Growth (in %)
Premium(` in crores)
2,14,672.86 1,93,866.24 10.73
Number of Policies
2,86,87,812 2,81,98,778 1.73
Sum Assured(` in crores)
43,33,541.41 38,82,171.65 11.63
Source: Insurance Regulatory and Development Authority of India (IRDAI)
Salient features of Indian Life Insurance IndustryInsurance Regulatory Authority of India regulates India’s life insurance industry. Twenty-four Life Insurance companies are licensed to conduct Insurance business in India. Life Insurance Corporation of India is the only public sector company amongst 24 companies.
Stable Growth: During FY2012 to FY2018, the new business premium has grown at a Compounded Annual Growth Rate (CAGR) of 14.44%.
Low Insurance Penetration: According to Swiss Re Institute 2019, Taiwan tops the charts for highest insurance (including both Life and Non-Life) premium penetration with 20.9% of its GDP, followed by Hong Kong and Cayman Islands at 18.7% and 17.5%, respectively. India ranks 43rd at 3.7% premium penetration as a percentage of its GDP.
10.73% INDIAN LIFE INSURANCE INDUSTRY GROWTH Y-O-Y
The Indian Life insurance industry is driven by growth factors such as low insurance penetration, widening customer presence, increasing government support, and higher levels of FDI.
Management Discussion and Analysis contd...

21
STRA
TEG
IC R
EPO
RT /
STA
TUTO
RY R
EPO
RTS
/ F
INA
NCI
ALS
STA
TEM
ENTS
Insurance Penetration: Premium as % of GDP
Source: Swiss Re Institute 2019
Life Premium Volume (in million US$) and Share of world market 2018E (in 2018): United States leads the Life Premium volume (US$ 593,391 million) with 21.0% global share in 2018, due to lower taxes and higher public spending. India entered the 10th spot in Life Premium volume (US$ 73,735 million) with 2.6% global share due to the government’s focus on financial inclusive schemes aiding insurers gain access to new customers.
Taiw
an
Hon
g Ko
ng
Caym
an Is
land
s
Sout
h A
fric
a
Sout
h Ko
rea
Uni
ted
King
dom
Den
mar
k
Finl
and
Net
herla
nds
Fran
ce
Japa
n
Switz
erla
nd
Italy
Sing
apor
e
Cana
da
Nam
ibia
Uni
ted
Stat
es
Irela
nd
Swed
en
Port
ugal
Indi
a
20.9
18.7
17.5
12.9
11.2
10.6
10.4
9.9
9.2
8.9
8.9
8.4
8.3
7.8
7.5
7.3
7.1
6.8
6.8
6.4
3.7
Uni
ted
Stat
es
Japa
n
Uni
ted
Stat
es
Japa
n
Chin
a
Uni
ted
King
dom
Fran
ce
Italy
Taiw
an
Ger
man
y
Indi
a
Sout
h Ko
rea
Life Premium Volume (in million US$) and Share of world market 2018E (in 2018)

22
Annual Report 2018-19
Rise in market share of private players: The market share of private insurance player has grown from 2.0% in FY2003 to 33.76% in FY2019.
Particulars FY2003 FY2019
Market Share of Private Players
2.00% 33.76%
Government Support: The Government’s drive towards building an environment of protection in the country backed by ecosystem gave impetus to the Indian Life Insurance industry. It was further exemplified by various schemes such as Ayushman Bharat for health insurance, Pradhan Mantri Jiwan Jyoti Bima Yojana (PMJJBY) for life insurance, Pradhan Mantri Suraksha Yojana for accidental death and disability insurance and Atal Pension Scheme for retirement planning.
Foreign Direct Investment and IPO boost: The government’s decision to permit 49% foreign direct investment made the Indian insurance sector
lucrative to foreign investors. It has further enabled the insurers to secure capital facilitating to work on aggressive expansion and innovation plans. Further, insurers who have been in business for at least 10 years can now raise capital through initial public offerings (IPOs).
Omnichannel presence widening customer reach: The industry’s customer reach has widened with fascinating term plans both through e-commerce as well as offline channels.
Low cost: The low cost of protection products backed with attractive commission structures have made life insurance products a gripping proposition for both buyers and sellers.
Premium ComparisonThe total premium comprises of single and non-single premium collected with each of these premium groups including individual and group premium.
Comparison of Premium (` in Crores)
Premium (in ` Crores)
Single Non-SingleFY2019 FY2018 Growth FY2019 FY2018 Growth
Group 1,08,408.7 95,127.3 14.0% 3,864.5 2,776.0 39.2%Individual 31,667.3 31,820.6 -0.5% 66,015.9 60,289.1 9.5%
The group single and non-single premium grew by 14.0% and 39.2% Y-o-Y, respectively in FY2019. On the other hand, the Individual single premium de-grew by 0.5% in FY19, whereas the Individual non-single premium surged by 9.5% Y-o-Y during the same period.
Performance of Private Insurers vis-à-vis LIC of IndiaDuring FY2019, LIC of India continues to lead in Individual Single, Group Single and Group Non-Single premium at ` 24,393.6 crores, ` 86,527.4 crores and ` 3,465.0 crores respectively. On the other hand, the private players collectively garner ` 39,397.3 crores and ` 3,529.4 crores for Individual Non-Single and Group Yearly Renewable premiums in FY2019.
Indi
vidu
alSi
ngle
Indi
vidu
alN
on-S
ingl
e
Gro
up
Sing
le
Gro
up
Non
-Sin
gle
Gro
up Y
ear
Rene
wab
le
7273
.824
393.
6 3939
7.3
2661
8.6
2188
.13
8652
7.4
399.
534
65.0
3529
.411
87.1
Premium in ` Crores
Total Private Players
LIC of India
Management Discussion and Analysis contd...

23
STRA
TEG
IC R
EPO
RT /
STA
TUTO
RY R
EPO
RTS
/ F
INA
NCI
ALS
STA
TEM
ENTS
Market ShareLIC of India continues to be the market leader in FY2019 with 66.24% market share in premium, 74.71% share in number of policies and 75.21% lion share in the total sum assured.
Life Insurers Market Share
Insurer Premium Policies Sum Assured
LIC of India 66.24% 74.71% 75.21%
Private Players 33.76% 25.29% 24.79%
Reliance Nippon Life 0.50% 0.79% 0.84%
The road aheadAccording to Associated Chambers of Commerce and Industry of India referring a joint study conducted with research firm APAS, India’s insurance industry is expected to surpass US$ 280 billion by FY2020. The steady growth is propelled by Government’s Ayushman Bharat Health insurance schemes along with growth drivers like rising disposable incomes, presence of global players and easing of the regulatory regime, impelling penetration of the insurance culture in the country.
India accounts for a mere 1.5% of the world’s insurance premiums and 2% of world’s life insurance premiums, despite of being the 2nd
most populous nation in the world. According to IRDA, the life insurance industry in India promises a huge untapped potential as only 23% of the Indians were covered with a life insurance policy in FY2019.
Life insurers are stimulating premium growth by actively reaching out to the current and potential customers by offering innovative product and services. The companies are now focusing on operational efficiencies, refining and redefining process for enhancing its bottom line.
The life insurance industry in India promises a huge untapped potential as only 23% of the Indians were covered with a life insurance policy in FY2019.

24
Annual Report 2018-19
About the CompanyReliance Nippon Life Insurance Company is amongst the leading private sector life insurance companies in India in terms of individual WRP (weighted received premium) and new business WRP. The company is one of the largest non-banks supported private life insurers with over 10 million policy holders, a strong distribution network of 727 Branches and over 55,000 Advisors as on March 31, 2019. The company holds Claim Settlement Ratio of 97.71% as on March 31, 2019.
Rated amongst the Top 3 Most Trusted Life Insurance Service Brands by Brand Equity‘s Most Trusted Brands Survey 2017, the company’s vision is “To be a company people are proud of, trust in and grow with; providing financial independence to every life we touch.” With this in mind, Reliance Nippon Life caters to five distinct segments, namely Protection, Child, Retirement, Saving & Investment, and Health; for individuals as well as Groups or Corporate entities.
Parentage The key shareholders of the Company are Reliance Capital and Nippon Life. Both are amongst the world’s strongest brands.
Reliance Nippon Life Insurance Company is a part of Reliance Capital, one of India’s leading private sector financial services companies, which ranks among the top private sector financial services and non-banking companies. Reliance Capital has interests in asset management and mutual funds, stock broking, life and general insurance, proprietary investments, private equity and other activities in financial services.
Currently, Nippon Life, as one of Japan’s largest private life insurer, has a revenue of US$ 70 Billion and profit of US$ 5.1 billion as of March 31, 2018. The Company, with over 32 million policies in Japan, offers a wide range of products, including individual and group life and annuity policies through various distribution channels and mainly uses face-to-face sales channel for its traditional insurance products including individual and group life and annuity policies. The company primarily operates in Japan, North America, Europe and Asia and is headquartered in Osaka, Japan. It is ranked 126th among the global Fortune 500 firms in 2018. Nippon Life holds 49% stake in Reliance Life.
97.71% Claim Settlement Ratio as on March 31, 2019
Management Discussion and Analysis contd...
25
STRA
TEG
IC R
EPO
RT /
STA
TUTO
RY R
EPO
RTS
/ F
INA
NCI
ALS
STA
TEM
ENTS
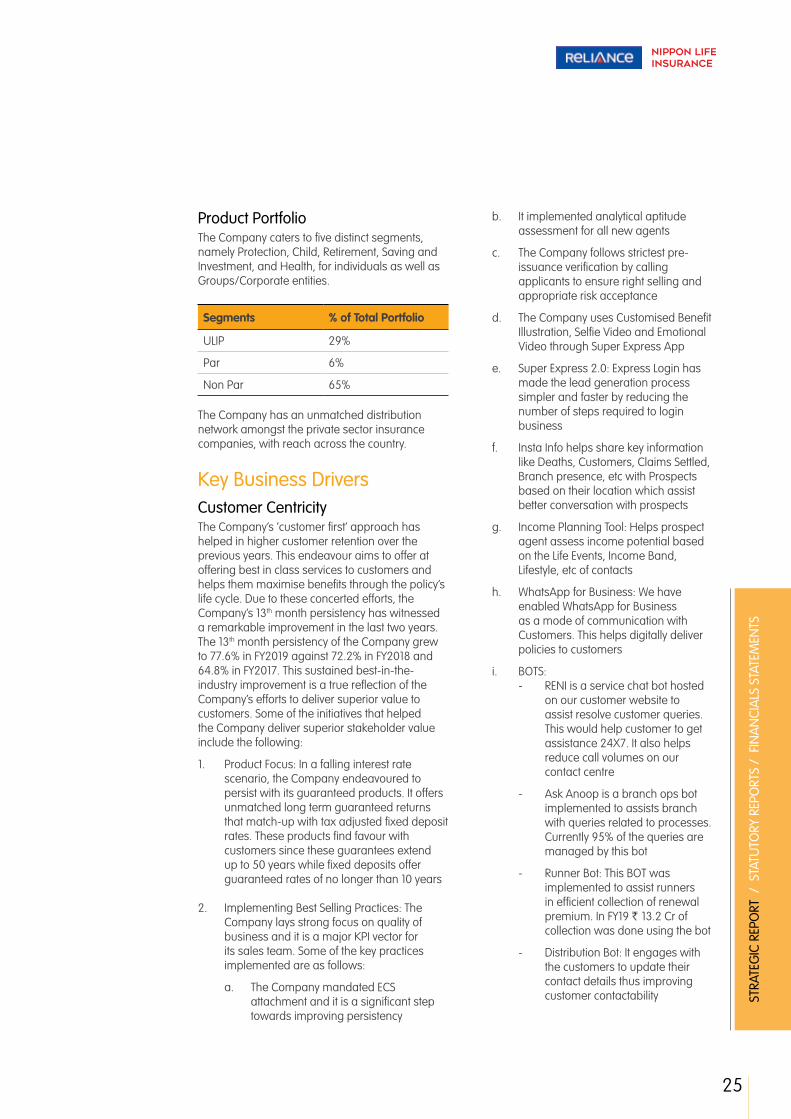
Product Portfolio The Company caters to five distinct segments, namely Protection, Child, Retirement, Saving and Investment, and Health, for individuals as well as Groups/Corporate entities.
Segments % of Total Portfolio
ULIP 29%
Par 6%
Non Par 65%
The Company has an unmatched distribution network amongst the private sector insurance companies, with reach across the country.
Key Business Drivers Customer Centricity The Company’s ‘customer first’ approach has helped in higher customer retention over the previous years. This endeavour aims to offer at offering best in class services to customers and helps them maximise benefits through the policy’s life cycle. Due to these concerted efforts, the Company’s 13th month persistency has witnessed a remarkable improvement in the last two years. The 13th month persistency of the Company grew to 77.6% in FY2019 against 72.2% in FY2018 and 64.8% in FY2017. This sustained best-in-the-industry improvement is a true reflection of the Company’s efforts to deliver superior value to customers. Some of the initiatives that helped the Company deliver superior stakeholder value include the following:
1. Product Focus: In a falling interest rate scenario, the Company endeavoured to persist with its guaranteed products. It offers unmatched long term guaranteed returns that match-up with tax adjusted fixed deposit rates. These products find favour with customers since these guarantees extend up to 50 years while fixed deposits offer guaranteed rates of no longer than 10 years
2. Implementing Best Selling Practices: The Company lays strong focus on quality of business and it is a major KPI vector for its sales team. Some of the key practices implemented are as follows:
a. The Company mandated ECS attachment and it is a significant step towards improving persistency
b. It implemented analytical aptitude assessment for all new agents
c. The Company follows strictest pre-issuance verification by calling applicants to ensure right selling and appropriate risk acceptance
d. The Company uses Customised Benefit Illustration, Selfie Video and Emotional Video through Super Express App
e. Super Express 2.0: Express Login has made the lead generation process simpler and faster by reducing the number of steps required to login business
f. Insta Info helps share key information like Deaths, Customers, Claims Settled, Branch presence, etc with Prospects based on their location which assist better conversation with prospects
g. Income Planning Tool: Helps prospect agent assess income potential based on the Life Events, Income Band, Lifestyle, etc of contacts
h. WhatsApp for Business: We have enabled WhatsApp for Business as a mode of communication with Customers. This helps digitally deliver policies to customers
i. BOTS: - RENI is a service chat bot hosted
on our customer website to assist resolve customer queries. This would help customer to get assistance 24X7. It also helps reduce call volumes on our contact centre
- Ask Anoop is a branch ops bot implemented to assists branch with queries related to processes. Currently 95% of the queries are managed by this bot
- Runner Bot: This BOT was implemented to assist runners in efficient collection of renewal premium. In FY19 ` 13.2 Cr of collection was done using the bot
- Distribution Bot: It engages with the customers to update their contact details thus improving customer contactability
26
Annual Report 2018-19
3. Sharp Focus on Claims Settlement: The Company extends a 10-day Claims Settlement guarantee for all claims post submission of necessary claim documents. It offers 6.5% annual rate of interest on the claim amount in the event of non-adherence to this TAT. This endeavour towards faster claims settlement has also helped the Company achieve 97.7% claims settlement ratio.
4. In addition, the Company’s unique centralised communication channel also helps in rapid claim settlement. In instances, where a technical intervention may be required from a Claims Subject Matter Expert, the Company has introduced a dedicated, ‘Claims Help Line’. This helpline offers the claimant direct access to the SME namely Claims Assessor.
Multi-channel Distribution Reliance Nippon Life Insurance has invested significantly in building a multi-channel distribution infrastructure across the country. The Company’s distribution infrastructure and reach is one of the largest amongst the private sector.
The Company’s products are marketed through a distinctive, multi-channel distribution model. In addition to the agency led business, the Company has made relevant investments to strengthen its multi-platform national footprint through its owned distribution network, bancassurance and third-party owned distribution channels.
Tied Agency: The Company’s tied agency channel is the largest sales vertical in terms of business and employee strength. Under this model, it has over 55,000 licensed advisors to solicit insurance sales and service customers across 727 branches in the metros, Tier I and Tier II cities and towns of India.
The Company has been consistently ranked amongst the “Top 5 Agency Companies” in India for the past 2* years, with a predominantly agency-led model for distribution.
*For FY18 & FY19 Public disclosure of few companies yet to be disclosed
Direct Marketing: This Channel primarily focuses on the ecosystem by cross-selling and up-selling to the existing clients, including orphan customers.
However, the channel also aggressively pursues leads generated from aggregators and affiliates and contributes significantly to business growth from new customers.
The Company’s Direct Marketing channel is helmed by its highly trained staff. Regular structured training and induction is provided to the sales team, as they progressively move up the ladder.
Each of the frontline sales staff is equipped with a mobile App to assist customers in choosing the right plan, based on specific life planning needs. Direct Marketing channel rewards high performers adequately through career progression, promotions and monetary benefits.
Direct Marketing continues to be the most dynamic and effective distribution channel as the sales process are well controlled and managed by the Company. This results in fewer instances of mis-selling, faster conversion and better 13-month persistency.
Face-to-Face Channel: This is a unique distribution channel and the first of its kind in India. This service-based sales platform is primarily served by carefully screened and well-trained women employees called Life Planning Officers (LPOs). These LPOs have deep local knowledge and the Company empowers these LPOs through extensive training that is founded on the premise
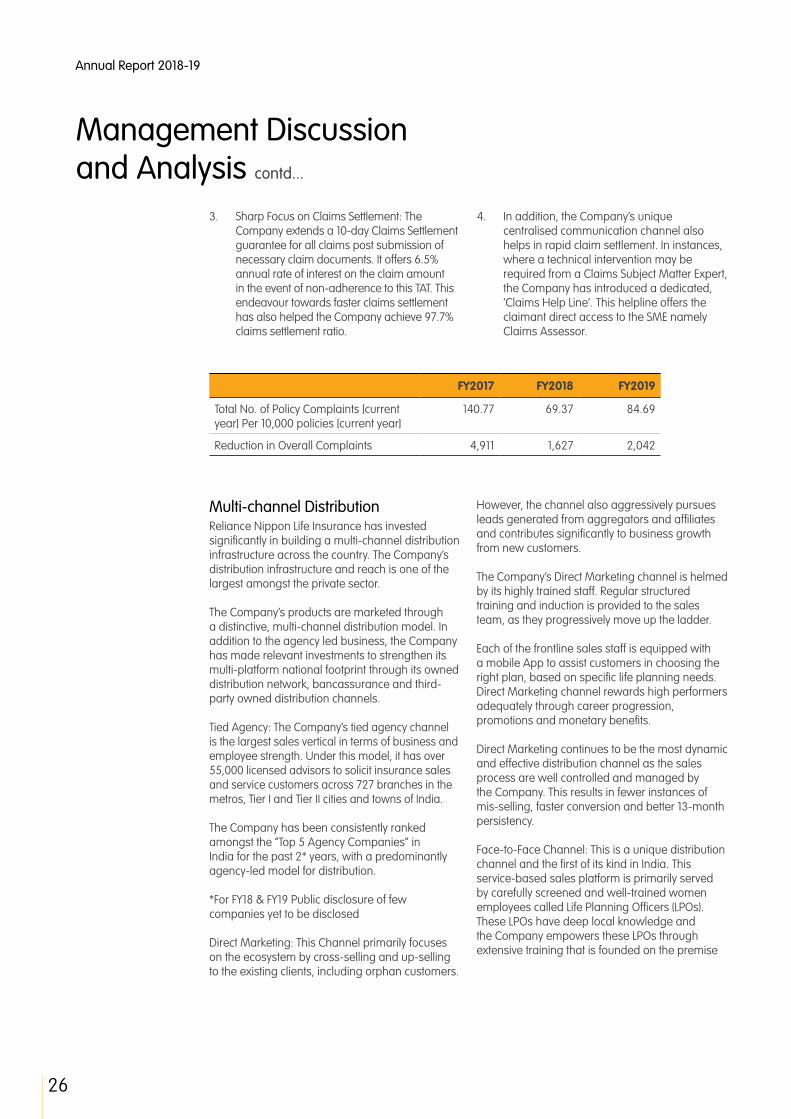
FY2017 FY2018 FY2019
Total No. of Policy Complaints [current year] Per 10,000 policies [current year]
140.77 69.37 84.69
Reduction in Overall Complaints 4,911 1,627 2,042
Management Discussion and Analysis contd...
27
STRA
TEG
IC R
EPO
RT /
STA
TUTO
RY R
EPO
RTS
/ F
INA
NCI
ALS
STA
TEM
ENTS
of building relationship with orphan customers based on trust. A tailored training enables these LPOs to effectively re-engage with customers and cross-sell meaningfully, based on specific protection needs.
TechnologyThe Company uses technology to offer greater convenience to its customers by improving the overall experience of purchasing life insurance. The Company is at the forefront of leveraging the latest technology for optimising sales and its after-sales processes. The Company possesses a new agency management system - Saleskonnect for quicker agent on-boarding. It has also helped in bringing greater efficiencies in the processes of the stake-holding functions such as Sales Support, Sales Channels and Operations.
The Company’s IT infrastructure has also been strengthened over the year. The Company has replaced the traditional tape backups with the introduction of Disk to Disk to ensure that systems are released quicker for issuance related activities.
The Company’s business distribution methodology also underwent the beginnings of a major transformation. The Company embarked on a digitisation drive and implemented its entire product suite on to the digital platform for sales channels. Benefits of digital product suite has resulted into faster customer on-boarding. The
distributors have also been empowered through a device-agnostic digital platform, which enables them to provide services to customers with ease.
Reliance Nippon Life is the first in the Indian life insurance space to implement Mpower system for investments. This new system has enhanced capabilities in terms of user friendliness and capability to handle regulatory requirements.
The Company successfully increased its digital adoption during the year. As an ongoing initiative, the Company undertook the following technology-oriented activities during the year.
Super Express: The Company reinforced/developed its end-to-end digital policy issuance application for superior customer experience and faster policy issuance. The system leverages technology for superior risk selection and paperless issuance of policies.
Super Sync: This lead management system offers a system of organising and qualifying leads with prospect profiles. The leads are synchronised with Super Express for further relationship-based prospecting and consultative selling.

28
Annual Report 2018-19
Digi 30 Training: Digi 30 is an improvised learning pedagogy that leverages @Workplace for innovative delivery of video-based training content that has been specifically designed keeping in view the preferred learning modes of the sales team.
Pathshala: A new learning management system was launched for the new generation of employees who want to learn on the job and desire immersive experience, while having a short span of attention. Paathshaala has the ability to create within itself micro sites for multiple cohorts of different roles and responsibilities. Paathshaala works on the employee’s smart phone, even on low network connections and perfectly suits the Company’s requisite because of its widespread branch presence.
The objective of these project is to improve upon the Digital adoption and create a paperless office environment and reduce non-productive travel by the sales force. The IT enabled function will also create transparent end to end processes. These new app will essentially bring in a better, seamless user experience from lead to issuance, and handy functionalities to improve TAT, helping keep a better track of business activity.
Operational Review The Company reported significant improvement in profitability and persistency in FY2019. The New Business Achieved Profit Margin was higher by 15% and the Company reported a profit of ` 25.46 Crore in FY2019. The Company’s 13th month persistency rose from 72% in the previous year to 78% in March 2019, while the average ticket size improved by 16% to ` 40,500. During the year, the Company successfully scaled up the distribution tie-up with the Bank of Maharashtra, and gained access to over 1,897 branches.
The transformation in the Company’s performance was led by origination control and systemic process enhancements towards improving customer engagement. As the Company continues on this path of transformation, the target is to improve the qualitative parameters further, with stronger performance ownership among individuals.
During the year, Reliance Nippon Life focused on building people capabilities and driving a balanced product portfolio strategy. The Company initiated steps to instil ownership amongst its employees, enhancing productivity and individual contribution. Furthermore, the Company introduced a financial matrix to assess and motivate superior branch performance.
The Company progressed on its transformation journey and realigned its people, customer, distribution operations to align with changing customer preferences and distributor priorities. The Company made strategic advancements to adopt new technologies that helped in faster service delivery and superior risk assessment.
Product Mix During the year, the Company maintained its focus on NON-PAR products, which contributed 65%* to the overall business. Contribution from ULIP products remained below 30%* of the overall business.
*Figures are Product Mix Consolidated Issuance Report FY19
Channel Mix The agency business dominated the overall distribution mix, contributing 56% to the overall business; compared to its contribution of 66% during the previous year.
ULI
P
PAR
Non
PA
R
29%
5%
65%
Product Mix
Channel Mix FY19 (%)
56%
4%
13%
27%
Agency Banca CA+BR Direct
Management Discussion and Analysis contd...
29
STRA
TEG
IC R
EPO
RT /
STA
TUTO
RY R
EPO
RTS
/ F
INA
NCI
ALS
STA
TEM
ENTS
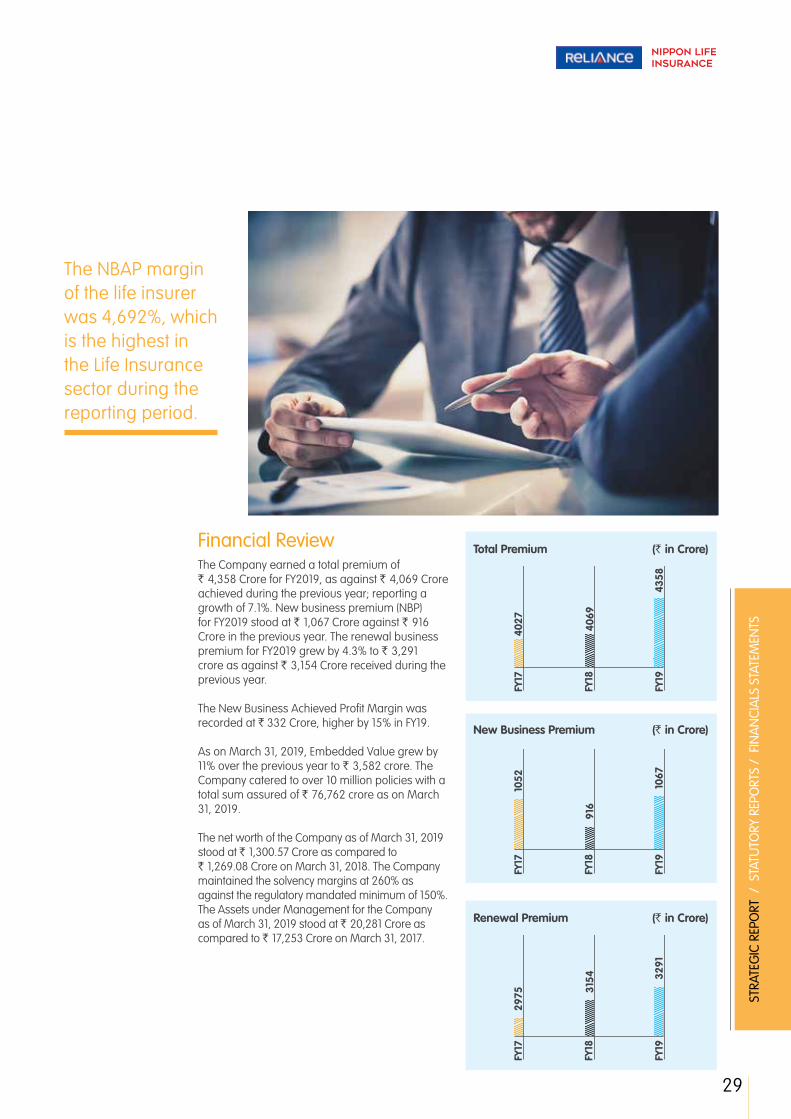
Financial Review The Company earned a total premium of ` 4,358 Crore for FY2019, as against ` 4,069 Crore achieved during the previous year; reporting a growth of 7.1%. New business premium (NBP) for FY2019 stood at ` 1,067 Crore against ` 916 Crore in the previous year. The renewal business premium for FY2019 grew by 4.3% to ` 3,291 crore as against ` 3,154 Crore received during the previous year.
The New Business Achieved Profit Margin was recorded at ` 332 Crore, higher by 15% in FY19.
As on March 31, 2019, Embedded Value grew by 11% over the previous year to ` 3,582 crore. The Company catered to over 10 million policies with a total sum assured of ` 76,762 crore as on March 31, 2019.
The net worth of the Company as of March 31, 2019 stood at ` 1,300.57 Crore as compared to ` 1,269.08 Crore on March 31, 2018. The Company maintained the solvency margins at 260% as against the regulatory mandated minimum of 150%. The Assets under Management for the Company as of March 31, 2019 stood at ` 20,281 Crore as compared to ` 17,253 Crore on March 31, 2017.
The NBAP margin of the life insurer was 4,692%, which is the highest in the Life Insurance sector during the reporting period.
FY17
FY18
FY19
4027
4069
4358
FY17
FY18
FY19
1052
916
1067
FY17
FY18
FY19
2975 31
54 3291
Total Premium (` in Crore)
New Business Premium (` in Crore)
Renewal Premium (` in Crore)

30
Annual Report 2018-19
Outlook Over the past few years, the life insurance industry in India has undergone fundamental shifts: rapid expansion to the next tier geographies; the rebalancing of distribution with rise of Bancassurance; digital enablement and the transition of product mix towards more of protection oriented products. There has been a consistent industry-wide improvement across parameters of business quality. These developments have helped the industry create significant value for customers, shareholders and other stakeholders. Looking ahead, the external factors that are likely to help the momentum are continued economic reforms; rising disposable incomes; relative under-penetration of life insurance; and shift of savings from physical assets to financial sector.
To capitalise on the existing opportunities, the Company will concentrate on the development of its distribution channels, product innovation, digital transformation, maintain its laser-sharp focus on delivery of outstanding value to customers
The Company will continue to intensify its focus on strategic channels and deployment of technology tools that will help deliver the right solutions to customers in every interaction and standardize experience across touch points. The development of new emerging channels and digital distribution will help expand and deepen distribution. Furthermore, the Company will expand its product portfolio and improve its penetration in existing micro-market. In particular, the Company will also grow its focus to address the rising demand of retirement solutions, savings and protection products.
Rising internet penetration and government initiatives such as digital push, and the introduction of UPI, are accelerating the adoption of digital technologies. The Company’s digital transformation to deliver products to customers on digital platforms and create process enhancements have yielded superior customer
experience and cost efficiencies. We have experienced significant performance uptick on account of these initiatives, and we expect these initiatives to deliver significantly higher benefits in the coming years.
Risk ManagementThe Company has undertaken many initiatives towards the implementation of Enterprise Risk Management (ERM). The Management’s commitment for effective ERM initiatives is clearly visible from the independent organisational structure set up by the Company for this purpose and has aligned its risk management practices with ISO31000:2018 standard. The Company has formed a Control Committee that consists of executive council members, and heads of business and operations functions such as Actuary, Human Resources, Finance and Risk Management amongst others. This Committee also includes the Chief Executive Officer, and meets on a monthly basis to monitor and review risk management processes, compliance and audit related issues, etc. Issues are therefore, identified and resolved at the initial stage itself. Similarly, Risk Management Practices are also reviewed quarterly with the Board Level Committee.
The Company has effectively addressed burgeoning challenges to mitigate risks proactively. This is done in addition to classic reactive services. Through the implementation and effective use of technology, the Company seeks to proactively manage risk, so as to set the ground for a more comprehensive Enterprise Wide Risk Management System. This has been done by developing analytical approaches, methods and models that identify trends, risks, or potential regulatory violations.
The Company has automated key processes across Compliance, Audit & Risk for integrated assessment and effective monitoring. The Company has implemented Fraud Framework, Risk Control Self Assessment, Risk Reviews, Risk Scoring Models and Proactive risk management framework, Conducting Pre- and Post-issuance risk verification (PIRV) based on a risk matrix etc
The Company has implemented tools such as Fraud Prevention Framework, Risk Control Self-Assessment (RCSA), Risk Reviews, Risk Scoring Models, and Proactive Risk Management frameworks by implementing measures such as implementing analytical models for proactive risk alerts and triggers. This helps us to minimise the levels of unidentified risks.
11% Growth in Embeded Value Y-O-Y
Management Discussion and Analysis contd...

31
STRA
TEG
IC R
EPO
RT /
STA
TUTO
RY R
EPO
RTS
/ F
INA
NCI
ALS
STA
TEM
ENTS
Integrated Risk Management: The Building Blocks ERM Framework at RNLIC is aligned with the ISO 31000 :2018 Risk Management guidelines.
Integration
DesignImprovement
EvaluationImplementation
ContinualImprovement Integrated
Structured andComprehensive
Customized
InclusiveDynamic
Best Available Information
Human and CulturalFactors
RECORDING & REPORTING
COM
MU
NIC
ATIO
N &
CO
NSU
LTAT
ION
MO
NIT
ORI
NG
& R
EVIE
W
Scope, Contest, Criteria
Risk Identification
Risk Analysis
Risk Treatment
Risk Evaluation
Risk AssessmentLeadership
and Commitment
Framework
Principles
Process
Value Creation and Protection

32
Annual Report 2018-19
Reliance Nippon Risk Management PolicyThe vision that the risk management unit encompasses; is that risk management is a key part of how we all do things to ensure success:
Enterprise Wide Risk Management Structure at Reliance Nippon
01 02 03 04 05 06
We take accountability for
managing our business risks
We take informed risks in order to achieve superior
returns
Risk management enables us
to realize our opportunities
We insist on practices which help us manage
our risks well
Risk management helps us avoid
unwelcome surprises
Risk management contributes to the achievement of
business objectives
Operations Risk
Internal & ExternalInvestigations
Disciplinary Actions(CEDC)
Fraud Risk Monitoring
Risk & FraudPrevention
Risk & Fraud Analytics
New Product,Process and Technology
Review (NPR)
Market / Credit Risk
Market RiskAnalysis
Credit Risk Monitoring
Mid-office Monitoring
Asset LiabilityManagement
Investment Committee
ALM committee
Information Security Risk
Information SecurityManagement
Systems (ISO 27001)
Penetration Testing
Infosec Risk Review
Information SecurityMonitoring
IT Risk Assessment
Infosec Committee
ERM & Governance
Board Risk &Control Committee
ERM RiskDashboards
Risk Reviews
Risk Assessment
Risk Sensitization
Zonal Risk Framework
Business Continuity(ISO22301)
Internal Audit Co-ordination
Management Discussion and Analysis contd...

33
STRA
TEG
IC R
EPO
RT /
STA
TUTO
RY R
EPO
RTS
/ F
INA
NCI
ALS
STA
TEM
ENTS
Cautionary Statement This document contains statements about expected future events, financial and operating results of Reliance Nippon Life Insurance Company, which are forward-looking. By their nature, forward-looking statements requires the Company to make assumptions and are subject to inherent risks and uncertainties. There is significant risk that the assumptions, predictions and other forward-looking statements will not prove to be accurate. Readers are cautioned not to place undue reliance on forward-looking statements as several factors could cause assumptions, actual future results and events to differ materially from those expressed in the forward-looking statements. Accordingly, this document is subject to the dis-claimer and qualified in its entirely by the assumptions, qualifications and risk factors referred to in the Management’s Discussion and Analysis of Reliance Nippon Life Insurance Company’s Annual Report, FY2019.
Through the implementation and effective use of technology, the Company seeks to proactively manage risk, so as to set the ground for a more comprehensive Enterprise Wide Risk Management System.
260% Solvency Margin as on 31st Match 2019
Annual Report 2018-19
34
Board’s Report
The Members Of Reliance Nippon Life Insurance Company Limited:Your Directors present the eighteenth Annual Report of Reliance Nippon Life Insurance Company Limited (“the Company / RNLIC”) with the audited financial statement of accounts for the year ended March 31, 2019.
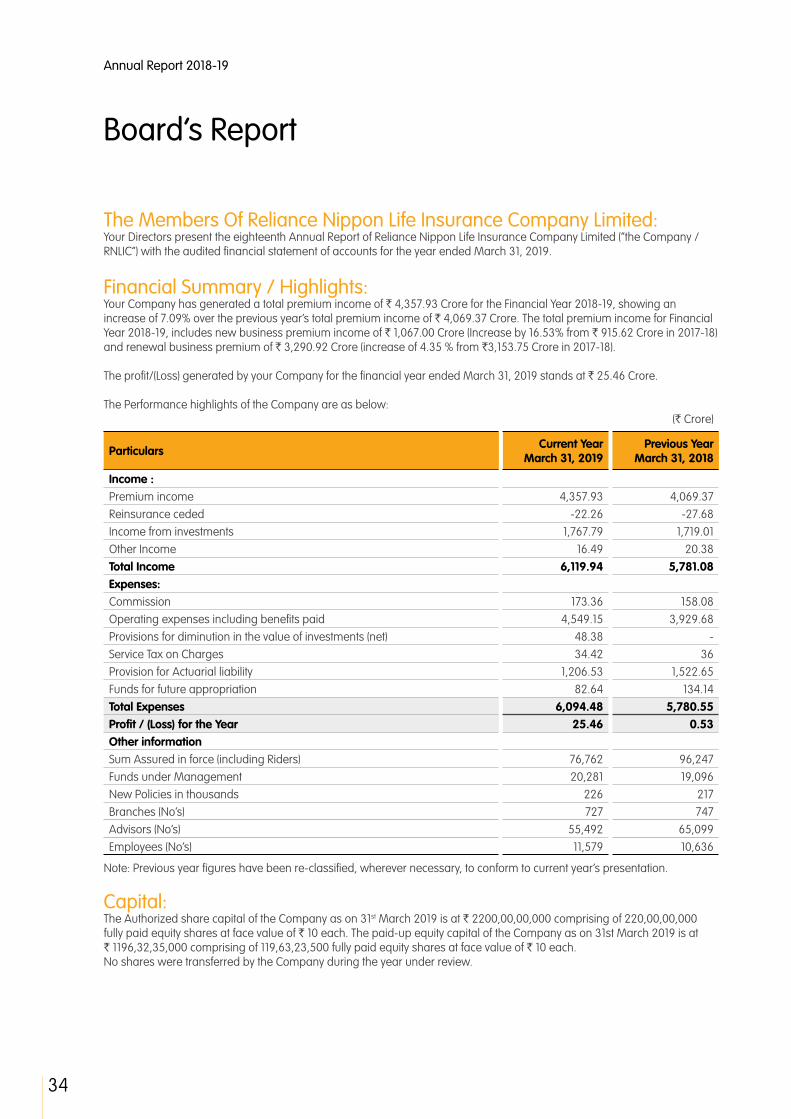
Financial Summary / Highlights: Your Company has generated a total premium income of ` 4,357.93 Crore for the Financial Year 2018-19, showing an increase of 7.09% over the previous year’s total premium income of ` 4,069.37 Crore. The total premium income for Financial Year 2018-19, includes new business premium income of ` 1,067.00 Crore (Increase by 16.53% from ` 915.62 Crore in 2017-18) and renewal business premium of ` 3,290.92 Crore (increase of 4.35 % from `3,153.75 Crore in 2017-18).
The profit/(Loss) generated by your Company for the financial year ended March 31, 2019 stands at ` 25.46 Crore.
The Performance highlights of the Company are as below: (` Crore)
Particulars Current Year March 31, 2019
Previous Year March 31, 2018
Income :Premium income 4,357.93 4,069.37Reinsurance ceded -22.26 -27.68Income from investments 1,767.79 1,719.01 Other Income 16.49 20.38Total Income 6,119.94 5,781.08Expenses: Commission 173.36 158.08Operating expenses including benefits paid 4,549.15 3,929.68Provisions for diminution in the value of investments (net) 48.38 - Service Tax on Charges 34.42 36Provision for Actuarial liability 1,206.53 1,522.65Funds for future appropriation 82.64 134.14Total Expenses 6,094.48 5,780.55Profit / (Loss) for the Year 25.46 0.53Other information Sum Assured in force (including Riders) 76,762 96,247Funds under Management 20,281 19,096New Policies in thousands 226 217Branches (No’s) 727 747Advisors (No’s) 55,492 65,099Employees (No’s) 11,579 10,636
Note: Previous year figures have been re-classified, wherever necessary, to conform to current year’s presentation.
Capital:The Authorized share capital of the Company as on 31st March 2019 is at ` 2200,00,00,000 comprising of 220,00,00,000 fully paid equity shares at face value of ` 10 each. The paid-up equity capital of the Company as on 31st March 2019 is at ` 1196,32,35,000 comprising of 119,63,23,500 fully paid equity shares at face value of ` 10 each.No shares were transferred by the Company during the year under review.
35
STRA
TEG
IC R
EPO
RT /
STA
TUTO
RY R
EPO
RTS
/ F
INA
NCI
ALS
STA
TEM
ENTS
Solvency:The Solvency margin of the Company as at 31st March 2019 is at 260% (previous year 266%) as against the Regulatory requirement of 150%”.
Particulars Of Loans, Guarantees Or Investments: The provisions of Section 186(4) of the Companies Act, 2013, requiring disclosure in the financial statements of the full particulars of the loans given, investment made or guarantee given or security provided and the purpose for which the loan or guarantee or security is proposed to be utilized, by the Company, are not applicable to an insurance company.
Investment Policy Of The Company:The Company has constituted an Investment Committee as mandated under IRDAI Corporate Guidelines. The Investment Committee manages funds as per the objectives laid down in the Investment Policy, Asset Liability Management Policy and respective Funds’ objectives, if any. The Policies are supported by robust internal control systems and in compliance with prudential regulatory norms on investments. The objectives stated in the policies are tracked on regular basis, in the meetings held during the year. The detailed description and procedure of Investment Committee is stated in the Corporate Governance Report appended.
Social & Rural Sector Obligation:The IRDAI (Obligations of Insurers to Rural and Social Sector) Regulations 2015 requires Insurers to fulfil the Rural and Social Sector obligation each year. Your Company has covered 7,77,576 lives (Financial Year 2019 - 19) in social sector against the target of 73,060 lives. Your Company has underwritten 2,25,871 policies in Rural Sector which is 22.10% of total policies.
Indian Accounting Standard (Ind-As):IRDAI through its circular no. IRDA/F&A/CIR/ACTS/146/ 06/2017 dated 28 June, 2017 deferred the implementation of Ind AS in the insurance sector in India for a period of two years. Accordingly, Ind AS for Indian insurance companies would be applicable from 1 April 2020. However, Company needs to submit the proforma Ind AS financial statements on a quarterly basis to the IRDAI.
The Company is in a process to evaluate system changes with regard to preparation of Ind-AS financial statements with effect from April 1, 2020 onwards.
Dividend:During the year under review, the Board of Directors have not recommended any dividend on equity shares of the Company.
Reserves:No amount is being transferred to free reserves during the Financial Year 2018-19.
Brief Description Of The Company’s Working During The Year / State Of Company’s Affair: Performance OverviewThe financial year 2018-19 has been the third year of Transformation journey for your Company. It has been a year of several milestones where Reliance Nippon Life Insurance (RNLIC) has grown at a rate faster than the private sector on Individual Weighted Risk Premium (RNLIC grew at 21% Vs private sector growth of 12%). In addition to this the Financial Year (FY) 19, has been a rewarding year on various parameters of the business:
• 13m persistency improved by 6% in third consecutive year and ended at 78%• Opex ratio remained steady at ~29% (29.2% in FY19 Vs 29.7% in FY18)• We reported profits in double digits at ` 25.46 Cr

Annual Report 2018-19
36
These performance trends are led by a strong planning and execution strategy, comprehensive focus across all key metric of business and leveraging of digital and technology as the key levers for driving efficiencies and outcomes.
a. The growth in Individual WRP has been led by improved performance across all distribution channels including the banks we acquired in the previous fiscal.
i. Our product mix has been balanced with ~70% traditional portfolio and there is an increase in average ticket size by 16% to ~` 40,500
b. 13m Persistency increased from 71.6% in FY18 to 77.6% as at end of FY19, with our several initiatives launched at sourcing stage over the last three years now showing positive impact. Given the sustained efforts on enhancing customer lifecycle journey, we expect continued uptick on the organization-wide quality journey.
c. Renewal premium rose to ` 3291 Cr, a YoY increase of 4% with a segmented focus and concerted efforts from distribution and operations. These efforts have helped grow the number of in-force policies that will aid in driving superior profitability and future cash-flows.
d. As a result, the Assets under Management increased to ` 20,281 Cr marking a +6% increase from previous fiscal.
2. Our focus is to keep delivering superior services to our customers – our claims settlement ratio as at end of FY19 is amongst the highest in the industry at 97.71%, and complaints ratio at 0.9% of Number of Policies. Our heavy digital focus continues with the second version of our flagship sales tool – Super Express and as a result the digital log-ins has increased from 53% in FY18 to 74% in FY19.
Concerted efforts to mitigate impact on the bottom-line As a prudent and cautious measure, your Company has also strengthened its reserves in some segments of the business to mitigate risks arising out of sharp reduction in interest rates. Your Company has also witnessed a decline in the older profit streams due to changes in product regulations and subsequent changes in product strategy and mix.
Your company is focused on harnessing operating efficiencies through productivity improvement, waste elimination, risk mitigation and digital enablement of processes to ensure lower cost of business acquisition, bring predictability of expenses and new business and build sustainability of operations.
With an all rounded effort in this direction your Company complied with the Expense of Management regulation for FY19
• Considering the low margins on ULIP products, your company has maintained the contribution of ULIPs within comfortable limits (29.7% in FY19)
• Further, due to the impact of expense overrun on participating policies and expecting regulatory guidance on this front, your Company proactively controlled the sale of participating products and reduced its contribution to 5.6%
• Your Company has also taken several cost optimization initiatives including eliminating non-productive set-up and digitizing processes; these measures have helped reduce the Opex Ratio (Opex + Commission/ WRF + Renewal) from 29.7% to 29.20%
These measures have helped your Company to run into profits of INR 25.46 Cr. The Company is focused on continuing its Transformation roadmap for further three years to ensure sustained profitability track.
Continued improvement in service levels Your Company’s endeavor to incessantly enhance customer experience is manifested through exponential improvement in the service delivery metrics:The claims settlement ratio continues to rank among the best in the industry at 97.71% in FY19. The early claims have shown a continuous declining trend from 32.6% in FY16, 26.2% in FY17, 19.6% in FY18 to 14% in FY19. Maturity claim settlement within 30 days from the Due Date or Last Document Received Date is at 100% - the best ever for the company.Your company continues to be steadfast on the quality journey. In FY19, the overall complaints received are 0.90% of the total policies sold and the mis-selling complaints are at a flat 0.51%.
Board’s Report contd...
37
STRA
TEG
IC R
EPO
RT /
STA
TUTO
RY R
EPO
RTS
/ F
INA
NCI
ALS
STA
TEM
ENTS
Key Initiatives Your Company undertook major transformation initiatives during the year 2018-19 with the objective of developing sustainable performance improvement across key business vectors. These transformation initiatives rest on the following pillars outlined below:
1. Sales Efficiency and Growth – Digitization was at the core of all our strategies, with customer centric tools for building sales efficiency:
• We launched the second and more advanced version of our an end to end digital issuance tool –Super Express: a mobile sales app that enhances sales performance through tracking sales activity, generating real time customer propositions and facilitating instant issuance.
• Our Digi-30 platform– an award winning mobile based on-the-go learning tool that delivers experiential learning through regimented and digitally monitored 30-minute learning capsules, continued to give us positive results with a 16% increase in average ticket size.
• New tools we experimented with include Income Planning tool which calculates potential income of a salesperson through phone book leverage and thus contributes to increased productivity and, Referral tool for warm lead generation and QR code for location based authentication.
In FY20, we will continue to evolve these tools and build sustainability around it. ‘Digitally enabled models’ and ‘Data’ will be key drivers for growth going forward.
2. Business quality – We continued our focus on business quality and enhanced our Pre-Issuance Risk Verification tool which is a Claims predictive modelling built at U/W stage. Also, through Super Express our digital authentication tool aided in lowering our risk significantly with customer declaration on selfie video. Our improved acquisition and servicing processes resulted in low complaints ratio at 0.9% of NoP, and claims settlement ratio being amongst the top in the industry.
3. Customer Retention - Customer centricity has been at the core across our diverse strategies we adopted this year. We made fundamental changes in FY17 including better customer data capture and management, which resulted in sharp rise in 13m persistency and continued impact in FY18, FY19. Our performance beyond of 13m persistency is showing gradual movement, as we channelize our efforts towards revival of customers. This year we will continue to drive towards regaining our customer relationships from old book through improvised engagement and specific segment target strategies. Also, with stringent controls built now at sourcing stage our renewal book going forward is expected to have much higher persistency. Some of the benefits of structural changes from FY18 to FY19 are - Dual contact: <10% to 60%; E-mail penetration: 70% to 80%; ECS attachment 50% to 69%
4. Margin movement: We focused on building a strong customer proposition in the year through continued promotion of protection riders. We also shifted our focus on longer term products which provide higher Sum Assured to customers and continued our segment focus on guaranteed returns as our target customer profiles prefer investment in less risky portfolios. We also launched protection and health products – Digit Term and Cancer Protection Plus with innovative features. This resulted in increase in average ticket size, and a sharp rise in margins and VoNB.
5. Process and controls: We operated with zero tolerances on non-compliance matters and as result managed our risks robustly.
Face to Face increasing foot print with all women employeesA unique distribution format In India - developed in close collaboration with Nippon Life. Number of branches in this channel has moved up from 110 in FY17 to 180 in FY19. The channel has achieved its VNB target along with reduction in LPO attrition, 16% growth in LPO productivity, achieving 10% Combo Sales and Face to Face 13th month persistency is at 83.2% of FY19.
Awards & AccoladesThe transformative and digital initiatives undertaken by your company received multiple (over 20 awards) accolades across various industry platforms. The transformation initiatives have been acknowledged at leading industry forums.

Annual Report 2018-19
38
1. We have been rated as one of Asia’s Greatest Brands in 2018 held in Singapore. This recognition stands in testimony to the efforts undertaken by the organization in enhancing customer life time value which also reflects in improved persistency and renewal collection across policy stages
2. We take our Risk Management Initiatives very seriously and hence have been adjudged as:
a. Best Risk Technology of the year for Proactive Risk Technology used for identifying and investigating frauds at both CRO Leadership Summit 2019 and Finnoviti 2019 of Banking Frontiers
b. Best Risk Team of the year at CRO Leadership Summit 2019
3. The company’s Digi-30 initiative has been acclaimed at multiple industry forums for innovative cross-pollination of behavioral knowledge and digital application in delivering unique learning experience to over 5,000 employees at over 720+ locations every day. This initiative has received numerous acclaims including:
a. Certificate of Excellence: Special Recognition for Digital Insurer of the Year at Emerging Asia Insurance Conclave and Awards 2018
b. Digital Insurance Initiative of the Year- India at Asian Banking and Finance Awards 2018
4. Further, in recognition of the sustained transformative initiatives implemented by the company, RNLIC was awarded the Life Insurance Company of the Year at –
a. ET Now BFSI Awards, 2019
b. India Insurance Summit & Awards, 2019
c. ABP News BFSI Awards 2019
5. The company was also adjudged the ‘Product Innovator of the Year’ for the innovative customer value proposition for its flagship Increasing Money Back plan and the Cancer Protection Plus Plan at:
a. SKOCH Order-of-Merit Awards 2018
b. Emerging Asia Insurance Conclave and Awards 2018
c. ET NOW BFSI Awards, 2019
We continue to be rated ‘AAAefs’ by Brickworks Rating, for the highest degree of ‘Enterprise-wide Risk management capabilities & financial strength’ to meet ongoing policyholder obligations.
Material Changes And Commitments Affecting Financial Position Of The Company:There were no material changes and commitments affecting the financial position of the Company.
Details Of Significant And Material Orders Passed By Regulators / Courts / Tribunals Impacting Going Concern Status And Company’s Operations In Future:There were no significant and material orders passed by any Regulator or Tribunal impacting the ‘Going Concern’ status and Company’s future operations, during the financial year 2018 - 19.
Details Of Subsidiary Companies:Your Company does not have any subsidiary.
Board’s Report contd...

39
STRA
TEG
IC R
EPO
RT /
STA
TUTO
RY R
EPO
RTS
/ F
INA
NCI
ALS
STA
TEM
ENTS
Deposits:During the year under review, the Company has not accepted any deposits under Section 73 of the Companies Act, 2013.
Auditors And Auditor’s Report:M/s Pathak H.D. & Associates, Chartered Accountants, (ICAI Registration No. 107783W) and M/s Singhi & Co., Chartered Accountants, (ICAI Registration No. 302049E) were appointed as the joint statutory auditors of the Company, for a term of 5 years.
M/s Singhi & Co., Chartered Accountants, (ICAI Registration No. 302049E) was appointed as the Joint Statutory Auditor of the Company, in the 15th Annual General Meeting (AGM) held on June 2, 2016, to hold office from the conclusion of the 15th AGM till the conclusion of the 19th AGM.
M/s Pathak H.D. & Associates, Chartered Accountants, (ICAI Registration No. 107783W) were appointed as the Joint Statutory Auditor in the 14th AGM of the Company, held on May 21, 2015, to hold office from the conclusion of the 14th AGM till the conclusion of the 18th AGM. The firm has completed their tenure of five years at the first instance and accordingly, it is proposed to re-appoint M/s Pathak H.D. & Associates, as the Joint Statutory Auditor of the Company, for another term of five years. The proposal to re-appoint M/s Pathak H.D. & Associates, Chartered Accountants, will be presented for approval of the Shareholders in the ensuing AGM of the Company, in terms of section 139 of The Companies Act 2013.
The Joint Statutory Auditors, being M/s Pathak H.D. & Associates and M/s Singhi & Associates, Chartered Accountants, have confirmed their eligibility for the proposed term, respectively. The Resolution seeking the appointment of M/s Pathak H.D. & Associates, Chartered Accountants, (ICAI Registration No. 107783W) is included in the Notice of the ensuing AGM. Your Directors recommend the re-appointment of M/s Pathak H.D. & Associates, Chartered Accountants, (ICAI Registration No. 107783W), as the Joint Statutory Auditors of the Company, for another term of five years.
The observations and comments given by the Auditors in their report read together with notes on financial statements are self – explanatory and hence do not call for any further comments under Section 134 of The Companies Act, 2013. There were no qualifications, reservation or adverse remarks made by the Joint Statutory Auditors in their Audit Report. The Joint Statutory Auditors have not come across any instance of fraud that could be reported to the Audit Committee or the Board.
Maintenance Of Cost Records:The Central Government has not specified maintenance of cost records for any of the products of the Company, under Section 148(1) of the Companies Act, 2013 and rules made thereunder.
Compliance With Secretarial Standards :During the year under review, the Company has been in compliance with the applicable Secretarial Standards issued by the Institute of Company Secretaries of India for the financial year 2019.
Extract Of The Annual ReturnIn accordance with Section 134(3)(a) of The Companies Act, 2013, an extract of the annual return is available on the website of the Company at https://www.reliancenipponlife.com/downloads
Please refer Annexure D.
Conservation Of Energy, Technology Absorption And Foreign Exchange Earnings And Outgo:Please refer Annexure C

Annual Report 2018-19
40
Corporate Social Responsibility (Csr):The Company has constituted Corporate Social Responsibility Committee in compliance with the provisions of Section 135 of the Companies Act, 2013 read with the Companies (Corporate Social Responsibility Policy) Rules, 2014. The Corporate Social Responsibility Committee has formulated a Corporate Social Responsibility Policy (CSR policy) indicating the activities to be undertaken by the Company.
CSR Committee presently consists of the following Directors of the Company, as its members:1. Shri. Gautam Doshi
2. Shri. Rajendra Chitale
3. Ms. Renu Challu
4. Prof. Indira Parikh
5. Shri. Amit Bapna
6. Shri. Minoru Kimura
7. Shri. Koji Ichiba
8. Shri. Ashish Vohra
Please refer Annexure A for details on CSR of the Company.
Compliance With Provisions Of Sexual Harassment Of Women At Work-place (Prevention, Prohibition And Redressal) Act, 2013The Company is committed to uphold and maintain the dignity of woman employees and it has in place a policy which provides for protection against sexual harassment of women at work place and for prevention and Redressal of such complaints. The Company has also constituted an Internal Complaints Committee under the Sexual Harassment of Women at Workplace (Prevention, Prohibition and Redressal) Act, 2013
During the financial year 2018 - 19, the Company received 12 complaints, out of which 7 were closed and 5 are pending.
Details Of Appointment / Resignation Of Directors And Key Managerial Personnel During The Year :Directors:The Board of Directors in its meeting held on March 12, 2019, appointed Shri. S.B. Nayar as an Independent Director with effect from April 24, 2019. The Board of Directors also approved the appointment of Shri. Nayar as the Chairman on the Board of the Company.
All Independent Directors have given declarations that they meet the criteria of independence as laid down under Section 149(6) of the Companies Act, 2013.
Shri. Ashok Chawla ceased to be an Independent Director and Chairman, with effect from September 18, 2018. Gen. Ved Prakash Malik resigned as an Independent Director of the Board, with effect from July 5, 2018.In terms of the provisions of The Companies Act, 2013, Shri. Ashish Vohra, Executive Director & Chief Executive Officer retires by rotation and being eligible, offers himself for re-appointment at the ensuing Annual General Meeting of the Company.
Key Managerial PersonnelDuring the year under review, there was no change in the ‘Key Managerial Personnel’ of the Company.
Evaluation of Directors, Board and CommitteesThe Company has devised a policy for performance evaluation of the individual directors, Board and its Committees, which includes criteria for performance evaluation.
Pursuant to the provisions of the Companies Act, 2013, the Board has carried out an annual performance evaluation of its own performance, the directors individually as well as the evaluation of the working of the Committees of the Board. The Board performance was evaluated based on inputs received from all the Directors after considering criteria such as Board
Board’s Report contd...
41
STRA
TEG
IC R
EPO
RT /
STA
TUTO
RY R
EPO
RTS
/ F
INA
NCI
ALS
STA
TEM
ENTS
composition and structure, effectiveness of Board / committee’s processes and information provided to the Board etc. A separate meeting of the Independent Directors was also held during the year, for the evaluation of the performance of Non – independent Directors and performance of the Board as a whole.
The Nomination and Remuneration Committee has also reviewed the performance of the individual directors based on their knowledge, level of preparation and effective participation in meetings, understanding of their roles as directors etc.
Number of meetings of the Board of Directors:During the year, five Board Meetings were convened and held, the details of which are covered in the Corporate Governance Report. The intervening gap between the Meetings was within the period prescribed under The Companies Act,2013.
Board Audit & Compliance Committee:The Board Audit and Compliance Committee of the Company comprises three Independent Directors and two Non - executive Directors, the composition of the same is covered under the Corporate Governance Report.During the year under review, recommendations, if any, made by the Board Audit and Compliance Committee were duly followed / implemented within the Company.
The Board Nomination and Remuneration Committee:The Company has a Nomination and Remuneration Committee which determines on behalf of the Board and the Shareholders, the Company’s Remuneration policy. The Composition of Nomination and Remuneration Committee are in compliance with the provisions of Section 178 of the Companies Act, 2013 and other applicable laws. The Remuneration Policy shall determine remuneration of Directors, Key Managerial Personnel (KMP) and other Employees on and the compensation payable to the Executive Director & Chief Executive Officer (CEO) of the Company, subject to IRDAI approval under Section 34(A)(1) of the Insurance Act, 1938.The salient feature of the said policy:
1. To follow the process for selection and appointment of new directors and succession plans;
2. To recommend to the Board from time to time, a compensation structure for Directors and their senior management personnel, subject to the approval for IRDAI;
3. To identify persons who are qualified to be appointed as directors and who may be appointed in senior management in accordance with the criteria laid down and to recommend their appoint and /or removal to the Board;
4. To formulate the criteria for evaluation of performance of Independent Directors, the Board and the Committee’s thereof;
5. To assess whether to extend or continue the term of appointment of the Independent Directors, on the basis of the report of performance evaluation of Independent Directors;
6. To carry out evaluation of every Director’s performance;
7. To perform functions relating to all share based employees benefits; and
8. To formulate the criteria for determining qualifications, positive attributes and independence of a director and recommend to the Board of Directors a policy, relating to the remuneration for the directors, key managerial personnel and other employees.
The Remuneration Policy is available on the website of the Company at https://www.reliancenipponlife.com/downloads
Particulars Of Contracts Or Arrangements With Related Parties: All contracts / arrangements / transactions entered into / by the Company during the financial year under review with related parties were on arm’s length basis and in ordinary course of business. There were no materially significant related party transactions made by the Company with Promoters, Directors, Key Managerial Personnel or other designated persons, which may have a potential conflict with the interest of the Company at large.

Annual Report 2018-19
42
Secretarial Audit ReportPursuant to the provisions of Section 204 of the Act and the Companies (Appointment and Remuneration of Managerial Personnel) Rules, 2014, the Board of Directors had appointed Aashish K. Bhatt & Associates, Practicing Company Secretaries, to undertake the Secretarial Audit of the Company. There is no qualification, reservation or adverse remark made in the Audit Report of the Secretarial Auditors. The Audit Report of the Secretarial Auditor is attached as Annexure B - Form No. MR-3.
Risk Management Policy:The Company has undertaken many initiatives towards the implementation of a robust Enterprise Wide Risk Management (EWRM).
The Management’s commitment for effective ERM initiatives is clearly visible from the independent organizational structure set up by the Company for this purpose. The Company has formed a Control Committee that consists of executive council members and heads of business and operations functions like Actuary, Human Resources, Finance, Risk Management etc. This Committee also includes the Chief Executive Officer and meets on monthly basis to monitor and review risk management processes, compliance and audit related issues, etc. Issues are therefore, identified and resolved at the initial stage itself. Similarly, Risk Management Practices are also reviewed quarterly with Board Level Committees.
The Company has effectively addressed burgeoning challenges to mitigate risks proactively. This is done in addition to the traditional reactive services – like Risk Reviews and audits. Through the implementation and effective use of technology, the Company seeks to proactively manage risk to set the ground for a more comprehensive Enterprise Wide Risk Management System. This has been done by developing analytical approaches, methods and models that identify trends, risks or potential regulatory violations. The Company has automated key processes across Compliance, Audit & Risk for integrated assessment and effective monitoring. The Company has implemented Fraud Framework, Risk Control Self-Assessment, Risk Reviews, Risk Scoring Models and Proactive risk management framework, Conducting Preand Post-issuance risk verification (PIRV) based on a risk matrix etc. This will help us minimize the levels of unidentified risks. RNLIC has automated the following modules in Risk & Audit as part of Governance, Risk & Audit and Compliance tool (GRC) tool, which will help in workflow and repository of key risk and audit processes. Some of the modules in this tool are Risk control self-assessment (RCSA), risk reviews, Risk register etc and for audit, audit planning to completion and follow up tracker to track implementation of the action plans.
The Company has also implemented analytical models for proactive risk alerts and triggers. For detecting fraudulent claims, a Predictive Analytical Model in SAS has been built. This model has been built at the auto-underwriting pre-issuance stage to help identify the cases that may turn out to be of fraudulent nature and thereby helping the company to identify the adverse / suspicious lives to ensure enhanced due diligence before the life is insured, as a preventive vigilance measure.
The Company monitors Business Risk, Market Risk, Credit Risk, Information Technology Risk, Insurance Risk and Operational Risk at an Organization level through a robust risk identification mechanism, risk analysis and risk mitigation measures represented in the form of Dashboards and Risk Reports. The Company is developing its experience to enable transition to the next level of maturity and embed risk management as a part of the Business strategy, Functional risk management and Performance measurement.
The Executive Control Committee alongside the Zonal Control Committee, Ethics & Disciplinary Committee forms the Governance Risk and Compliance (GRC) framework of the Company and continued to address Legal & Regulatory Compliance, Risk Management and Audit issues through effective risk mitigating action plans. EWRM encompasses IT security and IT risk management inter alia.
The Company has achieved Certification of integration of 2 standards – for Business Continuity Management System (BCMS), ISO 22301:2012 and for Information Security Management System (ISMS), ISO 27001:2005 Certification. For the Financial Year 2017-18, the third annual surveillance audit was due in April 2018 and RNLIC successfully achieved re-certification for both the ISO standards for BCMS and ISMS.
RNLIC has aligned the Enterprise wide risk management (EWRM) framework to ISO 31000:2018 standard and is on the journey to align its ERM practices to international standards.
Board’s Report contd...

43
STRA
TEG
IC R
EPO
RT /
STA
TUTO
RY R
EPO
RTS
/ F
INA
NCI
ALS
STA
TEM
ENTS
Certification and Awards• The Company Retained the rating of AAAefs from Brickworks for Enterprise Risk Management (ERM) and Financial
Strength
• The Company has integrated and re-certified for ISO 27001 and ISO 22301 for ISMS and BCMS.
• The company won many awards for Risk management for areas such as Best Risk Technology, Best CRO, Best Risk manager, Best Risk Rising Star, Best Risk Team and also Best Risk Innovation from various forums across industry.
Directors’ Responsibility Statement:Pursuant to Section 134(5) of the Companies Act, 2013, with respect to Directors’ Responsibility Statement, it is hereby confirmed that:
a) In the preparation of the annual financial statements for the year ended March 31, 2019, the applicable Accounting Standards had been followed along with proper explanation relating to material departures, if any;
b) The Directors had selected such accounting policies and applied them consistently and made judgments and estimates that are reasonable and prudent so as to give a true and fair view of the state of affairs of the Company as at March 31, 2019 and of the loss of the Company for the year ended on that date;
c) The Directors had taken proper and sufficient care for the maintenance of adequate accounting records in accordance with the provisions of The Companies Act, 2013 for safeguarding the assets of the Company and for preventing and detecting fraud and other irregularities;
d) The Directors had prepared the annual financial statements for the financial year ended March 31, 2019 on a ‘going concern’ basis;
e) The Directors had laid down proper internal financial controls to be followed by the Company and such financial controls are adequate and are operating effectively; and
f) The Directors had devised proper systems to ensure compliance with the provisions of all applicable laws and that such systems are adequate and operating effectively.
Internal Financial Controls And Their Adequacy:The Company has in place internal controls over financial reporting review mechanism. The internal control over financial reporting framework is intended to increase transparency and accountability in an organization’s processes of designing and implementing a system of internal control over financial reporting. The Company has successfully laid down the framework and ensured its effectiveness. The Company has laid down policies and procedures to guide the business operations. The same is subject to review periodically by the internal audit team for its effectiveness. During the year, such controls were tested and no material reportable weaknesses in the design or operation were observed.
AcknowledgementsYour Directors would like to express their sincere appreciation for the co-operation and assistance received from shareholders, bankers, financial institutions, regulatory bodies and other business constituents during the year under review. Your Directors also wish to place on record their deep sense of appreciation for the commitment displayed by all executives, officers and staffs, resulting in the successful performance of the Company during the year.
For and on behalf of the Board of Directors
Place: Mumbai S.B. NayarDate: April 24, 2019 Independent Director & Chairman DIN: 02175871

Annual Report 2018-19
44
Annexure A
Annual Report On Csr Activities To Be Included In The Board’s Report1) A brief outline of the Company’s CSR policy, including overview of projects or programmes proposed to be
undertaken and a reference to the web-link to the CSR policy and projects or programmes As part of its initiatives under “Corporate Social Responsibility (CSR), the Company has undertaken projects in the
areas of Education and Health Care. These projects are largely in accordance with Schedule VII of the Companies Act, 2013.
2) The Composition of the CSR Committee.
1) Ms. Renu Challu
2) Shri. Rajendra Chitale
3) Prof. Indira Parikh
4) Shri. Gautam Doshi
5) Shri. Koji Ichiba
6) Shri. Minoru Kimura
7) Shri. Amit Bapna
8) Shri. Ashish Vohra
Average net profit of the company for last three financial years: The Company had been incurring losses during the preceding three financial years.
3) Prescribed CSR Expenditure: NIL
4) Details of CSR spent during the financial year:
(a) Total amount spent for the financial year: NIL
(b) Amount unspent if any: NA
(c) Manner in which the amount spent during the financial year is detailed below:

45
STRA
TEG
IC R
EPO
RT /
STA
TUTO
RY R
EPO
RTS
/ F
INA
NCI
ALS
STA
TEM
ENTS
(c)
Man
ner i
n w
hich
the
amou
nt s
pent
dur
ing
the
finan
cial
yea
r is
deta
iled
belo
w:
(Am
ount
in `
)
1.2.
3.4.
5.6.
7.8.
S.N
o.CS
R Pr
ojec
t or
Act
ivity
Iden
tified
Sect
or in
whi
ch th
e pr
ojec
t is
cove
red
Proj
ects
or
Prog
ram
s:
(1) L
ocal
are
a or
ot
hers
(2) S
peci
fy S
tate
/
Dis
tric
t whe
re
proj
ect /
pr
ogra
m w
as
unde
rtak
en
Am
ount
Out
lay
(Bud
get P
rogr
am o
r Pr
ojec
t wis
e)
Am
ount
spe
nt
on th
e pr
ojec
t /
prog
ram
Sub-
head
s:D
irect
exp
endi
ture
on
pro
ject
/
prog
ram
Ove
rhea
ds
Cum
ulat
ive
expe
nditu
re u
pto
the
repo
rtin
g pe
riod
Am
ount
spe
nt:
Dire
ct o
r thr
ough
im
plem
entin
g ag
ency
NA
5)
In c
ase
the
com
pany
has
faile
d to
spe
nd th
e tw
o pe
r cen
t of t
he a
vera
ge o
f net
pro
fit o
f the
last
thre
e fin
anci
al y
ears
or a
ny p
art t
here
of, t
he c
ompa
ny s
hall
prov
ide
the
reas
ons
for n
ot s
pend
ing
the
amou
nt in
its
Boar
d re
port
: N
A.
6)
A re
spon
sibi
lity
stat
emen
t of t
he C
SR C
omm
ittee
that
the
impl
emen
tatio
n an
d m
onito
ring
of C
SR P
olic
y, is
in c
ompl
ianc
e w
ith C
SR o
bjec
tives
and
pol
icy
of th
e Co
mpa
ny: T
he
impl
emen
tatio
n an
d m
onito
ring
of C
orpo
rate
Soc
ial R
espo
nsib
ility
(CSR
) Pol
icy
is in
com
plia
nce
with
CSR
obj
ectiv
es a
nd p
olic
y of
the
Com
pany
.
S/d-
S/d-
Dire
ctor
/CEO
(C
hairm
an, C
SR C
omm
ittee
)
Annual Report 2018-19
46
Annexure B
Form MR-3SECRETARIAL AUDIT REPORT
FOR THE FINANCIAL YEAR ENDED 31ST MARCH, 2019[Pursuant to section 204(1) of The Companies Act, 2013 and rule No. 9 of the Companies
(Appointment and Remuneration of Managerial Personnel) Rules, 2014]
To,The Members,Reliance Nippon Life Insurance Company Limited
I have conducted the secretarial audit of the compliance of applicable statutory provisions and the adherence to good corporate governance practice by Reliance Nippon Life Insurance Company Limited (hereinafter called “the Company”). Secretarial Audit was conducted in a manner that provided me a reasonable basis for evaluating the corporate conducts / statutory compliances and expressing my opinion thereon.
Based on my verification of the Company’s books, papers, minutes books, forms and returns filed and other records maintained by the Company and also the information provided by the Company, its officers, agents and authorized representatives during the conduct of secretarial audit, I hereby report that in my opinion, the Company has, during the financial year ended 31st March, 2019, complied with the statutory provisions listed hereunder and also that the Company has proper Board processes and compliance mechanism in place to the extent, in the manner and subject to the reporting made hereinafter:
1. I have examined the books, papers, minute books, forms and returns filed and other records maintained by the Company, for the financial year ended on 31st March, 2019, according to the provisions of:
i. The Companies Act, 2013 (the Act) and the rules made thereunder; ii. The Securities Contracts (Regulation) Act, 1956 (‘SCRA’) and the rules made thereunder - Not Applicable;
iii. The Depositories Act, 1996 and the Regulations and Bye-laws framed thereunder – Not Applicable;
iv. Foreign Exchange Management Act, 1999 and the rules and regulations made thereunder to the extent of Foreign Direct Investment. Overseas Direct Investment and External Commercial Borrowings are not applicable;
v. The following regulations and guidelines prescribed under the Securities and Exchange Board of India Act, 1992 (‘SEBI Act’) are not applicable:-
a) The Securities and Exchange Board of India (Substantial Acquisition of Shares and Takeovers) Regulations, 2011;
b) The Securities and Exchange Board of India (Prohibition of Insider Trading) Regulations, 2015;
c) The Securities and Exchange Board of India (Issue of Capital and Disclosure Requirements) Regulations, 2009;
d) The Securities and Exchange Board of India (Share Based Employee Benefits) Regulations, 2014;
e) The Securities and Exchange Board of India (Issue and Listing of Debt Securities) Regulations, 2008;
f) The Securities and Exchange Board of India (Registrars to an Issue and Share Transfer Agents) Regulations, 1993, regarding the Companies Act and dealing with client;
g) The Securities and Exchange Board of India (Delisting of Equity Shares) Regulations, 2009;
h) The Securities and Exchange Board of India (Buyback of Securities) Regulations, 1998;

47
STRA
TEG
IC R
EPO
RT /
STA
TUTO
RY R
EPO
RTS
/ F
INA
NCI
ALS
STA
TEM
ENTS
vi. Further I report that, based on the compliance mechanism established by the Company, which has been verified on test checked basis and the Compliance Report submitted to and taken on record by the Board of Directors of the Company, we are of the opinion that the Company has complied with the provisions of the Insurance Act, 1938, the Insurance Laws (Amendment) Act, 2015 and regulations, guidelines and directions issued by IRDAI.
I have examined compliances with applicable clauses of:
i. Secretarial Standards issued by the Institute of the Company Secretaries of India,
ii. Listing Agreement – Not Applicable
During the financial year under report, the Company has complied with the provisions of the Act, Rules, Regulations, Guidelines, Standards, etc. mentioned above and has only made reference of Nomination and Remuneration Policy in Board Report.
I further report that:
The Board of Directors of the Company is duly constituted with proper balance of Executive Directors, Non-Executive Directors and Independent Directors. The changes in the composition of the Board of Directors that took place during the year under review were carried out in compliance with the provisions of the Act.
Adequate notice, agenda and detailed notes have been given to all Directors to schedule the Board Meetings at least seven days in advance and on shorter notice and a system exists for seeking and obtaining further information and clarifications on the agenda items before the meeting and for meaningful participation at the meeting.
The decisions at Board Meetings and Committee Meetings are carried out and recorded in the minutes of the Board of Directors and Committee of the Board accordingly.
I have relied on the representation made by the Company and its Officers for adequate systems and processes in the company commensurate with its size & operation to monitor and ensure compliance with applicable laws.
I further report that during the year under report, the Company has undertaken event / action having a major bearing on the Company’s affairs in pursuance of the above referred laws, rules, regulations, guidelines, standards, etc. referred to above viz.
(i) Appointment and Resignation of Directors;
(ii) Reconstitution of Board and its committees;
(iii) Revision in remuneration of Mr. Ashish Vohra, Executive Director & Chief Executive Officer of the Company;
(iv) Appointment and Resignation of Key Managerial Personnels;
(v) Payment of penalty to IRDA;
(vi) Application for legal entity identifier;
(vii) Appointment of Karvy Fintech Private Limited as Register and Share Transfer Agent;
For Aashish K. Bhatt & Associates Company Secretaries
(ICSI Unique Code S2008MH100200)
Sd/- Aashish BhattPlace: Mumbai ProprietorDate: April 24, 2019 ACS No.: 19639, COP No.: 7023

Annual Report 2018-19
48
Annexure C
Annexure C - Conservation of energy, technology absorption and foreign exchange earnings and outgo:
Conservation of energy:
Particulars Management’s Response
1. Steps taken / impact on conservation of energy:We are using LED light in relocating existing branch or upgrading infrastructure of existing branch premise or replacement of lights for conservation of energy.
2. Steps taken by the Company for utilizing alternate sources of energy
We have implemented services of M/s Vigyan Lab for desktop / laptop power saving. Company is saving 60 MWh pm.
3. Taken Various steps at RCS for Energy Taken Various steps at Reliance Centre Santacruz office for Energy saving
a) Optimization of AC Chillers usage
b) Air curtains installed at the required spots
c) Movement Sensors for lights, TVs etc.
4. Green Initiatives Taken Various steps at Reliance Centre Santacruz office for Green Initiatives
a) Water bottles changed to Metal & avoid plastics to the possible extent.
b) Garbage bag eliminated and used only bio degradable
c) DG Hazardous waste handling and recycling
d) Reduction of Paper and Consumables through reduction in printers
e) Wet waste recycling and conversion into manure
f) Recycling of Plant dry leaves
g) Recycled water for Plants and Flushing
5. Capital investment on energy conservation equipmentsa) Exploring Aircon Saver for ACs
b) Exploring IOT device to reduce abuse.
Technology absorption:
Particulars Management’s Response
Super Express 2.0: Express Login has made the lead generation process simpler and faster by reducing the number of steps required to login business.
Insta Info helps share key information like Deaths, Customers, Claims Settled, Branch presence, etc with Prospects based on their location which assist better conversation with prospects.
Income Planning Tool: Helps prospect agent assess income potential based on the Life Events, Income Band, Lifestyle, etc of contacts.
WhatsApp for Business: We have enabled WhatsApp for Business as a mode of communication with Customers. This helps digitally deliver policies to customers.
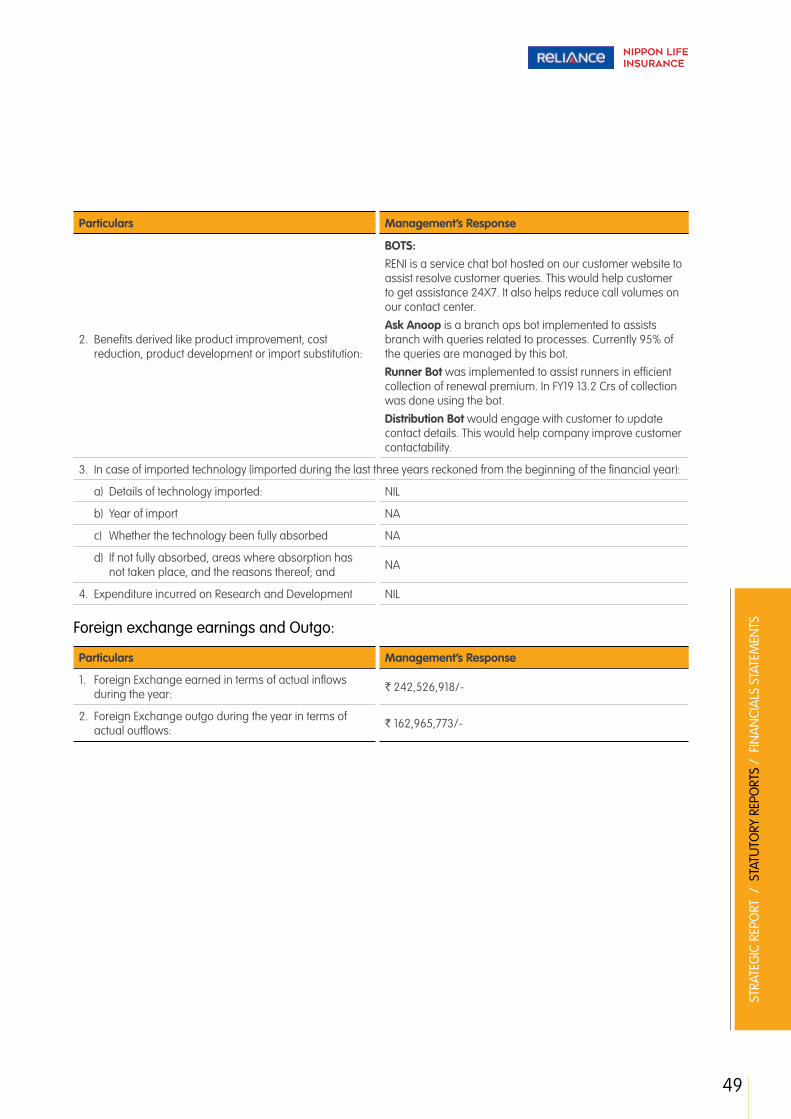
49
STRA
TEG
IC R
EPO
RT /
STA
TUTO
RY R
EPO
RTS
/ F
INA
NCI
ALS
STA
TEM
ENTS
Particulars Management’s Response
2. Benefits derived like product improvement, cost reduction, product development or import substitution:
BOTS: RENI is a service chat bot hosted on our customer website to assist resolve customer queries. This would help customer to get assistance 24X7. It also helps reduce call volumes on our contact center.
Ask Anoop is a branch ops bot implemented to assists branch with queries related to processes. Currently 95% of the queries are managed by this bot.
Runner Bot was implemented to assist runners in efficient collection of renewal premium. In FY19 13.2 Crs of collection was done using the bot.
Distribution Bot would engage with customer to update contact details. This would help company improve customer contactability.
3. In case of imported technology (imported during the last three years reckoned from the beginning of the financial year):
a) Details of technology imported: NIL
b) Year of import NA
c) Whether the technology been fully absorbed NA
d) If not fully absorbed, areas where absorption has not taken place, and the reasons thereof; and NA
4. Expenditure incurred on Research and Development NIL
Foreign exchange earnings and Outgo:
Particulars Management’s Response
1. Foreign Exchange earned in terms of actual inflows during the year: ` 242,526,918/-
2. Foreign Exchange outgo during the year in terms of actual outflows: ` 162,965,773/-

Annual Report 2018-19
50
Annexure D
Form No. MGT-9ANNUAL RETURN
as on the financial year ended on March 31, 2019[Pursuant to section 92(3) of the Companies Act, 2013, and Rule 12(1) of the Companies (Management and
Administration) Rules, 2014]
I. Registration and Other Details:1. CIN U66010MH2001PLC167089
2. Registration Date May 14, 2001
3. Name of the Company Reliance Nippon Life Insurance Company Limited
4. Category / Sub-Category of the Company Public Company Limited by sharesIndian Non-Government Company
5. Address of the Registered office and contact details ‘H’ Block, 1st Floor, Dhirubhai Ambani Knowledge City, Kopar Khairne, Navi Mumbai - 400710, Maharashtra, IndiaTel: +91 22 3303 5280Fax: +91 22 3303 5662
6. Whether listed company Yes / No No
7. Name, Address and Contact details of Registrar and Transfer Agent, if any
Karvy Fintech Private LimitedKarvy Selenium Tower B, Plot Nos. 31 & 32 | Financial DistrictNanakramguda |Serilingampally Mandal | Hyderabad - 500032 Contact Details: +91 40 6716 1751
8. Financial year from and to date 1st April, 2018 to 31st March, 2019
II. PRINCIPAL BUSINESS ACTIVITIES OF THE COMPANY All the business activities contributing 10% or more of the total turnover of the Company shall be stated:
Sl. No.
Name and Description of main products / services
NIC Code of the Product / service
% to total turnover of the company
1. Life Insurance 65 100%
III. PARTICULARS OF HOLDING, SUBSIDIARY AND ASSOCIATE COMPANIES: Sl. No.
Name of the Company Corporate Identification Number (CIN)
% of shares Type (Holding/ Subsidiary/ Associates
Section
1. Reliance Capital Limited L65910MH1986PLC165645 51% Holding 2 (46)

51
STRA
TEG
IC R
EPO
RT /
STA
TUTO
RY R
EPO
RTS
/ F
INA
NCI
ALS
STA
TEM
ENTS
IV.
SHA
RE H
OLD
ING
PAT
TERN
(Equ
ity S
hare
Cap
ital B
reak
up a
s pe
rcen
tage
of T
otal
Equ
ity):
i. Ca
tego
ry-w
ise
Shar
e H
oldi
ng:
Cate
gory
of S
hare
hold
ers
No.
of S
hare
s he
ld a
t the
beg
inni
ng o
f the
yea
r (A
pril
1, 2
018)
No.
of S
hare
s he
ld a
t the
end
of t
he y
ear
(Mar
ch 3
1, 2
019)
% C
hang
e du
ring
the
year
Dem
atPh
ysic
alTo
tal
% o
f Tot
al
Shar
esD
emat
Phys
ical
Tota
l%
of T
otal
Sh
ares
A.
Prom
oter
s
1. In
dian
a)
Indi
vidu
al /
HU
F5
-5
005
5-
00-
b)
Cent
ral G
ovt.
NIL
c)
Stat
e G
ovt(s
)N
IL
d)
Bodi
es C
orp.
61,0
1,24,
980
-61
,01,2
4,98
051
.00
61,0
1,24,
980
-61
,01,2
4,98
051
.00
-
e)
Bank
s /
FI-
--
--
--
--
f) A
ny o
ther
--
--
--
--
-
Sub
Tota
l (A
)(1):
61,0
1,24
,985
61,0
1,24
,985
51.0
061
,01,
24,9
8561
,01,
24,9
8551
.00
-
2.
Fore
ign
a)
NRI
s-In
divi
dual
s-
--
--
--
--
b)
Oth
er In
divi
dual
s-
--
--
--
--
c)
Bodi
es C
orp.
58,6
1,98,
515
-58
,61,9
8,51
549
.00
58,6
1,98,
515
-58
,61,9
8,51
549
.00
-
d)
Bank
s /
FI-
--
--
--
--
e)
Any
Oth
er-
--
--
--
--
Sub
Tota
l (A
)(2):
58,6
1,98
,515
-58
,61,
98,5
1549
.00
58,6
1,98
,515
-58
,61,
98,5
1549
.00
-
Tota
l Sha
reho
ldin
g of
Pr
omot
er (A
) = (A
)(1) +
(A)(2
)1,
19,6
3,23
,500
-1,
19,6
3,23
,500
100.
001,
19,6
3,23
,500
-1,
19,6
3,23
,500
100.
00-

Annual Report 2018-19
52
B.
Publ
ic S
hare
hold
ing
Cate
gory
of S
hare
hold
ers
No.
of S
hare
s he
ld a
t the
beg
inni
ng o
f the
yea
r (A
pril
1, 2
018)
No.
of S
hare
s he
ld a
t the
end
of t
he y
ear
(Mar
ch 3
1, 2
019)
%
Chan
ge
durin
g th
e ye
arD
emat
Phys
ical
Tota
l%
of T
otal
Sh
ares
Dem
atPh
ysic
alTo
tal
% o
f Tot
al
Shar
es1.
In
stitu
tions
a)
Mut
ual F
unds
b)
Bank
s /
FI-
--
--
--
--
c)
Cent
ral G
ovt
--
--
--
--
-
d)
Stat
e G
ovt(s
)-
--
--
--
--
e)
Vent
ure
Capi
tal F
unds
--
--
--
--
-
f) FI
Is-
--
--
--
--
g)
Fore
ign
Vent
ure
Capi
tal
Fund
s-
--
--
--
--
h)
Oth
ers
(spe
cify
)-
--
--
--
--
Sub
Tota
l (B)
(1):
Nil
Nil
Nil
Nil
Nil
Nil
Nil
Nil
Nil
2.
Non
-inst
itutio
nsa)
Bo
dies
cor
p.-
--
--
--
--
Indi
an-
--
--
--
--
Ove
rsea
s-
--
--
--
--
b)
Indi
vidu
als
--
--
--
--
-
Indi
vidua
l Sha
reho
lder
s ho
ldin
g no
min
al s
hare
ca
pita
l upt
o `
1 Lak
h
--
--
--
--
-
Indi
vidu
al s
hare
hold
ers
hold
ing
nom
inal
sha
re
capi
tal i
n ex
cess
of `
1 la
kh
--
--
--
--
-
c)
Oth
ers
(spe
cify
)-
--
--
--
--
Sub
Tota
l (B)
(2):
--
--
--
--
-
Tota
l Pub
lic S
hare
hold
ing
(B) =
(B)
(1) +
(B)(2
)-
--
--
--
--
C.
Shar
es h
eld
by C
usto
dian
for
GD
Rs &
AD
Rs
Gra
nd T
otal
(A)+
(B)+
(C)
1,19
,63,
23,5
00-
1,19
,63,
23,5
0010
0.00
1,19
,63,
23,5
00-
1,19
,63,
23,5
0010
0.00
-

53
STRA
TEG
IC R
EPO
RT /
STA
TUTO
RY R
EPO
RTS
/ F
INA
NCI
ALS
STA
TEM
ENTS
ii.
Shar
ehol
ding
of P
rom
oter
s
Sl.
No.
Shar
ehol
der’s
Nam
e
Shar
ehol
ding
at t
he b
egin
ning
of t
he y
ear
(Apr
il 1,
201
8)Sh
are
hold
ing
at th
e en
d of
the
year
(Mar
ch 3
1, 2
019)
% c
hang
e in
sh
are
hold
ing
durin
g th
e ye
ar
No.
of S
hare
s %
of t
otal
Sh
ares
of t
he
com
pany
% o
f Sha
res
Pled
ged
/ en
cum
bere
d to
to
tal s
hare
s
No.
of S
hare
s %
of t
otal
Sh
ares
of t
he
com
pany
% o
f Sha
res
Pled
ged
/ en
cum
bere
d to
to
tal s
hare
s
1.Re
lianc
e Ca
pita
l Lim
ited
610,
124,
985
51.0
0-
610,
124,
985
51.0
0-
-
2.N
ippo
n Lif
e In
sura
nce
Com
pany
586,
198,
515
49.0
0-
586,
198,
515
49.0
0-
-
Tota
l1,
19,6
3,23
,500
100
-1,
19,6
3,23
,500
100
--
iii.
Chan
ge in
Pro
mot
ers
Shar
ehol
ding
( pl
ease
spe
cify
, if t
here
is n
o ch
ange
):
Sl.
No.
Shar
ehol
ders
Nam
eSh
areh
oldi
ng a
t the
beg
inni
ng o
f the
yea
r (A
pril
1, 2
017)
Cum
ulat
ive
Shar
ehol
ding
dur
ing
the
year
1.A
t the
beg
inni
ng o
f the
yea
r
2.D
ate
wis
e In
crea
se /
Dec
reas
e in
Pro
mot
ers
Shar
e ho
ldin
g du
ring
the
year
spe
cify
ing
the
reas
ons
for i
ncre
ase
/ de
crea
se (e
.g.
allo
tmen
t / tr
ansf
er /
bon
us/
swea
t equ
ity e
tc):
Ther
e is
no
chan
ge in
the
shar
ehol
ding
of t
he P
rom
oter
At t
he E
nd o
f the
yea
r

Annual Report 2018-19
54
iv.
Shar
ehol
ding
Pat
tern
of t
op te
n Sh
areh
olde
rs (o
ther
than
Dire
ctor
s, P
rom
oter
s an
d H
olde
rs o
f GD
Rs a
nd A
DRs
): Pl
ease
refe
r poi
nt i
& ii
abo
ve
v. Sh
areh
oldi
ng o
f Dire
ctor
s an
d Ke
y M
anag
eria
l Per
sonn
el: N
one
of th
e D
irect
ors
or K
ey M
anag
eria
l Per
sonn
el h
olds
an
y sh
ares
in th
e Co
mpa
ny.
V.
IND
EBTE
DN
ESS:
In
debt
edne
ss o
f the
Com
pany
incl
udin
g in
tere
st o
utst
andi
ng/a
ccru
ed b
ut n
ot d
ue fo
r pay
men
t: N
il
VI.
REM
UN
ERAT
ION
OF
DIR
ECTO
RS A
ND
KEY
MA
NA
GER
IAL
PERS
ON
NEL
A.
Rem
uner
atio
n to
Man
agin
g D
irect
or, W
hole
-tim
e D
irect
ors
and
/ or
Man
ager
: A
s pe
r MG
T 9
B.
Rem
uner
atio
n to
oth
er D
irect
ors:
(Am
ount
in `
)
Sl.
No.
Part
icul
ars
of R
emun
erat
ion
Nam
e of
Dire
ctor
sTo
tal A
mou
ntSh
ri. A
shok
Ch
awla
*Sh
ri. R
ajen
dra
Chita
lePr
of. I
ndira
Pa
rikh
Ms.
Ren
u Ch
allu
1.In
depe
nden
t Dire
ctor
s•
Fee
for a
ttend
ing
boar
d /
com
mitt
ee m
eetin
gs2,
30,0
0010
,80,
000
8,50
,000
11,0
0,00
032
,60,
000
• Co
mm
issi
onN
ilN
ilN
ilN
ilN
il•
Oth
ers,
ple
ase
spec
ifyN
ilN
ilN
ilN
ilN
ilTo
tal (
1)2,
30,0
0010
,80,
000
8,50
,000
11,0
0,00
032
,60,
000
Gen
. Ved
Pr
akas
h M
alik
#Sh
ri. K
oji I
chib
aSh
ri. M
inor
u Ki
mur
a Sh
ri. G
auta
m
Dos
hiSh
ri. A
mit
Bapn
aTo
tal A
mou
nt
2.O
ther
Non
-Exe
cutiv
e D
irect
ors
• Fe
e fo
r atte
ndin
g bo
ard
/ co
mm
ittee
mee
tings
2,30
,000
8,70
,000
9,90
,000
9,90
,000
Nil
32,0
0,00
0•
Com
mis
sion
Nil
Nil
Nil
Nil
Nil
Nil
• O
ther
s, p
leas
e sp
ecify
Nil
Nil
Nil
Nil
Nil
Nil
Tota
l (2)
2,
30,0
008,
70,0
009,
90,0
0011
,10,
000
Nil
32,0
0,00
0To
tal (
B)=(
1+2)
4,
60,0
0019
,50,
000
18,4
0,00
022
,10,
000
Nil
64,6
0,00
0
* C
ease
d to
be
Dire
ctor
of t
he C
ompa
ny w
.e.f
Sept
embe
r18,
201
8#
Ceas
ed to
be
Dire
ctor
of t
he C
ompa
ny w
.e.f
July
05,
201
8

55
STRA
TEG
IC R
EPO
RT /
STA
TUTO
RY R
EPO
RTS
/ F
INA
NCI
ALS
STA
TEM
ENTS
C.
REM
UN
ERAT
ION
TO
KEY
MA
NA
GER
IAL
PERS
ON
NEL
OTH
ER T
HA
N M
D/M
AN
AG
ER/W
TD: A
s pe
r MG
T 9
Sl. N
o.Pa
rtic
ular
s of
Rem
uner
atio
n
Key
Man
ager
ial P
erso
nnel
Ms.
Poo
rnim
a Su
bram
ania
n –
Chie
f Fin
anci
al O
ffice
r
Shri.
Ash
ish
Sarm
aCo
mpa
ny S
ecre
tary
& H
ead
– Le
gal &
Com
plia
nce
Shri.
Ash
ish
Vora
– C
hief
Ex
ecut
ive
Offi
cer &
Who
le-t
ime
Dire
ctor
1G
ross
Sal
ary
a) S
alar
y as
per
pro
visi
ons
cont
aine
d in
Sec
tion
17(1)
of t
he
Inco
me
Tax
Act
, 196
149
6691
374
4303
877
0799
44
b) V
alue
of p
erqu
isite
s u/
s 17
(2) o
f the
Inco
me
Tax
Act
, 196
174
5037
-39
600
c)
Profi
ts in
lieu
of s
alar
y u/
s 17
(3) o
f the
Inco
me
Tax
Act
, 196
1-
--
2St
ock
Opt
ions
(Num
ber o
f Opt
ions
)
3Sw
eat E
quity
4Co
mm
issi
on
5O
ther
s
Tota
l57
1195
074
4303
877
1195
44
VII.
PEN
ALT
IES
/ PU
NIS
HM
ENT/
CO
MPO
UN
DIN
G O
F O
FFEN
CES:
NO
NE

Annual Report 2018-19
56
Corporate Governance
Philosophy of Corporate GovernanceCorporate Governance is the foundation on whose edifice efficient and effective corporate management rests. At the heart of corporate governance lies transparency and a well -established principle of indoor democracy that gives Stakeholders qualified, yet definite and vital rights in matters relating to the functioning of the company, in which they hold an interest. It involves a set of relationships between a Company’s Management, its Board, its Shareholders and other Stakeholders with an objective of creating long-term Shareholder value, while at the same time protecting the interest of all Stakeholders (investors, customers, employees, vendors, government and society at large).
At RNLIC, ‘Good Corporate Governance’ is simply ‘Good Business’ which is based on the following principles:
• Satisfying the spirit of the law and not just the letter of the law
• Going beyond the law in upholding corporate governance standards
• Maintaining transparency and a high degree of disclosure levels
• Making a clear distinction between personal convenience and corporate resources
• Embracing a trusteeship model in which the management is the trustee of the shareholders’ capital and not the owner
Through the philosophy of good Corporate Governance, the Company endeavors to ensure fairness to every Stakeholder. We believe that sound corporate governance is critical in retaining and enhancing investor trust. It is a reflection of our culture, our policies, our relationship with Stakeholders and our commitment to values. Accordingly, we always seek to ensure that our performance is driven by integrity.
Procedure of Board MeetingThe Company adheres to the provisions specified in The Companies Act, 2013 and the Rules made thereunder, its Articles of Association (AOA) and Shareholders’ Agreement (SHA) with the shareholders, while organizing its Board meetings. Also, as a good corporate governance measure, the Company adopts the principles covered in the Secretarial Standards for scheduling the meetings of the Board and its Committees.
A calendar of meetings highlighting proposed dates for the future meetings of the Company is prepared and circulated in advance to the Board of Directors and as per their availability; the dates of the future meetings of the Company are finalized. The Company adheres to the timelines specified under The Companies Act, 2013 and Rules made thereunder, Secretarial Standards, SHA with Nippon Life and AOA, while sending ‘Notice’ and ‘Agenda’ of the meetings to the Directors.
The Company also has a strong review mechanism for the agenda items, before they are circulated to the Directors. The Company Secretary plays a pivotal role in ensuring that the Board meetings of the Company are effectively organized. He works closely with the leadership team and proactively manages the agenda, to ensure that a high quality and updated information is presented to the Board of Directors in advance. The objective is to enable Directors to contribute fully in board discussions and to enhance the capability of the Board in making decisions.
The process for collation and circulation of agenda for Board meetings of RNLIC is presented below:
Appointed Actuary(Actuary)
Chief Risk Officer(Audit, Risk,
Compliance & Fraud)
Chief Financial Officer(Accounts & Finance)
Chief Strategy Officer(New Business)
Chief Investment Officer(Investments)
Chief Operating Officer(Underwriting,
Operations, Claims & IT)
CompanySecretary
ExecutiveDirector & ChiefExecutive Officer
Board ofDirectors
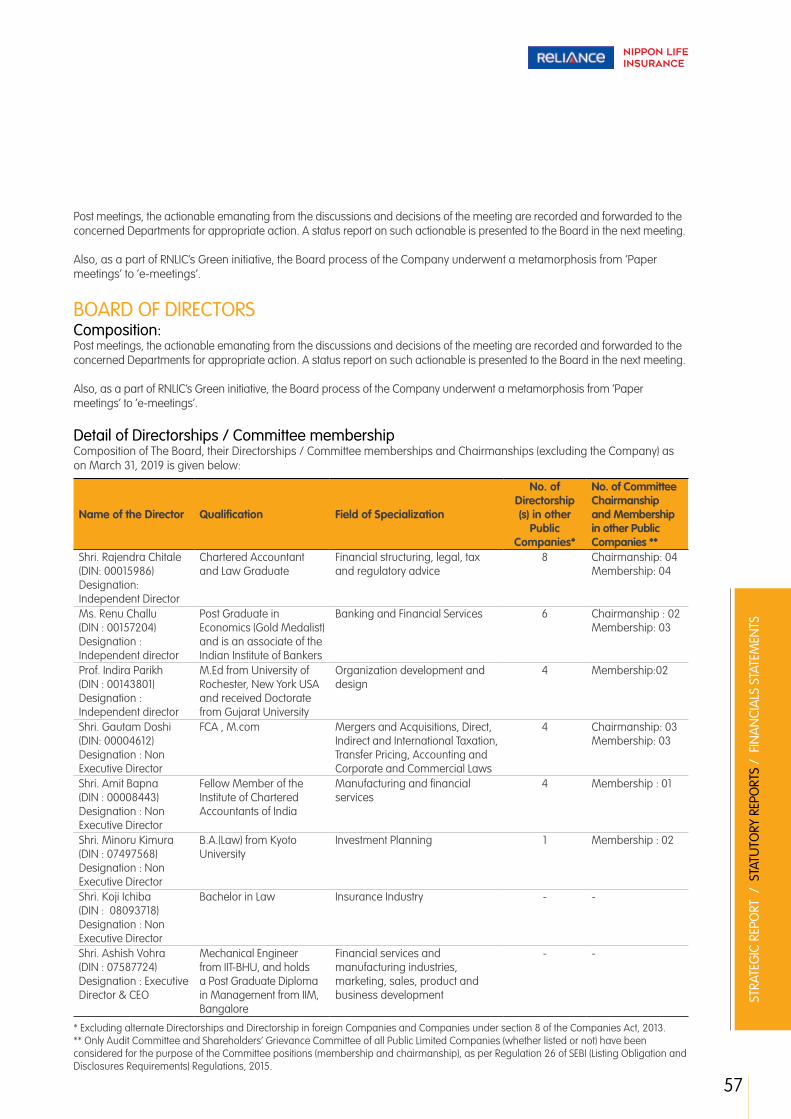
57
STRA
TEG
IC R
EPO
RT /
STA
TUTO
RY R
EPO
RTS
/ F
INA
NCI
ALS
STA
TEM
ENTS
Post meetings, the actionable emanating from the discussions and decisions of the meeting are recorded and forwarded to the concerned Departments for appropriate action. A status report on such actionable is presented to the Board in the next meeting.
Also, as a part of RNLIC’s Green initiative, the Board process of the Company underwent a metamorphosis from ‘Paper meetings’ to ‘e-meetings’.
BOARD OF DIRECTORS Composition:Post meetings, the actionable emanating from the discussions and decisions of the meeting are recorded and forwarded to the concerned Departments for appropriate action. A status report on such actionable is presented to the Board in the next meeting.
Also, as a part of RNLIC’s Green initiative, the Board process of the Company underwent a metamorphosis from ‘Paper meetings’ to ‘e-meetings’.
Detail of Directorships / Committee membershipComposition of The Board, their Directorships / Committee memberships and Chairmanships (excluding the Company) as on March 31, 2019 is given below:
Name of the Director Qualification Field of Specialization
No. of Directorship (s) in other
Public Companies*
No. of Committee Chairmanship and Membership in other Public Companies **
Shri. Rajendra Chitale (DIN: 00015986)Designation: Independent Director
Chartered Accountant and Law Graduate
Financial structuring, legal, tax and regulatory advice
8 Chairmanship: 04Membership: 04
Ms. Renu Challu(DIN : 00157204)Designation : Independent director
Post Graduate in Economics (Gold Medalist) and is an associate of the Indian Institute of Bankers
Banking and Financial Services 6 Chairmanship : 02Membership: 03
Prof. Indira Parikh(DIN : 00143801)Designation : Independent director
M.Ed from University of Rochester, New York USA and received Doctorate from Gujarat University
Organization development and design
4 Membership:02
Shri. Gautam Doshi(DIN: 00004612)Designation : Non Executive Director
FCA , M.com Mergers and Acquisitions, Direct, Indirect and International Taxation, Transfer Pricing, Accounting and Corporate and Commercial Laws
4 Chairmanship: 03Membership: 03
Shri. Amit Bapna(DIN : 00008443)Designation : Non Executive Director
Fellow Member of the Institute of Chartered Accountants of India
Manufacturing and financial services
4 Membership : 01
Shri. Minoru Kimura(DIN : 07497568)Designation : Non Executive Director
B.A.(Law) from Kyoto University
Investment Planning 1 Membership : 02
Shri. Koji Ichiba (DIN : 08093718)Designation : Non Executive Director
Bachelor in Law Insurance Industry - -
Shri. Ashish Vohra(DIN : 07587724)Designation : Executive Director & CEO
Mechanical Engineer from IIT-BHU, and holds a Post Graduate Diploma in Management from IIM, Bangalore
Financial services and manufacturing industries, marketing, sales, product and business development
- -
* Excluding alternate Directorships and Directorship in foreign Companies and Companies under section 8 of the Companies Act, 2013.** Only Audit Committee and Shareholders’ Grievance Committee of all Public Limited Companies (whether listed or not) have been considered for the purpose of the Committee positions (membership and chairmanship), as per Regulation 26 of SEBI (Listing Obligation and Disclosures Requirements) Regulations, 2015.

Annual Report 2018-19
58
The details of sitting fees paid to Directors during FY 2018-19 are given below:. ‘000)
Name of Directors Total Board
Board Audit & Compliance Committee
Board Share Transfer and
Allotment Committee
Board Risk Management Committee***
Board Asset Liability
Management Committee***
Board Investment Committee
Board Policyholders’
Protection Committee
Board Corporate
Social Responsibility
Committee
Board Nomination
And Remuneration
Committee
Board With Profits
CommitteeTotal
Shri. Ashok Chawla1 40 40 - 30 30 30 30 30 - - 230
Shri. Rajendra Chitale 200 160 - 120 120 120 120 120 120 - 1080
Ms. Renu Challu 160 160 - 120 120 120 120 120 120 60 1100
Gen. Ved Prakash Malik2 40 40 - 30 30 30 30 30 - - 230
Prof. Indira Parikh 160 120 - 90 90 90 90 90 120 - 850
Shri. Amit Bapna# - - - - - - - - - - -
Shri. Gautam Doshi 200 160 - 120 120 120 120 120 150 - 1110
Shri. Minoru Kimura 200 40 - 120 120 120 120 120 150 - 990
Shri. Koji Ichiba 200 40 - 120 120 120 120 120 - 30 870
Shri. Ashish Vohra% - - - - - - - - - - -
Note: #Shri. Amit Bapna is not paid Sitting Fees in view of waiver of Sitting Fees by them. %Shri. Ashish Vohra is not paid Sitting Fee as he receives Remuneration in the form of salary as per MGT-9
Responsibilities of the Board
The Board of Directors are responsible for overall Corporate Strategy and other related matters. The Executive Director oversees implementation of strategy, achievement of the business plan, day-to-day activities and operations. None of the Directors are related to any other Director or employee of the Company.
The Board of Directors represent the interests of the Company’s shareholders and policyholders and provides the Management with guidance and strategic direction on behalf of the shareholders. The Board oversees the Company’s strategic direction, reviews corporate performance, authorizes and monitors strategic investments, regulatory compliance and safeguards interests of all stakeholders.
The Board responsibilities also include various matters as provided under the IRDAI Corporate Governance Guidelines which are:
a) Overall direction of the business of the Company, including projections on capital requirements, revenue streams, expenses and profitability;
b) Obligation to fully comply with various laws and regulations;
c) Addressing conflicts of interest;
d) Ensuring fair treatment of policyholders and employees;
e) Ensuring information sharing with and disclosures to various stakeholders including investors, policyholders, employees, regulators etc;
f) Developing a corporate culture that recognizes and rewards adherence to ethical standards.
The Board functions either as a full Board or through various Committees constituted to oversee specific operational areas.
Corporate Governance contd...

59
STRA
TEG
IC R
EPO
RT /
STA
TUTO
RY R
EPO
RTS
/ F
INA
NCI
ALS
STA
TEM
ENTS
BOARD MEETINGS:Ordinarily, the meetings of the Board of Directors are held at the Company’s corporate office in Mumbai or any other place as may be agreed by the Board. The Board meets at least once a quarter to inter alia review the quarterly performance. The meetings are scheduled in a manner that the time gap between two successive Board meetings is not more than 120 Days.
The Board is provided with requisite information and detailed agenda papers, together with necessary supporting papers as required. The Board papers, agenda and other explanatory notes are circulated to the Directors in advance. As part of the information and agenda papers, following minimum information is provided to Directors for each meeting:
a. Minutes of the previous Board and Committee meetings;
b. Financial results review;
c. Business updates and plans;
d. Regulatory updates and compliances;
e. Any material default, show cause, demand, penalty notices, materially important Litigation status.
a. Composition and attendance The composition of the Board of Directors and their attendance during FY 2018-19 and at the last Annual General
meeting is given below:
Name of DirectorsNo. of Board Meetings held during FY 2018-19 Attendance in the last
AGM dated July 23, 2018Held Attended
Shri. Ashok Chawla1 5 1 Yes
Shri. Rajendra Chitale 5 5 Yes
Ms. Renu Challu 5 4 Yes
Gen. Ved Prakash Malik2 5 1 No
Prof. Indira Parikh 5 4 Yes
Shri Gautam Doshi 5 5 Yes
Shri. Koji Ichiba 5 5 Yes
Shri. Minoru Kimura 5 5 Yes
Shri. Amit Bapna 5 5 Yes
Shri. Ashish Vohra 5 5 Yes
b. Meetings: During FY2018-19, Five Board meetings were held as below:
• April 20, 2018;
• July 23, 2018;
• October 26, 2018;
• January 31, 2019; and
• March 12, 2019.
Meetings were held once every quarter and the time gap between two successive Board meetings did not exceed 120 days.

Annual Report 2018-19
60
BOARD COMMITTEESAs on March 31, 2019 the Company has Nine Board Committees which comprises of seven mandatory Committees and two Non - mandatory Committees (mandatory and Non – mandatory in terms of Corporate Governance Guidelines dated May 18, 2016 issued by IRDAI).
The Constitution and functioning of these Committees is governed, wherever applicable, by the relevant provisions of the Companies Act, 2013 as well as IRDAI Guidelines and Regulations. A brief on each Committee, its scope, composition, meetings for the year is given below:
A. COMMITTEES OF THE BOARD (MANDATORY) & THEIR SCOPE(i) Board Audit & Compliance Committee (BACC);
Responsible for overseeing financial reporting and internal control systems, audit plan, review of financial statements, review of findings of internal and statutory auditors, review of external auditor’s independence, objectivity, effectiveness and recommendation for appointment/ re-appointment and if required, replacement or removal of statutory/ internal/ concurrent auditors, fixing their remuneration, regulatory inspections and review of litigations.
a. Composition and attendance:The composition of the BACC and attendance during FY 2018-19:
Name of the Committee Members Designation
No. of Meetings held during FY 2018-19
Held Attended
Shri. Ashok Chawla1 Member & Independent Director 4 1
Shri. Rajendra Chitale Member & Independent Director 4 4
Ms. Renu Challu Member & Independent Director 4 4
Prof. Indira J. Parikh Member & Independent Director 4 3
Gen. Ved Prakash Malik2 Member & Independent Director 4 1
Shri. Gautam Doshi Member & Non Executive Director 4 4
Shri. Amit Bapna Member & Non Executive Director 4 4
Shri. Koji Ichiba+ Member & Non Executive Director 4 1
Shri. Minoru Kimurao Member & Non Executive Director 4 1
+Shri. Koji Ichiba has stepped down from the Committee as member w.e.f October 26, 2018 o The Committee was reconstituted w.e.f April 20, 2018 wherein Shri.Koji Ichiba replaced Shri. Minoru Kimura as a member of BACC
The Company Secretary acts as the Secretary to the Committee.
All the members of the Committee are financially literate and have the necessary and related financial expertise.
The Appointed Actuary, Chief Executive Officer, Chief Financial Officer, Chief Risk Officer, Chief Investment Officer, Chief Operating Officer, Chief Strategy Officer, the Statutory Auditors and Internal Auditors are the permanent invitees at Committee meetings.
b. Meetings:During FY 2018-19, the BACC met four times viz.• April 20, 2018;
• July 23, 2018;
• October 26, 2018; and
• January 31, 2019
Corporate Governance contd...
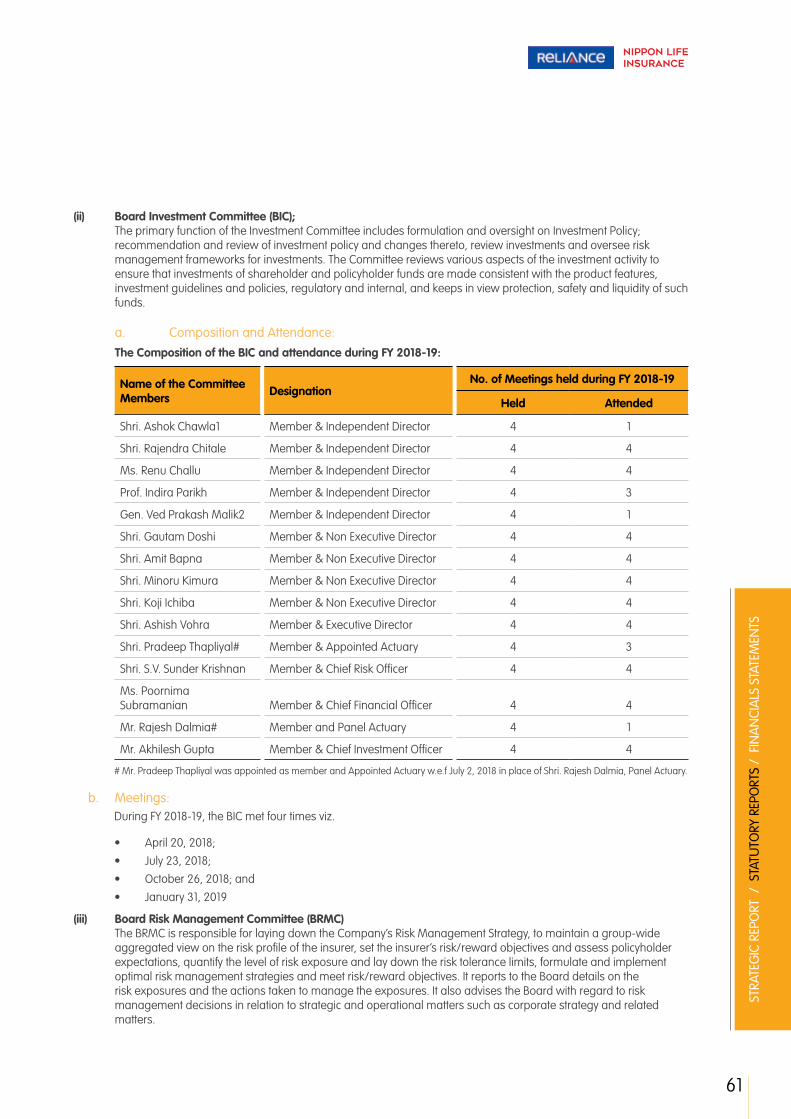
61
STRA
TEG
IC R
EPO
RT /
STA
TUTO
RY R
EPO
RTS
/ F
INA
NCI
ALS
STA
TEM
ENTS
(ii) Board Investment Committee (BIC); The primary function of the Investment Committee includes formulation and oversight on Investment Policy;
recommendation and review of investment policy and changes thereto, review investments and oversee risk management frameworks for investments. The Committee reviews various aspects of the investment activity to ensure that investments of shareholder and policyholder funds are made consistent with the product features, investment guidelines and policies, regulatory and internal, and keeps in view protection, safety and liquidity of such funds.
a. Composition and Attendance: The Composition of the BIC and attendance during FY 2018-19:
Name of the Committee Members Designation
No. of Meetings held during FY 2018-19
Held Attended
Shri. Ashok Chawla1 Member & Independent Director 4 1
Shri. Rajendra Chitale Member & Independent Director 4 4
Ms. Renu Challu Member & Independent Director 4 4
Prof. Indira Parikh Member & Independent Director 4 3
Gen. Ved Prakash Malik2 Member & Independent Director 4 1
Shri. Gautam Doshi Member & Non Executive Director 4 4
Shri. Amit Bapna Member & Non Executive Director 4 4
Shri. Minoru Kimura Member & Non Executive Director 4 4
Shri. Koji Ichiba Member & Non Executive Director 4 4
Shri. Ashish Vohra Member & Executive Director 4 4
Shri. Pradeep Thapliyal# Member & Appointed Actuary 4 3
Shri. S.V. Sunder Krishnan Member & Chief Risk Officer 4 4
Ms. Poornima Subramanian Member & Chief Financial Officer 4 4
Mr. Rajesh Dalmia# Member and Panel Actuary 4 1
Mr. Akhilesh Gupta Member & Chief Investment Officer 4 4
# Mr. Pradeep Thapliyal was appointed as member and Appointed Actuary w.e.f July 2, 2018 in place of Shri. Rajesh Dalmia, Panel Actuary.
b. Meetings:During FY 2018-19, the BIC met four times viz.
• April 20, 2018;
• July 23, 2018;
• October 26, 2018; and
• January 31, 2019
(iii) Board Risk Management Committee (BRMC) The BRMC is responsible for laying down the Company’s Risk Management Strategy, to maintain a group-wide
aggregated view on the risk profile of the insurer, set the insurer’s risk/reward objectives and assess policyholder expectations, quantify the level of risk exposure and lay down the risk tolerance limits, formulate and implement optimal risk management strategies and meet risk/reward objectives. It reports to the Board details on the risk exposures and the actions taken to manage the exposures. It also advises the Board with regard to risk management decisions in relation to strategic and operational matters such as corporate strategy and related matters.
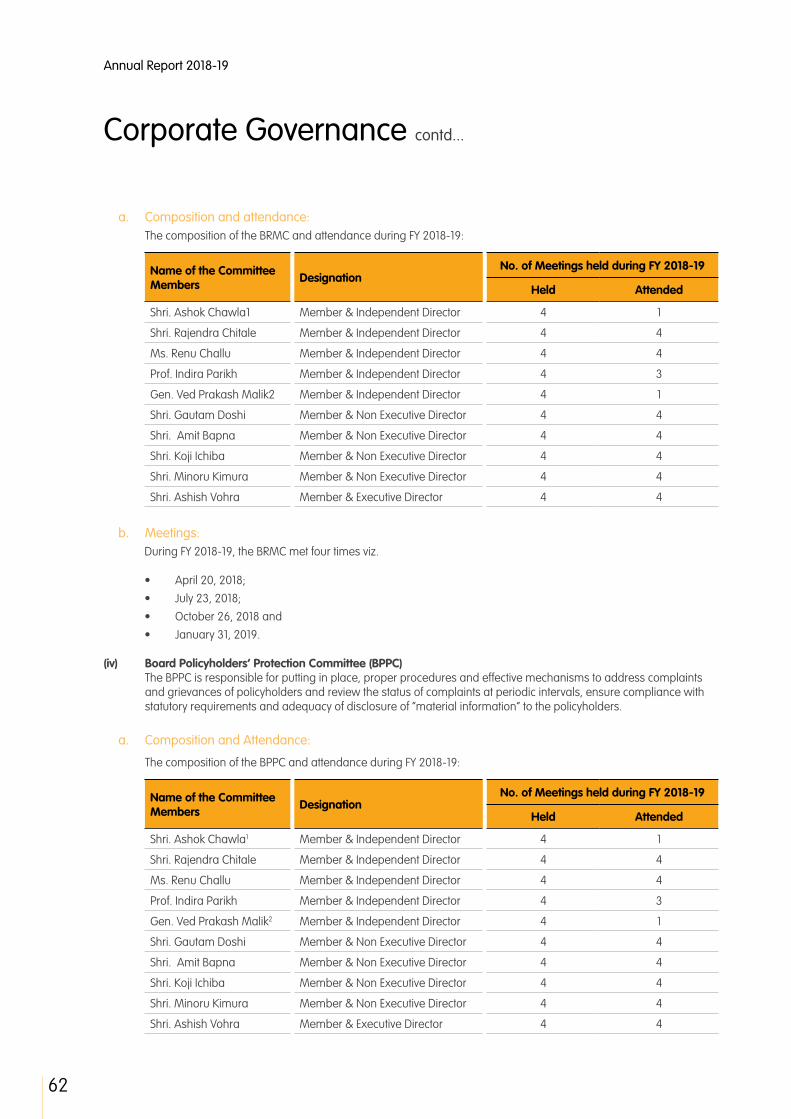
Annual Report 2018-19
62
a. Composition and attendance: The composition of the BRMC and attendance during FY 2018-19:
Name of the Committee Members Designation
No. of Meetings held during FY 2018-19
Held Attended
Shri. Ashok Chawla1 Member & Independent Director 4 1
Shri. Rajendra Chitale Member & Independent Director 4 4
Ms. Renu Challu Member & Independent Director 4 4
Prof. Indira Parikh Member & Independent Director 4 3
Gen. Ved Prakash Malik2 Member & Independent Director 4 1
Shri. Gautam Doshi Member & Non Executive Director 4 4
Shri. Amit Bapna Member & Non Executive Director 4 4
Shri. Koji Ichiba Member & Non Executive Director 4 4
Shri. Minoru Kimura Member & Non Executive Director 4 4
Shri. Ashish Vohra Member & Executive Director 4 4
b. Meetings:During FY 2018-19, the BRMC met four times viz.
• April 20, 2018;
• July 23, 2018;
• October 26, 2018 and
• January 31, 2019.
(iv) Board Policyholders’ Protection Committee (BPPC) The BPPC is responsible for putting in place, proper procedures and effective mechanisms to address complaints
and grievances of policyholders and review the status of complaints at periodic intervals, ensure compliance with statutory requirements and adequacy of disclosure of “material information” to the policyholders.
a. Composition and Attendance:
The composition of the BPPC and attendance during FY 2018-19:
Name of the Committee Members Designation
No. of Meetings held during FY 2018-19
Held Attended
Shri. Ashok Chawla1 Member & Independent Director 4 1
Shri. Rajendra Chitale Member & Independent Director 4 4
Ms. Renu Challu Member & Independent Director 4 4
Prof. Indira Parikh Member & Independent Director 4 3
Gen. Ved Prakash Malik2 Member & Independent Director 4 1
Shri. Gautam Doshi Member & Non Executive Director 4 4
Shri. Amit Bapna Member & Non Executive Director 4 4
Shri. Koji Ichiba Member & Non Executive Director 4 4
Shri. Minoru Kimura Member & Non Executive Director 4 4
Shri. Ashish Vohra Member & Executive Director 4 4
Corporate Governance contd...
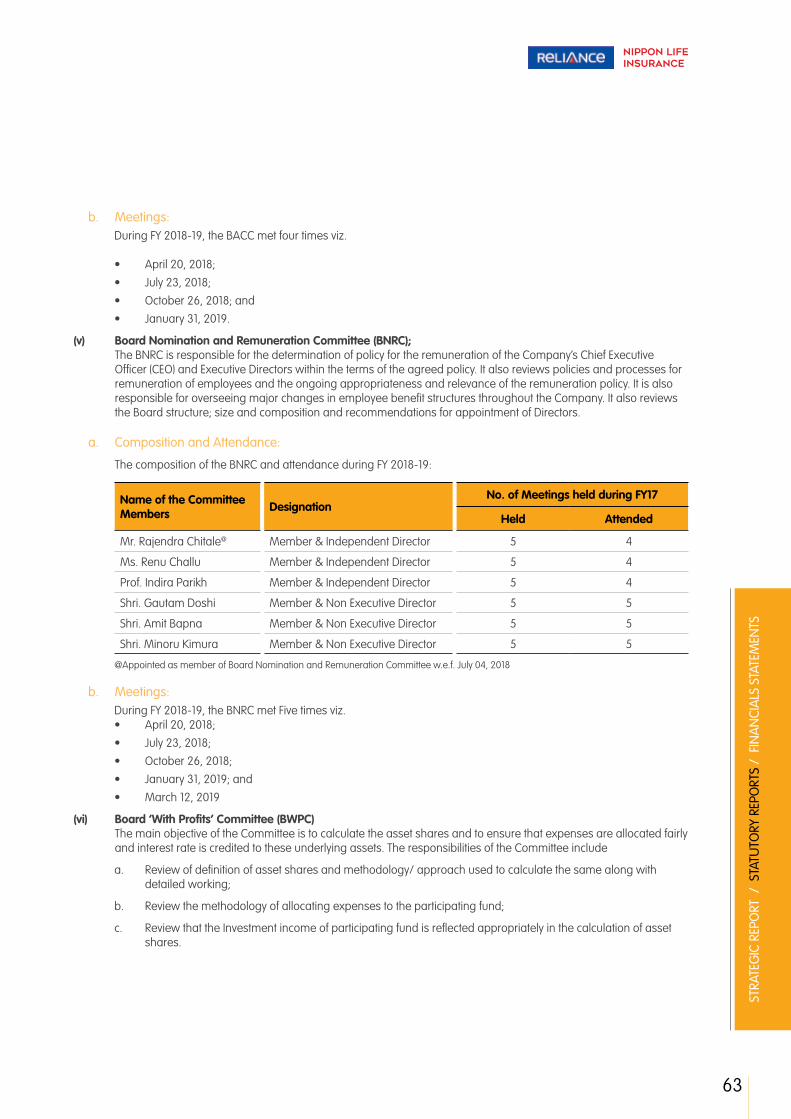
63
STRA
TEG
IC R
EPO
RT /
STA
TUTO
RY R
EPO
RTS
/ F
INA
NCI
ALS
STA
TEM
ENTS
b. Meetings:During FY 2018-19, the BACC met four times viz.
• April 20, 2018;
• July 23, 2018;
• October 26, 2018; and
• January 31, 2019.
(v) Board Nomination and Remuneration Committee (BNRC); The BNRC is responsible for the determination of policy for the remuneration of the Company’s Chief Executive
Officer (CEO) and Executive Directors within the terms of the agreed policy. It also reviews policies and processes for remuneration of employees and the ongoing appropriateness and relevance of the remuneration policy. It is also responsible for overseeing major changes in employee benefit structures throughout the Company. It also reviews the Board structure; size and composition and recommendations for appointment of Directors.
a. Composition and Attendance:
The composition of the BNRC and attendance during FY 2018-19:
Name of the Committee Members Designation
No. of Meetings held during FY17
Held Attended
Mr. Rajendra Chitale@ Member & Independent Director 5 4
Ms. Renu Challu Member & Independent Director 5 4
Prof. Indira Parikh Member & Independent Director 5 4
Shri. Gautam Doshi Member & Non Executive Director 5 5
Shri. Amit Bapna Member & Non Executive Director 5 5
Shri. Minoru Kimura Member & Non Executive Director 5 5
@Appointed as member of Board Nomination and Remuneration Committee w.e.f. July 04, 2018
b. Meetings:During FY 2018-19, the BNRC met Five times viz.• April 20, 2018;
• July 23, 2018;
• October 26, 2018;
• January 31, 2019; and
• March 12, 2019
(vi) Board ‘With Profits’ Committee (BWPC) The main objective of the Committee is to calculate the asset shares and to ensure that expenses are allocated fairly
and interest rate is credited to these underlying assets. The responsibilities of the Committee include
a. Review of definition of asset shares and methodology/ approach used to calculate the same along with detailed working;
b. Review the methodology of allocating expenses to the participating fund;
c. Review that the Investment income of participating fund is reflected appropriately in the calculation of asset shares.

Annual Report 2018-19
64
a. Composition and Attendance
The composition of the BWPC and attendance during FY 2018-19:
Name of the Committee Members Designation
No. of Meetings held during FY 2018-19
Held AttendedMs. Renu Challu Member & Independent Director 2 2Shri. Ashish Vohra Member & Executive Director 2 2Shri. Koji Ichiba Member & Non-Executive Director 2 1Shri. Minoru Kimura Member & Non Executive Director 2 0Shri Rajesh Dalmia$ Member & Actuary 2 1Shri. PradeepThapiyal$ Member & Actuary 2 1Shri. Gautam Kakar^ Member & Independent Actuary 2 1Ms. Anuradha Lal^ Member & Independent Actuary 2 1
$Shri. Pradeep Thapiyal was Appointed as Member and Actuary in place of Shri. Rajesh Dalmia w.e.f. July 02, 2018.^ Ms. Anuradha Lal Appointed as Independent Actuary in place of Shri. Gautam Kakar w.e.f. January 31, 2019
b. Meetings
The BWPC met twice in the FY 2018-19 on April 20, 2018 and March 30, 2019
(vii) Board Corporate Social Responsibility Committee (BCSRC) The responsibilities of the BCSRC include:
• Specifying the CSR projects and programmes to be undertaken during the year (specifying modalities of execution in the areas/sectors chosen and implementation schedules for the same);
• Formulating and recommending to the Board a CSR Policy indicating the activities to be undertaken by the Company as specified in amended Schedule VII of Companies Act, 2013;
• Approving the CSR Policy of the Company;
• Recommending the amount of expenditure to be incurred on the CSR activities;
• Monitoring the CSR policy from time to time;
• Disclosing contents of CSR;
• Apprising the Board of the CSR activities and
• Specifying reasons for failure (if any) for not spending the CSR amount in the Directors’ Report.
a. Composition and attendance
The composition of the BCSRC and attendance during FY 2018-19:
Name of the Committee Members Designation
No. of Meetings held during FY 2018-19
Held AttendedShri. Ashok Chawla1 Member & Independent Director 4 1Shri. Rajendra Chitale Member & Independent Director 4 4Ms. Renu Challu Member & Independent Director 4 4Prof. Indira Parikh Member & Independent Director 4 3Gen. Ved Prakash Malik2 Member & Independent Director 4 1Shri. Gautam Doshi Member & Non Executive Director 4 4Shri. Amit Bapna Member & Non Executive Director 4 4Shri. Minoru Kimura Member & Non Executive Director 4 4Shri. Koji Ichiba Member & Non Executive Director 4 4Shri. Ashish Vohra Member & Executive Director 4 4
Corporate Governance contd...

65
STRA
TEG
IC R
EPO
RT /
STA
TUTO
RY R
EPO
RTS
/ F
INA
NCI
ALS
STA
TEM
ENTS
b. Meetings and Attendance
During FY 2018-19, the BCSRC met four times viz.
• April 20, 2018;
• July 23, 2018;
• October 26, 2018; and
• January 31, 2019.
OTHER COMMITTEES OF THE BOARD (NON-MANDATORY) & THEIR SCOPE(i) Board Asset Liability Management Committee (BALMC) The BALMC ensures that the Company invests in a manner, which enables it to meet its cash flow needs and capital
requirements. The Committee formulates and implements ALM strategies at product and enterprise level, monitors risk exposures periodically and revise ALM strategies, if necessary.
The Committee is also responsible for updating the Board periodically on the status of ALM.
a. Composition and Attendance:
The composition of the BALMC and attendance during FY 2018-19:
Name of the Committee Members Designation
No. of Meetings held during the year
Held Attended
Shri. Ashok Chawla1 Member & Independent Director 4 1
Shri. Rajendra Chitale Member & Independent Director 4 4
Ms. Renu Challu Member & Independent Director 4 4
Prof. Indira Parikh Member & Independent Director 4 3
Gen. Ved Prakash Malik2 Member & Independent Director 4 1
Shri. Gautam DoshiMember and Non Executive Director 4 4
Shri. Amit Bapna Member & Non Executive Director 4 4
Shri. Koji Ichiba Member & Non Executive Director 4 4
Shri. Minoru Kimura Member & Non Executive Director 4 4
Shri. Ashish Vohra Member & Executive Director 4 4
b. Meetings
During FY 2018-19, the BALMC met four times viz. April 20, 2018;
• April 20, 2018;
• July 23, 2018;
• October 26, 2018 and
• January 31, 2019.
(ii) Board Share Transfer and Allotment Committee (BSTAC); The terms of reference of the BSTAC includes approving/ ratifying allotment of shares; appointing/ removing
Registrar and Transfer Agent/ Depositories etc; approving the requests lodged with the Company for transfer/ transmission/ de-materialization/ re-materialization of shares; and approving/ ratifying the issuance of duplicate, replaced, split, consolidated share certificates duly verified, confirmed and recommended by the Company Secretary, from time to time.

Annual Report 2018-19
66
a. Composition and Attendance:
The composition of the BSTAC and attendance during FY 2018-19:
Name of the Committee Members Designation
No. of Meetings held during FY 2018-19
Held AttendedShri. Ashok Chawla1 Member & Independent Director Nil NilMs. Renu Challu Member & Independent Director Nil NilProf. Indira Parikh Member & Independent Director Nil NilGen. Ved Prakash Malik2 Member & Independent Director Nil NilShri. Gautam Doshi Member & Non Executive Director Nil NilShri. Amit Bapna Member & Non Executive Director Nil NilShri. Koji Ichiba Member & Non Executive Director Nil NilShri. Minoru Kimura Member & Non Executive Director Nil NilShri. Ashish Vohra Member & Executive Director Nil Nil
b. Meetings
No meeting of BSTAC was conducted as there was no capital infusion or share transfers during FY 2018-19.
Disclosures
A. Related party Transaction All the related party transactions are strictly done on arms length basis. The related party transactions of the
Company are periodically placed and reviewed by the Board Audit & Compliance Committee of the Company and the necessary briefing is given to the Board as well. Particulars for related party transaction are listed out in the Boards report forming part of the Annual Report.
B. Remuneration of Directors The detailed note on the remuneration of Directors has already been incorporated in Directors report. Apart from the
details mentioned therein, no other remuneration is paid to any of the Directors.
None of the Directors of the Company have any holding in the share capital of the Company.
C. Management A detailed Management Discussion and Analysis Report form part of the Annual Report being sent to stakeholders,
including shareholders, of the Company.
Corporate Governance contd...

67
STRA
TEG
IC R
EPO
RT /
STA
TUTO
RY R
EPO
RTS
/ F
INA
NCI
ALS
STA
TEM
ENTS
D. Shareholders & General Information
(i) General Body Meetings The particulars of the last three Annual general meetings (AGMs) of the Company are provided in the following table:
AGM Financial Year Date of the AGM Time Venue
15th 2015-2016 June 2, 2016 2:00 PM Board Room, Reliance Centre, 5th Floor, Off Western Express Highway, Santacruz (East), Mumbai – 400055
16th 2016-17 June 9, 2017 2:00 PM Board Room, Reliance Centre, 5th Floor, Off Western Express Highway, Santacruz (East), Mumbai – 400055
17th 2017-18 July 23, 2018 9:00 AM Conference Room, Ground Floor, Business Centre, Reliance Centre, Off Western Express Highway, Santacruz (East), Mumbai – 400055
(ii) Details of the Special Resolutions passed in the last three Annual General Meetings:
AGM Business(es) transacted by Special Resolution
15th -
16th -
17th -
(iii) Details of Extraordinary General Meetings (EGMs) held in last three financial years, and Special Resolutions passed thereat:
FY Date of EGM EGM Venue Time of Meeting Special Resolutions passed
2016-2017 - - - -
2017-2018 - - - -
2018-19 November 12, 2018
Board Room, Reliance Centre, 5th Floor, Off Western Express Highway, Santacruz (East), Mumbai – 400055
9:00 A.M. Approval for Compensation of Shri. Ashish Vohra, Executive Director and CEO of the Company for Financial Year 2018 - 19
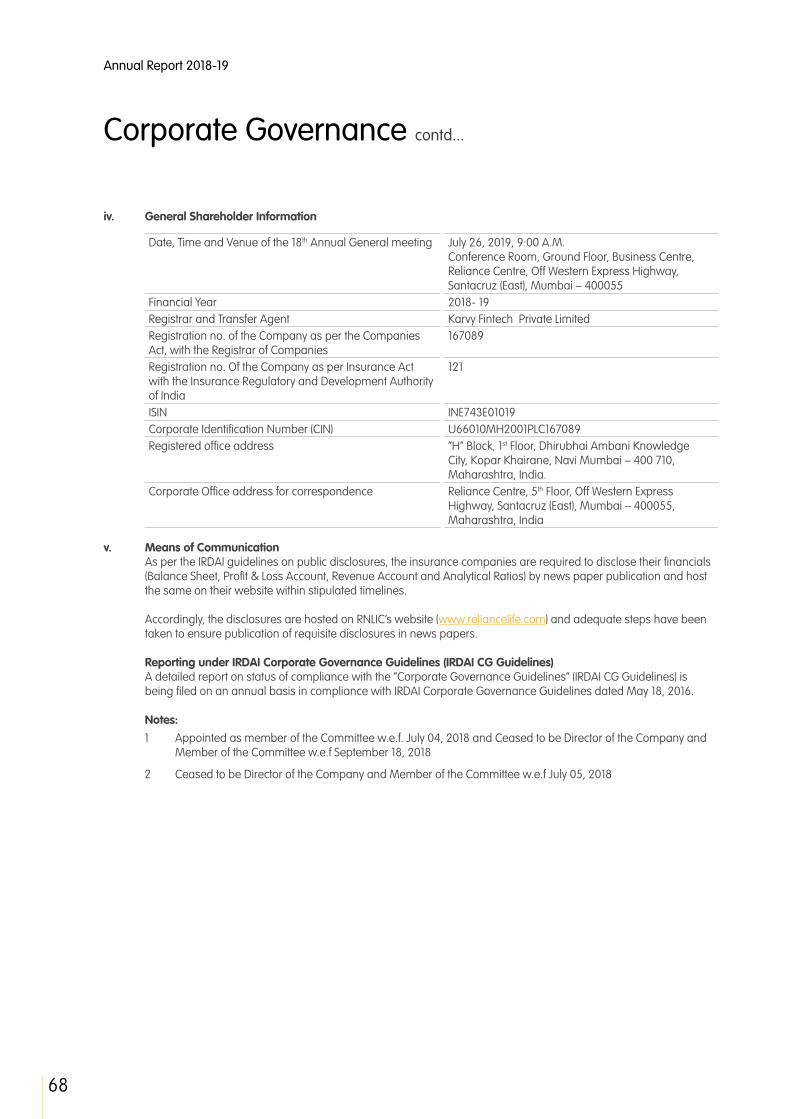
Annual Report 2018-19
68
iv. General Shareholder Information
Date, Time and Venue of the 18th Annual General meeting July 26, 2019, 9:00 A.M.Conference Room, Ground Floor, Business Centre, Reliance Centre, Off Western Express Highway, Santacruz (East), Mumbai – 400055
Financial Year 2018- 19Registrar and Transfer Agent Karvy Fintech Private LimitedRegistration no. of the Company as per the Companies Act, with the Registrar of Companies
167089
Registration no. Of the Company as per Insurance Act with the Insurance Regulatory and Development Authority of India
121
ISIN INE743E01019 Corporate Identification Number (CIN) U66010MH2001PLC167089Registered office address “H” Block, 1st Floor, Dhirubhai Ambani Knowledge
City, Kopar Khairane, Navi Mumbai – 400 710, Maharashtra, India.
Corporate Office address for correspondence Reliance Centre, 5th Floor, Off Western Express Highway, Santacruz (East), Mumbai – 400055, Maharashtra, India
v. Means of Communication As per the IRDAI guidelines on public disclosures, the insurance companies are required to disclose their financials
(Balance Sheet, Profit & Loss Account, Revenue Account and Analytical Ratios) by news paper publication and host the same on their website within stipulated timelines.
Accordingly, the disclosures are hosted on RNLIC’s website (www.reliancelife.com) and adequate steps have been
taken to ensure publication of requisite disclosures in news papers.
Reporting under IRDAI Corporate Governance Guidelines (IRDAI CG Guidelines) A detailed report on status of compliance with the “Corporate Governance Guidelines” (IRDAI CG Guidelines) is
being filed on an annual basis in compliance with IRDAI Corporate Governance Guidelines dated May 18, 2016.
Notes:1 Appointed as member of the Committee w.e.f. July 04, 2018 and Ceased to be Director of the Company and
Member of the Committee w.e.f September 18, 2018
2 Ceased to be Director of the Company and Member of the Committee w.e.f July 05, 2018
Corporate Governance contd...

69
STRA
TEG
IC R
EPO
RT /
STA
TUTO
RY R
EPO
RTS
/ F
INA
NCI
ALS
STA
TEM
ENTS
Certification for compliance of the Corporate Governance Guidelines
I, Ashish Sarma, hereby certify that to the best of my knowledge and information available with me, the Company has complied with the Corporate Governance Guidelines for Insurance companies dated May 18, 2016, as amended from time to time and nothing has been concealed or suppressed.
FOR RELIANCE NIPPON LIFE INSURANCE COMPANY LIMITED
Ashish SarmaCompany Secretary and Head – Legal & Compliance
Place: MumbaiDate: April 24, 2019
70
Annual Report 2018-19
As part of the Financial Statements for the year ended 31st March, 2019
As required by the Insurance Regulatory and Development Authority (Preparation of financial statements and Auditor’s report of Insurance Companies) Regulations, 2002, the following management report is submitted by the management of Reliance Nippon Life Insurance Company Limited (the Company):
1. Validity of registration We confirm that the Company has got a valid certificate of registration from the Insurance Regulatory and
Development Authority of India (IRDAI) to transact Life Insurance business and the same is in force as on the date of this report.
2. Statutory dues We certify that all material dues payable to the statutory authorities, other than those which are being contested with
the statutory authorities, have been duly paid by the Company.
3. Shareholding pattern We confirm that the shareholding pattern and transfer, if any, of shares of the Company during the year are in
conformity with regulatory or statutory requirements.
4. Investment of funds We declare that the Company has not, directly or indirectly, invested outside India, the funds of the holders of the
policies issued in India.
5. Solvency margin We confirm that the Company is maintaining the solvency margins as required by IRDAI.
6. Valuation of assets We certify that all assets of the Company have been reviewed on the date of the Balance Sheet and to the best of
our knowledge and belief, the assets set forth in the Balance Sheet as at 31st March, 2019 have been shown in the aggregate at amounts not exceeding their realisable or market value, except in case of fixed income investments made in the controlled funds (shareholder’s funds and policyholder’s non linked funds) which have been valued and shown at amortised cost as per IRDAI regulations and are lower than their market value by ` 2,095,017 thousands in aggregate as at 31st March, 2019.
7. Investment details We certify that no part of the life insurance fund has been directly or indirectly applied by the Company in
contravention of the provisions of the Insurance Act, 1938 (4 of 1938) relating to the application and investment of the life insurance funds.
8. Enterprise Wide Risk Management (EWRM) The Company has undertaken many initiatives towards the implementation of a robust Enterprise Wide Risk
Management (EWRM). The Company monitors market risk, credit risk, information technology risk, insurance risk and operational risk at organization level through dashboards and risk reports. The Company is developing its experience which would enable them to transition to next level of maturity.
RNLIC has aligned the Enterprise wide risk management (EWRM) framework to ISO 31000:2018 standard and is on
the journey to align its ERM practices to international standards. The Company has automated key processes across Compliance, Audit & Risk for integrated assessment and effective monitoring. The Company has automated other processes especially in Asset Liability Management (ALM) and proactive investigation.
The management’s commitment for effective ERM initiative is clearly visible from the independent organization
structure set up by the company for the purpose. The company has formed a Control Committee (Executive Risk Management Committee) that includes heads of business functions like actuary, human resource, finance, risk management etc. along with chief executive officer that meet on monthly basis to monitor and review the risk management processes and identify and resolve any issues at the initial stage. Similarly, Risk management practices are also reviewed quarterly at a Board Level committee.
Management’s Report
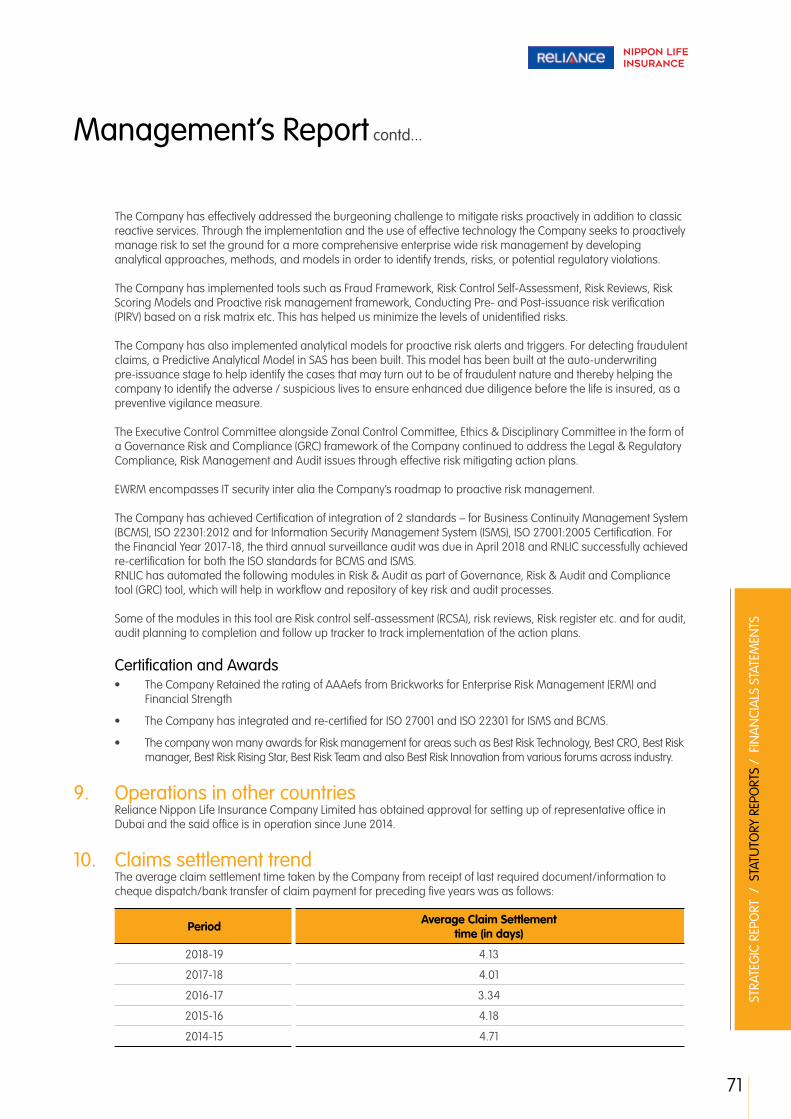
71
STRA
TEG
IC R
EPO
RT /
STA
TUTO
RY R
EPO
RTS
/ F
INA
NCI
ALS
STA
TEM
ENTS
The Company has effectively addressed the burgeoning challenge to mitigate risks proactively in addition to classic reactive services. Through the implementation and the use of effective technology the Company seeks to proactively manage risk to set the ground for a more comprehensive enterprise wide risk management by developing analytical approaches, methods, and models in order to identify trends, risks, or potential regulatory violations.
The Company has implemented tools such as Fraud Framework, Risk Control Self-Assessment, Risk Reviews, Risk
Scoring Models and Proactive risk management framework, Conducting Pre- and Post-issuance risk verification (PIRV) based on a risk matrix etc. This has helped us minimize the levels of unidentified risks.
The Company has also implemented analytical models for proactive risk alerts and triggers. For detecting fraudulent claims, a Predictive Analytical Model in SAS has been built. This model has been built at the auto-underwriting pre-issuance stage to help identify the cases that may turn out to be of fraudulent nature and thereby helping the company to identify the adverse / suspicious lives to ensure enhanced due diligence before the life is insured, as a preventive vigilance measure.
The Executive Control Committee alongside Zonal Control Committee, Ethics & Disciplinary Committee in the form of
a Governance Risk and Compliance (GRC) framework of the Company continued to address the Legal & Regulatory Compliance, Risk Management and Audit issues through effective risk mitigating action plans.
EWRM encompasses IT security inter alia the Company’s roadmap to proactive risk management.
The Company has achieved Certification of integration of 2 standards – for Business Continuity Management System (BCMS), ISO 22301:2012 and for Information Security Management System (ISMS), ISO 27001:2005 Certification. For the Financial Year 2017-18, the third annual surveillance audit was due in April 2018 and RNLIC successfully achieved re-certification for both the ISO standards for BCMS and ISMS.
RNLIC has automated the following modules in Risk & Audit as part of Governance, Risk & Audit and Compliance tool (GRC) tool, which will help in workflow and repository of key risk and audit processes.
Some of the modules in this tool are Risk control self-assessment (RCSA), risk reviews, Risk register etc. and for audit, audit planning to completion and follow up tracker to track implementation of the action plans.
Certification and Awards• The Company Retained the rating of AAAefs from Brickworks for Enterprise Risk Management (ERM) and
Financial Strength
• The Company has integrated and re-certified for ISO 27001 and ISO 22301 for ISMS and BCMS.
• The company won many awards for Risk management for areas such as Best Risk Technology, Best CRO, Best Risk manager, Best Risk Rising Star, Best Risk Team and also Best Risk Innovation from various forums across industry.
9. Operations in other countries Reliance Nippon Life Insurance Company Limited has obtained approval for setting up of representative office in
Dubai and the said office is in operation since June 2014.
10. Claims settlement trend The average claim settlement time taken by the Company from receipt of last required document/information to
cheque dispatch/bank transfer of claim payment for preceding five years was as follows:
Period Average Claim Settlement time (in days)
2018-19 4.13
2017-18 4.01
2016-17 3.34
2015-16 4.18
2014-15 4.71
Management’s Report contd...

72
Annual Report 2018-19
The ageing of claims registered and not settled, is as follows:
Period
Linked Business Traditional Business
As at 31st March 2019
As at 31st March 2018
As at 31st March 2019
As at 31st March 2018
No of claims
Amount (` Lakhs)
No of claims
Amount (` Lakhs)
No of claims
Amount (` Lakhs)
No of claims
Amount (` Lakhs)
Upto 30 days Nil Nil Nil Nil 2 17.58 1 11.90
Greater than 30 days and upto 6 months
Nil Nil Nil Nil 6 49.92 3 97.99
Greater than 6 months and upto 1 years
Nil Nil Nil Nil Nil Nil Nil Nil
Greater than 1 year and upto 5 years
Nil Nil Nil Nil Nil Nil Nil Nil
Greater than 5 years Nil Nil Nil Nil Nil Nil Nil Nil
11. Investments Investments are recorded at cost on the date of purchase, which includes brokerage, stamp duty and taxes if
any, but excludes accrued interest paid, if any on the date of purchase. Bonus entitlements are recognised as investments on ex-bonus date. Rights Entitlements are recognised as investments on the ex-rights date.
Classification Investments maturing within twelve months from the balance sheet date and investments made with the specific
intention to dispose them off within twelve months from the balance sheet date are classified as short-term investments.
Investments other than short-term investments are classified as long-term investments.
Valuation Non-linked policyholders’ investments, non-unit reserve and shareholders’ investments All debt securities held by the Company are considered as ‘held to maturity’ and measured at historical cost subject
to amortisation of the premium/discount over the remaining period to maturity of these securities on Effective Interest Rate Method.
Listed equities and Exchange Traded Funds (‘ETF’) are measured at fair value, being the quoted closing prices on the National Stock Exchange (in case it is not traded on the National Stock Exchange then quoted closing price on the Bombay Stock Exchange is used) on the last trading day of the financial year. In case the equity ETF’s are not traded either on the primary or the secondary exchange, then the equity ETF’s are valued at the latest available Net Asset value (NAV).
Mutual fund units are valued at the previous day’s net asset value of the respective fund. Additional Tier-1 Bonds are
valued at using Crisil Bond valuer and Infrastructure Investment Trusts are valued at market value using last quoted price on National Stock exchange and Bombay stock exchange.
In respect of listed equities, ETF, Additional Tier-1 bonds, Infrastructure Investment Trusts and mutual funds, the unrealised gains/losses between the cost price and the fair value price are accounted in the “Fair Value Change” account in the balance sheet.
Investments bought on ‘repo’ basis are valued at cost plus interest accrued on reverse repo rate. Investments in venture funds are valued at historical cost subject to impairment, if any.
The Company assesses at each Balance Sheet date whether there is any indication that any equity investment may be impaired. In case of impairment, any impairment loss is recognised as an expense in the Revenue or Profit
Management’s Report contd...

73
STRA
TEG
IC R
EPO
RT /
STA
TUTO
RY R
EPO
RTS
/ F
INA
NCI
ALS
STA
TEM
ENTS
and Loss Account to the extent of difference between the re-measured fair value of the security/investment and its acquisition cost as reduced by any impairment loss recognized as an expense in the Revenue or Profit and Loss Account. Any reversal of impairment loss, earlier recognized in Revenue or Profit and Loss Account, is recognized in the Revenue or Profit and Loss Account respectively.
Linked business Securities issued by Government of India (except Treasury Bills) and State government securities are valued at prices
released by Credit Rating Information Services of India Limited (CRISIL).
Bonds and debentures including asset backed securities are valued on the basis of CRISIL Bond Valuer. Money market instruments including treasury bills are valued at historical cost, subject to amortisation of premium
or accretion of discount on straight-line basis over the remaining period to maturity of these securities.
Listed equities and ETF are measured at fair value, being the quoted closing prices on the National Stock Exchange (in case it is not traded on the National Stock Exchange then quoted closing price on the Bombay Stock Exchange is used) on the last trading day of the financial year. In case the equity ETF’s are not traded either on the primary or the secondary exchange, then the equity ETF’s are valued at the latest available Net Asset value (NAV).
Mutual fund units are valued at the previous day’s net asset value of the respective fund.
Investments bought on ‘repo’ basis are valued at cost plus interest accrued on reverse repo rate. Unrealised gain/loss arising on valuation of these investments is recognised in the Revenue Account of the
respective fund.
Transfer of investments Any transfer of investments from shareholders to policyholders is carried out at amortised cost or market value,
whichever is lower. In case of linked funds, any inter fund transfer of equities is carried out at the prevailing market price during market hours and any inter fund transfer of Government Securities is carried out at market price prevailing on Negotiated dealing system (NDS) at the time of such transfer. Securities other than equities and government securities are transferred at previous day valuation price.
12. Asset quality review All investments of the Company are performing investments. In terms of asset quality for non-government securities,
investments have been made in highly rated securities.
In case of Linked business, the investments have generally been made in companies with a good track record.
13. Details of payments made to individuals, firms, companies and or-ganizations in which Directors are interested
(` in Lakhs)
Sr. No.
Name of Interested Director Entity in which Directors are interested Interested as Amount of payment
during the year
1 Mr. Amit Bapna Reliance Capital Limited CFO 1,099.22
Reliance Capital Limited Employees’ Group Gratuity – Cum - Life Assurance Scheme
Trustee 143.68
Reliance Home Finance Limited Director 508.09
Reliance Securities Limited Director 1,086.95
2 Mr. Rajendra Chitale Reliance Capital Limited Director 1,099.22
The Clearing Corporation of India Limited Director 31.41
Reliance General Insurance Company Limited
Director 1,120.13
3 Mr. Gautam Doshi Reliance Home Finance Limited Director 508.09
Management’s Report contd...

74
Annual Report 2018-19
14. Management’s Responsibility Statement The Management confirms that:
(a) In preparation of the financial statements, all applicable accounting standards, generally accepted accounting principles and policies have been followed, along with proper explanations relating to material departure, if any;
(b) The management has adopted accounting policies and applied them consistently. The management has made judgments and estimates that are reasonable and prudent so as to give a true and fair view of the state of affairs of the Company at the end of the financial year and of the operating profit and of the profit of the Company for the year;
(c) Sufficient and proper care has been taken for the maintenance of adequate accounting records in accordance with the Insurance Act, 1938 and the Companies Act, 2013 for safeguarding the assets of the Company and for preventing and detecting fraud and other irregularities;
(d) The financial statements have been prepared on a going concern basis; and
(e) An internal audit system commensurate with the size and nature of the business is in place and is operating effectively.
For and on behalf of Board of Directors
Chairman of the meeting Director Director
Executive Director & Chief Financial Officer Appointed ActuaryChief Executive Officer
Company Secretary
Place: MumbaiDate: 24th April 2019
Management’s Report contd...
75
STRA
TEG
IC R
EPO
RT /
STA
TUTO
RY R
EPO
RTS
/ F
INA
NCI
ALS
STA
TEM
ENTS
Independent Auditors’ Report
To the Members of Reliance Nippon Life Insurance Company Limited on the Financial Statements
OpinionWe have audited the financial statements of Reliance Nippon Life Insurance Company Limited (“the Company”), which comprise the Balance Sheet as at March 31, 2019, and the related Revenue (also called the “Policyholders’ Account” or the “Technical Account”), the Profit and Loss Account (also called the “Shareholders’ Account” or “Non-Technical Account”) and Receipts and Payments Account for the year then ended, and notes to the financial statements, including a summary of significant accounting policies and other explanatory information .
In our opinion and to the best of our information and according to the explanations given to us, the aforesaid financial statements are prepared in accordance with the requirements of the Insurance Act, 1938 (the “Insurance Act”), Insurance Regulatory and Development Act, 1999 (the “IRDA Act”), Insurance Regulatory and Development Authority (Preparation of Financial Statements and Auditor’s Report of Insurance Companies) Regulations, 2002 (the “Regulations”) and the Companies Act 2013 (“the Act”), to the extent applicable and in the manner so required, and give a true and fair view in conformity with the accounting principles generally accepted in India, as applicable to insurance companies:
(a) in the case of the Balance Sheet, of the state of affairs of the Company as at March 31, 2019;
(b) in the case of the Revenue Account, of the operating profit/ (loss) for the year ended on that date;
(c) in the case of the Profit and Loss Account, of the profit for the year ended on that date; and
(d) in the case of the Receipts and Payments Account, of the receipts and payments for the year ended on that date.
Basis for opinionWe conducted our audit in accordance with the Standards on Auditing (the “SAs”) specified under section 143(10) of the Companies Act, 2013. Our responsibilities under those Standards are further described in the Auditor’s Responsibilities for the Audit of the Financial Statements section of our report. We are independent of the Company in accordance with the Code of Ethics issued by the Institute of Chartered Accountants of India together with the ethical requirements that are relevant to our audit of the financial statements under the Insurance Act, the IRDA Act, the Regulations, the Act and the Rules thereunder, and we have fulfilled our other ethical responsibilities in accordance with these requirements and the Code of Ethics. We believe that the audit evidence we have obtained is sufficient and appropriate to provide a basis for our opinion.
Other MattersThe actuarial valuation of liabilities for life policies in-force and policies where premium is discontinued is the responsibility of the Company’s Appointed Actuary. The actuarial valuation of these liabilities as at March 31, 2019 has been duly certified by the Appointed Actuary and in his opinion, the assumptions for such valuation are in accordance with the generally accepted actuarial principles and practices requirements of the Insurance Act, regulations notified by the IRDAI and Actuarial Practice Standards issued by the Institute of Actuaries of India in concurrence with the IRDAI. We have relied upon the Appointed Actuary’s certificate in this regard for forming our opinion on the financial statements of the Company.
Other InformationThe Company’s Board of Directors is responsible for the other information. The other information comprises the information included in the ‘the management report” and “Director’s report”, but does not include the financial statements and our auditor’s report thereon.
Our opinion on the financial statements does not cover the other information and we do not express any form of assurance conclusion thereon.
In connection with our audit of the financial statements, our responsibility is to read the other information and, in doing so, consider whether the other information is materially inconsistent with the financial statements or our knowledge obtained in the audit or otherwise appears to be materially misstated. If, based on the work we have performed, we conclude that there is a material misstatement of this other information; we are required to report that fact.
We have nothing to report in this regard.
Responsibilities of management for the financial statementsThe Company’s Board of Directors is responsible for the matters stated in section 134(5) of the Companies Act, 2013 with respect to the preparation of these financial statements that give a true and fair view of the financial position, financial performance, and receipts and payments of the Company in accordance with the requirements of the Insurance Act 1938, as amended by Insurance Laws (Amendment) Act, 2015 read with the IRDA Act, the Regulations, order/ directions

Annual Report 2018-19
76
Independent Auditors’ Report (Contd...)
issued by the IRDAI in this regard and in accordance with the accounting principles generally accepted in India, including the Companies (Accounting Standards) Rules, 2006 (as amended) specified under section 133 of the Act, read with the Companies (Accounts) Rules, 2014 as amended to the extent applicable and in the manner so required. This responsibility also includes maintenance of adequate accounting records in accordance with the provisions of the Act for safeguarding of the assets of the Company and for preventing and detecting frauds and other irregularities; selection and application of appropriate implementation and maintenance of accounting policies; making judgments and estimates that are reasonable and prudent; and design, implementation and maintenance of adequate internal financial controls, that were operating effectively for ensuring the accuracy and completeness of the accounting records, relevant to the preparation and presentation of the financial statement that give a true and fair view and are free from material misstatement, whether due to fraud or error.
In preparing the financial statements, management is responsible for assessing the Company’s ability to continue as a going concern, disclosing, as applicable, matters related to going concern and using the going concern basis of accounting unless management either intends to liquidate the Company or to cease operations, or has no realistic alternative but to do so. The Board of Directors are also responsible for overseeing the Company’s financial reporting process.
Auditor’s responsibilities for the audit of the financial statementsOur objectives are to obtain reasonable assurance about whether the financial statements as a whole are free from material misstatement, whether due to fraud or error, and to issue an auditor’s report that includes our opinion. Reasonable assurance is a high level of assurance, but is not a guarantee that an audit conducted in accordance with the SAs will always detect a material misstatement when it exists. Misstatements can arise from fraud or error and are considered material if, individually or in the aggregate, they could reasonably be expected to influence the economic decisions of users taken on the basis of these financial statements.
As part of an audit in accordance with the SAs, we exercise professional judgment and maintain professional scepticism throughout the audit. We also:
• Identify and assess the risks of material misstatement of the financial statements, whether due to fraud or error, design and perform audit procedures responsive to those risks, and obtain audit evidence that is sufficient and appropriate to provide a basis for our opinion. The risk of not detecting a material misstatement resulting from fraud is higher than for one resulting from error, as fraud may involve collusion, forgery, intentional omissions, misrepresentations, or the override of internal control.
• Obtain an understanding of internal control relevant to the audit in order to design audit procedures that are appropriate in the circumstances.
• Evaluate the appropriateness of accounting policies used and the reasonableness of accounting estimates and related disclosures made by management.
• Conclude on the appropriateness of management’s use of the going concern basis of accounting and, based on the audit evidence obtained, whether a material uncertainty exists related to events or conditions that may cast significant doubt on the Company’s ability to continue as a going concern. If we conclude that a material uncertainty exists, we are required to draw attention in our auditor’s report to the related disclosures in the financial statements or, if such disclosures are inadequate, to modify our opinion. Our conclusions are based on the audit evidence obtained up to the date of our auditor’s report. However, future events or conditions may cause the Company to cease to continue as a going concern.
• Evaluate the overall presentation, structure and content of the financial statements, including the disclosures, and whether the financial statements represent the underlying transactions and events in a manner that achieves fair presentation.
We communicate with those charged with governance regarding, among other matters, the planned scope and timing of the audit and significant audit findings, including any significant deficiencies in internal control that we identify during our audit.
We also provide those charged with governance with a statement that we have complied with relevant ethical requirements regarding independence, and to communicate with them all relationships and other matters that may reasonably be thought to bear on our independence, and where applicable, related safeguards.
77
STRA
TEG
IC R
EPO
RT /
STA
TUTO
RY R
EPO
RTS
/ F
INA
NCI
ALS
STA
TEM
ENTS
Report on other legal and regulatory requirements As required by the Regulations, we have issued a separate certificate dated April 24, 2019, certifying the matters specified in paragraphs 3 and 4 of Schedule C to the Regulations.
Further, to our comments in the Certificate referred to above, as required under the Regulations, read with Section 143 (3) of the Act, we report that:
a) We have sought and obtained all the information and explanations which to the best of our knowledge and belief were necessary for the purposes of our audit;
b) In our opinion and to the best of our information and according to the explanations given to us, proper books of account as required by law have been kept by the Company so far as it appears from our examination of those books;
c) The Balance Sheet, the Revenue Account, the Profit and Loss Account, and the Receipts and Payments Account dealt with by this Report are in agreement with the books of account;
d) In our opinion and to the best of our information and according to the explanations given to us, investments have been valued in accordance with the provisions of the Insurance Act, 1938 and the IRDA Financial Statements Regulations and/or orders/directions issued by the IRDAI in this behalf;
e) In our opinion and to the best of our information and according to the explanations given to us, the accounting policies selected by the Company are appropriate and are in compliance with the Accounting Standards referred to in Companies (Accounting Standards) Rules, 2006 (as amended) specified under section 133 of the Act, read with the Companies (Accounts) Rules, 2014 as amended, to the extent they are not inconsistent with the accounting principles prescribed in the IRDA Financial Statements Regulations and orders/directions issued by the IRDAI in this behalf;
f) In our opinion and to the best of our information and according to the explanations given to us, the Balance Sheet, the Revenue Account, the Profit and Loss Account and the Receipts and Payments Account dealt with by this report comply with the Accounting Standards referred to in Companies (Accounting Standards) Rules, 2006 (as amended) specified under section 133 of the Act, read with the Companies (Accounts) Rules, 2014 as amended, to the extent they are not inconsistent with the accounting principles prescribed in the IRDA Financial Statements Regulations and orders/directions issued by IRDAI in this regard; and
g) On the basis of the written representations received from the directors as on March 31, 2019, taken on record by the Board of Directors, none of the directors is disqualified as on March 31, 2019, from being appointed as a director in terms of Section 164 (2) of the Act;
h) As per the information and explanation given to us, the managerial remuneration has been paid in accordance with the provisions of Section 34A of the Insurance Act 1938. Sitting fees paid to the Directors is in compliance with Section 197 of the Companies Act, 2013.
i) With respect to the adequacy of the internal financial controls over financial reporting of the Company and the operating effectiveness of such controls, refer to our separate Report in “Annexure A”;
j) With respect to the other matters to be included in the Auditor’s Report in accordance with Rule 11 of the Companies (Audit and Auditors) Rules, 2014, in our opinion and to the best of our information and according to the explanations given to us:
i. The Company has disclosed the impact of pending litigations on its financial position in its financial statements – Refer Schedule 16 Note 3.1 on Contingent Liabilities to the financial statements;
ii. The Company has made provision, as required under the applicable law or accounting standards, for material foreseeable losses, if any, on long-term contracts including derivative contracts. Further, the Company does not have any derivative contracts;
iii. There were no amounts which were required to be transferred to the Investor Education and Protection Fund by the Company.
For Singhi & Co. For Pathak H.D. & Associates Chartered Accountants Chartered Accountants Firm Registration No. 302049E Firm Registration No. 107783W
Sukhendra Lodha Mukesh MehtaPartner Partner Membership No. 071272 Membership No. 043495
Place: MumbaiDate: April 24, 2019
Annual Report 2018-19
78
Annexure 1 (Contd...) to the Independent Auditors’ Report
[Referred to under Report on Other Legal and Regulatory Requirements in the Independent Auditor’s Report of even date to the members of Reliance Nippon Life Insurance Company Limited on the financial statements for the year ended March 31, 2019]
Report on the Internal Financial Controls over Financial Reporting under Clause (i) of Sub-section 3 of Section 143 of the Companies Act, 2013 (“the Act”)We have audited the internal financial controls over financial reporting of Reliance Nippon Life Insurance Company Limited (“the Company”) as of March 31, 2019 in conjunction with our audit of the financial statements of the Company for the year ended on that date.
Management’s Responsibility for Internal Financial ControlsThe Company’s management is responsible for establishing and maintaining internal financial controls based on the internal control over financial reporting criteria established by the Company considering the essential components of internal control stated in the Guidance Note on Audit of Internal Financial Controls Over Financial Reporting issued by the Institute of Chartered Accountants of India (“ICAI”). These responsibilities include the design, implementation and maintenance of adequate internal financial controls that were operating effectively for ensuring the orderly and efficient conduct of its business, including adherence to company’s policies, the safeguarding of its assets, the prevention and detection of frauds and errors, the accuracy and completeness of the accounting records, and the timely preparation of reliable financial information, as required under the Companies Act, 2013.
Auditors’ ResponsibilityOur responsibility is to express an opinion on the Company's internal financial controls over financial reporting based on our audit. We conducted our audit in accordance with the Guidance Note on Audit of Internal Financial Controls Over Financial Reporting (the “Guidance Note”) and the Standards on Auditing specified under section 143(10) of the Act to the extent applicable to an audit of internal financial controls, both issued by the ICAI. Those Standards and the Guidance Note require that we comply with ethical requirements and plan and perform the audit to obtain reasonable assurance about whether adequate internal financial controls over financial reporting was established and maintained and if such controls operated effectively in all material respects.
Our audit involves performing procedures to obtain audit evidence about the adequacy of the internal financial controls system over financial reporting and their operating effectiveness.
Our audit of internal financial controls over financial reporting included obtaining an understanding of internal financial controls over financial reporting, assessing the risk that a material weakness exists, and testing and evaluating the design and operating effectiveness of internal control based on the assessed risk. The procedures selected depend on the auditor’s judgement, including the assessment of the risks of material misstatement of the financial statements, whether due to fraud or error.
We believe that the audit evidence we have obtained is sufficient and appropriate to provide a basis for our audit opinion on the Company’s internal financial controls system over financial reporting.
Meaning of Internal Financial Controls Over Financial ReportingA company's internal financial control over financial reporting is a process designed to provide reasonable assurance regarding the reliability of financial reporting and the preparation of financial statements for external purposes in accordance with generally accepted accounting principles. A company's internal financial control over financial reporting includes those policies and procedures that (1) pertain to the maintenance of records that, in reasonable detail, accurately and fairly reflect the transactions and dispositions of the assets of the company;(2) provide reasonable assurance that transactions are recorded as necessary to permit preparation of financial statements in accordance with generally accepted accounting principles, and that receipts and expenditures of the company are being made only in accordance with authorisations of management and directors of the company; and (3) provide reasonable assurance regarding prevention or timely detection of unauthorised acquisition, use, or disposition of the company's assets that could have a material effect on the financial statements.
Inherent Limitations of Internal Financial Controls Over Financial Reporting
79
STRA
TEG
IC R
EPO
RT /
STA
TUTO
RY R
EPO
RTS
/ F
INA
NCI
ALS
STA
TEM
ENTS
Because of the inherent limitations of internal financial controls over financial reporting, including the possibility of collusion or improper management override of controls, material misstatements due to error or fraud may occur and not be detected. Also, projections of any evaluation of the internal financial controls over financial reporting to future periods are subject to the risk that the internal financial control over financial reporting may become inadequate because of changes in conditions, or that the degree of compliance with the policies or procedures may deteriorate.
OpinionIn our opinion, the Company has, in all material respects, an adequate internal financial controls system over financial reporting and such internal financial controls over financial reporting were operating effectively as at March 31, 2019, based on the internal control over financial reporting criteria established by the Company considering the essential components of internal control stated in the Guidance Note on Audit of Internal Financial Controls Over Financial Reporting issued by the ICAI.
Other MattersThe actuarial valuation of liabilities for life policies in-force and policies where premium is discontinued is required to be certified by the Appointed Actuary as per the regulations and has been relied upon by us, as mentioned in Other Matter Para of our audit report on the financial statements for the year ended March 31, 2019. Accordingly while giving our opinion with regards to adequacy and operating effectiveness of the Internal Financial Control system over financial reporting, in so far as it relates to the actuarial valuation of liabilities, we have placed reliance on the Appointed Actuary’s and the Risk Officer’s certificate.
For Singhi & Co. For Pathak H.D. & Associates Chartered Accountants Chartered Accountants Firm Registration No. 302049E Firm Registration No. 107783W
Sukhendra Lodha Mukesh MehtaPartner Partner Membership No. 071272 Membership No. 043495
Place: MumbaiDate: April 24, 2019
Annual Report 2018-19
80
Independent Auditors’ Certificate
1. At the request of RELIANCE NIPPON LIFE INSURANCE COMPANY LIMITED (the “Company”), we have performed the procedures stated in paragraph 2 below, for the purpose of issuing a certificate in connection with Regulation 13 (D) (7) of the Insurance Regulatory and Development Authority (Investment) (Fifth Amendment) Regulations, 2013 (the “Regulations”), regarding the declaration and application of Net Asset Value (“NAV”) for unit link business application received on the last business day.
2. In this connection, we have performed the following procedures:
a) Obtained representation from the management;
b) Obtained the certificate issued by the concurrent auditors of the Company for compliance with the requirements of the regulation;
c) Obtained the list of applications received in respect of Unit Linked Business on March 31, 2019 (referred to as “application forms”), from the management;
d) Selected samples of application forms from listing mentioned in paragraph 2(c) above and verified whether:
i) The applications received on Sunday, March 31, 2019, upto 3.00 pm have been processed with NAV of March 31, 2019; and
ii) The applications received on Sunday, March 31, 2019, after 3.00 pm have been processed with NAV of appropriate dates in subsequent year.
3. The compliance with conditions stated in the regulations is the responsibility of the Company’s management. Our responsibility is to perform the above-mentioned procedures on the particulars and state our findings. We performed the above-mentioned procedures, in accordance with the Guidance Note on Audit Reports and Certificates for Special Purposes issued by the Institute of Chartered Accountants of India (“ICAI”). The above-mentioned procedures include examining evidence supporting the particulars on a test basis. Further, our scope of work did not involve us performing audit tests for the purposes of expressing an opinion on the fairness or accuracy of any of the financial information or the financial statements of the Company taken as a whole. We have not performed an audit, the objective of which would be the expression of an opinion on the financial statements, specified elements, accounts or items thereof, for the purpose of this certificate. Accordingly, we do not express such opinion.
4. Based on the procedures performed by us, as mentioned in paragraph 2 above, according to the information and explanations provided to us and representation by the Company’s management, we confirm that:
(a) The Company has declared NAV for March 31, 2019;
(b) The applications received on Sunday, March 31, 2019 upto 3.00 pm have been processed with the NAV of March 31, 2019; and
(c) The applications received on Sunday, March 31, 2019 after 3.00 pm have been processed with the appropriate NAV of appropriate dates in subsequent year.
5. This certificate is issued at the request of the Company solely for use of the Company for inclusion in the annual accounts as per requirements as per Regulation 13 (D) (7)) of the Regulations and is not intended to be used or distributed for any other purpose. We have no responsibility to update this certificate for events and circumstances occurring after the date of this certificate.
For Singhi & Co. For Pathak H.D. & Associates Chartered Accountants Chartered Accountants Firm Registration No. 302049E Firm Registration No. 107783W
Sukhendra Lodha Mukesh Mehta Partner Partner Membership No. 071272 Membership No. 043495 UDIN - 19071272AAAAAH6161 UDIN - 19043495AAAAAS1206
Place: MumbaiDate: April 24, 2019

81
STRA
TEG
IC R
EPO
RT /
STA
TUTO
RY R
EPO
RTS
/ F
INA
NCI
ALS
STA
TEM
ENTS
Independent Auditors’ Certificate
To The Members of Reliance Nippon Life Insurance Company Limited
(Referred to in our Report on Other Legal and Regulatory Requirements forming part of the Independent Auditors’ Report dated April 24, 2019)
This certificate is issued to comply with the provisions of paragraphs 3 and 4 of Schedule C of the Insurance Regulatory and Development Authority (Preparation of Financial Statements and Auditor’s Report of Insurance Companies) Regulations 2002, (the “Regulations”) read with regulation 3 of the Regulations.
Management ResponsibilityThe Company’s Board of Directors is responsible for complying with the provisions of The Insurance Act, 1938 as amended from time to time including amendment brought by Insurance Laws (Amendment) Act, 2015 (the “Insurance Act”), the Insurance Regulatory and Development Authority Act, 1999 (the “IRDA Act”), the Insurance Regulatory and Development Authority (Preparation of Financial Statements and Auditor’s Report of Insurance Companies) Regulations, 2002 (the “ IRDA Financial Statements Regulations”), orders/directions issued by the Insurance Regulatory and Development Authority of India (the “IRDAI”). This includes collecting, collating and validating data and designing, implementing and monitoring of internal controls suitable for ensuring compliance as aforesaid.
Auditor’s ResponsibilityOur responsibility, for the purpose of this certificate, is limited to certifying matters contained in paragraphs 3 and 4 of Schedule C of the Regulations. We conducted our examination in accordance with the Guidance Note on Audit Reports and Certificates for Special Purposes issued by the Institute of Chartered Accountants of India (the ‘ICAI’).
OpinionIn accordance with the information and explanations given to us and to the best of our knowledge and belief and based on our examination of the books of accounts and other records maintained by Reliance Nippon Life Insurance Company Limited (the “Company”) for the year ended March 31, 2019, we certify that:
1. We have reviewed the Management Report attached to the financial statements for the year ended March 31, 2019 and have found no apparent mistake or material inconsistency with the financial statements;
2. Based on management representations and the compliance certificate submitted to the Board of Directors by the officers of the Company charged with compliance and the same being noted by the Board, nothing has come to our attention that causes us to believe that the Company has not complied with the terms and conditions of registration stipulated by IRDAI;
3. We have verified the cash balances, to the extent considered necessary and securities relating to Company’s investments as at March 31, 2019, by actual inspection or on the basis of certificates/ confirmations received from the Custodians and/or Depository Participants appointed by the Company, as the case may be.
4. The Company is not a trustee of any trust; and
5. No part of the assets of the Policyholders’ Funds has been directly or indirectly applied in contravention of the provisions of the Insurance Act relating to the application and investments of the Policyholders’ Funds.
For Singhi & Co. For Pathak H.D. & Associates Chartered Accountants Chartered Accountants Firm Registration No. 302049E Firm Registration No. 107783W
Sukhendra Lodha Mukesh Mehta Partner Partner Membership No. 071272 Membership No. 043495 UDIN - 19071272AAAAAF4814 UDIN - 19043495AAAAAQ8023
Place: MumbaiDate: April 24, 2019

Annual Report 2018-19
82
Revenue Accountfor the year ended 31st March, 2019 Policyholders’ Account (Technical Account)
(` ‘000)
Particulars Schedule Current Year Previous Year
Premiums earned – net
(a) Premium 1 4,35,79,268 4,06,93,707
(b) Reinsurance ceded (2,22,577) (2,76,836)
(c) Reinsurance accepted - -
4,33,56,691 4,04,16,871
Income from investments
(a) Interest, dividends & rent – gross 1,05,17,322 84,29,456
(b) Profit on sale/redemption of investments 75,48,313 1,11,29,278
(c) (Loss on sale/redemption of investments) (36,73,772) (22,28,305)
(d) Transfer/gain on revaluation/change in fair value 7,84,840 (28,86,056)
(e) Amortisation of premium/discount on investments 13,80,770 14,20,183
Other Income
(a) Miscellaneous Income 1,64,895 2,03,842
(b) Contribution from Shareholders' Account 12,23,252 16,34,425
Total (A) 6,13,02,311 5,81,19,694
Commission 2 17,33,563 15,80,762
Operating expenses related to insurance business 3 89,59,679 85,80,014
Provision for doubtful debts - -
Bad debts written off - -
Provision for tax - -
Provisions (other than taxation)
(a) For diminution in the value of investments (net) 4,83,782 -
(b) Others -Provision for standard assets - -
Service tax/GST on charges 3,44,152 3,59,992
Total (B) 1,15,21,176 1,05,20,768
Benefits paid (net) 4 3,53,85,108 2,97,07,943
Interim bonuses paid 7,046 7,050
Change in valuation of liability in respect of life policies
(a) Gross 1,20,65,329 1,52,26,476
(b) Amount ceded in reinsurance - -
(c) Amount accepted in reinsurance - -
Total (C) 4,74,57,483 4,49,41,469
Surplus/(Deficit) (D) = (A) - (B) - (C) 23,23,652 26,57,457
Appropriations
Transfer to Shareholders’ Account 14,97,218 13,16,045
Transfer to other reserves - -
Balance being funds for future appropriations 8,26,434 13,41,412
Total (E) 23,23,652 26,57,457

83
STRA
TEG
IC R
EPO
RT /
STA
TUTO
RY R
EPO
RTS
/ F
INA
NCI
ALS
STA
TEM
ENTS
(` ‘000)
Particulars Schedule Current Year Previous Year
Funds for future appropriations
Opening balance at the beginning of the year 19,97,489 6,56,077
Add: Current year appropriation 8,26,434 13,41,412
Balance carried forward to Balance Sheet 28,23,923 19,97,489
The break-up for the surplus is as below:-
(a) Interim bonuses paid 7,046 7,050
(b) Allocation of bonus to policyholders 19,09,380 15,35,831
(c) Surplus shown in the revenue account 23,23,652 26,57,457
(d) Total Surplus (a+b+c) 42,40,078 42,00,338
We state that all expenses of the Management incurred by the Company in respect of Life Insurance business transacted in India by the Company have been fully debited to the Policyholders Revenue Account as expenses.
hedules referred to above form an integral part of the financial statements. 16
As per our report of even date attached For and on behalf of the Board of Directors
For Singhi & Co. For Pathak H.D. & Associates Chartered Accountants Chartered Accountants Chairman of the meeting DirectorFirm Registration No. 302049E Firm Registration No. 107783W
Sukhendra Lodha Mukesh MehtaPartner Partner Director Executive Director & Membership No. 071272 Membership No. 043495 Chief Executive Officer
Appointed Actuary Chief Financial Officer
Company Secretary
Place: Mumbai, Place: Mumbai, Date: 24th April, 2019 Date: 24th April, 2019
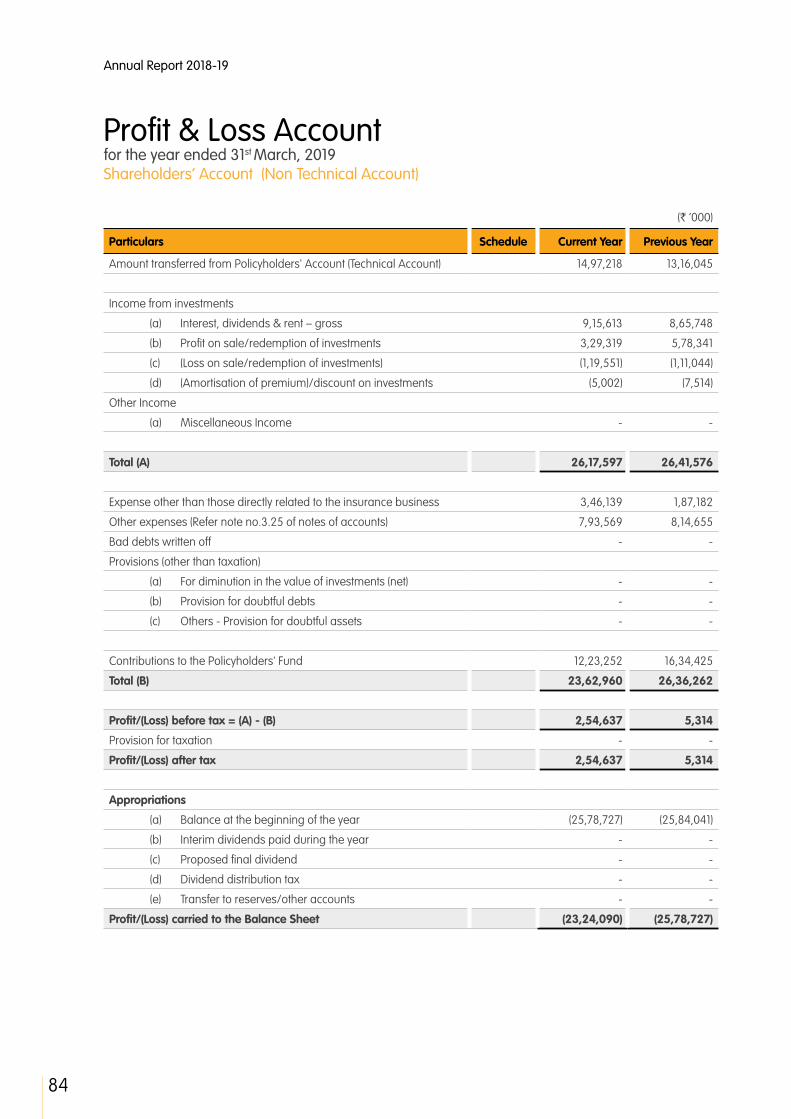
Annual Report 2018-19
84
Profit & Loss Accountfor the year ended 31st March, 2019 Shareholders’ Account (Non Technical Account)
(` ‘000)
Particulars Schedule Current Year Previous Year
Amount transferred from Policyholders' Account (Technical Account) 14,97,218 13,16,045
Income from investments
(a) Interest, dividends & rent – gross 9,15,613 8,65,748
(b) Profit on sale/redemption of investments 3,29,319 5,78,341
(c) (Loss on sale/redemption of investments) (1,19,551) (1,11,044)
(d) (Amortisation of premium)/discount on investments (5,002) (7,514)
Other Income
(a) Miscellaneous Income - -
Total (A) 26,17,597 26,41,576
Expense other than those directly related to the insurance business 3,46,139 1,87,182
Other expenses (Refer note no.3.25 of notes of accounts) 7,93,569 8,14,655
Bad debts written off - -
Provisions (other than taxation)
(a) For diminution in the value of investments (net) - -
(b) Provision for doubtful debts - -
(c) Others - Provision for doubtful assets - -
Contributions to the Policyholders' Fund 12,23,252 16,34,425
Total (B) 23,62,960 26,36,262
Profit/(Loss) before tax = (A) - (B) 2,54,637 5,314
Provision for taxation - -
Profit/(Loss) after tax 2,54,637 5,314
Appropriations
(a) Balance at the beginning of the year (25,78,727) (25,84,041)
(b) Interim dividends paid during the year - -
(c) Proposed final dividend - -
(d) Dividend distribution tax - -
(e) Transfer to reserves/other accounts - -
Profit/(Loss) carried to the Balance Sheet (23,24,090) (25,78,727)
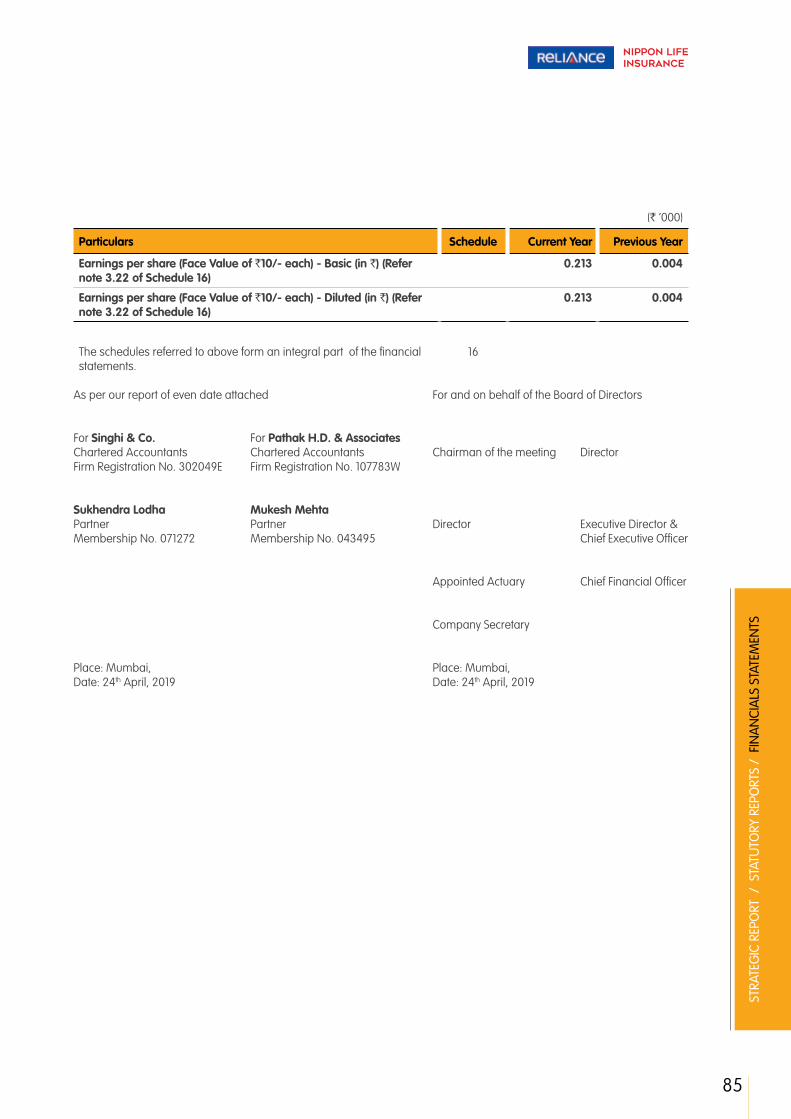
85
STRA
TEG
IC R
EPO
RT /
STA
TUTO
RY R
EPO
RTS
/ F
INA
NCI
ALS
STA
TEM
ENTS
(` ‘000)
Particulars Schedule Current Year Previous Year
Earnings per share (Face Value of `10/- each) - Basic (in `) (Refer note 3.22 of Schedule 16)
0.213 0.004
Earnings per share (Face Value of `10/- each) - Diluted (in `) (Refer note 3.22 of Schedule 16)
0.213 0.004
The schedules referred to above form an integral part of the financial statements.
16
As per our report of even date attached For and on behalf of the Board of Directors
For Singhi & Co. For Pathak H.D. & Associates Chartered Accountants Chartered Accountants Chairman of the meeting DirectorFirm Registration No. 302049E Firm Registration No. 107783W
Sukhendra Lodha Mukesh MehtaPartner Partner Director Executive Director & Membership No. 071272 Membership No. 043495 Chief Executive Officer
Appointed Actuary Chief Financial Officer
Company Secretary
Place: Mumbai, Place: Mumbai, Date: 24th April, 2019 Date: 24th April, 2019
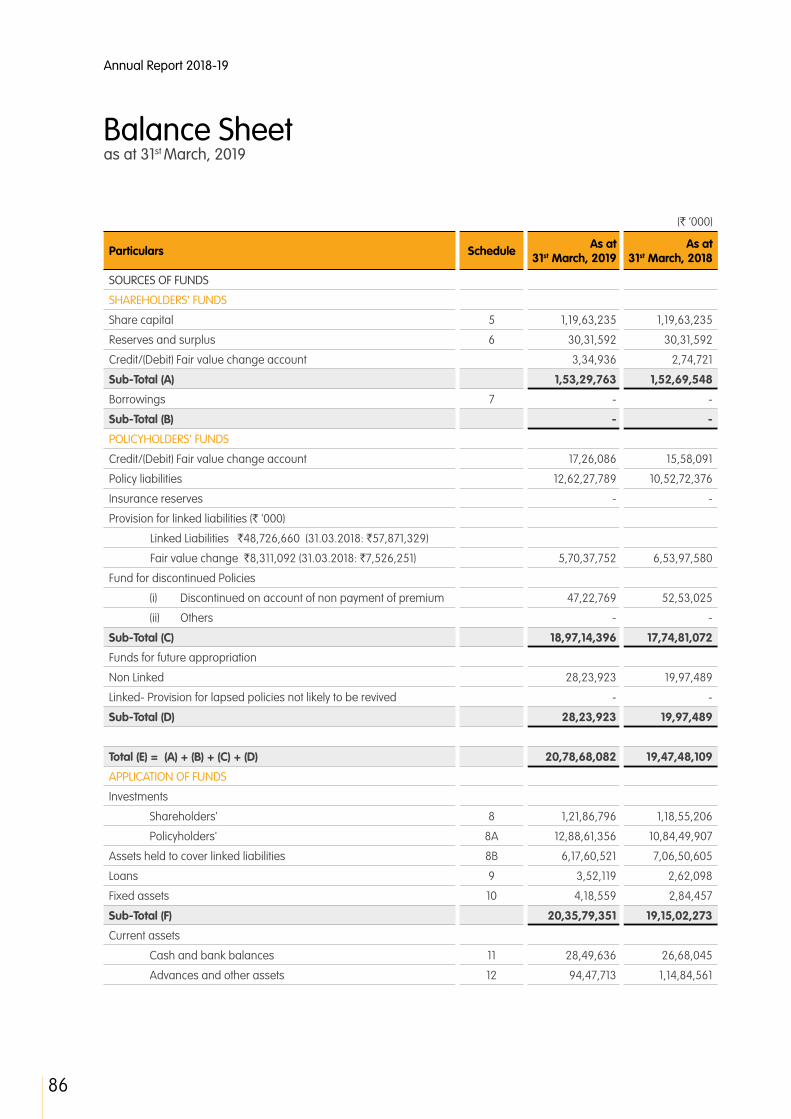
Annual Report 2018-19
86
Balance Sheetas at 31st March, 2019
(` ‘000)
Particulars Schedule As at 31st March, 2019
As at 31st March, 2018
SOURCES OF FUNDS
SHAREHOLDERS' FUNDS
Share capital 5 1,19,63,235 1,19,63,235
Reserves and surplus 6 30,31,592 30,31,592
Credit/(Debit) Fair value change account 3,34,936 2,74,721
Sub-Total (A) 1,53,29,763 1,52,69,548
Borrowings 7 - -
Sub-Total (B) - -
POLICYHOLDERS' FUNDS
Credit/(Debit) Fair value change account 17,26,086 15,58,091
Policy liabilities 12,62,27,789 10,52,72,376
Insurance reserves - -
Provision for linked liabilities (` '000)
Linked Liabilities `48,726,660 (31.03.2018: `57,871,329)
Fair value change `8,311,092 (31.03.2018: `7,526,251) 5,70,37,752 6,53,97,580
Fund for discontinued Policies
(i) Discontinued on account of non payment of premium 47,22,769 52,53,025
(ii) Others - -
Sub-Total (C) 18,97,14,396 17,74,81,072
Funds for future appropriation
Non Linked 28,23,923 19,97,489
Linked- Provision for lapsed policies not likely to be revived - -
Sub-Total (D) 28,23,923 19,97,489
Total (E) = (A) + (B) + (C) + (D) 20,78,68,082 19,47,48,109
APPLICATION OF FUNDS
Investments
Shareholders' 8 1,21,86,796 1,18,55,206
Policyholders' 8A 12,88,61,356 10,84,49,907
Assets held to cover linked liabilities 8B 6,17,60,521 7,06,50,605
Loans 9 3,52,119 2,62,098
Fixed assets 10 4,18,559 2,84,457
Sub-Total (F) 20,35,79,351 19,15,02,273
Current assets
Cash and bank balances 11 28,49,636 26,68,045
Advances and other assets 12 94,47,713 1,14,84,561

87
STRA
TEG
IC R
EPO
RT /
STA
TUTO
RY R
EPO
RTS
/ F
INA
NCI
ALS
STA
TEM
ENTS
(` ‘000)
Particulars Schedule As at 31st March, 2019
As at 31st March, 2018
Sub-Total (G) 1,22,97,349 1,41,52,606
Current liabilities 13 1,01,31,303 1,33,93,701
Provisions 14 2,01,405 91,796
Sub-Total (H) 1,03,32,708 1,34,85,497
Net Current Assets/(Liabilities) (I) = (G) – (H) 19,64,641 6,67,109
Miscellaneous expenditure (to the extent not written off or adjusted) 15 - -
Debit balance in Profit & Loss Account (Shareholders' account) 23,24,090 25,78,727
Sub-Total (J) 23,24,090 25,78,727
Total (K) = (F) + (I) + (J) 20,78,68,082 19,47,48,109
Significant accounting policies and notes to accounts 16
As per our report of even date attached For and on behalf of the Board of Directors
For Singhi & Co. For Pathak H.D. & Associates Chartered Accountants Chartered Accountants Chairman of the meeting DirectorFirm Registration No. 302049E Firm Registration No. 107783W
Sukhendra Lodha Mukesh MehtaPartner Partner Director Executive Director & Membership No. 071272 Membership No. 043495 Chief Executive Officer
Appointed Actuary Chief Financial Officer
Company Secretary
Place: Mumbai, Place: Mumbai, Date: 24th April, 2019 Date: 24th April, 2019

Annual Report 2018-19
88
Receipts and Payments Account (Cash Flow Statement) for the year ended 31st March, 2019
(` ‘000)
Particulars Current Year Previous Year
Cash flow from Operating Activities
Premium received from policyholders, including advance receipts 4,35,26,672 4,07,97,740
Other receipts 1,60,778 81,478
Payments (to)/received from the re-insurers, net of commissions and claims/benefits
1,62,417 (1,58,063)
Payments of claims/benefits (3,75,20,163) (2,82,58,474)
Payments of commission and brokerage (18,12,881) (15,30,521)
Payments of other operating expenses (99,08,294) (72,23,652)
Deposits and advances 3,74,736 (2,60,110)
Income taxes paid (Net) (31,551) (15,116)
Service tax/GST paid (3,44,152) (3,59,992)
Net cash inflow/(outflow) from operating activities (53,92,438) 30,73,290
Cash flow from extraordinary operations - -
Net cash inflow/(outflow) from operating activities (A) (53,92,438) 30,73,290
Cash flow from Investing Activities
Purchase of fixed assets (3,06,693) (1,91,971)
Proceeds from sale of fixed assets 5,394 391
Purchases of investments (11,08,30,754) (13,53,96,208)
Loans (disbursed) / repayment received - -
Loans against policies (1,56,871) (1,17,518)
Sales of investments 14,20,48,293 12,46,62,317
Repayments received of Loans agasint policies 66,850 72,627
Rents/Interests/Dividends received 1,09,30,419 88,89,888
Investments in money market instruments and in liquid mutual funds (Net)
(3,61,89,028) (2,15,986)
Expenses related to investments (12,172) (10,672)
Net cash generated/(used) in investing activities (B) 55,55,438 (23,07,132)
Cash flow from financing activities
Proceeds from issue of share capital - -
Proceeds of Share Premium from issue of share capital - -
Loans (disbursed) / repayment received - -
Final dividend paid - -
Dividend distribution tax - -
Net cash inflow/(outflow) from financing activities (C) - -
Effect of foreign exchange rates on cash and cash equivalents, net (D) (1,276) (826)
Cash and Cash Equivalents
Net increase/(decrease) in cash and cash equivalents (A+B+C+D) 1,61,724 7,65,332

89
STRA
TEG
IC R
EPO
RT /
STA
TUTO
RY R
EPO
RTS
/ F
INA
NCI
ALS
STA
TEM
ENTS
(` ‘000)
Particulars Current Year Previous Year
Cash and cash equivalents at the beginning of the year 26,90,373 19,25,041
Cash and cash equivalents at the end of the year 28,52,097 26,90,373
Net increase/(decrease) in cash and cash equivalents 1,61,724 7,65,332
Notes :
1. Cash and Cash Equivalents at the end of the year as per Balance Sheet
28,49,636 26,68,045
Add : Bank balance as per schedule 8B and Schedule 8A 2,461 22,328
28,52,097 26,90,373
2. Refer Schedule 11 for components of 'Cash and cash equivalents'. Receipts and Payments account has been prepared under the “Direct method” in accordance with Accounting Standard 3 Cash Flow Statements Significant accounting policies and notes to accounts 16 The schedules referred to above form an integral part of the financial statements.
As per our report of even date attached For and on behalf of the Board of Directors
For Singhi & Co. For Pathak H.D. & Associates Chartered Accountants Chartered Accountants Chairman of the meeting DirectorFirm Registration No. 302049E Firm Registration No. 107783W
Sukhendra Lodha Mukesh MehtaPartner Partner Director Executive Director & Membership No. 071272 Membership No. 043495 Chief Executive Officer
Appointed Actuary Chief Financial Officer
Company Secretary
Place: Mumbai, Place: Mumbai, Date: 24th April, 2019 Date: 24th April, 2019
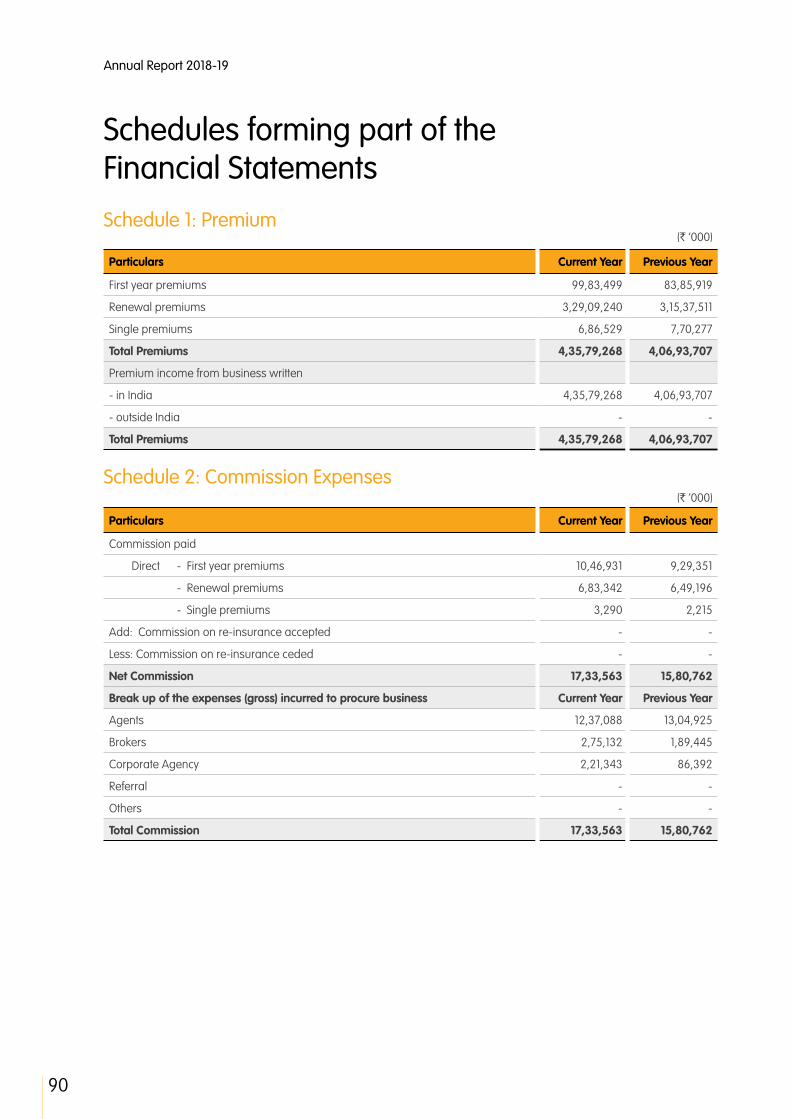
Annual Report 2018-19
90
Schedules forming part of the Financial StatementsSchedule 1: Premium
(` ‘000)
Particulars Current Year Previous Year
First year premiums 99,83,499 83,85,919
Renewal premiums 3,29,09,240 3,15,37,511
Single premiums 6,86,529 7,70,277
Total Premiums 4,35,79,268 4,06,93,707
Premium income from business written
- in India 4,35,79,268 4,06,93,707
- outside India - -
Total Premiums 4,35,79,268 4,06,93,707
Schedule 2: Commission Expenses(` ‘000)
Particulars Current Year Previous Year
Commission paid
Direct - First year premiums 10,46,931 9,29,351
- Renewal premiums 6,83,342 6,49,196
- Single premiums 3,290 2,215
Add: Commission on re-insurance accepted - -
Less: Commission on re-insurance ceded - -
Net Commission 17,33,563 15,80,762
Break up of the expenses (gross) incurred to procure business Current Year Previous Year
Agents 12,37,088 13,04,925
Brokers 2,75,132 1,89,445
Corporate Agency 2,21,343 86,392
Referral - -
Others - -
Total Commission 17,33,563 15,80,762
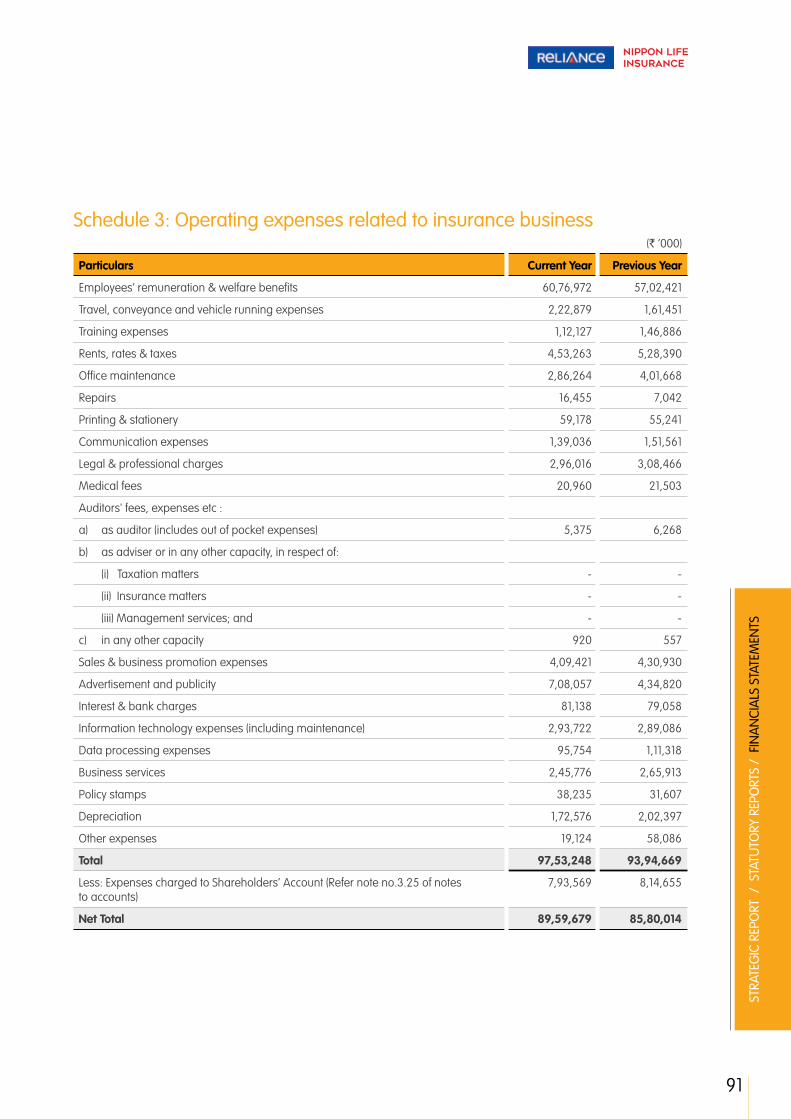
91
STRA
TEG
IC R
EPO
RT /
STA
TUTO
RY R
EPO
RTS
/ F
INA
NCI
ALS
STA
TEM
ENTS
Schedule 3: Operating expenses related to insurance business(` ‘000)
Particulars Current Year Previous Year
Employees’ remuneration & welfare benefits 60,76,972 57,02,421
Travel, conveyance and vehicle running expenses 2,22,879 1,61,451
Training expenses 1,12,127 1,46,886
Rents, rates & taxes 4,53,263 5,28,390
Office maintenance 2,86,264 4,01,668
Repairs 16,455 7,042
Printing & stationery 59,178 55,241
Communication expenses 1,39,036 1,51,561
Legal & professional charges 2,96,016 3,08,466
Medical fees 20,960 21,503
Auditors' fees, expenses etc :
a) as auditor (includes out of pocket expenses) 5,375 6,268
b) as adviser or in any other capacity, in respect of:
(i) Taxation matters - -
(ii) Insurance matters - -
(iii) Management services; and - -
c) in any other capacity 920 557
Sales & business promotion expenses 4,09,421 4,30,930
Advertisement and publicity 7,08,057 4,34,820
Interest & bank charges 81,138 79,058
Information technology expenses (including maintenance) 2,93,722 2,89,086
Data processing expenses 95,754 1,11,318
Business services 2,45,776 2,65,913
Policy stamps 38,235 31,607
Depreciation 1,72,576 2,02,397
Other expenses 19,124 58,086
Total 97,53,248 93,94,669
Less: Expenses charged to Shareholders’ Account (Refer note no.3.25 of notes to accounts)
7,93,569 8,14,655
Net Total 89,59,679 85,80,014

Annual Report 2018-19
92
Schedule 4: Benefits paid (net)(` ‘000)
Particulars Current Year Previous Year
1. Insurance claims:
(a) Claims by death 19,40,272 18,44,834
(b) Claims by maturity 62,40,762 55,85,748
(c) Annuities / Pension payment 24,449 18,441
(d) Other benefits:
- Survival benefit 52,53,623 57,44,965
- Health benefit 14,598 19,118
- Critical illness rider 2,264 3,030
- Claims investigation expenses 12,683 11,225
(e) Surrenders 2,19,22,796 1,63,32,763
(f) Others 1,78,578 3,80,821
2. Amount ceded in reinsurance (net of reversals, if any):
(a) Claims by death (2,04,245) (2,32,157)
(b) Claims by maturity - -
(c) Annuities / Pension payment - -
(d) Other benefits: - -
- Health benefit (672) (845)
3. Amount accepted in reinsurance:
(a) Claims by death - -
(b) Claims by maturity - -
(c) Annuities / Pension payment - -
(d) Other benefits - -
Total 3,53,85,108 2,97,07,943
Schedule 5: Share capital(` ‘000)
Particulars As at 31st March, 2019
As at 31st March, 2018
Authorised Capital2,200,000,000 (31.03.2018 : 2,200,000,000) equity shares of `10 each 2,20,00,000 2,20,00,000
Issued Capital1,196,323,500 (31.03.2018 : 1,196,323,500) equity shares of `10 each 1,19,63,235 1,19,63,235
Subscribed Capital1,196,323,500 (31.03.2018 : 1,196,323,500) equity shares of `10 each 1,19,63,235 1,19,63,235
Called-up Capital1,196,323,500 (31.03.2018 : 1,196,323,500) equity shares of `10 each 1,19,63,235 1,19,63,235
Less : Calls unpaid - -
Add : Shares forfeited (amount originally paid up) - -
Less : Par value of equity shares bought back - -
Less : Preliminary expenses - -
Less : Expenses including commission or brokerage on underwriting or subscription of shares
- -
Total 1,19,63,235 1,19,63,235
Schedules forming part of the Financial Statements
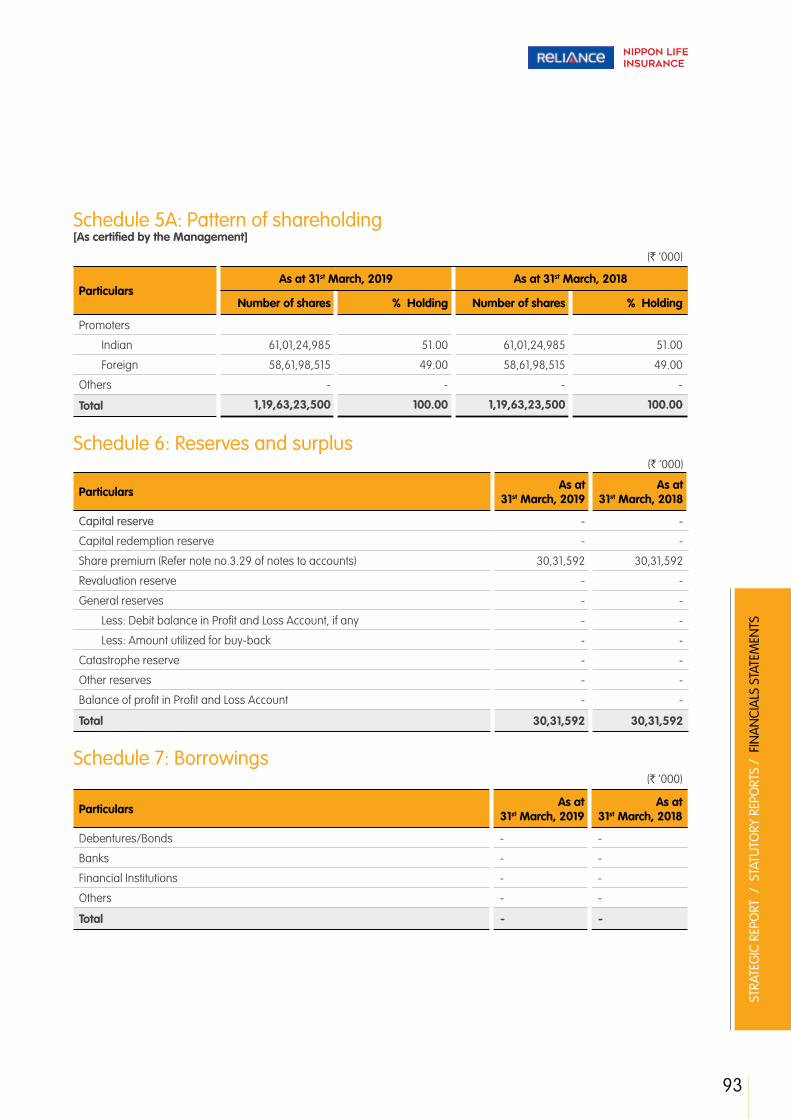
93
STRA
TEG
IC R
EPO
RT /
STA
TUTO
RY R
EPO
RTS
/ F
INA
NCI
ALS
STA
TEM
ENTS
Schedule 5A: Pattern of shareholding[As certified by the Management]
(` ‘000)
ParticularsAs at 31st March, 2019 As at 31st March, 2018
Number of shares % Holding Number of shares % Holding
Promoters
Indian 61,01,24,985 51.00 61,01,24,985 51.00
Foreign 58,61,98,515 49.00 58,61,98,515 49.00
Others - - - -
Total 1,19,63,23,500 100.00 1,19,63,23,500 100.00
Schedule 6: Reserves and surplus(` ‘000)
Particulars As at 31st March, 2019
As at 31st March, 2018
Capital reserve - -
Capital redemption reserve - -
Share premium (Refer note no.3.29 of notes to accounts) 30,31,592 30,31,592
Revaluation reserve - -
General reserves - -
Less: Debit balance in Profit and Loss Account, if any - -
Less: Amount utilized for buy-back - -
Catastrophe reserve - -
Other reserves - -
Balance of profit in Profit and Loss Account - -
Total 30,31,592 30,31,592
Schedule 7: Borrowings(` ‘000)
Particulars As at 31st March, 2019
As at 31st March, 2018
Debentures/Bonds - -
Banks - -
Financial Institutions - -
Others - -
Total - -

Annual Report 2018-19
94
Schedule 8: Investments - Shareholders’(` ‘000)
Particulars As at 31st March, 2019
As at 31st March, 2018
LONG TERM INVESTMENTSGovernment securities and Government guaranteed bonds including Treasury Bills 33,98,682 33,74,855
Other approved securities 28,08,575 23,74,898
Other investments
(a) Shares
(aa) Equity 16,87,359 19,01,792
(bb) Preference - -
(b) Mutual Funds/ETF 18,203 49,237
(c) Derivative instruments - -
(d) Debentures/Bonds 11,60,593 14,99,134
(e) Other securities - FD 1,29,039 1,19,079
(f) Subsidiaries - -
(g) Investment properties - Real Estate - -
Investments in infrastructure and social sector - Equity/Debt Securities 14,57,202 16,07,613
Other than approved investments - Equity/Debt Securities 8,91,453 4,43,266
1,15,51,106 1,13,69,874 SHORT TERM INVESTMENTSGovernment securities and Government guaranteed bonds including Treasury Bills - 4,998
Other approved securities - -
Other investments - -
(a) Shares - -
(aa) Equity - -
(bb) Preference - -
(b) Mutual Funds - -
(c) Derivative instruments - -
(d) Debentures/Bonds 14,986 5,029
(e) Other securities - CBLO/FD 2,70,977 1,75,393
(f) Subsidiaries - -
(g) Investment properties - Real Estate - -
Investments in infrastructure and social sector - Debt Securities 49,766 -
Other than approved investments 2,99,961 2,99,912
6,35,690 4,85,332 Total 1,21,86,796 1,18,55,206
Note:1. The aggregate amount of investments other than listed equity shares ,mutual funds , infrastructure investment trusts
and derivative instruments is ` 9,744,235 thousands (31.03.2018 : ` 92,58,392 thousands) and market value thereof is ` 9,970,997 thousands (31.03.2018 : ` 95,64,892 thousands).
2. Includes Government securities of ` 48,493 thousands (market value ` 50,455 thousands) - 7.16% GOI 2023 (MD -20/05/2023), {( 31.03.2018 : ` 48,199 thousands (market value ` 49,500 thousands) )} deposited with CCIL as collateral security for trades in Collateralised Borrowing and Lending Obligation (CBLO) segment as at 31.03.2019.
3. Includes Government securities of ` 255,914 thousands (market value ` 261,496 thousands) - 8.83% GOI CG 25-11-2023, (31.03.2018 : ` 482,247 thousands (market value ` 493,874 thousands) ) deposited with CCIL as collateral security for trades in Securities Segment as at 31.03.2019.
Schedules forming part of the Financial Statements
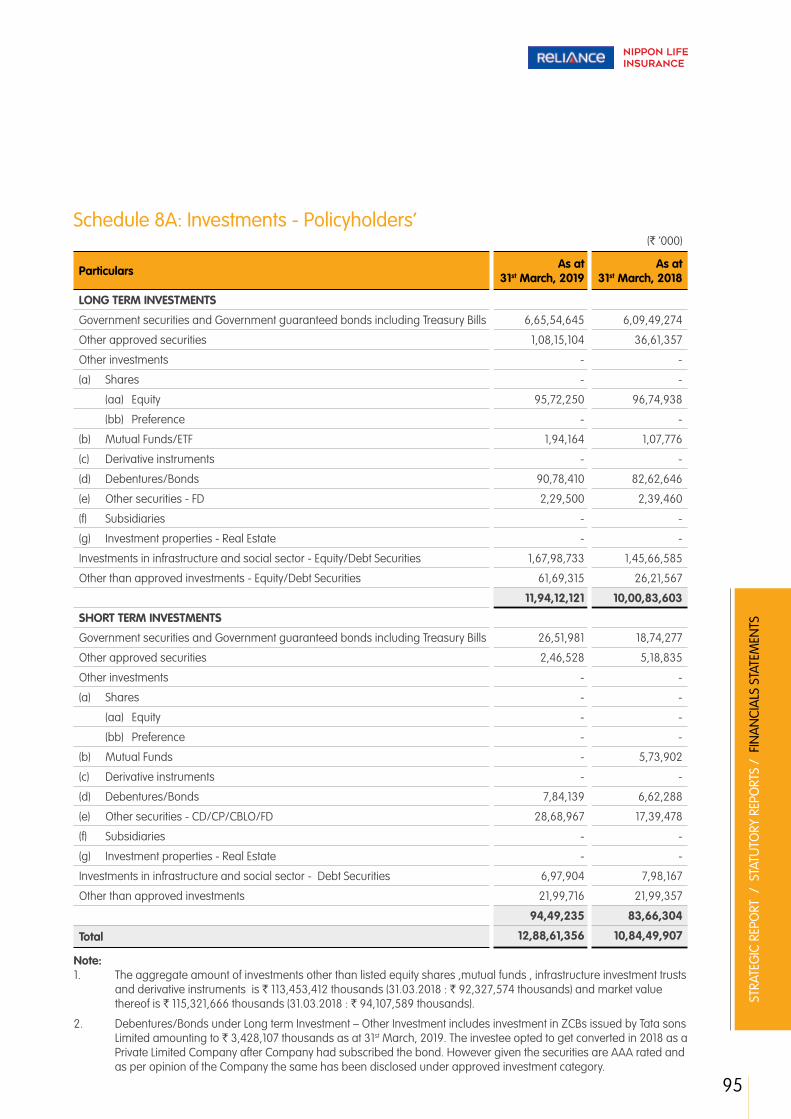
95
STRA
TEG
IC R
EPO
RT /
STA
TUTO
RY R
EPO
RTS
/ F
INA
NCI
ALS
STA
TEM
ENTS
Schedule 8A: Investments - Policyholders’(` ‘000)
Particulars As at 31st March, 2019
As at 31st March, 2018
LONG TERM INVESTMENTS
Government securities and Government guaranteed bonds including Treasury Bills 6,65,54,645 6,09,49,274
Other approved securities 1,08,15,104 36,61,357
Other investments - -
(a) Shares - -
(aa) Equity 95,72,250 96,74,938
(bb) Preference - -
(b) Mutual Funds/ETF 1,94,164 1,07,776
(c) Derivative instruments - -
(d) Debentures/Bonds 90,78,410 82,62,646
(e) Other securities - FD 2,29,500 2,39,460
(f) Subsidiaries - -
(g) Investment properties - Real Estate - -
Investments in infrastructure and social sector - Equity/Debt Securities 1,67,98,733 1,45,66,585
Other than approved investments - Equity/Debt Securities 61,69,315 26,21,567
11,94,12,121 10,00,83,603
SHORT TERM INVESTMENTS
Government securities and Government guaranteed bonds including Treasury Bills 26,51,981 18,74,277
Other approved securities 2,46,528 5,18,835
Other investments - -
(a) Shares - -
(aa) Equity - -
(bb) Preference - -
(b) Mutual Funds - 5,73,902
(c) Derivative instruments - -
(d) Debentures/Bonds 7,84,139 6,62,288
(e) Other securities - CD/CP/CBLO/FD 28,68,967 17,39,478
(f) Subsidiaries - -
(g) Investment properties - Real Estate - -
Investments in infrastructure and social sector - Debt Securities 6,97,904 7,98,167
Other than approved investments 21,99,716 21,99,357
94,49,235 83,66,304
Total 12,88,61,356 10,84,49,907
Note:1. The aggregate amount of investments other than listed equity shares ,mutual funds , infrastructure investment trusts
and derivative instruments is ` 113,453,412 thousands (31.03.2018 : ` 92,327,574 thousands) and market value thereof is ` 115,321,666 thousands (31.03.2018 : ` 94,107,589 thousands).
2. Debentures/Bonds under Long term Investment – Other Investment includes investment in ZCBs issued by Tata sons Limited amounting to ` 3,428,107 thousands as at 31st March, 2019. The investee opted to get converted in 2018 as a Private Limited Company after Company had subscribed the bond. However given the securities are AAA rated and as per opinion of the Company the same has been disclosed under approved investment category.
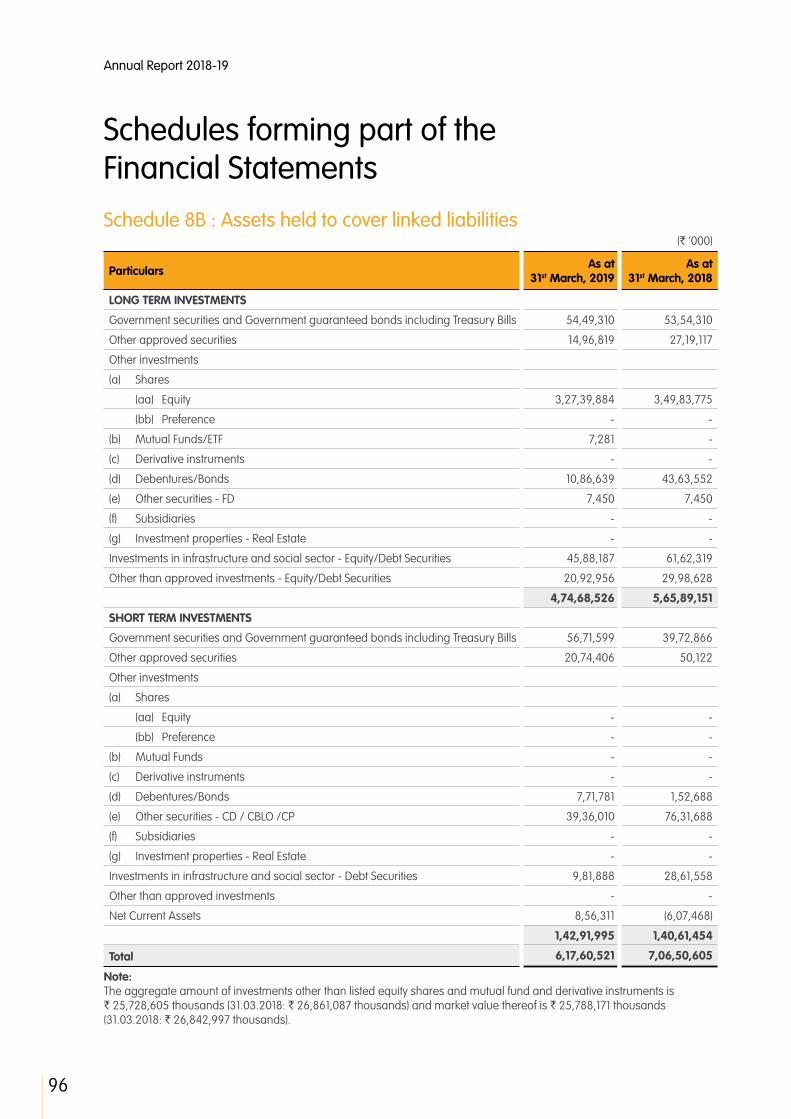
Annual Report 2018-19
96
Schedule 8B : Assets held to cover linked liabilities(` ‘000)
Particulars As at 31st March, 2019
As at 31st March, 2018
LONG TERM INVESTMENTS
Government securities and Government guaranteed bonds including Treasury Bills 54,49,310 53,54,310
Other approved securities 14,96,819 27,19,117
Other investments
(a) Shares
(aa) Equity 3,27,39,884 3,49,83,775
(bb) Preference - -
(b) Mutual Funds/ETF 7,281 -
(c) Derivative instruments - -
(d) Debentures/Bonds 10,86,639 43,63,552
(e) Other securities - FD 7,450 7,450
(f) Subsidiaries - -
(g) Investment properties - Real Estate - -
Investments in infrastructure and social sector - Equity/Debt Securities 45,88,187 61,62,319
Other than approved investments - Equity/Debt Securities 20,92,956 29,98,628
4,74,68,526 5,65,89,151
SHORT TERM INVESTMENTS
Government securities and Government guaranteed bonds including Treasury Bills 56,71,599 39,72,866
Other approved securities 20,74,406 50,122
Other investments
(a) Shares
(aa) Equity - -
(bb) Preference - -
(b) Mutual Funds - -
(c) Derivative instruments - -
(d) Debentures/Bonds 7,71,781 1,52,688
(e) Other securities - CD / CBLO /CP 39,36,010 76,31,688
(f) Subsidiaries - -
(g) Investment properties - Real Estate - -
Investments in infrastructure and social sector - Debt Securities 9,81,888 28,61,558
Other than approved investments - -
Net Current Assets 8,56,311 (6,07,468)
1,42,91,995 1,40,61,454
Total 6,17,60,521 7,06,50,605
Note:The aggregate amount of investments other than listed equity shares and mutual fund and derivative instruments is ` 25,728,605 thousands (31.03.2018: ` 26,861,087 thousands) and market value thereof is ` 25,788,171 thousands (31.03.2018: ` 26,842,997 thousands).
Schedules forming part of the Financial Statements
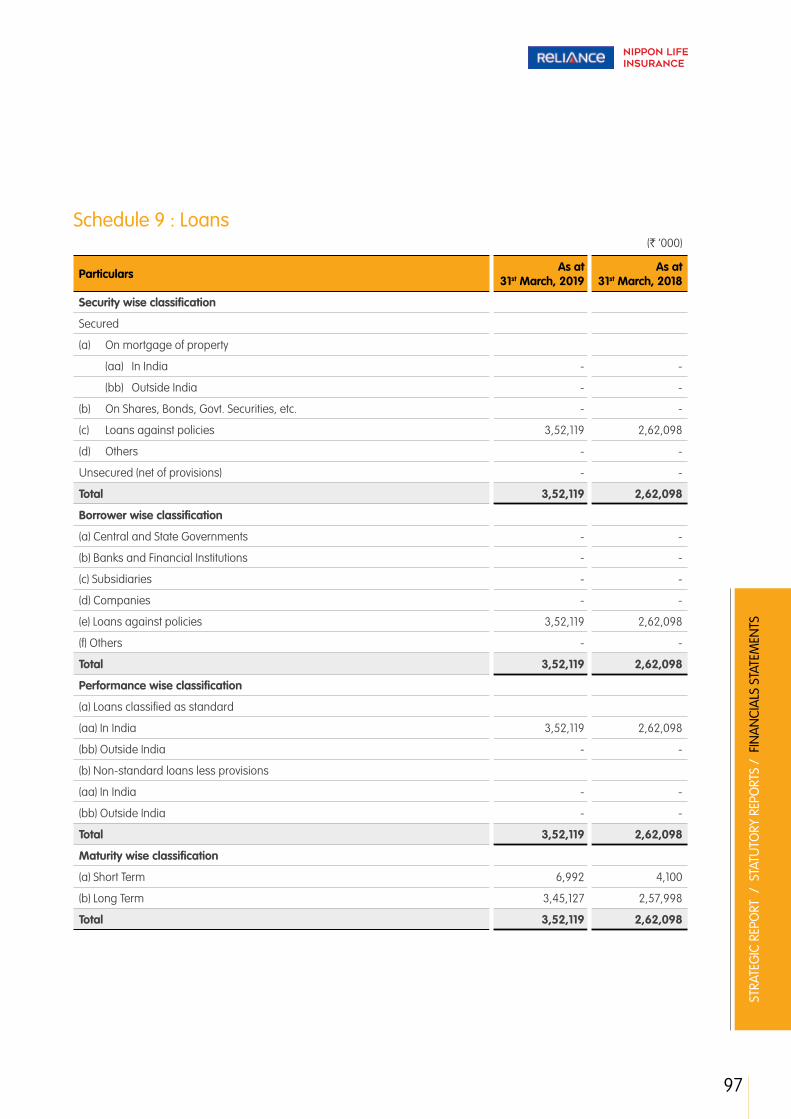
97
STRA
TEG
IC R
EPO
RT /
STA
TUTO
RY R
EPO
RTS
/ F
INA
NCI
ALS
STA
TEM
ENTS
Schedule 9 : Loans(` ‘000)
Particulars As at 31st March, 2019
As at 31st March, 2018
Security wise classification
Secured
(a) On mortgage of property
(aa) In India - -
(bb) Outside India - -
(b) On Shares, Bonds, Govt. Securities, etc. - -
(c) Loans against policies 3,52,119 2,62,098
(d) Others - -
Unsecured (net of provisions) - -
Total 3,52,119 2,62,098
Borrower wise classification
(a) Central and State Governments - -
(b) Banks and Financial Institutions - -
(c) Subsidiaries - -
(d) Companies - -
(e) Loans against policies 3,52,119 2,62,098
(f) Others - -
Total 3,52,119 2,62,098
Performance wise classification
(a) Loans classified as standard
(aa) In India 3,52,119 2,62,098
(bb) Outside India - -
(b) Non-standard loans less provisions
(aa) In India - -
(bb) Outside India - -
Total 3,52,119 2,62,098
Maturity wise classification
(a) Short Term 6,992 4,100
(b) Long Term 3,45,127 2,57,998
Total 3,52,119 2,62,098
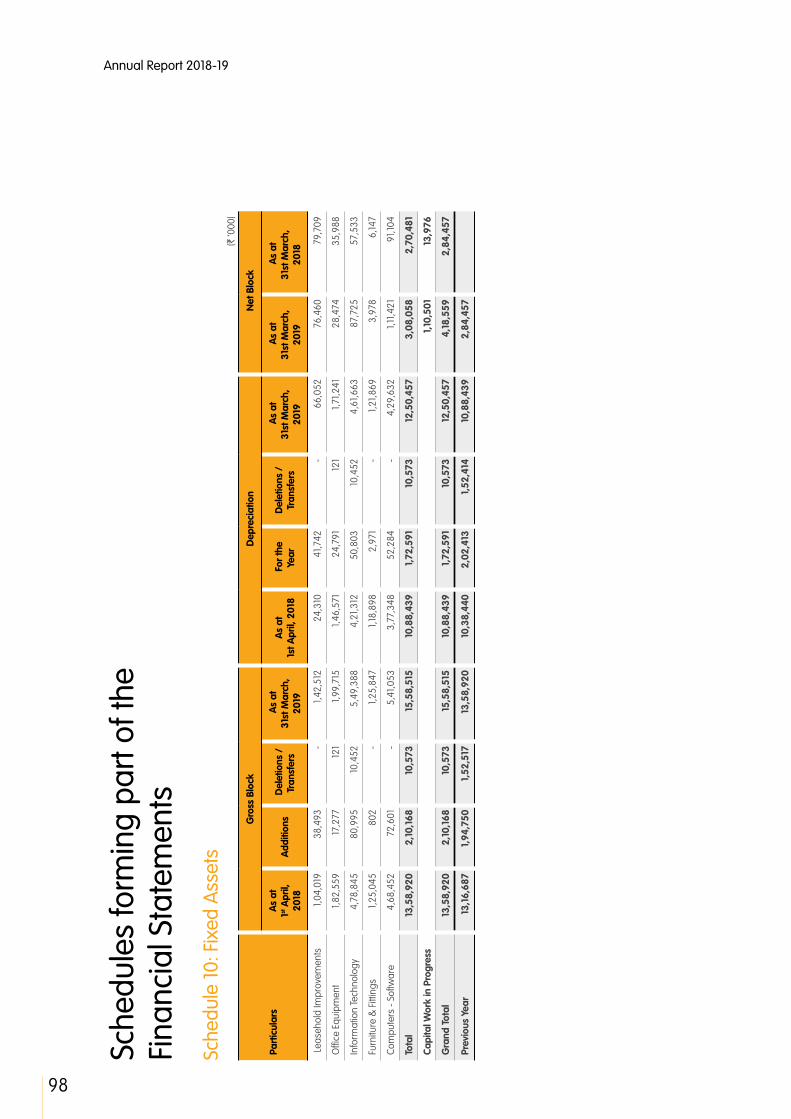
Annual Report 2018-19
98
Sche
dule
10: F
ixed
Ass
ets
(` ‘0
00)
Part
icul
ars
Gro
ss B
lock
Dep
reci
atio
n N
et B
lock
As
at1st
Apr
il,
2018
Add
ition
s D
elet
ions
/
Tran
sfer
s
As
at
31
st M
arch
, 20
19
As
at
1st A
pril,
201
8 F
or th
e Ye
arD
elet
ions
/
Tran
sfer
s
As
at
31
st M
arch
, 20
19
As
at
31
st M
arch
, 20
19
As
at
31st
Mar
ch,
2018
Lea
seho
ld Im
prov
emen
ts
1,04
,019
3
8,49
3 -
1,42
,512
2
4,31
0 4
1,742
-
66,
052
76,
460
79,
709
Offi
ce E
quip
men
t 1,
82,5
59
17,2
77
121
1,99
,715
1,
46,5
71
24,
791
121
1,71
,241
2
8,47
4 3
5,98
8
Info
rmat
ion
Tech
nolo
gy
4,7
8,84
5 8
0,99
5 10
,452
5
,49,
388
4,2
1,312
5
0,80
3 10
,452
4
,61,6
63
87,
725
57,
533
Furn
iture
& F
ittin
gs
1,25
,045
8
02
- 1,
25,8
47
1,18
,898
2
,971
-
1,21
,869
3
,978
6
,147
Com
pute
rs -
Softw
are
4,6
8,45
2 7
2,60
1 -
5,4
1,053
3
,77,
348
52,
284
- 4
,29,
632
1,11
,421
9
1,104
Tota
l 1
3,58
,920
2
,10,
168
10,
573
15,
58,5
15
10,
88,4
39
1,7
2,59
1 1
0,57
3 1
2,50
,457
3
,08,
058
2,7
0,48
1
Capi
tal W
ork
in P
rogr
ess
1,1
0,50
1 1
3,97
6
Gra
nd T
otal
1
3,58
,920
2
,10,
168
10,
573
15,
58,5
15
10,
88,4
39
1,7
2,59
1 1
0,57
3 1
2,50
,457
4
,18,
559
2,8
4,45
7
Prev
ious
Yea
r 1
3,16
,687
1
,94,
750
1,5
2,51
7 1
3,58
,920
1
0,38
,440
2
,02,
413
1,5
2,41
4 1
0,88
,439
2
,84,
457
Sche
dule
s fo
rmin
g pa
rt of
the
Fi
nanc
ial S
tate
men
ts

99
STRA
TEG
IC R
EPO
RT /
STA
TUTO
RY R
EPO
RTS
/ F
INA
NCI
ALS
STA
TEM
ENTS
Schedule 11: Cash and Bank balances(` ‘000)
Particulars As at 31st March, 2019
As at 31st March, 2018
Cash (including cheques in hand, drafts and stamps) 8,81,840 6,57,210 Bank Balances(a) Deposit Accounts
(aa) Short-term (due within 12 months of the date of the Balance Sheet) 998 3,520 (bb) Others 1,60,095 1,57,500
(b) Current Accounts 18,06,703 18,49,815 (c) Others - - Money at Call and Short Notice(a) With Banks - - (b) With other Institutions - - Others - - Total 28,49,636 26,68,045 Balances with non-scheduled banks included above - - Cash and Bank BalancesIn India 28,45,113 26,65,670 Outside India 4,523 2,375 Total 28,49,636 26,68,045
Schedule 12: Advances and other assets(` ‘000)
Particulars As at 31st March, 2019
As at 31st March, 2018
AdvancesReserve deposits with ceding companies - - Application money for investments - - Prepayments 1,11,474 44,712 Advances to Directors / Officers - - Advance tax paid and taxes deducted at source (net of provision for taxation) 74,529 42,978 Others - Advances for expenses 1,15,777 78,021 Total (A) 3,01,780 1,65,711 Other AssetsIncome accrued on investments 33,93,353 27,64,605 Outstanding premiums 18,25,172 20,34,022 Agents’ balances - - Foreign agencies balances - - Due from other entities carrying on insurance business (including reinsurers) 1,26,814 2,39,988 Due from subsidiaries/holding company - - Deposit with RBI [Pursuant to section 7 of Insurance Act, 1938] - - Others
Deposits for offices and staff residences etc. 3,58,898 3,40,428 Other receivable 1,99,860 2,13,999 Less Provisions for other receivable (63,902) (48,047)Sundry Debtors - (Investments) 24,605 4,39,763 Service Tax / GST Unutilised Credits 85,470 1,29,354 Unclaimed Fund 30,25,202 45,88,386 Income on Unclaimed Fund 1,70,461 6,16,352
Total (B) 91,45,933 1,13,18,850 Total (A+B) 94,47,713 1,14,84,561

Annual Report 2018-19
100
Schedule 13: Current liabilities(` ‘000)
Particulars As at 31st March, 2019
As at 31st March, 2018
Agents’ balances 2,52,875 3,32,193 Balances due to other insurance companies 2,05,298 1,73,166 Deposits held on re-insurance ceded - - Premiums received in advance 1,65,156 2,97,730 Unallocated premium (deposits pending underwriting) 9,83,092 8,72,113 Sundry creditors 34,81,987 45,52,783 Due to subsidiaries/holding company - - Claims outstanding 15,84,834 17,38,702 Unclaimed amount of policyholders 30,25,202 45,88,386 Income on Unclaimed Fund 1,70,461 6,16,352 Annuities due - - Due to Officers/Directors - - Others - Proposal deposit refundable 36,148 35,264 Others - Statutory liabilities 2,26,250 1,87,012 Total 1,01,31,303 1,33,93,701
Schedule 14 : Provisions(` ‘000)
Particulars As at 31st March, 2019
As at 31st March, 2018
For taxation (less payments and taxes deducted at source) - - For proposed dividends - - For dividend distribution tax - - Other Provisions 2,01,405 91,796 Total 2,01,405 91,796
Schedule 15 : Miscellaneous Expenditure(to the extent not written off or adjusted)
(` ‘000)
Particulars As at 31st March, 2019
As at 31st March, 2018
Discount Allowed in issue of shares/debentures - - Others - - Total - -
Schedules forming part of the Financial Statements

101
STRA
TEG
IC R
EPO
RT /
STA
TUTO
RY R
EPO
RTS
/ F
INA
NCI
ALS
STA
TEM
ENTS
Schedule 16: Significant accounting policies and Notes to accounts
1. Corporate information Reliance Nippon Life Insurance Company Limited (‘RNLICL’ or ‘the Company’) was incorporated on 14th May 2001
under the Companies Act, 1956 as amended in 2013. The Company is licensed by the Insurance Regulatory & Development Authority of India (‘IRDAI’) for carrying life insurance and annuity business. The Company offers participating life and pension, non-participating linked and non-linked life, health, variable, annuity and pension products including riders for individual and group businesses. These products are distributed through individual agents, corporate agents, brokers and direct sales channels across the country.
2. Significant accounting policies2.1 Basis of preparation The financial statements have been prepared and presented under the historical cost convention and on accrual
basis of accounting in accordance with generally accepted accounting principles (GAAP) in India, the requirements prescribed by the Insurance Regulatory and Development Authority of India (‘IRDAI’) (Preparation of Financial Statements and Auditors’ Report of Insurance Companies) Regulations, 2002 (the Financial Statements Regulations), the Insurance Act, 1938 as amended in Insurance Laws (Amendment) Act, 2015, the Insurance Regulatory and Development Authority Act, 1999, Master Circular No. IRDA/F&A/Cir/232/12/2013 dated December 11, 2013 on Preparation of Financial Statements and Filing Returns of Life Insurance Business (‘Master Circular’) and various other circulars, regulations, instructions, guidelines and notifications issued by IRDAI, Accounting Standards (AS) notified in the Companies (Accounting Standards) Rules, 2006 as amended in Companies (Indian
Accounting Standards) (Amendment) Rules, 2016 in terms of Section 133 of the Companies Act, 2013 to the extent applicable and the practices prevailing within the insurance industry in India. Accounting policies applied have been consistent with previous year.
2.2 Use of estimates The preparation of the financial statements is in conformity with GAAP which requires the management to make
estimates and assumptions that affect the reported amount of assets and liabilities as of the date of financial statement, reported amount of revenues and expenses for the year and disclosures of contingent liabilities as of the date of financial statements. The estimates and assumptions used in the accompanying financial statements are based upon management’s evaluation of the relevant facts and circumstances as of the date of the financial statements. Actual results could differ from these estimates. Any revision in the accounting estimates is recognized prospectively.
2.3 Revenue recognition Premium Income
Premium on non linked insurance policies is recognised when due except on policies with explicit charging structure and variable insurance policies, which are recognised when policy account is credited. Premium on unit linked insurance policies is recognized when associated units are created. Premium on lapsed insurance policies is recognised as income when such policies are reinstated. Top-up premium is considered as single premium.
Income from unit linked policies Income from unit linked policies which include fund management charges, policy administration charges, mortality
charges etc. is recognised when due and recovered from the linked fund in accordance with terms and conditions of insurance policies.
Income from non-linked policies with explicit charge structure and variable insurance policies
Income from non-linked policies with explicit charge structure and variable insurance policies which includes account administration fees, mortality charges etc. is recognised when due and recovered from the such non-linked policy in accordance with terms and conditions of policies.
Income earned on investment Interest income on investments is recognised on accrual basis. Dividend income on listed equity securities is
recognised on the ex-dividend date. Dividend income on other equity securities is recognised when the right to receive dividend is established.

Annual Report 2018-19
102
Schedule 16: Significant accounting policies and Notes to accounts (Contd...)
Non-linked Accretion of discount and amortisation of premium relating to debt securities is recognised using Effective Interest
Rate Method (EIR) over the remaining period to maturity of these securities.
Realised gain/loss on debt securities is the difference between the net sale consideration and the amortised cost, which is computed on a weighted average basis, as on date of sale.
Profit or loss on sale of equity shares/mutual fund units is the difference between the net sale consideration and the book cost computed on weighted average basis after adjusting the accumulated changes in the fair value previously recognised under “Fair Value Change Account”.
Income earned on investments in venture funds is recognized on receipt basis.
Linked Accretion of discount and amortisation of premium relating to money market instruments is recognised on a
straight-line basis over the remaining period to maturity of these securities.
Realised gain/loss on debt securities is the difference between the net sales consideration and the book value, which is computed on a weighted average basis, as on date of sale.
Profit or loss on sale of equity shares/mutual fund units is the difference between the net sale consideration and the book cost computed on weighted average basis as on date of sale.
Unrealised gain/loss arising on valuation of investments is recognised in the revenue account of the respective fund.
Interest on loans and re-instatement of policies Interest income on loans is recognised on accrual basis. Interest income from re-instatement of policy is recognised
on receipt basis.
2.4 Re-insurance premium Premium ceded on re-insurance is recognised as an expense at the time of recognition of corresponding premium
income and is disclosed as a deduction from premium income. Commission on re-insurance ceded is netted off against premium ceded on reinsurance.
2.5 Acquisition costs Acquisition costs representing costs incurred for acquisition of insurance policies are expensed in the period in
which they are incurred.
2.6 Actuarial liability valuation A brief methodology used for the various line of business is as given below:
i. Liabilities on life insurance policies are determined by the Appointed Actuary by using generally accepted actuarial practice in accordance with the actuarial practice standards and guidance notes issued by the Institute of Actuaries of India, the requirements of the Insurance Act, 1938 and the relevant regulations issued by the IRDAI.
ii. The liabilities under Non- Linked individual policies are calculated by the prospective Gross Premium Valuation (GPV) method. The liabilities are calculated so that together with the estimated future premium payments and investment income, the assets of the Company are expected to be sufficient to meet future claims (including bonus entitlements to policyholders, if any) and expenses.
iii. The liabilities for Linked individual comprises of unit and non-unit reserves. The unit reserve is determined as number of units, as on valuation date multiplied by the unit prices at the valuation date. The non-unit reserve is calculated using the cash flow method by ensuring that at each point of time in future projection there is flooring at zero. The non-unit reserve is calculated on gross premium valuation on prospective basis. No credit is given to the positive profits after the month of last negative profit.
103
STRA
TEG
IC R
EPO
RT /
STA
TUTO
RY R
EPO
RTS
/ F
INA
NCI
ALS
STA
TEM
ENTS
iv. The liabilities for one year renewable group protection business are calculated by using the Unearned Premium Reserve (UPR) approach. The reserve is further compared with the reserve computed as per the Gross Premium Valuation (GPV) method and the reserve has been kept as the higher of the two. For more than one year renewable group business, the liabilities are calculated using gross premium valuation method.
v. For the Fund based Group (linked business and non linked) business with explicit charging structure, the liabilities are taken as the sum of the policyholder’s account balances plus additional reserve for expenses (considered only for policies with greater than 1 year policy term) and mortality calculated using the projection method. Further for non-linked fund based products (Individual and Group), where the funds earmarked are higher than the policy account plus non-unit reserve/additional reserve and others adjustments (provisions), the excess is held as a global reserve.
vi. For some liabilities, the Appointed Actuary has used a method of valuation other than the Gross Premium
Method as appropriate, in accordance with IRDAI (Assets, Liabilities and Solvency Margins of Life Insurance Business) Regulations 2016 Section 2.8 of Schedule II.
vii. The Riders are valued at higher of Gross Premium Valuation (GPV) and Unearned Premium Reserve (UPR).
Additional reserves are determined to:i. Allow for the claims that may have occurred already but not yet reported (Incurred But not Reported).
ii. Meet the strain in respect of free-look cancellations. For each line of business, free look cancellation reserve is set on the basis of expected proportion of the policies eligible to exercise free- look option as at the valuation date. (Free Look Reserve)
iii. Meet the expected liabilities that would arise on the revival / reinstatement of lapsed / reduced paid-up policies, on the basis of proportion of the policies expected to be revived / reinstated based on the revival / reinstatement experience of the company (Revival / Reinstatement reserve).
iv. Allow for the cost of options and guarantees, wherever applicable.
Above calculation are based on various assumptions such as probability of death, disability, investment return, inflation, policy termination, expenses, tax rates etc. which would impact the amount and their timings.
The actuarial assumptions are given in note 3.2 below.
2.7 Benefits paid Benefits paid comprise of policy benefits, claims and claim settlement costs, if any. Death benefit, rider benefits
and surrender claims are accounted for on receipt of intimation. Survival benefit claims and maturity claims are accounted when due.
Withdrawals and surrenders for unit linked policies are accounted in the respective schemes when the associated units are cancelled, for variable insurance policies and policies with explicit charge structures are accounted when the policy accounts are debited. Surrenders includes amount payable on lapsed insurance policies which are recognised when the revival period of such policies is over and on discontinued policies which are recognised after expiry of lock-in period. Withdrawals and surrenders are disclosed at net of recovered charges. Interest payment, if any, to policyholder is accounted on payment basis.
Reinsurance recoveries on claims are accounted for, in the same period as the related claims and netted off against claim expenses incurred.
2.8 Investments Investments are recorded at cost on the date of purchase, which includes brokerage, stamp duty and taxes if
any, but excludes accrued interest paid, if any on the date of purchase. Bonus entitlements are recognised as investments on ex-bonus date. Rights entitlements are recognised as investments on the ex-rights date.

Annual Report 2018-19
104
Schedule 16: Significant accounting policies and Notes to accounts (Contd...)
Classification Investments maturing within twelve months from the balance sheet date and investments made with the specific
intention to dispose them off within twelve months from the balance sheet date are classified as short-term investments.
Investments other than short-term investments are classified as long-term investments.
Valuation Non-linked policyholders’ investments, non-unit reserve and shareholders’ investments
All debt securities held by the Company are considered as ‘held to maturity’ and measured at historical cost subject to amortisation of the premium/discount using Effective Interest Rate Method (EIR) over the remaining period to maturity.
Listed equities and Exchange Traded Funds (‘ETF’) are measured at fair value, being the quoted closing prices on the National Stock Exchange (in case it is not traded on the National Stock Exchange then quoted closing price on the Bombay Stock Exchange is used) on the last trading day of the financial year. In case the equity ETF’s are not traded either on the primary or the secondary exchange, then the equity ETF’s are valued at the latest available Net Asset value (NAV).
Mutual fund units are valued at the previous day’s net asset value of the respective fund.
Additional Tier-1 bonds are valued at using Crisil Bond valuer and Infrastructure Investment Trusts are valued at market value using last quoted price on National Stock exchange and Bombay stock exchange.
In respect of listed equities, ETF, Additional Tier-1 bonds, Infrastructure Investment Trusts and mutual funds, the unrealised gains/losses between the cost price and the fair value price are accounted in the “Fair Value Change” account in the balance sheet.
Investments bought on ‘repo’ basis are valued at cost plus interest accrued on reverse repo rate. Investments in venture funds are valued at historical cost subject to impairment, if any. The Company assesses at each Balance Sheet date whether there is any indication that any equity investment may be impaired. In case of impairment, any impairment loss is recognised as an expense in the Revenue or Profit and Loss Account to the extent of difference between the re-measured fair value of the security/investment and its acquisition cost as reduced by any impairment loss recognized as an expense in the Revenue or Profit and Loss Account. Any reversal of impairment loss, earlier recognized in Revenue or Profit and Loss Account, is recognized in the Revenue or Profit and Loss Account respectively.
Linked business Securities issued by Government of India (except Treasury Bills) and State government securities are valued at prices
released by Credit Rating Information Services of India Limited (CRISIL).
Bonds and debentures including asset backed securities are valued on the basis of CRISIL Bond Valuer.
Money market instruments including treasury bills are valued at historical cost, subject to amortisation of premium or accretion of discount on straight-line basis over the remaining period to maturity of these securities.
Listed equities and ETF are measured at fair value, being the quoted closing prices on the National Stock Exchange (in case it is not traded on the National Stock Exchange then quoted closing price on the Bombay Stock Exchange is used) on the last trading day of the financial year.
Mutual fund units are valued at the previous day’s net asset value of the respective fund.
Investments bought on ‘repo’ basis are valued at cost plus interest accrued on reverse repo rate. Unrealised gain/loss arising on valuation of these investments is recognised in the Revenue Account of the
respective fund.
105
STRA
TEG
IC R
EPO
RT /
STA
TUTO
RY R
EPO
RTS
/ F
INA
NCI
ALS
STA
TEM
ENTS
Transfer of investments Any transfer of investments from shareholders to policyholders is carried out at amortised cost or market value,
whichever is lower.
In case of linked funds, any inter fund transfer of equities is carried out at the prevailing market price during market hours and any inter fund transfer of Government Securities is carried out at market price prevailing on Negotiated dealing system (NDS) at the time of such transfer. Securities other than equities and government securities are transferred at previous day valuation price.
Loans Loans are recognized when those are advanced to the borrowers. Loans are stated at historical cost subject to
impairments, if any. Loans are classified as short term in case the maturity is less than 12 months. Loans other than short term are classified as long term.
2.9 Fixed Assets and Depreciation/Amortisation Tangible assets
Tangible assets are capitalised on the day they are ready for use and are stated at cost less accumulated depreciation. Cost includes the purchase price and all identifiable cost incurred to bring the assets to its working condition and location. Tangible Assets not ready for intended use on the date of balance sheet are disclosed as capital work in progress.
Depreciation is provided using the straight line method on a pro-rata basis from the date of being ready to use. Individual assets costing rupees twenty thousand or less considered low value assets are depreciated in full in the month of capitalisation. The management’s estimate of useful life of the various fixed assets is given below:
Asset Useful life
Information technology equipments-Server & Networks* 3 years
Information technology equipments- Other than Server & Networks 3 years
Furniture and Fittings* 5 years
Office equipments* 4 years
* For these class of assets, based internal assessment and independent technical advice, the management is of the opinion that the useful lives as stated above best represent the useful lives of these respective assets. Hence, the useful lives of these assets are different from the useful lives as prescribed under Part C of Schedule II of Companies Act, 2013.
Based on internal assessment and independent technical advice, the residual value is considered to be Nil for above mentioned assets.
Intangible assets Intangible assets comprising software are stated at cost less amortisation. Significant improvements to software are
capitalised and amortised over the remaining useful life of original software.
Software expenses are amortised using straight line method over a period of 4 years from the date of being ready for use or actual useful life whichever is lower.
Leasehold improvements Improvements to lease hold premises are capitalised as Lease hold improvements.
Leasehold improvements are amortised over the primary period of lease term, not exceeding three years.
2.10 Impairment of Assets The carrying amounts of assets are reviewed at each balance sheet date if there is any indication of impairment
based on internal/external factors. An impairment loss is recognised wherever the carrying amount of an asset exceeds its recoverable amount. The recoverable amount is the greater of the assets net selling price and value in use. In assessing value in use, the estimated future cash flows are discounted to their present value at the weighted

Annual Report 2018-19
106
Schedule 16: Significant accounting policies and Notes to accounts (Contd...)
average cost of capital. If at the balance sheet date there is an indication that a previously assessed impairment loss no longer exists, the recoverable amount is reassessed and the asset is reflected at the recoverable amount, subject to maximum of depreciable historical cost.
2.11 Operating Leases Leases where the lessor effectively retains substantially all the risks and benefits of ownership over the leased term
are classified as operating leases. Operating lease rentals are recognised as an expense, as applicable, over the lease period as per the terms of the leases.
2.12 Segment reporting policies The segmental information has been disclosed based on the segments identified as per Accounting Standard 17 on
“Segmental Reporting" read with the IRDAI (Preparation of Financial Statements and Auditor’s Report of Insurance Companies) Regulations, 2002. The business is broadly classified as Participating (Life, Pension) and Non-Participating businesses which is further segmented into Non Linked (Group Life, Group Variable Life, Group Variable Pension, Individual Life, Individual Variable Life, Individual Variable Pension, Annuity and Health) and Linked (Group, Life, Pension).
There are no reportable geographical segments, since all business is written in India.
Allocation Income, expenses, assets and liabilities are allocated to specific business segments in the following manner, which
is applied on consistent basis.
Income, expenses, assets and liabilities which are directly attributable or allocable to the segments are recorded and disclosed under the respective segments. Income, expenses, assets and liabilities which are not directly identifiable, are allocated based on relevant basis which includes:-
Allocation basis:- Number of new policies issued during the year- Number of in-force policies- Weighted Received Premium (Regular premium + ten percent of single premium)- New Business Premium- Total Premium - Asset under management- Actuarial reserve- Renewal Premium- Total Policies (in-force policies + paid-up policies)- Claims intimation count- Headcount
The method of allocation has been decided based on the nature of the expense during the year and its logical correlation with various business segments.
2.13 Employee benefits Short Term Employee Benefits:
All employee benefits payable within twelve months of rendering the service are classified as short term employee benefits and accounted on undiscounted basis during the accounting period based on services rendered by employees.
Long Term Employee Benefits:i. Defined Contribution Plan: Provident fund: Each eligible employee and the Company make contribution at a percentage of the basic
salary specified under the Employees Provident Funds and Miscellaneous Provisions Act, 1952.
Superannuation: The Company has incorporated a superannuation trust. The superannuation contribution is based on a percentage of basic salary payable to eligible employees for the period of service.
The Company has no further obligations under the plans beyond its periodic contributions.
107
STRA
TEG
IC R
EPO
RT /
STA
TUTO
RY R
EPO
RTS
/ F
INA
NCI
ALS
STA
TEM
ENTS
ii. Defined Benefit Plan: Gratuity and Leave Encashment: The Company has incorporated a Gratuity trust. The Company’s liability
towards gratuity and leave encashment is accounted for on the basis of an independent actuarial valuation done at the year end and any actuarial gains/losses are charged to the revenue account or the profit and loss account, as applicable.
iii. Phantom Stock Option Schemes Phantom Stock Option Schemes are cash settled rights where the Employees are entitled to get cash
compensation based on a formula linked to the Fair Market Value of Shares upon exercise of the Phantom Stock Options. The Company’s liability towards the scheme is accounted for on the basis of an independent actuarial valuation done at the year end and any actuarial gains/losses are charged to the revenue account or the profit and loss account, as applicable.
2.14 Foreign currency transactions Transactions denominated in foreign currencies are recorded at the exchange rates prevailing at the time of the
transaction. Monetary items denominated in foreign currencies at the year-end are reinstated at the year-end rates. Non-monetary foreign currency items are carried at cost. Any gain or loss on account of exchange difference either on settlement or on translation is recognised in the revenue account or the profit and loss account as applicable.
2.15 Taxationi. Direct Tax Income-tax expense comprises current tax and deferred tax charge or credit. Current income tax charge is
measured at the amount expected to be paid to the tax authorities in accordance with the Income tax Act, 1961. Deferred income tax charge or credit reflects the impact of current year timing differences between taxable income and accounting income for the year and reversal of timing differences of earlier years.
Deferred tax assets and liabilities are determined based on the difference between the financial statements and tax bases of assets and liabilities, as measured by the enacted/substantively enacted tax rates. Deferred tax expense/income is the result of changes in the net deferred tax assets and liabilities.
Deferred tax assets are recognised only if there is a virtual certainty supported by convincing evidence
of realisation of such assets. Deferred tax assets are reviewed as at each balance sheet date and are appropriately adjusted to reflect the amount that is reasonably or virtually certain to be realised.
ii. Indirect Taxes: Goods and Services tax liability on output services is set off against the Goods and Services tax credits
available from tax paid on input services and unutilised credits, if any, are carried forward for future set-off.
2.16 Earnings per share Basic earnings per share are calculated by dividing the net profit or loss for the period attributable to equity
shareholders by the weighted average number of equity shares outstanding during the period. For the purpose of calculating diluted earnings per share, the net profit or loss for the period attributable to equity shareholders and the weighted average number of shares outstanding during the period are adjusted for the effects of all dilutive potential equity shares.
2.17 Provisions , contingent liabilities and contingent assets Provisions are accounted for claims, litigation, taxes, fines, penalties, etc. in respect of present obligation as a
result of a past event that probably requires an outflow of resources and a reliable estimate can be made of the amount of the obligation. Where no reliable estimate can be made, a disclosure is made as contingent liability. A disclosure for a contingent liability is also made when there is a possible obligation or a present obligation that may, but probably will not, require an outflow of resources. When there is a possible obligation or a present obligation in respect of which the likelihood of outflow of resources is remote, no provision or disclosure is made. Contingent assets are neither accounted for nor disclosed.

Annual Report 2018-19
108
Schedule 16: Significant accounting policies and Notes to accounts (Contd...)
2.18 Funds for Future Appropriations – Non Linked Funds for Future Appropriations (FFA) – (Non Linked) in the participating segment, represents the surplus, which is
not allocated to policyholders or shareholders as at the Balance Sheet date. The Company appropriates FFA from the Revenue Account.
2.19 Cash and Cash equivalent Cash and cash equivalent for the purpose of cash flow statements includes cash in hand, bank balance, deposits
with banks and other short term highly liquid investments.
3. Notes to accounts3.1 Contingent liabilities:
(` ‘000)
Particulars Current Year Previous Year
Partly paid up investments 300,297 470,930
Claims, other than those under policies, not acknowledged as debts 12,950 16,256
Guarantees given by or on behalf of the Company 998 924
Statutory demands/liabilities not provided for * 1,731,287 1,499,442
Others (Policy related claims) 302,994 448,031
* Mainly includes the following matters:
a) The Company had received a demand cum order dated 26th November, 2014 from Service Tax Department for ` 239,919 thousands excluding interest on account of non-payment of service tax on surrender charges and partial withdrawal charges. The Company has filed a suitable appeal before CESTAT against the said order. The Company has received favorable order from CESTAT vide order dated 12th April, 2018. However, the department has filed rectification of mistake (ROM) application against CESTAT’s order which has been accepted for hearing by the CESTAT. The Company has filed a writ application before the Hon’ble High Court against the order passed by CESTAT on admitting ROM application. The liability in dispute as on 31st March 2019 is ` 239,919 (31.03.2018: ` Nil).
b) The Company had received show cause cum demand notice dated 14th October, 2014 of `22,976 thousands (31.03.2018: ` 22,976 thousands) excluding interest and penalty for excess CENVAT credit utilized & service tax payable on services provided in Jammu and Kashmir. The Company had filed reply for Show cause Notice on 12th December, 2014. The Commissioner has passed an order confirming the demand vide order dated 28th November, 2018. The Company has filed the appeal before CESTAT against the said order.
c) The Company had received 3 show cause cum demand notices (SCN’s) for proportionate reversal of CENVAT credit in relation to trading of securities as below:
(i) SCN dated 30th November,2016 of ` 932,632 thousands (31.03.2018: ` 932,632 thousands) excluding interest and penalty for the period July 2012 to March 2015 issued by the Commissioner Service Tax Audit – III, Mumbai.
(ii) SCN dated 12th April, 2017 of `209,745 thousands (31.03.2018: `209,745 thousands) excluding interest and penalty for the period April 2015 to March 2016 issued by the Commissioner of Service Tax-IV, Mumbai.
(iii) SCN dated 12th April, 2019 of `273,697 thousands (31.03.2018: ` Nil) excluding interest and penalty for the period April 2016 to June 2017 issued by the Commissioner of CGST, Mumbai (West).
d) The Company had received show cause cum demand notice dated 24thApril, 2014 of ` 281,770 thousands excluding interest and penalty for service tax liability on lead generation fees. The Company has received favorable order from the Commissioner, Service Tax vide order dated 30th October, 2014. However, the department has filed the appeal before CESTAT against the said order. The Company has received favorable order from CESTAT vide order dated 21st December, 2018. Hence, the liability in dispute as on 31st March 2019 is ` Nil (31.03.2018: ` 281,770 thousands).
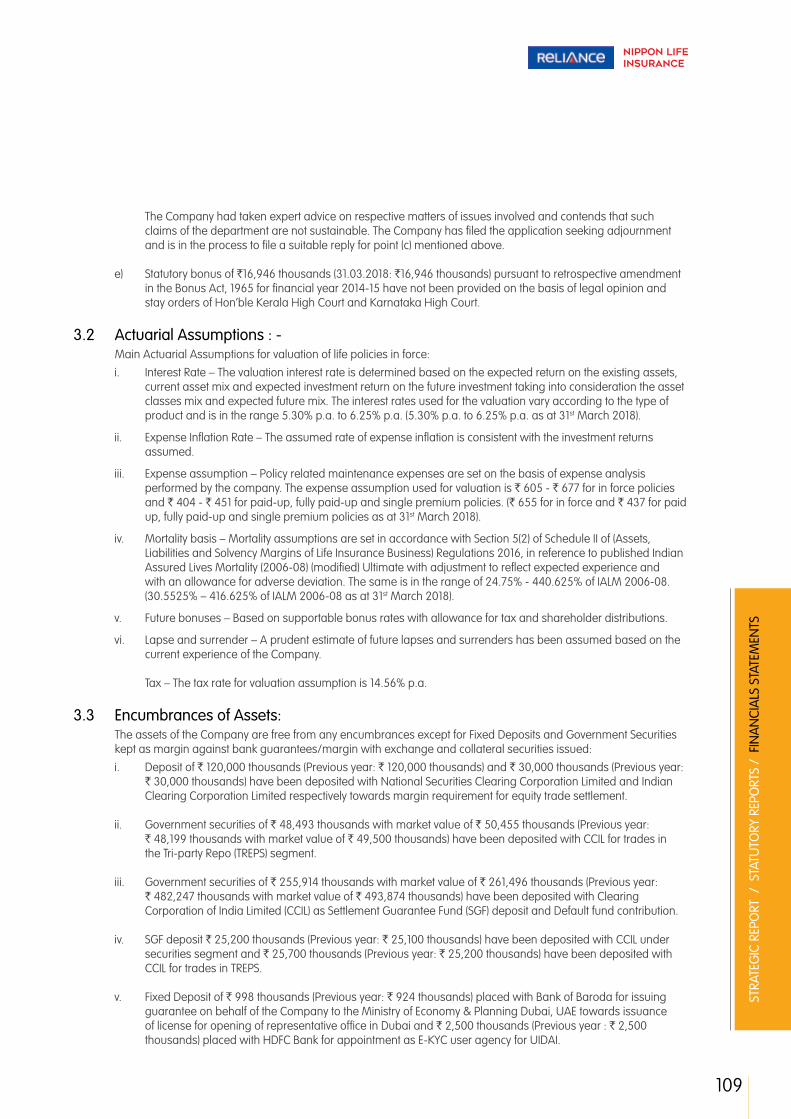
109
STRA
TEG
IC R
EPO
RT /
STA
TUTO
RY R
EPO
RTS
/ F
INA
NCI
ALS
STA
TEM
ENTS
The Company had taken expert advice on respective matters of issues involved and contends that such claims of the department are not sustainable. The Company has filed the application seeking adjournment and is in the process to file a suitable reply for point (c) mentioned above.
e) Statutory bonus of `16,946 thousands (31.03.2018: `16,946 thousands) pursuant to retrospective amendment in the Bonus Act, 1965 for financial year 2014-15 have not been provided on the basis of legal opinion and stay orders of Hon’ble Kerala High Court and Karnataka High Court.
3.2 Actuarial Assumptions : - Main Actuarial Assumptions for valuation of life policies in force:
i. Interest Rate – The valuation interest rate is determined based on the expected return on the existing assets, current asset mix and expected investment return on the future investment taking into consideration the asset classes mix and expected future mix. The interest rates used for the valuation vary according to the type of product and is in the range 5.30% p.a. to 6.25% p.a. (5.30% p.a. to 6.25% p.a. as at 31st March 2018).
ii. Expense Inflation Rate – The assumed rate of expense inflation is consistent with the investment returns assumed.
iii. Expense assumption – Policy related maintenance expenses are set on the basis of expense analysis performed by the company. The expense assumption used for valuation is ` 605 - ` 677 for in force policies and ` 404 - ` 451 for paid-up, fully paid-up and single premium policies. (` 655 for in force and ` 437 for paid up, fully paid-up and single premium policies as at 31st March 2018).
iv. Mortality basis – Mortality assumptions are set in accordance with Section 5(2) of Schedule II of (Assets, Liabilities and Solvency Margins of Life Insurance Business) Regulations 2016, in reference to published Indian Assured Lives Mortality (2006-08) (modified) Ultimate with adjustment to reflect expected experience and with an allowance for adverse deviation. The same is in the range of 24.75% - 440.625% of IALM 2006-08. (30.5525% – 416.625% of IALM 2006-08 as at 31st March 2018).
v. Future bonuses – Based on supportable bonus rates with allowance for tax and shareholder distributions.
vi. Lapse and surrender – A prudent estimate of future lapses and surrenders has been assumed based on the current experience of the Company.
Tax – The tax rate for valuation assumption is 14.56% p.a.
3.3 Encumbrances of Assets: The assets of the Company are free from any encumbrances except for Fixed Deposits and Government Securities
kept as margin against bank guarantees/margin with exchange and collateral securities issued:
i. Deposit of ` 120,000 thousands (Previous year: ` 120,000 thousands) and ` 30,000 thousands (Previous year: ` 30,000 thousands) have been deposited with National Securities Clearing Corporation Limited and Indian Clearing Corporation Limited respectively towards margin requirement for equity trade settlement.
ii. Government securities of ` 48,493 thousands with market value of ` 50,455 thousands (Previous year: ` 48,199 thousands with market value of ` 49,500 thousands) have been deposited with CCIL for trades in the Tri-party Repo (TREPS) segment.
iii. Government securities of ` 255,914 thousands with market value of ` 261,496 thousands (Previous year: ` 482,247 thousands with market value of ` 493,874 thousands) have been deposited with Clearing Corporation of India Limited (CCIL) as Settlement Guarantee Fund (SGF) deposit and Default fund contribution.
iv. SGF deposit ` 25,200 thousands (Previous year: ` 25,100 thousands) have been deposited with CCIL under securities segment and ` 25,700 thousands (Previous year: ` 25,200 thousands) have been deposited with CCIL for trades in TREPS.
v. Fixed Deposit of ` 998 thousands (Previous year: ` 924 thousands) placed with Bank of Baroda for issuing guarantee on behalf of the Company to the Ministry of Economy & Planning Dubai, UAE towards issuance of license for opening of representative office in Dubai and ` 2,500 thousands (Previous year : ` 2,500 thousands) placed with HDFC Bank for appointment as E-KYC user agency for UIDAI.
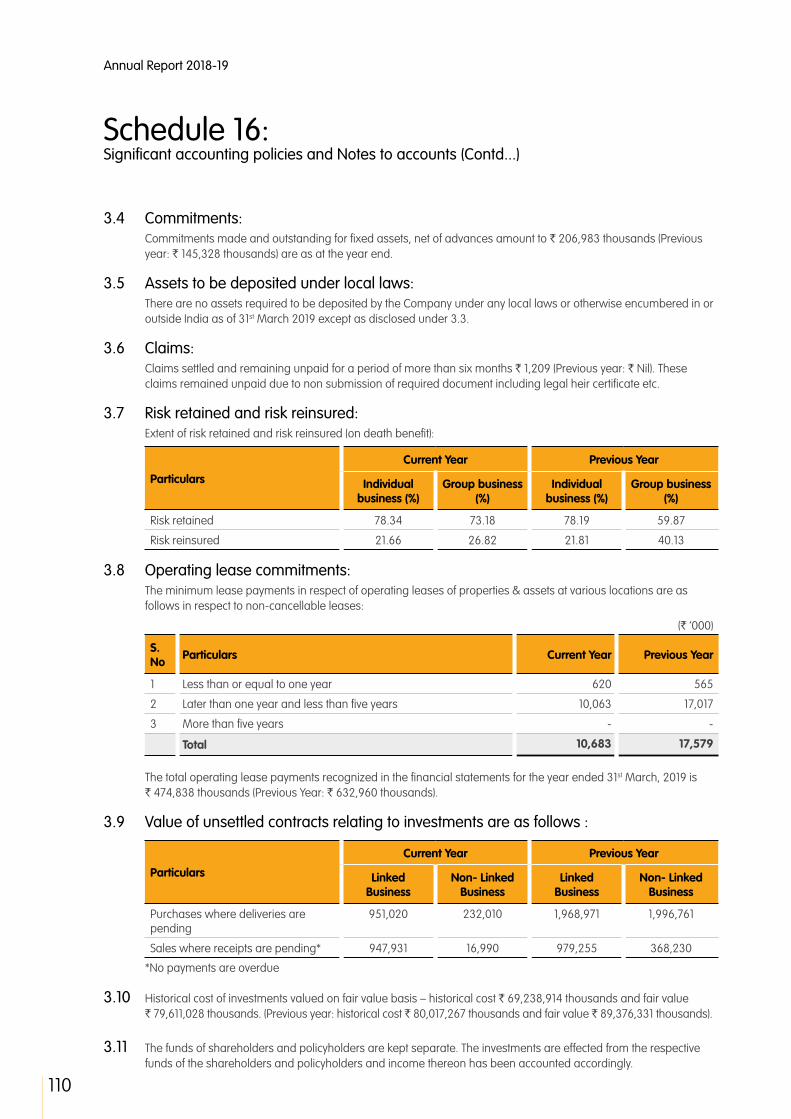
Annual Report 2018-19
110
Schedule 16: Significant accounting policies and Notes to accounts (Contd...)
3.4 Commitments: Commitments made and outstanding for fixed assets, net of advances amount to ` 206,983 thousands (Previous
year: ` 145,328 thousands) are as at the year end. 3.5 Assets to be deposited under local laws: There are no assets required to be deposited by the Company under any local laws or otherwise encumbered in or
outside India as of 31st March 2019 except as disclosed under 3.3.
3.6 Claims: Claims settled and remaining unpaid for a period of more than six months ` 1,209 (Previous year: ` Nil). These
claims remained unpaid due to non submission of required document including legal heir certificate etc. 3.7 Risk retained and risk reinsured: Extent of risk retained and risk reinsured (on death benefit):
Particulars
Current Year Previous Year
Individual business (%)
Group business (%)
Individual business (%)
Group business (%)
Risk retained 78.34 73.18 78.19 59.87
Risk reinsured 21.66 26.82 21.81 40.13
3.8 Operating lease commitments: The minimum lease payments in respect of operating leases of properties & assets at various locations are as
follows in respect to non-cancellable leases:
(` ‘000)
S. No Particulars Current Year Previous Year
1 Less than or equal to one year 620 565
2 Later than one year and less than five years 10,063 17,017
3 More than five years - -
Total 10,683 17,579
The total operating lease payments recognized in the financial statements for the year ended 31st March, 2019 is ` 474,838 thousands (Previous Year: ` 632,960 thousands).
3.9 Value of unsettled contracts relating to investments are as follows :
Particulars
Current Year Previous Year
Linked Business
Non- Linked Business
Linked Business
Non- Linked Business
Purchases where deliveries are pending
951,020 232,010 1,968,971 1,996,761
Sales where receipts are pending* 947,931 16,990 979,255 368,230
*No payments are overdue
3.10 Historical cost of investments valued on fair value basis – historical cost ` 69,238,914 thousands and fair value ` 79,611,028 thousands. (Previous year: historical cost ` 80,017,267 thousands and fair value ` 89,376,331 thousands).
3.11 The funds of shareholders and policyholders are kept separate. The investments are effected from the respective funds of the shareholders and policyholders and income thereon has been accounted accordingly.

111
STRA
TEG
IC R
EPO
RT /
STA
TUTO
RY R
EPO
RTS
/ F
INA
NCI
ALS
STA
TEM
ENTS
3.12 There are no non-performing investments as at 31st March, 2019 (Previous year: ` Nil). Further, there are no assets including loans subject to restructuring (Previous year: ` Nil).
3.13 Sector wise percentage of business: Rural sector Business*:
Particulars Current Year Previous Year
No. of policies 49,913 51,156
% of policies 22.10% 23.63%
Total policies 225,871 216,507
*Only Individual policies are considered.
Social Sector Business:
Particulars Current Year Previous Year
(1) Total Business (Individual Policies + Number of Lives of Group Insurance) in the preceding financial year
1,461,193 2,937,418
(2) No. of lives covered under Social sector in current year 777,576 300,115
(3) Social sector lives as % of above (1) 53.22% 10.22%
3.14 Managerial Remuneration (as per applicable statutes) is as follows: (` ‘000)
Particulars Current Year Previous Year
Mr. Ashish Vohra
- Salary, perquisites (as per IT rules) and Allowances 77,120 56,057
- Contribution to provident fund and superannuation fund 1,620 1,470
Total 78,740 57,527
Expenses towards Gratuity, Leave encashment and Phantom stock option scheme are determined by the external actuary for the Company as a whole on an annual basis and accordingly have not been considered in the above information.
The managerial remuneration is in accordance with the requirements of section 34A of the Insurance Act, 1938 and has been approved by IRDAI.
Management has recognized a provision for incentives payable to employees (including the Executive Director & Chief Executive Officer). As this provision is made on a general basis for the Company as a whole and pending quantification of amounts actually due to each employee, it is not practicable to attribute a portion thereof as managerial remuneration.
Managerial remuneration in excess of limit prescribed by IRDAI is charged to Shareholder account amounting ` 63,740 thousands (Previous year: ` 42,527 thousands).
3.15 The Company has provided segment-wise information for the business segments as disclosed in Appendix 1.
Income and expenses directly attributable or allocable to the segments are recorded and disclosed under the respective segments in the revenue account and the profit and loss account.
Assets and liabilities directly attributable or allocable to the segments are recorded and disclosed under the respective segments in the Balance Sheet.
Other income, expenses, assets and liabilities which are not directly identifiable are allocated on the allocation basis mentioned above.

Annual Report 2018-19
112
Schedule 16: Significant accounting policies and Notes to accounts (Contd...)
3.16 Employee benefits: Provision for staff benefits as per revised AS-15:
(a) Defined Contribution Plans: The amount recognised as an expense during the year is ` 106,642 thousands (Previous Year: ` 91,091 thousands).
(b) Defined Benefit Plan(Gratuity Fund):
(` ‘000)
Particulars Current Year Previous Year
Change in Defined Benefit Obligation:
Opening obligations 198,227 217,597
Service cost 27,369 31,805
Interest cost 15,462 15,254
Actuarial (gain) / loss 30,573 (5583)
Liability transfer in - -
Benefits paid (50,121) (60,846)
Present value of the defined benefit obligations (A) 221,510 198,227
Change in Plan Asset:
Opening fair value of plan assets 193,981 217,729
Expected return on plan assets 15,131 15,263
Actuarial gain / (loss) (4,445) (12,261)
Fund transfer in - -
Contributions 67,309 34,097
Benefits paid (50,121) (60,846)
Closing fair value of plan assets (B) 221,856 193,981
Cost recognised for the year:
Service cost 27,369 31,805
Net Interest cost 331 (92)
Expected return on plan assets - -
Actuarial (gain) / loss 35,018 6,678
Total net cost recognised as Gratuity in P&L 62,718 38,474
Reconciliation of Benefit Obligations & Planned Assets for the period:
Present value of the defined benefit obligations (A) (221,510) (198,227)
Fair value of plan assets (B) 221,856 193,981
Net asset / (liability) recognised in Balance Sheet 346 (4,246)
Investment details of plan assets:
The plan assets are invested in insurer managed funds.
Assumptions:
Discount rate 7.67% 7.80%
Salary escalation rate 3.71% 3.71%
Estimated rate of return on plan assets 7.67% 7.80%

113
STRA
TEG
IC R
EPO
RT /
STA
TUTO
RY R
EPO
RTS
/ F
INA
NCI
ALS
STA
TEM
ENTS
Experience adjustment arising on plan liabilities and plan assets for five financial years are given below:
Particulars Mar-19 Mar-18 Mar-17 Mar-16 Mar-15
Defined benefit obligation 221,510 198,227 217,597 193,197 229,481
Plan assets 221,856 193,981 217,729 193,712 226,750
Surplus (deficit) 346 (4,246) 132 (516) 2,730
Experience adjustments :
on plan liabilities 28,081 9,319 15,782 25,000 48,118
on plan assets (4,445) (12,261) 183 4,920 (8,857)
3.17 Details of related parties and transactions with related parties in accordance with AS-18: Related parties and nature of relationship:
Nature of relationship Name of the related party
Holding Company Reliance Capital Limited
Investing Party in respect of which the Company is an
Associate Nippon Life Insurance Company
Fellow subsidiaries Reliance Nippon Life Asset Management Limited (formerly Reliance Capital Asset Management Limited) (ceased w.e.f. 03.07.2017)
Reliance Asset Management (Singapore) Pte Limited (ceased w.e.f. 03.07.2017)
Reliance Asset Management (Mauritius) Limited (ceased w.e.f. 03.07.2017)
Reliance Capital Pension Fund Limited
Reliance AIF Management Company Limited (ceased w.e.f. 03.07.2017)
Reliance Capital Trustee Co. Limited
Reliance General Insurance Company Limited
Reliance Commercial Finance Limited (formerly Reliance Gilts Limited)
Reliance Money Precious Metals Private Limited
Reliance Home Finance Limited
Reliance Securities Limited
Reliance Commodities Limited
Reliance Financial Limited
Reliance Wealth Management Limited
Reliance Money Solutions Private Limited
Reliance Exchangenext Limited
Reliance Corporate Advisory Services Limited (formerly Reliance Spot Exchange Infrastructure Limited)
Reliance Capital AIF Trustee Company Private Limited
Reliance Health Insurance Limited (w.e.f. May 4, 2017)
Quant Capital Private Limited
Quant Broking Private Limited
Quant Securities Private Limited
Quant Investments Services Private Limited
Gullfoss Enterprises Private Limited (w.e.f. February 20, 2019)
Key Managerial Personnel Mr. Ashish Vohra

Annual Report 2018-19
114
Schedule 16: Significant accounting policies and Notes to accounts (Contd...)
Nature of relationship Name of the related party
Other related parties under common control with whom transactions have taken place during the year.(ceased w.e.f. 03.10.2017)
Reliance Communications Limited
Reliance IDC Limited
Reliance Infocomm Infrastructure Limited
Reliance Communications Infrastructure Limited
Reliance Globalcom Limited
Reliance Infratel Limited
Reliance Tech Services Limited
Reliance Telecom Limited
Reliance Webstore Limited
Zapak Digital Entertainment Limited
The above information regarding related parties have been determined to the extent such parties have been identified on the basis of information available with the Company.
List of transactions with related parties:
(` ‘000)
Name of the Related Party Particulars Current Year Previous Year
Holding Company:
Reliance Capital Limited Premium Income 1,474 1,256
Software Maintenance & IT Infrastructure Management Charges
64,905 46,078
Rent Expense Nil 2,042
Management Fees 60,000 60,075
Reimbursement of Expenses Nil 1,067
Investing Party in respect of which the Company is an associate:
Nippon Life Insurance Company
Sitting Fees Expenses 1,860 1,930
Reimbursement Hotel & Travelling Expenses 3,117 2,998
Fellow subsidiaires :
Reliance Nippon Life Asset Management Limited (formerly Reliance Capital Asset Management Limited)(ceased w.e.f. 03.07.2017)
Premium Income Nil 5,156
Reliance Commodities Limited Premium Income 163 155
Reliance Commercial Finance Limited
Premium Income 215,448 95,462
Claims Paid 65,218 43,798
Rent paid 781 Nil
Reliance Financial Limited Premium Income 38 52
Reliance Money Solutions Private Limited
Premium Income 28 24

115
STRA
TEG
IC R
EPO
RT /
STA
TUTO
RY R
EPO
RTS
/ F
INA
NCI
ALS
STA
TEM
ENTS
(` ‘000)
Name of the Related Party Particulars Current Year Previous Year
Reliance General Insurance Company Limited
Rent Expense 1459 790
Insurance Expense 90,997 61,337
Advance for Insurance Expense 41,000 20,000
Premium Income 9,488 7,099
Sale of Securities Nil 161,425
Reimbursement of Expenses 14 Nil
Reliance Home Finance Limited
Premium Income 56,771 225,333
Group Claim Paid 50,809 28,691
Interest Income on Securities Nil 2,434
Reliance Securities Limited Premium Income 4,653 3,967
Commission paid 102,115 43,533
Brokerage paid 8,053 2,400
Reliance Wealth Management Limited
Premium Income 1,064 805
Reliance Health Insurance Limited
Premium Income 2,325 765
Key Managerial Personnel: (Refer note 3.14 to Schedule 16)
Mr. Ashish Vohra Managerial Remuneration 78,740 57,527
(` ‘000)
Name of the Related Party Particulars Current Year Previous Year
Other related parties under common control with whom transactions have taken place during the year (ceased w.e.f. 03.10.2017)
Reliance Communications Limited
Claims paid Nil 25,974
Communication Expenses Nil 16,584
Reliance Globalcom Limited Premium Income Nil 5,086
Reliance IDC Limited IT Infra Management Charges Nil 13,100
Reliance Tech Services Limited Claims paid Nil 3,095
Reliance Telecom Limited Rent paid Nil 480
Reliance Webstore Limited Communication Expenses Nil 696
Reliance Infocomm Infrastructure Limited
Business Services Nil 374

Annual Report 2018-19
116
Schedule 16: Significant accounting policies and Notes to accounts (Contd...)
Balances of Related parties as at 31st March, 2019:
(` ‘000)
Name of the Related Party Particulars As at 31st March, 2019
As at 31st March, 2018
Holding Company
Reliance Capital Limited Deposit for group policies Nil 470
Expense Payable 26,808 7,389
Software Maintenance Charges paid in Advance
Nil 1,403
Investing Party in respect of which the Company is an associate:
Nippon Life Insurance Company Sitting Fees Expenses 110 Nil
Fellow Subsidiaires :
Reliance Commodities Limited Deposit for group policies 60 52
Reliance Commercial Finance Limited
Deposit for group policies 6,435 98,315
Rent Payable 1,323 Nil
Reliance Financial Limited Deposit for group policies 81 47
Reliance General Insurance Company Limited
Deposit for group policies 300 Nil
Rent payable 3,106 1,647
Advance paid against Insurance Expenses 41,000 20,000
Reliance Health Insurance Limited Deposit for group policies 2 33
Reliance Home Finance Limited Deposit for Group Policies 453 3,434
Reliance Money Solutions Private Limited
Deposit for group policies 49 37
Reliance Securities Limited Deposit for group policies 1,197 188
Commission payable 473 5,772
Reliance Wealth Management Limited
Deposit for group policies Nil 84
3.18 Phantom Stock Option Scheme (PSOS):(a) Phantom Stock Option Scheme (PSOS) – 2015 Scheme
i. Details of vesting schedule and conditions: -
Phantom Stock Options granted under the Scheme would vest within not less than 1 year and not more than 5 years from the last date of vesting of such Phantom Stock Options. Vesting of Phantom Stock Options would be subject to continued employment with the Company and thus the Phantom Stock Options would vest on passage of time.
ii. Options granted, forfeited and exercised are given below:
Particulars Current Year Previous Year
Opening No. of options 1,820,900 2,748,900
Granted Nil Nil
Exercised 530,600 2,480
Lapsed/ Forfeited/Surrendered 72,300 925,520
Outstanding options as at Balance sheet date 1,218,000 1,820,900
Exercisable as at Balance sheet date 518,560 621,680

117
STRA
TEG
IC R
EPO
RT /
STA
TUTO
RY R
EPO
RTS
/ F
INA
NCI
ALS
STA
TEM
ENTS
iii. Detail of phantom share granted subject to the term and conditions as per Phantom stock scheme:
Date of grant 26th October 2015 01st October 2016
Appreciation as per Phantom stock Option Excess of 'fair market of share on the date of exercise' determined in term of the Phantom Stock Option Scheme over the Base Price'
Exercise Period In case of continuation of employment: Vested Phantom Stock Options can be exercised any time up to 3 year from the date of last vesting of Phantom stock Options; and
In case of cessation of employment: Different periods depending on kind of cessation as per provision of the Phantom Stock Option scheme.
Settlement of Phantom Stock Options Within 90 days from the date of exercise by cash.
iv. The fair value of the options granted was estimated on the date of grant with the following assumptions:
Particulars Current Year Previous Year
Discount rate 6.96% 7.35%
Expected Life 5 years 5 years
(b) Phantom Stock Option Scheme (PSOS) – 2017 Schemei. Details of vesting schedule and conditions: -
Phantom Stock Options granted under the Scheme would vest within not less than 1 year and not more than 4 years from the last date of vesting of such Phantom Stock Options. Vesting of Phantom Stock Options would be subject to continued employment with the Company and thus the Phantom Stock Options would vest on passage of time.
ii. Options granted, forfeited and exercised are given below:
Particulars Current Year Previous Year
Opening No. of options 4,180,185 Nil
Granted Nil 5,357,490
Exercised 611,040 Nil
Lapsed/ Forfeited/Surrendered 191,937 1,195,305
Outstanding options as at Balance sheet date 3,377,208 4,180,185
Exercisable as at Balance sheet date 390,713 Nil
iii. Detail of phantom share granted subject to the term and conditions as per Phantom stock scheme:
Period of grant 1st July 2017 to 1st July 2018
Appreciation as per Phantom stock Option Excess of ‘fair market of share on the date of exercise’ determined in term of the Phantom Stock Option Scheme over the Base Price’
Exercise Period In case of continuation of employment: Vested Phantom Stock Options can be exercised any time up to 3 year from the date of last vesting of Phantom stock Options; and
In case of cessation of employment:Different periods depending on kind of cessation as per provision of the Phantom Stock Option scheme.
Settlement of Phantom Stock Options Within 90 days from the date of exercise by cash.

Annual Report 2018-19
118
Schedule 16: Significant accounting policies and Notes to accounts (Contd...)
iv. The fair value of the options granted was estimated on the date of grant with the following assumptions:
Particulars Current Year Previous Year
Discount rate 6.96% 7.35%
Expected Life 4 years 4 years
(c) Phantom Stock Option Scheme (PSOS) – 2018 Schemei. Details of vesting schedule and conditions: -
Phantom Stock Options granted under the Scheme would vest within not less than 1 year and not more than 4 years from the last date of vesting of such Phantom Stock Options. Vesting of Phantom Stock Options would be subject to continued employment with the Company and thus the Phantom Stock Options would vest on passage of time.
ii. Options granted, forfeited and exercised are given below:
Particulars Current Year Previous Year
Opening No. of options Nil Nil
Granted 4,576,874 Nil
Exercised Nil Nil
Lapsed/ Forfeited/Surrendered Nil Nil
Outstanding options as at Balance sheet date 4,576,874 Nil
Exercisable as at Balance sheet date Nil Nil
iii. Detail of phantom share granted subject to the term and conditions as per Phantom stock scheme:
Period of grant 1st May 2018 to 1st May 2019
Appreciation as per Phantom stock Option Excess of ‘fair market of share on the date of exercise’ determined in term of the Phantom Stock Option Scheme over the Base Price’
Exercise Period In case of continuation of employment: Vested Phantom Stock Options can be exercised any time up to 3 year from the date of last vesting of Phantom stock Options; and
In case of cessation of employment:Different periods depending on kind of cessation as per provision of the Phantom Stock Option scheme.
Settlement of Phantom Stock Options Within 90 days from the date of exercise by cash.
iv. The fair value of the options granted was estimated on the date of grant with the following assumptions:
Particulars Current Year Previous Year
Discount rate 6.96% -
Expected Life 4 years -
The Company’s liability towards the scheme is accounted for on the basis of an independent actuarial valuation done at the year end. The valuation of the shares is done considering the intrinsic value and the progression of share price up to the exercise of the option. The total expense recognised for the year is ` 129,918 thousands (Previous Year: ` 89,856 thousands)

119
STRA
TEG
IC R
EPO
RT /
STA
TUTO
RY R
EPO
RTS
/ F
INA
NCI
ALS
STA
TEM
ENTS
3.19 Disclosure on fines and penalties:Penal actions taken by various Government Authorities are as under:
Sl No. Authority Non-Compliance/ Violation
Amount in (` ‘000)
Penalty Awarded
Penalty Paid
Penalty Waived/ Reduced
1 Insurance Regulatory and Development Authority
(i) Non-compliance of IRDAI directions on EoM for FY14-15
(ii) Violation of Reg 6(2) of IRDAI (PPI) Regulations, 2002
(iii) Non-compliance of “Guidelines on Outsourcing of Activities by insurance companies”
Nil(500)
Nil(500)
4,000(Nil)
Nil(500)
Nil(500)
4,000 (Nil)
Nil(Nil)
Nil(Nil)
Nil(Nil)
2 Service Tax Authority - Nil Nil Nil
3 Income Tax Authorities - Nil Nil Nil
4 Any other Tax Authorities - Nil Nil Nil
5 Enforcement Directorate/ Adjudicating Authority/ Tribunal or any Authority under FEMA
- Nil Nil Nil
6 Registrar of Companies/ NCLT/CLB/Department of Corporate Affairs or any Authority under Companies Act, 2013
- Nil Nil Nil
7 Penalty Awarded by any court/ Tribunal for any matter including claim settle but excluding compensation
- Nil Nil Nil
8 Securities and Exchange Board of India
- Nil Nil Nil
9 Competition Commission of India - Nil Nil Nil
10 Any other Central/State/Local Government / Statutory Authority
(i) Tamilnadu Shops & Establishment act Dindigul
(ii) Tamilnadu Shops & Establishment act Karur
Nil(2)Nil(2)
Nil(2)Nil(2)
Nil(Nil)Nil
(Nil)
# Previous year amounts if applicable for any category have been mentioned in brackets.
The above does not include the penalties levied by the tax authorities and/or the regulator, for which the Company is in or is in the process of appeals with appropriate authorities. The Company has taken expert opinion on respective issues involved & contends that the claims of the department are not sustainable.
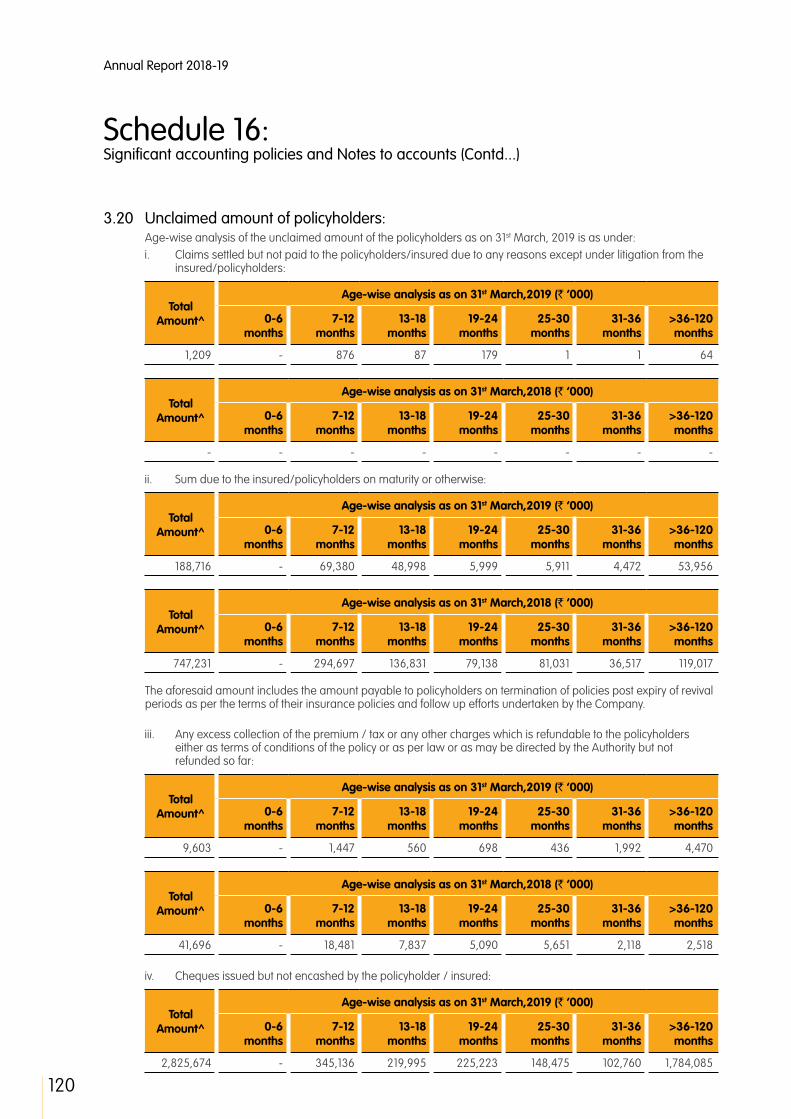
Annual Report 2018-19
120
Schedule 16: Significant accounting policies and Notes to accounts (Contd...)
3.20 Unclaimed amount of policyholders: Age-wise analysis of the unclaimed amount of the policyholders as on 31st March, 2019 is as under:
i. Claims settled but not paid to the policyholders/insured due to any reasons except under litigation from the insured/policyholders:
Total Amount^
Age-wise analysis as on 31st March,2019 (` ‘000)
0-6 months
7-12 months
13-18 months
19-24 months
25-30 months
31-36 months
>36-120 months
1,209 - 876 87 179 1 1 64
Total Amount^
Age-wise analysis as on 31st March,2018 (` ‘000)
0-6 months
7-12 months
13-18 months
19-24 months
25-30 months
31-36 months
>36-120 months
- - - - - - - -
ii. Sum due to the insured/policyholders on maturity or otherwise:
Total Amount^
Age-wise analysis as on 31st March,2019 (` ‘000)
0-6 months
7-12 months
13-18 months
19-24 months
25-30 months
31-36 months
>36-120 months
188,716 - 69,380 48,998 5,999 5,911 4,472 53,956
Total Amount^
Age-wise analysis as on 31st March,2018 (` ‘000)
0-6 months
7-12 months
13-18 months
19-24 months
25-30 months
31-36 months
>36-120 months
747,231 - 294,697 136,831 79,138 81,031 36,517 119,017
The aforesaid amount includes the amount payable to policyholders on termination of policies post expiry of revival periods as per the terms of their insurance policies and follow up efforts undertaken by the Company.
iii. Any excess collection of the premium / tax or any other charges which is refundable to the policyholders either as terms of conditions of the policy or as per law or as may be directed by the Authority but not refunded so far:
Total Amount^
Age-wise analysis as on 31st March,2019 (` ‘000)
0-6 months
7-12 months
13-18 months
19-24 months
25-30 months
31-36 months
>36-120 months
9,603 - 1,447 560 698 436 1,992 4,470
Total Amount^
Age-wise analysis as on 31st March,2018 (` ‘000)
0-6 months
7-12 months
13-18 months
19-24 months
25-30 months
31-36 months
>36-120 months
41,696 - 18,481 7,837 5,090 5,651 2,118 2,518
iv. Cheques issued but not encashed by the policyholder / insured:
Total Amount^
Age-wise analysis as on 31st March,2019 (` ‘000)
0-6 months
7-12 months
13-18 months
19-24 months
25-30 months
31-36 months
>36-120 months
2,825,674 - 345,136 219,995 225,223 148,475 102,760 1,784,085

121
STRA
TEG
IC R
EPO
RT /
STA
TUTO
RY R
EPO
RTS
/ F
INA
NCI
ALS
STA
TEM
ENTS
Total Amount^
Age-wise analysis as on 31st March,2018 (` ‘000)
0-6 months
7-12 months
13-18 months
19-24 months
25-30 months
31-36 months
>36-120 months
3,799,459 - 309,134 292,436 195,160 191,648 1,636,047 1,175,034
^ Does not include income on unclaimed fund.
The cheques issued but not encashed by policyholder/insured amounting ` 2,946,584 thousands (Previous Year: ` 1,897,026 thousands) pertaining to cheques which are within the validity period but not yet encashed by the policyholders as on 31st March, 2019 is not included in the category (iv) above. This amount forms part of bank reconciliation statement and consequently not considered in unclaimed amount of policyholders as disclosed under Schedule 13 - Current liabilities.
Details of unclaimed amount and investment income for the year ended 31st March, 2019 is as under:
(` ‘000)
Particulars Current Year Previous Year
Opening Balance 5,204,738 4,921,256
Add : Amount transferred to Unclaimed amount 242,112 1,816,367
Add : Cheques issued out of Unclaimed amount but not encashed by the policyholders (To be included only when cheques are stale)
801,804 893,014
Add :Investment Income 178,578 380,821
Less :Amount paid during year 3,222,648 2,799,453
Less : Amount transferred to SCWF ( net of claims paid in respect of amounts transferred earlier)
8,921 7,268
Closing Balance of Unclaimed amount 3,195,663 5,204,738
3.21 Disclosure on Discontinued Policy Fund: Pursuant to IRDA (Treatment of Discontinued Linked Insurance policies) regulations, 2010, the following information is
given –
(` ‘000) Particulars Current Year Previous YearOpening balance of fund for discontinued policies 5,253,025 5,189,104 Add : Fund of policies discontinued during the year 2,267,984 2,740,690 Less : Fund of policies revived during the year 1,677,049 1,534,242 Add : Net income/gains on investment of the fund 356,641 334,657 Less : Fund management charges levied 31,082 30,633 Less : Amount refunded to policyholders during the year (including claims payable)
1,446,750 1,446,551
Closing balance of fund for discontinued policies 4,722,769 5,253,025No. of policies discontinued (Product-wise) during the year :Reliance Highest NAV Advantage Plan (Regular) - -Reliance Classic Plan (Regular) 26 1,590Reliance Classic Plan - Limited - -Reliance Classic Plan II Regular 43 -Reliance Life insurance Pay Five Plan 3 -Reliance Life Insurance Smart Pension Plan - -Reliance Life Insurance Smart Pension Plan-Limited - -Reliance Classic Plan - II Refiled 10,234 16,524Reliance Pay Five Plan Refiled 1,794 2,573
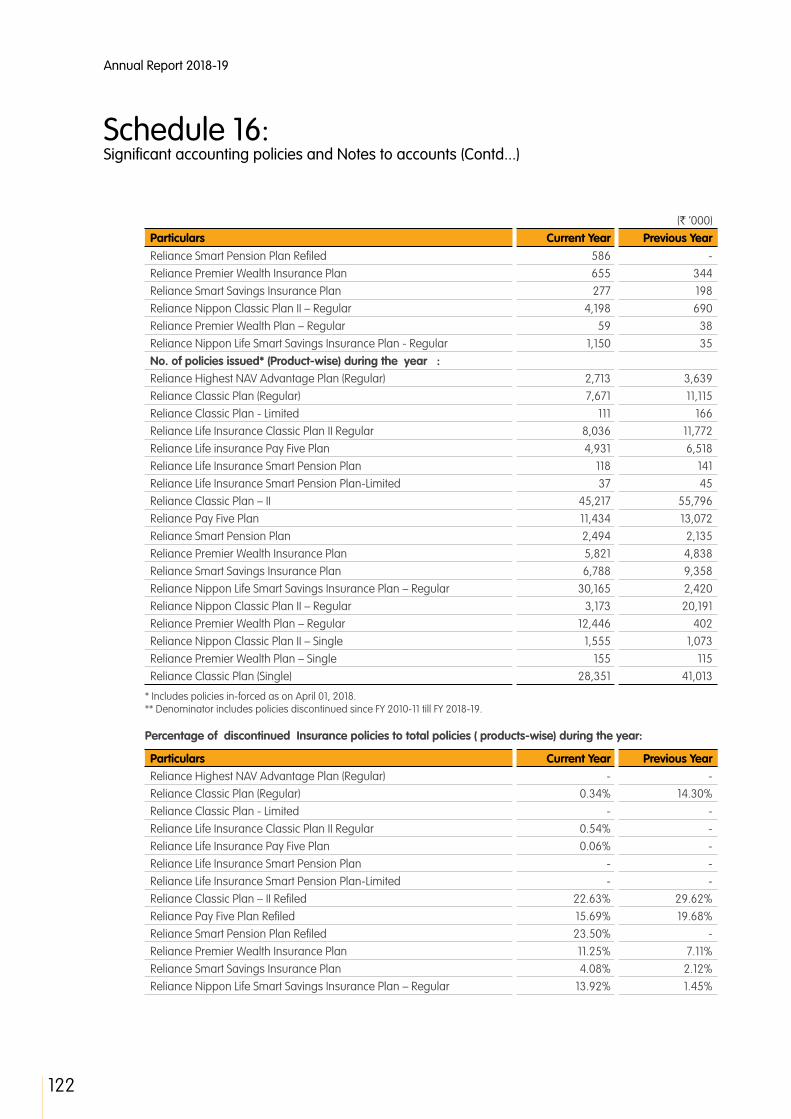
Annual Report 2018-19
122
Schedule 16: Significant accounting policies and Notes to accounts (Contd...)
(` ‘000) Particulars Current Year Previous YearReliance Smart Pension Plan Refiled 586 -Reliance Premier Wealth Insurance Plan 655 344Reliance Smart Savings Insurance Plan 277 198Reliance Nippon Classic Plan II – Regular 4,198 690Reliance Premier Wealth Plan – Regular 59 38Reliance Nippon Life Smart Savings Insurance Plan - Regular 1,150 35No. of policies issued* (Product-wise) during the year :Reliance Highest NAV Advantage Plan (Regular) 2,713 3,639Reliance Classic Plan (Regular) 7,671 11,115Reliance Classic Plan - Limited 111 166Reliance Life Insurance Classic Plan II Regular 8,036 11,772Reliance Life insurance Pay Five Plan 4,931 6,518Reliance Life Insurance Smart Pension Plan 118 141Reliance Life Insurance Smart Pension Plan-Limited 37 45Reliance Classic Plan – II 45,217 55,796Reliance Pay Five Plan 11,434 13,072Reliance Smart Pension Plan 2,494 2,135Reliance Premier Wealth Insurance Plan 5,821 4,838Reliance Smart Savings Insurance Plan 6,788 9,358Reliance Nippon Life Smart Savings Insurance Plan – Regular 30,165 2,420Reliance Nippon Classic Plan II – Regular 3,173 20,191Reliance Premier Wealth Plan – Regular 12,446 402Reliance Nippon Classic Plan II – Single 1,555 1,073Reliance Premier Wealth Plan – Single 155 115Reliance Classic Plan (Single) 28,351 41,013
* Includes policies in-forced as on April 01, 2018. ** Denominator includes policies discontinued since FY 2010-11 till FY 2018-19.
Percentage of discontinued Insurance policies to total policies ( products-wise) during the year:
Particulars Current Year Previous YearReliance Highest NAV Advantage Plan (Regular) - -Reliance Classic Plan (Regular) 0.34% 14.30%Reliance Classic Plan - Limited - -Reliance Life Insurance Classic Plan II Regular 0.54% -Reliance Life Insurance Pay Five Plan 0.06% -Reliance Life Insurance Smart Pension Plan - -Reliance Life Insurance Smart Pension Plan-Limited - -Reliance Classic Plan – II Refiled 22.63% 29.62%Reliance Pay Five Plan Refiled 15.69% 19.68%Reliance Smart Pension Plan Refiled 23.50% -Reliance Premier Wealth Insurance Plan 11.25% 7.11%Reliance Smart Savings Insurance Plan 4.08% 2.12%Reliance Nippon Life Smart Savings Insurance Plan – Regular 13.92% 1.45%

123
STRA
TEG
IC R
EPO
RT /
STA
TUTO
RY R
EPO
RTS
/ F
INA
NCI
ALS
STA
TEM
ENTS
Particulars Current Year Previous YearReliance Nippon Classic Plan II – Regular 1.86% 3.42%Reliance Premier Wealth Plan – Regular 9.24% 9.45%No. of policies revived (Product-wise) during year :Reliance Highest NAV Advantage Plan (Regular) 19 -Reliance Classic Plan (Regular) 74 661Reliance Classic Plan - Limited - -Reliance Life Insurance Classic Plan II Regular 140 -Reliance Life insurance Pay Five Plan 25 -Reliance Life Insurance Smart Pension Plan 2 -Reliance Life Insurance Smart Pension Plan-Limited - -Reliance Classic Plan – II 5,108 6,013Reliance Pay Five Plan 833 933Reliance Smart Pension Plan - -Reliance Premier Wealth Insurance Plan 204 99Reliance Nippon Life Smart Savings Insurance Plan – Regular 85 5Reliance Nippon Classic Plan II – Regular 1,301 164Reliance Premier Wealth Plan – Regular 20 12Reliance Smart Savings Insurance Plan 204 46Percentage of revived insurance policies to total discontinued policies** (products-wise) during the year:Reliance Highest NAV Advantage Plan (Regular) 0.08% -
Reliance Classic Plan (Regular) 0.12% 1.07%
Reliance Classic Plan - Limited - -
Reliance Life Insurance Classic Plan II Regular 0.50% -
Reliance Life Insurance Pay Five Plan 0.22% -
Reliance Life Insurance Smart Pension Plan 0.40% -
Reliance Life Insurance Smart Pension Plan-Limited - -
Reliance Classic Plan – II 7.87% 10.99%
Reliance Pay Five Plan 7.26% 9.63%
Reliance Smart Pension Plan - -
Reliance Premier Wealth Insurance Plan 20.24% 28.05%
Reliance Nippon Life Smart Savings Insurance Plan – Regular 27.24% 14.29%
Reliance Nippon Classic Plan II – Regular 26.62% 23.77%
Reliance Premier Wealth Plan – Regular 20.62% 31.58%
Reliance Premier Wealth Insurance Plan 20.24% 28.05%
Reliance Smart Savings Insurance Plan 23.94% 23.12%
Charges imposed/readjusted on account of discontinued policies/revival of discontinued policies during the year are as follows: Charges imposed on account of discontinued Insurance policies 29,134 40,612
Charges readjusted on account of discontinued Insurance policies 12,093 15,862
Total 17,041 24,750
* Includes policies in-forced as on April 01, 2018. ** Denominator includes policies discontinued since FY 2010-11 till FY 2018-19.

Annual Report 2018-19
124
Schedule 16: Significant accounting policies and Notes to accounts (Contd...)
3.22 Earnings per share: In accordance with Accounting Standard 20 on Earnings Per Share (EPS), the following table reconciles the
numerator and denominator used to calculate the basic/diluted earnings per share.
Particulars Current Year Previous YearProfit/(Loss) after tax (` ‘000) 254,637 5,314Weighted average no. of equity shares for Basic earnings per share (par value of ` 10/- each)
1,196,323,500 1,196,323,500
Earnings per share – Basic (in `) (Face Value of ` 10/- each) 0.213 0.004Weighted average no. of equity shares for Diluted earnings per share (par value of ` 10/- each)
1,196,323,500 1,196,323,500
Earnings per share –Diluted (in `) (Face Value of ` 10/- each) 0.213 0.004
3.23 The Micro, Small and Medium Enterprises Development Act, 2006: The amount due to Micro and Small Enterprises as defined in the "The Micro, Small and Medium Enterprises
Development Act, 2006" has been determined to the extent such parties have been identified on the basis of information available with the Company. The disclosures relating to Micro and Small Enterprises as at 31st March, 2019 are as under:
(` ‘000)
Particulars Current Year Previous Year
The principal amount remaining unpaid to supplier as at the end of the year
415 1,077
The interest due thereon remaining unpaid to supplier as at the end of the year
219 244
The amount of interest due and payable for the period of delay in making payment (which have been paid but beyond the appointed day during the year) but without adding the interest specified under this Act.
Nil Nil
The amount of interest accrued during the year and remaining unpaid at the end of the year
219 244
3.24 Disclosures on other work given to auditors: Pursuant to clause 7.1 (g) of Corporate Governance Guidelines issued by IRDAI on August 5, 2009 the services of the
auditors are disclosed below:
(` ‘000)
Name of the auditor Service rendered Current Year Previous Year
Pathak H.D. & Associates Certification work 510 400
Singhi & Co. Certification work 360 265
Ernst & Young LLP Professional Fees 55,923 71,555
3.25 The Company has charged an amount of ` 793,569 thousands (Previous year: ` 814,655 thousands) over and above allowable expenses under respective segments to Shareholders’ Account in compliance to IRDAI (Expenses of Management of Insurers transacting life insurance business) Regulations, 2016.
3.26 Shareholders’ contribution: During the year, the Company has contributed ` 1,223,252 thousands (Previous Year: ` 1,634,425 thousands),
to make good the deficit in the Non-Participating Business of Revenue Account. Any contribution made by the shareholders to the policyholder’s account is irreversible in nature and shall not be recouped to the shareholders at any point of time in future. The shareholders’ approval with regard to the contribution during the current year shall be obtained in the ensuing Annual General Meeting of the Company.
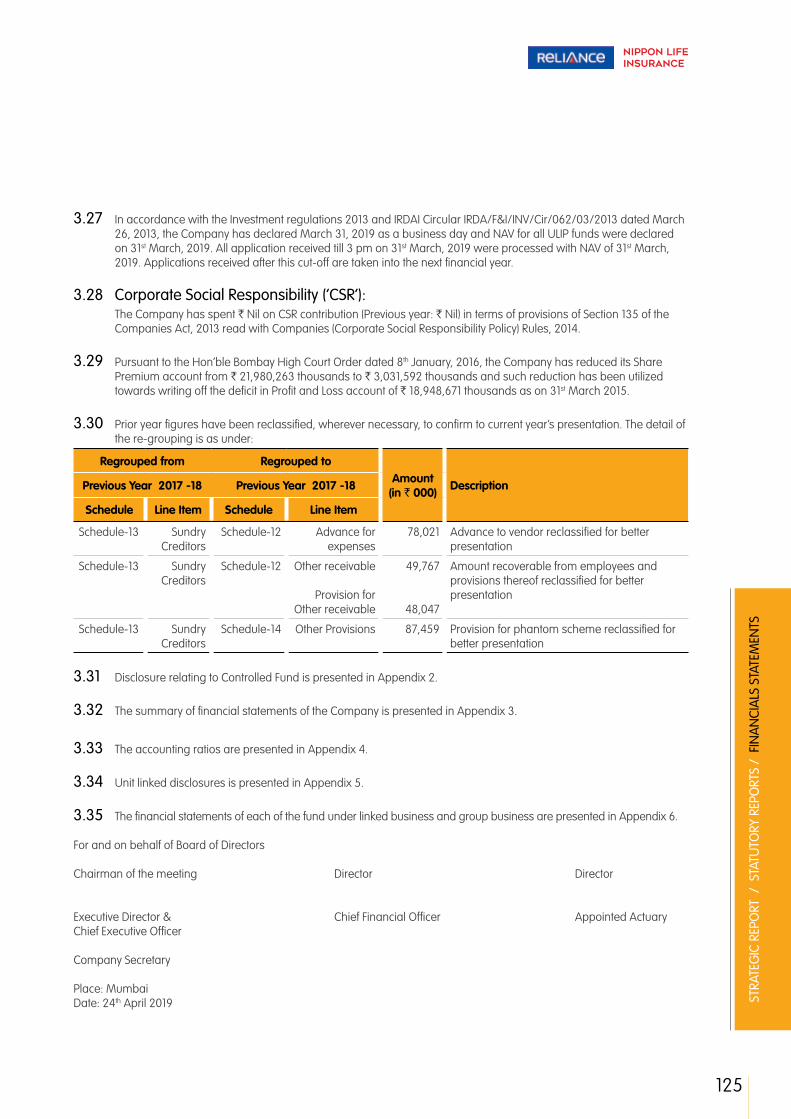
125
STRA
TEG
IC R
EPO
RT /
STA
TUTO
RY R
EPO
RTS
/ F
INA
NCI
ALS
STA
TEM
ENTS
3.27 In accordance with the Investment regulations 2013 and IRDAI Circular IRDA/F&I/INV/Cir/062/03/2013 dated March 26, 2013, the Company has declared March 31, 2019 as a business day and NAV for all ULIP funds were declared on 31st March, 2019. All application received till 3 pm on 31st March, 2019 were processed with NAV of 31st March, 2019. Applications received after this cut-off are taken into the next financial year.
3.28 Corporate Social Responsibility (‘CSR’): The Company has spent ` Nil on CSR contribution (Previous year: ` Nil) in terms of provisions of Section 135 of the
Companies Act, 2013 read with Companies (Corporate Social Responsibility Policy) Rules, 2014.
3.29 Pursuant to the Hon’ble Bombay High Court Order dated 8th January, 2016, the Company has reduced its Share Premium account from ` 21,980,263 thousands to ` 3,031,592 thousands and such reduction has been utilized towards writing off the deficit in Profit and Loss account of ` 18,948,671 thousands as on 31st March 2015.
3.30 Prior year figures have been reclassified, wherever necessary, to confirm to current year’s presentation. The detail of the re-grouping is as under:
Regrouped from Regrouped toAmount
(in ` 000) DescriptionPrevious Year 2017 -18 Previous Year 2017 -18
Schedule Line Item Schedule Line Item
Schedule-13 Sundry Creditors
Schedule-12 Advance for expenses
78,021 Advance to vendor reclassified for better presentation
Schedule-13 Sundry Creditors
Schedule-12 Other receivable
Provision for Other receivable
49,767
48,047
Amount recoverable from employees and provisions thereof reclassified for better presentation
Schedule-13 Sundry Creditors
Schedule-14 Other Provisions 87,459 Provision for phantom scheme reclassified for better presentation
3.31 Disclosure relating to Controlled Fund is presented in Appendix 2.
3.32 The summary of financial statements of the Company is presented in Appendix 3.
3.33 The accounting ratios are presented in Appendix 4.
3.34 Unit linked disclosures is presented in Appendix 5.
3.35 The financial statements of each of the fund under linked business and group business are presented in Appendix 6.
For and on behalf of Board of Directors Chairman of the meeting Director Director
Executive Director & Chief Financial Officer Appointed ActuaryChief Executive Officer Company Secretary
Place: MumbaiDate: 24th April 2019

Annual Report 2018-19
126
Segm
ent R
even
ue A
ccou
nt
for t
he y
ear e
nded
31st
Mar
ch, 2
019
Polic
yhol
ders
’ Acc
ount
(Te
chni
cal A
ccou
nt)
(` ‘0
00)
Par
ticul
ars
Sche
dule
Cur
rent
Yea
r
Parti
cipat
ing
Busin
ess
Non
- Par
ticip
atng
Bus
ines
s
Tota
l L
ife
Pen
sion
Non
Par
G
roup
Life
Non
Par
G
roup
Va
riabl
e Pe
nsio
n
Non
Par
G
roup
Va
riabl
e Lif
e
Non
Lin
ked
Indi
vidua
l
Non
Lin
ked
Indi
vidua
l Va
riabl
e Lif
e
Non
Linke
d
Varia
ble
Pens
ion
Non
Linke
d
Hea
lthNo
n Lin
ked
An
nuity
Linke
d
Life
Linke
d
Pens
ion
Linke
d
Gro
up
Prem
ium
s ea
rned
- n
et
(a)
Prem
ium
I
1,08
,20,
041
1,07
,893
4
,01,1
32
15,3
64
28,
165
2,20
,40,
375
2,9
5,26
3 16
,595
3
7,34
5 1,
38,9
28
80,
88,6
51
3,7
0,56
3 12
,18,9
53
4,3
5,79
,268
(b)
Rein
sura
nce
cede
d (1
4,71
2) (1
8) (4
2,25
4) -
(8)
(1,17
,136)
(33)
- (1
,581
) -
(45,
722)
(548
) (5
65)
(2,2
2,57
7)
(c)
Rein
sura
nce
acce
pted
-
- -
- -
- -
- -
- -
- -
-
1,08
,05,
329
1,0
7,87
5 3
,58,
878
15,
364
28,
157
2,1
9,23
,239
2
,95,
230
16,
595
35,
764
1,3
8,92
8 8
0,42
,929
3
,70,
015
12,
18,3
88
4,3
3,56
,691
Inco
me
From
Inve
stm
ents
(a)
Inte
rest
, div
iden
d &
rent
- g
ross
3
1,86,
113
11,7
30
50,
108
59,
732
48,
147
48,
13,2
78
3,4
4,28
8 2
3,64
4 13
,021
2
4,98
8 12
,61,9
56
1,12
,159
5,6
8,15
8 1
,05,
17,3
22
(b)
Profi
t on
sale
/re
dem
ptio
n of
in
vest
men
ts
12,0
5,24
9 5
51
6,9
94
1,90
8 2
,081
6
,00,
260
13,12
7 6
82
1,88
7 9
99
44,
38,0
58
4,8
5,19
8 7
,91,3
19
75,
48,3
13
(c)
(Loss
on
sale
/re
dem
ptio
n of
in
vest
men
ts)
(4,6
5,75
8) (9
) (1
,976
) (5
72)
(545
) (1
,94,
063)
(4,4
77)
(75)
(511
) (2
38)
(22,
17,6
94)
(2,2
5,37
1) (5
,62,
483)
(36,
73,7
72)
(d)
Tran
sfer
/gai
n re
valu
atio
n/ch
ange
in
fair
valu
e
- -
- -
- -
- -
- -
8,4
2,36
3 (3
,068
) (5
4,45
5) 7
,84,
840
(e)
Am
ortis
atio
n of
pr
emiu
m/d
isco
unt o
n in
vest
men
ts
63,
098
234
2
,087
(1
,458
) (2
,233
) 4
,94,
577
(13,
663)
(829
) 5
46
116
6,0
6,43
2 7
8,28
8 1,
53,5
75
13,
80,7
70
Oth
er In
com
e
(a)
Mis
cella
neou
s In
com
e 8
8,85
6 10
1 -
- -
59,
203
559
9
2 3
83
1 14
,586
1,
113
1 1
,64,
895
(b)
Cont
ribut
ion
from
Sh
areh
olde
rs' A
ccou
nt
- -
- -
1,13
2 1,
03,6
27
- -
- 10
,126
10,9
5,65
8 -
12,7
09
12,
23,2
52
Tota
l (A
) 1,
48,8
2,88
7 1
,20,
482
4,1
6,09
1 7
4,97
4 7
6,73
9 2,
78,0
0,12
1 6
,35,
064
40,
109
51,
090
1,7
4,92
0 1,
40,8
4,28
8 8
,18,
334
21,
27,2
12
6,1
3,02
,311
Com
mis
sion
II
3,2
2,83
5 2
,617
4
6 -
- 12
,84,
540
1,31
4 6
4 9
40
1,47
2 1,
16,4
17
3,3
18
- 1
7,33
,563
Ope
ratin
g ex
pens
es re
late
d to
insu
ranc
e bu
sine
ss
III
9,3
6,58
4 4
,267
5
6,11
1 1,
563
2,6
65
54,
26,9
97
43,
555
585
6
,328
5
,597
2
3,64
,861
15
,646
9
4,92
0 8
9,59
,679
Prov
isio
n fo
r dou
btfu
l deb
ts
- -
- -
- -
- -
- -
- -
- -
App
endi
x 1

127
STRA
TEG
IC R
EPO
RT /
STA
TUTO
RY R
EPO
RTS
/ F
INA
NCI
ALS
STA
TEM
ENTS
(` ‘0
00)
Par
ticul
ars
Sche
dule
Cur
rent
Yea
r
Parti
cipat
ing
Busin
ess
Non
- Par
ticip
atng
Bus
ines
s
Tota
l Lif
ePe
nsio
n No
n Pa
r G
roup
Life
Non
Par
Gro
up
Varia
ble
Pens
ion
Non
Par
G
roup
Va
riabl
e Lif
e
Non
Lin
ked
Indi
vidua
l
Non
Lin
ked
Indi
vidua
l Va
riabl
e Lif
e
Non
Lin
ked
Va
riabl
e Pe
nsio
n
Non
Linke
d
Hea
lthNo
n Lin
ked
An
nuity
Linke
d
Life
Linke
d
Pens
ion
Linke
d
Gro
up
Bad
debt
s w
ritte
n of
f -
- -
- -
- -
- -
- -
- -
-
Prov
isio
n fo
r tax
-
- -
- -
- -
- -
- -
- -
-
Prov
isio
n Fo
r dim
inut
ion
in
the
valu
e of
inve
stm
ents
(n
et)
- -
- -
- 1,
27,6
87
- -
- -
2,0
4,51
1 13
,549
1,
38,0
35
4,8
3,78
2
Serv
ice
tax/
GST
on
char
ges
- -
- 1,
087
1,51
8 1,
530
21,3
34
1,41
0 -
- 2
,81,4
11
16,2
60
19,6
02
3,4
4,15
2
Tota
l (B)
1
2,59
,419
6
,884
5
6,15
7 2
,650
4
,183
6
8,40
,754
6
6,20
3 2
,059
7
,268
7
,069
2
9,67
,200
4
8,77
3 2
,52,
557
1,1
5,21
,176
Bene
fits
paid
(net
) IV
7
6,97
,034
3
16
3,6
2,95
3 1,
41,6
29
3,17
,698
2
3,63
,001
18
,02,
221
97,
103
13,5
46
29,
230
1,25
,94,
291
13,9
3,46
8 8
5,72
,618
3
,53,
85,1
08
Inte
rim b
onus
es p
aid
7,0
12
34
- -
- -
- -
- -
- -
- 7
,046
Chan
ge in
val
uatio
n of
lia
bilit
y in
resp
ect o
f life
po
licie
s
(a)
Gro
ss
49,
14,0
77
79,
223
(1,3
8,15
1) (7
7,33
2) (2
,48,
089)
1,77
,25,
045
(12,
98,8
59)
(65,
805)
(57,
857)
1,34
,775
(1
4,77
,203
) (7
,06,
001)
(67,
18,4
94)
1,2
0,65
,329
(b)
(Am
ount
ced
ed in
re
insu
ranc
e)
- -
- -
- -
- -
- -
- -
- -
(c)
Am
ount
acc
epte
d in
re
insu
ranc
e -
- -
- -
- -
- -
- -
- -
-
Tot
al (C
) 1
,26,
18,1
23
79,
573
2,2
4,80
2 6
4,29
7 6
9,60
9 2,
00,8
8,04
6 5
,03,
362
31,
298
(44,
311)
1,6
4,00
5 1
,11,
17,0
88
6,8
7,46
7 1
8,54
,124
4
,74,
57,4
83
Sur
plus
/ (D
efici
t) (D
) = (A
) -
(B) -
(C)
10,
05,3
45
34,
025
1,3
5,13
2 8
,027
2
,947
8
,71,
321
65,
499
6,7
52
88,
133
3,8
46
-
82,
094
20,
531
23,
23,6
52
App
ropr
iatio
ns
Tran
sfer
to S
hare
hold
ers’
A
ccou
nt
2,11
,598
1,
338
1,35
,132
8,0
27
2,9
47
8,7
1,321
6
5,49
9 6
,752
8
8,13
3 3
,846
-
82,
094
20,
531
14,
97,2
18
Tran
sfer
to o
ther
rese
rves
-
- -
- -
- -
- -
- -
- -
-
Bala
nce
bein
g fu
nds
for
futu
re a
ppro
pria
tions
7
,93,
747
32,
687
- -
- -
- -
- -
- -
- 8
,26,
434
Tota
l (E)
1
0,05
,345
3
4,02
5 1
,35,
132
8,0
27
2,9
47
8,7
1,32
1 6
5,49
9 6
,752
8
8,13
3 3
,846
-
8
2,09
4 2
0,53
1 2
3,23
,652
Fund
s fo
r fut
ure
appr
opria
tions
Ope
ning
bal
ance
at t
he
begi
nnin
g of
the
year
19
,36,
911
60,
578
- -
- -
- -
- -
- -
- 1
9,97
,489
Add
: Cur
rent
yea
r ap
prop
riatio
n 7
,93,
747
32,
687
- -
- -
- -
- -
- -
- 8
,26,
434
Bala
nce
carr
ied
forw
ard
to
Bala
nce
Shee
t 2
7,30
,658
9
3,26
5 -
-
-
-
-
-
-
-
-
-
-
2
8,23
,923
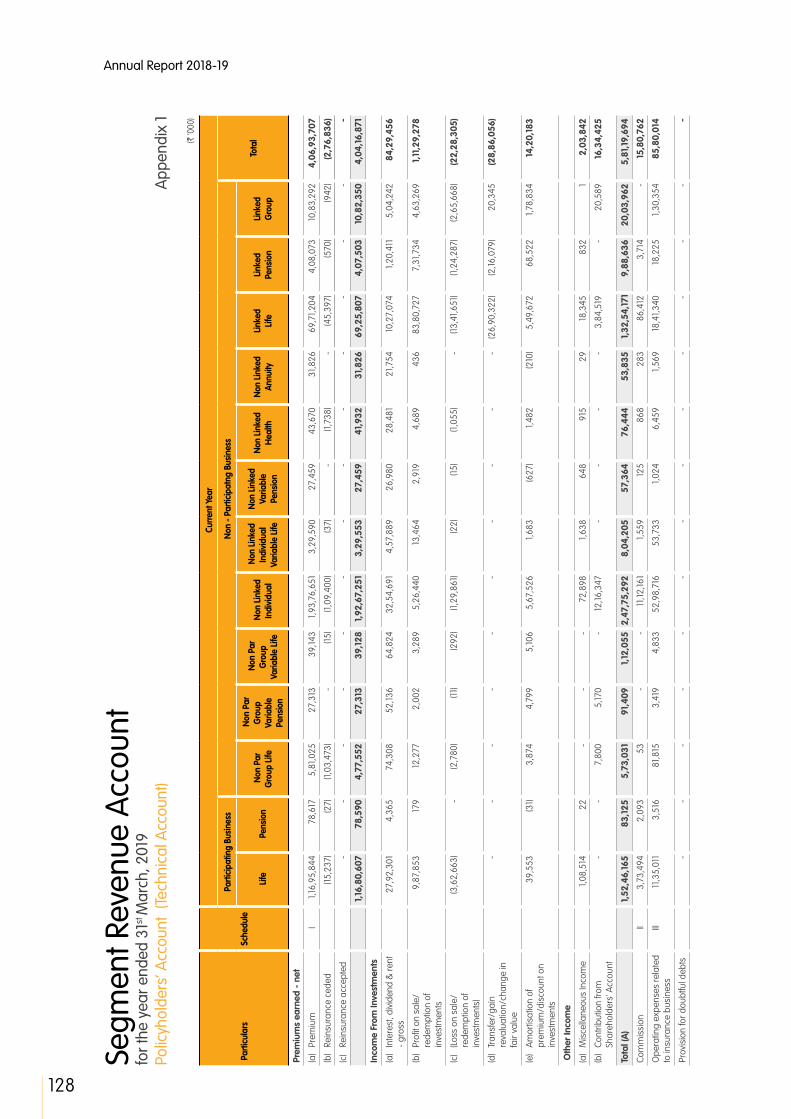
Annual Report 2018-19
128
Segm
ent R
even
ue A
ccou
nt
for t
he y
ear e
nded
31st
Mar
ch, 2
019
Polic
yhol
ders
’ Acc
ount
(Te
chni
cal A
ccou
nt)
App
endi
x 1
(` ‘0
00)
Par
ticul
ars
Sche
dule
Cur
rent
Yea
r
Parti
cipat
ing
Busin
ess
Non
- Par
ticip
atng
Bus
ines
s
Tota
l L
ife
Pen
sion
Non
Par
G
roup
Life
Non
Par
G
roup
Va
riabl
e Pe
nsio
n
Non
Par
G
roup
Va
riabl
e Lif
e
Non
Lin
ked
Indi
vidua
l
Non
Lin
ked
Indi
vidua
l Va
riabl
e Lif
e
Non
Linke
d
Varia
ble
Pens
ion
Non
Linke
d
Hea
lthNo
n Lin
ked
An
nuity
Linke
d
Life
Linke
d
Pens
ion
Linke
d
Gro
up
Prem
ium
s ea
rned
- n
et
(a)
Prem
ium
I
1,16
,95,
844
78,
617
5,8
1,025
2
7,31
3 3
9,14
3 1,
93,7
6,65
1 3
,29,
590
27,
459
43,
670
31,8
26
69,
71,2
04
4,0
8,07
3 10
,83,
292
4,0
6,93
,707
(b)
Rein
sura
nce
cede
d (1
5,23
7) (2
7) (1
,03,
473)
- (1
5) (1
,09,
400)
(37)
- (1
,738
) -
(45,
397)
(570
) (9
42)
(2,7
6,83
6)
(c)
Rein
sura
nce
acce
pted
-
- -
- -
- -
- -
- -
- -
-
1,1
6,80
,607
7
8,59
0 4
,77,
552
27,
313
39,
128
1,9
2,67
,251
3
,29,
553
27,
459
41,
932
31,
826
69,
25,8
07
4,0
7,50
3 1
0,82
,350
4
,04,
16,8
71
Inco
me
From
Inve
stm
ents
(a)
Inte
rest
, div
iden
d &
rent
- g
ross
2
7,92
,301
4
,365
7
4,30
8 5
2,13
6 6
4,82
4 3
2,54
,691
4
,57,
889
26,
980
28,
481
21,7
54
10,2
7,07
4 1,
20,4
11
5,0
4,24
2 8
4,29
,456
(b)
Profi
t on
sale
/re
dem
ptio
n of
in
vest
men
ts
9,8
7,85
3 17
9 12
,277
2
,002
3
,289
5
,26,
440
13,4
64
2,9
19
4,6
89
436
8
3,80
,727
7
,31,7
34
4,6
3,26
9 1
,11,
29,2
78
(c)
(Loss
on
sale
/re
dem
ptio
n of
in
vest
men
ts)
(3,6
2,66
3) -
(2,7
80)
(11)
(292
) (1
,29,
861)
(22)
(15)
(1,0
55)
- (1
3,41
,651
) (1
,24,
287)
(2,6
5,66
8) (2
2,28
,305
)
(d)
Tran
sfer
/gai
n re
valu
atio
n/ch
ange
in
fair
valu
e
- -
- -
- -
- -
- -
(26,
90,3
22)
(2,16
,079
) 2
0,34
5 (2
8,86
,056
)
(e)
Am
ortis
atio
n of
pr
emiu
m/d
isco
unt o
n in
vest
men
ts
39,
553
(31)
3,8
74
4,7
99
5,10
6 5
,67,
526
1,68
3 (6
27)
1,48
2 (2
10)
5,4
9,67
2 6
8,52
2 1,
78,8
34
14,
20,1
83
Oth
er In
com
e
(a)
Mis
cella
neou
s In
com
e 1,
08,5
14
22
- -
- 7
2,89
8 1,
638
648
9
15
29
18,3
45
832
1
2,0
3,84
2
(b)
Cont
ribut
ion
from
Sh
areh
olde
rs' A
ccou
nt
- -
7,8
00
5,17
0 -
12,16
,347
-
- -
- 3
,84,
519
- 2
0,58
9 1
6,34
,425
Tota
l (A
) 1
,52,
46,1
65
83,
125
5,7
3,03
1 9
1,40
9 1
,12,
055
2,47
,75,
292
8,0
4,20
5 5
7,36
4 7
6,44
4 5
3,83
5 1
,32,
54,1
71
9,8
8,63
6 2
0,03
,962
5
,81,
19,6
94
Com
mis
sion
II
3,7
3,49
4 2
,093
5
3 -
- 11
,12,16
1 1,
559
125
868
2
83
86,
412
3,7
14
- 1
5,80
,762
Ope
ratin
g ex
pens
es re
late
d to
insu
ranc
e bu
sine
ss
III
11,3
5,01
1 3
,516
8
1,815
3
,419
4
,833
5
2,98
,716
5
3,73
3 1,
024
6,4
59
1,56
9 18
,41,3
40
18,2
25
1,30
,354
8
5,80
,014
Prov
isio
n fo
r dou
btfu
l deb
ts
- -
- -
- -
- -
- -
- -
- -

129
STRA
TEG
IC R
EPO
RT /
STA
TUTO
RY R
EPO
RTS
/ F
INA
NCI
ALS
STA
TEM
ENTS
(` ‘0
00)
Par
ticul
ars
Sche
dule
Cur
rent
Yea
r
Parti
cipat
ing
Busin
ess
Non
- Par
ticip
atng
Bus
ines
s
Tota
l Lif
ePe
nsio
n No
n Pa
r G
roup
Life
Non
Par
Gro
up
Varia
ble
Pens
ion
Non
Par
G
roup
Va
riabl
e Lif
e
Non
Lin
ked
Indi
vidua
l
Non
Lin
ked
Indi
vidua
l Va
riabl
e Lif
e
Non
Lin
ked
Va
riabl
e Pe
nsio
n
Non
Linke
d
Hea
lthNo
n Lin
ked
An
nuity
Linke
d
Life
Linke
d
Pens
ion
Linke
d
Gro
up
Bad
debt
s w
ritte
n of
f -
- -
- -
- -
- -
- -
- -
-
Prov
isio
n fo
r tax
-
- -
- -
- -
- -
- -
- -
-
Prov
isio
n Fo
r dim
inut
ion
in
the
valu
e of
inve
stm
ents
(n
et)
- -
- -
- -
- -
- -
- -
- -
Serv
ice
tax/
GST
on
char
ges
- -
- 1,
055
1,58
6 1,
926
37,
779
1,63
6 -
- 2
,76,
950
19,0
83
19,9
77
3,5
9,99
2
Tota
l (B)
1
5,08
,505
5
,609
8
1,86
8 4
,474
6
,419
6
4,12
,803
9
3,07
1 2
,785
7
,327
1
,852
2
2,04
,702
4
1,02
2 1
,50,
331
1,0
5,20
,768
Bene
fits
paid
(net
) IV
8
1,71,1
08
408
3
,37,
593
49,
499
2,0
3,49
4 16
,60,
414
13,0
8,10
0 1,
12,5
35
18,15
9 19
,865
1,
50,7
5,09
3 14
,70,
894
12,8
0,78
1 2
,97,
07,9
43
Inte
rim b
onus
es p
aid
7,0
39
11
- -
- -
- -
- -
- -
- 7
,050
Chan
ge in
val
uatio
n of
lia
bilit
y in
resp
ect o
f life
po
licie
s
(a)
Gro
ss
40,
71,8
18
52,
732
(3,5
6,40
9) 3
5,43
7 (1
,19,9
20)
1,67
,02,
075
(7,5
3,48
7) (7
0,62
2) (2
,62,
696)
27,
124
(40,
25,6
24)
(6,3
4,50
3) 5
,60,
551
1,5
2,26
,476
(b)
(Am
ount
ced
ed in
re
insu
ranc
e)
- -
- -
- -
- -
- -
- -
- -
(c)
Am
ount
acc
epte
d in
re
insu
ranc
e -
- -
- -
- -
- -
- -
- -
-
Tot
al (C
) 1,
22,4
9,96
5 5
3,15
1 (1
8,81
6) 8
4,93
6 8
3,57
4 1
,83,
62,4
89
5,5
4,61
3 4
1,91
3 (2
,44,
537)
46,
989
1,1
0,49
,469
8
,36,
391
18,
41,3
32
4,4
9,41
,469
Sur
plus
/ (D
efici
t) (D
) = (A
) -
(B) -
(C)
14,
87,6
95
24,
365
5,0
9,97
9 1
,999
2
2,06
2 -
1
,56,
521
12,
666
3,1
3,65
4 4
,994
-
1
,11,
223
12,
299
26,
57,4
57
App
ropr
iatio
ns
Tran
sfer
to S
hare
hold
ers’
A
ccou
nt
1,69
,703
9
45
5,0
9,97
9 1,
999
22,
062
- 1,
56,5
21
12,6
66
3,13
,654
4
,994
-
1,11
,223
12
,299
1
3,16
,045
Tran
sfer
to o
ther
rese
rves
-
- -
- -
- -
- -
- -
- -
-
Bala
nce
bein
g fu
nds
for
futu
re a
ppro
pria
tions
13
,17,9
92
23,
420
- -
- -
- -
- -
- -
- 1
3,41
,412
Tota
l (E)
1
4,87
,695
2
4,36
5 5
,09,
979
1,9
99
22,
062
-
1,5
6,52
1 1
2,66
6 3
,13,
654
4,9
94
-
1,1
1,22
3 1
2,29
9 2
6,57
,457
Fund
s fo
r fut
ure
appr
opria
tions
Ope
ning
bal
ance
at t
he
begi
nnin
g of
the
year
6
,18,9
19
37,
158
- -
- -
- -
- -
- -
- 6
,56,
077
Add
: Cur
rent
yea
r ap
prop
riatio
n 13
,17,9
92
23,
420
- -
- -
- -
- -
- -
- 1
3,41
,412
Bala
nce
carr
ied
forw
ard
to
Bala
nce
Shee
t 1
9,36
,911
6
0,57
8 -
-
-
-
-
-
-
-
-
-
-
1
9,97
,489

Annual Report 2018-19
130
Segm
enta
l Bal
ance
She
et
(`
‘000
)
Par
ticul
ars
As a
t 31st
Mar
ch, 2
019
Parti
cipat
ing
Busin
ess
Non-
Parti
cipat
ing
Busin
ess
Shar
ehol
ders
’ Fu
nds
Tota
l L
ife
Pen
sion
Non
Par
G
roup
Life
Non
Par
G
roup
Va
riabl
e Pe
nsio
n
Non
Par
G
roup
Va
riabl
e Lif
e
Non
Lin
ked
Indi
vidua
l
Non
Lin
ked
Indi
vidua
l Va
riabl
e Lif
e
Non
Linke
d
Varia
ble
Pens
ion
Non
Lin
ked
Hea
lth
Non
Lin
ked
Annu
ity
Lin
ked
Lif
eLin
ked
Pe
nsio
nLin
ked
G
roup
SOUR
CES
OF
FUND
S
SHAR
EHO
LDER
S' FU
NDS
Shar
e ca
pita
l -
- -
- -
- -
- -
- -
- -
1,19
,63,
235
1,19
,63,
235
Rese
rves
and
sur
plus
- -
- -
- -
- -
- -
- -
- 3
0,31
,592
3
0,31
,592
Cred
it / (
Debi
t) Fa
ir va
lue
chan
ge a
ccou
nt -
- -
- -
- -
- -
- -
- -
3,3
4,93
6 3
,34,
936
Sub-
Tota
l (A)
-
-
-
-
-
-
-
-
-
-
-
-
-
1,5
3,29
,763
1,
53,2
9,76
3
Borro
win
gs -
- -
- -
- -
- -
- -
- -
- -
Sub-
Tota
l (B)
-
-
-
-
-
-
-
-
-
-
-
-
-
-
-
POLIC
YHO
LDER
S' FU
NDS
Cred
it / (
Debi
t) Fa
ir va
lue
chan
ge a
ccou
nt 14
,74,
738
- 2
,044
-
- 2
,46,
575
- -
518
-
2,0
25
145
41
- 17
,26,
086
Polic
y lia
biliti
es4,
64,8
6,12
4 1,
47,0
25
5,9
8,32
1 7
,11,6
13
6,6
1,322
7
,21,9
0,19
9 3
9,14
,423
3
,03,
353
1,51
,648
4
,16,3
14
5,9
2,87
0 4
2,57
2 12
,005
-
12,6
2,27
,789
Insu
ranc
e re
serv
es -
- -
- -
- -
- -
- -
- -
- -
Prov
ision
for l
inke
d lia
biliti
es -
- -
- -
- -
- -
- 4
,72,
49,10
2 3
6,58
,015
6
1,30,
635
- 5
,70,
37,7
52
Fund
for d
iscon
tinue
d Po
licie
s
(i)
Disc
ontin
ued
on
acco
unt o
f non
pa
ymen
t of P
rem
ium
- -
- -
- -
- -
- -
39,
26,2
09
7,9
6,56
0 -
- 4
7,22
,769
(ii)
Oth
ers
- -
- -
- -
- -
- -
- -
- -
-
Sub-
Tota
l (C)
4,7
9,60
,862
1
,47,
025
6,0
0,36
5 7
,11,
613
6,6
1,32
2 7
,24,
36,7
74
39,
14,4
23
3,0
3,35
3 1
,52,
166
4,1
6,31
4 5
,17,
70,2
06
44,
97,2
92
61,
42,6
81
-
18,9
7,14
,396
Fund
s fo
r fut
ure
appr
opria
tion
Non
Linke
d 2
7,30
,658
9
3,26
5 -
- -
- -
- -
- -
- -
28,
23,9
23
Linke
d - P
rovis
ion
for l
apse
d po
licie
s no
t like
ly to
be
reviv
ed -
- -
- -
- -
- -
- -
- -
-
Sub-
Tota
l (D)
27,
30,6
58
93,
265
-
-
-
-
-
-
-
-
-
-
-
-
28,
23,9
23
Tota
l (E)
= (
A) +
(B) +
(C) +
(D)
5,06
,91,
520
2,4
0,29
0 6
,00,
365
7,1
1,61
3 6
,61,
322
7,2
4,36
,774
3
9,14
,423
3
,03,
353
1,5
2,16
6 4
,16,
314
5,1
7,70
,206
4
4,97
,292
6
1,42
,681
1
,53,
29,7
63
20,
78,6
8,08
2
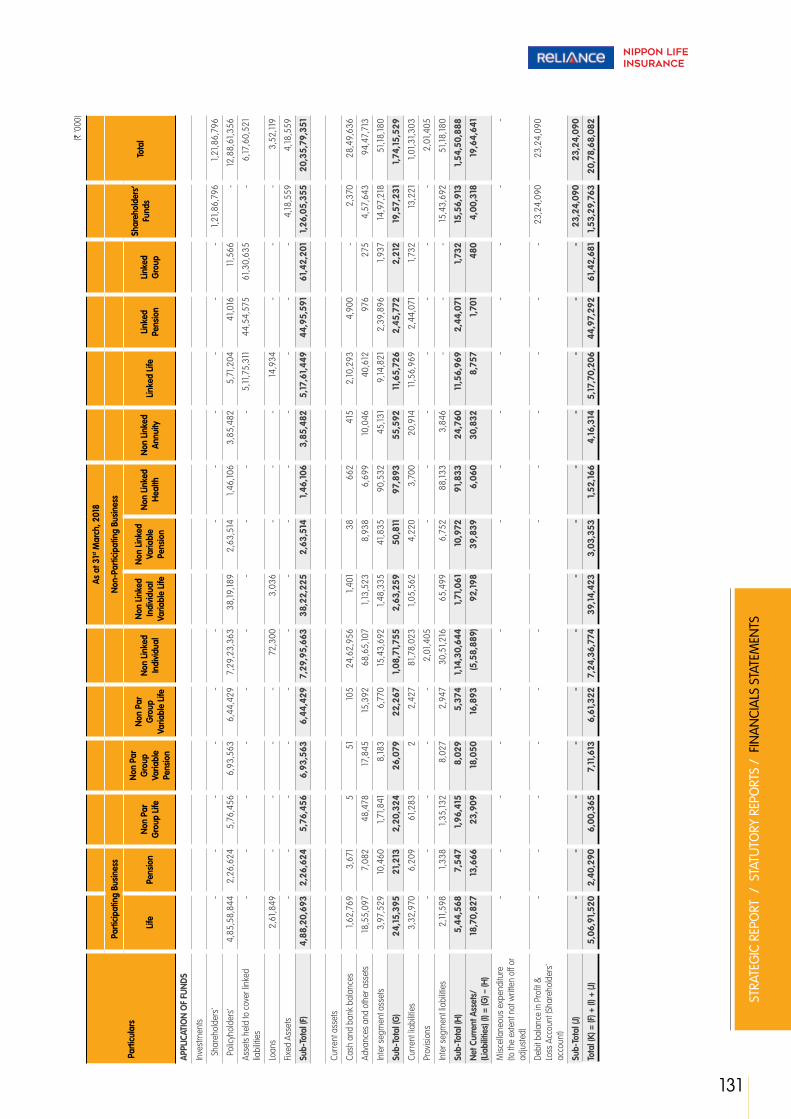
131
STRA
TEG
IC R
EPO
RT /
STA
TUTO
RY R
EPO
RTS
/ F
INA
NCI
ALS
STA
TEM
ENTS
(` ‘0
00)
Par
ticul
ars
As a
t 31st
Mar
ch, 2
018
Parti
cipat
ing
Busin
ess
Non-
Parti
cipat
ing
Busin
ess
Shar
ehol
ders
’ Fu
nds
Tota
l Lif
ePe
nsio
n No
n Pa
r G
roup
Life
Non
Par
Gro
up
Varia
ble
Pens
ion
Non
Par
Gro
up
Varia
ble
Life
Non
Linke
d In
divid
ual
Non
Linke
d In
divid
ual
Varia
ble
Life
Non
Linke
d
Varia
ble
Pens
ion
Non
Linke
d
Hea
lthNo
n Lin
ked
An
nuity
Linke
d Lif
eLin
ked
Pe
nsio
nLin
ked
G
roup
APPL
ICAT
ION
OF
FUND
S
Inve
stm
ents
Shar
ehol
ders
' -
- -
- -
- -
- -
- -
- 1,
21,8
6,79
6 1,
21,8
6,79
6
Polic
yhol
ders
' 4
,85,
58,8
44
2,2
6,62
4 5
,76,
456
6,9
3,56
3 6
,44,
429
7,2
9,23
,363
3
8,19
,189
2,6
3,51
4 1,
46,10
6 3
,85,
482
5,7
1,204
4
1,016
11
,566
-
12,8
8,61
,356
Asse
ts h
eld
to c
over
linke
d lia
biliti
es -
- -
- -
- -
- -
- 5
,11,7
5,31
1 4
4,54
,575
6
1,30,
635
- 6
,17,6
0,52
1
Loan
s 2
,61,8
49
- -
- -
72,
300
3,0
36
- -
- 14
,934
-
- -
3,5
2,11
9
Fixed
Ass
ets
- -
- -
- -
- -
- -
- -
- 4
,18,5
59
4,18
,559
Sub-
Tota
l (F)
4,8
8,20
,693
2
,26,
624
5,7
6,45
6 6
,93,
563
6,4
4,42
9 7
,29,
95,6
63
38,
22,2
25
2,6
3,51
4 1
,46,
106
3,8
5,48
2 5
,17,
61,4
49
44,
95,5
91
61,
42,2
01
1,2
6,05
,355
2
0,35
,79,
351
Curre
nt a
sset
s
Cash
and
ban
k ba
lanc
es 1,
62,7
69
3,6
71
5
51
105
24,
62,9
56
1,40
1 3
8 6
62
415
2
,10,2
93
4,9
00
- 2,
370
28,
49,6
36
Adva
nces
and
oth
er a
sset
s 18
,55,
097
7,0
82
48,
478
17,8
45
15,3
92
68,
65,10
7 1,
13,5
23
8,9
38
6,6
99
10,0
46
40,
612
976
2
75
4,57
,643
94,
47,7
13
Inte
r seg
men
t ass
ets
3,9
7,52
9 10
,460
1,
71,8
41
8,18
3 6
,770
15
,43,
692
1,48
,335
4
1,835
9
0,53
2 4
5,13
1 9
,14,8
21
2,3
9,89
6 1,
937
14,9
7,21
8 5
1,18,
180
Sub-
Tota
l (G
) 2
4,15
,395
2
1,21
3 2
,20,
324
26,
079
22,
267
1,0
8,71
,755
2
,63,
259
50,
811
97,
893
55,
592
11,
65,7
26
2,4
5,77
2 2
,212
1
9,57
,231
1
,74,
15,5
29
Curre
nt lia
biliti
es 3
,32,
970
6,2
09
61,2
83
2
2,4
27
81,7
8,02
3 1,
05,5
62
4,2
20
3,7
00
20,
914
11,5
6,96
9 2
,44,
071
1,73
2 13
,221
1,
01,3
1,303
Prov
ision
s -
- -
- -
2,0
1,405
-
- -
- -
- -
2,0
1,405
Inte
r seg
men
t lia
biliti
es 2
,11,5
98
1,33
8 1,
35,13
2 8
,027
2
,947
3
0,51
,216
6
5,49
9 6
,752
8
8,13
3 3
,846
-
- -
15,4
3,69
2 5
1,18,
180
Sub-
Tota
l (H
) 5
,44,
568
7,5
47
1,9
6,41
5 8
,029
5
,374
1
,14,
30,6
44
1,7
1,06
1 1
0,97
2 9
1,83
3 2
4,76
0 1
1,56
,969
2
,44,
071
1,7
32
15,
56,9
13
1,5
4,50
,888
Net C
urre
nt A
sset
s/(Li
abilit
ies)
(I) =
(G) –
(H)
18,
70,8
27
13,
666
23,
909
18,
050
16,
893
(5,5
8,88
9) 9
2,19
8 3
9,83
9 6
,060
3
0,83
2 8
,757
1
,701
4
80
4,0
0,31
8 1
9,64
,641
Misc
ella
neou
s ex
pend
iture
(to
the
exte
nt n
ot w
ritte
n of
f or
adju
sted
)
- -
- -
- -
- -
- -
- -
- -
Debi
t bal
ance
in P
rofit
&
Loss
Acc
ount
(Sha
reho
lder
s' ac
coun
t)
- -
- -
- -
- -
- -
- -
23,
24,0
90
23,
24,0
90
Sub-
Tota
l (J)
-
-
-
-
-
-
-
-
-
-
-
-
-
23,
24,0
90
23,
24,0
90
Tota
l (K)
= (F
) + (I
) + (J
) 5
,06,
91,5
20
2,4
0,29
0 6
,00,
365
7,1
1,61
3 6
,61,
322
7,2
4,36
,774
3
9,14
,423
3
,03,
353
1,5
2,16
6 4
,16,
314
5,1
7,70
,206
4
4,97
,292
6
1,42
,681
1
,53,
29,7
63
20,
78,6
8,08
2
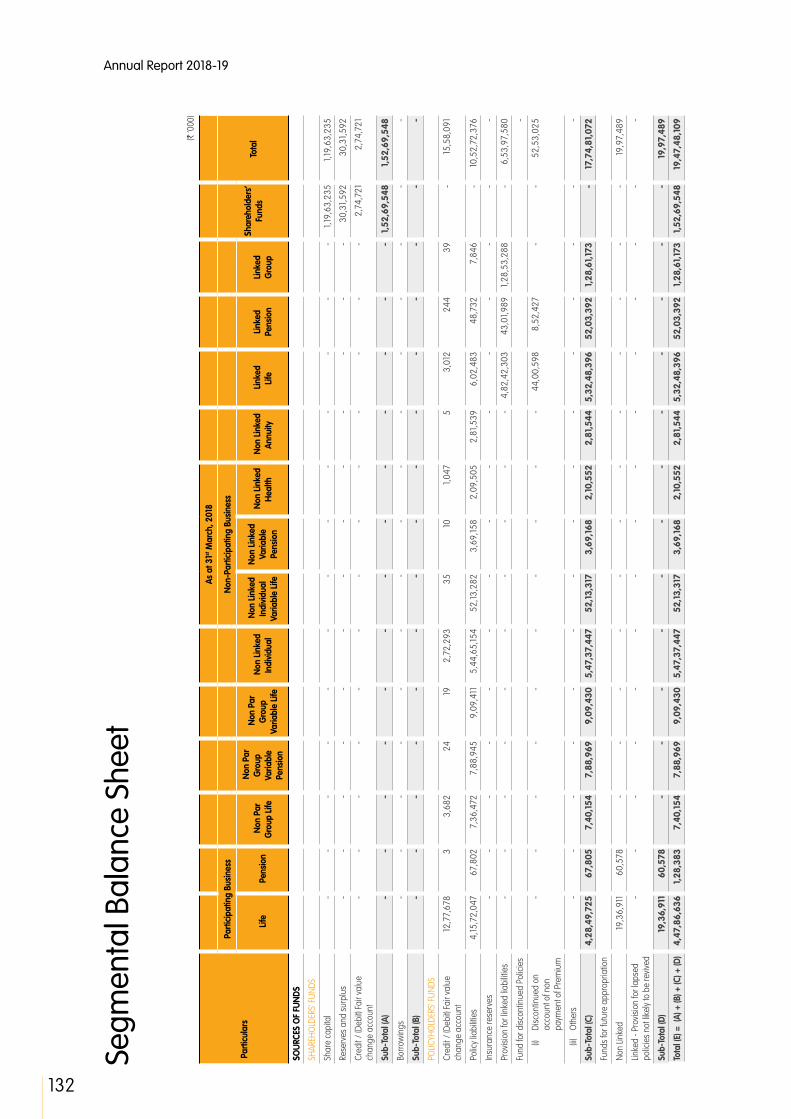
Annual Report 2018-19
132
Segm
enta
l Bal
ance
She
et
(`
‘000
)
Par
ticul
ars
As a
t 31st
Mar
ch, 2
018
Parti
cipat
ing
Busin
ess
Non-
Parti
cipat
ing
Busin
ess
Shar
ehol
ders
’ Fu
nds
Tota
l L
ife
Pen
sion
Non
Par
G
roup
Life
Non
Par
G
roup
Va
riabl
e Pe
nsio
n
Non
Par
G
roup
Va
riabl
e Lif
e
Non
Lin
ked
Indi
vidua
l
Non
Lin
ked
Indi
vidua
l Va
riabl
e Lif
e
Non
Linke
d
Varia
ble
Pens
ion
Non
Lin
ked
Hea
lth
Non
Lin
ked
Annu
ity
Lin
ked
Lif
eLin
ked
Pe
nsio
nLin
ked
G
roup
SOUR
CES
OF
FUND
S
SHAR
EHO
LDER
S' FU
NDS
Shar
e ca
pita
l -
- -
- -
- -
- -
- -
- -
1,19
,63,
235
1,19
,63,
235
Rese
rves
and
sur
plus
- -
- -
- -
- -
- -
- -
- 3
0,31
,592
3
0,31
,592
Cred
it / (
Debi
t) Fa
ir va
lue
chan
ge a
ccou
nt -
- -
- -
- -
- -
- -
- -
2,7
4,72
1 2
,74,
721
Sub-
Tota
l (A)
-
-
-
-
-
-
-
-
-
-
-
-
-
1,5
2,69
,548
1
,52,
69,5
48
Borro
win
gs -
- -
- -
- -
- -
- -
- -
- -
Sub-
Tota
l (B)
-
-
-
-
-
-
-
-
-
-
-
-
-
-
-
POLIC
YHO
LDER
S' FU
NDS
Cred
it / (
Debi
t) Fa
ir va
lue
chan
ge a
ccou
nt 12
,77,
678
3
3,6
82
24
19
2,7
2,29
3 3
5 10
1,
047
5
3,0
12
244
3
9 -
15,5
8,09
1
Polic
y lia
biliti
es 4
,15,7
2,04
7 6
7,80
2 7
,36,
472
7,8
8,94
5 9
,09,
411
5,4
4,65
,154
52,
13,2
82
3,6
9,15
8 2
,09,
505
2,8
1,539
6
,02,
483
48,
732
7,8
46
- 10
,52,
72,3
76
Insu
ranc
e re
serv
es -
- -
- -
- -
- -
- -
- -
- -
Prov
ision
for l
inke
d lia
biliti
es -
- -
- -
- -
- -
- 4
,82,
42,3
03
43,
01,9
89
1,28
,53,
288
- 6
,53,
97,5
80
Fund
for d
iscon
tinue
d Po
licie
s -
(i)
Disc
ontin
ued
on
acco
unt o
f non
pa
ymen
t of P
rem
ium
- -
- -
- -
- -
- -
44,
00,5
98
8,5
2,42
7 -
- 5
2,53
,025
(ii)
Oth
ers
- -
- -
- -
- -
- -
- -
- -
-
Sub-
Tota
l (C)
4,2
8,49
,725
6
7,80
5 7
,40,
154
7,8
8,96
9 9
,09,
430
5,4
7,37
,447
5
2,13
,317
3
,69,
168
2,1
0,55
2 2
,81,
544
5,3
2,48
,396
5
2,03
,392
1
,28,
61,1
73
-
17,
74,8
1,07
2
Fund
s fo
r fut
ure
appr
opria
tion
Non
Linke
d 19
,36,
911
60,
578
- -
- -
- -
- -
- -
- -
19,9
7,48
9
Linke
d - P
rovis
ion
for l
apse
d po
licie
s no
t like
ly to
be
reviv
ed -
- -
- -
- -
- -
- -
- -
- -
Sub-
Tota
l (D)
19,
36,9
11
60,
578
-
-
-
-
-
-
-
-
-
-
-
-
19,
97,4
89
Tota
l (E)
= (
A) +
(B) +
(C) +
(D)
4,4
7,86
,636
1
,28,
383
7,4
0,15
4 7
,88,
969
9,0
9,43
0 5
,47,
37,4
47
52,
13,3
17
3,6
9,16
8 2
,10,
552
2,8
1,54
4 5
,32,
48,3
96
52,
03,3
92
1,2
8,61
,173
1
,52,
69,5
48
19,
47,4
8,10
9

133
STRA
TEG
IC R
EPO
RT /
STA
TUTO
RY R
EPO
RTS
/ F
INA
NCI
ALS
STA
TEM
ENTS
(` ‘0
00)
Par
ticul
ars
As a
t 31st
Mar
ch, 2
018
Parti
cipat
ing
Busin
ess
Non-
Parti
cipat
ing
Busin
ess
Shar
ehol
ders
’ Fu
nds
Tota
l Lif
ePe
nsio
n No
n Pa
r G
roup
Life
Non
Par
Gro
up
Varia
ble
Pens
ion
Non
Par
Gro
up
Varia
ble
Life
Non
Linke
d In
divid
ual
Non
Linke
d In
divid
ual
Varia
ble
Life
Non
Linke
d
Varia
ble
Pens
ion
Non
Linke
d
Hea
lthNo
n Lin
ked
An
nuity
Linke
d Lif
eLin
ked
Pe
nsio
nLin
ked
G
roup
APPL
ICAT
ION
OF
FUND
S
Inve
stm
ents
Shar
ehol
ders
' -
- -
- -
- -
- -
- -
- -
1,18
,55,
206
1,18
,55,
206
Polic
yhol
ders
' 4
,29,
47,4
72
98,
093
7,4
3,30
1 7
,72,
083
8,7
4,93
1 5
,64,
49,7
37
50,
59,7
33
3,2
7,38
7 2
,11,4
47
3,0
0,55
1 6
,08,
070
49,
184
7,9
18
- 10
,84,
49,9
07
Asse
ts h
eld
to c
over
linke
d lia
biliti
es -
- -
- -
- -
- -
- 5
,26,
42,9
01
51,5
4,41
6 1,
28,5
3,28
8 -
7,0
6,50
,605
Loan
s 2
,01,3
00
- -
- -
32,
532
2,15
9 -
- -
26,
107
- -
- 2
,62,
098
Fixed
Ass
ets
- -
- -
- -
- -
- -
- -
- 2
,84,
457
2,8
4,45
7
Sub-
Tota
l (F)
4,3
1,48
,772
9
8,09
3 7
,43,
301
7,7
2,08
3 8
,74,
931
5,6
4,82
,269
5
0,61
,892
3
,27,
387
2,1
1,44
7 3
,00,
551
5,3
2,77
,078
5
2,03
,600
1,
28,6
1,20
6 1
,21,
39,6
63
19,
15,0
2,27
3
Curre
nt a
sset
s
Cash
and
ban
k ba
lanc
es 1,
06,6
20
2,2
81
6
14
60
23,
70,8
37
1,55
8 6
1 4
19
1,22
3 1,
79,18
7 5
,710
5
2 17
2
6,68
,045
Adva
nces
and
oth
er a
sset
s 18
,45,
874
6,5
42
1,17
,396
17
,225
3
3,06
3 8
6,26
,369
1,
61,6
63
10,6
84
16,7
42
8,10
7 4
0,89
9 1,
148
183
5,9
8,66
6 1,
14,8
4,56
1
Inte
r seg
men
t ass
ets
3,12
,188
25,
723
6,9
6,80
9 2
,084
2
7,50
0 12
,81,5
99
1,65
,886
4
4,39
2 3
,03,
465
- 10
,66,
885
2,0
8,04
5 6
08
13,16
,045
5
4,51
,229
Sub-
Tota
l (G
) 2
2,64
,682
3
4,54
6 8
,14,
211
19,
323
60,
623
1,2
2,78
,805
3
,29,
107
55,
137
3,2
0,62
6 9
,330
1
2,86
,971
2
,14,
903
843
1
9,14
,728
1
,96,
03,8
35
Curre
nt lia
biliti
es 4
,57,
115
3,3
11
3,0
7,37
9 4
38
4,0
62
1,09
,73,
729
21,1
61
690
7
,867
4
,338
13
,15,6
53
2,15
,111
876
8
1,971
1,
33,9
3,70
1
Prov
ision
s -
- -
- -
91,7
96
- -
- -
- -
- -
91,7
96
Inte
r seg
men
t lia
biliti
es 1,
69,7
03
945
5
,09,
979
1,99
9 2
2,06
2 2
9,58
,102
1,56
,521
12
,666
3
,13,6
54
23,
999
- -
- 12
,81,5
99
54,
51,2
29
Sub-
Tota
l (H
) 6
,26,
818
4,2
56
8,1
7,35
8 2
,437
2
6,12
4 1
,40,
23,6
27
1,7
7,68
2 1
3,35
6 3
,21,
521
28,
337
13,
15,6
53
2,1
5,11
1 8
76
13,
63,5
70
1,8
9,36
,726
Net C
urre
nt A
sset
s/(Li
abilit
ies)
(I) =
(G) –
(H)
16,
37,8
64
30,
290
(3,1
47)
16,
886
34,
499
(17,
44,8
22)
1,5
1,42
5 4
1,78
1 (8
95)
(19,
007)
(28,
682)
(208
) (3
3) 5
,51,
158
6,6
7,10
9
Misc
ella
neou
s ex
pend
iture
(to
the
exte
nt n
ot w
ritte
n of
f or
adju
sted
)
- -
- -
- -
- -
- -
- -
- -
-
Debi
t bal
ance
in P
rofit
&
Loss
Acc
ount
(Sha
reho
lder
s' ac
coun
t)
- -
- -
- -
- -
- -
- -
- 2
5,78
,727
2
5,78
,727
Sub-
Tota
l (J)
-
-
-
-
-
-
-
-
-
-
-
-
-
25,
78,7
27
25,
78,7
27
Tota
l (K)
= (F
) + (I
) + (J
) 4
,47,
86,6
36
1,2
8,38
3 7
,40,
154
7,8
8,96
9 9
,09,
430
5,4
7,37
,447
5
2,13
,317
3
,69,
168
2,1
0,55
2 2
,81,
544
5,3
2,48
,396
5
2,03
,392
1
,28,
61,1
73
1,5
2,69
,548
1
9,47
,48,
109
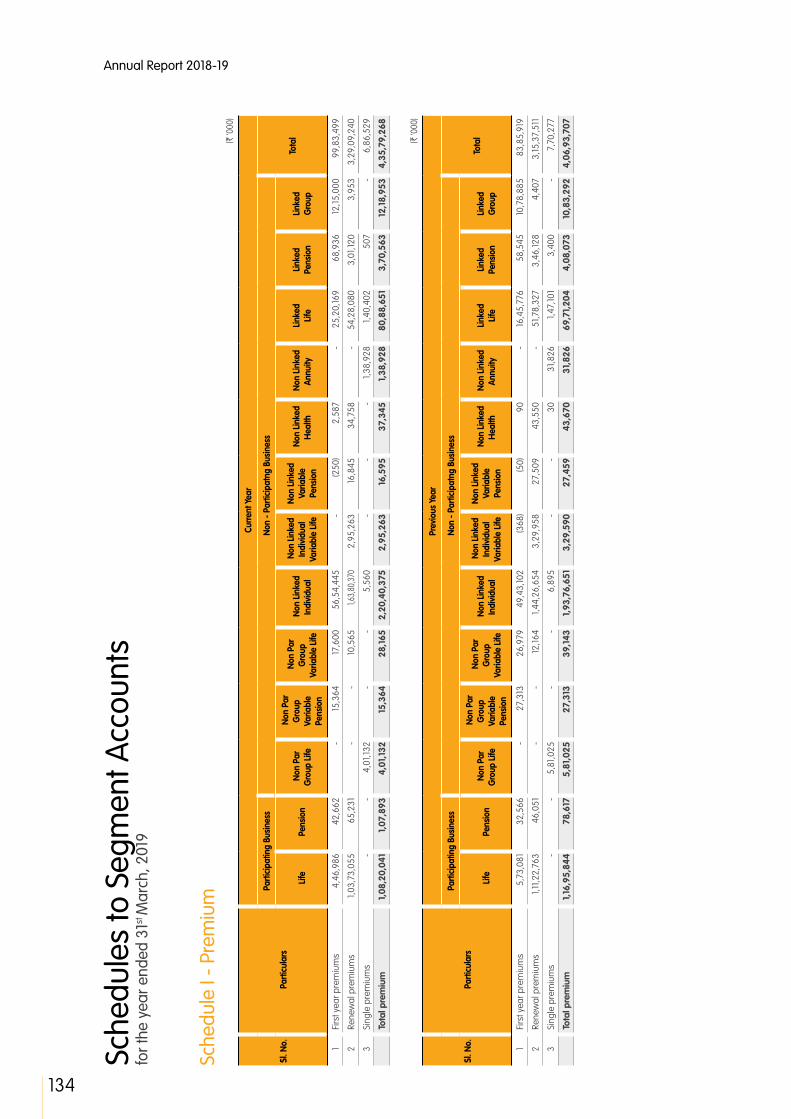
Annual Report 2018-19
134
Sche
dule
s to
Seg
men
t Acc
ount
s fo
r the
yea
r end
ed 3
1st M
arch
, 201
9
Sche
dule
I - P
rem
ium
(`
‘000
)
Sl. N
o. P
artic
ular
s
Cur
rent
Yea
r
Parti
cipat
ing
Busin
ess
Non
- Par
ticip
atng
Bus
ines
s
Tota
l L
ife
Pen
sion
Non
Par
G
roup
Life
Non
Par
G
roup
Va
riabl
e Pe
nsio
n
Non
Par
G
roup
Va
riabl
e Lif
e
Non
Lin
ked
Indi
vidua
l
Non
Lin
ked
Indi
vidua
l Va
riabl
e Lif
e
Non
Linke
d
Varia
ble
Pens
ion
Non
Lin
ked
Hea
lth
Non
Lin
ked
Annu
ity
Linke
d
Life
Linke
d
Pens
ion
Linke
d
Gro
up
1 F
irst y
ear p
rem
ium
s 4
,46,
986
42,
662
- 15
,364
17
,600
5
6,54
,445
-
(250
) 2
,587
-
25,
20,16
9 6
8,93
6 12
,15,0
00
99,
83,4
99
2
Ren
ewal
pre
miu
ms
1,03
,73,
055
65,
231
- -
10,5
65
1,63
,80,
370
2,9
5,26
3 16
,845
3
4,75
8 -
54,
28,0
80
3,0
1,120
3
,953
3
,29,
09,2
40
3
Sin
gle
prem
ium
s -
- 4
,01,1
32
- -
5,5
60
- -
- 1,
38,9
28
1,40
,402
5
07
- 6
,86,
529
Tot
al p
rem
ium
1,
08,2
0,04
1 1
,07,
893
4,0
1,13
2 1
5,36
4 2
8,16
5 2,
20,4
0,37
5 2
,95,
263
16,
595
37,
345
1,3
8,92
8 8
0,88
,651
3
,70,
563
12,
18,9
53
4,35
,79,
268
(` ‘0
00)
Sl. N
o. P
artic
ular
s
Prev
ious
Yea
r
Parti
cipat
ing
Busin
ess
Non
- Par
ticip
atng
Bus
ines
s
Tota
l L
ife
Pen
sion
Non
Par
G
roup
Life
Non
Par
G
roup
Va
riabl
e Pe
nsio
n
Non
Par
G
roup
Va
riabl
e Lif
e
Non
Lin
ked
Indi
vidua
l
Non
Lin
ked
Indi
vidua
l Va
riabl
e Lif
e
Non
Linke
d
Varia
ble
Pens
ion
Non
Lin
ked
Hea
lth
Non
Lin
ked
Annu
ity
Linke
d
Life
Linke
d
Pens
ion
Linke
d
Gro
up
1 F
irst y
ear p
rem
ium
s 5
,73,
081
32,
566
- 2
7,31
3 2
6,97
9 4
9,43
,102
(368
) (5
0) 9
0 -
16,4
5,77
6 5
8,54
5 10
,78,
885
83,
85,9
19
2
Ren
ewal
pre
miu
ms
1,11
,22,
763
46,
051
- -
12,16
4 1,
44,2
6,65
4 3
,29,
958
27,
509
43,
550
- 5
1,78,
327
3,4
6,12
8 4
,407
3
,15,3
7,51
1
3
Sin
gle
prem
ium
s -
- 5
,81,0
25
- -
6,8
95
- -
30
31,8
26
1,47
,101
3,4
00
- 7
,70,
277
Tot
al p
rem
ium
1
,16,
95,8
44
78,
617
5,8
1,02
5 2
7,31
3 3
9,14
3 1
,93,
76,6
51
3,2
9,59
0 2
7,45
9 4
3,67
0 3
1,82
6 6
9,71
,204
4
,08,
073
10,
83,2
92
4,0
6,93
,707

135
STRA
TEG
IC R
EPO
RT /
STA
TUTO
RY R
EPO
RTS
/ F
INA
NCI
ALS
STA
TEM
ENTS
Sche
dule
II -
Com
mis
sion
(`
‘000
)
Sl. N
o. P
artic
ular
s
Cur
rent
Yea
r
Parti
cipat
ing
Busin
ess
Non
- Par
ticip
atng
Bus
ines
s
Tota
l L
ife
Pen
sion
Non
Par
G
roup
Life
Non
Par
G
roup
Va
riabl
e Pe
nsio
n
Non
Par
G
roup
Va
riabl
e Lif
e
Non
Lin
ked
Indi
vidua
l
Non
Lin
ked
Indi
vidua
l Va
riabl
e Lif
e
Non
Linke
d
Varia
ble
Pens
ion
Non
Lin
ked
Hea
lth
Non
Lin
ked
Annu
ity
Linke
d
Life
Linke
d
Pens
ion
Linke
d
Gro
up
1 F
irst y
ear p
rem
ium
s
Dire
ct
- Fi
rst y
ear p
rem
ium
s 9
8,35
3 2
,005
-
- -
8,7
7,35
0 (1
1) (1
8) 2
44
- 6
7,47
6 1,
532
- 10
,46,
931
-
Rene
wal
pre
miu
ms
2,2
4,48
2 6
12
- -
- 4
,07,
125
1,32
5 8
2 6
96
- 4
7,22
9 1,
791
- 6
,83,
342
-
Sing
le p
rem
ium
s -
- 4
6 -
- 6
5 -
- -
1,47
2 1,
712
(5)
- 3
,290
2
Add
: Co
mm
issi
on o
n re
insu
ranc
e ac
cept
ed
- -
- -
- -
- -
- -
- -
- -
3
Les
s: C
omm
issi
on o
n re
insu
ranc
e ce
ded
- -
- -
- -
- -
- -
- -
- -
Net
Com
mis
sion
3
,22,
835
2,6
17
46
-
-
12,
84,5
40
1,3
14
64
940
1
,472
1
,16,
417
3,3
18
-
17,
33,5
63
(` ‘0
00)
Sl. N
o. P
artic
ular
s
Pre
vious
Yea
r
Parti
cipat
ing
Busin
ess
Non
- Par
ticip
atng
Bus
ines
s
Tota
l L
ife
Pen
sion
Non
Par
G
roup
Life
Non
Par
G
roup
Va
riabl
e Pe
nsio
n
Non
Par
G
roup
Va
riabl
e Lif
e
Non
Lin
ked
Indi
vidua
l
Non
Lin
ked
Indi
vidua
l Va
riabl
e Lif
e
Non
Linke
d
Varia
ble
Pens
ion
Non
Lin
ked
Hea
lth
Non
Lin
ked
Annu
ity
Linke
d
Life
Linke
d
Pens
ion
Linke
d
Gro
up
1 F
irst y
ear p
rem
ium
s
Dire
ct
- Fi
rst y
ear p
rem
ium
s 1,
24,4
51
1,70
8 -
- -
7,5
5,10
9 (1
13)
(4)
5
- 4
6,36
7 1,
828
- 9
,29,
351
-
Rene
wal
pre
miu
ms
2,4
9,04
3 3
85
- -
- 3
,56,
985
1,67
2 12
9 8
63
- 3
8,26
0 1,
859
- 6
,49,
196
-
Sing
le p
rem
ium
s -
- 5
3 -
- 6
7 -
- -
283
1,
785
27
- 2
,215
2
Add
: Co
mm
issi
on o
n re
insu
ranc
e ac
cept
ed
- -
- -
- -
- -
- -
- -
- -
3
Les
s: C
omm
issi
on o
n re
insu
ranc
e ce
ded
- -
- -
- -
- -
- -
- -
- -
Net
Com
mis
sion
3
,73,
494
2,0
93
53
-
-
11,
12,1
61
1,5
59
125
8
68
283
8
6,41
2 3
,714
-
1
5,80
,762
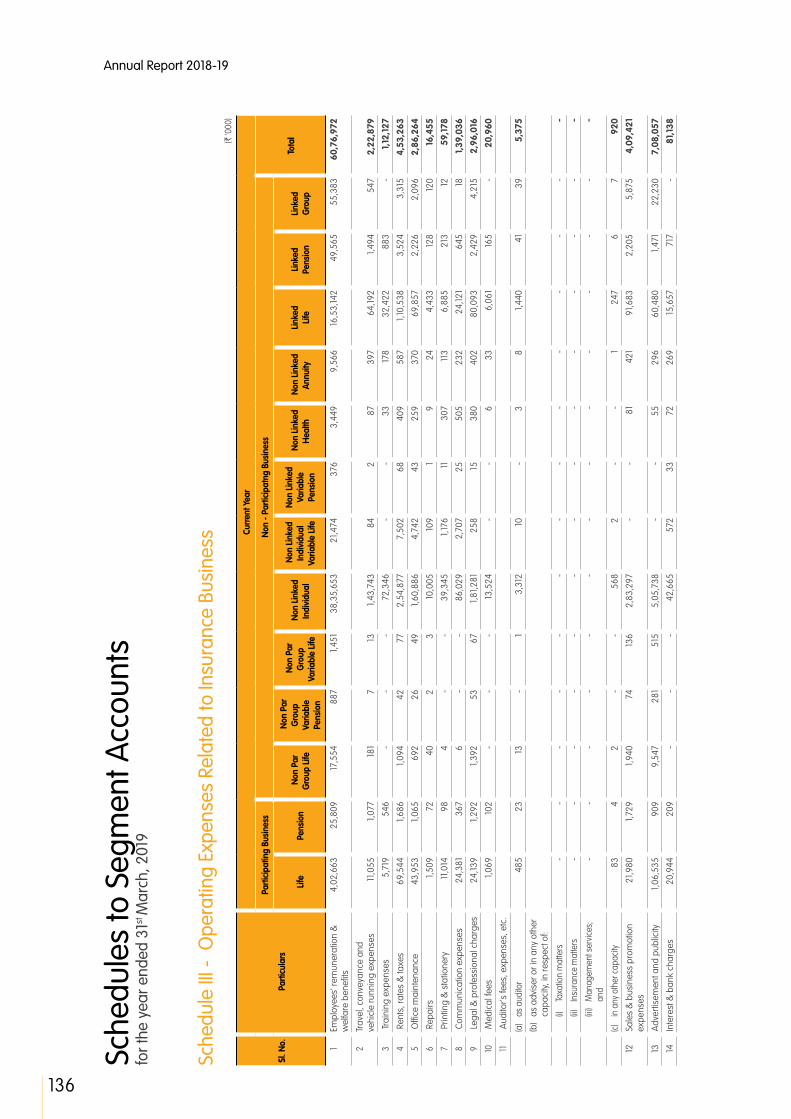
Annual Report 2018-19
136
Sche
dule
III -
Ope
ratin
g Ex
pens
es R
elat
ed to
Insu
ranc
e Bu
sine
ss(`
‘000
)
Sl. N
o. P
artic
ular
s
Cur
rent
Yea
r
Parti
cipat
ing
Busin
ess
Non
- Par
ticip
atng
Bus
ines
s
Tota
l L
ife
Pen
sion
Non
Par
G
roup
Life
Non
Par
G
roup
Va
riabl
e Pe
nsio
n
Non
Par
G
roup
Va
riabl
e Lif
e
Non
Lin
ked
Indi
vidua
l
Non
Lin
ked
Indi
vidua
l Va
riabl
e Lif
e
Non
Linke
d
Varia
ble
Pens
ion
Non
Lin
ked
Hea
lth
Non
Lin
ked
Annu
ity
Linke
d
Life
Linke
d
Pens
ion
Linke
d
Gro
up
1 Em
ploy
ees'
rem
uner
atio
n &
w
elfa
re b
enefi
ts
4,0
2,66
3 2
5,80
9 17
,554
8
87
1,45
1 3
8,35
,653
2
1,474
3
76
3,4
49
9,5
66
16,5
3,14
2 4
9,56
5 5
5,38
3 60
,76,
972
2
Trav
el, c
onve
yanc
e an
d ve
hicl
e ru
nnin
g ex
pens
es
11,0
55
1,07
7 18
1 7
13
1,
43,7
43
84
2
87
397
6
4,19
2 1,
494
547
2
,22,
879
3
Trai
ning
exp
ense
s 5
,719
5
46
- -
- 7
2,34
6 -
- 3
3 17
8 3
2,42
2 8
83
- 1
,12,
127
4
Ren
ts, r
ates
& ta
xes
69,
544
1,68
6 1,
094
42
77
2,5
4,87
7 7
,502
6
8 4
09
587
1,
10,5
38
3,5
24
3,3
15
4,5
3,26
3
5
Offi
ce m
aint
enan
ce
43,
953
1,06
5 6
92
26
49
1,60
,886
4
,742
4
3 2
59
370
6
9,85
7 2
,226
2
,096
2
,86,
264
6
Rep
airs
1,
509
72
40
2
3
10,0
05
109
1 9
2
4 4
,433
12
8 12
0 1
6,45
5
7
Prin
ting
& s
tatio
nery
11
,014
9
8 4
-
- 3
9,34
5 1,
176
11
307
11
3 6
,885
2
13
12
59,
178
8
Com
mun
icat
ion
expe
nses
2
4,38
1 3
67
6
- -
86,
029
2,7
07
25
505
2
32
24,
121
645
18
1
,39,
036
9
Leg
al &
pro
fess
iona
l cha
rges
2
4,13
9 1,
292
1,39
2 5
3 6
7 1,
81,2
81
258
15
3
80
402
8
0,09
3 2
,429
4
,215
2
,96,
016
10
Med
ical
fees
1,
069
102
- -
- 13
,524
-
- 6
3
3 6
,061
16
5 -
20,
960
11
Aud
itor's
fees
, exp
ense
s, e
tc.
(a)
as a
udito
r 4
85
23
13
- 1
3,3
12
10
- 3
8
1,
440
41
39
5,3
75
(b)
as a
dvis
er o
r in
any
othe
r ca
paci
ty, i
n re
spec
t of:
(i)
Taxa
tion
mat
ters
-
- -
- -
- -
- -
- -
- -
-
(ii)
In
sura
nce
mat
ters
-
- -
- -
- -
- -
- -
- -
-
(iii
) M
anag
emen
t ser
vices
;
and
- -
- -
- -
- -
- -
- -
- -
(c)
in a
ny o
ther
cap
acity
8
3 4
2
-
- 5
68
2
- -
1 2
47
6
7
920
12
Sale
s &
bus
ines
s pr
omot
ion
expe
nses
2
1,980
1,
729
1,94
0 7
4 13
6 2
,83,
297
- -
81
421
9
1,683
2
,205
5
,875
4
,09,
421
13
Adv
ertis
emen
t and
pub
licity
1,
06,5
35
909
9
,547
2
81
515
5
,05,
738
- -
55
296
6
0,48
0 1,
471
22,
230
7,0
8,05
7
14
Inte
rest
& b
ank
char
ges
20,
944
209
-
- -
42,
665
572
3
3 7
2 2
69
15,6
57
717
-
81,
138
Sche
dule
s to
Seg
men
t Acc
ount
s fo
r the
yea
r end
ed 3
1st M
arch
, 201
9
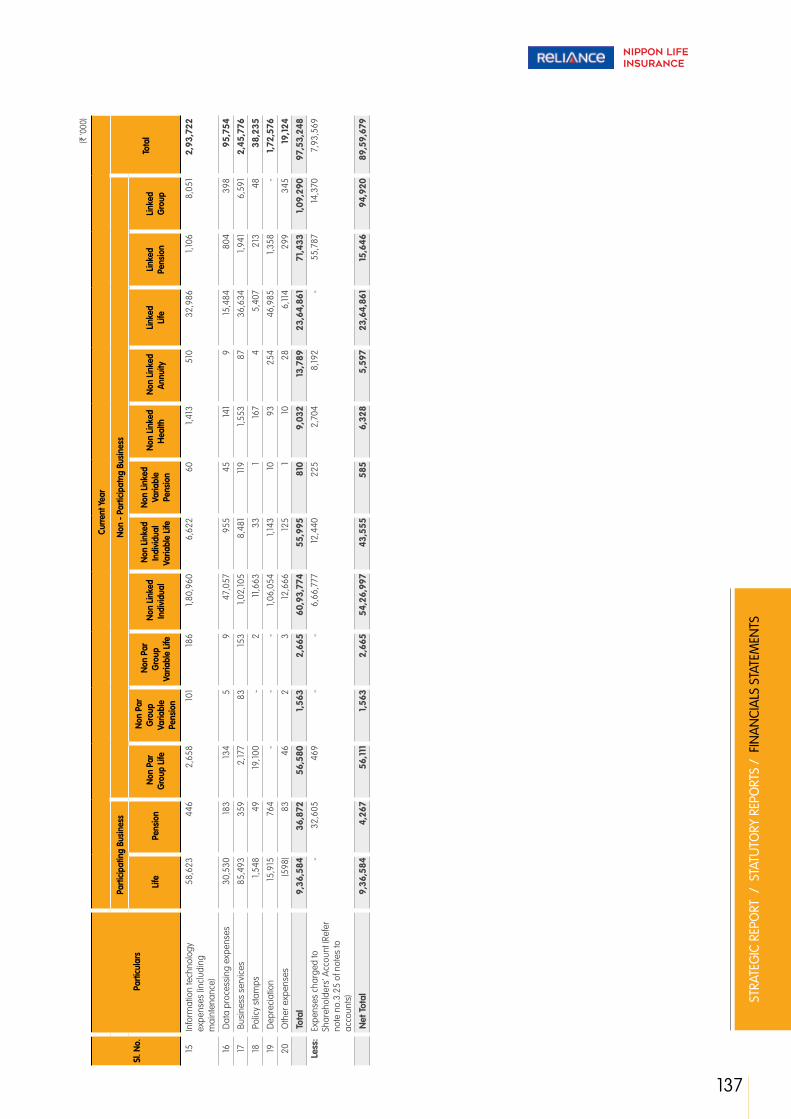
137
STRA
TEG
IC R
EPO
RT /
STA
TUTO
RY R
EPO
RTS
/ F
INA
NCI
ALS
STA
TEM
ENTS
(` ‘0
00)
Sl. N
o. P
artic
ular
s
Cur
rent
Yea
r
Parti
cipat
ing
Busin
ess
Non
- Par
ticip
atng
Bus
ines
s
Tota
l L
ife
Pen
sion
Non
Par
G
roup
Life
Non
Par
G
roup
Va
riabl
e Pe
nsio
n
Non
Par
G
roup
Va
riabl
e Lif
e
Non
Lin
ked
Indi
vidua
l
Non
Lin
ked
Indi
vidua
l Va
riabl
e Lif
e
Non
Linke
d
Varia
ble
Pens
ion
Non
Lin
ked
Hea
lth
Non
Lin
ked
Annu
ity
Linke
d
Life
Linke
d
Pens
ion
Linke
d
Gro
up
15
Info
rmat
ion
tech
nolo
gy
expe
nses
(inc
ludi
ng
mai
nten
ance
)
58,
623
446
2
,658
10
1 18
6 1,
80,9
60
6,6
22
60
1,41
3 5
10
32,
986
1,10
6 8
,051
2
,93,
722
16
Dat
a pr
oces
sing
exp
ense
s 3
0,53
0 18
3 13
4 5
9
4
7,05
7 9
55
45
141
9
15,4
84
804
3
98
95,
754
17
Bus
ines
s se
rvic
es
85,
493
359
2
,177
83
153
1,02
,105
8,4
81
119
1,55
3 8
7 3
6,63
4 1,
941
6,5
91
2,4
5,77
6
18
Pol
icy
stam
ps
1,54
8 4
9 19
,100
- 2
11
,663
3
3 1
167
4
5,4
07
213
4
8 3
8,23
5
19
Dep
reci
atio
n 15
,915
7
64
- -
- 1,
06,0
54
1,14
3 10
9
3 2
54
46,
985
1,35
8 -
1,7
2,57
6
20
Oth
er e
xpen
ses
(598
) 8
3 4
6 2
3
12
,666
12
5 1
10
28
6,11
4 2
99
345
1
9,12
4
Tot
al
9,3
6,58
4 3
6,87
2 5
6,58
0 1
,563
2
,665
60
,93,
774
55,
995
810
9
,032
1
3,78
9 2
3,64
,861
7
1,43
3 1
,09,
290
97,5
3,24
8
Les
s:
Expe
nses
cha
rged
to
Shar
ehol
ders
’ Acc
ount
(Ref
er
note
no.
3.25
of n
otes
to
acco
unts
)
- 3
2,60
5 4
69
- -
6,6
6,77
7 12
,440
2
25
2,7
04
8,19
2 -
55,
787
14,3
70
7,9
3,56
9
Net
Tot
al
9,3
6,58
4 4
,267
5
6,11
1 1
,563
2
,665
5
4,26
,997
4
3,55
5 5
85
6,3
28
5,5
97
23,
64,8
61
15,
646
94,
920
89,
59,6
79
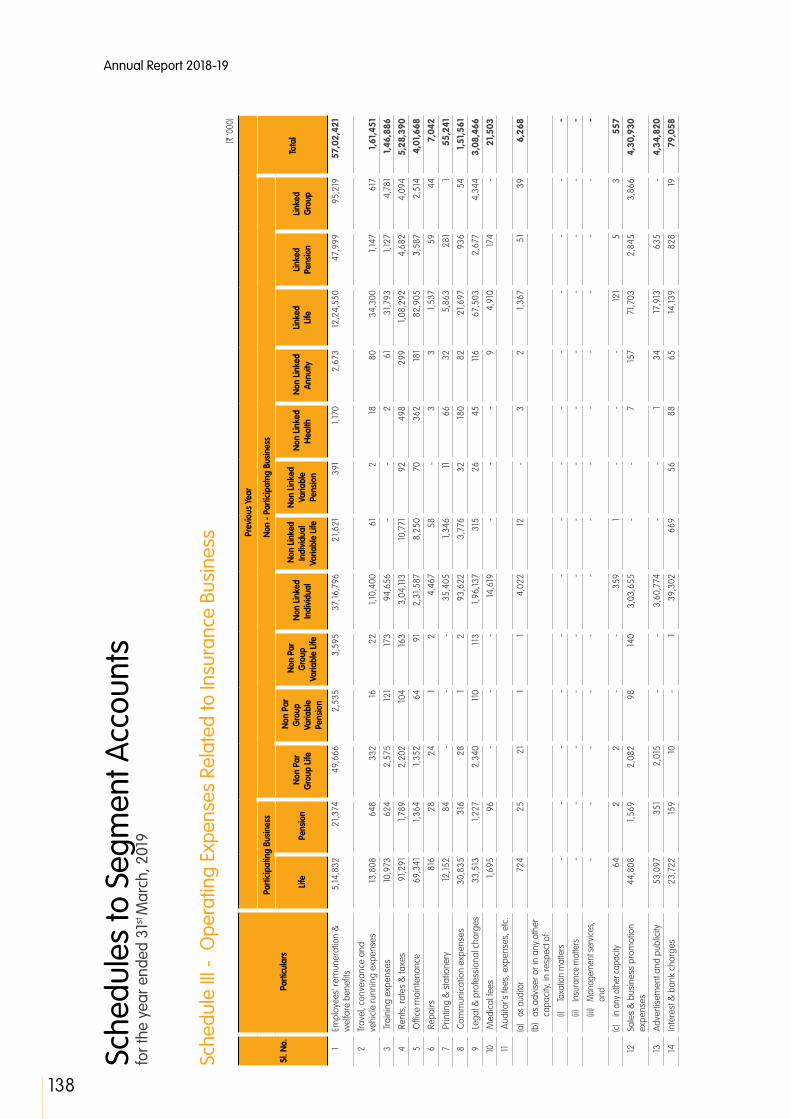
Annual Report 2018-19
138
Sche
dule
III -
Ope
ratin
g Ex
pens
es R
elat
ed to
Insu
ranc
e Bu
sine
ss(`
‘000
)
Sl. N
o. P
artic
ular
s
Pre
vious
Yea
r
Parti
cipat
ing
Busin
ess
Non
- Par
ticip
atng
Bus
ines
s
Tota
l L
ife
Pen
sion
Non
Par
G
roup
Life
Non
Par
G
roup
Va
riabl
e Pe
nsio
n
Non
Par
G
roup
Va
riabl
e Lif
e
Non
Lin
ked
Indi
vidua
l
Non
Lin
ked
Indi
vidua
l Va
riabl
e Lif
e
Non
Linke
d
Varia
ble
Pens
ion
Non
Lin
ked
Hea
lth
Non
Lin
ked
Annu
ity
Linke
d
Life
Linke
d
Pens
ion
Linke
d
Gro
up
1 Em
ploy
ees'
rem
uner
atio
n &
w
elfa
re b
enefi
ts
5,14
,832
2
1,374
4
9,66
6 2
,535
3
,595
3
7,16
,796
2
1,621
3
91
1,17
0 2
,673
12
,24,
550
47,
999
95,
219
57,
02,4
21
2
Trav
el, c
onve
yanc
e an
d ve
hicl
e ru
nnin
g ex
pens
es
13,8
08
648
3
32
16
22
1,10
,400
6
1 2
18
8
0 3
4,30
0 1,
147
617
1
,61,
451
3
Trai
ning
exp
ense
s 10
,973
6
24
2,5
75
121
173
94,
656
- -
2
61
31,7
93
1,12
7 4
,781
1
,46,
886
4
Ren
ts, r
ates
& ta
xes
91,2
91
1,78
9 2
,202
10
4 16
3 3
,04,
113
10,7
71
92
498
2
99
1,08
,292
4
,682
4
,094
5
,28,
390
5
Offi
ce m
aint
enan
ce
69,
341
1,36
4 1,
352
64
91
2,3
1,587
8
,250
7
0 3
62
181
82,
905
3,5
87
2,5
14
4,0
1,66
8
6
Rep
airs
8
16
28
24
1 2
4
,467
5
8 -
3
3
1,53
7 5
9 4
4 7
,042
7
Prin
ting
& s
tatio
nery
12
,152
84
- -
- 3
5,40
5 1,
346
11
66
32
5,8
63
281
1
55,
241
8
Com
mun
icat
ion
expe
nses
3
0,83
5 3
16
28
1 2
9
3,62
2 3
,776
3
2 18
0 8
2 2
1,697
9
36
54
1,5
1,56
1
9
Leg
al &
pro
fess
iona
l cha
rges
3
3,51
3 1,
227
2,3
40
110
113
1,96
,137
315
2
6 4
5 11
6 6
7,50
3 2
,677
4
,344
3
,08,
466
10
Med
ical
fees
1,
695
96
- -
- 14
,619
-
- -
9
4,9
10
174
- 2
1,50
3
11
Aud
itor's
fees
, exp
ense
s, e
tc.
(a)
as a
udito
r 7
24
25
21
1 1
4,0
22
12
- 3
2
1,
367
51
39
6,2
68
(b)
as a
dvis
er o
r in
any
othe
r ca
paci
ty, i
n re
spec
t of:
(i)
Taxa
tion
mat
ters
-
- -
- -
- -
- -
- -
- -
-
(ii)
In
sura
nce
mat
ters
-
- -
- -
- -
- -
- -
- -
-
(iii
) M
anag
emen
t ser
vices
;
and
- -
- -
- -
- -
- -
- -
- -
(c)
in a
ny o
ther
cap
acity
6
4 2
2
-
- 3
59
1 -
- -
121
5
3
557
12
Sale
s &
bus
ines
s pr
omot
ion
expe
nses
4
4,80
8 1,
569
2,0
82
98
140
3,0
3,65
5 -
- 7
15
7 7
1,703
2
,845
3
,866
4
,30,
930
13
Adv
ertis
emen
t and
pub
licity
5
3,09
7 3
51
2,0
15
- -
3,6
0,77
4 -
- 1
34
17,9
13
635
-
4,3
4,82
0
14
Inte
rest
& b
ank
char
ges
23,
722
159
10
- 1
39,
302
669
5
6 8
8 6
5 14
,139
828
19
7
9,05
8
Sche
dule
s to
Seg
men
t Acc
ount
s fo
r the
yea
r end
ed 3
1st M
arch
, 201
9

139
STRA
TEG
IC R
EPO
RT /
STA
TUTO
RY R
EPO
RTS
/ F
INA
NCI
ALS
STA
TEM
ENTS
(` ‘0
00)
Sl. N
o. P
artic
ular
s
Pre
vious
Yea
r
Parti
cipat
ing
Busin
ess
Non
- Par
ticip
atng
Bus
ines
s
Tota
l L
ife
Pen
sion
Non
Par
G
roup
Life
Non
Par
G
roup
Va
riabl
e Pe
nsio
n
Non
Par
G
roup
Va
riabl
e Lif
e
Non
Lin
ked
Indi
vidua
l
Non
Lin
ked
Indi
vidua
l Va
riabl
e Lif
e
Non
Linke
d
Varia
ble
Pens
ion
Non
Lin
ked
Hea
lth
Non
Lin
ked
Annu
ity
Linke
d
Life
Linke
d
Pens
ion
Linke
d
Gro
up
15
Info
rmat
ion
tech
nolo
gy
expe
nses
(inc
ludi
ng
mai
nten
ance
)
63,
049
398
4
,986
2
35
336
1,
70,3
59
7,9
67
68
384
15
9 3
0,33
3 1,
549
9,2
63
2,8
9,08
6
16
Dat
a pr
oces
sing
exp
ense
s 4
0,99
1 18
0 14
9 7
10
4
9,62
1 1,
190
90
205
3
17
,460
1,
133
279
1
,11,
318
17
Bus
ines
s se
rvic
es
97,
575
284
2
,689
12
6 18
1 9
8,35
2 13
,235
17
1 2
,672
9
1 4
2,72
3 2
,815
4
,999
2
,65,
913
18
Pol
icy
stam
ps
1,72
7 3
7 16
,115
- 3
9
,746
3
7 1
5
1 3
,673
19
3 6
9 3
1,60
7
19
Dep
reci
atio
n 2
3,61
1 8
23
- -
- 1,
29,7
84
1,66
3 14
7
4 9
0 4
4,62
4 1,
713
1 2
,02,
397
20
Oth
er e
xpen
ses
6,3
87
8
271
-
- 3
5,74
6 4
14
- 8
05
(156
) 13
,934
5
29
148
58,
086
Tot
al
11,
35,0
11
31,
386
86,
859
3,4
19
4,8
33
60,
03,5
22
71,
386
1,0
24
6,5
88
3,9
82
18,
41,3
40
74,
965
1,3
0,35
4 9
3,94
,669
Les
s:
Expe
nses
cha
rged
to
Shar
ehol
ders
’ Acc
ount
(Ref
er
note
no.
3.25
of n
otes
to
acco
unts
)
- 2
7,87
0 5
,044
-
- 7
,04,
806
17,6
53
- 12
9 2
,413
-
56,
740
- 8
,14,6
55
Net
Tot
al
11,
35,0
11
3,5
16
81,
815
3,4
19
4,8
33
52,
98,7
16
53,
733
1,0
24
6,4
59
1,5
69
18,
41,3
40
18,
225
1,3
0,35
4 8
5,80
,014
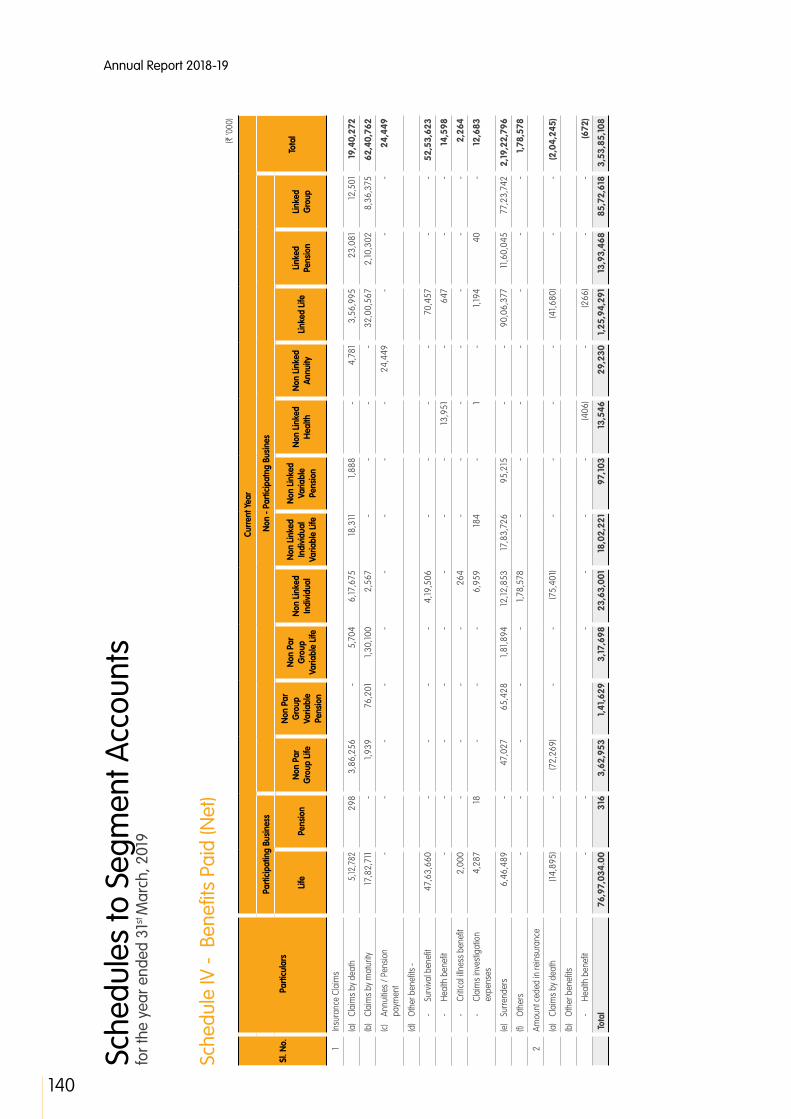
Annual Report 2018-19
140
Sche
dule
IV -
Ben
efits
Pai
d (N
et)
(` ‘0
00)
Sl. N
o. P
artic
ular
s
Cur
rent
Yea
r
Parti
cipat
ing
Busin
ess
Non
- Par
ticip
atng
Bus
ines
Tota
l Lif
ePe
nsio
n No
n Pa
r G
roup
Life
Non
Par
Gro
up
Varia
ble
Pens
ion
Non
Par
Gro
up
Varia
ble
Life
Non
Linke
d In
divid
ual
Non
Linke
d In
divid
ual
Varia
ble
Life
Non
Linke
d
Varia
ble
Pens
ion
Non
Linke
d
Hea
lthNo
n Lin
ked
An
nuity
Linke
d Lif
eLin
ked
Pe
nsio
nLin
ked
G
roup
1 In
sura
nce
Clai
ms
(a)
Clai
ms
by d
eath
5
,12,7
82
298
3
,86,
256
- 5
,704
6
,17,6
75
18,3
11
1,88
8 -
4,7
81
3,5
6,99
5 2
3,08
1 12
,501
1
9,40
,272
(b)
Clai
ms
by m
atur
ity
17,8
2,71
1 -
1,93
9 7
6,20
1 1,
30,10
0 2
,567
-
- -
- 3
2,00
,567
2
,10,3
02
8,3
6,37
5 6
2,40
,762
(c)
Annu
ities
/ Pen
sion
paym
ent
- -
- -
- -
- -
- 2
4,44
9 -
- -
24,
449
(d)
Oth
er b
enefi
ts -
- Su
rviva
l ben
efit
47,
63,6
60
- -
- -
4,19
,506
-
- -
- 7
0,45
7 -
- 5
2,53
,623
- He
alth
ben
efit
- -
- -
- -
- -
13,9
51
- 6
47
- -
14,
598
- Cr
itical
illne
ss b
enefi
t 2
,000
-
- -
- 2
64
- -
- -
- -
- 2
,264
- Cl
aim
s in
vest
igat
ion
expe
nses
4
,287
18
-
- -
6,9
59
184
- 1
- 1,
194
40
- 1
2,68
3
(e)
Surre
nder
s 6
,46,
489
- 4
7,02
7 6
5,42
8 1,
81,8
94
12,12
,853
17
,83,
726
95,
215
- -
90,
06,3
77
11,6
0,04
5 7
7,23
,742
2
,19,
22,7
96
(f) O
ther
s -
- -
- -
1,78
,578
-
- -
- -
- -
1,7
8,57
8
2
Amou
nt c
eded
in re
insu
ranc
e
(a)
Clai
ms
by d
eath
(1
4,89
5) -
(72,
269)
- -
(75,
401)
- -
- -
(41,6
80)
- -
(2,0
4,24
5)
(b)
Oth
er b
enefi
ts
- He
alth
ben
efit
- -
- -
- -
(406
) -
(266
) -
- (6
72)
Tota
l 76
,97,
034.
00 3
16
3,6
2,95
3 1
,41,
629
3,1
7,69
8 2
3,63
,001
1
8,02
,221
9
7,10
3 1
3,54
6 2
9,23
0 1
,25,
94,2
91
13,
93,4
68
85,
72,6
18
3,5
3,85
,108
Sche
dule
s to
Seg
men
t Acc
ount
s fo
r the
yea
r end
ed 3
1st M
arch
, 201
9

141
STRA
TEG
IC R
EPO
RT /
STA
TUTO
RY R
EPO
RTS
/ F
INA
NCI
ALS
STA
TEM
ENTS
(` ‘0
00)
Sl. N
o. P
artic
ular
s
Pre
vious
Yea
r
Parti
cipat
ing
Busin
ess
Non
- Par
ticip
atng
Bus
ines
Tota
l Lif
ePe
nsio
n No
n Pa
r G
roup
Life
Non
Par
Gro
up
Varia
ble
Pens
ion
Non
Par
Gro
up
Varia
ble
Life
Non
Linke
d In
divid
ual
Non
Linke
d In
divid
ual
Varia
ble
Life
Non
Linke
d
Varia
ble
Pens
ion
Non
Linke
d
Hea
lthNo
n Lin
ked
An
nuity
Linke
d Lif
eLin
ked
Pe
nsio
nLin
ked
G
roup
1 In
sura
nce
Clai
ms
(a)
Clai
ms
by d
eath
5
,32,
422
408
3
,65,
161
33
9,3
28
5,5
1,977
16
,929
3
,184
- 1,
424
3,3
6,67
3 19
,757
7
,538
1
8,44
,834
(b)
Clai
ms
by m
atur
ity
12,6
9,42
2 -
- 4
9,46
6 1,
18,2
62
1,85
6 -
- -
- 2
8,97
,648
2
,44,
197
10,0
4,89
7 5
5,85
,748
(c)
Annu
ities
/ Pen
sion
paym
ent
- -
- -
- -
- -
- 18
,441
-
- -
18,
441
(d)
Oth
er b
enefi
ts -
- Su
rviva
l ben
efit
57,
44,9
65
- -
- -
- -
- -
- -
- -
57,
44,9
65
- He
alth
ben
efit
- -
- -
- -
- -
18,9
64
- 15
4 -
- 1
9,11
8
- Cr
itical
illne
ss b
enefi
t 2
,200
-
- -
- 4
00
- -
- -
430
-
- 3
,030
- Cl
aim
s in
vest
igat
ion
expe
nses
4
,126
- -
- -
5,2
07
347
-
- -
1,54
0 5
-
11,
225
(e)
Surre
nder
s 6
,33,
423
- 5
0,83
2 -
75,
904
8,4
0,58
4 12
,91,5
41
1,09
,351
-
- 1,
18,5
5,84
7 12
,06,
935
2,6
8,34
6 1
,63,
32,7
63
(f) O
ther
s -
- -
- -
3,8
0,82
1 -
- -
- -
- -
3,8
0,82
1
2
Amou
nt c
eded
in re
insu
ranc
e
(a)
Clai
ms
by d
eath
(1
5,45
0) -
(78,
400)
- -
(1,2
0,43
1) (7
17)
- -
- (1
7,15
9) -
- (2
,32,
157)
(b)
Oth
er b
enefi
ts
- He
alth
ben
efit
- -
- -
- -
- -
(805
) -
(40)
- -
(845
)
Tota
l 8
1,71
,108
4
08
3,3
7,59
3 4
9,49
9 2
,03,
494
16,
60,4
14
13,
08,1
00
1,1
2,53
5 1
8,15
9 1
9,86
5 1
,50,
75,0
93
14,
70,8
94
12,
80,7
81
2,97
,07,
943
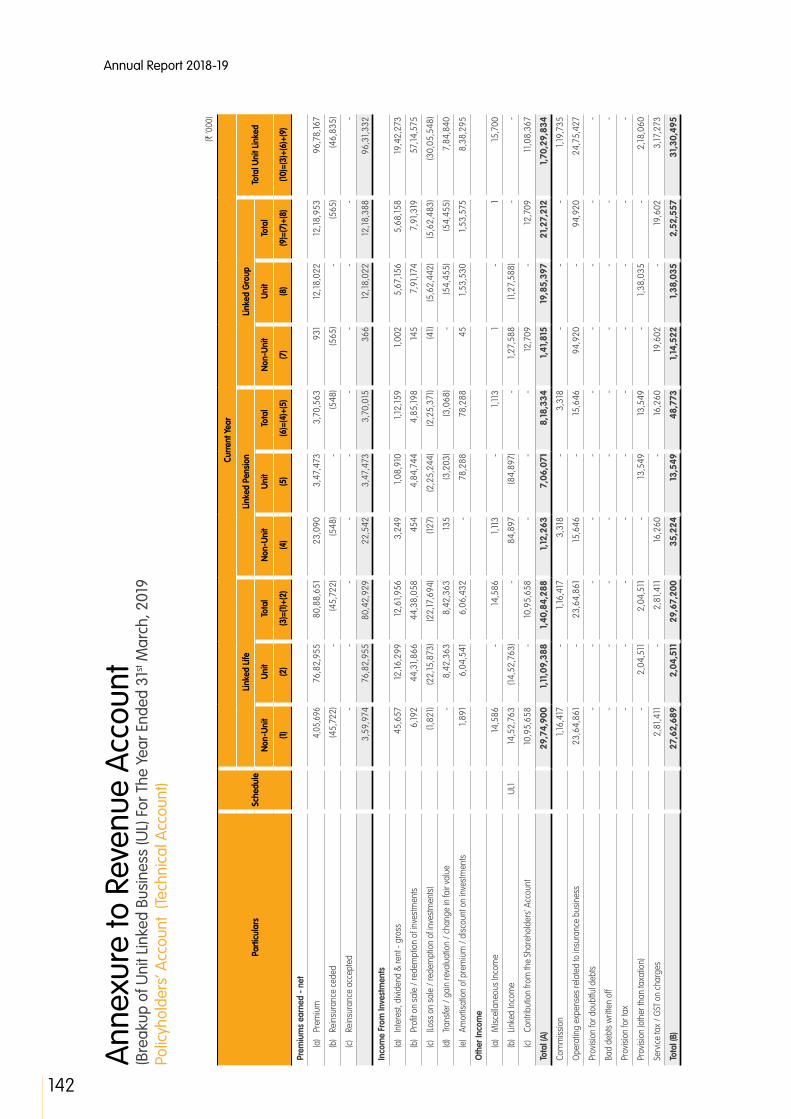
Annual Report 2018-19
142
Ann
exur
e to
Rev
enue
Acc
ount
(B
reak
up o
f Uni
t Lin
ked
Busi
ness
(UL)
For
The
Yea
r End
ed 3
1st M
arch
, 201
9Po
licyh
olde
rs’ A
ccou
nt (
Tech
nica
l Acc
ount
)
(` ‘0
00)
Par
ticul
ars
Sche
dule
Cur
rent
Yea
r
Lin
ked
Life
Lin
ked
Pens
ion
Lin
ked
Gro
up To
tal U
nit L
inke
d N
on-U
nit
Uni
t To
tal
Non
-Uni
t U
nit
Tota
l N
on-U
nit
Uni
t To
tal
(1)
(2)
(3)=
(1)+(
2)
(4)
(5)
(6)=
(4)+
(5)
(7)
(8)
(9)=
(7)+
(8)
(10)
=(3)
+(6)
+(9)
Pre
miu
ms
earn
ed -
net
(a)
Prem
ium
4
,05,
696
76,
82,9
55
80,
88,6
51
23,
090
3,4
7,47
3 3
,70,
563
931
12
,18,0
22
12,18
,953
9
6,78
,167
(b)
Rein
sura
nce
cede
d (4
5,72
2) -
(45,
722)
(548
) -
(548
) (5
65)
- (5
65)
(46,
835)
(c)
Rein
sura
nce
acce
pted
-
- -
- -
- -
- -
-
3,5
9,97
4 7
6,82
,955
8
0,42
,929
2
2,54
2 3
,47,
473
3,7
0,01
5 3
66
12,18
,022
12
,18,3
88
96,
31,3
32
Inco
me
From
Inve
stm
ents
(a)
Inte
rest
, divi
dend
& re
nt -
gros
s 4
5,65
7 12
,16,2
99
12,6
1,956
3
,249
1,
08,9
10
1,12
,159
1,00
2 5
,67,
156
5,6
8,15
8 19
,42,
273
(b)
Profi
t on
sale
/ re
dem
ptio
n of
inve
stm
ents
6
,192
44,
31,8
66
44,
38,0
58
454
4
,84,
744
4,8
5,19
8 14
5 7
,91,1
74
7,9
1,319
5
7,14
,575
(c)
(Loss
on
sale
/ re
dem
ptio
n of
inve
stm
ents
) (1
,821
) (2
2,15
,873
) (2
2,17
,694
) (1
27)
(2,2
5,24
4) (2
,25,
371)
(41)
(5,6
2,44
2) (5
,62,
483)
(30,
05,5
48)
(d)
Trans
fer /
gai
n re
valu
atio
n / c
hang
e in
fair
valu
e -
8,4
2,36
3 8
,42,
363
135
(3,2
03)
(3,0
68)
- (5
4,45
5) (5
4,45
5) 7
,84,
840
(e)
Amor
tisat
ion
of p
rem
ium
/ di
scou
nt o
n in
vest
men
ts
1,89
1 6
,04,
541
6,0
6,43
2 -
78,
288
78,
288
45
1,53
,530
1,
53,5
75
8,3
8,29
5
Oth
er In
com
e
(a)
Misc
ella
neou
s In
com
e 14
,586
-
14,5
86
1,11
3 -
1,11
3 1
- 1
15,7
00
(b)
Linke
d In
com
e U
L1
14,5
2,76
3 (1
4,52
,763
) -
84,
897
(84,
897)
- 1,
27,5
88
(1,2
7,58
8) -
-
(c)
Cont
ribut
ion
from
the
Shar
ehol
ders
' Acc
ount
10
,95,
658
- 10
,95,
658
- -
- 12
,709
-
12,7
09
11,0
8,36
7
Tota
l (A)
2
9,74
,900
1
,11,
09,3
88
1,4
0,84
,288
1
,12,
263
7,0
6,07
1 8
,18,
334
1,4
1,81
5 1
9,85
,397
2
1,27
,212
1
,70,
29,8
34
Com
miss
ion
1,16
,417
-
1,16
,417
3
,318
-
3,3
18
- -
- 1,
19,7
35
Ope
ratin
g ex
pens
es re
late
d to
insu
ranc
e bu
sines
s 2
3,64
,861
-
23,
64,8
61
15,6
46
- 15
,646
9
4,92
0 -
94,
920
24,
75,4
27
Pro
visio
n fo
r dou
btfu
l deb
ts
- -
- -
- -
- -
- -
Bad
deb
ts w
ritte
n of
f -
- -
- -
- -
- -
-
Pro
visio
n fo
r tax
-
- -
- -
- -
- -
-
Pro
visio
n (o
ther
than
taxa
tion)
-
2,0
4,51
1 2
,04,
511
- 13
,549
13
,549
-
1,38
,035
-
2,18
,060
Ser
vice
tax
/ GST
on
char
ges
2,8
1,411
-
2,8
1,411
16
,260
-
16,2
60
19,6
02
- 19
,602
3
,17,2
73
Tota
l (B)
2
7,62
,689
2
,04,
511
29,
67,2
00
35,
224
13,
549
48,
773
1,1
4,52
2 1
,38,
035
2,5
2,55
7 3
1,30
,495

143
STRA
TEG
IC R
EPO
RT /
STA
TUTO
RY R
EPO
RTS
/ F
INA
NCI
ALS
STA
TEM
ENTS
(` ‘0
00)
Par
ticul
ars
Sche
dule
Cur
rent
Yea
r
Lin
ked
Life
Lin
ked
Pens
ion
Lin
ked
Gro
up To
tal U
nit L
inke
d N
on-U
nit
Uni
t To
tal
Non
-Uni
t U
nit
Tota
l N
on-U
nit
Uni
t To
tal
(1)
(2)
(3)=
(1)+(
2)
(4)
(5)
(6)=
(4)+
(5)
(7)
(8)
(9)=
(7)+
(8)
(10)
=(3)
+(6)
+(9)
Ben
efits
pai
d (n
et)
UL2
2
,21,8
24
1,23
,72,
467
1,25
,94,
291
1,10
5 13
,92,
363
13,9
3,46
8 2
,603
8
5,70
,015
8
5,72
,618
2
,25,
60,3
77
Inte
rim b
onus
pai
d -
- -
- -
- -
- -
Cha
nge
in va
luat
ion
of lia
bility
in re
spec
t of l
ife p
olici
es
(a)
Gros
s (9
,613
) (1
4,67
,590
) (1
4,77
,203
) (6
,160)
(6,9
9,84
1) (7
,06,
001)
4,15
9 (6
7,22
,653
) (6
7,18
,494
) (8
9,01
,698
)
(b)
(Am
ount
ced
ed in
rein
sura
nce)
-
- -
- -
- -
- -
-
(c)
Amou
nt a
ccep
ted
in re
insu
ranc
e -
- -
- -
- -
- -
-
Tota
l (C)
2
,12,
211
1,0
9,04
,877
1
,11,
17,0
88
(5,0
55)
6,9
2,52
2 6
,87,
467
6,7
62
18,
47,3
62
18,
54,1
24
1,3
6,58
,679
Sur
plus
/ (D
eficit
) (D)
= (A
) - (B
) - (C
) -
-
-
8
2,09
4 -
8
2,09
4 2
0,53
1 -
2
0,53
1 2
,40,
660
App
ropr
iatio
ns
Tran
sfer
to S
hare
hold
ers’
Acco
unt
- -
- 8
2,09
4 -
82,
094
20,
531
- 2
0,53
1 1,
02,6
25
Tran
sfer
to o
ther
rese
rves
-
- -
- -
- -
- -
-
Bal
ance
bei
ng fu
nds
for f
utur
e ap
prop
riatio
ns
- -
- -
- -
- -
- -
Tota
l (E)
-
-
-
8
2,09
4 -
8
2,09
4 2
0,53
1 -
2
0,53
1 1
,02,
625

Annual Report 2018-19
144
Ann
exur
e to
Rev
enue
Acc
ount
(B
reak
up o
f Uni
t Lin
ked
Busi
ness
(UL)
For
The
Yea
r End
ed 3
1st M
arch
, 201
9Po
licyh
olde
rs’ A
ccou
nt (
Tech
nica
l Acc
ount
)
(` ‘0
00)
Par
ticul
ars
Sche
dule
Pre
vious
Yea
r
Lin
ked
Life
Lin
ked
Pens
ion
Lin
ked
Gro
up To
tal U
nit L
inke
d N
on-U
nit
Uni
t To
tal
Non
-Uni
t U
nit
Tota
l N
on-U
nit
Uni
t To
tal
(1)
(2)
(3)=
(1)+(
2)
(4)
(5)
(6)=
(4)+
(5)
(7)
(8)
(9)=
(7)+
(8)
(10)
=(3)
+(6)
+(9)
Pre
miu
ms
earn
ed -
net
(a)
Prem
ium
3
,86,
790
65,
84,4
14
69,
71,2
04
23,
821
3,8
4,25
2 4
,08,
073
339
10
,82,
953
10,8
3,29
2 8
4,62
,569
(b)
Rein
sura
nce
cede
d (4
5,39
7) -
(45,
397)
(570
) -
(570
) (9
42)
- (9
42)
(46,
909)
(c)
Rein
sura
nce
acce
pted
-
- -
- -
- -
- -
-
3,4
1,393
6
5,84
,414
6
9,25
,807
2
3,25
1 3
,84,
252
4,0
7,50
3 (6
03)
10,8
2,95
3 10
,82,
350
84,
15,6
60
Inco
me
From
Inve
stm
ents
(a)
Inte
rest
, divi
dend
& re
nt -
gros
s 4
2,55
8 9
,84,
516
10,2
7,07
4 4
,211
1,
16,2
00
1,20
,411
1,
944
5,0
2,29
8 5
,04,
242
16,5
1,727
(b)
Profi
t on
sale
/ re
dem
ptio
n of
inve
stm
ents
7
,033
8
3,73
,694
8
3,80
,727
6
70
7,3
1,064
7
,31,7
34
342
4
,62,
927
4,6
3,26
9 9
5,75
,730
(c)
(Loss
on
sale
/ re
dem
ptio
n of
inve
stm
ents
) (1
,662
) (1
3,39
,989
) (1
3,41
,651
) (1
63)
(1,2
4,12
4) (1
,24,
287)
(73)
(2,6
5,59
5) (2
,65,
668)
(17,
31,6
06)
(d)
Trans
fer /
gai
n re
valu
atio
n / c
hang
e in
fair
valu
e -
(26,
90,3
22)
(26,
90,3
22)
215
(2
,16,2
94)
(2,16
,079
) -
20,
345
20,
345
(28,
86,0
56)
(e)
Amor
tisat
ion
of p
rem
ium
/ di
scou
nt o
n in
vest
men
ts
2,2
20
5,4
7,45
2 5
,49,
672
- 6
8,52
2 6
8,52
2 10
3 1,
78,7
31
1,78
,834
7
,97,
028
Oth
er In
com
e
(a)
Misc
ella
neou
s In
com
e 18
,345
-
18,3
45
832
-
832
1
- 1
19,17
8
(b)
Linke
d In
com
e U
L1
15,3
3,66
3 (1
5,33
,663
) -
1,06
,484
(1
,06,
484)
- 1,
33,6
66
(1,3
3,66
6) -
-
(c)
Cont
ribut
ion
from
the
Shar
ehol
ders
' Acc
ount
3
,84,
519
- 3
,84,
519
- -
- 2
0,58
9 -
20,
589
4,0
5,10
8
Tota
l (A)
2
3,28
,069
1
,09,
26,1
02
1,3
2,54
,171
1
,35,
500
8,5
3,13
6 9
,88,
636
1,5
5,96
9 1
8,47
,993
2
0,03
,962
1
,62,
46,7
69
Com
miss
ion
86,
412
- 8
6,41
2 3
,714
-
3,7
14
- -
- 9
0,12
6
Ope
ratin
g ex
pens
es re
late
d to
insu
ranc
e bu
sines
s 18
,41,3
40
- 18
,41,3
40
18,2
25
- 18
,225
1,
30,3
54
- 1,
30,3
54
19,8
9,91
9
Pro
visio
n fo
r dou
btfu
l deb
ts
- -
- -
- -
- -
- -
Bad
deb
ts w
ritte
n of
f -
- -
- -
- -
- -
-
Pro
visio
n fo
r tax
-
- -
- -
- -
- -
-
Pro
visio
n (o
ther
than
taxa
tion)
-
- -
- -
- -
- -
-
Ser
vice
tax
/ GST
on
char
ges
2,7
6,95
0 -
2,7
6,95
0 19
,083
-
19,0
83
19,9
77
- 19
,977
3
,16,0
10
Tota
l (B)
2
2,04
,702
-
2
2,04
,702
4
1,02
2 -
4
1,02
2 1
,50,
331
-
1,5
0,33
1 2
3,96
,055

145
STRA
TEG
IC R
EPO
RT /
STA
TUTO
RY R
EPO
RTS
/ F
INA
NCI
ALS
STA
TEM
ENTS
(` ‘0
00)
Par
ticul
ars
Sche
dule
Pre
vious
Yea
r
Lin
ked
Life
Lin
ked
Pens
ion
Lin
ked
Gro
up To
tal U
nit L
inke
d N
on-U
nit
Uni
t To
tal
Non
-Uni
t U
nit
Tota
l N
on-U
nit
Uni
t To
tal
(1)
(2)
(3)=
(1)+(
2)
(4)
(5)
(6)=
(4)+
(5)
(7)
(8)
(9)=
(7)+
(8)
(10)
=(3)
+(6)
+(9)
Ben
efits
pai
d (n
et)
UL2
1,
55,3
09
1,49
,19,7
84
1,50
,75,
093
239
14
,70,
655
14,7
0,89
4 5
,500
12
,75,
281
12,8
0,78
1 1,
78,2
6,76
8
Inte
rim b
onus
pai
d -
- -
- -
- -
- -
-
Cha
nge
in va
luat
ion
of lia
bility
in re
spec
t of l
ife p
olici
es
(a)
Gros
s (3
1,942
) (3
9,93
,682
) (4
0,25
,624
) (1
6,98
4) (6
,17,5
19)
(6,3
4,50
3) (1
2,16
1) 5
,72,
712
5,6
0,55
1 (4
0,99
,576
)
(b)
(Am
ount
ced
ed in
rein
sura
nce)
-
- -
- -
- -
- -
-
(c)
Amou
nt a
ccep
ted
in re
insu
ranc
e -
- -
- -
- -
- -
-
Tota
l (C)
1
,23,
367
1,0
9,26
,102
1
,10,
49,4
69
(16,
745)
8,5
3,13
6 8
,36,
391
(6,6
61)
18,
47,9
93
18,
41,3
32
1,3
7,27
,192
Sur
plus
/ (D
eficit
) (D)
= (A
) - (B
) - (C
) -
-
-
1
,11,
223
-
1,1
1,22
3 1
2,29
9 -
1
2,29
9 1
,23,
522
App
ropr
iatio
ns
Tran
sfer
to S
hare
hold
ers’
Acco
unt
- -
- 1,
11,2
23
- 1,
11,2
23
12,2
99
- 12
,299
1,
23,5
22
Tran
sfer
to o
ther
rese
rves
-
- -
- -
- -
- -
-
Bal
ance
bei
ng fu
nds
for f
utur
e ap
prop
riatio
ns
- -
- -
- -
- -
- -
Tota
l (E)
-
-
-
1
,11,
223
-
1,1
1,22
3 1
2,29
9 -
1
2,29
9 1
,23,
522

Annual Report 2018-19
146
Sche
dule
s to
Ann
exur
e to
Rev
enue
Acc
ount
(UL)
fo
r the
yea
r end
ed 3
1st M
arch
, 201
9 fo
rmin
g pa
rt of
Fin
anci
al S
tate
men
tsSc
hedu
le U
L1
Linke
d In
com
e (re
cove
red
from
link
ed fu
nds)
*
(` ‘0
00)
Sl. N
o. P
artic
ular
s
Cur
rent
Yea
r P
revio
us Y
ear
Lin
ked
Life
Lin
ked
Pens
ion
Lin
ked
Gro
up
Tota
l L
inke
d Lif
e L
inke
d Pe
nsio
n L
inke
d G
roup
To
tal
(1)
(
2)
(3)
(4
)=(1)
+(2)
+(3)
(
1)
(2)
(
3)
(4)=
(1)+(
2)+(
3)
1 F
und
adm
inis
tratio
n ch
arge
-
- -
- -
- -
-
2
Fun
d m
anag
emen
t cha
rge
6,7
0,39
1 6
2,18
5 9
2,83
6 8
,25,
412
7,2
9,07
3 7
6,00
8 9
5,00
8 9
,00,
089
3
Pol
icy
adm
inis
tratio
n ch
arge
1,
22,6
67
2,5
77
90
1,25
,334
1,
28,5
81
6,6
18
111
1,35
,310
4
Sur
rend
er c
harg
e 2
,212
-
- 2
,212
2
,974
(2
3) 3
2
,954
5
Sw
itchi
ng c
harg
e 5
2 5
1 -
103
66
49
- 11
5
6
Mor
talit
y ch
arge
3
,21,0
69
2,8
62
15,0
60
3,3
8,99
1 3
,34,
079
3,0
23
18,5
67
3,5
5,66
9
7
Rid
er p
rem
ium
cha
rge
27,
651
136
- 2
7,78
7 2
6,78
1 17
0 -
26,
951
8
Par
tial w
ithdr
awal
cha
rge
39
- -
39
33
- -
33
9
Sum
ass
ured
fee
- -
- -
- -
- -
10
Mis
cella
neou
s ch
arge
2
7,27
0 8
26
- 2
8,09
6 3
5,12
8 1,
556
- 3
6,68
4
11
Ser
vice
tax
/ G
ST
2,8
1,412
16
,260
19
,602
3
,17,2
74
2,7
6,94
8 19
,083
19
,977
3
,16,0
08
TO
TAL
(UL1
) 1
4,52
,763
8
4,89
7 1
,27,
588
16,
65,2
48
15,
33,6
63
1,0
6,48
4 1
,33,
666
17,
73,8
13
*(net
of s
ervi
ce ta
x/G
ST, i
f any
)

147
STRA
TEG
IC R
EPO
RT /
STA
TUTO
RY R
EPO
RTS
/ F
INA
NCI
ALS
STA
TEM
ENTS
Sche
dule
s to
Ann
exur
e to
Rev
enue
Acc
ount
(UL)
fo
r the
yea
r end
ed 3
1st M
arch
, 201
9 fo
rmin
g pa
rt of
Fin
anci
al S
tate
men
tsSc
hedu
le U
L2
Bene
fits
Paid
(Net
)
(` ‘0
00)
Sl. N
o. P
artic
ular
s
Cur
rent
Yea
r
Lin
ked
Life
Lin
ked
Pens
ion
Lin
ked
Gro
up To
tal U
nit L
inke
d N
on-U
nit
Uni
t To
tal
Non
-Uni
t U
nit
Tota
l N
on-U
nit
Uni
t To
tal
(1)
(2)
(3)=
(1)+(
2)
(4)
(5)
(6)=
(4)+
(5)
(7)
(8)
(9)=
(7)+
(8)
(10)
=(3)
+(6)
+(9)
1In
sura
nce
Clai
ms
(a)
Clai
ms
by d
eath
1,
91,4
72
1,65
,523
3
,56,
995
1,06
5 2
2,01
6 2
3,08
1 2
,603
9
,898
12
,501
3
,92,
577
(b)
Clai
ms
by M
atur
ity
- 3
2,00
,567
3
2,00
,567
-
2,10
,302
2
,10,3
02
- 8
,36,
375
8,3
6,37
5 4
2,47
,244
(c)
Ann
uitie
s /
Pens
ion
Paym
ents
-
- -
- -
- -
- -
-
(d)
Oth
er b
enefi
ts:
- -
- -
- -
Su
rviv
al b
enefi
ts
70,
457
- 7
0,45
7 -
- -
- -
- 7
0,45
7
H
ealth
ben
efits
6
47
- 6
47
- -
- -
- -
647
Cr
itical
illne
ss b
enefi
t -
- -
- -
- -
- -
-
Su
rren
ders
-
90,
06,3
77
90,
06,3
77
- 11
,60,
045
11,6
0,04
5 -
77,
23,7
42
77,
23,7
42
1,78
,90,
164
(e)
Clai
ms
Inve
stig
atio
n ex
pens
es
1,19
4 -
1,19
4 4
0 -
40
- -
- 1,
234
Sub
Tota
l (A
) 2
,63,
770
1,23
,72,
467
1,26
,36,
237
1,10
5 13
,92,
363
13,9
3,46
8 2
,603
8
5,70
,015
8
5,72
,618
2
,26,
02,3
23
2A
mou
nt c
eded
in re
insu
ranc
e (a
) Cl
aim
s by
dea
th
(41,6
80)
- (4
1,680
) -
- -
- -
- (4
1,680
)
(b)
Clai
ms
by M
atur
ity
- -
- -
- -
- -
- -
(c)
Ann
uitie
s /
Pens
ion
Paym
ents
-
- -
- -
- -
- -
-
(d)
Oth
er b
enefi
ts
- -
- -
- -
- -
- -
H
ealth
ben
efits
(2
66)
- (2
66)
- -
- -
- -
(266
)
Sub
Tota
l (B)
(4
1,946
) -
(41,9
46)
- -
- -
- -
(41,9
46)
Tota
l (A
) + (B
) 2
,21,8
24
1,23
,72,
467
1,25
,94,
291
1,10
5 13
,92,
363
13,9
3,46
8 2
,603
8
5,70
,015
8
5,72
,618
2
,25,
60,3
77
Bene
fits
paid
to c
laim
ants
In In
dia
2,2
1,824
1,
23,7
2,46
7 1,
25,9
4,29
1 1,
105
13,9
2,36
3 13
,93,
468
2,6
03
85,
70,0
15
85,
72,6
18
2,2
5,60
,377
Out
side
Indi
a -
- -
- -
- -
- -
-
TO
TAL
(UL2
) 2
,21,8
24
1,23
,72,
467
1,25
,94,
291
1,10
5 13
,92,
363
13,9
3,46
8 2
,603
8
5,70
,015
8
5,72
,618
2
,25,
60,3
77

Annual Report 2018-19
148
Sche
dule
s to
Ann
exur
e to
Rev
enue
Acc
ount
(UL)
fo
r the
yea
r end
ed 3
1st M
arch
, 201
9 fo
rmin
g pa
rt of
Fin
anci
al S
tate
men
tsSc
hedu
le U
L2
Bene
fits
Paid
(Net
)
(` ‘0
00)
Sl. N
o. P
artic
ular
s
Prev
ious
Yea
r
Lin
ked
Life
Lin
ked
Pens
ion
Lin
ked
Gro
up To
tal U
nit L
inke
d N
on-U
nit
Uni
t To
tal
Non
-Uni
t U
nit
Tota
l N
on-U
nit
Uni
t To
tal
(1)
(2)
(3)=
(1)+(
2)
(4)
(5)
(6)=
(4)+
(5)
(7)
(8)
(9)=
(7)+
(8)
(10)
=(3)
+(6)
+(9)
1In
sura
nce
Clai
ms
(a)
Clai
ms
by d
eath
1,
70,3
84
1,66
,289
3
,36,
673
234
19
,523
19
,757
5
,500
2
,038
7
,538
3
,63,
968
(b)
Clai
ms
by M
atur
ity
- 2
8,97
,648
2
8,97
,648
-
2,4
4,19
7 2
,44,
197
- 10
,04,
897
10,0
4,89
7 4
1,46,
742
(c)
Ann
uitie
s /
Pens
ion
Paym
ents
-
- -
- -
- -
- -
-
(d)
Oth
er b
enefi
ts:
- -
- -
- -
- -
-
Su
rviv
al b
enefi
ts
- -
- -
- -
- -
- -
H
ealth
ben
efits
15
4 -
154
- -
- -
- -
154
Cr
itical
illne
ss b
enefi
t 4
30
- 4
30
- -
- -
- -
430
Su
rren
ders
-
1,18
,55,
847
1,18
,55,
847
- 12
,06,
935
12,0
6,93
5 -
2,6
8,34
6 2
,68,
346
1,33
,31,1
28
(e)
Clai
ms
Inve
stig
atio
n ex
pens
es
1,54
0 -
1,54
0 5
-
5
- -
- 1,
545
Sub
Tota
l (A
) 1
,72,
508
1,4
9,19
,784
1
,50,
92,2
92
239
1
4,70
,655
1
4,70
,894
5
,500
1
2,75
,281
1
2,80
,781
1
,78,
43,9
67
2A
mou
nt c
eded
in re
insu
ranc
e (a
) Cl
aim
s by
dea
th
(17,
159)
- (1
7,15
9) -
- -
- -
- (1
7,15
9)
(b)
Clai
ms
by M
atur
ity
- -
- -
- -
- -
- -
(c)
Ann
uitie
s /
Pens
ion
Paym
ents
-
- -
- -
- -
- -
-
(d)
Oth
er b
enefi
ts
- -
- -
- -
- -
- -
H
ealth
ben
efits
(4
0) -
(40)
- -
- -
- -
(40)
Sub
Tota
l (B)
(1
7,19
9) -
(1
7,19
9) -
-
-
-
-
-
(1
7,19
9)To
tal (
A) +
(B)
1,5
5,30
9 1
,49,
19,7
84
1,5
0,75
,093
2
39
14,
70,6
55
14,
70,8
94
5,5
00
12,
75,2
81
12,
80,7
81
1,7
8,26
,768
Be
nefit
s pa
id to
cla
iman
ts
In In
dia
1,55
,309
1,
49,19
,784
1,
50,7
5,09
3 2
39
14,7
0,65
5 14
,70,
894
5,5
00
12,7
5,28
1 12
,80,
781
1,78
,26,
768
Out
side
Indi
a -
- -
- -
- -
- -
-
TO
TAL
(UL2
) 1
,55,
309
1,4
9,19
,784
1
,50,
75,0
93
239
1
4,70
,655
1
4,70
,894
5
,500
1
2,75
,281
1
2,80
,781
1
,78,
26,7
68
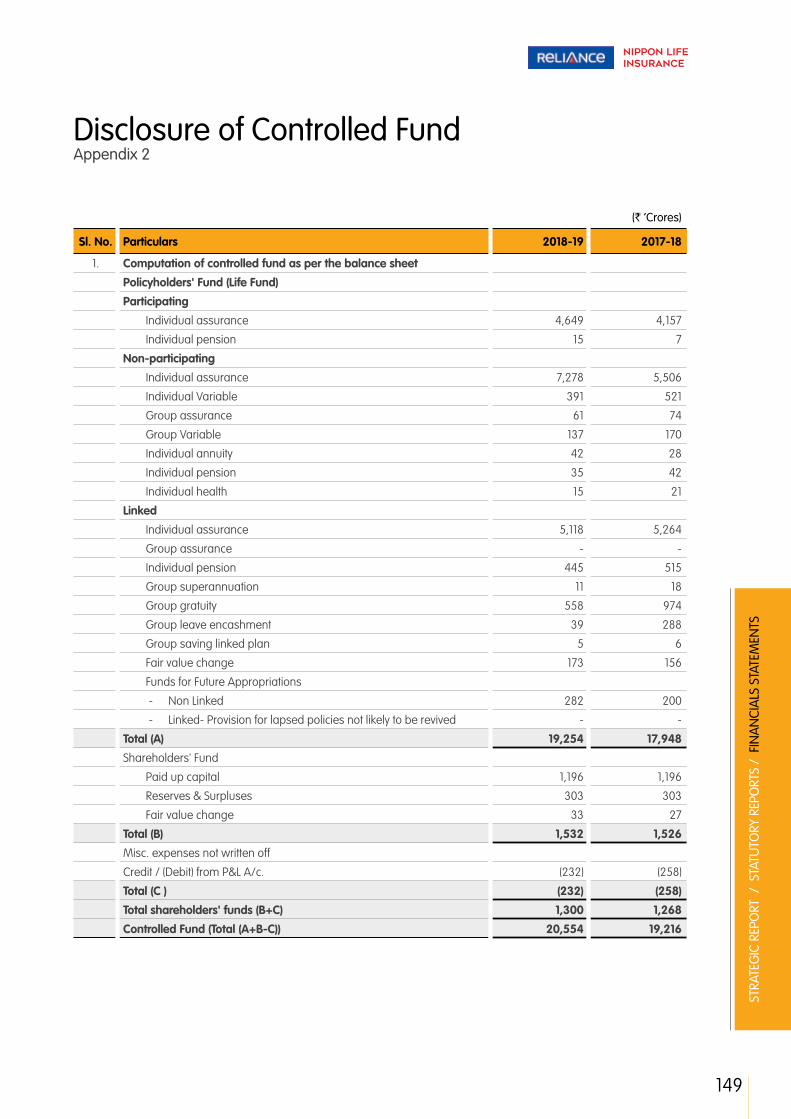
149
STRA
TEG
IC R
EPO
RT /
STA
TUTO
RY R
EPO
RTS
/ F
INA
NCI
ALS
STA
TEM
ENTS
Disclosure of Controlled FundAppendix 2
(` ‘Crores)
Sl. No. Particulars 2018-19 2017-18
1. Computation of controlled fund as per the balance sheet
Policyholders' Fund (Life Fund)
Participating
Individual assurance 4,649 4,157
Individual pension 15 7
Non-participating
Individual assurance 7,278 5,506
Individual Variable 391 521
Group assurance 61 74
Group Variable 137 170
Individual annuity 42 28
Individual pension 35 42
Individual health 15 21
Linked
Individual assurance 5,118 5,264
Group assurance - -
Individual pension 445 515
Group superannuation 11 18
Group gratuity 558 974
Group leave encashment 39 288
Group saving linked plan 5 6
Fair value change 173 156
Funds for Future Appropriations
- Non Linked 282 200
- Linked- Provision for lapsed policies not likely to be revived - -
Total (A) 19,254 17,948
Shareholders' Fund
Paid up capital 1,196 1,196
Reserves & Surpluses 303 303
Fair value change 33 27
Total (B) 1,532 1,526
Misc. expenses not written off
Credit / (Debit) from P&L A/c. (232) (258)
Total (C ) (232) (258)
Total shareholders' funds (B+C) 1,300 1,268
Controlled Fund (Total (A+B-C)) 20,554 19,216

Annual Report 2018-19
150
(` ‘Crores)
Sl. No. Particulars 2018-19 2017-18
2. Reconciliation of the Controlled Fund from Revenue and Profit & Loss Account
Opening Balance of Controlled Fund 19,216 17,540
Add: Inflow
Income
Premium Income 4,358 4,069
Less: Reinsurance ceded (22) (28)
Net Premium 4,336 4,041
Investment Income 1,656 1,586
Other Income 16 20
Funds transferred from Shareholders' Accounts 122 163
Total Income 6,130 5,810
Less: Outgo
(i) Benefits paid (Net) 3,539 2,971
(ii) Interim bonus paid 1 1
(iii) Change in valuation of liability 1,207 1,523
(iv) Commission 173 158
(v) Operating expenses 896 858
(vi) Provision for taxation
(a) FBT - -
(b) I.T. - -
Provisions (other than taxation)
(a) For diminution in the value of investments (net) 48 -
(b) Others -Provision for standard assets - -
(vii) GST/Service tax on charges 34 36
Total Outgo 5,898 5,547
Surplus of the Policyholders' Fund 232 263
Less: transferred to Shareholders' Account 150 132
Net Flow in Policyholders' account 82 131
Add: Net income in Shareholders' Fund 31 (8)
Net In Flow / Outflow 113 123
Add: change in valuation Liabilities 1,207 1,523
Add: change in fair value change account 17 29
Add: Increase in Paid up Capital - -
Disclosure of Controlled FundAppendix 2

151
STRA
TEG
IC R
EPO
RT /
STA
TUTO
RY R
EPO
RTS
/ F
INA
NCI
ALS
STA
TEM
ENTS
(` ‘Crores)
Sl. No. Particulars 2018-19 2017-18
3 Reconciliation with Shareholders' and Policyholders' Fund
Policyholders' Funds
3.1 Policyholders' Funds - Traditional-PAR and NON-PAR
Opening Balance of the Policyholders' Fund 10,882 8,794
Add: Surplus of the Revenue Account 83 134
Add: change in fair value change account 17 29
Add: change in valuation Liabilities 2,095 1,925
Total 13,077 10,882
As per Balance Sheet 13,077 10,882
Difference, if any - -
3.2 Policyholders' Funds - Linked
Opening Balance of the Policyholders' Fund 7,065 7,469
Add: Surplus of the Revenue Account - -
Add: change in valuation Liabilities (889) (404)
Total 6,176 7,065
As per Balance Sheet 6,176 7,065
Difference, if any - -
3.3 Shareholders'' Funds
Opening Balance of Shareholders' Fund 1,269 1,277
Add: net income of Shareholders' account (P&L) 32 (8)
Add: Infusion of Capital - -
Closing Balance of the Shareholders'' fund 1,301 1,269
As per Balance Sheet 1,301 1,269
Difference, if any - -

Annual Report 2018-19
152
(` ‘000)
Sl. No. Particulars 2018-19 2017-18 2016-17 2015-16 2014-15
POLICYHOLDERS' A/C
1 Gross premium income 4,35,79,268 4,06,93,707 4,02,68,213 4,39,81,174 4,62,10,816
2 Net premium income 4,33,56,691 4,04,16,871 3,99,92,557 4,37,06,405 4,59,16,669
3 Income from investments, net of amortisation
1,65,57,473 1,58,64,556 1,85,10,942 57,63,375 3,20,27,852
4 Other income 13,88,147 18,38,267 16,23,693 39,99,518 16,28,188
5 Total income 6,13,02,311 5,81,19,694 6,01,27,192 5,34,69,298 7,95,72,709
6 Commission 14,58,431 13,91,317 17,63,507 21,09,245 23,32,086
7 Brokerage 2,75,132 1,89,445 1,90,597 3,49,534 4,74,930
8 Operating expenses related to the insurance business
89,59,679 85,80,014 77,98,169 1,38,62,812 1,48,00,533
9 Provision for diminution in the value of investments (net)
4,83,782 - - - -
10 Service tax on charges 3,44,152 3,59,992 3,43,878 3,86,118 4,45,353 11 Total expenses 1,15,21,176 1,05,20,768 1,00,96,151 1,67,07,709 1,80,52,902
12 Payment to policyholders 3,53,92,154 2,97,14,993 3,12,78,438 4,24,56,282 6,20,82,798
13 Increase in actuarial liability 2,09,55,413 1,92,64,964 1,76,26,696 64,23,317 1,29,83,865
14 Provision for Linked Liabilities (88,90,084) (40,38,488) (2,67,753) (1,29,20,165) (1,48,97,410)
15 Surplus/(Deficit) from operations 23,23,652 26,57,457 13,93,660 8,02,155 13,50,554
SHAREHOLDERS' A/C16 Total income under Shareholders'
Account * 26,17,597 26,41,576 20,62,941 22,17,607 29,89,296
17 Total expenses under Shareholder's Account *
23,62,960 26,36,262 26,74,202 41,90,387 16,37,505
18 Profit/(Loss) before tax 2,54,637 5,314 (6,11,261) (19,72,780) 13,51,791
19 Provisions for tax - - - - -
20 Profit/(Loss) after tax 2,54,637 5,314 (6,11,261) (19,72,780) 13,51,791
Summary of Financial StatementsAppendix 3

153
STRA
TEG
IC R
EPO
RT /
STA
TUTO
RY R
EPO
RTS
/ F
INA
NCI
ALS
STA
TEM
ENTS
(` ‘000)
Sl. No. Particulars 2018-19 2017-18 2016-17 2015-16 2014-15
21 Profit/(Loss) carried to Balance Sheet
(23,24,090) (25,78,727) (25,84,041) (19,72,780) (1,89,48,671)
MISCELLANEOUS22 (A) Policyholders' account:
Total funds 19,25,38,319 17,94,78,561 16,26,24,659 14,36,36,975 15,09,56,972
Total investments (including assets held to cover linked liabilities)
19,06,21,877 17,91,00,512 15,93,63,181 14,43,96,799 15,30,07,979
Yield** on investments (%) 9.38% 9.84% 12.98% 3.95% 22.09%
(B) Shareholders' account:
Total funds 1,30,05,673 1,26,90,821 1,27,72,022 1,31,34,643 1,54,94,129
Total investments 1,21,86,796 1,18,55,206 1,31,67,498 1,52,49,186 1,60,16,345
Yield** on investments (%) 9.78% 11.19% 9.22% 9.55% 10.30%
23 Yield** on total investments (%) 9.40% 9.93% 12.65% 4.47% 21.02%
24 Paid up equity capital 1,19,63,235 1,19,63,235 1,19,63,235 1,19,63,235 1,19,63,235
25 Networth (Shareholders' fund less Profit & Loss Debit balance)
1,30,05,673 1,26,90,821 1,27,72,022 1,31,34,643 1,54,94,129
(Shareholders' Funds)
26 Total assets (Investments + Loans + Fixed Assets + Net Current Assets)
20,55,43,992 19,21,69,382 17,53,96,681 15,67,71,618 16,64,51,101
27 Earnings/(Loss) per share (`) 0.213 0.004 (0.51) (1.65) 1.13
(Profit/(Loss) as per Shareholders' Account/weighted average no. of shares)
28 Book value per share (`) 10.87 10.61 10.68 10.98 12.95
* Including of transfer from/to Policyholders’ account** Yield = 2 * investment income/(Opening investment + closing investment - investment income)

Annual Report 2018-19
154
Accounting RatiosAppendix 4
Sl. No. Particulars 2018-19 2017-18
1 New business premium income growth (number of times)
Participating Business
Life (0.22) (0.53)
Pension 0.31 (0.45)
Non Participating Business
Non Linked Individual 0.14 0.16
Non Linked Individual Variable Life 1.00 0.79
Non Par Group Life (0.31) (0.18)
Non Par Group Variable Pension (0.44) (0.81)
Non Par Group Variable Life (0.35) (0.72)
Non Linked Variable Pension (4.00) 0.94
Non Linked Health 20.56 (0.99)
Non Linked Annuity 3.37 (0.39)
Linked Life 0.48 0.27
Linked Pension 0.12 (0.29)
Linked Group 0.13 (0.56)
(new business premium current year-new business premium previous year)/new business premium previous year.
2 Net retention ratio 0.995 0.993
(net premium/gross premium)
3 Ratio of expenses of management 0.25 0.25
(Gross commission plus operating expenses/gross direct premium)
4 Commission ratio 0.04 0.04
(gross commission paid/gross premium)
5 Ratio of policyholders' liabilities to shareholders' funds 14.80 14.14
(policyholder's liabilites/shareholder's fund)
6 Growth rate of shareholders' funds 2.48% -0.64%
[change in shareholders' funds over previous year/shareholders' funds (previous year)]
7 Ratio of surplus/(deficit) to policyholders' liability 0.01 0.01
[surplus/(deficit) as per Revenue Account/policyholders' liability]
8 Change in net worth (` '000) 3,14,852 (81,201)
(current year shareholders' funds - previous year shareholders' funds)
9 Profit after tax/Total income 0.00 0.00
(Shareholders' Account)
10 (Total real estate + Loans)/Cash & invested assets 0.0017 0.0014
11 Total investments/[Capital + Surplus)** 13.53 12.73
12 Total affiliated investments/[Capital + Surplus)** - -
13 Investment yield (gross and net)^
Policyholder's Funds
Non-linked 8.77% 5.71%
Linked 7.34% 9.07%
Shareholder's Funds 8.95% 6.98%
14 Conservation Ratio
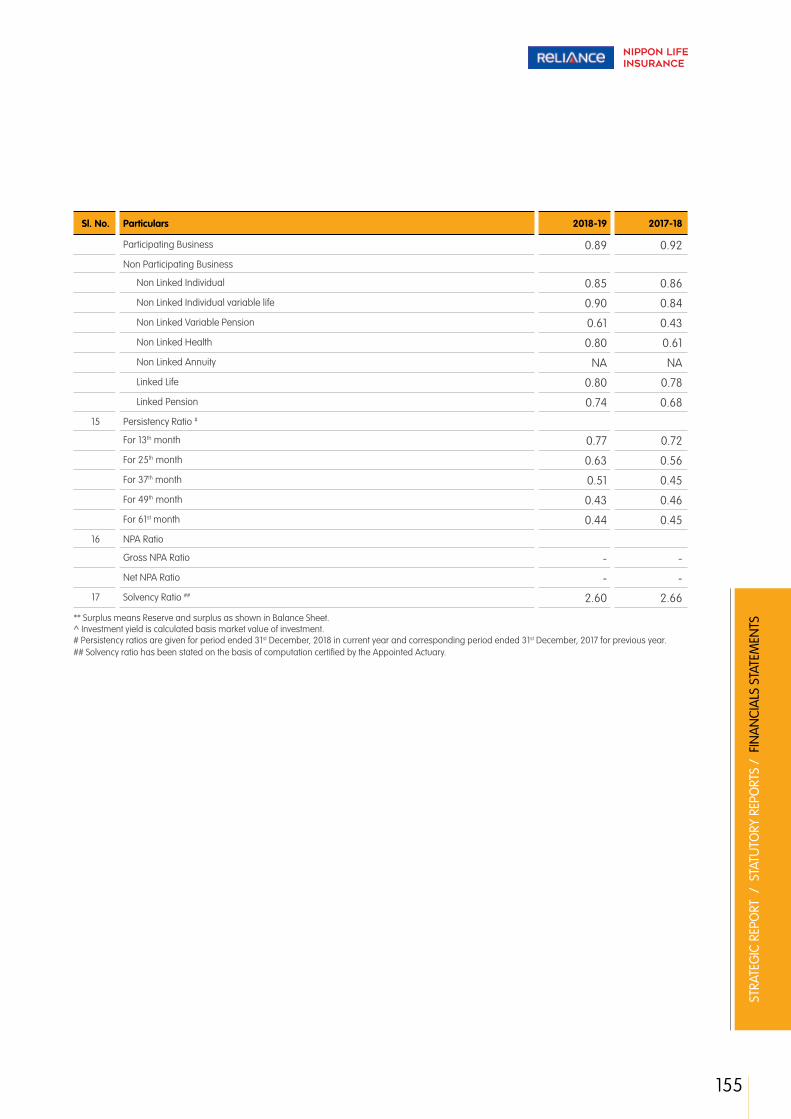
155
STRA
TEG
IC R
EPO
RT /
STA
TUTO
RY R
EPO
RTS
/ F
INA
NCI
ALS
STA
TEM
ENTS
Sl. No. Particulars 2018-19 2017-18
Participating Business 0.89 0.92
Non Participating Business
Non Linked Individual 0.85 0.86
Non Linked Individual variable life 0.90 0.84
Non Linked Variable Pension 0.61 0.43
Non Linked Health 0.80 0.61
Non Linked Annuity NA NA
Linked Life 0.80 0.78
Linked Pension 0.74 0.68
15 Persistency Ratio #
For 13th month 0.77 0.72
For 25th month 0.63 0.56
For 37th month 0.51 0.45
For 49th month 0.43 0.46
For 61st month 0.44 0.45
16 NPA Ratio
Gross NPA Ratio - -
Net NPA Ratio - -
17 Solvency Ratio ## 2.60 2.66
** Surplus means Reserve and surplus as shown in Balance Sheet. ^ Investment yield is calculated basis market value of investment. # Persistency ratios are given for period ended 31st December, 2018 in current year and corresponding period ended 31st December, 2017 for previous year. ## Solvency ratio has been stated on the basis of computation certified by the Appointed Actuary.
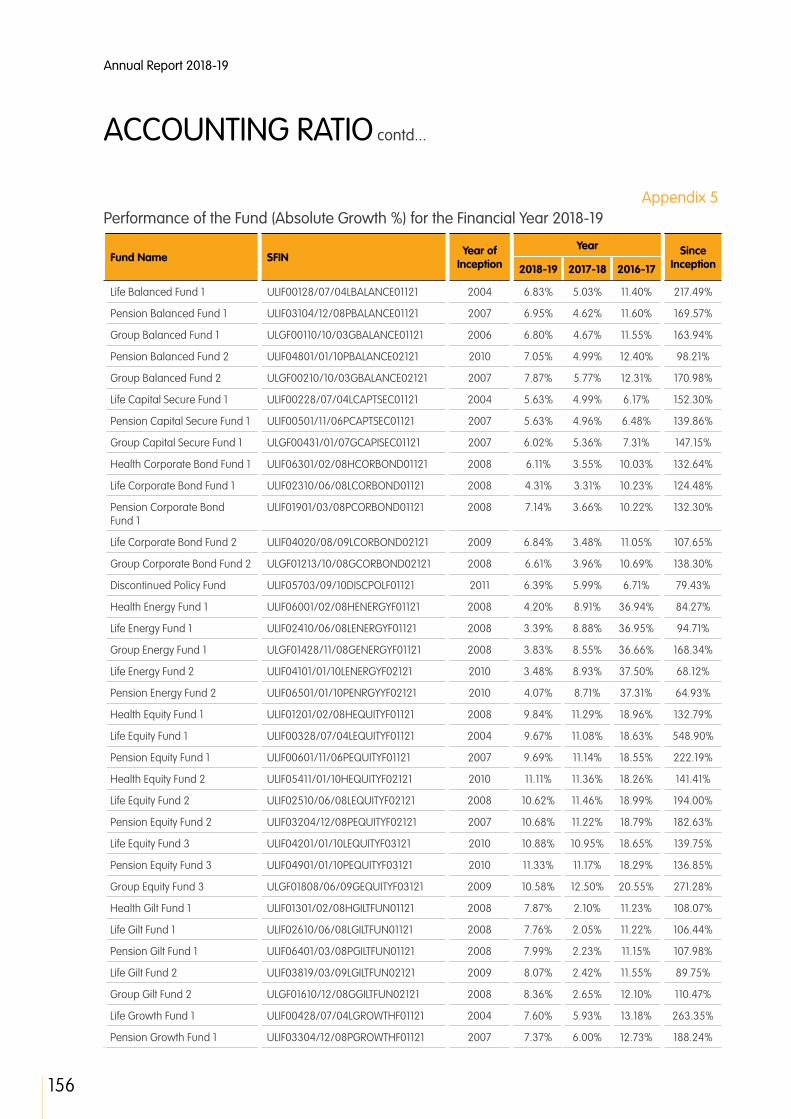
156
Annual Report 2018-19
Appendix 5
ACCOUNTING RATIO contd...
Performance of the Fund (Absolute Growth %) for the Financial Year 2018-19
Fund Name SFIN Year of Inception
Year Since Inception2018-19 2017-18 2016-17
Life Balanced Fund 1 ULIF00128/07/04LBALANCE01121 2004 6.83% 5.03% 11.40% 217.49%
Pension Balanced Fund 1 ULIF03104/12/08PBALANCE01121 2007 6.95% 4.62% 11.60% 169.57%
Group Balanced Fund 1 ULGF00110/10/03GBALANCE01121 2006 6.80% 4.67% 11.55% 163.94%
Pension Balanced Fund 2 ULIF04801/01/10PBALANCE02121 2010 7.05% 4.99% 12.40% 98.21%
Group Balanced Fund 2 ULGF00210/10/03GBALANCE02121 2007 7.87% 5.77% 12.31% 170.98%
Life Capital Secure Fund 1 ULIF00228/07/04LCAPTSEC01121 2004 5.63% 4.99% 6.17% 152.30%
Pension Capital Secure Fund 1 ULIF00501/11/06PCAPTSEC01121 2007 5.63% 4.96% 6.48% 139.86%
Group Capital Secure Fund 1 ULGF00431/01/07GCAPISEC01121 2007 6.02% 5.36% 7.31% 147.15%
Health Corporate Bond Fund 1 ULIF06301/02/08HCORBOND01121 2008 6.11% 3.55% 10.03% 132.64%
Life Corporate Bond Fund 1 ULIF02310/06/08LCORBOND01121 2008 4.31% 3.31% 10.23% 124.48%
Pension Corporate Bond Fund 1
ULIF01901/03/08PCORBOND01121 2008 7.14% 3.66% 10.22% 132.30%
Life Corporate Bond Fund 2 ULIF04020/08/09LCORBOND02121 2009 6.84% 3.48% 11.05% 107.65%
Group Corporate Bond Fund 2 ULGF01213/10/08GCORBOND02121 2008 6.61% 3.96% 10.69% 138.30%
Discontinued Policy Fund ULIF05703/09/10DISCPOLF01121 2011 6.39% 5.99% 6.71% 79.43%
Health Energy Fund 1 ULIF06001/02/08HENERGYF01121 2008 4.20% 8.91% 36.94% 84.27%
Life Energy Fund 1 ULIF02410/06/08LENERGYF01121 2008 3.39% 8.88% 36.95% 94.71%
Group Energy Fund 1 ULGF01428/11/08GENERGYF01121 2008 3.83% 8.55% 36.66% 168.34%
Life Energy Fund 2 ULIF04101/01/10LENERGYF02121 2010 3.48% 8.93% 37.50% 68.12%
Pension Energy Fund 2 ULIF06501/01/10PENRGYYF02121 2010 4.07% 8.71% 37.31% 64.93%
Health Equity Fund 1 ULIF01201/02/08HEQUITYF01121 2008 9.84% 11.29% 18.96% 132.79%
Life Equity Fund 1 ULIF00328/07/04LEQUITYF01121 2004 9.67% 11.08% 18.63% 548.90%
Pension Equity Fund 1 ULIF00601/11/06PEQUITYF01121 2007 9.69% 11.14% 18.55% 222.19%
Health Equity Fund 2 ULIF05411/01/10HEQUITYF02121 2010 11.11% 11.36% 18.26% 141.41%
Life Equity Fund 2 ULIF02510/06/08LEQUITYF02121 2008 10.62% 11.46% 18.99% 194.00%
Pension Equity Fund 2 ULIF03204/12/08PEQUITYF02121 2007 10.68% 11.22% 18.79% 182.63%
Life Equity Fund 3 ULIF04201/01/10LEQUITYF03121 2010 10.88% 10.95% 18.65% 139.75%
Pension Equity Fund 3 ULIF04901/01/10PEQUITYF03121 2010 11.33% 11.17% 18.29% 136.85%
Group Equity Fund 3 ULGF01808/06/09GEQUITYF03121 2009 10.58% 12.50% 20.55% 271.28%
Health Gilt Fund 1 ULIF01301/02/08HGILTFUN01121 2008 7.87% 2.10% 11.23% 108.07%
Life Gilt Fund 1 ULIF02610/06/08LGILTFUN01121 2008 7.76% 2.05% 11.22% 106.44%
Pension Gilt Fund 1 ULIF06401/03/08PGILTFUN01121 2008 7.99% 2.23% 11.15% 107.98%
Life Gilt Fund 2 ULIF03819/03/09LGILTFUN02121 2009 8.07% 2.42% 11.55% 89.75%
Group Gilt Fund 2 ULGF01610/12/08GGILTFUN02121 2008 8.36% 2.65% 12.10% 110.47%
Life Growth Fund 1 ULIF00428/07/04LGROWTHF01121 2004 7.60% 5.93% 13.18% 263.35%
Pension Growth Fund 1 ULIF03304/12/08PGROWTHF01121 2007 7.37% 6.00% 12.73% 188.24%

157
STRA
TEG
IC R
EPO
RT /
STA
TUTO
RY R
EPO
RTS
/ F
INA
NCI
ALS
STA
TEM
ENTS
Fund Name SFIN Year of Inception
Year Since Inception2018-19 2017-18 2016-17
Group Growth Fund 1 ULGF00310/10/03GGROWTHF01121 2007 8.16% 7.88% 14.16% 172.11%
Life Growth Fund 2 ULIF01102/11/07LGROWTHF02121 2007 8.02% 6.62% 13.98% 121.28%
Pension Growth Fund 2 ULIF05001/01/10PGROWTHF02121 2010 8.19% 6.66% 13.96% 107.35%
Health Growth Plus Fund 1 ULIF01401/02/08HGRWTPLS01121 2008 7.46% 7.44% 14.37% 129.69%
Life Growth Plus Fund 1 ULIF00809/04/07LGRWTPLS01121 2007 7.89% 7.27% 14.60% 179.61%
Life Growth Plus Fund 2 ULIF04301/01/10LGRWTPLS02121 2010 7.65% 7.91% 13.97% 114.58%
Life High Growth Fund 1 ULIF00728/02/07LHIGROWT01121 2007 8.69% 8.14% 15.51% 186.36%
Life High Growth Fund 2 ULIF05511/01/10LHIGROWT02121 2010 7.69% 9.12% 14.06% 113.02%
Life Highest NAV Advantage Fund 1
ULIF05803/09/10LHNAVADV01121 2010 9.25% 10.24% 9.21% 49.94%
Life Highest NAV Advantage Fund 2
ULIF05901/06/11LHNAVADV02121 2011 11.51% 10.52% 9.86% 72.50%
Life Highest NAV Guarantee Fund 1
ULIF05612/02/10LHNAVGUA01121 2010 6.00% 10.64% 10.05% 73.90%
Health Infrastructure Fund 1 ULIF06101/02/08HINFRAST01121 2008 -2.14% 7.62% 30.02% 15.30%
Life Infrastructure Fund 1 ULIF02710/06/08LINFRAST01121 2008 -2.61% 7.48% 30.03% 17.68%
Group Infrastructure Fund 1 ULGF01908/06/09GINFRASF01121 2009 -1.93% 8.38% 30.70% 38.73%
Life Infrastructure Fund 2 ULIF04401/01/10LINFRAST02121 2010 -2.55% 7.67% 29.92% 20.82%
Pension Infrastructure Fund 2 ULIF06601/01/10PINFRAST02121 2010 -2.22% 7.47% 30.34% 24.25%
Health Midcap Fund 1 ULIF06201/02/08HMIDCAPF01121 2008 -1.49% 10.53% 40.73% 198.70%
Life Midcap Fund 1 ULIF02810/06/08LMIDCAPF01121 2008 -1.10% 12.42% 41.09% 184.39%
Group Midcap Fund 1 ULGF02008/06/09GMIDCAPF01121 2009 -0.43% 12.10% 42.03% 270.37%
Life Midcap Fund 2 ULIF04501/01/10LMIDCAPF02121 2010 -1.60% 12.57% 41.53% 158.13%
Pension Midcap Fund 2 ULIF05101/01/10PMIDCAPF02121 2010 -1.58% 12.46% 41.19% 160.45%
Health Money Market Fund 1 ULIF01501/02/08HMONMRKT01121 2008 -0.93% 5.42% 6.88% 106.47%
Life Money Market Fund 1 ULIF02910/06/08LMONMRKT01121 2008 -0.80% 5.42% 6.84% 102.71%
Life Money Market Fund 2 ULIF03919/03/09LMONMRKT02121 2009 -1.01% 5.69% 6.93% 88.34%
Pension Money Market Fund 2 ULIF05201/01/10PMONMRKT02121 2010 -1.42% 5.45% 6.90% 76.37%
Group Money Market Fund 2 ULGF00930/09/08GMONMRKT02121 2008 0.33% 6.05% 7.49% 112.67%
Life Pure Debt Fund 1 ULIF00909/04/07LPURDEBT01121 2007 6.61% 3.34% 10.34% 144.27%
Health Pure Equity Fund 1 ULIF01601/02/08HPUEQUTY01121 2008 3.76% 9.96% 13.16% 148.51%
Life Pure Equity Fund 1 ULIF03010/06/08LPUEQUTY01121 2008 3.84% 9.49% 13.20% 176.77%
Group Pure Equity Fund 1 ULGF01528/11/08GPUREEQF01121 2008 3.65% 9.76% 12.89% 279.11%
Life Pure Equity Fund 2 ULIF04601/01/10LPUEQUTY02121 2010 3.54% 9.90% 13.52% 109.88%
Pension Pure Equity Fund 2 ULIF05301/01/10PPUEQUTY02121 2010 4.11% 9.66% 13.01% 112.71%
Health Super Growth Fund 1 ULIF01701/02/08HSPRGRWT01121 2008 7.56% 9.69% 17.01% 119.51%
Life Super Growth Fund 1 ULIF01009/04/07LSPRGRWT01121 2007 9.22% 10.15% 17.68% 165.75%
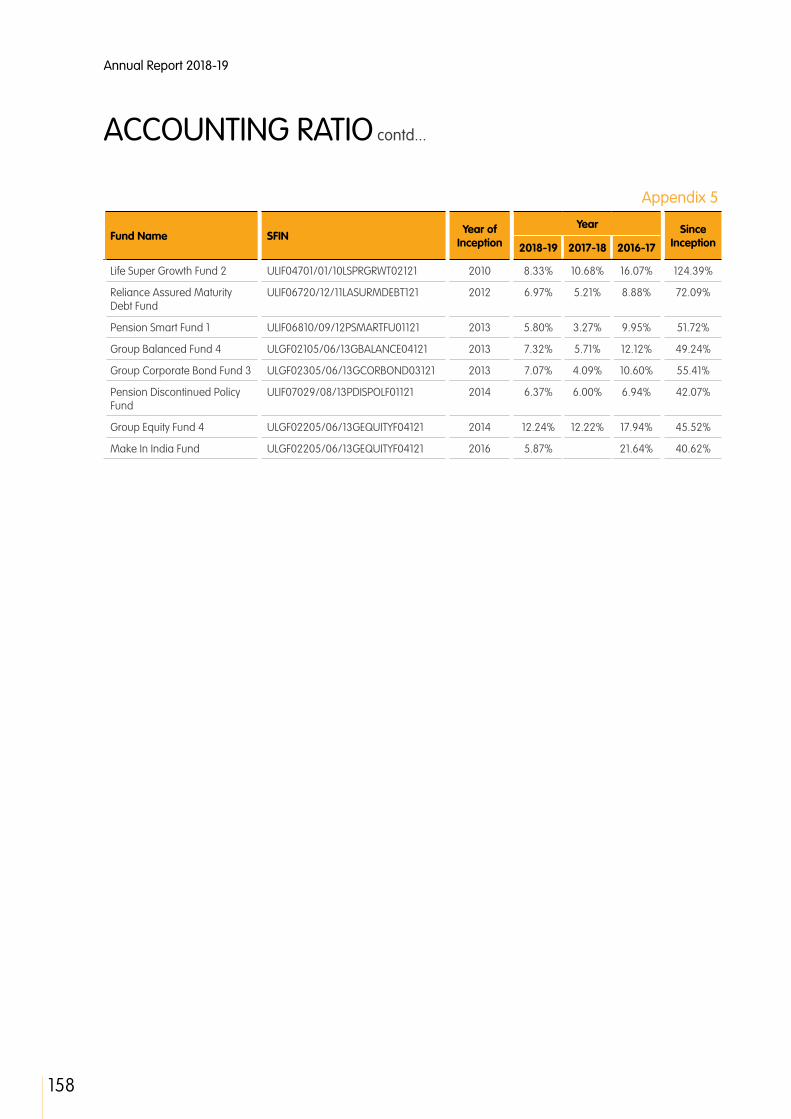
158
Annual Report 2018-19
Appendix 5
ACCOUNTING RATIO contd...
Fund Name SFIN Year of Inception
Year Since Inception2018-19 2017-18 2016-17
Life Super Growth Fund 2 ULIF04701/01/10LSPRGRWT02121 2010 8.33% 10.68% 16.07% 124.39%
Reliance Assured Maturity Debt Fund
ULIF06720/12/11LASURMDEBT121 2012 6.97% 5.21% 8.88% 72.09%
Pension Smart Fund 1 ULIF06810/09/12PSMARTFU01121 2013 5.80% 3.27% 9.95% 51.72%
Group Balanced Fund 4 ULGF02105/06/13GBALANCE04121 2013 7.32% 5.71% 12.12% 49.24%
Group Corporate Bond Fund 3 ULGF02305/06/13GCORBOND03121 2013 7.07% 4.09% 10.60% 55.41%
Pension Discontinued Policy Fund
ULIF07029/08/13PDISPOLF01121 2014 6.37% 6.00% 6.94% 42.07%
Group Equity Fund 4 ULGF02205/06/13GEQUITYF04121 2014 12.24% 12.22% 17.94% 45.52%
Make In India Fund ULGF02205/06/13GEQUITYF04121 2016 5.87% 21.64% 40.62%

159
STRA
TEG
IC R
EPO
RT /
STA
TUTO
RY R
EPO
RTS
/ F
INA
NCI
ALS
STA
TEM
ENTS
Performance of the Fund (Absolute Growth %) for the Financial Year 2017-18
Fund Name SFIN Year of Inception
Year Since Inception2017-18 2016-17 2015-16
Life Balanced Fund 1 ULIF00128/07/04LBALANCE01121 2004 5.03% 11.40% 3.59% 197.20%
Pension Balanced Fund 1 ULIF03104/12/08PBALANCE01121 2007 4.62% 11.60% 3.67% 152.06%
Group Balanced Fund 1 ULGF00110/10/03GBALANCE01121 2006 4.67% 11.55% 3.43% 147.14%
Pension Balanced Fund 2 ULIF04801/01/10PBALANCE02121 2010 4.99% 12.40% 3.11% 85.17%
Group Balanced Fund 2 ULGF00210/10/03GBALANCE02121 2007 5.77% 12.31% 4.33% 151.21%
Life Capital Secure Fund 1 ULIF00228/07/04LCAPTSEC01121 2004 4.99% 6.17% 6.51% 138.86%
Pension Capital Secure Fund 1
ULIF00501/11/06PCAPTSEC01121 2007 4.96% 6.48% 6.56% 127.07%
Group Capital Secure Fund 1 ULGF00431/01/07GCAPISEC01121 2007 5.36% 7.31% 7.45% 133.13%
Health Corporate Bond Fund 1
ULIF06301/02/08HCORBOND01121 2008 3.55% 10.03% 6.57% 119.24%
Life Corporate Bond Fund 1 ULIF02310/06/08LCORBOND01121 2008 3.31% 10.23% 6.56% 115.20%
Pension Corporate Bond Fund 1
ULIF01901/03/08PCORBOND01121 2008 3.66% 10.22% 6.56% 116.83%
Life Corporate Bond Fund 2 ULIF04020/08/09LCORBOND02121 2009 3.48% 11.05% 6.80% 94.35%
Group Corporate Bond Fund 2
ULGF01213/10/08GCORBOND02121 2008 3.96% 10.69% 7.06% 123.53%
Discontinued Policy Fund ULIF05703/09/10DISCPOLF01121 2011 5.99% 6.71% 7.62% 68.65%
Health Energy Fund 1 ULIF06001/02/08HENERGYF01121 2008 8.91% 36.94% -3.32% 76.84%
Life Energy Fund 1 ULIF02410/06/08LENERGYF01121 2008 8.88% 36.95% -3.47% 88.32%
Pension Energy Fund 1 ULIF02001/03/08PENRGYYF01121 2008 NA NA -3.51% NA
Group Energy Fund 1 ULGF01428/11/08GENERGYF01121 2008 8.55% 36.66% -3.46% 158.44%
Life Energy Fund 2 ULIF04101/01/10LENERGYF02121 2010 8.93% 37.50% -3.90% 62.47%
Pension Energy Fund 2 ULIF06501/01/10PENRGYYF02121 2010 8.71% 37.31% -3.77% 58.48%
Health Equity Fund 1 ULIF01201/02/08HEQUITYF01121 2008 11.29% 18.96% -4.78% 111.94%
Life Equity Fund 1 ULIF00328/07/04LEQUITYF01121 2004 11.08% 18.63% -5.23% 491.70%
Pension Equity Fund 1 ULIF00601/11/06PEQUITYF01121 2007 11.14% 18.55% -4.92% 193.74%
Health Equity Fund 2 ULIF05411/01/10HEQUITYF02121 2010 11.36% 18.26% -6.20% 117.27%
Life Equity Fund 2 ULIF02510/06/08LEQUITYF02121 2008 11.46% 18.99% -4.73% 165.79%
Pension Equity Fund 2 ULIF03204/12/08PEQUITYF02121 2007 11.22% 18.79% -4.89% 155.36%
Group Equity Fund 2 ULGF01328/11/08GEQUITYF02121 2008 NA NA -5.32% NA
Life Equity Fund 3 ULIF04201/01/10LEQUITYF03121 2010 10.95% 18.65% -6.65% 116.23%
Pension Equity Fund 3 ULIF04901/01/10PEQUITYF03121 2010 11.17% 18.29% -6.12% 112.75%
Group Equity Fund 3 ULGF01808/06/09GEQUITYF03121 2009 12.50% 20.55% -6.15% 235.75%
Health Gilt Fund 1 ULIF01301/02/08HGILTFUN01121 2008 2.10% 11.23% 6.02% 92.88%
Life Gilt Fund 1 ULIF02610/06/08LGILTFUN01121 2008 2.05% 11.22% 6.19% 91.57%
Pension Gilt Fund 1 ULIF06401/03/08PGILTFUN01121 2008 2.23% 11.15% 6.07% 92.59%

160
Annual Report 2018-19
Appendix 5
ACCOUNTING RATIO contd...
Fund Name SFIN Year of Inception
Year Since Inception2017-18 2016-17 2015-16
Life Gilt Fund 2 ULIF03819/03/09LGILTFUN02121 2009 2.42% 11.55% 6.42% 75.59%
Group Gilt Fund 2 ULGF01610/12/08GGILTFUN02121 2008 2.65% 12.10% 6.60% 94.22%
Life Growth Fund 1 ULIF00428/07/04LGROWTHF01121 2004 5.93% 13.18% 0.98% 237.68%
Pension Growth Fund 1 ULIF03304/12/08PGROWTHF01121 2007 6.00% 12.73% 1.11% 168.45%
Group Growth Fund 1 ULGF00310/10/03GGROWTHF01121 2007 7.88% 14.16% 1.47% 151.58%
Life Growth Fund 2 ULIF01102/11/07LGROWTHF02121 2007 6.62% 13.98% 1.63% 104.85%
Pension Growth Fund 2 ULIF05001/01/10PGROWTHF02121 2010 6.66% 13.96% 1.39% 91.66%
Health Growth Plus Fund 1 ULIF01401/02/08HGRWTPLS01121 2008 7.44% 14.37% 0.18% 113.75%
Life Growth Plus Fund 1 ULIF00809/04/07LGRWTPLS01121 2007 7.27% 14.60% 0.27% 159.16%
Life Growth Plus Fund 2 ULIF04301/01/10LGRWTPLS02121 2010 7.91% 13.97% -0.47% 99.34%
Life High Growth Fund 1 ULIF00728/02/07LHIGROWT01121 2007 8.14% 15.51% -0.85% 163.47%
Life High Growth Fund 2 ULIF05511/01/10LHIGROWT02121 2010 9.12% 14.06% -1.77% 97.80%
Life Highest NAV Advantage Fund 1
ULIF05803/09/10LHNAVADV01121 2010 10.24% 9.21% -4.59% 37.24%
Life Highest NAV Advantage Fund 2
ULIF05901/06/11LHNAVADV02121 2011 10.52% 9.86% -5.53% 54.70%
Life Highest NAV Guarantee Fund 1
ULIF05612/02/10LHNAVGUA01121 2010 10.64% 10.05% -8.05% 64.05%
Health Infrastructure Fund 1 ULIF06101/02/08HINFRAST01121 2008 7.62% 30.02% -9.02% 17.82%
Life Infrastructure Fund 1 ULIF02710/06/08LINFRAST01121 2008 7.48% 30.03% -8.98% 20.83%
Pension Infrastructure Fund 1 ULIF02101/03/08PINFRAST01121 2008 NA NA -9.06% NA
Group Infrastructure Fund 1 ULGF01908/06/09GINFRASF01121 2009 8.38% 30.70% -7.95% 41.46%
Life Infrastructure Fund 2 ULIF04401/01/10LINFRAST02121 2010 7.67% 29.92% -8.98% 23.97%
Pension Infrastructure Fund 2
ULIF06601/01/10PINFRAST02121 2010 7.47% 30.34% -8.60% 27.07%
Health Midcap Fund 1 ULIF06201/02/08HMIDCAPF01121 2008 10.53% 40.73% -0.63% 203.20%
Life Midcap Fund 1 ULIF02810/06/08LMIDCAPF01121 2008 12.42% 41.09% -0.39% 187.57%
Pension Midcap Fund 1 ULIF02201/03/08PMIDCAPF01121 2008 NA NA -1.57% NA
Group Midcap Fund 1 ULGF02008/06/09GMIDCAPF01121 2009 12.10% 42.03% 0.36% 271.97%
Life Midcap Fund 2 ULIF04501/01/10LMIDCAPF02121 2010 12.57% 41.53% -0.33% 162.33%
Pension Midcap Fund 2 ULIF05101/01/10PMIDCAPF02121 2010 12.46% 41.19% -0.34% 164.62%
Health Money Market Fund 1 ULIF01501/02/08HMONMRKT01121 2008 5.42% 6.88% 7.37% 108.40%
Life Money Market Fund 1 ULIF02910/06/08LMONMRKT01121 2008 5.42% 6.84% 7.18% 104.35%
Pension Money Market Fund 1
ULIF03404/12/08PMONMRKT01121 2008 NA NA 6.74% NA
Life Money Market Fund 2 ULIF03919/03/09LMONMRKT02121 2009 5.69% 6.93% 7.42% 90.26%

161
STRA
TEG
IC R
EPO
RT /
STA
TUTO
RY R
EPO
RTS
/ F
INA
NCI
ALS
STA
TEM
ENTS
Fund Name SFIN Year of Inception
Year Since Inception2017-18 2016-17 2015-16
Pension Money Market Fund 2
ULIF05201/01/10PMONMRKT02121 2010 5.45% 6.90% 7.30% 78.91%
Group Money Market Fund 2 ULGF00930/09/08GMONMRKT02121 2008 6.05% 7.49% 7.67% 111.96%
Life Pure Debt Fund 1 ULIF00909/04/07LPURDEBT01121 2007 3.34% 10.34% 6.42% 129.13%
Group Pure Debt Fund 1 ULGF01030/09/08GPUREDEB01121 2008 NA NA 6.49% NA
Health Pure Equity Fund 1 ULIF01601/02/08HPUEQUTY01121 2008 9.96% 13.16% 1.25% 139.51%
Life Pure Equity Fund 1 ULIF03010/06/08LPUEQUTY01121 2008 9.49% 13.20% 1.45% 166.52%
Pension Pure Equity Fund 1 ULIF03504/12/08PPUEQUTY01121 2008 NA NA 1.31% NA
Group Pure Equity Fund 1 ULGF01528/11/08GPUREEQF01121 2008 9.76% 12.89% 0.88% 265.76%
Life Pure Equity Fund 2 ULIF04601/01/10LPUEQUTY02121 2010 9.90% 13.52% 1.54% 102.70%
Pension Pure Equity Fund 2 ULIF05301/01/10PPUEQUTY02121 2010 9.66% 13.01% 1.00% 104.31%
Health Super Growth Fund 1 ULIF01701/02/08HSPRGRWT01121 2008 9.69% 17.01% -3.29% 104.09%
Life Super Growth Fund 1 ULIF01009/04/07LSPRGRWT01121 2007 10.15% 17.68% -3.20% 143.32%
Life Super Growth Fund 2 ULIF04701/01/10LSPRGRWT02121 2010 10.68% 16.07% -4.83% 107.13%
Reliance Assured Maturity Debt Fund
ULIF06720/12/11LASURMDEBT121 2012 5.21% 8.88% 7.83% 60.87%
Health Balanced Fund 1 ULIF01801/02/08HBALANCE01121 2012 NA NA 4.48% NA
Pension Smart Fund 1 ULIF06810/09/12PSMARTFU01121 2013 3.27% 9.95% 6.44% 43.40%
Group Balanced Fund 4 ULGF02105/06/13GBALANCE04121 2013 5.71% 12.12% 4.09% 39.06%
Group Corporate Bond Fund 3
ULGF02305/06/13GCORBOND03121 2013 4.09% 10.60% 7.09% 45.15%
Pension Discontinued Policy Fund
ULIF07029/08/13PDISPOLF01121 2014 6.00% 6.94% 7.46% 33.57%
Group Equity Fund 4 ULGF02205/06/13GEQUITYF04121 2014 12.22% 17.94% -5.21% 29.65%
Make In India Fund ULIF06924/03/15LMAKEINDIA121 2016 8.79% 21.64% 0.37% 32.83%
N.A. - refers to schemes not existing during the relevant year.
Investment Management
Activities outsourced: NilFees Paid for various activities charged to Policyholders Account for the year ended 31st March 2019: Nil (Previous Year: Nil)Basis of payment of fees: N.A.Related party transactions - Fund wise details for the Financial Year 2018-19NIL Transactions Related party transactions - Fund wise details for the Financial Year 2017-18NIL Transactions

162
Annual Report 2018-19
Appendix 5
ACCOUNTING RATIO contd...
Company-wise details of investment held in the promoter group along with its % to assets under management as on 31st March, 2019.
(`’000)
Fund Name SFIN Company Name Market Value AUM % of
AUM
% of Total AUM
Life Highest NAV Advantage Fund 1
ULIF05803/09/10LHNAVADV01121 RELIANCE MUTUAL FUND
62,896 1,490,535 4.22% 0.10%
Life Highest NAV Advantage Fund 2
ULIF05901/06/11LHNAVADV02121 RELIANCE MUTUAL FUND
8,449 201,888 4.18% 0.01%
Make in India Fund ULIF06924/03/15LMAKEINDIA121 RELIANCE MUTUAL FUND
7,281 3,346,423 0.22% 0.01%
Company-wise details of investment held in the promoter group along with its % to assets under management as on 31st March, 2018
(`’000)
Fund Name SFIN Company Name Market Value AUM % of
AUM
% of Total AUM
Health Equity Fund 1 ULIF01201/02/08HEQUITYF01121 RELIANCE COMMUNICATION LTD
227 273,361 0.08% 0.00%
Life Equity Fund 1 ULIF00328/07/04LEQUITYF01121 RELIANCE COMMUNICATION LTD
7,231 1,546,274 0.47% 0.01%
Life Equity Fund 2 ULIF02510/06/08LEQUITYF02121 RELIANCE COMMUNICATION LTD
44,384 8,598,222 0.52% 0.06%
Life Equity Fund 3 ULIF04201/01/10LEQUITYF03121 RELIANCE COMMUNICATION LTD
17,511 15,195,641 0.12% 0.02%
Life Highest NAV Advantage Fund 1
ULIF05803/09/10LHNAVADV01121 RELIANCE MUTUAL FUND
66,894 1,624,506 4.12% 0.09%
Life Highest NAV Advantage Fund 2
ULIF05901/06/11LHNAVADV02121 RELIANCE MUTUAL FUND
7,120 219,014 3.25% 0.01%
Pension Equity Fund 1 ULIF00601/11/06PEQUITYF01121 RELIANCE COMMUNICATION LTD
4,858 638,596 0.76% 0.01%
Pension Equity Fund 2 ULIF03204/12/08PEQUITYF02121 RELIANCE COMMUNICATION LTD
4,822 1,142,812 0.42% 0.01%
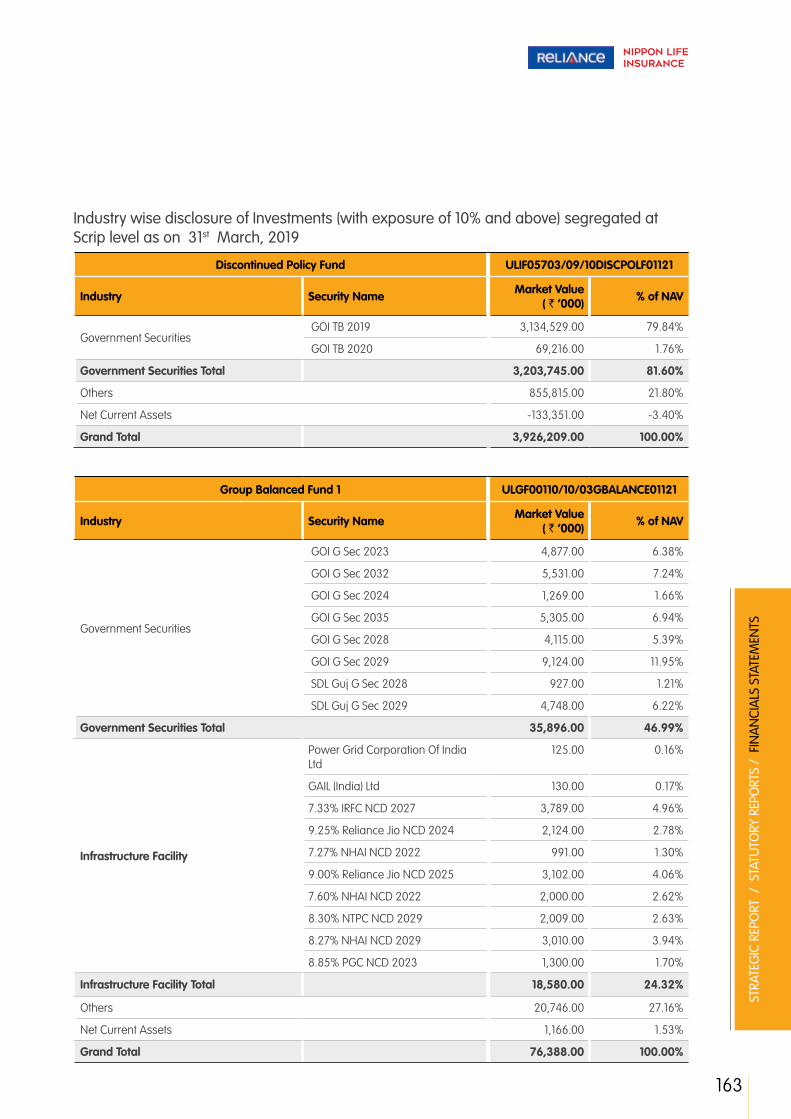
163
STRA
TEG
IC R
EPO
RT /
STA
TUTO
RY R
EPO
RTS
/ F
INA
NCI
ALS
STA
TEM
ENTS
Industry wise disclosure of Investments (with exposure of 10% and above) segregated at Scrip level as on 31st March, 2019
Discontinued Policy Fund ULIF05703/09/10DISCPOLF01121
Industry Security Name Market Value ( ` ‘000) % of NAV
Government Securities GOI TB 2019 3,134,529.00 79.84%
GOI TB 2020 69,216.00 1.76%
Government Securities Total 3,203,745.00 81.60%
Others 855,815.00 21.80%
Net Current Assets -133,351.00 -3.40%
Grand Total 3,926,209.00 100.00%
Group Balanced Fund 1 ULGF00110/10/03GBALANCE01121
Industry Security Name Market Value ( ` ‘000) % of NAV
Government Securities
GOI G Sec 2023 4,877.00 6.38%
GOI G Sec 2032 5,531.00 7.24%
GOI G Sec 2024 1,269.00 1.66%
GOI G Sec 2035 5,305.00 6.94%
GOI G Sec 2028 4,115.00 5.39%
GOI G Sec 2029 9,124.00 11.95%
SDL Guj G Sec 2028 927.00 1.21%
SDL Guj G Sec 2029 4,748.00 6.22%
Government Securities Total 35,896.00 46.99%
Infrastructure Facility
Power Grid Corporation Of India Ltd
125.00 0.16%
GAIL (India) Ltd 130.00 0.17%
7.33% IRFC NCD 2027 3,789.00 4.96%
9.25% Reliance Jio NCD 2024 2,124.00 2.78%
7.27% NHAI NCD 2022 991.00 1.30%
9.00% Reliance Jio NCD 2025 3,102.00 4.06%
7.60% NHAI NCD 2022 2,000.00 2.62%
8.30% NTPC NCD 2029 2,009.00 2.63%
8.27% NHAI NCD 2029 3,010.00 3.94%
8.85% PGC NCD 2023 1,300.00 1.70%
Infrastructure Facility Total 18,580.00 24.32%
Others 20,746.00 27.16%
Net Current Assets 1,166.00 1.53%
Grand Total 76,388.00 100.00%

164
Annual Report 2018-19
Appendix 5
ACCOUNTING RATIO contd...
Group Balanced Fund 2 ULGF00210/10/03GBALANCE02121
Industry Security Name Market Value ( ` ‘000) % of NAV
Government Securities
GOI G Sec 2023 5,192.00 4.89%
GOI G Sec 2032 7,854.00 7.39%
GOI G Sec 2024 1,797.00 1.69%
GOI G Sec 2035 7,542.00 7.10%
GOI G Sec 2028 5,800.00 5.46%
GOI G Sec 2029 12,960.00 12.20%
SDL Guj G Sec 2028 1,197.00 1.13%
SDL Guj G Sec 2029 6,843.00 6.44%
Government Securities Total 49,185.00 46.30%
Infrastructure Facility
Power Grid Corporation Of India Ltd
187.00 0.18%
GAIL (India) Ltd 201.00 0.19%
7.93% PGC NCD 2028 981.00 0.92%
7.33% IRFC NCD 2027 2,841.00 2.67%
9.25% Reliance Jio NCD 2024 4,247.00 4.00%
7.27% NHAI NCD 2022 991.00 0.93%
8.40% PGC NCD 2022 4,085.00 3.85%
9.00% Reliance Jio NCD 2025 2,068.00 1.95%
7.60% NHAI NCD 2022 1,000.00 0.94%
8.45% IRFC NCD 2028 3,044.00 2.87%
8.30% NTPC NCD 2029 2,009.00 1.89%
8.27% NHAI NCD 2029 7,023.00 6.61%
8.85% PGC NCD 2023 3,900.00 3.67%
Infrastructure Facility Total 32,577.00 30.67%
Others 23,102.00 21.74%
Net Current Assets 1,366.00 1.29%
Grand Total 106,230.00 100.00%
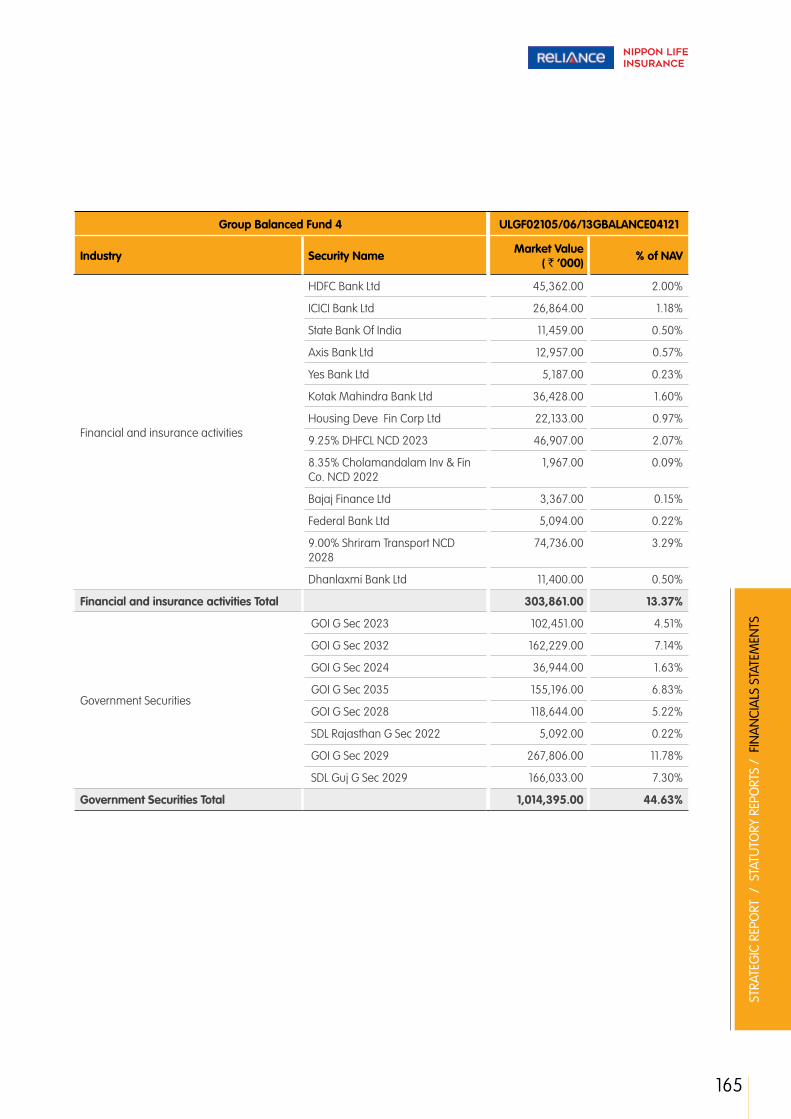
165
STRA
TEG
IC R
EPO
RT /
STA
TUTO
RY R
EPO
RTS
/ F
INA
NCI
ALS
STA
TEM
ENTS
Group Balanced Fund 4 ULGF02105/06/13GBALANCE04121
Industry Security Name Market Value ( ` ‘000) % of NAV
Financial and insurance activities
HDFC Bank Ltd 45,362.00 2.00%
ICICI Bank Ltd 26,864.00 1.18%
State Bank Of India 11,459.00 0.50%
Axis Bank Ltd 12,957.00 0.57%
Yes Bank Ltd 5,187.00 0.23%
Kotak Mahindra Bank Ltd 36,428.00 1.60%
Housing Deve Fin Corp Ltd 22,133.00 0.97%
9.25% DHFCL NCD 2023 46,907.00 2.07%
8.35% Cholamandalam Inv & Fin Co. NCD 2022
1,967.00 0.09%
Bajaj Finance Ltd 3,367.00 0.15%
Federal Bank Ltd 5,094.00 0.22%
9.00% Shriram Transport NCD 2028
74,736.00 3.29%
Dhanlaxmi Bank Ltd 11,400.00 0.50%
Financial and insurance activities Total 303,861.00 13.37%
Government Securities
GOI G Sec 2023 102,451.00 4.51%
GOI G Sec 2032 162,229.00 7.14%
GOI G Sec 2024 36,944.00 1.63%
GOI G Sec 2035 155,196.00 6.83%
GOI G Sec 2028 118,644.00 5.22%
SDL Rajasthan G Sec 2022 5,092.00 0.22%
GOI G Sec 2029 267,806.00 11.78%
SDL Guj G Sec 2029 166,033.00 7.30%
Government Securities Total 1,014,395.00 44.63%
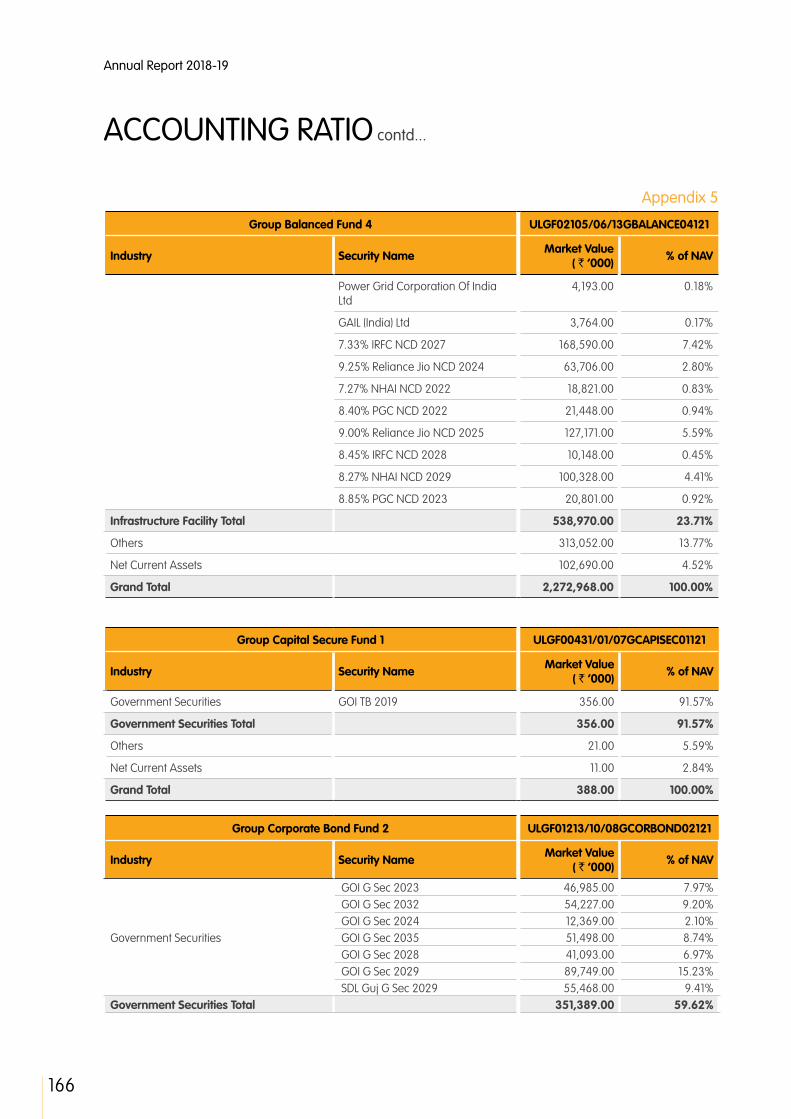
166
Annual Report 2018-19
Appendix 5
ACCOUNTING RATIO contd...
Group Balanced Fund 4 ULGF02105/06/13GBALANCE04121
Industry Security Name Market Value ( ` ‘000) % of NAV
Power Grid Corporation Of India Ltd
4,193.00 0.18%
GAIL (India) Ltd 3,764.00 0.17%
7.33% IRFC NCD 2027 168,590.00 7.42%
9.25% Reliance Jio NCD 2024 63,706.00 2.80%
7.27% NHAI NCD 2022 18,821.00 0.83%
8.40% PGC NCD 2022 21,448.00 0.94%
9.00% Reliance Jio NCD 2025 127,171.00 5.59%
8.45% IRFC NCD 2028 10,148.00 0.45%
8.27% NHAI NCD 2029 100,328.00 4.41%
8.85% PGC NCD 2023 20,801.00 0.92%
Infrastructure Facility Total 538,970.00 23.71%
Others 313,052.00 13.77%
Net Current Assets 102,690.00 4.52%
Grand Total 2,272,968.00 100.00%
Group Capital Secure Fund 1 ULGF00431/01/07GCAPISEC01121
Industry Security Name Market Value ( ` ‘000) % of NAV
Government Securities GOI TB 2019 356.00 91.57%
Government Securities Total 356.00 91.57%
Others 21.00 5.59%
Net Current Assets 11.00 2.84%
Grand Total 388.00 100.00%
Group Corporate Bond Fund 2 ULGF01213/10/08GCORBOND02121
Industry Security Name Market Value ( ` ‘000) % of NAV
Government Securities
GOI G Sec 2023 46,985.00 7.97% GOI G Sec 2032 54,227.00 9.20% GOI G Sec 2024 12,369.00 2.10% GOI G Sec 2035 51,498.00 8.74% GOI G Sec 2028 41,093.00 6.97% GOI G Sec 2029 89,749.00 15.23% SDL Guj G Sec 2029 55,468.00 9.41%
Government Securities Total 351,389.00 59.62%

167
STRA
TEG
IC R
EPO
RT /
STA
TUTO
RY R
EPO
RTS
/ F
INA
NCI
ALS
STA
TEM
ENTS
Group Corporate Bond Fund 2 ULGF01213/10/08GCORBOND02121
Industry Security Name Market Value ( ` ‘000) % of NAV
9.35% PGC NCD 2022 1,050.00 0.18%8.80% PGC NCD 2023 10,344.00 1.76%7.33% IRFC NCD 2027 19,890.00 3.38%7.27% NHAI NCD 2022 41,604.00 7.06%7.60% NHAI NCD 2022 1,000.00 0.17%8.45% IRFC NCD 2028 3,044.00 0.52%8.30% NTPC NCD 2029 50,235.00 8.52%8.27% NHAI NCD 2029 7,023.00 1.19%8.35% IRFC NCD 2029 25,239.00 4.28%
Infrastructure Facility Total 159,429.00 27.06%Others 70,055.00 11.89%Net Current Assets 8,400.00 1.43%Grand Total 589,273.00 100.00%
Group Corporate Bond Fund 3 ULGF02305/06/13GCORBOND03121
Industry Security Name Market Value ( ` ‘000) % of NAV
Government Securities GOI G Sec 2023 169,483.00 7.49%
GOI G Sec 2032 175,675.00 7.77%
GOI G Sec 2024 40,173.00 1.78%
GOI G Sec 2035 166,638.00 7.37%
GOI G Sec 2028 129,990.00 5.75%
GOI G Sec 2029 290,656.00 12.85%
SDL Guj G Sec 2029 180,197.00 7.97%
Government Securities Total 1,152,812.00 50.98%Government Securities 8.80% PGC NCD 2023 25,861.00 1.14%
7.33% IRFC NCD 2027 25,573.00 1.13%
9.25% Reliance Jio NCD 2024 37,162.00 1.64%
7.27% NHAI NCD 2022 34,670.00 1.53%
9.00% Reliance Jio NCD 2025 115,798.00 5.12%
8.45% IRFC NCD 2028 3,044.00 0.14%
8.30% NTPC NCD 2029 154,725.00 6.84%
8.27% NHAI NCD 2029 110,361.00 4.88%
8.35% IRFC NCD 2029 72,689.00 3.21%
8.40% IRFC NCD 2029 12,145.00 0.54%
Infrastructure Facility Total 592,028.00 26.17%
Others 156,561.00 6.92%
Net Current Assets 360,162.00 15.93%
Grand Total 2,261,563.00 100.00%
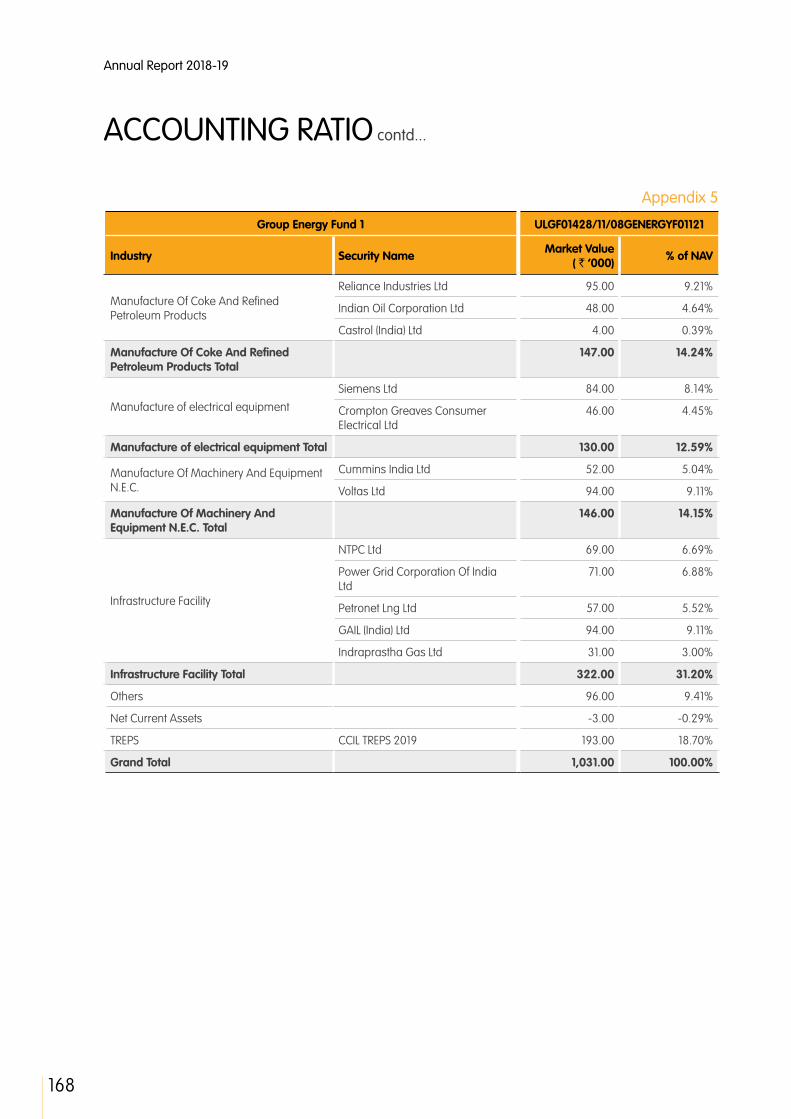
168
Annual Report 2018-19
Appendix 5
ACCOUNTING RATIO contd...
Group Energy Fund 1 ULGF01428/11/08GENERGYF01121
Industry Security Name Market Value ( ` ‘000) % of NAV
Manufacture Of Coke And Refined Petroleum Products
Reliance Industries Ltd 95.00 9.21%
Indian Oil Corporation Ltd 48.00 4.64%
Castrol (India) Ltd 4.00 0.39%
Manufacture Of Coke And Refined Petroleum Products Total
147.00 14.24%
Manufacture of electrical equipment
Siemens Ltd 84.00 8.14%
Crompton Greaves Consumer Electrical Ltd
46.00 4.45%
Manufacture of electrical equipment Total 130.00 12.59%
Manufacture Of Machinery And Equipment N.E.C.
Cummins India Ltd 52.00 5.04%
Voltas Ltd 94.00 9.11%
Manufacture Of Machinery And Equipment N.E.C. Total
146.00 14.15%
Infrastructure Facility
NTPC Ltd 69.00 6.69%
Power Grid Corporation Of India Ltd
71.00 6.88%
Petronet Lng Ltd 57.00 5.52%
GAIL (India) Ltd 94.00 9.11%
Indraprastha Gas Ltd 31.00 3.00%
Infrastructure Facility Total 322.00 31.20%
Others 96.00 9.41%
Net Current Assets -3.00 -0.29%
TREPS CCIL TREPS 2019 193.00 18.70%
Grand Total 1,031.00 100.00%

169
STRA
TEG
IC R
EPO
RT /
STA
TUTO
RY R
EPO
RTS
/ F
INA
NCI
ALS
STA
TEM
ENTS
Group Equity Fund 3 ULGF01808/06/09GEQUITYF03121
Industry Security Name Market Value ( ` ‘000) % of NAV
Computer programming, consultancy and related activities
Infosys Ltd 13,508.00 5.92%
Tata Consultancy Services Ltd 9,899.00 4.33%
HCL Technologies Ltd 3,465.00 1.52%
Tech Mahindra Ltd 928.00 0.41%
Computer programming, consultancy and related activities Total
27,800.00 12.18%
Financial and insurance activities
HDFC Bank Ltd 16,351.00 7.17%
ICICI Bank Ltd 12,798.00 5.61%
State Bank Of India 2,511.00 1.10%
Axis Bank Ltd 6,834.00 2.99%
Yes Bank Ltd 2,016.00 0.88%
Kotak Mahindra Bank Ltd 7,970.00 3.49%
Housing Deve Fin Corp Ltd 1,344.00 0.59%
Bajaj Finance Ltd 1,016.00 0.44%
Indiabulls Housing Finance Ltd 2,037.00 0.89%
Federal Bank Ltd 1,878.00 0.82%
Financial and insurance activities Total 54,755.00 23.98%
Manufacture Of Coke And Refined Petroleum Products
Reliance Industries Ltd 21,076.00 9.23%
Hindustan Petroleum Corporation Ltd
957.00 0.42%
Bharat Petroleum Corporation Ltd 1,028.00 0.45%
Manufacture Of Coke And Refined Petroleum Products Total
23,061.00 10.10%
Others 120,890.00 52.94%
Net Current Assets 1,818.00 0.80%
Grand Total 228,324.00 100.00%
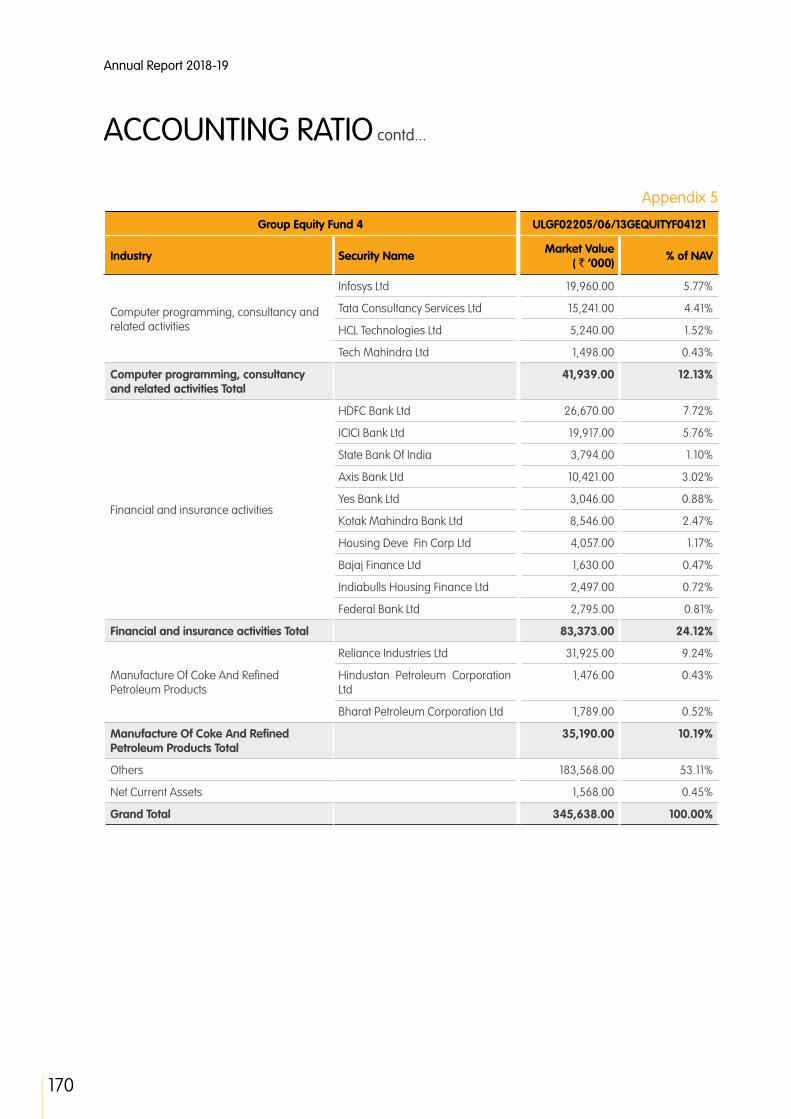
170
Annual Report 2018-19
Appendix 5
ACCOUNTING RATIO contd...
Group Equity Fund 4 ULGF02205/06/13GEQUITYF04121
Industry Security Name Market Value ( ` ‘000) % of NAV
Computer programming, consultancy and related activities
Infosys Ltd 19,960.00 5.77%
Tata Consultancy Services Ltd 15,241.00 4.41%
HCL Technologies Ltd 5,240.00 1.52%
Tech Mahindra Ltd 1,498.00 0.43%
Computer programming, consultancy and related activities Total
41,939.00 12.13%
Financial and insurance activities
HDFC Bank Ltd 26,670.00 7.72%
ICICI Bank Ltd 19,917.00 5.76%
State Bank Of India 3,794.00 1.10%
Axis Bank Ltd 10,421.00 3.02%
Yes Bank Ltd 3,046.00 0.88%
Kotak Mahindra Bank Ltd 8,546.00 2.47%
Housing Deve Fin Corp Ltd 4,057.00 1.17%
Bajaj Finance Ltd 1,630.00 0.47%
Indiabulls Housing Finance Ltd 2,497.00 0.72%
Federal Bank Ltd 2,795.00 0.81%
Financial and insurance activities Total 83,373.00 24.12%
Manufacture Of Coke And Refined Petroleum Products
Reliance Industries Ltd 31,925.00 9.24%
Hindustan Petroleum Corporation Ltd
1,476.00 0.43%
Bharat Petroleum Corporation Ltd 1,789.00 0.52%
Manufacture Of Coke And Refined Petroleum Products Total
35,190.00 10.19%
Others 183,568.00 53.11%
Net Current Assets 1,568.00 0.45%
Grand Total 345,638.00 100.00%
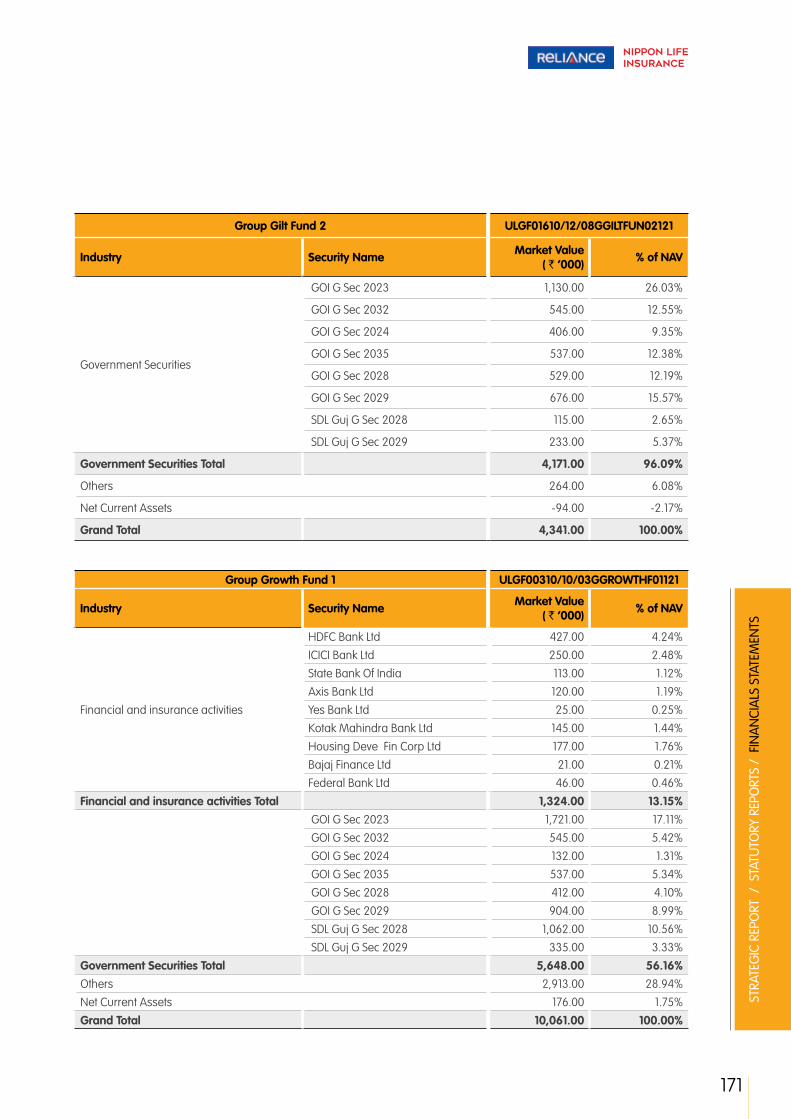
171
STRA
TEG
IC R
EPO
RT /
STA
TUTO
RY R
EPO
RTS
/ F
INA
NCI
ALS
STA
TEM
ENTS
Group Gilt Fund 2 ULGF01610/12/08GGILTFUN02121
Industry Security Name Market Value ( ` ‘000) % of NAV
Government Securities
GOI G Sec 2023 1,130.00 26.03%
GOI G Sec 2032 545.00 12.55%
GOI G Sec 2024 406.00 9.35%
GOI G Sec 2035 537.00 12.38%
GOI G Sec 2028 529.00 12.19%
GOI G Sec 2029 676.00 15.57%
SDL Guj G Sec 2028 115.00 2.65%
SDL Guj G Sec 2029 233.00 5.37%
Government Securities Total 4,171.00 96.09%
Others 264.00 6.08%
Net Current Assets -94.00 -2.17%
Grand Total 4,341.00 100.00%
Group Growth Fund 1 ULGF00310/10/03GGROWTHF01121
Industry Security Name Market Value ( ` ‘000) % of NAV
Financial and insurance activities
HDFC Bank Ltd 427.00 4.24%
ICICI Bank Ltd 250.00 2.48%
State Bank Of India 113.00 1.12%
Axis Bank Ltd 120.00 1.19%
Yes Bank Ltd 25.00 0.25%
Kotak Mahindra Bank Ltd 145.00 1.44%
Housing Deve Fin Corp Ltd 177.00 1.76%
Bajaj Finance Ltd 21.00 0.21%
Federal Bank Ltd 46.00 0.46%
Financial and insurance activities Total 1,324.00 13.15% GOI G Sec 2023 1,721.00 17.11%
GOI G Sec 2032 545.00 5.42%
GOI G Sec 2024 132.00 1.31%
GOI G Sec 2035 537.00 5.34%
GOI G Sec 2028 412.00 4.10%
GOI G Sec 2029 904.00 8.99%
SDL Guj G Sec 2028 1,062.00 10.56%
SDL Guj G Sec 2029 335.00 3.33%
Government Securities Total 5,648.00 56.16%Others 2,913.00 28.94%
Net Current Assets 176.00 1.75%
Grand Total 10,061.00 100.00%

172
Annual Report 2018-19
Appendix 5
ACCOUNTING RATIO contd...
Group Infrastructure Fund 1 ULGF01908/06/09GINFRASF01121
Industry Security Name Market Value ( ` ‘000) % of NAV
Computer programming, consultancy and related activities
Infosys Ltd 155.00 6.71%
Tata Consultancy Services Ltd 124.00 5.37%
HCL Technologies Ltd 14.00 0.61%
Tech Mahindra Ltd 12.00 0.52%
Computer programming, consultancy and related activities Total
305.00 13.21%
Infrastructure Facility
NTPC Ltd 156.00 6.80%
Power Grid Corporation Of India Ltd
111.00 4.84%
GAIL (India) Ltd 95.00 4.11%
Adani Ports & Special Eco-nomic Zone Ltd
67.00 2.90%
Indraprastha Gas Ltd 18.00 0.78%
Infrastructure Facility Total 447.00 19.43%
Manufacture Of Basic Metals
Tata Steel Ltd 109.00 4.72%
Hindustan Zinc Ltd 20.00 0.87%
JSW Steel Ltd 83.00 3.59%
Hindalco Industries Ltd 89.00 3.85%
Manufacture Of Basic Metals Total 301.00 13.03%
Others 885.00 38.22%
Net Current Assets 5.00 0.22%
TREPS CCIL TREPS 2019 367.00 15.89%
Grand Total 2,310.00 100.00%
Group Midcap Fund 1 ULGF02008/06/09GMIDCAPF01121
Industry Security Name Market Value ( ` ‘000) % of NAV
Financial and insurance activities
Yes Bank Ltd 37.00 1.31%
Cholamandalam Invest-ment & Fin Co. Ltd
68.00 2.41%
RBL Bank Ltd 215.00 7.62%
Federal Bank Ltd 227.00 8.04%
Dhanlaxmi Bank Ltd 35.00 1.24%
Mahindra & Mahindra Fi-nancial Serv Ltd
84.00 2.98%
Financial and insurance activities Total 666.00 23.60%

173
STRA
TEG
IC R
EPO
RT /
STA
TUTO
RY R
EPO
RTS
/ F
INA
NCI
ALS
STA
TEM
ENTS
Group Midcap Fund 1 ULGF02008/06/09GMIDCAPF01121
Industry Security Name Market Value ( ` ‘000) % of NAV
Manufacture Of Pharmaceuticals, Medicinal Chemical And Botanical Products
Aurobindo Pharma Ltd 68.00 2.41%
Divi's Laboratories Ltd 153.00 5.42%
Torrent Pharmaceuticals Ltd 68.00 2.41%
Manufacture Of Pharmaceuticals, Medicinal Chemical And Botanical Products Total
289.00 10.24%
Others 1,351.00 47.94%
Net Current Assets 89.00 3.15%
TREPS CCIL TREPS 2019 425.00 15.07%
Grand Total 2,820.00 100.00%
Group Money Market Fund 2 ULGF00930/09/08GMONMRKT02121
Industry Security Name Market Value ( ` ‘000) % of NAV
Government Securities 199,755.00 88.83%
Government Securities Total 199,755.00 88.83%
Others 24,305.00 10.81%
Net Current Assets 816.00 0.36%
Grand Total 224,876.00 100.00%
Group Pure Equity Fund 1 ULGF01528/11/08GPUREEQF01121
Industry Security Name Market Value ( ` ‘000) % of NAV
Computer programming, consultancy and related activities
HCL Technologies Ltd 321.00 7.26%
Tech Mahindra Ltd 272.00 6.15%
Computer programming, consultancy and related activities Total
593.00 13.41%
Manufacture Of Chemicals And Chemical Products
Asian Paints Ltd 240.00 5.43%
Hindustan Unilever Ltd 357.00 8.06%
Manufacture Of Chemicals And Chemical Products Total
597.00 13.49%
Manufacture Of Food Products
Glaxosmithkline Consumer Healthcare Ltd
268.00 6.06%
Nestle India Ltd 153.00 3.46%
Britannia Industries Ltd 189.00 4.27%
Manufacture Of Food Products Total 610.00 13.79%
Others 2,616.00 59.17%
Net Current Assets 6.00 0.14%
Grand Total 4,422.00 100.00%
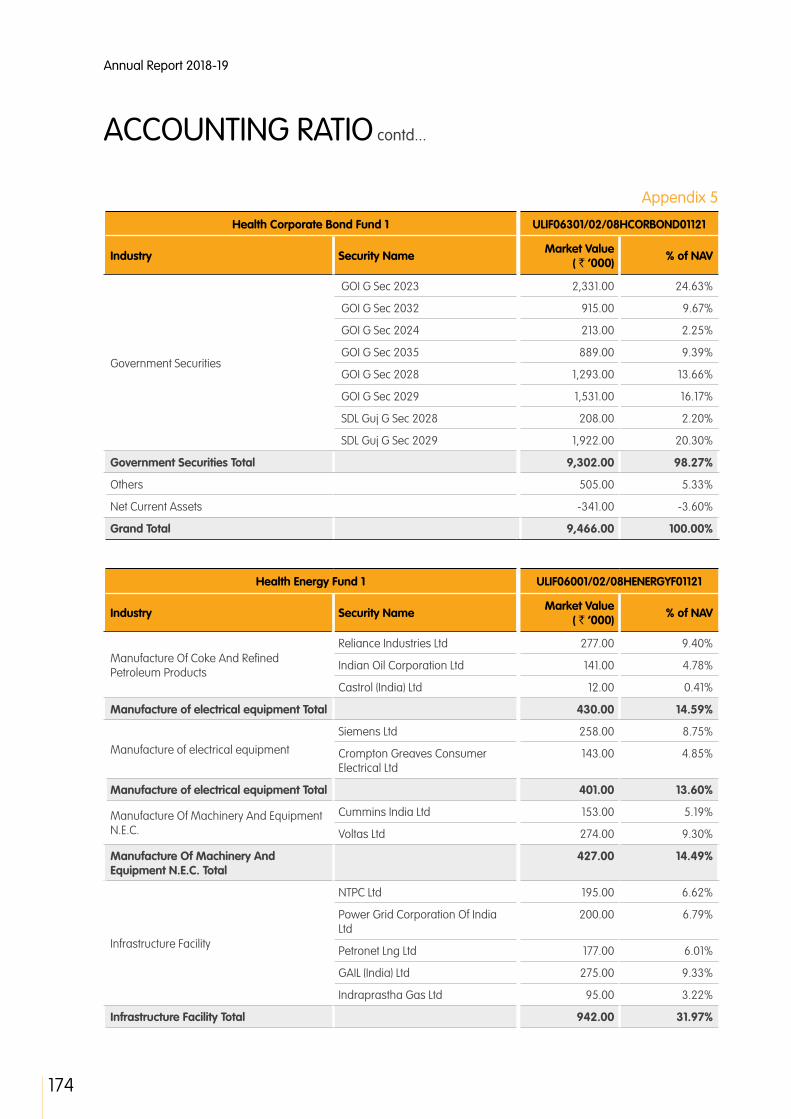
174
Annual Report 2018-19
Appendix 5
ACCOUNTING RATIO contd...
Health Corporate Bond Fund 1 ULIF06301/02/08HCORBOND01121
Industry Security Name Market Value ( ` ‘000) % of NAV
Government Securities
GOI G Sec 2023 2,331.00 24.63%
GOI G Sec 2032 915.00 9.67%
GOI G Sec 2024 213.00 2.25%
GOI G Sec 2035 889.00 9.39%
GOI G Sec 2028 1,293.00 13.66%
GOI G Sec 2029 1,531.00 16.17%
SDL Guj G Sec 2028 208.00 2.20%
SDL Guj G Sec 2029 1,922.00 20.30%
Government Securities Total 9,302.00 98.27%
Others 505.00 5.33%
Net Current Assets -341.00 -3.60%
Grand Total 9,466.00 100.00%
Health Energy Fund 1 ULIF06001/02/08HENERGYF01121
Industry Security Name Market Value ( ` ‘000) % of NAV
Manufacture Of Coke And Refined Petroleum Products
Reliance Industries Ltd 277.00 9.40%
Indian Oil Corporation Ltd 141.00 4.78%
Castrol (India) Ltd 12.00 0.41%
Manufacture of electrical equipment Total 430.00 14.59%
Manufacture of electrical equipment
Siemens Ltd 258.00 8.75%
Crompton Greaves Consumer Electrical Ltd
143.00 4.85%
Manufacture of electrical equipment Total 401.00 13.60%
Manufacture Of Machinery And Equipment N.E.C.
Cummins India Ltd 153.00 5.19%
Voltas Ltd 274.00 9.30%
Manufacture Of Machinery And Equipment N.E.C. Total
427.00 14.49%
Infrastructure Facility
NTPC Ltd 195.00 6.62%
Power Grid Corporation Of India Ltd
200.00 6.79%
Petronet Lng Ltd 177.00 6.01%
GAIL (India) Ltd 275.00 9.33%
Indraprastha Gas Ltd 95.00 3.22%
Infrastructure Facility Total 942.00 31.97%

175
STRA
TEG
IC R
EPO
RT /
STA
TUTO
RY R
EPO
RTS
/ F
INA
NCI
ALS
STA
TEM
ENTS
Health Energy Fund 1 ULIF06001/02/08HENERGYF01121
Industry Security Name Market Value ( ` ‘000) % of NAV
Others 284.00 9.57%
Net Current Assets -94.00 -3.19%
TREPS CCIL TREPS 2019 559.00 18.97%
Grand Total 2,949.00 100.00%
Health Equity Fund 1 ULIF01201/02/08HEQUITYF01121
Industry Security Name Market Value ( ` ‘000) % of NAV
Computer programming, consultancy and related activities
Infosys Ltd 8,451.00 6.24%
Tata Consultancy Services Ltd 6,467.00 4.78%
HCL Technologies Ltd 2,412.00 1.78%
Tech Mahindra Ltd 565.00 0.42%
Computer programming, consultancy and related activities Total
17,895.00 13.22%
Financial and insurance activities
HDFC Bank Ltd 11,648.00 8.60%
ICICI Bank Ltd 9,004.00 6.65%
State Bank Of India 1,031.00 0.76%
Axis Bank Ltd 3,526.00 2.60%
Yes Bank Ltd 1,287.00 0.95%
Kotak Mahindra Bank Ltd 3,334.00 2.46%
Bajaj Finance Ltd 944.00 0.70%
Indiabulls Housing Finance Ltd 1,141.00 0.84%
Federal Bank Ltd 971.00 0.72%
Financial and insurance activities Total 32,886.00 24.28%
Manufacture Of Coke And Refined Petroleum Products
Reliance Industries Ltd 12,479.00 9.22%
Hindustan Petroleum Corporation Ltd
999.00 0.74%
Bharat Petroleum Corporation Ltd 984.00 0.73%
Manufacture Of Coke And Refined Petroleum Products Total
14,462.00 10.69%
Others 68,456.00 50.56%
Net Current Assets 1,693.00 1.25%
Grand Total 135,392.00 100.00%

176
Annual Report 2018-19
Appendix 5
ACCOUNTING RATIO contd...
Health Equity Fund 2 ULIF05411/01/10HEQUITYF02121
Industry Security Name Market Value ( ` ‘000) % of NAV
Computer programming, consultancy and related activities
Infosys Ltd 2,256.00 5.80%
Tata Consultancy Services Ltd 1,719.00 4.42%
HCL Technologies Ltd 590.00 1.52%
Tech Mahindra Ltd 158.00 0.41%
Computer programming, consultancy and related activities Total
4,723.00 12.15%
Financial and insurance activities
HDFC Bank Ltd 3,073.00 7.90%
ICICI Bank Ltd 2,262.00 5.80%
State Bank Of India 428.00 1.10%
Axis Bank Ltd 1,100.00 2.83%
Yes Bank Ltd 344.00 0.88%
Kotak Mahindra Bank Ltd 996.00 2.56%
Housing Deve Fin Corp Ltd 407.00 1.05%
Bajaj Finance Ltd 178.00 0.46%
Indiabulls Housing Finance Ltd 253.00 0.65%
Federal Bank Ltd 303.00 0.78%
Financial and insurance activities Total 9,344.00 24.01%
Manufacture Of Coke And Refined Petroleum Products
Reliance Industries Ltd 3,580.00 9.20%
Hindustan Petroleum Corporation Ltd
168.00 0.43%
Bharat Petroleum Corporation Ltd 177.00 0.45%
Manufacture Of Coke And Refined Petroleum Products Total
3,925.00 10.08%
Others 20,724.00 53.25%
Net Current Assets 197.00 0.51%
Grand Total 38,913.00 100.00%

177
STRA
TEG
IC R
EPO
RT /
STA
TUTO
RY R
EPO
RTS
/ F
INA
NCI
ALS
STA
TEM
ENTS
Health Gilt Fund 1 ULIF01301/02/08HGILTFUN01121
Industry Security Name Market Value ( ` ‘000) % of NAV
Government Securities
GOI G Sec 2023 1,578.00 25.75%
GOI G Sec 2032 792.00 12.92%
GOI G Sec 2024 589.00 9.61%
GOI G Sec 2035 830.00 13.54%
GOI G Sec 2028 754.00 12.30%
GOI G Sec 2029 1,004.00 16.38%
SDL Guj G Sec 2028 135.00 2.20%
SDL Guj G Sec 2029 426.00 6.95%
Government Securities Total 6,108.00 99.65%
Others 339.00 5.50%
Net Current Assets -316.00 -5.15%
Grand Total 6,131.00 100.00%
Health Growth Plus Fund 1 ULIF01401/02/08HGRWTPLS01121
Industry Security Name Market Value ( ` ‘000) % of NAV
Financial and insurance activities
HDFC Bank Ltd 1,243.00 5.22%
ICICI Bank Ltd 816.00 3.42%
State Bank Of India 382.00 1.60%
Axis Bank Ltd 316.00 1.33%
Yes Bank Ltd 168.00 0.70%
Kotak Mahindra Bank Ltd 506.00 2.12%
Housing Deve Fin Corp Ltd 677.00 2.84%
Bajaj Finance Ltd 109.00 0.46%
Federal Bank Ltd 156.00 0.65%
Financial and insurance activities Total 4,373.00 18.34%
Government Securities
GOI G Sec 2023 1,079.00 4.53%
GOI G Sec 2032 1,172.00 4.92%
GOI G Sec 2024 274.00 1.15%
GOI G Sec 2035 1,114.00 4.67%
GOI G Sec 2028 872.00 3.66%
GOI G Sec 2029 1,948.00 8.17%
SDL Guj G Sec 2028 219.00 0.92%
SDL Guj G Sec 2029 771.00 3.23%
Government Securities Total 7,449.00 31.25%
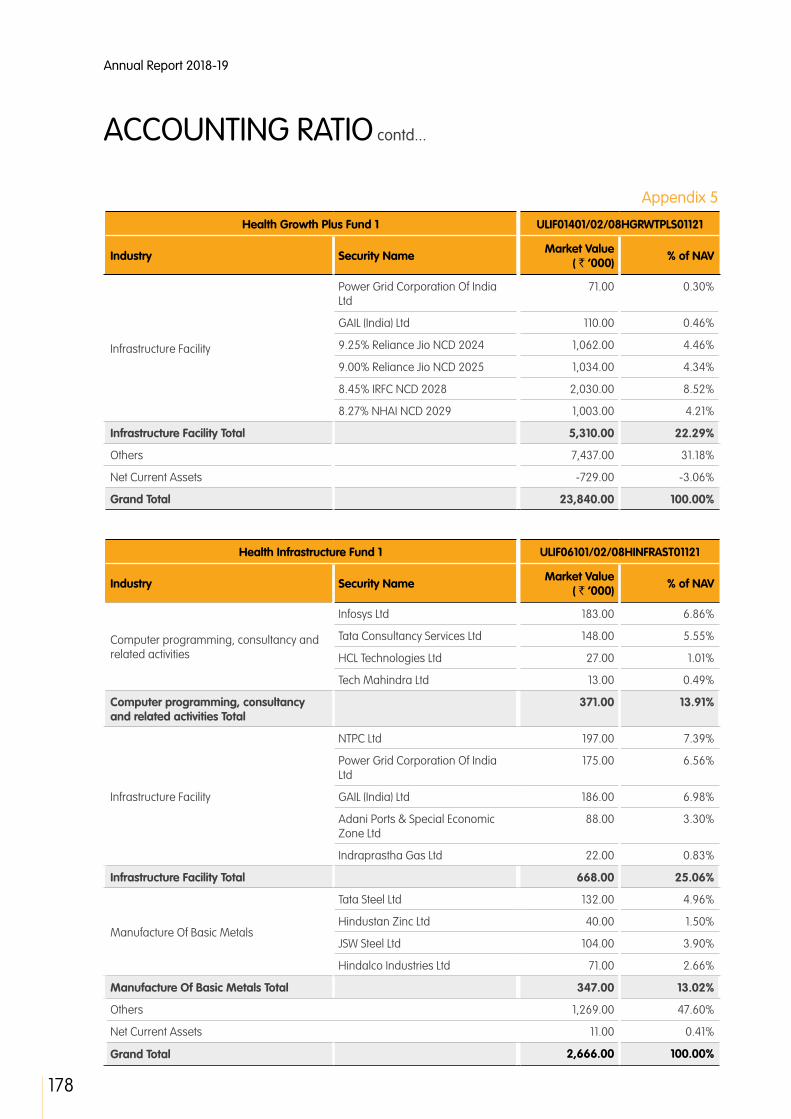
178
Annual Report 2018-19
Appendix 5
ACCOUNTING RATIO contd...
Health Growth Plus Fund 1 ULIF01401/02/08HGRWTPLS01121
Industry Security Name Market Value ( ` ‘000) % of NAV
Infrastructure Facility
Power Grid Corporation Of India Ltd
71.00 0.30%
GAIL (India) Ltd 110.00 0.46%
9.25% Reliance Jio NCD 2024 1,062.00 4.46%
9.00% Reliance Jio NCD 2025 1,034.00 4.34%
8.45% IRFC NCD 2028 2,030.00 8.52%
8.27% NHAI NCD 2029 1,003.00 4.21%
Infrastructure Facility Total 5,310.00 22.29%
Others 7,437.00 31.18%
Net Current Assets -729.00 -3.06%
Grand Total 23,840.00 100.00%
Health Infrastructure Fund 1 ULIF06101/02/08HINFRAST01121
Industry Security Name Market Value ( ` ‘000) % of NAV
Computer programming, consultancy and related activities
Infosys Ltd 183.00 6.86%
Tata Consultancy Services Ltd 148.00 5.55%
HCL Technologies Ltd 27.00 1.01%
Tech Mahindra Ltd 13.00 0.49%
Computer programming, consultancy and related activities Total
371.00 13.91%
Infrastructure Facility
NTPC Ltd 197.00 7.39%
Power Grid Corporation Of India Ltd
175.00 6.56%
GAIL (India) Ltd 186.00 6.98%
Adani Ports & Special Economic Zone Ltd
88.00 3.30%
Indraprastha Gas Ltd 22.00 0.83%
Infrastructure Facility Total 668.00 25.06%
Manufacture Of Basic Metals
Tata Steel Ltd 132.00 4.96%
Hindustan Zinc Ltd 40.00 1.50%
JSW Steel Ltd 104.00 3.90%
Hindalco Industries Ltd 71.00 2.66%
Manufacture Of Basic Metals Total 347.00 13.02%
Others 1,269.00 47.60%
Net Current Assets 11.00 0.41%
Grand Total 2,666.00 100.00%
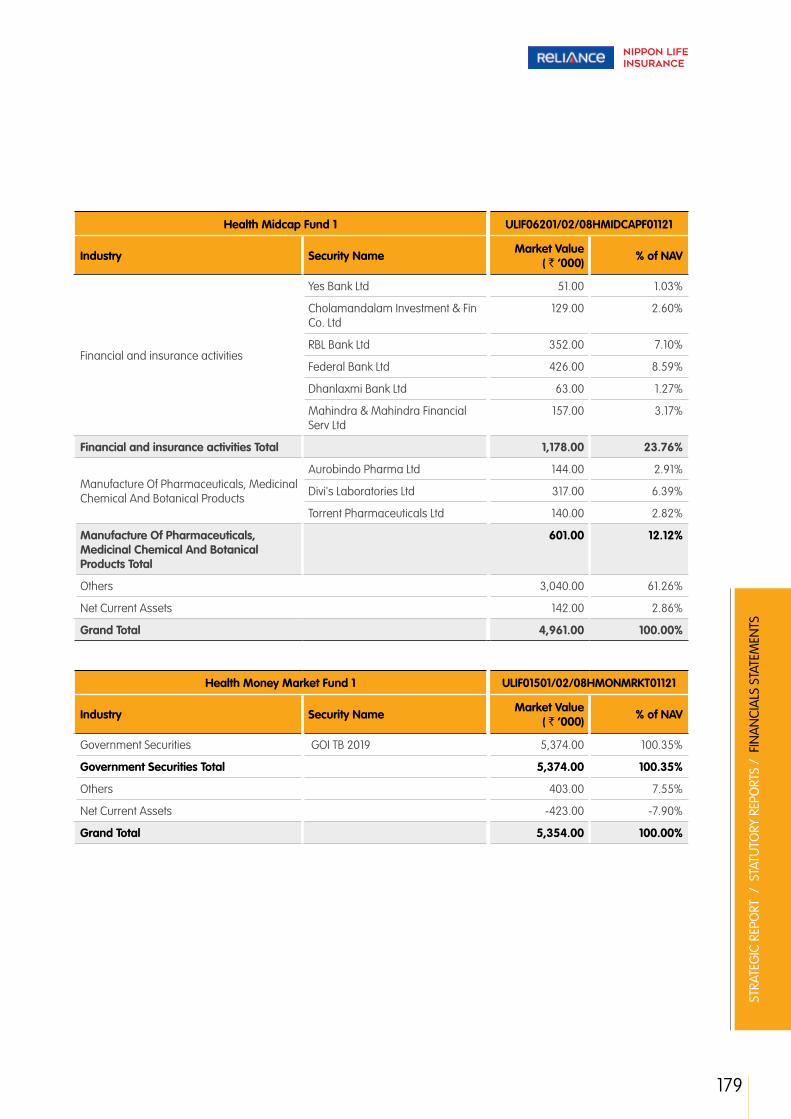
179
STRA
TEG
IC R
EPO
RT /
STA
TUTO
RY R
EPO
RTS
/ F
INA
NCI
ALS
STA
TEM
ENTS
Health Midcap Fund 1 ULIF06201/02/08HMIDCAPF01121
Industry Security Name Market Value ( ` ‘000) % of NAV
Financial and insurance activities
Yes Bank Ltd 51.00 1.03%
Cholamandalam Investment & Fin Co. Ltd
129.00 2.60%
RBL Bank Ltd 352.00 7.10%
Federal Bank Ltd 426.00 8.59%
Dhanlaxmi Bank Ltd 63.00 1.27%
Mahindra & Mahindra Financial Serv Ltd
157.00 3.17%
Financial and insurance activities Total 1,178.00 23.76%
Manufacture Of Pharmaceuticals, Medicinal Chemical And Botanical Products
Aurobindo Pharma Ltd 144.00 2.91%
Divi's Laboratories Ltd 317.00 6.39%
Torrent Pharmaceuticals Ltd 140.00 2.82%
Manufacture Of Pharmaceuticals, Medicinal Chemical And Botanical Products Total
601.00 12.12%
Others 3,040.00 61.26%
Net Current Assets 142.00 2.86%
Grand Total 4,961.00 100.00%
Health Money Market Fund 1 ULIF01501/02/08HMONMRKT01121
Industry Security Name Market Value ( ` ‘000) % of NAV
Government Securities GOI TB 2019 5,374.00 100.35%
Government Securities Total 5,374.00 100.35%
Others 403.00 7.55%
Net Current Assets -423.00 -7.90%
Grand Total 5,354.00 100.00%

180
Annual Report 2018-19
Appendix 5
ACCOUNTING RATIO contd...
Health Pure Equity Fund 1 ULIF01601/02/08HPUEQUTY01121
Industry Security Name Market Value ( ` ‘000) % of NAV
Computer programming, consultancy and related activities
HCL Technologies Ltd 2,126.00 7.57%
Tech Mahindra Ltd 1,832.00 6.52%
Computer programming, consultancy and related activities Total
3,958.00 14.09%
Manufacture Of Chemicals And Chemical Products
Asian Paints Ltd 1,567.00 5.58%
Hindustan Unilever Ltd 2,388.00 8.50%
Manufacture Of Chemicals And Chemical Products Total
3,955.00 14.08%
Manufacture Of Food Products
Glaxosmithkline Consumer Healthcare Ltd
1,739.00 6.19%
Nestle India Ltd 943.00 3.36%
Britannia Industries Ltd 1,185.00 4.21%
Manufacture Of Food Products Total 3,867.00 13.76%
Others 16,363.00 58.24%
Net Current Assets -48.00 -0.17%
Grand Total 28,095.00 100.00%
Health Super Growth Fund 1 ULIF01701/02/08HSPRGRWT01121
Industry Security Name Market Value ( ` ‘000) % of NAV
Computer programming, consultancy and related activities
Infosys Ltd 1,016.00 4.80%
Tata Consultancy Services Ltd 757.00 3.58%
HCL Technologies Ltd 299.00 1.41%
Tech Mahindra Ltd 213.00 1.01%
Computer programming, consultancy and related activities Total
2,285.00 10.80%
Financial and insurance activities
HDFC Bank Ltd 1,540.00 7.28%
ICICI Bank Ltd 1,134.00 5.36%
State Bank Of India 286.00 1.35%
Axis Bank Ltd 557.00 2.63%
Yes Bank Ltd 234.00 1.11%
Kotak Mahindra Bank Ltd 669.00 3.16%
Bajaj Finance Ltd 176.00 0.83%
Federal Bank Ltd 211.00 1.00%

181
STRA
TEG
IC R
EPO
RT /
STA
TUTO
RY R
EPO
RTS
/ F
INA
NCI
ALS
STA
TEM
ENTS
Health Money Market Fund 1 ULIF01701/02/08HSPRGRWT01121
Industry Security Name Market Value ( ` ‘000) % of NAV
Financial and insurance activities Total 4,807.00 22.72%
Government Securities
GOI G Sec 2023 356.00 1.68%
GOI G Sec 2032 391.00 1.85%
GOI G Sec 2024 92.00 0.43%
GOI G Sec 2035 401.00 1.89%
GOI G Sec 2028 294.00 1.39%
GOI G Sec 2029 607.00 2.87%
SDL Guj G Sec 2028 73.00 0.34%
SDL Guj G Sec 2029 233.00 1.10%
Government Securities Total 2,447.00 11.55%
Infrastructure Facility
Power Grid Corporation Of India Ltd
212.00 1.00%
GAIL (India) Ltd 191.00 0.90%
7.60% NHAI NCD 2022 999.00 4.72%
8.45% IRFC NCD 2028 1,015.00 4.80%
Infrastructure Facility Total 2,417.00 11.42%
Others 9,288.00 43.90%
Net Current Assets -82.00 -0.39%
Grand Total 21,162.00 100.00%
Life Balanced Fund 1 ULIF00128/07/04LBALANCE01121
Industry Security Name Market Value ( ` ‘000) % of NAV
Financial and insurance activities
HDFC Bank Ltd 22,197.00 2.03%
ICICI Bank Ltd 13,354.00 1.22%
State Bank Of India 6,000.00 0.55%
Axis Bank Ltd 6,332.00 0.58%
Yes Bank Ltd 2,354.00 0.22%
Kotak Mahindra Bank Ltd 16,607.00 1.52%
Housing Deve Fin Corp Ltd 4,236.00 0.39%
9.25% DHFCL NCD 2023 44,867.00 4.10%
Bajaj Finance Ltd 1,718.00 0.16%
Federal Bank Ltd 2,536.00 0.23%
9.00% Shriram Transport NCD 2028
26,551.00 2.43%
Dhanlaxmi Bank Ltd 5,376.00 0.49%
Financial and insurance activities Total 152,128.00 13.92%

182
Annual Report 2018-19
Appendix 5
ACCOUNTING RATIO contd...
Life Balanced Fund 1 ULIF00128/07/04LBALANCE01121
Industry Security Name Market Value ( ` ‘000) % of NAV
Government Securities
GOI G Sec 2023 70,361.00 6.43%
GOI G Sec 2032 79,855.00 7.30%
GOI G Sec 2024 18,218.00 1.67%
GOI G Sec 2035 73,549.00 6.72%
GOI G Sec 2028 58,357.00 5.33%
GOI G Sec 2029 130,847.00 11.96%
SDL Guj G Sec 2028 8,526.00 0.78%
SDL Guj G Sec 2029 73,332.00 6.70%
Government Securities Total 513,045.00 46.89%
Infrastructure Facility
NTPC Ltd 33.00 0.00%
Power Grid Corporation Of India Ltd
2,197.00 0.20%
GAIL (India) Ltd 1,966.00 0.18%
8.80% PGC NCD 2023 10,344.00 0.95%
7.93% PGC NCD 2028 981.00 0.09%
7.33% IRFC NCD 2027 50,198.00 4.59%
9.25% Reliance Jio NCD 2024 23,359.00 2.14%
8.40% PGC NCD 2022 13,277.00 1.21%
9.00% Reliance Jio NCD 2025 47,560.00 4.35%
8.45% IRFC NCD 2028 4,060.00 0.37%
8.30% NTPC NCD 2029 16,075.00 1.47%
8.27% NHAI NCD 2029 40,131.00 3.67%
Infrastructure Facility Total 210,181.00 19.22%
Others 196,712.00 17.97%
Net Current Assets 21,870.00 2.00%
Grand Total 1,093,936.00 100.00%
Life Capital Secure Fund 1 ULIF00228/07/04LCAPTSEC01121
Industry Security Name Market Value ( ` ‘000) % of NAV
Government Securities GOI TB 2019 24,589.00 72.24%
Government Securities Total 24,589.00 72.24%
Others 10,472.00 30.76%
Net Current Assets -1,022.00 -3.00%
Grand Total 34,039.00 100.00%

183
STRA
TEG
IC R
EPO
RT /
STA
TUTO
RY R
EPO
RTS
/ F
INA
NCI
ALS
STA
TEM
ENTS
Life Corporate Bond Fund 1 ULIF02310/06/08LCORBOND01121
Industry Security Name Market Value ( ` ‘000) % of NAV
Government Securities
GOI G Sec 2023 196,820.00 7.05%
GOI G Sec 2032 255,839.00 9.16%
GOI G Sec 2024 58,340.00 2.09%
GOI G Sec 2035 242,667.00 8.69%
GOI G Sec 2028 188,905.00 6.77%
GOI G Sec 2029 423,541.00 15.17%
SDL Guj G Sec 2029 261,617.00 9.37%
Government Securities Total 1,627,729.00 58.30%
Infrastructure Facility
7.93% PGC NCD 2028 28,449.00 1.02%
9.25% Reliance Jio NCD 2024 105,115.00 3.76%
7.27% NHAI NCD 2022 44,576.00 1.60%
9.00% Reliance Jio NCD 2025 148,883.00 5.33%
7.60% NHAI NCD 2022 20,998.00 0.75%
8.30% NTPC NCD 2029 94,442.00 3.38%
8.27% NHAI NCD 2029 128,420.00 4.60%
8.35% IRFC NCD 2029 145,379.00 5.21%
8.40% IRFC NCD 2029 30,361.00 1.09%
Infrastructure Facility Total 746,623.00 26.74%
Others 351,295.00 12.59%
Net Current Assets 66,292.00 2.37%
Grand Total 2,791,939.00 100.00%
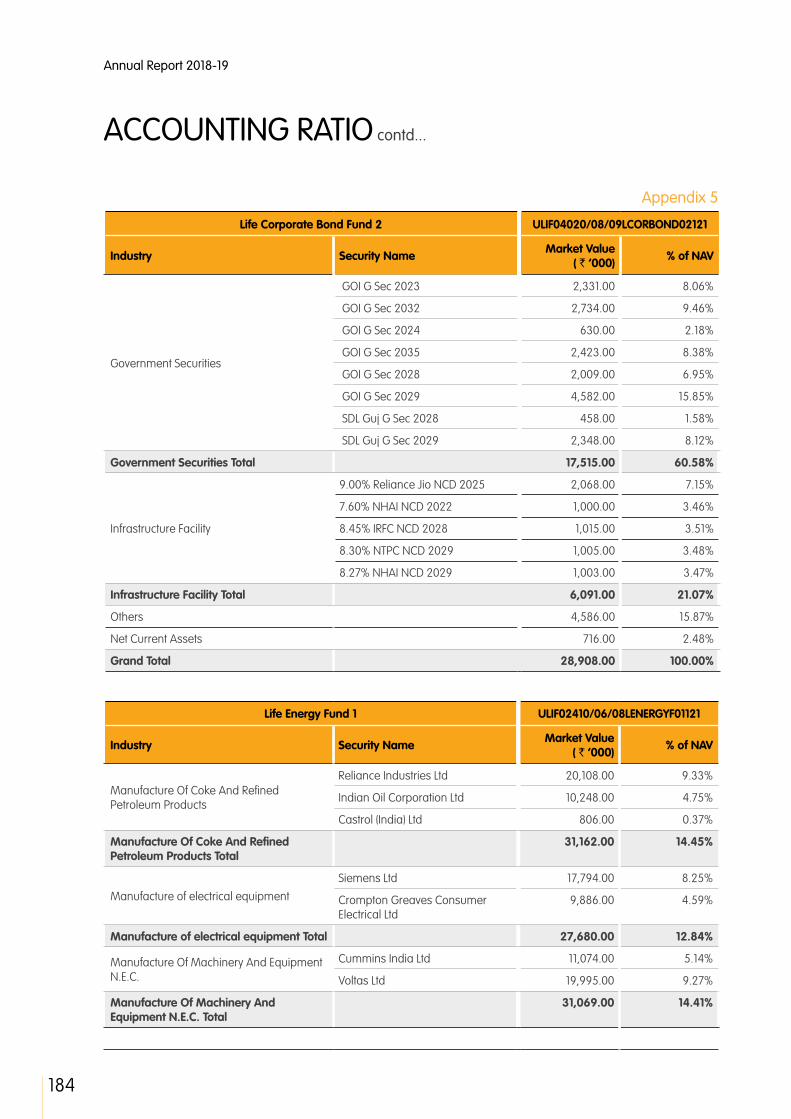
184
Annual Report 2018-19
Appendix 5
ACCOUNTING RATIO contd...
Life Corporate Bond Fund 2 ULIF04020/08/09LCORBOND02121
Industry Security Name Market Value ( ` ‘000) % of NAV
Government Securities
GOI G Sec 2023 2,331.00 8.06%
GOI G Sec 2032 2,734.00 9.46%
GOI G Sec 2024 630.00 2.18%
GOI G Sec 2035 2,423.00 8.38%
GOI G Sec 2028 2,009.00 6.95%
GOI G Sec 2029 4,582.00 15.85%
SDL Guj G Sec 2028 458.00 1.58%
SDL Guj G Sec 2029 2,348.00 8.12%
Government Securities Total 17,515.00 60.58%
Infrastructure Facility
9.00% Reliance Jio NCD 2025 2,068.00 7.15%
7.60% NHAI NCD 2022 1,000.00 3.46%
8.45% IRFC NCD 2028 1,015.00 3.51%
8.30% NTPC NCD 2029 1,005.00 3.48%
8.27% NHAI NCD 2029 1,003.00 3.47%
Infrastructure Facility Total 6,091.00 21.07%
Others 4,586.00 15.87%
Net Current Assets 716.00 2.48%
Grand Total 28,908.00 100.00%
Life Energy Fund 1 ULIF02410/06/08LENERGYF01121
Industry Security Name Market Value ( ` ‘000) % of NAV
Manufacture Of Coke And Refined Petroleum Products
Reliance Industries Ltd 20,108.00 9.33%
Indian Oil Corporation Ltd 10,248.00 4.75%
Castrol (India) Ltd 806.00 0.37%
Manufacture Of Coke And Refined Petroleum Products Total
31,162.00 14.45%
Manufacture of electrical equipment
Siemens Ltd 17,794.00 8.25%
Crompton Greaves Consumer Electrical Ltd
9,886.00 4.59%
Manufacture of electrical equipment Total 27,680.00 12.84%
Manufacture Of Machinery And Equipment N.E.C.
Cummins India Ltd 11,074.00 5.14%
Voltas Ltd 19,995.00 9.27%
Manufacture Of Machinery And Equipment N.E.C. Total
31,069.00 14.41%

185
STRA
TEG
IC R
EPO
RT /
STA
TUTO
RY R
EPO
RTS
/ F
INA
NCI
ALS
STA
TEM
ENTS
Life Energy Fund 1 ULIF02410/06/08LENERGYF01121
Industry Security Name Market Value ( ` ‘000) % of NAV
Infrastructure Facility
NTPC Ltd 12,946.00 6.00%
Power Grid Corporation Of India Ltd
13,307.00 6.17%
Petronet Lng Ltd 11,752.00 5.45%
GAIL (India) Ltd 20,060.00 9.30%
Indraprastha Gas Ltd 6,367.00 2.95%
Infrastructure Facility Total 64,432.00 29.87%
Others 20,449.00 9.50%
Net Current Assets -2,014.00 -0.93%
TREPS CCIL TREPS 2019 42,824.00 19.86%
Grand Total 215,602.00 100.00%
Life Energy Fund 2 ULIF04101/01/10LENERGYF02121
Industry Security Name Market Value ( ` ‘000) % of NAV
Manufacture Of Coke And Refined Petroleum Products
Reliance Industries Ltd 6,824.00 9.18%
Indian Oil Corporation Ltd 3,452.00 4.64%
Castrol (India) Ltd 271.00 0.36%
Manufacture Of Coke And Refined Petroleum Products Total
10,547.00 14.18%
Manufacture of electrical equipmentSiemens Ltd 5,994.00 8.07%
Crompton Greaves Consumer Electrical Ltd
3,330.00 4.48%
Manufacture of electrical equipment Total 9,324.00 12.55%
Manufacture Of Machinery And Equipment N.E.C.
Cummins India Ltd 3,758.00 5.06%
Voltas Ltd 6,734.00 9.06%
Manufacture Of Machinery And Equipment N.E.C. Total
10,492.00 14.12%
Infrastructure Facility
NTPC Ltd 4,361.00 5.87%
Power Grid Corporation Of India Ltd
4,482.00 6.03%
Petronet Lng Ltd 3,958.00 5.33%
GAIL (India) Ltd 6,757.00 9.09%
Indraprastha Gas Ltd 2,145.00 2.89%
Infrastructure Facility Total 21,703.00 29.21%
Others 6,940.00 9.33%
Net Current Assets 289.00 0.39%
TREPS CCIL TREPS 2019 15,025.00 20.22%
Grand Total 74,320.00 100.00%
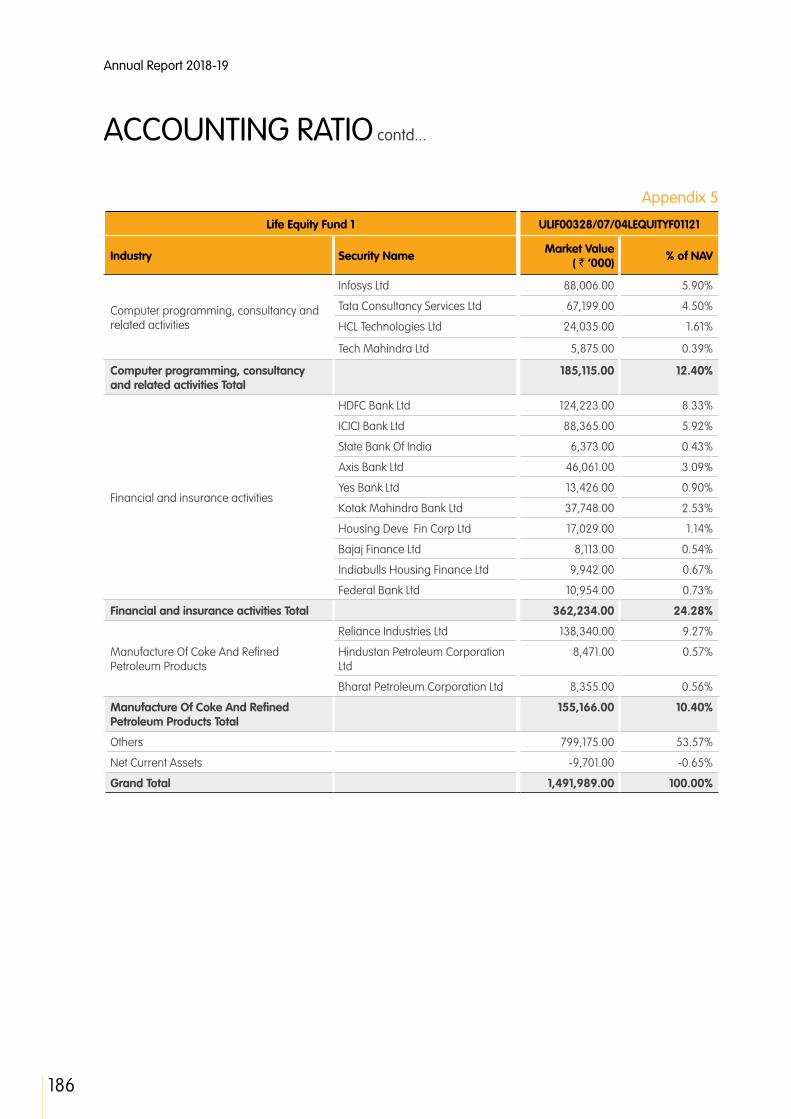
186
Annual Report 2018-19
Appendix 5
ACCOUNTING RATIO contd...
Life Equity Fund 1 ULIF00328/07/04LEQUITYF01121
Industry Security Name Market Value ( ` ‘000) % of NAV
Computer programming, consultancy and related activities
Infosys Ltd 88,006.00 5.90%
Tata Consultancy Services Ltd 67,199.00 4.50%
HCL Technologies Ltd 24,035.00 1.61%
Tech Mahindra Ltd 5,875.00 0.39%
Computer programming, consultancy and related activities Total
185,115.00 12.40%
Financial and insurance activities
HDFC Bank Ltd 124,223.00 8.33%
ICICI Bank Ltd 88,365.00 5.92%
State Bank Of India 6,373.00 0.43%
Axis Bank Ltd 46,061.00 3.09%
Yes Bank Ltd 13,426.00 0.90%
Kotak Mahindra Bank Ltd 37,748.00 2.53%
Housing Deve Fin Corp Ltd 17,029.00 1.14%
Bajaj Finance Ltd 8,113.00 0.54%
Indiabulls Housing Finance Ltd 9,942.00 0.67%
Federal Bank Ltd 10,954.00 0.73%
Financial and insurance activities Total 362,234.00 24.28%
Manufacture Of Coke And Refined Petroleum Products
Reliance Industries Ltd 138,340.00 9.27%
Hindustan Petroleum Corporation Ltd
8,471.00 0.57%
Bharat Petroleum Corporation Ltd 8,355.00 0.56%
Manufacture Of Coke And Refined Petroleum Products Total
155,166.00 10.40%
Others 799,175.00 53.57%
Net Current Assets -9,701.00 -0.65%
Grand Total 1,491,989.00 100.00%

187
STRA
TEG
IC R
EPO
RT /
STA
TUTO
RY R
EPO
RTS
/ F
INA
NCI
ALS
STA
TEM
ENTS
Life Equity Fund 2 ULIF02510/06/08LEQUITYF02121
Industry Security Name Market Value ( ` ‘000) % of NAV
Computer programming, consultancy and related activities
Infosys Ltd 406,044.00 6.07%
Tata Consultancy Services Ltd 307,908.00 4.60%
HCL Technologies Ltd 110,371.00 1.65%
Tech Mahindra Ltd 26,917.00 0.40%
Computer programming, consultancy and related activities Total
851,240.00 12.72%
Financial and insurance activities
HDFC Bank Ltd 582,396.00 8.71%
ICICI Bank Ltd 410,703.00 6.14%
State Bank Of India 29,002.00 0.43%
Axis Bank Ltd 216,420.00 3.24%
Yes Bank Ltd 61,428.00 0.92%
Kotak Mahindra Bank Ltd 156,780.00 2.34%
Housing Deve Fin Corp Ltd 49,712.00 0.74%
Bajaj Finance Ltd 40,668.00 0.61%
Indiabulls Housing Finance Ltd 55,653.00 0.83%
Federal Bank Ltd 49,926.00 0.75%
Financial and insurance activities Total 1,652,688.00 24.71%
Manufacture Of Coke And Refined Petroleum Products
Reliance Industries Ltd 630,514.00 9.43%
Hindustan Petroleum Corporation Ltd
42,880.00 0.64%
Bharat Petroleum Corporation Ltd 42,283.00 0.63%
Manufacture Of Coke And Refined Petroleum Products Tot
715,677.00 10.70%
Others 3,597,712.00 53.80%
Net Current Assets -129,326.00 -1.93%
Grand Total 6,687,991.00 100.00%
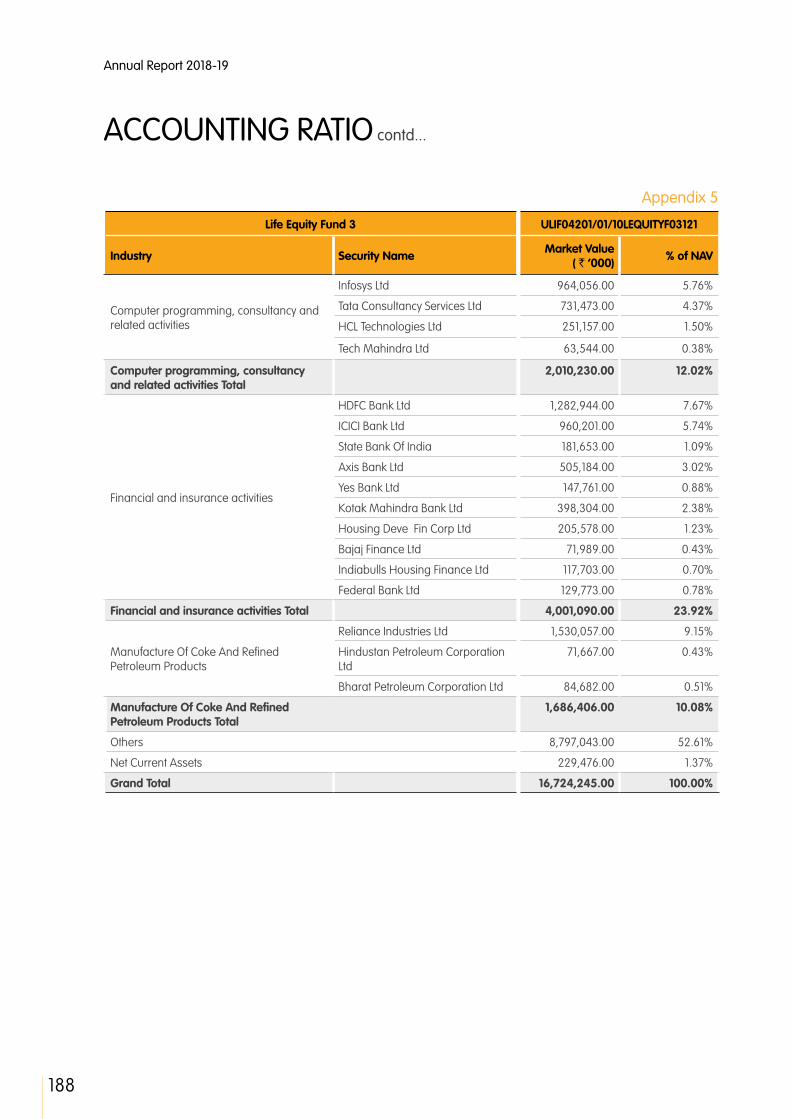
188
Annual Report 2018-19
Appendix 5
ACCOUNTING RATIO contd...
Life Equity Fund 3 ULIF04201/01/10LEQUITYF03121
Industry Security Name Market Value ( ` ‘000) % of NAV
Computer programming, consultancy and related activities
Infosys Ltd 964,056.00 5.76%
Tata Consultancy Services Ltd 731,473.00 4.37%
HCL Technologies Ltd 251,157.00 1.50%
Tech Mahindra Ltd 63,544.00 0.38%
Computer programming, consultancy and related activities Total
2,010,230.00 12.02%
Financial and insurance activities
HDFC Bank Ltd 1,282,944.00 7.67%
ICICI Bank Ltd 960,201.00 5.74%
State Bank Of India 181,653.00 1.09%
Axis Bank Ltd 505,184.00 3.02%
Yes Bank Ltd 147,761.00 0.88%
Kotak Mahindra Bank Ltd 398,304.00 2.38%
Housing Deve Fin Corp Ltd 205,578.00 1.23%
Bajaj Finance Ltd 71,989.00 0.43%
Indiabulls Housing Finance Ltd 117,703.00 0.70%
Federal Bank Ltd 129,773.00 0.78%
Financial and insurance activities Total 4,001,090.00 23.92%
Manufacture Of Coke And Refined Petroleum Products
Reliance Industries Ltd 1,530,057.00 9.15%
Hindustan Petroleum Corporation Ltd
71,667.00 0.43%
Bharat Petroleum Corporation Ltd 84,682.00 0.51%
Manufacture Of Coke And Refined Petroleum Products Total
1,686,406.00 10.08%
Others 8,797,043.00 52.61%
Net Current Assets 229,476.00 1.37%
Grand Total 16,724,245.00 100.00%

189
STRA
TEG
IC R
EPO
RT /
STA
TUTO
RY R
EPO
RTS
/ F
INA
NCI
ALS
STA
TEM
ENTS
Life Gilt Fund 1 ULIF02610/06/08LGILTFUN01121
Industry Security Name Market Value ( ` ‘000) % of NAV
Government Securities
GOI G Sec 2023 117,540.00 25.25%
GOI G Sec 2032 56,972.00 12.24%
GOI G Sec 2024 42,164.00 9.06%
GOI G Sec 2035 55,738.00 11.98%
GOI G Sec 2028 55,378.00 11.90%
GOI G Sec 2029 71,889.00 15.45%
SDL Guj G Sec 2028 10,473.00 2.25%
SDL Guj G Sec 2029 26,945.00 5.79%
Government Securities Total 437,099.00 93.92%
Others 21,556.00 4.63%
Net Current Assets 6,761.00 1.45%
Grand Total 465,416.00 100.00%
Life Gilt Fund 2 ULIF03819/03/09LGILTFUN02121
Industry Security Name Market Value ( ` ‘000) % of NAV
Government Securities
GOI G Sec 2023 3,889.00 24.75%
GOI G Sec 2032 1,892.00 12.04%
GOI G Sec 2024 1,412.00 8.99%
GOI G Sec 2035 1,856.00 11.81%
GOI G Sec 2028 1,842.00 11.72%
GOI G Sec 2029 2,385.00 15.18%
SDL Guj G Sec 2028 344.00 2.19%
SDL Guj G Sec 2029 873.00 5.56%
Government Securities Total 14,493.00 92.24%
Others 939.00 5.96%
Net Current Assets 283.00 1.80%
Grand Total 15,715.00 100.00%
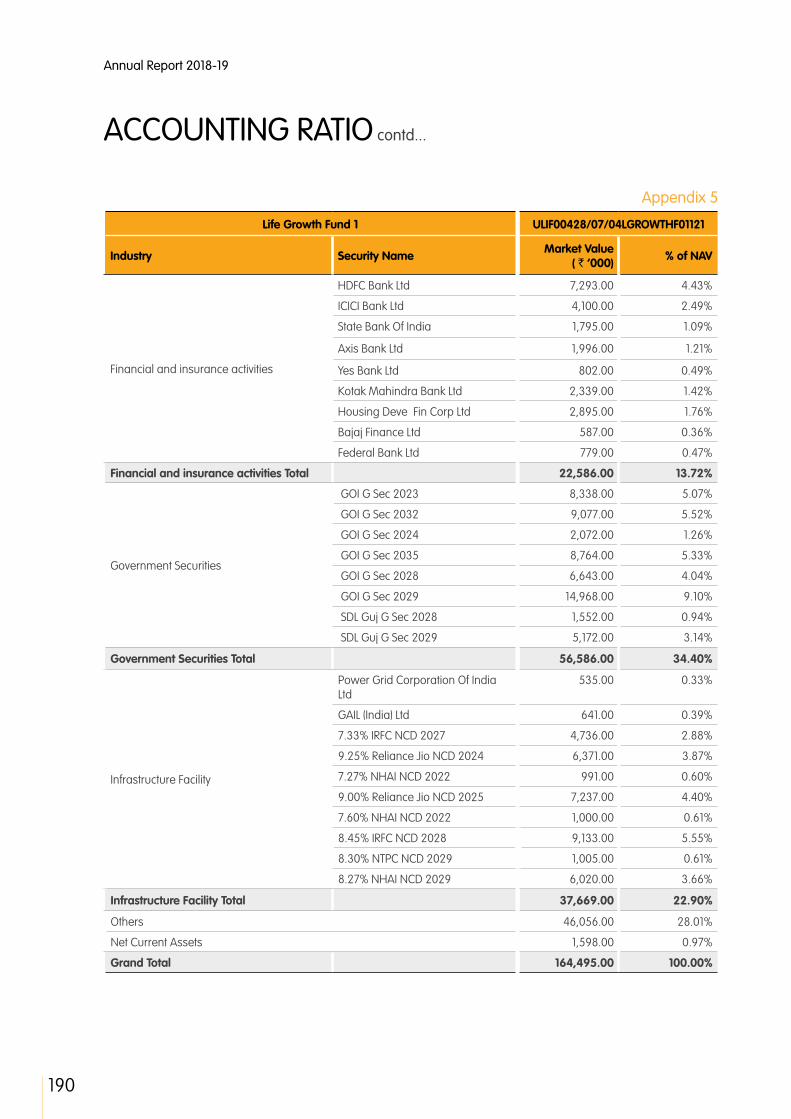
190
Annual Report 2018-19
Appendix 5
ACCOUNTING RATIO contd...
Life Growth Fund 1 ULIF00428/07/04LGROWTHF01121
Industry Security Name Market Value ( ` ‘000) % of NAV
Financial and insurance activities
HDFC Bank Ltd 7,293.00 4.43%
ICICI Bank Ltd 4,100.00 2.49%
State Bank Of India 1,795.00 1.09%
Axis Bank Ltd 1,996.00 1.21%
Yes Bank Ltd 802.00 0.49%
Kotak Mahindra Bank Ltd 2,339.00 1.42%
Housing Deve Fin Corp Ltd 2,895.00 1.76%
Bajaj Finance Ltd 587.00 0.36%
Federal Bank Ltd 779.00 0.47%
Financial and insurance activities Total 22,586.00 13.72%
Government Securities
GOI G Sec 2023 8,338.00 5.07%
GOI G Sec 2032 9,077.00 5.52%
GOI G Sec 2024 2,072.00 1.26%
GOI G Sec 2035 8,764.00 5.33%
GOI G Sec 2028 6,643.00 4.04%
GOI G Sec 2029 14,968.00 9.10%
SDL Guj G Sec 2028 1,552.00 0.94%
SDL Guj G Sec 2029 5,172.00 3.14%
Government Securities Total 56,586.00 34.40%
Infrastructure Facility
Power Grid Corporation Of India Ltd
535.00 0.33%
GAIL (India) Ltd 641.00 0.39%
7.33% IRFC NCD 2027 4,736.00 2.88%
9.25% Reliance Jio NCD 2024 6,371.00 3.87%
7.27% NHAI NCD 2022 991.00 0.60%
9.00% Reliance Jio NCD 2025 7,237.00 4.40%
7.60% NHAI NCD 2022 1,000.00 0.61%
8.45% IRFC NCD 2028 9,133.00 5.55%
8.30% NTPC NCD 2029 1,005.00 0.61%
8.27% NHAI NCD 2029 6,020.00 3.66%
Infrastructure Facility Total 37,669.00 22.90%
Others 46,056.00 28.01%
Net Current Assets 1,598.00 0.97%
Grand Total 164,495.00 100.00%
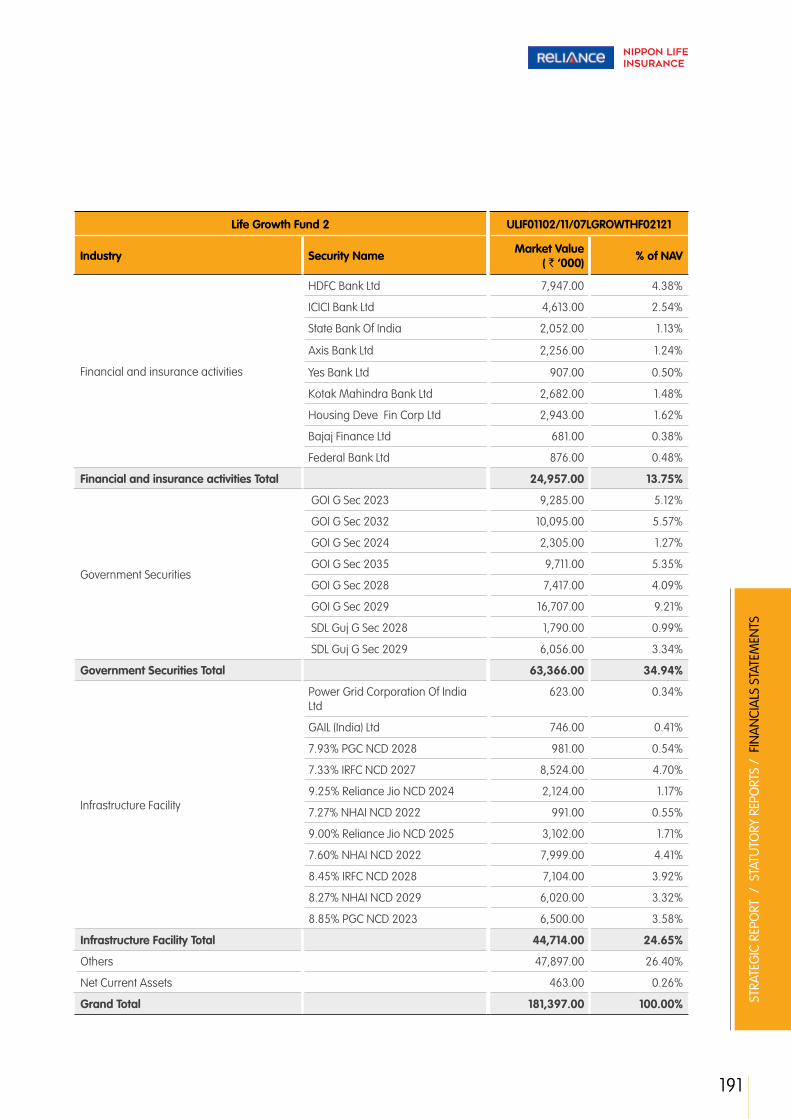
191
STRA
TEG
IC R
EPO
RT /
STA
TUTO
RY R
EPO
RTS
/ F
INA
NCI
ALS
STA
TEM
ENTS
Life Growth Fund 2 ULIF01102/11/07LGROWTHF02121
Industry Security Name Market Value ( ` ‘000) % of NAV
Financial and insurance activities
HDFC Bank Ltd 7,947.00 4.38%
ICICI Bank Ltd 4,613.00 2.54%
State Bank Of India 2,052.00 1.13%
Axis Bank Ltd 2,256.00 1.24%
Yes Bank Ltd 907.00 0.50%
Kotak Mahindra Bank Ltd 2,682.00 1.48%
Housing Deve Fin Corp Ltd 2,943.00 1.62%
Bajaj Finance Ltd 681.00 0.38%
Federal Bank Ltd 876.00 0.48%
Financial and insurance activities Total 24,957.00 13.75%
Government Securities
GOI G Sec 2023 9,285.00 5.12%
GOI G Sec 2032 10,095.00 5.57%
GOI G Sec 2024 2,305.00 1.27%
GOI G Sec 2035 9,711.00 5.35%
GOI G Sec 2028 7,417.00 4.09%
GOI G Sec 2029 16,707.00 9.21%
SDL Guj G Sec 2028 1,790.00 0.99%
SDL Guj G Sec 2029 6,056.00 3.34%
Government Securities Total 63,366.00 34.94%
Infrastructure Facility
Power Grid Corporation Of India Ltd
623.00 0.34%
GAIL (India) Ltd 746.00 0.41%
7.93% PGC NCD 2028 981.00 0.54%
7.33% IRFC NCD 2027 8,524.00 4.70%
9.25% Reliance Jio NCD 2024 2,124.00 1.17%
7.27% NHAI NCD 2022 991.00 0.55%
9.00% Reliance Jio NCD 2025 3,102.00 1.71%
7.60% NHAI NCD 2022 7,999.00 4.41%
8.45% IRFC NCD 2028 7,104.00 3.92%
8.27% NHAI NCD 2029 6,020.00 3.32%
8.85% PGC NCD 2023 6,500.00 3.58%
Infrastructure Facility Total 44,714.00 24.65%
Others 47,897.00 26.40%
Net Current Assets 463.00 0.26%
Grand Total 181,397.00 100.00%
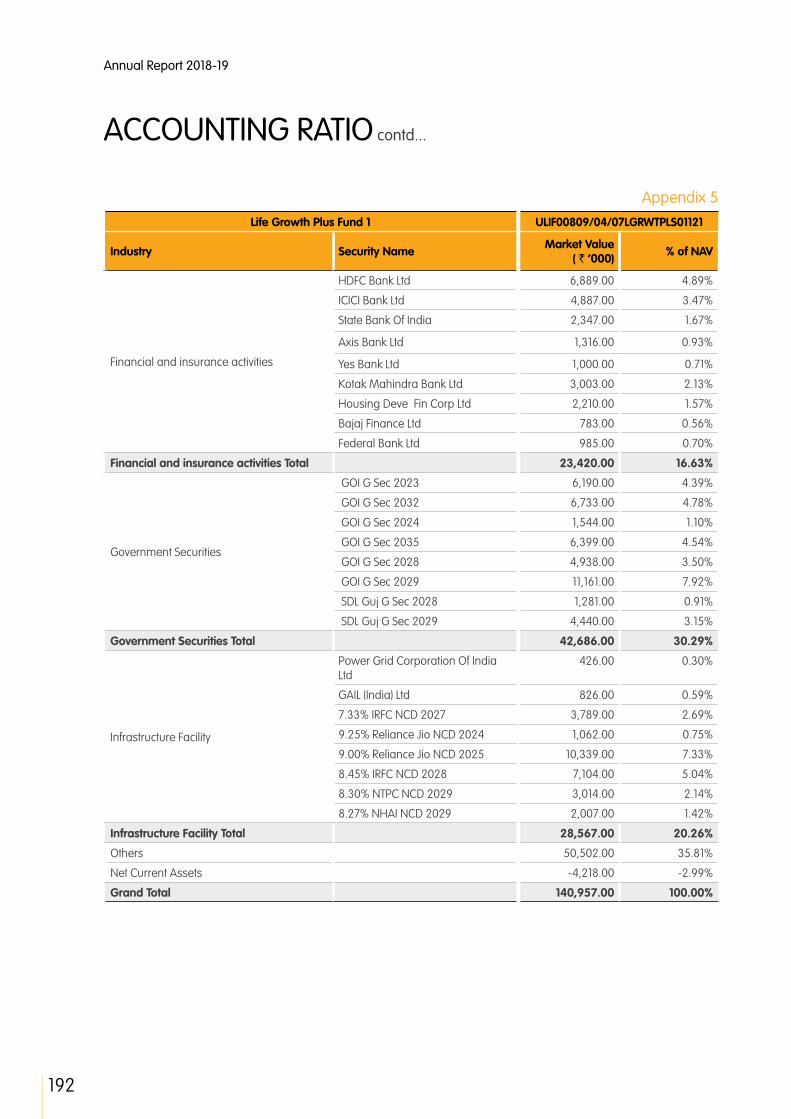
192
Annual Report 2018-19
Appendix 5
ACCOUNTING RATIO contd...
Life Growth Plus Fund 1 ULIF00809/04/07LGRWTPLS01121
Industry Security Name Market Value ( ` ‘000) % of NAV
Financial and insurance activities
HDFC Bank Ltd 6,889.00 4.89%
ICICI Bank Ltd 4,887.00 3.47%
State Bank Of India 2,347.00 1.67%
Axis Bank Ltd 1,316.00 0.93%
Yes Bank Ltd 1,000.00 0.71%
Kotak Mahindra Bank Ltd 3,003.00 2.13%
Housing Deve Fin Corp Ltd 2,210.00 1.57%
Bajaj Finance Ltd 783.00 0.56%
Federal Bank Ltd 985.00 0.70%
Financial and insurance activities Total 23,420.00 16.63%
Government Securities
GOI G Sec 2023 6,190.00 4.39%
GOI G Sec 2032 6,733.00 4.78%
GOI G Sec 2024 1,544.00 1.10%
GOI G Sec 2035 6,399.00 4.54%
GOI G Sec 2028 4,938.00 3.50%
GOI G Sec 2029 11,161.00 7.92%
SDL Guj G Sec 2028 1,281.00 0.91%
SDL Guj G Sec 2029 4,440.00 3.15%
Government Securities Total 42,686.00 30.29%
Infrastructure Facility
Power Grid Corporation Of India Ltd
426.00 0.30%
GAIL (India) Ltd 826.00 0.59%
7.33% IRFC NCD 2027 3,789.00 2.69%
9.25% Reliance Jio NCD 2024 1,062.00 0.75%
9.00% Reliance Jio NCD 2025 10,339.00 7.33%
8.45% IRFC NCD 2028 7,104.00 5.04%
8.30% NTPC NCD 2029 3,014.00 2.14%
8.27% NHAI NCD 2029 2,007.00 1.42%
Infrastructure Facility Total 28,567.00 20.26%
Others 50,502.00 35.81%
Net Current Assets -4,218.00 -2.99%
Grand Total 140,957.00 100.00%
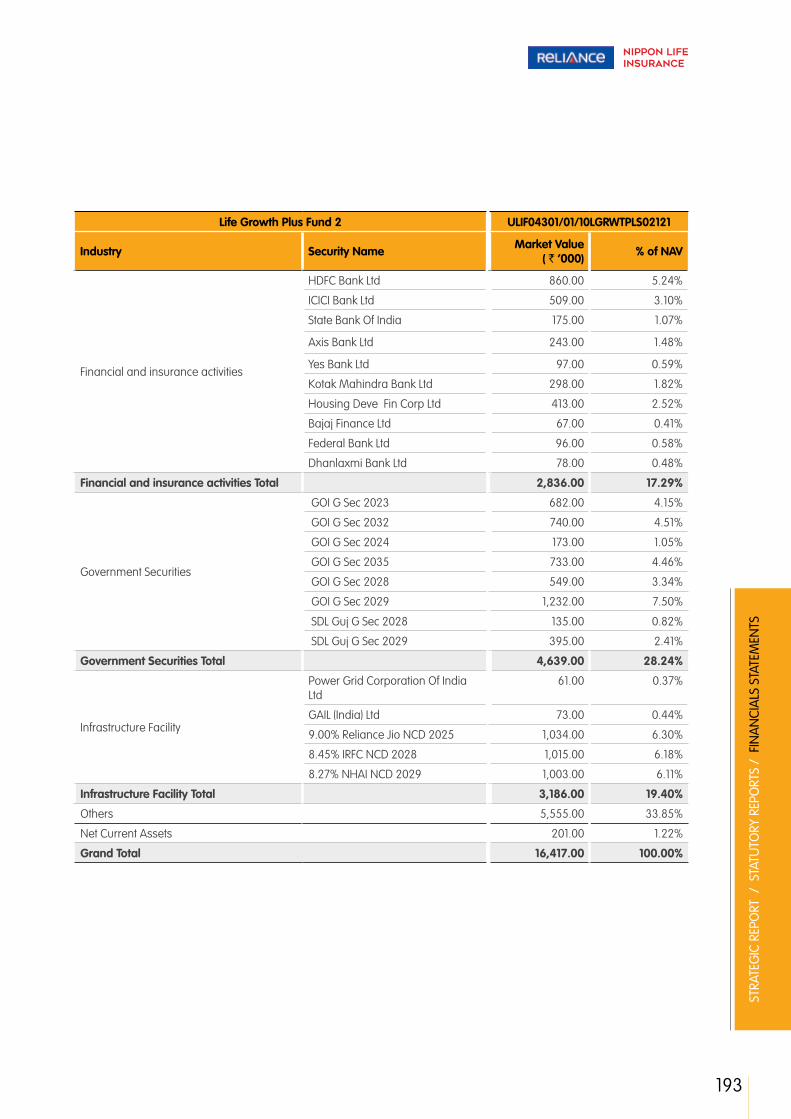
193
STRA
TEG
IC R
EPO
RT /
STA
TUTO
RY R
EPO
RTS
/ F
INA
NCI
ALS
STA
TEM
ENTS
Life Growth Plus Fund 2 ULIF04301/01/10LGRWTPLS02121
Industry Security Name Market Value ( ` ‘000) % of NAV
Financial and insurance activities
HDFC Bank Ltd 860.00 5.24%
ICICI Bank Ltd 509.00 3.10%
State Bank Of India 175.00 1.07%
Axis Bank Ltd 243.00 1.48%
Yes Bank Ltd 97.00 0.59%
Kotak Mahindra Bank Ltd 298.00 1.82%
Housing Deve Fin Corp Ltd 413.00 2.52%
Bajaj Finance Ltd 67.00 0.41%
Federal Bank Ltd 96.00 0.58%
Dhanlaxmi Bank Ltd 78.00 0.48%
Financial and insurance activities Total 2,836.00 17.29%
Government Securities
GOI G Sec 2023 682.00 4.15%
GOI G Sec 2032 740.00 4.51%
GOI G Sec 2024 173.00 1.05%
GOI G Sec 2035 733.00 4.46%
GOI G Sec 2028 549.00 3.34%
GOI G Sec 2029 1,232.00 7.50%
SDL Guj G Sec 2028 135.00 0.82%
SDL Guj G Sec 2029 395.00 2.41%
Government Securities Total 4,639.00 28.24%
Infrastructure Facility
Power Grid Corporation Of India Ltd
61.00 0.37%
GAIL (India) Ltd 73.00 0.44%
9.00% Reliance Jio NCD 2025 1,034.00 6.30%
8.45% IRFC NCD 2028 1,015.00 6.18%
8.27% NHAI NCD 2029 1,003.00 6.11%
Infrastructure Facility Total 3,186.00 19.40%
Others 5,555.00 33.85%
Net Current Assets 201.00 1.22%
Grand Total 16,417.00 100.00%

194
Annual Report 2018-19
Appendix 5
ACCOUNTING RATIO contd...
Life High Growth Fund 1 ULIF00728/02/07LHIGROWT01121
Industry Security Name Market Value ( ` ‘000) % of NAV
Financial and insurance activities
HDFC Bank Ltd 23,154.00 6.03%
ICICI Bank Ltd 15,343.00 4.00%
State Bank Of India 7,113.00 1.85%
Axis Bank Ltd 6,443.00 1.68%
Yes Bank Ltd 3,082.00 0.80%
Kotak Mahindra Bank Ltd 9,398.00 2.45%
Housing Deve Fin Corp Ltd 8,849.00 2.31%
9.25% DHFCL NCD 2023 10,197.00 2.66%
Bajaj Finance Ltd 2,263.00 0.59%
Federal Bank Ltd 2,915.00 0.76%
Financial and insurance activities Total 88,757.00 23.13%
Government Securities
GOI G Sec 2023 13,286.00 3.46%
GOI G Sec 2032 14,443.00 3.76%
GOI G Sec 2024 3,300.00 0.86%
GOI G Sec 2035 14,157.00 3.69%
GOI G Sec 2028 10,582.00 2.76%
GOI G Sec 2029 24,092.00 6.28%
SDL Guj G Sec 2028 1,864.00 0.49%
SDL Guj G Sec 2029 9,888.00 2.58%
Government Securities Total 91,612.00 23.88%
Infrastructure Facility
Power Grid Corporation Of India Ltd
1,330.00 0.35%
GAIL (India) Ltd 2,504.00 0.65%
7.33% IRFC NCD 2027 8,524.00 2.22%
9.25% Reliance Jio NCD 2024 14,865.00 3.87%
8.45% IRFC NCD 2028 15,222.00 3.97%
8.30% NTPC NCD 2029 6,028.00 1.57%
8.27% NHAI NCD 2029 2,007.00 0.52%
8.35% IRFC NCD 2029 2,019.00 0.53%
Infrastructure Facility Total 52,499.00 13.68%
Others 154,058.00 40.16%
Net Current Assets -3,248.00 -0.85%
Grand Total 383,678.00 100.00%
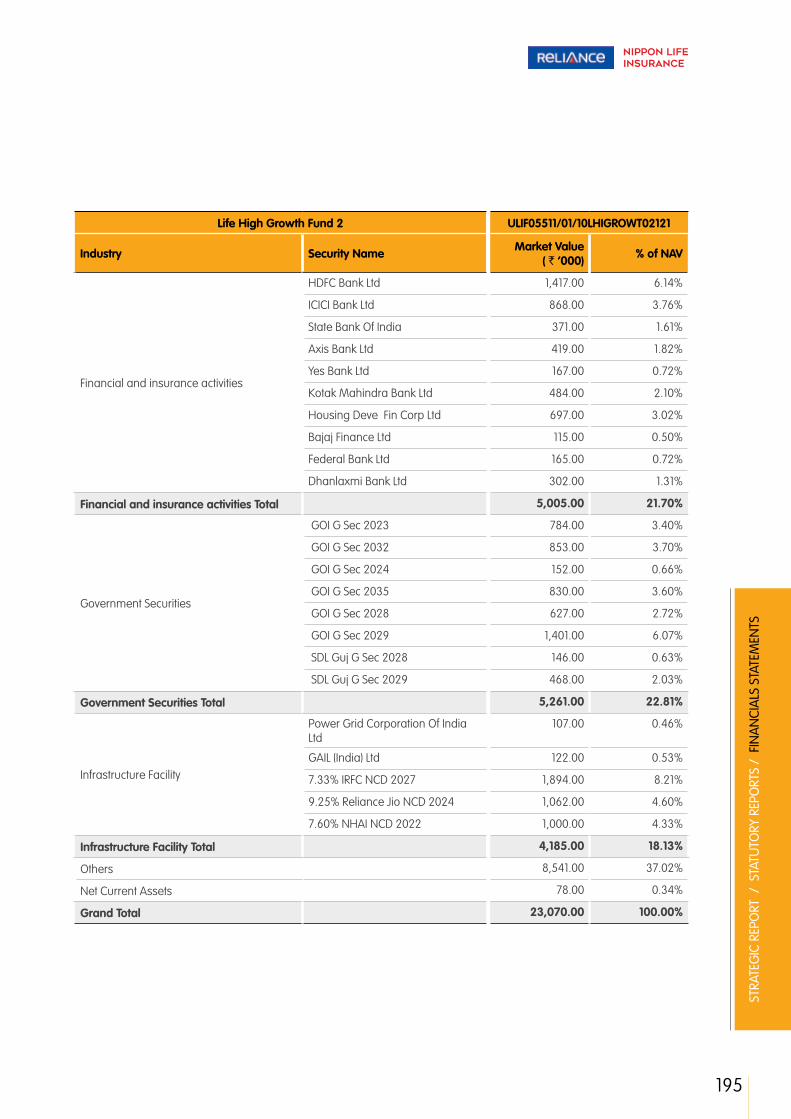
195
STRA
TEG
IC R
EPO
RT /
STA
TUTO
RY R
EPO
RTS
/ F
INA
NCI
ALS
STA
TEM
ENTS
Life High Growth Fund 2 ULIF05511/01/10LHIGROWT02121
Industry Security Name Market Value ( ` ‘000) % of NAV
Financial and insurance activities
HDFC Bank Ltd 1,417.00 6.14%
ICICI Bank Ltd 868.00 3.76%
State Bank Of India 371.00 1.61%
Axis Bank Ltd 419.00 1.82%
Yes Bank Ltd 167.00 0.72%
Kotak Mahindra Bank Ltd 484.00 2.10%
Housing Deve Fin Corp Ltd 697.00 3.02%
Bajaj Finance Ltd 115.00 0.50%
Federal Bank Ltd 165.00 0.72%
Dhanlaxmi Bank Ltd 302.00 1.31%
Financial and insurance activities Total 5,005.00 21.70%
Government Securities
GOI G Sec 2023 784.00 3.40%
GOI G Sec 2032 853.00 3.70%
GOI G Sec 2024 152.00 0.66%
GOI G Sec 2035 830.00 3.60%
GOI G Sec 2028 627.00 2.72%
GOI G Sec 2029 1,401.00 6.07%
SDL Guj G Sec 2028 146.00 0.63%
SDL Guj G Sec 2029 468.00 2.03%
Government Securities Total 5,261.00 22.81%
Infrastructure Facility
Power Grid Corporation Of India Ltd
107.00 0.46%
GAIL (India) Ltd 122.00 0.53%
7.33% IRFC NCD 2027 1,894.00 8.21%
9.25% Reliance Jio NCD 2024 1,062.00 4.60%
7.60% NHAI NCD 2022 1,000.00 4.33%
Infrastructure Facility Total 4,185.00 18.13%
Others 8,541.00 37.02%
Net Current Assets 78.00 0.34%
Grand Total 23,070.00 100.00%

196
Annual Report 2018-19
Appendix 5
ACCOUNTING RATIO contd...
Life Highest NAV Advantage Fund 1 ULIF05803/09/10LHNAVADV01121
Industry Security Name Market Value ( ` ‘000) % of NAV
Computer programming, consultancy and related activities
Infosys Ltd 79,386.00 5.33%
Tata Consultancy Services Ltd 59,147.00 3.97%
HCL Technologies Ltd 20,012.00 1.34%
Computer programming, consultancy and related activities Total
158,545.00 10.64%
Financial and insurance activities
HDFC Bank Ltd 78,089.00 5.24%
ICICI Bank Ltd 40,198.00 2.70%
State Bank Of India 18,841.00 1.26%
Axis Bank Ltd 21,576.00 1.45%
Yes Bank Ltd 7,980.00 0.54%
Reliance ETF Sensex 62,896.00 4.22%
Kotak Mahindra Bank Ltd 24,708.00 1.66%
Housing Deve Fin Corp Ltd 53,052.00 3.56%
Indusind Bank Ltd 11,162.00 0.75%
HDFC CP 2019 47,304.00 3.17%
Bajaj Finance Ltd 13,195.00 0.89%
Financial and insurance activities Total 379,001.00 25.44%
Government Securities GOI TB 2019 182,183.00 12.22%
Government Securities Total 182,183.00 12.22%
Manufacture Of Coke And Refined Petroleum Products
Reliance Industries Ltd 109,199.00 7.33%
IOCL CP 2019 59,918.00 4.02%
Manufacture Of Coke And Refined Petroleum Products Total
169,117.00 11.35%
Others 596,465.00 40.00%
Net Current Assets 5,224.00 0.35%
Grand Total 1,490,535.00 100.00%
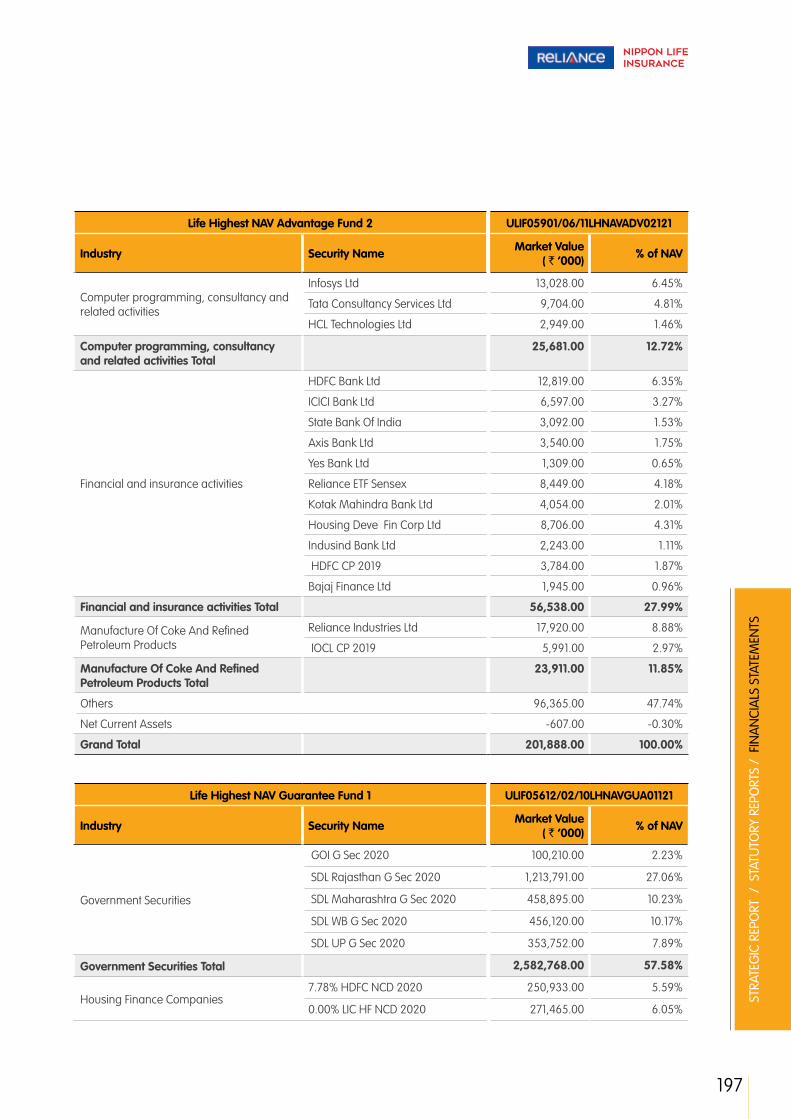
197
STRA
TEG
IC R
EPO
RT /
STA
TUTO
RY R
EPO
RTS
/ F
INA
NCI
ALS
STA
TEM
ENTS
Life Highest NAV Advantage Fund 2 ULIF05901/06/11LHNAVADV02121
Industry Security Name Market Value ( ` ‘000) % of NAV
Computer programming, consultancy and related activities
Infosys Ltd 13,028.00 6.45%
Tata Consultancy Services Ltd 9,704.00 4.81%
HCL Technologies Ltd 2,949.00 1.46%
Computer programming, consultancy and related activities Total
25,681.00 12.72%
Financial and insurance activities
HDFC Bank Ltd 12,819.00 6.35%
ICICI Bank Ltd 6,597.00 3.27%
State Bank Of India 3,092.00 1.53%
Axis Bank Ltd 3,540.00 1.75%
Yes Bank Ltd 1,309.00 0.65%
Reliance ETF Sensex 8,449.00 4.18%
Kotak Mahindra Bank Ltd 4,054.00 2.01%
Housing Deve Fin Corp Ltd 8,706.00 4.31%
Indusind Bank Ltd 2,243.00 1.11%
HDFC CP 2019 3,784.00 1.87%
Bajaj Finance Ltd 1,945.00 0.96%
Financial and insurance activities Total 56,538.00 27.99%
Manufacture Of Coke And Refined Petroleum Products
Reliance Industries Ltd 17,920.00 8.88%
IOCL CP 2019 5,991.00 2.97%
Manufacture Of Coke And Refined Petroleum Products Total
23,911.00 11.85%
Others 96,365.00 47.74%
Net Current Assets -607.00 -0.30%
Grand Total 201,888.00 100.00%
Life Highest NAV Guarantee Fund 1 ULIF05612/02/10LHNAVGUA01121
Industry Security Name Market Value ( ` ‘000) % of NAV
Government Securities
GOI G Sec 2020 100,210.00 2.23%
SDL Rajasthan G Sec 2020 1,213,791.00 27.06%
SDL Maharashtra G Sec 2020 458,895.00 10.23%
SDL WB G Sec 2020 456,120.00 10.17%
SDL UP G Sec 2020 353,752.00 7.89%
Government Securities Total 2,582,768.00 57.58%
Housing Finance Companies7.78% HDFC NCD 2020 250,933.00 5.59%
0.00% LIC HF NCD 2020 271,465.00 6.05%
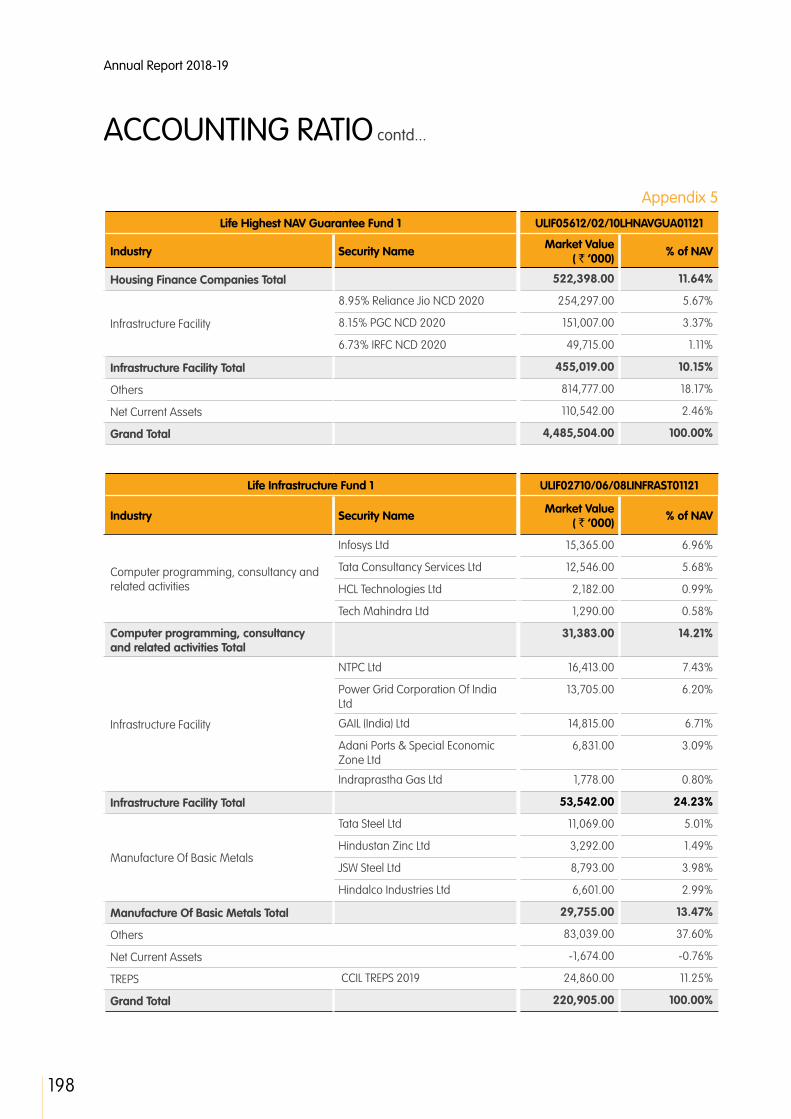
198
Annual Report 2018-19
Appendix 5
ACCOUNTING RATIO contd...
Life Highest NAV Guarantee Fund 1 ULIF05612/02/10LHNAVGUA01121
Industry Security Name Market Value ( ` ‘000) % of NAV
Housing Finance Companies Total 522,398.00 11.64%
Infrastructure Facility
8.95% Reliance Jio NCD 2020 254,297.00 5.67%
8.15% PGC NCD 2020 151,007.00 3.37%
6.73% IRFC NCD 2020 49,715.00 1.11%
Infrastructure Facility Total 455,019.00 10.15%
Others 814,777.00 18.17%
Net Current Assets 110,542.00 2.46%
Grand Total 4,485,504.00 100.00%
Life Infrastructure Fund 1 ULIF02710/06/08LINFRAST01121
Industry Security Name Market Value ( ` ‘000) % of NAV
Computer programming, consultancy and related activities
Infosys Ltd 15,365.00 6.96%
Tata Consultancy Services Ltd 12,546.00 5.68%
HCL Technologies Ltd 2,182.00 0.99%
Tech Mahindra Ltd 1,290.00 0.58%
Computer programming, consultancy and related activities Total
31,383.00 14.21%
Infrastructure Facility
NTPC Ltd 16,413.00 7.43%
Power Grid Corporation Of India Ltd
13,705.00 6.20%
GAIL (India) Ltd 14,815.00 6.71%
Adani Ports & Special Economic Zone Ltd
6,831.00 3.09%
Indraprastha Gas Ltd 1,778.00 0.80%
Infrastructure Facility Total 53,542.00 24.23%
Manufacture Of Basic Metals
Tata Steel Ltd 11,069.00 5.01%
Hindustan Zinc Ltd 3,292.00 1.49%
JSW Steel Ltd 8,793.00 3.98%
Hindalco Industries Ltd 6,601.00 2.99%
Manufacture Of Basic Metals Total 29,755.00 13.47%
Others 83,039.00 37.60%
Net Current Assets -1,674.00 -0.76%
TREPS CCIL TREPS 2019 24,860.00 11.25%
Grand Total 220,905.00 100.00%

199
STRA
TEG
IC R
EPO
RT /
STA
TUTO
RY R
EPO
RTS
/ F
INA
NCI
ALS
STA
TEM
ENTS
Life Infrastructure Fund 2 ULIF04401/01/10LINFRAST02121
Industry Security Name Market Value ( ` ‘000) % of NAV
Computer programming, consultancy and related activities
Infosys Ltd 6,981.00 6.82%
Tata Consultancy Services Ltd 5,773.00 5.64%
HCL Technologies Ltd 983.00 0.96%
Tech Mahindra Ltd 419.00 0.41%
Computer programming, consultancy and related activities Total
14,156.00 13.83%
Infrastructure Facility
NTPC Ltd 7,343.00 7.18%
Power Grid Corporation Of India Ltd
6,298.00 6.16%
GAIL (India) Ltd 6,448.00 6.30%
Adani Ports & Special Economic Zone Ltd
3,143.00 3.07%
Indraprastha Gas Ltd 815.00 0.80%
Infrastructure Facility Total 24,047.00 23.51%
Manufacture Of Basic Metals
Tata Steel Ltd 4,984.00 4.87%
Hindustan Zinc Ltd 1,455.00 1.42%
JSW Steel Ltd 3,979.00 3.89%
Hindalco Industries Ltd 3,299.00 3.22%
Manufacture Of Basic Metals Total 13,717.00 13.40%
Others 37,526.00 36.69%
Net Current Assets -561.00 -0.55%
TREPS CCIL TREPS 2019 13,421.00 13.12%
Grand Total 102,306.00 100.00%
Life Midcap Fund 1 ULIF02810/06/08LMIDCAPF01121
Industry Security Name Market Value ( ` ‘000) % of NAV
Financial and insurance activities
Yes Bank Ltd 3,139.00 1.07%
Cholamandalam Investment & Fin Co. Ltd
8,052.00 2.75%
RBL Bank Ltd 20,559.00 7.01%
Federal Bank Ltd 25,429.00 8.68%
Dhanlaxmi Bank Ltd 3,951.00 1.35%
Mahindra & Mahindra Financial Serv Ltd
9,803.00 3.34%
Financial and insurance activities Total 70,933.00 24.20%

200
Annual Report 2018-19
Appendix 5
ACCOUNTING RATIO contd...
Life Midcap Fund 1 ULIF02810/06/08LMIDCAPF01121
Industry Security Name Market Value ( ` ‘000) % of NAV
Manufacture Of Pharmaceuticals, Medicinal Chemical And Botanical Products
Aurobindo Pharma Ltd 7,989.00 2.73%
Divi's Laboratories Ltd 17,927.00 6.12%
Torrent Pharmaceuticals Ltd 7,935.00 2.71%
Manufacture Of Pharmaceuticals, Medicinal Chemical And Botanical Products Total
33,851.00 11.56%
Others 178,312.00 60.83%
Net Current Assets 9,981.00 3.41%
Grand Total 293,077.00 100.00%
Life Midcap Fund 2 ULIF04501/01/10LMIDCAPF02121
Industry Security Name Market Value ( ` ‘000) % of NAV
Financial and insurance activities
Yes Bank Ltd 6,865.00 1.22%
Cholamandalam Investment & Fin Co. Ltd
14,687.00 2.62%
RBL Bank Ltd 39,068.00 6.97%
Federal Bank Ltd 47,249.00 8.43%
Dhanlaxmi Bank Ltd 7,287.00 1.30%
Mahindra & Mahindra Financial Serv Ltd
17,881.00 3.19%
Financial and insurance activities Total 133,037.00 23.73%
Manufacture Of Pharmaceuticals, Medicinal Chemical And Botanical Products
Aurobindo Pharma Ltd 14,331.00 2.56%
Divi's Laboratories Ltd 31,473.00 5.61%
Torrent Pharmaceuticals Ltd 14,071.00 2.51%
Manufacture Of Pharmaceuticals, Medicinal Chemical And Botanical Products Total
59,875.00 10.68%
Others 278,058.00 49.60%
Net Current Assets 21,946.00 3.91%
TREPS CCIL TREPS 2019 67,700.00 12.08%
Grand Total 560,616.00 100.00%

201
STRA
TEG
IC R
EPO
RT /
STA
TUTO
RY R
EPO
RTS
/ F
INA
NCI
ALS
STA
TEM
ENTS
Life Money Market Fund 1 ULIF02910/06/08LMONMRKT01121
Industry Security Name Market Value ( ` ‘000) % of NAV
Government Securities GOI TB 2019 1,075,003.00 53.91%
GOI TB 2020 188,813.00 9.47%
Government Securities Total 1,263,816.00 63.38%
Infrastructure Facility
IRFC CP 2019 69,673.00 3.49%
PGC CP 2019 163,728.00 8.21%
NTPC CP 2019 128,528.00 6.45%
Infrastructure Facility Total 361,929.00 18.15%
Others 362,746.00 18.19%
Net Current Assets 5,631.00 0.28%
Grand Total 1,994,122.00 100.00%
Life Money Market Fund 2 ULIF03919/03/09LMONMRKT02121
Industry Security Name Market Value ( ` ‘000) % of NAV
Government Securities GOI TB 2019 15,590.00 64.55%
Government Securities Total 15,590.00 64.55%
Infrastructure Facility PGC CP 2019 1,985.00 8.22%
NTPC CP 2019 1,477.00 6.12%
Infrastructure Facility Total 3,462.00 14.34%
Others 5,567.00 23.04%
Net Current Assets -466.00 -1.93%
Grand Total 24,153.00 100.00%
Life Pure Debt Fund 1 ULIF00909/04/07LPURDEBT01121
Industry Security Name Market Value ( ` ‘000) % of NAV
Government Securities
GOI G Sec 2023 27,621.00 8.21%
GOI G Sec 2032 31,426.00 9.34%
GOI G Sec 2024 7,169.00 2.13%
GOI G Sec 2035 30,043.00 8.93%
GOI G Sec 2028 23,006.00 6.84%
GOI G Sec 2029 52,239.00 15.53%
SDL Guj G Sec 2028 3,644.00 1.08%
SDL Guj G Sec 2029 28,475.00 8.46%
Government Securities Total 203,623.00 60.52%
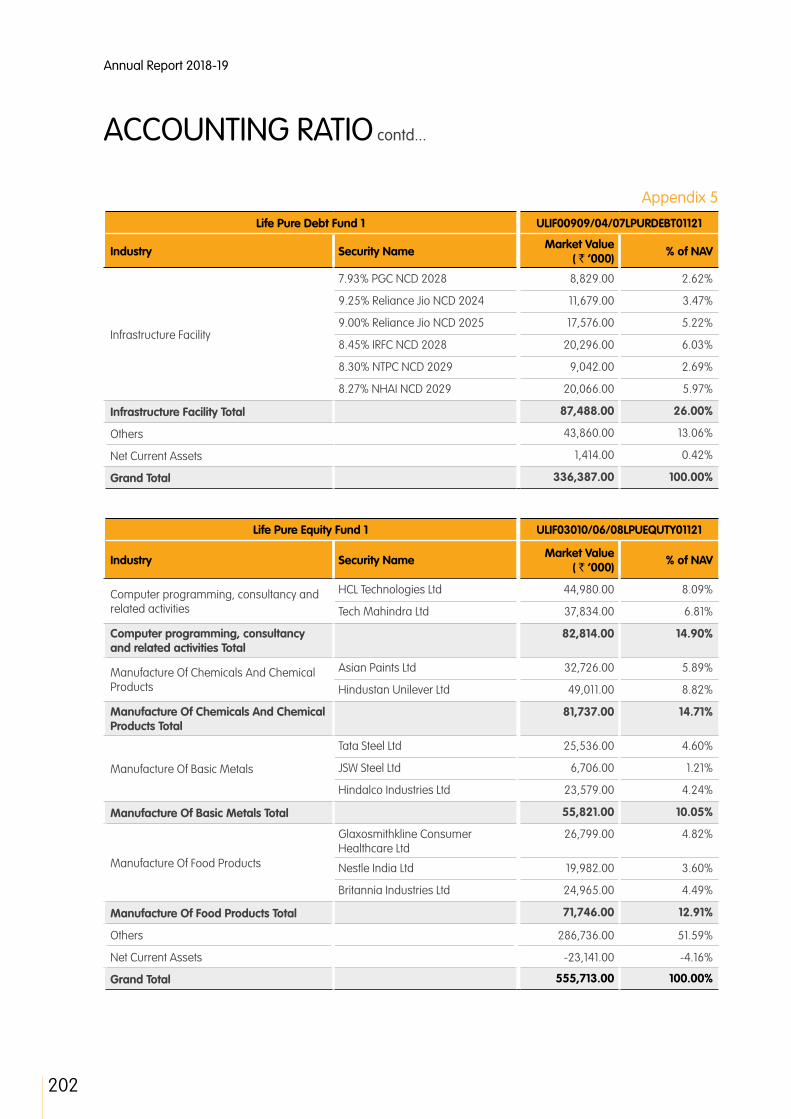
202
Annual Report 2018-19
Appendix 5
ACCOUNTING RATIO contd...
Life Pure Debt Fund 1 ULIF00909/04/07LPURDEBT01121
Industry Security Name Market Value ( ` ‘000) % of NAV
Infrastructure Facility
7.93% PGC NCD 2028 8,829.00 2.62%
9.25% Reliance Jio NCD 2024 11,679.00 3.47%
9.00% Reliance Jio NCD 2025 17,576.00 5.22%
8.45% IRFC NCD 2028 20,296.00 6.03%
8.30% NTPC NCD 2029 9,042.00 2.69%
8.27% NHAI NCD 2029 20,066.00 5.97%
Infrastructure Facility Total 87,488.00 26.00%
Others 43,860.00 13.06%
Net Current Assets 1,414.00 0.42%
Grand Total 336,387.00 100.00%
Life Pure Equity Fund 1 ULIF03010/06/08LPUEQUTY01121
Industry Security Name Market Value ( ` ‘000) % of NAV
Computer programming, consultancy and related activities
HCL Technologies Ltd 44,980.00 8.09%
Tech Mahindra Ltd 37,834.00 6.81%
Computer programming, consultancy and related activities Total
82,814.00 14.90%
Manufacture Of Chemicals And Chemical Products
Asian Paints Ltd 32,726.00 5.89%
Hindustan Unilever Ltd 49,011.00 8.82%
Manufacture Of Chemicals And Chemical Products Total
81,737.00 14.71%
Manufacture Of Basic Metals
Tata Steel Ltd 25,536.00 4.60%
JSW Steel Ltd 6,706.00 1.21%
Hindalco Industries Ltd 23,579.00 4.24%
Manufacture Of Basic Metals Total 55,821.00 10.05%
Manufacture Of Food Products
Glaxosmithkline Consumer Healthcare Ltd
26,799.00 4.82%
Nestle India Ltd 19,982.00 3.60%
Britannia Industries Ltd 24,965.00 4.49%
Manufacture Of Food Products Total 71,746.00 12.91%
Others 286,736.00 51.59%
Net Current Assets -23,141.00 -4.16%
Grand Total 555,713.00 100.00%

203
STRA
TEG
IC R
EPO
RT /
STA
TUTO
RY R
EPO
RTS
/ F
INA
NCI
ALS
STA
TEM
ENTS
Life Pure Equity Fund 2 ULIF04601/01/10LPUEQUTY02121
Industry Security Name Market Value ( ` ‘000) % of NAV
Computer programming, consultancy and related activities
HCL Technologies Ltd 156,671.00 7.41%
Tech Mahindra Ltd 127,227.00 6.01%
Computer programming, consultancy and related activities Total
283,898.00 13.42%
Manufacture Of Chemicals And Chemical Products
Asian Paints Ltd 112,869.00 5.33%
Hindustan Unilever Ltd 172,095.00 8.13%
Manufacture Of Chemicals And Chemical Products Total
284,964.00 13.46%
Manufacture Of Food Products
Glaxosmithkline Consumer Healthcare Ltd
132,037.00 6.24%
Nestle India Ltd 66,160.00 3.13%
Britannia Industries Ltd 90,729.00 4.29%
Manufacture Of Food Products Total 288,926.00 13.66%
Others 1,226,597.00 57.98%
Net Current Assets 31,322.00 1.48%
Grand Total 2,115,707.00 100.00%
Life Super Growth Fund 1 ULIF01009/04/07LSPRGRWT01121
Industry Security Name Market Value ( ` ‘000) % of NAV
Computer programming, consultancy and related activities
Infosys Ltd 12,402.00 5.62%
Tata Consultancy Services Ltd 7,923.00 3.59%
HCL Technologies Ltd 3,273.00 1.48%
Tech Mahindra Ltd 2,242.00 1.02%
Computer programming, consultancy and related activities Total
25,840.00 11.71%
Financial and insurance activities
HDFC Bank Ltd 16,221.00 7.36%
ICICI Bank Ltd 11,588.00 5.26%
State Bank Of India 3,588.00 1.63%
Axis Bank Ltd 5,735.00 2.60%
Yes Bank Ltd 2,336.00 1.06%
Kotak Mahindra Bank Ltd 7,252.00 3.29%
Housing Deve Fin Corp Ltd 1,679.00 0.76%
Bajaj Finance Ltd 1,827.00 0.83%
Federal Bank Ltd 2,225.00 1.01%
Financial and insurance activities Total 52,451.00 23.80%
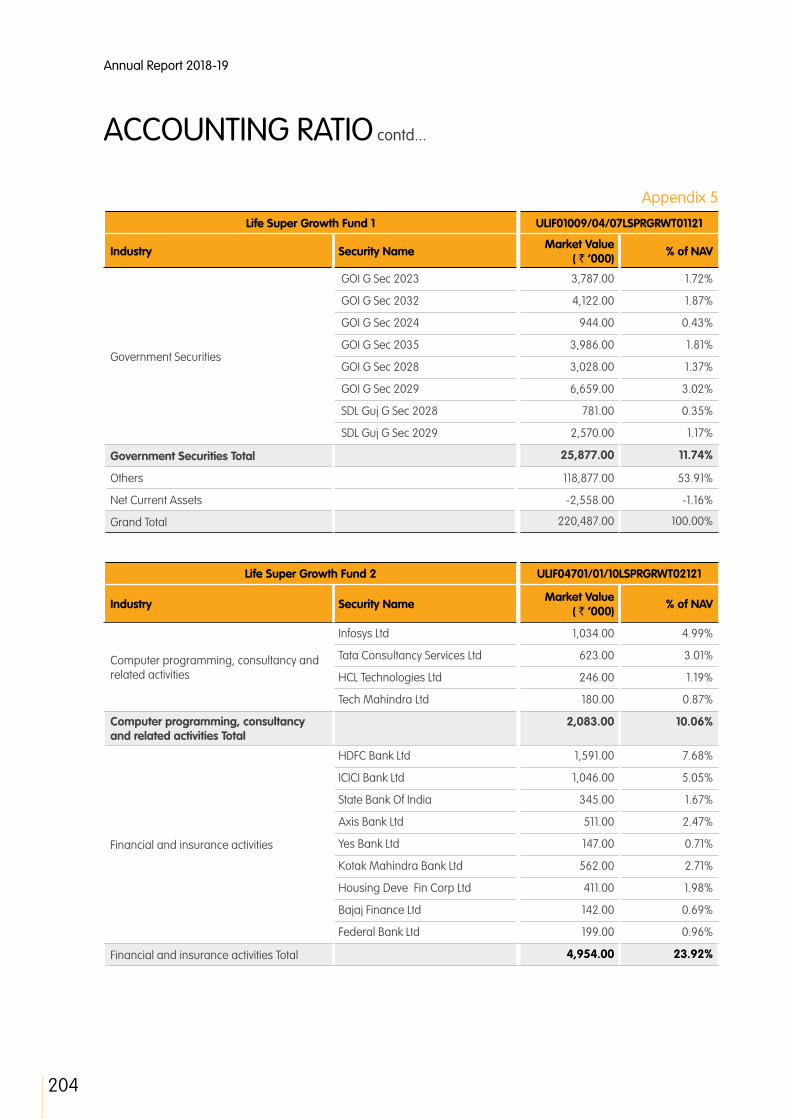
204
Annual Report 2018-19
Appendix 5
ACCOUNTING RATIO contd...
Life Super Growth Fund 1 ULIF01009/04/07LSPRGRWT01121
Industry Security Name Market Value ( ` ‘000) % of NAV
Government Securities
GOI G Sec 2023 3,787.00 1.72%
GOI G Sec 2032 4,122.00 1.87%
GOI G Sec 2024 944.00 0.43%
GOI G Sec 2035 3,986.00 1.81%
GOI G Sec 2028 3,028.00 1.37%
GOI G Sec 2029 6,659.00 3.02%
SDL Guj G Sec 2028 781.00 0.35%
SDL Guj G Sec 2029 2,570.00 1.17%
Government Securities Total 25,877.00 11.74%
Others 118,877.00 53.91%
Net Current Assets -2,558.00 -1.16%
Grand Total 220,487.00 100.00%
Life Super Growth Fund 2 ULIF04701/01/10LSPRGRWT02121
Industry Security Name Market Value ( ` ‘000) % of NAV
Computer programming, consultancy and related activities
Infosys Ltd 1,034.00 4.99%
Tata Consultancy Services Ltd 623.00 3.01%
HCL Technologies Ltd 246.00 1.19%
Tech Mahindra Ltd 180.00 0.87%
Computer programming, consultancy and related activities Total
2,083.00 10.06%
Financial and insurance activities
HDFC Bank Ltd 1,591.00 7.68%
ICICI Bank Ltd 1,046.00 5.05%
State Bank Of India 345.00 1.67%
Axis Bank Ltd 511.00 2.47%
Yes Bank Ltd 147.00 0.71%
Kotak Mahindra Bank Ltd 562.00 2.71%
Housing Deve Fin Corp Ltd 411.00 1.98%
Bajaj Finance Ltd 142.00 0.69%
Federal Bank Ltd 199.00 0.96%
Financial and insurance activities Total 4,954.00 23.92%
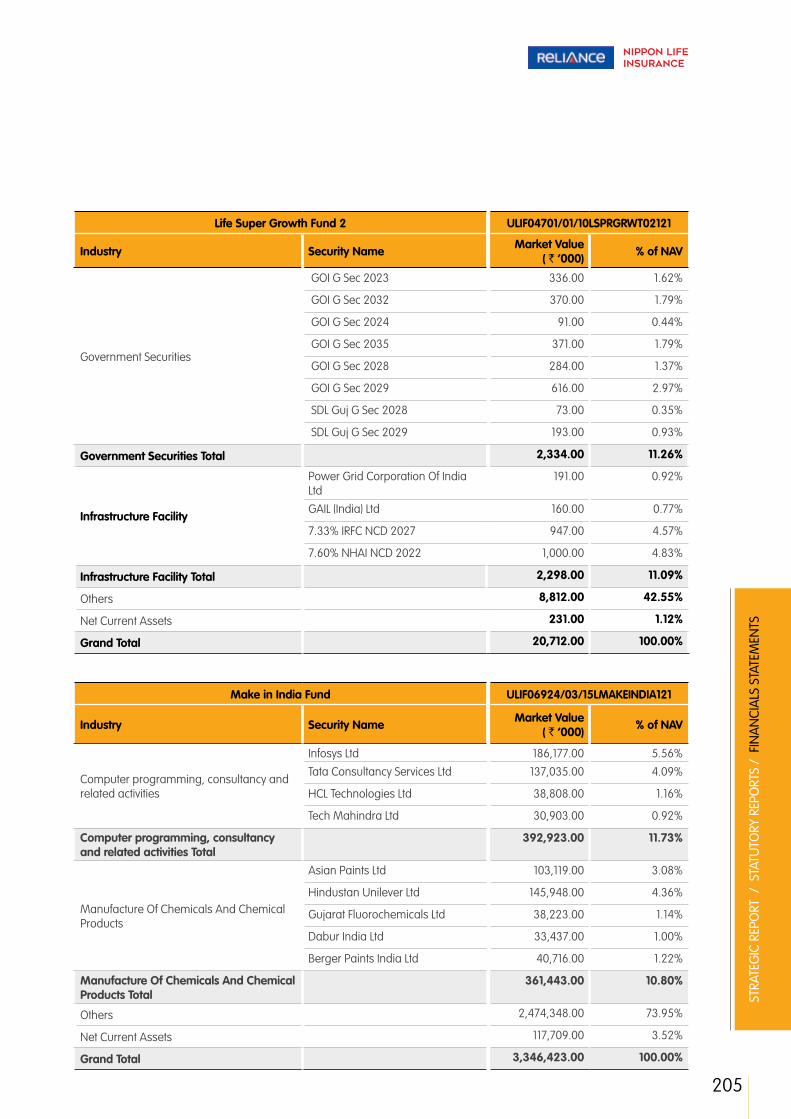
205
STRA
TEG
IC R
EPO
RT /
STA
TUTO
RY R
EPO
RTS
/ F
INA
NCI
ALS
STA
TEM
ENTS
Life Super Growth Fund 2 ULIF04701/01/10LSPRGRWT02121
Industry Security Name Market Value ( ` ‘000) % of NAV
Government Securities
GOI G Sec 2023 336.00 1.62%
GOI G Sec 2032 370.00 1.79%
GOI G Sec 2024 91.00 0.44%
GOI G Sec 2035 371.00 1.79%
GOI G Sec 2028 284.00 1.37%
GOI G Sec 2029 616.00 2.97%
SDL Guj G Sec 2028 73.00 0.35%
SDL Guj G Sec 2029 193.00 0.93%
Government Securities Total 2,334.00 11.26%
Infrastructure Facility
Power Grid Corporation Of India Ltd
191.00 0.92%
GAIL (India) Ltd 160.00 0.77%
7.33% IRFC NCD 2027 947.00 4.57%
7.60% NHAI NCD 2022 1,000.00 4.83%
Infrastructure Facility Total 2,298.00 11.09%
Others 8,812.00 42.55%
Net Current Assets 231.00 1.12%
Grand Total 20,712.00 100.00%
Make in India Fund ULIF06924/03/15LMAKEINDIA121
Industry Security Name Market Value ( ` ‘000) % of NAV
Computer programming, consultancy and related activities
Infosys Ltd 186,177.00 5.56%
Tata Consultancy Services Ltd 137,035.00 4.09%
HCL Technologies Ltd 38,808.00 1.16%
Tech Mahindra Ltd 30,903.00 0.92%
Computer programming, consultancy and related activities Total
392,923.00 11.73%
Manufacture Of Chemicals And Chemical Products
Asian Paints Ltd 103,119.00 3.08%
Hindustan Unilever Ltd 145,948.00 4.36%
Gujarat Fluorochemicals Ltd 38,223.00 1.14%
Dabur India Ltd 33,437.00 1.00%
Berger Paints India Ltd 40,716.00 1.22%
Manufacture Of Chemicals And Chemical Products Total
361,443.00 10.80%
Others 2,474,348.00 73.95%
Net Current Assets 117,709.00 3.52%
Grand Total 3,346,423.00 100.00%
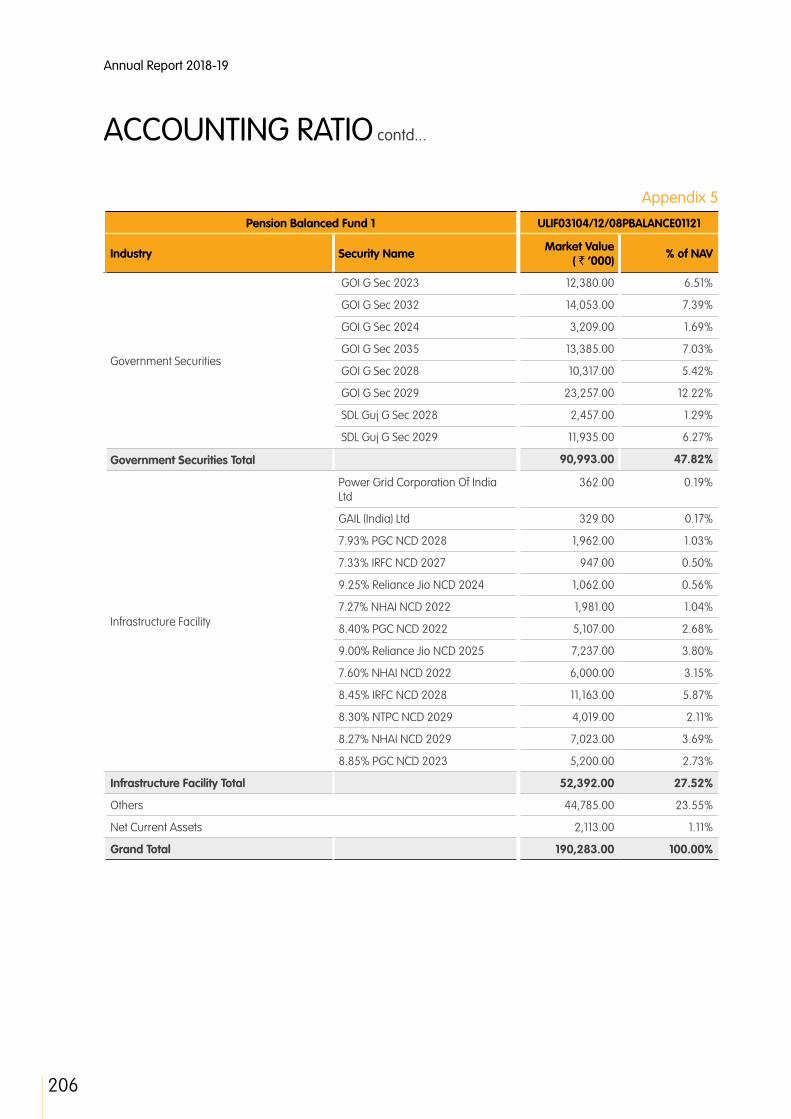
206
Annual Report 2018-19
Appendix 5
ACCOUNTING RATIO contd...
Pension Balanced Fund 1 ULIF03104/12/08PBALANCE01121
Industry Security Name Market Value ( ` ‘000) % of NAV
Government Securities
GOI G Sec 2023 12,380.00 6.51%
GOI G Sec 2032 14,053.00 7.39%
GOI G Sec 2024 3,209.00 1.69%
GOI G Sec 2035 13,385.00 7.03%
GOI G Sec 2028 10,317.00 5.42%
GOI G Sec 2029 23,257.00 12.22%
SDL Guj G Sec 2028 2,457.00 1.29%
SDL Guj G Sec 2029 11,935.00 6.27%
Government Securities Total 90,993.00 47.82%
Infrastructure Facility
Power Grid Corporation Of India Ltd
362.00 0.19%
GAIL (India) Ltd 329.00 0.17%
7.93% PGC NCD 2028 1,962.00 1.03%
7.33% IRFC NCD 2027 947.00 0.50%
9.25% Reliance Jio NCD 2024 1,062.00 0.56%
7.27% NHAI NCD 2022 1,981.00 1.04%
8.40% PGC NCD 2022 5,107.00 2.68%
9.00% Reliance Jio NCD 2025 7,237.00 3.80%
7.60% NHAI NCD 2022 6,000.00 3.15%
8.45% IRFC NCD 2028 11,163.00 5.87%
8.30% NTPC NCD 2029 4,019.00 2.11%
8.27% NHAI NCD 2029 7,023.00 3.69%
8.85% PGC NCD 2023 5,200.00 2.73%
Infrastructure Facility Total 52,392.00 27.52%
Others 44,785.00 23.55%
Net Current Assets 2,113.00 1.11%
Grand Total 190,283.00 100.00%

207
STRA
TEG
IC R
EPO
RT /
STA
TUTO
RY R
EPO
RTS
/ F
INA
NCI
ALS
STA
TEM
ENTS
Pension Balanced Fund 2 ULIF04801/01/10PBALANCE02121
Industry Security Name Market Value ( ` ‘000) % of NAV
Government Securities
GOI G Sec 2023 1,700.00 4.28%
GOI G Sec 2032 3,002.00 7.56%
GOI G Sec 2024 691.00 1.74%
GOI G Sec 2035 2,843.00 7.16%
GOI G Sec 2028 2,205.00 5.56%
GOI G Sec 2029 4,970.00 12.52%
SDL Guj G Sec 2028 552.00 1.39%
SDL Guj G Sec 2029 2,551.00 6.43%
Government Securities Total 18,514.00 46.64%
Infrastructure Facility
Power Grid Corporation Of India Ltd
89.00 0.22%
GAIL (India) Ltd 72.00 0.18%
7.33% IRFC NCD 2027 2,841.00 7.16%
9.25% Reliance Jio NCD 2024 2,124.00 5.35%
8.40% PGC NCD 2022 2,043.00 5.15%
7.60% NHAI NCD 2022 2,000.00 5.04%
8.30% NTPC NCD 2029 2,009.00 5.06%
8.27% NHAI NCD 2029 1,003.00 2.53%
Infrastructure Facility Total 12,181.00 30.69%
Others 9,357.00 23.59%
Net Current Assets -366.00 -0.92%
Grand Total 39,686.00 100.00%
Pension Capital Secure Fund 1 ULIF00501/11/06PCAPTSEC01121
Industry Security Name Market Value ( ` ‘000) % of NAV
Government Securities GOI TB 2019 19,191.00 66.82%
Government Securities Total 19,191.00 66.82%
Infrastructure Facility
IRFC CP 2019 995.00 3.46%
PGC CP 2019 992.00 3.45%
NTPC CP 2019 2,462.00 8.57%
Infrastructure Facility Total 4,449.00 15.48%
Others 5,110.00 17.80%
Net Current Assets -28.00 -0.10%
Grand Total 28,722.00 100.00%
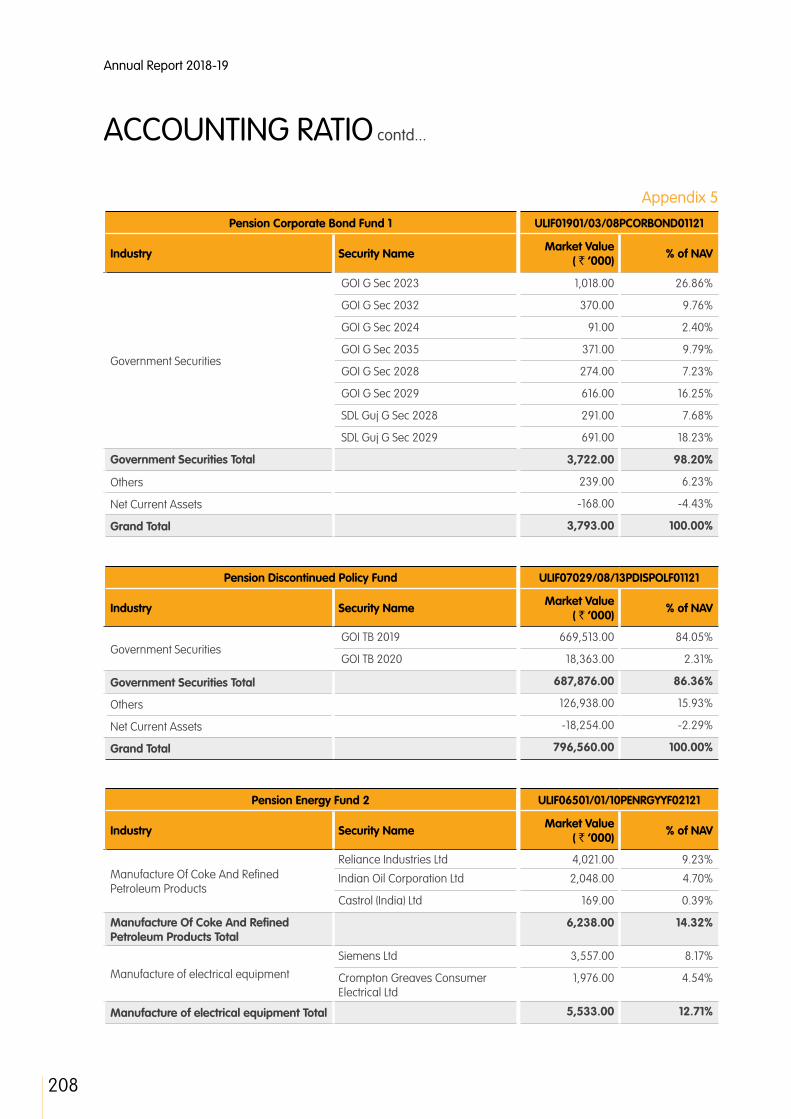
208
Annual Report 2018-19
Appendix 5
ACCOUNTING RATIO contd...
Pension Corporate Bond Fund 1 ULIF01901/03/08PCORBOND01121
Industry Security Name Market Value ( ` ‘000) % of NAV
Government Securities
GOI G Sec 2023 1,018.00 26.86%
GOI G Sec 2032 370.00 9.76%
GOI G Sec 2024 91.00 2.40%
GOI G Sec 2035 371.00 9.79%
GOI G Sec 2028 274.00 7.23%
GOI G Sec 2029 616.00 16.25%
SDL Guj G Sec 2028 291.00 7.68%
SDL Guj G Sec 2029 691.00 18.23%
Government Securities Total 3,722.00 98.20%
Others 239.00 6.23%
Net Current Assets -168.00 -4.43%
Grand Total 3,793.00 100.00%
Pension Discontinued Policy Fund ULIF07029/08/13PDISPOLF01121
Industry Security Name Market Value ( ` ‘000) % of NAV
Government Securities GOI TB 2019 669,513.00 84.05%
GOI TB 2020 18,363.00 2.31%
Government Securities Total 687,876.00 86.36%
Others 126,938.00 15.93%
Net Current Assets -18,254.00 -2.29%
Grand Total 796,560.00 100.00%
Pension Energy Fund 2 ULIF06501/01/10PENRGYYF02121
Industry Security Name Market Value ( ` ‘000) % of NAV
Manufacture Of Coke And Refined Petroleum Products
Reliance Industries Ltd 4,021.00 9.23%
Indian Oil Corporation Ltd 2,048.00 4.70%
Castrol (India) Ltd 169.00 0.39%
Manufacture Of Coke And Refined Petroleum Products Total
6,238.00 14.32%
Manufacture of electrical equipment
Siemens Ltd 3,557.00 8.17%
Crompton Greaves Consumer Electrical Ltd
1,976.00 4.54%
Manufacture of electrical equipment Total 5,533.00 12.71%
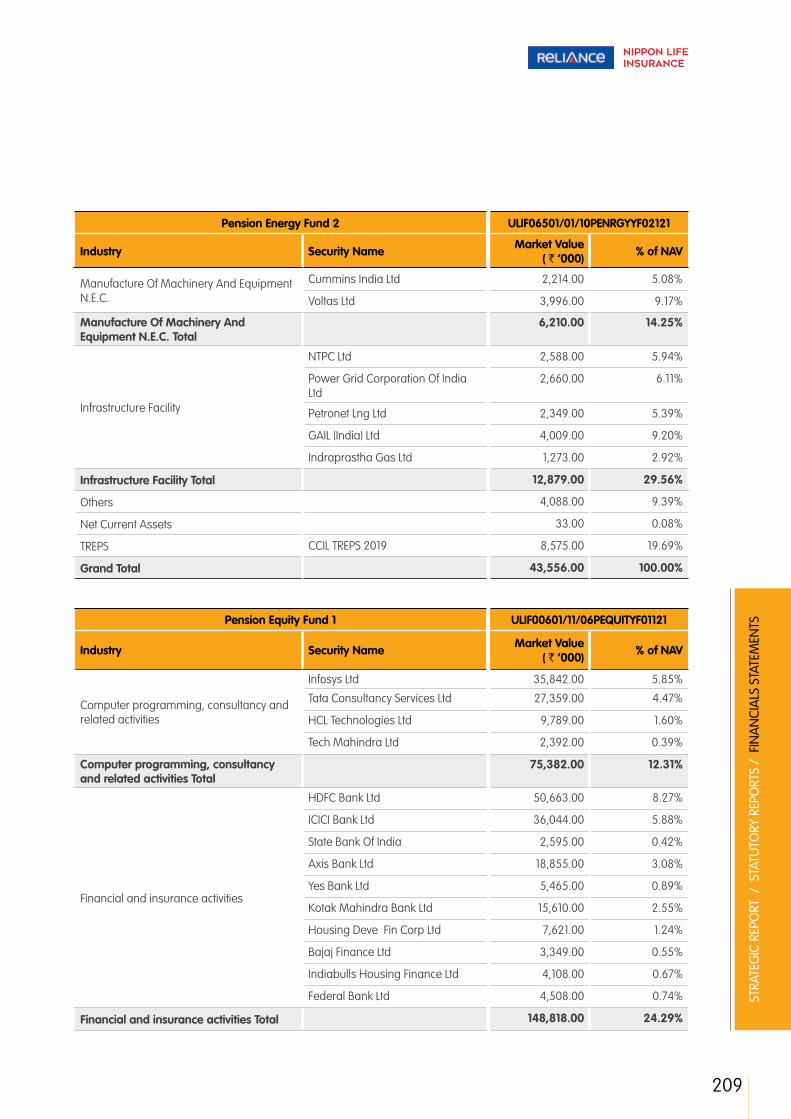
209
STRA
TEG
IC R
EPO
RT /
STA
TUTO
RY R
EPO
RTS
/ F
INA
NCI
ALS
STA
TEM
ENTS
Pension Energy Fund 2 ULIF06501/01/10PENRGYYF02121
Industry Security Name Market Value ( ` ‘000) % of NAV
Manufacture Of Machinery And Equipment N.E.C.
Cummins India Ltd 2,214.00 5.08%
Voltas Ltd 3,996.00 9.17%
Manufacture Of Machinery And Equipment N.E.C. Total
6,210.00 14.25%
Infrastructure Facility
NTPC Ltd 2,588.00 5.94%
Power Grid Corporation Of India Ltd
2,660.00 6.11%
Petronet Lng Ltd 2,349.00 5.39%
GAIL (India) Ltd 4,009.00 9.20%
Indraprastha Gas Ltd 1,273.00 2.92%
Infrastructure Facility Total 12,879.00 29.56%
Others 4,088.00 9.39%
Net Current Assets 33.00 0.08%
TREPS CCIL TREPS 2019 8,575.00 19.69%
Grand Total 43,556.00 100.00%
Pension Equity Fund 1 ULIF00601/11/06PEQUITYF01121
Industry Security Name Market Value ( ` ‘000) % of NAV
Computer programming, consultancy and related activities
Infosys Ltd 35,842.00 5.85%
Tata Consultancy Services Ltd 27,359.00 4.47%
HCL Technologies Ltd 9,789.00 1.60%
Tech Mahindra Ltd 2,392.00 0.39%
Computer programming, consultancy and related activities Total
75,382.00 12.31%
Financial and insurance activities
HDFC Bank Ltd 50,663.00 8.27%
ICICI Bank Ltd 36,044.00 5.88%
State Bank Of India 2,595.00 0.42%
Axis Bank Ltd 18,855.00 3.08%
Yes Bank Ltd 5,465.00 0.89%
Kotak Mahindra Bank Ltd 15,610.00 2.55%
Housing Deve Fin Corp Ltd 7,621.00 1.24%
Bajaj Finance Ltd 3,349.00 0.55%
Indiabulls Housing Finance Ltd 4,108.00 0.67%
Federal Bank Ltd 4,508.00 0.74%
Financial and insurance activities Total 148,818.00 24.29%

210
Annual Report 2018-19
Appendix 5
ACCOUNTING RATIO contd...
Pension Equity Fund 1 ULIF00601/11/06PEQUITYF01121
Industry Security Name Market Value ( ` ‘000) % of NAV
Manufacture Of Coke And Refined Petroleum Products
Reliance Industries Ltd 56,927.00 9.29%
Hindustan Petroleum Corporation Ltd
3,506.00 0.57%
Bharat Petroleum Corporation Ltd 3,457.00 0.56%
Manufacture Of Coke And Refined Petroleum Products Total
63,890.00 10.42%
Others 330,736.00 53.98%
Net Current Assets -6,133.00 -1.00%
Grand Total 612,693.00 100.00%
Pension Equity Fund 2 ULIF03204/12/08PEQUITYF02121
Industry Security Name Market Value ( ` ‘000) % of NAV
Computer programming, consultancy and related activities
Infosys Ltd 50,690.00 5.93%
Tata Consultancy Services Ltd 38,320.00 4.49%
HCL Technologies Ltd 13,746.00 1.61%
Tech Mahindra Ltd 3,350.00 0.39%
Computer programming, consultancy and related activities Total
106,106.00 12.42%
Financial and insurance activities
HDFC Bank Ltd 72,591.00 8.50%
ICICI Bank Ltd 51,437.00 6.02%
State Bank Of India 3,634.00 0.43%
Axis Bank Ltd 25,163.00 2.95%
Yes Bank Ltd 7,637.00 0.89%
Kotak Mahindra Bank Ltd 20,219.00 2.37%
Housing Deve Fin Corp Ltd 4,566.00 0.53%
Bajaj Finance Ltd 5,267.00 0.62%
Indiabulls Housing Finance Ltd 6,335.00 0.74%
Federal Bank Ltd 6,118.00 0.72%
Financial and insurance activities Total 202,967.00 23.77%
Manufacture Of Coke And Refined Petroleum Products
Reliance Industries Ltd 77,674.00 9.09%
Hindustan Petroleum Corporation Ltd 5,529.00 0.65%
Bharat Petroleum Corporation Ltd 5,453.00 0.64%
Manufacture Of Coke And Refined Petroleum Products Total
88,656.00 10.38%
Others 435,887.00 51.02%
Net Current Assets 20,596.00 2.41%
Grand Total 854,212.00 100.00%
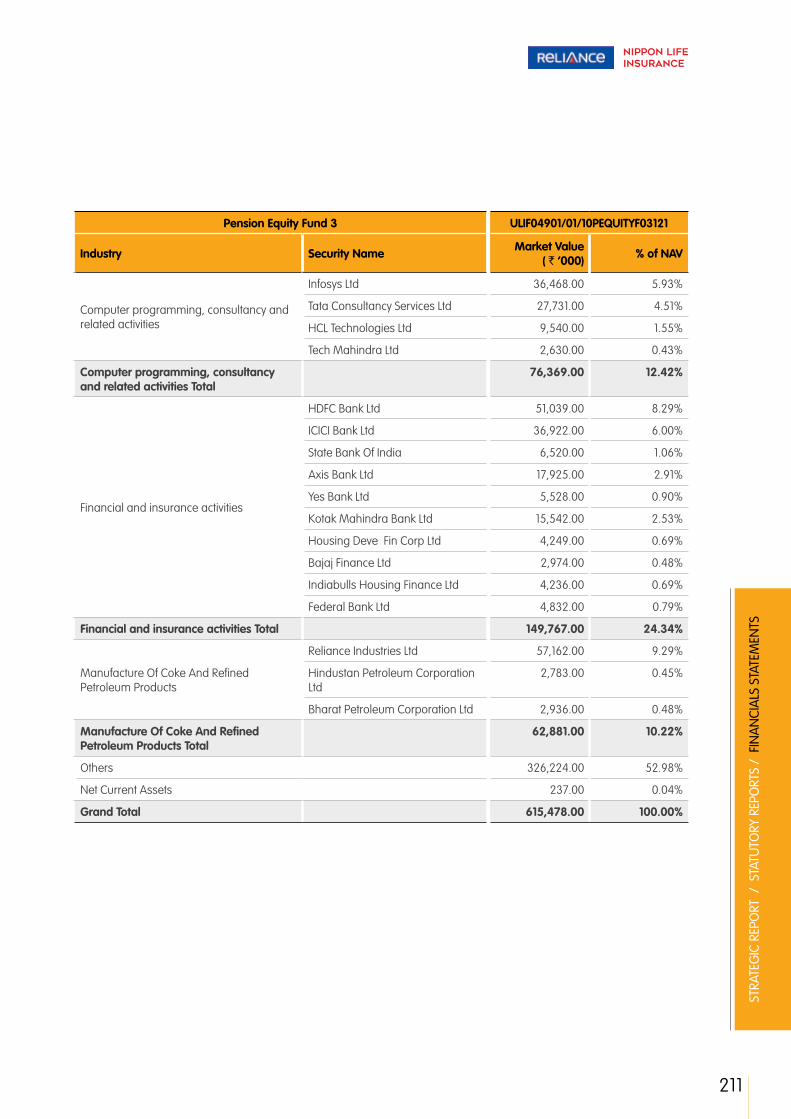
211
STRA
TEG
IC R
EPO
RT /
STA
TUTO
RY R
EPO
RTS
/ F
INA
NCI
ALS
STA
TEM
ENTS
Pension Equity Fund 3 ULIF04901/01/10PEQUITYF03121
Industry Security Name Market Value ( ` ‘000) % of NAV
Computer programming, consultancy and related activities
Infosys Ltd 36,468.00 5.93%
Tata Consultancy Services Ltd 27,731.00 4.51%
HCL Technologies Ltd 9,540.00 1.55%
Tech Mahindra Ltd 2,630.00 0.43%
Computer programming, consultancy and related activities Total
76,369.00 12.42%
Financial and insurance activities
HDFC Bank Ltd 51,039.00 8.29%
ICICI Bank Ltd 36,922.00 6.00%
State Bank Of India 6,520.00 1.06%
Axis Bank Ltd 17,925.00 2.91%
Yes Bank Ltd 5,528.00 0.90%
Kotak Mahindra Bank Ltd 15,542.00 2.53%
Housing Deve Fin Corp Ltd 4,249.00 0.69%
Bajaj Finance Ltd 2,974.00 0.48%
Indiabulls Housing Finance Ltd 4,236.00 0.69%
Federal Bank Ltd 4,832.00 0.79%
Financial and insurance activities Total 149,767.00 24.34%
Manufacture Of Coke And Refined Petroleum Products
Reliance Industries Ltd 57,162.00 9.29%
Hindustan Petroleum Corporation Ltd
2,783.00 0.45%
Bharat Petroleum Corporation Ltd 2,936.00 0.48%
Manufacture Of Coke And Refined Petroleum Products Total
62,881.00 10.22%
Others 326,224.00 52.98%
Net Current Assets 237.00 0.04%
Grand Total 615,478.00 100.00%
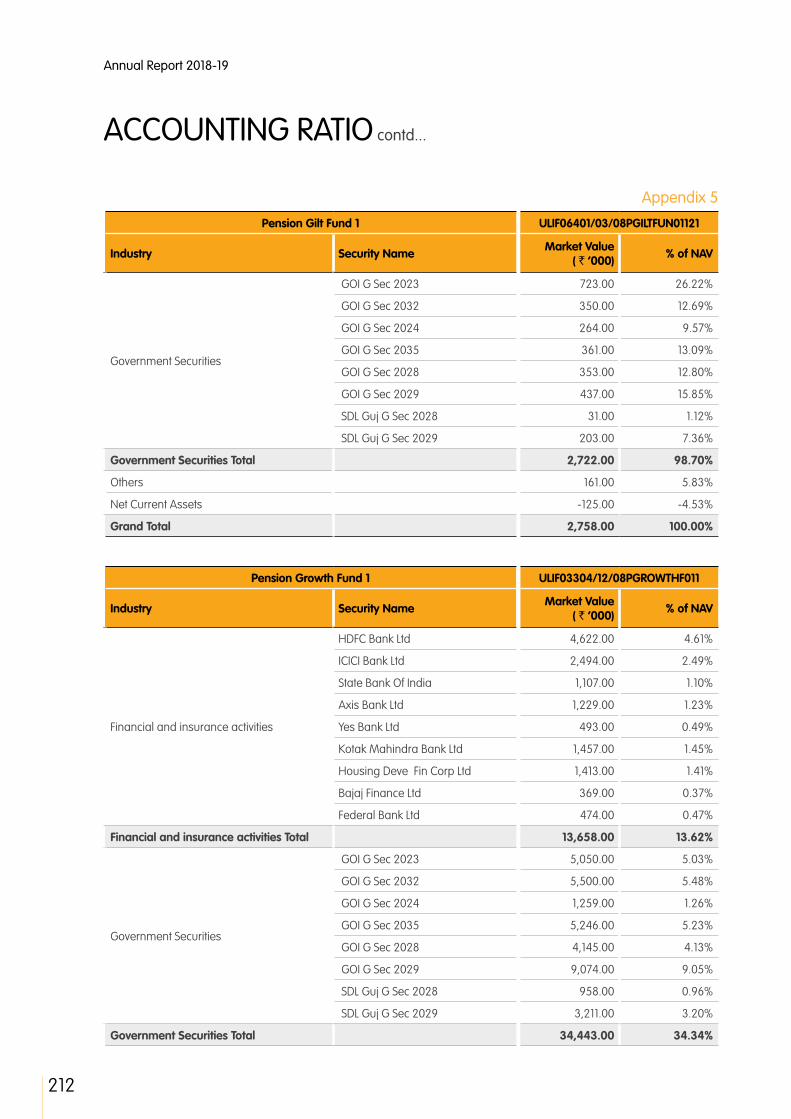
212
Annual Report 2018-19
Appendix 5
ACCOUNTING RATIO contd...
Pension Gilt Fund 1 ULIF06401/03/08PGILTFUN01121
Industry Security Name Market Value ( ` ‘000) % of NAV
Government Securities
GOI G Sec 2023 723.00 26.22%
GOI G Sec 2032 350.00 12.69%
GOI G Sec 2024 264.00 9.57%
GOI G Sec 2035 361.00 13.09%
GOI G Sec 2028 353.00 12.80%
GOI G Sec 2029 437.00 15.85%
SDL Guj G Sec 2028 31.00 1.12%
SDL Guj G Sec 2029 203.00 7.36%
Government Securities Total 2,722.00 98.70%
Others 161.00 5.83%
Net Current Assets -125.00 -4.53%
Grand Total 2,758.00 100.00%
Pension Growth Fund 1 ULIF03304/12/08PGROWTHF011
Industry Security Name Market Value ( ` ‘000) % of NAV
Financial and insurance activities
HDFC Bank Ltd 4,622.00 4.61%
ICICI Bank Ltd 2,494.00 2.49%
State Bank Of India 1,107.00 1.10%
Axis Bank Ltd 1,229.00 1.23%
Yes Bank Ltd 493.00 0.49%
Kotak Mahindra Bank Ltd 1,457.00 1.45%
Housing Deve Fin Corp Ltd 1,413.00 1.41%
Bajaj Finance Ltd 369.00 0.37%
Federal Bank Ltd 474.00 0.47%
Financial and insurance activities Total 13,658.00 13.62%
Government Securities
GOI G Sec 2023 5,050.00 5.03%
GOI G Sec 2032 5,500.00 5.48%
GOI G Sec 2024 1,259.00 1.26%
GOI G Sec 2035 5,246.00 5.23%
GOI G Sec 2028 4,145.00 4.13%
GOI G Sec 2029 9,074.00 9.05%
SDL Guj G Sec 2028 958.00 0.96%
SDL Guj G Sec 2029 3,211.00 3.20%
Government Securities Total 34,443.00 34.34%

213
STRA
TEG
IC R
EPO
RT /
STA
TUTO
RY R
EPO
RTS
/ F
INA
NCI
ALS
STA
TEM
ENTS
Pension Growth Fund 1 ULIF03304/12/08PGROWTHF01121
Industry Security Name Market Value ( ` ‘000) % of NAV
Infrastructure Facility
Power Grid Corporation Of India Ltd
335.00 0.33%
GAIL (India) Ltd 399.00 0.40%
7.93% PGC NCD 2028 981.00 0.98%
7.33% IRFC NCD 2027 1,894.00 1.89%
9.25% Reliance Jio NCD 2024 2,124.00 2.12%
9.00% Reliance Jio NCD 2025 2,068.00 2.06%
8.45% IRFC NCD 2028 1,015.00 1.01%
8.27% NHAI NCD 2029 4,013.00 4.00%
8.85% PGC NCD 2023 3,900.00 3.89%
8.35% IRFC NCD 2029 5,048.00 5.03%
Infrastructure Facility Total 21,777.00 21.71%
Others 28,964.00 28.88%
Net Current Assets 1,458.00 1.45%
Grand Total 100,300.00 100.00%
Pension Growth Fund 2 ULIF05001/01/10PGROWTHF02121
Industry Security Name Market Value ( ` ‘000) % of NAV
Financial and insurance activities
HDFC Bank Ltd 2,157.00 4.17%
ICICI Bank Ltd 1,318.00 2.55%
State Bank Of India 571.00 1.10%
Axis Bank Ltd 640.00 1.24%
Yes Bank Ltd 257.00 0.50%
Kotak Mahindra Bank Ltd 738.00 1.43%
Housing Deve Fin Corp Ltd 793.00 1.53%
Bajaj Finance Ltd 182.00 0.35%
Federal Bank Ltd 250.00 0.48%
Financial and insurance activities Total 6,906.00 13.35%

214
Annual Report 2018-19
Appendix 5
ACCOUNTING RATIO contd...
Pension Growth Fund 2 ULIF05001/01/10PGROWTHF02121
Industry Security Name Market Value ( ` ‘000) % of NAV
Government Securities
GOI G Sec 2023 2,627.00 5.08%
GOI G Sec 2032 2,857.00 5.52%
GOI G Sec 2024 660.00 1.28%
GOI G Sec 2035 2,726.00 5.27%
GOI G Sec 2028 2,136.00 4.13%
GOI G Sec 2029 4,701.00 9.08%
SDL Guj G Sec 2028 489.00 0.94%
SDL Guj G Sec 2029 1,625.00 3.14%
Government Securities Total 17,821.00 34.44%
Infrastructure Facility
Power Grid Corporation Of India Ltd
164.00 0.32%
GAIL (India) Ltd 200.00 0.39%
7.33% IRFC NCD 2027 2,841.00 5.49%
9.25% Reliance Jio NCD 2024 2,123.00 4.10%
8.40% PGC NCD 2022 1,021.00 1.97%
9.00% Reliance Jio NCD 2025 1,034.00 2.00%
7.60% NHAI NCD 2022 1,000.00 1.93%
8.27% NHAI NCD 2029 3,010.00 5.82%
8.35% IRFC NCD 2029 1,010.00 1.95%
Infrastructure Facility Total 12,403.00 23.97%
Others 14,131.00 27.27%
Net Current Assets 500.00 0.97%
Grand Total 51,761.00 100.00%

215
STRA
TEG
IC R
EPO
RT /
STA
TUTO
RY R
EPO
RTS
/ F
INA
NCI
ALS
STA
TEM
ENTS
Pension Infrastructure Fund 2 ULIF06601/01/10PINFRAST02121
Industry Security Name Market Value ( ` ‘000) % of NAV
Computer programming, consultancy and related activities
Infosys Ltd 2,566.00 6.79%
Tata Consultancy Services Ltd 2,084.00 5.51%
HCL Technologies Ltd 365.00 0.97%
Tech Mahindra Ltd 214.00 0.57%
Computer programming, consultancy and related activities Total
5,229.00 13.84%
Infrastructure Facility
NTPC Ltd 2,745.00 7.26%
Power Grid Corporation Of India Ltd
2,272.00 6.01%
GAIL (India) Ltd 2,456.00 6.49%
Adani Ports & Special Economic Zone Ltd
1,135.00 3.00%
Indraprastha Gas Ltd 299.00 0.79%
Infrastructure Facility Total 8,907.00 23.55%
Manufacture Of Basic Metals
Tata Steel Ltd 1,848.00 4.89%
Hindustan Zinc Ltd 557.00 1.47%
JSW Steel Ltd 1,466.00 3.88%
Hindalco Industries Ltd 1,142.00 3.02%
Manufacture Of Basic Metals Total 5,013.00 13.26%
Others 14,036.00 37.11%
Net Current Assets -94.00 -0.25%
TREPS CCIL TREPS 2019 4,725.00 12.49%
Grand Total 37,816.00 100.00%

216
Annual Report 2018-19
Appendix 5
ACCOUNTING RATIO contd...
Pension Midcap Fund 2 ULIF05101/01/10PMIDCAPF02121
Industry Security Name Market Value ( ` ‘000) % of NAV
Financial and insurance activities
Yes Bank Ltd 1,624.00 1.22%
Cholamandalam Investment & Fin Co. Ltd
3,465.00 2.60%
RBL Bank Ltd 9,150.00 6.86%
Federal Bank Ltd 11,026.00 8.27%
Dhanlaxmi Bank Ltd 1,782.00 1.34%
Mahindra & Mahindra Financial Serv Ltd
4,218.00 3.16%
Financial and insurance activities Total 31,265.00 23.45%
Manufacture Of Pharmaceuticals, Medicinal Chemical And Botanical Products
Aurobindo Pharma Ltd 3,354.00 2.52%
Divi's Laboratories Ltd 7,689.00 5.77%
Torrent Pharmaceuticals Ltd 3,404.00 2.55%
Manufacture Of Pharmaceuticals, Medicinal Chemical And Botanical Products Total
14,447.00 10.84%
Others 80,545.00 60.39%
Net Current Assets 7,093.00 5.32%
Grand Total 133,350.00 100.00%

217
STRA
TEG
IC R
EPO
RT /
STA
TUTO
RY R
EPO
RTS
/ F
INA
NCI
ALS
STA
TEM
ENTS
Pension Money Market Fund 2 ULIF05201/01/10PMONMRKT02121
Industry Security Name Market Value ( ` ‘000) % of NAV
Government Securities GOI TB 2019 63,003.00 59.53%
GOI TB 2020 6,121.00 5.78%
Government Securities Total 69,124.00 65.31%
Infrastructure Facility
IRFC CP 2019 4,977.00 4.70%
PGC CP 2019 3,969.00 3.75%
NTPC CP 2019 7,879.00 7.45%
Infrastructure Facility Total 16,825.00 15.90%
Others 20,714.00 19.58%
Net Current Assets -837.00 -0.79%
Grand Total 105,826.00 100.00%
Pension Pure Equity Fund 2 ULIF05301/01/10PPUEQUTY02121
Industry Security Name Market Value ( ` ‘000) % of NAV
Computer programming, consultancy and related activities
HCL Technologies Ltd 8,637.00 7.68%
Tech Mahindra Ltd 7,241.00 6.44%
Computer programming, consultancy and related activities Total
15,878.00 14.12%
Manufacture Of Chemicals And Chemical Products
Asian Paints Ltd 6,329.00 5.63%
Hindustan Unilever Ltd 9,536.00 8.48%
Manufacture Of Chemicals And Chemical Products Total
15,865.00 14.11%
Manufacture Of Food Products
Glaxosmithkline Consumer Healthcare Ltd
5,211.00 4.63%
Nestle India Ltd 3,836.00 3.41%
Britannia Industries Ltd 4,838.00 4.30%
Manufacture Of Food Products Total 13,885.00 12.34%
Others 68,422.00 60.81%
Net Current Assets -1,558.00 -1.38%
Grand Total 112,492.00 100.00%
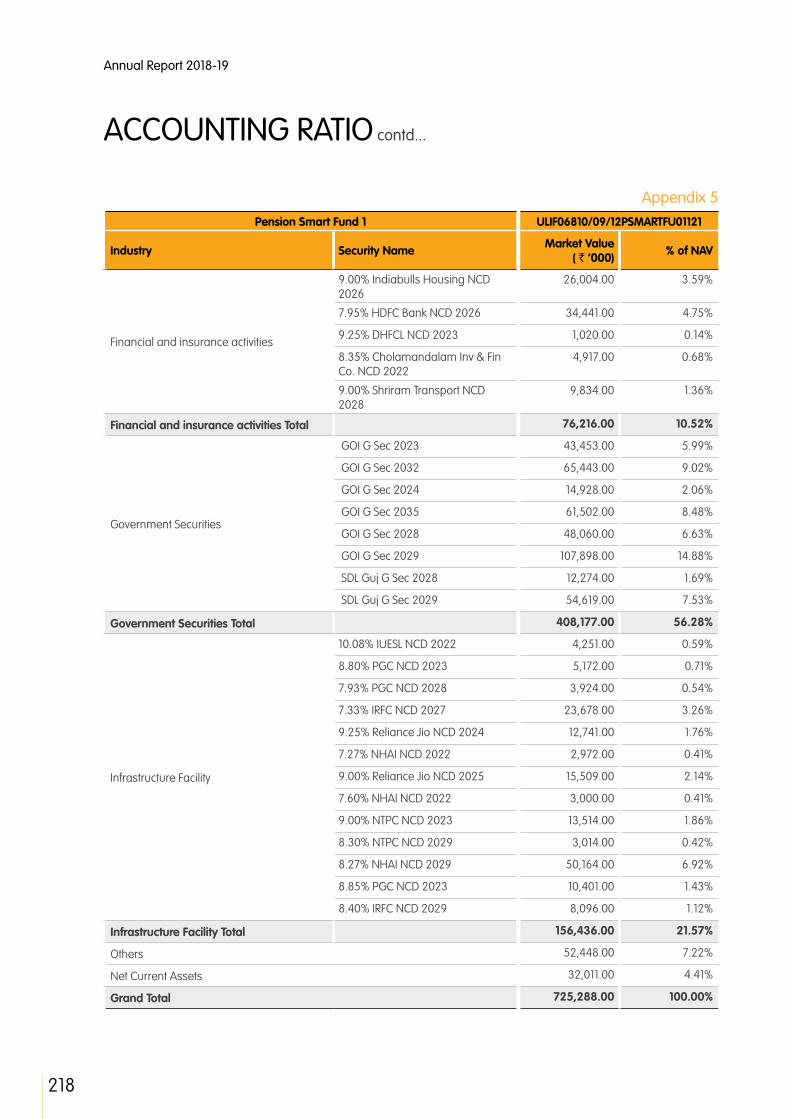
218
Annual Report 2018-19
Appendix 5
ACCOUNTING RATIO contd...
Pension Smart Fund 1 ULIF06810/09/12PSMARTFU01121
Industry Security Name Market Value ( ` ‘000) % of NAV
Financial and insurance activities
9.00% Indiabulls Housing NCD 2026
26,004.00 3.59%
7.95% HDFC Bank NCD 2026 34,441.00 4.75%
9.25% DHFCL NCD 2023 1,020.00 0.14%
8.35% Cholamandalam Inv & Fin Co. NCD 2022
4,917.00 0.68%
9.00% Shriram Transport NCD 2028
9,834.00 1.36%
Financial and insurance activities Total 76,216.00 10.52%
Government Securities
GOI G Sec 2023 43,453.00 5.99%
GOI G Sec 2032 65,443.00 9.02%
GOI G Sec 2024 14,928.00 2.06%
GOI G Sec 2035 61,502.00 8.48%
GOI G Sec 2028 48,060.00 6.63%
GOI G Sec 2029 107,898.00 14.88%
SDL Guj G Sec 2028 12,274.00 1.69%
SDL Guj G Sec 2029 54,619.00 7.53%
Government Securities Total 408,177.00 56.28%
Infrastructure Facility
10.08% IUESL NCD 2022 4,251.00 0.59%
8.80% PGC NCD 2023 5,172.00 0.71%
7.93% PGC NCD 2028 3,924.00 0.54%
7.33% IRFC NCD 2027 23,678.00 3.26%
9.25% Reliance Jio NCD 2024 12,741.00 1.76%
7.27% NHAI NCD 2022 2,972.00 0.41%
9.00% Reliance Jio NCD 2025 15,509.00 2.14%
7.60% NHAI NCD 2022 3,000.00 0.41%
9.00% NTPC NCD 2023 13,514.00 1.86%
8.30% NTPC NCD 2029 3,014.00 0.42%
8.27% NHAI NCD 2029 50,164.00 6.92%
8.85% PGC NCD 2023 10,401.00 1.43%
8.40% IRFC NCD 2029 8,096.00 1.12%
Infrastructure Facility Total 156,436.00 21.57%
Others 52,448.00 7.22%
Net Current Assets 32,011.00 4.41%
Grand Total 725,288.00 100.00%
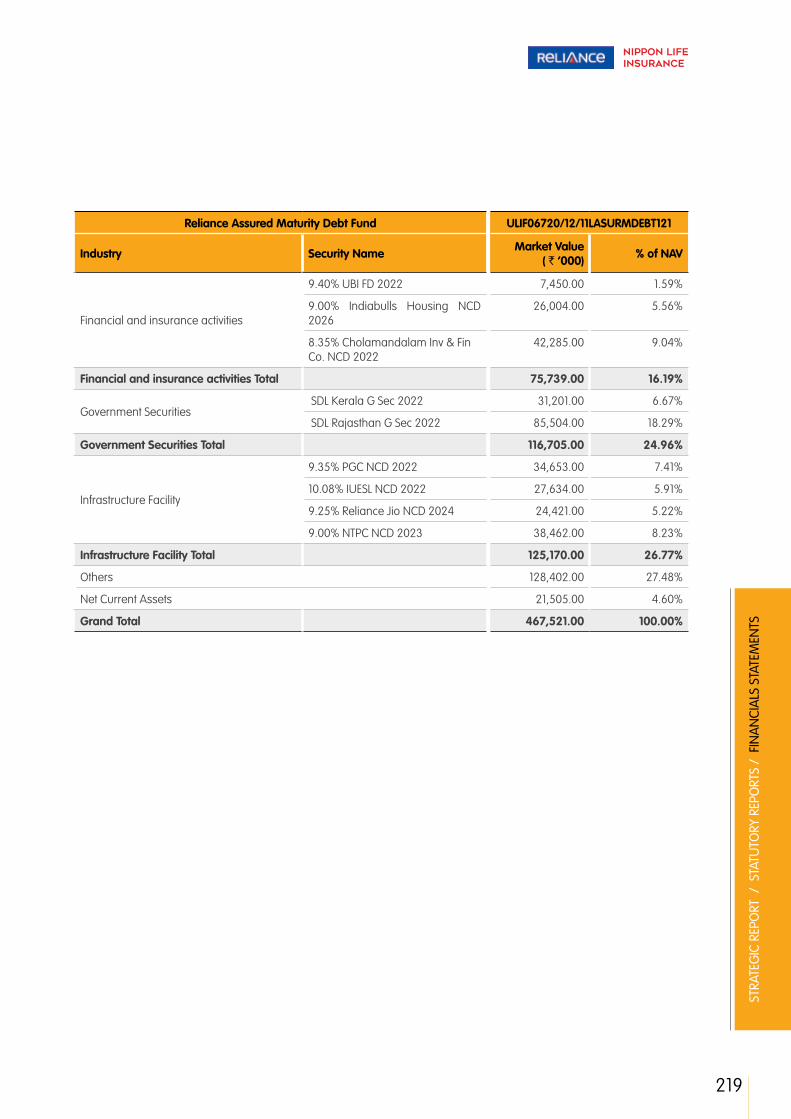
219
STRA
TEG
IC R
EPO
RT /
STA
TUTO
RY R
EPO
RTS
/ F
INA
NCI
ALS
STA
TEM
ENTS
Reliance Assured Maturity Debt Fund ULIF06720/12/11LASURMDEBT121
Industry Security Name Market Value ( ` ‘000) % of NAV
Financial and insurance activities
9.40% UBI FD 2022 7,450.00 1.59%
9.00% Indiabulls Housing NCD 2026
26,004.00 5.56%
8.35% Cholamandalam Inv & Fin Co. NCD 2022
42,285.00 9.04%
Financial and insurance activities Total 75,739.00 16.19%
Government Securities SDL Kerala G Sec 2022 31,201.00 6.67%
SDL Rajasthan G Sec 2022 85,504.00 18.29%
Government Securities Total 116,705.00 24.96%
Infrastructure Facility
9.35% PGC NCD 2022 34,653.00 7.41%
10.08% IUESL NCD 2022 27,634.00 5.91%
9.25% Reliance Jio NCD 2024 24,421.00 5.22%
9.00% NTPC NCD 2023 38,462.00 8.23%
Infrastructure Facility Total 125,170.00 26.77%
Others 128,402.00 27.48%
Net Current Assets 21,505.00 4.60%
Grand Total 467,521.00 100.00%

220
Annual Report 2018-19
Appendix 5
ACCOUNTING RATIO contd...
Industry wise disclosure of Investments (with exposure of 10% and above) segregated at Scrip level as on 31st Mar, 2018
Discontinued Policy Fund ULIF05703/09/10DISCPOLF01121
Industry Security Name Market Value ( ` ‘000) % of NAV
Government Securities GOI TB 2018 2,838,645.00 64.50%
GOI TB 2019 47,672.00 1.08%
Government Securities Total 2,886,317.00 65.58%
Others 1,578,309.00 35.87%
Net Current Assets -64,028.00 -1.45%
Grand Total 4,400,598.00 100.00%
Group Balanced Fund 1 ULGF00110/10/03GBALANCE01121
Industry Security Name Market Value ( ` ‘000) % of NAV
Financial and insurance activities
HDFC Bank Ltd 986.00 1.30%
ICICI Bank Ltd 367.00 0.49%
State Bank Of India 246.00 0.34%
Axis Bank Ltd 194.00 0.26%
Yes Bank Ltd 740.00 0.98%
Kotak Mahindra Bank Ltd 272.00 0.36%
Bharat Financial Inclusion Ltd 216.00 0.29%
Equitas Holdings Ltd 213.00 0.28%
Cholamandalam Investment & Fin Co. Ltd
249.00 0.33%
8.85% Bajaj Fin NCD 2019 3,034.00 4.01%
Housing Deve Fin Corp Ltd 327.00 0.43%
Bajaj Fin NCD 2019 3,033.00 4.01%
8.55% Shriram Transport NCD 2021
1,008.00 1.33%
8.25% Tata Sons NCD 2022 1,015.00 1.34%
Financial and insurance activities Total 11,900.00 15.75%
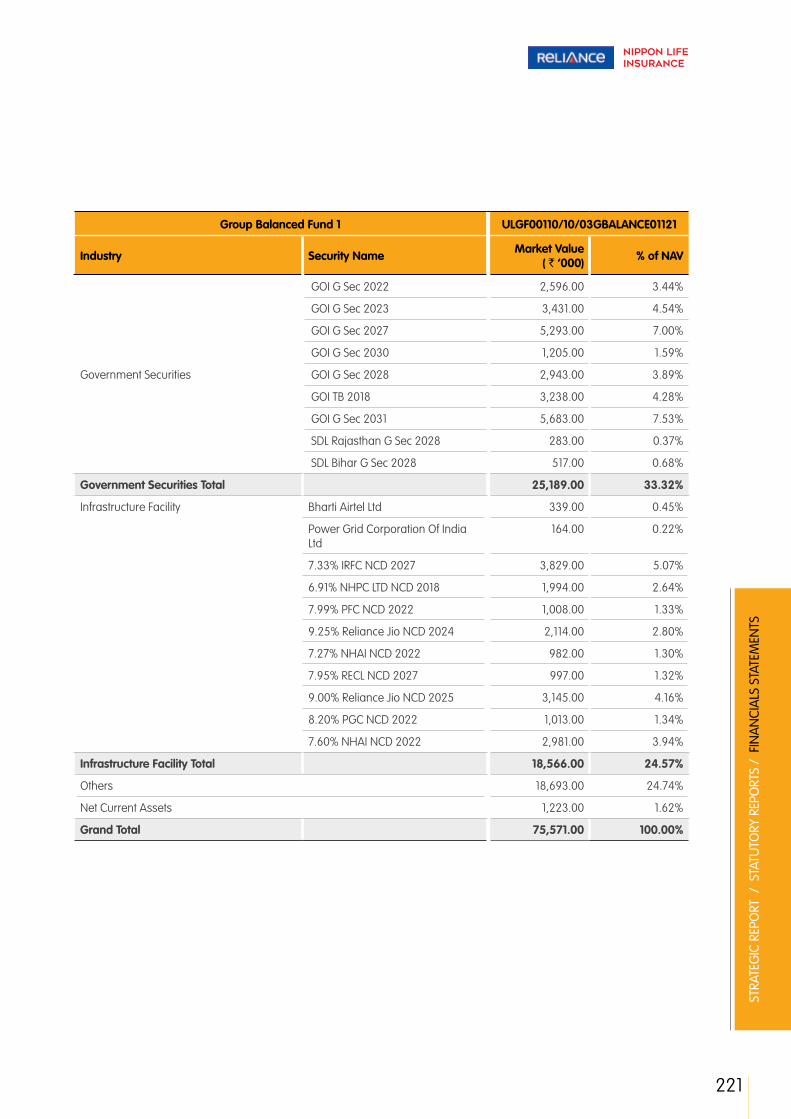
221
STRA
TEG
IC R
EPO
RT /
STA
TUTO
RY R
EPO
RTS
/ F
INA
NCI
ALS
STA
TEM
ENTS
Group Balanced Fund 1 ULGF00110/10/03GBALANCE01121
Industry Security Name Market Value ( ` ‘000) % of NAV
Government Securities
GOI G Sec 2022 2,596.00 3.44%
GOI G Sec 2023 3,431.00 4.54%
GOI G Sec 2027 5,293.00 7.00%
GOI G Sec 2030 1,205.00 1.59%
GOI G Sec 2028 2,943.00 3.89%
GOI TB 2018 3,238.00 4.28%
GOI G Sec 2031 5,683.00 7.53%
SDL Rajasthan G Sec 2028 283.00 0.37%
SDL Bihar G Sec 2028 517.00 0.68%
Government Securities Total 25,189.00 33.32%
Infrastructure Facility Bharti Airtel Ltd 339.00 0.45%
Power Grid Corporation Of India Ltd
164.00 0.22%
7.33% IRFC NCD 2027 3,829.00 5.07%
6.91% NHPC LTD NCD 2018 1,994.00 2.64%
7.99% PFC NCD 2022 1,008.00 1.33%
9.25% Reliance Jio NCD 2024 2,114.00 2.80%
7.27% NHAI NCD 2022 982.00 1.30%
7.95% RECL NCD 2027 997.00 1.32%
9.00% Reliance Jio NCD 2025 3,145.00 4.16%
8.20% PGC NCD 2022 1,013.00 1.34%
7.60% NHAI NCD 2022 2,981.00 3.94%
Infrastructure Facility Total 18,566.00 24.57%
Others 18,693.00 24.74%
Net Current Assets 1,223.00 1.62%
Grand Total 75,571.00 100.00%

222
Annual Report 2018-19
Appendix 5
ACCOUNTING RATIO contd...
Group Balanced Fund 2 ULGF00210/10/03GBALANCE02121
Industry Security Name Market Value ( ` ‘000) % of NAV
Financial and insurance activities
HDFC Bank Ltd 2,637.00 1.41%
ICICI Bank Ltd 961.00 0.51%
State Bank Of India 624.00 0.33%
Axis Bank Ltd 493.00 0.26%
Yes Bank Ltd 1,748.00 0.93%
Kotak Mahindra Bank Ltd 685.00 0.37%
Bharat Financial Inclusion Ltd 564.00 0.30%
Equitas Holdings Ltd 530.00 0.28%
Cholamandalam Investment & Fin Co. Ltd
341.00 0.18%
8.85% Bajaj Fin NCD 2019 9,101.00 4.88%
Housing Deve Fin Corp Ltd 818.00 0.44%
Bajaj Fin NCD 2019 4,044.00 2.16%
10.00% Ind Bulls Housing NCD 2019
4,132.00 2.21%
7.95% HDFC Bank NCD 2026 4,966.00 2.65%
8.25% Tata Sons NCD 2022 2,030.00 1.09%
9.70% Tata Sons NCD 2022 4,268.00 2.28%
Financial and insurance activities Total 37,942.00 20.28%
Government Securities
GOI G Sec 2022 6,832.00 3.65%
GOI G Sec 2023 8,892.00 4.75%
GOI G Sec 2027 13,133.00 7.02%
GOI G Sec 2030 2,987.00 1.60%
GOI G Sec 2028 7,234.00 3.87%
GOI TB 2018 7,055.00 3.77%
GOI G Sec 2031 14,078.00 7.52%
SDL Rajasthan G Sec 2028 1,424.00 0.76%
SDL Bihar G Sec 2028 568.00 0.30%
Government Securities Total 62,203.00 33.24%
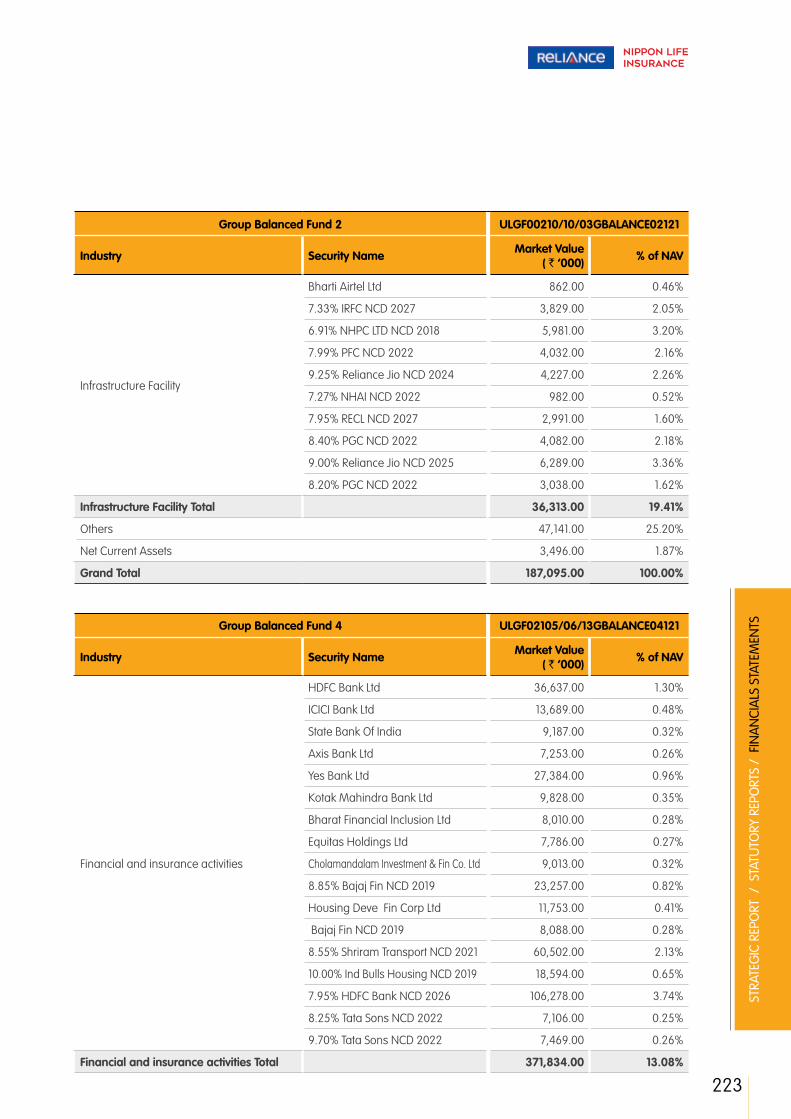
223
STRA
TEG
IC R
EPO
RT /
STA
TUTO
RY R
EPO
RTS
/ F
INA
NCI
ALS
STA
TEM
ENTS
Group Balanced Fund 2 ULGF00210/10/03GBALANCE02121
Industry Security Name Market Value ( ` ‘000) % of NAV
Infrastructure Facility
Bharti Airtel Ltd 862.00 0.46%
7.33% IRFC NCD 2027 3,829.00 2.05%
6.91% NHPC LTD NCD 2018 5,981.00 3.20%
7.99% PFC NCD 2022 4,032.00 2.16%
9.25% Reliance Jio NCD 2024 4,227.00 2.26%
7.27% NHAI NCD 2022 982.00 0.52%
7.95% RECL NCD 2027 2,991.00 1.60%
8.40% PGC NCD 2022 4,082.00 2.18%
9.00% Reliance Jio NCD 2025 6,289.00 3.36%
8.20% PGC NCD 2022 3,038.00 1.62%
Infrastructure Facility Total 36,313.00 19.41%
Others 47,141.00 25.20%
Net Current Assets 3,496.00 1.87%
Grand Total 187,095.00 100.00%
Group Balanced Fund 4 ULGF02105/06/13GBALANCE04121
Industry Security Name Market Value ( ` ‘000) % of NAV
Financial and insurance activities
HDFC Bank Ltd 36,637.00 1.30%
ICICI Bank Ltd 13,689.00 0.48%
State Bank Of India 9,187.00 0.32%
Axis Bank Ltd 7,253.00 0.26%
Yes Bank Ltd 27,384.00 0.96%
Kotak Mahindra Bank Ltd 9,828.00 0.35%
Bharat Financial Inclusion Ltd 8,010.00 0.28%
Equitas Holdings Ltd 7,786.00 0.27%
Cholamandalam Investment & Fin Co. Ltd 9,013.00 0.32%
8.85% Bajaj Fin NCD 2019 23,257.00 0.82%
Housing Deve Fin Corp Ltd 11,753.00 0.41%
Bajaj Fin NCD 2019 8,088.00 0.28%
8.55% Shriram Transport NCD 2021 60,502.00 2.13%
10.00% Ind Bulls Housing NCD 2019 18,594.00 0.65%
7.95% HDFC Bank NCD 2026 106,278.00 3.74%
8.25% Tata Sons NCD 2022 7,106.00 0.25%
9.70% Tata Sons NCD 2022 7,469.00 0.26%
Financial and insurance activities Total 371,834.00 13.08%
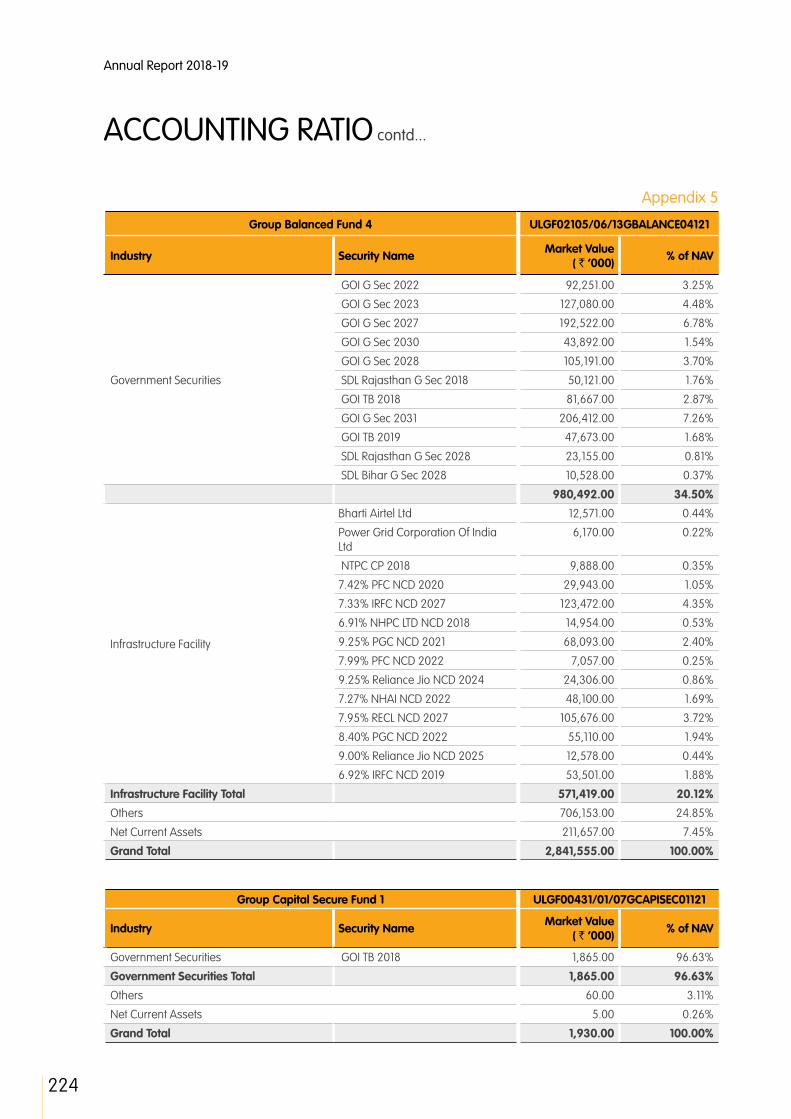
224
Annual Report 2018-19
Appendix 5
ACCOUNTING RATIO contd...
Group Balanced Fund 4 ULGF02105/06/13GBALANCE04121
Industry Security Name Market Value ( ` ‘000) % of NAV
Government Securities
GOI G Sec 2022 92,251.00 3.25%
GOI G Sec 2023 127,080.00 4.48%
GOI G Sec 2027 192,522.00 6.78%
GOI G Sec 2030 43,892.00 1.54%
GOI G Sec 2028 105,191.00 3.70%
SDL Rajasthan G Sec 2018 50,121.00 1.76%
GOI TB 2018 81,667.00 2.87%
GOI G Sec 2031 206,412.00 7.26%
GOI TB 2019 47,673.00 1.68%
SDL Rajasthan G Sec 2028 23,155.00 0.81%
SDL Bihar G Sec 2028 10,528.00 0.37%
980,492.00 34.50%
Infrastructure Facility
Bharti Airtel Ltd 12,571.00 0.44%
Power Grid Corporation Of India Ltd
6,170.00 0.22%
NTPC CP 2018 9,888.00 0.35%
7.42% PFC NCD 2020 29,943.00 1.05%
7.33% IRFC NCD 2027 123,472.00 4.35%
6.91% NHPC LTD NCD 2018 14,954.00 0.53%
9.25% PGC NCD 2021 68,093.00 2.40%
7.99% PFC NCD 2022 7,057.00 0.25%
9.25% Reliance Jio NCD 2024 24,306.00 0.86%
7.27% NHAI NCD 2022 48,100.00 1.69%
7.95% RECL NCD 2027 105,676.00 3.72%
8.40% PGC NCD 2022 55,110.00 1.94%
9.00% Reliance Jio NCD 2025 12,578.00 0.44%
6.92% IRFC NCD 2019 53,501.00 1.88%
Infrastructure Facility Total 571,419.00 20.12%
Others 706,153.00 24.85%
Net Current Assets 211,657.00 7.45%
Grand Total 2,841,555.00 100.00%
Group Capital Secure Fund 1 ULGF00431/01/07GCAPISEC01121
Industry Security Name Market Value ( ` ‘000) % of NAV
Government Securities GOI TB 2018 1,865.00 96.63%
Government Securities Total 1,865.00 96.63%
Others 60.00 3.11%
Net Current Assets 5.00 0.26%
Grand Total 1,930.00 100.00%

225
STRA
TEG
IC R
EPO
RT /
STA
TUTO
RY R
EPO
RTS
/ F
INA
NCI
ALS
STA
TEM
ENTS
Group Corporate Bond Fund 2 ULGF01213/10/08GCORBOND02121
Industry Security Name Market Value ( ` ‘000) % of NAV
Financial and insurance activities
Bajaj Fin NCD 2019 65,713.00 3.07%
8.55% Shriram Transport NCD 2021
20,167.00 0.94%
10.00% Ind Bulls Housing NCD 2019
19,627.00 0.92%
7.95% HDFC Bank NCD 2026 176,799.00 8.27%
8.25% Tata Sons NCD 2022 20,303.00 0.95%
Financial and insurance activities Total 302,609.00 14.15%
Government Securities
GOI G Sec 2022 92,385.00 4.32%
GOI G Sec 2023 121,028.00 5.66%
GOI G Sec 2027 185,236.00 8.67%
GOI G Sec 2030 42,505.00 1.99%
GOI G Sec 2028 103,498.00 4.84%
GOI TB 2018 70,304.00 3.29%
GOI G Sec 2031 200,254.00 9.37%
SDL Bihar G Sec 2028 28,887.00 1.35%
Government Securities Total 844,097.00 39.49%
Housing Finance Companies
7.80% LIC HF NCD 2022 86,008.00 4.02%
7.86% LIC HF NCD 2027 3,955.00 0.19%
7.78% LIC HF NCD 2022 65,954.00 3.09%
9.25% DHFCL NCD 2023 63,262.00 2.96%
Housing Finance Companies Total 219,179.00 10.26%
Infrastructure Facility
NTPC CP 2018 29,663.00 1.39%
7.42% PFC NCD 2020 34,933.00 1.63%
7.33% IRFC NCD 2027 38,286.00 1.79%
6.91% NHPC LTD NCD 2018 68,786.00 3.22%
7.99% PFC NCD 2022 73,591.00 3.44%
9.25% Reliance Jio NCD 2024 76,089.00 3.56%
7.27% NHAI NCD 2022 11,779.00 0.55%
7.95% RECL NCD 2027 60,814.00 2.84%
8.40% PGC NCD 2022 61,233.00 2.86%
9.00% Reliance Jio NCD 2025 92,241.00 4.32%
6.92% IRFC NCD 2019 29,723.00 1.39%
Infrastructure Facility Total 577,138.00 26.99%
Others 95,462.00 4.47%
Net Current Assets 99,091.00 4.64%
Grand Total 2,137,576.00 100.00%

226
Annual Report 2018-19
Appendix 5
ACCOUNTING RATIO contd...
Group Corporate Bond Fund 3 ULGF02305/06/13GCORBOND03121
Industry Security Name Market Value ( ` ‘000) % of NAV
Financial and insurance activities
Bajaj Fin NCD 2019 6,066.00 0.21%
8.55% Shriram Transport NCD 2021
100,837.00 3.47%
10.00% Ind Bulls Housing NCD 2019
41,320.00 1.42%
7.95% HDFC Bank NCD 2026 212,556.00 7.33%
8.25% Tata Sons NCD 2022 32,484.00 1.12%
Financial and insurance activities Total 393,263.00 13.55%
Government Securities
GOI G Sec 2022 123,489.00 4.26%
GOI G Sec 2023 163,765.00 5.64%
GOI G Sec 2027 254,219.00 8.76%
GOI G Sec 2030 57,571.00 1.98%
GOI G Sec 2028 139,569.00 4.81%
GOI TB 2018 -30.00 0.00%
GOI G Sec 2031 271,658.00 9.36%
GOI TB 2019 174,383.00 6.01%
SDL Rajasthan G Sec 2028 38,723.00 1.33%
Government Securities Total 1,223,347.00 42.15%
Infrastructure Facility
7.42% PFC NCD 2020 39,923.00 1.38%
7.33% IRFC NCD 2027 95,715.00 3.30%
6.91% NHPC LTD NCD 2018 9,969.00 0.34%
7.99% PFC NCD 2022 110,890.00 3.82%
9.25% Reliance Jio NCD 2024 63,407.00 2.19%
7.27% NHAI NCD 2022 83,438.00 2.88%
8.40% PGC NCD 2022 93,891.00 3.24%
9.00% Reliance Jio NCD 2025 100,626.00 3.47%
6.92% IRFC NCD 2019 87,186.00 3.00%
Infrastructure Facility Total 685,045.00 23.62%
Others 463,329.00 15.97%
Net Current Assets 136,766.00 4.71%
Grand Total 2,901,750.00 100.00%

227
STRA
TEG
IC R
EPO
RT /
STA
TUTO
RY R
EPO
RTS
/ F
INA
NCI
ALS
STA
TEM
ENTS
Group Energy Fund 1 ULGF01428/11/08GENERGYF01121
Industry Security Name Market Value ( ` ‘000) % of NAV
Manufacture Of Coke And Refined Petroleum Products
Reliance Industries Ltd 124.00 8.58%
Indian Oil Corporation Ltd 55.00 3.80%
Castrol (India) Ltd 17.00 1.18%
Manufacture Of Coke And Refined Petroleum Products Total
196.00 13.56%
Manufacture of electrical equipment
Bharat Heavy Electricals Ltd 70.00 4.84%
GE Power India Ltd 34.00 2.35%
Bajaj Electricals Ltd 43.00 2.98%
Manufacture of electrical equipment Total 147.00 10.17%
Manufacture Of Machinery And Equipment N.E.C.
Cummins India Ltd 69.00 4.78%
Voltas Ltd 124.00 8.58%
Manufacture Of Machinery And Equipment N.E.C. Total
193.00 13.36%
Infrastructure Facility
NTPC Ltd 107.00 7.40%
Power Grid Corporation Of India Ltd
102.00 7.06%
Petronet Lng Ltd 73.00 5.05%
GAIL (India) Ltd 119.00 8.24%
Gujarat State Petronet Ltd 76.00 5.26%
Infrastructure Facility Total 477.00 33.01%
Others 445.00 30.80%
Net Current Assets -13.00 -0.90%
Grand Total 1,445.00 100.00%
Group Equity Fund 3 ULGF01808/06/09GEQUITYF03121
Industry Security Name Market Value ( ` ‘000) % of NAV
Computer programming, consultancy and related activities
Infosys Ltd 46,473.00 5.64%
Tata Consultancy Services Ltd 13,425.00 1.63%
HCL Technologies Ltd 20,277.00 2.46%
Tech Mahindra Ltd 11,790.00 1.43%
NIIT Ltd 3,928.00 0.48%
Cyient Ltd 5,777.00 0.70%
Computer programming, consultancy and related activities Total
101,670.00 12.34%

228
Annual Report 2018-19
Appendix 5
ACCOUNTING RATIO contd...
Group Equity Fund 3 ULGF01808/06/09GEQUITYF03121
Industry Security Name Market Value ( ` ‘000) % of NAV
Financial and insurance activities
HDFC Bank Ltd 62,285.00 7.56%
ICICI Bank Ltd 26,391.00 3.20%
State Bank Of India 8,692.00 1.05%
Axis Bank Ltd 8,147.00 0.99%
Yes Bank Ltd 27,838.00 3.37%
Kotak Mahindra Bank Ltd 14,008.00 1.70%
Bharat Financial Inclusion Ltd 11,158.00 1.35%
Equitas Holdings Ltd 6,788.00 0.82%
Housing Deve Fin Corp Ltd 23,744.00 2.88%
SBI Life Insurance Co Ltd 4,160.00 0.50%
Financial and insurance activities Total 193,211.00 23.42%
Manufacture Of Pharmaceuticals, Medicinal Chemical And Botanical Products
Sanofi India Ltd 22,861.00 2.77%
Aurobindo Pharma Ltd 1,793.00 0.22%
Dr. Reddy's Laboratories Ltd 6,098.00 0.74%
Sun Pharmaceutical Industries Ltd 22,990.00 2.79%
Divi's Laboratories Ltd 32,603.00 3.96%
Manufacture Of Pharmaceuticals, Medicinal Chemical And Botanical Products Total
86,345.00 10.48%
Manufacture of motor vehicles, trailers and semi-trailers
Maruti Suzuki India Ltd 39,042.00 4.74%
Motherson Sumi Systems Ltd 19,459.00 2.36%
Tata Motors Ltd 16,612.00 2.02%
Mahindra & Mahindra Ltd 14,741.00 1.79%
Manufacture of motor vehicles, trailers and semi-trailers Total
89,854.00 10.91%
Others 351,577.00 42.65%
Net Current Assets 1,643.00 0.20%
Grand Total 824,300.00 100.00%

229
STRA
TEG
IC R
EPO
RT /
STA
TUTO
RY R
EPO
RTS
/ F
INA
NCI
ALS
STA
TEM
ENTS
Group Equity Fund 4 ULGF02205/06/13GEQUITYF04121
Industry Security Name Market Value ( ` ‘000) % of NAV
Computer programming, consultancy and related activities
Infosys Ltd 107,384.00 6.16%
Tata Consultancy Services Ltd 31,016.00 1.78%
HCL Technologies Ltd 32,943.00 1.89%
Tech Mahindra Ltd 26,629.00 1.53%
Cyient Ltd 13,286.00 0.76%
Computer programming, consultancy and related activities Total
211,258.00 12.12%
Financial and insurance activities
HDFC Bank Ltd 132,764.00 7.61%
ICICI Bank Ltd 51,234.00 2.93%
State Bank Of India 20,097.00 1.15%
Axis Bank Ltd 18,152.00 1.04%
Yes Bank Ltd 63,455.00 3.64%
Kotak Mahindra Bank Ltd 32,364.00 1.86%
Equitas Holdings Ltd 15,686.00 0.90%
Housing Deve Fin Corp Ltd 54,896.00 3.15%
SBI Life Insurance Co Ltd 9,570.00 0.55%
Financial and insurance activities Total 398,218.00 22.83%
Manufacture of motor vehicles, trailers and semi-trailers
Maruti Suzuki India Ltd 81,345.00 4.66%
Motherson Sumi Systems Ltd 44,974.00 2.58%
Tata Motors Ltd 38,149.00 2.19%
Mahindra & Mahindra Ltd 34,010.00 1.95%
Manufacture of motor vehicles, trailers and semi-trailers Total
198,478.00 11.38%
Others 948,931.00 54.41%
Net Current Assets -12,870.00 -0.74%
Grand Total 1,744,015.00 100.00%

230
Annual Report 2018-19
Appendix 5
ACCOUNTING RATIO contd...
Group Gilt Fund 2 ULGF01610/12/08GGILTFUN02121
Industry Security Name Market Value ( ` ‘000) % of NAV
Government Securities
GOI G Sec 2022 471.00 11.27%
GOI G Sec 2023 764.00 18.27%
GOI G Sec 2027 808.00 19.33%
GOI G Sec 2030 182.00 4.35%
GOI G Sec 2028 443.00 10.59%
GOI TB 2018 519.00 12.41%
GOI G Sec 2031 578.00 13.82%
GOI TB 2019 94.00 2.25%
SDL Rajasthan G Sec 2028 40.00 0.96%
SDL Bihar G Sec 2028 81.00 1.94%
Government Securities Total 3,980.00 95.19%
Others 180.00 4.31%
Net Current Assets 21.00 0.50%
Grand Total 4,181.00 100.00%
Group Growth Fund 1 ULGF00310/10/03GGROWTHF01121
Industry Security Name Market Value ( ` ‘000) % of NAV
Financial and insurance activities
HDFC Bank Ltd 1,313.00 2.63%
ICICI Bank Ltd 498.00 1.00%
State Bank Of India 334.00 0.67%
Axis Bank Ltd 264.00 0.53%
Yes Bank Ltd 996.00 2.00%
Kotak Mahindra Bank Ltd 366.00 0.73%
Bharat Financial Inclusion Ltd 287.00 0.58%
Equitas Holdings Ltd 282.00 0.57%
Cholamandalam Investment & Fin Co. Ltd
335.00 0.67%
8.85% Bajaj Fin NCD 2019 2,023.00 4.06%
Housing Deve Fin Corp Ltd 436.00 0.87%
Bajaj Fin NCD 2019 2,022.00 4.05%
10.00% Ind Bulls Housing NCD 2019
1,033.00 2.07%
Financial and insurance activities Total 10,189.00 20.43%
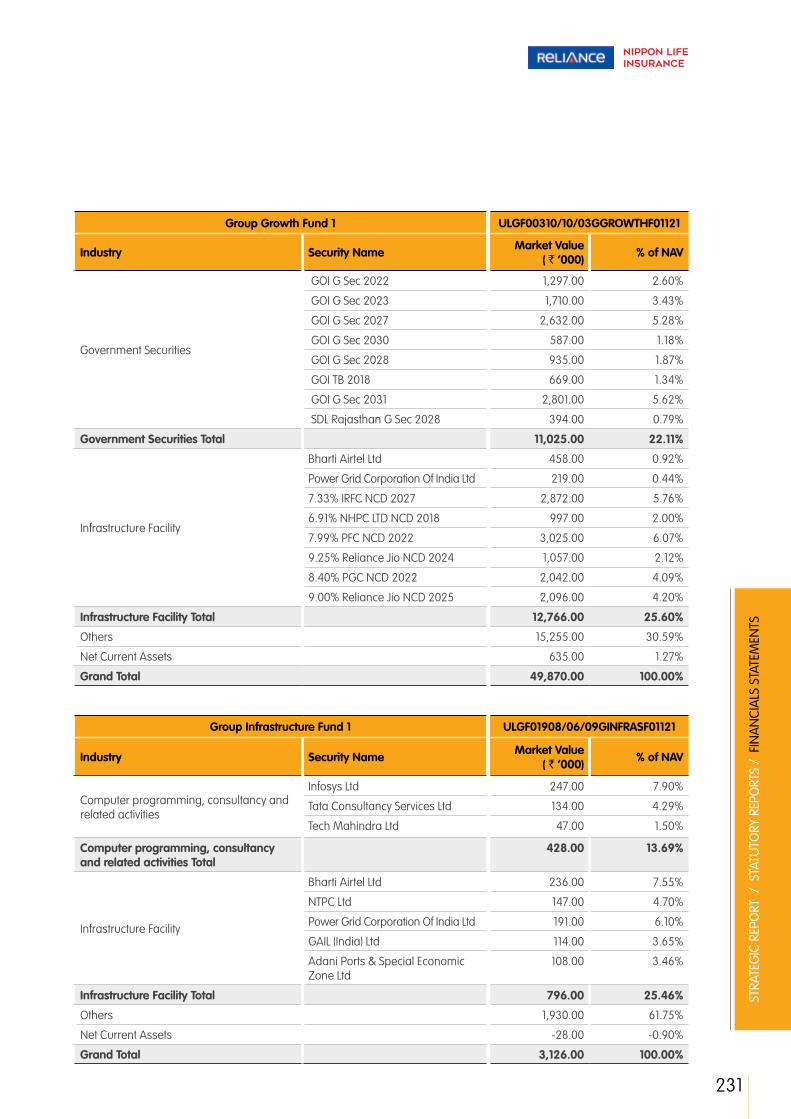
231
STRA
TEG
IC R
EPO
RT /
STA
TUTO
RY R
EPO
RTS
/ F
INA
NCI
ALS
STA
TEM
ENTS
Group Growth Fund 1 ULGF00310/10/03GGROWTHF01121
Industry Security Name Market Value ( ` ‘000) % of NAV
Government Securities
GOI G Sec 2022 1,297.00 2.60%
GOI G Sec 2023 1,710.00 3.43%
GOI G Sec 2027 2,632.00 5.28%
GOI G Sec 2030 587.00 1.18%
GOI G Sec 2028 935.00 1.87%
GOI TB 2018 669.00 1.34%
GOI G Sec 2031 2,801.00 5.62%
SDL Rajasthan G Sec 2028 394.00 0.79%
Government Securities Total 11,025.00 22.11%
Infrastructure Facility
Bharti Airtel Ltd 458.00 0.92%
Power Grid Corporation Of India Ltd 219.00 0.44%
7.33% IRFC NCD 2027 2,872.00 5.76%
6.91% NHPC LTD NCD 2018 997.00 2.00%
7.99% PFC NCD 2022 3,025.00 6.07%
9.25% Reliance Jio NCD 2024 1,057.00 2.12%
8.40% PGC NCD 2022 2,042.00 4.09%
9.00% Reliance Jio NCD 2025 2,096.00 4.20%
Infrastructure Facility Total 12,766.00 25.60%
Others 15,255.00 30.59%
Net Current Assets 635.00 1.27%
Grand Total 49,870.00 100.00%
Group Infrastructure Fund 1 ULGF01908/06/09GINFRASF01121
Industry Security Name Market Value ( ` ‘000) % of NAV
Computer programming, consultancy and related activities
Infosys Ltd 247.00 7.90%
Tata Consultancy Services Ltd 134.00 4.29%
Tech Mahindra Ltd 47.00 1.50%
Computer programming, consultancy and related activities Total
428.00 13.69%
Infrastructure Facility
Bharti Airtel Ltd 236.00 7.55%
NTPC Ltd 147.00 4.70%
Power Grid Corporation Of India Ltd 191.00 6.10%
GAIL (India) Ltd 114.00 3.65%
Adani Ports & Special Economic Zone Ltd
108.00 3.46%
Infrastructure Facility Total 796.00 25.46%
Others 1,930.00 61.75%
Net Current Assets -28.00 -0.90%
Grand Total 3,126.00 100.00%
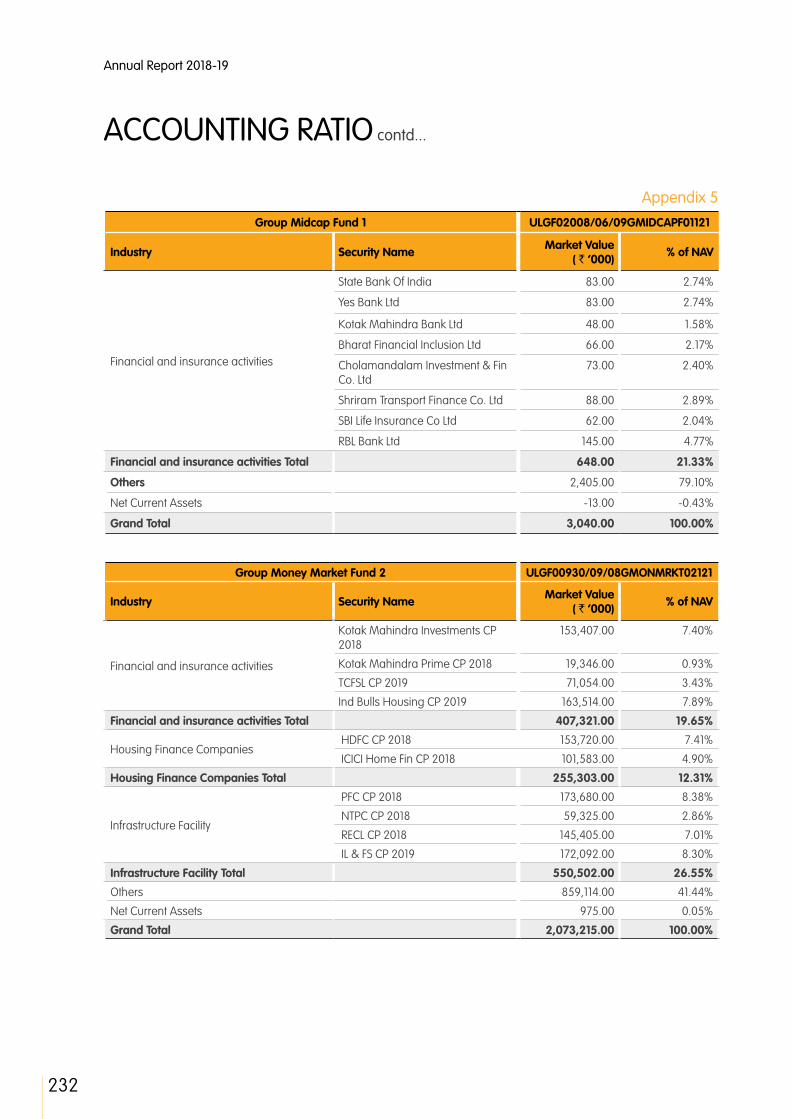
232
Annual Report 2018-19
Appendix 5
ACCOUNTING RATIO contd...
Group Midcap Fund 1 ULGF02008/06/09GMIDCAPF01121
Industry Security Name Market Value ( ` ‘000) % of NAV
Financial and insurance activities
State Bank Of India 83.00 2.74%
Yes Bank Ltd 83.00 2.74%
Kotak Mahindra Bank Ltd 48.00 1.58%
Bharat Financial Inclusion Ltd 66.00 2.17%
Cholamandalam Investment & Fin Co. Ltd
73.00 2.40%
Shriram Transport Finance Co. Ltd 88.00 2.89%
SBI Life Insurance Co Ltd 62.00 2.04%
RBL Bank Ltd 145.00 4.77%
Financial and insurance activities Total 648.00 21.33%
Others 2,405.00 79.10%
Net Current Assets -13.00 -0.43%
Grand Total 3,040.00 100.00%
Group Money Market Fund 2 ULGF00930/09/08GMONMRKT02121
Industry Security Name Market Value ( ` ‘000) % of NAV
Financial and insurance activities
Kotak Mahindra Investments CP 2018
153,407.00 7.40%
Kotak Mahindra Prime CP 2018 19,346.00 0.93%
TCFSL CP 2019 71,054.00 3.43%
Ind Bulls Housing CP 2019 163,514.00 7.89%
Financial and insurance activities Total 407,321.00 19.65%
Housing Finance Companies HDFC CP 2018 153,720.00 7.41%
ICICI Home Fin CP 2018 101,583.00 4.90%
Housing Finance Companies Total 255,303.00 12.31%
Infrastructure Facility
PFC CP 2018 173,680.00 8.38%
NTPC CP 2018 59,325.00 2.86%
RECL CP 2018 145,405.00 7.01%
IL & FS CP 2019 172,092.00 8.30%
Infrastructure Facility Total 550,502.00 26.55%
Others 859,114.00 41.44%
Net Current Assets 975.00 0.05%
Grand Total 2,073,215.00 100.00%

233
STRA
TEG
IC R
EPO
RT /
STA
TUTO
RY R
EPO
RTS
/ F
INA
NCI
ALS
STA
TEM
ENTS
Group Pure Equity Fund 1 ULGF01528/11/08GPUREEQF01121
Industry Security Name Market Value ( ` ‘000) % of NAV
Manufacture Of Chemicals And Chemical Products
Asian Paints Ltd 181.00 3.92%
Hindustan Unilever Ltd 421.00 9.11%
UPL Ltd 53.00 1.15%
Manufacture Of Chemicals And Chemical Products Total
655.00 14.18%
Manufacture Of Pharmaceuticals, Medicinal Chemical And Botanical Products
Cipla Ltd 192.00 4.16%
Aurobindo Pharma Ltd 45.00 0.97%
Dr. Reddy's Laboratories Ltd 166.00 3.59%
Sun Pharmaceutical Industries Ltd 55.00 1.19%
Lupin Ltd 50.00 1.08%
Cadila Healthcare Ltd 65.00 1.41%
Manufacture Of Pharmaceuticals, Medicinal Chemical And Botanical Products Total
573.00 12.40%
Manufacture of motor vehicles, trailers and semi-trailers
Maruti Suzuki India Ltd 426.00 9.22%
Motherson Sumi Systems Ltd 105.00 2.28%
Mahindra & Mahindra Ltd 39.00 0.84%
Manufacture of motor vehicles, trailers and semi-trailers Total
570.00 12.34%
Others 2,933.00 63.50%
Net Current Assets -112.00 -2.42%
Grand Total 4,619.00 100.00%
Health Corporate Bond Fund 1 ULIF06301/02/08HCORBOND01121
Industry Security Name Market Value ( ` ‘000) % of NAV
Financial and insurance activities7.95% HDFC Bank NCD 2026 993.00 6.18%
8.25% Tata Sons NCD 2022 1,015.00 6.32%
Financial and insurance activities Total 2,008.00 12.50%
Government Securities
GOI G Sec 2022 781.00 4.86%
GOI G Sec 2023 961.00 5.98%
GOI G Sec 2027 1,449.00 9.02%
GOI G Sec 2030 324.00 2.02%
GOI G Sec 2028 807.00 5.02%
GOI TB 2018 1,158.00 7.21%
GOI G Sec 2031 1,547.00 9.63%
GOI TB 2019 188.00 1.17%
SDL Bihar G Sec 2028 223.00 1.39%
Government Securities Total 7,438.00 46.30%
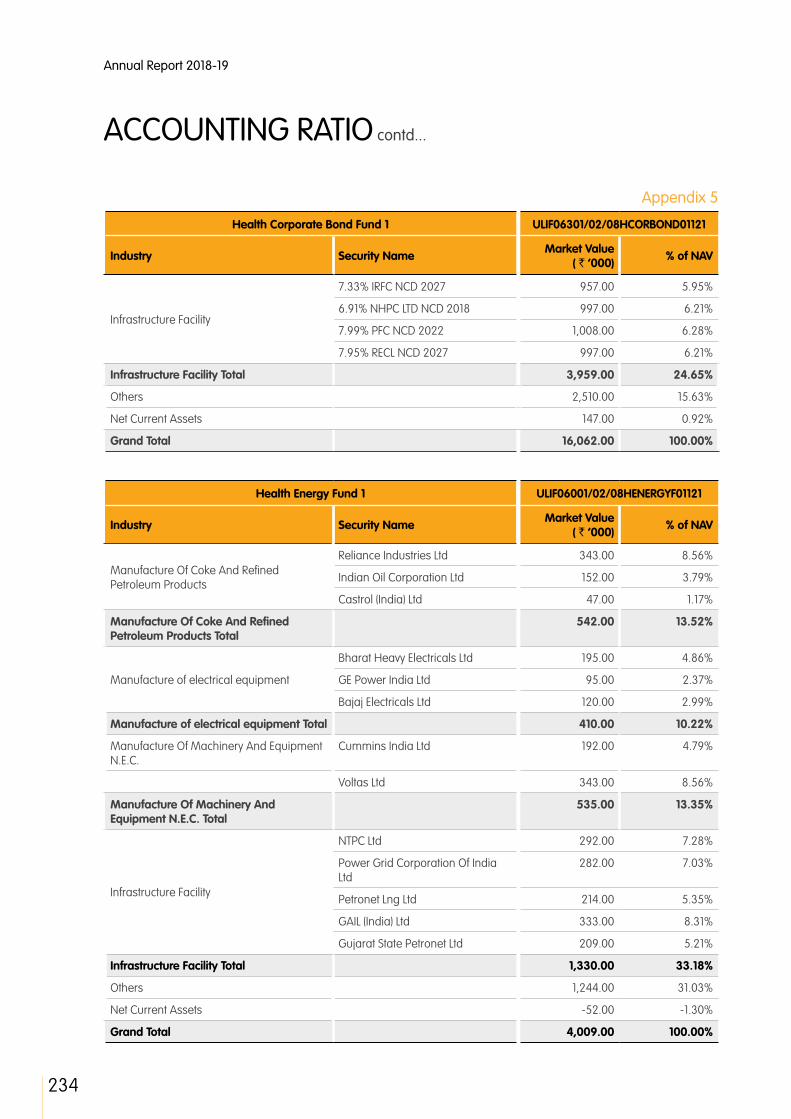
234
Annual Report 2018-19
Appendix 5
ACCOUNTING RATIO contd...
Health Corporate Bond Fund 1 ULIF06301/02/08HCORBOND01121
Industry Security Name Market Value ( ` ‘000) % of NAV
Infrastructure Facility
7.33% IRFC NCD 2027 957.00 5.95%
6.91% NHPC LTD NCD 2018 997.00 6.21%
7.99% PFC NCD 2022 1,008.00 6.28%
7.95% RECL NCD 2027 997.00 6.21%
Infrastructure Facility Total 3,959.00 24.65%
Others 2,510.00 15.63%
Net Current Assets 147.00 0.92%
Grand Total 16,062.00 100.00%
Health Energy Fund 1 ULIF06001/02/08HENERGYF01121
Industry Security Name Market Value ( ` ‘000) % of NAV
Manufacture Of Coke And Refined Petroleum Products
Reliance Industries Ltd 343.00 8.56%
Indian Oil Corporation Ltd 152.00 3.79%
Castrol (India) Ltd 47.00 1.17%
Manufacture Of Coke And Refined Petroleum Products Total
542.00 13.52%
Manufacture of electrical equipment
Bharat Heavy Electricals Ltd 195.00 4.86%
GE Power India Ltd 95.00 2.37%
Bajaj Electricals Ltd 120.00 2.99%
Manufacture of electrical equipment Total 410.00 10.22%
Manufacture Of Machinery And Equipment N.E.C.
Cummins India Ltd 192.00 4.79%
Voltas Ltd 343.00 8.56%
Manufacture Of Machinery And Equipment N.E.C. Total
535.00 13.35%
Infrastructure Facility
NTPC Ltd 292.00 7.28%
Power Grid Corporation Of India Ltd
282.00 7.03%
Petronet Lng Ltd 214.00 5.35%
GAIL (India) Ltd 333.00 8.31%
Gujarat State Petronet Ltd 209.00 5.21%
Infrastructure Facility Total 1,330.00 33.18%
Others 1,244.00 31.03%
Net Current Assets -52.00 -1.30%
Grand Total 4,009.00 100.00%

235
STRA
TEG
IC R
EPO
RT /
STA
TUTO
RY R
EPO
RTS
/ F
INA
NCI
ALS
STA
TEM
ENTS
Health Equity Fund 1 ULIF01201/02/08HEQUITYF01121
Industry Security Name Market Value ( ` ‘000) % of NAV
Computer programming, consultancy and related activities
Infosys Ltd 20,179.00 7.38%
Tata Consultancy Services Ltd 4,673.00 1.71%
HCL Technologies Ltd 6,272.00 2.29%
Tech Mahindra Ltd 4,605.00 1.69%
Cyient Ltd 764.00 0.28%
Computer programming, consultancy and related activities Total
36,493.00 13.35%
Financial and insurance activities
HDFC Bank Ltd 26,125.00 9.56%
ICICI Bank Ltd 9,537.00 3.49%
State Bank Of India 2,214.00 0.81%
Axis Bank Ltd 3,493.00 1.28%
Yes Bank Ltd 12,017.00 4.40%
Bharat Financial Inclusion Ltd 2,438.00 0.89%
Equitas Holdings Ltd 2,665.00 0.97%
Housing Deve Fin Corp Ltd 11,098.00 4.06%
SBI Life Insurance Co Ltd 2,167.00 0.79%
Financial and insurance activities Total 71,754.00 26.25%
Manufacture of motor vehicles, trailers and semi-trailers
Maruti Suzuki India Ltd 15,321.00 5.60%
Motherson Sumi Systems Ltd 8,383.00 3.07%
Tata Motors Ltd 6,372.00 2.33%
Mahindra & Mahindra Ltd 7,405.00 2.71%
Manufacture of motor vehicles, trailers and semi-trailers Total
37,481.00 13.71%
Others 154,617.00 56.56%
Net Current Assets -26,984.00 -9.87%
Grand Total 273,361.00 100.00%
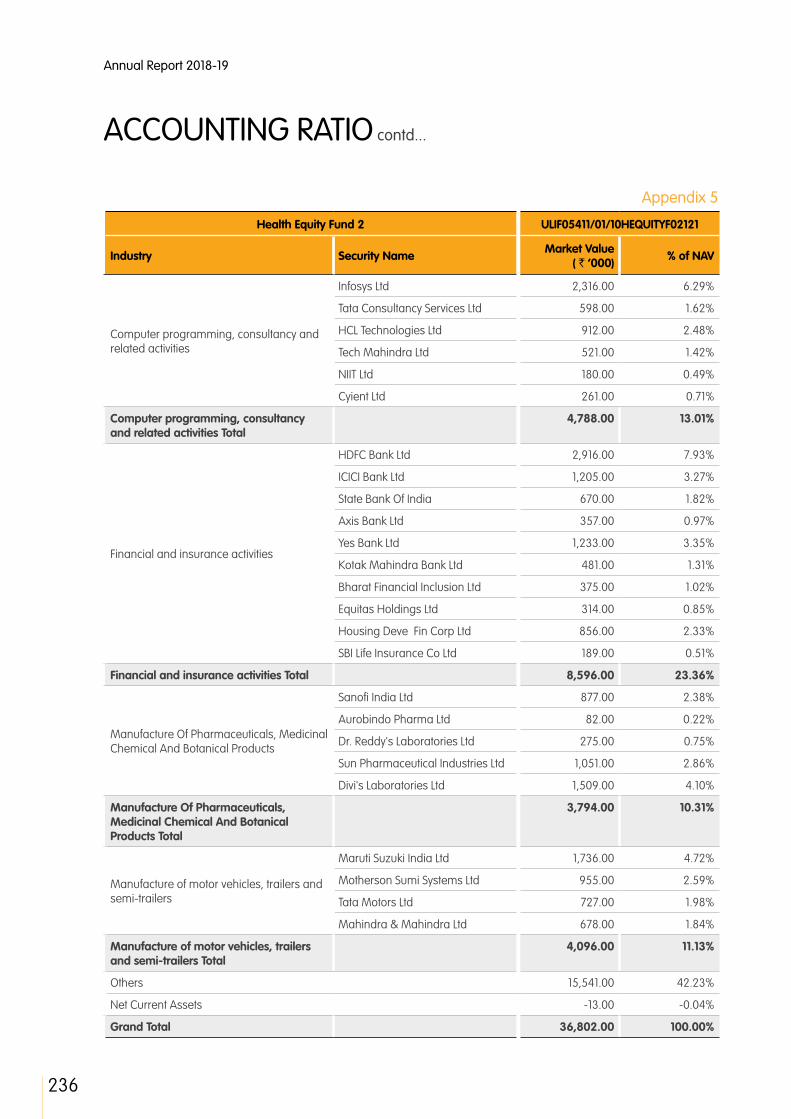
236
Annual Report 2018-19
Appendix 5
ACCOUNTING RATIO contd...
Health Equity Fund 2 ULIF05411/01/10HEQUITYF02121
Industry Security Name Market Value ( ` ‘000) % of NAV
Computer programming, consultancy and related activities
Infosys Ltd 2,316.00 6.29%
Tata Consultancy Services Ltd 598.00 1.62%
HCL Technologies Ltd 912.00 2.48%
Tech Mahindra Ltd 521.00 1.42%
NIIT Ltd 180.00 0.49%
Cyient Ltd 261.00 0.71%
Computer programming, consultancy and related activities Total
4,788.00 13.01%
Financial and insurance activities
HDFC Bank Ltd 2,916.00 7.93%
ICICI Bank Ltd 1,205.00 3.27%
State Bank Of India 670.00 1.82%
Axis Bank Ltd 357.00 0.97%
Yes Bank Ltd 1,233.00 3.35%
Kotak Mahindra Bank Ltd 481.00 1.31%
Bharat Financial Inclusion Ltd 375.00 1.02%
Equitas Holdings Ltd 314.00 0.85%
Housing Deve Fin Corp Ltd 856.00 2.33%
SBI Life Insurance Co Ltd 189.00 0.51%
Financial and insurance activities Total 8,596.00 23.36%
Manufacture Of Pharmaceuticals, Medicinal Chemical And Botanical Products
Sanofi India Ltd 877.00 2.38%
Aurobindo Pharma Ltd 82.00 0.22%
Dr. Reddy's Laboratories Ltd 275.00 0.75%
Sun Pharmaceutical Industries Ltd 1,051.00 2.86%
Divi's Laboratories Ltd 1,509.00 4.10%
Manufacture Of Pharmaceuticals, Medicinal Chemical And Botanical Products Total
3,794.00 10.31%
Manufacture of motor vehicles, trailers and semi-trailers
Maruti Suzuki India Ltd 1,736.00 4.72%
Motherson Sumi Systems Ltd 955.00 2.59%
Tata Motors Ltd 727.00 1.98%
Mahindra & Mahindra Ltd 678.00 1.84%
Manufacture of motor vehicles, trailers and semi-trailers Total
4,096.00 11.13%
Others 15,541.00 42.23%
Net Current Assets -13.00 -0.04%
Grand Total 36,802.00 100.00%

237
STRA
TEG
IC R
EPO
RT /
STA
TUTO
RY R
EPO
RTS
/ F
INA
NCI
ALS
STA
TEM
ENTS
Health Gilt Fund 1 ULIF01301/02/08HGILTFUN01121
Industry Security Name Market Value ( ` ‘000) % of NAV
Government Securities
GOI G Sec 2022 1,354.00 12.29%
GOI G Sec 2023 2,081.00 18.88%
GOI G Sec 2027 2,195.00 19.92%
GOI G Sec 2030 496.00 4.50%
GOI G Sec 2028 1,220.00 11.07%
GOI TB 2018 859.00 7.79%
GOI G Sec 2031 1,560.00 14.15%
GOI TB 2019 658.00 5.97%
SDL Rajasthan G Sec 2028 152.00 1.38%
SDL Bihar G Sec 2028 183.00 1.66%
Government Securities Total 10,758.00 97.61%
Others 560.00 5.08%
Net Current Assets -297.00 -2.69%
Grand Total 11,021.00 100.00%
Health Growth Plus Fund 1 ULIF01401/02/08HGRWTPLS01121
Industry Security Name Market Value ( ` ‘000) % of NAV
Financial and insurance activities
HDFC Bank Ltd 1,339.00 2.83%
ICICI Bank Ltd 894.00 1.89%
State Bank Of India 477.00 1.01%
Axis Bank Ltd 377.00 0.80%
Yes Bank Ltd 1,441.00 3.05%
Kotak Mahindra Bank Ltd 513.00 1.08%
Bharat Financial Inclusion Ltd 352.00 0.74%
Equitas Holdings Ltd 281.00 0.59%
Cholamandalam Investment & Fin Co. Ltd
290.00 0.61%
8.85% Bajaj Fin NCD 2019 1,011.00 2.15%
Housing Deve Fin Corp Ltd 555.00 1.17%
Bajaj Fin NCD 2019 2,022.00 4.28%
10.00% Ind Bulls Housing NCD 2019
1,033.00 2.18%
7.95% HDFC Bank NCD 2026 993.00 2.10%
Financial and insurance activities Total 11,578.00 24.48%
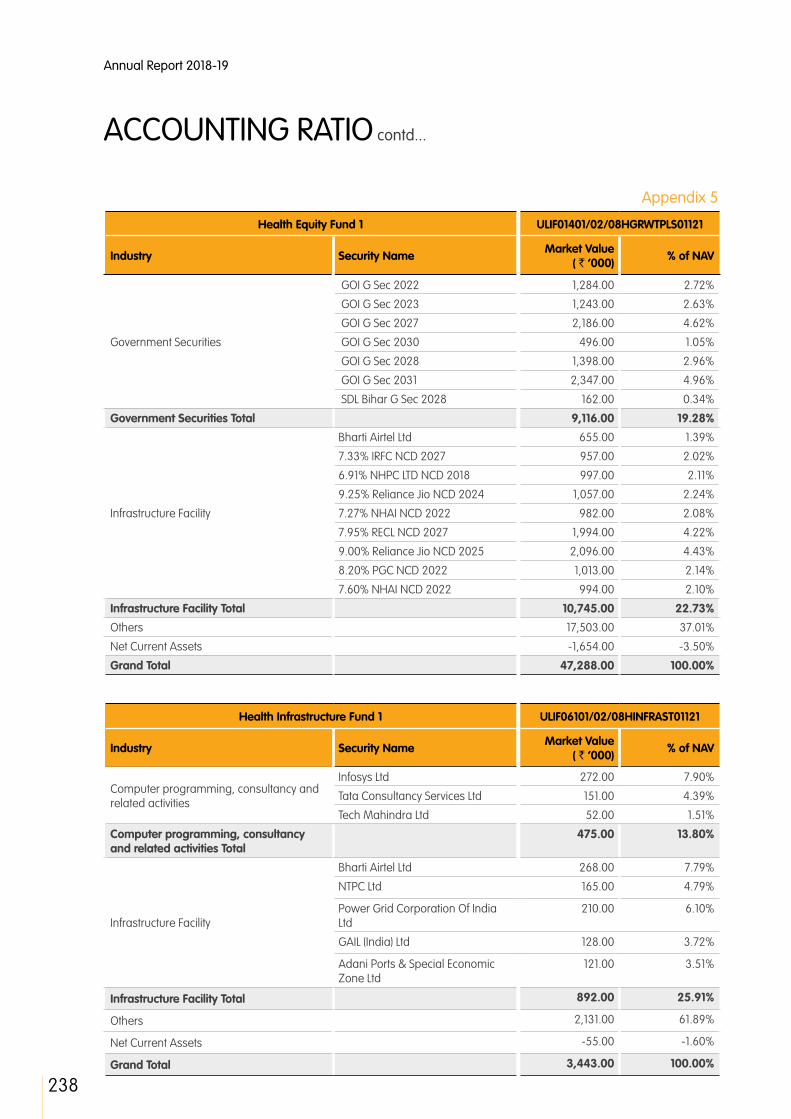
238
Annual Report 2018-19
Appendix 5
ACCOUNTING RATIO contd...
Health Equity Fund 1 ULIF01401/02/08HGRWTPLS01121
Industry Security Name Market Value ( ` ‘000) % of NAV
Government Securities
GOI G Sec 2022 1,284.00 2.72%
GOI G Sec 2023 1,243.00 2.63%
GOI G Sec 2027 2,186.00 4.62%
GOI G Sec 2030 496.00 1.05%
GOI G Sec 2028 1,398.00 2.96%
GOI G Sec 2031 2,347.00 4.96%
SDL Bihar G Sec 2028 162.00 0.34%
Government Securities Total 9,116.00 19.28%
Infrastructure Facility
Bharti Airtel Ltd 655.00 1.39%
7.33% IRFC NCD 2027 957.00 2.02%
6.91% NHPC LTD NCD 2018 997.00 2.11%
9.25% Reliance Jio NCD 2024 1,057.00 2.24%
7.27% NHAI NCD 2022 982.00 2.08%
7.95% RECL NCD 2027 1,994.00 4.22%
9.00% Reliance Jio NCD 2025 2,096.00 4.43%
8.20% PGC NCD 2022 1,013.00 2.14%
7.60% NHAI NCD 2022 994.00 2.10%
Infrastructure Facility Total 10,745.00 22.73%
Others 17,503.00 37.01%
Net Current Assets -1,654.00 -3.50%
Grand Total 47,288.00 100.00%
Health Infrastructure Fund 1 ULIF06101/02/08HINFRAST01121
Industry Security Name Market Value ( ` ‘000) % of NAV
Computer programming, consultancy and related activities
Infosys Ltd 272.00 7.90%
Tata Consultancy Services Ltd 151.00 4.39%
Tech Mahindra Ltd 52.00 1.51%
Computer programming, consultancy and related activities Total
475.00 13.80%
Infrastructure Facility
Bharti Airtel Ltd 268.00 7.79%
NTPC Ltd 165.00 4.79%
Power Grid Corporation Of India Ltd
210.00 6.10%
GAIL (India) Ltd 128.00 3.72%
Adani Ports & Special Economic Zone Ltd
121.00 3.51%
Infrastructure Facility Total 892.00 25.91%
Others 2,131.00 61.89%
Net Current Assets -55.00 -1.60%
Grand Total 3,443.00 100.00%

239
STRA
TEG
IC R
EPO
RT /
STA
TUTO
RY R
EPO
RTS
/ F
INA
NCI
ALS
STA
TEM
ENTS
Health Midcap Fund 1 ULIF06201/02/08HMIDCAPF01121
Industry Security Name Market Value ( ` ‘000) % of NAV
Financial and insurance activities
State Bank Of India 198.00 2.78%
Yes Bank Ltd 216.00 3.03%
Kotak Mahindra Bank Ltd 112.00 1.57%
Bharat Financial Inclusion Ltd 171.00 2.40%
Cholamandalam Investment & Fin Co. Ltd
180.00 2.53%
Shriram Transport Finance Co. Ltd 204.00 2.86%
SBI Life Insurance Co Ltd 147.00 2.06%
RBL Bank Ltd 339.00 4.76%
Financial and insurance activities Total 1,567.00 21.99%
Others 6,058.00 85.07%
Net Current Assets -503.00 -7.06%
Grand Total 7,122.00 100.00%
Health Money Market Fund 1 ULIF01501/02/08HMONMRKT01121
Industry Security Name Market Value ( ` ‘000) % of NAV
Financial and insurance activities
Bajaj Fin CP 2018 978.00 9.48%
Kotak Mahindra Investments CP 2018
981.00 9.50%
Ind Bulls Housing CP 2019 467.00 4.53%
Financial and insurance activities Total 2,426.00 23.51%
Infrastructure Facility
PFC CP 2018 992.00 9.61%
RECL CP 2018 970.00 9.40%
IL & FS CP 2019 467.00 4.53%
Infrastructure Facility Total 2,429.00 23.54%
Others 6,365.00 61.70%
Net Current Assets -903.00 -8.75%
Grand Total 10,317.00 100.00%

240
Annual Report 2018-19
Appendix 5
ACCOUNTING RATIO contd...
Health Pure Equity Fund 1 ULIF01601/02/08HPUEQUTY01121
Industry Security Name Market Value ( ` ‘000) % of NAV
Manufacture Of Chemicals And Chemical Products
Asian Paints Ltd 1,173.00 3.93%
Hindustan Unilever Ltd 2,697.00 9.03%
UPL Ltd 339.00 1.14%
Manufacture Of Chemicals And Chemical Products Total
4,209.00 14.10%
Manufacture Of Pharmaceuticals, Medicinal Chemical And Botanical Products
Cipla Ltd 1,226.00 4.11%
Aurobindo Pharma Ltd 284.00 0.95%
Dr. Reddy's Laboratories Ltd 1,078.00 3.61%
Sun Pharmaceutical Industries Ltd 344.00 1.15%
Lupin Ltd 313.00 1.05%
Cadila Healthcare Ltd 420.00 1.41%
Manufacture Of Pharmaceuticals, Medicinal Chemical And Botanical Products Total
3,665.00 12.28%
Manufacture of motor vehicles, trailers and semi-trailers
Maruti Suzuki India Ltd 2,622.00 8.78%
Motherson Sumi Systems Ltd 657.00 2.20%
Mahindra & Mahindra Ltd 245.00 0.82%
Manufacture of motor vehicles, trailers and semi-trailers Total
3,524.00 11.80%
Others 18,666.00 62.51%
Net Current Assets -205.00 -0.69%
Grand Total 29,859.00 100.00%
Health Super Growth Fund 1 ULIF01701/02/08HSPRGRWT01121
Industry Security Name Market Value ( ` ‘000) % of NAV
Computer programming, consultancy and related activities
Infosys Ltd 2,251.00 6.38%
Tata Consultancy Services Ltd 399.00 1.13%
HCL Technologies Ltd 755.00 2.14%
Tech Mahindra Ltd 380.00 1.08%
Computer programming, consultancy and related activities Total
3,785.00 10.73%

241
STRA
TEG
IC R
EPO
RT /
STA
TUTO
RY R
EPO
RTS
/ F
INA
NCI
ALS
STA
TEM
ENTS
Health Super Growth Fund 1 ULIF01701/02/08HSPRGRWT01121
Industry Security Name Market Value ( ` ‘000) % of NAV
Financial and insurance activities
HDFC Bank Ltd 2,373.00 6.72%
ICICI Bank Ltd 1,148.00 3.25%
Axis Bank Ltd 485.00 1.37%
Yes Bank Ltd 1,834.00 5.20%
Kotak Mahindra Bank Ltd 658.00 1.86%
Bharat Financial Inclusion Ltd 424.00 1.20%
Equitas Holdings Ltd 360.00 1.02%
Housing Deve Fin Corp Ltd 708.00 2.01%
Bajaj Fin NCD 2019 1,011.00 2.87%
Financial and insurance activities Total 9,001.00 25.50%
Infrastructure Facility
Bharti Airtel Ltd 367.00 1.04%
7.33% IRFC NCD 2027 957.00 2.71%
6.91% NHPC LTD NCD 2018 997.00 2.83%
7.95% RECL NCD 2027 997.00 2.83%
8.40% PGC NCD 2022 1,021.00 2.89%
Infrastructure Facility Total 4,339.00 12.30%
Others 20,629.00 58.46%
Net Current Assets -2,466.00 -6.99%
Grand Total 35,288.00 100.00%

242
Annual Report 2018-19
Appendix 5
ACCOUNTING RATIO contd...
Life Balanced Fund 1 ULIF00128/07/04LBALANCE01121
Industry Security Name Market Value ( ` ‘000) % of NAV
Financial and insurance activities
HDFC Bank Ltd 13,310.00 1.32%
ICICI Bank Ltd 4,918.00 0.49%
State Bank Of India 3,322.00 0.33%
Axis Bank Ltd 2,622.00 0.27%
Yes Bank Ltd 9,902.00 0.98%
Kotak Mahindra Bank Ltd 3,667.00 0.36%
Bharat Financial Inclusion Ltd 2,906.00 0.29%
Equitas Holdings Ltd 2,826.00 0.28%
Cholamandalam Investment & Fin Co. Ltd
3,365.00 0.33%
8.85% Bajaj Fin NCD 2019 44,492.00 4.42%
Housing Deve Fin Corp Ltd 4,380.00 0.43%
Bajaj Fin NCD 2019 40,439.00 4.01%
8.55% Shriram Transport NCD 2021
6,050.00 0.60%
10.00% Ind Bulls Housing NCD 2019
30,990.00 3.08%
7.95% HDFC Bank NCD 2026 44,696.00 4.44%
Financial and insurance activities Total 217,885.00 21.63%
Government Securities
GOI G Sec 2022 34,777.00 3.45%
GOI G Sec 2023 46,525.00 4.63%
GOI G Sec 2027 70,132.00 6.96%
GOI G Sec 2030 15,987.00 1.59%
GOI G Sec 2028 38,679.00 3.84%
GOI TB 2018 7,714.00 0.77%
GOI G Sec 2031 75,303.00 7.47%
SDL Rajasthan G Sec 2028 6,486.00 0.64%
SDL Bihar G Sec 2028 4,179.00 0.41%
Government Securities Total 299,782.00 29.76%
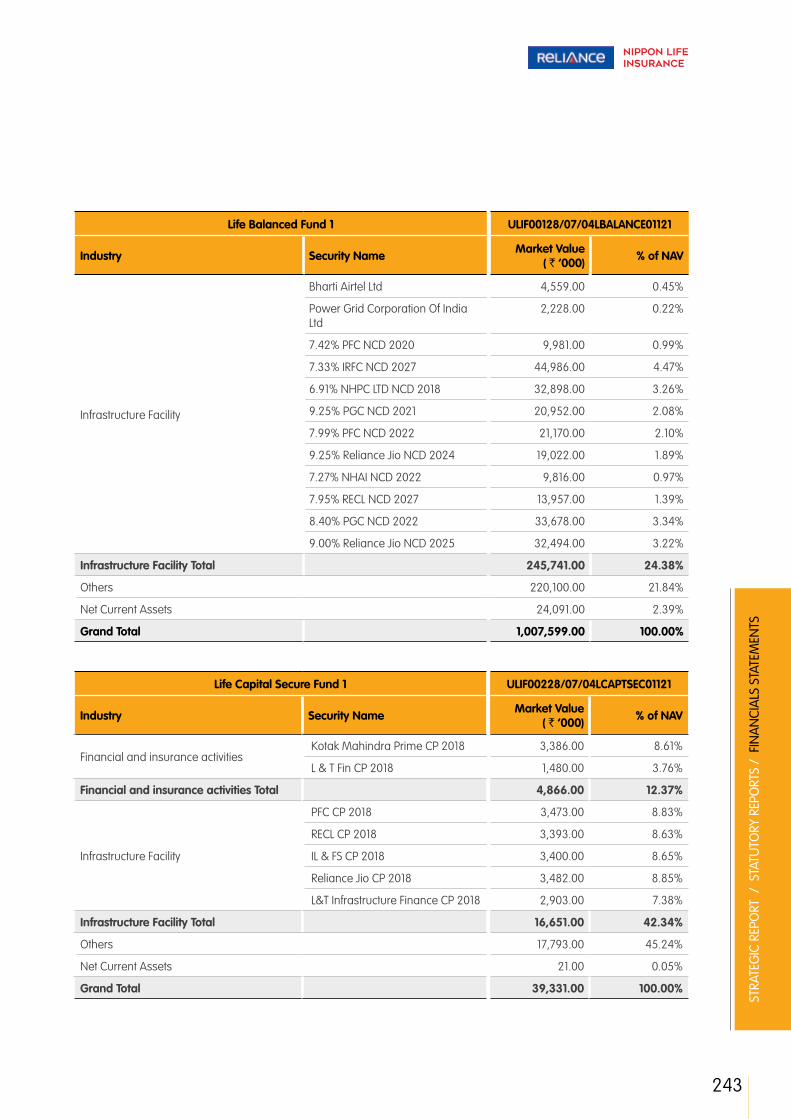
243
STRA
TEG
IC R
EPO
RT /
STA
TUTO
RY R
EPO
RTS
/ F
INA
NCI
ALS
STA
TEM
ENTS
Life Balanced Fund 1 ULIF00128/07/04LBALANCE01121
Industry Security Name Market Value ( ` ‘000) % of NAV
Infrastructure Facility
Bharti Airtel Ltd 4,559.00 0.45%
Power Grid Corporation Of India Ltd
2,228.00 0.22%
7.42% PFC NCD 2020 9,981.00 0.99%
7.33% IRFC NCD 2027 44,986.00 4.47%
6.91% NHPC LTD NCD 2018 32,898.00 3.26%
9.25% PGC NCD 2021 20,952.00 2.08%
7.99% PFC NCD 2022 21,170.00 2.10%
9.25% Reliance Jio NCD 2024 19,022.00 1.89%
7.27% NHAI NCD 2022 9,816.00 0.97%
7.95% RECL NCD 2027 13,957.00 1.39%
8.40% PGC NCD 2022 33,678.00 3.34%
9.00% Reliance Jio NCD 2025 32,494.00 3.22%
Infrastructure Facility Total 245,741.00 24.38%
Others 220,100.00 21.84%
Net Current Assets 24,091.00 2.39%
Grand Total 1,007,599.00 100.00%
Life Capital Secure Fund 1 ULIF00228/07/04LCAPTSEC01121
Industry Security Name Market Value ( ` ‘000) % of NAV
Financial and insurance activities Kotak Mahindra Prime CP 2018 3,386.00 8.61%
L & T Fin CP 2018 1,480.00 3.76%
Financial and insurance activities Total 4,866.00 12.37%
Infrastructure Facility
PFC CP 2018 3,473.00 8.83%
RECL CP 2018 3,393.00 8.63%
IL & FS CP 2018 3,400.00 8.65%
Reliance Jio CP 2018 3,482.00 8.85%
L&T Infrastructure Finance CP 2018 2,903.00 7.38%
Infrastructure Facility Total 16,651.00 42.34%
Others 17,793.00 45.24%
Net Current Assets 21.00 0.05%
Grand Total 39,331.00 100.00%

244
Annual Report 2018-19
Appendix 5
ACCOUNTING RATIO contd...
Life Corporate Bond Fund 1 ULIF02310/06/08LCORBOND01121
Industry Security Name Market Value ( ` ‘000) % of NAV
Financial and insurance activities
Bajaj Fin NCD 2019 56,615.00 1.74%
8.55% Shriram Transport NCD 2021
42,352.00 1.30%
10.00% Ind Bulls Housing NCD 2019
223,126.00 6.86%
7.95% HDFC Bank NCD 2026 293,010.00 9.00%
8.25% Tata Sons NCD 2022 66,999.00 2.06%
9.70% Tata Sons NCD 2022 21,340.00 0.66%
Financial and insurance activities Total 703,442.00 21.62%
Government Securities
GOI G Sec 2022 141,729.00 4.35%
GOI G Sec 2023 185,335.00 5.69%
GOI G Sec 2027 282,875.00 8.69%
GOI G Sec 2030 64,780.00 1.99%
GOI G Sec 2028 167,245.00 5.14%
GOI TB 2018 11,532.00 0.35%
GOI G Sec 2031 304,516.00 9.35%
GOI TB 2019 3,104.00 0.10%
SDL Rajasthan G Sec 2028 13,517.00 0.42%
SDL Bihar G Sec 2028 27,254.00 0.84%
Government Securities Total 1,201,887.00 36.92%
Infrastructure Facility
7.42% PFC NCD 2020 24,952.00 0.77%
7.33% IRFC NCD 2027 62,215.00 1.91%
6.91% NHPC LTD NCD 2018 109,660.00 3.37%
7.99% PFC NCD 2022 129,036.00 3.96%
9.25% Reliance Jio NCD 2024 126,814.00 3.90%
7.27% NHAI NCD 2022 71,658.00 2.20%
9.00% Reliance Jio NCD 2025 172,951.00 5.31%
8.20% PGC NCD 2022 6,076.00 0.19%
7.60% NHAI NCD 2022 118,245.00 3.63%
6.92% IRFC NCD 2019 30,713.00 0.94%
Infrastructure Facility Total 852,320.00 26.18%
Others 410,620.00 12.61%
Net Current Assets 87,040.00 2.67%
Grand Total 3,255,309.00 100.00%

245
STRA
TEG
IC R
EPO
RT /
STA
TUTO
RY R
EPO
RTS
/ F
INA
NCI
ALS
STA
TEM
ENTS
Life Corporate Bond Fund 2 ULIF04020/08/09LCORBOND02121
Industry Security Name Market Value ( ` ‘000) % of NAV
Government Securities
GOI G Sec 2022 1,361.00 4.17%
GOI G Sec 2023 1,741.00 5.34%
GOI G Sec 2027 1,530.00 4.69%
GOI G Sec 2030 638.00 1.96%
GOI G Sec 2028 1,575.00 4.83%
GOI TB 2018 4,457.00 13.66%
GOI G Sec 2031 3,036.00 9.31%
SDL Bihar G Sec 2028 2,008.00 6.16%
Government Securities Total 16,346.00 50.12%
Infrastructure Facility
7.33% IRFC NCD 2027 1,914.00 5.87%
6.91% NHPC LTD NCD 2018 997.00 3.06%
7.99% PFC NCD 2022 2,016.00 6.18%
7.27% NHAI NCD 2022 982.00 3.01%
7.95% RECL NCD 2027 997.00 3.06%
9.00% Reliance Jio NCD 2025 1,048.00 3.21%
Infrastructure Facility Total 7,954.00 24.39%
Others 7,261.00 22.26%
Net Current Assets 1,054.00 3.23%
Grand Total 32,615.00 100.00%
Life Energy Fund 1 ULIF02410/06/08LENERGYF01121
Industry Security Name Market Value ( ` ‘000) % of NAV
Manufacture Of Coke And Refined Petroleum Products
Reliance Industries Ltd 29,290.00 9.42%
Indian Oil Corporation Ltd 12,979.00 4.17%
Castrol (India) Ltd 4,201.00 1.35%
Manufacture Of Coke And Refined Petroleum Products Total
46,470.00 14.94%
Manufacture of electrical equipment
Bharat Heavy Electricals Ltd 17,061.00 5.49%
GE Power India Ltd 9,459.00 3.04%
Bajaj Electricals Ltd 10,178.00 3.27%
Manufacture of electrical equipment Total 36,698.00 11.80%
Manufacture Of Machinery And Equipment N.E.C.
Cummins India Ltd 17,005.00 5.47%
Voltas Ltd 30,057.00 9.66%
Manufacture Of Machinery And Equipment N.E.C. Total
47,062.00 15.13%

246
Annual Report 2018-19
Appendix 5
ACCOUNTING RATIO contd...
Life Energy Fund 1 ULIF02410/06/08LENERGYF01121
Industry Security Name Market Value ( ` ‘000) % of NAV
Civil Engineering Larsen & Toubro Ltd 31,382.00 10.09%
Civil Engineering Total 31,382.00 10.09%
Infrastructure Facility
NTPC Ltd 25,888.00 8.32%
Power Grid Corporation Of India Ltd
24,744.00 7.95%
Petronet Lng Ltd 16,971.00 5.45%
GAIL (India) Ltd 29,636.00 9.53%
Gujarat State Petronet Ltd 18,325.00 5.89%
Infrastructure Facility Total 115,564.00 37.14%
Others 69,666.00 22.39%
Net Current Assets -35,746.00 -11.49%
Grand Total 311,096.00 100.00%
Life Energy Fund 2 ULIF04101/01/10LENERGYF02121
Industry Security Name Market Value ( ` ‘000) % of NAV
Manufacture Of Coke And Refined Petroleum Products
Reliance Industries Ltd 7,682.00 8.70%
Indian Oil Corporation Ltd 3,309.00 3.75%
Castrol (India) Ltd 1,077.00 1.22%
Manufacture Of Coke And Refined Petroleum Products Total
12,068.00 13.67%
Manufacture of electrical equipment
Bharat Heavy Electricals Ltd 4,370.00 4.95%
GE Power India Ltd 2,465.00 2.79%
Bajaj Electricals Ltd 2,673.00 3.03%
Manufacture of electrical equipment Total 9,508.00 10.77%
Manufacture Of Machinery And Equipment N.E.C.
Cummins India Ltd 4,286.00 4.85%
Voltas Ltd 7,779.00 8.81%
Manufacture Of Machinery And Equipment N.E.C. Total
12,065.00 13.66%
Infrastructure Facility
NTPC Ltd 6,655.00 7.53%
Power Grid Corporation Of India Ltd
6,373.00 7.21%
Petronet Lng Ltd 4,520.00 5.12%
GAIL (India) Ltd 7,484.00 8.46%
Gujarat State Petronet Ltd 4,694.00 5.31%
Infrastructure Facility Total 29,726.00 33.63%
Others 26,768.00 30.30%
Net Current Assets -1,796.00 -2.03%
Grand Total 88,339.00 100.00%

247
STRA
TEG
IC R
EPO
RT /
STA
TUTO
RY R
EPO
RTS
/ F
INA
NCI
ALS
STA
TEM
ENTS
Life Equity Fund 1 ULIF00328/07/04LEQUITYF01121
Industry Security Name Market Value ( ` ‘000) % of NAV
Computer programming, consultancy and related activities
Infosys Ltd 100,254.00 6.48%
Tata Consultancy Services Ltd 19,762.00 1.28%
HCL Technologies Ltd 31,472.00 2.04%
Tech Mahindra Ltd 19,290.00 1.25%
NIIT Ltd 11,708.00 0.75%
Cyient Ltd 11,842.00 0.77%
Computer programming, consultancy and related activities Total
194,328.00 12.57%
Financial and insurance activities
HDFC Bank Ltd 124,403.00 8.05%
ICICI Bank Ltd 50,716.00 3.28%
State Bank Of India 18,879.00 1.22%
Axis Bank Ltd 14,708.00 0.95%
Yes Bank Ltd 50,412.00 3.25%
Kotak Mahindra Bank Ltd 35,030.00 2.27%
Bharat Financial Inclusion Ltd 13,595.00 0.88%
Equitas Holdings Ltd 11,100.00 0.72%
Housing Deve Fin Corp Ltd 46,629.00 3.02%
SBI Life Insurance Co Ltd 9,101.00 0.59%
Financial and insurance activities Total 374,573.00 24.23%
Manufacture of motor vehicles, trailers and semi-trailers
Maruti Suzuki India Ltd 74,974.00 4.84%
Motherson Sumi Systems Ltd 39,220.00 2.54%
Tata Motors Ltd 34,880.00 2.26%
Mahindra & Mahindra Ltd 31,131.00 2.01%
Manufacture of motor vehicles, trailers and semi-trailers Total
180,205.00 11.65%
Others 771,887.00 49.92%
Net Current Assets 25,281.00 1.63%
Grand Total 1,546,274.00 100.00%

248
Annual Report 2018-19
Appendix 5
ACCOUNTING RATIO contd...
Life Equity Fund 2 ULIF02510/06/08LEQUITYF02121
Industry Security Name Market Value ( ` ‘000) % of NAV
Computer programming, consultancy and related activities
Infosys Ltd 575,348.00 6.69%
Tata Consultancy Services Ltd 153,635.00 1.79%
HCL Technologies Ltd 166,894.00 1.94%
Tech Mahindra Ltd 118,161.00 1.37%
NIIT Ltd 108,799.00 1.27%
Cyient Ltd 37,860.00 0.44%
Computer programming, consultancy and related activities Total
1,160,697.00 13.50%
Financial and insurance activities
HDFC Bank Ltd 693,930.00 8.07%
ICICI Bank Ltd 296,488.00 3.45%
State Bank Of India 88,413.00 1.03%
Axis Bank Ltd 84,721.00 0.99%
Yes Bank Ltd 299,516.00 3.47%
Kotak Mahindra Bank Ltd 222,390.00 2.59%
Bharat Financial Inclusion Ltd 63,074.00 0.73%
Equitas Holdings Ltd 65,070.00 0.76%
Housing Deve Fin Corp Ltd 271,240.00 3.15%
SBI Life Insurance Co Ltd 40,288.00 0.47%
Financial and insurance activities Total 2,125,130.00 24.71%
Manufacture of motor vehicles, trailers and semi-trailers
Maruti Suzuki India Ltd 422,905.00 4.92%
Motherson Sumi Systems Ltd 227,638.00 2.65%
Tata Motors Ltd 181,678.00 2.11%
Mahindra & Mahindra Ltd 176,030.00 2.05%
Manufacture of motor vehicles, trailers and semi-trailers Total
1,008,251.00 11.73%
Others 4,482,543.00 52.13%
Net Current Assets -178,399.00 -2.07%
Grand Total 8,598,222.00 100.00%
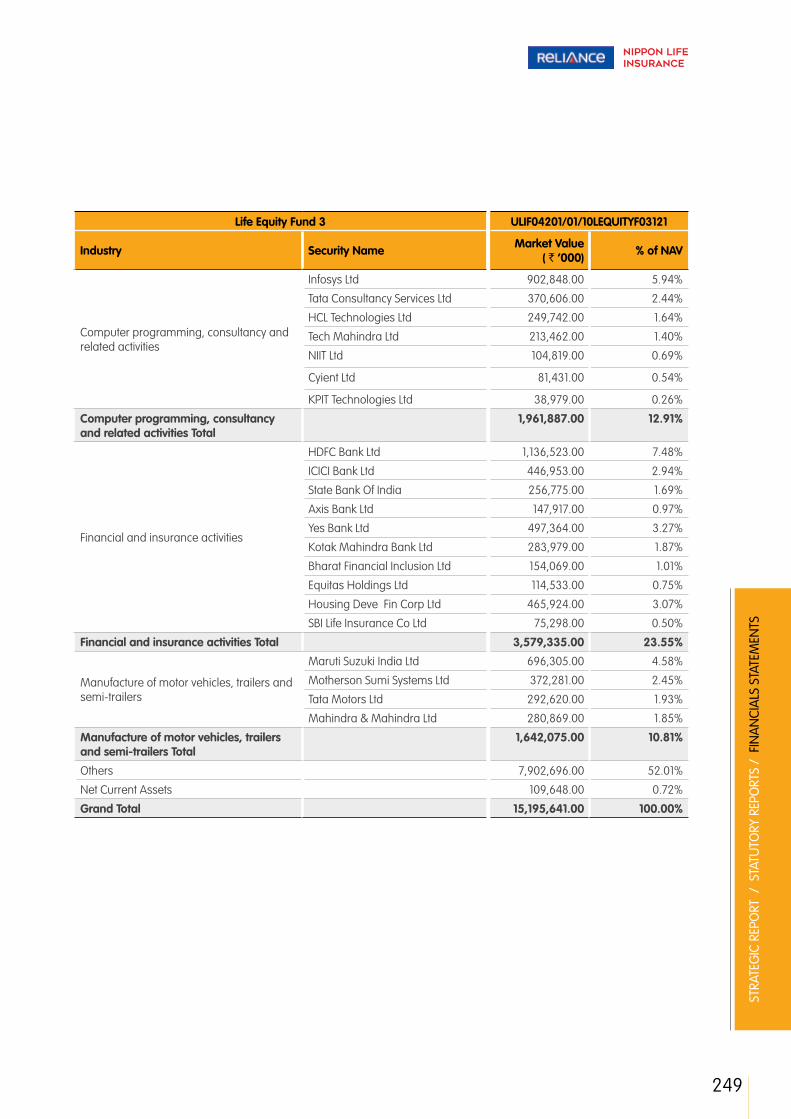
249
STRA
TEG
IC R
EPO
RT /
STA
TUTO
RY R
EPO
RTS
/ F
INA
NCI
ALS
STA
TEM
ENTS
Life Equity Fund 3 ULIF04201/01/10LEQUITYF03121
Industry Security Name Market Value ( ` ‘000) % of NAV
Computer programming, consultancy and related activities
Infosys Ltd 902,848.00 5.94%
Tata Consultancy Services Ltd 370,606.00 2.44%
HCL Technologies Ltd 249,742.00 1.64%
Tech Mahindra Ltd 213,462.00 1.40%
NIIT Ltd 104,819.00 0.69%
Cyient Ltd 81,431.00 0.54%
KPIT Technologies Ltd 38,979.00 0.26%
Computer programming, consultancy and related activities Total
1,961,887.00 12.91%
Financial and insurance activities
HDFC Bank Ltd 1,136,523.00 7.48%
ICICI Bank Ltd 446,953.00 2.94%
State Bank Of India 256,775.00 1.69%
Axis Bank Ltd 147,917.00 0.97%
Yes Bank Ltd 497,364.00 3.27%
Kotak Mahindra Bank Ltd 283,979.00 1.87%
Bharat Financial Inclusion Ltd 154,069.00 1.01%
Equitas Holdings Ltd 114,533.00 0.75%
Housing Deve Fin Corp Ltd 465,924.00 3.07%
SBI Life Insurance Co Ltd 75,298.00 0.50%
Financial and insurance activities Total 3,579,335.00 23.55%
Manufacture of motor vehicles, trailers and semi-trailers
Maruti Suzuki India Ltd 696,305.00 4.58%
Motherson Sumi Systems Ltd 372,281.00 2.45%
Tata Motors Ltd 292,620.00 1.93%
Mahindra & Mahindra Ltd 280,869.00 1.85%
Manufacture of motor vehicles, trailers and semi-trailers Total
1,642,075.00 10.81%
Others 7,902,696.00 52.01%
Net Current Assets 109,648.00 0.72%
Grand Total 15,195,641.00 100.00%

250
Annual Report 2018-19
Appendix 5
ACCOUNTING RATIO contd...
Life Gilt Fund 1 ULIF02610/06/08LGILTFUN01121
Industry Security Name Market Value ( ` ‘000) % of NAV
Government Securities
GOI G Sec 2022 71,991.00 12.23%
GOI G Sec 2023 108,951.00 18.51%
GOI G Sec 2027 114,954.00 19.53%
GOI G Sec 2030 26,254.00 4.46%
GOI G Sec 2028 64,396.00 10.95%
GOI TB 2018 37,275.00 6.33%
GOI G Sec 2031 81,729.00 13.89%
GOI TB 2019 42,138.00 7.16%
SDL Rajasthan G Sec 2028 7,526.00 1.28%
SDL Bihar G Sec 2028 10,011.00 1.70%
Government Securities Total 565,225.00 96.04%
Others 27,831.00 4.73%
Net Current Assets -4,529.00 -0.77%
Grand Total 588,527.00 100.00%
Life Gilt Fund 2 ULIF03819/03/09LGILTFUN02121
Industry Security Name Market Value ( ` ‘000) % of NAV
Government Securities
GOI G Sec 2022 2,080.00 11.77%
GOI G Sec 2023 3,196.00 18.08%
GOI G Sec 2027 3,421.00 19.35%
GOI G Sec 2030 780.00 4.40%
GOI G Sec 2028 1,909.00 10.80%
GOI TB 2018 1,687.00 9.54%
GOI G Sec 2031 2,443.00 13.82%
GOI TB 2019 847.00 4.79%
SDL Rajasthan G Sec 2028 192.00 1.09%
SDL Bihar G Sec 2028 325.00 1.84%
Government Securities Total 16,880.00 95.48%
Others 780.00 4.41%
Net Current Assets 19.00 0.11%
Grand Total 17,679.00 28.15%
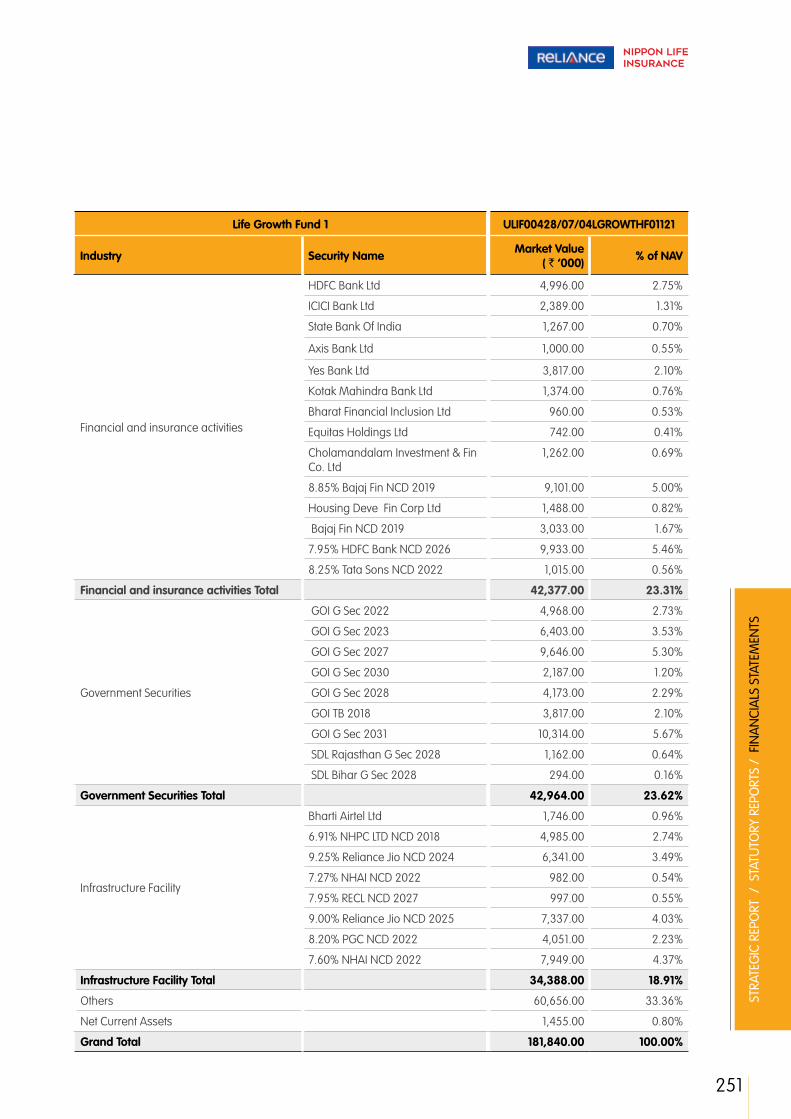
251
STRA
TEG
IC R
EPO
RT /
STA
TUTO
RY R
EPO
RTS
/ F
INA
NCI
ALS
STA
TEM
ENTS
Life Growth Fund 1 ULIF00428/07/04LGROWTHF01121
Industry Security Name Market Value ( ` ‘000) % of NAV
Financial and insurance activities
HDFC Bank Ltd 4,996.00 2.75%
ICICI Bank Ltd 2,389.00 1.31%
State Bank Of India 1,267.00 0.70%
Axis Bank Ltd 1,000.00 0.55%
Yes Bank Ltd 3,817.00 2.10%
Kotak Mahindra Bank Ltd 1,374.00 0.76%
Bharat Financial Inclusion Ltd 960.00 0.53%
Equitas Holdings Ltd 742.00 0.41%
Cholamandalam Investment & Fin Co. Ltd
1,262.00 0.69%
8.85% Bajaj Fin NCD 2019 9,101.00 5.00%
Housing Deve Fin Corp Ltd 1,488.00 0.82%
Bajaj Fin NCD 2019 3,033.00 1.67%
7.95% HDFC Bank NCD 2026 9,933.00 5.46%
8.25% Tata Sons NCD 2022 1,015.00 0.56%
Financial and insurance activities Total 42,377.00 23.31%
Government Securities
GOI G Sec 2022 4,968.00 2.73%
GOI G Sec 2023 6,403.00 3.53%
GOI G Sec 2027 9,646.00 5.30%
GOI G Sec 2030 2,187.00 1.20%
GOI G Sec 2028 4,173.00 2.29%
GOI TB 2018 3,817.00 2.10%
GOI G Sec 2031 10,314.00 5.67%
SDL Rajasthan G Sec 2028 1,162.00 0.64%
SDL Bihar G Sec 2028 294.00 0.16%
Government Securities Total 42,964.00 23.62%
Infrastructure Facility
Bharti Airtel Ltd 1,746.00 0.96%
6.91% NHPC LTD NCD 2018 4,985.00 2.74%
9.25% Reliance Jio NCD 2024 6,341.00 3.49%
7.27% NHAI NCD 2022 982.00 0.54%
7.95% RECL NCD 2027 997.00 0.55%
9.00% Reliance Jio NCD 2025 7,337.00 4.03%
8.20% PGC NCD 2022 4,051.00 2.23%
7.60% NHAI NCD 2022 7,949.00 4.37%
Infrastructure Facility Total 34,388.00 18.91%
Others 60,656.00 33.36%
Net Current Assets 1,455.00 0.80%
Grand Total 181,840.00 100.00%

252
Annual Report 2018-19
Appendix 5
ACCOUNTING RATIO contd...
Life Growth Fund 2 ULIF01102/11/07LGROWTHF02121
Industry Security Name Market Value ( ` ‘000) % of NAV
Financial and insurance activities
HDFC Bank Ltd 6,433.00 2.78%
ICICI Bank Ltd 3,040.00 1.32%
State Bank Of India 1,612.00 0.70%
Axis Bank Ltd 1,272.00 0.55%
Yes Bank Ltd 4,904.00 2.12%
Kotak Mahindra Bank Ltd 1,731.00 0.75%
Bharat Financial Inclusion Ltd 1,225.00 0.53%
Equitas Holdings Ltd 943.00 0.41%
Cholamandalam Investment & Fin Co. Ltd
1,607.00 0.70%
8.85% Bajaj Fin NCD 2019 1,011.00 0.43%
Housing Deve Fin Corp Ltd 1,875.00 0.81%
Bajaj Fin NCD 2019 1,011.00 0.43%
10.00% Ind Bulls Housing NCD 2019
15,495.00 6.70%
7.95% HDFC Bank NCD 2026 9,933.00 4.30%
8.25% Tata Sons NCD 2022 2,030.00 0.88%
Financial and insurance activities Total 54,122.00 23.41%
Government Securities
GOI G Sec 2022 6,501.00 2.81%
GOI G Sec 2023 8,184.00 3.54%
GOI G Sec 2027 12,344.00 5.34%
GOI G Sec 2030 2,795.00 1.21%
GOI G Sec 2028 4,281.00 1.85%
GOI TB 2018 8,354.00 3.61%
GOI G Sec 2031 13,147.00 5.69%
SDL Rajasthan G Sec 2028 1,869.00 0.81%
Government Securities Total 57,475.00 24.86%
Infrastructure Facility
Bharti Airtel Ltd 2,216.00 0.96%
7.33% IRFC NCD 2027 3,829.00 1.66%
6.91% NHPC LTD NCD 2018 5,981.00 2.60%
7.99% PFC NCD 2022 1,008.00 0.44%
9.25% Reliance Jio NCD 2024 2,114.00 0.91%
7.27% NHAI NCD 2022 982.00 0.42%
8.40% PGC NCD 2022 7,144.00 3.09%
9.00% Reliance Jio NCD 2025 3,145.00 1.36%
8.20% PGC NCD 2022 5,063.00 2.19%
Infrastructure Facility Total 31,482.00 13.63%
Others 86,016.00 37.21%
Net Current Assets 2,056.00 0.89%
Grand Total 231,151.00 100.00%

253
STRA
TEG
IC R
EPO
RT /
STA
TUTO
RY R
EPO
RTS
/ F
INA
NCI
ALS
STA
TEM
ENTS
Life Growth Plus Fund 1 ULIF00809/04/07LGRWTPLS01121
Industry Security Name Market Value ( ` ‘000) % of NAV
Financial and insurance activities
HDFC Bank Ltd 10,502.00 3.44%
ICICI Bank Ltd 5,320.00 1.74%
State Bank Of India 2,864.00 0.94%
Axis Bank Ltd 2,262.00 0.74%
Yes Bank Ltd 8,621.00 2.83%
Kotak Mahindra Bank Ltd 3,028.00 0.99%
Bharat Financial Inclusion Ltd 2,199.00 0.72%
Equitas Holdings Ltd 1,512.00 0.50%
Cholamandalam Investment & Fin Co. Ltd
1,620.00 0.53%
8.85% Bajaj Fin NCD 2019 16,179.00 5.30%
Housing Deve Fin Corp Ltd 3,281.00 1.08%
Bajaj Fin NCD 2019 2,022.00 0.66%
10.00% Ind Bulls Housing NCD 2019
5,165.00 1.69%
7.95% HDFC Bank NCD 2026 4,966.00 1.63%
Financial and insurance activities Total 69,541.00 22.79%
Government Securities
GOI G Sec 2022 9,629.00 3.16%
GOI G Sec 2023 9,346.00 3.06%
GOI G Sec 2027 13,708.00 4.49%
GOI G Sec 2030 3,119.00 1.02%
GOI G Sec 2028 7,145.00 2.34%
GOI G Sec 2031 14,673.00 4.81%
SDL Rajasthan G Sec 2028 1,212.00 0.40%
SDL Bihar G Sec 2028 862.00 0.28%
Government Securities Total 59,694.00 19.56%
Infrastructure Facility
9.35% PGC NCD 2022 1,056.00 0.35%
Bharti Airtel Ltd 3,889.00 1.27%
7.33% IRFC NCD 2027 6,700.00 2.20%
7.99% PFC NCD 2022 3,024.00 0.99%
9.25% Reliance Jio NCD 2024 8,454.00 2.77%
7.27% NHAI NCD 2022 1,963.00 0.64%
7.95% RECL NCD 2027 6,979.00 2.29%
9.00% Reliance Jio NCD 2025 10,482.00 3.44%
8.20% PGC NCD 2022 5,063.00 1.66%
Infrastructure Facility Total 47,610.00 15.61%
Others 130,941.00 42.92%
Net Current Assets -2,690.00 -0.88%
Grand Total 305,096.00 100.00%

254
Annual Report 2018-19
Appendix 5
ACCOUNTING RATIO contd...
Life Growth Plus Fund 2 ULIF04301/01/10LGRWTPLS02121
Industry Security Name Market Value ( ` ‘000) % of NAV
Financial and insurance activities
HDFC Bank Ltd 517.00 3.38%
ICICI Bank Ltd 191.00 1.25%
State Bank Of India 129.00 0.84%
Axis Bank Ltd 102.00 0.67%
Yes Bank Ltd 389.00 2.55%
Kotak Mahindra Bank Ltd 138.00 0.90%
Bharat Financial Inclusion Ltd 42.00 0.27%
Equitas Holdings Ltd 108.00 0.71%
Cholamandalam Investment & Fin Co. Ltd
128.00 0.84%
Housing Deve Fin Corp Ltd 170.00 1.11%
Financial and insurance activities Total 1,914.00 12.52%
Government Securities
GOI G Sec 2022 822.00 5.38%
GOI G Sec 2023 446.00 2.92%
GOI G Sec 2027 670.00 4.39%
GOI G Sec 2030 152.00 0.99%
GOI G Sec 2028 374.00 2.45%
GOI G Sec 2031 718.00 4.70%
SDL Rajasthan G Sec 2028 30.00 0.20%
SDL Bihar G Sec 2028 71.00 0.46%
Government Securities Total 3,283.00 21.49%
Infrastructure Facility
Bharti Airtel Ltd 177.00 1.16%
Power Grid Corporation Of India Ltd
85.00 0.56%
6.91% NHPC LTD NCD 2018 997.00 6.53%
7.99% PFC NCD 2022 1,008.00 6.60%
7.95% RECL NCD 2027 997.00 6.52%
9.00% Reliance Jio NCD 2025 1,048.00 6.86%
Infrastructure Facility Total 4,312.00 28.23%
Others 5,443.00 35.63%
Net Current Assets 325.00 2.13%
Grand Total 15,277.00 100.00%

255
STRA
TEG
IC R
EPO
RT /
STA
TUTO
RY R
EPO
RTS
/ F
INA
NCI
ALS
STA
TEM
ENTS
Life High Growth Fund 1 ULIF00728/02/07LHIGROWT01121
Industry Security Name Market Value ( ` ‘000) % of NAV
Financial and insurance activities
9.54% Tata Sons NCD 2022 1,060.00 0.17%
HDFC Bank Ltd 25,283.00 4.08%
ICICI Bank Ltd 11,828.00 1.91%
State Bank Of India 5,498.00 0.89%
Axis Bank Ltd 5,228.00 0.84%
Yes Bank Ltd 19,952.00 3.22%
Kotak Mahindra Bank Ltd 7,008.00 1.13%
Bharat Financial Inclusion Ltd 5,526.00 0.89%
Equitas Holdings Ltd 3,825.00 0.62%
Cholamandalam Investment & Fin Co. Ltd
6,481.00 1.05%
8.85% Bajaj Fin NCD 2019 23,257.00 3.75%
Housing Deve Fin Corp Ltd 7,598.00 1.23%
7.95% HDFC Bank NCD 2026 14,899.00 2.40%
9.70% Tata Sons NCD 2022 8,536.00 1.38%
Financial and insurance activities Total 145,979.00 23.56%
Government Securities
GOI G Sec 2022 16,997.00 2.74%
GOI G Sec 2023 15,180.00 2.45%
GOI G Sec 2027 22,327.00 3.60%
GOI G Sec 2030 5,052.00 0.82%
GOI G Sec 2028 8,139.00 1.31%
GOI G Sec 2031 23,711.00 3.83%
Government Securities Total 91,406.00 14.75%
Infrastructure Facility
Bharti Airtel Ltd 8,995.00 1.45%
6.91% NHPC LTD NCD 2018 17,944.00 2.90%
7.99% PFC NCD 2022 1,008.00 0.16%
9.25% Reliance Jio NCD 2024 20,079.00 3.25%
7.27% NHAI NCD 2022 3,926.00 0.63%
8.40% PGC NCD 2022 5,103.00 0.82%
9.00% Reliance Jio NCD 2025 27,253.00 4.40%
8.20% PGC NCD 2022 12,152.00 1.96%
Infrastructure Facility Total 96,460.00 15.57%
Others 286,997.00 46.32%
Net Current Assets -1,225.00 -0.20%
Grand Total 619,617.00 100.00%

256
Annual Report 2018-19
Appendix 5
ACCOUNTING RATIO contd...
Life High Growth Fund 2 ULIF05511/01/10LHIGROWT02121
Industry Security Name Market Value ( ` ‘000) % of NAV
Financial and insurance activities
HDFC Bank Ltd 969.00 4.11%
ICICI Bank Ltd 374.00 1.57%
State Bank Of India 250.00 1.06%
Axis Bank Ltd 198.00 0.84%
Yes Bank Ltd 745.00 3.16%
Kotak Mahindra Bank Ltd 269.00 1.14%
Bharat Financial Inclusion Ltd 214.00 0.91%
Equitas Holdings Ltd 200.00 0.85%
Cholamandalam Investment & Fin Co. Ltd
245.00 1.04%
Housing Deve Fin Corp Ltd 321.00 1.36%
10.00% Ind Bulls Housing NCD 2019
1,033.00 4.38%
Financial and insurance activities Total 4,818.00 20.42%
Government Securities
GOI G Sec 2022 424.00 1.80%
GOI G Sec 2023 576.00 2.44%
GOI G Sec 2027 836.00 3.54%
GOI G Sec 2030 182.00 0.77%
GOI G Sec 2028 226.00 0.96%
GOI TB 2018 460.00 1.95%
GOI G Sec 2031 885.00 3.75%
SDL Rajasthan G Sec 2028 121.00 0.51%
Government Securities Total 3,710.00 15.72%
Infrastructure Facility
Bharti Airtel Ltd 340.00 1.44%
Power Grid Corporation Of India Ltd
163.00 0.69%
6.91% NHPC LTD NCD 2018 997.00 4.22%
7.99% PFC NCD 2022 1,008.00 4.27%
9.25% Reliance Jio NCD 2024 1,057.00 4.48%
7.60% NHAI NCD 2022 994.00 4.21%
Infrastructure Facility Total 4,559.00 19.31%
Others 10,418.00 44.14%
Net Current Assets 97.00 0.41%
Grand Total 23,602.00 100.00%

257
STRA
TEG
IC R
EPO
RT /
STA
TUTO
RY R
EPO
RTS
/ F
INA
NCI
ALS
STA
TEM
ENTS
Life Highest NAV Advantage Fund 1 ULIF05803/09/10LHNAVADV01121
Industry Security Name Market Value ( ` ‘000) % of NAV
Financial and insurance activities
HDFC Bank Ltd 50,089.00 3.08%
ICICI Bank Ltd 24,212.00 1.49%
State Bank Of India 15,040.00 0.93%
Axis Bank Ltd 14,286.00 0.88%
Yes Bank Ltd 7,522.00 0.46%
Reliance MF ETF 66,894.00 4.12%
Kotak Mahindra Bank Ltd 11,869.00 0.73%
Housing Deve Fin Corp Ltd 40,742.00 2.51%
Indusind Bank Ltd 32,090.00 1.97%
Financial and insurance activities Total 262,744.00 16.17%
Manufacture Of Chemicals And Chemical Products
Asian Paints Ltd 15,332.00 0.94%
Hindustan Unilever Ltd 28,798.00 1.77%
Godrej Industries CP 2018 138,447.00 8.53%
Manufacture Of Chemicals And Chemical Products Total
182,577.00 11.24%
Infrastructure Facility
Bharti Airtel Ltd 13,431.00 0.83%
NTPC Ltd 15,611.00 0.96%
Power Grid Corporation Of India Ltd
12,822.00 0.79%
GAIL (India) Ltd 8,475.00 0.52%
PFC CP 2018 136,416.00 8.40%
PGC CP 2018 104,174.00 6.41%
NTPC CP 2018 98,875.00 6.09%
Adani Ports & Special Economic Zone Ltd
8,460.00 0.52%
RECL CP 2018 145,405.00 8.95%
Infrastructure Facility Total 543,669.00 33.47%
Others 637,648.00 39.25%
Net Current Assets -2,132.00 -0.13%
Grand Total 1,624,506.00 100.00%

258
Annual Report 2018-19
Appendix 5
ACCOUNTING RATIO contd...
Life Highest NAV Advantage Fund 2 ULIF05901/06/11LHNAVADV02121
Industry Security Name Market Value ( ` ‘000) % of NAV
Computer programming, consultancy and related activities
Infosys Ltd 13,715.00 6.26%
Tata Consultancy Services Ltd 8,767.00 4.00%
Wipro Ltd 2,288.00 1.04%
Computer programming, consultancy and related activities Total
24,770.00 11.30%
Financial and insurance activities
HDFC Bank Ltd 10,624.00 4.85%
ICICI Bank Ltd 5,137.00 2.35%
State Bank Of India 3,191.00 1.46%
Axis Bank Ltd 3,031.00 1.38%
Yes Bank Ltd 1,596.00 0.73%
Reliance MF ETF 7,120.00 3.25%
Kotak Mahindra Bank Ltd 2,519.00 1.15%
Housing Deve Fin Corp Ltd 8,644.00 3.96%
Indusind Bank Ltd 4,623.00 2.11%
Financial and insurance activities Total 46,485.00 21.24%
Infrastructure Facility
Bharti Airtel Ltd 2,850.00 1.30%
NTPC Ltd 3,312.00 1.51%
Power Grid Corporation Of India Ltd
2,720.00 1.24%
GAIL (India) Ltd 1,798.00 0.82%
PGC CP 2018 9,921.00 4.53%
NTPC CP 2018 14,831.00 6.77%
Adani Ports & Special Economic Zone Ltd
1,795.00 0.82%
RECL CP 2018 9,694.00 4.43%
Infrastructure Facility Total 46,921.00 21.42%
Others 101,302.00 46.25%
Net Current Assets -464.00 -0.21%
Grand Total 219,014.00 100.00%

259
STRA
TEG
IC R
EPO
RT /
STA
TUTO
RY R
EPO
RTS
/ F
INA
NCI
ALS
STA
TEM
ENTS
Life Highest NAV Guarantee Fund 1 ULIF05612/02/10LHNAVGUA01121
Industry Security Name Market Value ( ` ‘000) % of NAV
Financial and insurance activities
7.80% Bajaj Fin NCD 2020 248,486.00 5.61%
8.12% Cholamandalam Inv & Fin Co. NCD 2020
247,059.00 5.58%
Financial and insurance activities Total 495,545.00 11.19%
Government Securities
SDL Rajasthan G Sec 2020 1,219,618.00 27.55%
SDL Maharashtra G Sec 2020 461,232.00 10.43%
SDL WB G Sec 2020 460,147.00 10.39%
SDL UP G Sec 2020 253,814.00 5.73%
Government Securities Total 2,394,811.00 54.10%
CBLO CCIL CBLO 2018 1,085,643.00 24.52%
CBLO Total 1,085,643.00 24.52%
Infrastructure Facility
GAIL (India) Ltd 319.00 0.01%
PFC CP 2018 9,744.00 0.22%
PGC CP 2018 257,955.00 5.83%
L&T Infrastructure Finance CP 2018 43,545.00 0.98%
7.42% PFC NCD 2020 99,808.00 2.25%
7.13% RECL NCD 2020 247,736.00 5.60%
7.53% PFC NCD 2020 250,108.00 5.65%
8.95% Reliance Jio NCD 2020 257,377.00 5.81%
Infrastructure Facility Total 1,166,592.00 26.35%
Others 306,436.00 6.92%
Net Current Assets -1,021,827.00 -23.08%
Grand Total 4,427,200.00 100.00%
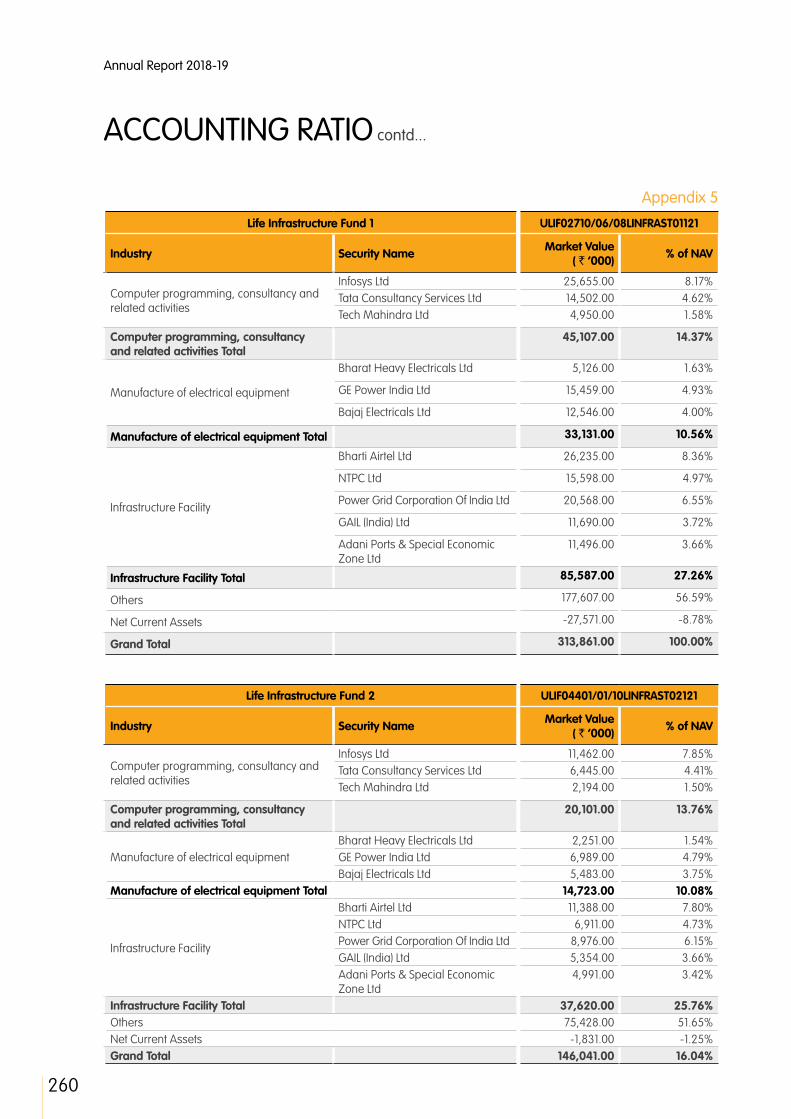
260
Annual Report 2018-19
Appendix 5
ACCOUNTING RATIO contd...
Life Infrastructure Fund 1 ULIF02710/06/08LINFRAST01121
Industry Security Name Market Value ( ` ‘000) % of NAV
Computer programming, consultancy and related activities
Infosys Ltd 25,655.00 8.17%Tata Consultancy Services Ltd 14,502.00 4.62%Tech Mahindra Ltd 4,950.00 1.58%
Computer programming, consultancy and related activities Total
45,107.00 14.37%
Manufacture of electrical equipment
Bharat Heavy Electricals Ltd 5,126.00 1.63%
GE Power India Ltd 15,459.00 4.93%
Bajaj Electricals Ltd 12,546.00 4.00%
Manufacture of electrical equipment Total 33,131.00 10.56%
Infrastructure Facility
Bharti Airtel Ltd 26,235.00 8.36%
NTPC Ltd 15,598.00 4.97%
Power Grid Corporation Of India Ltd 20,568.00 6.55%
GAIL (India) Ltd 11,690.00 3.72%
Adani Ports & Special Economic Zone Ltd
11,496.00 3.66%
Infrastructure Facility Total 85,587.00 27.26%
Others 177,607.00 56.59%
Net Current Assets -27,571.00 -8.78%
Grand Total 313,861.00 100.00%
Life Infrastructure Fund 2 ULIF04401/01/10LINFRAST02121
Industry Security Name Market Value ( ` ‘000) % of NAV
Computer programming, consultancy and related activities
Infosys Ltd 11,462.00 7.85%Tata Consultancy Services Ltd 6,445.00 4.41%Tech Mahindra Ltd 2,194.00 1.50%
Computer programming, consultancy and related activities Total
20,101.00 13.76%
Manufacture of electrical equipmentBharat Heavy Electricals Ltd 2,251.00 1.54%GE Power India Ltd 6,989.00 4.79%Bajaj Electricals Ltd 5,483.00 3.75%
Manufacture of electrical equipment Total 14,723.00 10.08%
Infrastructure Facility
Bharti Airtel Ltd 11,388.00 7.80%NTPC Ltd 6,911.00 4.73%Power Grid Corporation Of India Ltd 8,976.00 6.15%GAIL (India) Ltd 5,354.00 3.66%Adani Ports & Special Economic Zone Ltd
4,991.00 3.42%
Infrastructure Facility Total 37,620.00 25.76%Others 75,428.00 51.65%Net Current Assets -1,831.00 -1.25%Grand Total 146,041.00 16.04%

261
STRA
TEG
IC R
EPO
RT /
STA
TUTO
RY R
EPO
RTS
/ F
INA
NCI
ALS
STA
TEM
ENTS
Life Midcap Fund 1 ULIF02810/06/08LMIDCAPF01121
Industry Security Name Market Value ( ` ‘000) % of NAV
Financial and insurance activities
State Bank Of India 13,494.00 3.04%
Yes Bank Ltd 13,833.00 3.12%
Kotak Mahindra Bank Ltd 7,588.00 1.71%
Bharat Financial Inclusion Ltd 11,315.00 2.55%
Cholamandalam Investment & Fin Co. Ltd
11,875.00 2.69%
Shriram Transport Finance Co. Ltd 13,532.00 3.05%
SBI Life Insurance Co Ltd 9,348.00 2.12%
RBL Bank Ltd 22,579.00 5.09%
Financial and insurance activities Total 103,564.00 23.37%
Others 366,611.00 82.72%
Net Current Assets -26,994.00 -6.09%
Grand Total 443,181.00 100.00%
Life Midcap Fund 2 ULIF04501/01/10LMIDCAPF02121
Industry Security Name Market Value ( ` ‘000) % of NAV
Financial and insurance activities
State Bank Of India 21,046.00 2.87%
Yes Bank Ltd 21,438.00 2.92%
Kotak Mahindra Bank Ltd 11,612.00 1.58%
Bharat Financial Inclusion Ltd 17,387.00 2.37%
Cholamandalam Investment & Fin Co. Ltd
18,234.00 2.48%
Shriram Transport Finance Co. Ltd 20,509.00 2.79%
SBI Life Insurance Co Ltd 14,688.00 2.00%
RBL Bank Ltd 34,425.00 4.69%
Financial and insurance activities Total 159,339.00 21.70%
Others 578,798.00 78.83%
Net Current Assets -3,914.00 -0.53%
Grand Total 734,223.00 100.00%

262
Annual Report 2018-19
Appendix 5
ACCOUNTING RATIO contd...
Life Money Market Fund 1 ULIF02910/06/08LMONMRKT01121
Industry Security Name Market Value ( ` ‘000) % of NAV
Financial and insurance activities
Bajaj Fin CP 2018 194,671.00 8.35%
Kotak Mahindra Investments CP 2018
188,697.00 8.09%
Kotak Mahindra Prime CP 2018 7,738.00 0.33%
TCFSL CP 2019 85,545.00 3.67%
Ind Bulls Housing CP 2019 49,054.00 2.10%
Financial and insurance activities Total 525,705.00 22.54%
Housing Finance Companies HDFC CP 2018 193,060.00 8.28%
ICICI Home Fin CP 2018 71,592.00 3.07%
Housing Finance Companies Total 264,652.00 11.35%
Infrastructure Facility
PFC CP 2018 205,436.00 8.81%
NTPC CP 2018 39,550.00 1.70%
RECL CP 2018 189,027.00 8.11%
IL & FS CP 2018 42,748.00 1.83%
IL & FS CP 2019 155,749.00 6.68%
Infrastructure Facility Total 632,510.00 27.13%
Others 886,455.00 38.02%
Net Current Assets 22,408.00 0.96%
Grand Total 2,331,730.00 100.00%
Life Money Market Fund 2 ULIF03919/03/09LMONMRKT02121
Industry Security Name Market Value ( ` ‘000) % of NAV
Financial and insurance activities
Bajaj Fin CP 2018 1,464.00 6.00%
Kotak Mahindra Investments CP 2018
1,470.00 6.03%
Kotak Mahindra Prime CP 2018 1,451.00 5.95%
TCFSL CP 2019 935.00 3.83%
Ind Bulls Housing CP 2019 467.00 1.91%
Financial and insurance activities Total 5,787.00 23.72%
Housing Finance Companies HDFC CP 2018 1,958.00 8.03%
ICICI Home Fin CP 2018 967.00 3.96%
Housing Finance Companies Total 2,925.00 11.99%
Manufacture Of Pharmaceuticals, Medicinal Chemical And Botanical Products
Piramal Enterises Limited CP 2018 1,962.00 8.04%
Sun Pharma CP 2018 493.00 2.02%
Manufacture Of Pharmaceuticals, Medicinal Chemical And Botanical Products Total
2,455.00 10.06%
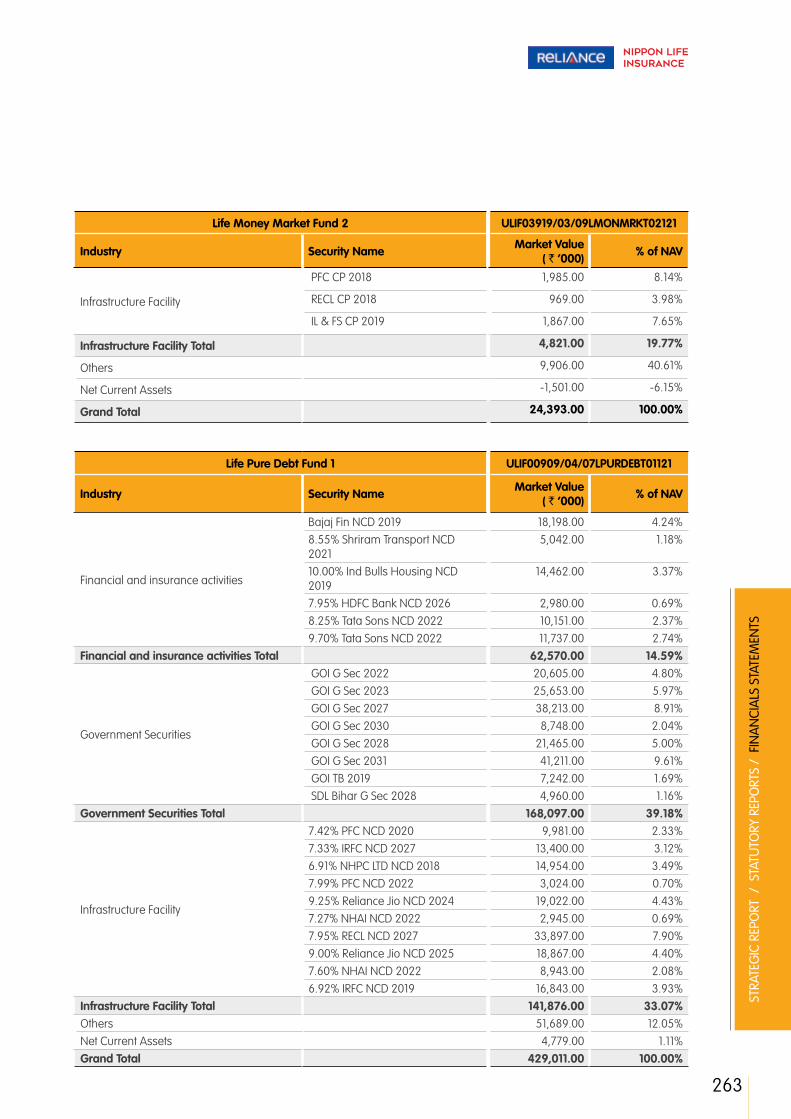
263
STRA
TEG
IC R
EPO
RT /
STA
TUTO
RY R
EPO
RTS
/ F
INA
NCI
ALS
STA
TEM
ENTS
Life Money Market Fund 2 ULIF03919/03/09LMONMRKT02121
Industry Security Name Market Value ( ` ‘000) % of NAV
Infrastructure Facility
PFC CP 2018 1,985.00 8.14%
RECL CP 2018 969.00 3.98%
IL & FS CP 2019 1,867.00 7.65%
Infrastructure Facility Total 4,821.00 19.77%
Others 9,906.00 40.61%
Net Current Assets -1,501.00 -6.15%
Grand Total 24,393.00 100.00%
Life Pure Debt Fund 1 ULIF00909/04/07LPURDEBT01121
Industry Security Name Market Value ( ` ‘000) % of NAV
Financial and insurance activities
Bajaj Fin NCD 2019 18,198.00 4.24%8.55% Shriram Transport NCD 2021
5,042.00 1.18%
10.00% Ind Bulls Housing NCD 2019
14,462.00 3.37%
7.95% HDFC Bank NCD 2026 2,980.00 0.69%8.25% Tata Sons NCD 2022 10,151.00 2.37%9.70% Tata Sons NCD 2022 11,737.00 2.74%
Financial and insurance activities Total 62,570.00 14.59%
Government Securities
GOI G Sec 2022 20,605.00 4.80% GOI G Sec 2023 25,653.00 5.97% GOI G Sec 2027 38,213.00 8.91% GOI G Sec 2030 8,748.00 2.04% GOI G Sec 2028 21,465.00 5.00% GOI G Sec 2031 41,211.00 9.61% GOI TB 2019 7,242.00 1.69% SDL Bihar G Sec 2028 4,960.00 1.16%
Government Securities Total 168,097.00 39.18%
Infrastructure Facility
7.42% PFC NCD 2020 9,981.00 2.33%7.33% IRFC NCD 2027 13,400.00 3.12%6.91% NHPC LTD NCD 2018 14,954.00 3.49%7.99% PFC NCD 2022 3,024.00 0.70%9.25% Reliance Jio NCD 2024 19,022.00 4.43%7.27% NHAI NCD 2022 2,945.00 0.69%7.95% RECL NCD 2027 33,897.00 7.90%9.00% Reliance Jio NCD 2025 18,867.00 4.40%7.60% NHAI NCD 2022 8,943.00 2.08%6.92% IRFC NCD 2019 16,843.00 3.93%
Infrastructure Facility Total 141,876.00 33.07%Others 51,689.00 12.05%Net Current Assets 4,779.00 1.11%Grand Total 429,011.00 100.00%
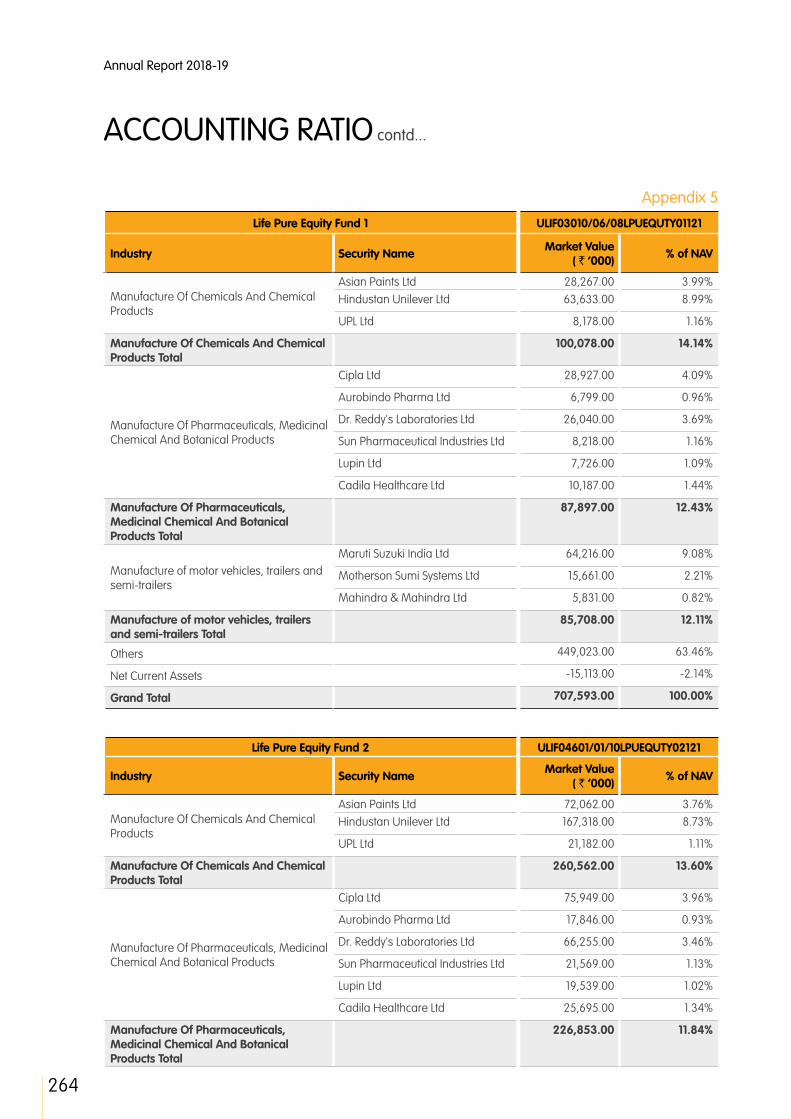
264
Annual Report 2018-19
Appendix 5
ACCOUNTING RATIO contd...
Life Pure Equity Fund 1 ULIF03010/06/08LPUEQUTY01121
Industry Security Name Market Value ( ` ‘000) % of NAV
Manufacture Of Chemicals And Chemical Products
Asian Paints Ltd 28,267.00 3.99%Hindustan Unilever Ltd 63,633.00 8.99%
UPL Ltd 8,178.00 1.16%
Manufacture Of Chemicals And Chemical Products Total
100,078.00 14.14%
Manufacture Of Pharmaceuticals, Medicinal Chemical And Botanical Products
Cipla Ltd 28,927.00 4.09%
Aurobindo Pharma Ltd 6,799.00 0.96%
Dr. Reddy's Laboratories Ltd 26,040.00 3.69%
Sun Pharmaceutical Industries Ltd 8,218.00 1.16%
Lupin Ltd 7,726.00 1.09%
Cadila Healthcare Ltd 10,187.00 1.44%
Manufacture Of Pharmaceuticals, Medicinal Chemical And Botanical Products Total
87,897.00 12.43%
Manufacture of motor vehicles, trailers and semi-trailers
Maruti Suzuki India Ltd 64,216.00 9.08%
Motherson Sumi Systems Ltd 15,661.00 2.21%
Mahindra & Mahindra Ltd 5,831.00 0.82%
Manufacture of motor vehicles, trailers and semi-trailers Total
85,708.00 12.11%
Others 449,023.00 63.46%
Net Current Assets -15,113.00 -2.14%
Grand Total 707,593.00 100.00%
Life Pure Equity Fund 2 ULIF04601/01/10LPUEQUTY02121
Industry Security Name Market Value ( ` ‘000) % of NAV
Manufacture Of Chemicals And Chemical Products
Asian Paints Ltd 72,062.00 3.76%Hindustan Unilever Ltd 167,318.00 8.73%
UPL Ltd 21,182.00 1.11%
Manufacture Of Chemicals And Chemical Products Total
260,562.00 13.60%
Manufacture Of Pharmaceuticals, Medicinal Chemical And Botanical Products
Cipla Ltd 75,949.00 3.96%
Aurobindo Pharma Ltd 17,846.00 0.93%
Dr. Reddy's Laboratories Ltd 66,255.00 3.46%
Sun Pharmaceutical Industries Ltd 21,569.00 1.13%
Lupin Ltd 19,539.00 1.02%
Cadila Healthcare Ltd 25,695.00 1.34%
Manufacture Of Pharmaceuticals, Medicinal Chemical And Botanical Products Total
226,853.00 11.84%

265
STRA
TEG
IC R
EPO
RT /
STA
TUTO
RY R
EPO
RTS
/ F
INA
NCI
ALS
STA
TEM
ENTS
Life Pure Equity Fund 2 ULIF04601/01/10LPUEQUTY02121
Industry Security Name Market Value ( ` ‘000) % of NAV
Manufacture of motor vehicles, trailers and semi-trailers
Maruti Suzuki India Ltd 167,404.00 8.74%
Motherson Sumi Systems Ltd 41,313.00 2.15%
Mahindra & Mahindra Ltd 15,383.00 0.80%
Manufacture of motor vehicles, trailers and semi-trailers Total
224,100.00 11.69%
Others 1,199,383.00 62.59%
Net Current Assets 5,293.00 0.28%
Grand Total 1,916,191.00 100.00%
Life Super Growth Fund 1 ULIF01009/04/07LSPRGRWT01121
Industry Security Name Market Value ( ` ‘000) % of NAV
Financial and insurance activities
HDFC Bank Ltd 21,826.00 5.90%
ICICI Bank Ltd 10,372.00 2.80%
State Bank Of India 4,421.00 1.20%
Axis Bank Ltd 4,318.00 1.17%
Yes Bank Ltd 16,301.00 4.41%
Kotak Mahindra Bank Ltd 5,674.00 1.53%
Bharat Financial Inclusion Ltd 4,203.00 1.14%
Equitas Holdings Ltd 3,191.00 0.86%
Cholamandalam Investment & Fin Co. Ltd
3,303.00 0.89%
Housing Deve Fin Corp Ltd 6,123.00 1.66%
Bajaj Fin NCD 2019 2,022.00 0.55%
7.95% HDFC Bank NCD 2026 4,966.00 1.34%
Financial and insurance activities Total 86,720.00 23.45%
Infrastructure Facility
Bharti Airtel Ltd 7,395.00 2.00%
6.91% NHPC LTD NCD 2018 7,975.00 2.16%
7.99% PFC NCD 2022 2,016.00 0.55%
9.25% Reliance Jio NCD 2024 3,170.00 0.86%
7.27% NHAI NCD 2022 982.00 0.27%
8.40% PGC NCD 2022 4,082.00 1.10%
9.00% Reliance Jio NCD 2025 4,193.00 1.13%
8.20% PGC NCD 2022 8,101.00 2.18%
7.60% NHAI NCD 2022 994.00 0.27%
Infrastructure Facility Total 38,908.00 10.52%
Others 248,772.00 67.26%
Net Current Assets -4,535.00 -1.23%
Grand Total 369,865.00 100.00%

266
Annual Report 2018-19
Appendix 5
ACCOUNTING RATIO contd...
Life Super Growth Fund 2 ULIF04701/01/10LSPRGRWT02121
Industry Security Name Market Value ( ` ‘000) % of NAV
Financial and insurance activities
HDFC Bank Ltd 1,128.00 5.50%
ICICI Bank Ltd 420.00 2.05%
State Bank Of India 284.00 1.39%
Axis Bank Ltd 224.00 1.09%
Yes Bank Ltd 856.00 4.18%
Kotak Mahindra Bank Ltd 306.00 1.49%
Bharat Financial Inclusion Ltd 249.00 1.21%
Equitas Holdings Ltd 233.00 1.14%
Cholamandalam Investment & Fin Co. Ltd
278.00 1.36%
Housing Deve Fin Corp Ltd 363.00 1.77%
Financial and insurance activities Total 4,341.00 21.18%
Infrastructure Facility
Bharti Airtel Ltd 389.00 1.90%
Power Grid Corporation Of India Ltd
197.00 0.96%
7.33% IRFC NCD 2027 957.00 4.67%
7.60% NHAI NCD 2022 994.00 4.85%
Infrastructure Facility Total 2,537.00 12.38%
Others 13,615.00 66.42%
Net Current Assets 5.00 0.02%
Grand Total 20,498.00 100.00%
Make in India Fund ULIF06924/03/15LMAKEINDIA121
Industry Security Name Market Value ( ` ‘000) % of NAV
Computer programming, consultancy and related activities
Infosys Ltd 76,631.00 5.06%
Tata Consultancy Services Ltd 58,336.00 3.85%
HCL Technologies Ltd 18,380.00 1.21%
Tech Mahindra Ltd 15,891.00 1.05%
KPIT Technologies Ltd 12,672.00 0.84%Computer programming, consultancy and related activities Total
181,910.00 12.01%
Manufacture Of Coke And Refined Petroleum Products
Reliance Industries Ltd 112,206.00 7.41%
Indian Oil Corporation Ltd 23,607.00 1.56%
Castrol (India) Ltd 23,266.00 1.54%Manufacture Of Coke And Refined Petroleum Products Total
159,079.00 10.51%
Others 1,024,220.00 67.66%
Net Current Assets 148,671.00 9.82%
Grand Total 1,513,880.00 100.00%

267
STRA
TEG
IC R
EPO
RT /
STA
TUTO
RY R
EPO
RTS
/ F
INA
NCI
ALS
STA
TEM
ENTS
Pension Balanced Fund 1 ULIF03104/12/08PBALANCE01121
Industry Security Name Market Value ( ` ‘000) % of NAV
Financial and insurance activities
HDFC Bank Ltd 2,920.00 1.30%
ICICI Bank Ltd 1,458.00 0.65%
State Bank Of India 781.00 0.35%
Axis Bank Ltd 616.00 0.27%
Yes Bank Ltd 2,327.00 1.04%
Kotak Mahindra Bank Ltd 825.00 0.37%
Bharat Financial Inclusion Ltd 573.00 0.26%
Equitas Holdings Ltd 449.00 0.20%
Cholamandalam Investment & Fin Co. Ltd
760.00 0.34%
8.85% Bajaj Fin NCD 2019 10,112.00 4.51%
Housing Deve Fin Corp Ltd 896.00 0.40%
Bajaj Fin NCD 2019 10,110.00 4.51%
10.00% Ind Bulls Housing NCD 2019
10,330.00 4.60%
7.95% HDFC Bank NCD 2026 4,966.00 2.21%
8.25% Tata Sons NCD 2022 3,045.00 1.36%
Financial and insurance activities Total 50,168.00 22.37%
Government Securities
GOI G Sec 2022 8,060.00 3.59%
GOI G Sec 2023 10,400.00 4.64%
GOI G Sec 2027 15,799.00 7.04%
GOI G Sec 2030 3,594.00 1.60%
GOI G Sec 2028 8,681.00 3.87%
GOI G Sec 2031 16,931.00 7.55%
SDL Rajasthan G Sec 2028 1,647.00 0.73%
SDL Bihar G Sec 2028 751.00 0.33%
Government Securities Total 65,863.00 29.35%
Infrastructure Facility
Bharti Airtel Ltd 1,067.00 0.48%
7.33% IRFC NCD 2027 3,829.00 1.71%
6.91% NHPC LTD NCD 2018 6,978.00 3.10%
7.99% PFC NCD 2022 6,049.00 2.70%
9.25% Reliance Jio NCD 2024 1,057.00 0.47%
7.27% NHAI NCD 2022 1,963.00 0.87%
7.95% RECL NCD 2027 13,957.00 6.22%
8.40% PGC NCD 2022 5,103.00 2.27%
9.00% Reliance Jio NCD 2025 7,337.00 3.27%
8.20% PGC NCD 2022 4,051.00 1.81%
Infrastructure Facility Total 51,391.00 22.90%
Others 53,726.00 23.94%
Net Current Assets 3,227.00 1.44%
Grand Total 224,375.00 100.00%

268
Annual Report 2018-19
Appendix 5
ACCOUNTING RATIO contd...
Pension Balanced Fund 2 ULIF04801/01/10PBALANCE02121
Industry Security Name Market Value ( ` ‘000) % of NAV
Financial and insurance activities
HDFC Bank Ltd 651.00 1.03%
ICICI Bank Ltd 242.00 0.38%
State Bank Of India 164.00 0.26%
Axis Bank Ltd 129.00 0.20%
Yes Bank Ltd 488.00 0.77%
Kotak Mahindra Bank Ltd 171.00 0.27%
Bharat Financial Inclusion Ltd 143.00 0.23%
Equitas Holdings Ltd 136.00 0.21%
Cholamandalam Investment & Fin Co. Ltd
161.00 0.25%
8.85% Bajaj Fin NCD 2019 2,022.00 3.19%
Housing Deve Fin Corp Ltd 206.00 0.33%
Bajaj Fin NCD 2019 2,022.00 3.19%
8.55% Shriram Transport NCD 2021
1,008.00 1.59%
Financial and insurance activities Total 7,543.00 11.90%
Government Securities
GOI G Sec 2022 1,376.00 2.17%
GOI G Sec 2023 2,216.00 3.50%
GOI G Sec 2027 3,369.00 5.32%
GOI G Sec 2030 759.00 1.20%
GOI G Sec 2028 1,870.00 2.94%
GOI TB 2018 460.00 0.73%
GOI G Sec 2031 3,609.00 5.70%
SDL Rajasthan G Sec 2028 182.00 0.29%
SDL Bihar G Sec 2028 325.00 0.51%
Government Securities Total 14,166.00 22.36%
Infrastructure Facility
Bharti Airtel Ltd 222.00 0.35%
Power Grid Corporation Of India Ltd
111.00 0.18%
7.33% IRFC NCD 2027 1,914.00 3.02%
6.91% NHPC LTD NCD 2018 997.00 1.57%
7.99% PFC NCD 2022 3,024.00 4.76%
9.25% Reliance Jio NCD 2024 2,114.00 3.34%
7.95% RECL NCD 2027 2,991.00 4.72%
8.40% PGC NCD 2022 2,041.00 3.22%
9.00% Reliance Jio NCD 2025 2,096.00 3.31%
7.60% NHAI NCD 2022 1,987.00 3.14%
Infrastructure Facility Total 17,497.00 27.61%
Others 8,174.00 12.90%
Net Current Assets 15,988.00 25.23%
Grand Total 63,368.00 100.00%
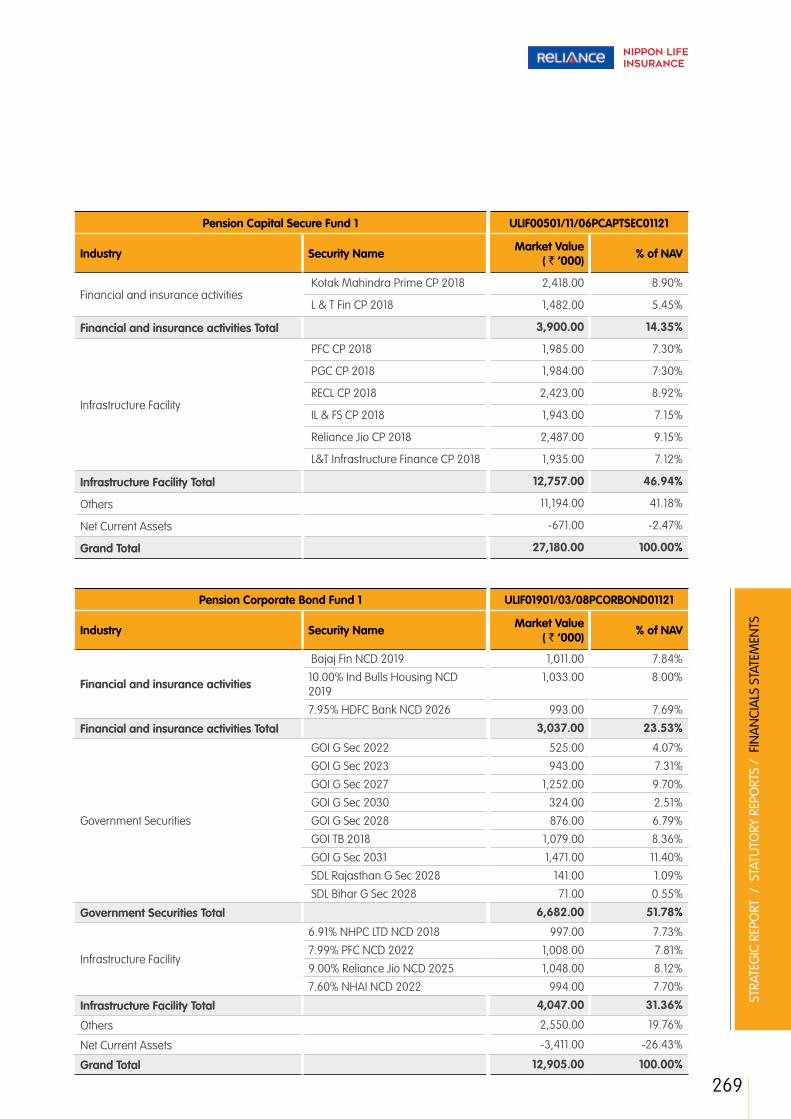
269
STRA
TEG
IC R
EPO
RT /
STA
TUTO
RY R
EPO
RTS
/ F
INA
NCI
ALS
STA
TEM
ENTS
Pension Capital Secure Fund 1 ULIF00501/11/06PCAPTSEC01121
Industry Security Name Market Value ( ` ‘000) % of NAV
Financial and insurance activities Kotak Mahindra Prime CP 2018 2,418.00 8.90%
L & T Fin CP 2018 1,482.00 5.45%
Financial and insurance activities Total 3,900.00 14.35%
Infrastructure Facility
PFC CP 2018 1,985.00 7.30%
PGC CP 2018 1,984.00 7.30%
RECL CP 2018 2,423.00 8.92%
IL & FS CP 2018 1,943.00 7.15%
Reliance Jio CP 2018 2,487.00 9.15%
L&T Infrastructure Finance CP 2018 1,935.00 7.12%
Infrastructure Facility Total 12,757.00 46.94%
Others 11,194.00 41.18%
Net Current Assets -671.00 -2.47%
Grand Total 27,180.00 100.00%
Pension Corporate Bond Fund 1 ULIF01901/03/08PCORBOND01121
Industry Security Name Market Value ( ` ‘000) % of NAV
Financial and insurance activities
Bajaj Fin NCD 2019 1,011.00 7.84%
10.00% Ind Bulls Housing NCD 2019
1,033.00 8.00%
7.95% HDFC Bank NCD 2026 993.00 7.69%
Financial and insurance activities Total 3,037.00 23.53%
Government Securities
GOI G Sec 2022 525.00 4.07%
GOI G Sec 2023 943.00 7.31%
GOI G Sec 2027 1,252.00 9.70%
GOI G Sec 2030 324.00 2.51%
GOI G Sec 2028 876.00 6.79%
GOI TB 2018 1,079.00 8.36%
GOI G Sec 2031 1,471.00 11.40%
SDL Rajasthan G Sec 2028 141.00 1.09%
SDL Bihar G Sec 2028 71.00 0.55%
Government Securities Total 6,682.00 51.78%
Infrastructure Facility
6.91% NHPC LTD NCD 2018 997.00 7.73%
7.99% PFC NCD 2022 1,008.00 7.81%
9.00% Reliance Jio NCD 2025 1,048.00 8.12%
7.60% NHAI NCD 2022 994.00 7.70%
Infrastructure Facility Total 4,047.00 31.36%
Others 2,550.00 19.76%
Net Current Assets -3,411.00 -26.43%
Grand Total 12,905.00 100.00%
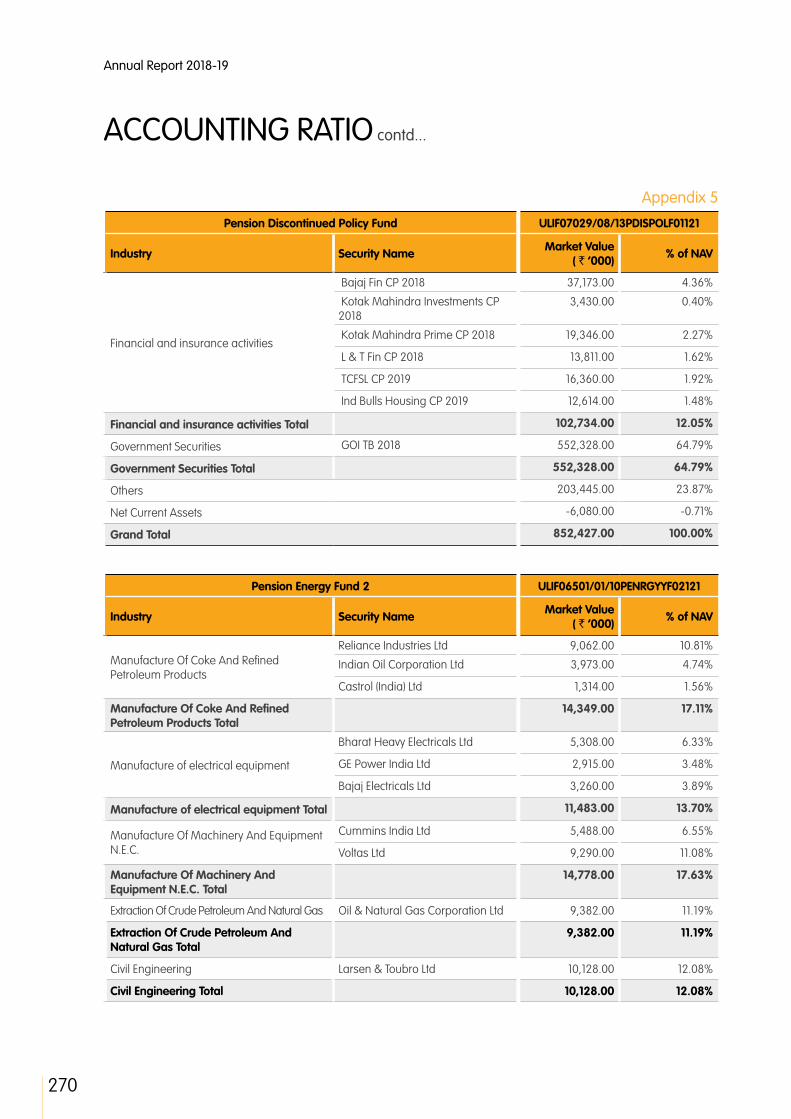
270
Annual Report 2018-19
Appendix 5
ACCOUNTING RATIO contd...
Pension Discontinued Policy Fund ULIF07029/08/13PDISPOLF01121
Industry Security Name Market Value ( ` ‘000) % of NAV
Financial and insurance activities
Bajaj Fin CP 2018 37,173.00 4.36%
Kotak Mahindra Investments CP 2018
3,430.00 0.40%
Kotak Mahindra Prime CP 2018 19,346.00 2.27%
L & T Fin CP 2018 13,811.00 1.62%
TCFSL CP 2019 16,360.00 1.92%
Ind Bulls Housing CP 2019 12,614.00 1.48%
Financial and insurance activities Total 102,734.00 12.05%
Government Securities GOI TB 2018 552,328.00 64.79%
Government Securities Total 552,328.00 64.79%
Others 203,445.00 23.87%
Net Current Assets -6,080.00 -0.71%
Grand Total 852,427.00 100.00%
Pension Energy Fund 2 ULIF06501/01/10PENRGYYF02121
Industry Security Name Market Value ( ` ‘000) % of NAV
Manufacture Of Coke And Refined Petroleum Products
Reliance Industries Ltd 9,062.00 10.81%
Indian Oil Corporation Ltd 3,973.00 4.74%
Castrol (India) Ltd 1,314.00 1.56%
Manufacture Of Coke And Refined Petroleum Products Total
14,349.00 17.11%
Manufacture of electrical equipment
Bharat Heavy Electricals Ltd 5,308.00 6.33%
GE Power India Ltd 2,915.00 3.48%
Bajaj Electricals Ltd 3,260.00 3.89%
Manufacture of electrical equipment Total 11,483.00 13.70%
Manufacture Of Machinery And Equipment N.E.C.
Cummins India Ltd 5,488.00 6.55%
Voltas Ltd 9,290.00 11.08%
Manufacture Of Machinery And Equipment N.E.C. Total
14,778.00 17.63%
Extraction Of Crude Petroleum And Natural Gas Oil & Natural Gas Corporation Ltd 9,382.00 11.19%
Extraction Of Crude Petroleum And Natural Gas Total
9,382.00 11.19%
Civil Engineering Larsen & Toubro Ltd 10,128.00 12.08%
Civil Engineering Total 10,128.00 12.08%

271
STRA
TEG
IC R
EPO
RT /
STA
TUTO
RY R
EPO
RTS
/ F
INA
NCI
ALS
STA
TEM
ENTS
Pension Energy Fund 2 ULIF06501/01/10PENRGYYF02121
Industry Security Name Market Value ( ` ‘000) % of NAV
Infrastructure Facility
NTPC Ltd 8,055.00 9.61%
Power Grid Corporation Of India Ltd
7,655.00 9.13%
Petronet Lng Ltd 5,279.00 6.29%
GAIL (India) Ltd 9,202.00 71.57%
Gujarat State Petronet Ltd 5,574.00 6.65%
Infrastructure Facility Total 35,765.00 42.65%
Others 17,533.00 20.91%
Net Current Assets -29,573.00 -35.27%
Grand Total 83,845.00 100.00%
Pension Equity Fund 1 ULIF00601/11/06PEQUITYF01121
Industry Security Name Market Value ( ` ‘000) % of NAV
Computer programming, consultancy and related activities
Infosys Ltd 42,060.00 6.59%Tata Consultancy Services Ltd 6,844.00 1.07%HCL Technologies Ltd 12,222.00 1.91%Tech Mahindra Ltd 8,011.00 1.25%NIIT Ltd 5,953.00 0.93%Cyient Ltd 4,986.00 0.79%
Computer programming, consultancy and related activities Total
80,076.00 12.54%
Financial and insurance activities
HDFC Bank Ltd 51,856.00 8.12%ICICI Bank Ltd 21,194.00 3.32%State Bank Of India 5,659.00 0.89%Axis Bank Ltd 6,099.00 0.96%Yes Bank Ltd 21,214.00 3.32%Kotak Mahindra Bank Ltd 14,590.00 2.28%Bharat Financial Inclusion Ltd 5,805.00 0.91%Equitas Holdings Ltd 4,704.00 0.74%Housing Deve Fin Corp Ltd 19,439.00 3.04%SBI Life Insurance Co Ltd 3,200.00 0.50%
Financial and insurance activities Total 153,760.00 24.08%
Manufacture of motor vehicles, trailers and semi-trailers
Maruti Suzuki India Ltd 31,439.00 4.92%Motherson Sumi Systems Ltd 16,686.00 2.61%Tata Motors Ltd 14,533.00 2.28%Mahindra & Mahindra Ltd 12,964.00 2.03%
Manufacture of motor vehicles, trailers and semi-trailers Total
75,622.00 11.84%
Others 338,825.00 53.06%
Net Current Assets -9,687.00 -1.52%
Grand Total 638,596.00 100.00%

272
Annual Report 2018-19
Appendix 5
ACCOUNTING RATIO contd...
Pension Equity Fund 2 ULIF03204/12/08PEQUITYF02121
Industry Security Name Market Value ( ` ‘000) % of NAV
Computer programming, consultancy and related activities
Infosys Ltd 79,453.00 6.95%
Tata Consultancy Services Ltd 12,998.00 1.14%
HCL Technologies Ltd 23,098.00 2.02%
Tech Mahindra Ltd 15,323.00 1.34%
NIIT Ltd 3,986.00 0.35%
Cyient Ltd 9,362.00 0.82%
Computer programming, consultancy and related activities Total
144,220.00 12.62%
Financial and insurance activities
HDFC Bank Ltd 98,155.00 8.59%
ICICI Bank Ltd 40,069.00 3.51%
State Bank Of India 12,509.00 1.09%
Axis Bank Ltd 11,673.00 1.02%
Yes Bank Ltd 43,667.00 3.82%
Kotak Mahindra Bank Ltd 27,712.00 2.42%
Equitas Holdings Ltd 8,793.00 0.77%
Housing Deve Fin Corp Ltd 36,967.00 3.23%
SBI Life Insurance Co Ltd 7,223.00 0.63%
Financial and insurance activities Total 286,768.00 25.08%
Manufacture of motor vehicles, trailers and semi-trailers
Maruti Suzuki India Ltd 54,017.00 4.73%
Motherson Sumi Systems Ltd 34,444.00 3.01%
Tata Motors Ltd 27,623.00 2.42%
Mahindra & Mahindra Ltd 24,630.00 2.16%
Manufacture of motor vehicles, trailers and semi-trailers Total
140,714.00 12.32%
Others 608,408.00 53.24%
Net Current Assets -37,298.00 -3.26%
Grand Total 1,142,812.00 100.00%
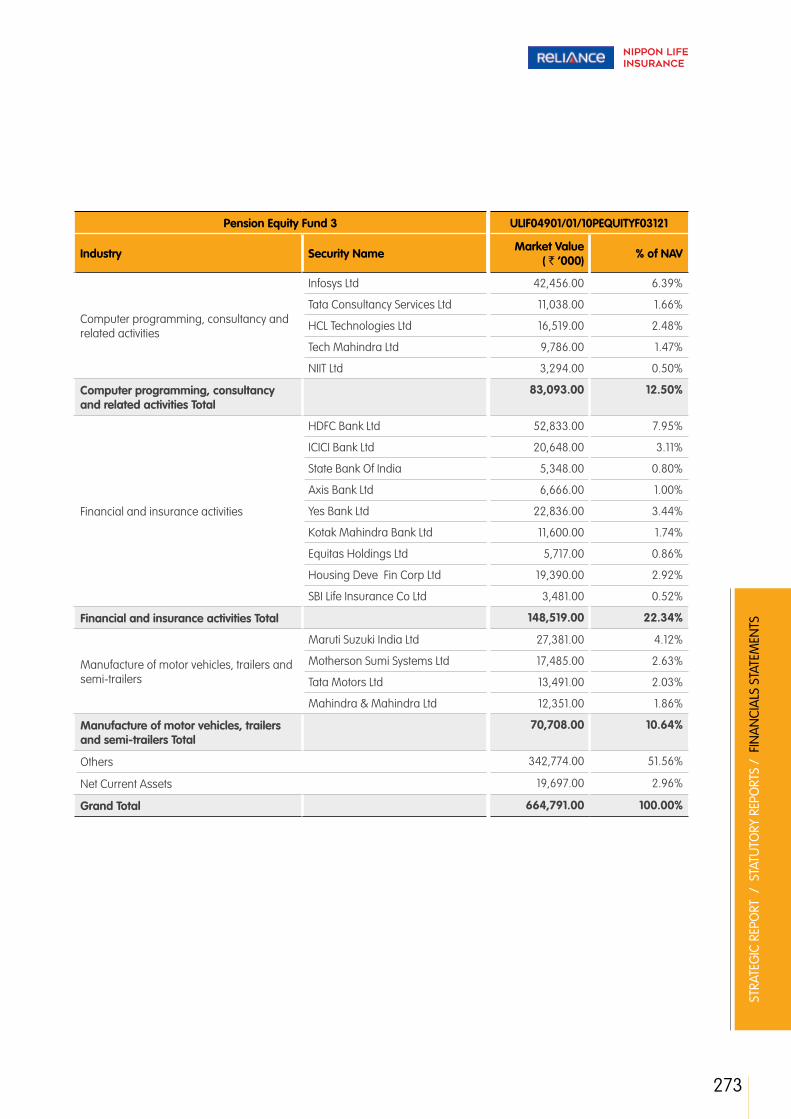
273
STRA
TEG
IC R
EPO
RT /
STA
TUTO
RY R
EPO
RTS
/ F
INA
NCI
ALS
STA
TEM
ENTS
Pension Equity Fund 3 ULIF04901/01/10PEQUITYF03121
Industry Security Name Market Value ( ` ‘000) % of NAV
Computer programming, consultancy and related activities
Infosys Ltd 42,456.00 6.39%
Tata Consultancy Services Ltd 11,038.00 1.66%
HCL Technologies Ltd 16,519.00 2.48%
Tech Mahindra Ltd 9,786.00 1.47%
NIIT Ltd 3,294.00 0.50%
Computer programming, consultancy and related activities Total
83,093.00 12.50%
Financial and insurance activities
HDFC Bank Ltd 52,833.00 7.95%
ICICI Bank Ltd 20,648.00 3.11%
State Bank Of India 5,348.00 0.80%
Axis Bank Ltd 6,666.00 1.00%
Yes Bank Ltd 22,836.00 3.44%
Kotak Mahindra Bank Ltd 11,600.00 1.74%
Equitas Holdings Ltd 5,717.00 0.86%
Housing Deve Fin Corp Ltd 19,390.00 2.92%
SBI Life Insurance Co Ltd 3,481.00 0.52%
Financial and insurance activities Total 148,519.00 22.34%
Manufacture of motor vehicles, trailers and semi-trailers
Maruti Suzuki India Ltd 27,381.00 4.12%
Motherson Sumi Systems Ltd 17,485.00 2.63%
Tata Motors Ltd 13,491.00 2.03%
Mahindra & Mahindra Ltd 12,351.00 1.86%
Manufacture of motor vehicles, trailers and semi-trailers Total
70,708.00 10.64%
Others 342,774.00 51.56%
Net Current Assets 19,697.00 2.96%
Grand Total 664,791.00 100.00%
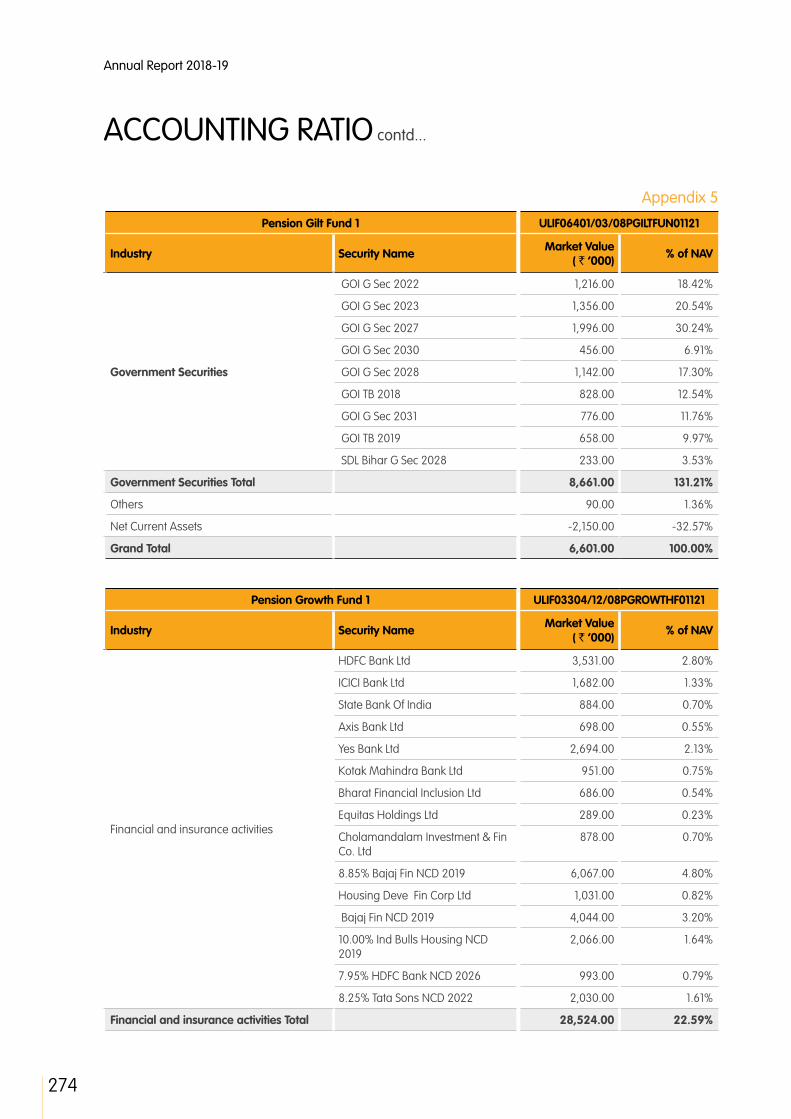
274
Annual Report 2018-19
Appendix 5
ACCOUNTING RATIO contd...
Pension Gilt Fund 1 ULIF06401/03/08PGILTFUN01121
Industry Security Name Market Value ( ` ‘000) % of NAV
Government Securities
GOI G Sec 2022 1,216.00 18.42%
GOI G Sec 2023 1,356.00 20.54%
GOI G Sec 2027 1,996.00 30.24%
GOI G Sec 2030 456.00 6.91%
GOI G Sec 2028 1,142.00 17.30%
GOI TB 2018 828.00 12.54%
GOI G Sec 2031 776.00 11.76%
GOI TB 2019 658.00 9.97%
SDL Bihar G Sec 2028 233.00 3.53%
Government Securities Total 8,661.00 131.21%
Others 90.00 1.36%
Net Current Assets -2,150.00 -32.57%
Grand Total 6,601.00 100.00%
Pension Growth Fund 1 ULIF03304/12/08PGROWTHF01121
Industry Security Name Market Value ( ` ‘000) % of NAV
Financial and insurance activities
HDFC Bank Ltd 3,531.00 2.80%
ICICI Bank Ltd 1,682.00 1.33%
State Bank Of India 884.00 0.70%
Axis Bank Ltd 698.00 0.55%
Yes Bank Ltd 2,694.00 2.13%
Kotak Mahindra Bank Ltd 951.00 0.75%
Bharat Financial Inclusion Ltd 686.00 0.54%
Equitas Holdings Ltd 289.00 0.23%
Cholamandalam Investment & Fin Co. Ltd
878.00 0.70%
8.85% Bajaj Fin NCD 2019 6,067.00 4.80%
Housing Deve Fin Corp Ltd 1,031.00 0.82%
Bajaj Fin NCD 2019 4,044.00 3.20%
10.00% Ind Bulls Housing NCD 2019
2,066.00 1.64%
7.95% HDFC Bank NCD 2026 993.00 0.79%
8.25% Tata Sons NCD 2022 2,030.00 1.61%
Financial and insurance activities Total 28,524.00 22.59%
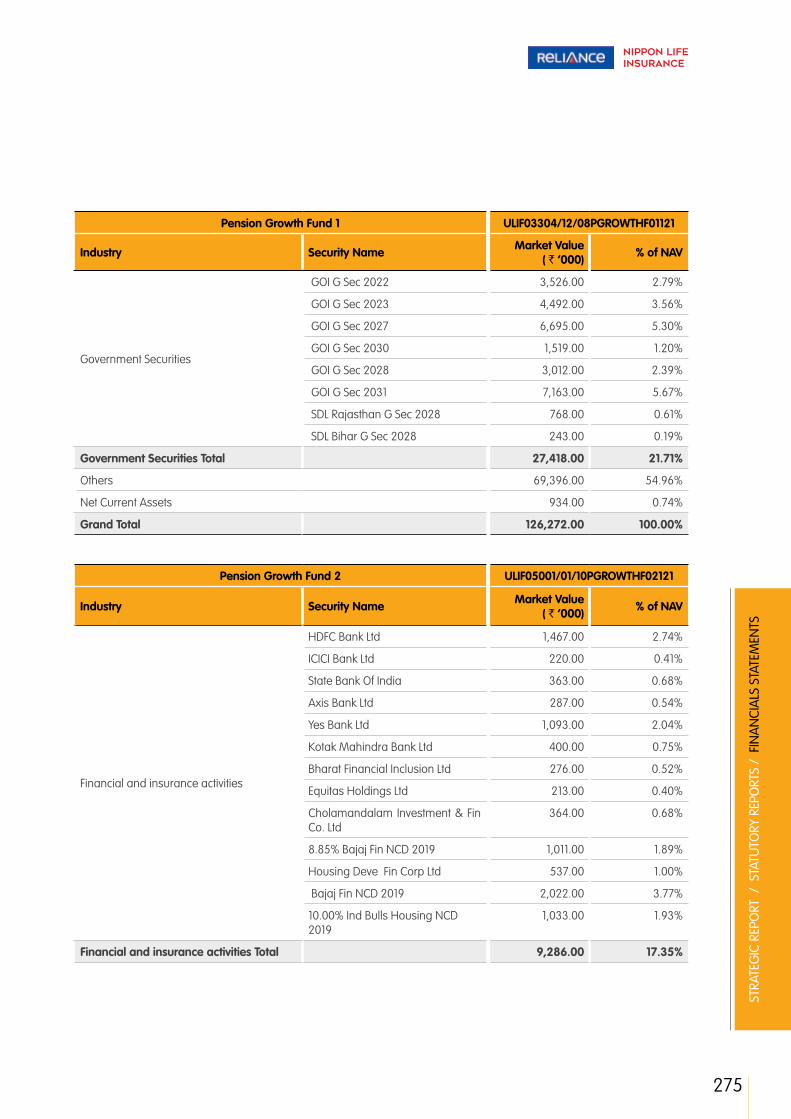
275
STRA
TEG
IC R
EPO
RT /
STA
TUTO
RY R
EPO
RTS
/ F
INA
NCI
ALS
STA
TEM
ENTS
Pension Growth Fund 1 ULIF03304/12/08PGROWTHF01121
Industry Security Name Market Value ( ` ‘000) % of NAV
Government Securities
GOI G Sec 2022 3,526.00 2.79%
GOI G Sec 2023 4,492.00 3.56%
GOI G Sec 2027 6,695.00 5.30%
GOI G Sec 2030 1,519.00 1.20%
GOI G Sec 2028 3,012.00 2.39%
GOI G Sec 2031 7,163.00 5.67%
SDL Rajasthan G Sec 2028 768.00 0.61%
SDL Bihar G Sec 2028 243.00 0.19%
Government Securities Total 27,418.00 21.71%
Others 69,396.00 54.96%
Net Current Assets 934.00 0.74%
Grand Total 126,272.00 100.00%
Pension Growth Fund 2 ULIF05001/01/10PGROWTHF02121
Industry Security Name Market Value ( ` ‘000) % of NAV
Financial and insurance activities
HDFC Bank Ltd 1,467.00 2.74%
ICICI Bank Ltd 220.00 0.41%
State Bank Of India 363.00 0.68%
Axis Bank Ltd 287.00 0.54%
Yes Bank Ltd 1,093.00 2.04%
Kotak Mahindra Bank Ltd 400.00 0.75%
Bharat Financial Inclusion Ltd 276.00 0.52%
Equitas Holdings Ltd 213.00 0.40%
Cholamandalam Investment & Fin Co. Ltd
364.00 0.68%
8.85% Bajaj Fin NCD 2019 1,011.00 1.89%
Housing Deve Fin Corp Ltd 537.00 1.00%
Bajaj Fin NCD 2019 2,022.00 3.77%
10.00% Ind Bulls Housing NCD 2019
1,033.00 1.93%
Financial and insurance activities Total 9,286.00 17.35%
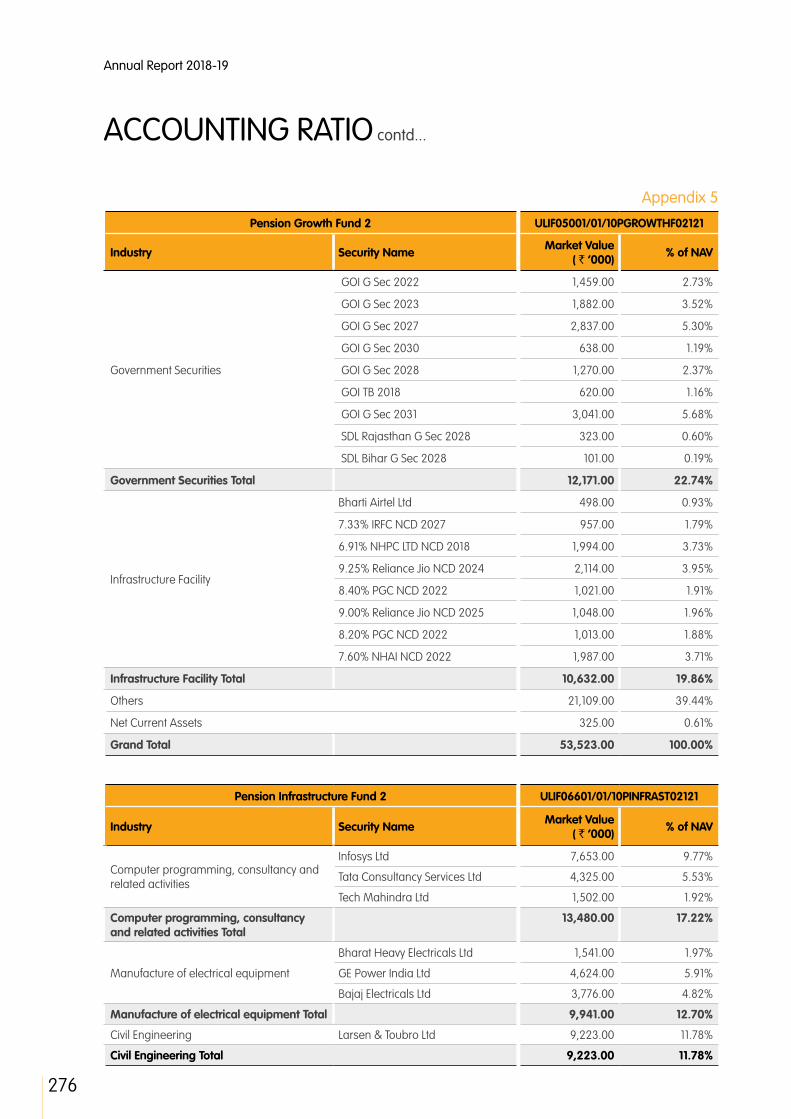
276
Annual Report 2018-19
Appendix 5
ACCOUNTING RATIO contd...
Pension Growth Fund 2 ULIF05001/01/10PGROWTHF02121
Industry Security Name Market Value ( ` ‘000) % of NAV
Government Securities
GOI G Sec 2022 1,459.00 2.73%
GOI G Sec 2023 1,882.00 3.52%
GOI G Sec 2027 2,837.00 5.30%
GOI G Sec 2030 638.00 1.19%
GOI G Sec 2028 1,270.00 2.37%
GOI TB 2018 620.00 1.16%
GOI G Sec 2031 3,041.00 5.68%
SDL Rajasthan G Sec 2028 323.00 0.60%
SDL Bihar G Sec 2028 101.00 0.19%
Government Securities Total 12,171.00 22.74%
Infrastructure Facility
Bharti Airtel Ltd 498.00 0.93%
7.33% IRFC NCD 2027 957.00 1.79%
6.91% NHPC LTD NCD 2018 1,994.00 3.73%
9.25% Reliance Jio NCD 2024 2,114.00 3.95%
8.40% PGC NCD 2022 1,021.00 1.91%
9.00% Reliance Jio NCD 2025 1,048.00 1.96%
8.20% PGC NCD 2022 1,013.00 1.88%
7.60% NHAI NCD 2022 1,987.00 3.71%
Infrastructure Facility Total 10,632.00 19.86%
Others 21,109.00 39.44%
Net Current Assets 325.00 0.61%
Grand Total 53,523.00 100.00%
Pension Infrastructure Fund 2 ULIF06601/01/10PINFRAST02121
Industry Security Name Market Value ( ` ‘000) % of NAV
Computer programming, consultancy and related activities
Infosys Ltd 7,653.00 9.77%
Tata Consultancy Services Ltd 4,325.00 5.53%
Tech Mahindra Ltd 1,502.00 1.92%
Computer programming, consultancy and related activities Total
13,480.00 17.22%
Manufacture of electrical equipment
Bharat Heavy Electricals Ltd 1,541.00 1.97%
GE Power India Ltd 4,624.00 5.91%
Bajaj Electricals Ltd 3,776.00 4.82%
Manufacture of electrical equipment Total 9,941.00 12.70%
Civil Engineering Larsen & Toubro Ltd 9,223.00 11.78%
Civil Engineering Total 9,223.00 11.78%

277
STRA
TEG
IC R
EPO
RT /
STA
TUTO
RY R
EPO
RTS
/ F
INA
NCI
ALS
STA
TEM
ENTS
Pension Infrastructure Fund 2 ULIF06601/01/10PINFRAST02121
Industry Security Name Market Value ( ` ‘000) % of NAV
Infrastructure Facility
Bharti Airtel Ltd 7,863.00 10.04%
NTPC Ltd 4,690.00 5.99%
Power Grid Corporation Of India Ltd
6,184.00 7.90%
GAIL (India) Ltd 3,715.00 4.74%
Adani Ports & Special Economic Zone Ltd
3,409.00 4.35%
Infrastructure Facility Total 25,861.00 33.02%
Others 43,806.00 55.95%
Net Current Assets -24,016.00 -30.67%
Grand Total 78,295.00 100.00%
Pension Midcap Fund 2 ULIF05101/01/10PMIDCAPF02121
Industry Security Name Market Value ( ` ‘000) % of NAV
Financial and insurance activities
State Bank Of India 6,888.00 3.14%
Yes Bank Ltd 7,053.00 3.22%
Kotak Mahindra Bank Ltd 3,748.00 1.71%
Bharat Financial Inclusion Ltd 5,682.00 2.59%
Cholamandalam Investment & Fin Co. Ltd
5,992.00 2.73%
Shriram Transport Finance Co. Ltd 6,963.00 3.18%
SBI Life Insurance Co Ltd 4,822.00 2.20%
RBL Bank Ltd 11,293.00 5.15%
Financial and insurance activities Total 52,441.00 23.92%
Others 186,300.00 84.98%
Net Current Assets -19,518.00 -8.90%
Grand Total 219,223.00 100.00%
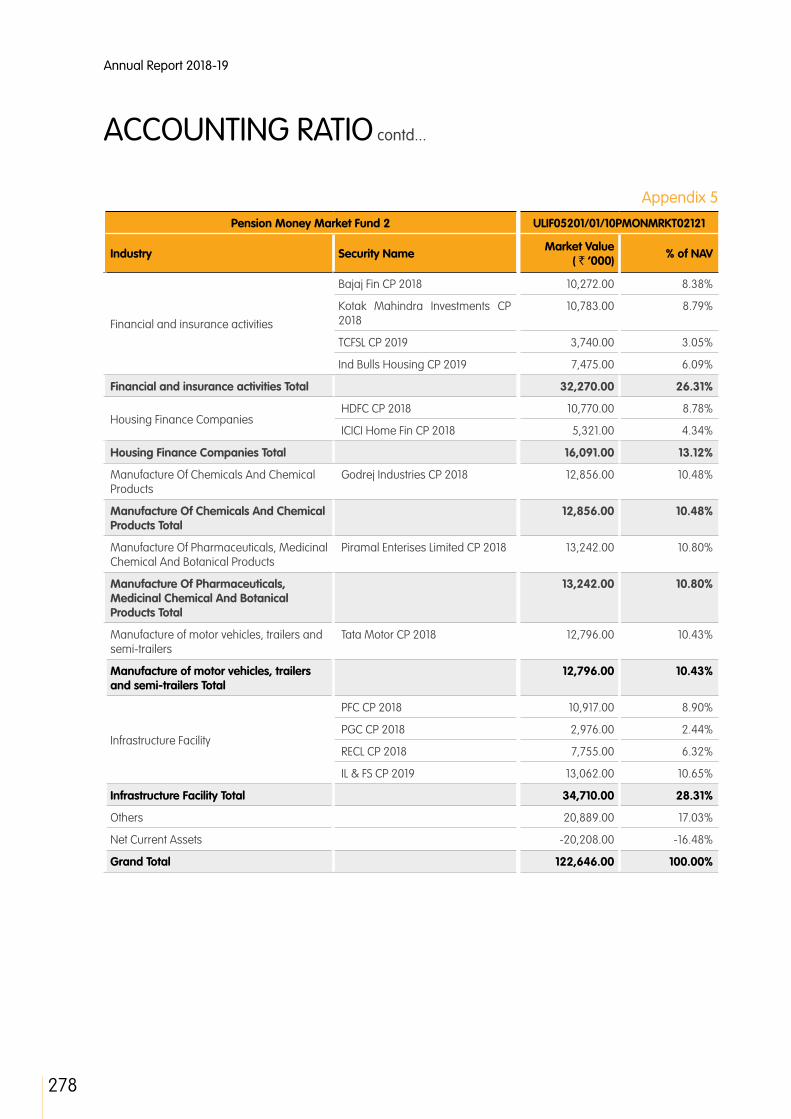
278
Annual Report 2018-19
Appendix 5
ACCOUNTING RATIO contd...
Pension Money Market Fund 2 ULIF05201/01/10PMONMRKT02121
Industry Security Name Market Value ( ` ‘000) % of NAV
Financial and insurance activities
Bajaj Fin CP 2018 10,272.00 8.38%
Kotak Mahindra Investments CP 2018
10,783.00 8.79%
TCFSL CP 2019 3,740.00 3.05%
Ind Bulls Housing CP 2019 7,475.00 6.09%
Financial and insurance activities Total 32,270.00 26.31%
Housing Finance Companies HDFC CP 2018 10,770.00 8.78%
ICICI Home Fin CP 2018 5,321.00 4.34%
Housing Finance Companies Total 16,091.00 13.12%
Manufacture Of Chemicals And Chemical Products
Godrej Industries CP 2018 12,856.00 10.48%
Manufacture Of Chemicals And Chemical Products Total
12,856.00 10.48%
Manufacture Of Pharmaceuticals, Medicinal Chemical And Botanical Products
Piramal Enterises Limited CP 2018 13,242.00 10.80%
Manufacture Of Pharmaceuticals, Medicinal Chemical And Botanical Products Total
13,242.00 10.80%
Manufacture of motor vehicles, trailers and semi-trailers
Tata Motor CP 2018 12,796.00 10.43%
Manufacture of motor vehicles, trailers and semi-trailers Total
12,796.00 10.43%
Infrastructure Facility
PFC CP 2018 10,917.00 8.90%
PGC CP 2018 2,976.00 2.44%
RECL CP 2018 7,755.00 6.32%
IL & FS CP 2019 13,062.00 10.65%
Infrastructure Facility Total 34,710.00 28.31%
Others 20,889.00 17.03%
Net Current Assets -20,208.00 -16.48%
Grand Total 122,646.00 100.00%
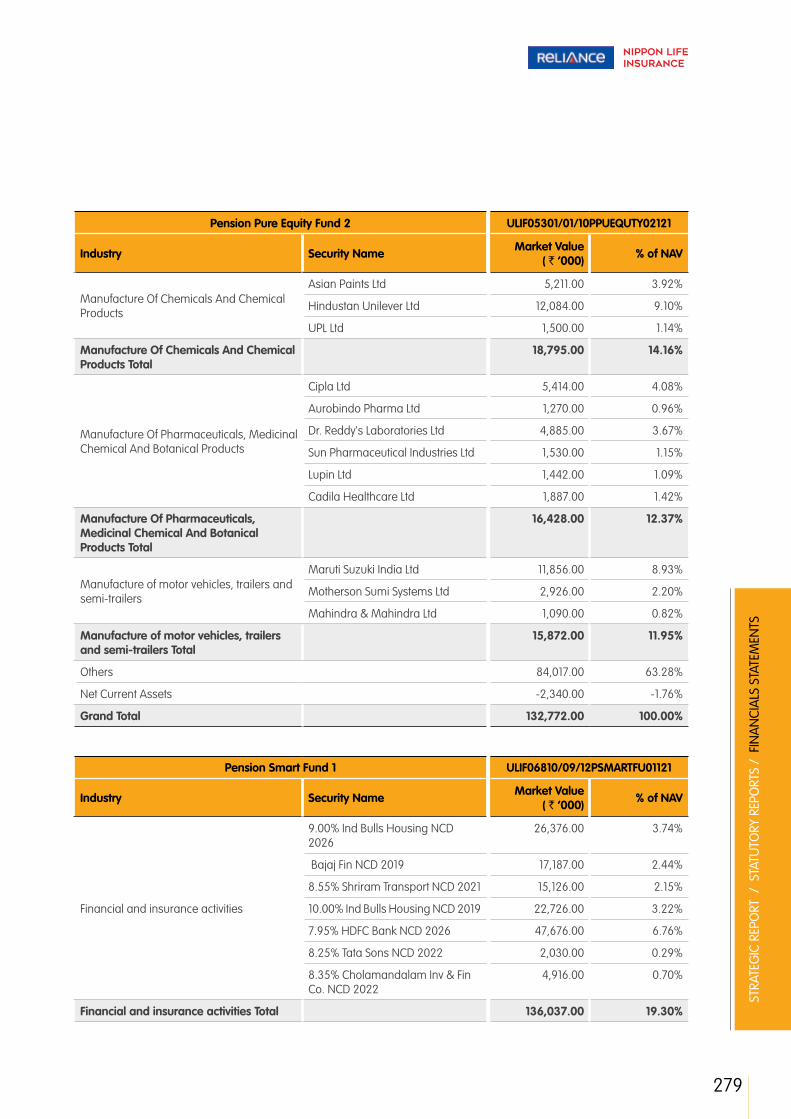
279
STRA
TEG
IC R
EPO
RT /
STA
TUTO
RY R
EPO
RTS
/ F
INA
NCI
ALS
STA
TEM
ENTS
Pension Pure Equity Fund 2 ULIF05301/01/10PPUEQUTY02121
Industry Security Name Market Value ( ` ‘000) % of NAV
Manufacture Of Chemicals And Chemical Products
Asian Paints Ltd 5,211.00 3.92%
Hindustan Unilever Ltd 12,084.00 9.10%
UPL Ltd 1,500.00 1.14%
Manufacture Of Chemicals And Chemical Products Total
18,795.00 14.16%
Manufacture Of Pharmaceuticals, Medicinal Chemical And Botanical Products
Cipla Ltd 5,414.00 4.08%
Aurobindo Pharma Ltd 1,270.00 0.96%
Dr. Reddy's Laboratories Ltd 4,885.00 3.67%
Sun Pharmaceutical Industries Ltd 1,530.00 1.15%
Lupin Ltd 1,442.00 1.09%
Cadila Healthcare Ltd 1,887.00 1.42%
Manufacture Of Pharmaceuticals, Medicinal Chemical And Botanical Products Total
16,428.00 12.37%
Manufacture of motor vehicles, trailers and semi-trailers
Maruti Suzuki India Ltd 11,856.00 8.93%
Motherson Sumi Systems Ltd 2,926.00 2.20%
Mahindra & Mahindra Ltd 1,090.00 0.82%
Manufacture of motor vehicles, trailers and semi-trailers Total
15,872.00 11.95%
Others 84,017.00 63.28%
Net Current Assets -2,340.00 -1.76%
Grand Total 132,772.00 100.00%
Pension Smart Fund 1 ULIF06810/09/12PSMARTFU01121
Industry Security Name Market Value ( ` ‘000) % of NAV
Financial and insurance activities
9.00% Ind Bulls Housing NCD 2026
26,376.00 3.74%
Bajaj Fin NCD 2019 17,187.00 2.44%
8.55% Shriram Transport NCD 2021 15,126.00 2.15%
10.00% Ind Bulls Housing NCD 2019 22,726.00 3.22%
7.95% HDFC Bank NCD 2026 47,676.00 6.76%
8.25% Tata Sons NCD 2022 2,030.00 0.29%
8.35% Cholamandalam Inv & Fin Co. NCD 2022
4,916.00 0.70%
Financial and insurance activities Total 136,037.00 19.30%
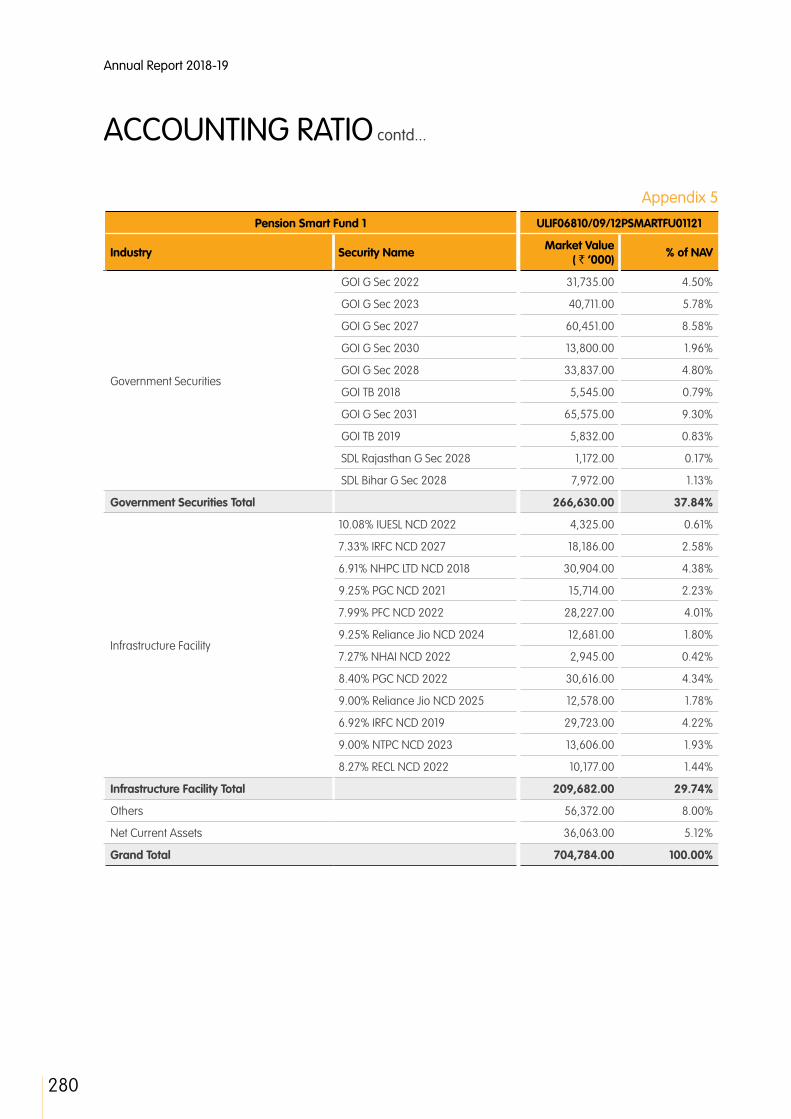
280
Annual Report 2018-19
Appendix 5
ACCOUNTING RATIO contd...
Pension Smart Fund 1 ULIF06810/09/12PSMARTFU01121
Industry Security Name Market Value ( ` ‘000) % of NAV
Government Securities
GOI G Sec 2022 31,735.00 4.50%
GOI G Sec 2023 40,711.00 5.78%
GOI G Sec 2027 60,451.00 8.58%
GOI G Sec 2030 13,800.00 1.96%
GOI G Sec 2028 33,837.00 4.80%
GOI TB 2018 5,545.00 0.79%
GOI G Sec 2031 65,575.00 9.30%
GOI TB 2019 5,832.00 0.83%
SDL Rajasthan G Sec 2028 1,172.00 0.17%
SDL Bihar G Sec 2028 7,972.00 1.13%
Government Securities Total 266,630.00 37.84%
Infrastructure Facility
10.08% IUESL NCD 2022 4,325.00 0.61%
7.33% IRFC NCD 2027 18,186.00 2.58%
6.91% NHPC LTD NCD 2018 30,904.00 4.38%
9.25% PGC NCD 2021 15,714.00 2.23%
7.99% PFC NCD 2022 28,227.00 4.01%
9.25% Reliance Jio NCD 2024 12,681.00 1.80%
7.27% NHAI NCD 2022 2,945.00 0.42%
8.40% PGC NCD 2022 30,616.00 4.34%
9.00% Reliance Jio NCD 2025 12,578.00 1.78%
6.92% IRFC NCD 2019 29,723.00 4.22%
9.00% NTPC NCD 2023 13,606.00 1.93%
8.27% RECL NCD 2022 10,177.00 1.44%
Infrastructure Facility Total 209,682.00 29.74%
Others 56,372.00 8.00%
Net Current Assets 36,063.00 5.12%
Grand Total 704,784.00 100.00%

281
STRA
TEG
IC R
EPO
RT /
STA
TUTO
RY R
EPO
RTS
/ F
INA
NCI
ALS
STA
TEM
ENTS
Reliance Assured Maturity Debt Fund ULIF06720/12/11LASURMDEBT121
Industry Security Name Market Value ( ` ‘000) % of NAV
Financial and insurance activities
9.40% UBI FD 2022 7,450.00 1.52%
9.54% Tata Sons NCD 2022 20,148.00 4.12%
9.00% Ind Bulls Housing NCD 2026
26,376.00 5.39%
9.67% Tata Sons NCD 2022 10,676.00 2.18%
8.35% Cholamandalam Inv & Fin Co. NCD 2022
44,244.00 9.04%
Financial and insurance activities Total 108,894.00 22.25%
Government Securities SDL Kerala G Sec 2022 31,220.00 6.38%
SDL Rajasthan G Sec 2022 90,631.00 18.52%
Government Securities Total 121,851.00 24.90%
Infrastructure Facility
9.35% PGC NCD 2022 34,834.00 7.12%
10.08% IUESL NCD 2022 28,112.00 5.75%
9.25% Reliance Jio NCD 2024 24,306.00 4.97%
9.00% NTPC NCD 2023 38,725.00 7.91%
8.27% RECL NCD 2022 40,707.00 8.32%
Infrastructure Facility Total 166,684.00 34.07%
Others 68,081.00 13.91%
Net Current Assets 23,820.00 4.87%
Grand Total 489,330.00 100.00%

282
Annual Report 2018-19
Appendix 5
ACCOUNTING RATIO contd...
Unclaimed redemption of units as at 31st March 2019: Nil (Previous Year : Nil)NAV : Highest, Lowest & Closing at the end of 31st March 2019
Scheme Name SFIN Highest NAV
Lowest NAV
Close NAV
Discontinued Policy Fund ULIF05703/09/10DISCPOLF01121 17.9430 16.8710 17.9430
Health Corporate Bond Fund 1 ULIF06301/02/08HCORBOND01121 23.2639 21.3968 23.2639
Health Energy Fund 1 ULIF06001/02/08HENERGYF01121 18.5539 16.1712 18.4271
Health Equity Fund 1 ULIF01201/02/08HEQUITYF01121 23.8853 20.3450 23.2786
Health Equity Fund 2 ULIF05411/01/10HEQUITYF02121 24.7193 21.1538 24.1410
Health Gilt Fund 1 ULIF01301/02/08HGILTFUN01121 20.8114 18.9494 20.8068
Health Growth Plus Fund 1 ULIF01401/02/08HGRWTPLS01121 22.9692 20.9194 22.9692
Health Infrastructure Fund 1 ULIF06101/02/08HINFRAST01121 12.4838 10.4566 11.5300
Health Midcap Fund 1 ULIF06201/02/08HMIDCAPF01121 32.8713 26.1774 29.8695
Health Money Market Fund 1 ULIF01501/02/08HMONMRKT01121 21.3342 20.2311 20.6470
Health Pure Equity Fund 1 ULIF01601/02/08HPUEQUTY01121 26.3519 22.6412 24.8509
Health Super Growth Fund 1 ULIF01701/02/08HSPRGRWT01121 22.0651 19.4672 21.9513
Life Balanced Fund 1 ULIF00128/07/04LBALANCE01121 31.7486 29.3921 31.7486
Life Capital Secure Fund 1 ULIF00228/07/04LCAPTSEC01121 25.2298 23.8934 25.2298
Life Corporate Bond Fund 1 ULIF02310/06/08LCORBOND01121 22.4477 21.0276 22.4477
Life Corporate Bond Fund 2 ULIF04020/08/09LCORBOND02121 22.5930 20.6515 22.5930
Life Energy Fund 1 ULIF02410/06/08LENERGYF01121 19.7028 17.1364 19.4706
Life Energy Fund 2 ULIF04101/01/10LENERGYF02121 17.0186 14.8131 16.8122
Life Equity Fund 1 ULIF00328/07/04LEQUITYF01121 66.6661 56.8198 64.8897
Life Equity Fund 2 ULIF02510/06/08LEQUITYF02121 30.1559 25.6250 29.4001
Life Equity Fund 3 ULIF04201/01/10LEQUITYF03121 24.6574 20.9656 23.9747
Life Gilt Fund 1 ULIF02610/06/08LGILTFUN01121 20.6485 18.8122 20.6436
Life Gilt Fund 2 ULIF03819/03/09LGILTFUN02121 20.1812 18.3492 20.1771
Life Growth Fund 1 ULIF00428/07/04LGROWTHF01121 36.3348 33.2821 36.3348
Life Growth Fund 2 ULIF01102/11/07LGROWTHF02121 22.1284 20.2420 22.1284
Life Growth Plus Fund 1 ULIF00809/04/07LGRWTPLS01121 27.9609 25.4152 27.9609
Life Growth Plus Fund 2 ULIF04301/01/10LGRWTPLS02121 21.4577 19.5227 21.4577
Life High Growth Fund 1 ULIF00728/02/07LHIGROWT01121 28.6359 25.7964 28.6359
Life High Growth Fund 2 ULIF05511/01/10LHIGROWT02121 21.3016 19.1762 21.3016
Life Highest NAV Advantage Fund 1 ULIF05803/09/10LHNAVADV01121 15.6816 13.7571 14.9936
Life Highest NAV Advantage Fund 2 ULIF05901/06/11LHNAVADV02121 17.9310 15.5205 17.2497
Life Highest NAV Guarantee Fund 1 ULIF05612/02/10LHNAVGUA01121 17.3895 16.3043 17.3895
Life Infrastructure Fund 1 ULIF02710/06/08LINFRAST01121 12.8124 10.6698 11.7677

283
STRA
TEG
IC R
EPO
RT /
STA
TUTO
RY R
EPO
RTS
/ F
INA
NCI
ALS
STA
TEM
ENTS
Scheme Name SFIN Highest NAV
Lowest NAV
Close NAV
Life Infrastructure Fund 2 ULIF04401/01/10LINFRAST02121 13.1291 10.9769 12.0815
Life Midcap Fund 1 ULIF02810/06/08LMIDCAPF01121 31.3114 25.0031 28.4394
Life Midcap Fund 2 ULIF04501/01/10LMIDCAPF02121 28.4588 22.7203 25.8125
Life Money Market Fund 1 ULIF02910/06/08LMONMRKT01121 20.9510 19.8547 20.2709
Life Money Market Fund 2 ULIF03919/03/09LMONMRKT02121 20.4188 19.2676 19.6872
Life Pure Debt Fund 1 ULIF00909/04/07LPURDEBT01121 24.4269 22.3872 24.4269
Life Pure Equity Fund 1 ULIF03010/06/08LPUEQUTY01121 29.3435 25.1892 27.6766
Life Pure Equity Fund 2 ULIF04601/01/10LPUEQUTY02121 22.2894 19.1719 20.9882
Life Super Growth Fund 1 ULIF01009/04/07LSPRGRWT01121 26.6889 23.5586 26.5750
Life Super Growth Fund 2 ULIF04701/01/10LSPRGRWT02121 22.5761 19.9112 22.4389
Pension Balanced Fund 1 ULIF03104/12/08PBALANCE01121 31.6414 29.2813 31.6414
Pension Balanced Fund 2 ULIF04801/01/10PBALANCE02121 19.8210 18.2824 19.8210
Pension Capital Secure Fund 1 ULIF00501/11/06PCAPTSEC01121 25.4002 24.0528 25.4002
Pension Corporate Bond Fund 1 ULIF01901/03/08PCORBOND01121 23.2303 21.2206 23.2303
Pension Energy Fund 2 ULIF06501/01/10PENRGYYF02121 16.7191 14.5171 16.4929
Pension Equity Fund 1 ULIF00601/11/06PEQUITYF01121 33.0983 28.1910 32.2188
Pension Equity Fund 2 ULIF03204/12/08PEQUITYF02121 28.9211 24.6438 28.2634
Pension Equity Fund 3 ULIF04901/01/10PEQUITYF03121 24.2903 20.7208 23.6850
Pension Gilt Fund 1 ULIF06401/03/08PGILTFUN01121 20.8026 18.9263 20.7980
Pension Growth Fund 1 ULIF03304/12/08PGROWTHF01121 28.8237 26.4350 28.8237
Pension Growth Fund 2 ULIF05001/01/10PGROWTHF02121 20.7353 18.9388 20.7353
Pension Infrastructure Fund 2 ULIF06601/01/10PINFRAST02121 13.4498 11.2658 12.4248
Pension Midcap Fund 2 ULIF05101/01/10PMIDCAPF02121 28.6725 23.0397 26.0446
Pension Money Market Fund 2 ULIF05201/01/10PMONMRKT02121 18.3499 17.2783 17.6365
Pension Pure Equity Fund 2 ULIF05301/01/10PPUEQUTY02121 22.4881 19.2966 21.2708
Pension Smart Fund 1 ULIF06810/09/12PSMARTFU01121 15.1722 14.0258 15.1722
Reliance Assured Maturity Debt Fund ULIF06720/12/11LASURMDEBT121 17.2090 15.8284 17.2090
Group Balanced Fund 1 ULGF00110/10/03GBALANCE01121 30.9509 28.6581 30.9509
Group Balanced Fund 2 ULGF00210/10/03GBALANCE02121 27.0976 24.8605 27.0976
Group Capital Secure Fund 1 ULGF00431/01/07GCAPISEC01121 24.7154 23.3202 24.7154
Group Corporate Bond Fund 2 ULGF01213/10/08GCORBOND02121 23.8303 21.8681 23.8303
Group Energy Fund 1 ULGF01428/11/08GENERGYF01121 27.1051 23.6413 26.8341
Group Equity Fund 3 ULGF01808/06/09GEQUITYF03121 38.1555 32.5852 37.1275
Group Equity Fund 4 ULGF02205/06/13GEQUITYF04121 14.7731 12.5966 14.5522
Group Gilt Fund 2 ULGF01610/12/08GGILTFUN02121 21.0506 19.0946 21.0470
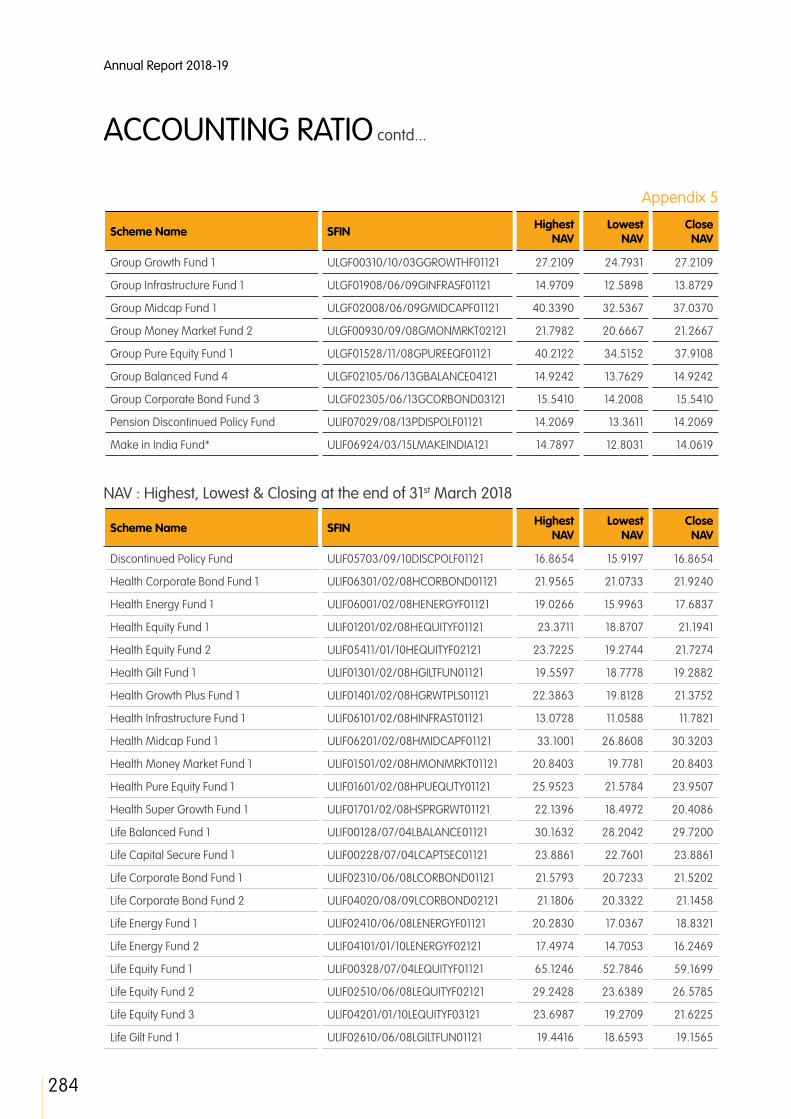
284
Annual Report 2018-19
Appendix 5
ACCOUNTING RATIO contd...
Scheme Name SFIN Highest NAV
Lowest NAV
Close NAV
Group Growth Fund 1 ULGF00310/10/03GGROWTHF01121 27.2109 24.7931 27.2109
Group Infrastructure Fund 1 ULGF01908/06/09GINFRASF01121 14.9709 12.5898 13.8729
Group Midcap Fund 1 ULGF02008/06/09GMIDCAPF01121 40.3390 32.5367 37.0370
Group Money Market Fund 2 ULGF00930/09/08GMONMRKT02121 21.7982 20.6667 21.2667
Group Pure Equity Fund 1 ULGF01528/11/08GPUREEQF01121 40.2122 34.5152 37.9108
Group Balanced Fund 4 ULGF02105/06/13GBALANCE04121 14.9242 13.7629 14.9242
Group Corporate Bond Fund 3 ULGF02305/06/13GCORBOND03121 15.5410 14.2008 15.5410
Pension Discontinued Policy Fund ULIF07029/08/13PDISPOLF01121 14.2069 13.3611 14.2069
Make in India Fund* ULIF06924/03/15LMAKEINDIA121 14.7897 12.8031 14.0619
NAV : Highest, Lowest & Closing at the end of 31st March 2018
Scheme Name SFIN Highest NAV
Lowest NAV
Close NAV
Discontinued Policy Fund ULIF05703/09/10DISCPOLF01121 16.8654 15.9197 16.8654
Health Corporate Bond Fund 1 ULIF06301/02/08HCORBOND01121 21.9565 21.0733 21.9240
Health Energy Fund 1 ULIF06001/02/08HENERGYF01121 19.0266 15.9963 17.6837
Health Equity Fund 1 ULIF01201/02/08HEQUITYF01121 23.3711 18.8707 21.1941
Health Equity Fund 2 ULIF05411/01/10HEQUITYF02121 23.7225 19.2744 21.7274
Health Gilt Fund 1 ULIF01301/02/08HGILTFUN01121 19.5597 18.7778 19.2882
Health Growth Plus Fund 1 ULIF01401/02/08HGRWTPLS01121 22.3863 19.8128 21.3752
Health Infrastructure Fund 1 ULIF06101/02/08HINFRAST01121 13.0728 11.0588 11.7821
Health Midcap Fund 1 ULIF06201/02/08HMIDCAPF01121 33.1001 26.8608 30.3203
Health Money Market Fund 1 ULIF01501/02/08HMONMRKT01121 20.8403 19.7781 20.8403
Health Pure Equity Fund 1 ULIF01601/02/08HPUEQUTY01121 25.9523 21.5784 23.9507
Health Super Growth Fund 1 ULIF01701/02/08HSPRGRWT01121 22.1396 18.4972 20.4086
Life Balanced Fund 1 ULIF00128/07/04LBALANCE01121 30.1632 28.2042 29.7200
Life Capital Secure Fund 1 ULIF00228/07/04LCAPTSEC01121 23.8861 22.7601 23.8861
Life Corporate Bond Fund 1 ULIF02310/06/08LCORBOND01121 21.5793 20.7233 21.5202
Life Corporate Bond Fund 2 ULIF04020/08/09LCORBOND02121 21.1806 20.3322 21.1458
Life Energy Fund 1 ULIF02410/06/08LENERGYF01121 20.2830 17.0367 18.8321
Life Energy Fund 2 ULIF04101/01/10LENERGYF02121 17.4974 14.7053 16.2469
Life Equity Fund 1 ULIF00328/07/04LEQUITYF01121 65.1246 52.7846 59.1699
Life Equity Fund 2 ULIF02510/06/08LEQUITYF02121 29.2428 23.6389 26.5785
Life Equity Fund 3 ULIF04201/01/10LEQUITYF03121 23.6987 19.2709 21.6225
Life Gilt Fund 1 ULIF02610/06/08LGILTFUN01121 19.4416 18.6593 19.1565

285
STRA
TEG
IC R
EPO
RT /
STA
TUTO
RY R
EPO
RTS
/ F
INA
NCI
ALS
STA
TEM
ENTS
Scheme Name SFIN Highest NAV
Lowest NAV Close NAV
Life Gilt Fund 2 ULIF03819/03/09LGILTFUN02121 18.9007 18.1206 18.6708
Life Growth Fund 1 ULIF00428/07/04LGROWTHF01121 35.0567 31.7318 33.7683
Life Growth Fund 2 ULIF01102/11/07LGROWTHF02121 21.2545 19.1394 20.4849
Life Growth Plus Fund 1 ULIF00809/04/07LGRWTPLS01121 27.1763 24.0524 25.9156
Life Growth Plus Fund 2 ULIF04301/01/10LGRWTPLS02121 20.8854 18.4254 19.9335
Life High Growth Fund 1 ULIF00728/02/07LHIGROWT01121 27.8845 24.2465 26.3472
Life High Growth Fund 2 ULIF05511/01/10LHIGROWT02121 20.9244 18.0620 19.7803
Life Highest NAV Advantage Fund 1 ULIF05803/09/10LHNAVADV01121 14.8082 12.3384 13.7243
Life Highest NAV Advantage Fund 2 ULIF05901/06/11LHNAVADV02121 16.8646 13.8791 15.4695
Life Highest NAV Guarantee Fund 1 ULIF05612/02/10LHNAVGUA01121 17.7947 14.6747 16.4046
Life Infrastructure Fund 1 ULIF02710/06/08LINFRAST01121 13.4316 11.3615 12.0830
Life Infrastructure Fund 2 ULIF04401/01/10LINFRAST02121 13.7773 11.6370 12.3971
Life Midcap Fund 1 ULIF02810/06/08LMIDCAPF01121 31.4099 25.0894 28.7568
Life Midcap Fund 2 ULIF04501/01/10LMIDCAPF02121 28.6537 22.8328 26.2325
Life Money Market Fund 1 ULIF02910/06/08LMONMRKT01121 20.4353 19.3938 20.4353
Life Money Market Fund 2 ULIF03919/03/09LMONMRKT02121 19.8875 18.8257 19.8875
Life Pure Debt Fund 1 ULIF00909/04/07LPURDEBT01121 22.9521 22.0563 22.9126
Life Pure Equity Fund 1 ULIF03010/06/08LPUEQUTY01121 28.9087 24.1092 26.6519
Life Pure Equity Fund 2 ULIF04601/01/10LPUEQUTY02121 21.9424 18.2717 20.2700
Life Super Growth Fund 1 ULIF01009/04/07LSPRGRWT01121 26.3259 21.9595 24.3324
Life Super Growth Fund 2 ULIF04701/01/10LSPRGRWT02121 22.4066 18.6352 20.7130
Pension Balanced Fund 1 ULIF03104/12/08PBALANCE01121 30.0397 28.1633 29.5860
Pension Balanced Fund 2 ULIF04801/01/10PBALANCE02121 18.7890 17.5711 18.5165
Pension Capital Secure Fund 1 ULIF00501/11/06PCAPTSEC01121 24.0453 22.9181 24.0453
Pension Corporate Bond Fund 1 ULIF01901/03/08PCORBOND01121 21.6861 20.8030 21.6829
Pension Energy Fund 2 ULIF06501/01/10PENRGYYF02121 17.1106 14.3666 15.8478
Pension Equity Fund 1 ULIF00601/11/06PEQUITYF01121 32.3235 26.1898 29.3735
Pension Equity Fund 2 ULIF03204/12/08PEQUITYF02121 28.1003 22.7432 25.5358
Pension Equity Fund 3 ULIF04901/01/10PEQUITYF03121 23.2936 18.9165 21.2753
Pension Gilt Fund 1 ULIF06401/03/08PGILTFUN01121 19.5117 18.7294 19.2586
Pension Growth Fund 1 ULIF03304/12/08PGROWTHF01121 27.8634 25.2210 26.8452
Pension Growth Fund 2 ULIF05001/01/10PGROWTHF02121 19.8352 17.8918 19.1662
Pension Infrastructure Fund 2 ULIF06601/01/10PINFRAST02121 14.1291 11.9537 12.7073
Pension Midcap Fund 2 ULIF05101/01/10PMIDCAPF02121 28.9236 23.0614 26.4617
Pension Money Market Fund 2 ULIF05201/01/10PMONMRKT02121 17.8910 16.9745 17.8910

286
Annual Report 2018-19
Appendix 5
ACCOUNTING RATIO contd...
Scheme Name SFIN Highest NAV
Lowest NAV Close NAV
Pension Pure Equity Fund 2 ULIF05301/01/10PPUEQUTY02121 22.1624 18.4676 20.4309
Pension Smart Fund 1 ULIF06810/09/12PSMARTFU01121 14.3852 13.8163 14.3398
Reliance Assured Maturity Debt Fund ULIF06720/12/11LASURMDEBT121 16.0873 15.2087 16.0873
Group Balanced Fund 1 ULGF00110/10/03GBALANCE01121 29.4225 27.5883 28.9808
Group Balanced Fund 2 ULGF00210/10/03GBALANCE02121 25.4663 23.6594 25.1213
Group Capital Secure Fund 1 ULGF00431/01/07GCAPISEC01121 23.3131 22.1368 23.3131
Group Corporate Bond Fund 2 ULGF01213/10/08GCORBOND02121 22.3530 21.3968 22.3530
Group Energy Fund 1 ULGF01428/11/08GENERGYF01121 27.8499 23.4579 25.8440
Group Equity Fund 3 ULGF01808/06/09GEQUITYF03121 36.6647 29.5514 33.5748
Group Equity Fund 4 ULGF02205/06/13GEQUITYF04121 14.1885 11.4134 12.9651
Group Gilt Fund 2 ULGF01610/12/08GGILTFUN02121 19.6199 18.8154 19.4224
Group Growth Fund 1 ULGF00310/10/03GGROWTHF01121 26.0334 23.2638 25.1579
Group Infrastructure Fund 1 ULGF01908/06/09GINFRASF01121 15.6461 13.1880 14.1459
Group Midcap Fund 1 ULGF02008/06/09GMIDCAPF01121 40.5871 32.5433 37.1967
Group Money Market Fund 2 ULGF00930/09/08GMONMRKT02121 21.1957 19.9965 21.1957
Group Pure Equity Fund 1 ULGF01528/11/08GPUREEQF01121 39.6061 33.0110 36.5759
Group Balanced Fund 4 ULGF02105/06/13GBALANCE04121 14.1089 13.1106 13.9064
Group Corporate Bond Fund 3 ULGF02305/06/13GCORBOND03121 14.5170 13.8765 14.5145
Pension Discontinued Policy Fund ULIF07029/08/13PDISPOLF01121 13.3566 12.6066 13.3566
Make in India Fund ULIF06924/03/15LMAKEINDIA121 14.4566 12.2397 13.2826
Expenses charged and Gross Income to Fund (%)Annualized expense ratio and ratio of gross income (including unrealized gains) to average daily net assets of the fund for the for the financial year 2018-19
Fund Name SFIN Expenses Ratio (%)
Gross Income Ratio (%)
Discontinued Policy Fund ULIF05703/09/10DISCPOLF01121 0.50% 6.78%
Group Balanced Fund 1 ULGF00110/10/03GBALANCE01121 1.50% 8.34%
Group Balanced Fund 2 ULGF00210/10/03GBALANCE02121 0.75% 8.38%
Group Capital Secure Fund 1 ULGF00431/01/07GCAPISEC01121 0.75% 6.57%
Group Corporate Bond Fund 2 ULGF01213/10/08GCORBOND02121 0.75% 7.36%
Group Energy Fund 1 ULGF01428/11/08GENERGYF01121 1.50% 5.57%
Group Equity Fund 3 ULGF01808/06/09GEQUITYF03121 0.75% 10.85%
Group Gilt Fund 2 ULGF01610/12/08GGILTFUN02121 0.75% 8.92%
Group Growth Fund 1 ULGF00310/10/03GGROWTHF01121 0.75% 8.75%

287
STRA
TEG
IC R
EPO
RT /
STA
TUTO
RY R
EPO
RTS
/ F
INA
NCI
ALS
STA
TEM
ENTS
Fund Name SFIN Expenses Ratio (%)
Gross Income Ratio (%)
Group Infrastructure Fund 1 ULGF01908/06/09GINFRASF01121 0.75% -1.05%
Group Midcap Fund 1 ULGF02008/06/09GMIDCAPF01121 0.75% 0.52%
Group Money Market Fund 2 ULGF00930/09/08GMONMRKT02121 0.75% 0.89%
Group Pure Equity Fund 1 ULGF01528/11/08GPUREEQF01121 1.50% 5.38%
Health Corporate Bond Fund 1 ULIF06301/02/08HCORBOND01121 1.25% 7.39%
Health Energy Fund 1 ULIF06001/02/08HENERGYF01121 1.35% 5.71%
Health Equity Fund 1 ULIF01201/02/08HEQUITYF01121 1.50% 11.04%
Health Equity Fund 2 ULIF05411/01/10HEQUITYF02121 1.35% 12.12%
Health Gilt Fund 1 ULIF01301/02/08HGILTFUN01121 1.25% 9.04%
Health Growth Plus Fund 1 ULIF01401/02/08HGRWTPLS01121 1.30% 8.67%
Health Infrastructure Fund 1 ULIF06101/02/08HINFRAST01121 1.35% -0.57%
Health Midcap Fund 1 ULIF06201/02/08HMIDCAPF01121 1.35% 0.07%
Health Money Market Fund 1 ULIF01501/02/08HMONMRKT01121 1.25% 0.53%
Health Pure Equity Fund 1 ULIF01601/02/08HPUEQUTY01121 1.35% 5.28%
Health Super Growth Fund 1 ULIF01701/02/08HSPRGRWT01121 1.35% 8.79%
Life Balanced Fund 1 ULIF00128/07/04LBALANCE01121 1.25% 8.08%
Life Capital Secure Fund 1 ULIF00228/07/04LCAPTSEC01121 1.50% 7.24%
Life Corporate Bond Fund 1 ULIF02310/06/08LCORBOND01121 1.25% 5.70%
Life Corporate Bond Fund 2 ULIF04020/08/09LCORBOND02121 1.00% 7.80%
Life Energy Fund 1 ULIF02410/06/08LENERGYF01121 1.50% 5.03%
Life Energy Fund 2 ULIF04101/01/10LENERGYF02121 1.35% 5.01%
Life Equity Fund 1 ULIF00328/07/04LEQUITYF01121 1.75% 11.30%
Life Equity Fund 2 ULIF02510/06/08LEQUITYF02121 1.50% 11.83%
Life Equity Fund 3 ULIF04201/01/10LEQUITYF03121 1.35% 11.92%
Life Gilt Fund 1 ULIF02610/06/08LGILTFUN01121 1.25% 8.92%
Life Gilt Fund 2 ULIF03819/03/09LGILTFUN02121 1.00% 8.93%
Life Growth Fund 1 ULIF00428/07/04LGROWTHF01121 1.75% 9.38%
Life Growth Fund 2 ULIF01102/11/07LGROWTHF02121 1.25% 9.17%
Life Growth Plus Fund 1 ULIF00809/04/07LGRWTPLS01121 1.38% 9.20%
Life Growth Plus Fund 2 ULIF04301/01/10LGRWTPLS02121 1.30% 8.90%
Life High Growth Fund 1 ULIF00728/02/07LHIGROWT01121 1.40% 9.95%
Life High Growth Fund 2 ULIF05511/01/10LHIGROWT02121 1.35% 9.00%
Life Highest Nav Advantage Fund 1 ULIF05803/09/10LHNAVADV01121 1.60% 10.73%
Life Highest Nav Advantage Fund 2 ULIF05901/06/11LHNAVADV02121 1.60% 12.76%
Life Highest Nav Guarantee Fund 1 ULIF05612/02/10LHNAVGUA01121 1.50% 7.60%

288
Annual Report 2018-19
Appendix 5
ACCOUNTING RATIO contd...
Fund Name SFIN Expenses Ratio (%)
Gross Income Ratio (%)
Life Infrastructure Fund 1 ULIF02710/06/08LINFRAST01121 1.50% -0.94%
Life Infrastructure Fund 2 ULIF04401/01/10LINFRAST02121 1.35% -1.07%
Life Midcap Fund 1 ULIF02810/06/08LMIDCAPF01121 1.50% 0.58%
Life Midcap Fund 2 ULIF04501/01/10LMIDCAPF02121 1.35% 0.03%
Life Money Market Fund 1 ULIF02910/06/08LMONMRKT01121 1.25% 0.68%
Life Money Market Fund 2 ULIF03919/03/09LMONMRKT02121 1.00% 0.16%
Life Pure Debt Fund 1 ULIF00909/04/07LPURDEBT01121 1.25% 7.87%
Life Pure Equity Fund 1 ULIF03010/06/08LPUEQUTY01121 1.50% 5.52%
Life Pure Equity Fund 2 ULIF04601/01/10LPUEQUTY02121 1.35% 5.07%
Life Super Growth Fund 1 ULIF01009/04/07LSPRGRWT01121 1.45% 10.49%
Life Super Growth Fund 2 ULIF04701/01/10LSPRGRWT02121 1.35% 9.58%
Pension Balanced Fund 1 ULIF03104/12/08PBALANCE01121 1.50% 8.48%
Pension Balanced Fund 2 ULIF04801/01/10PBALANCE02121 1.30% 8.30%
Pension Capital Secure Fund 1 ULIF00501/11/06PCAPTSEC01121 1.50% 7.24%
Pension Corporate Bond Fund 1 ULIF01901/03/08PCORBOND01121 1.25% 8.34%
Pension Energy Fund 2 ULIF06501/01/10PENRGYYF02121 1.35% 5.40%
Pension Equity Fund 1 ULIF00601/11/06PEQUITYF01121 1.75% 11.30%
Pension Equity Fund 2 ULIF03204/12/08PEQUITYF02121 1.50% 11.87%
Pension Equity Fund 3 ULIF04901/01/10PEQUITYF03121 1.35% 12.31%
Pension Gilt Fund 1 ULIF06401/03/08PGILTFUN01121 1.25% 9.14%
Pension Growth Fund 1 ULIF03304/12/08PGROWTHF01121 1.75% 9.17%
Pension Growth Fund 2 ULIF05001/01/10PGROWTHF02121 1.30% 9.40%
Pension Infrastructure Fund 2 ULIF06601/01/10PINFRAST02121 1.35% -0.88%
Pension Midcap Fund 2 ULIF05101/01/10PMIDCAPF02121 1.35% -0.09%
Pension Money Market Fund 2 ULIF05201/01/10PMONMRKT02121 1.25% 0.03%
Pension Pure Equity Fund 2 ULIF05301/01/10PPUEQUTY02121 1.35% 5.59%
Reliance Assured Maturity Debt Fund ULIF06720/12/11LASURMDEBT121 1.00% 7.92%
Pension Smart Fund 1 ULIF06810/09/12PSMARTFU01121 1.35% 7.22%
Group Balanced Fund 4 ULGF02105/06/13GBALANCE04121 0.75% 7.90%
Group Equity Fund 4 ULGF02205/06/13GEQUITYF04121 0.75% 11.14%
Group Corporate Bond Fund 3 ULGF02305/06/13GCORBOND03121 0.75% 7.65%
Pension Discontinued Policy Fund ULIF07029/08/13PDISPOLF01121 0.50% 6.76%
Make in India Fund ULIF06924/03/15LMAKEINDIA121 1.35% 7.37%
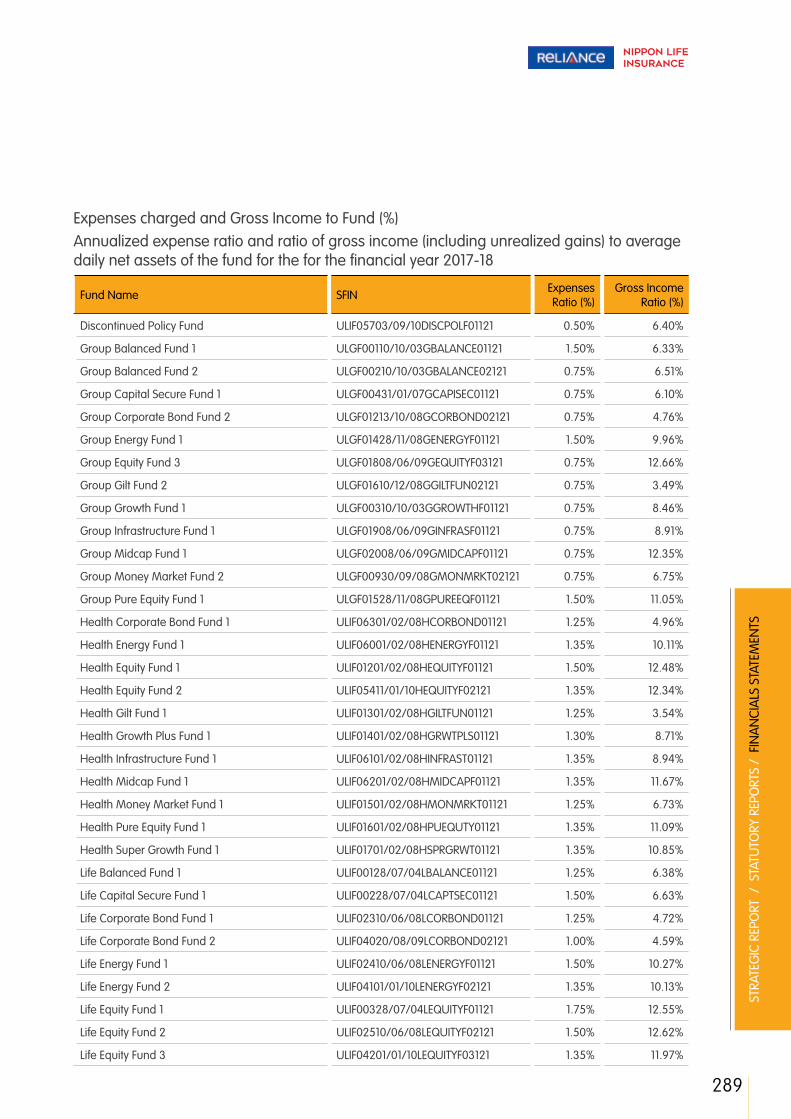
289
STRA
TEG
IC R
EPO
RT /
STA
TUTO
RY R
EPO
RTS
/ F
INA
NCI
ALS
STA
TEM
ENTS
Expenses charged and Gross Income to Fund (%)Annualized expense ratio and ratio of gross income (including unrealized gains) to average daily net assets of the fund for the for the financial year 2017-18
Fund Name SFIN Expenses Ratio (%)
Gross Income Ratio (%)
Discontinued Policy Fund ULIF05703/09/10DISCPOLF01121 0.50% 6.40%
Group Balanced Fund 1 ULGF00110/10/03GBALANCE01121 1.50% 6.33%
Group Balanced Fund 2 ULGF00210/10/03GBALANCE02121 0.75% 6.51%
Group Capital Secure Fund 1 ULGF00431/01/07GCAPISEC01121 0.75% 6.10%
Group Corporate Bond Fund 2 ULGF01213/10/08GCORBOND02121 0.75% 4.76%
Group Energy Fund 1 ULGF01428/11/08GENERGYF01121 1.50% 9.96%
Group Equity Fund 3 ULGF01808/06/09GEQUITYF03121 0.75% 12.66%
Group Gilt Fund 2 ULGF01610/12/08GGILTFUN02121 0.75% 3.49%
Group Growth Fund 1 ULGF00310/10/03GGROWTHF01121 0.75% 8.46%
Group Infrastructure Fund 1 ULGF01908/06/09GINFRASF01121 0.75% 8.91%
Group Midcap Fund 1 ULGF02008/06/09GMIDCAPF01121 0.75% 12.35%
Group Money Market Fund 2 ULGF00930/09/08GMONMRKT02121 0.75% 6.75%
Group Pure Equity Fund 1 ULGF01528/11/08GPUREEQF01121 1.50% 11.05%
Health Corporate Bond Fund 1 ULIF06301/02/08HCORBOND01121 1.25% 4.96%
Health Energy Fund 1 ULIF06001/02/08HENERGYF01121 1.35% 10.11%
Health Equity Fund 1 ULIF01201/02/08HEQUITYF01121 1.50% 12.48%
Health Equity Fund 2 ULIF05411/01/10HEQUITYF02121 1.35% 12.34%
Health Gilt Fund 1 ULIF01301/02/08HGILTFUN01121 1.25% 3.54%
Health Growth Plus Fund 1 ULIF01401/02/08HGRWTPLS01121 1.30% 8.71%
Health Infrastructure Fund 1 ULIF06101/02/08HINFRAST01121 1.35% 8.94%
Health Midcap Fund 1 ULIF06201/02/08HMIDCAPF01121 1.35% 11.67%
Health Money Market Fund 1 ULIF01501/02/08HMONMRKT01121 1.25% 6.73%
Health Pure Equity Fund 1 ULIF01601/02/08HPUEQUTY01121 1.35% 11.09%
Health Super Growth Fund 1 ULIF01701/02/08HSPRGRWT01121 1.35% 10.85%
Life Balanced Fund 1 ULIF00128/07/04LBALANCE01121 1.25% 6.38%
Life Capital Secure Fund 1 ULIF00228/07/04LCAPTSEC01121 1.50% 6.63%
Life Corporate Bond Fund 1 ULIF02310/06/08LCORBOND01121 1.25% 4.72%
Life Corporate Bond Fund 2 ULIF04020/08/09LCORBOND02121 1.00% 4.59%
Life Energy Fund 1 ULIF02410/06/08LENERGYF01121 1.50% 10.27%
Life Energy Fund 2 ULIF04101/01/10LENERGYF02121 1.35% 10.13%
Life Equity Fund 1 ULIF00328/07/04LEQUITYF01121 1.75% 12.55%
Life Equity Fund 2 ULIF02510/06/08LEQUITYF02121 1.50% 12.62%
Life Equity Fund 3 ULIF04201/01/10LEQUITYF03121 1.35% 11.97%

290
Annual Report 2018-19
Appendix 5
ACCOUNTING RATIO contd...
Fund Name SFIN Expenses Ratio (%)
Gross Income Ratio (%)
Life Gilt Fund 1 ULIF02610/06/08LGILTFUN01121 1.25% 3.49%
Life Gilt Fund 2 ULIF03819/03/09LGILTFUN02121 1.00% 3.57%
Life Growth Fund 1 ULIF00428/07/04LGROWTHF01121 1.75% 7.80%
Life Growth Fund 2 ULIF01102/11/07LGROWTHF02121 1.25% 7.88%
Life Growth Plus Fund 1 ULIF00809/04/07LGRWTPLS01121 1.38% 8.63%
Life Growth Plus Fund 2 ULIF04301/01/10LGRWTPLS02121 1.30% 9.13%
Life High Growth Fund 1 ULIF00728/02/07LHIGROWT01121 1.40% 9.45%
Life High Growth Fund 2 ULIF05511/01/10LHIGROWT02121 1.35% 10.30%
Life Highest Nav Advantage Fund 1 ULIF05803/09/10LHNAVADV01121 1.60% 11.62%
Life Highest Nav Advantage Fund 2 ULIF05901/06/11LHNAVADV02121 1.60% 11.88%
Life Highest Nav Guarantee Fund 1 ULIF05612/02/10LHNAVGUA01121 1.50% 11.87%
Life Infrastructure Fund 1 ULIF02710/06/08LINFRAST01121 1.50% 8.98%
Life Infrastructure Fund 2 ULIF04401/01/10LINFRAST02121 1.35% 8.94%
Life Midcap Fund 1 ULIF02810/06/08LMIDCAPF01121 1.50% 13.46%
Life Midcap Fund 2 ULIF04501/01/10LMIDCAPF02121 1.35% 13.45%
Life Money Market Fund 1 ULIF02910/06/08LMONMRKT01121 1.25% 6.74%
Life Money Market Fund 2 ULIF03919/03/09LMONMRKT02121 1.00% 6.71%
Life Pure Debt Fund 1 ULIF00909/04/07LPURDEBT01121 1.25% 4.74%
Life Pure Equity Fund 1 ULIF03010/06/08LPUEQUTY01121 1.50% 10.81%
Life Pure Equity Fund 2 ULIF04601/01/10LPUEQUTY02121 1.35% 11.02%
Life Super Growth Fund 1 ULIF01009/04/07LSPRGRWT01121 1.45% 11.36%
Life Super Growth Fund 2 ULIF04701/01/10LSPRGRWT02121 1.35% 11.73%
Pension Balanced Fund 1 ULIF03104/12/08PBALANCE01121 1.50% 6.27%
Pension Balanced Fund 2 ULIF04801/01/10PBALANCE02121 1.30% 6.38%
Pension Capital Secure Fund 1 ULIF00501/11/06PCAPTSEC01121 1.50% 6.58%
Pension Corporate Bond Fund 1 ULIF01901/03/08PCORBOND01121 1.25% 4.96%
Pension Energy Fund 2 ULIF06501/01/10PENRGYYF02121 1.35% 9.95%
Pension Equity Fund 1 ULIF00601/11/06PEQUITYF01121 1.75% 12.62%
Pension Equity Fund 2 ULIF03204/12/08PEQUITYF02121 1.50% 12.39%
Pension Equity Fund 3 ULIF04901/01/10PEQUITYF03121 1.35% 12.18%
Pension Gilt Fund 1 ULIF06401/03/08PGILTFUN01121 1.25% 3.67%
Pension Growth Fund 1 ULIF03304/12/08PGROWTHF01121 1.75% 7.88%
Pension Growth Fund 2 ULIF05001/01/10PGROWTHF02121 1.30% 7.97%
Pension Infrastructure Fund 2 ULIF06601/01/10PINFRAST02121 1.35% 8.80%
Pension Midcap Fund 2 ULIF05101/01/10PMIDCAPF02121 1.35% 13.29%
Pension Money Market Fund 2 ULIF05201/01/10PMONMRKT02121 1.25% 6.76%

291
STRA
TEG
IC R
EPO
RT /
STA
TUTO
RY R
EPO
RTS
/ F
INA
NCI
ALS
STA
TEM
ENTS
Fund Name SFIN Expenses Ratio (%)
Gross Income Ratio (%)
Pension Pure Equity Fund 2 ULIF05301/01/10PPUEQUTY02121 1.35% 10.81%
Reliance Assured Maturity Debt Fund ULIF06720/12/11LASURMDEBT121 1.00% 6.24%
Pension Smart Fund 1 ULIF06810/09/12PSMARTFU01121 1.35% 4.80%
Group Balanced Fund 4 ULGF02105/06/13GBALANCE04121 0.75% 6.44%
Group Equity Fund 4 ULGF02205/06/13GEQUITYF04121 0.75% 12.42%
Group Corporate Bond Fund 3 ULGF02305/06/13GCORBOND03121 0.75% 4.88%
Pension Discontinued Policy Fund ULIF07029/08/13PDISPOLF01121 0.50% 6.42%
Make in India Fund ULIF06924/03/15LMAKEINDIA121 1.35% 10.04%
Provision for doubtful debts on assets of the respective Fund for the Financial Year 2018-19 : Nil (Previous Year: Nil)Fund-wise disclosure of appreciation and/or (depreciation) in value of investments segregat-ed class-wise as on 31st March 2019
Fund SFIN Bonds/Debentures Equity GILTS ETF Total
Discontinued Policy Fund ULIF05703/09/10DISCPOLF01121 - - - - -
Group Balanced Fund 1 ULGF00110/10/03GBALANCE01121 -29 2,419 275 - 2,665
Group Balanced Fund 2 ULGF00210/10/03GBALANCE02121 349 2,158 420 - 2,927
Group Balanced Fund 3 ULGF01718/05/09GBALANCE03121 - - - - -
Group Capital Secure Fund 1 ULGF00431/01/07GCAPISEC01121 - - - - -
Group Corporate Bond Fund 1 ULGF00524/10/07GCORBOND01121 - - - - -
Group Corporate Bond Fund 2 ULGF01213/10/08GCORBOND02121 1,764 - 2,589 - 4,353
Group Energy Fund 1 ULGF01428/11/08GENERGYF01121 - 76 - - 76
Group Equity Fund 1 ULGF00724/10/07GEQUITYF01121 - - - - -
Group Equity Fund 2 ULGF01328/11/08GEQUITYF02121 - - - - -
Group Equity Fund 3 ULGF01808/06/09GEQUITYF03121 - 43,060 - - 43,060
Group Gilt Fund 1 ULGF00824/10/07GGILTFUN01121 - - - - -
Group Gilt Fund 2 ULGF01610/12/08GGILTFUN02121 - - 34 - 34
Group Growth Fund 1 ULGF00310/10/03GGROWTHF01121 - 413 35 - 448
Group Infrastructure Fund 1 ULGF01908/06/09GINFRASF01121 - 19 - - 19
Group Midcap Fund 1 ULGF02008/06/09GMIDCAPF01121 - 132 - - 132
Group Money Market Fund 1 ULGF00624/10/07GMONMRKT01121 - - - - -
Group Money Market Fund 2 ULGF00930/09/08GMONMRKT02121 - - - - -
Group Pure Debt Fund 1 ULGF01030/09/08GPUREDEB01121 - - - - -
Group Pure Debt Fund 2 ULGF01130/09/08GPURDEBT02121 - - - - -
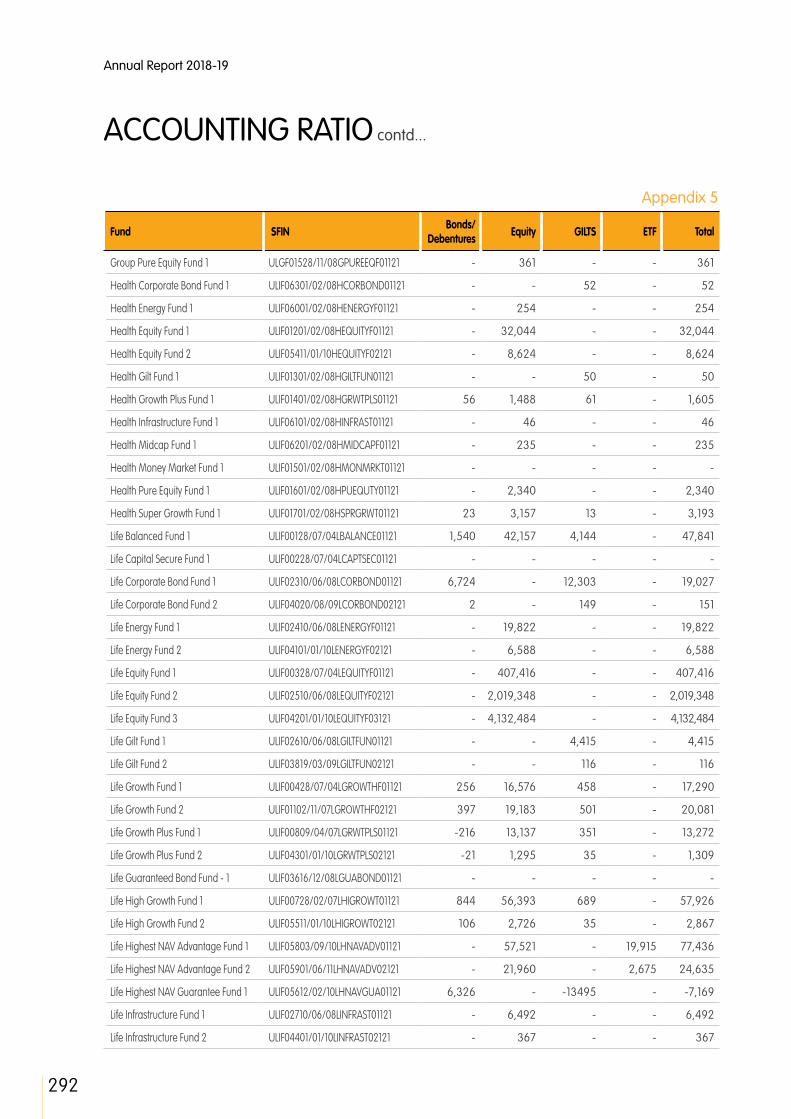
292
Annual Report 2018-19
Appendix 5
ACCOUNTING RATIO contd...
Fund SFIN Bonds/Debentures Equity GILTS ETF Total
Group Pure Equity Fund 1 ULGF01528/11/08GPUREEQF01121 - 361 - - 361
Health Corporate Bond Fund 1 ULIF06301/02/08HCORBOND01121 - - 52 - 52
Health Energy Fund 1 ULIF06001/02/08HENERGYF01121 - 254 - - 254
Health Equity Fund 1 ULIF01201/02/08HEQUITYF01121 - 32,044 - - 32,044
Health Equity Fund 2 ULIF05411/01/10HEQUITYF02121 - 8,624 - - 8,624
Health Gilt Fund 1 ULIF01301/02/08HGILTFUN01121 - - 50 - 50
Health Growth Plus Fund 1 ULIF01401/02/08HGRWTPLS01121 56 1,488 61 - 1,605
Health Infrastructure Fund 1 ULIF06101/02/08HINFRAST01121 - 46 - - 46
Health Midcap Fund 1 ULIF06201/02/08HMIDCAPF01121 - 235 - - 235
Health Money Market Fund 1 ULIF01501/02/08HMONMRKT01121 - - - - -
Health Pure Equity Fund 1 ULIF01601/02/08HPUEQUTY01121 - 2,340 - - 2,340
Health Super Growth Fund 1 ULIF01701/02/08HSPRGRWT01121 23 3,157 13 - 3,193
Life Balanced Fund 1 ULIF00128/07/04LBALANCE01121 1,540 42,157 4,144 - 47,841
Life Capital Secure Fund 1 ULIF00228/07/04LCAPTSEC01121 - - - - -
Life Corporate Bond Fund 1 ULIF02310/06/08LCORBOND01121 6,724 - 12,303 - 19,027
Life Corporate Bond Fund 2 ULIF04020/08/09LCORBOND02121 2 - 149 - 151
Life Energy Fund 1 ULIF02410/06/08LENERGYF01121 - 19,822 - - 19,822
Life Energy Fund 2 ULIF04101/01/10LENERGYF02121 - 6,588 - - 6,588
Life Equity Fund 1 ULIF00328/07/04LEQUITYF01121 - 407,416 - - 407,416
Life Equity Fund 2 ULIF02510/06/08LEQUITYF02121 - 2,019,348 - - 2,019,348
Life Equity Fund 3 ULIF04201/01/10LEQUITYF03121 - 4,132,484 - - 4,132,484
Life Gilt Fund 1 ULIF02610/06/08LGILTFUN01121 - - 4,415 - 4,415
Life Gilt Fund 2 ULIF03819/03/09LGILTFUN02121 - - 116 - 116
Life Growth Fund 1 ULIF00428/07/04LGROWTHF01121 256 16,576 458 - 17,290
Life Growth Fund 2 ULIF01102/11/07LGROWTHF02121 397 19,183 501 - 20,081
Life Growth Plus Fund 1 ULIF00809/04/07LGRWTPLS01121 -216 13,137 351 - 13,272
Life Growth Plus Fund 2 ULIF04301/01/10LGRWTPLS02121 -21 1,295 35 - 1,309
Life Guaranteed Bond Fund - 1 ULIF03616/12/08LGUABOND01121 - - - - -
Life High Growth Fund 1 ULIF00728/02/07LHIGROWT01121 844 56,393 689 - 57,926
Life High Growth Fund 2 ULIF05511/01/10LHIGROWT02121 106 2,726 35 - 2,867
Life Highest NAV Advantage Fund 1 ULIF05803/09/10LHNAVADV01121 - 57,521 - 19,915 77,436
Life Highest NAV Advantage Fund 2 ULIF05901/06/11LHNAVADV02121 - 21,960 - 2,675 24,635
Life Highest NAV Guarantee Fund 1 ULIF05612/02/10LHNAVGUA01121 6,326 - -13495 - -7,169
Life Infrastructure Fund 1 ULIF02710/06/08LINFRAST01121 - 6,492 - - 6,492
Life Infrastructure Fund 2 ULIF04401/01/10LINFRAST02121 - 367 - - 367

293
STRA
TEG
IC R
EPO
RT /
STA
TUTO
RY R
EPO
RTS
/ F
INA
NCI
ALS
STA
TEM
ENTS
Fund SFIN Bonds/Debentures Equity GILTS ETF Total
Life Midcap Fund 1 ULIF02810/06/08LMIDCAPF01121 - 23,534 - - 23,534
Life Midcap Fund 2 ULIF04501/01/10LMIDCAPF02121 - 50,014 - - 50,014
Life Money Market Fund 1 ULIF02910/06/08LMONMRKT01121 - - - - -
Life Money Market Fund 2 ULIF03919/03/09LMONMRKT02121 - - - - -
Life Pure Debt Fund 1 ULIF00909/04/07LPURDEBT01121 467 - 1,427 - 1,894
Life Pure Equity Fund 1 ULIF03010/06/08LPUEQUTY01121 - 55,087 - - 55,087
Life Pure Equity Fund 2 ULIF04601/01/10LPUEQUTY02121 - 180,964 - - 180,964
Life Super Growth Fund 1 ULIF01009/04/07LSPRGRWT01121 -173 46,793 206 - 46,826
Life Super Growth Fund 2 ULIF04701/01/10LSPRGRWT02121 -55 3,448 16 - 3,409
Pension Balanced Fund 1 ULIF03104/12/08PBALANCE01121 223 7,990 764 - 8,977
Pension Balanced Fund 2 ULIF04801/01/10PBALANCE02121 179 898 153 - 1,230
Pension Capital Secure Fund 1 ULIF00501/11/06PCAPTSEC01121 - - - - -
Pension Corporate Bond Fund 1 ULIF01901/03/08PCORBOND01121 - - 30 - 30
Pension Energy Fund 1 ULIF02001/03/08PENRGYYF01121 - - - - -
Pension Energy Fund 2 ULIF06501/01/10PENRGYYF02121 - 3,134 - - 3,134
Pension Equity Fund 1 ULIF00601/11/06PEQUITYF01121 - 157,861 - - 157,861
Pension Equity Fund 2 ULIF03204/12/08PEQUITYF02121 - 238,598 - - 238,598
Pension Equity Fund 3 ULIF04901/01/10PEQUITYF03121 - 150,631 - - 150,631
Pension Gilt Fund 1 ULIF06401/03/08PGILTFUN01121 - - 23 - 23
Pension Growth Fund 1 ULIF03304/12/08PGROWTHF01121 225 8,802 270 - 9,297
Pension Growth Fund 2 ULIF05001/01/10PGROWTHF02121 97 4,642 144 - 4,883
Pension Guaranteed Bond Fund - 1 ULIF03716/12/08PGUABOND01121 - - - - -
Pension Infrastructure Fund 1 ULIF02101/03/08PINFRAST01121 - - - - -
Pension Infrastructure Fund 2 ULIF06601/01/10PINFRAST02121 - 55 - - 55
Pension Midcap Fund 1 ULIF02201/03/08PMIDCAPF01121 - - - - -
Pension Midcap Fund 2 ULIF05101/01/10PMIDCAPF02121 - 8,969 - - 8,969
Pension Money Market Fund 1 ULIF03404/12/08PMONMRKT01121 - - - - -
Pension Money Market Fund 2 ULIF05201/01/10PMONMRKT02121 - - - - -
Pension Pure Equity Fund 1 ULIF03504/12/08PPUEQUTY01121 - - - - -
Pension Pure Equity Fund 2 ULIF05301/01/10PPUEQUTY02121 - 10,116 - - 10,116
Reliance Assured Maturity Debt Fund ULIF06720/12/11LASURMDEBT121 4,385 - -1,058 - 3,327
Health Balanced Fund 1 ULIF01801/02/08HBALANCE01121 - - - - -
Pension Smart Fund 1 ULIF06810/09/12PSMARTFU01121 -2,521 - 2,887 - 366
Group Balanced Fund 4 ULGF02105/06/13GBALANCE04121 3,762 76,947 6,944 - 87,653
Group Corporate Bond Fund 3 ULGF02305/06/13GCORBOND03121 2,249 - 7,568 - 9,817

294
Annual Report 2018-19
Appendix 5
ACCOUNTING RATIO contd...
Fund SFIN Bonds/Debentures Equity GILTS ETF Total
Pension Discontinued Policy Fund ULIF07029/08/13PDISPOLF01121 - - - - -
Group Equity Fund 4 ULGF02205/06/13GEQUITYF04121 - - - - 62,940
Make in India Fund ULIF06924/03/15LMAKEINDIA121 - 216,715 - 505 217,220
Total 26,959 8,228,429 32,604 23,095 8,311,087
Fund-wise disclosure of appreciation and/or (depreciation) in value of investments segregat-ed class-wise as on 31st Mar 2018
Fund SFIN Bonds/Debentures Equity GILTS ETF Total
Discontinued Policy Fund ULIF05703/09/10DISCPOLF01121 - - - - -
Group Balanced Fund 1 ULGF00110/10/03GBALANCE01121 (209) 2,042 (9) - 1,824
Group Balanced Fund 2 ULGF00210/10/03GBALANCE02121 (253) 2,557 (23) - 2,281
Group Balanced Fund 3 ULGF01718/05/09GBALANCE03121 - - - - -
Group Capital Secure Fund 1 ULGF00431/01/07GCAPISEC01121 - - - - -
Group Corporate Bond Fund 1 ULGF00524/10/07GCORBOND01121 - - - - -
Group Corporate Bond Fund 2 ULGF01213/10/08GCORBOND02121 (4,571) - (1,409) - (5,980)
Group Energy Fund 1 ULGF01428/11/08GENERGYF01121 - 153 - - 153
Group Equity Fund 1 ULGF00724/10/07GEQUITYF01121 - - - - -
Group Equity Fund 2 ULGF01328/11/08GEQUITYF02121 - - - - -
Group Equity Fund 3 ULGF01808/06/09GEQUITYF03121 - 95,398 - - 95,398
Group Gilt Fund 1 ULGF00824/10/07GGILTFUN01121 - - - - -
Group Gilt Fund 2 ULGF01610/12/08GGILTFUN02121 - - 6 - 6
Group Growth Fund 1 ULGF00310/10/03GGROWTHF01121 (32) 3,506 (14) - 3,460
Group Infrastructure Fund 1 ULGF01908/06/09GINFRASF01121 - 150 - - 150
Group Midcap Fund 1 ULGF02008/06/09GMIDCAPF01121 - ]42 - - 42
Group Money Market Fund 1 ULGF00624/10/07GMONMRKT01121 - - - - -
Group Money Market Fund 2 ULGF00930/09/08GMONMRKT02121 - - - - -
Group Pure Debt Fund 1 ULGF01030/09/08GPUREDEB01121 - - - - -
Group Pure Debt Fund 2 ULGF01130/09/08GPURDEBT02121 - - - - -
Group Pure Equity Fund 1 ULGF01528/11/08GPUREEQF01121 - 414 - - 414
Health Corporate Bond Fund 1 ULIF06301/02/08HCORBOND01121 (105) - 4 - (101)
Health Energy Fund 1 ULIF06001/02/08HENERGYF01121 - 365 - - 365
Health Equity Fund 1 ULIF01201/02/08HEQUITYF01121 - 52,499 - - 52,499
Health Equity Fund 2 ULIF05411/01/10HEQUITYF02121 - 6,913 - - 6,913
Health Gilt Fund 1 ULIF01301/02/08HGILTFUN01121 - - 18 - 18
Health Growth Plus Fund 1 ULIF01401/02/08HGRWTPLS01121 (115) 3,207 (7) - 3,085
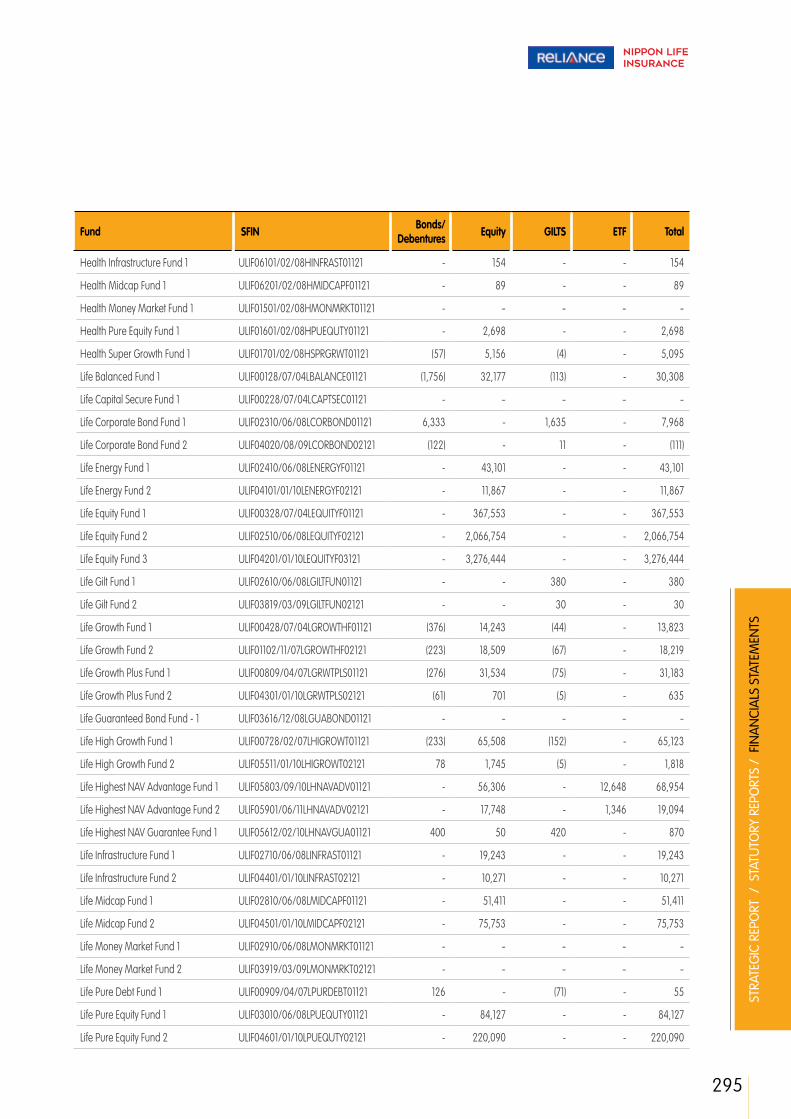
295
STRA
TEG
IC R
EPO
RT /
STA
TUTO
RY R
EPO
RTS
/ F
INA
NCI
ALS
STA
TEM
ENTS
Fund SFIN Bonds/Debentures Equity GILTS ETF Total
Health Infrastructure Fund 1 ULIF06101/02/08HINFRAST01121 - 154 - - 154
Health Midcap Fund 1 ULIF06201/02/08HMIDCAPF01121 - 89 - - 89
Health Money Market Fund 1 ULIF01501/02/08HMONMRKT01121 - - - - -
Health Pure Equity Fund 1 ULIF01601/02/08HPUEQUTY01121 - 2,698 - - 2,698
Health Super Growth Fund 1 ULIF01701/02/08HSPRGRWT01121 (57) 5,156 (4) - 5,095
Life Balanced Fund 1 ULIF00128/07/04LBALANCE01121 (1,756) 32,177 (113) - 30,308
Life Capital Secure Fund 1 ULIF00228/07/04LCAPTSEC01121 - - - - -
Life Corporate Bond Fund 1 ULIF02310/06/08LCORBOND01121 6,333 - 1,635 - 7,968
Life Corporate Bond Fund 2 ULIF04020/08/09LCORBOND02121 (122) - 11 - (111)
Life Energy Fund 1 ULIF02410/06/08LENERGYF01121 - 43,101 - - 43,101
Life Energy Fund 2 ULIF04101/01/10LENERGYF02121 - 11,867 - - 11,867
Life Equity Fund 1 ULIF00328/07/04LEQUITYF01121 - 367,553 - - 367,553
Life Equity Fund 2 ULIF02510/06/08LEQUITYF02121 - 2,066,754 - - 2,066,754
Life Equity Fund 3 ULIF04201/01/10LEQUITYF03121 - 3,276,444 - - 3,276,444
Life Gilt Fund 1 ULIF02610/06/08LGILTFUN01121 - - 380 - 380
Life Gilt Fund 2 ULIF03819/03/09LGILTFUN02121 - - 30 - 30
Life Growth Fund 1 ULIF00428/07/04LGROWTHF01121 (376) 14,243 (44) - 13,823
Life Growth Fund 2 ULIF01102/11/07LGROWTHF02121 (223) 18,509 (67) - 18,219
Life Growth Plus Fund 1 ULIF00809/04/07LGRWTPLS01121 (276) 31,534 (75) - 31,183
Life Growth Plus Fund 2 ULIF04301/01/10LGRWTPLS02121 (61) 701 (5) - 635
Life Guaranteed Bond Fund - 1 ULIF03616/12/08LGUABOND01121 - - - - -
Life High Growth Fund 1 ULIF00728/02/07LHIGROWT01121 (233) 65,508 (152) - 65,123
Life High Growth Fund 2 ULIF05511/01/10LHIGROWT02121 78 1,745 (5) - 1,818
Life Highest NAV Advantage Fund 1 ULIF05803/09/10LHNAVADV01121 - 56,306 - 12,648 68,954
Life Highest NAV Advantage Fund 2 ULIF05901/06/11LHNAVADV02121 - 17,748 - 1,346 19,094
Life Highest NAV Guarantee Fund 1 ULIF05612/02/10LHNAVGUA01121 400 50 420 - 870
Life Infrastructure Fund 1 ULIF02710/06/08LINFRAST01121 - 19,243 - - 19,243
Life Infrastructure Fund 2 ULIF04401/01/10LINFRAST02121 - 10,271 - - 10,271
Life Midcap Fund 1 ULIF02810/06/08LMIDCAPF01121 - 51,411 - - 51,411
Life Midcap Fund 2 ULIF04501/01/10LMIDCAPF02121 - 75,753 - - 75,753
Life Money Market Fund 1 ULIF02910/06/08LMONMRKT01121 - - - - -
Life Money Market Fund 2 ULIF03919/03/09LMONMRKT02121 - - - - -
Life Pure Debt Fund 1 ULIF00909/04/07LPURDEBT01121 126 - (71) - 55
Life Pure Equity Fund 1 ULIF03010/06/08LPUEQUTY01121 - 84,127 - - 84,127
Life Pure Equity Fund 2 ULIF04601/01/10LPUEQUTY02121 - 220,090 - - 220,090

296
Annual Report 2018-19
Appendix 5
ACCOUNTING RATIO contd...
Fund SFIN Bonds/Debentures Equity GILTS ETF Total
Life Super Growth Fund 1 ULIF01009/04/07LSPRGRWT01121 (396) 61,170 (25) - 60,749
Life Super Growth Fund 2 ULIF04701/01/10LSPRGRWT02121 (51) 2,788 (3) - 2,734
Pension Balanced Fund 1 ULIF03104/12/08PBALANCE01121 (831) 6,216 (73) - 5,312
Pension Balanced Fund 2 ULIF04801/01/10PBALANCE02121 (78) 1,126 (2) - 1,046
Pension Capital Secure Fund 1 ULIF00501/11/06PCAPTSEC01121 - - - - -
Pension Corporate Bond Fund 1 ULIF01901/03/08PCORBOND01121 (84) - (11) - (95)
Pension Energy Fund 1 ULIF02001/03/08PENRGYYF01121 - - - - -
Pension Energy Fund 2 ULIF06501/01/10PENRGYYF02121 - 9,664 - - 9,664
Pension Equity Fund 1 ULIF00601/11/06PEQUITYF01121 - 130,340 - - 130,340
Pension Equity Fund 2 ULIF03204/12/08PEQUITYF02121 - 267,861 - - 267,861
Pension Equity Fund 3 ULIF04901/01/10PEQUITYF03121 - 137,002 - - 137,002
Pension Gilt Fund 1 ULIF06401/03/08PGILTFUN01121 - - 20 - 20
Pension Growth Fund 1 ULIF03304/12/08PGROWTHF01121 (285) 8,001 (30) - 7,686
Pension Growth Fund 2 ULIF05001/01/10PGROWTHF02121 22 3,044 (15) - 3,051
Pension Guaranteed Bond Fund - 1 ULIF03716/12/08PGUABOND01121 - - - - -
Pension Infrastructure Fund 1 ULIF02101/03/08PINFRAST01121 - - - - -
Pension Infrastructure Fund 2 ULIF06601/01/10PINFRAST02121 - 3,709 - - 3,709
Pension Midcap Fund 1 ULIF02201/03/08PMIDCAPF01121 - - - - -
Pension Midcap Fund 2 ULIF05101/01/10PMIDCAPF02121 - 21,521 - - 21,521
Pension Money Market Fund 1 ULIF03404/12/08PMONMRKT01121 - - - - -
Pension Money Market Fund 2 ULIF05201/01/10PMONMRKT02121 - - - - -
Pension Pure Equity Fund 1 ULIF03504/12/08PPUEQUTY01121 - - - - -
Pension Pure Equity Fund 2 ULIF05301/01/10PPUEQUTY02121 - 13,555 - - 13,555
Reliance Assured Maturity Debt Fund ULIF06720/12/11LASURMDEBT121 6,724 - (1,032) - 5,692
Health Balanced Fund 1 ULIF01801/02/08HBALANCE01121 - - - - -
Pension Smart Fund 1 ULIF06810/09/12PSMARTFU01121 (3,566) - 132 - (3,434)
Group Balanced Fund 4 ULGF02105/06/13GBALANCE04121 (6,822) 47,569 (1,156) - 39,591
Group Corporate Bond Fund 3 ULGF02305/06/13GCORBOND03121 (8,495) - (1,087) - (9,582)
Pension Discontinued Policy Fund ULIF07029/08/13PDISPOLF01121 - - - - -
Group Equity Fund 4 ULGF02205/06/13GEQUITYF04121 - 141,185 - - 141,185
Make in India Fund ULIF06924/03/15LMAKEINDIA121 - 35,118 - - 35,118
Total (15,314) 7,530,347 (2,776) 13,994 7,526,251
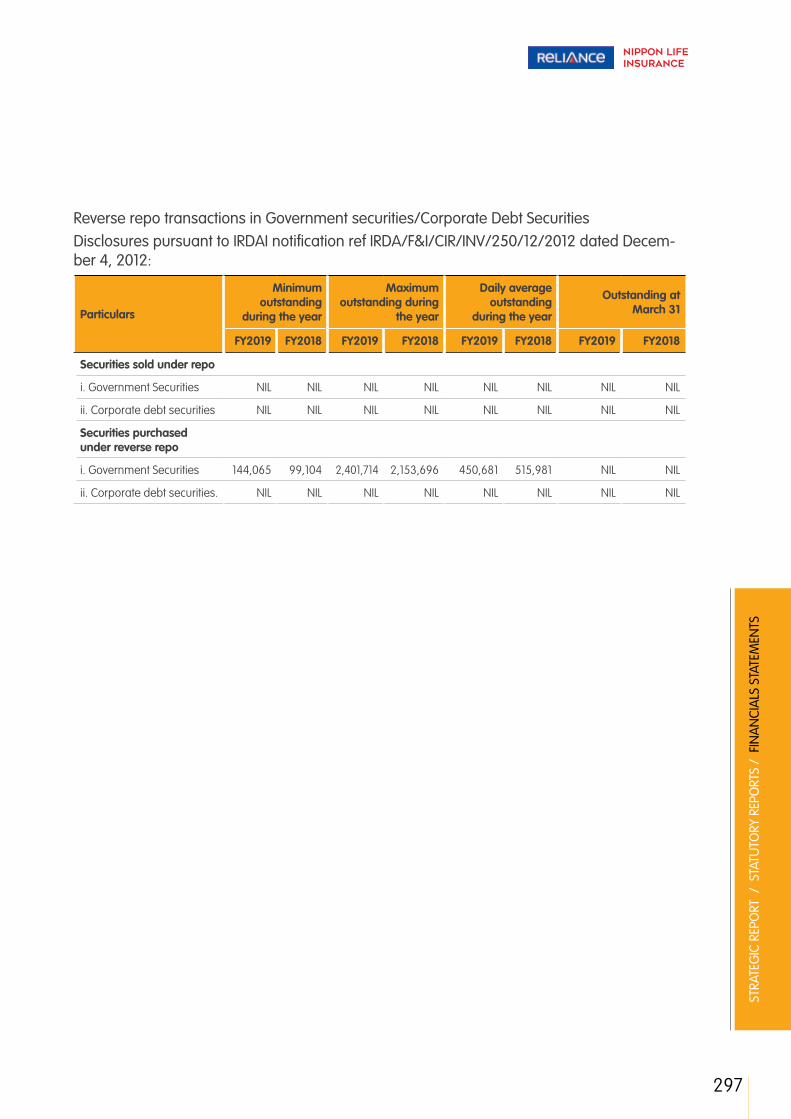
297
STRA
TEG
IC R
EPO
RT /
STA
TUTO
RY R
EPO
RTS
/ F
INA
NCI
ALS
STA
TEM
ENTS
Reverse repo transactions in Government securities/Corporate Debt SecuritiesDisclosures pursuant to IRDAI notification ref IRDA/F&I/CIR/INV/250/12/2012 dated Decem-ber 4, 2012:
Particulars
Minimum outstanding
during the year
Maximum outstanding during
the year
Daily average outstanding
during the year
Outstanding at March 31
FY2019 FY2018 FY2019 FY2018 FY2019 FY2018 FY2019 FY2018
Securities sold under repo
i. Government Securities NIL NIL NIL NIL NIL NIL NIL NIL
ii. Corporate debt securities NIL NIL NIL NIL NIL NIL NIL NIL
Securities purchased under reverse repo
i. Government Securities 144,065 99,104 2,401,714 2,153,696 450,681 515,981 NIL NIL
ii. Corporate debt securities. NIL NIL NIL NIL NIL NIL NIL NIL

Annual Report 2018-19
298
Fund
Bal
ance
She
et
as a
t 31st
Mar
ch, 2
019
App
endi
x 6
(` ‘0
00)
Parti
cula
rsSc
hedu
leCu
rrent
Year
DISC
ONTIN
UED
POLIC
Y FU
ND
LIFE
BAL
ANCE
D FU
ND 1
LIFE
CAP
ITAL
SECU
RE FU
ND 1
LIFE
COR
PORA
TE
BOND
FUND
1 LI
FE C
ORPO
RATE
BO
ND FU
ND 2
LI
FE EN
ERGY
FU
ND 1
LIFE
ENER
GY
FUND
2
LIFE
EQUI
TY
FUND
1 LI
FE EQ
UITY
FU
ND 2
LI
FE EQ
UITY
FU
ND 3
LI
FE G
ILT FU
ND 1
LIFE
GILT
FU
ND 2
LI
FE G
ROW
TH
FUND
1 LI
FE G
ROW
TH
FUND
2
SFIN
ULIF
0570
3/
09/10
DISC
PO
LF01
121
ULIF
0012
8/
07/0
4LBA
L AN
CE01
121
ULIF
0022
8/
07/0
4LCA
PT
SEC0
1121
ULIF
0231
0/
06/0
8LCO
R BO
ND01
121
ULIF
0402
0/
08/0
9LCO
R BO
ND02
121
ULIF
0241
0/
06/0
8LEN
ER
GYF0
1121
ULIF
0410
1/ 01
/10LE
NER
GYF0
2121
ULIF
0032
8/
07/0
4LEQ
UI
TYF0
1121
ULIF
0251
0/
06/0
8LEQ
UI
TYF0
2121
ULIF
0420
1/ 01
/10LE
QUI
TYF0
3121
ULIF
0261
0/
06/0
8LGI
LT
FUN0
1121
ULIF
0381
9/
03/0
9LGI
LTF
UN02
121
ULIF
0042
8/
07/0
4LGR
OW
THF0
1121
ULIF
0110
2/
11/07
LGRO
W
THF0
2121
So
urce
s of F
unds
Polic
yhold
ers'
Fund
s:Po
licyh
older
cont
ribut
ionF-
1 2
5,23
,271
7,
17,0
35
(29,
512)
14,9
5,24
5 (2
2,28
7) (1
1,366
) 15
,677
(9
,88,
426)
(1,3
7,35,
925)
49,
98,6
50
7,33
,945
(1
4,48
8) (4
8,52
2) (5
6,54
9)Re
venu
e Ac
coun
t 14
,02,
938
3,76
,901
6
3,55
1 12
,96,
694
51,1
95
2,2
6,96
9 5
8,64
4 2
4,80
,415
2
,04,
23,9
16
1,17
,25,
596
(2,6
8,52
9) 3
0,20
3 2
,13,0
17
2,3
7,946
To
tal
39,
26,2
09
10,9
3,93
6 3
4,03
9 2
7,91
,939
2
8,90
8 2
,15,6
03
74,
321
14,9
1,989
6
6,87
,991
1,
67,2
4,24
6 4
,65,
416
15,7
15
1,64
,495
1,
81,3
97
Appl
icatio
n of
Fund
sInv
estm
ents
F-2
40,
59,5
61
10,72
,067
3
5,06
1 2
7,25,
647
28,
193
2,17
,617
74
,031
15
,01,6
90
68,
17,3
18
1,64
,94,
769
4,5
8,65
6 15
,432
1,
62,8
97
1,80
,934
Cu
rrent
Ass
ets
F-3
2
25,
653
3
71,5
91
718
1,99
9 5
08
8,2
27
50,
721
2,6
8,56
5 8
,101
285
2
,814
3
,181
Less
: Cur
rent
Liab
ilities
an
d Pr
ovisi
ons
F-4
1,33
,354
3
,784
1,02
5 5
,299
3
4
,013
2
18
17,9
28
1,80
,048
3
9,08
8 1,
341
2
1,21
6 2
,718
Net c
urre
nt a
sset
s (1
,33,
352)
21,8
69
(1,0
22)
66,
292
715
(2,0
14)
290
(9
,701)
(1,2
9,32
7) 2
,29,
477
6,76
0 2
83
1,59
8 4
63
Tota
l 3
9,26
,209
10
,93,
936
34,
039
27,
91,9
39
28,
908
2,15
,603
7
4,32
1 14
,91,9
89
66,
87,9
91
1,67
,24,
246
4,6
5,41
6 15
,715
1,
64,4
95
1,81
,397
(` ‘0
00)
Parti
cula
rsSc
hedu
le
Curre
nt Ye
ar
LIFE
GRO
WTH
PL
US FU
ND 1
LIFE
GRO
WTH
PL
US FU
ND 2
LIFE
GU
ARAN
TEED
BO
ND FU
ND
- 1**
LIFE
HIG
H GR
OWTH
FU
ND 1
LIFE
HIG
H GR
OWTH
FU
ND 2
LIFE
HI
GHES
T NAV
GU
ARAN
TEE
FUND
1
LIFE
HI
GHES
T NAV
AD
VANT
AGE
FUND
1
LIFE
HI
GHES
T NAV
AD
VANT
AGE
FUND
2
LIFE
IN
FRAS
TRUC
TURE
FU
ND 1
LIFE
IN
FRAS
TRUC
TURE
FU
ND 2
LIFE
MID
CAP
FUND
1 LI
FE M
IDCA
P FU
ND 2
LI
FE M
ONEY
M
ARKE
T FUN
D 1
LIFE
MON
EY
MAR
KET F
UND
2
SFIN
ULIF
0080
9/
04/0
7LGR
W
TPLS
0112
1
ULIF
0430
1/ 01
/10LG
RW
TPLS
0212
1
ULIF
0361
6/
12/0
8LGU
AB
OND0
1121
ULIF
0072
8/
02/0
7LHI
GR
OWT0
1121
ULIF
0551
1/ 01
/10LH
IGR
OWT0
2121
ULIF
0561
2/
02/10
LHNA
VG
UA01
121
ULIF
0580
3/
09/10
LHNA
VA
DV01
121
ULIF
0590
1/ 06
/11LH
NAV
ADV0
2121
ULIF
0271
0/
06/0
8LIN
FR
AST0
1121
ULIF
0440
1/ 01
/10LIN
FR
AST0
2121
ULIF
0281
0/
06/0
8LM
ID
CAPF
0112
1
ULIF
0450
1/ 01
/10LM
IDC
APF0
2121
ULIF
0291
0/
06/0
8LM
ON
MRK
T0112
1
ULIF
0391
9/
03/0
9LM
ON
MRK
T021
21
Sour
ces o
f Fun
dsPo
licyh
older
s' Fu
nds:
Polic
yhold
er co
ntrib
ution
F-1
(4,4
4,96
3) (2
,729)
(77,6
52)
(13,
70,6
70)
(7,78
2) 13
,46,
606
9,4
2,93
8 6
6,65
4 1,
47,8
20
32,
480
(4,3
0,04
1) (3
,73,3
15)
12,8
0,95
4 (3
,923
)Re
venu
e Ac
coun
t 5
,85,
920
19,14
6 77
,652
17
,54,
348
30,
852
31,3
8,89
8 5
,47,5
96
1,35
,235
73
,085
6
9,82
6 7,
23,11
8 9
,33,
932
7,13
,167
28,
076
Tota
l 1,
40,9
57
16,4
17
- 3
,83,
678
23,
070
44,
85,5
04
14,9
0,53
4 2
,01,8
89
2,2
0,90
5 1,
02,3
06
2,9
3,07
7 5
,60,
617
19,9
4,12
1 2
4,15
3 Ap
plica
tion
of Fu
nds
Inves
tmen
tsF-
2 1,
45,17
5 16
,216
-
3,8
6,92
5 2
2,99
1 4
3,74
,962
14
,85,
311
2,0
2,49
5 2
,22,
579
1,02
,867
2
,83,
096
5,3
8,67
1 19
,88,
491
24,
619
Curre
nt A
sset
sF-
3 2
,205
2
04
- 8
,957
4
42
1,11,
190
7,73
4 3
4 8
11 3
02
13,2
43
24,
194
5,8
72
29
Less
: Cur
rent
Liab
ilities
an
d Pr
ovisi
ons
F-4
6,4
23
3
- 12
,204
3
63
648
2
,511
640
2
,485
8
63
3,2
62
2,2
48
242
4
95
Net c
urre
nt a
sset
s (4
,218
) 2
01
- (3
,247
) 79
1,
10,5
42
5,2
23
(606
) (1
,674
) (5
61)
9,9
81
21,9
46
5,6
30
(466
)To
tal
1,40
,957
16
,417
-
3,8
3,67
8 2
3,07
0 4
4,85
,504
14
,90,
534
2,0
1,889
2
,20,
905
1,02
,306
2
,93,
077
5,6
0,61
7 19
,94,
121
24,
153
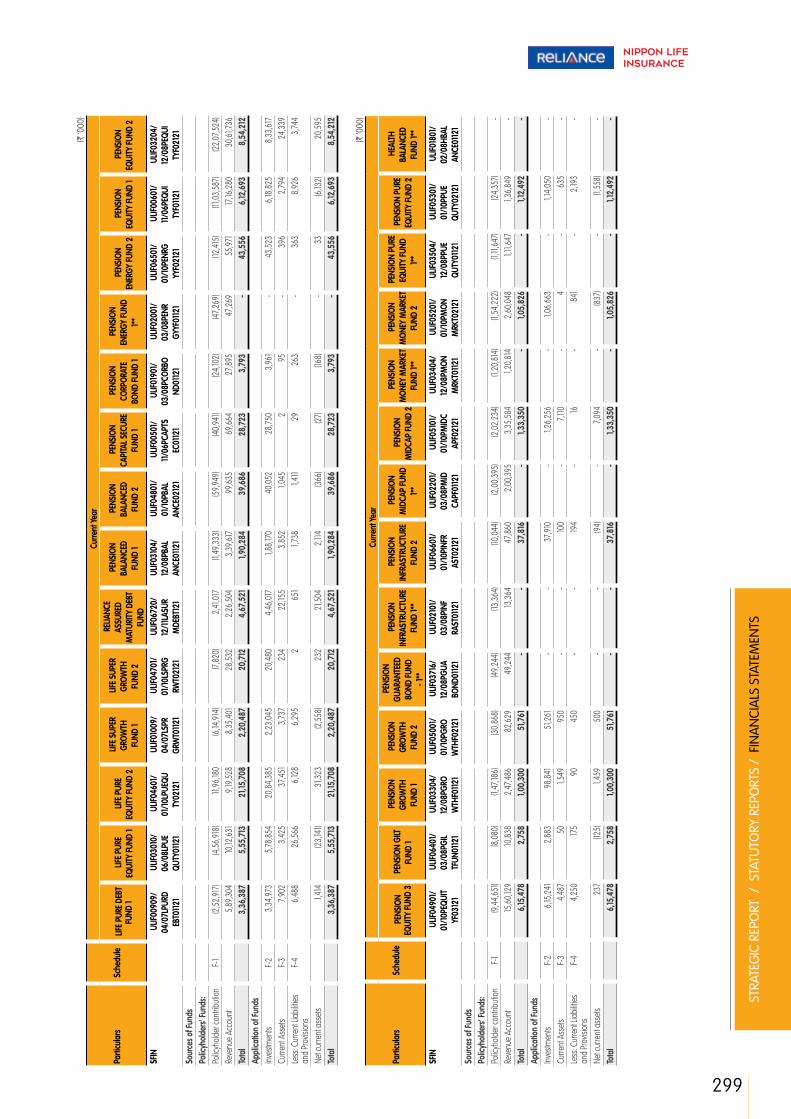
299
STRA
TEG
IC R
EPO
RT /
STA
TUTO
RY R
EPO
RTS
/ F
INA
NCI
ALS
STA
TEM
ENTS
(` ‘0
00)
Parti
cula
rsSc
hedu
le
Curre
nt Ye
ar
LIFE
PUR
E DEB
T FU
ND 1
LIFE
PUR
E EQ
UITY
FUND
1 LI
FE P
URE
EQUI
TY FU
ND 2
LIFE
SUP
ER
GROW
TH
FUND
1
LIFE
SUP
ER
GROW
TH
FUND
2
REL
IANC
E AS
SURE
D M
ATUR
ITY D
EBT
FUND
PEN
SION
BALA
NCED
FU
ND 1
PEN
SION
BALA
NCED
FU
ND 2
PEN
SION
CAPI
TAL S
ECUR
E FU
ND 1
PEN
SION
CORP
ORAT
E BO
ND FU
ND 1
PEN
SION
ENER
GY FU
ND
1**
PEN
SION
ENER
GY FU
ND 2
P
ENSIO
N EQ
UITY
FUND
1 P
ENSIO
N EQ
UITY
FUND
2
SFIN
ULIF
0090
9/
04/0
7LPU
RD
EBT0
1121
ULIF
0301
0/
06/0
8LPU
E QU
TY01
121
ULIF
0460
1/ 01
/10LP
UEQU
TY
0212
1
ULIF
0100
9/
04/0
7LSP
R GR
WT0
1121
ULIF
0470
1/ 01
/10LS
PRG
RWT0
2121
ULIF
0672
0/
12/11
LASU
R M
DEBT
121
ULIF
0310
4/
12/0
8PBA
L AN
CE01
121
ULIF
0480
1/ 01
/10PB
AL
ANCE
0212
1
ULIF
0050
1/ 11/
06PC
APTS
EC
0112
1
ULIF
0190
1/ 03
/08P
CORB
O ND
0112
1
ULIF
0200
1/ 03
/08P
ENR
GYYF
0112
1
ULIF
0650
1/ 01
/10PE
NRG
YYF0
2121
ULIF
0060
1/ 11/
06PE
QUI
TYF0
1121
ULIF
0320
4/
12/0
8PEQ
UI
TYF0
2121
So
urce
s of F
unds
Polic
yhold
ers'
Fund
s:Po
licyh
older
cont
ribut
ionF-
1 (2
,52,
917)
(4,5
6,91
8) 11
,96,
180
(6,14
,914
) (7
,820
) 2
,41,0
17
(1,4
9,33
3) (5
9,94
9) (4
0,94
1) (2
4,10
2) (4
7,269
) (1
2,41
5) (1
1,03,
587)
(22,
07,5
24)
Reve
nue
Acco
unt
5,8
9,30
4 10
,12,6
31
9,19
,528
8
,35,
401
28,
532
2,2
6,50
4 3
,39,
617
99,
635
69,
664
27,8
95
47,2
69
55,
971
17,16
,280
3
0,61
,736
Tota
l 3
,36,
387
5,5
5,71
3 2
1,15,
708
2,2
0,48
7 2
0,71
2 4
,67,
521
1,90
,284
3
9,68
6 2
8,72
3 3
,793
-
43,
556
6,12
,693
8
,54,
212
Appl
icatio
n of
Fund
sInv
estm
ents
F-2
3,3
4,97
3 5
,78,8
54
20,
84,3
85
2,2
3,04
5 2
0,48
0 4
,46,
017
1,88
,170
40,
052
28,
750
3,9
61
- 4
3,52
3 6
,18,8
25
8,3
3,61
7 Cu
rrent
Ass
ets
F-3
7,90
2 3
,425
3
7,451
3
,737
234
2
2,15
5 3
,852
1,
045
2
95
- 3
96
2,79
4 2
4,33
9 Le
ss: C
urre
nt Li
abilit
ies
and
Prov
ision
sF-
4 6
,488
2
6,56
6 6
,128
6,2
95
2
651
1,
738
1,41
1 2
9 2
63
- 3
63
8,9
26
3,74
4
Net c
urre
nt a
sset
s 1,
414
(23,
141)
31,3
23
(2,5
58)
232
2
1,504
2
,114
(366
) (2
7) (1
68)
- 3
3 (6
,132)
20,
595
Tota
l 3
,36,
387
5,5
5,71
3 2
1,15,
708
2,2
0,48
7 2
0,71
2 4
,67,
521
1,90
,284
3
9,68
6 2
8,72
3 3
,793
-
43,
556
6,12
,693
8
,54,
212
(`
‘000
)
Parti
cula
rsSc
hedu
le
Curre
nt Ye
ar
PEN
SION
EQUI
TY FU
ND 3
P
ENSIO
N GI
LT
FUND
1
PEN
SION
GROW
TH
FUND
1
PEN
SION
GROW
TH
FUND
2
PEN
SION
GUAR
ANTE
ED
BOND
FUND
- 1
**
PEN
SION
INFR
ASTR
UCTU
RE
FUND
1**
PEN
SION
INFR
ASTR
UCTU
RE
FUND
2
PEN
SION
MID
CAP
FUND
1**
PEN
SION
MID
CAP
FUND
2
PEN
SION
MON
EY M
ARKE
T FU
ND 1*
*
PEN
SION
MON
EY M
ARKE
T FU
ND 2
PEN
SION
PURE
EQ
UITY
FUND
1**
PEN
SION
PURE
EQ
UITY
FUND
2
HEA
LTH
BALA
NCED
FU
ND 1*
*
SFIN
ULIF
0490
1/ 01
/10PE
QUIT
YF03
121
ULIF
0640
1/ 03
/08P
GIL
TFUN
0112
1
ULIF
0330
4/
12/0
8PGR
O W
THF0
1121
ULIF
0500
1/ 01
/10PG
RO
WTH
F021
21
ULIF
0371
6/
12/0
8PGU
A BO
ND01
121
ULIF
0210
1/ 03
/08P
INF
RAST
0112
1
ULIF
0660
1/ 01
/10PI
NFR
AST0
2121
ULIF
0220
1/ 03
/08P
MID
CA
PF01
121
ULIF
0510
1/ 01
/10PM
IDC
APF0
2121
ULIF
0340
4/
12/0
8PM
ON
MRK
T0112
1
ULIF
0520
1/ 01
/10PM
ON
MRK
T021
21
ULIF
0350
4/
12/0
8PPU
E QU
TY01
121
ULIF
0530
1/ 01
/10PP
UE
QUTY
0212
1
ULIF
0180
1/ 02
/08H
BAL
ANCE
0112
1 So
urce
s of F
unds
Polic
yhold
ers'
Fund
s:Po
licyh
older
cont
ribut
ionF-
1 (9
,44,
651)
(8,0
80)
(1,4
7,186
) (3
0,86
8) (4
9,24
4) (1
3,36
4) (1
0,04
4) (2
,00,
395)
(2,0
2,23
4) (1
,20,
814)
(1,5
4,22
2) (1
,11,6
47)
(24,
357)
- Re
venu
e Ac
coun
t 15
,60,
129
10,8
38
2,4
7,486
8
2,62
9 4
9,24
4 13
,364
4
7,860
2
,00,
395
3,3
5,58
4 1,
20,8
14
2,6
0,04
8 1,
11,64
7 1,
36,8
49
- To
tal
6,15
,478
2
,758
1,
00,3
00
51,7
61
- -
37,
816
- 1,
33,3
50
- 1,
05,8
26
- 1,
12,4
92
- Ap
plica
tion
of Fu
nds
Inves
tmen
tsF-
2 6
,15,2
41
2,8
83
98,
841
51,2
61
- -
37,9
10
- 1,
26,2
56
- 1,
06,6
63
- 1,
14,0
50
- Cu
rrent
Ass
ets
F-3
4,4
87
50
1,54
9 9
50
- -
100
- 7,
110
- 4
-
635
-
Less
: Cur
rent
Liab
ilities
an
d Pr
ovisi
ons
F-4
4,2
50
175
90
450
-
- 19
4 -
16
- 8
41
- 2
,193
-
Net c
urre
nt a
sset
s 2
37
(125
) 1,
459
500
-
- (9
4) -
7,09
4 -
(837
) -
(1,5
58)
- To
tal
6,15
,478
2
,758
1,
00,3
00
51,7
61
- -
37,
816
- 1,
33,3
50
- 1,
05,8
26
- 1,
12,4
92
-
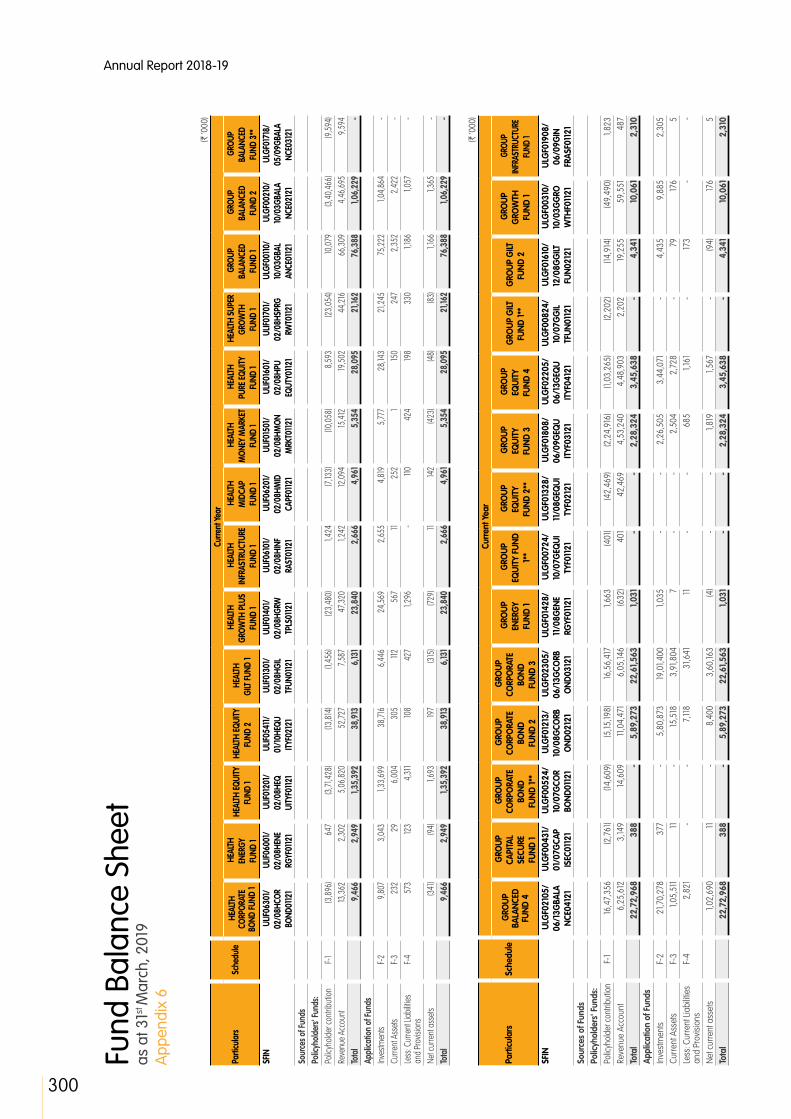
Annual Report 2018-19
300
Fund
Bal
ance
She
et
as a
t 31st
Mar
ch, 2
019
App
endi
x 6
(` ‘0
00)
Parti
cula
rsSc
hedu
le
Curre
nt Ye
ar H
EALT
H CO
RPOR
ATE
BOND
FUND
1
HEA
LTH
EN
ERGY
FU
ND 1
HEA
LTH
EQUI
TY
FUND
1 H
EALT
H EQ
UITY
FU
ND 2
H
EALT
H
GILT
FUND
1
HEA
LTH
GROW
TH P
LUS
FUND
1
HEA
LTH
INFR
ASTR
UCTU
RE
FUND
1
HEA
LTH
MID
CAP
FUND
1
HEA
LTH
MON
EY M
ARKE
T FU
ND 1
HEA
LTH
PU
RE EQ
UITY
FU
ND 1
HEA
LTH
SUPE
R GR
OWTH
FU
ND 1
GRO
UP
BALA
NCED
FU
ND 1
GRO
UP
BALA
NCED
FU
ND 2
GRO
UP
BALA
NCED
FU
ND 3
** SF
IN U
LIF06
301/
02/0
8HCO
R BO
ND01
121
ULIF
0600
1/ 02
/08H
ENE
RGYF
0112
1
ULIF
0120
1/ 02
/08H
EQ
UITY
F0112
1
ULIF
0541
1/ 01
/10HE
QU
ITYF0
2121
ULIF
0130
1/ 02
/08H
GIL
TFUN
0112
1
ULIF
0140
1/ 02
/08H
GRW
TP
LS01
121
ULIF
0610
1/ 02
/08H
INF
RAST
0112
1
ULIF
0620
1/ 02
/08H
MID
CA
PF01
121
ULIF
0150
1/ 02
/08H
MON
M
RKT0
1121
ULIF
0160
1/ 02
/08H
PU
EQUT
Y0112
1
ULIF
0170
1/ 02
/08H
SPRG
RW
T0112
1
ULG
F001
10/
10/0
3GBA
L AN
CE01
121
ULG
F002
10/
10/0
3GBA
LA
NCE0
2121
ULG
F017
18/
05/0
9GBA
LA
NCE0
3121
So
urce
s of F
unds
Polic
yhold
ers'
Fund
s:Po
licyh
older
cont
ribut
ionF-
1 (3
,896
) 6
47
(3,71
,428
) (1
3,81
4) (1
,456
) (2
3,48
0) 1,
424
(7,13
3) (1
0,05
8) 8
,593
(2
3,05
4) 10
,079
(3
,40,
466)
(9,5
94)
Reve
nue
Acco
unt
13,3
62
2,3
02
5,0
6,82
0 5
2,72
7 7,
587
47,3
20
1,24
2 12
,094
15
,412
19
,502
4
4,21
6 6
6,30
9 4
,46,
695
9,5
94
Tota
l 9
,466
2
,949
1,
35,3
92
38,
913
6,13
1 2
3,84
0 2
,666
4
,961
5
,354
2
8,09
5 2
1,162
7
6,38
8 1,
06,2
29
- Ap
plica
tion
of Fu
nds
Inves
tmen
tsF-
2 9
,807
3
,043
1,
33,6
99
38,
716
6,4
46
24,
569
2,6
55
4,8
19
5,77
7 2
8,14
3 2
1,245
75
,222
1,
04,8
64
- Cu
rrent
Ass
ets
F-3
232
2
9 6
,004
3
05
112
567
11
2
52
1 15
0 2
47
2,3
52
2,4
22
- Le
ss: C
urre
nt Li
abilit
ies
and
Prov
ision
sF-
4 5
73
123
4,3
11 10
8 4
27
1,29
6 -
110
424
19
8 3
30
1,18
6 1,
057
-
Net c
urre
nt a
sset
s (3
41)
(94)
1,69
3 19
7 (3
15)
(729
) 11
14
2 (4
23)
(48)
(83)
1,16
6 1,
365
- To
tal
9,4
66
2,9
49
1,35
,392
3
8,91
3 6
,131
23,
840
2,6
66
4,9
61
5,3
54
28,
095
21,1
62
76,
388
1,06
,229
-
(`
‘000
)
Parti
cula
rsSc
hedu
le
Curre
nt Y
ear
GRO
UP
BALA
NCED
FU
ND 4
GRO
UP
CAPI
TAL
SECU
RE
FUND
1
GRO
UP
CORP
ORA
TE
BOND
FU
ND 1*
*
GRO
UP
CORP
ORA
TE
BOND
FU
ND 2
GRO
UP
CORP
ORA
TE
BOND
FU
ND 3
GRO
UP
ENER
GY
FUND
1
GRO
UP
EQUI
TY F
UND
1**
GRO
UP
EQUI
TY
FUND
2**
GRO
UP
EQUI
TY
FUND
3
GRO
UP
EQUI
TY
FUND
4
GRO
UP G
ILT
FUND
1**
GRO
UP G
ILT
FUND
2
GRO
UP
GRO
WTH
FU
ND 1
GRO
UP
INFR
ASTR
UCTU
RE
FUND
1
SFIN
ULG
F021
05/
06/1
3GBA
LA
NCE0
4121
ULG
F004
31/
01/0
7GCA
P IS
EC01
121
ULG
F005
24/
10/0
7GCO
R BO
ND01
121
ULG
F012
13/
10/0
8GCO
RB
OND
0212
1
ULG
F023
05/
06/1
3GCO
RB
OND
0312
1
ULG
F014
28/
11/0
8GEN
E RG
YF01
121
ULG
F007
24/
10/0
7GEQ
UI
TYF0
1121
ULG
F013
28/
11/0
8GEQ
UI
TYF0
2121
ULG
F018
08/
06/0
9GEQ
U IT
YF03
121
ULG
F022
05/
06/1
3GEQ
U IT
YF04
121
ULG
F008
24/
10/0
7GG
IL TF
UN01
121
ULG
F016
10/
12/0
8GG
ILT
FUN0
2121
ULG
F003
10/
10/0
3GG
RO
WTH
F011
21
ULG
F019
08/
06/0
9GIN
FR
ASF0
1121
So
urce
s of
Fun
dsPo
licyh
olde
rs' F
unds
:Po
licyh
olde
r con
tribu
tion
F-1
16,4
7,35
6 (2
,761
) (1
4,60
9) (5
,15,19
8) 16
,56,
417
1,66
3 (4
01)
(42,
469)
(2,2
4,91
6) (1
,03,
265)
(2,2
02)
(14,
914)
(49,
490)
1,82
3 Re
venu
e Ac
coun
t 6
,25,
612
3,14
9 14
,609
11
,04,
471
6,0
5,14
6 (6
32)
401
4
2,46
9 4
,53,
240
4,4
8,90
3 2
,202
19
,255
5
9,55
1 4
87
Tota
l 2
2,72
,968
3
88
- 5
,89,
273
22,
61,5
63
1,03
1 -
- 2
,28,
324
3,4
5,63
8 -
4,3
41
10,0
61
2,3
10
Appl
icatio
n of
Fun
dsIn
vest
men
tsF-
2 2
1,70,
278
377
-
5,8
0,87
3 19
,01,4
00
1,03
5 -
- 2
,26,
505
3,4
4,07
1 -
4,4
35
9,8
85
2,3
05
Curre
nt A
sset
sF-
3 1,
05,5
11
11
- 15
,518
3
,91,8
04
7
- -
2,5
04
2,7
28
- 7
9 17
6 5
Le
ss: C
urre
nt Li
abilit
ies
and
Prov
ision
sF-
4 2
,821
-
- 7
,118
31,6
41
11
- -
685
1,
161
- 17
3 -
-
Net c
urre
nt a
sset
s 1,
02,6
90
11
- 8
,400
3
,60,
163
(4)
- -
1,81
9 1,
567
- (9
4) 17
6 5
To
tal
22,
72,9
68
388
-
5,8
9,27
3 2
2,61
,563
1,
031
- -
2,2
8,32
4 3
,45,
638
- 4
,341
10
,061
2
,310
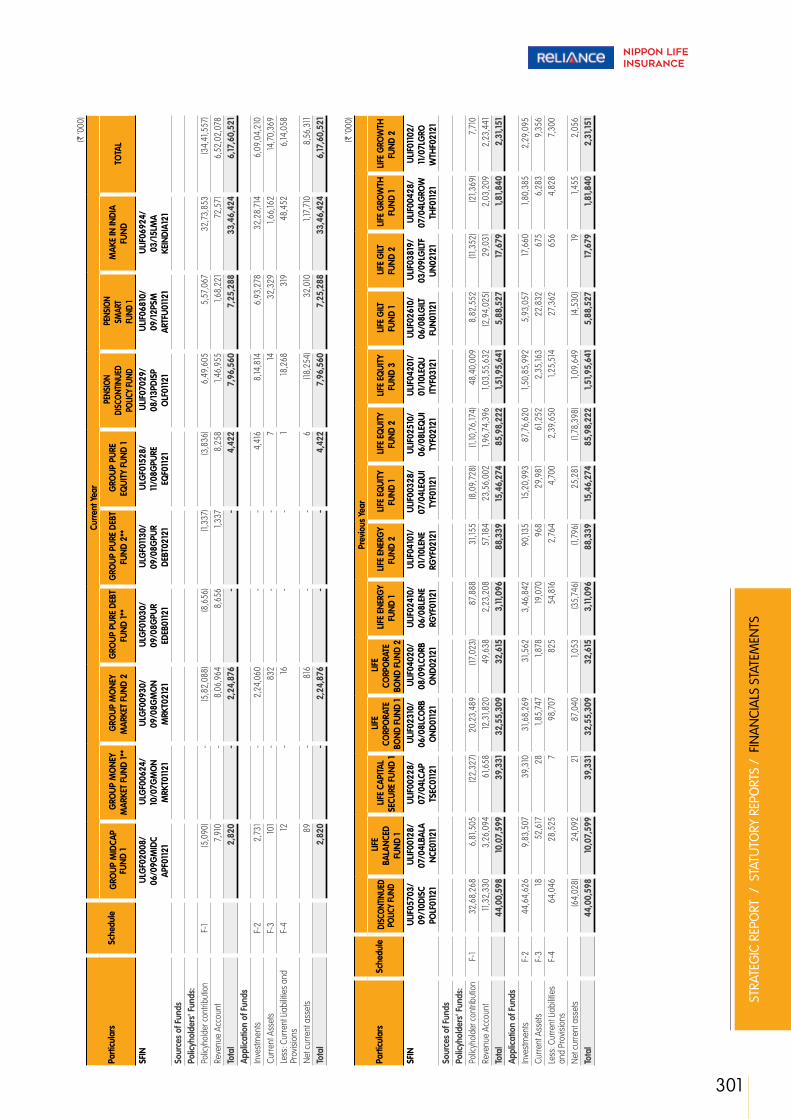
301
STRA
TEG
IC R
EPO
RT /
STA
TUTO
RY R
EPO
RTS
/ F
INA
NCI
ALS
STA
TEM
ENTS
(` ‘0
00)
Parti
cula
rsSc
hedu
le
Curre
nt Y
ear
GRO
UP M
IDCA
P FU
ND 1
GRO
UP M
ONE
Y M
ARKE
T FU
ND 1*
* G
ROUP
MO
NEY
MAR
KET
FUND
2
GRO
UP P
URE
DEBT
FU
ND 1*
* G
ROUP
PUR
E DE
BT
FUND
2**
G
ROUP
PUR
E EQ
UITY
FUN
D 1
PEN
SION
DISC
ONTIN
UED
POLIC
Y FU
ND
PEN
SION
SMAR
T FU
ND 1
MAK
E IN
INDI
A FU
ND
TO
TAL
SFIN
ULG
F020
08/
06/0
9GM
IDC
APF0
1121
ULG
F006
24/
10/0
7GM
ON
MRK
T011
21
ULG
F009
30/
09/0
8GM
ON
MRK
T021
21
ULG
F010
30/
09/0
8GPU
R ED
EB01
121
ULG
F011
30/
09/0
8GPU
R DE
BT02
121
ULG
F015
28/
11/0
8GPU
RE
EQF0
1121
ULIF
0702
9/
08/1
3PDI
SP
OLF
0112
1
ULIF
0681
0/
09/1
2PSM
AR
TFU0
1121
ULIF
0692
4/
03/1
5LM
A KE
INDI
A121
So
urce
s of
Fun
dsPo
licyh
olde
rs' F
unds
:Po
licyh
olde
r con
tribu
tion
F-1
(5,0
90)
- (5
,82,
088)
(8,6
56)
(1,3
37)
(3,8
36)
6,4
9,60
5 5
,57,
067
32,
73,8
53
(34,
41,5
57)
Reve
nue
Acco
unt
7,9
10
- 8
,06,
964
8,6
56
1,33
7 8
,258
1,
46,9
55
1,68
,221
7
2,57
1 6
,52,
02,0
78
Tota
l 2
,820
-
2,2
4,87
6 -
- 4
,422
7
,96,
560
7,2
5,28
8 3
3,46
,424
6
,17,6
0,52
1 Ap
plica
tion
of F
unds
Inve
stm
ents
F-2
2,7
31
- 2
,24,
060
- -
4,4
16
8,14
,814
6
,93,
278
32,
28,7
14
6,0
9,04
,210
Cu
rrent
Ass
ets
F-3
101
- 8
32
- -
7
14
32,
329
1,66
,162
14,7
0,36
9 Le
ss: C
urre
nt Li
abilit
ies
and
Prov
ision
sF-
4 12
-
16
- -
1 18
,268
3
19
48,
452
6,14
,058
Net c
urre
nt a
sset
s 8
9 -
816
-
- 6
(1
8,25
4) 3
2,01
0 1,
17,7
10
8,5
6,31
1 To
tal
2,8
20
- 2
,24,
876
- -
4,4
22
7,9
6,56
0 7
,25,
288
33,
46,4
24
6,17
,60,
521
(`
‘000
)
Parti
cula
rsSc
hedu
le
Prev
ious
Yea
r
DISC
ONTIN
UED
POLIC
Y FU
ND
LIFE
BA
LANC
ED
FUND
1
LIFE
CAP
ITAL
SECU
RE F
UND
1
LIFE
CO
RPO
RATE
BO
ND F
UND
1
LIFE
CO
RPO
RATE
BO
ND F
UND
2
LIFE
ENE
RGY
FUND
1 L
IFE E
NERG
Y FU
ND 2
L
IFE E
QUI
TY
FUND
1 L
IFE E
QUI
TY
FUND
2
LIFE
EQ
UITY
FU
ND 3
L
IFE G
ILT
FUND
1 L
IFE G
ILT
FUND
2
LIFE
GRO
WTH
FU
ND 1
LIFE
GRO
WTH
FU
ND 2
SFIN
ULIF
0570
3/
09/1
0DIS
C PO
LF01
121
ULIF
0012
8/
07/0
4LBA
LA
NCE0
1121
ULIF
0022
8/
07/0
4LCA
P TS
EC01
121
ULIF
0231
0/
06/0
8LCO
RB
OND
0112
1
ULIF
0402
0/
08/0
9LCO
RB
OND
0212
1
ULIF
0241
0/
06/0
8LEN
E RG
YF01
121
ULIF
0410
1/
01/1
0LEN
E RG
YF02
121
ULIF
0032
8/
07/0
4LEQ
UI
TYF0
1121
ULIF
0251
0/
06/0
8LEQ
UI
TYF0
2121
ULIF
0420
1/
01/1
0LEQ
U IT
YF03
121
ULIF
0261
0/
06/0
8LG
ILT
FUN0
1121
ULIF
0381
9/
03/0
9LG
ILTF
UN02
121
ULIF
0042
8/
07/0
4LG
ROW
TH
F011
21
ULIF
0110
2/
11/0
7LG
RO
WTH
F021
21
Sour
ces
of F
unds
Polic
yhol
ders
' Fun
ds:
Polic
yhol
der c
ontri
butio
nF-
1 3
2,68
,268
6
,81,5
05
(22,
327)
20,
23,4
89
(17,
023)
87,
888
31,1
55
(8,0
9,72
8) (1
,10,7
6,17
4) 4
8,40
,009
8
,82,
552
(11,3
52)
(21,3
69)
7,7
10
Reve
nue
Acco
unt
11,3
2,33
0 3
,26,
094
61,6
58
12,3
1,820
4
9,63
8 2
,23,
208
57,
184
23,
56,0
02
1,96
,74,
396
1,03
,55,
632
(2,9
4,02
5) 2
9,03
1 2
,03,
209
2,2
3,44
1 To
tal
44,
00,5
98
10,0
7,59
9 3
9,33
1 3
2,55
,309
3
2,61
5 3
,11,0
96
88,
339
15,4
6,27
4 8
5,98
,222
1,
51,9
5,64
1 5
,88,
527
17,6
79
1,81
,840
2
,31,1
51
Appl
icatio
n of
Fun
dsIn
vest
men
tsF-
2 4
4,64
,626
9
,83,
507
39,
310
31,6
8,26
9 3
1,562
3
,46,
842
90,
135
15,2
0,99
3 8
7,76
,620
1,
50,8
5,99
2 5
,93,
057
17,6
60
1,80
,385
2
,29,
095
Curre
nt A
sset
sF-
3 18
5
2,61
7 2
8 1,
85,7
47
1,87
8 19
,070
9
68
29,
981
61,2
52
2,3
5,16
3 2
2,83
2 6
75
6,2
83
9,3
56
Less
: Cur
rent
Liab
ilitie
s an
d Pr
ovisi
ons
F-4
64,
046
28,
525
7
98,
707
825
5
4,81
6 2
,764
4
,700
2
,39,
650
1,25
,514
2
7,36
2 6
56
4,8
28
7,3
00
Net c
urre
nt a
sset
s (6
4,02
8) 2
4,09
2 2
1 8
7,04
0 1,
053
(35,
746)
(1,7
96)
25,
281
(1,7
8,39
8) 1,
09,6
49
(4,5
30)
19
1,45
5 2
,056
To
tal
44,
00,5
98
10,0
7,59
9 3
9,33
1 3
2,55
,309
3
2,61
5 3
,11,0
96
88,
339
15,4
6,27
4 8
5,98
,222
1,
51,9
5,64
1 5
,88,
527
17,6
79
1,81
,840
2
,31,1
51
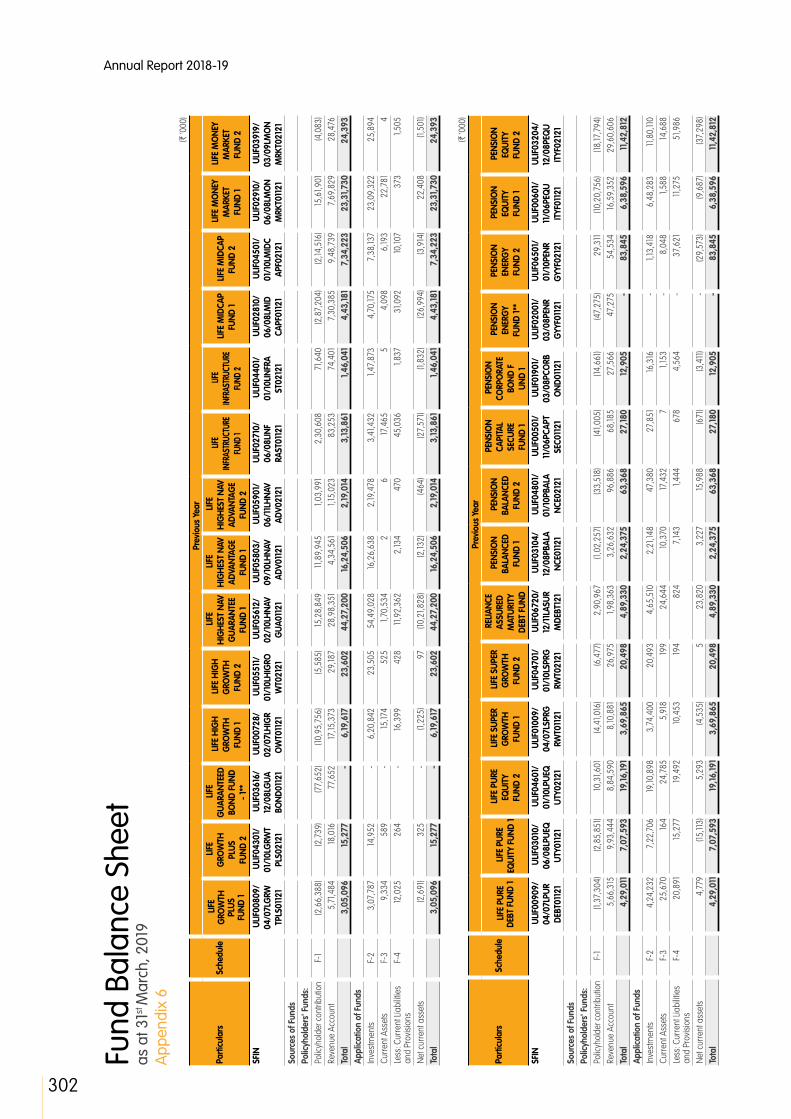
Annual Report 2018-19
302
Fund
Bal
ance
She
et
as a
t 31st
Mar
ch, 2
019
App
endi
x 6
(` ‘0
00)
Parti
cula
rsSc
hedu
le
Prev
ious
Yea
r
LIFE
G
ROW
TH
PLUS
FU
ND 1
LIFE
G
ROW
TH
PLUS
FU
ND 2
LIFE
G
UARA
NTEE
D BO
ND F
UND
- 1**
LIFE
HIG
H
GRO
WTH
FU
ND 1
LIFE
HIG
H
GRO
WTH
FU
ND 2
LIFE
H
IGH
EST
NAV
GUA
RANT
EE
FUND
1
LIFE
H
IGH
EST
NAV
ADVA
NTAG
E FU
ND 1
LIFE
H
IGH
EST
NAV
ADVA
NTAG
E FU
ND 2
LIFE
IN
FRAS
TRUC
TURE
FU
ND 1
LIFE
IN
FRAS
TRUC
TURE
FU
ND 2
LIFE
MID
CAP
FUND
1 L
IFE M
IDCA
P FU
ND 2
LIFE
MO
NEY
MAR
KET
FUND
1
LIFE
MO
NEY
MAR
KET
FUND
2
SFIN
ULIF
0080
9/
04/0
7LG
RW
TPLS
0112
1
ULIF
0430
1/
01/1
0LG
RWT
PLS0
2121
ULIF
0361
6/
12/0
8LG
UA
BOND
0112
1
ULIF
0072
8/
02/0
7LH
IGR
OW
T011
21
ULIF
0551
1/
01/1
0LH
IGRO
W
T021
21
ULIF
0561
2/
02/1
0LH
NAV
GUA
0112
1
ULIF
0580
3/
09/1
0LH
NAV
ADV0
1121
ULIF
0590
1/
06/1
1LH
NAV
ADV0
2121
ULIF
0271
0/
06/0
8LIN
F RA
ST01
121
ULIF
0440
1/
01/1
0LIN
FRA
ST02
121
ULIF
0281
0/
06/0
8LM
ID
CAPF
0112
1
ULIF
0450
1/
01/1
0LM
IDC
APF0
2121
ULIF
0291
0/
06/0
8LM
ON
MRK
T011
21
ULIF
0391
9/
03/0
9LM
ON
MRK
T021
21
Sour
ces
of F
unds
Polic
yhol
ders
' Fun
ds:
Polic
yhol
der c
ontri
butio
nF-
1 (2
,66,
388)
(2,7
39)
(77,
652)
(10,
95,7
56)
(5,5
85)
15,2
8,84
9 11
,89,
945
1,03
,991
2
,30,
608
71,6
40
(2,8
7,20
4) (2
,14,5
16)
15,6
1,901
(4
,083
)Re
venu
e Ac
coun
t 5
,71,4
84
18,0
16
77,
652
17,15
,373
2
9,18
7 2
8,98
,351
4
,34,
561
1,15
,023
8
3,25
3 7
4,40
1 7
,30,
385
9,4
8,73
9 7
,69,
829
28,
476
Tota
l 3
,05,
096
15,2
77
- 6
,19,6
17
23,
602
44,
27,2
00
16,2
4,50
6 2
,19,0
14
3,13
,861
1,
46,0
41
4,4
3,18
1 7
,34,
223
23,
31,7
30
24,
393
Appl
icatio
n of
Fun
dsIn
vest
men
tsF-
2 3
,07,
787
14,9
52
- 6
,20,
842
23,
505
54,
49,0
28
16,2
6,63
8 2
,19,4
78
3,4
1,432
1,
47,8
73
4,7
0,17
5 7
,38,
137
23,
09,3
22
25,
894
Curre
nt A
sset
sF-
3 9
,334
5
89
- 15
,174
525
1,
70,5
34
2
6
17,4
65
5
4,0
98
6,19
3 2
2,78
1 4
Le
ss: C
urre
nt Li
abilit
ies
and
Prov
ision
sF-
4 12
,025
2
64
- 16
,399
4
28
11,9
2,36
2 2
,134
470
4
5,03
6 1,
837
31,0
92
10,10
7 3
73
1,50
5
Net c
urre
nt a
sset
s (2
,691
) 3
25
- (1
,225
) 9
7 (1
0,21
,828
) (2
,132)
(464
) (2
7,57
1) (1
,832
) (2
6,99
4) (3
,914
) 2
2,40
8 (1
,501
)To
tal
3,0
5,09
6 15
,277
-
6,19
,617
2
3,60
2 4
4,27
,200
16
,24,
506
2,19
,014
3
,13,8
61
1,46
,041
4
,43,
181
7,3
4,22
3 2
3,31
,730
2
4,39
3
(` ‘0
00)
Parti
cula
rsSc
hedu
le
Prev
ious
Yea
r
LIFE
PUR
E DE
BT F
UND
1 L
IFE P
URE
EQUI
TY F
UND
1
LIFE
PUR
E EQ
UITY
FU
ND 2
LIFE
SUP
ER
GRO
WTH
FU
ND 1
LIFE
SUP
ER
GRO
WTH
FU
ND 2
REL
IANC
E AS
SURE
D M
ATUR
ITY
DEBT
FUN
D
PEN
SIO
N BA
LANC
ED
FUND
1
PEN
SIO
N BA
LANC
ED
FUND
2
PEN
SIO
N CA
PITA
L SE
CURE
FU
ND 1
PEN
SIO
N CO
RPO
RATE
BO
ND F
UND
1
PEN
SIO
N EN
ERG
Y FU
ND 1*
*
PEN
SIO
N EN
ERG
Y FU
ND 2
PEN
SIO
N EQ
UITY
FU
ND 1
PEN
SIO
N EQ
UITY
FU
ND 2
SFIN
ULIF
0090
9/
04/0
7LPU
R DE
BT01
121
ULIF
0301
0/
06/0
8LPU
EQ
UTY0
1121
ULIF
0460
1/
01/1
0LPU
EQ
UTY0
2121
ULIF
0100
9/
04/0
7LSP
RG
RWT0
1121
ULIF
0470
1/
01/1
0LSP
RG
RWT0
2121
ULIF
0672
0/
12/1
1LAS
UR
MDE
BT12
1
ULIF
0310
4/
12/0
8PBA
LA
NCE0
1121
ULIF
0480
1/
01/1
0PBA
LA
NCE0
2121
ULIF
0050
1/
11/0
6PCA
PT
SEC0
1121
ULIF
0190
1/
03/0
8PCO
RB
OND
0112
1
ULIF
0200
1/
03/0
8PEN
R G
YYF0
1121
ULIF
0650
1/
01/1
0PEN
R G
YYF0
2121
ULIF
0060
1/
11/0
6PEQ
U IT
YF01
121
ULIF
0320
4/
12/0
8PEQ
U IT
YF02
121
Sour
ces
of F
unds
Polic
yhol
ders
' Fun
ds:
Polic
yhol
der c
ontri
butio
nF-
1 (1
,37,
304)
(2,8
5,85
1) 10
,31,6
01
(4,4
1,016
) (6
,477
) 2
,90,
967
(1,0
2,25
7) (3
3,51
8) (4
1,005
) (1
4,66
1) (4
7,27
5) 2
9,31
1 (1
0,20
,756
) (1
8,17
,794
)Re
venu
e Ac
coun
t 5
,66,
315
9,9
3,44
4 8
,84,
590
8,10
,881
2
6,97
5 1,
98,3
63
3,2
6,63
2 9
6,88
6 6
8,18
5 2
7,56
6 4
7,27
5 5
4,53
4 16
,59,
352
29,
60,6
06
Tota
l 4
,29,
011
7,0
7,59
3 19
,16,19
1 3
,69,
865
20,
498
4,8
9,33
0 2
,24,
375
63,
368
27,
180
12,9
05
- 8
3,84
5 6
,38,
596
11,4
2,81
2 Ap
plica
tion
of F
unds
Inve
stm
ents
F-2
4,2
4,23
2 7
,22,
706
19,10
,898
3
,74,
400
20,
493
4,6
5,51
0 2
,21,1
48
47,
380
27,
851
16,3
16
- 1,
13,4
18
6,4
8,28
3 11
,80,
110
Curre
nt A
sset
sF-
3 2
5,67
0 16
4 2
4,78
5 5
,918
19
9 2
4,64
4 10
,370
17
,432
7
1,
153
- 8
,048
1,
588
14,6
88
Less
: Cur
rent
Liab
ilitie
s an
d Pr
ovisi
ons
F-4
20,
891
15,2
77
19,4
92
10,4
53
194
824
7
,143
1,44
4 6
78
4,5
64
- 3
7,62
1 11
,275
5
1,986
Net c
urre
nt a
sset
s 4
,779
(1
5,11
3) 5
,293
(4
,535
) 5
2
3,82
0 3
,227
15
,988
(6
71)
(3,4
11)
- (2
9,57
3) (9
,687
) (3
7,29
8)To
tal
4,2
9,01
1 7
,07,
593
19,16
,191
3,6
9,86
5 2
0,49
8 4
,89,
330
2,2
4,37
5 6
3,36
8 2
7,18
0 12
,905
-
83,
845
6,3
8,59
6 11
,42,
812

303
STRA
TEG
IC R
EPO
RT /
STA
TUTO
RY R
EPO
RTS
/ F
INA
NCI
ALS
STA
TEM
ENTS
(` ‘0
00)
Parti
cula
rsSc
hedu
le
Prev
ious
Yea
r
PEN
SIO
N EQ
UITY
FU
ND 3
PEN
SIO
N G
ILT
FUND
1
PEN
SIO
N G
ROW
TH
FUND
1
PEN
SIO
N G
ROW
TH
FUND
2
PEN
SIO
N G
UARA
NTEE
D BO
ND F
UND
- 1**
PEN
SION
INFR
ASTR
UCTU
RE
FUND
1**
PEN
SION
INFR
ASTR
UCTU
RE
FUND
2
PEN
SIO
N M
IDCA
P FU
ND
1**
PEN
SIO
N M
IDCA
P FU
ND 2
PEN
SIO
N M
ONE
Y M
ARKE
T FU
ND
1**
PEN
SIO
N M
ONE
Y M
ARKE
T FU
ND 2
PEN
SIO
N PU
RE E
QUI
TY
FUND
1**
PEN
SIO
N PU
RE E
QUI
TY
FUND
2
HEA
LTH
BA
LANC
ED
FUND
1**
SFIN
ULIF
0490
1/
01/1
0PEQ
U IT
YF03
121
ULIF
0640
1/
03/0
8PG
ILT
FUN0
1121
ULIF
0330
4/
12/0
8PG
RO
WTH
F011
21
ULIF
0500
1/
01/1
0PG
RO
WTH
F021
21
ULIF
0371
6/
12/0
8PG
UA
BOND
0112
1
ULIF
0210
1/
03/0
8PIN
F RA
ST01
121
ULIF
0660
1/
01/1
0PIN
FR
AST0
2121
ULIF
0220
1/
03/0
8PM
ID
CAPF
0112
1
ULIF
0510
1/
01/1
0PM
IDC
APF0
2121
ULIF
0340
4/
12/0
8PM
ON
MRK
T011
21
ULIF
0520
1/
01/1
0PM
ON
MRK
T021
21
ULIF
0350
4/
12/0
8PPU
E Q
UTY0
1121
ULIF
0530
1/
01/1
0PPU
E Q
UTY0
2121
ULIF
0180
1/
02/0
8HBA
LA
NCE0
1121
So
urce
s of
Fun
dsPo
licyh
olde
rs' F
unds
:Po
licyh
olde
r con
tribu
tion
F-1
(8,2
7,22
2) (3
,932
) (1
,13,8
50)
(25,
146)
(49,
244)
(13,
378)
29,
314
(2,0
0,40
0) (1
,18,0
58)
(1,2
0,81
7) (1
,39,
459)
(1,11
,650
) 5
08
- Re
venu
e Ac
coun
t 14
,92,
013
10,5
33
2,4
0,12
2 7
8,66
9 4
9,24
4 13
,378
4
8,98
1 2
,00,
400
3,3
7,28
1 1,
20,8
17
2,6
2,10
5 1,
11,6
50
1,32
,264
-
Tota
l 6
,64,
791
6,6
01
1,26
,272
5
3,52
3 -
- 7
8,29
5 -
2,19
,223
-
1,22
,646
-
1,32
,772
-
Appl
icatio
n of
Fun
dsIn
vest
men
tsF-
2 6
,45,
094
8,7
51
1,25
,338
5
3,19
8 -
- 1,
02,3
11
- 2
,38,
741
- 1,
42,8
55
- 1,
35,11
2 -
Curre
nt A
sset
sF-
3 19
,993
8
35
4,3
27
1,87
3 -
- 5
,298
-
2,0
40
- 17
-
37
- Le
ss: C
urre
nt Li
abilit
ies
and
Prov
ision
sF-
4 2
96
2,9
85
3,3
93
1,54
8 -
- 2
9,31
4 -
21,5
58
- 2
0,22
6 -
2,3
77
-
Net c
urre
nt a
sset
s 19
,697
(2
,150)
934
3
25
- -
(24,
016)
- (1
9,51
8) -
(20,
209)
- (2
,340
) -
Tota
l 6
,64,
791
6,6
01
1,26
,272
5
3,52
3 -
- 7
8,29
5 -
2,19
,223
-
1,22
,646
-
1,32
,772
-
(`
‘000
)
Parti
cula
rsSc
hedu
le
Prev
ious
Yea
r
HEA
LTH
CO
RPO
RATE
BO
ND F
UND
1
HEA
LTH
EN
ERG
Y FU
ND 1
HEA
LTH
EQ
UITY
FU
ND 1
HEA
LTH
EQ
UITY
FU
ND 2
HEA
LTH
GILT
FU
ND 1
HEA
LTH
G
ROW
TH
PLUS
FUN
D 1
HEA
LTH
INFR
ASTR
UCTU
RE
FUND
1
HEA
LTH
M
IDCA
P FU
ND 1
HEA
LTH
M
ONE
Y M
ARKE
T FU
ND 1
HEA
LTH
PU
RE E
QUI
TY
FUND
1
HEA
LTH
SU
PER
GRO
WTH
FU
ND 1
GRO
UP
BALA
NCED
FU
ND 1
GRO
UP
BALA
NCED
FU
ND 2
GRO
UP
BALA
NCED
FU
ND 3
**
SFIN
ULIF
0630
1/
02/0
8HCO
RB
OND
0112
1
ULIF
0600
1/
02/0
8HEN
ER
GYF
0112
1
ULIF
0120
1/
02/0
8HEQ
U IT
YF01
121
ULIF
0541
1/
01/1
0HEQ
UI
TYF0
2121
ULIF
0130
1/
02/0
8HG
ILT
FUN0
1121
ULIF
0140
1/
02/0
8HG
RW
TPLS
0112
1
ULIF
0610
1/
02/0
8HIN
FR
AST0
1121
ULIF
0620
1/
02/0
8HM
ID
CAPF
0112
1
ULIF
0150
1/
02/0
8HM
ON
MRK
T011
21
ULIF
0160
1/
02/0
8HPU
E Q
UTY0
1121
ULIF
0170
1/
02/0
8HSP
R G
RWT0
1121
ULG
F001
10/
10/0
3GBA
L AN
CE01
121
ULG
F002
10/
10/0
3GBA
LA
NCE0
2121
ULG
F017
18/
05/0
9GBA
LA
NCE0
3121
So
urce
s of
Fun
dsPo
licyh
olde
rs' F
unds
:Po
licyh
olde
r con
tribu
tion
F-1
3,2
99
1,76
2 (2
,15,2
36)
(12,
283)
4,0
15
1,86
8 2
,085
(5
,214
) (5
,210
) 11
,378
(7
,271
) 14
,120
(2,4
9,51
9) (9
,594
)Re
venu
e Ac
coun
t 12
,763
2
,247
4
,88,
597
49,
085
7,0
06
45,
420
1,35
8 12
,336
15
,527
18
,481
4
2,55
9 6
1,451
4
,36,
614
9,5
94
Tota
l 16
,062
4
,009
2
,73,
361
36,
802
11,0
21
47,
288
3,4
43
7,12
2 10
,317
2
9,85
9 3
5,28
8 7
5,57
1 1,
87,0
95
- Ap
plica
tion
of F
unds
Inve
stm
ents
F-2
15,9
15
4,0
61
3,0
0,34
4 3
6,81
5 11
,319
4
8,94
1 3
,498
7
,625
11
,220
3
0,06
4 3
7,75
5 7
4,34
9 1,
83,5
99
- Cu
rrent
Ass
ets
F-3
912
5
4 4
9 15
0 4
42
1,57
3 2
8
0 5
6
1 8
25
3,0
93
9,0
33
- Le
ss: C
urre
nt Li
abilit
ies
and
Prov
ision
sF-
4 7
65
106
27,
032
163
740
3
,226
5
7 5
83
908
2
66
3,2
92
1,87
1 5
,537
-
Net c
urre
nt a
sset
s 14
7 (5
2) (2
6,98
3) (1
3) (2
98)
(1,6
53)
(55)
(503
) (9
03)
(205
) (2
,467
) 1,
222
3,4
96
- To
tal
16,0
62
4,0
09
2,7
3,36
1 3
6,80
2 11
,021
4
7,28
8 3
,443
7
,122
10,3
17
29,
859
35,
288
75,
571
1,87
,095
-

Annual Report 2018-19
304
Fund
Bal
ance
She
et
as a
t 31st
Mar
ch, 2
019
App
endi
x 6
(` ‘0
00)
Parti
cula
rsSc
hedu
le
Prev
ious
Yea
r
GRO
UP
BALA
NCED
FU
ND 4
GRO
UP
CAPI
TAL
SECU
RE
FUND
1
GRO
UP
CORP
ORA
TE
BOND
FUN
D 1*
*
GRO
UP
CORP
ORA
TE
BOND
FU
ND 2
GRO
UP
CORP
ORA
TE
BOND
FU
ND 3
GRO
UP
ENER
GY
FUND
1
GRO
UP
EQUI
TY F
UND
1**
GRO
UP
EQUI
TY F
UND
2**
GRO
UP
EQUI
TY
FUND
3
GRO
UP
EQUI
TY
FUND
4
GRO
UP G
ILT
FUND
1**
GRO
UP G
ILT
FUND
2
GRO
UP
GRO
WTH
FU
ND 1
GRO
UP
INFR
ASTR
UCTU
RE
FUND
1
GRO
UP
MID
CAP
FUND
1
SFIN
ULG
F021
05/
06/1
3GBA
LA
NCE0
4121
ULG
F004
31/
01/0
7GCA
PI
SEC0
1121
ULG
F005
24/
10/0
7GCO
RB
OND
0112
1
ULG
F012
13/
10/0
8GCO
R BO
ND02
121
ULG
F023
05/
06/1
3GCO
R BO
ND03
121
ULG
F014
28/
11/0
8GEN
E RG
YF01
121
ULG
F007
24/
10/0
7GEQ
U IT
YF01
121
ULG
F013
28/
11/0
8GEQ
UI
TYF0
2121
ULG
F018
08/
06/0
9GEQ
UI
TYF0
3121
ULG
F022
05/
06/1
3GEQ
U IT
YF04
121
ULG
F008
24/
10/0
7GG
ILT
FUN0
1121
ULG
F016
10/
12/0
8GG
IL TF
UN02
121
ULG
F003
10/
10/0
3GG
RO
WTH
F011
21
ULG
F019
08/
06/0
9GIN
F RA
SF01
121
ULG
F020
08/
06/0
9GM
I DC
APF0
1121
So
urce
s of
Fun
dsPo
licyh
olde
rs' F
unds
:Po
licyh
olde
r con
tribu
tion
F-1
23,
96,5
20
(1,13
7) (1
4,60
9) 11
,51,0
92
24,
80,3
95
2,0
69
(401
) (4
2,46
9) 4
,08,
918
14,0
2,45
5 (2
,202
) (1
4,72
7) (7
,778
) 2
,478
(4
,911
)Re
venu
e Ac
coun
t 3
,09,
208
3,0
67
14,6
09
9,8
6,48
4 3
,17,7
87
(624
) 4
01
42,
469
4,15
,382
1,
24,0
32
2,2
02
18,9
08
57,
648
648
7
,951
To
tal
27,
05,7
28
1,93
0 -
21,3
7,57
6 2
7,98
,182
1,44
5 -
- 8
,24,
300
15,2
6,48
7 -
4,18
1 4
9,87
0 3
,126
3,0
40
Appl
icatio
n of
Fun
dsIn
vest
men
tsF-
2 2
6,29
,898
1,
925
- 2
0,38
,485
2
7,64
,984
1,
459
- -
8,2
2,65
7 17
,56,
885
- 4
,160
49,
234
3,15
4 3
,054
Cu
rrent
Ass
ets
F-3
2,9
4,83
7 5
-
1,54
,661
2
,52,
008
24
- -
6,2
65
13,9
13
- 17
2 1,
903
9
16
Less
: Cur
rent
Liab
ilitie
s an
d Pr
ovisi
ons
F-4
83,
180
- -
55,
570
1,15
,242
3
8 -
- 4
,622
2
6,78
3 -
151
1,26
7 3
7 3
0
Net c
urre
nt a
sset
s 2
,11,6
57
5
- 9
9,09
1 1,
36,7
66
(14)
- -
1,64
3 (1
2,87
0) -
21
636
(2
8) (1
4)To
tal
28,
41,5
55
1,93
0 -
21,3
7,57
6 2
9,01
,750
1,
445
- -
8,2
4,30
0 17
,44,
015
- 4
,181
49,
870
3,12
6 3
,040
(` ‘0
00)
Parti
cula
rsSc
hedu
le
Prev
ious
Yea
r
GRO
UP M
ONE
Y M
ARKE
T FU
ND 1*
* G
ROUP
MO
NEY
MAR
KET
FUND
2
GRO
UP P
URE
DEBT
FU
ND 1*
* G
ROUP
PUR
E DE
BT
FUND
2**
G
ROUP
PUR
E EQ
UITY
FU
ND 1
PEN
SIO
N DI
SCO
NTIN
UED
POLIC
Y FU
ND
PEN
SIO
N SM
ART
FUND
1 M
AKE
IN IN
DIA
FUND
T
OTA
L
SFIN
ULG
F006
24/
10/0
7GM
ON
MRK
T011
21
ULG
F009
30/
09/0
8GM
ON
MRK
T021
21
ULG
F010
30/
09/0
8GPU
R ED
EB01
121
ULG
F011
30/
09/0
8GPU
R DE
BT02
121
ULG
F015
28/
11/0
8GPU
R EE
QF0
1121
U
LIF07
029/
08
/13P
DIS
POLF
0112
1 U
LIF06
810/
09
/12P
SMA
RTFU
0112
1 U
LIF06
924/
03
/15L
MAK
EIN
DIA1
21
Sour
ces
of F
unds
Polic
yhol
ders
' Fun
ds:
Polic
yhold
er co
ntribu
tion
F-1
- 12
,50,
846
(8,6
56)
(1,3
37)
(3,5
17)
7,6
0,42
3 5
,70,
253
14,7
8,69
1 9
6,44
,841
Re
venu
e Ac
coun
t -
8,2
2,36
9 8
,656
1,
337
8,13
6 4
8,04
8 1,
34,5
31
35,
189
6,0
5,04
,885
To
tal
- 2
0,73
,215
-
- 4
,619
8
,08,
471
7,0
4,78
4 15
,13,8
80
7,0
1,49,
726
Appl
icatio
n of
Fun
dsIn
vest
men
tsF-
2 -
20,
72,2
40
- -
4,7
31
8,5
8,50
7 6
,68,
722
13,6
5,20
9 7
,12,5
8,07
0 Cu
rrent
Ass
ets
F-3
- 1,
176
- -
7
5
54,
915
1,48
,910
19
,86,
769
Less
: Cur
rent
Liab
ilitie
s an
d Pr
ovisi
ons
F-4
- 2
01
- -
119
6,0
85
18,8
53
239
2
5,94
,234
Net c
urre
nt a
sset
s -
975
-
- (1
12)
(6,0
80)
36,
062
1,48
,671
(6
,07,
465)
Tota
l -
20,
73,2
15
- -
4,6
19
8,5
2,42
7 7
,04,
784
15,13
,880
7
,06,
50,6
05
** S
chem
es h
ave
beco
me
dorm
ant.

305
STRA
TEG
IC R
EPO
RT /
STA
TUTO
RY R
EPO
RTS
/ F
INA
NCI
ALS
STA
TEM
ENTS
Net
Ass
et V
alue
(NAV
) per
Uni
t: (a
) N
et A
sset
as
per B
alan
ce S
heet
(Tot
al A
sset
s le
ss C
urre
nt L
iabi
litie
s an
d Pr
ovis
ions
)
(` ‘0
00)
Parti
cula
rsSc
hedu
le
Cur
rent
Yea
r
DISC
ONTIN
UED
POLIC
Y FU
ND
LIFE
BA
LANC
ED
FUND
1
LIFE
CAP
ITAL
SECU
RE
FUND
1
LIFE
CO
RPO
RATE
BO
ND F
UND
1
LIFE
CO
RPO
RATE
BO
ND F
UND
2
LIFE
ENE
RGY
FUND
1 L
IFE E
NERG
Y FU
ND 2
L
IFE E
QUI
TY
FUND
1 L
IFE E
QUI
TY
FUND
2
LIFE
EQ
UITY
FU
ND 3
L
IFE G
ILT
FUND
1 L
IFE G
ILT
FUND
2
LIFE
GRO
WTH
FU
ND 1
LIFE
GRO
WTH
FU
ND 2
SFIN
ULIF
0570
3/
09/1
0DIS
CP
OLF
0112
1
ULIF
0012
8/
07/0
4LBA
LA
NCE0
1121
ULIF
0022
8/
07/0
4LCA
PT
SEC0
1121
ULIF
0231
0/
06/0
8LCO
R BO
ND01
121
ULIF
0402
0/
08/0
9LCO
R BO
ND02
121
ULIF
0241
0/
06/0
8LEN
ER
GYF
0112
1
ULIF
0410
1/
01/1
0LEN
ER
GYF
0212
1
ULIF
0032
8/
07/0
4LEQ
UI
TYF0
1121
ULIF
0251
0/
06/0
8LEQ
UI
TYF0
2121
ULIF
0420
1/
01/1
0LEQ
U IT
YF03
121
ULIF
0261
0/
06/0
8LG
ILT
FUN0
1121
ULIF
0381
9/
03/0
9LG
ILT
FUN0
2121
ULIF
0042
8/
07/0
4LG
RO
WTH
F011
21
ULIF
0110
2/
11/0
7LG
ROW
TH
F021
21
Net A
sset
-Exis
ting
Fund
s 3
9,26
,209
10
,93,
936
34,
039
27,
91,9
39
28,
908
2,15
,603
7
4,32
1 14
,91,9
89
66,
87,9
91
1,67
,24,
246
4,6
5,41
6 15
,715
1,
64,4
95
1,81
,397
To
tal
39,
26,2
09
10,9
3,93
6 3
4,03
9 2
7,91
,939
2
8,90
8 2
,15,6
03
74,
321
14,9
1,989
6
6,87
,991
1,6
7,24
,246
4
,65,
416
15,7
15
1,64
,495
1,
81,3
97
(` ‘0
00)
Parti
cula
rsSc
hedu
le
Cur
rent
Yea
r
LIFE
G
ROW
TH
PLUS
FUN
D 1
LIFE
G
ROW
TH
PLUS
FUN
D 2
LIFE
G
UARA
NTEE
D BO
ND F
UND
- 1**
LIFE
HIG
H
GRO
WTH
FU
ND 1
LIFE
HIG
H
GRO
WTH
FU
ND 2
LIFE
H
IGH
EST
NAV
GUA
RANT
EE
FUND
1
LIFE
H
IGH
EST
NAV
ADVA
NTAG
E FU
ND 1
LIFE
H
IGH
EST
NAV
ADVA
NTAG
E FU
ND 2
LIFE
IN
FRAS
TRUC
TURE
FU
ND 1
LIFE
IN
FRAS
TRUC
TURE
FU
ND 2
LIFE
MID
CAP
FUND
1 L
IFE M
IDCA
P FU
ND 2
LIFE
MO
NEY
MAR
KET
FUND
1
LIFE
MO
NEY
MAR
KET
FUND
2
SFIN
ULIF
0080
9/
04/0
7LG
R W
TPLS
0112
1
ULIF
0430
1/
01/1
0LG
RW
TPLS
0212
1
ULIF
0361
6/
12/0
8LG
UA
BOND
0112
1
ULIF
0072
8/
02/0
7LH
IGR
OW
T011
21
ULIF
0551
1/
01/1
0LH
IGR
OW
T021
21
ULIF
0561
2/
02/1
0LH
NAV
GUA
0112
1
ULIF
0580
3/
09/1
0LH
NAV
ADV0
1121
ULIF
0590
1/
06/1
1LH
NAV
ADV0
2121
ULIF
0271
0/
06/0
8LIN
F RA
ST01
121
ULIF
0440
1/
01/1
0LIN
F RA
ST02
121
ULIF
0281
0/
06/0
8LM
ID
CAPF
0112
1
ULIF
0450
1/
01/1
0LM
ID
CAPF
0212
1
ULIF
0291
0/
06/0
8LM
ON
MRK
T011
21
ULIF
0391
9/
03/0
9LM
ON
MRK
T021
21
Net A
sset
-Exis
ting
Fund
s 1,
40,9
57
16,4
17
- 3
,83,
678
23,
070
44,
85,5
04
14,9
0,53
4 2
,01,8
89
2,2
0,90
5 1,
02,3
06
2,9
3,07
7 5
,60,
617
19,9
4,12
1 2
4,15
3 To
tal
1,40
,957
16
,417
-
3,8
3,67
8 2
3,07
0 4
4,85
,504
14
,90,
534
2,0
1,889
2
,20,
905
1,02
,306
2
,93,
077
5,6
0,61
7 19
,94,
121
24,
153
(` ‘0
00)
Parti
cula
rsSc
hedu
le
Cur
rent
Yea
r
LIFE
PUR
E DE
BT F
UND
1
LIFE
PUR
E EQ
UITY
FU
ND 1
LIFE
PUR
E EQ
UITY
FU
ND 2
LIFE
SUP
ER
GRO
WTH
FU
ND 1
LIFE
SUP
ER
GRO
WTH
FU
ND 2
REL
IANC
E AS
SURE
D M
ATUR
ITY
DEBT
FUN
D
PEN
SIO
N BA
LANC
ED
FUND
1
PEN
SIO
N BA
LANC
ED
FUND
2
PEN
SIO
N CA
PITA
L SE
CURE
FU
ND 1
PEN
SIO
N CO
RPO
RATE
BO
ND F
UN
D 1
PEN
SIO
N EN
ERG
Y
FUND
1**
PEN
SIO
N EN
ERG
Y FU
ND 2
PEN
SIO
N EQ
UITY
FU
ND 1
PEN
SIO
N EQ
UITY
FU
ND 2
SFIN
ULIF
0090
9/
04/0
7LPU
RD
EBT0
1121
ULIF
0301
0/
06/0
8LPU
EQ
UTY0
1121
ULIF
0460
1/
01/1
0LPU
EQ
UTY0
2121
ULIF
0100
9/
04/0
7LSP
R G
RWT0
1121
ULIF
0470
1/
01/1
0LSP
RG
RWT0
2121
ULIF
0672
0/1
2/11
LASU
R M
DEBT
121
ULIF
0310
4/
12/0
8PBA
LA
NCE0
1121
ULIF
0480
1/
01/1
0PBA
L AN
CE02
121
ULIF
0050
1/
11/0
6PCA
P TS
EC01
121
ULIF
0190
1/
03/0
8PCO
RB
OND
0112
1
ULIF
0200
1/
03/0
8PEN
RG
YYF0
1121
ULIF
0650
1/
01/1
0PEN
RG
YYF0
2121
ULIF
0060
1/
11/0
6PEQ
U IT
YF01
121
ULIF
0320
4/
12/0
8PEQ
U IT
YF02
121
Net A
sset
-Exis
ting
Fund
s 3
,36,
387
5,5
5,71
3 2
1,15,
708
2,2
0,48
7 2
0,71
2 4
,67,
521
1,90
,284
3
9,68
6 2
8,72
3 3
,793
-
43,
556
6,12
,693
8
,54,
212
Tota
l 3
,36,
387
5,5
5,71
3 2
1,15,
708
2,2
0,48
7 2
0,71
2 4
,67,
521
1,90
,284
3
9,68
6 2
8,72
3 3
,793
-
43,
556
6,12
,693
8
,54,
212
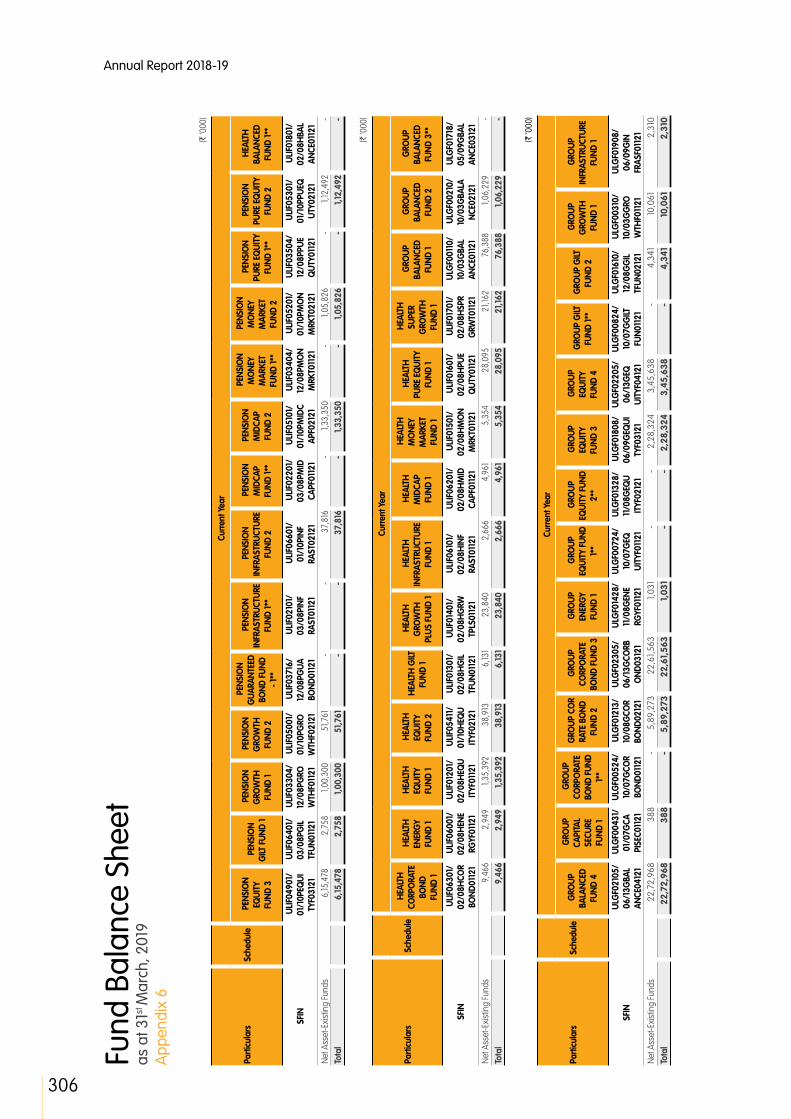
Annual Report 2018-19
306
Fund
Bal
ance
She
et
as a
t 31st
Mar
ch, 2
019
App
endi
x 6
(` ‘0
00)
Parti
cula
rsSc
hedu
le
Cur
rent
Yea
r
PEN
SIO
N EQ
UITY
FU
ND 3
PEN
SIO
N G
ILT F
UND
1
PEN
SIO
N G
ROW
TH
FUND
1
PEN
SIO
N G
ROW
TH
FUND
2
PEN
SIO
N G
UARA
NTEE
D BO
ND F
UND
- 1**
PEN
SIO
N IN
FRAS
TRUC
TURE
FU
ND 1*
*
PEN
SIO
N IN
FRAS
TRUC
TURE
FU
ND 2
PEN
SIO
N M
IDCA
P FU
ND 1*
*
PEN
SIO
N M
IDCA
P FU
ND 2
PEN
SIO
N M
ONE
Y M
ARKE
T FU
ND 1*
*
PEN
SIO
N M
ONE
Y M
ARKE
T FU
ND 2
PEN
SIO
N PU
RE E
QUI
TY
FUND
1**
PEN
SIO
N PU
RE E
QUI
TY
FUND
2
HEA
LTH
BA
LANC
ED
FUND
1**
SFIN
ULIF
0490
1/
01/1
0PEQ
UI
TYF0
3121
ULIF
0640
1/
03/0
8PG
IL TF
UN01
121
ULIF
0330
4/
12/0
8PG
RO
WTH
F011
21
ULIF
0500
1/
01/1
0PG
RO
WTH
F021
21
ULIF
0371
6/
12/0
8PG
UA
BOND
0112
1
ULIF
0210
1/
03/0
8PIN
F RA
ST01
121
ULIF
0660
1/
01/1
0PIN
F RA
ST02
121
ULIF
0220
1/
03/0
8PM
ID
CAPF
0112
1
ULIF
0510
1/
01/1
0PM
IDC
APF0
2121
ULIF
0340
4/
12/0
8PM
ON
MRK
T011
21
ULIF
0520
1/
01/1
0PM
ON
MRK
T021
21
ULIF
0350
4/
12/0
8PPU
E Q
UTY0
1121
ULIF
0530
1/
01/1
0PPU
EQ
UTY0
2121
ULIF
0180
1/
02/0
8HBA
L AN
CE01
121
Net A
sset
-Exis
ting
Fund
s 6
,15,4
78
2,7
58
1,00
,300
5
1,761
-
- 3
7,81
6 -
1,33
,350
-
1,05
,826
-
1,12
,492
-
Tota
l 6
,15,4
78
2,7
58
1,00
,300
5
1,761
-
- 3
7,81
6 -
1,33
,350
-
1,05
,826
-
1,12
,492
-
(` ‘0
00)
Parti
cula
rsSc
hedu
le
Cur
rent
Yea
r
HEA
LTH
CO
RPO
RATE
BO
ND
FUND
1
HEA
LTH
EN
ERG
Y FU
ND 1
HEA
LTH
EQ
UITY
FU
ND 1
HEA
LTH
EQ
UITY
FU
ND 2
HEA
LTH
GILT
FU
ND 1
HEA
LTH
G
ROW
TH
PLUS
FUN
D 1
HEA
LTH
IN
FRAS
TRUC
TURE
FU
ND 1
HEA
LTH
M
IDCA
P FU
ND 1
HEA
LTH
M
ONE
Y M
ARKE
T FU
ND 1
HEA
LTH
PU
RE E
QUI
TY
FUND
1
HEA
LTH
SU
PER
GRO
WTH
FU
ND 1
GRO
UP
BALA
NCED
FU
ND 1
GRO
UP
BALA
NCED
FU
ND 2
GRO
UP
BALA
NCED
FU
ND 3
**
SFIN
ULIF
0630
1/
02/0
8HCO
R BO
ND01
121
ULIF
0600
1/
02/0
8HEN
E RG
YF01
121
ULIF
0120
1/
02/0
8HEQ
U IT
YF01
121
ULIF
0541
1/
01/1
0HEQ
U IT
YF02
121
ULIF
0130
1/
02/0
8HG
IL TF
UN01
121
ULIF
0140
1/
02/0
8HG
RW
TPLS
0112
1
ULIF
0610
1/
02/0
8HIN
F RA
ST01
121
ULIF
0620
1/
02/0
8HM
ID
CAPF
0112
1
ULIF
0150
1/
02/0
8HM
ON
MRK
T011
21
ULIF
0160
1/
02/0
8HPU
E Q
UTY0
1121
ULIF
0170
1/
02/0
8HSP
R G
RWT0
1121
ULG
F001
10/
10/0
3GBA
L AN
CE01
121
ULG
F002
10/
10/0
3GBA
LA
NCE0
2121
ULG
F017
18/
05/0
9GBA
L AN
CE03
121
Net A
sset
-Exis
ting
Fund
s 9
,466
2
,949
1,
35,3
92
38,
913
6,13
1 2
3,84
0 2
,666
4
,961
5
,354
2
8,09
5 2
1,162
7
6,38
8 1,
06,2
29
- To
tal
9,4
66
2,9
49
1,35
,392
3
8,91
3 6
,131
23,
840
2,6
66
4,9
61
5,3
54
28,
095
21,1
62
76,
388
1,06
,229
-
(` ‘0
00)
Parti
cula
rsSc
hedu
le
Cur
rent
Yea
r
GRO
UP
BALA
NCED
FU
ND 4
GRO
UP
CAPI
TAL
SECU
RE
FUND
1
GRO
UP
CORP
ORA
TE
BOND
FUN
D 1*
*
GRO
UP C
OR
RATE
BO
ND
FUND
2
GRO
UP
CORP
ORA
TE
BOND
FUN
D 3
GRO
UP
ENER
GY
FUND
1
GRO
UP
EQUI
TY F
UND
1**
GRO
UP
EQUI
TY F
UND
2**
GRO
UP
EQUI
TY
FUND
3
GRO
UP
EQUI
TY
FUND
4
GRO
UP G
ILT
FUND
1**
GRO
UP G
ILT
FUND
2
GRO
UP
GRO
WTH
FU
ND 1
GRO
UP
INFR
ASTR
UCTU
RE
FUND
1
SFIN
ULG
F021
05/
06/1
3GBA
L AN
CE04
121
ULG
F004
31/
01/0
7GCA
PI
SEC0
1121
ULG
F005
24/
10/0
7GCO
R BO
ND01
121
ULG
F012
13/
10/0
8GCO
R BO
ND02
121
ULG
F023
05/
06/1
3GCO
RB
OND
0312
1
ULG
F014
28/
11/0
8GEN
E RG
YF01
121
ULG
F007
24/
10/0
7GEQ
UI
TYF0
1121
ULG
F013
28/
11/0
8GEQ
U IT
YF02
121
ULG
F018
08/
06/0
9GEQ
UI
TYF0
3121
ULG
F022
05/
06/1
3GEQ
UI
TYF0
4121
ULG
F008
24/
10/0
7GG
ILT
FUN0
1121
ULG
F016
10/
12/0
8GG
IL TF
UN02
121
ULG
F003
10/
10/0
3GG
RO
WTH
F011
21
ULG
F019
08/
06/0
9GIN
FR
ASF0
1121
Ne
t Ass
et-E
xistin
g Fu
nds
22,
72,9
68
388
-
5,8
9,27
3 2
2,61
,563
1,
031
- -
2,2
8,32
4 3
,45,
638
- 4
,341
10
,061
2
,310
To
tal
22,
72,9
68
388
-
5
,89,
273
22,
61,5
63
1,0
31
-
-
2,2
8,32
4 3
,45,
638
-
4,3
41
10,
061
2,3
10

307
STRA
TEG
IC R
EPO
RT /
STA
TUTO
RY R
EPO
RTS
/ F
INA
NCI
ALS
STA
TEM
ENTS
(` ‘0
00)
Parti
cula
rsSc
hedu
le
Cur
rent
Yea
r
GRO
UP M
IDCA
P FU
ND 1
GRO
UP M
ONE
Y M
ARKE
T FU
ND 1*
* G
ROUP
MO
NEY
MAR
KET
FUND
2
GRO
UP P
URE
DEBT
FU
ND 1*
* G
ROUP
PUR
E DE
BT
FUND
2**
G
ROUP
PUR
E EQ
UITY
FUN
D 1
PEN
SIO
N DI
SCO
NTIN
UED
POLIC
Y FU
ND
PEN
SIO
N SM
ART
FUND
1 M
AKE
IN IN
DIA
FUND
T
OTA
L
SFIN
ULG
F020
08/
06/0
9GM
ID
CAPF
0112
1
ULG
F006
24/
10/0
7GM
ON
MRK
T011
21
ULG
F009
30/
09/0
8GM
ON
MRK
T021
21
ULG
F010
30/
09/0
8GPU
R ED
EB01
121
ULG
F011
30/
09/0
8GPU
R DE
BT02
121
ULG
F015
28/
11/0
8GPU
RE
EQF0
1121
ULIF
0702
9/
08/1
3PDI
SP
OLF
0112
1
ULIF
0681
0/
09/1
2PSM
AR
TFU0
1121
ULIF
0692
4/
03/1
5LM
AK
EIND
IA12
1
-
Net A
sset
-Exis
ting
Fund
s 2
,820
-
2,2
4,87
6 -
- 4
,422
7
,96,
560
7,2
5,28
8 3
3,46
,424
6
,17,6
0,52
1 To
tal
2,8
20
- 2
,24,
876
- -
4,4
22
7,9
6,56
0 7
,25,
288
33,
46,4
24
6,17
,60,
521
(` ‘0
00)
Parti
cula
rsSc
hedu
le
Prev
ious
Yea
r
DIS
CONT
INUE
D PO
LICY
FUND
LIF
E BA
LAN
CED
FU
ND
1
LIF
E CA
PITA
L SE
CURE
FU
ND
1
LIF
E CO
RPO
RATE
BO
ND
FU
ND
1
LIF
E CO
RPO
RATE
BO
ND
FU
ND
2
LIF
E EN
ERG
Y FU
ND
1
LIF
E EN
ERG
Y FU
ND
2
LIF
E EQ
UIT
Y FU
ND
1
LIF
E EQ
UIT
Y FU
ND
2
LIF
E EQ
UIT
Y FU
ND
3
LIF
E G
ILT
FUN
D 1
L
IFE
GILT
FU
ND
2
LIF
E G
ROW
TH
FUN
D 1
LIF
E G
ROW
TH
FUN
D 2
SFIN
ULI
F057
03/
09/1
0DIS
C PO
LF01
121
ULI
F001
28/
07/0
4LBA
L A
NCE
0112
1
ULI
F002
28/
07/0
4LCA
P TS
EC01
121
ULI
F023
10/
06/0
8LCO
R BO
ND
0112
1
ULI
F040
20/
08/0
9LCO
R BO
ND
0212
1
ULI
F024
10/
06/0
8LEN
E RG
YF01
121
ULI
F041
01/
01/1
0LEN
ER
GYF
0212
1
ULI
F003
28/
07/0
4LEQ
U
ITYF
0112
1
ULI
F025
10/
06/0
8LEQ
U
ITYF
0212
1
ULI
F042
01/
01/1
0LEQ
U
ITYF
0312
1
ULI
F026
10/
06/0
8LG
ILT
FUN
0112
1
ULI
F038
19/
03/0
9LG
ILT
FUN
0212
1
ULI
F004
28/
07/0
4LG
RO
WTH
F011
21
ULI
F011
02/
11/0
7LG
RO
WTH
F021
21
Net A
sset
-Exis
ting
Fund
s 4
4,00
,598
10
,07,
599
39,
331
32,
55,3
09
32,
615
3,11
,096
8
8,33
9 15
,46,
274
85,
98,2
22
1,51
,95,
641
5,8
8,52
7 17
,679
1,
81,8
40
2,3
1,151
To
tal
44,
00,5
98
10,
07,5
99
39,
331
32,
55,3
09
32,
615
3,1
1,09
6 8
8,33
9 1
5,46
,274
8
5,98
,222
1
,51,
95,6
41
5,8
8,52
7 1
7,67
9 1
,81,
840
2,3
1,15
1
(` ‘0
00)
Parti
cula
rsSc
hedu
le
Prev
ious
Yea
r
LIFE
G
ROW
TH
PLUS
FUN
D 1
LIFE
G
ROW
TH
PLUS
FU
ND 2
LIFE
G
UARA
NTEE
D BO
ND F
UND
- 1**
LIFE
HIG
H
GRO
WTH
FU
ND 1
LIFE
HIG
H
GRO
WTH
FU
ND 2
LIFE
H
IGH
EST
NAV
GUA
RANT
EE
FUND
1
LIFE
H
IGH
EST
NAV
ADVA
NTAG
E FU
ND 1
LIFE
H
IGH
EST
NAV
ADVA
NTAG
E FU
ND 2
LIFE
IN
FRAS
TRUC
TURE
FU
ND 1
LIFE
IN
FRAS
TRUC
TURE
FU
ND 2
LIFE
M
IDCA
P FU
ND 1
LIFE
M
IDCA
P FU
ND 2
LIFE
MO
NEY
MAR
KET
FUND
1
LIFE
MO
NEY
MAR
KET
FUND
2
SFIN
ULIF
0080
9/
04/0
7LG
R W
TPLS
0112
1
ULIF
0430
1/
01/1
0LG
RW
TPLS
0212
1
ULIF
0361
6/
12/0
8LG
UAB
OND
0112
1
ULIF
0072
8/
02/0
7LH
IG
ROW
T011
21
ULIF
0551
1/
01/1
0LH
IGR
OW
T021
21
ULIF
0561
2/
02/1
0LH
NA
VGUA
0112
1
ULIF
0580
3/
09/1
0LH
NA
VADV
0112
1
ULIF
0590
1/
06/1
1LH
NAV
ADV0
2121
ULIF
0271
0/
06/0
8LIN
F RA
ST01
121
ULIF
0440
1/
01/1
0LIN
FR
AST0
2121
ULIF
0281
0/
06/0
8LM
ID
CAPF
0112
1
ULIF
0450
1/
01/1
0LM
ID
CAPF
0212
1
ULIF
0291
0/
06/0
8LM
ON
MRK
T011
21
ULIF
0391
9/
03/0
9LM
ON
MRK
T021
21
Net A
sset
-Exis
ting
Fund
s 3
,05,
096
15,2
77
- 6
,19,6
17
23,
602
44,
27,2
00
16,2
4,50
6 2
,19,0
14
3,13
,861
1,
46,0
41
4,4
3,18
1 7
,34,
223
23,
31,7
30
24,
393
Tota
l 3
,05,
096
15,
277
-
6,1
9,61
7 2
3,60
2 4
4,27
,200
1
6,24
,506
2
,19,
014
3,1
3,86
1 1
,46,
041
4,4
3,18
1 7
,34,
223
23,
31,7
30
24,
393

Annual Report 2018-19
308
Fund
Bal
ance
She
et
as a
t 31st
Mar
ch, 2
019
App
endi
x 6
(` ‘0
00)
Parti
cula
rsSc
hedu
le
Prev
ious
Yea
r
LIFE
PUR
E DE
BT F
UND
1
LIFE
PUR
E EQ
UITY
FU
ND 1
LIFE
PUR
E EQ
UITY
FU
ND 2
LIFE
SUP
ER
GRO
WTH
FU
ND 1
LIFE
SUP
ER
GRO
WTH
FU
ND 2
REL
IANC
E AS
SURE
D M
ATUR
ITY
DEBT
FUN
D
PEN
SIO
N BA
LANC
ED
FUND
1
PEN
SIO
N BA
LANC
ED
FUND
2
PEN
SIO
N CA
PITA
L SE
CURE
FU
ND 1
PEN
SIO
N CO
RPO
RATE
BO
ND
FUND
1
PEN
SIO
N EN
ERG
Y FU
ND 1*
*
PEN
SIO
N EN
ERG
Y FU
ND 2
PEN
SIO
N EQ
UITY
FU
ND 1
PEN
SIO
N EQ
UITY
FU
ND 2
SFIN
ULIF
0090
9/
04/0
7LPU
R DE
BT01
121
ULIF
0301
0/
06/0
8LPU
E Q
UTY0
1121
ULIF
0460
1/
01/1
0LPU
EQ
UTY0
2121
ULIF
0100
9/
04/0
7LSP
R G
RWT0
1121
ULIF
0470
1/
01/1
0LSP
RG
RWT0
2121
ULIF
0672
0/
12/1
1LAS
UR
MDE
BT12
1
ULIF
0310
4/
12/0
8PBA
L AN
CE01
121
ULIF
0480
1/
01/1
0PBA
L AN
CE02
121
ULIF
0050
1/
11/0
6PCA
P TS
EC01
121
ULIF
0190
1/
03/0
8PCO
RB
OND
0112
1
ULIF
0200
1/
03/0
8PEN
RG
YYF0
1121
ULIF
0650
1/
01/1
0PEN
R G
YYF0
2121
ULIF
0060
1/
11/0
6PEQ
U IT
YF01
121
ULIF
0320
4/
12/0
8PEQ
U IT
YF02
121
Net A
sset
-Exis
ting
Fund
s 4
,29,
011
7,0
7,59
3 19
,16,19
1 3
,69,
865
20,
498
4,8
9,33
0 2
,24,
375
63,
368
27,
180
12,9
05
- 8
3,84
5 6
,38,
596
11,4
2,81
2 To
tal
4,2
9,01
1 7
,07,
593
19,
16,1
91
3,6
9,86
5 2
0,49
8 4
,89,
330
2,2
4,37
5 6
3,36
8 2
7,18
0 1
2,90
5 -
8
3,84
5 6
,38,
596
11,
42,8
12
(` ‘0
00)
Parti
cula
rsSc
hedu
le
Prev
ious
Yea
r
PEN
SIO
N EQ
UITY
FU
ND 3
PEN
SIO
N G
ILT F
UND
1
PEN
SIO
N G
ROW
TH
FUND
1
PEN
SIO
N G
ROW
TH
FUND
2
PEN
SIO
N G
UARA
NTEE
D BO
ND F
UND
- 1**
PEN
SIO
N IN
FRAS
TRUC
TURE
FU
ND 1*
*
PEN
SIO
N IN
FRAS
TRUC
TURE
FU
ND 2
PEN
SIO
N M
IDCA
P FU
ND 1*
*
PEN
SIO
N M
IDCA
P FU
ND 2
PEN
SIO
N M
ONE
Y M
ARKE
T FU
ND 1*
*
PEN
SIO
N M
ONE
Y M
ARKE
T FU
ND 2
PEN
SIO
N PU
RE E
QUI
TY
FUND
1**
PEN
SIO
N PU
RE E
QUI
TY
FUND
2
HEA
LTH
BA
LANC
ED
FUND
1**
SFIN
ULI
F049
01/
01/1
0PEQ
U
ITYF
0312
1
ULI
F064
01/
03/0
8PG
ILT
FUN
0112
1
ULI
F033
04/
12/0
8PG
RO
WTH
F011
21
ULI
F050
01/
01/1
0PG
RO
WTH
F021
21
ULI
F037
16/
12/0
8PG
UA
B O
ND
0112
1
ULI
F021
01/
03/0
8PIN
FR
AST
0112
1
ULI
F066
01/
01/1
0PIN
FR
AST
0212
1
ULI
F022
01/
03/0
8PM
ID
CAPF
0112
1
ULI
F051
01/
01/1
0PM
IDC
APF
0212
1
ULI
F034
04/
12/0
8PM
ON
M
RKT0
1121
ULI
F052
01/
01/1
0PM
ON
M
RKT0
2121
ULI
F035
04/
12/0
8PPU
E Q
UTY
0112
1
ULI
F053
01/
01/1
0PPU
E Q
UTY
0212
1
ULI
F018
01/
02/0
8HBA
L A
NCE
0112
1 Ne
t Ass
et-E
xistin
g Fu
nds
6,6
4,79
1 6
,601
1,
26,2
72
53,
523
- -
78,
295
- 2
,19,2
23
- 1,
22,6
46
- 1,
32,7
72
- To
tal
6,6
4,79
1 6
,601
1
,26,
272
53,
523
-
-
78,
295
-
2,1
9,22
3 -
1
,22,
646
-
1,3
2,77
2 -
(` ‘0
00)
Parti
cula
rsSc
hedu
le
Prev
ious
Yea
r
HEA
LTH
CO
RPO
RATE
BO
ND
FUND
1
HEA
LTH
EN
ERG
Y FU
ND 1
HEA
LTH
EQ
UITY
FU
ND 1
HEA
LTH
EQ
UITY
FU
ND 2
HEA
LTH
GILT
FU
ND 1
HEA
LTH
G
ROW
TH
PLUS
FUN
D 1
HEA
LTH
IN
FRAS
TRUC
TURE
FU
ND 1
HEA
LTH
M
IDCA
P FU
ND 1
HEA
LTH
M
ONE
Y M
ARKE
T FU
ND 1
HEA
LTH
PU
RE E
QUI
TY
FUND
1
HEA
LTH
SU
PER
GRO
WTH
FU
ND 1
GRO
UP
BALA
NCED
FU
ND 1
GRO
UP
BALA
NCED
FU
ND 2
GRO
UP
BALA
NCED
FU
ND 3
**
SFIN
ULI
F063
01/
02/0
8HCO
R BO
ND
0112
1
ULI
F060
01/
02/0
8HEN
E RG
YF01
121
ULI
F012
01/
02/0
8HEQ
U
ITYF
0112
1
ULI
F054
11/
01/1
0HEQ
U
ITYF
0212
1
ULI
F013
01/
02/0
8HG
IL
TFU
N01
121
ULI
F014
01/
02/0
8HG
R W
TPLS
0112
1
ULI
F061
01/
02/0
8HIN
F RA
ST01
121
ULI
F062
01/
02/0
8HM
I D
CAPF
0112
1
ULI
F015
01/
02/0
8HM
ON
M
RKT0
1121
ULI
F016
01/
02/0
8HPU
E Q
UTY
0112
1
ULI
F017
01/
02/0
8HSP
R G
RWT0
1121
ULG
F001
10/
10/0
3GBA
L A
NCE
0112
1
ULG
F002
10/
10/0
3GBA
L A
NCE
0212
1
ULG
F017
18/
05/0
9GBA
L A
NCE
0312
1 Ne
t Ass
et-E
xistin
g Fu
nds
16,0
62
4,0
09
2,7
3,36
1 3
6,80
2 11
,021
4
7,28
8 3
,443
7
,122
10,3
17
29,
859
35,
288
75,
571
1,87
,095
-
Tota
l 1
6,06
2 4
,009
2
,73,
361
36,
802
11,
021
47,
288
3,4
43
7,1
22
10,
317
29,
859
35,
288
75,
571
1,8
7,09
5 -

309
STRA
TEG
IC R
EPO
RT /
STA
TUTO
RY R
EPO
RTS
/ F
INA
NCI
ALS
STA
TEM
ENTS
(` ‘0
00)
Parti
cula
rsSc
hedu
le
Prev
ious
Yea
r
GRO
UP
BALA
NCED
FU
ND 4
GRO
UP
CAPI
TAL
SECU
RE
FUND
1
GRO
UP
CORP
ORA
TE
BOND
FU
ND 1*
*
GRO
UP
CORP
ORA
TE
BOND
FU
ND 2
GRO
UP
CORP
ORA
TE
BOND
FU
ND 3
GRO
UP
ENER
GY
FUND
1
GRO
UP
EQUI
TY
FUND
1**
GRO
UP
EQUI
TY
FUND
2**
GRO
UP
EQUI
TY
FUND
3
GRO
UP
EQUI
TY
FUND
4*
GRO
UP
GILT
FUN
D 1*
*
GRO
UP
GILT
FU
ND 2
GRO
UP
GRO
WTH
FU
ND 1
GRO
UP
INFR
ASTR
UCTU
RE
FUND
1
GRO
UP
MID
CAP
FUND
1
SFIN
ULG
F021
05/
06/1
3GBA
L AN
CE04
121
ULG
F004
31/
01/0
7GCA
P IS
EC01
121
ULG
F005
24/
10/0
7GCO
R BO
ND01
121
ULG
F012
13/
10/0
8GCO
R BO
ND02
121
ULG
F023
05/
06/1
3GCO
R BO
ND03
121
ULG
F014
28/
11/0
8GEN
E RG
YF01
121
ULG
F007
24/
10/0
7GEQ
UI
TYF0
1121
ULG
F013
28/
11/0
8GEQ
U IT
YF02
121
ULG
F018
08/
06/0
9GEQ
UI
TYF0
3121
ULG
F022
05/
06/1
3GEQ
U IT
YF04
121
ULG
F008
24/
10/0
7GG
IL TF
UN01
121
ULG
F016
10/
12/0
8GG
ILT
FUN0
2121
ULG
F003
10/
10/0
3GG
RO
WTH
F011
21
ULG
F019
08/
06/0
9GIN
F RA
SF01
121
ULG
F020
08/
06/0
9GM
ID
CAPF
0112
1 Ne
t Ass
et-E
xistin
g Fu
nds
28,
41,5
55
1,93
0 -
21,3
7,57
6 2
9,01
,750
1,
445
- -
8,2
4,30
0 17
,44,
015
- 4
,181
49,
870
3,12
6 3
,040
To
tal
28,
41,5
55
1,93
0 -
21,3
7,57
6 2
9,01
,750
1,
445
- -
8,2
4,30
0 17
,44,
015
- 4
,181
49,
870
3,12
6 3
,040
(` ‘0
00)
Parti
cula
rsSc
hedu
le G
ROUP
MO
NEY
MAR
KET
FUND
1**
GRO
UP M
ONE
Y M
ARKE
T FU
ND 2
G
ROUP
PUR
E DE
BT
FUND
1**
GRO
UP P
URE
DEBT
FU
ND 2
**
GRO
UP P
URE
EQUI
TY
FUND
1
PEN
SIO
N DI
SCO
NTIN
UED
POLIC
Y FU
ND
PEN
SIO
N SM
ART
FUND
1 M
AKE
IN IN
DIA
FUND
T
OTA
L
SFIN
ULG
F006
24/
10/0
7GM
O N
MRK
T011
21
ULG
F009
30/
09/0
8GM
ON
MRK
T021
21
ULG
F010
30/
09/0
8GPU
RE
DEB0
1121
ULG
F011
30/
09/0
8GPU
R DE
BT02
121
ULG
F015
28/
11/0
8GPU
R EE
QF0
1121
U
LIF07
029/
08
/13P
DIS
POLF
0112
1 U
LIF06
810/
09
/12P
SMA
RTFU
0112
1
ULIF
0692
4/
03/1
5LM
AK E
INDI
A121
Net A
sset
-Exis
ting
Fund
s -
20,
73,2
15
- -
4,6
19
8,5
2,42
7 7
,04,
784
15,13
,880
7
,06,
50,6
05
Tota
l -
20,
73,2
15
- -
4,6
19
8,5
2,42
7 7
,04,
784
15,13
,880
7
,06,
50,6
05
** S
chem
es h
ave
beco
me
dorm
ant.

Annual Report 2018-19
310
Fund
Bal
ance
She
et
as a
t 31st
Mar
ch, 2
019
App
endi
x 6
(b)
Num
ber o
f Uni
ts o
utst
andi
ng(`
‘000
)
Parti
cula
rsSc
hedu
le
Cur
rent
Yea
r
DIS
CONT
INUE
D PO
LICY
FUND
LIFE
BA
LANC
ED
FUND
1
LIFE
CAP
ITAL
SECU
RE
FUND
1
LIFE
CO
RPO
RATE
BO
ND F
UND
1
LIFE
CO
RPO
RATE
BO
ND F
UND
2
LIFE
ENE
RGY
FUND
1 L
IFE E
NERG
Y FU
ND 2
L
IFE E
QUI
TY
FUND
1 L
IFE E
QUI
TY
FUND
2
LIFE
EQ
UITY
FU
ND 3
L
IFE G
ILT
FUND
1 L
IFE G
ILT
FUND
2
LIFE
GRO
WTH
FU
ND 1
LIFE
G
ROW
TH
FUND
2
SFIN
ULIF
0570
3/
09/1
0DIS
C PO
LF01
121
ULIF
0012
8/
07/0
4LBA
L AN
CE01
121
ULIF
0022
8/
07/0
4LCA
P TS
EC01
121
ULIF
0231
0/
06/0
8LCO
R BO
ND01
121
ULIF
0402
0/
08/0
9LCO
R BO
ND02
121
ULIF
0241
0/
06/0
8LEN
E RG
YF01
121
ULIF
0410
1/
01/1
0LEN
ER
GYF
0212
1
ULIF
0032
8/
07/0
4LEQ
U IT
YF01
121
ULIF
0251
0/
06/0
8LEQ
U IT
YF02
121
ULIF
0420
1/
01/1
0LEQ
U IT
YF03
121
ULIF
0261
0/
06/0
8LG
ILT
FUN0
1121
ULIF
0381
9/
03/0
9LG
ILT
FUN0
2121
ULIF
0042
8/
07/0
4LG
RO
WTH
F011
21
ULIF
0110
2/
11/0
7LG
RO
WTH
F021
21
Net A
sset
-Exis
ting
Fund
s 2
,18,8
16
34,
456
1,34
9 1,
24,3
75
1,27
9 11
,073
4
,421
2
2,99
3 2
,27,
482
6,9
7,57
9 2
2,54
5 7
79
4,5
27
8,19
7 To
tal
2,18
,816
3
4,45
6 1,
349
1,24
,375
1,
279
11,0
73
4,4
21
22,
993
2,2
7,48
2 6
,97,
579
22,
545
779
4
,527
8
,197
(` ‘0
00)
Parti
cula
rsSc
hedu
le
Cur
rent
Yea
r
LIFE
GRO
WTH
PL
US F
UND
1
LIF
E G
ROW
TH
PLU
S FU
ND
2
LIF
E G
UA
RAN
TEED
BO
ND
FU
ND
-
1**
LIF
E H
IGH
G
ROW
TH
FUN
D 1
LIF
E H
IGH
G
ROW
TH
FUN
D 2
LIF
E H
IGH
EST
NAV
G
UA
RAN
TEE
FUN
D 1
LIF
E H
IGH
EST
NAV
A
DVA
NTA
GE
FUN
D 1
LIF
E H
IGH
EST
NAV
A
DVA
NTA
GE
FUN
D 2
LIFE
IN
FRAS
TRUC
TURE
FU
ND 1
LIFE
IN
FRAS
TRUC
TURE
FU
ND 2
LIF
E M
IDCA
P FU
ND
1
LIF
E M
IDCA
P FU
ND
2
LIF
E M
ON
EY
MA
RKET
FU
ND
1
LIF
E M
ON
EY
MA
RKET
FU
ND
2
SFIN
ULI
F008
09/
04/0
7LG
RW
TPLS
0112
1
ULI
F043
01/
01/1
0LG
RW
TPLS
0212
1
ULI
F036
16/
12/0
8LG
UA
BO
ND
0112
1
ULI
F007
28/
02/0
7LH
IG
ROW
T011
21
ULI
F055
11/
01/1
0LH
IGR
OW
T021
21
ULI
F056
12/
02/1
0LH
NA
VG
UA
0112
1
ULI
F058
03/
09/1
0LH
NA
VA
DV0
1121
ULI
F059
01/
06/1
1LH
NAV
A
DV0
2121
ULI
F027
10/
06/0
8LIN
F RA
ST01
121
ULI
F044
01/
01/1
0LIN
FR
AST
0212
1
ULI
F028
10/
06/0
8LM
ID
CAPF
0112
1
ULI
F045
01/
01/1
0LM
IDC
APF
0212
1
ULIF
0291
0/
06/0
8LM
ON
MRK
T011
21
ULIF
0391
9/
03/0
9LM
ON
MRK
T021
21
Net A
sset
-Exis
ting
Fund
s 5
,041
7
65
- 13
,398
1,
083
2,5
7,94
3 9
9,41
1 11
,704
18
,772
8
,468
10
,305
2
1,719
9
8,37
4 1,
227
Tota
l 5
,041
7
65
-
13,
398
1,0
83
2,5
7,94
3 9
9,41
1 1
1,70
4 1
8,77
2 8
,468
1
0,30
5 2
1,71
9 9
8,37
4 1
,227
(` ‘0
00)
Parti
cula
rsSc
hedu
le
Cur
rent
Yea
r
LIFE
PUR
E DE
BT F
UND
1
LIF
E PU
RE
EQU
ITY
FUN
D 1
LIF
E PU
RE
EQU
ITY
FUN
D 2
LIF
E SU
PER
GRO
WTH
FU
ND
1
LIF
E SU
PER
GRO
WTH
FU
ND
2
REL
IAN
CE
ASS
URE
D
MAT
URI
TY
DEB
T FU
ND
PEN
SIO
N
BALA
NCE
D
FUN
D 1
PEN
SIO
N
BALA
NCE
D
FUN
D 2
PEN
SION
CAPI
TAL S
ECUR
E FU
ND 1
PEN
SION
CORP
ORAT
E BO
ND FU
ND 1
PEN
SIO
N
ENER
GY
FUN
D 1
**
PEN
SIO
N
ENER
GY
FUN
D 2
PEN
SIO
N
EQU
ITY
FUN
D 1
PEN
SIO
N
EQU
ITY
FUN
D 2
SFIN
ULI
F009
09/
04/0
7LPU
R D
EBT0
1121
ULI
F030
10/
06/0
8LPU
E Q
UTY
0112
1
ULI
F046
01/
01/1
0LPU
EQ
UTY
0212
1
ULI
F010
09/
04/0
7LSP
R G
RWT0
1121
ULI
F047
01/
01/1
0LSP
RG
RWT0
2121
ULI
F067
20/
12/1
1LA
SUR
MD
EBT1
21
ULI
F031
04/
12/0
8PBA
L A
NCE
0112
1
ULI
F048
01/
01/1
0PBA
LA
NCE
0212
1
ULI
F005
01/
11/0
6PCA
P TS
EC01
121
ULI
F019
01/
03/0
8PCO
R BO
ND
0112
1
ULI
F020
01/
03/0
8PEN
R G
YYF0
1121
ULI
F065
01/
01/1
0PEN
RG
YYF0
2121
ULIF
0060
1/
11/0
6PEQ
U IT
YF01
121
ULIF
0320
4/
12/0
8PEQ
U IT
YF02
121
Net A
sset
-Exis
ting
Fund
s 13
,771
2
0,07
9 1,
00,8
05
8,2
97
923
2
7,16
7 6
,014
2
,002
1,
131
163
- 2
,641
19
,017
3
0,22
3 To
tal
13,
771
20,
079
1,0
0,80
5 8
,297
9
23
27,
167
6,0
14
2,0
02
1,1
31
163
-
2
,641
1
9,01
7 3
0,22
3
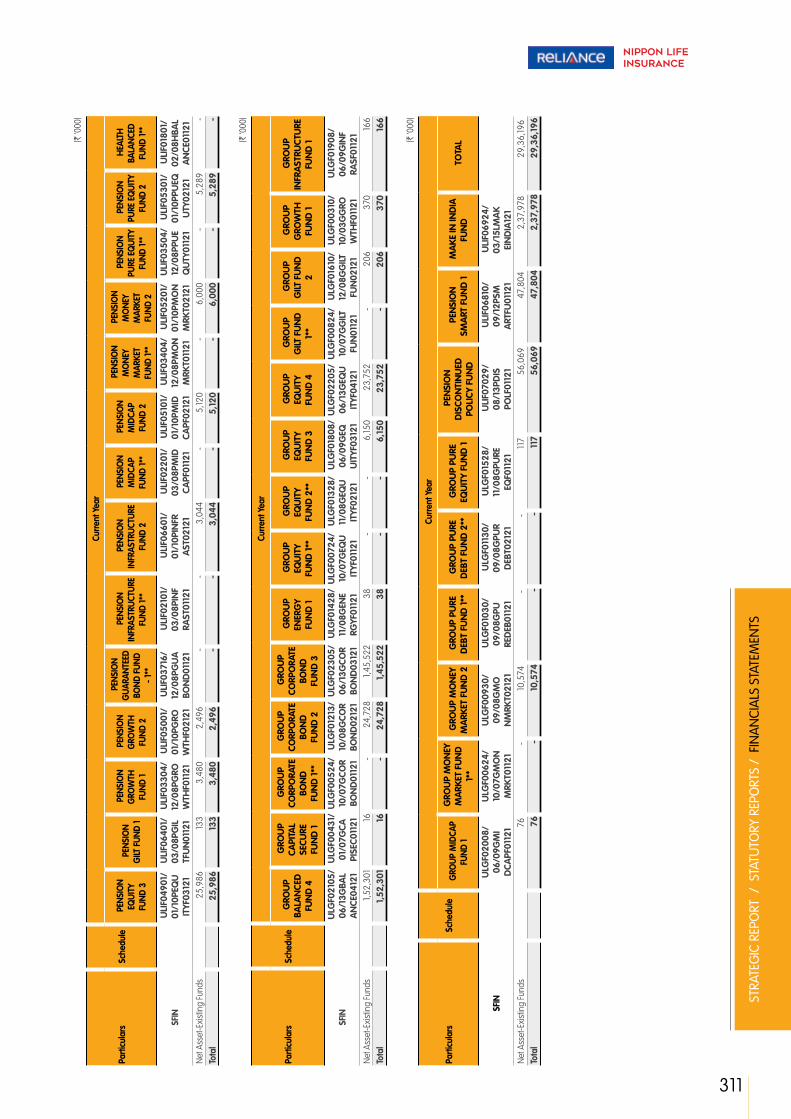
311
STRA
TEG
IC R
EPO
RT /
STA
TUTO
RY R
EPO
RTS
/ F
INA
NCI
ALS
STA
TEM
ENTS
(` ‘0
00)
Parti
cula
rsSc
hedu
le
Cur
rent
Yea
r
PEN
SIO
N EQ
UITY
FU
ND 3
PEN
SIO
N G
ILT F
UND
1
PEN
SIO
N G
ROW
TH
FUND
1
PEN
SIO
N G
ROW
TH
FUND
2
PEN
SIO
N G
UARA
NTEE
D BO
ND F
UND
- 1**
PEN
SIO
N IN
FRAS
TRUC
TURE
FU
ND 1*
*
PEN
SIO
N IN
FRAS
TRUC
TURE
FU
ND 2
PEN
SIO
N M
IDCA
P FU
ND 1*
*
PEN
SIO
N M
IDCA
P FU
ND 2
PEN
SIO
N M
ONE
Y M
ARKE
T FU
ND 1*
*
PEN
SIO
N M
ONE
Y M
ARKE
T FU
ND 2
PEN
SIO
N PU
RE E
QUI
TY
FUND
1**
PEN
SIO
N PU
RE E
QUI
TY
FUND
2
HEA
LTH
BA
LANC
ED
FUND
1**
SFIN
ULI
F049
01/
01/1
0PEQ
U
ITYF
0312
1
ULI
F064
01/
03/0
8PG
IL
TFU
N01
121
ULI
F033
04/
12/0
8PG
RO
WTH
F011
21
ULI
F050
01/
01/1
0PG
RO
WTH
F021
21
ULI
F037
16/
12/0
8PG
UA
BO
ND
0112
1
ULI
F021
01/
03/0
8PIN
F RA
ST01
121
ULI
F066
01/
01/1
0PIN
FR
AST
0212
1
ULI
F022
01/
03/0
8PM
ID
CAPF
0112
1
ULI
F051
01/
01/1
0PM
ID
CAPF
0212
1
ULI
F034
04/
12/0
8PM
ON
M
RKT0
1121
ULI
F052
01/
01/1
0PM
ON
M
RKT0
2121
ULI
F035
04/
12/0
8PPU
E Q
UTY
0112
1
ULI
F053
01/
01/1
0PPU
EQ
UTY
0212
1
ULI
F018
01/
02/0
8HBA
L A
NCE
0112
1 Ne
t Ass
et-E
xistin
g Fu
nds
25,
986
133
3,4
80
2,4
96
- -
3,0
44
- 5
,120
- 6
,000
-
5,2
89
- To
tal
25,
986
133
3
,480
2
,496
-
-
3
,044
-
5
,120
-
6
,000
-
5
,289
-
(` ‘0
00)
Parti
cula
rsSc
hedu
le
Cur
rent
Yea
r
GRO
UP
BALA
NCE
D
FUN
D 4
GRO
UP
CAPI
TAL
SECU
RE
FUN
D 1
GRO
UP
CORP
ORA
TE
BON
D
FUN
D 1
**
GRO
UP
CORP
ORA
TE
BON
D
FUN
D 2
GRO
UP
CORP
ORA
TE
BON
D
FUN
D 3
GRO
UP
ENER
GY
FUN
D 1
GRO
UP
EQU
ITY
FUN
D 1
**
GRO
UP
EQU
ITY
FUN
D 2
**
GRO
UP
EQU
ITY
FUN
D 3
GRO
UP
EQU
ITY
FUN
D 4
GRO
UP
GILT
FU
ND
1*
*
GRO
UP
GILT
FU
ND
2
GRO
UP
GRO
WTH
FU
ND
1
GRO
UP
INFR
AST
RUCT
URE
FU
ND
1
SFIN
ULG
F021
05/
06/1
3GBA
L A
NCE
0412
1
ULG
F004
31/
01/0
7GCA
PI
SEC0
1121
ULG
F005
24/
10/0
7GCO
R BO
ND
0112
1
ULG
F012
13/
10/0
8GCO
R BO
ND
0212
1
ULG
F023
05/
06/1
3GCO
R BO
ND
0312
1
ULG
F014
28/
11/0
8GEN
E RG
YF01
121
ULG
F007
24/
10/0
7GEQ
U
ITYF
0112
1
ULG
F013
28/
11/0
8GEQ
U
ITYF
0212
1
ULG
F018
08/
06/0
9GEQ
U
ITYF
0312
1
ULG
F022
05/
06/1
3GEQ
U
ITYF
0412
1
ULG
F008
24/
10/0
7GG
ILT
FUN
0112
1
ULG
F016
10/
12/0
8GG
ILT
FUN
0212
1
ULG
F003
10/
10/0
3GG
RO
WTH
F011
21
ULG
F019
08/
06/0
9GIN
F RA
SF01
121
Net A
sset
-Exis
ting
Fund
s 1,
52,3
01
16
- 2
4,72
8 1,
45,5
22
38
- -
6,15
0 2
3,75
2 -
206
3
70
166
Tota
l 1
,52,
301
16
-
24,
728
1,4
5,52
2 3
8 -
-
6
,150
2
3,75
2 -
2
06
370
1
66
(` ‘0
00)
Parti
cula
rsSc
hedu
le
Cur
rent
Yea
r
GRO
UP M
IDCA
P FU
ND 1
GRO
UP
MO
NEY
M
ARK
ET F
UN
D
1**
GRO
UP
MO
NEY
M
ARK
ET F
UN
D 2
G
ROU
P PU
RE
DEB
T FU
ND
1**
G
ROU
P PU
RE
DEB
T FU
ND
2**
G
ROU
P PU
RE
EQU
ITY
FUN
D 1
PEN
SIO
N
DIS
CON
TIN
UED
PO
LICY
FU
ND
PEN
SIO
N
SMA
RT F
UN
D 1
M
AKE
IN IN
DIA
FU
ND
T
OTA
L
SFIN
ULG
F020
08/
06/0
9GM
I D
CAPF
0112
1
ULG
F006
24/
10/0
7GM
ON
M
RKT0
1121
ULG
F009
30/
09/0
8GM
O
NM
RKT0
2121
ULG
F010
30/
09/0
8GPU
RE
DEB
0112
1
ULG
F011
30/
09/0
8GPU
R D
EBT0
2121
ULG
F015
28/
11/0
8GPU
RE
EQF0
1121
ULI
F070
29/
08/1
3PD
IS
POLF
0112
1
ULI
F068
10/
09/1
2PSM
A
RTFU
0112
1
ULI
F069
24/
03/1
5LM
AK
EIN
DIA
121
Net A
sset
-Exis
ting
Fund
s 7
6 -
10,5
74
- -
117
56,
069
47,
804
2,3
7,97
8 2
9,36
,196
Tota
l 7
6 -
1
0,57
4 -
-
1
17
56,
069
47,
804
2,3
7,97
8 2
9,36
,196

Annual Report 2018-19
312
Fund
Bal
ance
She
et
as a
t 31st
Mar
ch, 2
019
App
endi
x 6
(` ‘0
00)
Parti
cula
rsSc
hedu
le
Prev
ious
Yea
r
DI
SCO
NTIN
UED
POLIC
Y FU
ND
LIF
E BA
LAN
CED
FU
ND
1
LIF
E CA
PITA
L SE
CURE
FU
ND
1
LIF
E CO
RPO
RATE
BO
ND
FU
ND
1
LIF
E CO
RPO
RATE
BO
ND
FU
ND
2
LIF
E EN
ERG
Y FU
ND
1
LIF
E EN
ERG
Y FU
ND
2
LIF
E EQ
UIT
Y FU
ND
1
LIF
E EQ
UIT
Y FU
ND
2
LIF
E EQ
UIT
Y FU
ND
3
LIF
E G
ILT
FUN
D 1
L
IFE
GILT
FU
ND
2
LIF
E G
ROW
TH
FUN
D 1
LIF
E G
ROW
TH
FUN
D 2
SFIN
ULI
F057
03/
09/1
0DIS
C PO
LF01
121
ULI
F001
28/
07/0
4LBA
L A
NCE
0112
1
ULI
F002
28/
07/0
4LCA
P TS
EC01
121
ULI
F023
10/
06/0
8LCO
R BO
ND
0112
1
ULI
F040
20/
08/0
9LCO
R BO
ND
0212
1
ULI
F024
10/
06/0
8LEN
E RG
YF01
121
ULI
F041
01/
01/1
0LEN
E RG
YF02
121
ULI
F003
28/
07/0
4LEQ
U
ITYF
0112
1
ULI
F025
10/
06/0
8LEQ
U
ITYF
0212
1
ULI
F042
01/
01/1
0LEQ
U
ITYF
0312
1
ULI
F026
10/
06/0
8LG
IL
TFU
N01
121
ULI
F038
19/
03/0
9LG
ILT
FUN
0212
1
ULI
F004
28/
07/0
4LG
RO
WTH
F011
21
ULI
F011
02/
11/0
7LG
RO
WTH
F021
21
Net A
sset
-Exis
ting
Fund
s 2
,60,
925
33,
903
1,64
7 1,
51,2
68
1,54
2 16
,519
5
,437
2
6,13
3 3
,23,
503
7,0
2,77
0 3
0,72
2 9
47
5,3
85
11,2
84
Tota
l 2
,60,
925
33,
903
1,6
47
1,5
1,26
8 1
,542
1
6,51
9 5
,437
2
6,13
3 3
,23,
503
7,0
2,77
0 3
0,72
2 9
47
5,3
85
11,
284
(` ‘0
00)
Parti
cula
rsSc
hedu
le
Prev
ious
Yea
r
LIFE
G
ROW
TH
PLUS
FUN
D 1
LIFE
G
ROW
TH
PLUS
FUN
D 2
LIFE
G
UARA
NTEE
D BO
ND F
UND
- 1**
LIFE
HIG
H
GRO
WTH
FU
ND 1
LIFE
HIG
H
GRO
WTH
FU
ND 2
LIFE
H
IGH
EST
NAV
GUA
RANT
EE
FUND
1
LIFE
H
IGH
EST
NAV
ADVA
NTAG
E FU
ND 1
LIFE
H
IGH
EST
NAV
ADVA
NTAG
E FU
ND 2
LIFE
IN
FRAS
TRUC
TURE
FU
ND 1
LIFE
IN
FRAS
TRUC
TURE
FU
ND 2
LIFE
MID
CAP
FUND
1 L
IFE M
IDCA
P FU
ND 2
LIFE
M
ONE
Y M
ARKE
T FU
ND 1
LIFE
M
ONE
Y M
ARKE
T FU
ND 2
SFIN
ULIF
0080
9/
04/0
7LG
R W
TPLS
0112
1
ULIF
0430
1/
01/1
0LG
RW
TPLS
0212
1
ULIF
0361
6/
12/0
8LG
UA
BOND
0112
1
ULIF
0072
8/
02/0
7LH
IG
ROW
T011
21
ULIF
0551
1/
01/1
0LH
IGR
OW
T021
21
ULIF
0561
2/
02/1
0LH
NA
VGUA
0112
1
ULIF
0580
3/
09/1
0LH
NA
VADV
0112
1
ULIF
0590
1/
06/1
1LH
NA
VADV
0212
1
ULIF
0271
0/
06/0
8LIN
FR
AST0
1121
ULIF
0440
1/
01/1
0LIN
FR
AST0
2121
ULIF
0281
0/
06/0
8LM
ID
CAPF
0112
1
ULIF
0450
1/
01/1
0LM
IDC
APF0
2121
ULIF
0291
0/
06/0
8LM
ON
MRK
T011
21
ULIF
0391
9/
03/0
9LM
ON
MRK
T021
21
Net A
sset
-Exis
ting
Fund
s 11
,773
7
66
- 2
3,51
7 1,
193
2,6
9,87
6 1,
18,3
67
14,15
8 2
5,97
5 11
,780
15
,411
2
7,98
9 1,
14,10
3 1,
227
Tota
l 11
,773
7
66
- 2
3,51
7 1,
193
2,6
9,87
6 1,
18,3
67
14,15
8 2
5,97
5 11
,780
15
,411
2
7,98
9 1,
14,10
3 1,
227
(` ‘0
00)
Parti
cula
rsSc
hedu
le
Prev
ious
Yea
r
LIFE
PUR
E DE
BT F
UND
1
LIF
E PU
RE
EQU
ITY
FUN
D 1
LIF
E PU
RE
EQU
ITY
FUN
D 2
LIF
E SU
PER
GRO
WTH
FU
ND
1
LIF
E SU
PER
GRO
WTH
FU
ND
2
REL
IAN
CE
ASS
URE
D
MAT
URI
TY
DEB
T FU
ND
PEN
SIO
N
BALA
NCE
D
FUN
D 1
PEN
SIO
N
BALA
NCE
D
FUN
D 2
PEN
SIO
N
CAPI
TAL
SECU
RE
FUN
D 1
PEN
SIO
N
CORP
ORA
TE
BON
D
FUN
D 1
PEN
SIO
N
ENER
GY
FUN
D 1
**
PEN
SIO
N
ENER
GY
FUN
D 2
PEN
SIO
N
EQU
ITY
FUN
D 1
PEN
SIO
N
EQU
ITY
FUN
D 2
SFIN
ULI
F009
09/
04/0
7LPU
R D
EBT0
1121
ULI
F030
10/
06/0
8LPU
E Q
UTY
0112
1
ULI
F046
01/
01/1
0LPU
E Q
UTY
0212
1
ULI
F010
09/
04/0
7LSP
R G
RWT0
1121
ULI
F047
01/
01/1
0LSP
RG
RWT0
2121
ULI
F067
20/
12/1
1LA
SUR
MD
EBT1
21
ULI
F031
04/
12/0
8PBA
L A
NCE
0112
1
ULI
F048
01/
01/1
0PBA
LA
NCE
0212
1
ULI
F005
01/
11/0
6PCA
PT
SEC0
1121
ULI
F019
01/
03/0
8PCO
R BO
ND
0112
1
ULI
F020
01/
03/0
8PEN
R G
YYF0
1121
ULI
F065
01/
01/1
0PEN
R G
YYF0
2121
ULI
F006
01/
11/0
6PEQ
U
ITYF
0112
1
ULI
F032
04/
12/0
8PEQ
U
ITYF
0212
1 Ne
t Ass
et-E
xistin
g Fu
nds
18,7
24
26,
549
94,
533
15,2
01
990
3
0,41
7 7
,584
3
,422
1,
130
595
-
5,2
91
21,7
41
44,
753
Tota
l 18
,724
2
6,54
9 9
4,53
3 15
,201
9
90
30,
417
7,5
84
3,4
22
1,13
0 5
95
- 5
,291
2
1,741
4
4,75
3

313
STRA
TEG
IC R
EPO
RT /
STA
TUTO
RY R
EPO
RTS
/ F
INA
NCI
ALS
STA
TEM
ENTS
(` ‘0
00)
Parti
cula
rsSc
hedu
le
Prev
ious
Yea
r
PEN
SIO
N EQ
UITY
FU
ND 3
PEN
SIO
N G
ILT F
UND
1
PEN
SIO
N G
ROW
TH
FUND
1
PEN
SIO
N G
ROW
TH
FUND
2
PEN
SIO
N G
UARA
NTEE
D BO
ND F
UND
- 1**
PEN
SIO
N IN
FRAS
TRUC
TURE
FU
ND 1*
*
PEN
SIO
N IN
FRAS
TRUC
TURE
FU
ND 2
PEN
SIO
N M
IDCA
P FU
ND 1*
*
PEN
SIO
N M
IDCA
P FU
ND 2
PEN
SIO
N M
ONE
Y M
ARKE
T FU
ND 1*
*
PEN
SIO
N M
ONE
Y M
ARKE
T FU
ND 2
PEN
SIO
N PU
RE
EQUI
TY
FUND
1**
PEN
SIO
N PU
RE
EQUI
TY
FUND
2
HEA
LTH
BA
LANC
ED
FUND
1**
SFIN
ULIF
0490
1/
01/1
0PEQ
U IT
YF03
121
ULIF
0640
1/
03/0
8PG
IL TF
UN01
121
ULIF
0330
4/
12/0
8PG
RO
WTH
F011
21
ULIF
0500
1/
01/1
0PG
RO
WTH
F021
21
ULIF
0371
6/
12/0
8PG
UA
BOND
0112
1
ULIF
0210
1/
03/0
8PIN
F RA
ST01
121
ULIF
0660
1/
01/1
0PIN
FR
AST0
2121
ULIF
0220
1/
03/0
8PM
ID
CAPF
0112
1
ULIF
0510
1/
01/1
0PM
ID
CAPF
0212
1
ULIF
0340
4/
12/0
8PM
ON
MRK
T011
21
ULIF
0520
1/
01/1
0PM
ON
MRK
T021
21
ULIF
0350
4/
12/0
8PPU
E Q
UTY0
1121
ULIF
0530
1/
01/1
0PPU
E Q
UTY0
2121
ULIF
0180
1/
02/0
8HBA
L AN
CE01
121
Net A
sset
-Exis
ting
Fund
s 3
1,247
3
43
4,7
04
2,7
93
- -
6,16
1 -
8,2
85
- 6
,855
-
6,4
99
- To
tal
31,2
47
343
4
,704
2
,793
-
- 6
,161
- 8
,285
-
6,8
55
- 6
,499
-
(` ‘0
00)
Parti
cula
rsSc
hedu
le
Prev
ious
Yea
r
HEA
LTH
CO
RPO
RATE
BO
ND
FUND
1
HEA
LTH
EN
ERG
Y FU
ND 1
HEA
LTH
EQ
UITY
FU
ND 1
HEA
LTH
EQ
UITY
FU
ND 2
HEA
LTH
GILT
FU
ND 1
HEA
LTH
G
ROW
TH
PLUS
FUN
D 1
HEA
LTH
IN
FRAS
TRUC
TURE
FU
ND 1
HEA
LTH
M
IDCA
P FU
ND 1
HEA
LTH
M
ONE
Y M
ARKE
T FU
ND 1
HEA
LTH
PU
RE E
QUI
TY
FUND
1
HEA
LTH
SU
PER
GRO
WTH
FU
ND 1
GRO
UP
BALA
NCED
FU
ND 1
GRO
UP
BALA
NCED
FU
ND 2
GRO
UP
BALA
NCED
FU
ND 3
**
SFIN
ULIF
0630
1/
02/0
8HCO
R BO
ND01
121
ULIF
0600
1/
02/0
8HEN
E RG
YF01
121
ULIF
0120
1/
02/0
8HEQ
UI
TYF0
1121
ULIF
0541
1/
01/1
0HEQ
U IT
YF02
121
ULIF
0130
1/
02/0
8HG
IL TF
UN01
121
ULIF
0140
1/
02/0
8HG
RW
TPLS
0112
1
ULIF
0610
1/
02/0
8HIN
F RA
ST01
121
ULIF
0620
1/
02/0
8HM
ID
CAPF
0112
1
ULIF
0150
1/
02/0
8HM
ON
MRK
T011
21
ULIF
0160
1/
02/0
8HPU
E Q
UTY0
1121
ULIF
0170
1/
02/0
8HSP
R G
RWT0
1121
ULG
F001
10/
10/0
3GBA
L AN
CE01
121
ULG
F002
10/
10/0
3GBA
L AN
CE02
121
ULG
F017
18/
05/0
9GBA
L AN
CE03
121
Net A
sset
-Exis
ting
Fund
s 7
33
227
12
,898
1,
694
571
2
,212
2
92
235
4
95
1,24
7 1,
729
2,6
08
7,4
48
- To
tal
733
2
27
12,8
98
1,69
4 5
71
2,2
12
292
2
35
495
1,
247
1,72
9 2
,608
7
,448
-
(` ‘0
00)
Parti
cula
rsSc
hedu
le
Prev
ious
Yea
r
GRO
UP
BALA
NCED
FU
ND 4
GRO
UP
CAPI
TAL
SECU
RE
FUND
1
GRO
UP
CORP
ORA
TE
BOND
FUN
D 1*
*
GRO
UP
CORP
ORA
TE
BOND
FU
ND 2
GRO
UP
CORP
ORA
TE
BOND
FU
ND 3
GRO
UP
ENER
GY
FUND
1
GRO
UP
EQUI
TY
FUND
1**
GRO
UP
EQUI
TY
FUND
2**
GRO
UP
EQUI
TY
FUND
3
GRO
UP
EQUI
TY
FUND
4*
GRO
UP
GILT
FUN
D 1*
*
GRO
UP
GILT
FUN
D 2
GRO
UP
GRO
WTH
FU
ND 1
GRO
UP
INFR
ASTR
UCTU
RE
FUND
1
GRO
UP
MID
CAP
FUND
1
SFIN
ULG
F021
05/
06/1
3GBA
L AN
CE04
121
ULG
F004
31/
01/0
7GCA
P IS
EC01
121
ULG
F005
24/
10/0
7GCO
R BO
ND01
121
ULG
F012
13/
10/0
8GCO
R BO
ND02
121
ULG
F023
05/
06/1
3GCO
R BO
ND03
121
ULG
F014
28/
11/0
8GEN
E RG
YF01
121
ULG
F007
24/
10/0
7GEQ
U IT
YF01
121
ULG
F013
28/
11/0
8GEQ
U IT
YF02
121
ULG
F018
08/
06/0
9GEQ
U IT
YF03
121
ULG
F022
05/
06/1
3GEQ
U IT
YF04
121
ULG
F008
24/
10/0
7GG
ILT
FUN0
1121
ULG
F016
10/
12/0
8GG
ILT
FUN0
2121
ULG
F003
10/
10/0
3GG
RO
WTH
F011
21
ULG
F019
08/
06/0
9GIN
FR
ASF0
1121
ULG
F020
08/
06/0
9GM
ID
CAPF
0112
1 Ne
t Ass
et-E
xistin
g Fu
nds
2,0
4,33
4 8
3 -
95,
628
1,99
,921
5
6 -
- 2
4,55
1 1,
34,5
16
- 2
15
1,98
2 2
21
82
Tota
l 2
,04,
334
83
- 9
5,62
8 1,
99,9
21
56
- -
24,
551
1,34
,516
-
215
1,
982
221
8
2
(` ‘0
00)
Parti
cula
rsSc
hedu
le
Prev
ious
Yea
r
GRO
UP M
ONE
Y M
ARKE
T FU
ND 1*
* G
ROUP
MO
NEY
MAR
KET
FUND
2
GRO
UP P
URE
DEBT
FU
ND 1*
* G
ROUP
PUR
E DE
BT
FUND
2**
G
ROUP
PUR
E EQ
UITY
FUN
D 1
PEN
SIO
N DI
SCO
NTIN
UED
POLIC
Y FU
ND
PEN
SIO
N SM
ART
FUND
1 M
AKE
IN IN
DIA
FUND
T
OTA
L
SFIN
ULG
F006
24/ 1
0/07
GM
ON
MRK
T011
21
ULG
F009
30/
09/0
8GM
ON
MRK
T021
21
ULG
F010
30/
09/0
8GPU
RED
EB01
121
ULG
F011
30/ 0
9/08
GPU
R DE
BT02
121
ULG
F015
28/
11/0
8GPU
R EE
QF0
1121
ULIF
0702
9/
08/1
3PDI
S PO
LF01
121
ULIF
0681
0/
09/1
2PSM
A RT
FU01
121
ULIF
0692
4/
03/1
5LM
AK
EIND
IA12
1 Ne
t Ass
et-E
xistin
g Fu
nds
- 9
7,81
3 -
- 12
6 6
3,82
1 4
9,14
9 1,
13,9
75
35,
64,7
99
Tota
l -
97,
813
- -
126
63,
821
49,
149
1,13
,975
3
5,64
,799
** S
chem
es h
ave
beco
me
dorm
ant.

Annual Report 2018-19
314
Fund
Bal
ance
She
et
as a
t 31st
Mar
ch, 2
019
App
endi
x 6
(c)
NAV
per
Uni
t (a)
/(b)
(`)
(` ‘0
00)
Parti
cula
rsSc
hedu
le
Curre
nt Y
ear
DIS
CONT
INUE
D PO
LICY
FUND
LIF
E BA
LAN
CED
FU
ND
1
LIF
E CA
PITA
L SE
CURE
FU
ND
1
LIF
E CO
RPO
RATE
BO
ND
FU
ND
1
LIF
E CO
RPO
RATE
BO
ND
FU
ND
2
LIF
E EN
ERG
Y FU
ND
1
LIF
E EN
ERG
Y FU
ND
2
LIF
E EQ
UIT
Y FU
ND
1
LIF
E EQ
UIT
Y FU
ND
2
LIF
E EQ
UIT
Y FU
ND
3
LIF
E G
ILT
FUN
D 1
L
IFE
GILT
FU
ND
2
LIF
E G
ROW
TH
FUN
D 1
LIF
E G
ROW
TH
FUN
D 2
SFIN
ULI
F057
03
/09/
10D
ISC
POLF
0112
1
ULI
F001
28/
07/0
4LBA
L A
NCE
0112
1
ULI
F002
28/
07/0
4LCA
P TS
EC01
121
ULI
F023
10/
06/0
8LCO
R BO
ND
0112
1
ULI
F040
20/
08/0
9LCO
R BO
ND
0212
1
ULI
F024
10/
06/0
8LEN
E RG
YF01
121
ULI
F041
01/
01/1
0LEN
ER
GYF
0212
1
ULI
F003
28/
07/0
4LEQ
U
ITYF
0112
1
ULI
F025
10/
06/0
8LEQ
U
ITYF
0212
1
ULI
F042
01/
01/1
0LEQ
U
ITYF
0312
1
ULI
F026
10/
06/0
8LG
IL
TFU
N01
121
ULI
F038
19/
03/0
9LG
ILT
FUN
0212
1
ULI
F004
28/
07/0
4LG
RO
WTH
F011
21
ULI
F011
02/
11/0
7LG
RO
WTH
F021
21
Net A
sset
-Exis
ting
Fund
s 17
.943
0 3
1.748
6 2
5.22
98
22.
4477
2
2.59
30
19.4
706
16.8
122
64.
8897
2
9.40
01
23.
9747
2
0.64
36
20.
1771
3
6.33
48
22.
1284
(` ‘0
00)
Parti
cula
rsSc
hedu
le
Curre
nt Y
ear
LIFE
G
ROW
TH
PLUS
FU
ND 1
LIFE
G
ROW
TH
PLUS
FU
ND 2
LIFE
G
UARA
NTEE
D BO
ND F
UND
- 1**
LIFE
HIG
H
GRO
WTH
FU
ND 1
LIFE
HIG
H
GRO
WTH
FU
ND 2
LIFE
H
IGH
EST
NAV
GUA
RANT
EE
FUND
1
LIFE
H
IGH
EST
NAV
ADVA
NTAG
E FU
ND 1
LIFE
H
IGH
EST
NAV
ADVA
NTAG
E FU
ND 2
LIFE
IN
FRAS
TRUC
TURE
FU
ND 1
LIFE
IN
FRAS
TRUC
TURE
FU
ND 2
LIFE
M
IDCA
P FU
ND 1
LIFE
M
IDCA
P FU
ND 2
LIFE
MO
NEY
MAR
KET
FUND
1
LIFE
MO
NEY
MAR
KET
FUND
2
SFIN
ULIF
0080
9/
04/0
7LG
RW
TPLS
0112
1
ULIF
0430
1/
01/1
0LG
RW
TPLS
0212
1
ULIF
0361
6/
12/0
8LG
UA
BOND
0112
1
ULIF
0072
8/
02/0
7LH
IG
ROW
T011
21
ULIF
0551
1/
01/1
0LH
IGR
OW
T021
21
ULIF
0561
2/
02/1
0LH
NA
VGUA
0112
1
ULIF
0580
3/
09/1
0LH
NA
VADV
0112
1
ULIF
0590
1/
06/1
1LH
NAV
ADV0
2121
ULIF
0271
0/
06/0
8LIN
F RA
ST01
121
ULIF
0440
1/
01/1
0LIN
FR
AST0
2121
ULIF
0281
0/
06/0
8LM
ID
CAPF
0112
1
ULIF
0450
1/
01/1
0LM
ID
CAPF
0212
1
ULIF
0291
0/
06/0
8LM
ON
MRK
T011
21
ULIF
0391
9/
03/0
9LM
ON
MRK
T021
21
Net A
sset
-Exis
ting
Fund
s 2
7.96
09
21.4
577
- 2
8.63
59
21.3
016
17.3
895
14.9
936
17.2
497
11.7
677
12.0
815
28.
4394
2
5.81
25
20.
2709
19
.687
2
(` ‘0
00)
Parti
cula
rsSc
hedu
le
Curre
nt Y
ear
LIFE
PUR
E DE
BT F
UND
1
LIFE
PUR
E EQ
UITY
FU
ND 1
LIFE
PUR
E EQ
UITY
FU
ND 2
LIFE
SUP
ER
GRO
WTH
FU
ND 1
LIFE
SUP
ER
GRO
WTH
FU
ND 2
REL
IANC
E AS
SURE
D M
ATUR
ITY
DEBT
FUN
D
PEN
SIO
N BA
LANC
ED
FUND
1
PEN
SIO
N BA
LANC
ED
FUND
2
PEN
SIO
N CA
PITA
L SE
CURE
FU
ND 1
PEN
SIO
N CO
RPO
RATE
BO
ND
FUND
1
PEN
SIO
N EN
ERG
Y FU
ND 1*
*
PEN
SIO
N EN
ERG
Y FU
ND 2
PEN
SIO
N EQ
UITY
FU
ND 1
PEN
SIO
N EQ
UITY
FU
ND 2
SFIN
ULIF
0090
9/
04/0
7LPU
R DE
BT01
121
ULIF
0301
0/
06/0
8LPU
E Q
UTY0
1121
ULIF
0460
1/
01/1
0LPU
EQ
UTY0
2121
ULIF
0100
9/
04/0
7LSP
R G
RWT0
1121
ULIF
0470
1/
01/1
0LSP
RG
RWT0
2121
ULIF
0672
0/
12/1
1LAS
U RM
DEBT
121
ULIF
0310
4/
12/0
8PBA
L AN
CE01
121
ULIF
0480
1/
01/1
0PBA
LA
NCE0
2121
ULIF
0050
1/
11/0
6PCA
P TS
EC01
121
ULIF
0190
1/
03/0
8PCO
R BO
ND01
121
ULIF
0200
1/
03/0
8PEN
R G
YYF0
1121
ULIF
0650
1/
01/1
0PEN
RG
YYF0
2121
ULIF
0060
1/
11/0
6PEQ
U IT
YF01
121
ULIF
0320
4/
12/0
8PEQ
U IT
YF02
121
Net A
sset
-Exis
ting
Fund
s 2
4.42
69
27.
6766
2
0.98
82
26.
5750
2
2.43
89
17.2
090
31.6
414
19.8
210
25.
4002
2
3.23
03
10.0
000
16.4
929
32.
2188
2
8.26
34

315
STRA
TEG
IC R
EPO
RT /
STA
TUTO
RY R
EPO
RTS
/ F
INA
NCI
ALS
STA
TEM
ENTS
(` ‘0
00)
Parti
cula
rsSc
hedu
le
Curre
nt Y
ear
PEN
SIO
N EQ
UITY
FU
ND 3
PEN
SIO
N G
ILT F
UND
1
PEN
SIO
N G
ROW
TH
FUND
1
PEN
SIO
N G
ROW
TH
FUND
2
PEN
SIO
N G
UARA
NTEE
D BO
ND F
UND
- 1**
PEN
SIO
N IN
FRAS
TRUC
TURE
FU
ND 1*
*
PEN
SIO
N IN
FRAS
TRUC
TURE
FU
ND 2
PEN
SIO
N M
IDCA
P FU
ND 1*
*
PEN
SIO
N M
IDCA
P FU
ND 2
PEN
SIO
N M
ONE
Y M
ARKE
T FU
ND 1*
*
PEN
SIO
N M
ONE
Y M
ARKE
T FU
ND 2
PEN
SIO
N PU
RE
EQUI
TY
FUND
1**
PEN
SIO
N PU
RE E
QUI
TY
FUND
2
HEA
LTH
BA
LANC
ED
FUND
1**
SFIN
ULIF
0490
1/
01/1
0PEQ
U IT
YF03
121
ULIF
0640
1/
03/0
8PG
I LT
FUN0
1121
ULIF
0330
4/
12/0
8PG
RO
WTH
F011
21
ULIF
0500
1/
01/1
0PG
RO
WTH
F021
21
ULIF
0371
6/
12/0
8PG
UA
BOND
0112
1
ULIF
0210
1/
03/0
8PIN
F RA
ST01
121
ULIF
0660
1/
01/1
0PIN
F RA
ST02
121
ULIF
0220
1/
03/0
8PM
ID
CAPF
0112
1
ULIF
0510
1/
01/1
0PM
ID
CAPF
0212
1
ULIF
0340
4/
12/0
8PM
ON
MRK
T011
21
ULIF
0520
1/
01/1
0PM
ON
MRK
T021
21
ULIF
0350
4/
12/0
8PPU
E Q
UTY0
1121
ULIF
0530
1/
01/1
0PPU
E Q
UTY0
2121
ULIF
0180
1/
02/0
8HBA
L AN
CE01
121
Net A
sset
-Exis
ting
Fund
s 2
3.68
50
20.
7980
2
8.82
37
20.
7353
-
10.0
000
12.4
248
10.0
000
26.
0446
10
.000
0 17
.636
5 10
.000
0 2
1.270
8 -
(` ‘0
00)
Parti
cula
rsSc
hedu
le
Curre
nt Y
ear
HEA
LTH
CO
RPO
RATE
BO
ND
FUND
1
HEA
LTH
EN
ERG
Y FU
ND 1
HEA
LTH
EQ
UITY
FU
ND 1
HEA
LTH
EQ
UITY
FU
ND 2
HEA
LTH
GILT
FU
ND 1
HEA
LTH
G
ROW
TH
PLUS
FUN
D 1
HEA
LTH
INFR
ASTR
UCTU
RE
FUND
1
HEA
LTH
M
IDCA
P FU
ND 1
HEA
LTH
M
ONE
Y M
ARKE
T FU
ND 1
HEA
LTH
PU
RE E
QUI
TY
FUND
1
HEA
LTH
SU
PER
GRO
WTH
FU
ND 1
GRO
UP
BALA
NCED
FU
ND 1
GRO
UP
BALA
NCED
FU
ND 2
GRO
UP
BALA
NCED
FU
ND 3
**
SFIN
ULIF
0120
1/
02/0
8HEQ
U IT
YF01
121
ULIF
0600
1/
02/0
8HEN
E RG
YF01
121
ULIF
0120
1/
02/0
8HEQ
UI
TYF0
1121
ULIF
0541
1/
01/1
0HEQ
U IT
YF02
121
ULIF
0130
1/
02/0
8HG
IL TF
UN01
121
ULIF
0140
1/
02/0
8HG
R W
TPLS
0112
1
ULIF
0610
1/ 02
/08H
INF
RAST
0112
1
ULIF
0620
1/
02/0
8HM
ID
CAPF
0112
1
ULIF
0150
1/
02/0
8HM
ON
MRK
T011
21
ULIF
0160
1/
02/0
8HPU
E Q
UTY0
1121
ULIF
0170
1/
02/0
8HSP
R G
RWT0
1121
ULG
F001
10/
10/0
3GBA
L AN
CE01
121
ULG
F002
10/
10/0
3GBA
L AN
CE02
121
ULG
F017
18/
05/0
9GBA
L AN
CE03
121
Net A
sset
-Exis
ting
Fund
s 2
3.26
39
18.4
271
23.
2786
2
4.14
10
20.
8068
2
2.96
92
11.5
300
29.
8695
2
0.64
70
24.
8509
2
1.951
3 3
0.95
09
27.
0976
10
.000
0
(` ‘0
00)
Parti
cula
rsSc
hedu
le
Curre
nt Y
ear
GRO
UP
BALA
NCED
FU
ND 4
GRO
UP
CAPI
TAL
SECU
RE
FUND
1
GRO
UP
CORP
ORA
TE
BOND
FUN
D 1*
*
GRO
UP
CORP
ORA
TE
BOND
FU
ND 2
GRO
UP
CORP
ORA
TE
BOND
FU
ND 3
GRO
UP
ENER
GY
FUND
1
GRO
UP E
QUI
TY
FUND
1**
GRO
UP
EQUI
TY
FUND
2**
GRO
UP
EQUI
TY
FUND
3
GRO
UP
EQUI
TY
FUND
4
GRO
UP G
ILT
FUND
1**
GRO
UP G
ILT
FUND
2
GRO
UP
GRO
WTH
FU
ND 1
GRO
UP
INFR
ASTR
UCTU
RE
FUND
1
SFIN
ULG
F021
05/
06/1
3GBA
LA
NCE0
4121
ULG
F004
31/
01/0
7GCA
P IS
EC01
121
ULG
F005
24/
10/0
7GCO
RB
OND
0112
1
ULG
F012
13/
10/0
8GCO
RB
OND
0212
1
ULG
F023
05/
06/1
3GCO
R BO
ND03
121
ULG
F014
28/
11/0
8GEN
E RG
YF01
121
ULG
F007
24/
10/0
7GEQ
U TY
F011
21
ULG
F013
28/
11/0
8GEQ
U IT
YF02
121
ULG
F018
08/
06/0
9GEQ
U IT
YF03
121
ULG
F022
05/
06/1
3GEQ
U IT
YF04
121
ULG
F008
24/
10/0
7GG
ILTF
UN01
121
ULG
F016
10/
12/0
8GG
ILT
FUN0
2121
ULG
F003
10/
10/0
3GG
ROW
TH
F011
21
ULG
F019
08/
06/0
9GIN
FR
ASF0
1121
Ne
t Ass
et-E
xistin
g Fu
nds
14.9
242
24.
7154
-
23.
8303
15
.541
0 2
6.83
41
- 10
.000
0 3
7.12
75
14.5
522
- 2
1.047
0 2
7.21
09
13.8
729

Annual Report 2018-19
316
Fund
Bal
ance
She
et
as a
t 31st
Mar
ch, 2
019
App
endi
x 6
(` ‘0
00)
Parti
cula
rsSc
hedu
le
Cur
rent
Yea
r
GRO
UP M
IDCA
P FU
ND 1
GRO
UP M
ONE
Y M
ARKE
T FU
ND 1*
* G
ROUP
MO
NEY
MAR
KET
FUND
2
GRO
UP P
URE
DEBT
FUN
D 1*
* G
ROUP
PUR
E DE
BT F
UND
2**
GRO
UP P
URE
EQUI
TY F
UND
1
PEN
SIO
N DI
SCO
NTIN
UED
POLIC
Y FU
ND
PEN
SIO
N SM
ART
FUND
1 M
AKE
IN IN
DIA
FUND
T
OTA
L
SFIN
ULG
F020
08/
06/0
9GM
IDC
APF0
1121
ULG
F006
24/
10/0
7GM
ON
MRK
T011
21
ULG
F009
30/
09/0
8GM
ON
MRK
T021
21
ULG
F010
30/
09/0
8GPU
RE
DEB0
1121
ULG
F011
30/
09/0
8GPU
RD
EBT0
2121
ULG
F015
28/
11/0
8GPU
RE
EQF0
1121
ULIF
0702
9/
08/1
3PDI
S PO
LF01
121
ULIF
0681
0/
09/1
2PSM
A RT
FU01
121
ULIF
0692
4/
03/1
5LM
AK
EIND
IA12
1 Ne
t Ass
et-E
xistin
g Fu
nds
37.
0370
10
.000
0 2
1.266
7 10
.000
0 -
37.
9108
14
.206
9 15
.1722
14
.061
9
(` ‘0
00)
Parti
cula
rsSc
hedu
le
Prev
ious
Yea
r
DISC
ONTIN
UED
POLIC
Y FU
ND
LIFE
BA
LANC
ED
FUND
1
LIFE
CAP
ITAL
SECU
RE
FUND
1
LIFE
CO
RPO
RATE
BO
ND
FUND
1
LIFE
CO
RPO
RATE
BO
ND
FUND
2
LIFE
ENE
RGY
FUND
1 L
IFE E
NERG
Y FU
ND 2
L
IFE E
QUI
TY
FUND
1 L
IFE E
QUI
TY
FUND
2
LIFE
EQ
UITY
FU
ND 3
L
IFE G
ILT
FUND
1 L
IFE G
ILT
FUND
2
LIFE
G
ROW
TH
FUND
1
LIFE
G
ROW
TH
FUND
2
SFIN
ULIF
0570
3/
09/1
0DIS
CP
OLF
0112
1
ULIF
0012
8/
07/0
4LBA
L AN
CE01
121
ULIF
0022
8/
07/0
4LCA
PTS
EC01
121
ULIF
0231
0/
06/0
8LCO
RB
OND
0112
1
ULIF
0402
0/
08/0
9LCO
RB
OND
0212
1
ULIF
0241
0/
06/0
8LEN
ER
GYF
0112
1
ULIF
0410
1/
01/1
0LEN
ERG
YF
0212
1
ULIF
0032
8/
07/0
4LEQ
U IT
YF01
121
ULIF
0251
0/
06/0
8LEQ
UI
TYF0
2121
ULIF
0420
1/
01/1
0LEQ
UI
TYF0
3121
ULIF
0261
0/
06/0
8LG
ILTF
UN01
121
ULIF
0381
9/
03/0
9LG
ILTF
UN02
121
ULIF
0042
8/
07/0
4LG
RO
WTH
F011
21
ULIF
0110
2/
11/0
7LG
ROW
TH
F021
21
Net A
sset
-Exis
ting
Fund
s 16
.865
4 2
9.72
00
23.
8861
2
1.520
2 2
1.145
8 18
.832
1 16
.246
9 5
9.16
99
26.
5785
2
1.622
5 19
.1565
18
.670
8 3
3.76
83
20.
4849
(` ‘0
00)
Parti
cula
rsSc
hedu
le
Prev
ious
Yea
r
LIFE
GRO
WTH
PL
US F
UND
1
LIFE
G
ROW
TH
PLUS
FUN
D 2
LIFE
G
UARA
NTEE
D BO
ND F
UND
- 1**
LIFE
HIG
H
GRO
WTH
FU
ND 1
LIFE
HIG
H
GRO
WTH
FU
ND 2
LIFE
H
IGH
EST
NAV
GUA
RANT
EE
FUND
1
LIFE
H
IGH
EST
NAV
ADVA
NTAG
E FU
ND 1
LIFE
H
IGH
EST
NAV
ADVA
NTAG
E FU
ND 2
LIFE
IN
FRAS
TRUC
TURE
FU
ND 1
LIFE
IN
FRAS
TRUC
TURE
FU
ND 2
LIFE
M
IDCA
P FU
ND 1
LIFE
M
IDCA
P FU
ND 2
LIFE
MO
NEY
MAR
KET
FUND
1
LIFE
MO
NEY
MAR
KET
FUND
2
SFIN
ULIF
0080
9/
04/0
7LG
RW
TPLS
0112
1
ULIF
0430
1/
01/1
0LG
RW
TPLS
0212
1
ULIF
0361
6/
12/0
8LG
UAB
OND
0112
1
ULIF
0072
8/
02/0
7LH
IGR
OW
T011
21
ULIF
0551
1/
01/1
0LH
IGRO
W
T021
21
ULIF
0561
2/
02/1
0LH
NA
VGUA
0112
1
ULIF
0580
3/
09/1
0LH
NA
VADV
0112
1
ULIF
0590
1/
06/1
1LH
NA
VADV
0212
1
ULIF
0271
0/
06/0
8LIN
FR
AST0
1121
ULIF
0440
1/
01/1
0LIN
FR
AST0
2121
ULIF
0281
0/
06/0
8LM
IDC
APF0
1121
ULIF
0450
1/
01/1
0LM
IDC
APF0
2121
ULIF
0291
0/
06/0
8LM
ON
MRK
T011
21
ULIF
0391
9/
03/0
9LM
ON
MRK
T021
21
Net A
sset
-Exis
ting
Fund
s 2
5.91
56
19.9
335
- 2
6.34
72
19.7
803
16.4
046
13.7
243
15.4
695
12.0
830
12.3
971
28.
7568
2
6.23
25
20.
4353
19
.887
5

317
STRA
TEG
IC R
EPO
RT /
STA
TUTO
RY R
EPO
RTS
/ F
INA
NCI
ALS
STA
TEM
ENTS
(` ‘0
00)
Parti
cula
rsSc
hedu
le
Prev
ious
Yea
r
LIFE
PUR
E DEB
T FU
ND 1
LIFE
PUR
E EQ
UITY
FU
ND 1
LIFE
PUR
E EQ
UITY
FU
ND 2
LIFE
SUP
ER
GRO
WTH
FU
ND 1
LIFE
SUP
ER
GRO
WTH
FU
ND 2
REL
IANC
E AS
SURE
D M
ATUR
ITY
DEBT
FUN
D
PEN
SIO
N BA
LANC
ED
FUND
1
PEN
SIO
N BA
LANC
ED
FUND
2
PEN
SIO
N CA
PITA
L SE
CURE
FU
ND 1
PEN
SIO
N CO
RPO
RATE
BO
ND
FUND
1
PEN
SIO
N EN
ERG
Y FU
ND 1*
*
PEN
SIO
N EN
ERG
Y FU
ND 2
PEN
SIO
N EQ
UITY
FU
ND 1
PEN
SIO
N EQ
UITY
FU
ND 2
SFIN
ULI
F009
09/
04/0
7LPU
RD
EBT0
1121
ULI
F030
10/
06/0
8LPU
E Q
UTY
0112
1
ULI
F046
01/
01/1
0LPU
E Q
UTY
0212
1
ULI
F010
09/
04/0
7LSP
R G
RWT0
1121
ULI
F047
01/
01/1
0LSP
RG
RWT0
2121
ULI
F067
20/
12/1
1LA
SUR
MD
EBT1
21
ULI
F031
04/
12/0
8PBA
LA
NCE
0112
1
ULI
F048
01/
01/1
0PBA
L A
NCE
0212
1
ULI
F005
01/
11/0
6PCA
PT
SEC0
1121
ULI
F019
01/
03/0
8PCO
R BO
ND
0112
1
ULI
F020
01/
03/0
8PEN
R G
YYF0
1121
ULI
F065
01/
01/1
0PEN
RG
YYF0
2121
ULI
F006
01/
11/0
6PEQ
U
ITYF
0112
1
ULI
F032
04/
12/0
8PEQ
U
ITYF
0212
1 Ne
t Ass
et-E
xistin
g Fu
nds
22.
9126
2
6.65
19
20.
2700
2
4.33
24
20.
7130
16
.087
3 2
9.58
60
18.5
165
24.
0453
2
1.682
9 -
15.8
478
29.
3735
2
5.53
58
(` ‘0
00)
Parti
cula
rsSc
hedu
le
Prev
ious
Yea
r
PEN
SIO
N EQ
UITY
FUN
D 3
PEN
SIO
N G
ILT F
UND
1
PEN
SIO
N G
ROW
TH
FUND
1
PEN
SIO
N G
ROW
TH
FUND
2
PEN
SIO
N G
UARA
NTEE
D BO
ND F
UND
- 1**
PEN
SION
INFR
ASTR
UCTU
RE
FUND
1**
PEN
SION
INFR
ASTR
UCTU
RE
FUND
2
PEN
SIO
N M
IDCA
P FU
ND 1*
*
PEN
SIO
N M
IDCA
P FU
ND 2
PEN
SIO
N M
ONE
Y M
ARKE
T FU
ND 1*
*
PEN
SIO
N M
ONE
Y M
ARKE
T FU
ND 2
PEN
SIO
N PU
RE
EQUI
TY
FUND
1**
PEN
SIO
N PU
RE E
QUI
TY
FUND
2
HEA
LTH
BA
LANC
ED
FUND
1**
SFIN
ULIF
0490
1/
01/1
0PEQ
U IT
YF03
121
ULIF
0640
1/
03/0
8PG
ILT
FUN0
1121
ULIF
0330
4/
12/0
8PG
RO
WTH
F011
21
ULIF
0500
1/
01/1
0PG
RO
WTH
F021
21
ULIF
0371
6/
12/0
8PG
UA
BOND
0112
1
ULIF
0210
1/
03/0
8PIN
FR
AST0
1121
ULIF
0660
1/
01/1
0PIN
F RA
ST02
121
ULIF
0220
1/
03/0
8PM
ID
CAPF
0112
1
ULIF
0510
1/
01/1
0PM
IDC
APF0
2121
ULIF
0340
4/
12/0
8PM
ON
MRK
T011
21
ULIF
0520
1/
01/1
0PM
ON
MRK
T021
21
ULIF
0350
4/
12/0
8PPU
E Q
UTY0
1121
ULIF
0530
1/
01/1
0PPU
E Q
UTY0
2121
ULIF
0180
1/
02/0
8HBA
LA
NCE0
1121
Ne
t Ass
et-E
xistin
g Fu
nds
21.2
753
19.2
586
26.
8452
19
.1662
-
- 12
.707
3 -
26.
4617
-
17.8
910
- 2
0.43
09
-
(` ‘0
00)
Parti
cula
rsSc
hedu
le
Prev
ious
Yea
r
HEA
LTH
CO
RPO
RATE
BO
ND F
UND
1
HEA
LTH
EN
ERG
Y FU
ND 1
HEA
LTH
EQ
UITY
FU
ND 1
HEA
LTH
EQ
UITY
FU
ND 2
HEA
LTH
GILT
FU
ND 1
HEA
LTH
GROW
TH
PLUS
FUND
1
HEA
LTH
INFR
ASTR
UCTU
RE
FUND
1
HEA
LTH
M
IDCA
P FU
ND 1
HEA
LTH
M
ONE
Y M
ARKE
T FU
ND 1
HEA
LTH
PU
RE
EQUI
TY
FUND
1
HEA
LTH
SU
PER
GRO
WTH
FU
ND 1
GRO
UP
BALA
NCED
FU
ND 1
GRO
UP
BALA
NCED
FU
ND 2
GRO
UP
BALA
NCED
FU
ND 3
**
SFIN
ULIF
0630
1/
02/0
8HCO
R BO
ND01
121
ULIF
0600
1/
02/0
8HEN
E RG
YF01
121
ULIF
0120
1/
02/0
8HEQ
UI
TYF0
1121
ULIF
0541
1/
01/1
0HEQ
U IT
YF02
121
ULIF
0130
1/
02/0
8HG
IL TF
UN01
121
ULIF
0140
1/
02/0
8HG
R W
TPLS
0112
1
ULIF
0610
1/
02/0
8HIN
F RA
ST01
121
ULIF
0620
1/
02/0
8HM
ID
CAPF
0112
1
ULIF
0150
1/
02/0
8HM
ON
MRK
T011
21
ULIF
0160
1/
02/0
8HPU
E Q
UTY0
1121
ULIF
0170
1/
02/0
8HSP
RG
RWT0
1121
ULG
F001
10/
10/0
3GBA
L AN
CE01
121
ULG
F002
10/
10/0
3GBA
L AN
CE02
121
ULG
F017
18/
05/0
9GBA
LA
NCE0
3121
Ne
t Ass
et-E
xistin
g Fu
nds
21.9
240
17.6
837
21.1
941
21.7
274
19.2
882
21.3
752
11.7
821
30.
3203
2
0.84
03
23.
9507
2
0.40
86
28.
9808
2
5.12
13
-

Annual Report 2018-19
318
Fund
Bal
ance
She
et
as a
t 31st
Mar
ch, 2
019
App
endi
x 6
(` ‘0
00)
Parti
cula
rsSc
hedu
le
Prev
ious
Yea
r
GRO
UP
BALA
NCED
FU
ND 4
GRO
UP
CAPI
TAL
SECU
RE
FUND
1
GRO
UP
CORP
ORA
TE
BOND
FUN
D 1*
*
GRO
UP
CORP
ORA
TE
BOND
FU
ND 2
GRO
UP
CORP
ORA
TE
BOND
FU
ND 3
GRO
UP
ENER
GY
FUND
1
GRO
UP
EQUI
TY
FUND
1**
GRO
UP
EQUI
TY
FUND
2**
GRO
UP
EQUI
TY
FUND
3
GRO
UP
EQUI
TY
FUND
4*
GRO
UP
GILT
FUN
D 1*
*
GRO
UP
GILT
FUN
D 2
GRO
UP
GRO
WTH
FU
ND 1
GRO
UP
INFR
ASTR
UCTU
RE
FUND
1
GRO
UP
MID
CAP
FUND
1
SFIN
ULG
F021
05/
06/1
3GBA
L AN
CE04
121
ULG
F004
31/
01/0
7GCA
PI
SEC0
1121
ULG
F005
24/
10/0
7GCO
R BO
ND01
121
ULG
F012
13/
10/0
8GCO
R BO
ND02
121
ULG
F023
05/
06/1
3GCO
R BO
ND03
121
ULG
F014
28/
11/0
8GEN
E RG
YF01
121
ULG
F007
24/
10/0
7GEQ
U IT
YF01
121
ULG
F013
28/
11/0
8GEQ
UI
TYF0
2121
ULG
F018
08/
06/0
9GEQ
U IT
YF03
121
ULG
F022
05
/06/
13G
EQU
ITYF
0412
1
ULG
F008
24/
10/0
7GG
ILT
FUN0
1121
ULG
F016
10/
12/0
8GG
IL TF
UN02
121
ULG
F003
10/
10/0
3GG
RO
WTH
F011
21
ULG
F019
08/
06/0
9GIN
FR
ASF0
1121
ULG
F020
08/
06/0
9GM
ID
CAPF
0112
1 Ne
t Ass
et-E
xistin
g Fu
nds
13.9
064
23.
3131
-
22.
3530
14
.514
5 2
5.84
40
- -
33.
5748
12
.965
1 -
19.4
224
25.
1579
14
.1459
3
7.19
67
(` ‘0
00)
Parti
cula
rsSc
hedu
le
Prev
ious
Yea
r
GRO
UP M
ONE
Y M
ARKE
T FU
ND 1*
* G
ROUP
MO
NEY
MAR
KET
FUND
2
GRO
UP P
URE
DEBT
FU
ND 1*
* G
ROUP
PUR
E DE
BT
FUND
2**
G
ROUP
PUR
E EQ
UITY
FUN
D 1
PEN
SIO
N DI
SCO
NTIN
UED
POLIC
Y FU
ND
PEN
SIO
N SM
ART
FUND
1 M
AKE
IN IN
DIA
FUND
T
OTA
L
SFIN
ULG
F006
24/ 1
0/07
GM
ON
MRK
T011
21
ULG
F009
30/
09/0
8GM
ON
MRK
T021
21
ULG
F010
30/
09/0
8GPU
R ED
EB01
121
ULG
F011
30/ 0
9/08
GPU
R DE
BT02
121
ULG
F015
28/
11/0
8GPU
R EE
QF0
1121
ULIF
0702
9/
08/1
3PDI
SP O
LF01
121
ULIF
0681
0/
09/1
2PSM
A RT
FU01
121
ULIF
0692
4/
03/1
5LM
AKE
INDI
A121
Ne
t Ass
et-E
xistin
g Fu
nds
- 2
1.195
7 -
- 3
6.57
59
13.3
566
14.3
398
13.2
826
Tota
l
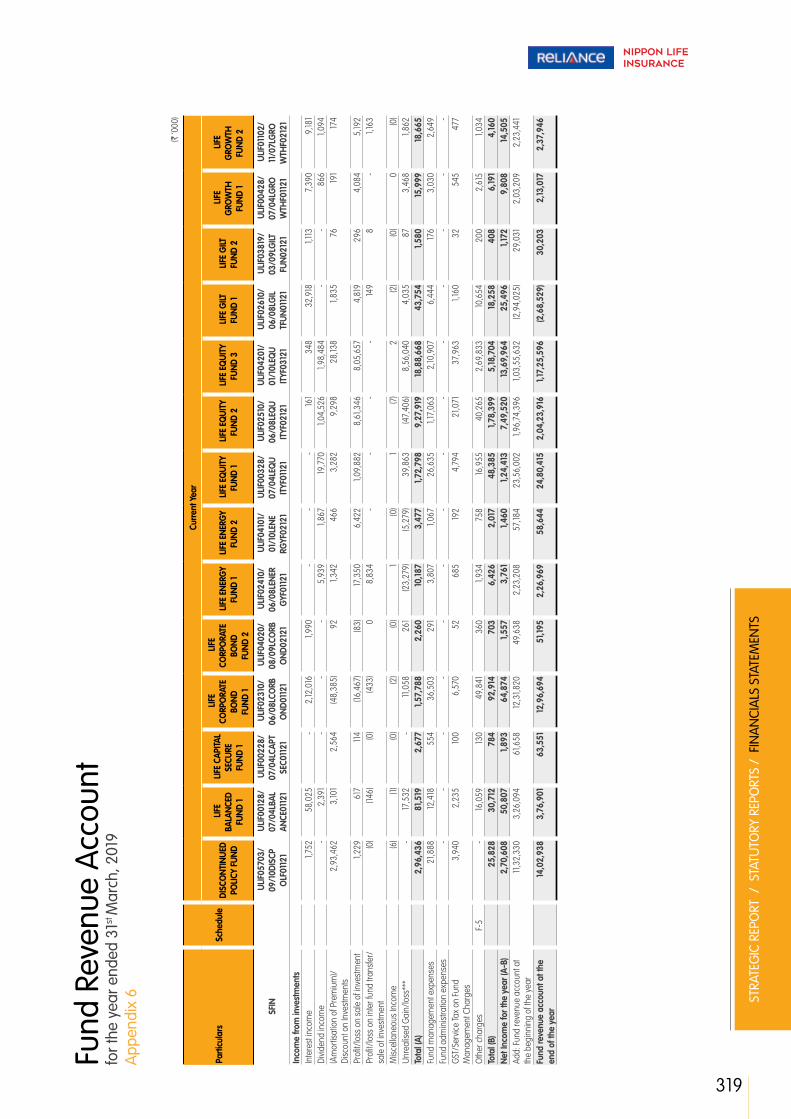
319
STRA
TEG
IC R
EPO
RT /
STA
TUTO
RY R
EPO
RTS
/ F
INA
NCI
ALS
STA
TEM
ENTS
Fund
Rev
enue
Acc
ount
fo
r the
yea
r end
ed 3
1st M
arch
, 201
9 A
ppen
dix
6
(` ‘0
00)
Parti
cula
rsSc
hedu
le
Cur
rent
Yea
r
DISC
ONT
INUE
D PO
LICY
FUND
LIFE
BA
LANC
ED
FUND
1
LIFE
CAP
ITAL
SECU
RE
FUND
1
LIFE
CO
RPO
RATE
BO
ND
FUND
1
LIFE
CO
RPO
RATE
BO
ND
FUND
2
LIFE
ENE
RGY
FUND
1 L
IFE E
NERG
Y FU
ND 2
L
IFE E
QUI
TY
FUND
1 L
IFE E
QUI
TY
FUND
2
LIFE
EQ
UITY
FU
ND 3
L
IFE G
ILT
FUND
1 L
IFE G
ILT
FUND
2
LIFE
G
ROW
TH
FUND
1
LIFE
G
ROW
TH
FUND
2
SFIN
ULIF
0570
3/
09/1
0DIS
CP
OLF
0112
1
ULIF
0012
8/
07/0
4LBA
L AN
CE01
121
ULIF
0022
8/
07/0
4LCA
PT
SEC0
1121
ULIF
0231
0/
06/0
8LCO
RB
OND
0112
1
ULIF
0402
0/
08/0
9LCO
RB
OND
0212
1
ULIF
0241
0/
06/0
8LEN
ER
GYF
0112
1
ULIF
0410
1/
01/1
0LEN
E RG
YF02
121
ULIF
0032
8/
07/0
4LEQ
U IT
YF01
121
ULIF
0251
0/
06/0
8LEQ
U IT
YF02
121
ULIF
0420
1/
01/1
0LEQ
U IT
YF03
121
ULIF
0261
0/
06/0
8LG
IL TF
UN01
121
ULIF
0381
9/
03/0
9LG
ILT
FUN0
2121
ULIF
0042
8/
07/0
4LG
RO
WTH
F011
21
ULIF
0110
2/
11/0
7LG
RO
WTH
F021
21
Inco
me
from
inve
stm
ents
Inte
rest
inco
me
1,75
2 5
8,02
5 -
2,12
,016
1,
990
- -
- 16
1 3
48
32,
918
1,11
3 7
,390
9
,181
Divid
end
inco
me
- 2
,391
-
- -
5,9
39
1,86
7 19
,770
1,
04,5
26
1,98
,484
-
- 8
66
1,09
4 (A
mor
tisat
ion
of P
rem
ium
)/Di
scou
nt o
n In
vest
men
ts 2
,93,
462
3,10
1 2
,564
(4
8,38
5) 9
2 1,
342
466
3
,282
9
,298
2
8,13
8 1,
835
76
191
174
Profi
t/los
s on
sal
e of
inve
stm
ent
1,22
9 6
17
114
(16,
467)
(83)
17,3
50
6,4
22
1,09
,882
8
,61,3
46
8,0
5,65
7 4
,819
2
96
4,0
84
5,19
2 Pr
ofit/l
oss
on in
ter f
und
trans
fer/
sa
le o
f inv
estm
ent
(0)
(146
) (0
) (4
33)
0
8,8
34
- -
- -
149
8
- 1,
163
Misc
ella
neou
s In
com
e (6
) (1
) (0
) (2
) (0
) 1
(0)
1 (7
) 2
(2
) (0
) 0
(0
)Un
real
ised
Gain
/loss
***
- 17
,532
-
11,0
58
261
(2
3,27
9) (5
,279
) 3
9,86
3 (4
7,40
6) 8
,56,
040
4,0
35
87
3,4
68
1,86
2 To
tal (
A) 2
,96,
436
81,5
19
2,6
77
1,57
,788
2
,260
10
,187
3,4
77
1,72
,798
9
,27,
919
18,8
8,66
8 4
3,75
4 1,
580
15,9
99
18,6
65
Fund
man
agem
ent e
xpen
ses
21,8
88
12,4
18
554
3
6,50
3 2
91
3,8
07
1,06
7 2
6,63
5 1,
17,0
63
2,10
,907
6
,444
17
6 3
,030
2
,649
Fu
nd a
dmin
istra
tion
expe
nses
- -
- -
- -
- -
- -
- -
- -
GST/
Serv
ice Ta
x on
Fund
M
anag
emen
t Cha
rges
3,9
40
2,2
35
100
6,5
70
52
685
19
2 4
,794
2
1,071
3
7,96
3 1,
160
32
545
4
77
Oth
er c
harg
es
F-
5 -
16,0
59
130
49,
841
360
1,
934
758
16
,955
4
0,26
5 2
,69,
833
10,6
54
200
2
,615
1,
034
Tota
l (B)
25,
828
30,
712
784
9
2,91
4 7
03
6,4
26
2,0
17
48,
385
1,78
,399
5
,18,7
04
18,2
58
408
6
,191
4,16
0 Ne
t Inc
ome
for t
he y
ear (
A-B)
2,7
0,60
8 5
0,80
7 1,
893
64,
874
1,55
7 3
,761
1,
460
1,24
,413
7
,49,
520
13,6
9,96
4 2
5,49
6 1,
172
9,8
08
14,5
05
Add:
Fund
reve
nue
acco
unt a
t th
e be
ginn
ing
of th
e ye
ar 11
,32,
330
3,2
6,09
4 6
1,658
12
,31,8
20
49,
638
2,2
3,20
8 5
7,18
4 2
3,56
,002
1,
96,7
4,39
6 1,
03,5
5,63
2 (2
,94,
025)
29,
031
2,0
3,20
9 2
,23,
441
Fund
reve
nue
acco
unt a
t the
en
d of
the
year
14,0
2,93
8 3
,76,
901
63,
551
12,9
6,69
4 5
1,195
2
,26,
969
58,
644
24,
80,4
15
2,0
4,23
,916
1,
17,2
5,59
6 (2
,68,
529)
30,
203
2,13
,017
2
,37,
946

Annual Report 2018-19
320
Fund
Rev
enue
Acc
ount
fo
r the
yea
r end
ed 3
1st M
arch
, 201
9 A
ppen
dix
6
(` ‘0
00)
Parti
cula
rsSc
hedu
le
Cur
rent
Yea
r
LIFE
GRO
WTH
PL
US F
UND
1
LIFE
G
ROW
TH
PLUS
FU
ND 2
LIFE
GU
ARAN
TEED
BO
ND FU
ND
- 1**
LIFE
HIG
H
GRO
WTH
FU
ND 1
LIFE
HIG
H
GRO
WTH
FU
ND 2
LIFE
H
IGH
EST
NAV
GUA
RANT
EE
FUND
1
LIFE
H
IGH
EST
NAV
ADVA
NTAG
E FU
ND 1
LIFE
H
IGH
EST
NAV
ADVA
NTAG
E FU
ND 2
LIFE
IN
FRAS
TRUC
TURE
FU
ND 1
LIFE
IN
FRAS
TRUC
TURE
FU
ND 2
LIFE
M
IDCA
P FU
ND 1
LIFE
M
IDCA
P FU
ND 2
LIFE
MO
NEY
MAR
KET
FUND
1
LIFE
MO
NEY
MAR
KET
FUND
2
SFIN
ULIF
0080
9/
04/0
7LG
RW
TPLS
0112
1
ULIF
0430
1/
01/1
0LG
RW
TPLS
0212
1
ULIF
0361
6/
12/0
8LG
UAB
OND
0112
1
ULIF
0072
8/
02/0
7LH
IGR
OW
T011
21
ULIF
0551
1/
01/1
0LH
IG
ROW
T021
21
ULIF
0561
2/
02/1
0LH
NAV
GUA
0112
1
ULIF
0580
3/
09/1
0LH
NAV
ADV0
1121
ULIF
0590
1/
06/1
1LH
NAV
ADV0
2121
ULIF
0271
0/
06/0
8LIN
F RA
ST01
121
ULIF
0440
1/
01/1
0LIN
FR
AST0
2121
ULIF
0281
0/
06/0
8LM
ID
CAPF
0112
1
ULIF
0450
1/
01/1
0LM
IDC
APF0
2121
ULIF
0291
0/
06/0
8LM
ON
MRK
T011
21
ULIF
0391
9/
03/0
9LM
ON
MRK
T021
21
Inco
me
from
inve
stm
ents
Inte
rest
inco
me
9,2
48
546
-
15,7
57
695
3
,19,4
00
- -
- -
- -
1,22
6 -
Divid
end
inco
me
1,47
3 9
5 -
4,0
57
170
- 18
,694
3
,099
6
,843
3
,090
3
,144
5,4
35
- -
(Am
ortis
atio
n of
Pre
miu
m)/
Disc
ount
on
Inve
stm
ents
301
5
6 -
926
5
7 2
6,81
3 3
2,37
7 1,
819
1,05
1 5
13
1,61
9 3
,030
11
,686
5
0
Profi
t/los
s on
sal
e of
inve
stm
ent
12,5
59
(44)
- 2
9,87
3 8
3 (6
,086
) 1,
12,8
85
17,3
51
3,2
53
2,5
58
7,0
20
16,0
34
1,67
0 7
6 Pr
ofit/l
oss
on in
ter f
und
trans
fer/
sa
le o
f inv
estm
ent
13,7
62
82
- 6
,050
16
(0
) (0
) -
(1,5
37)
2,4
93
17,0
04
374
(0
) 0
Misc
ella
neou
s In
com
e 1
(0)
- 0
(0
) (6
) (6
) (1
) 2
0
(0
) (1
) 0
(0
)Un
real
ised
Gain
/loss
***
(17,
911)
674
-
(7,19
6) 1,
049
(8,0
40)
8,4
82
5,5
41
(12,
751)
(9,9
05)
(27,
877)
(25,
740)
- -
Tota
l (A)
19,4
34
1,40
8 -
49,
469
2,0
69
3,3
2,08
1 1,
72,4
31
27,
809
(3,13
8) (1
,250
) 9
10
(867
) 14
,583
12
6 Fu
nd m
anag
emen
t exp
ense
s 3
,244
2
04
- 7
,308
3
13
65,
650
25,
201
3,4
60
3,9
47
1,61
7 5
,405
8
,477
2
7,32
5 2
33
Fund
adm
inist
ratio
n ex
pens
es -
- -
- -
- -
- -
- -
- -
- GS
T/Se
rvice
Tax
on Fu
nd
Man
agem
ent C
harg
es 5
84
37
- 1,
315
56
11,8
17
4,5
36
623
7
11
291
9
73
1,52
6 4
,919
4
2
Oth
er c
harg
es
F-
5 1,
170
37
- 1,
870
35
14,0
67
29,
659
3,5
14
2,3
72
1,41
7 1,
800
3,9
37
39,
001
251
To
tal (
B) 4
,998
2
78
- 10
,494
4
04
91,5
34
59,
396
7,5
97
7,0
30
3,3
25
8,17
7 13
,940
7
1,245
5
26
Net I
ncom
e fo
r the
yea
r (A-
B) 14
,436
1,
130
- 3
8,97
5 1,
665
2,4
0,54
7 1,
13,0
35
20,
212
(10,
168)
(4,5
75)
(7,2
67)
(14,
807)
(56,
662)
(400
)Ad
d: Fu
nd re
venu
e ac
coun
t at
the
begi
nnin
g of
the
year
5,7
1,484
18
,016
7
7,65
2 17
,15,3
73
29,
187
28,
98,3
51
4,3
4,56
1 1,
15,0
23
83,
253
74,
401
7,3
0,38
5 9
,48,
739
7,6
9,82
9 2
8,47
6
Fund
reve
nue
acco
unt a
t the
en
d of
the
year
5,8
5,92
0 19
,146
77,
652
17,5
4,34
8 3
0,85
2 3
1,38,
898
5,4
7,59
6 1,
35,2
35
73,
085
69,
826
7,2
3,11
8 9
,33,
932
7,13
,167
28,
076

321
STRA
TEG
IC R
EPO
RT /
STA
TUTO
RY R
EPO
RTS
/ F
INA
NCI
ALS
STA
TEM
ENTS
(` ‘0
00)
Parti
cula
rsSc
hedu
le
Cur
rent
Yea
r
LIFE
PUR
E DE
BT F
UND
1
LIFE
PUR
E EQ
UITY
FU
ND 1
LIFE
PUR
E EQ
UITY
FU
ND 2
LIFE
SUP
ER
GRO
WTH
FU
ND 1
LIFE
SUP
ER
GRO
WTH
FU
ND 2
REL
IANC
E AS
SURE
D M
ATUR
ITY
DEBT
FUN
D
PEN
SIO
N BA
LANC
ED
FUND
1
PEN
SIO
N BA
LANC
ED
FUND
2
PEN
SIO
N CA
PITA
L SE
CURE
FU
ND 1
PEN
SIO
N CO
RPO
RATE
BO
ND F
UND
1
PEN
SIO
N EN
ERG
Y FU
ND 1*
*
PEN
SIO
N EN
ERG
Y FU
ND 2
PEN
SIO
N EQ
UITY
FU
ND 1
PEN
SIO
N EQ
UITY
FU
ND 2
SFIN
ULIF
0090
9/
04/0
7LPU
R DE
BT01
121
ULIF
0301
0/
06/0
8LPU
EQ
UTY0
1121
ULIF
0460
1/
01/1
0LPU
EQ
UTY0
2121
ULIF
0100
9/
04/0
7LSP
RG
RWT0
1121
ULIF
0470
1/
01/1
0LSP
RG
RWT0
2121
ULIF
0672
0/
12/1
1LAS
UR
MDE
BT12
1
ULIF
0310
4/
12/0
8PBA
L AN
CE01
121
ULIF
0480
1/
01/1
0PBA
L AN
CE02
121
ULIF
0050
1/
11/0
6PCA
P TS
EC01
121
ULIF
0190
1/
03/0
8PCO
R BO
ND01
121
ULIF
0200
1/
03/0
8PEN
R G
YYF0
1121
ULIF
0650
1/
01/1
0PEN
RG
YYF0
2121
ULIF
0060
1/
11/0
6PEQ
U IT
YF01
121
ULIF
0320
4/
12/0
8PEQ
U IT
YF02
121
Inco
me
from
inve
stm
ents
Inte
rest
inco
me
26,
962
- 7
6 4
,731
2
91
38,
099
12,16
5 2
,519
0
5
21
- -
- -
Divid
end
inco
me
- 11
,933
3
5,70
5 3
,172
202
-
507
10
6 -
- -
1,20
1 8
,159
13,6
08
(Am
ortis
atio
n of
Pre
miu
m)/
Disc
ount
on
Inve
stm
ents
996
2
,491
10
,088
4
97
59
583
2
04
91
1,91
2 3
1 -
258
1,
401
1,26
9
Profi
t/los
s on
sal
e of
inve
stm
ent
(1,6
85)
46,
989
91,0
81
33,
108
732
4
84
489
19
1 9
5 3
6 -
7,0
59
33,
600
1,22
,385
Pr
ofit/l
oss
on in
ter f
und
trans
fer/
sa
le o
f inv
estm
ent
562
2
,755
7
,594
3
,445
-
(106
) (5
8) 4
54
(0)
(221
) -
500
-
12,7
79
Misc
ella
neou
s In
com
e (0
) 1
1 (0
) (0
) (0
) 0
0
0
(0
) -
(0)
(1)
2
Unre
alise
d Ga
in/lo
ss**
* 1,
839
(29,
040)
(39,
127)
(13,
924)
675
(2
,365
) 3
,665
18
5 -
124
- (6
,530
) 2
7,52
1 (2
9,26
3)To
tal (
A) 2
8,67
4 3
5,12
9 1,
05,4
19
31,0
27
1,95
9 3
6,69
5 16
,972
3
,544
2
,007
4
91
- 2
,487
7
0,68
0 1,
20,7
79
Fund
man
agem
ent e
xpen
ses
4,8
16
9,9
99
26,
460
4,4
98
276
4
,682
3
,093
5
90
415
9
8 -
721
10
,957
15
,163
Fund
adm
inist
ratio
n ex
pens
es -
- -
- -
- -
- -
- -
- -
- GS
T/Se
rvice
Tax
on Fu
nd
Man
agem
ent C
harg
es 8
67
1,80
0 4
,763
8
10
50
843
5
57
106
75
18
- 13
0 1,
972
2,7
29
Oth
er c
harg
es
F-
5 2
4
,143
39,
258
1,20
0 7
6 3
,029
3
37
99
38
46
6
200
8
22
1,75
7 To
tal (
B) 5
,685
15
,942
7
0,48
1 6
,507
4
02
8,5
54
3,9
87
795
5
28
162
6
1,05
0 13
,752
19
,649
Ne
t Inc
ome
for t
he y
ear (
A-B)
22,
989
19,18
7 3
4,93
8 2
4,52
0 1,
557
28,
141
12,9
85
2,7
49
1,47
9 3
29
(6)
1,43
7 5
6,92
8 1,
01,13
0 Ad
d: Fu
nd re
venu
e ac
coun
t at
the
begi
nnin
g of
the
year
5,6
6,31
5 9
,93,
444
8,8
4,59
0 8
,10,8
81
26,
975
1,98
,363
3
,26,
632
96,
886
68,
185
27,
566
47,
275
54,
534
16,5
9,35
2 2
9,60
,606
Fund
reve
nue
acco
unt a
t the
en
d of
the
year
5,8
9,30
4 10
,12,6
31
9,19
,528
8
,35,
401
28,
532
2,2
6,50
4 3
,39,
617
99,
635
69,
664
27,
895
47,
269
55,
971
17,16
,280
3
0,61
,736

Annual Report 2018-19
322
Fund
Rev
enue
Acc
ount
fo
r the
yea
r end
ed 3
1st M
arch
, 201
9 A
ppen
dix
6
(` ‘0
00)
Parti
cula
rsSc
hedu
le
Cur
rent
Yea
r
PEN
SIO
N EQ
UITY
FU
ND 3
PEN
SIO
N G
ILT F
UND
1
PEN
SIO
N G
ROW
TH
FUND
1
PEN
SIO
N G
ROW
TH
FUND
2
PEN
SION
GUAR
ANTE
ED
BOND
FUND
- 1
**
PENS
ION
INFR
ASTR
UCTU
RE
FUND
1**
PENS
ION
INFR
ASTR
UCTU
RE
FUND
2
PEN
SIO
N M
IDCA
P FU
ND 1*
*
PEN
SIO
N M
IDCA
P FU
ND 2
PEN
SIO
N M
ONE
Y M
ARKE
T FU
ND 1*
*
PEN
SIO
N M
ONE
Y M
ARKE
T FU
ND 2
PEN
SIO
N PU
RE
EQUI
TY
FUND
1**
PEN
SIO
N PU
RE
EQUI
TY
FUND
2
HEA
LTH
BA
LANC
ED
FUND
1**
SFIN
ULIF
0490
1 /0
1/10
PEQ
UI
TYF0
3121
ULIF
0640
1/
03/0
8PG
ILT
FUN0
1121
ULIF
0330
4/
12/0
8PG
RO
WTH
F011
21
ULIF
0500
1/
01/1
0PG
ROW
TH
F021
21
ULIF
0371
6/
12/0
8PG
UA
BOND
0112
1
ULIF
0210
1/
03/0
8PIN
FR
AST0
1121
ULIF
0660
1 /0
1/10
PINF
R AS
T021
21
ULIF
0220
1/
03/0
8PM
ID
CAPF
0112
1
ULIF
0510
1/
01/1
0PM
ID
CAPF
0212
1
ULIF
0340
4/
12/0
8PM
ON
MRK
T011
21
ULIF
0520
1/
01/1
0PM
ON
MRK
T021
21
ULIF
0350
4/
12/0
8PPU
E Q
UTY0
1121
ULIF
0530
1/
01/1
0PPU
EQ
UTY0
2121
ULIF
0180
1/
02/0
8HBA
LA
NCE0
1121
In
com
e fro
m in
vest
men
tsIn
tere
st in
com
e -
330
4
,937
2
,268
-
- -
- -
- -
- -
- Di
viden
d in
com
e 8
,364
-
567
2
68
- -
1,21
4 -
1,44
1 -
- -
2,4
02
- (A
mor
tisat
ion
of P
rem
ium
)/Di
scou
nt o
n In
vest
men
ts 1,
144
22
110
65
- -
178
- 6
78
- (4
18)
- 5
10
-
Profi
t/los
s on
sal
e of
inve
stm
ent
57,
123
60
2,2
78
501
-
- 1,
498
- 2
,362
-
402
-
6,2
91
- Pr
ofit/l
oss
on in
ter f
und
trans
fer/
sa
le o
f inv
estm
ent
- 14
4
03
- -
- 6
10
- 9
,297
-
(1)
- 1,
193
-
Misc
ella
neou
s In
com
e 2
0
(0
) 0
-
- 0
-
1 -
(0)
- 0
-
Unre
alise
d Ga
in/lo
ss**
* 13
,628
3
1,
611
1,83
2 -
- (3
,654
) -
(12,
552)
- -
- (3
,439
) -
Tota
l (A)
80,
262
429
9
,906
4
,934
-
- (1
54)
- 1,
227
- (1
7) -
6,9
58
- Fu
nd m
anag
emen
t exp
ense
s 8
,728
6
5 1,
959
686
-
- 6
63
- 2
,185
- 1,
525
- 1,
684
- Fu
nd a
dmin
istra
tion
expe
nses
- -
- -
- -
- -
- -
- -
- -
GST/
Serv
ice Ta
x on
Fund
M
anag
emen
t Cha
rges
1,57
1 12
3
53
123
- -
119
- 3
93
- 2
74
- 3
03
-
Oth
er c
harg
es
F-
5 1,
847
48
231
16
5 -
14
185
5
345
3
2
41
3
385
-
Tota
l (B)
12,14
6 12
4 2
,542
9
74
- 14
9
67
5
2,9
24
3
2,0
40
3
2,3
73
- Ne
t Inc
ome
for t
he y
ear (
A-B)
68,
116
305
7
,364
3
,960
-
(14)
(1,12
1) (5
) (1
,697
) (3
) (2
,057
) (3
) 4
,585
-
Add:
Fund
reve
nue
acco
unt a
t th
e be
ginn
ing
of th
e ye
ar 14
,92,
013
10,5
33
2,4
0,12
2 7
8,66
9 4
9,24
4 13
,378
4
8,98
1 2
,00,
400
3,3
7,28
1 1,
20,8
17
2,6
2,10
5 1,
11,6
50
1,32
,264
-
Fund
reve
nue
acco
unt a
t the
en
d of
the
year
15,6
0,12
9 10
,838
2
,47,
486
82,
629
49,
244
13,3
64
47,
860
2,0
0,39
5 3
,35,
584
1,20
,814
2
,60,
048
1,11
,647
1,
36,8
49
-
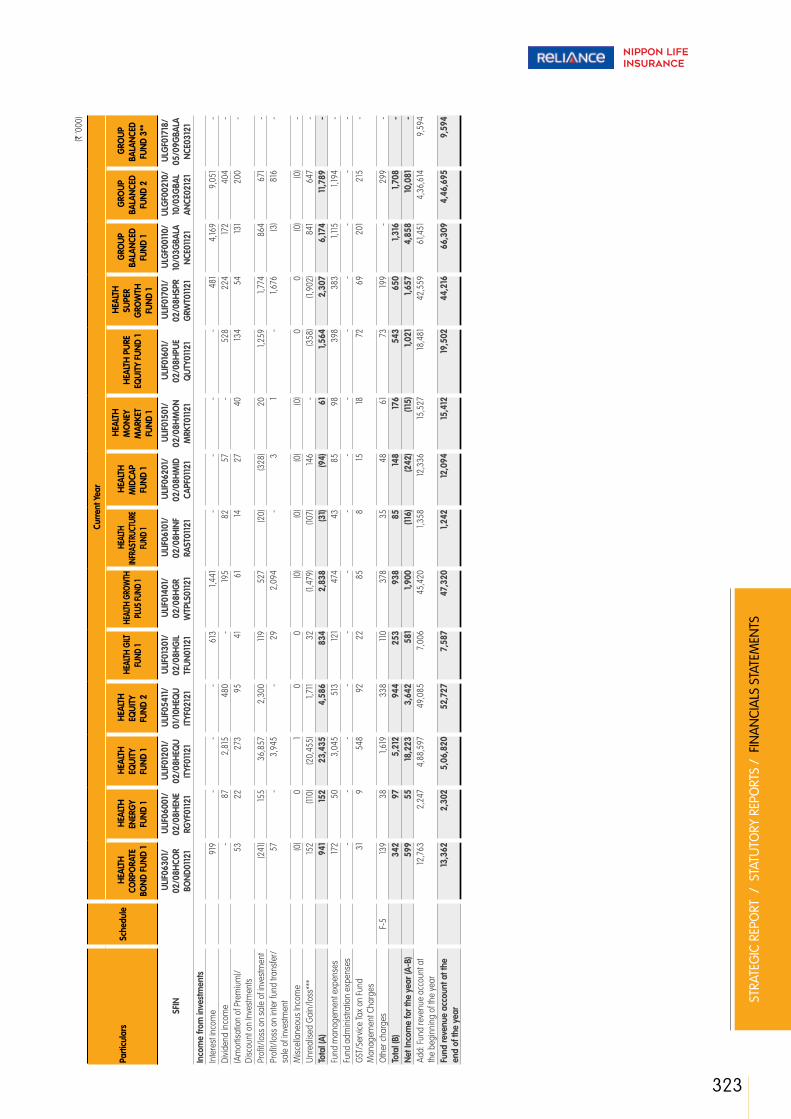
323
STRA
TEG
IC R
EPO
RT /
STA
TUTO
RY R
EPO
RTS
/ F
INA
NCI
ALS
STA
TEM
ENTS
(` ‘0
00)
Parti
cula
rsSc
hedu
le
Cur
rent
Yea
r
HEA
LTH
CO
RPO
RATE
BO
ND F
UND
1
HEA
LTH
EN
ERG
Y FU
ND 1
HEA
LTH
EQ
UITY
FU
ND 1
HEA
LTH
EQ
UITY
FU
ND 2
HEA
LTH
GILT
FU
ND 1
HEA
LTH G
ROW
TH
PLUS
FUND
1
HEA
LTH
INFR
ASTR
UCTU
RE
FUND
1
HEA
LTH
M
IDCA
P FU
ND 1
HEA
LTH
M
ONE
Y M
ARKE
T FU
ND 1
HEA
LTH
PUR
E EQ
UITY
FUN
D 1
HEA
LTH
SU
PER
GRO
WTH
FU
ND 1
GRO
UP
BALA
NCED
FU
ND 1
GRO
UP
BALA
NCED
FU
ND 2
GRO
UP
BALA
NCED
FU
ND 3
**
SFIN
ULIF
0630
1/
02/0
8HCO
R BO
ND01
121
ULIF
0600
1/
02/0
8HEN
E RG
YF01
121
ULIF
0120
1/
02/0
8HEQ
U IT
YF01
121
ULIF
0541
1/
01/1
0HEQ
U IT
YF02
121
ULIF
0130
1/
02/0
8HG
IL TF
UN01
121
ULIF
0140
1/
02/0
8HG
R W
TPLS
0112
1
ULIF
0610
1/
02/0
8HIN
F RA
ST01
121
ULIF
0620
1/
02/0
8HM
ID
CAPF
0112
1
ULIF
0150
1/
02/0
8HM
ON
MRK
T011
21
ULIF
0160
1/
02/0
8HPU
E Q
UTY0
1121
ULIF
0170
1/
02/0
8HSP
R G
RWT0
1121
ULG
F001
10/
10/0
3GBA
LA
NCE0
1121
ULG
F002
10/
10/0
3GBA
L AN
CE02
121
ULG
F017
18/
05/0
9GBA
LA
NCE0
3121
In
com
e fro
m in
vest
men
tsIn
tere
st in
com
e 9
19
- -
- 6
13
1,44
1 -
- -
- 4
81
4,16
9 9
,051
-
Divid
end
inco
me
- 8
7 2
,815
4
80
- 19
5 8
2 5
7 -
528
2
24
172
404
-
(Am
ortis
atio
n of
Pre
miu
m)/
Disc
ount
on
Inve
stm
ents
53
22
273
9
5 4
1 6
1 14
2
7 4
0 13
4 5
4 13
1 2
00
-
Profi
t/los
s on
sal
e of
inve
stm
ent
(241
) 15
5 3
6,85
7 2
,300
11
9 5
27
(20)
(328
) 2
0 1,
259
1,77
4 8
64
671
-
Profi
t/los
s on
inte
r fun
d tra
nsfe
r/
sale
of i
nves
tmen
t 5
7 -
3,9
45
- 2
9 2
,094
-
3
1 -
1,67
6 (3
) 8
16
-
Misc
ella
neou
s In
com
e (0
) 0
1
0
0
(0)
(0)
(0)
(0)
0
0
(0)
(0)
- Un
real
ised
Gain
/loss
***
152
(110
) (2
0,45
5) 1,
711
32
(1,4
79)
(107
) 14
6 -
(358
) (1
,902
) 8
41
647
-
Tota
l (A)
941
15
2 2
3,43
5 4
,586
8
34
2,8
38
(31)
(94)
61
1,56
4 2
,307
6
,174
11,7
89
- Fu
nd m
anag
emen
t exp
ense
s 17
2 5
0 3
,045
5
13
121
474
4
3 8
5 9
8 3
98
383
1,
115
1,19
4 -
Fund
adm
inist
ratio
n ex
pens
es -
- -
- -
- -
- -
- -
- -
- GS
T/Se
rvice
Tax
on Fu
nd
Man
agem
ent C
harg
es 3
1 9
5
48
92
22
85
8
15
18
72
69
201
2
15
-
Oth
er c
harg
es
F-
5 13
9 3
8 1,
619
338
11
0 3
78
35
48
61
73
199
- 2
99
- To
tal (
B) 3
42
97
5,2
12
944
2
53
938
8
5 14
8 17
6 5
43
650
1,
316
1,70
8 -
Net I
ncom
e fo
r the
yea
r (A-
B) 5
99
55
18,2
23
3,6
42
581
1,
900
(116
) (2
42)
(115
) 1,
021
1,65
7 4
,858
10
,081
-
Add:
Fund
reve
nue
acco
unt a
t th
e be
ginn
ing
of th
e ye
ar 12
,763
2
,247
4
,88,
597
49,
085
7,0
06
45,
420
1,35
8 12
,336
15
,527
18
,481
4
2,55
9 6
1,451
4
,36,
614
9,5
94
Fund
reve
nue
acco
unt a
t the
en
d of
the
year
13,3
62
2,3
02
5,0
6,82
0 5
2,72
7 7
,587
4
7,32
0 1,
242
12,0
94
15,4
12
19,5
02
44,
216
66,
309
4,4
6,69
5 9
,594

Annual Report 2018-19
324
Fund
Rev
enue
Acc
ount
fo
r the
yea
r end
ed 3
1st M
arch
, 201
9 A
ppen
dix
6
(` ‘0
00)
Parti
cula
rsSc
hedu
le
Cur
rent
Yea
r
GRO
UP
BALA
NCED
FU
ND 4
GRO
UP
CAPI
TAL
SECU
RE
FUND
1
GRO
UP
CORP
ORA
TE
BOND
FUN
D 1*
*
GRO
UP
CORP
ORA
TE
BOND
FU
ND 2
GRO
UP
CORP
ORA
TE
BOND
FU
ND 3
GRO
UP
ENER
GY
FUND
1
GRO
UP
EQUI
TY F
UND
1**
GRO
UP
EQUI
TY
FUND
2**
GRO
UP
EQUI
TY
FUND
3
GRO
UP
EQUI
TY
FUND
4
GRO
UP
GILT
FUN
D 1*
*
GRO
UP
GILT
FUN
D 2
GRO
UP
GRO
WTH
FU
ND 1
GRO
UP
INFR
ASTR
UCTU
RE
FUND
1
SFIN
ULG
F021
05/
06/1
3GBA
L AN
CE04
121
ULG
F004
31/
01/0
7GCA
PI
SEC0
1121
ULG
F005
24/
10/0
7GCO
R BO
ND01
121
ULG
F012
13/
10/0
8GCO
R BO
ND02
121
ULG
F023
05/
06/1
3GCO
RB
OND
0312
1
ULG
F014
28/
11/0
8GEN
E RG
YF01
121
ULG
F007
24/
10/0
7GEQ
U IT
YF01
121
ULG
F013
28/
11/0
8GEQ
U IT
YF02
121
ULG
F018
08/
06/0
9GEQ
U IT
YF03
121
ULG
F022
05/
06/1
3GEQ
U IT
YF04
121
ULG
F008
24/
10/0
7GG
ILT
FUN0
1121
ULG
F016
10/
12/0
8GG
IL TF
UN02
121
ULG
F003
10/
10/0
3GG
RO
WTH
F011
21
ULG
F019
08/
06/0
9GIN
F RA
SF01
121
Inco
me
from
inve
stm
ents
Inte
rest
inco
me
1,62
,548
-
- 1,
37,8
49
2,12
,051
-
- -
- -
- 2
71
1,60
7 -
Divid
end
inco
me
6,8
46
- -
- -
31
- -
10,4
94
21,2
99
- -
177
78
(Am
ortis
atio
n of
Pre
miu
m)/
Disc
ount
on
Inve
stm
ents
2,13
3 9
5 -
4,5
17
6,8
35
8
- -
1,59
9 3
,719
-
20
26
15
Profi
t/los
s on
sal
e of
inve
stm
ent
(7,7
89)
0
- (1
3,54
7) (2
0,00
4) 7
3 -
- 7
5,41
1 1,
77,9
58
- 7
0 2
73
(61)
Profi
t/los
s on
inte
r fun
d tra
nsfe
r/
sale
of i
nves
tmen
t 3
75
(0)
- (3
,602
) (1
,567
) -
- -
9,8
86
(1,7
91)
- -
3,15
4 -
Misc
ella
neou
s In
com
e 4
0
-
4
(10)
(0)
- -
1 (1
) -
(0)
(0)
0
Unre
alise
d Ga
in/lo
ss**
* 4
8,06
2 -
- 10
,333
19
,399
(7
8) -
- (5
2,33
8) (7
8,24
5) -
28
(3,0
12)
(131
)To
tal (
A) 2
,12,18
0 9
5 -
1,35
,554
2
,16,7
05
35
- -
45,
053
1,22
,940
-
389
2
,225
(9
9)Fu
nd m
anag
emen
t exp
ense
s 2
1,081
11
-
14,7
87
21,7
96
20
- -
5,9
74
12,10
2 -
32
273
2
3 Fu
nd a
dmin
istra
tion
expe
nses
- -
- -
- -
- -
- -
- -
- -
GST/
Serv
ice Ta
x on
Fund
M
anag
emen
t Cha
rges
3,7
95
2
- 2
,662
3
,923
4
-
- 1,
075
2,17
8 -
6
49
4
Oth
er c
harg
es
F-
5 6
,728
-
- 11
8 7
,194
19
- -
146
1,31
7 -
4
- 3
5 To
tal (
B) 3
1,603
13
-
17,5
67
32,
914
43
- -
7,19
5 15
,597
-
42
322
6
2 Ne
t Inc
ome
for t
he y
ear (
A-B)
1,80
,577
8
2 -
1,17
,987
1,
83,7
91
(8)
- -
37,
858
1,07
,343
-
347
1,
903
(161
)Ad
d: Fu
nd re
venu
e ac
coun
t at
the
begi
nnin
g of
the
year
4,4
5,03
5 3
,067
14
,609
9
,86,
484
4,2
1,355
(6
24)
401
4
2,46
9 4
,15,3
82
3,4
1,560
2
,202
18
,908
5
7,64
8 6
48
Fund
reve
nue
acco
unt a
t the
en
d of
the
year
6,2
5,61
2 3
,149
14,6
09
11,0
4,47
1 6
,05,
146
(632
) 4
01
42,
469
4,5
3,24
0 4
,48,
903
2,2
02
19,2
55
59,
551
487

325
STRA
TEG
IC R
EPO
RT /
STA
TUTO
RY R
EPO
RTS
/ F
INA
NCI
ALS
STA
TEM
ENTS
(` ‘0
00)
Parti
cula
rsSc
hedu
le
Cur
rent
Yea
r
GRO
UP M
IDCA
P FU
ND 1
GRO
UP M
ONE
Y M
ARKE
T FU
ND
1**
GRO
UP M
ONE
Y M
ARKE
T FU
ND 2
G
ROUP
PUR
E DE
BT F
UND
1**
GRO
UP P
URE
DEBT
FUN
D 2*
* G
ROUP
PUR
E EQ
UITY
FUN
D 1
PEN
SIO
N DI
SCO
NTIN
UED
POLIC
Y FU
ND
PEN
SIO
N SM
ART
FUND
1 M
AKE
IN IN
DIA
FUND
To
tal
SFIN
ULG
F020
08/
06/0
9GM
ID
CAPF
0112
1
ULG
F006
24/
10/0
7GM
ON
MRK
T011
21
ULG
F009
30/
09/0
8GM
ON
MRK
T021
21
ULG
F010
30/
09/0
8GPU
RE
DEB0
1121
ULG
F011
30/
09/0
8GPU
R DE
BT02
121
ULG
F015
28/
11/0
8GPU
R EE
QF0
1121
ULIF
0702
9/
08/1
3PDI
SP
OLF
0112
1
ULIF
0681
0/
09/1
2PSM
AR
TFU0
1121
ULIF
0692
4/
03/1
5LM
AKE
INDI
A121
In
com
e fro
m in
vest
men
tsIn
tere
st in
com
e -
- -
- -
- 17
9 4
8,14
6 -
13,4
3,99
3 Di
viden
d in
com
e 2
5 -
- -
- 8
3 -
- 3
4,44
0 5
,48,
403
(Am
ortis
atio
n of
Pre
miu
m)/D
iscou
nt o
n In
vest
men
ts 18
-
(3,8
44)
- -
21
59,
870
(2,7
20)
8,5
70
4,8
0,12
9
Profi
t/los
s on
sal
e of
inve
stm
ent
(145
) -
7,4
97
- -
133
150
(10)
(65,
826)
26,
00,9
12
Profi
t/los
s on
inte
r fun
d tra
nsfe
r/ s
ale
of
inve
stm
ent
11
- 0
-
- 4
9 -
20
1,12
2 1,
03,3
14
Misc
ella
neou
s In
com
e 0
-
2
- -
(0)
5
(1)
(13)
(31)
Unre
alise
d Ga
in/lo
ss**
* 9
1 -
- -
- (5
2) -
3,8
01
1,82
,103
7,8
4,84
0 To
tal (
A) -
- 3
,655
-
- 2
34
60,
205
49,
237
1,60
,395
5
8,61
,560
Fu
nd m
anag
emen
t exp
ense
s 2
2 -
14,3
35
- -
70
4,4
53
9,2
01
29,
513
8,3
6,46
3 Fu
nd a
dmin
istra
tion
expe
nses
- -
- -
- -
- -
- -
GST/
Serv
ice Ta
x on
Fund
Man
agem
ent
Char
ges
4
- 2
,580
-
- 13
8
02
1,65
6 5
,312
1,
50,5
63
Oth
er c
harg
es
F-
5 15
-
2,14
5 -
- 3
0 -
4,6
90
88,
188
6,7
8,21
9 To
tal (
B) 4
1 -
19,0
60
- -
112
5,2
54
15,5
47
1,23
,013
16
,65,
245
Net I
ncom
e fo
r the
yea
r (A-
B) (4
1) -
(15,
405)
- -
122
54,
951
33,
690
37,
382
41,9
6,31
5 Ad
d: Fu
nd re
venu
e ac
coun
t at t
he
begi
nnin
g of
the
year
7,9
51
- 8
,22,
369
8,6
56
1,33
7 8
,136
92,
004
1,34
,531
3
5,18
9 6
,10,0
5,76
4
Fund
reve
nue
acco
unt a
t the
end
of
the
year
7,9
10
- 8
,06,
964
8,6
56
1,33
7 8
,258
1,
46,9
55
1,68
,221
7
2,57
1 6
,52,
02,0
79
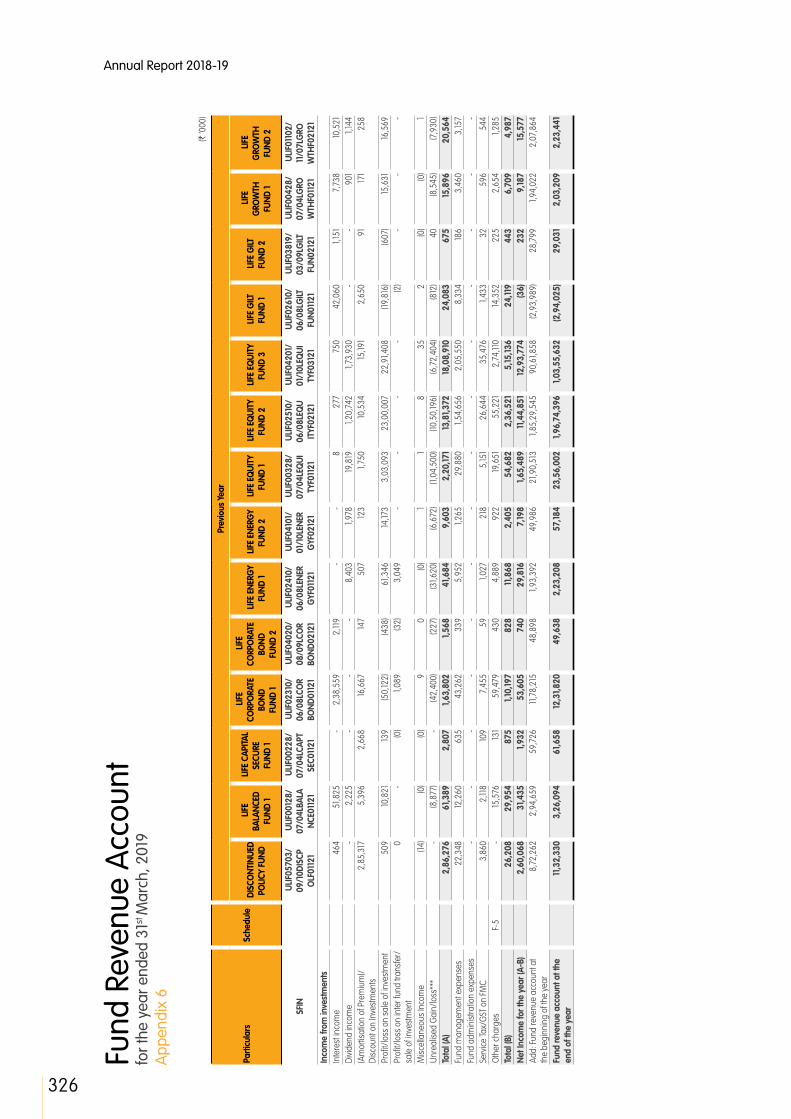
Annual Report 2018-19
326
Fund
Rev
enue
Acc
ount
fo
r the
yea
r end
ed 3
1st M
arch
, 201
9 A
ppen
dix
6
(` ‘0
00)
Parti
cula
rsSc
hedu
le
Prev
ious
Yea
r
DIS
CONT
INUE
D PO
LICY
FUND
LIFE
BA
LANC
ED
FUND
1
LIFE
CAP
ITAL
SECU
RE
FUND
1
LIFE
CO
RPO
RATE
BO
ND
FUND
1
LIFE
CO
RPO
RATE
BO
ND
FUND
2
LIFE
ENE
RGY
FUND
1 L
IFE E
NERG
Y FU
ND 2
L
IFE E
QUI
TY
FUND
1 L
IFE E
QUI
TY
FUND
2
LIFE
EQ
UITY
FU
ND 3
L
IFE G
ILT
FUND
1 L
IFE G
ILT
FUND
2
LIFE
G
ROW
TH
FUND
1
LIFE
G
ROW
TH
FUND
2
SFIN
ULIF
0570
3/
09/1
0DIS
CP
OLF
0112
1
ULIF
0012
8/
07/0
4LBA
LA
NCE0
1121
ULIF
0022
8/
07/0
4LCA
PT
SEC0
1121
ULIF
0231
0/
06/0
8LCO
R BO
ND01
121
ULIF
0402
0/
08/0
9LCO
R BO
ND02
121
ULIF
0241
0/
06/0
8LEN
ER
GYF
0112
1
ULIF
0410
1/
01/1
0LEN
ER
GYF
0212
1
ULIF
0032
8/
07/0
4LEQ
UI
TYF0
1121
ULIF
0251
0/
06/0
8LEQ
U IT
YF02
121
ULIF
0420
1/
01/1
0LEQ
UI
TYF0
3121
ULIF
0261
0/
06/0
8LG
ILT
FUN0
1121
ULIF
0381
9/
03/0
9LG
ILT
FUN0
2121
ULIF
0042
8/
07/0
4LG
RO
WTH
F011
21
ULIF
0110
2/
11/0
7LG
RO
WTH
F021
21
Inco
me
from
inve
stm
ents
Inte
rest
inco
me
464
5
1,825
-
2,3
8,55
9 2
,119
- -
8
277
7
50
42,
060
1,15
1 7
,738
10
,521
Di
viden
d in
com
e -
2,2
25
- -
- 8
,403
1,
978
19,8
19
1,20
,742
1,
73,9
30
- -
901
1,
144
(Am
ortis
atio
n of
Pre
miu
m)/
Disc
ount
on
Inve
stm
ents
2,8
5,31
7 5
,396
2
,668
16
,667
14
7 5
07
123
1,75
0 10
,534
15
,191
2,6
50
91
171
258
Profi
t/los
s on
sal
e of
inve
stm
ent
509
10
,821
13
9 (5
0,12
2) (4
38)
61,3
46
14,17
3 3
,03,
093
23,
00,0
07
22,
91,4
08
(19,
816)
(607
) 15
,631
16
,569
Pr
ofit/l
oss
on in
ter f
und
trans
fer/
sa
le o
f inv
estm
ent
0
- (0
) 1,
089
(32)
3,0
49
- -
- -
(2)
- -
-
Misc
ella
neou
s In
com
e (1
4) (0
) (0
) 9
0
(0
) 1
1 8
3
5 2
(0
) (0
) 1
Unre
alise
d Ga
in/lo
ss**
* -
(8,8
77)
- (4
2,40
0) (2
27)
(31,6
20)
(6,6
72)
(1,0
4,50
0) (1
0,50
,196)
(6,7
2,40
4) (8
12)
40
(8,5
45)
(7,9
30)
Tota
l (A)
2,8
6,27
6 6
1,389
2
,807
1,
63,8
02
1,56
8 4
1,684
9
,603
2
,20,
171
13,8
1,372
18
,08,
910
24,
083
675
15
,896
2
0,56
4 Fu
nd m
anag
emen
t exp
ense
s 2
2,34
8 12
,260
6
35
43,
262
339
5
,952
1,
265
29,
880
1,54
,656
2
,05,
550
8,3
34
186
3,4
60
3,15
7 Fu
nd a
dmin
istra
tion
expe
nses
- -
- -
- -
- -
- -
- -
- -
Serv
ice Ta
x/GS
T on
FMC
3,8
60
2,11
8 10
9 7
,455
5
9 1,
027
218
5
,151
26,
644
35,
476
1,43
3 3
2 5
96
544
O
ther
cha
rges
F-5
- 15
,576
13
1 5
9,47
9 4
30
4,8
89
922
19
,651
5
5,22
1 2
,74,
110
14,3
52
225
2
,654
1,
285
Tota
l (B)
26,
208
29,
954
875
1,
10,19
7 8
28
11,8
68
2,4
05
54,
682
2,3
6,52
1 5
,15,13
6 2
4,11
9 4
43
6,7
09
4,9
87
Net I
ncom
e fo
r the
yea
r (A-
B) 2
,60,
068
31,4
35
1,93
2 5
3,60
5 7
40
29,
816
7,19
8 1,
65,4
89
11,4
4,85
1 12
,93,
774
(36)
232
9
,187
15,5
77
Add:
Fund
reve
nue
acco
unt a
t th
e be
ginn
ing
of th
e ye
ar 8
,72,
262
2,9
4,65
9 5
9,72
6 11
,78,
215
48,
898
1,93
,392
4
9,98
6 2
1,90,
513
1,85
,29,
545
90,
61,8
58
(2,9
3,98
9) 2
8,79
9 1,
94,0
22
2,0
7,86
4
Fund
reve
nue
acco
unt a
t the
en
d of
the
year
11,3
2,33
0 3
,26,
094
61,6
58
12,3
1,820
4
9,63
8 2
,23,
208
57,
184
23,
56,0
02
1,96
,74,
396
1,03
,55,
632
(2,9
4,02
5) 2
9,03
1 2
,03,
209
2,2
3,44
1
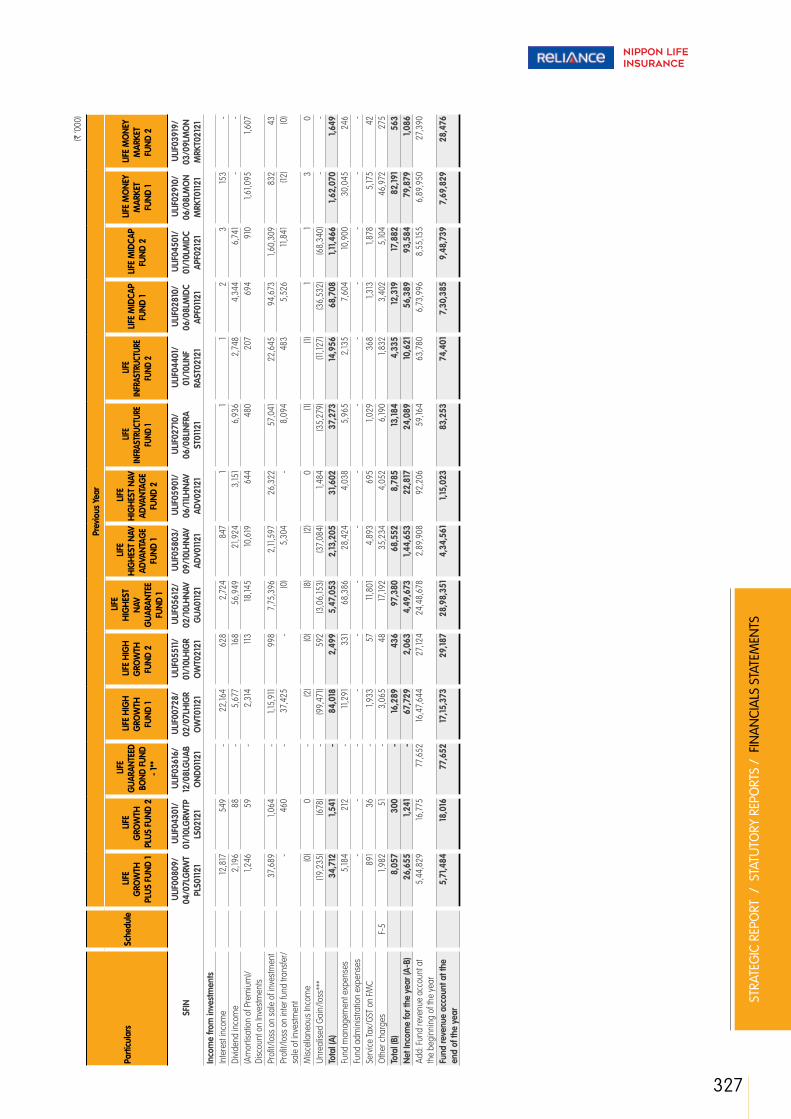
327
STRA
TEG
IC R
EPO
RT /
STA
TUTO
RY R
EPO
RTS
/ F
INA
NCI
ALS
STA
TEM
ENTS
(` ‘0
00)
Parti
cula
rsSc
hedu
le
Prev
ious
Yea
r
LIFE
G
ROW
TH
PLUS
FUN
D 1
LIFE
G
ROW
TH
PLUS
FUN
D 2
LIFE
GU
ARAN
TEED
BO
ND FU
ND
- 1**
LIFE
HIG
H
GRO
WTH
FU
ND 1
LIFE
HIG
H
GRO
WTH
FU
ND 2
LIFE
H
IGH
EST
NAV
GUA
RANT
EE
FUND
1
LIFE
H
IGH
EST
NAV
ADVA
NTAG
E FU
ND 1
LIFE
H
IGH
EST
NAV
ADVA
NTAG
E FU
ND 2
LIFE
IN
FRAS
TRUC
TURE
FU
ND 1
LIFE
IN
FRAS
TRUC
TURE
FU
ND 2
LIFE
MID
CAP
FUND
1 L
IFE M
IDCA
P FU
ND 2
LIFE
MO
NEY
MAR
KET
FUND
1
LIFE
MO
NEY
MAR
KET
FUND
2
SFIN
ULIF
0080
9/
04/0
7LG
RWT
PLS0
1121
ULIF
0430
1/
01/1
0LG
RWTP
LS
0212
1
ULIF
0361
6/
12/0
8LG
UAB
OND
0112
1
ULIF
0072
8/
02/0
7LH
IGR
OW
T011
21
ULIF
0551
1/
01/1
0LH
IGR
OW
T021
21
ULIF
0561
2/
02/1
0LH
NAV
GUA
0112
1
ULIF
0580
3/
09/1
0LH
NAV
ADV0
1121
ULIF
0590
1/
06/1
1LH
NAV
ADV0
2121
ULIF
0271
0/
06/0
8LIN
FRA
ST01
121
ULIF
0440
1/
01/1
0LIN
F RA
ST02
121
ULIF
0281
0/
06/0
8LM
IDC
APF0
1121
ULIF
0450
1/
01/1
0LM
IDC
APF0
2121
ULIF
0291
0/
06/0
8LM
ON
MRK
T011
21
ULIF
0391
9/
03/0
9LM
ON
MRK
T021
21
Inco
me
from
inve
stm
ents
Inte
rest
inco
me
12,8
17
549
-
22,
164
628
2
,724
8
47
1 1
1 2
3
15
3 -
Divid
end
inco
me
2,19
6 8
8 -
5,6
77
168
56,
949
21,9
24
3,15
1 6
,936
2
,748
4
,344
6
,741
-
- (A
mor
tisat
ion
of P
rem
ium
)/Di
scou
nt o
n In
vest
men
ts 1,
246
59
- 2
,314
11
3 18
,145
10,6
19
644
4
80
207
6
94
910
1,
61,0
95
1,60
7
Profi
t/los
s on
sal
e of
inve
stm
ent
37,
689
1,06
4 -
1,15
,911
9
98
7,7
5,39
6 2
,11,5
97
26,
322
57,
041
22,
645
94,
673
1,60
,309
8
32
43
Profi
t/los
s on
inte
r fun
d tra
nsfe
r/
sale
of i
nves
tmen
t -
460
-
37,
425
- (0
) 5
,304
-
8,0
94
483
5
,526
11
,841
(1
2) (0
)
Misc
ella
neou
s In
com
e (0
) 0
-
(2)
(0)
(8)
(2)
0
(1)
(1)
1 1
3
0
Unre
alise
d Ga
in/lo
ss**
* (1
9,23
5) (6
78)
- (9
9,47
1) 5
92
(3,0
6,15
3) (3
7,08
4) 1,
484
(35,
279)
(11,1
27)
(36,
532)
(68,
340)
- -
Tota
l (A)
34,
712
1,54
1 -
84,
018
2,4
99
5,4
7,05
3 2
,13,2
05
31,6
02
37,
273
14,9
56
68,
708
1,11
,466
1,
62,0
70
1,64
9 Fu
nd m
anag
emen
t exp
ense
s 5
,184
212
-
11,2
91
331
6
8,38
6 2
8,42
4 4
,038
5
,965
2
,135
7,6
04
10,9
00
30,
045
246
Fu
nd a
dmin
istra
tion
expe
nses
- -
- -
- -
- -
- -
- -
- -
Serv
ice Ta
x/GS
T on
FMC
891
3
6 -
1,93
3 5
7 11
,801
4
,893
6
95
1,02
9 3
68
1,31
3 1,
878
5,17
5 4
2 O
ther
cha
rges
F-5
1,98
2 5
1 -
3,0
65
48
17,19
2 3
5,23
4 4
,052
6
,190
1,83
2 3
,402
5
,104
46,
972
275
To
tal (
B) 8
,057
3
00
- 16
,289
4
36
97,
380
68,
552
8,7
85
13,18
4 4
,335
12
,319
17
,882
8
2,19
1 5
63
Net I
ncom
e fo
r the
yea
r (A-
B) 2
6,65
5 1,
241
- 6
7,72
9 2
,063
4
,49,
673
1,44
,653
2
2,81
7 2
4,08
9 10
,621
5
6,38
9 9
3,58
4 7
9,87
9 1,
086
Add:
Fund
reve
nue
acco
unt a
t th
e be
ginn
ing
of th
e ye
ar 5
,44,
829
16,7
75
77,
652
16,4
7,64
4 2
7,12
4 2
4,48
,678
2
,89,
908
92,
206
59,
164
63,
780
6,7
3,99
6 8
,55,
155
6,8
9,95
0 2
7,39
0
Fund
reve
nue
acco
unt a
t the
en
d of
the
year
5,7
1,484
18
,016
7
7,65
2 17
,15,3
73
29,
187
28,
98,3
51
4,3
4,56
1 1,
15,0
23
83,
253
74,
401
7,3
0,38
5 9
,48,
739
7,6
9,82
9 2
8,47
6

Annual Report 2018-19
328
Fund
Rev
enue
Acc
ount
fo
r the
yea
r end
ed 3
1st M
arch
, 201
9 A
ppen
dix
6
(` ‘0
00)
Parti
cula
rsSc
hedu
le
Prev
ious
Yea
r
LIFE
PUR
E DE
BT
FUND
1
LIFE
PUR
E EQ
UITY
FU
ND 1
LIFE
PUR
E EQ
UITY
FU
ND 2
LIFE
SUP
ER
GRO
WTH
FU
ND 1
LIFE
SUP
ER
GRO
WTH
FU
ND 2
REL
IANC
E AS
SURE
D M
ATUR
ITY
DEBT
FUN
D
PEN
SIO
N BA
LANC
ED
FUND
1
PEN
SIO
N BA
LANC
ED
FUND
2
PEN
SIO
N CA
PITA
L SE
CURE
FU
ND 1
PEN
SIO
N CO
RPO
RATE
BO
ND F
UND
1
PEN
SIO
N EN
ERG
Y FU
ND 1
PEN
SIO
N EN
ERG
Y FU
ND 2
PEN
SIO
N EQ
UITY
FU
ND 1
PEN
SIO
N EQ
UITY
FU
ND 2
SFIN
ULIF
0090
9/
04/0
7LPU
RD
EBT0
1121
ULIF
0301
0/
06/0
8LPU
E Q
UTY0
1121
ULIF
0460
1/
01/1
0LPU
EQ
UTY0
2121
ULIF
0100
9/
04/0
7LSP
RG
RWT0
1121
ULIF
0470
1/
01/1
0LSP
RGR
WT0
2121
ULIF
0672
0/
12/1
1LAS
UR
MDE
BT12
1
ULIF
0310
4/
12/0
8PBA
L AN
CE01
121
ULIF
0480
1/
01/1
0PBA
LA
NCE0
2121
ULIF
0050
1/
11/0
6PCA
PT
SEC0
1121
ULIF
0190
1/
03/0
8PCO
RB
OND
0112
1
ULIF
0200
1/
03/0
8PEN
R G
YYF0
1121
ULIF
0650
1/
01/1
0PEN
RG
YYF0
2121
ULIF
0060
1/
11/0
6PEQ
U IT
YF01
121
ULIF
0320
4/
12/0
8PEQ
U IT
YF02
121
Inco
me
from
inve
stm
ents
Inte
rest
inco
me
36,
101
6
31
6,0
10
272
4
2,37
4 13
,163
2,8
67
- 2
,126
- -
4
6
Divid
end
inco
me
- 11
,014
2
6,51
9 4
,068
19
4 -
541
12
9 -
- -
3,17
6 8
,902
15
,702
(A
mor
tisat
ion
of P
rem
ium
)/Di
scou
nt o
n In
vest
men
ts 9
76
812
2
,744
1,
110
50
27
248
11
5 2
,172
107
- 19
9 8
27
1,58
8
Profi
t/los
s on
sal
e of
inve
stm
ent
(3,5
14)
85,
655
1,70
,198
76,
974
2,2
07
773
5
,990
1,
378
110
(356
) -
24,
747
1,38
,600
2
,13,2
04
Profi
t/los
s on
inte
r fun
d tra
nsfe
r/
sale
of i
nves
tmen
t 3
,882
1,
693
- 8
55
71
3,2
64
- 5
5 2
(2
59)
- 3
,990
-
-
Misc
ella
neou
s In
com
e (0
) (0
) (4
) 1
0
2
(0)
(0)
(0)
0
- (0
) 2
(1
)Un
real
ised
Gain
/loss
***
(11,5
31)
(17,
271)
(6,8
34)
(32,
941)
(314
) (1
3,16
6) (4
,760
) (9
06)
- (1
90)
- (1
5,85
1) (4
6,49
4) (6
0,63
5)To
tal (
A) 2
5,91
3 8
1,909
1,
92,6
54
56,
077
2,4
81
33,
276
15,18
2 3
,638
2
,284
1,
427
- 16
,261
1,
01,8
41
1,69
,864
Fu
nd m
anag
emen
t exp
ense
s 6
,571
11
,255
2
4,45
9 6
,617
2
83
5,2
78
3,5
91
705
5
21
406
-
2,0
61
13,3
03
20,
010
Fund
adm
inist
ratio
n ex
pens
es -
- -
- -
- -
- -
- -
- -
- Se
rvice
Tax/
GST o
n FM
C 1,
127
1,94
3 4
,227
1,
137
49
907
6
19
121
90
70
- 3
55
2,2
89
3,4
51
Oth
er c
harg
es
F-
5 2
4
,797
3
7,46
7 1,
740
76
3,3
25
385
11
4 5
5 9
4 -
1,28
7 8
71
2,9
55
Tota
l (B)
7,7
00
17,9
96
66,
153
9,4
94
408
9
,510
4
,594
9
41
666
5
70
- 3
,704
16
,463
2
6,41
6 Ne
t Inc
ome
for t
he y
ear (
A-B)
18,2
13
63,
913
1,26
,501
4
6,58
3 2
,073
2
3,76
6 10
,588
2
,697
1,
618
857
-
12,5
57
85,
378
1,43
,448
Ad
d: Fu
nd re
venu
e ac
coun
t at
the
begi
nnin
g of
the
year
5,4
8,10
2 9
,29,
531
7,5
8,08
9 7
,64,
298
24,
902
1,74
,597
3
,16,0
44
94,
189
66,
567
26,
709
47,
275
41,9
77
15,7
3,97
4 2
8,17
,158
Fund
reve
nue
acco
unt a
t the
en
d of
the
year
5,6
6,31
5 9
,93,
444
8,8
4,59
0 8
,10,8
81
26,
975
1,98
,363
3
,26,
632
96,
886
68,
185
27,
566
47,
275
54,
534
16,5
9,35
2 2
9,60
,606
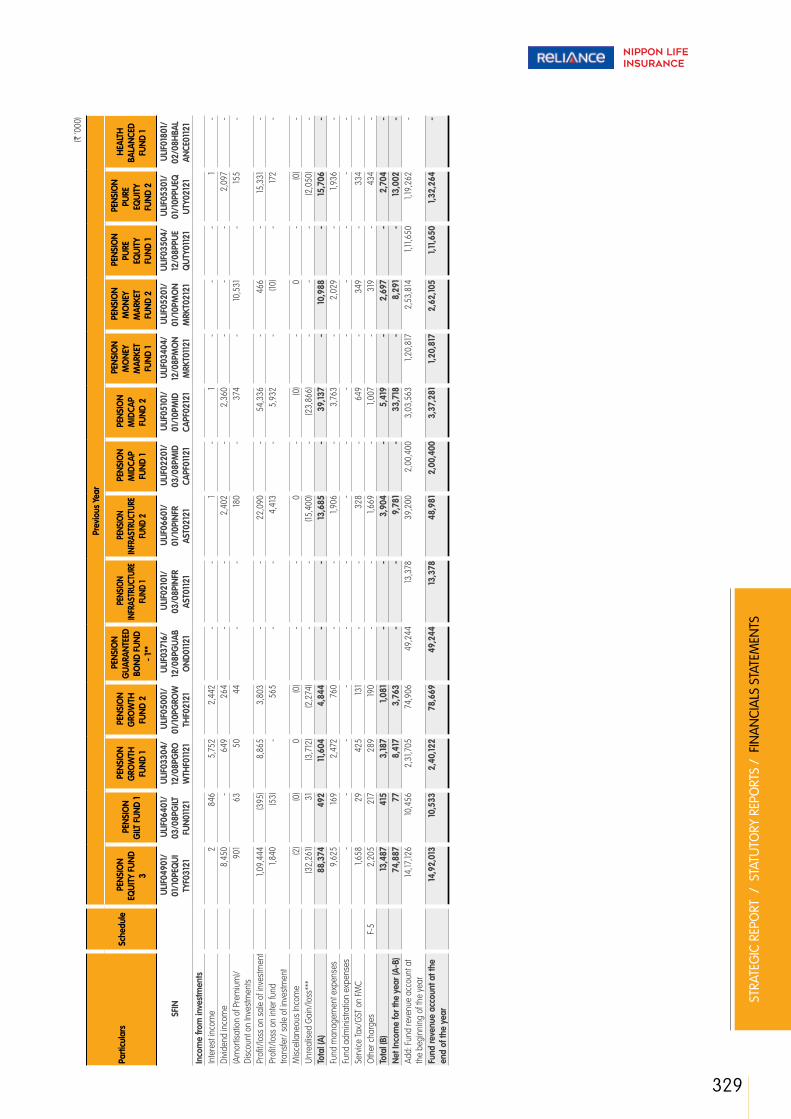
329
STRA
TEG
IC R
EPO
RT /
STA
TUTO
RY R
EPO
RTS
/ F
INA
NCI
ALS
STA
TEM
ENTS
(` ‘0
00)
Parti
cula
rsSc
hedu
le
Prev
ious
Yea
r
PEN
SIO
N EQ
UITY
FUN
D
3
PEN
SIO
N
GILT
FUN
D 1
PEN
SIO
N G
ROW
TH
FUND
1
PEN
SIO
N G
ROW
TH
FUND
2
PEN
SIO
N G
UARA
NTEE
D BO
ND F
UND
- 1**
PEN
SION
INFR
ASTR
UCTU
RE
FUND
1
PEN
SION
INFR
ASTR
UCTU
RE
FUND
2
PEN
SIO
N M
IDCA
P FU
ND 1
PEN
SIO
N M
IDCA
P FU
ND 2
PEN
SIO
N M
ONE
Y M
ARKE
T FU
ND 1
PEN
SIO
N M
ONE
Y M
ARKE
T FU
ND 2
PEN
SIO
N PU
RE
EQUI
TY
FUND
1
PEN
SIO
N PU
RE
EQUI
TY
FUND
2
HEA
LTH
BA
LANC
ED
FUND
1
SFIN
ULIF
0490
1/
01/1
0PEQ
UI
TYF0
3121
ULIF
0640
1/
03/0
8PG
ILT
FUN0
1121
ULIF
0330
4/
12/0
8PG
RO
WTH
F011
21
ULIF
0500
1/
01/1
0PG
ROW
TH
F021
21
ULIF
0371
6/
12/0
8PG
UAB
OND
0112
1
ULIF
0210
1/
03/0
8PIN
FR
AST0
1121
ULIF
0660
1/
01/1
0PIN
FR
AST0
2121
ULIF
0220
1/
03/0
8PM
ID
CAPF
0112
1
ULIF
0510
1/
01/1
0PM
ID
CAPF
0212
1
ULIF
0340
4/
12/0
8PM
ON
MRK
T011
21
ULIF
0520
1/
01/1
0PM
ON
MRK
T021
21
ULIF
0350
4/
12/0
8PPU
E Q
UTY0
1121
ULIF
0530
1/
01/1
0PPU
EQ
UTY0
2121
ULIF
0180
1/
02/0
8HBA
L AN
CE01
121
Inco
me
from
inve
stm
ents
Inte
rest
inco
me
2
846
5
,752
2
,442
-
- 1
- 1
- -
- 1
- Di
viden
d in
com
e 8
,450
-
649
2
64
- -
2,4
02
- 2
,360
-
- -
2,0
97
- (A
mor
tisat
ion
of P
rem
ium
)/Di
scou
nt o
n In
vest
men
ts 9
01
63
50
44
- -
180
- 3
74
- 10
,531
-
155
-
Profi
t/los
s on
sal
e of
inve
stm
ent
1,09
,444
(3
95)
8,8
65
3,8
03
- -
22,
090
- 5
4,33
6 -
466
-
15,3
31
- Pr
ofit/l
oss
on in
ter f
und
trans
fer/
sal
e of
inve
stm
ent
1,84
0 (5
3) -
565
-
- 4
,413
-
5,9
32
- (1
0) -
172
-
Misc
ella
neou
s In
com
e (2
) (0
) 0
(0
) -
- 0
-
(0)
- 0
-
(0)
- Un
real
ised
Gain
/loss
***
(32,
261)
31
(3,7
12)
(2,2
74)
- -
(15,
400)
- (2
3,86
6) -
- -
(2,0
50)
- To
tal (
A) 8
8,37
4 4
92
11,6
04
4,8
44
- -
13,6
85
- 3
9,13
7 -
10,9
88
- 15
,706
-
Fund
man
agem
ent e
xpen
ses
9,6
25
169
2,4
72
760
-
- 1,
906
- 3
,763
-
2,0
29
- 1,
936
- Fu
nd a
dmin
istra
tion
expe
nses
- -
- -
- -
- -
- -
- -
- -
Serv
ice Ta
x/GS
T on
FMC
1,65
8 2
9 4
25
131
- -
328
-
649
-
349
-
334
-
Oth
er c
harg
es
F-
5 2
,205
2
17
289
19
0 -
- 1,
669
- 1,
007
- 3
19
- 4
34
- To
tal (
B) 13
,487
4
15
3,18
7 1,
081
- -
3,9
04
- 5
,419
-
2,6
97
- 2
,704
-
Net I
ncom
e fo
r the
yea
r (A-
B) 7
4,88
7 7
7 8
,417
3
,763
-
- 9
,781
-
33,
718
- 8
,291
-
13,0
02
- Ad
d: Fu
nd re
venu
e ac
coun
t at
the
begi
nnin
g of
the
year
14,17
,126
10,4
56
2,3
1,705
7
4,90
6 4
9,24
4 13
,378
3
9,20
0 2
,00,
400
3,0
3,56
3 1,
20,8
17
2,5
3,81
4 1,
11,6
50
1,19
,262
-
Fund
reve
nue
acco
unt a
t the
en
d of
the
year
14,9
2,01
3 10
,533
2
,40,
122
78,
669
49,
244
13,3
78
48,
981
2,0
0,40
0 3
,37,
281
1,20
,817
2
,62,
105
1,11
,650
1,
32,2
64
-

Annual Report 2018-19
330
Fund
Rev
enue
Acc
ount
fo
r the
yea
r end
ed 3
1st M
arch
, 201
9 A
ppen
dix
6
(` ‘0
00)
Parti
cula
rsSc
hedu
le
Prev
ious
Yea
r
HEA
LTH
CO
RPO
RATE
BO
ND F
UND
1
HEA
LTH
EN
ERG
Y FU
ND 1
HEA
LTH
EQ
UITY
FU
ND 1
HEA
LTH
EQ
UITY
FU
ND 2
HEA
LTH
GILT
FU
ND 1
HEA
LTH
GROW
TH P
LUS
FUND
1
HEA
LTH
INFR
ASTR
UCTU
RE
FUND
1
HEA
LTH
M
IDCA
P FU
ND 1
HEA
LTH
M
ONE
Y M
ARKE
T FU
ND 1
HEA
LTH
PU
RE
EQUI
TY
FUND
1
HEA
LTH
SU
PER
GRO
WTH
FU
ND 1
GRO
UP
BALA
NCED
FU
ND 1
GRO
UP
BALA
NCED
FU
ND 2
GRO
UP
BALA
NCED
FU
ND 3
**
SFIN
ULIF
0630
1/
02/0
8HCO
RB
OND
0112
1
ULIF
0600
1/
02/0
8HEN
ER
GYF
0112
1
ULIF
0120
1/
02/0
8HEQ
U IT
YF01
121
ULIF
0541
1/
01/1
0HEQ
U IT
YF02
121
ULIF
0130
1/
02/0
8HG
ILT
FUN0
1121
ULIF
0140
1/
02/0
8HG
RWT
PLS0
1121
ULIF
0610
1/
02/0
8HIN
F RA
ST01
121
ULIF
0620
1/
02/0
8HM
ID
CAPF
0112
1
ULIF
0150
1/
02/0
8HM
O
NMRK
T011
21
ULIF
0160
1/
02/0
8HPU
E Q
UTY0
1121
ULIF
0170
1/
02/0
8HSP
RG
RWT0
1121
ULG
F001
10/
10/0
3GBA
L AN
CE01
121
ULG
F002
10/
10/0
3GBA
LA
NCE0
2121
ULG
F017
18/
05/0
9GBA
LA
NCE0
3121
In
com
e fro
m in
vest
men
tsIn
tere
st in
com
e 1,
268
- 2
0
7
54
1,97
0 0
0
-
0
546
3
,782
11
,718
-
Divid
end
inco
me
- 9
2 4
,929
4
60
- 3
33
69
74
- 4
39
394
16
6 4
63
- (A
mor
tisat
ion
of P
rem
ium
)/Di
scou
nt o
n In
vest
men
ts 4
1 8
5
85
59
58
235
6
19
8
03
41
163
168
353
-
Profi
t/los
s on
sal
e of
inve
stm
ent
(103
) 7
01
84,
864
5,6
11
(395
) 4
,878
5
49
1,25
5 3
9 2
,748
5
,615
1,
241
7,0
58
- Pr
ofit/l
oss
on in
ter f
und
trans
fer/
sal
e of
inve
stm
ent
1 11
6 2
6,12
4 6
31
(2)
1,67
8 9
7 7
86
(0)
- 1,
472
- 7
,518
-
Misc
ella
neou
s In
com
e 0
(0
) 1
0
(0)
0
0
0
(0)
(0)
0
(0)
0
- Un
real
ised
Gain
/loss
***
(266
) (4
43)
(58,
730)
(1,5
96)
23
(3,8
20)
(307
) (9
85)
- 8
8 (3
,188)
(755
) (1
2,44
0) -
Tota
l (A)
941
4
74
57,
774
5,16
4 4
38
5,2
74
414
1,
149
843
3
,316
5
,002
4
,602
14
,670
-
Fund
man
agem
ent e
xpen
ses
234
6
0 6
,411
5
40
151
767
5
5 12
3 15
6 4
06
602
1,
104
1,61
3 -
Fund
adm
inist
ratio
n ex
pens
es -
- -
- -
- -
- -
- -
- -
- Se
rvice
Tax/
GST o
n FM
C 4
0 10
1,
105
93
26
132
9
21
27
70
104
191
275
-
Oth
er c
harg
es
F-
5 18
3 4
3 3
,635
3
83
151
673
4
1 6
3 8
5 8
8 3
40
- 8
08
- To
tal (
B) 4
58
113
11,15
1 1,
016
328
1,
572
106
207
2
69
564
1,
046
1,29
5 2
,696
-
Net I
ncom
e fo
r the
yea
r (A-
B) 4
83
361
4
6,62
3 4
,148
110
3,7
02
308
9
42
574
2
,752
3
,956
3
,307
11
,974
-
Add:
Fund
reve
nue
acco
unt a
t th
e be
ginn
ing
of th
e ye
ar 12
,280
1,
886
4,4
1,974
4
4,93
7 6
,896
4
1,718
1,
050
11,3
94
14,9
53
15,7
29
38,
603
58,
144
4,2
4,64
0 9
,594
Fund
reve
nue
acco
unt a
t the
en
d of
the
year
12,7
63
2,2
47
4,8
8,59
7 4
9,08
5 7
,006
4
5,42
0 1,
358
12,3
36
15,5
27
18,4
81
42,
559
61,4
51
4,3
6,61
4 9
,594

331
STRA
TEG
IC R
EPO
RT /
STA
TUTO
RY R
EPO
RTS
/ F
INA
NCI
ALS
STA
TEM
ENTS
(` ‘0
00)
Parti
cula
rsSc
hedu
le
Prev
ious
Yea
r
GRO
UP
BALA
NCED
FU
ND 4
GRO
UP
CAPI
TAL
SECU
RE
FUND
1
GRO
UP
CORP
ORA
TE
BOND
FUN
D 1*
*
GRO
UP
CORP
ORA
TE
BOND
FU
ND 2
GRO
UP
CORP
ORA
TE
BOND
FU
ND 3
GRO
UP
ENER
GY
FUND
1
GRO
UP
EQUI
TY F
UND
1**
GRO
UP
EQUI
TY
FUND
2
GRO
UP
EQUI
TY
FUND
3
GRO
UP
EQUI
TY
FUND
4
GRO
UP G
ILT
FUND
1**
GRO
UP G
ILT
FUND
2
GRO
UP
GRO
WTH
FU
ND 1
GRO
UP
INFR
ASTR
UCTU
RE
FUND
1
SFIN
ULG
F021
05/
06/1
3GBA
LA
NCE0
4121
ULG
F004
31/
01/0
7GCA
PI
SEC0
1121
ULG
F005
24/
10/0
7GCO
R BO
ND01
121
ULG
F012
13/
10/0
8GCO
RB
OND
0212
1
ULG
F023
05/
06/1
3GCO
RB
OND
0312
1
ULG
F014
28/
11/0
8GEN
E RG
YF01
121
ULG
F007
24/
10/0
7GEQ
UI
TYF0
1121
ULG
F013
28/
11/0
8GEQ
U IT
YF02
121
ULG
F018
08/
06/0
9GEQ
U IT
YF03
121
ULG
F022
05/
06/1
3GEQ
UI
TYF0
4121
ULG
F008
24/
10/0
7GG
ILT
FUN0
1121
ULG
F016
10/
12/0
8GG
ILT
FUN0
2121
ULG
F003
10/
10/0
3GG
RO
WTH
F011
21
ULG
F019
08/
06/0
9GIN
FR
ASF0
1121
In
com
e fro
m in
vest
men
tsIn
tere
st in
com
e 1,
28,5
70
- -
1,41
,429
1,
77,0
25
- -
- 2
2
7 -
253
1,
937
0
Divid
end
inco
me
5,9
39
- -
- -
31
- -
9,0
39
21,5
51
- -
219
5
5 (A
mor
tisat
ion
of P
rem
ium
)/Di
scou
nt o
n In
vest
men
ts 13
,614
11
3 -
6,6
78
24,
888
3
- -
943
2
,166
- 2
4 6
6 6
Profi
t/los
s on
sal
e of
inve
stm
ent
27,
805
0
- (1
5,36
1) (4
7,59
7) 16
2 -
- 5
0,40
3 1,
40,14
3 -
(144
) 2
,352
3
56
Profi
t/los
s on
inte
r fun
d tra
nsfe
r/ s
ale
of in
vest
men
t (2
0) -
- (3
86)
31
- -
- -
17,7
61
- (0
) -
-
Misc
ella
neou
s In
com
e (1
) (0
) -
(4)
4
0
- -
(2)
(3)
- 0
0
0
Un
real
ised
Gain
/loss
***
(9,5
53)
- -
(28,
687)
(18,
905)
(57)
- -
38,
127
53,
762
- 11
(5
42)
(154
)To
tal (
A) 1,
66,3
53
114
- 1,
03,6
70
1,35
,446
13
8 -
- 9
8,51
2 2
,35,
405
- 14
4 4
,032
2
63
Fund
man
agem
ent e
xpen
ses
19,6
02
14
- 16
,144
21,0
82
21
- -
5,9
84
14,0
15
- 3
1 3
63
23
Fund
adm
inist
ratio
n ex
pens
es -
- -
- -
- -
- -
- -
- -
- Se
rvice
Tax/
GST o
n FM
C 3
,388
2
-
2,7
84
3,6
42
4
- -
1,03
5 2
,421
-
5
63
4
Oth
er c
harg
es
F-
5 7
,536
-
- 7
06
7,15
4 2
0 -
- 1,
188
1,44
1 -
3
- 3
7 To
tal (
B) 3
0,52
6 16
-
19,6
34
31,8
78
45
- -
8,2
08
17,8
77
- 3
9 4
26
65
Net I
ncom
e fo
r the
yea
r (A-
B) 1,
35,8
27
98
- 8
4,03
6 1,
03,5
68
93
- -
90,
304
2,17
,528
-
105
3,6
06
198
Add:
Fund
reve
nue
acco
unt a
t th
e be
ginn
ing
of th
e ye
ar 3
,09,
208
2,9
69
14,6
09
9,0
2,44
8 3
,17,7
87
(717
) 4
01
42,
469
3,2
5,07
8 1,
24,0
32
2,2
02
18,8
03
54,
042
450
Fund
reve
nue
acco
unt a
t the
en
d of
the
year
4,4
5,03
5 3
,067
14
,609
9
,86,
484
4,2
1,355
(6
24)
401
4
2,46
9 4
,15,3
82
3,4
1,560
2
,202
18
,908
5
7,64
8 6
48
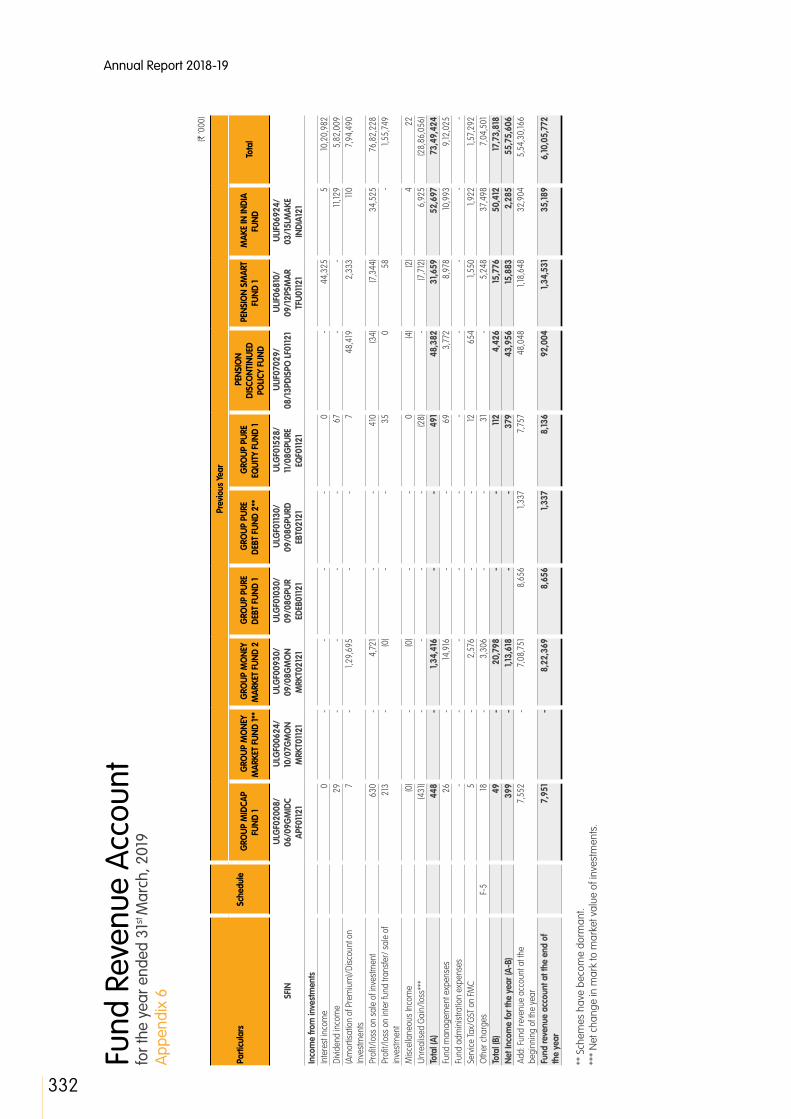
Annual Report 2018-19
332
Fund
Rev
enue
Acc
ount
fo
r the
yea
r end
ed 3
1st M
arch
, 201
9 A
ppen
dix
6
(` ‘0
00)
Parti
cula
rsSc
hedu
le
Prev
ious
Yea
r
GRO
UP M
IDCA
P FU
ND 1
GRO
UP M
ONE
Y M
ARKE
T FU
ND 1*
* G
ROUP
MO
NEY
MAR
KET
FUND
2
GRO
UP P
URE
DEBT
FUN
D 1
GRO
UP P
URE
DEBT
FUN
D 2*
* G
ROUP
PUR
E EQ
UITY
FUN
D 1
PEN
SIO
N DI
SCO
NTIN
UED
POLIC
Y FU
ND
PEN
SIO
N SM
ART
FUND
1 M
AKE
IN IN
DIA
FUND
To
tal
SFIN
ULG
F020
08/
06/0
9GM
IDC
APF0
1121
ULG
F006
24/
10/0
7GM
ON
MRK
T011
21
ULG
F009
30/
09/0
8GM
ON
MRK
T021
21
ULG
F010
30/
09/0
8GPU
R ED
EB01
121
ULG
F011
30/
09/0
8GPU
RD
EBT0
2121
ULG
F015
28/
11/0
8GPU
RE
EQF0
1121
ULIF
0702
9/
08/1
3PDI
SPO
LF0
1121
U
LIF06
810/
09
/12P
SMAR
TF
U011
21
ULIF
0692
4/
03/1
5LM
AKE
INDI
A121
In
com
e fro
m in
vest
men
tsIn
tere
st in
com
e 0
-
- -
- 0
-
44,
325
5
10,2
0,98
2 Di
viden
d in
com
e 2
9 -
- -
- 6
7 -
- 11
,129
5,8
2,00
9 (A
mor
tisat
ion
of P
rem
ium
)/Disc
ount
on
Inve
stm
ents
7
- 1,
29,6
95
- -
7
48,
419
2,3
33
110
7,9
4,49
0
Profi
t/los
s on
sal
e of
inve
stm
ent
630
-
4,7
21
- -
410
(3
4) (7
,344
) 3
4,52
5 7
6,82
,228
Pr
ofit/l
oss
on in
ter f
und
trans
fer/
sal
e of
in
vest
men
t 2
13
- (0
) -
- 3
5 0
5
8 -
1,55
,749
Misc
ella
neou
s In
com
e (0
) -
(0)
- -
0
(4)
(2)
4
22
Unre
alise
d Ga
in/lo
ss**
* (4
31)
- -
- -
(28)
- (7
,712
) 6
,925
(2
8,86
,056
)To
tal (
A) 4
48
- 1,
34,4
16
- -
491
4
8,38
2 3
1,659
5
2,69
7 7
3,49
,424
Fu
nd m
anag
emen
t exp
ense
s 2
6 -
14,9
16
- -
69
3,7
72
8,9
78
10,9
93
9,12
,025
Fu
nd a
dmin
istra
tion
expe
nses
- -
- -
- -
- -
- -
Serv
ice Ta
x/GS
T on
FMC
5
- 2
,576
-
- 12
6
54
1,55
0 1,
922
1,57
,292
O
ther
cha
rges
F-5
18
- 3
,306
-
- 3
1 -
5,2
48
37,
498
7,0
4,50
1 To
tal (
B) 4
9 -
20,
798
- -
112
4,4
26
15,7
76
50,
412
17,7
3,81
8 Ne
t Inc
ome
for t
he y
ear (
A-B)
399
-
1,13
,618
-
- 3
79
43,
956
15,8
83
2,2
85
55,
75,6
06
Add:
Fund
reve
nue
acco
unt a
t the
be
ginn
ing
of th
e ye
ar 7
,552
-
7,0
8,75
1 8
,656
1,
337
7,7
57
48,
048
1,18
,648
3
2,90
4 5
,54,
30,16
6
Fund
reve
nue
acco
unt a
t the
end
of
the
year
7,9
51
- 8
,22,
369
8,6
56
1,33
7 8
,136
92,
004
1,34
,531
3
5,18
9 6
,10,0
5,77
2
** S
chem
es h
ave
beco
me
dorm
ant.
***
Net
cha
nge
in m
ark
to m
arke
t val
ue o
f inv
estm
ents
.

333
STRA
TEG
IC R
EPO
RT /
STA
TUTO
RY R
EPO
RTS
/ F
INA
NCI
ALS
STA
TEM
ENTS
Sche
dule
to F
und
Bala
nce
Shee
t as
at 3
1st M
arch
, 201
9 Sc
hedu
le: F
-1
Polic
yhol
ders
’ Con
tribu
tion
(` ‘0
00)
Parti
cula
rs
Curre
nt Y
ear
DIS
CONT
INUE
D PO
LICY
FUND
LIFE
BA
LANC
ED
FUND
1
LIFE
CAP
ITAL
SECU
RE
FUND
1
LIFE
CO
RPO
RATE
BO
ND
FUND
1
LIFE
CO
RPO
RATE
BO
ND F
UND
2
LIFE
ENE
RGY
FUND
1 L
IFE E
NERG
Y FU
ND 2
L
IFE E
QUI
TY
FUND
1 L
IFE E
QUI
TY
FUND
2
LIFE
EQ
UITY
FU
ND 3
L
IFE G
ILT
FUND
1 L
IFE G
ILT
FUND
2
LIFE
G
ROW
TH
FUND
1
LIFE
GRO
WTH
FU
ND 2
SFIN
ULIF
0570
3/
09/1
0DIS
CP
OLF
0112
1
ULIF
0012
8/
07/0
4LBA
LA
NCE0
1121
ULIF
0022
8/
07/0
4LCA
PT
SEC0
1121
ULIF
0231
0/
06/0
8LCO
RB
OND
0112
1
ULIF
0402
0/
08/0
9LCO
RB
OND
0212
1
ULIF
0241
0/
06/0
8LEN
E RG
YF01
121
ULIF
0410
1/
01/1
0LEN
ER
GYF
0212
1
ULIF
0032
8/
07/0
4LEQ
U IT
YF01
121
ULIF
0251
0/
06/0
8LEQ
UI
TYF0
2121
ULIF
0420
1/
01/1
0LEQ
U IT
YF03
121
ULIF
0261
0/
06/0
8LG
ILT
FUN0
1121
ULIF
0381
9/
03/0
9LG
ILTF
UN02
121
ULIF
0042
8/
07/0
4LG
ROW
TH
F011
21
ULIF
0110
2/
11/0
7LG
RO
WTH
F021
21
Ope
ning
bal
ance
3
2,68
,268
6
,81,5
05
(22,
327)
20,
23,4
89
(17,
023)
87,
888
31,1
55
(8,0
9,72
8) (1
,10,7
6,17
4) 4
8,40
,009
8
,82,
552
(11,3
52)
(21,3
69)
7,7
10
Add:
Add
itions
dur
ing
the
year
***
20,
47,3
69
5,3
8,40
0 14
,594
10
,84,
071
13,4
90
21,4
28
10,2
98
58,
431
5,4
3,55
8 5
7,29
,660
1,
81,0
68
4,5
45
9,7
73
14,9
39
Less
: Ded
uctio
ns d
urin
g th
e ye
ar**
* 2
7,92
,366
5
,02,
870
21,7
79
16,12
,315
18
,754
1,
20,6
82
25,
776
2,3
7,12
9 3
2,03
,309
5
5,71
,019
3
,29,
675
7,6
81
36,
926
79,
198
Add:
Tran
sfer
from
Rev
enue
Acc
ount
- -
- -
- -
- -
- -
- -
- -
Clos
ing
bala
nce
25,
23,2
71
7,17
,035
(2
9,51
2) 14
,95,
245
(22,
287)
(11,3
66)
15,6
77
(9,8
8,42
6) (1
,37,
35,9
25)
49,
98,6
50
7,3
3,94
5 (1
4,48
8) (4
8,52
2) (5
6,54
9)
(` ‘0
00)
Parti
cula
rs
Curre
nt Y
ear
LIFE
GRO
WTH
PL
US F
UND
1
LIFE
G
ROW
TH
PLUS
FU
ND 2
LIFE
G
UARA
NTEE
D BO
ND F
UND
- 1**
LIFE
HIG
H
GRO
WTH
FU
ND 1
LIFE
HIG
H
GRO
WTH
FU
ND 2
LIFE
H
IGH
EST
NAV
GUA
RANT
EE
FUND
1
LIFE
H
IGH
EST
NAV
ADVA
NTAG
E FU
ND 1
LIFE
H
IGH
EST
NAV
ADVA
NTAG
E FU
ND 2
LIFE
IN
FRAS
TRUC
TURE
FU
ND 1
LIFE
IN
FRAS
TRUC
TURE
FU
ND 2
LIFE
M
IDCA
P FU
ND 1
LIFE
M
IDCA
P FU
ND 2
LIFE
MO
NEY
MAR
KET
FUND
1
LIFE
MO
NEY
MAR
KET
FUND
2
SFIN
ULIF
0080
9/
04/0
7LG
RWT
PLS0
1121
ULIF
0430
1/
01/1
0LG
RW
TPLS
0212
1
ULIF
0361
6/
12/0
8LG
UAB
OND
0112
1
ULIF
0072
8/
02/0
7LH
IGR
OW
T011
21
ULIF
0551
1/
01/1
0LH
IG
ROW
T021
21
ULIF
0561
2/
02/1
0LH
NAV
GUA
0112
1
ULIF
0580
3/
09/1
0LH
NAV
ADV0
1121
ULIF
0590
1/
06/1
1LH
NAV
ADV0
2121
ULIF
0271
0/
06/0
8LIN
FR
AST0
1121
ULIF
0440
1/
01/1
0LIN
FR
AST0
2121
ULIF
0281
0/
06/0
8LM
ID
CAPF
0112
1
ULIF
0450
1/
01/1
0LM
IDC
APF0
2121
ULIF
0291
0/
06/0
8LM
ON
MRK
T011
21
ULIF
0391
9/
03/0
9LM
ONM
RK
T021
21
Ope
ning
bal
ance
(2
,66,
388)
(2,7
39)
(77,
652)
(10,
95,7
56)
(5,5
85)
15,2
8,84
9 11
,89,
945
1,03
,991
2
,30,
608
71,6
40
(2,8
7,20
4) (2
,14,5
16)
15,6
1,901
(4
,083
)Ad
d: A
dditio
ns d
urin
g th
e ye
ar**
* 11
,123
911
-
32,
707
747
3
,54,
600
67,
090
8,5
19
26,
590
77,
005
65,
416
1,94
,914
2
1,06,
055
43,
767
Less
: Ded
uctio
ns d
urin
g th
e ye
ar**
* 1,
89,6
98
901
-
3,0
7,62
1 2
,944
5
,36,
843
3,14
,097
4
5,85
6 1,
09,3
78
1,16
,165
2,0
8,25
3 3
,53,
713
23,
87,0
02
43,
607
Add:
Tran
sfer
from
Rev
enue
Acc
ount
- -
- -
- -
- -
- -
- -
- -
Clos
ing
bala
nce
(4,4
4,96
3) (2
,729
) (7
7,65
2) (1
3,70
,670
) (7
,782
) 13
,46,
606
9,4
2,93
8 6
6,65
4 1,
47,8
20
32,
480
(4,3
0,04
1) (3
,73,
315)
12,8
0,95
4 (3
,923
)
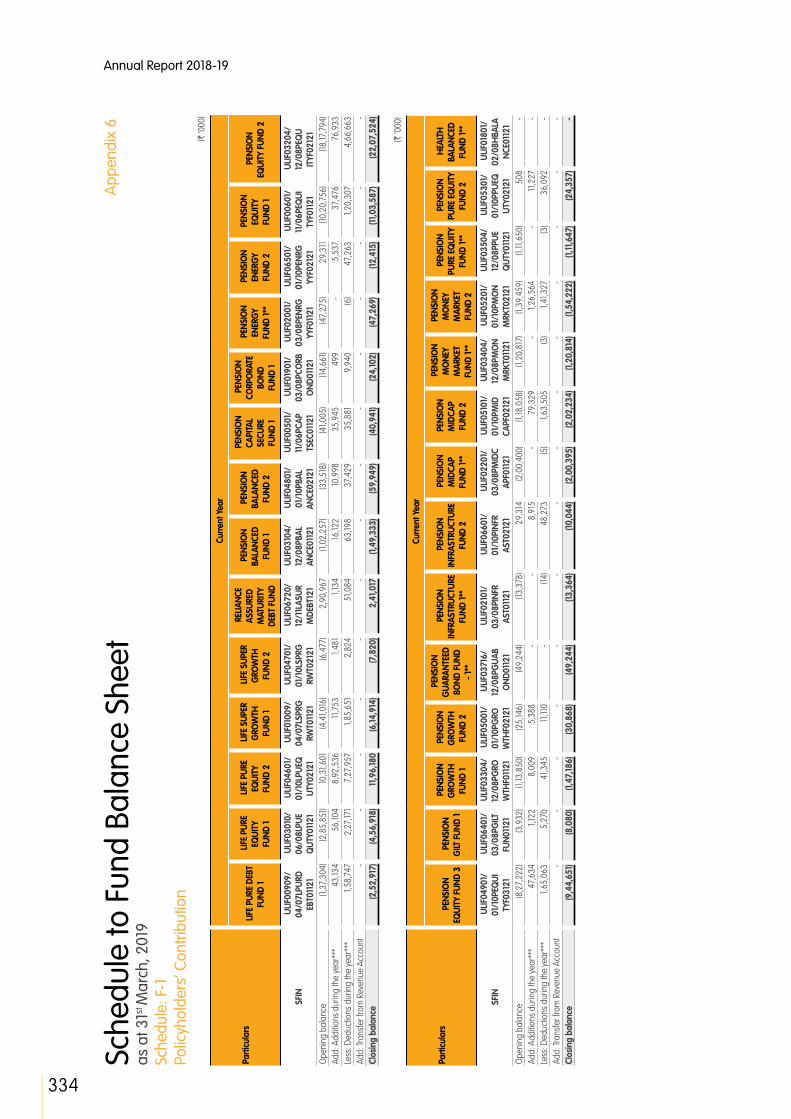
Annual Report 2018-19
334
Sche
dule
to F
und
Bala
nce
Shee
t as
at 3
1st M
arch
, 201
9 Sc
hedu
le: F
-1
Polic
yhol
ders
’ Con
tribu
tion
App
endi
x 6
(` ‘0
00)
Parti
cula
rs
Curre
nt Y
ear
LIFE
PUR
E DE
BT
FUND
1
LIFE
PUR
E EQ
UITY
FU
ND 1
LIFE
PUR
E EQ
UITY
FU
ND 2
LIFE
SUP
ER
GRO
WTH
FU
ND 1
LIFE
SUP
ER
GRO
WTH
FU
ND 2
REL
IANC
E AS
SURE
D M
ATUR
ITY
DEBT
FUN
D
PEN
SIO
N BA
LANC
ED
FUND
1
PEN
SIO
N BA
LANC
ED
FUND
2
PEN
SIO
N CA
PITA
L SE
CURE
FU
ND 1
PEN
SIO
N CO
RPO
RATE
BO
ND
FUND
1
PEN
SIO
N EN
ERG
Y FU
ND 1*
*
PEN
SIO
N EN
ERG
Y FU
ND 2
PEN
SIO
N EQ
UITY
FU
ND 1
PEN
SIO
N EQ
UITY
FUN
D 2
SFIN
ULIF
0090
9/
04/0
7LPU
RD
EBT0
1121
ULIF
0301
0/
06/0
8LPU
E Q
UTY0
1121
ULIF
0460
1/
01/1
0LPU
EQ
UTY0
2121
ULIF
0100
9/
04/0
7LSP
RG
RWT0
1121
ULIF
0470
1/
01/1
0LSP
RG
RWT0
2121
ULIF
0672
0/
12/1
1LAS
UR
MDE
BT12
1
ULIF
0310
4/
12/0
8PBA
L AN
CE01
121
ULIF
0480
1/
01/1
0PBA
L AN
CE02
121
ULIF
0050
1/
11/0
6PCA
P TS
EC01
121
ULIF
0190
1/
03/0
8PCO
RB
OND
0112
1
ULIF
0200
1/
03/0
8PEN
RG
YYF0
1121
ULIF
0650
1/
01/1
0PEN
RG
YYF0
2121
ULIF
0060
1/
11/0
6PEQ
UI
TYF0
1121
ULIF
0320
4/
12/0
8PEQ
U IT
YF02
121
Ope
ning
bal
ance
(1
,37,
304)
(2,8
5,85
1) 10
,31,6
01
(4,4
1,016
) (6
,477
) 2
,90,
967
(1,0
2,25
7) (3
3,51
8) (4
1,005
) (1
4,66
1) (4
7,27
5) 2
9,31
1 (1
0,20
,756
) (1
8,17
,794
)Ad
d: A
dditio
ns d
urin
g th
e ye
ar**
* 4
3,13
4 5
6,10
4 8
,92,
536
11,7
53
1,48
1 1,
134
16,12
2 10
,998
3
5,94
5 4
99
- 5
,537
3
7,47
6 7
6,93
3 Le
ss: D
educ
tions
dur
ing
the
year
***
1,58
,747
2
,27,
171
7,2
7,95
7 1,
85,6
51
2,8
24
51,0
84
63,
198
37,
429
35,
881
9,9
40
(6)
47,
263
1,20
,307
4
,66,
663
Add:
Tran
sfer
from
Rev
enue
Acc
ount
- -
- -
- -
- -
- -
- -
- -
Clos
ing
bala
nce
(2,5
2,91
7) (4
,56,
918)
11,9
6,18
0 (6
,14,9
14)
(7,8
20)
2,4
1,017
(1
,49,
333)
(59,
949)
(40,
941)
(24,
102)
(47,
269)
(12,
415)
(11,0
3,58
7) (2
2,07
,524
)
(` ‘0
00)
Parti
cula
rs
Curre
nt Y
ear
PEN
SIO
N EQ
UITY
FUN
D 3
PEN
SIO
N G
ILT F
UND
1
PEN
SIO
N G
ROW
TH
FUND
1
PEN
SIO
N G
ROW
TH
FUND
2
PEN
SIO
N G
UARA
NTEE
D BO
ND F
UND
- 1**
PEN
SIO
N IN
FRAS
TRUC
TURE
FU
ND 1*
*
PEN
SIO
N IN
FRAS
TRUC
TURE
FU
ND 2
PEN
SIO
N M
IDCA
P FU
ND 1*
*
PEN
SIO
N M
IDCA
P FU
ND 2
PEN
SIO
N M
ONE
Y M
ARKE
T FU
ND 1*
*
PEN
SIO
N M
ONE
Y M
ARKE
T FU
ND 2
PEN
SIO
N PU
RE E
QUI
TY
FUND
1**
PEN
SIO
N PU
RE E
QUI
TY
FUND
2
HEA
LTH
BA
LANC
ED
FUND
1**
SFIN
ULIF
0490
1/
01/1
0PEQ
UI
TYF0
3121
ULIF
0640
1/
03/0
8PG
ILT
FUN0
1121
ULIF
0330
4/
12/0
8PG
RO
WTH
F011
21
ULIF
0500
1/
01/1
0PG
RO
WTH
F021
21
ULIF
0371
6/
12/0
8PG
UAB
OND
0112
1
ULIF
0210
1/
03/0
8PIN
FR
AST0
1121
ULIF
0660
1/
01/1
0PIN
FR
AST0
2121
ULIF
0220
1/
03/0
8PM
IDC
APF0
1121
ULIF
0510
1/
01/1
0PM
ID
CAPF
0212
1
ULIF
0340
4/
12/0
8PM
ON
MRK
T011
21
ULIF
0520
1/
01/1
0PM
ON
MRK
T021
21
ULIF
0350
4/
12/0
8PPU
E Q
UTY0
1121
ULIF
0530
1/
01/1
0PPU
EQ
UTY0
2121
ULIF
0180
1/
02/0
8HBA
LA
NCE0
1121
O
peni
ng b
alan
ce
(8,2
7,22
2) (3
,932
) (1
,13,8
50)
(25,
146)
(49,
244)
(13,
378)
29,
314
(2,0
0,40
0) (1
,18,0
58)
(1,2
0,81
7) (1
,39,
459)
(1,11
,650
) 5
08
- Ad
d: A
dditio
ns d
urin
g th
e ye
ar**
* 4
7,63
4 1,
122
8,0
09
5,3
88
- -
8,9
15
- 7
9,32
9 -
1,26
,564
-
11,2
27
- Le
ss: D
educ
tions
dur
ing
the
year
***
1,65
,063
5
,270
4
1,345
11
,110
- (1
4) 4
8,27
3 (5
) 1,
63,5
05
(3)
1,41
,327
(3
) 3
6,09
2 -
Add:
Tran
sfer
from
Rev
enue
Acc
ount
- -
- -
- -
- -
- -
- -
- -
Clos
ing
bala
nce
(9,4
4,65
1) (8
,080
) (1
,47,
186)
(30,
868)
(49,
244)
(13,
364)
(10,
044)
(2,0
0,39
5) (2
,02,
234)
(1,2
0,81
4) (1
,54,
222)
(1,11
,647
) (2
4,35
7) -
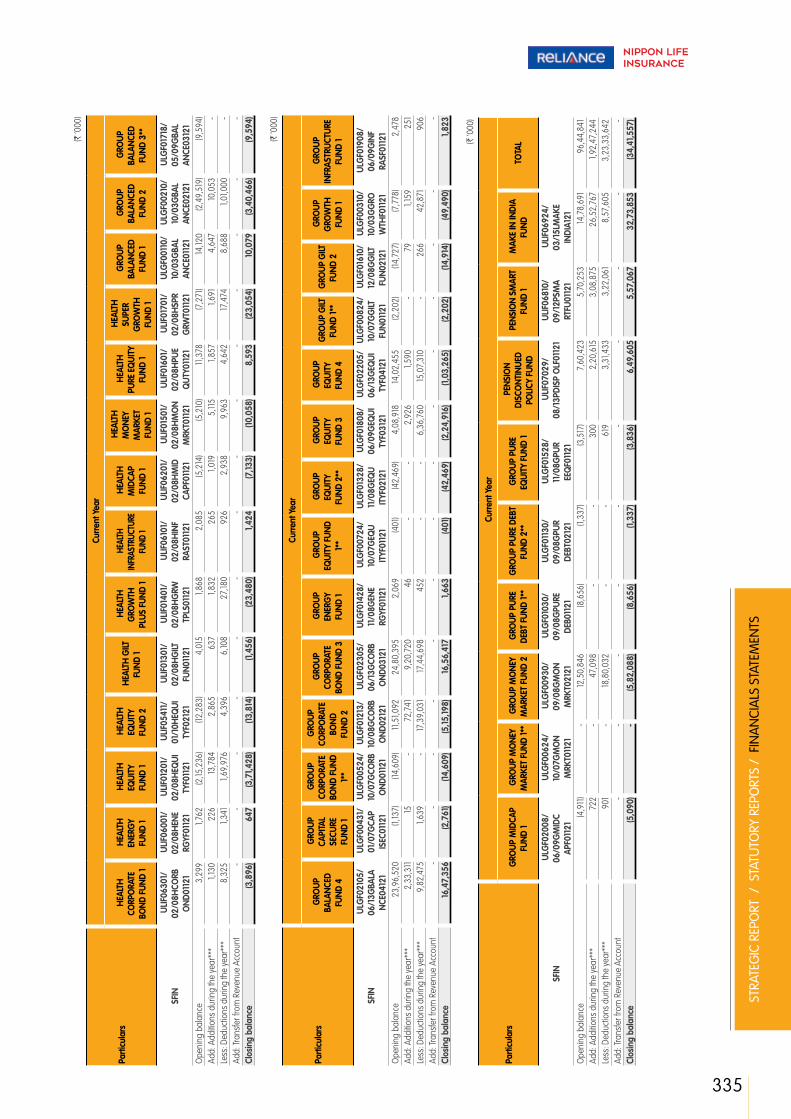
335
STRA
TEG
IC R
EPO
RT /
STA
TUTO
RY R
EPO
RTS
/ F
INA
NCI
ALS
STA
TEM
ENTS
(` ‘0
00)
Parti
cula
rs
Curre
nt Y
ear
HEA
LTH
CO
RPO
RATE
BO
ND F
UND
1
HEA
LTH
EN
ERG
Y FU
ND 1
HEA
LTH
EQ
UITY
FU
ND 1
HEA
LTH
EQ
UITY
FU
ND 2
HEA
LTH
GILT
FU
ND 1
HEA
LTH
G
ROW
TH
PLUS
FUN
D 1
HEA
LTH
INFR
ASTR
UCTU
RE
FUND
1
HEA
LTH
M
IDCA
P FU
ND 1
HEA
LTH
M
ONE
Y M
ARKE
T FU
ND 1
HEA
LTH
PU
RE E
QUI
TY
FUND
1
HEA
LTH
SU
PER
GRO
WTH
FU
ND 1
GRO
UP
BALA
NCED
FU
ND 1
GRO
UP
BALA
NCED
FU
ND 2
GRO
UP
BALA
NCED
FU
ND 3
**
SFIN
ULIF
0630
1/
02/0
8HCO
RB
OND
0112
1
ULIF
0600
1/
02/0
8HEN
E RG
YF01
121
ULIF
0120
1/
02/0
8HEQ
UI
TYF0
1121
ULIF
0541
1/
01/1
0HEQ
UI
TYF0
2121
ULIF
0130
1/
02/0
8HG
ILT
FUN0
1121
ULIF
0140
1/
02/0
8HG
RW
TPLS
0112
1
ULIF
0610
1/
02/0
8HIN
F RA
ST01
121
ULIF
0620
1/
02/0
8HM
ID
CAPF
0112
1
ULIF
0150
1/
02/0
8HM
ON
MRK
T011
21
ULIF
0160
1/
02/0
8HPU
E Q
UTY0
1121
ULIF
0170
1/
02/0
8HSP
R G
RWT0
1121
ULG
F001
10/
10/0
3GBA
L AN
CE01
121
ULG
F002
10/
10/0
3GBA
L AN
CE02
121
ULG
F017
18/
05/0
9GBA
L AN
CE03
121
Ope
ning
bal
ance
3
,299
1,
762
(2,15
,236
) (1
2,28
3) 4
,015
1,
868
2,0
85
(5,2
14)
(5,2
10)
11,3
78
(7,2
71)
14,12
0 (2
,49,
519)
(9,5
94)
Add:
Add
itions
dur
ing
the
year
***
1,13
0 2
26
13,7
84
2,8
65
637
1,
832
265
1,
019
5,11
5 1,
857
1,69
1 4
,647
10
,053
-
Less
: Ded
uctio
ns d
urin
g th
e ye
ar**
* 8
,325
1,
341
1,69
,976
4
,396
6
,108
27,
180
926
2
,938
9
,963
4
,642
17
,474
8
,688
1,
01,0
00
- Ad
d: Tr
ansf
er fr
om R
even
ue A
ccou
nt -
- -
- -
- -
- -
- -
- -
- Cl
osin
g ba
lanc
e (3
,896
) 6
47
(3,7
1,428
) (1
3,81
4) (1
,456
) (2
3,48
0) 1,
424
(7,13
3) (1
0,05
8) 8
,593
(2
3,05
4) 10
,079
(3
,40,
466)
(9,5
94)
(` ‘0
00)
Parti
cula
rs
Curre
nt Y
ear
GRO
UP
BALA
NCED
FU
ND 4
GRO
UP
CAPI
TAL
SECU
RE
FUND
1
GRO
UP
CORP
ORA
TE
BOND
FUN
D 1*
*
GRO
UP
CORP
ORA
TE
BOND
FU
ND 2
GRO
UP
CORP
ORA
TE
BOND
FUN
D 3
GRO
UP
ENER
GY
FUND
1
GRO
UP
EQUI
TY F
UND
1**
GRO
UP
EQUI
TY
FUND
2**
GRO
UP
EQUI
TY
FUND
3
GRO
UP
EQUI
TY
FUND
4
GRO
UP G
ILT
FUND
1**
GRO
UP G
ILT
FUND
2
GRO
UP
GRO
WTH
FU
ND 1
GRO
UP
INFR
ASTR
UCTU
RE
FUND
1
SFIN
ULG
F021
05/
06/1
3GBA
LA
NCE0
4121
ULG
F004
31/
01/0
7GCA
P IS
EC01
121
ULG
F005
24/
10/0
7GCO
RB
OND
0112
1
ULG
F012
13/
10/0
8GCO
RB
OND
0212
1
ULG
F023
05/
06/1
3GCO
RB
OND
0312
1
ULG
F014
28/
11/0
8GEN
E RG
YF01
121
ULG
F007
24/
10/0
7GEQ
U IT
YF01
121
ULG
F013
28/
11/0
8GEQ
U IT
YF02
121
ULG
F018
08/
06/0
9GEQ
UI
TYF0
3121
ULG
F022
05/
06/1
3GEQ
UI
TYF0
4121
ULG
F008
24/
10/0
7GG
ILT
FUN0
1121
ULG
F016
10/
12/0
8GG
ILT
FUN0
2121
ULG
F003
10/
10/0
3GG
RO
WTH
F011
21
ULG
F019
08/
06/0
9GIN
F RA
SF01
121
Ope
ning
bal
ance
2
3,96
,520
(1
,137)
(14,
609)
11,5
1,092
2
4,80
,395
2
,069
(4
01)
(42,
469)
4,0
8,91
8 14
,02,
455
(2,2
02)
(14,
727)
(7,7
78)
2,4
78
Add:
Add
itions
dur
ing
the
year
***
2,3
3,31
1 15
-
72,
741
9,2
0,72
0 4
6 -
- 2
,926
1,
590
- 7
9 1,
159
251
Le
ss: D
educ
tions
dur
ing
the
year
***
9,8
2,47
5 1,
639
- 17
,39,
031
17,4
4,69
8 4
52
- -
6,3
6,76
0 15
,07,
310
- 2
66
42,
871
906
Ad
d: Tr
ansf
er fr
om R
even
ue A
ccou
nt -
- -
- -
- -
- -
- -
- -
- Cl
osin
g ba
lanc
e 16
,47,
356
(2,7
61)
(14,
609)
(5,15
,198)
16,5
6,41
7 1,
663
(401
) (4
2,46
9) (2
,24,
916)
(1,0
3,26
5) (2
,202
) (1
4,91
4) (4
9,49
0) 1,
823
(` ‘0
00)
Parti
cula
rs
Curre
nt Y
ear
GRO
UP M
IDCA
P FU
ND 1
GRO
UP M
ONE
Y M
ARKE
T FU
ND 1*
* G
ROUP
MO
NEY
MAR
KET
FUND
2
GRO
UP P
URE
DEBT
FUN
D 1*
* G
ROUP
PUR
E DE
BT
FUND
2**
G
ROUP
PUR
E EQ
UITY
FUN
D 1
PEN
SIO
N DI
SCO
NTIN
UED
POLIC
Y FU
ND
PEN
SIO
N SM
ART
FUND
1 M
AKE
IN IN
DIA
FUND
T
OTA
L
SFIN
ULG
F020
08/
06/0
9GM
IDC
APF0
1121
ULG
F006
24/
10/0
7GM
ON
MRK
T011
21
ULG
F009
30/
09/0
8GM
ON
MRK
T021
21
ULG
F010
30/
09/0
8GPU
RE
DEB0
1121
ULG
F011
30/
09/0
8GPU
R DE
BT02
121
ULG
F015
28/
11/0
8GPU
R EE
QF0
1121
ULIF
0702
9/
08/1
3PDI
SP O
LF01
121
ULIF
0681
0/
09/1
2PSM
A RT
FU01
121
ULIF
0692
4/
03/1
5LM
AKE
INDI
A121
O
peni
ng b
alan
ce
(4,9
11)
- 12
,50,
846
(8,6
56)
(1,3
37)
(3,5
17)
7,6
0,42
3 5
,70,
253
14,7
8,69
1 9
6,44
,841
Ad
d: A
dditio
ns d
urin
g th
e ye
ar**
* 7
22
- 4
7,09
8 -
- 3
00
2,2
0,61
5 3
,08,
875
26,
52,7
67
1,92
,47,
244
Less
: Ded
uctio
ns d
urin
g th
e ye
ar**
* 9
01
- 18
,80,
032
- -
619
3
,31,4
33
3,2
2,06
1 8
,57,
605
3,2
3,33
,642
Ad
d: Tr
ansf
er fr
om R
even
ue A
ccou
nt -
- -
- -
- -
- -
- Cl
osin
g ba
lanc
e (5
,090
) -
(5,8
2,08
8) (8
,656
) (1
,337
) (3
,836
) 6
,49,
605
5,5
7,06
7 3
2,73
,853
(3
4,41
,557
)

Annual Report 2018-19
336
Sche
dule
to F
und
Bala
nce
Shee
t as
at 3
1st M
arch
, 201
9 Sc
hedu
le: F
-1
Polic
yhol
ders
’ Con
tribu
tion
App
endi
x 6
(` ‘0
00)
Parti
cula
rs
Prev
ious
Yea
r
DIS
CONT
INUE
D PO
LICY
FUND
LIFE
BA
LANC
ED
FUND
1
LIFE
CAP
ITAL
SECU
RE
FUND
1
LIFE
CO
RPO
RATE
BO
ND
FUND
1
LIFE
CO
RPO
RATE
BO
ND F
UND
2
LIFE
ENE
RGY
FUND
1 L
IFE E
NERG
Y FU
ND 2
L
IFE E
QUI
TY
FUND
1 L
IFE E
QUI
TY
FUND
2
LIFE
EQ
UITY
FU
ND 3
L
IFE G
ILT
FUND
1 L
IFE G
ILT
FUND
2
LIFE
G
ROW
TH
FUND
1
LIFE
GRO
WTH
FU
ND 2
SFIN
ULIF
0570
3/
09/1
0DIS
CP
OLF
0112
1
ULIF
0012
8/
07/0
4LBA
LA
NCE0
1121
ULIF
0022
8/
07/0
4LCA
PT
SEC0
1121
ULIF
0231
0/
06/0
8LCO
RB
OND
0112
1
ULIF
0402
0/
08/0
9LCO
RB
OND
0212
1
ULIF
0241
0/
06/0
8LEN
ER
GYF
0112
1
ULIF
0410
1/
01/1
0LEN
E RG
YF02
121
ULIF
0032
8/
07/0
4LEQ
UI
TYF0
1121
ULIF
0251
0/
06/0
8LEQ
UI
TYF0
2121
ULIF
0420
1/
01/1
0LEQ
UI
TYF0
3121
ULIF
0261
0/
06/0
8LG
ILTF
UN01
121
ULIF
0381
9/
03/0
9LG
ILTF
UN02
121
ULIF
0042
8/
07/0
4LG
RO
WTH
F011
21
ULIF
0110
2/
11/0
7LG
ROW
TH
F021
21
Ope
ning
bal
ance
3
6,85
,522
6
,44,
003
(15,
645)
23,
78,0
62
(15,
179)
2,0
2,93
8 4
6,78
9 (4
,32,
957)
(78,
82,18
5) 6
3,24
,209
10
,22,
337
(8,8
74)
16,9
02
50,
160
Add:
Add
itions
dur
ing
the
year
***
24,
98,5
56
4,4
6,48
0 18
,304
14
,59,
365
17,10
0 3
2,00
1 2
2,88
3 6
3,69
6 6
,66,
615
58,
70,5
20
1,91
,917
4
,129
13,9
87
27,
507
Less
: Ded
uctio
ns d
urin
g th
e ye
ar**
* 2
9,15
,810
4
,08,
978
24,
986
18,13
,938
18
,944
1,
47,0
51
38,
517
4,4
0,46
7 3
8,60
,604
7
3,54
,720
3
,31,7
02
6,6
07
52,
258
69,
957
Add:
Tran
sfer
from
Rev
enue
Acc
ount
- -
- -
- -
- -
- -
- -
- -
Clos
ing
bala
nce
32,
68,2
68
6,8
1,505
(2
2,32
7) 2
0,23
,489
(1
7,02
3) 8
7,88
8 3
1,155
(8
,09,
728)
(1,10
,76,
174)
48,
40,0
09
8,8
2,55
2 (1
1,352
) (2
1,369
) 7
,710
(` ‘0
00)
Parti
cula
rs
Prev
ious
Yea
r
LIFE
G
ROW
TH
PLUS
FUN
D 1
LIFE
G
ROW
TH
PLUS
FU
ND 2
LIFE
G
UARA
NTEE
D BO
ND F
UND
- 1**
LIFE
HIG
H
GRO
WTH
FU
ND 1
LIFE
HIG
H
GRO
WTH
FU
ND 2
LIFE
H
IGH
EST
NAV
GUA
RANT
EE
FUND
1
LIFE
H
IGH
EST
NAV
ADVA
NTAG
E FU
ND 1
LIFE
H
IGH
EST
NAV
ADVA
NTAG
E FU
ND 2
LIFE
IN
FRAS
TRUC
TURE
FU
ND 1
LIFE
IN
FRAS
TRUC
TURE
FU
ND 2
LIFE
M
IDCA
P FU
ND 1
LIFE
M
IDCA
P FU
ND 2
LIFE
MO
NEY
MAR
KET
FUND
1
LIFE
MO
NEY
MAR
KET
FUND
2
SFIN
ULIF
0080
9/
04/0
7LG
RW
TPLS
0112
1
ULIF
0430
1/
01/1
0LG
RW
TPLS
0212
1
ULIF
0361
6/
12/0
8LG
UAB
OND
0112
1
ULIF
0072
8/
02/0
7LH
IGR
OW
T011
21
ULIF
0551
1/
01/1
0LH
IGR
OW
T021
21
ULIF
0561
2/
02/1
0LH
NAV
GUA
0112
1
ULIF
0580
3/
09/1
0LH
NAV
ADV0
1121
ULIF
0590
1/
06/1
1LH
NAV
ADV0
2121
ULIF
0271
0/
06/0
8LIN
FR
AST0
1121
ULIF
0440
1/
01/1
0LIN
FR
AST0
2121
ULIF
0281
0/
06/0
8LM
IDC
APF0
1121
ULIF
0450
1/
01/1
0LM
IDC
APF0
2121
ULIF
0291
0/
06/0
8LM
ON
MRK
T011
21
ULIF
0391
9/
03/0
9LM
ON
MRK
T021
21
Ope
ning
bal
ance
(1
,32,
751)
1,32
7 (7
7,65
2) (6
,44,
361)
(3,0
94)
20,
64,7
17
16,2
9,76
8 1,
88,4
44
3,2
8,72
5 9
6,01
0 (1
,78,
325)
(53)
18,2
7,53
4 (3
,481
)Ad
d: A
dditio
ns d
urin
g th
e ye
ar**
* 2
6,51
0 1,
242
- 6
1,031
2
,352
3
,83,
105
90,
204
15,5
22
51,5
51
1,09
,956
1,
23,0
26
3,5
9,07
2 2
8,24
,628
4
8,46
4 Le
ss: D
educ
tions
dur
ing
the
year
***
1,60
,147
5,3
08
- 5
,12,4
26
4,8
43
9,18
,973
5
,30,
027
99,
975
1,49
,668
1,
34,3
26
2,3
1,905
5
,73,
535
30,
90,2
61
49,
066
Add:
Tran
sfer
from
Rev
enue
Acc
ount
- -
- -
- -
- -
- -
- -
- -
Clos
ing
bala
nce
(2,6
6,38
8) (2
,739
) (7
7,65
2) (1
0,95
,756
) (5
,585
) 15
,28,
849
11,8
9,94
5 1,
03,9
91
2,3
0,60
8 7
1,640
(2
,87,
204)
(2,14
,516
) 15
,61,9
01
(4,0
83)

337
STRA
TEG
IC R
EPO
RT /
STA
TUTO
RY R
EPO
RTS
/ F
INA
NCI
ALS
STA
TEM
ENTS
(` ‘0
00)
Parti
cula
rs
Prev
ious
Yea
r
LIFE
PUR
E DE
BT
FUND
1
LIFE
PUR
E EQ
UITY
FU
ND 1
LIFE
PUR
E EQ
UITY
FU
ND 2
LIFE
SUP
ER
GRO
WTH
FU
ND 1
LIFE
SUP
ER
GRO
WTH
FU
ND 2
REL
IANC
E AS
SURE
D M
ATUR
ITY
DEBT
FUN
D
PEN
SIO
N BA
LANC
ED
FUND
1
PEN
SIO
N BA
LANC
ED
FUND
2
PEN
SIO
N CA
PITA
L SE
CURE
FU
ND 1
PEN
SIO
N CO
RPO
RATE
BO
ND
FUND
1
PEN
SIO
N EN
ERG
Y FU
ND 1*
*
PEN
SIO
N EN
ERG
Y FU
ND 2
PEN
SIO
N EQ
UITY
FU
ND 1
PEN
SIO
N EQ
UITY
FUN
D 2
SFIN
ULIF
0090
9/
04/0
7LPU
RD
EBT0
1121
ULIF
0301
0/
06/0
8LPU
EQ
UTY0
1121
ULIF
0460
1/
01/1
0LPU
EQ
UTY0
2121
ULIF
0100
9/
04/0
7LSP
RG
RWT0
1121
ULIF
0470
1/
01/1
0LSP
RG
RWT0
2121
ULIF
0672
0/
12/1
1LAS
UR
MDE
BT12
1
ULIF
0310
4/
12/0
8PBA
LA
NCE0
1121
ULIF
0480
1/
01/1
0PBA
LA
NCE0
2121
ULIF
0050
1/
11/0
6PCA
PT
SEC0
1121
ULIF
0190
1/
03/0
8PCO
RB
OND
0112
1
ULIF
0200
1/
03/0
8PEN
RG
YYF0
1121
ULIF
0650
1/
01/1
0PEN
RG
YYF0
2121
ULIF
0060
1/
11/0
6PEQ
U IT
YF01
121
ULIF
0320
4/
12/0
8PEQ
UI
TYF0
2121
O
peni
ng b
alan
ce
74,
993
(1,9
3,79
3) 9
,88,
340
(2,6
5,93
5) (3
,757
) 4
,38,
729
(68,
068)
(32,
849)
(26,
716)
9,5
23
(47,
275)
1,14
,032
(7
,62,
039)
(14,
53,8
34)
Add:
Add
itions
dur
ing
the
year
***
58,
511
84,
437
7,8
8,28
7 2
1,806
1,
231
1,03
0 2
9,85
7 2
3,96
5 2
7,67
2 1,
179
- 9
,469
3
8,89
5 8
1,901
Le
ss: D
educ
tions
dur
ing
the
year
***
2,7
0,80
8 1,
76,4
95
7,4
5,02
6 1,
96,8
87
3,9
51
1,48
,792
6
4,04
6 2
4,63
4 4
1,961
2
5,36
3 -
94,
190
2,9
7,61
2 4
,45,
861
Add:
Tran
sfer
from
Rev
enue
Acc
ount
- -
- -
- -
- -
- -
- -
- -
Clos
ing
bala
nce
(1,3
7,30
4) (2
,85,
851)
10,3
1,601
(4
,41,0
16)
(6,4
77)
2,9
0,96
7 (1
,02,
257)
(33,
518)
(41,0
05)
(14,
661)
(47,
275)
29,
311
(10,
20,7
56)
(18,
17,7
94)
(` ‘0
00)
Parti
cula
rs
Prev
ious
Yea
r
PEN
SIO
N EQ
UITY
FU
ND 3
PEN
SIO
N G
ILT F
UND
1
PEN
SIO
N G
ROW
TH
FUND
1
PEN
SIO
N G
ROW
TH
FUND
2
PEN
SIO
N G
UARA
NTEE
D BO
ND F
UND
- 1**
PEN
SIO
N IN
FRAS
TRUC
TURE
FU
ND 1*
*
PEN
SIO
N IN
FRAS
TRUC
TURE
FU
ND 2
PEN
SIO
N M
IDCA
P FU
ND 1*
*
PEN
SIO
N M
IDCA
P FU
ND 2
PEN
SIO
N M
ONE
Y M
ARKE
T FU
ND 1*
*
PEN
SIO
N M
ONE
Y M
ARKE
T FU
ND 2
PEN
SIO
N PU
RE
EQUI
TY
FUND
1**
PEN
SIO
N PU
RE
EQUI
TY
FUND
2
HEA
LTH
BA
LANC
ED
FUND
1**
SFIN
ULIF
0490
1/
01/1
0PEQ
U IT
YF03
121
ULIF
0640
1/
03/0
8PG
ILT
FUN0
1121
ULIF
0330
4/
12/0
8PG
RO
WTH
F011
21
ULIF
0500
1/
01/1
0PG
RO
WTH
F021
21
ULIF
0371
6/
12/0
8PG
UAB
OND
0112
1
ULIF
0210
1/
03/0
8PIN
FR
AST0
1121
ULIF
0660
1/
01/1
0PIN
FR
AST0
2121
ULIF
0220
1/
03/0
8PM
IDC
APF0
1121
ULIF
0510
1/
01/1
0PM
ID
CAPF
0212
1
ULIF
0340
4/
12/0
8PM
ON
MRK
T011
21
ULIF
0520
1/
01/1
0PM
ON
MRK
T021
21
ULIF
0350
4/
12/0
8PPU
E Q
UTY0
1121
ULIF
0530
1/
01/1
0PPU
EQ
UTY0
2121
ULIF
0180
1/
02/0
8HBA
L AN
CE01
121
Ope
ning
bal
ance
(6
,56,
258)
4,17
5 (7
8,74
6) (1
1,668
) (4
9,24
4) (1
3,37
8) 1,
02,5
36
(2,0
0,40
0) (1
5,28
5) (1
,20,
817)
(80,
274)
(1,11
,650
) 2
8,21
9 -
Add:
Add
itions
dur
ing
the
year
***
70,
890
81
12,16
4 4
,419
-
- 2
7,20
5 -
1,00
,109
- 1,
24,16
8 -
18,2
09
- Le
ss: D
educ
tions
dur
ing
the
year
***
2,4
1,854
8
,188
47,
268
17,8
97
- -
1,00
,427
-
2,0
2,88
2 -
1,83
,353
-
45,
920
- Ad
d: Tr
ansf
er fr
om R
even
ue A
ccou
nt -
- -
- -
- -
- -
- -
- -
- Cl
osin
g ba
lanc
e (8
,27,
222)
(3,9
32)
(1,13
,850
) (2
5,14
6) (4
9,24
4) (1
3,37
8) 2
9,31
4 (2
,00,
400)
(1,18
,058
) (1
,20,
817)
(1,3
9,45
9) (1
,11,6
50)
508
-
(` ‘0
00)
Parti
cula
rs
Prev
ious
Yea
r
HEA
LTH
CO
RPO
RATE
BO
ND
FUND
1
HEA
LTH
EN
ERG
Y FU
ND 1
HEA
LTH
EQ
UITY
FU
ND 1
HEA
LTH
EQ
UITY
FU
ND 2
HEA
LTH
GILT
FU
ND 1
HEA
LTH
G
ROW
TH P
LUS
FUND
1
HEA
LTH
IN
FRAS
TRUC
TURE
FU
ND 1
HEA
LTH
M
IDCA
P FU
ND 1
HEA
LTH
M
ONE
Y M
ARKE
T FU
ND 1
HEA
LTH
PU
RE
EQUI
TY
FUND
1
HEA
LTH
SU
PER
GRO
WTH
FU
ND 1
GRO
UP
BALA
NCED
FU
ND 1
GRO
UP
BALA
NCED
FU
ND 2
GRO
UP
BALA
NCED
FU
ND 3
**
SFIN
ULIF
0630
1/
02/0
8HCO
RB
OND
0112
1
ULIF
0600
1/
02/0
8HEN
E RG
YF01
121
ULIF
0120
1/
02/0
8HEQ
U IT
YF01
121
ULIF
0541
1/
01/1
0HEQ
U IT
YF02
121
ULIF
0130
1/
02/0
8HG
IL TF
UN01
121
ULIF
0140
1/
02/0
8HG
R W
TPLS
0112
1
ULIF
0610
1/
02/0
8HIN
F RA
ST01
121
ULIF
0620
1/
02/0
8HM
ID
CAPF
0112
1
ULIF
0150
1/
02/0
8HM
ON
MRK
T011
21
ULIF
0160
1/
02/0
8HPU
E Q
UTY0
1121
ULIF
0170
1/
02/0
8HSP
RG
RWT0
1121
ULG
F001
10/
10/0
3GBA
L AN
CE01
121
ULG
F002
10/
10/0
3GBA
L AN
CE02
121
ULG
F017
18/
05/0
9GBA
LA
NCE0
3121
O
peni
ng b
alan
ce
7,0
95
2,7
15
(4,4
18)
(1,5
05)
6,13
4 18
,437
3
,273
(1
,411
) (2
,590
) 13
,352
5
,834
12
,142
(46,
324)
(9,5
94)
Add:
Add
itions
dur
ing
the
year
***
3,6
91
545
2
1,445
3
,406
1,
553
3,9
16
781
11
,029
13
,430
1,
757
2,6
18
4,5
55
49,
172
- Le
ss: D
educ
tions
dur
ing
the
year
***
7,4
87
1,49
8 2
,32,
263
14,18
4 3
,672
2
0,48
5 1,
969
14,8
32
16,0
50
3,7
31
15,7
23
2,5
77
2,5
2,36
7 -
Add:
Tran
sfer
from
Rev
enue
Acc
ount
- -
- -
- -
- -
- -
- -
- -
Clos
ing
bala
nce
3,2
99
1,76
2 (2
,15,2
36)
(12,
283)
4,0
15
1,86
8 2
,085
(5
,214
) (5
,210
) 11
,378
(7
,271
) 14
,120
(2,4
9,51
9) (9
,594
)
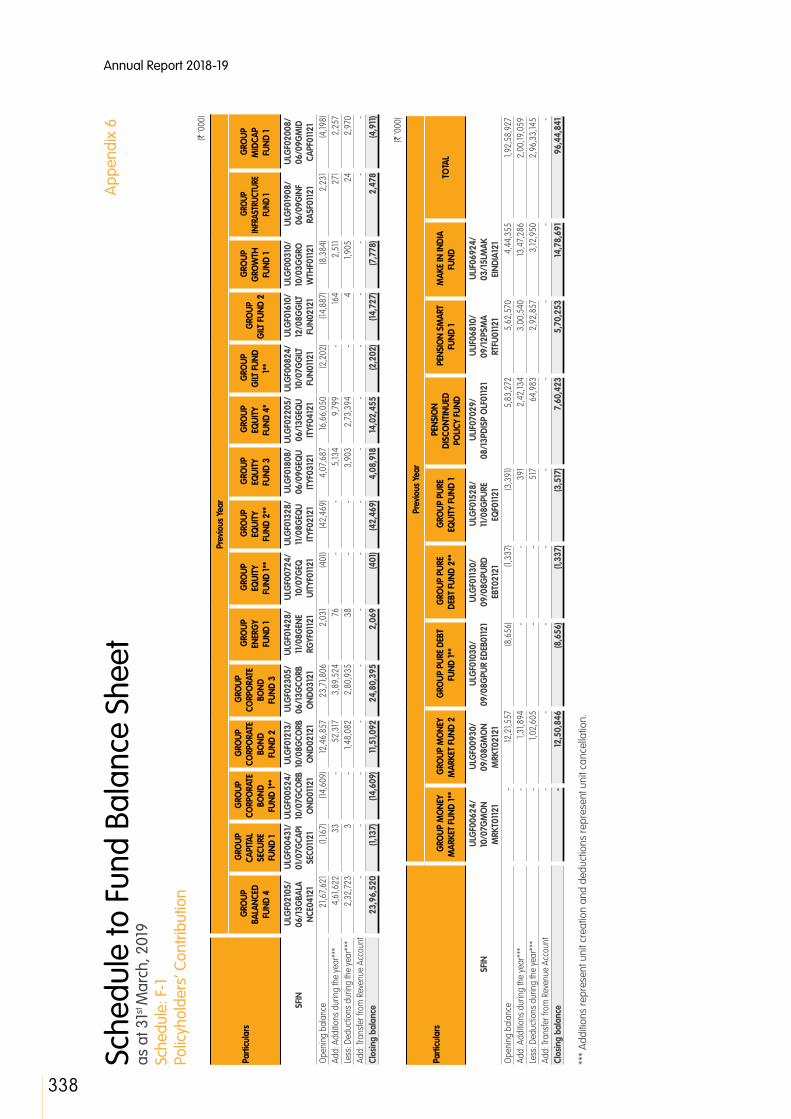
Annual Report 2018-19
338
Sche
dule
to F
und
Bala
nce
Shee
t as
at 3
1st M
arch
, 201
9 Sc
hedu
le: F
-1
Polic
yhol
ders
’ Con
tribu
tion
App
endi
x 6
(` ‘0
00)
Parti
cula
rs
Prev
ious
Yea
r
GRO
UP
BALA
NCED
FU
ND 4
GRO
UP
CAPI
TAL
SECU
RE
FUND
1
GRO
UP
CORP
ORA
TE
BOND
FU
ND 1*
*
GRO
UP
CORP
ORA
TE
BOND
FU
ND 2
GRO
UP
CORP
ORA
TE
BOND
FU
ND 3
GRO
UP
ENER
GY
FUND
1
GRO
UP
EQUI
TY
FUND
1**
GRO
UP
EQUI
TY
FUND
2**
GRO
UP
EQUI
TY
FUND
3
GRO
UP
EQUI
TY
FUND
4*
GRO
UP
GILT
FUN
D 1*
*
GRO
UP
GILT
FUN
D 2
GRO
UP
GRO
WTH
FU
ND 1
GRO
UP
INFR
ASTR
UCTU
RE
FUND
1
GRO
UP
MID
CAP
FUND
1
SFIN
ULG
F021
05/
06/1
3GBA
LA
NCE0
4121
ULG
F004
31/
01/0
7GCA
PI
SEC0
1121
ULG
F005
24/
10/0
7GCO
RB
OND
0112
1
ULG
F012
13/
10/0
8GCO
RB
OND
0212
1
ULG
F023
05/
06/1
3GCO
RB
OND
0312
1
ULG
F014
28/
11/0
8GEN
E RG
YF01
121
ULG
F007
24/
10/0
7GEQ
UI
TYF0
1121
ULG
F013
28/
11/0
8GEQ
U IT
YF02
121
ULG
F018
08/
06/0
9GEQ
U IT
YF03
121
ULG
F022
05/
06/1
3GEQ
U IT
YF04
121
ULG
F008
24/
10/0
7GG
ILT
FUN0
1121
ULG
F016
10/
12/0
8GG
ILT
FUN0
2121
ULG
F003
10/
10/0
3GG
RO
WTH
F011
21
ULG
F019
08/
06/0
9GIN
F RA
SF01
121
ULG
F020
08/
06/0
9GM
ID
CAPF
0112
1 O
peni
ng b
alan
ce
21,6
7,62
1 (1
,167)
(14,
609)
12,4
6,85
7 2
3,71
,806
2
,031
(4
01)
(42,
469)
4,0
7,68
7 16
,66,
050
(2,2
02)
(14,
887)
(8,3
84)
2,2
31
(4,19
8)Ad
d: A
dditio
ns d
urin
g th
e ye
ar**
* 4
,61,6
22
33
- 5
2,31
7 3
,89,
524
76
- -
5,13
4 9
,799
-
164
2,5
11
271
2
,257
Le
ss: D
educ
tions
dur
ing
the
year
***
2,3
2,72
3 3
-
1,48
,082
2
,80,
935
38
- -
3,9
03
2,7
3,39
4 -
4
1,90
5 2
4 2
,970
Ad
d: Tr
ansf
er fr
om R
even
ue A
ccou
nt -
- -
- -
- -
- -
- -
- -
- -
Clos
ing
bala
nce
23,
96,5
20
(1,13
7) (1
4,60
9) 11
,51,0
92
24,
80,3
95
2,0
69
(401
) (4
2,46
9) 4
,08,
918
14,0
2,45
5 (2
,202
) (1
4,72
7) (7
,778
) 2
,478
(4
,911
)
(` ‘0
00)
Parti
cula
rs
Prev
ious
Yea
r
GRO
UP M
ONE
Y M
ARKE
T FU
ND 1*
* G
ROUP
MO
NEY
MAR
KET
FUND
2
GRO
UP P
URE
DEBT
FU
ND 1*
* G
ROUP
PUR
E DE
BT F
UND
2**
GRO
UP P
URE
EQUI
TY F
UND
1
PEN
SIO
N DI
SCO
NTIN
UED
POLIC
Y FU
ND
PEN
SIO
N SM
ART
FUND
1 M
AKE
IN IN
DIA
FUND
T
OTA
L
SFIN
ULG
F006
24/
10/0
7GM
ON
MRK
T011
21
ULG
F009
30/
09/0
8GM
ON
MRK
T021
21
ULG
F010
30/
09/0
8GPU
R ED
EB01
121
ULG
F011
30/
09/0
8GPU
RD
EBT0
2121
ULG
F015
28/
11/0
8GPU
RE
EQF0
1121
ULIF
0702
9/
08/1
3PDI
SP O
LF01
121
ULIF
0681
0/
09/1
2PSM
A RT
FU01
121
ULIF
0692
4/
03/1
5LM
AK
EIND
IA12
1 O
peni
ng b
alan
ce
- 12
,21,5
57
(8,6
56)
(1,3
37)
(3,3
91)
5,8
3,27
2 5
,62,
570
4,4
4,35
5 1,
92,5
8,92
7 Ad
d: A
dditio
ns d
urin
g th
e ye
ar**
* -
1,31
,894
-
- 3
91
2,4
2,13
4 3
,00,
540
13,4
7,28
6 2
,00,
19,0
59
Less
: Ded
uctio
ns d
urin
g th
e ye
ar**
* -
1,02
,605
-
- 5
17
64,
983
2,9
2,85
7 3
,12,9
50
2,9
6,33
,145
Add:
Tran
sfer
from
Rev
enue
Acc
ount
- -
- -
- -
- -
- Cl
osin
g ba
lanc
e -
12,5
0,84
6 (8
,656
) (1
,337
) (3
,517
) 7
,60,
423
5,7
0,25
3 14
,78,
691
96,
44,8
41
***
Add
ition
s re
pres
ent u
nit c
reat
ion
and
dedu
ctio
ns re
pres
ent u
nit c
ance
llatio
n.

339
STRA
TEG
IC R
EPO
RT /
STA
TUTO
RY R
EPO
RTS
/ F
INA
NCI
ALS
STA
TEM
ENTS
Sche
dule
to F
und
Bala
nce
Shee
t as
at 3
1st M
arch
, 201
9 Sc
hedu
le: F
-2
Inve
stm
ents
(` ‘0
00)
Parti
cula
rs
Cur
rent
Yea
r
DISC
ONTIN
UED
POLIC
Y FUN
D
LIFE
BA
LANC
ED
FUND
1
LIFE
CAP
ITAL
SECU
RE
FUND
1
LIFE
CO
RPO
RATE
BO
ND F
UND
1
LIFE
CO
RPO
RATE
BO
ND F
UND
2
LIFE
ENE
RGY
FUND
1 L
IFE E
NERG
Y FU
ND 2
L
IFE E
QUI
TY
FUND
1 L
IFE E
QUI
TY
FUND
2
LIFE
EQ
UITY
FU
ND 3
L
IFE G
ILT
FUND
1 L
IFE G
ILT
FUND
2
LIFE
GRO
WTH
FU
ND 1
LIFE
GRO
WTH
FU
ND 2
SFIN
ULIF
0570
3/
09/1
0DIS
CP
OLF
0112
1
ULIF
0012
8/
07/0
4LBA
LA
NCE0
1121
ULIF
0022
8/
07/0
4LCA
P TS
EC01
121
ULIF
0231
0/
06/0
8LCO
RB
OND
0112
1
ULIF
0402
0/
08/0
9LCO
RB
OND
0212
1
ULIF
0241
0/
06/0
8LEN
E RG
YF01
121
ULIF
0410
1/
01/1
0LEN
ER
GYF
0212
1
ULIF
0032
8/
07/0
4LEQ
UI
TYF0
1121
ULIF
0251
0/
06/0
8LEQ
U IT
YF02
121
ULIF
0420
1/
01/1
0LEQ
U IT
YF03
121
ULIF
0261
0/
06/0
8LG
IL TF
UN01
121
ULIF
0381
9/
03/0
9LG
IL TF
UN02
121
ULIF
0042
8/
07/0
4LG
RO
WTH
F011
21
ULIF
0110
2/
11/0
7LG
RO
WTH
F021
21
Appr
oved
Inve
stm
ents
Gove
rnm
ent B
onds
32,
03,7
45
5,13
,045
2
4,58
8 16
,27,
727
17,5
15
4,3
7,09
8 14
,493
5
6,58
5 6
3,36
7 Co
rpor
ate
Bond
s 6
6,92
6 1,
63,10
4 2
,030
In
frast
ruct
ure
Bond
s 2
,05,
985
7,4
6,62
4 6
,091
3
6,49
2 4
3,34
4 Eq
uity
1,94
,524
1,
74,7
92
59,
006
13,5
3,45
8 6
3,57
,200
1,
45,12
,471
6
0,24
5 6
7,31
1 M
oney
Mar
ket
8,5
5,81
6 2
9,01
1 10
,473
1,
02,5
35
1,53
7 4
2,82
5 15
,025
7
9,61
8 1,
57,4
35
11,16
,786
2
1,558
9
39
5,7
84
2,6
03
Mut
ual F
unds
Sub
Tota
l 4
0,59
,561
10
,09,
491
35,
061
26,
39,9
91
27,
173
2,17
,617
7
4,03
1 14
,33,
077
65,
14,6
36
1,56
,29,
257
4,5
8,65
6 15
,432
1,
59,10
6 1,
76,6
25
Oth
er In
vest
men
tsCo
rpor
ate
Bond
s 4
4,86
7 8
5,65
6 1,
020
Infra
stru
ctur
e Bo
nds
Equ
ity
17,7
08
68,
613
3,0
2,68
2 8
,65,
512
3,7
91
4,3
09
Mon
ey M
arke
t -
- -
- -
- -
- -
- -
- -
- M
utua
l Fun
ds
Sub
Tota
l -
62,
576
- 8
5,65
6 1,
020
- -
68,
613
3,0
2,68
2 8
,65,
512
- -
3,7
91
4,3
09
TOTA
L 4
0,59
,561
10
,72,
067
35,
061
27,
25,6
47
28,
193
2,17
,617
7
4,03
1 15
,01,6
90
68,
17,3
18
1,64
,94,
769
4,5
8,65
6 15
,432
1,
62,8
97
1,80
,934
%
of A
ppro
ved
Inve
stm
ents
to To
tal
100
94
100
97
96
100
100
95
96
95
100
100
98
98
% o
f Oth
er In
vest
men
ts to
Tota
l -
6
- 3
4
-
- 5
4
5
-
- 2
2
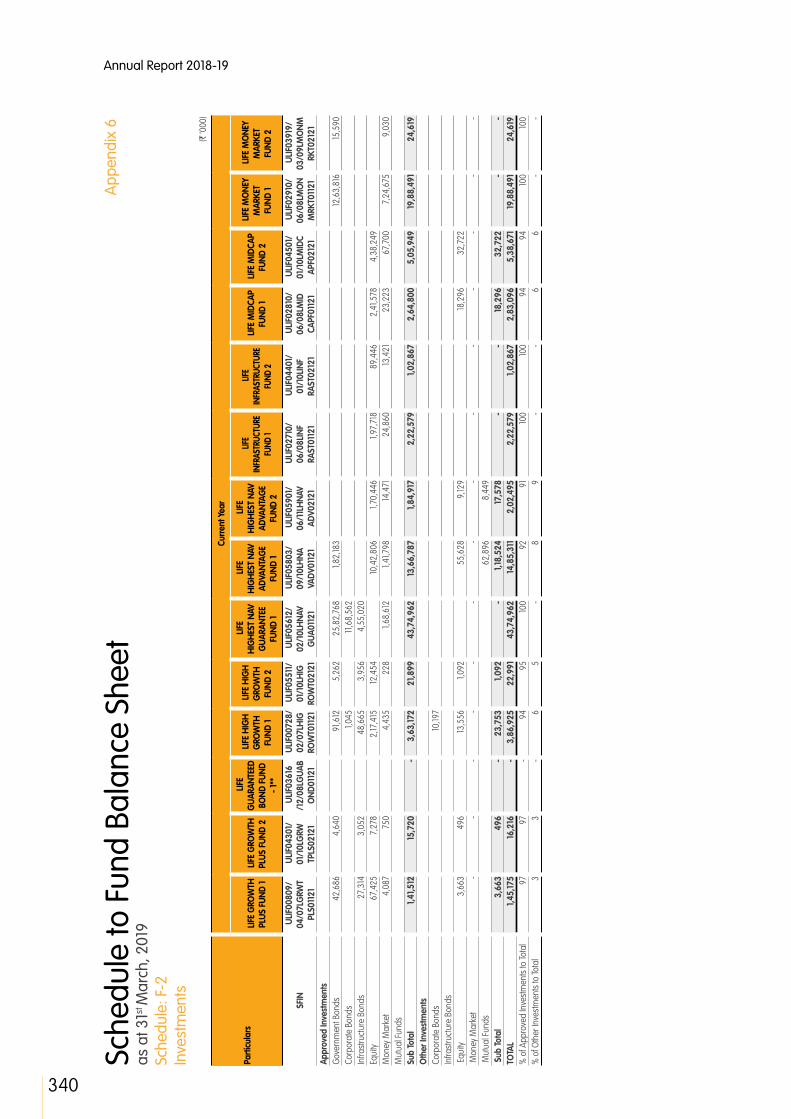
Annual Report 2018-19
340
Sche
dule
to F
und
Bala
nce
Shee
t as
at 3
1st M
arch
, 201
9 Sc
hedu
le: F
-2
Inve
stm
ents
App
endi
x 6
(` ‘0
00)
Parti
cula
rs
Cur
rent
Yea
r
LIFE
GRO
WTH
PL
US F
UND
1 L
IFE G
ROW
TH
PLUS
FUN
D 2
LIFE
G
UARA
NTEE
D BO
ND F
UND
- 1**
LIFE
HIG
H
GRO
WTH
FU
ND 1
LIFE
HIG
H
GRO
WTH
FU
ND 2
LIFE
H
IGH
EST
NAV
GUA
RANT
EE
FUND
1
LIFE
H
IGH
EST
NAV
ADVA
NTAG
E FU
ND 1
LIFE
H
IGH
EST
NAV
ADVA
NTAG
E FU
ND 2
LIFE
IN
FRAS
TRUC
TURE
FU
ND 1
LIFE
IN
FRAS
TRUC
TURE
FU
ND 2
LIFE
MID
CAP
FUND
1 L
IFE M
IDCA
P FU
ND 2
LIFE
MO
NEY
MAR
KET
FUND
1
LIFE
MO
NEY
MAR
KET
FUND
2
SFIN
ULIF
0080
9/
04/0
7LG
RWT
PLS0
1121
ULIF
0430
1/
01/1
0LG
RW
TPLS
0212
1
ULIF
0361
6 /1
2/08
LGUA
B O
ND01
121
ULIF
0072
8/
02/0
7LH
IG
ROW
T011
21
ULIF
0551
1/
01/1
0LH
IG
ROW
T021
21
ULIF
0561
2/
02/1
0LH
NAV
GUA
0112
1
ULIF
0580
3/
09/1
0LH
NA
VADV
0112
1
ULIF
0590
1/
06/1
1LH
NAV
ADV0
2121
ULIF
0271
0/
06/0
8LIN
F RA
ST01
121
ULIF
0440
1/
01/1
0LIN
F RA
ST02
121
ULIF
0281
0/
06/0
8LM
ID
CAPF
0112
1
ULIF
0450
1/
01/1
0LM
IDC
APF0
2121
ULIF
0291
0/
06/0
8LM
ON
MRK
T011
21
ULIF
0391
9/
03/0
9LM
ONM
RK
T021
21
Appr
oved
Inve
stm
ents
Gove
rnm
ent B
onds
42,
686
4,6
40
91,6
12
5,2
62
25,
82,7
68
1,82
,183
12,6
3,81
6 15
,590
Co
rpor
ate
Bond
s 1,
045
11,6
8,56
2 In
frast
ruct
ure
Bond
s 2
7,31
4 3
,052
4
8,66
5 3
,956
4
,55,
020
Equi
ty 6
7,42
5 7
,278
2
,17,4
15
12,4
54
10,4
2,80
6 1,
70,4
46
1,97
,718
8
9,44
6 2
,41,5
78
4,3
8,24
9 M
oney
Mar
ket
4,0
87
750
4
,435
2
28
1,68
,612
1,
41,7
98
14,4
71
24,
860
13,4
21
23,
223
67,
700
7,2
4,67
5 9
,030
M
utua
l Fun
dsSu
b To
tal
1,41
,512
15
,720
-
3,6
3,17
2 2
1,899
4
3,74
,962
13
,66,
787
1,84
,917
2
,22,
579
1,02
,867
2
,64,
800
5,0
5,94
9 19
,88,
491
24,
619
Oth
er In
vest
men
tsCo
rpor
ate
Bond
s 10
,197
Infra
stru
ctur
e Bo
nds
Equ
ity
3,6
63
496
13
,556
1,
092
55,
628
9,12
9 18
,296
3
2,72
2 M
oney
Mar
ket
- -
- -
- -
- -
- -
- -
- -
Mut
ual F
unds
6
2,89
6 8
,449
S
ub To
tal
3,6
63
496
-
23,
753
1,09
2 -
1,18
,524
17
,578
-
- 18
,296
3
2,72
2 -
- TO
TAL
1,45
,175
16,2
16
- 3
,86,
925
22,
991
43,
74,9
62
14,8
5,31
1 2
,02,
495
2,2
2,57
9 1,
02,8
67
2,8
3,09
6 5
,38,
671
19,8
8,49
1 2
4,61
9 %
of A
ppro
ved
Inve
stm
ents
to To
tal
97
97
- 9
4 9
5 10
0 9
2 9
1 10
0 10
0 9
4 9
4 10
0 10
0 %
of O
ther
Inve
stm
ents
to To
tal
3
3
- 6
5
-
8
9
- -
6
6
- -
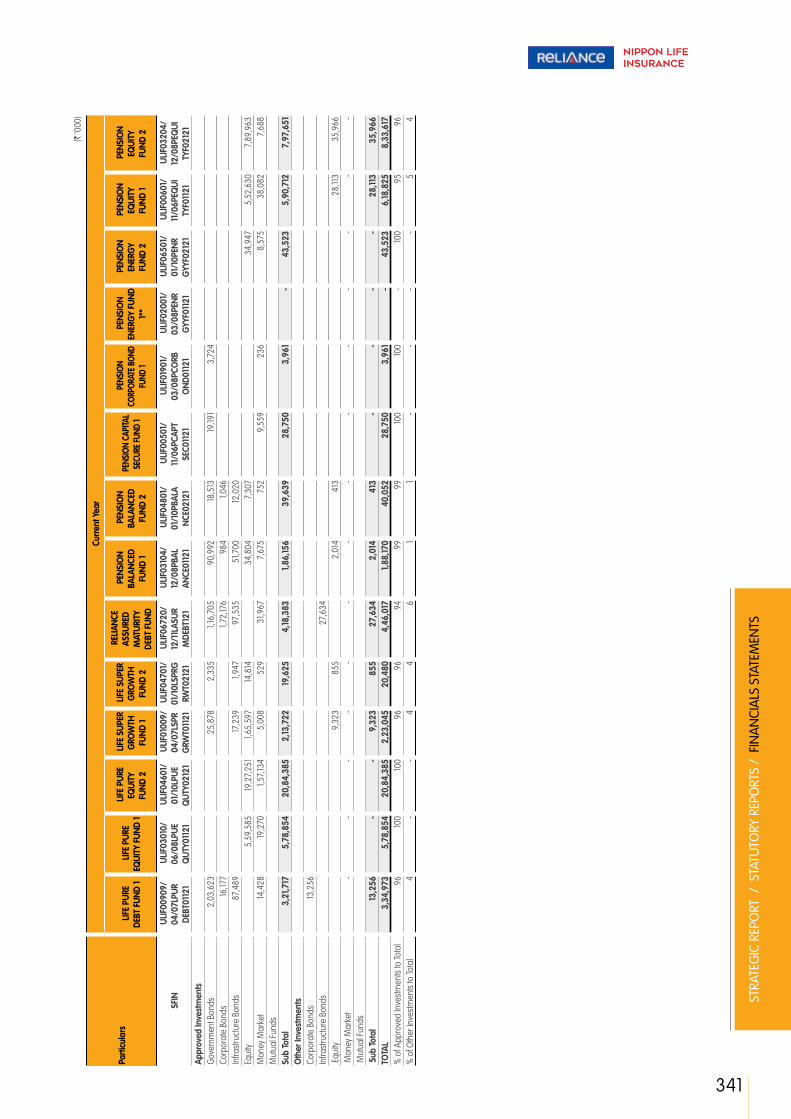
341
STRA
TEG
IC R
EPO
RT /
STA
TUTO
RY R
EPO
RTS
/ F
INA
NCI
ALS
STA
TEM
ENTS
(` ‘0
00)
Parti
cula
rs
Cur
rent
Yea
r
LIFE
PUR
E DE
BT F
UND
1 L
IFE P
URE
EQUI
TY F
UND
1
LIFE
PUR
E EQ
UITY
FU
ND 2
LIFE
SUP
ER
GRO
WTH
FU
ND 1
LIFE
SUP
ER
GRO
WTH
FU
ND 2
REL
IANC
E AS
SURE
D M
ATUR
ITY
DEBT
FUN
D
PEN
SIO
N BA
LANC
ED
FUND
1
PEN
SIO
N BA
LANC
ED
FUND
2
PEN
SION
CAPI
TAL
SECU
RE FU
ND 1
PEN
SION
CORP
ORAT
E BON
D FU
ND 1
PEN
SIO
N EN
ERG
Y FU
ND
1**
PEN
SIO
N EN
ERG
Y FU
ND 2
PEN
SIO
N EQ
UITY
FU
ND 1
PEN
SIO
N EQ
UITY
FU
ND 2
SFIN
ULIF
0090
9/
04/0
7LPU
R DE
BT01
121
ULIF
0301
0/
06/0
8LPU
E Q
UTY0
1121
ULIF
0460
1/
01/1
0LPU
E Q
UTY0
2121
ULIF
0100
9/
04/0
7LSP
R G
RWT0
1121
ULIF
0470
1/
01/1
0LSP
RG
RWT0
2121
ULIF
0672
0/
12/1
1LAS
UR
MDE
BT12
1
ULIF
0310
4/
12/0
8PBA
L AN
CE01
121
ULIF
0480
1/
01/1
0PBA
LA
NCE0
2121
ULIF
0050
1/
11/0
6PCA
PT
SEC0
1121
ULIF
0190
1/
03/0
8PCO
RB
OND
0112
1
ULIF
0200
1/
03/0
8PEN
R G
YYF0
1121
ULIF
0650
1/
01/1
0PEN
R G
YYF0
2121
ULIF
0060
1/
11/0
6PEQ
UI
TYF0
1121
ULIF
0320
4/
12/0
8PEQ
UI
TYF0
2121
Ap
prov
ed In
vest
men
tsGo
vern
men
t Bon
ds 2
,03,
623
25,
878
2,3
35
1,16
,705
9
0,99
2 18
,513
19
,191
3,7
24
Corp
orat
e Bo
nds
16,17
7 1,
72,17
6 9
84
1,04
6 In
frast
ruct
ure
Bond
s 8
7,48
9 17
,239
1,
947
97,
535
51,7
00
12,0
20
Equi
ty 5
,59,
585
19,2
7,25
1 1,
65,5
97
14,8
14
34,
804
7,3
07
34,
947
5,5
2,63
0 7
,89,
963
Mon
ey M
arke
t 14
,428
19
,270
1,
57,13
4 5
,008
5
29
31,9
67
7,6
75
752
9
,559
2
36
8,5
75
38,
082
7,6
88
Mut
ual F
unds
Sub
Tota
l 3
,21,7
17
5,7
8,85
4 2
0,84
,385
2
,13,7
22
19,6
25
4,18
,383
1,
86,15
6 3
9,63
9 2
8,75
0 3
,961
-
43,
523
5,9
0,71
2 7
,97,
651
Oth
er In
vest
men
tsCo
rpor
ate
Bond
s 13
,256
In
frast
ruct
ure
Bond
s 2
7,63
4 E
quity
9
,323
8
55
2,0
14
413
2
8,11
3 3
5,96
6 M
oney
Mar
ket
- -
- -
- -
- -
- -
- -
- -
Mut
ual F
unds
S
ub To
tal
13,2
56
- -
9,3
23
855
2
7,63
4 2
,014
4
13
- -
- -
28,
113
35,
966
TOTA
L 3
,34,
973
5,7
8,85
4 2
0,84
,385
2
,23,
045
20,
480
4,4
6,01
7 1,
88,17
0 4
0,05
2 2
8,75
0 3
,961
-
43,
523
6,18
,825
8
,33,
617
% o
f App
rove
d In
vest
men
ts to
Tota
l 9
6 10
0 10
0 9
6 9
6 9
4 9
9 9
9 10
0 10
0 -
100
95
96
% o
f Oth
er In
vest
men
ts to
Tota
l 4
-
- 4
4
6
1
1 -
- -
- 5
4
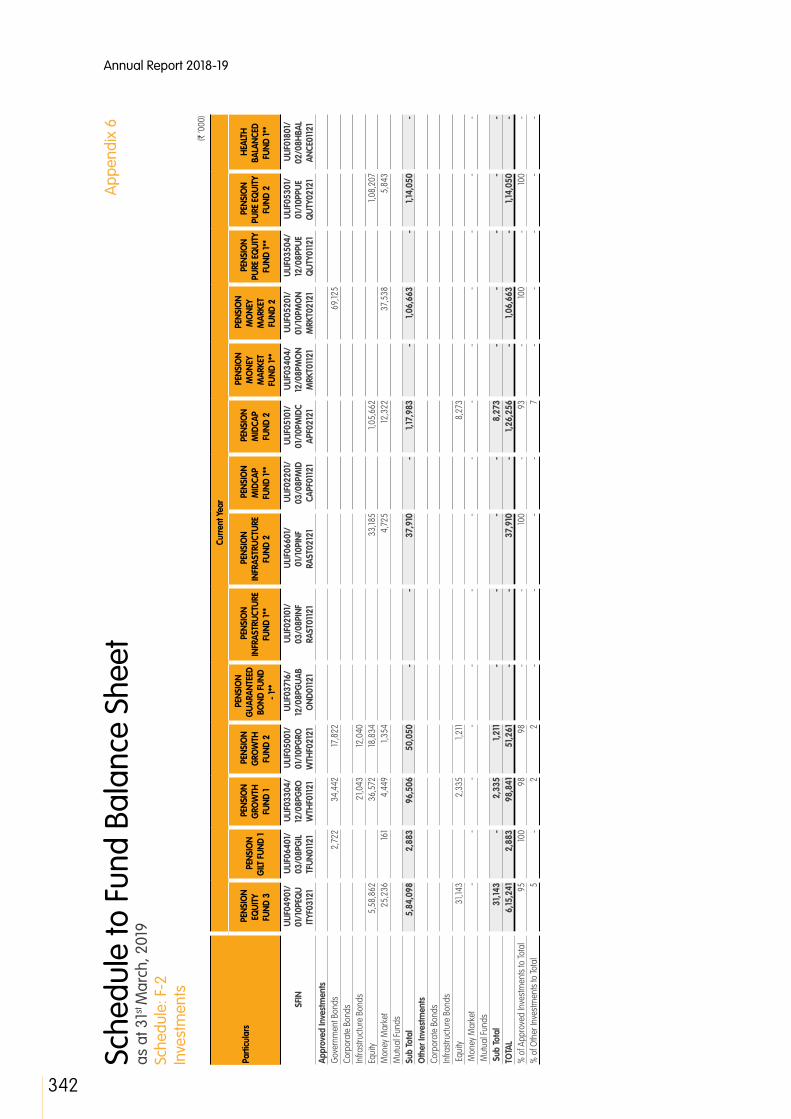
Annual Report 2018-19
342
Sche
dule
to F
und
Bala
nce
Shee
t as
at 3
1st M
arch
, 201
9 Sc
hedu
le: F
-2
Inve
stm
ents
App
endi
x 6
(` ‘0
00)
Parti
cula
rs
Cur
rent
Yea
r
PEN
SIO
N EQ
UITY
FU
ND 3
PEN
SIO
N G
ILT F
UND
1
PEN
SIO
N G
ROW
TH
FUND
1
PEN
SIO
N G
ROW
TH
FUND
2
PEN
SIO
N G
UARA
NTEE
D BO
ND F
UND
- 1**
PEN
SIO
N IN
FRAS
TRUC
TURE
FU
ND 1*
*
PEN
SIO
N IN
FRAS
TRUC
TURE
FU
ND 2
PEN
SIO
N M
IDCA
P FU
ND 1*
*
PEN
SIO
N M
IDCA
P FU
ND 2
PEN
SIO
N M
ONE
Y M
ARKE
T FU
ND 1*
*
PEN
SIO
N M
ONE
Y M
ARKE
T FU
ND 2
PEN
SIO
N PU
RE E
QUI
TY
FUND
1**
PEN
SIO
N PU
RE E
QUI
TY
FUND
2
HEA
LTH
BA
LANC
ED
FUND
1**
SFIN
ULIF
0490
1/
01/1
0PEQ
U IT
YF03
121
ULIF
0640
1/
03/0
8PG
IL TF
UN01
121
ULIF
0330
4/
12/0
8PG
RO
WTH
F011
21
ULIF
0500
1/
01/1
0PG
RO
WTH
F021
21
ULIF
0371
6/
12/0
8PG
UAB
OND
0112
1
ULIF
0210
1/
03/0
8PIN
F RA
ST01
121
ULIF
0660
1/
01/1
0PIN
F RA
ST02
121
ULIF
0220
1/
03/0
8PM
ID
CAPF
0112
1
ULIF
0510
1/
01/1
0PM
IDC
APF0
2121
ULIF
0340
4/
12/0
8PM
ON
MRK
T011
21
ULIF
0520
1/
01/1
0PM
ON
MRK
T021
21
ULIF
0350
4/
12/0
8PPU
E Q
UTY0
1121
ULIF
0530
1/
01/1
0PPU
E Q
UTY0
2121
ULIF
0180
1/
02/0
8HBA
L AN
CE01
121
Appr
oved
Inve
stm
ents
Gove
rnm
ent B
onds
2,7
22
34,
442
17,8
22
69,
125
Corp
orat
e Bo
nds
Infra
stru
ctur
e Bo
nds
21,0
43
12,0
40
Equi
ty 5
,58,
862
36,
572
18,8
34
33,
185
1,05
,662
1,
08,2
07
Mon
ey M
arke
t 2
5,23
6 16
1 4
,449
1,
354
4,7
25
12,3
22
37,
538
5,8
43
Mut
ual F
unds
Sub
Tota
l 5
,84,
098
2,8
83
96,
506
50,
050
- -
37,
910
- 1,
17,9
83
- 1,
06,6
63
- 1,
14,0
50
- O
ther
Inve
stm
ents
Corp
orat
e Bo
nds
Infra
stru
ctur
e Bo
nds
Equ
ity
31,1
43
2,3
35
1,21
1 8
,273
M
oney
Mar
ket
- -
- -
- -
- -
- -
- -
- -
Mut
ual F
unds
S
ub To
tal
31,1
43
- 2
,335
1,
211
- -
- -
8,2
73
- -
- -
- TO
TAL
6,15
,241
2
,883
9
8,84
1 5
1,261
-
- 3
7,91
0 -
1,26
,256
-
1,06
,663
-
1,14
,050
-
% o
f App
rove
d In
vest
men
ts to
Tota
l 9
5 10
0 9
8 9
8 -
- 10
0 -
93
- 10
0 -
100
- %
of O
ther
Inve
stm
ents
to To
tal
5
- 2
2
-
- -
- 7
-
- -
- -

343
STRA
TEG
IC R
EPO
RT /
STA
TUTO
RY R
EPO
RTS
/ F
INA
NCI
ALS
STA
TEM
ENTS
(` ‘0
00)
Parti
cula
rs
Cur
rent
Yea
r
HEA
LTH
CO
RPO
RATE
BO
ND
FUND
1
HEA
LTH
EN
ERG
Y FU
ND 1
HEA
LTH
EQ
UITY
FU
ND 1
HEA
LTH
EQ
UITY
FU
ND 2
HEA
LTH
GILT
FU
ND 1
HEA
LTH
GRO
WTH
PL
US F
UND
1
HEA
LTH
IN
FRAS
TRUC
TURE
FU
ND 1
HEA
LTH
M
IDCA
P FU
ND 1
HEA
LTH
M
ONE
Y M
ARKE
T FU
ND 1
HEA
LTH
PU
RE E
QUI
TY
FUND
1
HEA
LTH
SU
PER
GRO
WTH
FU
ND 1
GRO
UP
BALA
NCED
FU
ND 1
GRO
UP
BALA
NCED
FU
ND 2
GRO
UP
BALA
NCED
FU
ND 3
**
SFIN
ULIF
0630
1/
02/0
8HCO
R BO
ND01
121
ULIF
0600
1/
02/0
8HEN
ER
GYF
0112
1
ULIF
0120
1/
02/0
8HEQ
U IT
YF01
121
ULIF
0541
1/
01/1
0HEQ
U IT
YF02
121
ULIF
0130
1/
02/0
8HG
ILT
FUN0
1121
ULIF
0140
1/
02/0
8HG
RW
TPLS
0112
1
ULIF
0610
1/
02/0
8HIN
F RA
ST01
121
ULIF
0620
1/
02/0
8HM
ID
CAPF
0112
1
ULIF
0150
1/
02/0
8HM
ON
MRK
T011
21
ULIF
0160
1/
02/0
8HPU
E Q
UTY0
1121
ULIF
0170
1/
02/0
8HSP
R G
RWT0
1121
ULG
F001
10/
10/0
3GBA
L AN
CE01
121
ULG
F002
10/
10/0
3GBA
L AN
CE02
121
ULG
F017
18/
05/0
9GBA
L AN
CE03
121
Appr
oved
Inve
stm
ents
Gove
rnm
ent B
onds
9,3
02
6,10
9 7
,450
5
,373
2
,446
3
5,89
6 4
9,18
7 Co
rpor
ate
Bond
s 1,
046
Infra
stru
ctur
e Bo
nds
5,12
9 2
,015
18
,324
3
2,19
0 Eq
uity
2,4
83
1,27
,878
3
4,43
3 11
,197
2,3
94
4,19
0 2
6,92
8 15
,648
13
,093
18
,974
M
oney
Mar
ket
505
5
59
52
2,3
36
337
9
5 2
61
319
4
04
1,21
5 2
92
7,0
70
2,2
87
Mut
ual F
unds
Sub
Tota
l 9
,807
3
,043
1,
27,9
30
36,
769
6,4
46
23,
871
2,6
55
4,5
09
5,7
77
28,
143
20,
401
74,
383
1,03
,684
-
Oth
er In
vest
men
tsCo
rpor
ate
Bond
sIn
frast
ruct
ure
Bond
s E
quity
5
,769
1,
947
698
3
10
844
8
39
1,18
0 M
oney
Mar
ket
- -
- -
- -
- -
- -
- -
- -
Mut
ual F
unds
S
ub To
tal
- -
5,7
69
1,94
7 -
698
-
310
-
- 8
44
839
1,
180
- TO
TAL
9,8
07
3,0
43
1,33
,699
3
8,71
6 6
,446
2
4,56
9 2
,655
4
,819
5
,777
2
8,14
3 2
1,245
7
5,22
2 1,
04,8
64
- %
of A
ppro
ved
Inve
stm
ents
to To
tal
100
100
96
95
100
97
100
94
100
100
96
99
99
- %
of O
ther
Inve
stm
ents
to To
tal
- -
4
5
- 3
-
6
- -
4
1 1
-

Annual Report 2018-19
344
Sche
dule
to F
und
Bala
nce
Shee
t as
at 3
1st M
arch
, 201
9 Sc
hedu
le: F
-2
Inve
stm
ents
App
endi
x 6
(` ‘0
00)
Parti
cula
rs
Cur
rent
Yea
r
GRO
UP
BALA
NCED
FU
ND 4
GRO
UP
CAPI
TAL
SECU
RE
FUND
1
GRO
UP
CORP
ORA
TE
BOND
FUN
D 1*
*
GRO
UP
CORP
ORA
TE
BOND
FU
ND 2
GRO
UP
CORP
ORA
TE
BOND
FU
ND 3
GRO
UP
ENER
GY
FU
ND 1
GRO
UP
EQUI
TY F
UND
1**
GRO
UP
EQUI
TY F
UND
2**
GRO
UP
EQUI
TY
FUND
3
GRO
UP
EQUI
TY
FUND
4
GRO
UP G
ILT
FUND
1**
GRO
UP G
ILT
FUND
2
GRO
UP
GRO
WTH
FU
ND 1
GRO
UP
INFR
ASTR
UCTU
RE
FUND
1
SFIN
ULG
F021
05/
06/1
3GBA
L AN
CE04
121
ULG
F004
31/
01/0
7GCA
PI
SEC0
1121
ULG
F005
24/
10/0
7GCO
RB
OND
0112
1
ULG
F012
13/
10/0
8GCO
R BO
ND02
121
ULG
F023
05/
06/1
3GCO
RB
OND
0312
1
ULG
F014
28/
11/0
8GEN
ER
GYF
0112
1
ULG
F007
24/
10/0
7GEQ
U IT
YF01
121
ULG
F013
28/
11/0
8GEQ
U IT
YF02
121
ULG
F018
08/
06/0
9GEQ
U IT
YF03
121
ULG
F022
05/
06/1
3GEQ
U IT
YF04
121
ULG
F008
24/
10/0
7GG
ILT
FUN0
1121
ULG
F016
10/
12/0
8GG
IL TF
UN02
121
ULG
F003
10/
10/0
3GG
RO
WTH
F011
21
ULG
F019
08/
06/0
9GIN
FR
ASF0
1121
Ap
prov
ed In
vest
men
tsGo
vern
men
t Bon
ds 10
,14,3
96
356
3
,51,3
89
11,5
2,81
2 4
,171
5,6
48
Corp
orat
e Bo
nds
83,
656
46,
886
29,
531
Infra
stru
ctur
e Bo
nds
5,3
1,013
1,
59,4
30
5,9
2,02
7 Eq
uity
4,14
,777
8
42
1,99
,725
3
,01,8
01
3,6
23
1,93
8 M
oney
Mar
ket
43,
714
22
23,
168
75,
024
193
14,9
71
24,
320
264
3
82
367
M
utua
l Fun
dsSu
b To
tal
20,
87,5
56
377
-
5,8
0,87
3 18
,49,
395
1,03
5 -
- 2
,14,6
96
3,2
6,12
2 -
4,4
35
9,6
53
2,3
05
Oth
er In
vest
men
tsCo
rpor
ate
Bond
s 4
6,90
7 5
2,00
5 In
frast
ruct
ure
Bond
s E
quity
3
5,81
5 11
,809
17
,949
2
32
Mon
ey M
arke
t -
- -
- -
- -
- -
- -
- -
- M
utua
l Fun
ds
Sub
Tota
l 8
2,72
2 -
- -
52,
005
- -
- 11
,809
17
,949
-
- 2
32
- TO
TAL
21,7
0,27
8 3
77
- 5
,80,
873
19,0
1,400
1,
035
- -
2,2
6,50
5 3
,44,
071
- 4
,435
9
,885
2
,305
%
of A
ppro
ved
Inve
stm
ents
to To
tal
96
100
- 10
0 9
7 10
0 -
- 9
5 9
5 -
100
98
100
% o
f Oth
er In
vest
men
ts to
Tota
l 4
-
- -
3
- -
- 5
5
-
- 2
-

345
STRA
TEG
IC R
EPO
RT /
STA
TUTO
RY R
EPO
RTS
/ F
INA
NCI
ALS
STA
TEM
ENTS
(` ‘0
00)
Parti
cula
rs
Cur
rent
Yea
r
GRO
UP M
IDCA
P FU
ND 1
GRO
UP M
ONE
Y M
ARKE
T FU
ND
1**
GRO
UP M
ONE
Y M
ARKE
T FU
ND 2
G
ROUP
PUR
E DE
BT F
UND
1**
GRO
UP P
URE
DEBT
FU
ND 2
**
GRO
UP P
URE
EQUI
TY
FUND
1
PEN
SIO
N DI
SCO
NTIN
UED
POLIC
Y FU
ND
PEN
SIO
N SM
ART
FUND
1 M
AKE
IN IN
DIA
FUND
T
OTA
L
SFIN
ULG
F020
08/
06/0
9GM
ID
CAPF
0112
1
ULG
F006
24/
10/0
7GM
ON
MRK
T011
21
ULG
F009
30/
09/0
8GM
ON
MRK
T021
21
ULG
F010
30/
09/0
8GPU
R ED
EB01
121
ULG
F011
30/
09/0
8GPU
R DE
BT02
121
ULG
F015
28/
11/0
8GPU
RE E
QF0
1121
U
LIF07
029/
08
/13P
DIS
POLF
0112
1 U
LIF06
810/
09
/12P
SMAR
TF
U011
21
ULIF
0692
4/
03/1
5LM
AK
EIND
IA12
1
-
Appr
oved
Inve
stm
ents
Gove
rnm
ent B
onds
1,99
,755
6
,87,
877
4,0
8,17
5 1,
46,9
2,13
4 Co
rpor
ate
Bond
s 1,
05,2
48
18,5
8,42
0 In
frast
ruct
ure
Bond
s 1,
52,18
5 3
3,69
,867
Eq
uity
2,14
8 4
,202
2
7,60
,609
3
,41,5
8,92
6 M
oney
Mar
ket
425
2
4,30
5 2
14
1,26
,937
2
2,40
0 3
,20,
421
47,
24,6
26
Mut
ual F
unds
7,2
81
7,2
81
Sub
Tota
l 2
,573
-
2,2
4,06
0 -
- 4
,416
8
,14,8
14
6,8
8,00
7 3
0,88
,311
5
,88,
11,2
54
Oth
er In
vest
men
tsCo
rpor
ate
Bond
s 1,
020
2,5
4,92
9 In
frast
ruct
ure
Bond
s 4
,251
3
1,885
E
quity
15
8 1,
40,4
03
17,3
4,79
8 M
oney
Mar
ket
- -
- -
- -
- -
- -
Mut
ual F
unds
7
1,345
S
ub To
tal
158
- -
- -
- -
5,2
71
1,40
,403
2
0,92
,957
TO
TAL
2,7
31
- 2
,24,
060
- -
4,4
16
8,14
,814
6
,93,
278
32,
28,7
14
6,0
9,04
,211
%
of A
ppro
ved
Inve
stm
ents
to To
tal
94
- 10
0 -
- 10
0 10
0 9
9 9
6 9
7 %
of O
ther
Inve
stm
ents
to To
tal
6
- -
- -
- -
1 4
3

Annual Report 2018-19
346
Sche
dule
to F
und
Bala
nce
Shee
t as
at 3
1st M
arch
, 201
9 Sc
hedu
le: F
-2
Inve
stm
ents
App
endi
x 6
(` ‘0
00)
Parti
cula
rs
Prev
ious
Yea
r
DIS
CONT
INUE
D PO
LICY
FUND
LIFE
BA
LANC
ED
FUND
1
LIFE
CA
PITA
L SE
CURE
FU
ND 1
LIFE
CO
RPO
RATE
BO
ND
FUND
1
LIFE
CO
RPO
RATE
BO
ND F
UND
2
LIFE
ENE
RGY
FUND
1 L
IFE E
NERG
Y FU
ND 2
L
IFE E
QUI
TY
FUND
1 L
IFE E
QUI
TY
FUND
2
LIFE
EQ
UITY
FU
ND 3
L
IFE G
ILT
FUND
1 L
IFE G
ILT
FUND
2
LIFE
G
ROW
TH
FUND
1
LIFE
GRO
WTH
FU
ND 2
SFIN
ULIF
0570
3/
09/1
0DIS
C PO
LF01
121
ULIF
0012
8/
07/0
4LBA
L AN
CE01
121
ULIF
0022
8/
07/0
4LCA
P TS
EC01
121
ULIF
0231
0/
06/0
8LCO
RB
OND
0112
1
ULIF
0402
0/
08/0
9LCO
RB
OND
0212
1
ULIF
0241
0/
06/0
8LEN
E RG
YF01
121
ULIF
0410
1/
01/1
0LEN
ER
GYF
0212
1
ULIF
0032
8/
07/0
4LEQ
U IT
YF01
121
ULIF
0251
0/
06/0
8LEQ
U IT
YF02
121
ULIF
0420
1/
01/1
0LEQ
U IT
YF03
121
ULIF
0261
0/
06/0
8LG
ILT
FUN0
1121
ULIF
0381
9/
03/0
9LG
IL TF
UN02
121
ULIF
0042
8/
07/0
4LG
RO
WTH
F011
21
ULIF
0110
2/
11/0
7LG
ROW
TH
F021
21
Appr
oved
Inve
stm
ents
Gove
rnm
ent B
onds
28,
86,3
16
2,9
9,78
2 -
12,0
1,888
16
,346
-
- -
- -
5,6
5,22
6 16
,880
4
2,96
4 5
7,47
5 Co
rpor
ate
Bond
s -
2,14
,411
-
9,7
1,338
6
,062
-
- -
- -
- -
26,
994
43,
213
Infra
stru
ctur
e Bo
nds
- 2
,38,
954
- 8
,52,
320
7,9
54
- -
- -
- -
- 3
2,64
1 2
9,26
5 Eq
uity
- 1,
75,9
20
- -
- 3
,34,
184
86,
200
13,9
2,82
9 7
9,18
,731
1,
37,6
2,54
2 -
- 6
6,31
7 8
3,81
7 M
oney
Mar
ket
15,7
8,31
0 3
7,92
8 3
9,31
0 1,
42,7
23
1,20
0 3
,199
1,47
0 1,
609
1,21
,690
2
,83,
657
27,
831
780
6
,618
8
,617
M
utua
l Fun
ds -
- -
- -
- -
- -
- -
- -
- Su
b To
tal
44,
64,6
26
9,6
6,99
5 3
9,31
0 3
1,68,
269
31,5
62
3,3
7,38
3 8
7,67
0 13
,94,
438
80,
40,4
21
1,40
,46,
199
5,9
3,05
7 17
,660
1,
75,5
34
2,2
2,38
7 O
ther
Inve
stm
ents
Corp
orat
e Bo
nds
- -
- -
- -
- -
- -
- -
- -
Infra
stru
ctur
e Bo
nds
- -
- -
- -
- -
- -
- -
- -
Equ
ity
- 16
,512
-
- -
9,4
59
2,4
65
1,26
,555
7
,36,
199
10,3
9,79
3 -
- 4
,851
6
,708
M
oney
Mar
ket
- -
- -
- -
- -
- -
- -
- -
Mut
ual F
unds
-
- -
- -
- -
- -
- -
- -
- S
ub To
tal
- 16
,512
-
- -
9,4
59
2,4
65
1,26
,555
7
,36,
199
10,3
9,79
3 -
- 4
,851
6
,708
TO
TAL
44,
64,6
26
9,8
3,50
7 3
9,31
0 3
1,68,
269
31,5
62
3,4
6,84
2 9
0,13
5 15
,20,
993
87,
76,6
20
1,50
,85,
992
5,9
3,05
7 17
,660
1,
80,3
85
2,2
9,09
5 %
of A
ppro
ved
Inve
stm
ents
to To
tal
100
98
100
100
100
97
97
92
92
93
100
100
97
97
% o
f Oth
er In
vest
men
ts to
Tota
l -
2
- -
- 3
3
8
8
7
-
- 3
3

347
STRA
TEG
IC R
EPO
RT /
STA
TUTO
RY R
EPO
RTS
/ F
INA
NCI
ALS
STA
TEM
ENTS
(` ‘0
00)
Parti
cula
rs
Prev
ious
Yea
r
LIFE
G
ROW
TH
PLUS
FUN
D 1
LIFE
G
ROW
TH
PLUS
FUN
D 2
LIFE
G
UARA
NTEE
D BO
ND F
UND
- 1**
LIFE
HIG
H
GRO
WTH
FU
ND 1
LIFE
HIG
H
GRO
WTH
FU
ND 2
LIFE
H
IGH
EST
NAV
GUA
RANT
EE
FUND
1
LIFE
H
IGH
EST
NAV
ADVA
NTAG
E FU
ND 1
LIFE
H
IGH
EST
NAV
ADVA
NTAG
E FU
ND 2
LIFE
IN
FRAS
TRUC
TURE
FU
ND 1
LIFE
IN
FRAS
TRUC
TURE
FU
ND 2
LIFE
MID
CAP
FUND
1 L
IFE M
IDCA
P FU
ND 2
LIFE
MO
NEY
MAR
KET
FUND
1
LIFE
MO
NEY
MAR
KET
FUND
2
SFIN
ULIF
0080
9/
04/0
7LG
RW
TPLS
0112
1
ULIF
0430
1/
01/1
0LG
RW
TPLS
0212
1
ULIF
0361
6/
12/0
8LG
UAB
OND
0112
1
ULIF
0072
8/
02/0
7LH
IG
ROW
T011
21
ULIF
0551
1/
01/1
0LH
IG
ROW
T021
21
ULIF
0561
2/
02/1
0LH
NA
VGUA
0112
1
ULIF
0580
3/
09/1
0LH
NA
VADV
0112
1
ULIF
0590
1/
06/1
1LH
NA
VADV
0212
1
ULIF
0271
0/
06/0
8LIN
F RA
ST01
121
ULIF
0440
1/
01/1
0LIN
FR
AST0
2121
ULIF
0281
0/
06/0
8LM
ID
CAPF
0112
1
ULIF
0450
1/
01/1
0LM
IDC
APF0
2121
ULIF
0291
0/
06/0
8LM
ON
MRK
T011
21
ULIF
0391
9/
03/0
9LM
ON
MRK
T021
21
Appr
oved
Inve
stm
ents
Gove
rnm
ent B
onds
59,
693
3,2
82
- 9
1,408
3
,711
2
3,94
,811
-
- -
- -
- -
- Co
rpor
ate
Bond
s 4
4,46
3 -
- 6
7,54
9 1,
033
7,4
7,71
6 -
- -
- -
- -
- In
frast
ruct
ure
Bond
s 4
3,72
1 4
,050
-
87,
465
4,0
55
8,5
5,03
0 -
- -
- -
- -
- Eq
uity
1,40
,889
6
,782
-
3,4
1,536
12
,561
3
19
7,5
8,97
5 1,
55,5
18
3,0
5,66
2 1,
33,5
82
4,0
5,24
3 6
,27,
051
- -
Mon
ey M
arke
t 7
,268
2
70
- 4
,718
9
30
14,5
1,152
7
,81,9
44
52,
846
13,5
96
4,3
19
110
10,6
37
23,
09,3
22
25,
894
Mut
ual F
unds
- -
- -
- -
- -
- -
- -
- -
Sub
Tota
l 2
,96,
034
14,3
84
- 5
,92,
676
22,
290
54,
49,0
28
15,4
0,91
9 2
,08,
364
3,19
,258
1,
37,9
01
4,0
5,35
3 6
,37,
688
23,
09,3
22
25,
894
Oth
er In
vest
men
tsCo
rpor
ate
Bond
s -
- -
- -
- -
- -
- -
- -
- In
frast
ruct
ure
Bond
s -
- -
- -
- -
- -
- -
- -
- E
quity
11
,753
5
68
- 2
8,16
6 1,
215
- 18
,826
3
,994
2
2,17
4 9
,972
6
4,82
2 1,
00,4
49
- -
Mon
ey M
arke
t -
- -
- -
- -
- -
- -
- -
- M
utua
l Fun
ds
- -
- -
- -
66,
893
7,12
0 -
- -
- -
- S
ub To
tal
11,7
53
568
-
28,
166
1,21
5 -
85,
719
11,11
4 2
2,17
4 9
,972
6
4,82
2 1,
00,4
49
- -
TOTA
L 3
,07,
787
14,9
52
- 6
,20,
842
23,
505
54,
49,0
28
16,2
6,63
8 2
,19,4
78
3,4
1,432
1,
47,8
73
4,7
0,17
5 7
,38,
137
23,
09,3
22
25,
894
% o
f App
rove
d In
vest
men
ts to
Tota
l 9
6 9
6 -
95
95
100
95
95
94
93
86
86
100
100
% o
f Oth
er In
vest
men
ts to
Tota
l 4
4
-
5
5
- 5
5
6
7
14
14
-
-
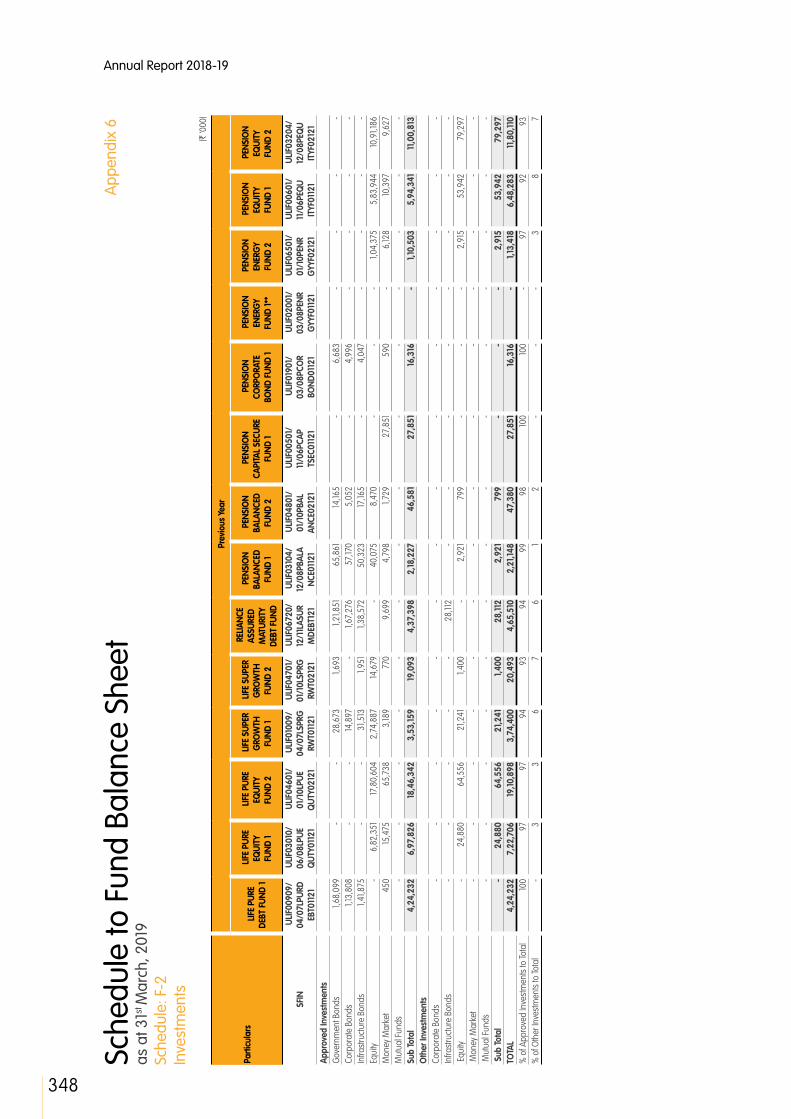
Annual Report 2018-19
348
Sche
dule
to F
und
Bala
nce
Shee
t as
at 3
1st M
arch
, 201
9 Sc
hedu
le: F
-2
Inve
stm
ents
App
endi
x 6
(` ‘0
00)
Parti
cula
rs
Prev
ious
Yea
r
LIFE
PUR
E DE
BT F
UND
1
LIFE
PUR
E EQ
UITY
FU
ND 1
LIFE
PUR
E EQ
UITY
FU
ND 2
LIFE
SUP
ER
GRO
WTH
FU
ND 1
LIFE
SUP
ER
GRO
WTH
FU
ND 2
REL
IANC
E AS
SURE
D M
ATUR
ITY
DEBT
FUN
D
PEN
SIO
N BA
LANC
ED
FUND
1
PEN
SIO
N BA
LANC
ED
FUND
2
PEN
SIO
N CA
PITA
L SE
CURE
FU
ND 1
PEN
SIO
N CO
RPO
RATE
BO
ND F
UND
1
PEN
SIO
N EN
ERG
Y FU
ND 1*
*
PEN
SIO
N EN
ERG
Y FU
ND 2
PEN
SIO
N EQ
UITY
FU
ND 1
PEN
SIO
N EQ
UITY
FU
ND 2
SFIN
ULIF
0090
9/
04/0
7LPU
RD
EBT0
1121
ULIF
0301
0/
06/0
8LPU
E Q
UTY0
1121
ULIF
0460
1/
01/1
0LPU
E Q
UTY0
2121
ULIF
0100
9/
04/0
7LSP
RG
RWT0
1121
ULIF
0470
1/
01/1
0LSP
RG
RWT0
2121
ULIF
0672
0/
12/1
1LAS
UR
MDE
BT12
1
ULIF
0310
4/
12/0
8PBA
LA
NCE0
1121
ULIF
0480
1/
01/1
0PBA
L AN
CE02
121
ULIF
0050
1/
11/0
6PCA
P TS
EC01
121
ULIF
0190
1/
03/0
8PCO
R BO
ND01
121
ULIF
0200
1/
03/0
8PEN
R G
YYF0
1121
ULIF
0650
1/
01/1
0PEN
R G
YYF0
2121
ULIF
0060
1/
11/0
6PEQ
U IT
YF01
121
ULIF
0320
4/
12/0
8PEQ
U IT
YF02
121
Appr
oved
Inve
stm
ents
Gove
rnm
ent B
onds
1,68
,099
-
- 2
8,67
3 1,
693
1,21
,851
6
5,86
1 14
,165
- 6
,683
-
- -
- Co
rpor
ate
Bond
s 1,
13,8
08
- -
14,8
97
- 1,
67,2
76
57,
170
5,0
52
- 4
,996
-
- -
- In
frast
ruct
ure
Bond
s 1,
41,8
75
- -
31,5
13
1,95
1 1,
38,5
72
50,
323
17,16
5 -
4,0
47
- -
- -
Equi
ty -
6,8
2,35
1 17
,80,
604
2,7
4,88
7 14
,679
-
40,
075
8,4
70
- -
- 1,
04,3
75
5,8
3,94
4 10
,91,1
86
Mon
ey M
arke
t 4
50
15,4
75
65,
738
3,18
9 7
70
9,6
99
4,7
98
1,72
9 2
7,85
1 5
90
- 6
,128
10,3
97
9,6
27
Mut
ual F
unds
- -
- -
- -
- -
- -
- -
- -
Sub
Tota
l 4
,24,
232
6,9
7,82
6 18
,46,
342
3,5
3,15
9 19
,093
4
,37,
398
2,18
,227
4
6,58
1 2
7,85
1 16
,316
-
1,10
,503
5
,94,
341
11,0
0,81
3 O
ther
Inve
stm
ents
Corp
orat
e Bo
nds
- -
- -
- -
- -
- -
- -
- -
Infra
stru
ctur
e Bo
nds
- -
- -
- 2
8,11
2 -
- -
- -
- -
- E
quity
-
24,
880
64,
556
21,2
41
1,40
0 -
2,9
21
799
-
- -
2,9
15
53,
942
79,
297
Mon
ey M
arke
t -
- -
- -
- -
- -
- -
- -
- M
utua
l Fun
ds
- -
- -
- -
- -
- -
- -
- -
Sub
Tota
l -
24,
880
64,
556
21,2
41
1,40
0 2
8,11
2 2
,921
7
99
- -
- 2
,915
5
3,94
2 7
9,29
7 TO
TAL
4,2
4,23
2 7
,22,
706
19,10
,898
3
,74,
400
20,
493
4,6
5,51
0 2
,21,1
48
47,
380
27,
851
16,3
16
- 1,
13,4
18
6,4
8,28
3 11
,80,
110
% o
f App
rove
d In
vest
men
ts to
Tota
l 10
0 9
7 9
7 9
4 9
3 9
4 9
9 9
8 10
0 10
0 -
97
92
93
% o
f Oth
er In
vest
men
ts to
Tota
l -
3
3
6
7
6
1 2
-
- -
3
8
7

349
STRA
TEG
IC R
EPO
RT /
STA
TUTO
RY R
EPO
RTS
/ F
INA
NCI
ALS
STA
TEM
ENTS
(` ‘0
00)
Parti
cula
rs
Prev
ious
Yea
r
PEN
SIO
N EQ
UITY
FU
ND 3
PEN
SIO
N G
ILT F
UND
1
PEN
SIO
N G
ROW
TH
FUND
1
PEN
SIO
N G
ROW
TH
FUND
2
PEN
SIO
N G
UARA
NTEE
D BO
ND F
UND
- 1**
PEN
SIO
N IN
FRAS
TRUC
TURE
FU
ND 1*
*
PEN
SIO
N IN
FRAS
TRUC
TURE
FU
ND 2
PEN
SIO
N M
IDCA
P FU
ND 1*
*
PEN
SIO
N M
IDCA
P FU
ND 2
PEN
SIO
N M
ONE
Y M
ARKE
T FU
ND 1*
*
PEN
SIO
N M
ONE
Y M
ARKE
T FU
ND 2
PEN
SIO
N PU
RE E
QUI
TY
FUND
1**
PEN
SIO
N PU
RE E
QUI
TY
FUND
2
HEA
LTH
BA
LANC
ED
FUND
1**
SFIN
ULIF
0490
1/
01/1
0PEQ
UI
TYF0
3121
ULIF
0640
1/
03/0
8PG
IL TF
UN01
121
ULIF
0330
4/
12/0
8PG
RO
WTH
F011
21
ULIF
0500
1/
01/1
0PG
RO
WTH
F021
21
ULIF
0371
6/
12/0
8PG
UAB
OND
0112
1
ULIF
0210
1/
03/0
8PIN
F RA
ST01
121
ULIF
0660
1/
01/1
0PIN
FR
AST0
2121
ULIF
0220
1/
03/0
8PM
I DC
APF0
1121
ULIF
0510
1/
01/1
0PM
ID
CAPF
0212
1
ULIF
0340
4/
12/0
8PM
ON
MRK
T011
21
ULIF
0520
1/
01/1
0PM
ON
MRK
T021
21
ULIF
0350
4/
12/0
8PPU
E Q
UTY0
1121
ULIF
0530
1/
01/1
0PPU
E Q
UTY0
2121
ULIF
0180
1/
02/0
8HBA
L AN
CE01
121
Appr
oved
Inve
stm
ents
Gove
rnm
ent B
onds
- 8
,661
2
7,41
8 12
,171
- -
- -
- -
- -
- -
Corp
orat
e Bo
nds
- -
32,
853
8,0
32
- -
- -
- -
- -
- -
Infra
stru
ctur
e Bo
nds
- -
11,14
2 10
,133
- -
- -
- -
- -
- -
Equi
ty 5
,98,
178
- 4
6,06
3 19
,211
-
- 9
1,735
-
2,0
5,05
4 -
- -
1,26
,918
-
Mon
ey M
arke
t 9
,837
9
0 4
,399
2
,139
- -
3,9
49
- 8
80
- 1,
42,8
55
- 3
,589
-
Mut
ual F
unds
- -
- -
- -
- -
- -
- -
- -
Sub
Tota
l 6
,08,
015
8,7
51
1,21
,875
5
1,686
-
- 9
5,68
4 -
2,0
5,93
4 -
1,42
,855
-
1,30
,507
-
Oth
er In
vest
men
tsCo
rpor
ate
Bond
s -
- -
- -
- -
- -
- -
- -
- In
frast
ruct
ure
Bond
s -
- -
- -
- -
- -
- -
- -
- E
quity
3
7,07
9 -
3,4
63
1,51
2 -
- 6
,627
-
32,
807
- -
- 4
,605
-
Mon
ey M
arke
t -
- -
- -
- -
- -
- -
- -
- M
utua
l Fun
ds
- -
- -
- -
- -
- -
- -
- -
Sub
Tota
l 3
7,07
9 -
3,4
63
1,51
2 -
- 6
,627
-
32,
807
- -
- 4
,605
-
TOTA
L 6
,45,
094
8,7
51
1,25
,338
5
3,19
8 -
- 1,
02,3
11
- 2
,38,
741
- 1,
42,8
55
- 1,
35,11
2 -
% o
f App
rove
d In
vest
men
ts to
Tota
l 9
4 10
0 9
7 9
7 -
- 9
4 -
86
- 10
0 -
97
- %
of O
ther
Inve
stm
ents
to To
tal
6
- 3
3
-
- 6
-
14
- -
- 3
-

Annual Report 2018-19
350
Sche
dule
to F
und
Bala
nce
Shee
t as
at 3
1st M
arch
, 201
9 Sc
hedu
le: F
-2
Inve
stm
ents
App
endi
x 6
(` ‘0
00)
Parti
cula
rs
Prev
ious
Yea
r
HEA
LTH
CO
RPO
RATE
BO
ND
FUND
1
HEA
LTH
EN
ERG
Y FU
ND 1
HEA
LTH
EQ
UITY
FU
ND 1
HEA
LTH
EQ
UITY
FU
ND 2
HEA
LTH
GILT
FU
ND 1
HEA
LTH
GRO
WTH
PL
US F
UND
1
HEA
LTH
IN
FRAS
TRUC
TURE
FU
ND 1
HEA
LTH
M
IDCA
P FU
ND 1
HEA
LTH
M
ONE
Y M
ARKE
T FU
ND 1
HEA
LTH
PU
RE E
QUI
TY
FUND
1
HEA
LTH
SU
PER
GRO
WTH
FU
ND 1
GRO
UP
BALA
NCED
FU
ND 1
GRO
UP
BALA
NCED
FU
ND 2
GRO
UP
BALA
NCED
FU
ND 3
**
SFIN
ULIF
0630
1/
02/0
8HCO
R BO
ND01
121
ULIF
0600
1/
02/0
8HEN
E RG
YF01
121
ULIF
0120
1/
02/0
8HEQ
U IT
YF01
121
ULIF
0541
1/
01/1
0HEQ
U IT
YF02
121
ULIF
0130
1/
02/0
8HG
ILT
FUN0
1121
ULIF
0140
1/
02/0
8HG
RW
TPLS
0112
1
ULIF
0610
1/
02/0
8HIN
FR
AST0
1121
ULIF
0620
1/
02/0
8HM
ID
CAPF
0112
1
ULIF
0150
1/
02/0
8HM
ON
MRK
T011
21
ULIF
0160
1/
02/0
8HPU
EQ
UTY0
1121
ULIF
0170
1/
02/0
8HSP
RG
RWT0
1121
ULG
F001
10/
10/0
3GBA
L AN
CE01
121
ULG
F002
10/
10/0
3GBA
L AN
CE02
121
ULG
F017
18/
05/0
9GBA
L AN
CE03
121
Appr
oved
Inve
stm
ents
Gove
rnm
ent B
onds
7,4
38
- -
- 10
,759
9
,116
- -
- -
2,8
84
25,
189
62,
203
- Co
rpor
ate
Bond
s 4
,078
-
- -
- 6
,030
-
- -
- 2
,011
14
,027
4
2,35
6 -
Infra
stru
ctur
e Bo
nds
3,9
59
- -
- -
10,0
89
- -
- -
3,9
72
18,0
61
35,
451
- Eq
uity
- 3
,846
2
,71,6
70
32,
634
- 2
2,17
0 3
,160
6,15
3 -
28,
448
26,
560
13,0
16
33,
239
- M
oney
Mar
ket
440
12
0 11
,956
1,
739
560
2
0 11
0 5
00
11,2
20
580
11
0 2
,829
7
,158
- M
utua
l Fun
ds -
- -
- -
- -
- -
- -
- -
- Su
b To
tal
15,9
15
3,9
66
2,8
3,62
6 3
4,37
3 11
,319
4
7,42
5 3
,270
6
,653
11
,220
2
9,02
8 3
5,53
7 7
3,12
2 1,
80,4
07
- O
ther
Inve
stm
ents
Corp
orat
e Bo
nds
- -
- -
- -
- -
- -
- -
- -
Infra
stru
ctur
e Bo
nds
- -
- -
- -
- -
- -
- -
- -
Equ
ity
- 9
5 16
,718
2
,442
-
1,51
6 2
28
972
-
1,03
6 2
,218
1,
227
3,19
2 -
Mon
ey M
arke
t -
- -
- -
- -
- -
- -
- -
- M
utua
l Fun
ds
- -
- -
- -
- -
- -
- -
- -
Sub
Tota
l -
95
16,7
18
2,4
42
- 1,
516
228
9
72
- 1,
036
2,2
18
1,22
7 3
,192
- TO
TAL
15,9
15
4,0
61
3,0
0,34
4 3
6,81
5 11
,319
4
8,94
1 3
,498
7
,625
11
,220
3
0,06
4 3
7,75
5 7
4,34
9 1,
83,5
99
- %
of A
ppro
ved
Inve
stm
ents
to To
tal
100
98
94
93
100
97
93
87
100
97
94
98
98
- %
of O
ther
Inve
stm
ents
to To
tal
- 2
6
7
-
3
7
13
- 3
6
2
2
-

351
STRA
TEG
IC R
EPO
RT /
STA
TUTO
RY R
EPO
RTS
/ F
INA
NCI
ALS
STA
TEM
ENTS
(` ‘0
00)
Parti
cula
rs
Prev
ious
Yea
r
GRO
UP
BALA
NCED
FU
ND 4
GRO
UP
CAPI
TAL
SECU
RE
FUND
1
GRO
UP
CORP
ORA
TE
BOND
FUN
D 1*
*
GRO
UP
CORP
ORA
TE
BOND
FU
ND 2
GRO
UP
CORP
ORA
TE
BOND
FU
ND 3
GRO
UP
ENER
GY
FUND
1
GRO
UP
EQUI
TY
FUND
1**
GRO
UP
EQUI
TY
FUND
2**
GRO
UP
EQUI
TY
FUND
3
GRO
UP
EQUI
TY
FUND
4*
GRO
UP
GILT
FUN
D 1*
*
GRO
UP
GILT
FUN
D 2
GRO
UP
GRO
WTH
FU
ND 1
GRO
UP
INFR
ASTR
UCTU
RE
FUND
1
GRO
UP
MID
CAP
FUND
1
SFIN
ULG
F021
05/
06/1
3GBA
LA
NCE0
4121
ULG
F004
31/
01/0
7GCA
P IS
EC01
121
ULG
F005
24/
10/0
7GCO
R BO
ND01
121
ULG
F012
13/
10/0
8GCO
R BO
ND02
121
ULG
F023
05/
06/1
3GCO
RB
OND
0312
1
ULG
F014
28/
11/0
8GEN
E RG
YF01
121
ULG
F007
24/
10/0
7GEQ
U IT
YF01
121
ULG
F013
28/
11/0
8GEQ
UI
TYF0
2121
ULG
F018
08/
06/0
9GEQ
U IT
YF03
121
ULG
F022
05/
06/1
3GEQ
UI
TYF0
4121
ULG
F008
24/
10/0
7GG
I LT
FUN0
1121
ULG
F016
10
/12/
08G
GILT
FU
N021
21
ULG
F003
10/
10/0
3GG
RO
WTH
F011
21
ULG
F019
08/
06/0
9GIN
FR
ASF0
1121
ULG
F020
08/
06/0
9GM
IDC
APF0
1121
Ap
prov
ed In
vest
men
tsGo
vern
men
t Bon
ds 9
,80,
493
1,86
5 -
8,4
4,09
9 12
,23,
347
- -
- -
- -
3,9
80
11,0
27
- -
Corp
orat
e Bo
nds
4,5
4,97
8 -
- 5
,64,
557
7,2
8,38
3 -
- -
- -
- -
5,0
77
- -
Infra
stru
ctur
e Bo
nds
5,4
2,78
9 -
- 5
,47,
474
6,8
5,04
6 -
- -
- -
- -
12,0
87
- -
Equi
ty 4
,87,
549
- -
- -
1,38
5 -
- 7
,44,
088
16,0
2,36
8 -
- 17
,541
2
,835
2
,522
M
oney
Mar
ket
1,18
,442
6
0 -
82,
355
1,28
,208
4
0 -
- 16
,795
4
9,08
4 -
180
1,86
9 11
0 13
0 M
utua
l Fun
ds -
- -
- -
- -
- -
- -
- -
- -
Sub
Tota
l 2
5,84
,251
1,
925
- 2
0,38
,485
2
7,64
,984
1,
425
- -
7,6
0,88
3 16
,51,4
52
- 4
,160
47,
601
2,9
45
2,6
52
Oth
er In
vest
men
tsCo
rpor
ate
Bond
s -
- -
- -
- -
- -
- -
- -
- -
Infra
stru
ctur
e Bo
nds
- -
- -
- -
- -
- -
- -
- -
- E
quity
4
5,64
7 -
- -
- 3
4 -
- 6
1,774
1,
05,4
33
- -
1,63
3 2
09
402
M
oney
Mar
ket
- -
- -
- -
- -
- -
- -
- -
- M
utua
l Fun
ds
- -
- -
- -
- -
- -
- -
- -
- S
ub To
tal
45,
647
- -
- -
34
- -
61,7
74
1,05
,433
-
- 1,
633
209
4
02
TOTA
L 2
6,29
,898
1,
925
- 2
0,38
,485
2
7,64
,984
1,
459
- -
8,2
2,65
7 17
,56,
885
- 4
,160
49,
234
3,15
4 3
,054
%
of A
ppro
ved
Inve
stm
ents
to To
tal
98
100
- 10
0 10
0 9
8 -
- 9
2 9
4 -
100
97
93
87
% o
f Oth
er In
vest
men
ts to
Tota
l 2
-
- -
- 2
-
- 8
6
-
- 3
7
13

Annual Report 2018-19
352
Sche
dule
to F
und
Bala
nce
Shee
t as
at 3
1st M
arch
, 201
9 Sc
hedu
le: F
-2
Inve
stm
ents
App
endi
x 6
(` ‘0
00)
Parti
cula
rs
Prev
ious
Yea
r
GRO
UP M
ONE
Y M
ARKE
T FU
ND 1*
* G
ROUP
MO
NEY
MAR
KET
FUND
2
GRO
UP P
URE
DEBT
FU
ND 1*
* G
ROUP
PUR
E DE
BT
FUND
2**
G
ROUP
PUR
E EQ
UITY
FUN
D 1
PEN
SIO
N DI
SCO
NTIN
UED
POLIC
Y FU
ND
PEN
SIO
N SM
ART
FUND
1 M
AKE
IN IN
DIA
FUND
T
OTA
L
SFIN
ULG
F006
24/
10/0
7GM
ON
MRK
T011
21
ULG
F009
30/
09/0
8GM
ON
MRK
T021
21
ULG
F010
30/
09/0
8GPU
R ED
EB01
121
ULG
F011
30/
09/0
8GPU
R DE
BT02
121
ULG
F015
28/
11/0
8GPU
R EE
QF0
1121
ULIF
0702
9/ 0
8/13
PDIS
PO
LF01
121
ULIF
0681
0/
09/1
2PSM
AR
TFU0
1121
ULIF
0692
4/
03/1
5LM
AK
EIND
IA12
1 Ap
prov
ed In
vest
men
tsGo
vern
men
t Bon
ds -
- -
- -
5,5
2,32
8 2
,66,
630
- 1,
20,9
6,41
5 Co
rpor
ate
Bond
s -
- -
- -
- 1,
67,8
78
- 4
5,16
,238
In
frast
ruct
ure
Bond
s -
- -
- -
- 2
,05,
357
- 4
6,26
,461
Eq
uity
- -
- -
4,4
70
- -
11,8
8,51
3 3
,68,
68,5
55
Mon
ey M
arke
t -
20,
72,2
40
- -
100
3,0
6,17
9 2
4,53
2 7
1,986
1,
01,5
1,779
M
utua
l Fun
ds -
- -
- -
- -
- -
Sub
Tota
l -
20,
72,2
40
- -
4,5
70
8,5
8,50
7 6
,64,
397
12,6
0,49
9 6
,82,
59,4
48
Oth
er In
vest
men
tsCo
rpor
ate
Bond
s -
- -
- -
- -
- -
Infra
stru
ctur
e Bo
nds
- -
- -
- -
4,3
25
- 3
2,43
7 E
quity
-
- -
- 16
1 -
- 1,
04,7
10
28,
92,17
2 M
oney
Mar
ket
- -
- -
- -
- -
- M
utua
l Fun
ds
- -
- -
- -
- -
74,
013
Sub
Tota
l -
- -
- 16
1 -
4,3
25
1,04
,710
2
9,98
,622
TO
TAL
- 2
0,72
,240
-
- 4
,731
8
,58,
507
6,6
8,72
2 13
,65,
209
7,12
,58,
070
% o
f App
rove
d In
vest
men
ts to
Tota
l -
100
- -
97
100
99
92
96
% o
f Oth
er In
vest
men
ts to
Tota
l -
- -
- 3
-
1 8
4
** S
chem
es h
ave
beco
me
dorm
ant.

353
STRA
TEG
IC R
EPO
RT /
STA
TUTO
RY R
EPO
RTS
/ F
INA
NCI
ALS
STA
TEM
ENTS
Sche
dule
to F
und
Bala
nce
Shee
t as
at 3
1st M
arch
, 201
9 Sc
hedu
le: F
-3
Curr
ent A
sset
s(`
‘000
)
Parti
cula
rs
Cur
rent
Yea
r
DIS
CONT
INUE
D PO
LICY
FUND
LIFE
BA
LANC
ED
FUND
1
LIFE
CAP
ITAL
SECU
RE
FUND
1
LIFE
CO
RPO
RATE
BO
ND F
UND
1
LIFE
CO
RPO
RATE
BO
ND
FUND
2
LIFE
ENE
RGY
FUND
1 L
IFE E
NERG
Y FU
ND 2
L
IFE E
QUI
TY
FUND
1 L
IFE E
QUI
TY
FUND
2
LIFE
EQ
UITY
FU
ND 3
L
IFE G
ILT
FUND
1 L
IFE G
ILT
FUND
2
LIFE
G
ROW
TH
FUND
1
LIFE
G
ROW
TH
FUND
2
SFIN
ULIF
0570
3/
09/1
0DIS
CP
OLF
0112
1
ULIF
0012
8/
07/0
4LBA
L AN
CE01
121
ULIF
0022
8/
07/0
4LCA
P TS
EC01
121
ULIF
0231
0/
06/0
8LCO
R BO
ND01
121
ULIF
0402
0/
08/0
9LCO
RB
OND
0212
1
ULIF
0241
0/
06/0
8LEN
E RG
YF01
121
ULIF
0410
1/
01/1
0LEN
ER
GYF
0212
1
ULIF
0032
8/
07/0
4LEQ
U IT
YF01
121
ULIF
0251
0/
06/0
8LEQ
U IT
YF02
121
ULIF
0420
1/
01/1
0LEQ
U IT
YF03
121
ULIF
0261
0/
06/0
8LG
ILT
FUN0
1121
ULIF
0381
9/
03/0
9LG
IL TF
UN02
121
ULIF
0042
8/
07/0
4LG
RO
WTH
F011
21
ULIF
0110
2/
11/0
7LG
RO
WTH
F021
21
Accr
ued
Inte
rest
018
934
049
723
482
00
00
080
9126
821
3924
34Ca
sh &
Ban
k Ba
lanc
e11
113
112
105
4311
1123
511
26
3Di
viden
d Re
ceiva
ble
021
00
013
044
00
00
07
8Re
ceiva
ble
for S
ale
of In
vest
men
ts0
3157
018
702
189
1763
420
8216
5071
384
740
00
662
736
Unit
Colle
ctio
n A/
c0
3531
031
5045
00
00
1835
730
150
0O
ther
Cur
rent
Ass
ets
(for I
nves
tmen
ts)
-9-1
05
01
10
-317
-10
00
Tota
l 2
2
5,65
3 3
7
1,591
7
18
1,99
9 5
08
8,2
27
50,
721
2,6
8,56
5 8
,101
285
2
,814
3
,181
(` ‘0
00)
Parti
cula
rs
Cur
rent
Yea
r
LIFE
GRO
WTH
PL
US F
UND
1
LIFE
G
ROW
TH
PLUS
FU
ND 2
LIFE
GU
ARAN
TEED
BO
ND FU
ND
- 1**
LIFE
HIG
H
GRO
WTH
FU
ND 1
LIFE
HIG
H
GRO
WTH
FU
ND 2
LIFE
H
IGH
EST
NAV
GUA
RANT
EE
FUND
1
LIFE
H
IGH
EST
NAV
ADVA
NTAG
E FU
ND 1
LIFE
H
IGH
EST
NAV
ADVA
NTAG
E FU
ND 2
LIFE
IN
FRAS
TRUC
TURE
FU
ND 1
LIFE
IN
FRAS
TRUC
TURE
FU
ND 2
LIFE
M
IDCA
P FU
ND 1
LIFE
M
IDCA
P FU
ND 2
LIFE
MO
NEY
MAR
KET
FUND
1
LIFE
MO
NEY
MAR
KET
FUND
2
SFIN
ULIF
0080
9/
04/0
7LG
RWT
PLS0
1121
ULIF
0430
1/
01/1
0LG
RW
TPLS
0212
1
ULIF
0361
6/
12/0
8LGU
AB
OND0
1121
ULIF
0072
8/
02/0
7LH
IGR
OW
T011
21
ULIF
0551
1/
01/1
0LH
IGR
OW
T021
21
ULIF
0561
2/
02/1
0LH
NAV
GUA
0112
1
ULIF
0580
3/
09/1
0LH
NA
VADV
0112
1
ULIF
0590
1/
06/1
1LH
NA
VADV
0212
1
ULIF
0271
0/
06/0
8LIN
F RA
ST01
121
ULIF
0440
1/
01/1
0LIN
F RA
ST02
121
ULIF
0281
0/
06/0
8LM
IDC
APF0
1121
ULIF
0450
1/
01/1
0LM
IDC
APF0
2121
ULIF
0291
0/
06/0
8LM
ON
MRK
T011
21
ULIF
0391
9/
03/0
9LM
ON
MRK
T021
21
Accr
ued
Inte
rest
1456
119
041
4430
075
606
00
00
00
00
Cash
& B
ank
Bala
nce
42
04
111
115
1111
1111
112
Divid
end
Rece
ivabl
e9
10
271
019
529
9140
00
00
Rece
ivabl
e fo
r Sal
e of
Inve
stm
ents
736
820
4782
140
075
330
708
251
1323
224
183
482
0Un
it Co
llect
ion
A/c
00
00
035
575
00
00
00
5375
27O
ther
Cur
rent
Ass
ets
(for I
nves
tmen
ts)
00
00
0-2
-50
10
00
40
Tota
l 2
,205
2
04
- 8
,957
4
42
1,11
,190
7,7
34
34
811
3
02
13,2
43
24,
194
5,8
72
29

Annual Report 2018-19
354
Sche
dule
to F
und
Bala
nce
Shee
t as
at 3
1st M
arch
, 201
9 Sc
hedu
le: F
-3
Inve
stm
ents
(` ‘0
00)
Parti
cula
rs
Cur
rent
Yea
r
LIFE
PUR
E DE
BT
FUND
1
LIFE
PUR
E EQ
UITY
FU
ND 1
LIFE
PUR
E EQ
UITY
FU
ND 2
LIFE
SUP
ER
GRO
WTH
FU
ND 1
LIFE
SUP
ER
GRO
WTH
FU
ND 2
REL
IANC
E AS
SURE
D M
ATUR
ITY
DEBT
FUN
D
PEN
SIO
N BA
LANC
ED
FUND
1
PEN
SIO
N BA
LANC
ED
FUND
2
PEN
SIO
N CA
PITA
L SE
CURE
FU
ND 1
PEN
SIO
N CO
RPO
RATE
BO
ND
FUND
1
PEN
SIO
N EN
ERG
Y FU
ND 1*
*
PEN
SIO
N EN
ERG
Y FU
ND 2
PEN
SIO
N EQ
UITY
FU
ND 1
PEN
SIO
N EQ
UITY
FU
ND 2
SFIN
ULIF
0090
9/
04/0
7LPU
RD
EBT0
1121
ULIF
0301
0/
06/0
8LPU
E Q
UTY0
1121
ULIF
0460
1/
01/1
0LPU
E Q
UTY0
2121
ULIF
0100
9/
04/0
7LSP
R G
RWT0
1121
ULIF
0470
1/
01/1
0LSP
RG
RWT0
2121
ULIF
0672
0/
12/1
1LAS
UR
MDE
BT12
1
ULIF
0310
4/
12/0
8PBA
LA
NCE0
1121
ULIF
0480
1/
01/1
0PBA
LA
NCE0
2121
ULIF
0050
1/
11/0
6PCA
PT
SEC0
1121
ULIF
0190
1/
03/0
8PCO
RB
OND
0112
1
ULIF
0200
1/
03/0
8PEN
R G
YYF0
1121
ULIF
0650
1/
01/1
0PEN
R G
YYF0
2121
ULIF
0060
1/
11/0
6PEQ
U IT
YF01
121
ULIF
0320
4/
12/0
8PEQ
UI
TYF0
2121
Ac
crue
d In
tere
st65
640
010
1511
022
143
2897
844
073
00
00
Cash
& B
ank
Bala
nce
1233
096
65
111
72
21
026
117
Divid
end
Rece
ivabl
e0
264
876
202
04
10
00
260
0Re
ceiva
ble
for S
ale
of In
vest
men
ts13
2628
3175
4826
9782
094
419
80
210
344
2783
2433
1Un
it Co
llect
ion
A/c
00
2806
30
390
00
00
00
00
Oth
er C
urre
nt A
sset
s (fo
r Inv
estm
ents
)0
0-2
00
10
00
00
00
1To
tal
7,9
02
3,4
25
37,
451
3,7
37
234
2
2,15
5 3
,852
1,
045
2
95
- 3
96
2,7
94
24,
339
(` ‘0
00)
Parti
cula
rs
Cur
rent
Yea
r
PEN
SIO
N EQ
UITY
FUN
D 3
PEN
SIO
N G
ILT F
UND
1
PEN
SIO
N G
ROW
TH
FUND
1
PEN
SIO
N G
ROW
TH
FUND
2
PEN
SIO
N G
UARA
NTEE
D BO
ND F
UND
- 1**
PEN
SION
INFR
ASTR
UCTU
RE
FUND
1**
PEN
SION
INFR
ASTR
UCTU
RE
FUND
2
PEN
SIO
N M
IDCA
P FU
ND 1*
*
PEN
SIO
N M
IDCA
P FU
ND 2
PEN
SIO
N M
ONE
Y M
ARKE
T FU
ND 1*
*
PEN
SIO
N M
ONE
Y M
ARKE
T FU
ND 2
PEN
SIO
N PU
RE E
QUI
TY
FUND
1**
PEN
SIO
N PU
RE E
QUI
TY
FUND
2
HEA
LTH
BA
LANC
ED
FUND
1**
SFIN
ULIF
0490
1/
01/1
0PEQ
UI
TYF0
3121
ULIF
0640
1/
03/0
8PG
ILT
FUN0
1121
ULIF
0330
4/
12/0
8PG
RO
WTH
F011
21
ULIF
0500
1/
01/1
0PG
RO
WTH
F021
21
ULIF
0371
6/
12/0
8PG
UA
BOND
0112
1
ULIF
0210
1/
03/0
8PIN
F RA
ST01
121
ULIF
0660
1/
01/1
0PIN
F RA
ST02
121
ULIF
0220
1/
03/0
8PM
ID
CAPF
0112
1
ULIF
0510
1/
01/1
0PM
IDC
APF0
2121
ULIF
0340
4/
12/0
8PM
ON
MRK
T011
21
ULIF
0520
1/
01/1
0PM
ONM
RK
T021
21
ULIF
0350
4/
12/0
8PPU
E Q
UTY0
1121
ULIF
0530
1/
01/1
0PPU
E Q
UTY0
2121
ULIF
0180
1/
02/0
8HBA
L AN
CE01
121
Accr
ued
Inte
rest
049
1140
738
00
00
00
00
00
Cash
& B
ank
Bala
nce
111
42
00
50
100
40
720
Divid
end
Rece
ivabl
e0
04
20
015
00
00
051
0Re
ceiva
ble
for S
ale
of In
vest
men
ts44
750
401
208
00
800
5759
00
051
20
Unit
Colle
ctio
n A/
c0
00
00
00
013
410
00
00
Oth
er C
urre
nt A
sset
s (fo
r Inv
estm
ents
)1
00
00
00
00
00
00
0To
tal
4,4
87
50
1,54
9 9
50
- -
100
- 7
,110
- 4
-
635
-
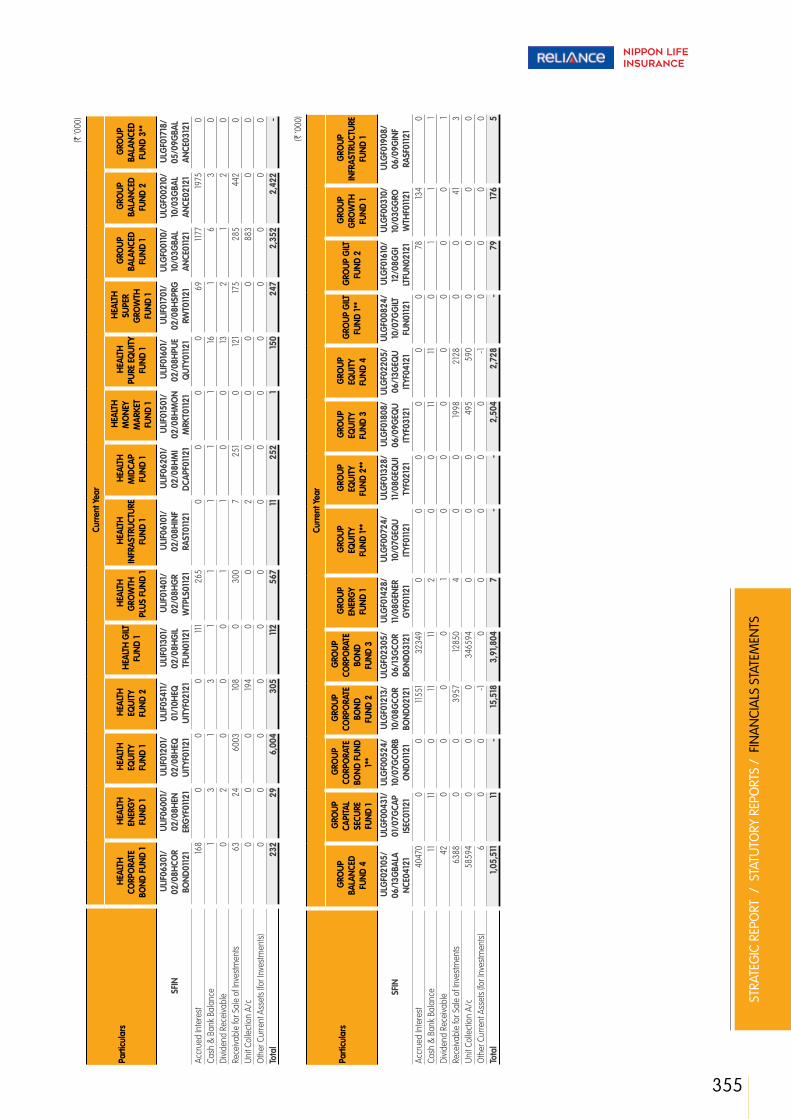
355
STRA
TEG
IC R
EPO
RT /
STA
TUTO
RY R
EPO
RTS
/ F
INA
NCI
ALS
STA
TEM
ENTS
(` ‘0
00)
Parti
cula
rs
Cur
rent
Yea
r
HEA
LTH
CO
RPO
RATE
BO
ND F
UND
1
HEA
LTH
EN
ERG
Y FU
ND 1
HEA
LTH
EQ
UITY
FU
ND 1
HEA
LTH
EQ
UITY
FU
ND 2
HEA
LTH
GILT
FU
ND 1
HEA
LTH
G
ROW
TH
PLUS
FUN
D 1
HEA
LTH
IN
FRAS
TRUC
TURE
FU
ND 1
HEA
LTH
M
IDCA
P FU
ND 1
HEA
LTH
M
ONE
Y M
ARKE
T FU
ND 1
HEA
LTH
PU
RE E
QUI
TY
FUND
1
HEA
LTH
SU
PER
GRO
WTH
FU
ND 1
GRO
UP
BALA
NCED
FU
ND 1
GRO
UP
BALA
NCED
FU
ND 2
GRO
UP
BALA
NCED
FU
ND 3
**
SFIN
ULIF
0630
1/
02/0
8HCO
R BO
ND01
121
ULIF
0600
1/
02/0
8HEN
ER
GYF
0112
1
ULIF
0120
1/
02/0
8HEQ
UI
TYF0
1121
ULIF
0541
1/
01/1
0HEQ
UI
TYF0
2121
ULIF
0130
1/
02/0
8HG
IL TF
UN01
121
ULIF
0140
1/
02/0
8HG
R W
TPLS
0112
1
ULIF
0610
1/
02/0
8HIN
F RA
ST01
121
ULIF
0620
1/
02/0
8HM
I DC
APF0
1121
ULIF
0150
1/
02/0
8HM
ON
MRK
T011
21
ULIF
0160
1/
02/0
8HPU
E Q
UTY0
1121
ULIF
0170
1/
02/0
8HSP
RG
RWT0
1121
ULG
F001
10/
10/0
3GBA
L AN
CE01
121
ULG
F002
10/
10/0
3GBA
L AN
CE02
121
ULG
F017
18/
05/0
9GBA
L AN
CE03
121
Accr
ued
Inte
rest
168
00
011
126
50
00
069
1177
1975
0Ca
sh &
Ban
k Ba
lanc
e1
31
31
11
11
161
63
0Di
viden
d Re
ceiva
ble
02
00
01
10
013
21
20
Rece
ivabl
e fo
r Sal
e of
Inve
stm
ents
6324
6003
108
030
07
251
012
117
528
544
20
Unit
Colle
ctio
n A/
c0
00
194
00
20
00
088
30
0O
ther
Cur
rent
Ass
ets
(for I
nves
tmen
ts)
00
00
00
00
00
00
00
Tota
l 2
32
29
6,0
04
305
11
2 5
67
11
252
1
150
247
2
,352
2
,422
-
(` ‘0
00)
Parti
cula
rs
Cur
rent
Yea
r
GRO
UP
BALA
NCED
FU
ND 4
GRO
UP
CAPI
TAL
SECU
RE
FUND
1
GRO
UP
CORP
ORA
TE
BOND
FUN
D 1*
*
GRO
UP
CORP
ORA
TE
BOND
FU
ND 2
GRO
UP
CORP
ORA
TE
BOND
FU
ND 3
GRO
UP
ENER
GY
FUND
1
GRO
UP
EQUI
TY
FUND
1**
GRO
UP
EQUI
TY
FUND
2**
GRO
UP
EQUI
TY
FUND
3
GRO
UP
EQUI
TY
FUND
4
GRO
UP G
ILT
FUND
1**
GRO
UP G
ILT
FUND
2
GRO
UP
GRO
WTH
FU
ND 1
GRO
UP
INFR
ASTR
UCTU
RE
FUND
1
SFIN
ULG
F021
05/
06/1
3GBA
LA
NCE0
4121
ULG
F004
31/
01/0
7GCA
P IS
EC01
121
ULG
F005
24/
10/0
7GCO
RB
OND
0112
1
ULG
F012
13/
10/0
8GCO
R BO
ND02
121
ULG
F023
05/
06/1
3GCO
R BO
ND03
121
ULG
F014
28/
11/0
8GEN
ER
GYF
0112
1
ULG
F007
24/
10/0
7GEQ
U IT
YF01
121
ULG
F013
28/
11/0
8GEQ
UI
TYF0
2121
ULG
F018
08/
06/0
9GEQ
U IT
YF03
121
ULG
F022
05/
06/1
3GEQ
U IT
YF04
121
ULG
F008
24/
10/0
7GG
ILT
FUN0
1121
ULG
F016
10/
12/0
8GG
I LT
FUN0
2121
ULG
F003
10/
10/0
3GG
RO
WTH
F011
21
ULG
F019
08/
06/0
9GIN
F RA
SF01
121
Accr
ued
Inte
rest
4047
00
011
551
3234
90
00
00
078
134
0Ca
sh &
Ban
k Ba
lanc
e11
110
1111
20
011
110
11
1Di
viden
d Re
ceiva
ble
420
00
01
00
00
00
01
Rece
ivabl
e fo
r Sal
e of
Inve
stm
ents
6388
00
3957
1285
04
00
1998
2128
00
413
Unit
Colle
ctio
n A/
c58
594
00
034
6594
00
049
559
00
00
0O
ther
Cur
rent
Ass
ets
(for I
nves
tmen
ts)
60
0-1
00
00
0-1
00
00
Tota
l 1,
05,5
11
11
- 15
,518
3
,91,8
04
7
- -
2,5
04
2,7
28
- 7
9 17
6 5

Annual Report 2018-19
356
Sche
dule
to F
und
Bala
nce
Shee
t as
at 3
1st M
arch
, 201
9 Sc
hedu
le: F
-3
Inve
stm
ents
(` ‘0
00)
Parti
cula
rs
Cur
rent
Yea
r
GRO
UP M
IDCA
P FU
ND 1
GRO
UP M
ONE
Y M
ARKE
T FU
ND 1*
* G
ROUP
MO
NEY
MAR
KET
FUND
2
GRO
UP P
URE
DEBT
FUN
D 1*
* G
ROUP
PUR
E DE
BT F
UND
2**
GRO
UP P
URE
EQUI
TY F
UND
1
PEN
SIO
N DI
SCO
NTIN
UED
POLIC
Y FU
ND
PEN
SIO
N SM
ART
FUND
1 M
AKE
IN IN
DIA
FUND
To
tal
SFIN
ULG
F020
08/
06/0
9GM
IDC
APF0
1121
ULG
F006
24/
10/0
7GM
ON
MRK
T011
21
ULG
F009
30/
09/0
8GM
ON
MRK
T021
21
ULG
F010
30/
09/0
8GPU
RE
DEB0
1121
ULG
F011
30/
09/0
8GPU
R DE
BT02
121
ULG
F015
28/
11/0
8GPU
R EE
QF0
1121
ULIF
0702
9/
08/1
3PDI
SP O
LF01
121
ULIF
0681
0/
09/1
2PSM
A RT
FU01
121
ULIF
0692
4/
03/1
5LM
AK
EIND
IA12
1 Ac
crue
d In
tere
st0
00
00
00
1521
10
3,0
2,82
7 Ca
sh &
Ban
k Ba
lanc
e1
05
00
411
1125
2 2
,444
Di
viden
d Re
ceiva
ble
00
00
02
00
358
2,2
94
Rece
ivabl
e fo
r Sal
e of
Inve
stm
ents
100
00
00
00
4778
0 3
,15,9
93
Unit
Colle
ctio
n A/
c0
082
70
01
012
330
1655
61 8
,46,
805
Oth
er C
urre
nt A
sset
s (fo
r Inv
estm
ents
)0
00
00
03
-1-9
6
Tota
l 10
1 -
832
-
- 7
14
3
2,32
9 1,
66,16
2 14
,70,
369
(` ‘0
00)
Parti
cula
rs
Prev
ious
Yea
r
DIS
CONT
INUE
D PO
LICY
FUND
LIFE
BA
LANC
ED
FUND
1
LIFE
CAP
ITAL
SECU
RE
FUND
1
LIFE
CO
RPO
RATE
BO
ND
FUND
1
LIFE
CO
RPO
RATE
BO
ND
FUND
2
LIFE
ENE
RGY
FUND
1 L
IFE E
NERG
Y FU
ND 2
L
IFE E
QUI
TY
FUND
1 L
IFE E
QUI
TY
FUND
2
LIFE
EQ
UITY
FU
ND 3
L
IFE G
ILT
FUND
1 L
IFE G
ILT
FUND
2
LIFE
G
ROW
TH
FUND
1
LIFE
G
ROW
TH
FUND
2
SFIN
ULIF
0570
3/
09/1
0DIS
CP
OLF
0112
1
ULIF
0012
8/
07/0
4LBA
L AN
CE01
121
ULIF
0022
8/
07/0
4LCA
P TS
EC01
121
ULIF
0231
0/
06/0
8LCO
RB
OND
0112
1
ULIF
0402
0/
08/0
9LCO
RB
OND
0212
1
ULIF
0241
0/
06/0
8LEN
E RG
YF01
121
ULIF
0410
1/
01/1
0LEN
E RG
YF02
121
ULIF
0032
8/
07/0
4LEQ
U IT
YF01
121
ULIF
0251
0/
06/0
8LEQ
U IT
YF02
121
ULIF
0420
1/
01/1
0LEQ
U IT
YF03
121
ULIF
0261
0/
06/0
8LG
ILT
FUN0
1121
ULIF
0381
9/
03/0
9LG
ILT
FUN0
2121
ULIF
0042
8/
07/0
4LG
RO
WTH
F011
21
ULIF
0110
2/
11/0
7LG
RO
WTH
F021
21
Accr
ued
Inte
rest
019
021
080
891
587
00
00
086
1925
421
5540
01Ca
sh &
Ban
k Ba
lanc
e20
1169
914
290
712
93
937
488
9Di
viden
d Re
ceiva
ble
00
00
015
738
277
1632
1983
00
00
Rece
ivabl
e fo
r Sal
e of
Inve
stm
ents
025
028
091
274
885
1890
791
829
697
5961
151
555
1417
541
840
4153
45Un
it Co
llect
ion
A/c
074
0019
1343
431
60
00
018
1601
00
00
Oth
er C
urre
nt A
sset
s (fo
r Inv
estm
ents
)-2
-10
60
-10
-26
151
-1-1
1To
tal
18
52,
617
28
1,85
,747
1,
878
19,0
70
968
2
9,98
1 6
1,252
2
,35,
163
22,
832
675
6
,283
9
,356

357
STRA
TEG
IC R
EPO
RT /
STA
TUTO
RY R
EPO
RTS
/ F
INA
NCI
ALS
STA
TEM
ENTS
(` ‘0
00)
Parti
cula
rs
Prev
ious
Yea
r
LIFE
G
ROW
TH
PLUS
FUN
D 1
LIFE
G
ROW
TH
PLUS
FU
ND 2
LIFE
G
UARA
NTEE
D BO
ND F
UND
- 1**
LIFE
HIG
H
GRO
WTH
FU
ND 1
LIFE
HIG
H
GRO
WTH
FU
ND 2
LIFE
H
IGH
EST
NAV
GUA
RANT
EE
FUND
1
LIFE
H
IGH
EST
NAV
ADVA
NTAG
E FU
ND 1
LIFE
H
IGH
EST
NAV
ADVA
NTAG
E FU
ND 2
LIFE
IN
FRAS
TRUC
TURE
FU
ND 1
LIFE
IN
FRAS
TRUC
TURE
FU
ND 2
LIFE
M
IDCA
P FU
ND 1
LIFE
M
IDCA
P FU
ND 2
LIFE
MO
NEY
MAR
KET
FUND
1
LIFE
MO
NEY
MAR
KET
FUND
2
SFIN
ULIF
0080
9/
04/0
7LG
RW
TPLS
0112
1
ULIF
0430
1/
01/1
0LG
RW
TPLS
0212
1
ULIF
0361
6/
12/0
8LG
UA
BOND
0112
1
ULIF
0072
8/
02/0
7LH
IG
ROW
T011
21
ULIF
0551
1/
01/1
0LH
IGR
OW
T021
21
ULIF
0561
2/
02/1
0LH
NA
VGUA
0112
1
ULIF
0580
3/
09/1
0LH
NA
VADV
0112
1
ULIF
0590
1/
06/1
1LH
NAV
ADV0
2121
ULIF
0271
0/
06/0
8LIN
F RA
ST01
121
ULIF
0440
1/
01/1
0LIN
FR
AST0
2121
ULIF
0281
0/
06/0
8LM
ID
CAPF
0112
1
ULIF
0450
1/
01/1
0LM
IDC
APF0
2121
ULIF
0291
0/
06/0
8LM
ON
MRK
T011
21
ULIF
0391
9/
03/0
9LM
ON
MRK
T021
21
Accr
ued
Inte
rest
3232
111
067
7821
951
235
00
00
00
00
Cash
& B
ank
Bala
nce
588
880
44
501
06
176
1012
34
Divid
end
Rece
ivabl
e0
00
00
00
00
022
634
70
0Re
ceiva
ble
for S
ale
of In
vest
men
ts55
1637
00
8392
254
1135
710
017
449
038
6258
330
0Un
it Co
llect
ion
A/c
019
00
4852
230
00
00
022
774
0O
ther
Cur
rent
Ass
ets
(for I
nves
tmen
ts)
-21
00
04
20
-1-1
01
40
Tota
l 9
,334
5
89
- 15
,174
525
1,
70,5
34
2
6
17,4
65
5
4,0
98
6,19
3 2
2,78
1 4
(` ‘0
00)
Parti
cula
rs
Prev
ious
Yea
r
LIFE
PUR
E DE
BT F
UND
1
LIFE
PUR
E EQ
UITY
FU
ND 1
LIFE
PUR
E EQ
UITY
FU
ND 2
LIFE
SUP
ER
GRO
WTH
FU
ND 1
LIFE
SU
PER
GRO
WTH
FU
ND 2
REL
IANC
E AS
SURE
D M
ATUR
ITY
DEBT
FUN
D
PEN
SIO
N BA
LANC
ED
FUND
1
PEN
SIO
N BA
LANC
ED
FUND
2
PEN
SIO
N CA
PITA
L SE
CURE
FU
ND 1
PEN
SIO
N CO
RPO
RATE
BO
ND F
UND
1
PEN
SIO
N EN
ERG
Y FU
ND 1*
*
PEN
SIO
N EN
ERG
Y FU
ND 2
PEN
SIO
N EQ
UITY
FU
ND 1
PEN
SIO
N EQ
UITY
FU
ND 2
SFIN
ULIF
0090
9/
04/0
7LPU
RD
EBT0
1121
ULIF
0301
0/
06/0
8LPU
E Q
UTY0
1121
ULIF
0460
1/
01/1
0LPU
E Q
UTY0
2121
ULIF
0100
9/
04/0
7LSP
RG
RWT0
1121
ULIF
0470
1/
01/1
0LSP
RG
RWT0
2121
ULIF
0672
0/
12/1
1LAS
U RM
DEBT
121
ULIF
0310
4/
12/0
8PBA
L AN
CE01
121
ULIF
0480
1/
01/1
0PBA
L AN
CE02
121
ULIF
0050
1/
11/0
6PCA
P TS
EC01
121
ULIF
0190
1/
03/0
8PCO
R BO
ND01
121
ULIF
0200
1/
03/0
8PEN
R G
YYF0
1121
ULIF
0650
1/
01/1
0PEN
R G
YYF0
2121
ULIF
0060
1/
11/0
6PEQ
U IT
YF01
121
ULIF
0320
4/
12/0
8PEQ
U IT
YF02
121
Accr
ued
Inte
rest
1059
60
022
8068
2463
440
2868
60
351
00
00
Cash
& B
ank
Bala
nce
2827
2172
11
911
7125
37
60
108
10Di
viden
d Re
ceiva
ble
014
442
60
00
00
00
053
113
214
Rece
ivabl
e fo
r Sal
e of
Inve
stm
ents
1224
70
036
3511
10
5170
1141
079
60
7985
1467
1446
4Un
it Co
llect
ion
A/c
00
2429
00
190
015
352
00
00
00
Oth
er C
urre
nt A
sset
s (fo
r Inv
estm
ents
)0
-1-3
20
11
00
00
00
0To
tal
25,
670
164
24,
785
5,9
18
199
24,
644
10,3
70
17,4
32
7
1,15
3 -
8,0
48
1,58
8 14
,688
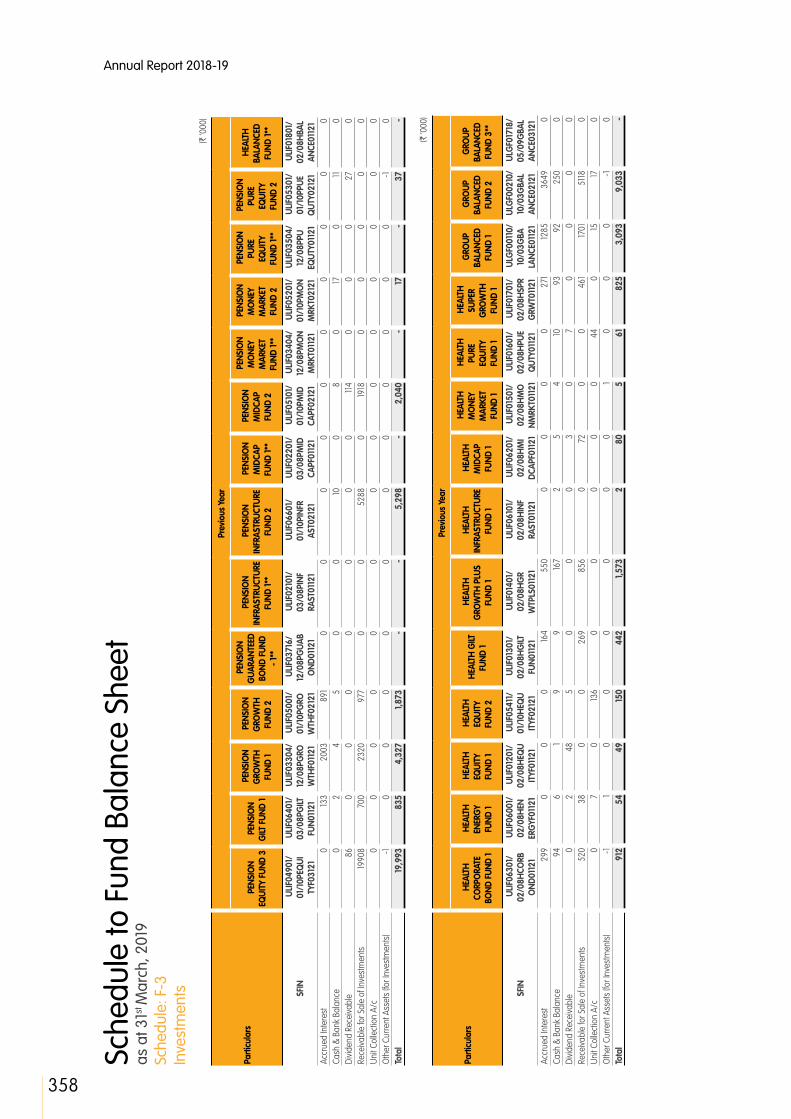
Annual Report 2018-19
358
Sche
dule
to F
und
Bala
nce
Shee
t as
at 3
1st M
arch
, 201
9 Sc
hedu
le: F
-3
Inve
stm
ents
(` ‘0
00)
Parti
cula
rs
Prev
ious
Yea
r
PEN
SIO
N EQ
UITY
FUN
D 3
PEN
SIO
N G
ILT F
UND
1
PEN
SIO
N G
ROW
TH
FUND
1
PEN
SIO
N G
ROW
TH
FUND
2
PEN
SIO
N G
UARA
NTEE
D BO
ND F
UND
- 1**
PEN
SIO
N IN
FRAS
TRUC
TURE
FU
ND 1*
*
PEN
SIO
N IN
FRAS
TRUC
TURE
FU
ND 2
PEN
SIO
N M
IDCA
P FU
ND 1*
*
PEN
SIO
N M
IDCA
P FU
ND 2
PEN
SIO
N M
ONE
Y M
ARKE
T FU
ND 1*
*
PEN
SIO
N M
ONE
Y M
ARKE
T FU
ND 2
PEN
SIO
N PU
RE
EQUI
TY
FUND
1**
PEN
SIO
N PU
RE
EQUI
TY
FUND
2
HEA
LTH
BA
LANC
ED
FUND
1**
SFIN
ULIF
0490
1/
01/1
0PEQ
UI
TYF0
3121
ULIF
0640
1/
03/0
8PG
ILT
FUN0
1121
ULIF
0330
4/
12/0
8PG
RO
WTH
F011
21
ULIF
0500
1/
01/1
0PG
RO
WTH
F021
21
ULIF
0371
6/
12/0
8PG
UAB
OND
0112
1
ULIF
0210
1/
03/0
8PIN
F RA
ST01
121
ULIF
0660
1/
01/1
0PIN
FR
AST0
2121
ULIF
0220
1/
03/0
8PM
ID
CAPF
0112
1
ULIF
0510
1/
01/1
0PM
ID
CAPF
0212
1
ULIF
0340
4/
12/0
8PM
ON
MRK
T011
21
ULIF
0520
1/
01/1
0PM
ON
MRK
T021
21
ULIF
0350
4/
12/0
8PPU
EQ
UTY0
1121
ULIF
0530
1/
01/1
0PPU
E Q
UTY0
2121
ULIF
0180
1/
02/0
8HBA
L AN
CE01
121
Accr
ued
Inte
rest
013
320
0389
10
00
00
00
00
0Ca
sh &
Ban
k Ba
lanc
e0
24
50
010
08
017
011
0Di
viden
d Re
ceiva
ble
860
00
00
00
114
00
027
0Re
ceiva
ble
for S
ale
of In
vest
men
ts19
908
700
2320
977
00
5288
019
180
00
00
Unit
Colle
ctio
n A/
c0
00
00
00
00
00
00
0O
ther
Cur
rent
Ass
ets
(for I
nves
tmen
ts)
-10
00
00
00
00
00
-10
Tota
l 19
,993
8
35
4,3
27
1,87
3 -
- 5
,298
-
2,0
40
- 17
-
37
-
(` ‘0
00)
Parti
cula
rs
Prev
ious
Yea
r
HEA
LTH
CO
RPO
RATE
BO
ND F
UND
1
HEA
LTH
EN
ERG
Y FU
ND 1
HEA
LTH
EQ
UITY
FU
ND 1
HEA
LTH
EQ
UITY
FU
ND 2
HEA
LTH
GILT
FU
ND 1
HEA
LTH
G
ROW
TH P
LUS
FUND
1
HEA
LTH
IN
FRAS
TRUC
TURE
FU
ND 1
HEA
LTH
M
IDCA
P FU
ND 1
HEA
LTH
M
ONE
Y M
ARKE
T FU
ND 1
HEA
LTH
PU
RE
EQUI
TY
FUND
1
HEA
LTH
SU
PER
GRO
WTH
FU
ND 1
GRO
UP
BALA
NCED
FU
ND 1
GRO
UP
BALA
NCED
FU
ND 2
GRO
UP
BALA
NCED
FU
ND 3
**
SFIN
ULIF
0630
1/
02/0
8HCO
RB
OND
0112
1
ULIF
0600
1/
02/0
8HEN
ER
GYF
0112
1
ULIF
0120
1/
02/0
8HEQ
U IT
YF01
121
ULIF
0541
1/
01/1
0HEQ
U IT
YF02
121
ULIF
0130
1/
02/0
8HG
ILT
FUN0
1121
ULIF
0140
1/
02/0
8HG
R W
TPLS
0112
1
ULIF
0610
1/
02/0
8HIN
F RA
ST01
121
ULIF
0620
1/
02/0
8HM
I DC
APF0
1121
ULIF
0150
1/
02/0
8HM
O
NMRK
T011
21
ULIF
0160
1/
02/0
8HPU
E Q
UTY0
1121
ULIF
0170
1/
02/0
8HSP
R G
RWT0
1121
ULG
F001
10/
10/0
3GBA
LA
NCE0
1121
ULG
F002
10/
10/0
3GBA
L AN
CE02
121
ULG
F017
18/
05/0
9GBA
L AN
CE03
121
Accr
ued
Inte
rest
299
00
016
455
00
00
027
112
8536
490
Cash
& B
ank
Bala
nce
946
19
916
72
54
1093
9225
00
Divid
end
Rece
ivabl
e0
248
50
00
30
70
00
0Re
ceiva
ble
for S
ale
of In
vest
men
ts52
038
00
269
856
072
00
461
1701
5118
0Un
it Co
llect
ion
A/c
07
013
60
00
00
440
1517
0O
ther
Cur
rent
Ass
ets
(for I
nves
tmen
ts)
-11
00
00
00
10
00
-10
Tota
l 9
12
54
49
150
442
1,
573
2
80
5
61
825
3
,093
9
,033
-
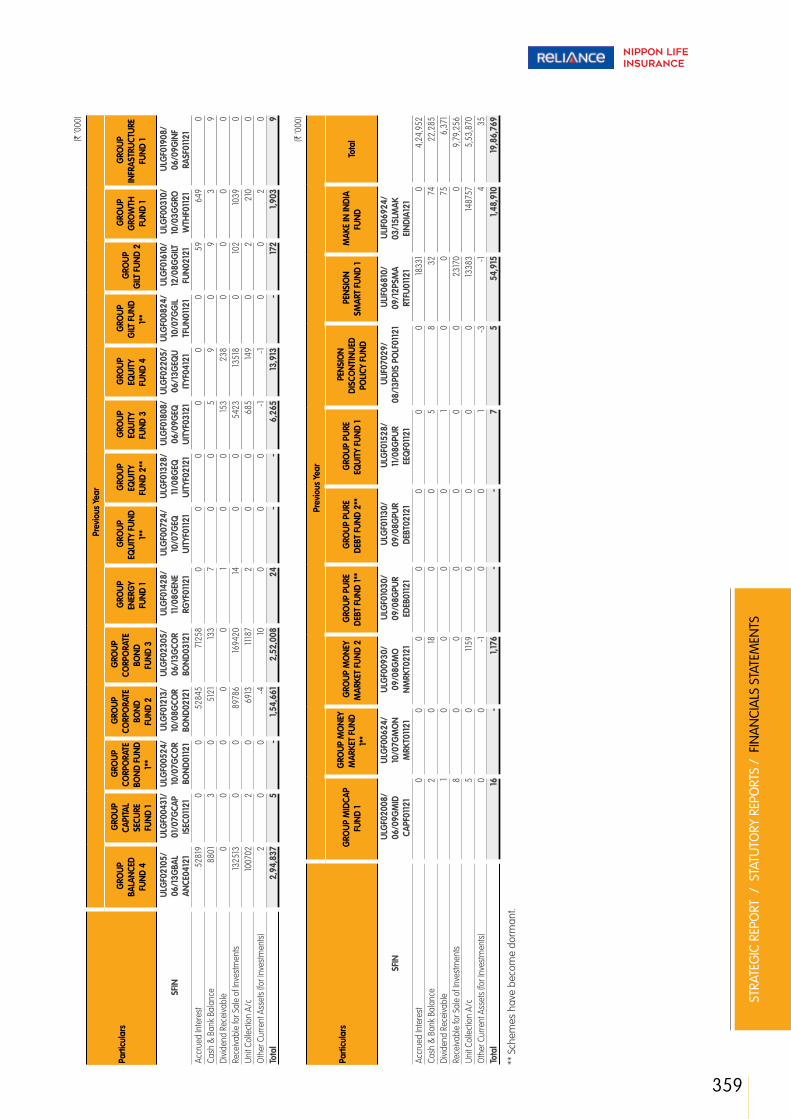
359
STRA
TEG
IC R
EPO
RT /
STA
TUTO
RY R
EPO
RTS
/ F
INA
NCI
ALS
STA
TEM
ENTS
(` ‘0
00)
Parti
cula
rs
Prev
ious
Yea
r
GRO
UP
BALA
NCED
FU
ND 4
GRO
UP
CAPI
TAL
SECU
RE
FUND
1
GRO
UP
CORP
ORA
TE
BOND
FUN
D 1*
*
GRO
UP
CORP
ORA
TE
BOND
FU
ND 2
GRO
UP
CORP
ORA
TE
BOND
FU
ND 3
GRO
UP
ENER
GY
FUND
1
GRO
UP
EQUI
TY F
UND
1**
GRO
UP
EQUI
TY
FUND
2**
GRO
UP
EQUI
TY
FUND
3
GRO
UP
EQUI
TY
FUND
4
GRO
UP
GILT
FUN
D 1*
*
GRO
UP
GILT
FUN
D 2
GRO
UP
GRO
WTH
FU
ND 1
GRO
UP
INFR
ASTR
UCTU
RE
FUND
1
SFIN
ULG
F021
05/
06/1
3GBA
L AN
CE04
121
ULG
F004
31/
01/0
7GCA
P IS
EC01
121
ULG
F005
24/
10/0
7GCO
R BO
ND01
121
ULG
F012
13/
10/0
8GCO
R BO
ND02
121
ULG
F023
05/
06/1
3GCO
R BO
ND03
121
ULG
F014
28/
11/0
8GEN
E RG
YF01
121
ULG
F007
24/
10/0
7GEQ
UI
TYF0
1121
ULG
F013
28/
11/0
8GEQ
UI
TYF0
2121
ULG
F018
08/
06/0
9GEQ
UI
TYF0
3121
ULG
F022
05/
06/1
3GEQ
U IT
YF04
121
ULG
F008
24/
10/0
7GG
IL TF
UN01
121
ULG
F016
10/
12/0
8GG
ILT
FUN0
2121
ULG
F003
10/
10/0
3GG
RO
WTH
F011
21
ULG
F019
08/
06/0
9GIN
F RA
SF01
121
Accr
ued
Inte
rest
5281
90
052
845
7125
80
00
00
059
649
0Ca
sh &
Ban
k Ba
lanc
e88
013
051
2113
37
00
59
09
39
Divid
end
Rece
ivabl
e0
00
00
10
015
323
80
00
0Re
ceiva
ble
for S
ale
of In
vest
men
ts13
2513
00
8978
616
9420
140
054
2313
518
010
210
390
Unit
Colle
ctio
n A/
c10
0702
20
6913
1118
72
00
685
149
02
210
0O
ther
Cur
rent
Ass
ets
(for I
nves
tmen
ts)
20
0-4
100
00
-1-1
00
20
Tota
l 2
,94,
837
5
- 1,
54,6
61
2,5
2,00
8 2
4 -
- 6
,265
13
,913
-
172
1,90
3 9
(` ‘0
00)
Parti
cula
rs
Prev
ious
Yea
r
GRO
UP M
IDCA
P FU
ND 1
GRO
UP M
ONE
Y M
ARKE
T FU
ND
1**
GRO
UP M
ONE
Y M
ARKE
T FU
ND 2
G
ROUP
PUR
E DE
BT F
UND
1**
GRO
UP P
URE
DEBT
FUN
D 2*
* G
ROUP
PUR
E EQ
UITY
FUN
D 1
PEN
SIO
N DI
SCO
NTIN
UED
POLIC
Y FU
ND
PEN
SIO
N SM
ART
FUND
1 M
AKE
IN IN
DIA
FUND
To
tal
SFIN
ULG
F020
08/
06/0
9GM
ID
CAPF
0112
1
ULG
F006
24/
10/0
7GM
ON
MRK
T011
21
ULG
F009
30/
09/0
8GM
O
NMRK
T021
21
ULG
F010
30/
09/0
8GPU
R ED
EB01
121
ULG
F011
30/
09/0
8GPU
R DE
BT02
121
ULG
F015
28/
11/0
8GPU
R EE
QF0
1121
ULIF
0702
9/
08/1
3PDI
S PO
LF01
121
ULIF
0681
0/
09/1
2PSM
A RT
FU01
121
ULIF
0692
4/
03/1
5LM
AK
EIND
IA12
1 Ac
crue
d In
tere
st0
00
00
00
1833
10
4,2
4,95
2 Ca
sh &
Ban
k Ba
lanc
e2
018
00
58
3274
22,
285
Divid
end
Rece
ivabl
e1
00
00
10
075
6,3
71
Rece
ivabl
e fo
r Sal
e of
Inve
stm
ents
80
00
00
023
170
0 9
,79,
256
Unit
Colle
ctio
n A/
c5
011
590
00
013
383
1487
57 5
,53,
870
Oth
er C
urre
nt A
sset
s (fo
r Inv
estm
ents
)0
0-1
00
1-3
-14
35
Tota
l 16
-
1,17
6 -
- 7
5
5
4,91
5 1,
48,9
10
19,8
6,76
9
** S
chem
es h
ave
beco
me
dorm
ant.
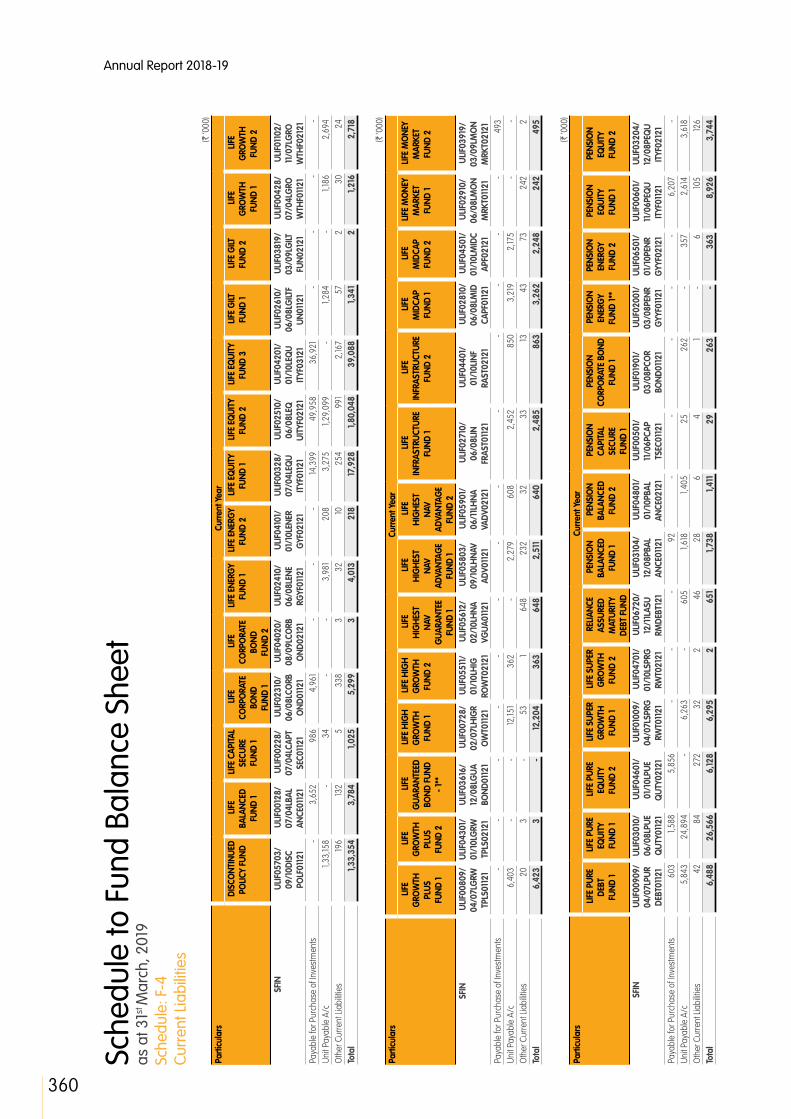
Annual Report 2018-19
360
Sche
dule
to F
und
Bala
nce
Shee
t as
at 3
1st M
arch
, 201
9 Sc
hedu
le: F
-4
Curr
ent L
iabi
litie
s(`
‘000
)Pa
rticu
lars
Cur
rent
Yea
r D
ISCO
NTIN
UED
POLIC
Y FU
ND
LIFE
BA
LANC
ED
FUND
1
LIFE
CAP
ITAL
SECU
RE
FUND
1
LIFE
CO
RPO
RATE
BO
ND
FUND
1
LIFE
CO
RPO
RATE
BO
ND
FUND
2
LIFE
ENE
RGY
FUND
1 L
IFE E
NERG
Y FU
ND 2
L
IFE E
QUI
TY
FUND
1 L
IFE E
QUI
TY
FUND
2
LIFE
EQ
UITY
FU
ND 3
L
IFE G
ILT
FUND
1 L
IFE G
ILT
FUND
2
LIFE
G
ROW
TH
FUND
1
LIFE
G
ROW
TH
FUND
2
SFIN
ULIF
0570
3/
09/1
0DIS
C PO
LF01
121
ULIF
0012
8/
07/0
4LBA
L AN
CE01
121
ULIF
0022
8/
07/0
4LCA
PT
SEC0
1121
ULIF
0231
0/
06/0
8LCO
RB
OND
0112
1
ULIF
0402
0/
08/0
9LCO
RB
OND
0212
1
ULIF
0241
0/
06/0
8LEN
E RG
YF01
121
ULIF
0410
1/
01/1
0LEN
ER
GYF
0212
1
ULIF
0032
8/
07/0
4LEQ
U IT
YF01
121
ULIF
0251
0/
06/0
8LEQ
UI
TYF0
2121
ULIF
0420
1/
01/1
0LEQ
U IT
YF03
121
ULIF
0261
0/
06/0
8LG
ILTF
UN01
121
ULIF
0381
9/
03/0
9LG
ILT
FUN0
2121
ULIF
0042
8/
07/0
4LG
RO
WTH
F011
21
ULIF
0110
2/
11/0
7LG
RO
WTH
F021
21
Paya
ble
for P
urch
ase
of In
vest
men
ts -
3,6
52
986
4
,961
-
- -
14,3
99
49,
958
36,
921
- -
- -
Unit
Paya
ble
A/c
1,33
,158
- 3
4 -
- 3
,981
2
08
3,2
75
1,29
,099
-
1,28
4 -
1,18
6 2
,694
O
ther
Cur
rent
Liab
ilitie
s 19
6 13
2 5
3
38
3
32
10
254
9
91
2,16
7 5
7 2
3
0 2
4 To
tal
1,33
,354
3
,784
1,
025
5,2
99
3
4,0
13
218
17
,928
1,
80,0
48
39,
088
1,34
1 2
1,
216
2,7
18
(` ‘0
00)
Parti
cula
rs C
urre
nt Y
ear
LIFE
G
ROW
TH
PLUS
FU
ND 1
LIFE
G
ROW
TH
PLUS
FU
ND 2
LIFE
G
UARA
NTEE
D BO
ND F
UND
- 1
**
LIFE
HIG
H
GRO
WTH
FU
ND 1
LIFE
HIG
H
GRO
WTH
FU
ND 2
LIFE
H
IGH
EST
NAV
GUA
RANT
EE
FUND
1
LIFE
H
IGH
EST
NAV
ADVA
NTAG
E FU
ND 1
LIFE
H
IGH
EST
NAV
ADVA
NTAG
E FU
ND 2
LIFE
IN
FRAS
TRUC
TURE
FU
ND 1
LIFE
IN
FRAS
TRUC
TURE
FU
ND 2
LIFE
M
IDCA
P FU
ND 1
LIFE
M
IDCA
P FU
ND 2
LIFE
MO
NEY
MAR
KET
FUND
1
LIFE
MO
NEY
MAR
KET
FUND
2
SFIN
ULIF
0080
9/
04/0
7LG
RW
TPLS
0112
1
ULIF0
4301
/ 01
/10L
GRW
TP
LS02
121
ULIF0
3616
/ 12
/08L
GUA
BO
ND01
121
ULIF
0072
8/
02/0
7LH
IGR
OW
T011
21
ULIF
0551
1/
01/1
0LH
IG
ROW
T021
21
ULIF
0561
2/
02/1
0LH
NA
VGUA
0112
1
ULIF
0580
3/
09/1
0LH
NAV
ADV0
1121
ULIF
0590
1/
06/1
1LH
NA
VADV
0212
1
ULIF
0271
0/
06/0
8LIN
FR
AST0
1121
ULIF
0440
1/
01/1
0LIN
F RA
ST02
121
ULIF
0281
0/
06/0
8LM
ID
CAPF
0112
1
ULIF
0450
1/
01/1
0LM
IDC
APF0
2121
ULIF
0291
0/
06/0
8LM
ON
MRK
T011
21
ULIF
0391
9/
03/0
9LM
ON
MRK
T021
21
Paya
ble
for P
urch
ase
of In
vest
men
ts -
- -
- -
- -
- -
- -
- -
493
Un
it Pa
yabl
e A/
c 6
,403
-
- 12
,151
362
-
2,2
79
608
2
,452
8
50
3,2
19
2,17
5 -
- O
ther
Cur
rent
Liab
ilitie
s 2
0 3
-
53
1 6
48
232
3
2 3
3 13
4
3 7
3 2
42
2
Tota
l 6
,423
3
-
12,2
04
363
6
48
2,5
11
640
2
,485
8
63
3,2
62
2,2
48
242
4
95
(` ‘0
00)
Parti
cula
rs C
urre
nt Y
ear
LIFE
PUR
E DE
BT
FUND
1
LIFE
PUR
E EQ
UITY
FU
ND 1
LIFE
PUR
E EQ
UITY
FU
ND 2
LIFE
SUP
ER
GRO
WTH
FU
ND 1
LIFE
SUP
ER
GRO
WTH
FU
ND 2
REL
IANC
E AS
SURE
D M
ATUR
ITY
DEBT
FUN
D
PEN
SIO
N BA
LANC
ED
FUND
1
PEN
SIO
N BA
LANC
ED
FUND
2
PEN
SIO
N CA
PITA
L SE
CURE
FU
ND 1
PEN
SIO
N CO
RPO
RATE
BO
ND
FUND
1
PEN
SIO
N EN
ERG
Y FU
ND 1*
*
PEN
SIO
N EN
ERG
Y FU
ND 2
PEN
SIO
N EQ
UITY
FU
ND 1
PEN
SIO
N EQ
UITY
FU
ND 2
SFIN
ULIF
0090
9/
04/0
7LPU
R DE
BT01
121
ULIF0
3010
/ 06
/08L
PUE
QUT
Y011
21
ULIF
0460
1/
01/1
0LPU
E Q
UTY0
2121
ULIF
0100
9/
04/0
7LSP
RG
RWT0
1121
ULIF
0470
1/
01/1
0LSP
RG
RWT0
2121
ULIF
0672
0/
12/1
1LAS
U RM
DEBT
121
ULIF
0310
4/
12/0
8PBA
L AN
CE01
121
ULIF
0480
1/
01/1
0PBA
L AN
CE02
121
ULIF
0050
1/
11/0
6PCA
P TS
EC01
121
ULIF
0190
1/
03/0
8PCO
R BO
ND01
121
ULIF
0200
1/
03/0
8PEN
R G
YYF0
1121
ULIF
0650
1/
01/1
0PEN
R G
YYF0
2121
ULIF
0060
1/
11/0
6PEQ
U IT
YF01
121
ULIF
0320
4/
12/0
8PEQ
U IT
YF02
121
Paya
ble
for P
urch
ase
of In
vest
men
ts 6
03
1,58
8 5
,856
-
- -
92
- -
- -
- 6
,207
-
Unit
Paya
ble
A/c
5,8
43
24,
894
- 6
,263
-
605
1,
618
1,40
5 2
5 2
62
- 3
57
2,6
14
3,6
18
Oth
er C
urre
nt Li
abilit
ies
42
84
272
3
2 2
4
6 2
8 6
4
1
- 6
10
5 12
6 To
tal
6,4
88
26,
566
6,12
8 6
,295
2
6
51
1,73
8 1,
411
29
263
-
363
8
,926
3
,744

361
STRA
TEG
IC R
EPO
RT /
STA
TUTO
RY R
EPO
RTS
/ F
INA
NCI
ALS
STA
TEM
ENTS
(` ‘0
00)
Parti
cula
rs C
urre
nt Y
ear
PEN
SIO
N EQ
UITY
FU
ND 3
PEN
SIO
N G
ILT F
UND
1 P
ENSI
ON
GRO
WTH
FU
ND 1
PEN
SIO
N G
ROW
TH
FUND
2
PEN
SIO
N G
UARA
NTEE
D BO
ND F
UND
- 1**
PEN
SIO
N IN
FRAS
TRUC
TURE
FU
ND 1*
*
PEN
SIO
N IN
FRAS
TRUC
TURE
FU
ND 2
PEN
SIO
N M
IDCA
P FU
ND 1*
*
PEN
SIO
N M
IDCA
P FU
ND 2
PEN
SIO
N M
ONE
Y M
ARKE
T FU
ND 1*
*
PEN
SIO
N M
ONE
Y M
ARKE
T FU
ND 2
PEN
SIO
N PU
RE
EQUI
TY
FUND
1**
PEN
SIO
N PU
RE
EQUI
TY
FUND
2
HEA
LTH
BA
LANC
ED
FUND
1**
SFIN
ULIF
0490
1/
01/1
0PEQ
U IT
YF03
121
ULIF
0640
1/
03/0
8PG
IL TF
UN01
121
ULIF
0330
4/
12/0
8PG
RO
WTH
F011
21
ULIF
0500
1/
01/1
0PG
RO
WTH
F021
21
ULIF
0371
6/
12/0
8PG
UA
BOND
0112
1
ULIF
0210
1/
03/0
8PIN
F RA
ST01
121
ULIF
0660
1/
01/1
0PIN
F RA
ST02
121
ULIF
0220
1/
03/0
8PM
ID
CAPF
0112
1
ULIF
0510
1/
01/1
0PM
IDC
APF0
2121
ULIF
0340
4/
12/0
8PM
ON
MRK
T011
21
ULIF
0520
1/
01/1
0PM
ON
MRK
T021
21
ULIF
0350
4/
12/0
8PPU
E Q
UTY0
1121
ULIF
0530
1/
01/1
0PPU
E Q
UTY0
2121
ULIF
0180
1/
02/0
8HBA
L AN
CE01
121
Paya
ble
for P
urch
ase
of In
vest
men
ts 1,
547
- -
- -
- -
- -
- -
- 1,
726
- Un
it Pa
yabl
e A/
c 2
,623
17
5 7
4 4
44
- -
189
- -
- 8
28
- 4
52
- O
ther
Cur
rent
Liab
ilitie
s 8
0 -
16
6
- -
5
- 16
-
13
- 15
-
Tota
l 4
,250
17
5 9
0 4
50
- -
194
- 16
-
841
-
2,19
3 -
(` ‘0
00)
Parti
cula
rs C
urre
nt Y
ear
HEA
LTH
CO
RPO
RATE
BO
ND
FUND
1
HEA
LTH
EN
ERG
Y FU
ND 1
HEA
LTH
EQ
UITY
FU
ND 1
HEA
LTH
EQ
UITY
FU
ND 2
HEA
LTH
GILT
FU
ND 1
HEA
LTH
G
ROW
TH P
LUS
FUND
1
HEA
LTH
IN
FRAS
TRUC
TURE
FU
ND 1
HEA
LTH
M
IDCA
P FU
ND 1
HEA
LTH
M
ONE
Y M
ARKE
T FU
ND 1
HEA
LTH
PU
RE
EQUI
TY
FUND
1
HEA
LTH
SU
PER
GRO
WTH
FU
ND 1
GRO
UP
BALA
NCED
FU
ND 1
GRO
UP
BALA
NCED
FU
ND 2
GRO
UP
BALA
NCED
FU
ND 3
**
SFIN
ULIF
0630
1/
02/0
8HCO
R BO
ND01
121
ULIF
0600
1/
02/0
8HEN
E RG
YF01
121
ULIF
0120
1/
02/0
8HEQ
UI
TYF0
1121
ULIF
0541
1/
01/1
0HEQ
UI
TYF0
2121
ULIF
0130
1/
02/0
8HG
ILT
FUN0
1121
ULIF
0140
1/
02/0
8HG
RW
TPLS
0112
1
ULIF
0610
1/
02/0
8HIN
F RA
ST01
121
ULIF
0620
1/
02/0
8HM
ID
CAPF
0112
1
ULIF
0150
1/
02/0
8HM
O
NMRK
T011
21
ULIF
0160
1/
02/0
8HPU
E Q
UTY0
1121
ULIF
0170
1/
02/0
8HSP
R G
RWT0
1121
ULG
F001
10/
10/0
3GBA
L AN
CE01
121
ULG
F002
10/
10/0
3GBA
L AN
CE02
121
ULG
F017
18/
05/0
9GBA
L AN
CE03
121
Paya
ble
for P
urch
ase
of In
vest
men
ts -
- -
103
- -
- -
197
- -
1,17
6 5
1 -
Unit
Paya
ble
A/c
573
12
3 4
,291
-
426
1,
293
- 11
0 2
27
193
326
-
997
-
Oth
er C
urre
nt Li
abilit
ies
- -
20
5
1 3
-
- -
5
4
10
9
- To
tal
573
12
3 4
,311
10
8 4
27
1,29
6 -
110
424
19
8 3
30
1,18
6 1,
057
-
(` ‘0
00)
Parti
cula
rs C
urre
nt Y
ear
GRO
UP
BALA
NCED
FU
ND 4
GRO
UP
CAPI
TAL
SECU
RE
FUND
1
GRO
UP
CORP
ORA
TE
BOND
FUN
D 1*
*
GRO
UP
CORP
ORA
TE
BOND
FU
ND 2
GRO
UP
CORP
ORA
TE
BOND
FUN
D 3
GRO
UP
ENER
GY
FUND
1
GRO
UP
EQUI
TY
FUND
1**
GRO
UP
EQUI
TY
FUND
2**
GRO
UP
EQUI
TY
FUND
3
GRO
UP
EQUI
TY
FUND
4
GRO
UP G
ILT
FUND
1**
GRO
UP G
ILT
FUND
2
GRO
UP
GRO
WTH
FU
ND 1
GRO
UP
INFR
ASTR
UCTU
RE
FUND
1
SFIN
ULG
F021
05/
06/1
3GBA
L AN
CE04
121
ULG
F004
31/
01/0
7GCA
PI
SEC0
1121
ULG
F005
24/
10/0
7GCO
RB
OND
0112
1
ULG
F012
13/
10/0
8GCO
R BO
ND02
121
ULG
F023
05/
06/1
3GCO
R BO
ND03
121
ULG
F014
28/
11/0
8GEN
E RG
YF01
121
ULG
F007
24/
10/0
7GEQ
U IT
YF01
121
ULG
F013
28/
11/0
8GEQ
U IT
YF02
121
ULG
F018
08/
06/0
9GEQ
U IT
YF03
121
ULG
F022
05/
06/1
3GEQ
U IT
YF04
121
ULG
F008
24/
10/0
7GG
IL TF
UN01
121
ULG
F016
10/
12/0
8GG
IL TF
UN02
121
ULG
F003
10/
10/0
3GG
RO
WTH
F011
21
ULG
F019
08/
06/0
9GIN
FR
ASF0
1121
Pa
yabl
e fo
r Pur
chas
e of
Inve
stm
ents
2,6
59
- -
6,2
29
31,4
94
- -
- 6
69
1,13
5 -
- -
- Un
it Pa
yabl
e A/
c -
- -
846
-
10
- -
- -
- 17
3 -
- O
ther
Cur
rent
Liab
ilitie
s 16
2 -
- 4
3 14
7 1
- -
16
26
- -
- -
Tota
l 2
,821
-
- 7
,118
31,6
41
11
- -
685
1,
161
- 17
3 -
-
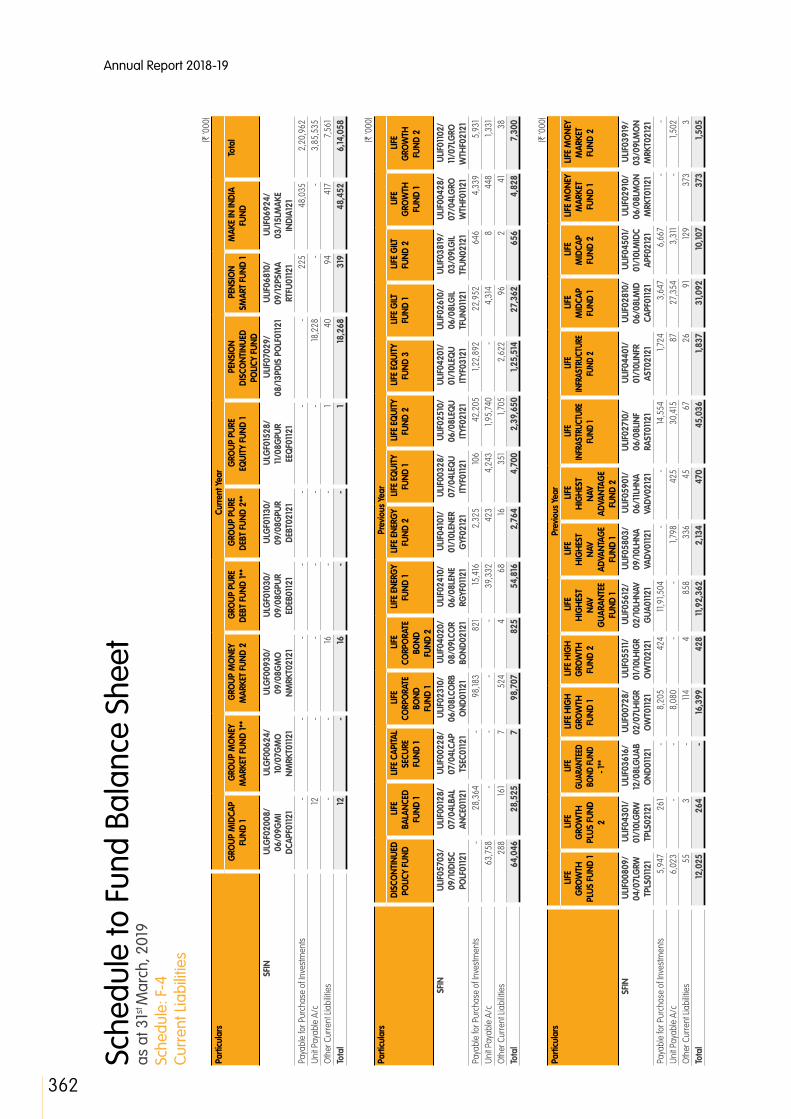
Annual Report 2018-19
362
Sche
dule
to F
und
Bala
nce
Shee
t as
at 3
1st M
arch
, 201
9 Sc
hedu
le: F
-4
Curr
ent L
iabi
litie
s(`
‘000
)Pa
rticu
lars
Cur
rent
Yea
r G
ROUP
MID
CAP
FUND
1 G
ROUP
MO
NEY
MAR
KET
FUND
1**
GRO
UP M
ONE
Y M
ARKE
T FU
ND 2
G
ROUP
PUR
E DE
BT F
UND
1**
GRO
UP P
URE
DEBT
FUN
D 2*
* G
ROUP
PUR
E EQ
UITY
FUN
D 1
PEN
SIO
N DI
SCO
NTIN
UED
POLIC
Y FU
ND
PEN
SIO
N SM
ART
FUND
1 M
AKE
IN IN
DIA
FUND
To
tal
SFIN
ULG
F020
08/
06/0
9GM
I DC
APF0
1121
ULG
F006
24/
10/0
7GM
O
NMRK
T011
21
ULG
F009
30/
09/0
8GM
O
NMRK
T021
21
ULG
F010
30/
09/0
8GPU
R ED
EB01
121
ULG
F011
30/
09/0
8GPU
R DE
BT02
121
ULG
F015
28/
11/0
8GPU
R EE
QF0
1121
ULIF
0702
9/
08/1
3PDI
S PO
LF01
121
ULIF
0681
0/
09/1
2PSM
A RT
FU01
121
ULIF
0692
4/
03/1
5LM
AKE
INDI
A121
Pa
yabl
e fo
r Pur
chas
e of
Inve
stm
ents
- -
- -
- -
- 2
25
48,
035
2,2
0,96
2 Un
it Pa
yabl
e A/
c 12
-
- -
- -
18,2
28
- -
3,8
5,53
5 O
ther
Cur
rent
Liab
ilitie
s -
- 16
-
- 1
40
94
417
7
,561
To
tal
12
- 16
-
- 1
18,2
68
319
4
8,45
2 6
,14,0
58
(` ‘0
00)
Parti
cula
rsPr
evio
us Y
ear
DIS
CONT
INUE
D PO
LICY
FUND
L
IFE
BALA
NCED
FU
ND 1
LIFE
CAP
ITAL
SECU
RE
FUND
1
LIFE
CO
RPO
RATE
BO
ND
FUND
1
LIFE
CO
RPO
RATE
BO
ND
FUND
2
LIFE
ENE
RGY
FUND
1 L
IFE E
NERG
Y FU
ND 2
L
IFE E
QUI
TY
FUND
1 L
IFE E
QUI
TY
FUND
2
LIFE
EQ
UITY
FU
ND 3
L
IFE G
ILT
FUND
1 L
IFE G
ILT
FUND
2
LIFE
G
ROW
TH
FUND
1
LIFE
G
ROW
TH
FUND
2
SFIN
ULIF
0570
3/
09/1
0DIS
C PO
LF01
121
ULIF
0012
8/
07/0
4LBA
L AN
CE01
121
ULIF
0022
8/
07/0
4LCA
P TS
EC01
121
ULIF
0231
0/
06/0
8LCO
RB
OND
0112
1
ULIF
0402
0/
08/0
9LCO
R BO
ND02
121
ULIF
0241
0/
06/0
8LEN
E RG
YF01
121
ULIF
0410
1/
01/1
0LEN
ER
GYF
0212
1
ULIF
0032
8/
07/0
4LEQ
U IT
YF01
121
ULIF
0251
0/
06/0
8LEQ
U IT
YF02
121
ULIF
0420
1/
01/1
0LEQ
U IT
YF03
121
ULIF
0261
0/
06/0
8LG
IL TF
UN01
121
ULIF
0381
9/
03/0
9LG
IL TF
UN02
121
ULIF
0042
8/
07/0
4LG
RO
WTH
F011
21
ULIF
0110
2/
11/0
7LG
RO
WTH
F021
21
Paya
ble
for P
urch
ase
of In
vest
men
ts -
28,
364
- 9
8,18
3 8
21
15,4
16
2,3
25
106
42,
205
1,22
,892
2
2,95
2 6
46
4,3
39
5,9
31
Unit
Paya
ble
A/c
63,
758
- -
- -
39,
332
423
4
,243
1,
95,7
40
- 4
,314
8
4
48
1,33
1 O
ther
Cur
rent
Liab
ilitie
s 2
88
161
7
524
4
6
8 16
3
51
1,70
5 2
,622
9
6 2
4
1 3
8 To
tal
64,
046
28,
525
7
98,
707
825
5
4,81
6 2
,764
4
,700
2
,39,
650
1,25
,514
2
7,36
2 6
56
4,8
28
7,3
00
(` ‘0
00)
Parti
cula
rsPr
evio
us Y
ear
LIFE
G
ROW
TH
PLUS
FUN
D 1
LIFE
G
ROW
TH
PLUS
FUN
D 2
LIFE
GU
ARAN
TEED
BO
ND FU
ND
- 1**
LIFE
HIG
H
GRO
WTH
FU
ND 1
LIFE
HIG
H
GRO
WTH
FU
ND 2
LIFE
H
IGH
EST
NAV
GUA
RANT
EE
FUND
1
LIFE
H
IGH
EST
NAV
ADVA
NTAG
E FU
ND 1
LIFE
H
IGH
EST
NAV
ADVA
NTAG
E FU
ND 2
LIFE
IN
FRAS
TRUC
TURE
FU
ND 1
LIFE
IN
FRAS
TRUC
TURE
FU
ND 2
LIFE
M
IDCA
P FU
ND 1
LIFE
M
IDCA
P FU
ND 2
LIFE
MO
NEY
MAR
KET
FUND
1
LIFE
MO
NEY
MAR
KET
FUND
2
SFIN
ULIF
0080
9/
04/0
7LG
RW
TPLS
0112
1
ULIF
0430
1/
01/1
0LG
RW
TPLS
0212
1
ULIF
0361
6/
12/0
8LG
UAB
OND
0112
1
ULIF
0072
8/
02/0
7LH
IGR
OW
T011
21
ULIF
0551
1/
01/1
0LH
IGR
OW
T021
21
ULIF
0561
2/
02/1
0LH
NAV
GUA
0112
1
ULIF
0580
3/
09/1
0LH
NA
VADV
0112
1
ULIF
0590
1/
06/1
1LH
NA
VADV
0212
1
ULIF
0271
0/
06/0
8LIN
F RA
ST01
121
ULIF
0440
1/
01/1
0LIN
FR
AST0
2121
ULIF
0281
0/
06/0
8LM
ID
CAPF
0112
1
ULIF
0450
1/
01/1
0LM
IDC
APF0
2121
ULIF
0291
0/
06/0
8LM
ON
MRK
T011
21
ULIF
0391
9/
03/0
9LM
ON
MRK
T021
21
Paya
ble
for P
urch
ase
of In
vest
men
ts 5
,947
2
61
- 8
,205
4
24
11,9
1,504
-
- 14
,554
1,
724
3,6
47
6,6
67
- -
Unit
Paya
ble
A/c
6,0
23
- -
8,0
80
- -
1,79
8 4
25
30,
415
87
27,
354
3,3
11
- 1,
502
Oth
er C
urre
nt Li
abilit
ies
55
3
- 11
4 4
8
58
336
4
5 6
7 2
6 9
1 12
9 3
73
3
Tota
l 12
,025
2
64
- 16
,399
4
28
11,9
2,36
2 2
,134
470
4
5,03
6 1,
837
31,0
92
10,10
7 3
73
1,50
5

363
STRA
TEG
IC R
EPO
RT /
STA
TUTO
RY R
EPO
RTS
/ F
INA
NCI
ALS
STA
TEM
ENTS
(` ‘0
00)
Parti
cula
rsPr
evio
us Y
ear
LIFE
PUR
E DE
BT F
UND
1 L
IFE P
URE
EQUI
TY
FUND
1
LIFE
PUR
E EQ
UITY
FU
ND 2
LIFE
SUP
ER
GRO
WTH
FU
ND 1
LIFE
SUP
ER
GRO
WTH
FU
ND 2
REL
IANC
E AS
SURE
D M
ATUR
ITY
DEBT
FUN
D
PEN
SIO
N BA
LANC
ED
FUND
1
PEN
SIO
N BA
LANC
ED
FUND
2
PEN
SION
CAPI
TAL
SECU
RE FU
ND 1
PEN
SION
CORP
ORAT
E BON
D FU
ND 1
PEN
SIO
N EN
ERG
Y FU
ND 1*
*
PEN
SIO
N EN
ERG
Y FU
ND 2
PEN
SIO
N EQ
UITY
FU
ND 1
PEN
SIO
N EQ
UITY
FU
ND 2
SFIN
ULIF
0090
9/
04/0
7LPU
R DE
BT01
121
ULIF
0301
0/
06/0
8LPU
E Q
UTY0
1121
ULIF
0460
1/
01/1
0LPU
EQ
UTY0
2121
ULIF
0100
9/
04/0
7LSP
R G
RWT0
1121
ULIF
0470
1/
01/1
0LSP
RG
RWT0
2121
ULIF
0672
0/
12/1
1LAS
UR
MDE
BT12
1
ULIF
0310
4/
12/0
8PBA
L AN
CE01
121
ULIF
0480
1/
01/1
0PBA
L AN
CE02
121
ULIF
0050
1/
11/0
6PCA
P TS
EC01
121
ULIF
0190
1/
03/0
8PCO
RB
OND
0112
1
ULIF
0200
1/
03/0
8PEN
R G
YYF0
1121
ULIF
0650
1/
01/1
0PEN
R G
YYF0
2121
ULIF
0060
1/
11/0
6PEQ
U IT
YF01
121
ULIF
0320
4/
12/0
8PEQ
U IT
YF02
121
Paya
ble
for P
urch
ase
of In
vest
men
ts 11
,358
6
,289
19
,162
3,8
36
190
- 6
,539
1,
435
- 1,
025
- 9
,651
3
,095
-
Unit
Paya
ble
A/c
9,4
62
8,8
49
- 6
,546
-
761
5
60
- 6
73
3,5
36
- 2
7,95
1 8
,034
5
1,754
O
ther
Cur
rent
Liab
ilitie
s 7
1 13
9 3
30
71
4
63
44
9
5
3
- 19
14
6 2
32
Tota
l 2
0,89
1 15
,277
19
,492
10
,453
19
4 8
24
7,14
3 1,
444
678
4
,564
-
37,
621
11,2
75
51,9
86
(` ‘0
00)
Parti
cula
rsPr
evio
us Y
ear
PEN
SIO
N EQ
UITY
FU
ND 3
PEN
SIO
N G
ILT F
UND
1 P
ENSI
ON
GRO
WTH
FU
ND 1
PEN
SIO
N G
ROW
TH
FUND
2
PEN
SIO
N G
UARA
NTEE
D BO
ND F
UND
- 1**
PEN
SION
INFR
ASTR
UCTU
RE
FUND
1**
PEN
SION
INFR
ASTR
UCTU
RE
FUND
2
PEN
SIO
N M
IDCA
P FU
ND 1*
*
PEN
SIO
N M
IDCA
P FU
ND 2
PEN
SIO
N M
ONE
Y M
ARKE
T FU
ND 1*
*
PEN
SIO
N M
ONE
Y M
ARKE
T FU
ND 2
PEN
SIO
N PU
RE
EQUI
TY
FUND
1**
PEN
SIO
N PU
RE
EQUI
TY
FUND
2
HEA
LTH
BA
LANC
ED
FUND
1**
SFIN
ULIF
0490
1/
01/1
0PEQ
U IT
YF03
121
ULIF
0640
1/
03/0
8PG
IL TF
UN01
121
ULIF
0330
4/
12/0
8PG
RO
WTH
F011
21
ULIF
0500
1/
01/1
0PG
RO
WTH
F021
21
ULIF
0371
6/
12/0
8PG
UAB
OND
0112
1
ULIF
0210
1/
03/0
8PIN
F RA
ST01
121
ULIF
0660
1/
01/1
0PIN
FR
AST0
2121
ULIF
0220
1/
03/0
8PM
ID
CAPF
0112
1
ULIF
0510
1/
01/1
0PM
ID
CAPF
0212
1
ULIF
0340
4/
12/0
8PM
ON
MRK
T011
21
ULIF
0520
1/
01/1
0PM
ON
MRK
T021
21
ULIF
0350
4/
12/0
8PPU
E Q
UTY0
1121
ULIF
0530
1/
01/1
0PPU
EQ
UTY0
2121
ULIF
0180
1/
02/0
8HBA
L AN
CE01
121
Paya
ble
for P
urch
ase
of In
vest
men
ts 15
6 4
21
2,9
84
1,25
7 -
- 6
,424
-
2,16
4 -
- -
1,25
0 -
Unit
Paya
ble
A/c
24
2,5
63
380
2
82
- -
22,
872
- 19
,352
-
20,
204
- 1,
104
- O
ther
Cur
rent
Liab
ilitie
s 11
6 1
29
9
- -
18
- 4
2 -
22
- 2
3 -
Tota
l 2
96
2,9
85
3,3
93
1,54
8 -
- 2
9,31
4 -
21,5
58
- 2
0,22
6 -
2,3
77
-
(` ‘0
00)
Parti
cula
rsPr
evio
us Y
ear
HEA
LTH
CO
RPO
RATE
BO
ND F
UND
1
HEA
LTH
EN
ERG
Y FU
ND 1
HEA
LTH
EQ
UITY
FU
ND 1
HEA
LTH
EQ
UITY
FU
ND 2
HEA
LTH
G
ILT F
UND
1 H
EALT
H GR
OWTH
PL
US FU
ND 1
HEA
LTH
INFR
ASTR
UCTU
RE
FUND
1
HEA
LTH
M
IDCA
P FU
ND 1
HEA
LTH
M
ONE
Y M
ARKE
T FU
ND 1
HEA
LTH
PU
RE E
QUI
TY
FUND
1
HEA
LTH
SU
PER
GRO
WTH
FU
ND 1
GRO
UP
BALA
NCED
FU
ND 1
GRO
UP
BALA
NCED
FU
ND 2
GRO
UP
BALA
NCED
FU
ND 3
**
SFIN
ULIF
0630
1/
02/0
8HCO
R BO
ND01
121
ULIF
0600
1/
02/0
8HEN
E RG
YF01
121
ULIF
0120
1/
02/0
8HEQ
U IT
YF01
121
ULIF
0541
1/
01/1
0HEQ
U IT
YF02
121
ULIF
0130
1/
02/0
8HG
ILT
FUN0
1121
ULIF
0140
1/
02/0
8HG
R W
TPLS
0112
1
ULIF
0610
1/
02/0
8HIN
F RA
ST01
121
ULIF
0620
1/
02/0
8HM
I DC
APF0
1121
ULIF
0150
1/
02/0
8HM
O
NMRK
T011
21
ULIF
0160
1/
02/0
8HPU
E Q
UTY0
1121
ULIF
0170
1/
02/0
8HSP
R G
RWT0
1121
ULG
F001
10/
10/0
3GBA
L AN
CE01
121
ULG
F002
10/
10/0
3GBA
L AN
CE02
121
ULG
F017
18/
05/0
9GBA
L AN
CE03
121
Paya
ble
for P
urch
ase
of In
vest
men
ts 3
89
105
- 15
7 4
45
747
4
0 2
18
- 2
61
195
1,85
6 5
,519
-
Unit
Paya
ble
A/c
373
-
26,
974
- 2
93
2,4
71
16
364
9
06
- 3
,090
-
- -
Oth
er C
urre
nt Li
abilit
ies
3
1 5
8 6
2
8
1
1 2
5
7
15
18
-
Tota
l 7
65
106
27,
032
163
740
3
,226
5
7 5
83
908
2
66
3,2
92
1,87
1 5
,537
-
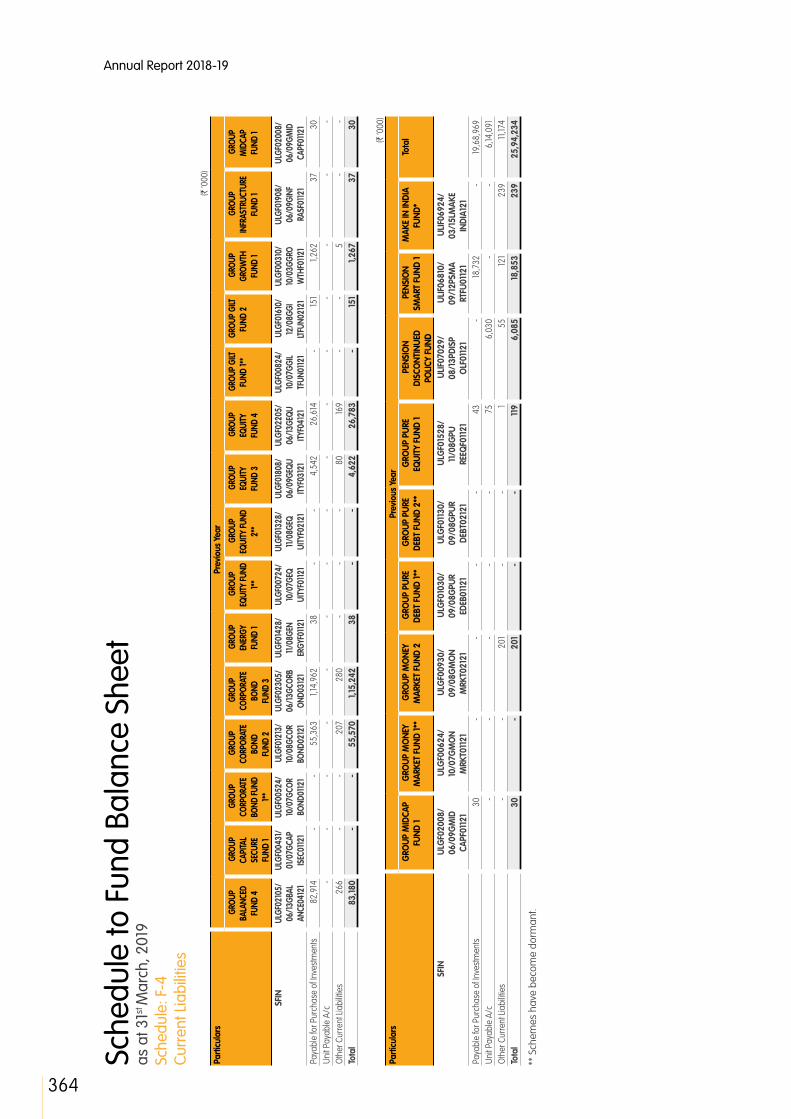
Annual Report 2018-19
364
Sche
dule
to F
und
Bala
nce
Shee
t as
at 3
1st M
arch
, 201
9 Sc
hedu
le: F
-4
Curr
ent L
iabi
litie
s(`
‘000
)Pa
rticu
lars
Prev
ious
Yea
r
GRO
UP
BALA
NCED
FU
ND 4
GRO
UP
CAPI
TAL
SECU
RE
FUND
1
GRO
UP
CORP
ORAT
E BO
ND FU
ND
1**
GRO
UP
CORP
ORAT
E BO
ND
FUND
2
GRO
UP
CORP
ORAT
E BO
ND
FUND
3
GRO
UP
ENER
GY
FUND
1
GRO
UP
EQUI
TY FU
ND
1**
GRO
UP
EQUI
TY FU
ND
2**
GRO
UP
EQUI
TY
FUND
3
GRO
UP
EQUI
TY
FUND
4
GRO
UP G
ILT
FUND
1**
GRO
UP G
ILT
FUND
2
GRO
UP
GROW
TH
FUND
1
GRO
UP
INFR
ASTR
UCTU
RE
FUND
1
GRO
UP
MID
CAP
FUND
1
SFIN
ULGF
0210
5/
06/13
GBAL
AN
CE04
121
ULGF
0043
1/ 01
/07G
CAP
ISEC0
1121
ULGF
0052
4/
10/0
7GCO
R BO
ND01
121
ULG
F012
13/
10/0
8GCO
R BO
ND02
121
ULGF
0230
5/
06/13
GCOR
B ON
D031
21
ULGF
0142
8/
11/08
GEN
ERGY
F0112
1
ULGF
0072
4/
10/0
7GEQ
UI
TYF0
1121
ULGF
0132
8/
11/08
GEQ
UITY
F021
21
ULGF
0180
8/
06/0
9GEQ
U ITY
F031
21
ULGF
0220
5/
06/13
GEQU
ITY
F041
21
ULGF
0082
4/
10/0
7GGI
L TF
UN01
121
ULG
F016
10/
12/0
8GGI
LT
FUN0
2121
ULGF
0031
0/
10/0
3GGR
O W
THF0
1121
ULGF
0190
8/
06/0
9GIN
F RA
SF01
121
ULGF
0200
8/
06/0
9GM
ID
CAPF
0112
1 Pa
yabl
e fo
r Pur
chas
e of
Inve
stm
ents
82,
914
- -
55,
363
1,14
,962
3
8 -
- 4
,542
2
6,61
4 -
151
1,26
2 3
7 3
0 Un
it Pa
yabl
e A/
c -
- -
- -
- -
- -
- -
- -
- -
Oth
er C
urre
nt Li
abilit
ies
266
-
- 2
07
280
-
- -
80
169
- -
5
- -
Tota
l 8
3,18
0 -
- 5
5,57
0 1,
15,2
42
38
- -
4,6
22
26,
783
- 15
1 1,
267
37
30
(` ‘0
00)
Parti
cula
rsPr
evio
us Y
ear
GRO
UP M
IDCA
P FU
ND 1
GRO
UP M
ONE
Y M
ARKE
T FU
ND 1*
* G
ROUP
MO
NEY
MAR
KET
FUND
2
GRO
UP P
URE
DEBT
FUN
D 1*
* G
ROUP
PUR
E DE
BT F
UND
2**
GRO
UP P
URE
EQUI
TY F
UND
1 P
ENSI
ON
DISC
ONT
INUE
D PO
LICY
FUND
PEN
SIO
N SM
ART
FUND
1 M
AKE
IN IN
DIA
FUND
* To
tal
SFIN
ULG
F020
08/
06/0
9GM
ID
CAPF
0112
1
ULG
F006
24/
10/0
7GM
ON
MRK
T011
21
ULG
F009
30/
09/0
8GM
ON
MRK
T021
21
ULG
F010
30/
09/0
8GPU
R ED
EB01
121
ULG
F011
30/
09/0
8GPU
R DE
BT02
121
ULG
F015
28/
11/0
8GPU
RE
EQF0
1121
ULIF
0702
9/
08/1
3PDI
SP
OLF
0112
1
ULIF
0681
0/
09/1
2PSM
A RT
FU01
121
ULIF
0692
4/
03/1
5LM
AKE
INDI
A121
Pa
yabl
e fo
r Pur
chas
e of
Inve
stm
ents
30
- -
- -
43
- 18
,732
-
19,6
8,96
9 Un
it Pa
yabl
e A/
c -
- -
- -
75
6,0
30
- -
6,14
,091
O
ther
Cur
rent
Liab
ilitie
s -
- 2
01
- -
1 5
5 12
1 2
39
11,17
4 To
tal
30
- 2
01
- -
119
6,0
85
18,8
53
239
2
5,94
,234
** S
chem
es h
ave
beco
me
dorm
ant.
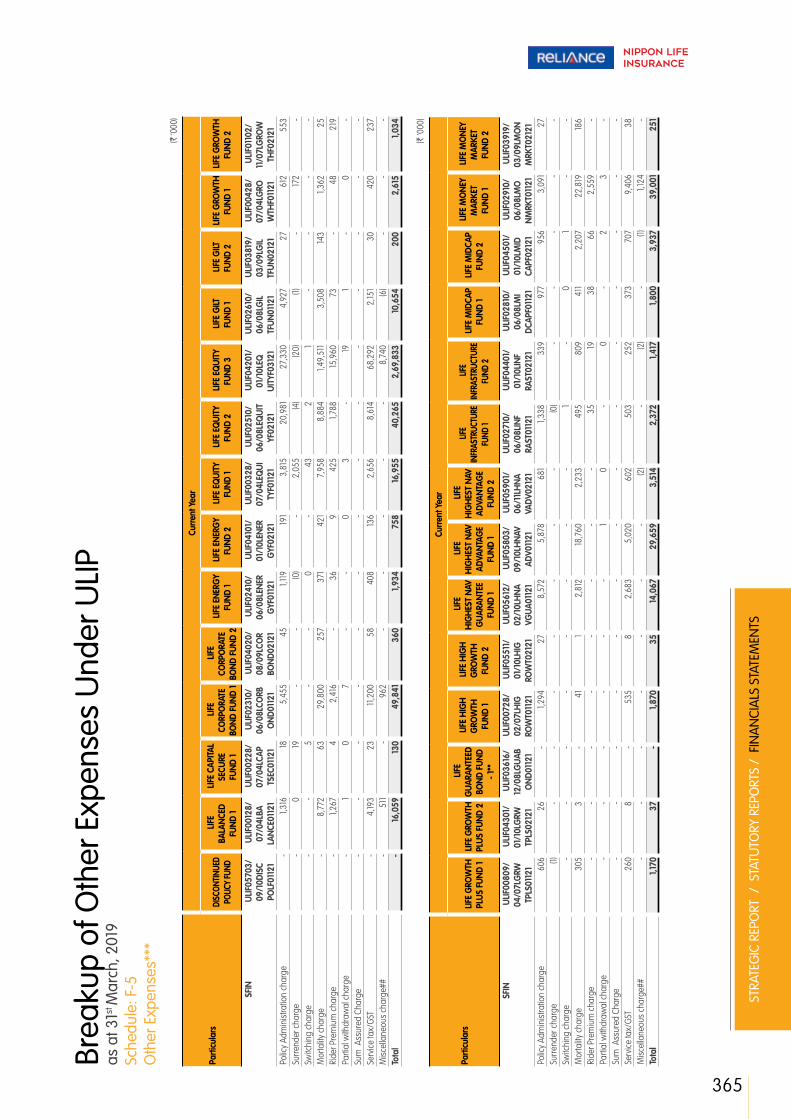
365
STRA
TEG
IC R
EPO
RT /
STA
TUTO
RY R
EPO
RTS
/ F
INA
NCI
ALS
STA
TEM
ENTS
Brea
kup
of O
ther
Exp
ense
s U
nder
ULIP
as
at 3
1st M
arch
, 201
9 Sc
hedu
le: F
-5
Oth
er E
xpen
ses*
**(`
‘000
)
Parti
cula
rs
Cur
rent
Yea
r
DISC
ONTIN
UED
POLIC
Y FU
ND
LIFE
BA
LANC
ED
FUND
1
LIFE
CAP
ITAL
SECU
RE
FUND
1
LIFE
CO
RPO
RATE
BO
ND F
UND
1
LIFE
CO
RPO
RATE
BO
ND F
UND
2
LIFE
ENE
RGY
FUND
1 L
IFE E
NERG
Y FU
ND 2
L
IFE E
QUI
TY
FUND
1 L
IFE E
QUI
TY
FUND
2
LIFE
EQ
UITY
FU
ND 3
L
IFE G
ILT
FUND
1 L
IFE G
ILT
FUND
2
LIFE
GRO
WTH
FU
ND 1
LIFE
GRO
WTH
FU
ND 2
SFIN
ULIF
0570
3/
09/1
0DIS
C PO
LF01
121
ULIF
0012
8/
07/0
4LBA
LA
NCE0
1121
ULIF
0022
8/
07/0
4LCA
P TS
EC01
121
ULIF
0231
0/
06/0
8LCO
RB
OND
0112
1
ULIF
0402
0/
08/0
9LCO
R BO
ND02
121
ULIF
0241
0/
06/0
8LEN
ER
GYF
0112
1
ULIF
0410
1/
01/1
0LEN
ER
GYF
0212
1
ULIF
0032
8/
07/0
4LEQ
UI
TYF0
1121
ULIF
0251
0/
06/0
8LEQ
UIT
YF02
121
ULIF
0420
1/
01/1
0LEQ
UI
TYF0
3121
ULIF
0261
0/
06/0
8LG
IL TF
UN01
121
ULIF
0381
9/
03/0
9LG
IL TF
UN02
121
ULIF
0042
8/
07/0
4LG
RO
WTH
F011
21
ULIF
0110
2/
11/0
7LG
ROW
TH
F021
21
Polic
y Adm
inist
ratio
n ch
arge
- 1,
316
18
5,4
55
45
1,11
9 19
1 3
,815
2
0,98
1 2
7,33
0 4
,927
2
7 6
12
553
Su
rrend
er c
harg
e -
0
19
- -
(0)
- 2
,055
(4
) (2
0) (1
) -
172
- Sw
itchi
ng c
harg
e -
- 5
-
- 0
-
43
2
1 -
- -
- M
orta
lity c
harg
e -
8,7
72
63
29,
800
257
3
71
421
7
,958
8
,884
1,
49,5
11
3,5
08
143
1,36
2 2
5 Ri
der P
rem
ium
cha
rge
- 1,
267
4
2,4
16
- 3
6 9
4
25
1,78
8 15
,960
7
3 -
48
219
Pa
rtial
with
draw
al c
harg
e -
1 0
7
-
- 0
3
-
19
1 -
0
- Su
m A
ssur
ed C
harg
e -
- -
- -
- -
- -
- -
- -
- Se
rvice
tax/
GST
- 4
,193
23
11,2
00
58
408
13
6 2
,656
8
,614
6
8,29
2 2
,151
30
420
2
37
Misc
ella
neou
s ch
arge
## -
511
-
962
-
- -
- -
8,7
40
(6)
- -
- To
tal
- 16
,059
13
0 4
9,84
1 3
60
1,93
4 7
58
16,9
55
40,
265
2,6
9,83
3 10
,654
2
00
2,6
15
1,03
4
(` ‘0
00)
Parti
cula
rs
Cur
rent
Yea
r
LIFE
GRO
WTH
PL
US F
UND
1 LI
FE G
ROW
TH
PLUS
FUN
D 2
LIFE
G
UARA
NTEE
D BO
ND F
UND
- 1**
LIFE
HIG
H
GRO
WTH
FU
ND 1
LIFE
HIG
H
GRO
WTH
FU
ND 2
LIFE
H
IGH
EST
NAV
GUA
RANT
EE
FUND
1
LIFE
H
IGH
EST
NAV
ADVA
NTAG
E FU
ND 1
LIFE
H
IGH
EST
NAV
ADVA
NTAG
E FU
ND 2
LIFE
IN
FRAS
TRUC
TURE
FU
ND 1
LIFE
IN
FRAS
TRUC
TURE
FU
ND 2
LIFE
MID
CAP
FUND
1 L
IFE M
IDCA
P FU
ND 2
LIFE
MO
NEY
MAR
KET
FUND
1
LIFE
MO
NEY
MAR
KET
FUND
2
SFIN
ULIF
0080
9/
04/0
7LG
RW
TPLS
0112
1
ULIF
0430
1/
01/1
0LG
RW
TPLS
0212
1
ULIF
0361
6/
12/0
8LG
UAB
OND
0112
1
ULIF
0072
8/
02/0
7LH
IG
ROW
T011
21
ULIF
0551
1/
01/1
0LH
IG
ROW
T021
21
ULIF
0561
2/
02/1
0LH
NA
VGUA
0112
1
ULIF
0580
3/
09/1
0LH
NAV
ADV0
1121
ULIF
0590
1/
06/1
1LH
NA
VADV
0212
1
ULIF
0271
0/
06/0
8LIN
F RA
ST01
121
ULIF
0440
1/
01/1
0LIN
F RA
ST02
121
ULIF
0281
0/
06/0
8LM
I DC
APF0
1121
ULIF
0450
1/
01/1
0LM
ID
CAPF
0212
1
ULIF
0291
0/
06/0
8LM
O
NMRK
T011
21
ULIF
0391
9/
03/0
9LM
ON
MRK
T021
21
Polic
y Adm
inist
ratio
n ch
arge
606
2
6 -
1,29
4 2
7 8
,572
5
,878
6
81
1,33
8 3
39
977
9
56
3,0
91
27
Surre
nder
cha
rge
(1)
- -
- -
- -
- (0
) -
- -
- -
Switc
hing
cha
rge
- -
- -
- -
- -
1 -
0
1 -
- M
orta
lity c
harg
e 3
05
3
- 4
1 1
2,8
12
18,7
60
2,2
33
495
8
09
411
2
,207
2
2,81
9 18
6 Ri
der P
rem
ium
cha
rge
- -
- -
- -
- -
35
19
38
66
2,5
59
- Pa
rtial
with
draw
al c
harg
e -
- -
- -
- 1
0
- 0
-
2
3
- Su
m A
ssur
ed C
harg
e -
- -
- -
- -
- -
- -
- -
- Se
rvice
tax/
GST
260
8
-
535
8
2
,683
5
,020
6
02
503
2
52
373
7
07
9,4
06
38
Misc
ella
neou
s ch
arge
## -
- -
- -
- -
(2)
- (2
) -
(1)
1,12
4 -
Tota
l 1,
170
37
- 1,
870
35
14,0
67
29,
659
3,5
14
2,3
72
1,41
7 1,
800
3,9
37
39,
001
251

Annual Report 2018-19
366
Brea
kup
of O
ther
Exp
ense
s U
nder
ULIP
as
at 3
1st M
arch
, 201
9 Sc
hedu
le: F
-5
Oth
er E
xpen
ses*
**(`
‘000
)
Parti
cula
rs
Cur
rent
Yea
r
LIFE
PUR
E DEB
T FU
ND 1
LIFE
PUR
E EQ
UITY
FU
ND 1
LIFE
PUR
E EQ
UITY
FU
ND 2
LIFE
SUP
ER
GRO
WTH
FU
ND 1
LIFE
SUP
ER
GRO
WTH
FU
ND 2
REL
IANC
E AS
SURE
D M
ATUR
ITY
DEBT
FUN
D
PEN
SIO
N BA
LANC
ED
FUND
1
PEN
SIO
N BA
LANC
ED
FUND
2
PEN
SIO
N CA
PITA
L SE
CURE
FU
ND 1
PEN
SIO
N CO
RPO
RATE
BO
ND F
UND
1
PEN
SIO
N EN
ERG
Y FU
ND
1**
PEN
SIO
N EN
ERG
Y FU
ND 2
PEN
SIO
N EQ
UITY
FU
ND 1
PEN
SIO
N EQ
UITY
FU
ND 2
SFIN
ULI
F009
09/
04/0
7LPU
R D
EBT0
1121
ULI
F030
10/
06/0
8LPU
E Q
UTY
0112
1
ULI
F046
01/
01/1
0LPU
E Q
UTY
0212
1
ULI
F010
09/
04/0
7LSP
R G
RWT0
1121
ULI
F047
01/
01/1
0LSP
R G
RWT0
2121
ULI
F067
20/
12/1
1LA
SU
RMD
EBT1
21
ULI
F031
04/
12/0
8PBA
L A
NCE
0112
1
ULI
F048
01/
01/1
0PBA
L A
NCE
0212
1
ULI
F005
01/
11/0
6PCA
P TS
EC01
121
ULI
F019
01/
03/0
8PCO
R BO
ND
0112
1
ULI
F020
01/
03/0
8PEN
R G
YYF0
1121
ULI
F065
01/
01/1
0PEN
R G
YYF0
2121
ULI
F006
01/
11/0
6PEQ
U
ITYF
0112
1
ULI
F032
04/
12/0
8PEQ
U
ITYF
0212
1 Po
licy A
dmin
istra
tion
char
ge 1
2,5
37
3,0
43
716
5
1 2
,294
-
50
- 3
9 4
7
8 -
204
Su
rrend
er c
harg
e -
- -
- -
- -
- -
- -
(6)
(2)
- Sw
itchi
ng c
harg
e -
- -
- -
- 5
-
0
- -
- 4
3 2
M
orta
lity c
harg
e -
632
2
1,647
2
10
12
8
147
20
22
- 0
7
5 4
29
939
Ri
der P
rem
ium
cha
rge
0
61
2,6
28
- -
- 8
5 -
6
- -
1 19
2
1 Pa
rtial
with
draw
al c
harg
e -
- 1
- -
- -
- -
- -
- -
- Su
m A
ssur
ed C
harg
e -
- -
- -
- -
- -
- -
- -
- Se
rvice
tax/
GST
1 9
13
10,3
38
275
14
7
27
100
29
10
7
1 5
2 3
34
591
M
iscel
lane
ous
char
ge##
- -
1,60
0 -
- -
- -
- -
- -
- -
Tota
l 2
4
,143
39,
258
1,20
0 7
6 3
,029
3
37
99
38
46
6
200
8
22
1,75
7
(` ‘0
00)
Parti
cula
rs
Cur
rent
Yea
r
PEN
SIO
N EQ
UITY
FU
ND 3
PEN
SIO
N G
ILT F
UND
1
PEN
SIO
N G
ROW
TH
FUND
1
PEN
SIO
N G
ROW
TH
FUND
2
PEN
SIO
N G
UARA
NTEE
D BO
ND F
UND
- 1**
PEN
SION
INFR
ASTR
UCTU
RE
FUND
1**
PEN
SION
INFR
ASTR
UCTU
RE
FUND
2
PEN
SIO
N M
IDCA
P FU
ND 1*
*
PEN
SIO
N M
IDCA
P FU
ND 2
PEN
SIO
N M
ONE
Y M
ARKE
T FU
ND 1*
*
PEN
SIO
N M
ONE
Y M
ARKE
T FU
ND 2
PEN
SIO
N PU
RE E
QUI
TY
FUND
1**
PEN
SIO
N PU
RE E
QUI
TY
FUND
2
HEA
LTH
BA
LANC
ED
FUND
1**
SFIN
ULIF
0490
1/
01/1
0PEQ
U IT
YF03
121
ULIF
0640
1/
03/0
8PG
IL TF
UN01
121
ULIF
0330
4/
12/0
8PG
RO
WTH
F011
21
ULIF
0500
1/
01/1
0PG
RO
WTH
F021
21
ULIF
0371
6/
12/0
8PGU
A BO
ND01
121
ULIF
0210
1/
03/0
8PIN
F RA
ST01
121
ULIF
0660
1/
01/1
0PIN
FR
AST0
2121
ULIF
0220
1/
03/0
8PM
ID
CAPF
0112
1
ULIF
0510
1/
01/1
0PM
ID
CAPF
0212
1
ULIF
0340
4/
12/0
8PM
ON
MRK
T011
21
ULIF
0520
1/
01/1
0PM
ON
MRK
T021
21
ULIF
0350
4/
12/0
8PPU
E Q
UTY0
1121
ULIF
0530
1/
01/1
0PPU
E Q
UTY0
2121
ULIF
0180
1/
02/0
8HBA
L AN
CE01
121
Polic
y Adm
inist
ratio
n ch
arge
960
4
0 -
86
- 6
9
2 4
15
5 -
71
2
120
- Su
rrend
er c
harg
e -
- -
- -
- -
- -
- -
- -
- Sw
itchi
ng c
harg
e -
- 0
-
- -
- -
- -
- -
- -
Mor
tality
cha
rge
336
-
148
30
- 5
4
2 0
7
5 3
10
2 0
15
9 -
Ride
r Pre
miu
m c
harg
e -
- 4
-
- -
1 -
- -
- -
0
- Pa
rtial
with
draw
al c
harg
e -
- -
- -
- -
- -
- -
- -
- Su
m A
ssur
ed C
harg
e -
- -
- -
- -
- -
- -
- -
- Se
rvice
tax/
GST
551
7
7
9 5
0 -
3
51
1 11
4 0
6
7 0
10
5 -
Misc
ella
neou
s ch
arge
## -
- -
- -
- -
- -
- -
- -
- To
tal
1,84
7 4
8 2
31
165
- 14
18
5 5
3
45
3
241
3
3
85
-

367
STRA
TEG
IC R
EPO
RT /
STA
TUTO
RY R
EPO
RTS
/ F
INA
NCI
ALS
STA
TEM
ENTS
(` ‘0
00)
Parti
cula
rs
Cur
rent
Yea
r
HEA
LTH
CO
RPO
RATE
BO
ND F
UND
1
HEA
LTH
EN
ERG
Y FU
ND 1
HEA
LTH
EQ
UITY
FU
ND 1
HEA
LTH
EQ
UITY
FU
ND 2
HEA
LTH
GILT
FU
ND 1
HEA
LTH
G
ROW
TH
PLUS
FUN
D 1
HEA
LTH
INFR
ASTR
UCTU
RE
FUND
1
HEA
LTH
M
IDCA
P FU
ND 1
HEA
LTH
M
ONE
Y M
ARKE
T FU
ND 1
HEA
LTH
PU
RE E
QUI
TY
FUND
1
HEA
LTH
SU
PER
GRO
WTH
FU
ND 1
GRO
UP
BALA
NCED
FU
ND 1
GRO
UP
BALA
NCED
FU
ND 2
GRO
UP
BALA
NCED
FU
ND 3
**
SFIN
ULIF
0630
1/
02/0
8HCO
RB
OND
0112
1
ULIF
0600
1/
02/0
8HEN
E RG
YF01
121
ULIF
0120
1/
02/0
8HEQ
U IT
YF01
121
ULIF
0541
1/
01/1
0HEQ
U IT
YF02
121
ULIF
0130
1/
02/0
8HG
ILT
FUN0
1121
ULIF
0140
1/
02/0
8HG
RW
TPLS
0112
1
ULIF
0610
1/ 02
/08H
INF
RAST
0112
1
ULIF
0620
1/
02/0
8HM
I DC
APF0
1121
ULIF
0150
1/
02/0
8HM
ON
MRK
T011
21
ULIF
0160
1/
02/0
8HPU
E Q
UTY0
1121
ULIF
0170
1/
02/0
8HSP
R G
RWT0
1121
ULG
F001
10/
10/0
3GB
ALAN
CE01
121
ULG
F002
10/
10/0
3GBA
L AN
CE02
121
ULG
F017
18/
05/0
9GBA
L AN
CE03
121
Polic
y Adm
inist
ratio
n ch
arge
34
10
404
6
3 2
8 7
9 8
10
16
15
5
6 -
11
- Su
rrend
er c
harg
e -
- -
- -
- -
- -
- -
- -
- Sw
itchi
ng c
harg
e -
- -
- -
- -
- -
- -
- -
- M
orta
lity c
harg
e 7
9 2
1 8
99
215
6
0 2
29
20
29
34
45
103
- 2
41
- Ri
der P
rem
ium
cha
rge
- -
- -
- -
- -
- -
- -
- -
Parti
al w
ithdr
awal
cha
rge
- -
- -
- -
- -
- -
- -
- -
Sum
Ass
ured
Cha
rge
- -
- -
- -
- -
- -
- -
- -
Serv
ice ta
x/GS
T 2
6 7
3
16
60
21
70
7
9
11
13
40
- 4
8 -
Misc
ella
neou
s ch
arge
## -
- -
- -
- -
- -
- -
- -
- To
tal
139
38
1,61
9 3
38
110
378
3
5 4
8 6
1 7
3 19
9 -
299
-
(` ‘0
00)
Parti
cula
rs
Cur
rent
Yea
r
GRO
UP
BALA
NCED
FU
ND 4
GRO
UP
CAPI
TAL
SECU
RE
FUND
1
GRO
UP
CORP
ORA
TE
BOND
FUN
D 1*
*
GRO
UP
CORP
ORA
TE
BOND
FU
ND 2
GRO
UP
CORP
ORA
TE
BOND
FU
ND 3
GRO
UP
ENER
GY
FUND
1
GRO
UP
EQUI
TY
FUND
1**
GRO
UP
EQUI
TY
FUND
2**
GRO
UP
EQUI
TY
FUND
3
GRO
UP
EQUI
TY
FUND
4
GRO
UP G
ILT
FUND
1**
GRO
UP G
ILT
FUND
2
GRO
UP
GRO
WTH
FU
ND 1
GRO
UP
INFR
ASTR
UCTU
RE
FUND
1
SFIN
ULG
F021
05/
06/1
3GBA
LA
NCE0
4121
ULG
F004
31/
01/0
7GCA
PI
SEC0
1121
ULG
F005
24/
10/0
7GCO
RB
OND
0112
1
ULG
F012
13/
10/0
8GCO
R BO
ND02
121
ULG
F023
05/
06/1
3GCO
RB
OND
0312
1
ULG
F014
28/
11/0
8GEN
E RG
YF01
121
ULG
F007
24/
10/0
7GEQ
U IT
YF01
121
ULG
F013
28/
11/0
8GEQ
U IT
YF02
121
ULG
F018
08/
06/0
9GEQ
UI
TYF0
3121
ULG
F022
05/
06/1
3GEQ
U IT
YF04
121
ULG
F008
24/
10/0
7GG
IL TF
UN01
121
ULG
F016
10/
12/0
8GG
IL TF
UN02
121
ULG
F003
10/
10/0
3GG
RO
WTH
F011
21
ULG
F019
08/
06/0
9GIN
F RA
SF01
121
Polic
y Adm
inist
ratio
n ch
arge
- -
- 14
-
2
- 0
4
2 -
- 2
-
6
Surre
nder
cha
rge
- -
- -
- -
- -
- -
- -
- -
Switc
hing
cha
rge
- -
- -
- -
- -
- -
- -
- -
Mor
tality
cha
rge
5,6
47
- -
86
6,0
38
14
- 0
8
2 1,
106
- 1
- 2
4 Ri
der P
rem
ium
cha
rge
- -
- -
- -
- -
- -
- -
- -
Parti
al w
ithdr
awal
cha
rge
- -
- -
- -
- -
- -
- -
- -
Sum
Ass
ured
Cha
rge
- -
- -
- -
- -
- -
- -
- -
Serv
ice ta
x/GS
T 1,
081
- -
18
1,15
6 3
-
- 2
3 2
12
- 1
- 6
M
iscel
lane
ous
char
ge##
- -
- -
- -
- -
- -
- -
- -
Tota
l 6
,728
-
- 11
8 7
,194
19
- -
146
1,31
7 -
4
- 3
5
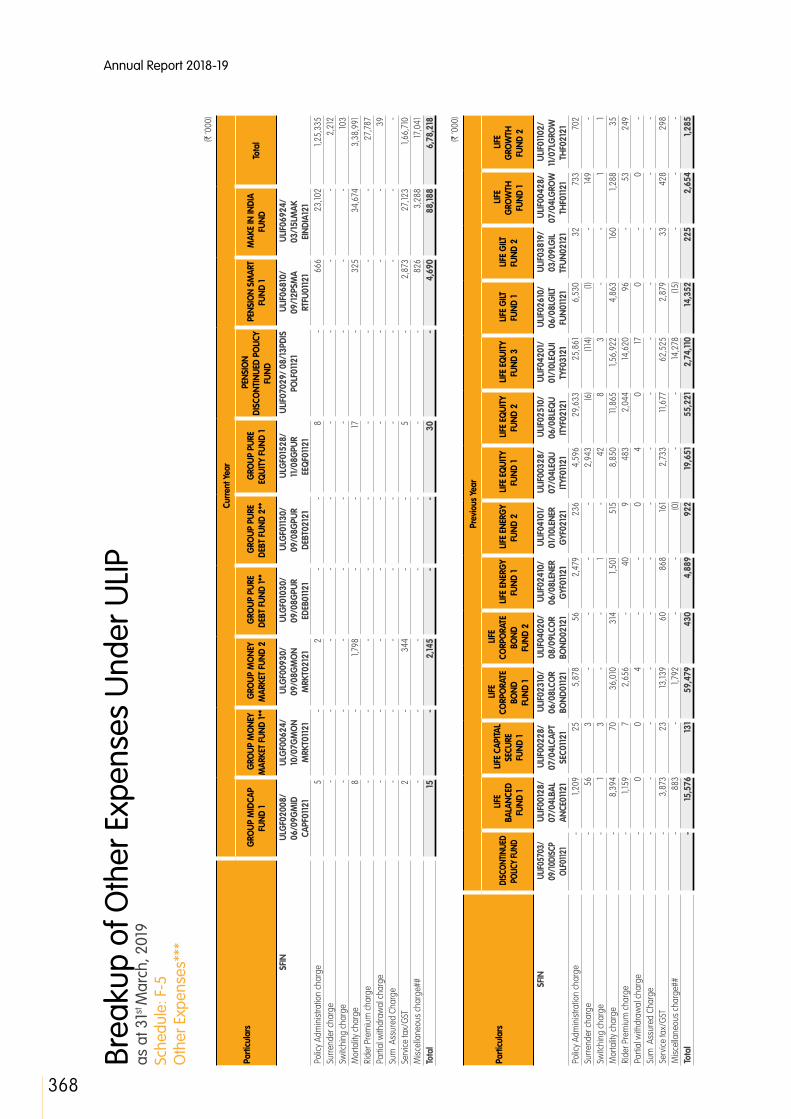
Annual Report 2018-19
368
Brea
kup
of O
ther
Exp
ense
s U
nder
ULIP
as
at 3
1st M
arch
, 201
9 Sc
hedu
le: F
-5
Oth
er E
xpen
ses*
**
(` ‘0
00)
Parti
cula
rs
Cur
rent
Yea
r
GRO
UP M
IDCA
P FU
ND 1
GRO
UP M
ONE
Y M
ARKE
T FU
ND 1*
* G
ROUP
MO
NEY
MAR
KET
FUND
2
GRO
UP P
URE
DEBT
FUN
D 1*
* G
ROUP
PUR
E DE
BT F
UND
2**
GRO
UP P
URE
EQUI
TY F
UND
1
PEN
SIO
N DI
SCO
NTIN
UED
POLIC
Y FU
ND
PEN
SIO
N SM
ART
FUND
1 M
AKE
IN IN
DIA
FUND
To
tal
SFIN
ULG
F020
08/
06/0
9GM
ID
CAPF
0112
1
ULG
F006
24/
10/0
7GM
ON
MRK
T011
21
ULG
F009
30/
09/0
8GM
ON
MRK
T021
21
ULG
F010
30/
09/0
8GPU
R ED
EB01
121
ULG
F011
30/
09/0
8GPU
R DE
BT02
121
ULG
F015
28/
11/0
8GPU
R EE
QF0
1121
ULIF
0702
9/ 0
8/13
PDIS
PO
LF01
121
ULIF
0681
0/
09/1
2PSM
A RT
FU01
121
ULIF
0692
4/
03/1
5LM
AK
EIND
IA12
1 Po
licy A
dmin
istra
tion
char
ge 5
-
2
- -
8
- 6
66
23,
102
1,25
,335
Su
rrend
er c
harg
e -
- -
- -
- -
- -
2,2
12
Switc
hing
cha
rge
- -
- -
- -
- -
- 10
3 M
orta
lity c
harg
e 8
-
1,79
8 -
- 17
-
325
3
4,67
4 3
,38,
991
Ride
r Pre
miu
m c
harg
e -
- -
- -
- -
- -
27,
787
Parti
al w
ithdr
awal
cha
rge
- -
- -
- -
- -
- 3
9 Su
m A
ssur
ed C
harg
e -
- -
- -
- -
- -
- Se
rvice
tax/
GST
2
- 3
44
- -
5
- 2
,873
2
7,12
3 1,
66,7
10
Misc
ella
neou
s ch
arge
## -
- -
- -
- -
826
3
,288
17
,041
To
tal
15
- 2
,145
- -
30
- 4
,690
8
8,18
8 6
,78,
218
(` ‘0
00)
Parti
cula
rs
Prev
ious
Yea
r
DISC
ONTIN
UED
POLIC
Y FU
ND
LIFE
BA
LANC
ED
FUND
1
LIFE
CAP
ITAL
SECU
RE
FUND
1
LIFE
CO
RPO
RATE
BO
ND
FUND
1
LIFE
CO
RPO
RATE
BO
ND
FUND
2
LIFE
ENE
RGY
FUND
1 L
IFE E
NERG
Y FU
ND 2
L
IFE E
QUI
TY
FUND
1 L
IFE E
QUI
TY
FUND
2
LIFE
EQ
UITY
FU
ND 3
L
IFE G
ILT
FUND
1 L
IFE G
ILT
FUND
2
LIFE
G
ROW
TH
FUND
1
LIFE
G
ROW
TH
FUND
2
SFIN
ULIF
0570
3/
09/10
DISC
P OL
F0112
1
ULIF
0012
8/
07/0
4LBA
L AN
CE01
121
ULIF
0022
8/
07/0
4LCA
PT
SEC0
1121
ULIF
0231
0/
06/0
8LCO
R BO
ND01
121
ULIF
0402
0/
08/0
9LCO
R BO
ND02
121
ULIF
0241
0/
06/0
8LEN
ER
GYF
0112
1
ULIF
0410
1/
01/1
0LEN
ER
GYF
0212
1
ULIF
0032
8/
07/0
4LEQ
U IT
YF01
121
ULIF
0251
0/
06/0
8LEQ
U IT
YF02
121
ULIF
0420
1/
01/1
0LEQ
UI
TYF0
3121
ULIF
0261
0/
06/0
8LG
ILT
FUN0
1121
ULIF
0381
9/
03/0
9LG
IL TF
UN02
121
ULIF
0042
8/
07/0
4LG
ROW
TH
F011
21
ULIF
0110
2/
11/0
7LG
ROW
TH
F021
21
Polic
y Adm
inist
ratio
n ch
arge
- 1,
209
25
5,8
78
56
2,4
79
236
4
,596
2
9,63
3 2
5,86
1 6
,530
3
2 7
33
702
Su
rrend
er c
harg
e -
56
3
- -
- -
2,9
43
(6)
(114
) (1
) -
149
- Sw
itchi
ng c
harg
e -
1 3
-
- 1
- 4
2 8
3
-
- 1
1 M
orta
lity c
harg
e -
8,3
94
70
36,
010
314
1,
501
515
8
,850
11
,865
1,
56,9
22
4,8
63
160
1,28
8 3
5 Ri
der P
rem
ium
cha
rge
- 1,
159
7
2,6
56
- 4
0 9
4
83
2,0
44
14,6
20
96
- 5
3 2
49
Parti
al w
ithdr
awal
cha
rge
- 0
0
4
-
- 0
4
0
17
0
-
0
- Su
m A
ssur
ed C
harg
e -
- -
- -
- -
- -
- -
- -
- Se
rvice
tax/
GST
- 3
,873
2
3 13
,139
60
868
16
1 2
,733
11
,677
6
2,52
5 2
,879
3
3 4
28
298
M
iscel
lane
ous
char
ge##
- 8
83
- 1,
792
- -
(0)
- -
14,2
78
(15)
- -
- To
tal
- 15
,576
13
1 5
9,47
9 4
30
4,8
89
922
19
,651
5
5,22
1 2
,74,
110
14,3
52
225
2
,654
1,
285

369
STRA
TEG
IC R
EPO
RT /
STA
TUTO
RY R
EPO
RTS
/ F
INA
NCI
ALS
STA
TEM
ENTS
(` ‘0
00)
Parti
cula
rs
Prev
ious
Yea
r
LIFE
G
ROW
TH
PLUS
FU
ND 1
LIFE
G
ROW
TH
PLUS
FU
ND 2
LIFE
G
UARA
NTEE
D BO
ND F
UND
- 1**
LIFE
HIG
H
GRO
WTH
FU
ND 1
LIFE
HIG
H
GRO
WTH
FU
ND 2
LIFE
H
IGH
EST
NAV
GUA
RANT
EE
FUND
1
LIFE
H
IGH
EST
NAV
ADVA
NTAG
E FU
ND 1
LIFE
H
IGH
EST
NAV
ADVA
NTAG
E FU
ND 2
LIFE
IN
FRAS
TRUC
TURE
FU
ND 1
LIFE
IN
FRAS
TRUC
TURE
FU
ND 2
LIFE
M
IDCA
P FU
ND 1
LIFE
M
IDCA
P FU
ND 2
LIFE
MO
NEY
MAR
KET
FUND
1
LIFE
MO
NEY
MAR
KET
FUND
2
SFIN
ULIF
0080
9/
04/0
7LG
RW
TPLS
0112
1
ULIF
0430
1/
01/1
0LG
RW
TPLS
0212
1
ULIF
0361
6/
12/0
8LG
UAB
OND
0112
1
ULIF
0072
8/
02/0
7LH
IG
ROW
T011
21
ULIF
0551
1/
01/1
0LH
IGR
OW
T021
21
ULIF
0561
2/
02/1
0LH
NA
VGUA
0112
1
ULIF
0580
3/
09/1
0LH
NA
VADV
0112
1
ULIF
0590
1/
06/1
1LH
NA
VADV
0212
1
ULIF
0271
0/
06/0
8LIN
F RA
ST01
121
ULIF
0440
1/
01/1
0LIN
F RA
ST02
121
ULIF
0281
0/
06/0
8LM
ID
CAPF
0112
1
ULIF
0450
1/
01/1
0LM
ID
CAPF
0212
1
ULIF
0291
0/
06/0
8LM
ON
MRK
T011
21
ULIF
0391
9/
03/0
9LM
ON
MRK
T021
21
Polic
y Adm
inist
ratio
n ch
arge
1,06
5 3
4 -
2,13
4 3
3 9
,653
7
,218
8
37
3,0
65
410
1,
773
1,19
3 3
,215
3
1 Su
rrend
er c
harg
e -
- -
- -
(50)
- -
(0)
- -
- -
- Sw
itchi
ng c
harg
e 1
- -
0
- -
- -
1 -
1 -
2
- M
orta
lity c
harg
e 4
55
7
- 5
4 1
4,5
09
22,
285
2,5
46
1,99
8 1,
075
962
2
,909
2
7,30
1 2
04
Ride
r Pre
miu
m c
harg
e -
- -
- -
- -
- 4
0 2
8 4
1 9
3 2
,886
-
Parti
al w
ithdr
awal
cha
rge
- -
- -
- -
2
- -
0
- 1
2
- Su
m A
ssur
ed C
harg
e -
- -
- -
- -
- -
- -
- -
- Se
rvice
tax/
GST
462
10
-
877
14
3
,079
5
,729
6
69
1,08
6 3
21
625
9
13
10,7
99
40
Misc
ella
neou
s ch
arge
## -
- -
- -
- -
- -
(2)
- (5
) 2
,768
-
Tota
l 1,
982
51
- 3
,065
4
8 17
,192
35,
234
4,0
52
6,19
0 1,
832
3,4
02
5,10
4 4
6,97
2 2
75
(` ‘0
00)
Parti
cula
rs
Prev
ious
Yea
r
LIFE
PUR
E DE
BT
FUND
1
LIFE
PUR
E EQ
UITY
FU
ND 1
LIFE
PUR
E EQ
UITY
FU
ND 2
LIFE
SUP
ER
GRO
WTH
FU
ND 1
LIFE
SUP
ER
GRO
WTH
FU
ND 2
REL
IANC
E AS
SURE
D M
ATUR
ITY
DEBT
FUN
D
PEN
SIO
N BA
LANC
ED
FUND
1
PEN
SIO
N BA
LANC
ED
FUND
2
PEN
SIO
N CA
PITA
L SE
CURE
FU
ND 1
PEN
SIO
N CO
RPO
RATE
BO
ND F
UND
1
PEN
SIO
N EN
ERG
Y FU
ND 1*
*
PEN
SIO
N EN
ERG
Y FU
ND 2
PEN
SIO
N EQ
UITY
FU
ND 1
PEN
SIO
N EQ
UITY
FU
ND 2
SFIN
ULIF
0090
9/
04/0
7LPU
R DE
BT01
121
ULIF
0301
0/
06/0
8LPU
E Q
UTY0
1121
ULIF
0460
1/
01/1
0LPU
E Q
UTY0
2121
ULIF
0100
9/
04/0
7LSP
R G
RWT0
1121
ULIF
0470
1/
01/1
0LSP
R G
RWT0
2121
ULIF
0672
0/
12/1
1LAS
UR
MDE
BT12
1
ULIF
0310
4/
12/0
8PBA
L AN
CE01
121
ULIF
0480
1/
01/1
0PBA
LA
NCE0
2121
ULIF
0050
1/
11/0
6PCA
P TS
EC01
121
ULIF
0190
1/
03/0
8PCO
R BO
ND01
121
ULIF
0200
1/
03/0
8PEN
R G
YYF0
1121
ULIF
0650
1/
01/1
0PEN
R G
YYF0
2121
ULIF
0060
1/
11/0
6PEQ
U IT
YF01
121
ULIF
0320
4/
12/0
8PEQ
U IT
YF02
121
Polic
y Adm
inist
ratio
n ch
arge
1 2
,959
2
,592
1,
139
52
2,4
52
- 6
1 -
80
- 9
92
- 1,
023
Surre
nder
cha
rge
- (0
) (1
) -
- -
(1)
- -
- -
- (2
) (5
)Sw
itchi
ng c
harg
e -
1 -
- -
- 8
-
1 -
- -
35
3
Mor
tality
cha
rge
0
712
2
1,034
2
68
11
3
163
20
25
- -
77
450
1,
043
Ride
r Pre
miu
m c
harg
e 0
6
7 2
,207
-
- -
105
- 15
-
- 0
2
6 2
0 Pa
rtial
with
draw
al c
harg
e -
- 1
- -
- -
- -
- -
- -
- Su
m A
ssur
ed C
harg
e -
- -
- -
- -
- -
- -
- -
- Se
rvice
tax/
GST
0
1,05
8 9
,133
333
13
8
37
110
33
15
14
- 2
19
362
8
71
Misc
ella
neou
s ch
arge
## -
- 2
,501
-
- 3
3 -
- -
- -
- -
- To
tal
2
4,7
97
37,
467
1,74
0 7
6 3
,325
3
85
114
55
94
- 1,
287
871
2
,955

Annual Report 2018-19
370
Brea
kup
of O
ther
Exp
ense
s U
nder
ULIP
as
at 3
1st M
arch
, 201
9 Sc
hedu
le: F
-5
Oth
er E
xpen
ses*
**(`
‘000
)
Parti
cula
rs
Prev
ious
Yea
r
PEN
SIO
N EQ
UITY
FU
ND 3
PEN
SIO
N G
ILT F
UND
1
PEN
SIO
N G
ROW
TH
FUND
1
PEN
SIO
N G
ROW
TH
FUND
2
PEN
SION
GUAR
ANTE
ED
BOND
FUND
- 1
**
PEN
SION
INFR
ASTR
UCTU
RE
FUND
1**
PEN
SION
INFR
ASTR
UCTU
RE
FUND
2
PEN
SIO
N M
IDCA
P FU
ND 1*
*
PEN
SIO
N M
IDCA
P FU
ND 2
PEN
SIO
N M
ONE
Y M
ARKE
T FU
ND 1*
*
PEN
SIO
N M
ONE
Y M
ARKE
T FU
ND 2
PEN
SIO
N PU
RE
EQUI
TY
FUND
1**
PEN
SIO
N PU
RE
EQUI
TY
FUND
2
HEA
LTH
BA
LANC
ED
FUND
1**
SFIN
ULIF
0490
1/
01/1
0PEQ
U IT
YF03
121
ULIF
0640
1/
03/0
8PG
ILT
FUN0
1121
ULIF
0330
4/
12/0
8PG
RO
WTH
F011
21
ULIF
0500
1/
01/1
0PG
RO
WTH
F021
21
ULIF
0371
6/
12/0
8PG
UA
BOND
0112
1
ULIF
0210
1/
03/0
8PIN
F RA
ST01
121
ULIF
0660
1/
01/1
0PIN
FR
AST0
2121
ULIF
0220
1/
03/0
8PM
ID
CAPF
0112
1
ULIF
0510
1/
01/1
0PM
ID
CAPF
0212
1
ULIF
0340
4/
12/0
8PM
ON
MRK
T011
21
ULIF
0520
1/
01/1
0PM
ON
MRK
T021
21
ULIF
0350
4/
12/0
8PPU
EQ
UTY0
1121
ULIF
0530
1/
01/1
0PPU
E Q
UTY0
2121
ULIF
0180
1/
02/0
8HBA
L AN
CE01
121
Polic
y Adm
inist
ratio
n ch
arge
1,18
8 18
5 -
104
- -
1,33
4 -
694
-
106
- 15
1 -
Surre
nder
cha
rge
(7)
- (1
) -
- -
- -
- -
(2)
- (7
) -
Switc
hing
cha
rge
- -
- -
- -
- -
1 -
2
- -
- M
orta
lity c
harg
e 3
65
- 18
2 2
9 -
- 5
6 -
84
- 13
5 -
169
- Ri
der P
rem
ium
cha
rge
- -
4
- -
- 1
- -
- -
- 1
- Pa
rtial
with
draw
al c
harg
e -
- -
- -
- -
- -
- -
- -
- Su
m A
ssur
ed C
harg
e -
- -
- -
- -
- -
- -
- -
- Se
rvice
tax/
GST
659
3
2 10
4 5
6 -
- 2
78
- 2
28
- 7
8 -
120
- M
iscel
lane
ous
char
ge##
- -
- -
- -
- -
- -
- -
- -
Tota
l 2
,205
2
17
289
19
0 -
- 1,
669
- 1,
007
- 3
19
- 4
34
-
(` ‘0
00)
Parti
cula
rs
Prev
ious
Yea
r
HEA
LTH
CO
RPO
RATE
BO
ND
FUND
1
HEA
LTH
EN
ERG
Y FU
ND 1
HEA
LTH
EQ
UITY
FU
ND 1
HEA
LTH
EQ
UITY
FU
ND 2
HEA
LTH
GILT
FU
ND 1
HEA
LTH
G
ROW
TH
PLUS
FU
ND 1
HEA
LTH
INFR
ASTR
UCTU
RE
FUND
1
HEA
LTH
M
IDCA
P FU
ND 1
HEA
LTH
M
ONE
Y M
ARKE
T FU
ND 1
HEA
LTH
PU
RE
EQUI
TY
FUND
1
HEA
LTH
SU
PER
GRO
WTH
FU
ND 1
GRO
UP
BALA
NCED
FU
ND 1
GRO
UP
BALA
NCED
FU
ND 2
GRO
UP
BALA
NCED
FU
ND 3
**
SFIN
ULIF
0630
1/
02/0
8HCO
R BO
ND01
121
ULIF
0600
1/
02/0
8HEN
ER
GYF
0112
1
ULIF
0120
1/
02/0
8HEQ
U IT
YF01
121
ULIF
0541
1/
01/1
0HEQ
U IT
YF02
121
ULIF
0130
1/
02/0
8HG
ILT
FUN0
1121
ULIF
0140
1/
02/0
8HG
R W
TPLS
0112
1
ULIF
0610
1/
02/0
8HIN
F RA
ST01
121
ULIF
0620
1/
02/0
8HM
ID
CAPF
0112
1
ULIF
0150
1/
02/0
8HM
ON
MRK
T011
21
ULIF
0160
1/
02/0
8HPU
EQ
UTY0
1121
ULIF
0170
1/
02/0
8HSP
R G
RWT0
1121
ULG
F001
10/
10/0
3GBA
L AN
CE01
121
ULG
F002
10/
10/0
3GBA
LA
NCE0
2121
ULG
F017
18/
05/0
9GBA
L AN
CE03
121
Polic
y Adm
inist
ratio
n ch
arge
44
10
929
7
2 3
9 14
4 10
13
2
1 2
0 10
3 -
15
- Su
rrend
er c
harg
e -
- -
- -
- -
- -
- -
- -
- Sw
itchi
ng c
harg
e -
- -
- -
- -
- -
- -
- -
- M
orta
lity c
harg
e 10
3 2
4 2
,024
2
46
83
404
2
3 3
9 4
6 5
2 16
9 -
742
-
Ride
r Pre
miu
m c
harg
e -
0
- -
- -
- -
- -
- -
- -
Parti
al w
ithdr
awal
cha
rge
- -
- -
- -
- -
- -
- -
- -
Sum
Ass
ured
Cha
rge
- -
- -
- -
- -
- -
- -
- -
Serv
ice ta
x/GS
T 3
5 8
6
82
66
29
125
8
11
17
16
68
- 5
1 -
Misc
ella
neou
s ch
arge
## -
- -
- -
- -
- -
- -
- -
- To
tal
183
43
3,6
35
383
15
1 6
73
41
63
85
88
340
-
808
-

371
STRA
TEG
IC R
EPO
RT /
STA
TUTO
RY R
EPO
RTS
/ F
INA
NCI
ALS
STA
TEM
ENTS
(` ‘0
00)
Parti
cula
rs
Prev
ious
Yea
r
GRO
UP
BALA
NCED
FU
ND 4
GRO
UP
CAPI
TAL
SECU
RE
FUND
1
GRO
UP
CORP
ORAT
E BO
ND FU
ND
1**
GRO
UP
CORP
ORAT
E BO
ND FU
ND 2
GRO
UP
CORP
ORAT
E BO
ND FU
ND 3
GRO
UP
ENER
GY
FUND
1
GRO
UP
EQUI
TY
FUND
1**
GRO
UP
EQUI
TY
FUND
2**
GRO
UP
EQUI
TY
FUND
3
GRO
UP
EQUI
TY
FUND
4
GRO
UP G
ILT
FUND
1**
GRO
UP
GILT
FUN
D 2
GRO
UP
GRO
WTH
FU
ND 1
GRO
UP
INFR
ASTR
UCTU
RE
FUND
1
GRO
UP
MID
CAP
FUND
1
SFIN
ULG
F021
05/
06/1
3GBA
LA
NCE0
4121
ULG
F004
31/
01/0
7GCA
PI
SEC0
1121
ULG
F005
24/
10/0
7GCO
R BO
ND01
121
ULG
F012
13/
10/0
8GCO
RB
OND
0212
1
ULG
F023
05/
06/1
3GCO
R BO
ND03
121
ULG
F014
28/
11/0
8GEN
E RG
YF01
121
ULG
F007
24/
10/0
7GEQ
U IT
YF01
121
ULG
F013
28/
11/0
8GEQ
U IT
YF02
121
ULG
F018
08/
06/0
9GEQ
U IT
YF03
121
ULG
F022
05/
06/1
3GEQ
U IT
YF04
121
ULG
F008
24/
10/0
7GG
IL TF
UN01
121
ULG
F016
10/
12/0
8GG
ILT
FUN0
2121
ULG
F003
10/
10/0
3GG
RO
WTH
F011
21
ULG
F019
08/
06/0
9GIN
F RA
SF01
121
ULG
F020
08/
06/0
9GM
ID
CAPF
0112
1 Po
licy A
dmin
istra
tion
char
ge -
- -
18
- 2
-
- 5
2 -
- 2
-
6
6
Surre
nder
cha
rge
- -
- -
- -
- -
- -
- -
- -
- Sw
itchi
ng c
harg
e -
- -
- -
- -
- -
- -
- -
- -
Mor
tality
cha
rge
6,3
39
- -
578
5
,818
15
-
- 1,
014
1,16
2 -
1 -
25
9
Ride
r Pre
miu
m c
harg
e -
- -
- -
- -
- -
- -
- -
- -
Parti
al w
ithdr
awal
cha
rge
- -
- -
- -
- -
- -
- -
- -
- Su
m A
ssur
ed C
harg
e -
- -
- -
- -
- -
- -
- -
- -
Serv
ice ta
x/GS
T 1,
197
- -
110
1,33
7 3
-
- 12
3 2
80
- 1
- 5
3
M
iscel
lane
ous
char
ge##
- -
- -
- -
- -
- -
- -
- -
- To
tal
7,5
36
- -
706
7
,154
20
- -
1,18
8 1,
441
- 3
-
37
18
(` ‘0
00)
Parti
cula
rs
Prev
ious
Yea
r
GRO
UP M
ONE
Y M
ARKE
T FU
ND 1*
* G
ROUP
MO
NEY
MAR
KET
FUND
2
GRO
UP P
URE
DEBT
FU
ND 1*
* G
ROUP
PUR
E DE
BT
FUND
2**
G
ROUP
PUR
E EQ
UITY
FUN
D 1
PEN
SIO
N DI
SCO
NTIN
UED
POLIC
Y FU
ND
PEN
SIO
N SM
ART
FUND
1 M
AKE
IN IN
DIA
FUND
To
tal
SFIN
ULG
F006
24/
10/0
7GM
O
NMRK
T011
21
ULG
F009
30/
09/0
8GM
ON
MRK
T021
21
ULG
F010
30/
09/0
8GPU
R ED
EB01
121
ULG
F011
30/
09/0
8GPU
R DE
BT02
121
ULG
F015
28/
11/0
8GPU
R EE
QF0
1121
ULIF
0702
9/
08/1
3PDI
S PO
LF01
121
ULIF
0681
0/
09/1
2PSM
A RT
FU01
121
ULIF
0692
4/
03/1
5LM
AK
EIND
IA12
1 Po
licy A
dmin
istra
tion
char
ge -
2
- -
9
- 6
99
9,3
48
1,35
,310
Su
rrend
er c
harg
e -
- -
- -
- -
- 2
,954
Sw
itchi
ng c
harg
e -
- -
- -
- -
- 11
5 M
orta
lity c
harg
e -
2,8
46
- -
17
- 2
27
13,7
47
3,5
5,66
9 Ri
der P
rem
ium
cha
rge
- -
- -
- -
- -
26,
951
Parti
al w
ithdr
awal
cha
rge
- -
- -
- -
- -
33
Sum
Ass
ured
Cha
rge
- -
- -
- -
- -
- Se
rvice
tax/
GST
- 4
58
- -
4
- 2
,778
13
,428
1,
58,7
18
Misc
ella
neou
s ch
arge
## -
- -
- -
- 1,
544
974
2
4,75
0 To
tal
- 3
,306
-
- 3
1 -
5,2
48
37,
498
7,0
4,50
0

Annual Report 2018-19
372
Notes


Registered OfficeH Block, 1st Floor,Dhirubhai Ambani Knowledge City,Kopar Khairane, Navi Mumbai – 400 710
Corporate OfficeReliance Centre,5th floor, Off Western Express Highway, Santacruz East, Mumbai, Mumbai - City district, Maharashtra - 400 055Tel.: 022 33031000
www.reliancenipponlife.com