Encapsulation of emulsion droplets with metal ... - UQ eSpace
Upload
khangminh22Category
view
4download
0
�����������������
Citation: Jacob, L.I.; Pauer, W.
Scale-up of Emulsion Polymerisation
up to 100 L and with a Polymer
Content of up to 67 wt%, Monitored
by Photon Density Wave
Spectroscopy. Polymers 2022, 14, 1574.
https://doi.org/10.3390/
polym14081574
Academic Editor: Ahmed I. A.
Abd El-Mageed
Received: 31 January 2022
Accepted: 7 April 2022
Published: 12 April 2022
Publisher’s Note: MDPI stays neutral
with regard to jurisdictional claims in
published maps and institutional affil-
iations.
Copyright: © 2022 by the authors.
Licensee MDPI, Basel, Switzerland.
This article is an open access article
distributed under the terms and
conditions of the Creative Commons
Attribution (CC BY) license (https://
creativecommons.org/licenses/by/
4.0/).
polymers
Article
Scale-up of Emulsion Polymerisation up to 100 L and with aPolymer Content of up to 67 wt%, Monitored by Photon DensityWave SpectroscopyLaurence Isabelle Jacob and Werner Pauer *
Institute for Technical and Macromolecular Chemistry, University of Hamburg, Bundesstraße 45,20146 Hamburg, Germany; [email protected]* Correspondence: [email protected]
Abstract: The scale-up process of the high solid content (up to 67 wt%) emulsion polymerisationof vinyl acetate and Versa®10 from 1 L over 10 L to 100 L was investigated. An emulsion copoly-merisation of vinyl acetate and neodecanoic acid vinyl ester in a molar ratio of 9:1 was carried outin a starved-fed semi-batch operation. As a radical source, a redox initiator system consisting ofL-ascorbic acid, tert-butyl hydroperoxide and ammonium iron (III) sulphate was used. The processparameters, such as the required stirring speed and heat dissipation, were determined and adjustedbeforehand via reaction calorimetry to ensure a successful scale-up without safety issues. In addition,the emulsion polymerisation was monitored inline by Raman (qualitative monomer accumulation),as well as Photon Density Wave spectroscopy (particle size and scattering coefficient) and temper-ature measurements. The data provided by Raman spectroscopy and temperature measurementsrevealed mixing difficulties due to an insufficient stirring rate, while the inline measurement withPhoton Density Wave spectroscopy offered an insight into the development of the product properties.It proved to be reliable and precise throughout the entire scale-up process, especially compared toconventional offline methods, such as dynamic light scattering or sedimentation analysis by meansof a disc centrifuge, both of which encountered issues when using higher polymer contents.
Keywords: scale up; inline analytics; photon density wave spectroscopy; emulsion polymerisation;mean particle size
1. Introduction
Emulsion polymerisation is the most commonly used process for the production ofwater-borne latex polymers, and its importance in the industry keeps growing. It is afree radical polymerisation method carried out in a heterogenous reaction system, andcommercially available polymer latex products usually contain around 40–55 wt% of solidcontent [1].
Before a polymer latex can be transferred from a laboratory scale into production, theprocess needs to be thoroughly examined, for example, regarding reproducibility or heattransfer, and then successfully scaled up to a larger set-up. The following work focuses onthe scale-up process of the emulsion polymerisation of vinyl acetate and Versa®10 froma 1 L scale to a 10 L and 100 L scale while achieving a high solid content of over 60 wt%.Moreover, this article examines the possibility of monitoring the scale-up process by usingan inline method to measure the particle size.
A commonly used monomer in emulsion polymerisation is vinyl acetate, which isnot only relevant in the industry but has also proved to be interesting for researchers [2].Emulsion polymerisation of vinyl acetate and Versa®10 with a high solid content of over60 wt% was successfully performed in the past and showed an excellent agreement betweenoffline and inline particle size measurement methods up to a solid content of 36 wt% [3].However, agglomeration of particles at polymer content of 40–50 wt% created difficulties
Polymers 2022, 14, 1574. https://doi.org/10.3390/polym14081574 https://www.mdpi.com/journal/polymers

Polymers 2022, 14, 1574 2 of 14
for further comparisons, which made a revision of the recipe necessary before consideringupscaling. Pohn et al. developed a CFD model to simulate an upscaling from 1 L to 100 Land found it challenging to describe an emulsion polymerisation process in a 100 L stirredvessel with a turbine stirrer, leading to a laminar regime. They also came across the sameissues regarding coagulation, resulting in a secondary population of larger particles [1].To avoid encountering the same difficulties, this work focused on improving the recipeon the one hand and modifying the set-up on the other hand. As a laminar regime doesnot seem suitable for the upscaling of emulsion polymerisation at high polymer contents,the process described in this work shows a set-up involving an anchor stirrer, instead of aturbine stirrer, leading to a turbulent regime.
1.1. Scale-Up
The scale-up process remains one of the major challenges of chemical engineering.It allows the building of a bridge between an innovation that occurred on a laboratory scaleand an actual invention that works in an industrial environment. Upscaling a process canoften reveal difficulties that were not detected on a smaller scale. Building a pilot plant is,therefore, a crucial step before transferring a new product into production. However, dueto the numerous factors that can influence the product properties and process development,there is no standard recipe for a scale-up process, and success often lies in the hands ofexperience, successful ideas, and many mistakes, which in the end, can lead to the desiredoutcome [4,5]. Nonetheless, guidelines exist that are designed to offer a starting pointin the planning of such a project. Firstly, it is recommended to avoid cross-influences bykeeping the set-up as identical as possible regarding the measurements of the reactor, thedosing units, dosing time, or molar ratio of the components. The size and width of thestirrer, as well as its speed, are also important factors of a scale-up. Modifying the flowor mixing characteristics can have a huge impact on the success of the polymerisationprocess. Besides these aspects, there is a list of rules commonly used and accepted that canbe considered for the scale-up process [6]. The first one involves maintaining a constantstirring speed, regardless of the reactor size. This can, however, result in unobtainablepower input and is therefore not adapted to all kinds of upscaling processes. The secondand third rules indirectly apply to the size of the reactor, as they involve keeping either thestirring tip speed, which considers the size of the stirrer, or the circulation time constant,which depends on the diameter of the vessel. Another approach to the upscaling processinvolves keeping the Reynolds number constant. The Reynolds number is defined as acorrelation between the density of the liquid, the viscosity, the stirring rate, and the diameterof the stirrer and is an important and dimensionless quantity used in fluid mechanics.It contributes to the description of the mixing quality and constitutes the main parameter ofthe scale-up process described in this work, as a turbulent regime was considered necessary.According to the fluid mechanics and when using an anchor stirrer, a turbulent regime isachieved when the Reynolds number of the stirring is higher than 10,000 [7]. Further rules,which can be applied when planning a scale-up process, are keeping the power inputconstant, or controlling the mean energy dissipation. Each of these rules aims at keepinga constant similarity of the process, regardless of the final scale. Past experience andpublished articles suggest employing a certain rule, depending on the requirements [8–10].For example, according to Zhou and Kresta [11,12], for liquid–liquid dispersions, bothenergy dissipation and flow are the most important characteristics. Nonetheless, everyoneagrees that a recipe that works for all processes does not exist.
1.2. Inline Monitoring
The successful upscaling of a process is not limited to the size of the set-up alone butalso includes maintaining the desired product properties. This is why a thorough analysisof the dispersion during the scale-up process is crucial. Among other properties, the latexparticle size and its distribution, for example, have an influence on the surface propertiesof the dried polymer film or, alternatively, can provide information about the kinetics of

Polymers 2022, 14, 1574 3 of 14
the reaction as well as the number of radicals per particle [13,14]. To obtain knowledge andcontrol of the particle size, it is essential to use the right analytical methods [15,16]. The mostcommon methods for particle size measurements are offline analysis, for example, dynamiclight scattering (DLS) or disc centrifuge (DC). Offline analysis has many disadvantages,which can be traced back to the sampling and sample preparation, as most methods excludehigh solid contents. However, a promising inline measurement method has gained interestin recent years, as it is able to monitor the particle size and scattering coefficient duringthe emulsion polymerisation process [17–22]. Photon density wave (PDW) spectroscopyhas already been established in the fields of biochemistry and food chemistry but haslately proven to be a useful tool in the process control of emulsion polymerisation [3,23].Studies on a laboratory scale showed a successful comparison of particle size measurementsbetween PDW spectroscopy and common offline measurements methods, such as DLS [24]and sedimentation analysis by means of a DC [3]. Furthermore, Schlappa et al. [23] showedthat the inline measurement of the reduced scattering coefficient could be useful for thereal-time detection of modifications occurring in the process. For example, gelation couldbe recognised instantly, and appropriate countermeasures could be initiated immediatelyin order to save the product. This could also prove to be useful for a scale-up process.
PDW spectroscopy is an inline Process Analysis Technology (PAT) that can be used tomonitor the reaction progress by measuring the optical properties of the dispersion, i.e., theabsorption coefficient and the reduced scattering coefficient [17–20,22]. The measurementmethod uses the correlation between the reduced scattering coefficient and the particle sizeto determine the latter in real time in the dispersion by measuring the reduced scatteringcoefficient [22,25–28].
2. Materials and Methods
All chemicals were used directly without further purification. Each component ofthe reaction was flushed with nitrogen for at least 40 min, and the nitrogen flow insidethe reactor was maintained during the whole process. The gas flow was fed into thereactor through a metal pipe with a diameter of 3 mm that was immersed into the initialcharge. The amount of water evacuated by the continuous nitrogen flow was not takeninto account for the 1 L process, as it was determined to be less than 1%. However, theamount of water evacuated during the 10 L and 100 L processes was calculated theoreticallyand confirmed by test runs. The amount of water lost at the end of the reaction wasconsidered when determining the amount of monomer needed to achieve the desiredpolymer content. The latter was also confirmed via solid content determination (seemethod descriptions below).
For safety reasons, the first emulsion polymerisations were performed in a 1.8 L RC1ereaction calorimeter (Mettler Toledo) with a double jacket steel reactor (HP60, MettlerToledo) to determine the heat generation during the process. The vessel had a diameter of10.3 cm and was sealed with a non-heated steel lid. An anchor stirrer with a span of 9 cmwas used to stir the dispersion.
The scale-up emulsion polymerisations were carried out in three different reactors of,respectively, 1 L, 10 L, and 100 L. The 1 L reactor was a double-jacket glass vessel, whereasthe 10 L and 100 L reactors were double-jacket reactors made of steel. Each reactor hada dish-like bottom with the sample outlet in the middle. For the sake of comparability,all three set-ups were kept as identical as possible. In scale-up processes, it is commonto keep a constant height to diameter ratio. The three reactors used for the experimentsdescribed in this work were not customised and therefore cannot fully meet this criterion.However, while H usually refers to the total height of the vessel, when considering thefilling height at the beginning of the reaction, the H1/D (cf. Figure 1 and Table 1) ratiois 0.25 in all three reactor sizes. The exact measurements are summarised in Table 1 andrepresented in Figure 1 for a better understanding.

Polymers 2022, 14, 1574 4 of 14
Figure 1. Schematic representation of the experimental set-up.
Table 1. Overview of the measurements of the experimental set-up of all three reactor sizes, repre-sented in Figure 1.
(In cm) 1 L 10 L 100 L
H 20.5 27 60H1 3 6 12h 1 1.5 5D 12 24 48d 10.4 20.8 41.6
In order to achieve a better mixing of the components at all stages of the reaction,a stainless-steel anchor stirrer was used in combination with two baffles [29]. To avoidforming a water swirl at the beginning of the reaction, when only water and emulsifierwere present, baffles were inserted into the reactor to interrupt the flow and to enable abetter mixing of the components. The width of the baffles amounted to 1/12 of the reactordiameter and they were placed at a distance of 1/72 from the tank wall [30,31]. The anchorstirrer had a width of 0.87.D of the respective vessel, and 0.95.D when deducting thebaffles [32,33]. The stirring rate is summarised in Table 2 and determined by the Reynoldsnumber (cf. Table 3).
Table 2. Overview of the stirring rates during the emulsion polymerisation in all three reactor sizes.
(In rpm) 1 L 10 L 100 L
Stirrer Rate(beginning) 300 75 60
Stirrer Rate(as of 30 wt%) 400 120 60
Stirrer Rate(as of 45 wt%) 500 240 90
The emulsion polymerisations were carried out as a semi-batch, closed-loop, controlledand starved–fed process at 1 bar. The initial charge contained demineralised water with aconductivity of 0.8 uS.cm−1 (see Table 4 for exact amount), 0.20 g.L−1 ammonium iron (III)
Polymers 2022, 14, 1574 5 of 14
sulphate (Merck KGaA) as a catalyst, and 50.4 g.L−1 Mowiol 4–88 (Sigma-Aldrich, St. Louis,MO, USA) as an emulsifier, resulting in a final emulsifier fraction of 2.44 wt% based on thetotal amount of monomer.
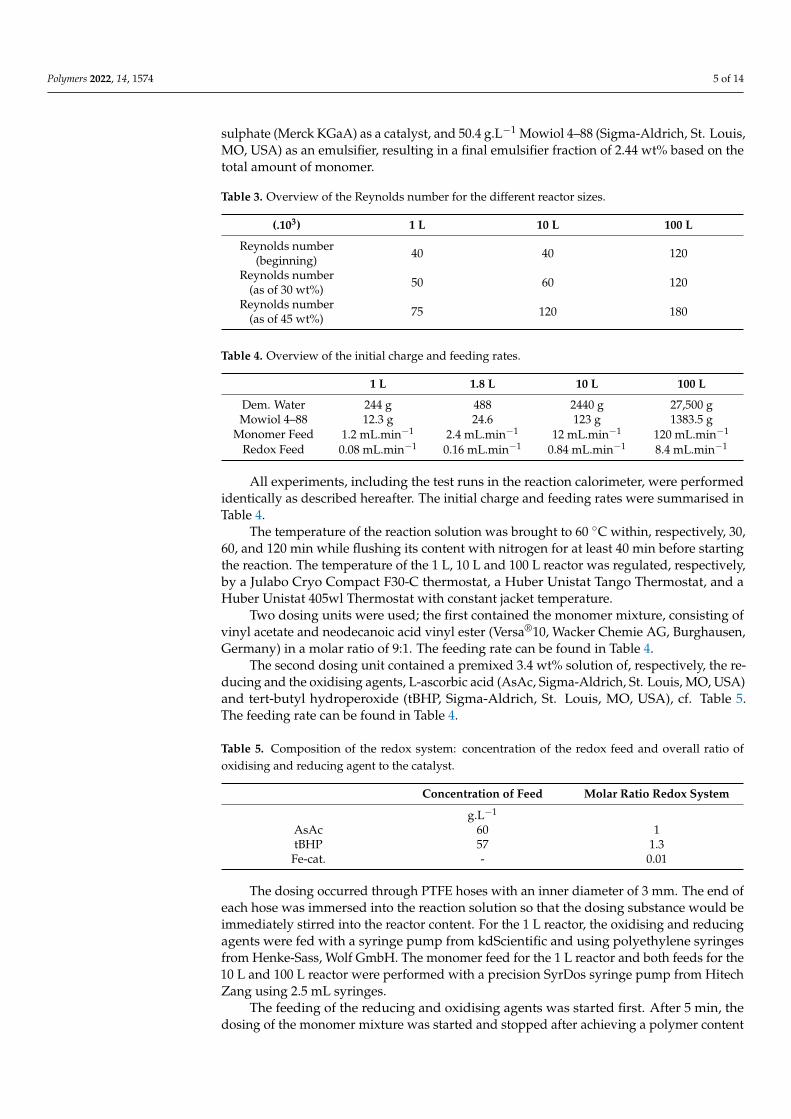
Table 3. Overview of the Reynolds number for the different reactor sizes.
(.103) 1 L 10 L 100 L
Reynolds number(beginning) 40 40 120
Reynolds number(as of 30 wt%) 50 60 120
Reynolds number(as of 45 wt%) 75 120 180
Table 4. Overview of the initial charge and feeding rates.
1 L 1.8 L 10 L 100 L
Dem. Water 244 g 488 2440 g 27,500 gMowiol 4–88 12.3 g 24.6 123 g 1383.5 g
Monomer Feed 1.2 mL.min−1 2.4 mL.min−1 12 mL.min−1 120 mL.min−1
Redox Feed 0.08 mL.min−1 0.16 mL.min−1 0.84 mL.min−1 8.4 mL.min−1
All experiments, including the test runs in the reaction calorimeter, were performedidentically as described hereafter. The initial charge and feeding rates were summarised inTable 4.
The temperature of the reaction solution was brought to 60 ◦C within, respectively, 30,60, and 120 min while flushing its content with nitrogen for at least 40 min before startingthe reaction. The temperature of the 1 L, 10 L and 100 L reactor was regulated, respectively,by a Julabo Cryo Compact F30-C thermostat, a Huber Unistat Tango Thermostat, and aHuber Unistat 405wl Thermostat with constant jacket temperature.
Two dosing units were used; the first contained the monomer mixture, consisting ofvinyl acetate and neodecanoic acid vinyl ester (Versa®10, Wacker Chemie AG, Burghausen,Germany) in a molar ratio of 9:1. The feeding rate can be found in Table 4.
The second dosing unit contained a premixed 3.4 wt% solution of, respectively, the re-ducing and the oxidising agents, L-ascorbic acid (AsAc, Sigma-Aldrich, St. Louis, MO, USA)and tert-butyl hydroperoxide (tBHP, Sigma-Aldrich, St. Louis, MO, USA), cf. Table 5.The feeding rate can be found in Table 4.
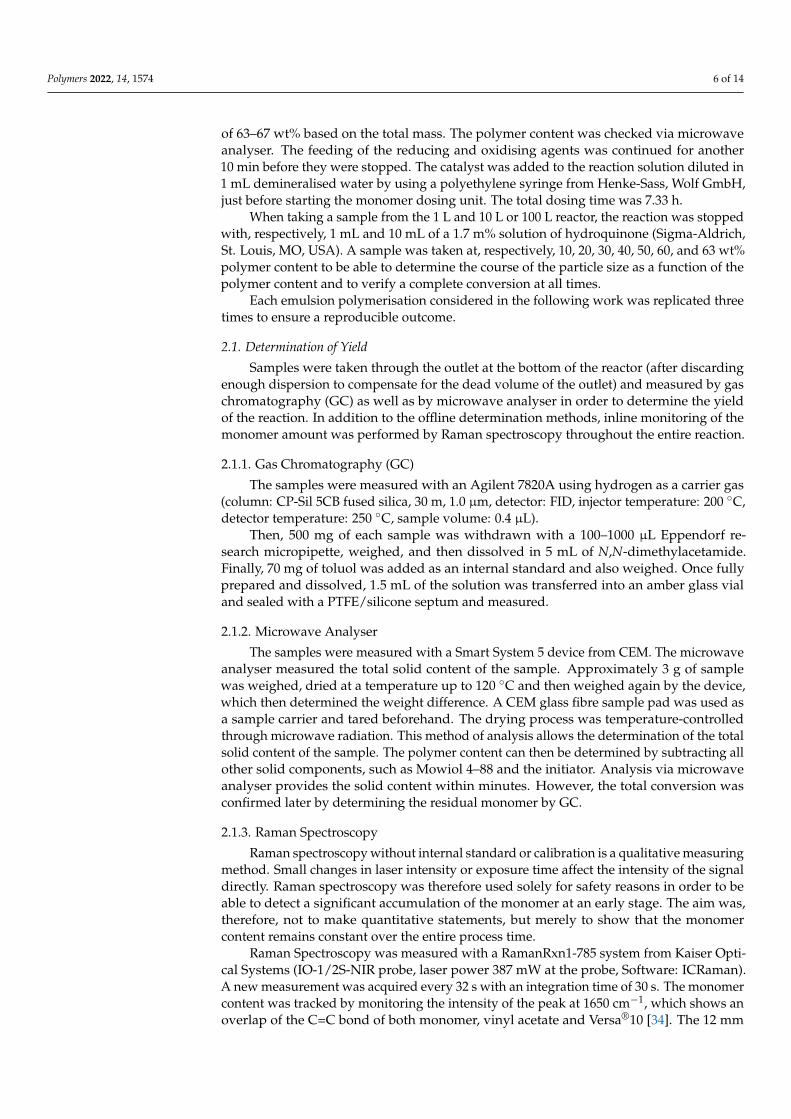
Table 5. Composition of the redox system: concentration of the redox feed and overall ratio ofoxidising and reducing agent to the catalyst.
Concentration of Feed Molar Ratio Redox System
g.L−1
AsAc 60 1tBHP 57 1.3
Fe-cat. - 0.01
The dosing occurred through PTFE hoses with an inner diameter of 3 mm. The end ofeach hose was immersed into the reaction solution so that the dosing substance would beimmediately stirred into the reactor content. For the 1 L reactor, the oxidising and reducingagents were fed with a syringe pump from kdScientific and using polyethylene syringesfrom Henke-Sass, Wolf GmbH. The monomer feed for the 1 L reactor and both feeds for the10 L and 100 L reactor were performed with a precision SyrDos syringe pump from HitechZang using 2.5 mL syringes.
The feeding of the reducing and oxidising agents was started first. After 5 min, thedosing of the monomer mixture was started and stopped after achieving a polymer content
Polymers 2022, 14, 1574 6 of 14
of 63–67 wt% based on the total mass. The polymer content was checked via microwaveanalyser. The feeding of the reducing and oxidising agents was continued for another10 min before they were stopped. The catalyst was added to the reaction solution diluted in1 mL demineralised water by using a polyethylene syringe from Henke-Sass, Wolf GmbH,just before starting the monomer dosing unit. The total dosing time was 7.33 h.
When taking a sample from the 1 L and 10 L or 100 L reactor, the reaction was stoppedwith, respectively, 1 mL and 10 mL of a 1.7 m% solution of hydroquinone (Sigma-Aldrich,St. Louis, MO, USA). A sample was taken at, respectively, 10, 20, 30, 40, 50, 60, and 63 wt%polymer content to be able to determine the course of the particle size as a function of thepolymer content and to verify a complete conversion at all times.
Each emulsion polymerisation considered in the following work was replicated threetimes to ensure a reproducible outcome.
2.1. Determination of Yield
Samples were taken through the outlet at the bottom of the reactor (after discardingenough dispersion to compensate for the dead volume of the outlet) and measured by gaschromatography (GC) as well as by microwave analyser in order to determine the yieldof the reaction. In addition to the offline determination methods, inline monitoring of themonomer amount was performed by Raman spectroscopy throughout the entire reaction.
2.1.1. Gas Chromatography (GC)
The samples were measured with an Agilent 7820A using hydrogen as a carrier gas(column: CP-Sil 5CB fused silica, 30 m, 1.0 µm, detector: FID, injector temperature: 200 ◦C,detector temperature: 250 ◦C, sample volume: 0.4 µL).
Then, 500 mg of each sample was withdrawn with a 100–1000 µL Eppendorf re-search micropipette, weighed, and then dissolved in 5 mL of N,N-dimethylacetamide.Finally, 70 mg of toluol was added as an internal standard and also weighed. Once fullyprepared and dissolved, 1.5 mL of the solution was transferred into an amber glass vialand sealed with a PTFE/silicone septum and measured.
2.1.2. Microwave Analyser
The samples were measured with a Smart System 5 device from CEM. The microwaveanalyser measured the total solid content of the sample. Approximately 3 g of samplewas weighed, dried at a temperature up to 120 ◦C and then weighed again by the device,which then determined the weight difference. A CEM glass fibre sample pad was used asa sample carrier and tared beforehand. The drying process was temperature-controlledthrough microwave radiation. This method of analysis allows the determination of the totalsolid content of the sample. The polymer content can then be determined by subtracting allother solid components, such as Mowiol 4–88 and the initiator. Analysis via microwaveanalyser provides the solid content within minutes. However, the total conversion wasconfirmed later by determining the residual monomer by GC.
2.1.3. Raman Spectroscopy
Raman spectroscopy without internal standard or calibration is a qualitative measuringmethod. Small changes in laser intensity or exposure time affect the intensity of the signaldirectly. Raman spectroscopy was therefore used solely for safety reasons in order to beable to detect a significant accumulation of the monomer at an early stage. The aim was,therefore, not to make quantitative statements, but merely to show that the monomercontent remains constant over the entire process time.
Raman Spectroscopy was measured with a RamanRxn1-785 system from Kaiser Opti-cal Systems (IO-1/2S-NIR probe, laser power 387 mW at the probe, Software: ICRaman).A new measurement was acquired every 32 s with an integration time of 30 s. The monomercontent was tracked by monitoring the intensity of the peak at 1650 cm−1, which shows anoverlap of the C=C bond of both monomer, vinyl acetate and Versa®10 [34]. The 12 mm

Polymers 2022, 14, 1574 7 of 14
probe was immersed into the initial charge at the opposite side of the PDW spectroscopyprobe to avoid light interferences.
2.2. Inline Particle Size Measurement
PDW spectroscopy measurements were carried out inline, immersing the stainless-steel probe (2.5 cm diameter) directly into the reaction solution during the process. The probewas passed vertically into the vessel and maintained at equal distance between the stirrerand the wall of the reactor. The probe was far enough within the vessel for the optical fibresto protrude approximately 0.5 cm into the initial charge.
Three different wavelengths were used: 638 nm, 778 nm, and 855 nm. The device usedwas a Mini-PDW-spectrometer from the company PDW Analytics GmbH in collaborationwith InnoFSPEC of the University of Potsdam. The measurements were processed withsoftware based on Labview 2016. The refractive index and density of the copolymer weredetermined in a previous work and were implemented in the software [3].
2.3. Offline Determination of the Mean Particle Size
In addition to the inline measurement via PDW spectroscopy, the mean particle sizewas also determined by sedimentation analysis by means of DC and DLS. The refrac-tive index and density of the copolymer were also implemented in the software of bothmeasurement methods [3].
2.3.1. Disc Centrifuge (DC)
Measuring the particle size by sedimentation analysis requires a gradient, which iswhy 0.2 mL of methanol was injected into the DC while at a halt. Then, the motor wasstarted, and when reaching the maximum speed, 15 g of demineralised water was addedsteadily. One drop of the sample was diluted in 0.3 mL demineralised water and 0.1 mLmethanol, and then 0.1 mL of the diluted sample was injected into the DC. The device usedwas a Disc Centrifuge DC24000 of the brand CPS. The given accuracy and repeatability lieat ±0.5% [35].
2.3.2. Dynamic Light Scattering (DLS)
The mean particle size was also determined by dynamic light scattering using a Zeta-sizer Nano ZS from Malvern Instruments. One drop of the same sample, used previously,was diluted in 5 mL demineralised water and then measured in a polyethylene UV-cuvette.Each given particle size was obtained through a triple determination, each consisting of18 measurements at 25 ◦C. A previous work provided a calibration of the device, whichwas used to correct the DLS measurements [3].
2.4. Determination of the Zeta Potential
The zeta potential was determined by a Zetasizer Ultra from Malvern Panalytical andusing the ZS XPLORER software. The sample was diluted 200 times with MilliQ water(0.055 µS.cm−1 at 25 ◦C) and then measured in a disposable folded capillary cell (DTS1070)at 25 ◦C.
2.5. Determination of the Theoretical Particle Size
The determination of the theoretical particle size was based on the previously cal-culated number of particles. The number of particles (Np) was calculated based on theconversion and on the average particle size (dp) of the first sample with 10 wt% polymercontent, measured by DC, as this was considered the reference measurement. The followingequation was used:
Np =3 × χ × gMonomer
4 × π × ρ × (dp2 )
3 × 10²¹

Polymers 2022, 14, 1574 8 of 14
where χ is the monomer conversion determined by GC, gMonomer is the amount of monomerdosed into the dispersion at the time of the sampling (g), ρ is the density of the copolymer(g.cm−3) [36], and dp is the particle size (nm) measured by DC.
It was assumed that the number of particles would stay constant throughout thereaction. The theoretical size of the other samples was then calculated accordingly.
3. Results and Discussion3.1. Process Optimisation
The scale-up started with an optimisation of the process. As explained before in theprevious chapter, all three reactors were kept as identical as possible in order to reducepossible cross-influences. In the past, Jacob et al. [3] published an emulsion polymerisa-tion process that achieved a high polymer content of over 60 wt% in a 1 L glass reactor.However, the process revealed many complications, starting with the draining of the re-actor and progressing to the forming of agglomeration as 40–50 wt% polymer content.This process worked at the time and formed a premise for the possibility of using PDWspectroscopy for industrial applications [20]. However, the process needed to be adjustedand optimised in order to establish whether upscaling could be accomplished withoutencountering safety issues due to heat generation. The new process, as described in theprevious chapter, was therefore first carried out in an RC1 steel calorimeter to determinethe heat generation during the process.
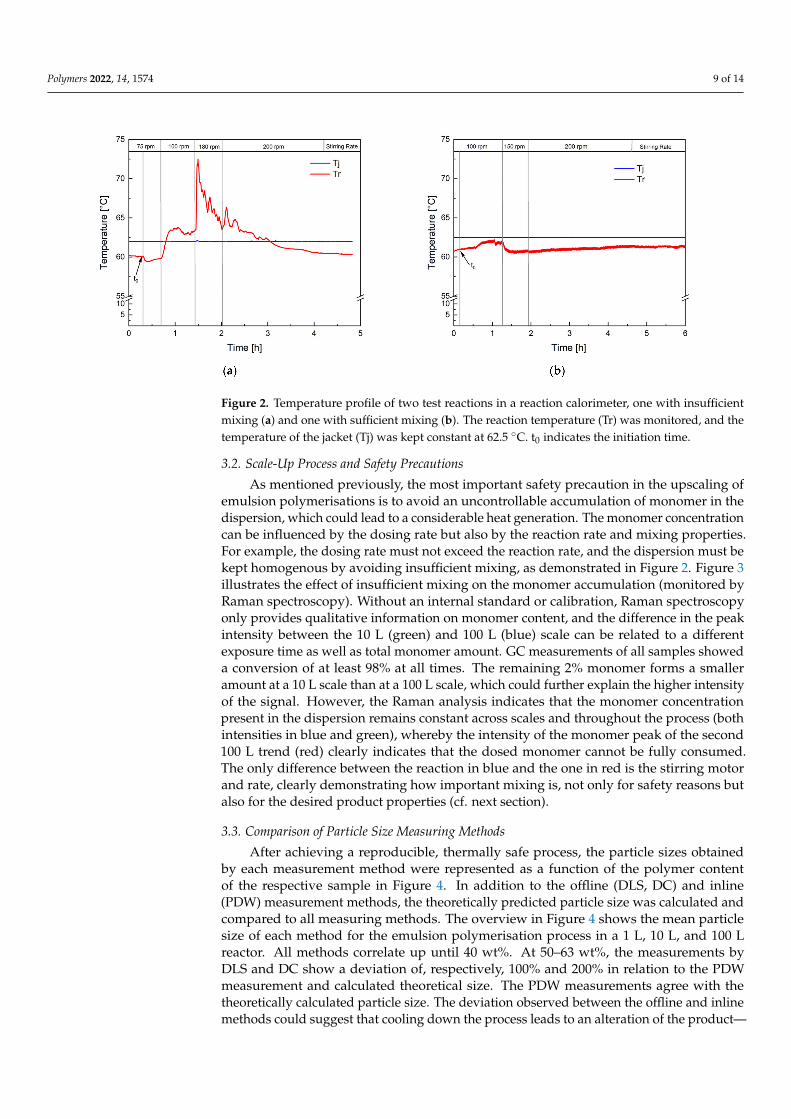
Figure 2 shows the temperature profile of two polymerisation processes performed inan RC1 reaction calorimeter. The jacket temperature (Tj) was kept constant at 62.5 ◦C so thatthe reaction was performed in isoperibolic reaction control. Figure 2a clearly demonstratesthe consequence of insufficient mixing: Tr increases by 10 ◦C after increasing the stirringrate from 75 to 100 rpm, indicating an accumulation of monomer now being consumed.Keeping the stirring rate constant throughout the entire process is therefore inadequate,and the stirring rate needs to be adjusted to the rising polymer content and viscosity of thedispersion. The temperature profile of the revised process (Figure 2b) showed that whenchoosing the right stirring rate, the constant jacket temperature supplies sufficient coolingto keep the reaction temperature in a constant, controllable range. Indeed, the calorimetricstudy showed a heat generation of 650 kJ and an increase in the reaction temperature(Tr) of a maximum of 2 ◦C at a constant jacket temperature. Considering a conversionof the monomer of 98%, which was confirmed via GC and microwave analysis, a heatgeneration of 920 kJ would have been expected (heat of polymerisation of vinyl acetate:−1036 J.g−1) [37]. This difference could be due to the fact that the dosing tanks were notheated, so the entire dosing volume was at room temperature when being transported intothe reactor. Considering that over 60% of the final charge was dosed during the process,this leads to a significant cooling, which is not considered by the calorimetric measurementand heat-generation calculation. However, this additional cooling facilitated the controlover the reaction temperature, even more at greater reaction volumes, such as 100 L, andwas therefore maintained. Moreover, 4.18 kJ is required to heat up 1 kg of water by 1 ◦C.Considering that Tr increased by a maximum of 2 ◦C, good control over the polymerisationheat can be concluded, and no risk of a dangerous increase in the reaction temperature wasto be expected during the scale-up process. The calorimetric study, therefore, showed thatthe optimised process could be carried out safely; even in the case of a temporary stirringor cooling failure, only the dosing needs to be interrupted until the problem is solved.
Additional inline monitoring of the monomer via Raman spectroscopy offered thepossibility of identifying resulting problems in the process, enabling a quick interventionto avoid problematic heat generation (cf. exemplary Raman trend, see SupplementaryMaterials Figure S1).
As a result of the preliminary test runs, it was possible to safely adjust the process tothe three reactor sizes of 1 L, 10 L, and 100 L, as described before in Tables 2 and 4.
Polymers 2022, 14, 1574 9 of 14
Figure 2. Temperature profile of two test reactions in a reaction calorimeter, one with insufficientmixing (a) and one with sufficient mixing (b). The reaction temperature (Tr) was monitored, and thetemperature of the jacket (Tj) was kept constant at 62.5 ◦C. t0 indicates the initiation time.
3.2. Scale-Up Process and Safety Precautions
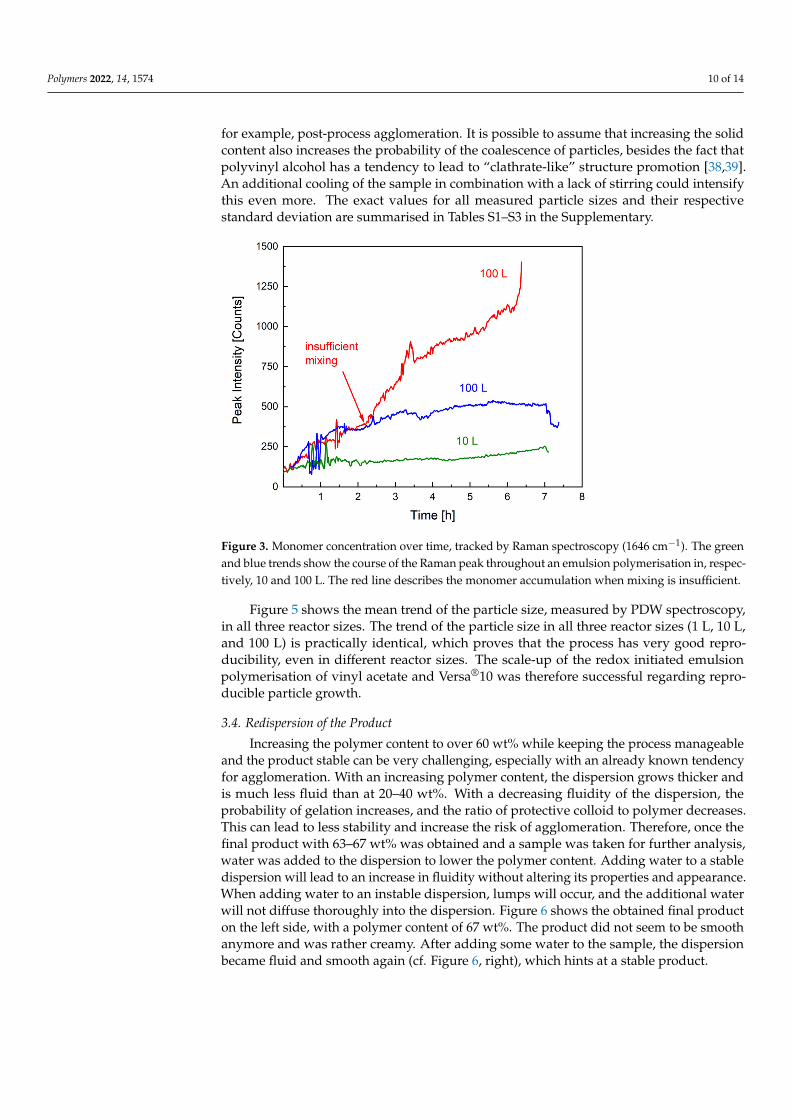
As mentioned previously, the most important safety precaution in the upscaling ofemulsion polymerisations is to avoid an uncontrollable accumulation of monomer in thedispersion, which could lead to a considerable heat generation. The monomer concentrationcan be influenced by the dosing rate but also by the reaction rate and mixing properties.For example, the dosing rate must not exceed the reaction rate, and the dispersion must bekept homogenous by avoiding insufficient mixing, as demonstrated in Figure 2. Figure 3illustrates the effect of insufficient mixing on the monomer accumulation (monitored byRaman spectroscopy). Without an internal standard or calibration, Raman spectroscopyonly provides qualitative information on monomer content, and the difference in the peakintensity between the 10 L (green) and 100 L (blue) scale can be related to a differentexposure time as well as total monomer amount. GC measurements of all samples showeda conversion of at least 98% at all times. The remaining 2% monomer forms a smalleramount at a 10 L scale than at a 100 L scale, which could further explain the higher intensityof the signal. However, the Raman analysis indicates that the monomer concentrationpresent in the dispersion remains constant across scales and throughout the process (bothintensities in blue and green), whereby the intensity of the monomer peak of the second100 L trend (red) clearly indicates that the dosed monomer cannot be fully consumed.The only difference between the reaction in blue and the one in red is the stirring motorand rate, clearly demonstrating how important mixing is, not only for safety reasons butalso for the desired product properties (cf. next section).
3.3. Comparison of Particle Size Measuring Methods
After achieving a reproducible, thermally safe process, the particle sizes obtainedby each measurement method were represented as a function of the polymer contentof the respective sample in Figure 4. In addition to the offline (DLS, DC) and inline(PDW) measurement methods, the theoretically predicted particle size was calculated andcompared to all measuring methods. The overview in Figure 4 shows the mean particlesize of each method for the emulsion polymerisation process in a 1 L, 10 L, and 100 Lreactor. All methods correlate up until 40 wt%. At 50–63 wt%, the measurements byDLS and DC show a deviation of, respectively, 100% and 200% in relation to the PDWmeasurement and calculated theoretical size. The PDW measurements agree with thetheoretically calculated particle size. The deviation observed between the offline and inlinemethods could suggest that cooling down the process leads to an alteration of the product—
Polymers 2022, 14, 1574 10 of 14
for example, post-process agglomeration. It is possible to assume that increasing the solidcontent also increases the probability of the coalescence of particles, besides the fact thatpolyvinyl alcohol has a tendency to lead to “clathrate-like” structure promotion [38,39].An additional cooling of the sample in combination with a lack of stirring could intensifythis even more. The exact values for all measured particle sizes and their respectivestandard deviation are summarised in Tables S1–S3 in the Supplementary.
Figure 3. Monomer concentration over time, tracked by Raman spectroscopy (1646 cm−1). The greenand blue trends show the course of the Raman peak throughout an emulsion polymerisation in, respec-tively, 10 and 100 L. The red line describes the monomer accumulation when mixing is insufficient.
Figure 5 shows the mean trend of the particle size, measured by PDW spectroscopy,in all three reactor sizes. The trend of the particle size in all three reactor sizes (1 L, 10 L,and 100 L) is practically identical, which proves that the process has very good repro-ducibility, even in different reactor sizes. The scale-up of the redox initiated emulsionpolymerisation of vinyl acetate and Versa®10 was therefore successful regarding repro-ducible particle growth.
3.4. Redispersion of the Product
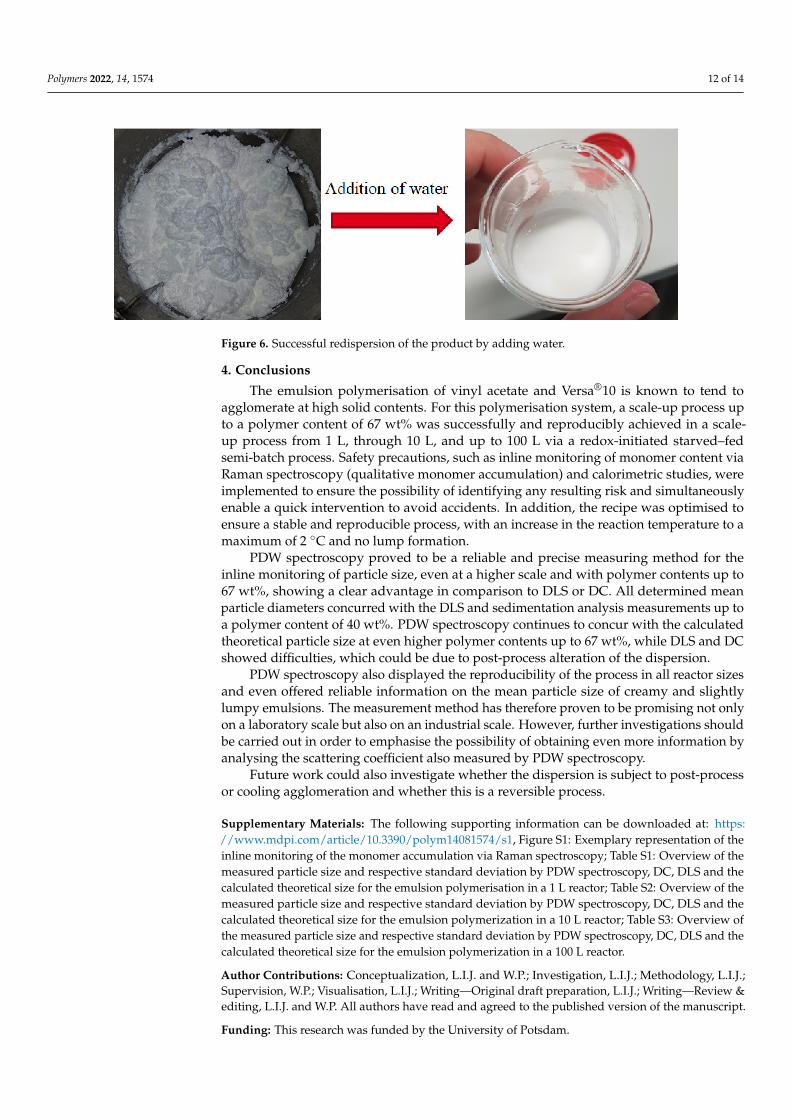
Increasing the polymer content to over 60 wt% while keeping the process manageableand the product stable can be very challenging, especially with an already known tendencyfor agglomeration. With an increasing polymer content, the dispersion grows thicker andis much less fluid than at 20–40 wt%. With a decreasing fluidity of the dispersion, theprobability of gelation increases, and the ratio of protective colloid to polymer decreases.This can lead to less stability and increase the risk of agglomeration. Therefore, once thefinal product with 63–67 wt% was obtained and a sample was taken for further analysis,water was added to the dispersion to lower the polymer content. Adding water to a stabledispersion will lead to an increase in fluidity without altering its properties and appearance.When adding water to an instable dispersion, lumps will occur, and the additional waterwill not diffuse thoroughly into the dispersion. Figure 6 shows the obtained final producton the left side, with a polymer content of 67 wt%. The product did not seem to be smoothanymore and was rather creamy. After adding some water to the sample, the dispersionbecame fluid and smooth again (cf. Figure 6, right), which hints at a stable product.

Polymers 2022, 14, 1574 11 of 14
Figure 4. Overview of the measured mean particles size of all three measurements methods and thecalculated theoretical size as a function of the polymer fraction with the respective standard deviationfor the emulsion polymerisation in a 1 L (a), 10 L (b), and 100 L (c) reactor.
Figure 5. Representation of the particle size as a function of the reaction time in all three reactor sizes:1 L (green), 10 L (red), and 100 L (blue). The standard deviation of each measurement is shown in therespective colour.
Particle size measurement via DLS of the dispersed sample showed no change com-pared to before, and the measured zeta potential of −12 mV was comparable to a com-mercially available Vinnapas® dispersion of polyvinyl acetate. Considering the com-monly known tendency of polyvinyl acetate to agglomerate, this can be considered to be astable dispersion.
Polymers 2022, 14, 1574 12 of 14
Figure 6. Successful redispersion of the product by adding water.
4. Conclusions
The emulsion polymerisation of vinyl acetate and Versa®10 is known to tend toagglomerate at high solid contents. For this polymerisation system, a scale-up process upto a polymer content of 67 wt% was successfully and reproducibly achieved in a scale-up process from 1 L, through 10 L, and up to 100 L via a redox-initiated starved–fedsemi-batch process. Safety precautions, such as inline monitoring of monomer content viaRaman spectroscopy (qualitative monomer accumulation) and calorimetric studies, wereimplemented to ensure the possibility of identifying any resulting risk and simultaneouslyenable a quick intervention to avoid accidents. In addition, the recipe was optimised toensure a stable and reproducible process, with an increase in the reaction temperature to amaximum of 2 ◦C and no lump formation.
PDW spectroscopy proved to be a reliable and precise measuring method for theinline monitoring of particle size, even at a higher scale and with polymer contents up to67 wt%, showing a clear advantage in comparison to DLS or DC. All determined meanparticle diameters concurred with the DLS and sedimentation analysis measurements up toa polymer content of 40 wt%. PDW spectroscopy continues to concur with the calculatedtheoretical particle size at even higher polymer contents up to 67 wt%, while DLS and DCshowed difficulties, which could be due to post-process alteration of the dispersion.
PDW spectroscopy also displayed the reproducibility of the process in all reactor sizesand even offered reliable information on the mean particle size of creamy and slightlylumpy emulsions. The measurement method has therefore proven to be promising not onlyon a laboratory scale but also on an industrial scale. However, further investigations shouldbe carried out in order to emphasise the possibility of obtaining even more information byanalysing the scattering coefficient also measured by PDW spectroscopy.
Future work could also investigate whether the dispersion is subject to post-processor cooling agglomeration and whether this is a reversible process.
Supplementary Materials: The following supporting information can be downloaded at: https://www.mdpi.com/article/10.3390/polym14081574/s1, Figure S1: Exemplary representation of theinline monitoring of the monomer accumulation via Raman spectroscopy; Table S1: Overview of themeasured particle size and respective standard deviation by PDW spectroscopy, DC, DLS and thecalculated theoretical size for the emulsion polymerisation in a 1 L reactor; Table S2: Overview of themeasured particle size and respective standard deviation by PDW spectroscopy, DC, DLS and thecalculated theoretical size for the emulsion polymerization in a 10 L reactor; Table S3: Overview ofthe measured particle size and respective standard deviation by PDW spectroscopy, DC, DLS and thecalculated theoretical size for the emulsion polymerization in a 100 L reactor.
Author Contributions: Conceptualization, L.I.J. and W.P.; Investigation, L.I.J.; Methodology, L.I.J.;Supervision, W.P.; Visualisation, L.I.J.; Writing—Original draft preparation, L.I.J.; Writing—Review &editing, L.I.J. and W.P. All authors have read and agreed to the published version of the manuscript.
Funding: This research was funded by the University of Potsdam.
Polymers 2022, 14, 1574 13 of 14
Data Availability Statement: The authors confirm that the data supporting the findings of this studyare available within the article and its Supplementary materials. Further data is available uponrequest from the corresponding author.
Acknowledgments: The authors would like to express very special gratitude to the innoFSPEC ofthe university of Potsdam, especially to Roland Hass, Lena Bressel, Marvin Münzberg, and StephanieSchlappa, for providing the PDW spectroscopy device as well as the necessary software, in additionto their input regarding any questions concerning the device and measuring method. The authorsalso wish to thank Wacker Chemie AG for providing sufficient amounts of vinyl acetate and Versa®10.Special thanks also go to the following students: Wiebke Kahns, Sören Rust, Willi Wagner, and LarissaGroßmann, for assisting with the execution of experiments and analytical methods.
Conflicts of Interest: The authors declare no conflict of interest.
References1. Pohn, J.; Heniche, M.; Fradette, L.; Cunningham, M.; McKenna, T. Computational analysis of mixing and scale-up in emulsion
polymerization reactors. Macromol. Symp. 2011, 302, 133–141. [CrossRef]2. Victoria-Valenzuela, D.; Herrera-Ordonez, J.; Luna-Barcenas, G.; Verros, G.D.; Achilias, D.S. Bulk Free Radical Polymerization of
Methyl Methacrylate and Vinyl Acetate: A Comparative Study. Macromol. React. Eng. 2016, 10, 577–587. [CrossRef]3. Jacob, L.I.; Pauer, W. In-line monitoring of latex-particle size during emulsion polymerizations with a high polymer content of
more than 60%. RSC Adv. 2020, 10, 26528–26534. [CrossRef]4. Zlokarnik, M. Scale-Up: Modellübertragung in der Verfahrenstechnik; Wiley-VCH: Weinheim, Germany, 2000.5. Donati, G.; Paludetto, R. Scale up of chemical reactors. Catal. Today 1997, 34, 483–533. [CrossRef]6. Kemmere, M.F.; Meuldijk, J.; Drinkenburg, A.A.H.; German, A.L. Emulsification in batch emulsion polymerization. J. Appl. Polym.
Sci. 1999, 74, 3225–3241. [CrossRef]7. McKnown, J.S.; Malaika, J. Effects of particle shape on settling velocity at low Reynolds numbers. Trans. Am. Geophys. Union 1950,
31, 74–82. [CrossRef]8. Esch, D.D.; D’Angelo, P.J.; Pike, R.W. On Minimum Power Requirements for Emulsification of Two-Phase, Liquid Systems. Can. J.
Chem. Eng. 1971, 49, 872–875. [CrossRef]9. Skelland, A.H.P.; Ramsay, G.G. Minimum Agitator Speeds for Complete Liquid—Liquid Dispersion. Ind. Eng. Chem. Res. 1987,
26, 77–81. [CrossRef]10. Van Heuven, J.W.; Beek, J.W. Power Input, Drop Size for Liquid-Liquid Dispersions. Proc. Int. Solvent Extr. Conf. 1971, 51, 70–80.11. Zhou, G.; Kresta, S.M. Evolution of drop size distribution in liquid-liquid dispersions for various impellers. Chem. Eng. Sci. 1998,
53, 2099–2113. [CrossRef]12. Zhou, G.; Kresta, S.M. Correlation of mean drop size and minimum drop size with the turbulence energy dissipation and the flow
in an agitated tank. Chem. Eng. J. 1998, 53, 2063–2079. [CrossRef]13. Bloch, D. Etablierung der Inline-Trübungsmessung zur Prozessüberwachung von Emulsionspolymerisationen; University of Hamburg:
Hamburg, Germany, 2017.14. Herrera-Ordonez, J. Simplified Calculation of the Average Number of Radicals Per Particle in Emulsion Polymerization: Effect of
Particle Nucleation and Coagulation Rates. Macromol. React. Eng. 2019, 13, 1–5. [CrossRef]15. Celis, M.T.; Contreras, B.; Levy, P.R.; Méndez, L.; Vejar, F.; García-Rubio, L.H. Role of emulsifier on the particle size and polymer
particle size distribution using multiwavelength spectroscopy measurements. J. Dispers. Sci. Technol. 2017, 38, 1600–1606.[CrossRef]
16. Ronco, L.I.; Minari, R.J.; Gugliotta, L.M. Particle nucleation using different initiators in the miniemulsion polymerization ofstyrene. Brazilian J. Chem. Eng. 2015, 32, 191–199. [CrossRef]
17. Reich, O. Photonendichtewellenspektroskopie mit Intensitätsmodulierten Diodenlasern; Universität Potsdam: Potsdam, Germany, 2005.18. Bressel, L.; Hass, R.; Reich, O. Particle sizing in highly turbid dispersions by Photon Density Wave spectroscopy. J. Quant.
Spectrosc. Radiat. Transf. 2013, 126, 122–128. [CrossRef]19. Hass, R.; Munzke, D.; Reich, O. Inline-Partikelgrößenmesstechniken für Suspensionen und Emulsionen. Chemie Ing. Tech. 2010,
82, 477–490. [CrossRef]20. Hass, R.; Münzberg, M.; Bressel, L.; Reich, O. Industrial applications of Photon Density Wave spectroscopy for in-line particle
sizing. Appl. Opt. 2013, 52, 1423–1431. [CrossRef]21. Ruiz, S.V.; Hass, R.; Reich, O. Optical monitoring of milk fat phase transition within homogenized fresh milk by Photon Density
Wave spectroscopy. Int. Dairy J. 2012, 26, 120–126. [CrossRef]22. Hass, R.; Munzke, D.; Ruiz, S.V.; Tippmann, J.; Reich, O. Optical monitoring of chemical processes in turbid biogenic liquid
dispersions by Photon Density Wave spectroscopy. Anal. Bioanal. Chem. 2015, 407, 2791–2802. [CrossRef]23. Schlappa, S.; Brenker, L.J.; Bressel, L.; Hass, R.; Münzberg, M. Process characterization of polyvinyl acetate emulsions applying
inline photon density wave spectroscopy at high solid contents. Polymers 2021, 13, 669. [CrossRef]24. Stetefeld, J.; McKenna, S.A.; Patel, T.R. Dynamic light scattering: A practical guide and applications in biomedical sciences.
Biophys. Rev. 2016, 8, 409–427. [CrossRef] [PubMed]

Polymers 2022, 14, 1574 14 of 14
25. Reich, O.; Bressel, L.; Hass, R. Sensing emulsification processes by Photon Density Wave spectroscopy. Proceeedings SPIE 2011,7753, 1–4.
26. Hass, R.; Reich, O. Photon Density Wave Spectroscopy for Dilution-Free Sizing of Highly Concentrated Nanoparticles DuringStarved-Feed Polymerization. ChemPhysChem 2011, 12, 2572–2575. [CrossRef] [PubMed]
27. Bressel, L. Untersuchung der Abhängigen Streuung in Hochkonzentrierten Dispersionen; Universität Potsdam: Potsdam, Germany, 2009.28. Bressel, L.; Wolter, J.; Reich, O. Particle sizing in highly turbid dispersions by Photon Density Wave spectroscopy: Bidisperse
systems. J. Quant. Spectrosc. Radiat. Transf. 2015, 162, 213–220. [CrossRef]29. Baerns, M.; Hofmann, H.; Renken, A. Chemische Reaktionstechnik-Lehrbuch der Technischen Chemie, 2nd ed.; Georg Thieme Verlag:
Stuttgart, Germany, 1992; Volume 1.30. Bates, R.; Fondy, P.; Fenic, J.; Uhl, V.W.; Joseph, B. Impeller characteristics and power. In Mixing V1: Theory and Practice; Academic
Press: New York, NY, USA, 1966; p. 157.31. Lin, P.Y.; Lee, H.L.; Chen, C.W.; Lee, T. Effects of baffle configuration and tank size on spherical agglomerates of dimethyl
fumarate in a common stirred tank. Int. J. Pharm. 2015, 495, 886–894. [CrossRef]32. DIN 28131:1992-09; Rührer und Stromstörer für Rührbehälter. Formen, Benennungen und Hauptmaße; Beuth Verlage GmbH:
Berlin, Germany, 1992.33. EKATO-Handbuch der Rührtechnik; EKATO Rühr- und Mischtechnik GmbH: Schopfheim, Germany, 1990.34. Hergeth, W.D. Raman-Streuung an Polymerdispersionen. Chemie-Ingenieur-Technik 1998, 70, 894–898. [CrossRef]35. CPS Scheibenzentrifuge-Handbuch; CPS Instruments, Lot Oriel Gruppe Europa: Zwijndrecht, Belgium, 2009; pp. 1–80.36. Jacob, L.; Pauer, W. Inline monitoring of latex-particle size distribution in emulsion polymerization process. RSC Adv. 2020, 10,
26528–26534. [CrossRef]37. Gustin, J.L.; Laganier, F. Understanding vinyl acetate polymerization accidents. Org. Process Res. Dev. 2005, 9, 962–975. [CrossRef]38. Peter, S.; Fasbender, H. Die rheologisch wirksame Ausdehnung der Solvathüllen des Polyvinylalkohols in wässriger Lösung in
Abhängigkeit vom Molekulargewicht. Rheol. Acta 1963, 3, 92–98. [CrossRef]39. Zichi, D.A.; Rossky, P.J. The equilibrium solvation structure for the solvent-separated hydrophobic bond. J. Chem. Phys. 1985, 83,
797–808. [CrossRef]
Copyright © 2022 FDOKUMEN