SAT Validity for Linguistic Minorities at the University of California, Santa Barbara
11
SAT Validity for Linguistic Minorities at the University of California, Santa Barbara Rebecca Zwick, University of California, Santa Barbara and Lizabeth Schlemer, California PoZgtechnic State University The validity of the SAT as an admissions criterion for Latinos and Asian Americans who are not native English speakers was examined. The analyses, based on 1997 and 1998 UCSB fresh- men, focused on the effectiveness of SAT scores and high school grade-point average (HSGPA) in predicting college freshman grade-point average (FGPA). When regression equations were es- timated based on all students combined, some systematic pre- diction errors occurred. For language minorities, using only high school grades as a predictor led to predicted FGPAs that tended to exceed actual FGPAs, particularIy for Latinos. lncluding SAT scores in the equation notably reduced prediction bias. Further analyses showed that, while HSGPA had the highest cor- relation with FGPA for most groups, SAT verbal score was the strongest predictor of FGPA for language minorities in 1998. An overriding conclusion is that combining data across language groups can obscure important test validity information. Keywords: admissions, language minorities, SAT he validity of the SAT as a college T admissions criterion has been the subject of increasing scrutiny in California since the passage in 1996 of Proposition 209, the state’s anti- affirmative action law. In particular, some California educators have claimed that the SAT plays a key role in keeping Latino students out of college (e.g., Garcia, Jorgensen, & Ormsby, 1999). In February 2001, Richard Atkinson, pres- ident of the University of California, made a surprise speech advocating the elimination of the SAT I as a criterion for admission to the University of California (Atkinson, 2001; see also Atkinson, 2004). Atkinson said he hoped to eventually move away from quantitative admissions formulas in order to “help all students, especially low-income and minority students, de- termine their own educational des- tinies.” Despite an increased focus on SAT validityfor ethnic minorities in the last 2 decades, little attention has typically been paid to language minority status per se. A substantial number of Latino and Asian-American test takers are not native English speakers. The primary goal of this study, sponsored by the University of California Linguistic Minority Research Institute, was to in- vestigate the validity of the SAT as an admissions criterion for Latino and Asian-American students who are not native speakers of English, and to com- pare the validity findings for language minority students to those obtained for native English speakers.’ Predictive Validity Analyses of College Admissions Tests A standard analysis of the predictive va- lidity of an admissions test focuses on whether the test is an effective and ac- curate predictor of subsequent grades. In the case of the SAT, for example, a key question is, Does the SAT lead to better prediction of college freshman grade- point average (FGPA) than would be at- tained using high school grades alone? Regression analysis is used to obtain an equation for predicting FGPA using high school grades and SAT mathematical and verbal scores (SAT-M and SAT-V). Predictive effectiveness is measured by the degree of correspondence between the predicted FGPAs and the actual FGPAs. The analysis can be repeated using high school grades alone as a pre- dictor; comparing the results of the two prediction analyses gives an estimate of the “value added” by using SAT scores. The correlation of a test score and the measure of success it is intended to pre- dict (in this case, FGPA) is called the predictive validity coefficient of that test. The multiple correlation of a set of test scores (e.g., SAT-M and SAT-V) with the success measure is often la- beled a validity coefficient as well. An investigation of SAT validity for language minorities needs to include an analysis of whether prediction of FGPA is as effective for these students as it is Rebecca Zwick is a Professor at the Gevirtx Graduate School of Education, University of Cal$fornia, Santa Barbara, CA 93106-9490; [email protected]. Her arem of specialixation are applied sta- tistics, psychometrics, and the assessment of test fairness. Lixabeth Schlemer is a Lecturer in the College of Engineering, California Poly- technic State University, San Luis Obispo, CA 93407; [email protected]. She is pursuing a Ph.D. in Education at UCSB. Her dissertation work examines the inter- action between time limits (speededness) in testing and cognitive styles. 6 Educational Measurement: Issues and Practice
Transcript of SAT Validity for Linguistic Minorities at the University of California, Santa Barbara

SAT Validity for Linguistic Minorities at the University of California, Santa Barbara Rebecca Zwick, University of California, Santa Barbara and Lizabeth Schlemer, California PoZgtechnic State University
The validity of the SAT as an admissions criterion for Latinos and Asian Americans who are not native English speakers was examined. The analyses, based on 1997 and 1998 UCSB fresh- men, focused on the effectiveness of SAT scores and high school grade-point average (HSGPA) in predicting college freshman grade-point average (FGPA). When regression equations were es- timated based on all students combined, some systematic pre- diction errors occurred. For language minorities, using only high school grades as a predictor led to predicted FGPAs that tended to exceed actual FGPAs, particularIy for Latinos. lncluding SAT scores in the equation notably reduced prediction bias. Further analyses showed that, while HSGPA had the highest cor- relation with FGPA for most groups, SAT verbal score was the strongest predictor of FGPA for language minorities in 1998. An overriding conclusion is that combining data across language groups can obscure important test validity information.
Keywords: admissions, language minorities, SAT
he validity of the SAT as a college T admissions criterion has been the subject of increasing scrutiny in California since the passage in 1996 of Proposition 209, the state’s anti- affirmative action law. In particular, some California educators have claimed that the SAT plays a key role in keeping Latino students out of college (e.g., Garcia, Jorgensen, & Ormsby, 1999). In February 2001, Richard Atkinson, pres- ident of the University of California, made a surprise speech advocating the elimination of the SAT I as a criterion for admission to the University of California (Atkinson, 2001; see also Atkinson, 2004). Atkinson said he hoped to eventually move away from quantitative admissions formulas in order to “help all students, especially low-income and minority students, de- termine their own educational des- tinies.”
Despite an increased focus on SAT validityfor ethnic minorities in the last 2 decades, little attention has typically been paid to language minority status per se. A substantial number of Latino and Asian-American test takers are not native English speakers. The primary goal of this study, sponsored by the University of California Linguistic Minority Research Institute, was to in- vestigate the validity of the SAT as an admissions criterion for Latino and Asian-American students who are not native speakers of English, and to com- pare the validity findings for language minority students to those obtained for native English speakers.’
Predictive Validity Analyses of College Admissions Tests A standard analysis of the predictive va- lidity of an admissions test focuses on
whether the test is an effective and ac- curate predictor of subsequent grades. In the case of the SAT, for example, a key question is, Does the SAT lead to better prediction of college freshman grade- point average (FGPA) than would be at- tained using high school grades alone? Regression analysis is used to obtain an equation for predicting FGPA using high school grades and SAT mathematical and verbal scores (SAT-M and SAT-V). Predictive effectiveness is measured by the degree of correspondence between the predicted FGPAs and the actual FGPAs. The analysis can be repeated using high school grades alone as a pre- dictor; comparing the results of the two prediction analyses gives an estimate of the “value added” by using SAT scores. The correlation of a test score and the measure of success it is intended to pre- dict (in this case, FGPA) is called the predictive validity coefficient of that test. The mult iple correlation of a set of test scores (e.g., SAT-M and SAT-V) with the success measure is often la- beled a validity coefficient as well.
An investigation of SAT validity for language minorities needs to include an analysis of whether prediction of FGPA is as effective for these students as it is
Rebecca Zwick is a Professor at the Gevirtx Graduate School of Education, University of Cal$fornia, Santa Barbara, CA 93106-9490; [email protected]. Her arem of specialixation are applied sta- tistics, psychometrics, and the assessment of test fairness.
Lixabeth Schlemer is a Lecturer in the College of Engineering, California Poly- technic State University, San Luis Obispo, CA 93407; [email protected]. She is pursuing a Ph.D. in Education at UCSB. Her dissertation work examines the inter- action between time limits (speededness) in testing and cognitive styles.
6 Educational Measurement: Issues and Practice

for native English speakers. One way this can be accomplished is to combine the data for all groups, estimate a regression cquation (to predict FGPA from SAT and high school grades), and then determine whether the fit of the equation can be improved by adding group membership information.
If the common regression equation does not fit all groups equally well, it is important to determine to what degree the use of this equation produces pre- dicted FGPA values that tend to be too high or too low for language minorities. In actual applications of regression analysis in college admissions, a single equation is typically derived for all stu- dents. If this equation yielded FGPApre- dictions that were systematical1y“off‘ for a particular group, this result would be consistent with the definition of test bias articulated by T. Anne Cleary (1968). Her definition says that a test is biased against a particular subgroup of test tak- ers “if the criterion score [in this case, FGPA] predicted from the common re- gression line is consistently too high or too low for members of the subgroup” (Clcary, 1968, p. 115). Today, testing professionals prefer the term “predic- tion bias,” in recognition of the fact that systematic errors in prediction can stem from a variety of causes, some of which are distinct from the test itself.
In addition to prediction bias, differ- ences in the strength of prediction are of interest: Are test scores more strongly associated with freshman grades in some student groups than in others? This can be assessed most easily by estimating separate prediction equations for each group.
Previous Predictive Validity Findings for Latinos, Asian Americans, and Language Minorities Although countless studies have been conducted on the validity of college admissions tests for ethnic minorities, few of these have explicitly considered whether the assessed students were lan- guage minorities. By the same token, some investigations have considered whether English was a student’s best language without consideringwhat his or her best language was, if not English, and without considering the possible role of ethnicity. In this section, we review se- lected findings from the last 20 years on the validity of college admissions tests for Latinos, for Asian Americans, and for language minorities. Like all stan-
dard ethnic categories, Latino and Asian- American groups actually consist of an array of diverse subgroups. Latinos may be Mexican-American, Puerto Rican, or Cuban American, for example; Asian Americans may be Chinese, Japanese, or Korean, to name just a few possibili- ties. In the studies reviewed here (as in our own), strong conclusions about Asian-American or Latino subgroups were impossible because of small sam- ples, incomplete information, or fea- tures of the research design (e.g., in Pennock-Roman’s [ 19901 study, sub- group membership was confounded with institutional affiliation).
The validity of admissions tests for Latino students has been studied quite extensively (e.g., Breland & Duran, 1985; Duran, 1983; Gandara & Lopez, 1998; Pearson, 1993; Pennock-Roman, 1990, 1993; see also the review by Young, 2001). Most of them, however, do not explicitly consider language background. In his comprehensive review of previous analyses in which FGPA was predicted using high school record and test scores, Duran (1983) found slightly smaller validity coefficients for Hispanic than for non-Hispanic White students (p. 93). Most of the reviewed studies involved primarily Mexican-American students. The finding of somewhat smaller validity coefficients for Latino students has re- curred in many subsequent studies (see Young, 2001, p. 12).
Pennock-Roman (1990) investigated SAT validity for Hispanic and non- Hispanic students who were freshmen at six universities in the early 1980s. In three institutions, the Hispanic stu- dents were primarily Mexican American; in two, they were mainly Puerto Rican; and in one, they were mostly Cuban American. In four schools, SAT-V was more highly correlated with first-year FGPA for non-Hispanics than for His- panics; for two schools, the reverse was true. SAT-M also had higher correla- tions with FGPA for non-Hispanics in four of the six schools. In her compar- isons, however, Pennock-Roman also considered the standard error of esti- mate (SEE), which is computed using both the correlation (or multiple corre- lation) and the standard deviation of the predicted variable-here, FGPA. The SEE is a measure of the degree to which estimated FGPAs deviate from actual FGPAs (regardless of the direc- tion of the deviation).2 Overall, she found no evidence of weaker prediction for Hispanic students, and concluded
that differences in regression systems between Hispanic and non-Hispanic White students within an institution were small compared to the differences among fields of study and among insti- tutions (1990, pp. 122-126). This study was unusual in that it also investigated the contribution of English proficiency to the prediction of FGPA. Pennock- Roman concluded that “in the predic- tion of college achievement, English proficiency did not have much of an added effect beyond the accuracy ob- tained from test scores and other pre- dictors. It seems likely that persons with somewhat limited English profi- ciency are handicapped both on test scores and in [freshman] college achievement. . .” (1990, pp. 129-130). Some evidence of overprediction of Hispanics’ FGPAs was found when the “non-Hispanic” regression equations were used, especially when high school record alone was used as a predictor (Pennock-Romin, 1990, p. 4).
Studies focusing on SAT validity for Asian Americans are few and far bet- ween. Sue and Abe (1988) studied the prediction of freshman grades for more than 4,000 Asian-American students (including six subgroups) and 1,000 White students at the University of California in 1984. A major finding was that SAT mathematics scores were nearly always better predictors than SAT-V scores for Asian Americans, but not for Whites. Fuertes, Sedlacek, and Liu (1994) studied the prediction of first-, third-, fifth-, and seventh-semester college GPA for about 400 Asian- American freshmen at a single university between 1979 and 1988. They evaluated both the SAT and noncognitive vari- ables, such as self-concept, leadership, and ability to handle racism. Although the research focused on the noncogni- tive factors, the only variable that had sizable correlations with college GPA was SAT-M. SAT-V scores and noncog- nitive variables were much less effec- tive as predictors of college grades. Additional studies are reviewed by Young (2001, see p. 12). In general, va- lidity coefficients for Asian Americans have been similar to those for Whites and somewhat greater than those for Latinos and other groups.
A detailed and painstaking study of the utility of the SAT as a predictor of college grades was conducted by Leonard Ramist, Charles Lewis, and Laura McCamley-Jenkins (1994) based on 1985 data from more than 45,000 stu-
Spring 2004 7

dents from 45 colleges. (All analyses were conducted separately within each school and then averaged.) Among other groups, Ramist et al. considered SAT validity for Hispanic students, Asian Americans, and language minorities, but language background and ethnicity were not considered simultaneously, and no specific language groups were in- vestigated.
Ramist et al. (1994) obtained the squared multiple correlations of the usual academic predictor variables with FGPA for Hispanic, Asian-American, and White students, among other groups (p. 11). SAT-V, SAT-M, and high school grade-point average (HSGPA) were all slightly more effective as predictors for White than for Hispanic students, but the largest differences were among Asian Americans and the two other groups. SAT-M (and, therefore, the combination of SAT-V and SAT-M) was far more pre- dictivc of FGPA for Asian Americans (squared correlations of .14 for SAT-M alone, versus .07 for Whites and .04 for Hispanics). When all three predictors were included, the squared multiple cor- relation was .23 for Asian Americans, .20 for Whites, and .18 for Hispanics. (The correlations given here from the Ramist et al. study do not include range restric- tion corrections or other adjustments.)
Ramist ct al. (1994) also computed the average differences, in GPA units, between actual and predicted FGPAs for the three groups (p. 15). These re- sults are based on the application of a single rcgression equation, estimated using data from all students. The aver- age prcdiction error for the combined group of students (which includes all ethnic groups, and not just the three dis- cussed here) must be equal to zero be- cause of the properties of regression analysis. (In least squares regression analysis, the residuals, or prediction er- rors, are constrained to sum to zero.) Because Whites constituted a large proportion (80%) of the combined group, the average prediction error for Whites was necessarily close to zero. The find- ings for the other two groups were quite different from each other: Asian- American FGPAs tended to be under- predicted-their actual grades were higher than those predicted using the common regression equation, especially if SAT-V was used alone as a predictor (underprediction of .14). Using HSGPA alone or SAT-M alone led to fairly unbi- ased prediction (underprediction of .02
to .03). The FGPAs for Hispanic stu- dents, however, tended to be overpre- dicted-their actual grades were lower than their predicted grades. This was especially true when HSGPA alone was used: The average prediction error was .24, nearlya quarter of agrade point. The least prediction bias (overprediction of. 13) occurred when SAT-V and SAT-M were used in combination, with or with- out HSGPA. (Possible reasons for the recurrent finding of overprediction for Latinos are discussed in Zwick, 2002, chapter 5, and in Zwick & Sklar, 2003.)
In their analysis of language back- ground, Ramist et al. (1994) compared predictive effectiveness for students who said English was their best language (EBL) to students who said it was not (ENBL) (p. 11). The regression analysis using HSGPA only as a predictor yielded a moderately high squared correlation of .I6 for the EBL group, compared to a value of .12 for the ENBL group. SAT-V score was a much more effective predic- tor of first-year FGPA in the EBL group than in the ENBL group (.lo vs. .03), but when both SAT-V and SAT-M scores were used as predictors, the squared multiple correlation was slightly higher in the ENBL group than in the EBL group (.15 versus .13). When HSGPA, SAT-M, and SAT-V were used in combi- nation, the squared multiple correlation rose to .23 in each group.
Patterns of over- and underprediction were also examined for these groups (Ramist et al., 1994, p. 15). Because the EBL group constituted 97% of the combined group, the average predic- tion error for the EBL group was close to zero. For the ENBL group, using only the SAT-V score to predict FGPA led to an average underprediction of .29 (i.e., ac- tual FGPAs were higher than predicted grades by this amount, on average). Any combination of predictors that included SAT-V led to some degree of under- prediction for the ENBL students, but predictions were quite accurate when SAT-M alone or HSGPA alone were used (underprediction of .Ol). These findings are in sharp contrast to the results for Hispanic students, whose grades tended to be overpredicted, especially when HSGPA alone or SAT-V alone were used as predictors. This highlights a funda- mental limitation of the ENBL results: The students for whom English was not the best language did not share a com- mon language background. This group cut across all ethnicities: 57% were Asian American, 4% were Black, 9% were
Hispanic, and 30% were White (Ramist et al., p. 27). The heterogeneity of the group makes the findings difficult to interpret.
In a more recent study, Bridgeman, McCamley-Jenkins, and Ervin (2000) also examined SAT validity and over- and underprediction by ethnic group. Their sample consisted of more than 90,000 students who were freshmen at 23 selective colleges in 1994 or 1995. (As in the Ramist et al. study, all analy- ses were conducted separately within each school and then averaged.) Bridgeman et al. went one step farther than the typical analysis by separately considering men and women within each ethnic group. The validity find- ings were consistent with those of Ramist et al. (1994), but they also showed that for Latinos, SAT validity was considerably higher for women than for men. The findings on predic- tion bias were particularly interesting. The FGPAs for Latinos were again overpredicted, but overprediction was revealed to be substantially more ex- treme for men than for women. The FGPAs of Asian-American and White men were overpredicted, especially when SAT-M was used as a predictor, while the FGPAs of Asian-American women and, to an even greater degree, White women, were underpredicted.
The Current Study In the current study, we used data from the University of California, Santa Barbara (UCSB) to investigate the degree to which SAT validity varied according to students' self-reported primary language and ethnicity." Spe- cifically, our main research questions were as follows:
1. How effectively do SAT scores and high school grades predict FGPA at UCSB, and to what degree do the prediction results vary ac- cording to students' primary lan- guage and ethnicity?
2. Does the use of a single regression equation for an entire freshman cohort lead to systematic over- or underprediction of FGPA for certain student groups?
Data Description Cohorts We obtained data from the 44,407 indi- viduals who applied to UCSB in 1997 or
8 Educational Measurement: Issues and Practice

1998 from the campus institutional re- search office. Those who ultimately en- rolled were the focus of our analyses. The data for these students included admissions test scores, HSGPA, FGPA at UCSB, ethnicity, and responses to a questionnaire item asking applicants to indicate “Language(s) you learned to speak first.” The item had three possi- ble responses: “English only,” “Another language,” or “English and another lan- guage.”Of the enrolled students (a total of 3,744 in 1997 and 3,584 in 1998), about 12% were excluded from analy- sis because their grades or test scores were unavailable, resulting in a sample of 3,291 students in 1997 and 3,173 stu- dents in 1998.
We decided to keep the two cohorts separate in our analyses because a preliminary exploration revealed large differences between cohorts in the amount of missing data for both lan- guage and cthnicity. In 1997, ethnicity information was unavailable for 1.2% of freshmen and language information was uiiavailable for 2.4%. In 1998, these percentages jumped to 14.5% and 44.1%, respectively. The 1998 entrants were the first cohort affected by Prop- osition 209, California’s anti-affirmative action law; an increase in the omission rate for such information was reported statewide (University of California, April 1998).
LnnyuageBthnicity Groups The absence of specific information about studcnts’ first language (if it was
not English) represented a significant limitation in our study. In order to achieve the most homogeneous language groups possible, given the shortcomings of the data, we used both ethnicity and language information to classify stu- dents into 10 groups. These are listed in Table 1, along with the sample sizes available for regression analysis. The only ethnic groups with a substantial proportion of “Another language” re- sponses to the question about primary language were Latinos, Chicanos, and Asian Americans. Because of the small number of students, the groups desig- nated as “Latino” and “Chicano” by UCSB were combined; the resulting group is la- beled “Latino” in this study. We classified the Latino and Asian-American students according to their responses to the lan- guage question, yielding Groups 1-6. (For simplicity, students responding “English and another language” are la- beled “Bilingual.”) Group 7, which con- sists of White students who said English was their primary language, can be con- sidered a reference group. Groups 8 and 9 are African-American and Filipino groups, which were not divided on the basis of language because they were too small, and Group 10 consists of all other students, including those who did not provide language or ethnicity data. Groups 1-9 are substantially smaller in 1998 than in 1997 because of the higher rate of nonresponse to ethnicity and language questions. Note that Group 10 contains 1,740 students in 1998, com- pared to only 345 students in 1997.
Although Group 1, “Latino/Other,” can reasonably be assumed to be a group of Spanish speakers, Group 3, “Asian/Other” is much more heteroge- neous and is likely to contain students who speak Japanese, Chinese, Korean, and other languages. The “Bilingual” groups (2 and 4) appeared to be quite different from the corresponding “Other Language” groups in terms of their grades and test performance (see below) and were, therefore, retained as sepa- rate groups.
Data Analysis Table 2 gives means and standard devia- tions for HSGPA, SAT scores, and FGPA for students who enrolled at UCSB in 1997 and 1998. The language/ethnicity groups differed substantially in average grades and test scores. In particular, large gaps between the “English” and “Other Language” groups were evident on SAT-V. In both 1997 and 1998, the AsiadOther and Latino/Other groups had averages between 470 and 500, whereas the three “English” groups had averages between 540 and 590. A simi- lar pattern held for FGPA, although dif- ferences among groups were much smaller.
A different configuration of results oc- curred for the other two academic mea- sures, however: The Latino/Other group had better high school grades, on aver- age, than most of the remaining groups, including the Latino/English group. The AsiadOther group had only middling
Table 1. LanguageIEthnicity Groups Used in the Current Study
Group Number Group Designation Ethnicity
Number of Students”
Primary Language 1997 1998
1 2 3 4 5 6 7 8 9
10
Latino/Other Latino/Bil ingual
As i a n/Ot he r As i an/B i I i ngual La t i n o/E n g 1 is h Asi an/Eng I is h White/English
African American Filipino
Residualb
Chicano and Latino Chicano and Latino
Asian American Asian American
Chicano and Latino Asian-American
White African American
Filipino All Others
Other Language En g I is h/Ot he r Language
Other Language E n g I i s h/Ot her Language
English English English
A V Any Any
106 121 139 139 195 136
1,896 99
115 345
54 98 72 93 92 52
81 9 90 63
1,740
Total ~
3,291 3,173
jNumber of records available for regression analysis. blncludes students for whom language or ethnicity data were missing.
Spring 2004 9
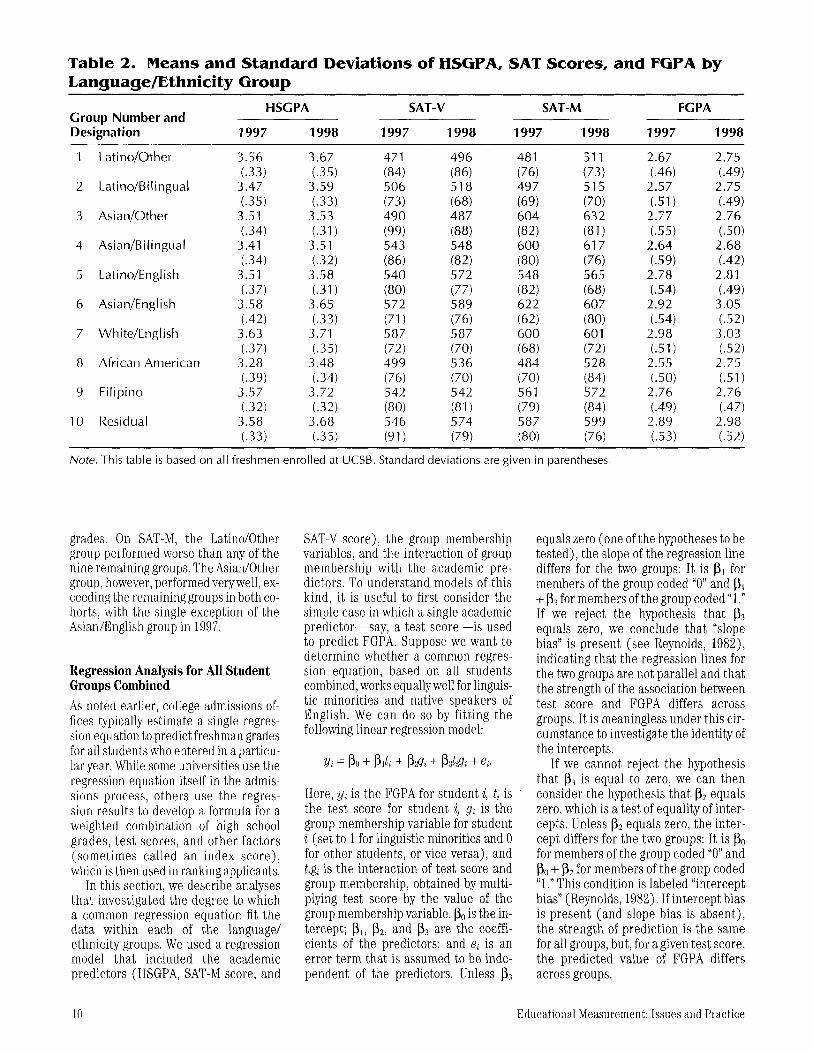
Table 2. Means and Standard Deviations of HSGPA, SAT Scores, and FGPA by Language/Ethnicity Group
Croup Number and Designation 1997 1998 1997 1998 1997 1998 1997 1998
HSCPA SAT-V SAT-M FC PA
1
2
3
4
5
6
7
8
9
10
L at i n o/Ot h e r
L at i no/B i I i n gu a I
Asia n/Ot her
Asian/Bilingual
Lat i no/E ngl is h
As i an/E ng l is h
W h ite/Eng I i s h
African American
Filipino
Residual
3.56 (.33)
3.47 (.35)
3.51 (.34)
3.41 (.34)
3.51 (.37)
3.58 (.42)
3.63 (.37)
3.28 (.39)
3.57 ( 3 2 )
3.58 f.33)
3.67 (.35)
3.59 (.33)
3.53 (.31)
3.51 (.32)
3.58 ( 3 1 1
3.65 (.33)
3.71 (.35)
3.48 (.34)
3.72 (.32)
3.68 (.35)
471 (84) 506 (73) 490 (99) 543 (86) 540 (80) 5 72 (71 1 587 (72) 499 (76) 542 (80) 546 (91 1
2.67 (.46)
2.57 ( 5 1 1
2.77 (.55)
2.64 (.59)
2.78 (-54)
2.92 (.54)
2.98 (.51)
2.55 (.50)
2.76 (.49)
2.89 (.53)
2.75 (.49)
2.75 (.49) 2.76 ( 5 0 )
2.68 (.42)
2.81 (.49) 3.05 ( 5 2 )
3.03 ( 5 2 )
2.75 ( 5 1 1
2.76 (.47)
2.98 (.52)
Note. This table i s based on all freshmen enrolled at UCSB. Standard deviations are given in parentheses
grades. On SAT-M, the Latino/Other group performed worse than any of the nine remaining groups. The AsianlOther group, however, performed verywell, ex- ceeding the reniaining groups in both co- horts, with the single exception of the Asian/English group in 1997.
Regression Analysis for All Student Groups Combined As noted earlier, college admissions of- fices typically estimate a single regres- sion equation to predict freshman grades for all students who entered in a particu- lar year. While some universities use the regression equation itself in the admis- sions process, others use the regres- sion results to develop a formula for a weighted combination of high school grades, test scores, and other factors (sometimes called an index score), which is then used in ranking applicants.
In this section, we describe analyses that investigated the degree to which a common regression equation fit the data within each of the language/ ethnicity groups. We used a regression model that included the academic predictors (HSGPA, SAT-M score, and
SAT-V score), the group membership variables, and the interaction of group membership with the academic pre- dictors. To understand models of this kind, it is useful to first consider the simple case in which a single academic predictor-say, a test score-is used to predict FGPA. Suppose we want to determine whether a common regres- sion equation, based on all students combined, works equallywell for linguis- tic minorities and native speakers of English. We can do so by fitting the following linear regression model:
Here, yi is the FGPA for student i, ti is the test score for student i, gi is the group membership variable for student i (set to 1 for linguistic minorities and 0 for other students, or vice versa), and tigi is the interaction of test score and group membership, obtained by multi- plying test score by the value of the group membership variable. Po is the in- tercept; PI, P2, and P3 are the coeffi- cients of the predictors; and ei is an error term that is assumed to be inde- pendent of the predictors. Unless P3
equals zero (one of the hypotheses to be tested), the slope of the regression line differs for the two groups: It is PI for members of the group coded “0” and P I + P3 for members of the group coded “1.” If we reject the hypothesis that P3 equals zero, we conclude that “slope bias” is present (see Reynolds, 1982) , indicating that the regression lines for the two groups are not parallel and that the strength of the association between test score and FGPA differs across groups. It is meaningless under this cir- cumstance to investigate the identity of the intercepts.
If we cannot reject the hypothesis that P3 is equal to zero, we can then consider the hypothesis that P2 equals zero, which is a test of equality of inter- cepts. Unless P2 equals zero, the inter- cept differs for the two groups: It is Po for members of the group coded “0” and Po + p2 for members of the group coded “1.” This condition is labeled “intercept bias” (Reynolds, 1982). If intercept bias is present (and slope bias is absent), the strength of prediction is the same for all groups, but, for a given test score, the predicted value of FGPA differs across groups.
10 Educational Measurement: Issues and Practice

In our analysis, this approach was generalized to three academic predic- tors (HSGPA, SAT-V score, and SAT-M score) and the G= 10 language/ethnicity groups. First, the academic predictors were entered into the regression equa- tion, and theR2 value determined. Then, the grouping variables were added (con- sisting of G - 1 = 9 dummy variables), and their contribution to the R2 value determined. (In coding the language/ ethnicity groups, the White/English group was assignedvalues of zero on the nine dummy variables; hence, it serves as a reference group.) Finally, the inter- action variables were added (consisting of 3 x 9 = 27 dummy codes), and their contribution assessed. The results are shown in Table 3.
Results were quite similar for the two cohorts. The three academic predictors, combined, produced moderate multiple correlations. The R2 value was ,219 in 1997 and .205 in 1998. In both years, the
interaction terms made only a trivial con- tribution to theR2value that was not sta- tistically significant at a = .01.4 Because there was no evidence of slope bias, intercept bias could then be explored. Here, the evidence was equivocal. Group membership did make a statistically sig- nificant contribution (a = . O l ) to the R2 value, but the magnitude of the contri- bution was small. In 1997, adding group membership increased theR2 value from .219 to ,226; in 1998, the R2 increased from .205 to .214. In each case, then, the increase in R2 value achieved by adding the group membership represented less than 1% of the variance of FGPA. The group membership variables that were statistically significant ( a = . O l ) when evaluated separately were the Asian/ Bilingual indicator in both years, the LatinoA3ilingual indicator in 1997, and the Filipino indicator in 1998. This find- ing can be interpreted to mean that the regression equations for these groups
differed somewhat from those of the WhiteEnglish (reference) group.
Overprediction and Underprediction of FGPA Within Language/Ethnicity Groups
Although the effect of including lan- guage/ethnicity group as a predictor of FGPA was small, we conducted addi- tional analyses to explore the accuracy of prediction when the common regres- sion equation, based on all groups, was applied. For each group, the average difference between the actual and pre- dicted FGPA was calculated in order to determine the degree to which system- atic overprediction or underprediction of FGPA occurred for certain student groups. This type of systematic predic- tion error, if substantial, constitutes test bias according to the Cleary (1968) definition, mentioned earlier.
Table 3. Summary of Combined-Group Regression Results Standardized Regression
Year Model R2 Valuea Predictor Variablesb Coefficient
1997 Academic predictors .219 HSGPA SAT-M SAT-V
1997 Academic predictors .226 HSGPA and group membership
SAT-M SAT-V Latino/Bilingual As ian/B i I i ngua I
1997 Academic predictors, group ,231 HSGPA membership, and interactions
SAT-M SAT-V
.357
.I 24
.I 92
.345
.I 13
.I 74 -.053 -.067
.346
.098
.I 79
1998 Academic predictors .205 HSGPA SAT-M SAT-V
1998 Academic predictors .214 HSGPA and group membership
SAT-M SAT-V Asian/B i I i ngual Filipino
1998 Academic predictors, group .220 HSGPA membership, and interactions
SAT-M SAT-V
.349
.059
.206
.341
.054
.I 93 -.065 -.054
.295
. I 20
.215
both cohorts, the contribution of the group membership variables to the R2 value was statistically significant (a = .Ol ) , but the con- tribution of the interaction variables was not. bOnly predictor variables that made a statistically significant contribution (a= .01) are listed. In coding the language/ethnicity groups, the White/English group was assigned values of zero on the nine dummy variables; hence, it serves as a reference group.
Spring 2004 11

Table 4. Average Difference Between Actual and Predicted FGPA Under Various Combined-Group Regression Models
Predictors in the Regression Model
HSCPA,
Designation Actual FGPA only only only SAT-M SAT-V SAT-M SAT-M Group Number and HSGPA SAT-V SAT-M SAT-V, HSGPA, HSCPA, SAT-V,
1997 Cohort 1 Latino/Other 2 3 Asian/Other 4 5 Latino/English 6 Asian/English 7 Wh ite/Eng I is h 8 African American 9 Filipino
10 Residual
1998 Cohort
Lat i no/B i I i ngua I
Asia n/B i I i ngu a I
1 Latino/Other 2 Lati no/Bi I i ngual 3 Asian/Other 4 Asian/Bilingual 5 Latino/English 6 Asian/English 7 W h i te/E ng I i s h 8 African American 9 Filipino
10 Residual
2.67 2.57 2.77 2.64 2.78 2.92 2.98 2.55 2.75 2.89
2.75 2.75 2.76 2.68 2.81 3.05 3.03 2.75 2.76 2.98
0.23 0.28 0.1 0 0.1 8 0.09 (0.01) (0.04) 0.20 0.1 6 0.02
0.20 0.1 6 0.1 1 0.1 8 0.09 (0.1 1 ) (0.05) 0.09 0.22 (0.02)
0.06 0.22 (0.01) 0.21 0.07 (0.02) (0.05) 0.22 0.1 0
(0.03)
0.07 0.1 1 0.04 0.23 0.1 5 (0.06) (0.05) 0.14 0.1 4 (0.02)
0.05 0.1 7 0.1 5 0.27 0.05 0.03 (0.07) 0.1 7 0.1 0 0.00
0.1 0 0.1 1 0.24 0.30 0.1 1 (0.08) (0.07) 0.1 3 0.1 7
(0.01 ) 0.1 5 0.05 0.24 0.04 0.02 (0.05) 0.1 5 0.08 (0.02)
0.03 0.07 0.08 0.25 0.1 3 (0.06) (0.05) 0.1 1 0.1 3
-06 . I 7
(.04) .I 2 .03
(.04) .07 . I 0
1.04)
.08
.08
.I 5
.I 0 (.OW (.03) 0.1 1 . I 8
.06 0.00
.I 3 0.1 1
.I 0 0.00
. I 7 0.1 4
.02 0.01
.01 0.00 (.05) (0.03) .03 0.01 . I 0 0.09
(.01) (0.03)
.I 2 0.06
.08 0.05
. I 5 0.02
.20 0.1 6
.06 0.08 (.I 0) (0.08) (.05) (0.03) .04 0.03 .20 0.1 7
(0.02) (0.02) (.02) (.02) (0.02)
Note. Each of the seven rightmost columns corresponds to a regression model (e.g., “HSGPA only” refers to a model that includes only HSGPA as a predictor). Values in parentheses are underpredictions (i.e., the actual FGPA exceeded the predicted FGPA); all other values are overpredictions.
While the analysis of Table 3 in- volved only the case in which all three academic predictors were included, the prediction accuracyanalyses shown in Table 4 also included alternative regression models in which each aca- demic predictor was used alone and models that involved all possible pairs of predictors. Each of the seven right- most columns of Table 4 corresponds to a regression model (e.g., “HSGPA only” refers to a model that includes only HSGPA as a predictor). Table entries in parentheses are underpredictions; all others are overpredictions.
One clear and important finding emerges: For students in the Latino/ Other Language or Latino/Bilingual groups, using only HSGPA to predict FGPA, sometimes advocated as a more fair procedure, tended to produce sub- stantial overpredictions of college grades. On average, predicted grades were higher than the grades actually at- tained by amounts ranging from .16 to .28 of a grade point. Including SAT scores in the equation reduced the aver-
age prediction error to values between .OO and .11 (see the rightmost column).
For the AsiadOther Language group, overprediction averaged .10 in 1997 and .I 1 in 1998 when only HSGPA was used as a predictor. However, the average pre- diction error achieved by using only SAT- V score in the equation was negligible for this group-almost as small as that achieved by using all three predictors.
For reasons that are not obvious, sub- stantial overprediction occurred in both years for the AsiadBilingual group in all regression models, even those that in- cluded all three predictors. Notable over- prediction also occurred in many of the regression models for the African- American and Filipino groups, and for the Latino/English group in 1998. In general, underprediction was most pro- nounced for the White/English group and, in 1998, for the AsiadEnglish group.
Two points should be kept in mind when interpreting the results of such analyses: First, results depend in part on the composition of the combined group of test takers. As noted earlier, for
example, larger subgroups (language/ ethnic groups, in this case) are more likely to be well fit by the common equation since they constitute a larger proportion of the combined group. Therefore, when the relative sizes of the subgroups vary across analyses, this compromises the comparability of the results. Second, resuIts such as those in Table 4 are averages of prediction er- rors for a given subgroup; an individual may be underpredicted, for example, even though he is a member of a sub- group that is, on average, overpredicted.
Regression Analysis Within LanguagelEthnicity Groups To further explore the prediction of FGPA using HSGPA, SAT-V, and SAT-M we estimated a separate regression equation for each language/ethnicity group. The resulting standardized regression coefficients are shown in Table 5. Coefficients for HSGPA were the largest and were nearly always sta- tistically significant ( a = . O l ) , with a
12 Educational Measurement: Issues and Practice

Table 5. Regression Equations for Predicting FGPA in Each Langwagemthnicity Group Using HSGPA, SAT-V Score, and SAT-M Score
Standardized Coefficient Standardized Coefficient Standardized Coefficient for HSGPA for SAT-V for SAT-M
Group Number and Designation 1997 1998 1997 1998 1997 1998
1 2 3 4 5 6 7 8 9
10
Latino/Other Lat i no/B i I i ng ual Asia n/Ot h e r As ian/B i I i ngu al Lat i no/E n g I i s h As i an/E ng I is h White/English African American Fi I ipino Residual
0.349* 0.357* 0.336" 0.394* 0.345* 0.349* 0.367* 0.238 0.249* 0.31 5*
0.290 0.460* 0.1 72 0.395* 0.296" 0.469* 0.297* 0.343* 0.31 6 0.354"
0.118 0.223 0.1 10 0.261 * 0.285" 0.1 98 0.1 71 * 0.008 0.231 0.1 38
0.31 7 0.1 01 0.226 0.01 3 0.306* 0.1 43 0.21 7* 0.340* 0.052 0.204*
0.083 0.049 0.201 0.045 0.080 0.058 0.088* 0.284* 0.252* 0.1 10
0.022 0.058 0.060 0.087
0.323* 0.084
-0.068 0.1 02 0.028
-0.094
____
Median coefficient 0.347 0.330 0.1 85 0.21 1 0.085 0.059
*Statistically significant at a = .01
median value of .35 in 1997 and 3 3 in 1998. This means that an increase of one standard deviation in HSGPA leads to an increase of about a third of a standard deviation in predicted FGPA, holding SAT scores constant. By contrast, the
median coefficients for SAT-V score were .19 and .21 for 1997 and 1998, re- spectively, and median coefficients for SAT-M score were only .09 and .06. The coefficient for SAT-V score was statisti- cally significant for the AsiadBilingual
group; otherwise, the SAT coefficients were not statistically significant in the Other Language or Bilingual groups.
Table 6 shows the squared correla- tion between each predictor and FGPA within each student group as well as
Table 6. Squared (Multiple) Correlations Between Academic Predictors and FGPA Group 1
HSGPA only 1997 1998
SAT-V only 1997 1998
SAT-M only 1997 1998
1997 1998
1997 1998
1997 1998
HSGPA, SAT-V, and SAT-M
1997 1998
1997 1998
SAT-V, SAT-M
HSGPA, SAT-V
HSGPA, SAT-M
SAT Incrementa
. I 3*
. I 8"
.01
.I 9*
.03
.06
.03
.I 9*
.I 4"
.26*
. I 4*
.21*
. I 5*
.26*
.02
.08
2 3 4 5 6 7 8 9 10 All
.I 3*
.20*
.06*
.01
.04
.02
.06
.02
.I 9*
.23*
.I 6*
.22*
.I 9*
.23*
.06
.03
.08*
.02
.01
.04
.03
.01
.04
.05
.I 1 *
.07
.I 3*
.03
.I 4*
.08
.06
.06
.I 2*
.I 5*
.05*
.oo
.oo
.01
.05
.01
.20*
.I 6"
.I 4*
.I 6*
.20*
.I 6*
.08
.01
.I 9*
.I o* , I 7* .08*
.I 3*
. 00
.I 9*
.09
.29*
.I 7*
.24*
.I o*
.29*
.I 7*
.I 0
.07
. I 5*
.28*
.07*
.I 6*
.03
.I 5*
.08*
.24*
.I 9*
.34*
.I 6"
.42*
.20*
.44*
.05
.I 6
.I 4"
.I 3*
.04*
.08*
.03*
.06*
.05*
.I o*
.I 7*
.I 8"
.I 5*
.I 6*
.I 8*
.I 9*
.04
.06
.07*
. I 4"
.02
.I 2*
.I o*
.01
.I o*
.I 2*
.09
.23*
.I 5*
.I 6*
.I 5*
.24*
.08
.I 0
.08*
.I 3"
.I 3*
.03
. I 5*
.07
.I 9*
.07
.20*
.I 5*
.21*
.I 5*
.25*
.I 5
.I 7
.02
.09*
.I 4*
.02*
.06*
.02*
.02*
.03*
.06*
.I 2"
.I 9"
.I 2*
.I 5*
.I 3*
.I 9*
.04
.05
.15*
.I 5*
.07*
.08*
.06*
.03*
.09*
.09*
.21*
.20*
.I 9*
.I 7*
.22*
.21*
.07
.06
*Correlation coefficient i s statistically significant at a = .01. aThe SAT increment i s the amount of increase in R2 achieved by adding SAT-V and SAT-M to HSGPA as predictors in the regression equation.
Spring 2004 13

the squared multiple correlations (R2) for each regression model that has more than one predictor. TheR2vdlues for the combined group are also given, in the rightmost column. HSGPA nearly always had the largest correla- tion with FGPA of all the predictors, as is typical. For both Other Language groups in 1998, however, SAT-V was slightly more highly correlated with FGPA than were high school grades. In fact, of the 22 squared correlations be- tween SAT-V and FGPA that appear in Table 6, the highest (.19, which corre- sponds to a correlation of .44) is for the Latino/Other group in 1998. In some instances, SAT scores were more strongly associated with FGPA than were high school grades for Filipinos and African Americans as well. In gen- eral, SAT-V tended to have higher cor- relations with FGPA than SAT-M. Using only HSGPA and SAT-V as pre- dictors was often as effective as using all three predictors.
When all three predictors were in- cluded in the model, R2 values were small to moderate, with most falling be- tween .15 and .25. A substantial excep- tion occurred for the Asian/English group, which had an R2 of .44 in 1998. For Asian Americans in both years and Latinos in 1997, prediction of FGPAwas better for the English groups than the Other Language groups. (For the Asian/ Other group, correlations were low regardless of which predictors were used.) In 1998, however, prediction was more effective for the Latiiio/Other and Latino/Bilingual groups than for either the Latino/English group or the White/ English group.
The SAT increments (the increases in R2 achieved by using the three-predictor model instead of the HSGPA-only model) were small to moderate, ranging from .01 to .17. For the combined group, the increments were .07 in 1997 and .06 in 1998. The only groups that showed an SAT increment greater than those of the combined group in both years were the Latino/English and African-American groups.
In addition to the correlations in Table 6, results that were “corrected” for range restriction were obtained using the procedure described in Gulliksen (1987, pp. 165-166). This correction is intended to adjust for the reduction in observed correlations that results because only a portion of the population of interest is available for
analysis. In the present case, the range restriction occurs because many col- lege applicants with low high school grades and test scores are not admit- ted, and, therefore, do not have FGPAs. The corrections attempt to answer the question, “What would the correlation be if the entire population were avail- able for analysis?” The corrections are only approximate because they rely on unrealistically simple assumptions about the selection process. The squared multiple correlations for all three predictors, after correction (re- ported in Zwick & Schlemer, 2002), were between .I8 and 57, and the SAT increments ranged from .01 t o .14. In general, the pattern of results was sim- ilar to that in Table 6.
Summary The goal of this research was to inves- tigate the predictive validityof the SAT for language minorities at UCSB, and to compare the validity results to those obtained for native English speakers. Freshmen who enrolled in 1997 and 1998 were included in the study. When a single regression equation (per co- hort) was estimated to predict FGPA from HSGPA and SAT scores, the three predictors, combined, produced mod- erate squared multiple correlations of just over .2 in both 1997 and 1998. For this regression model, there was some weak evidence of different intercepts for some languagdethnicity groups (specifically, the Asian/Bilingual group in both years, the Latino/Bilingual group in 1997, and the Filipino group in 1998), but no evidence of different slopes.
The degree to which this three- predictor model and several simpler models led to systematic prediction er- rors for particular groups was exam- ined. For the Other Language and Bilingual groups, using only HSGPA to predict FGPA led to substantial over- prediction. This was particularly true for Latino students, where the over- prediction sometimes exceeded a quarter of a grade point. Including SAT scores in the regression equation sub- stantially improved prediction accu- racy, except in the Asian/Bilingual group, where overprediction of at least .12 occurred in all regression models. The reason for this unusual pattern among the Asian/Bilingual students is not obvious.
Estimation of separate correlations and regression equations within the languagdethnicity groups showed that HSGPAwas nearly always the strongest of the three predictors, as is typical. For both Other Language groups in 1998, though, the SAT-V score was more highly correlated with freshman grades than was HSGPA. The SAT-M score was nearly always the weakest of the three predictors. In fact, the multi- ple correlation for HSGPA and SAT-V, combined, was typically almost as large as the multiple correlation for all three predictors. With all three predictors in the regression model, most of the squared multiple correlations for the languagekthnicity groups fell between .15 and .25. For this model, prediction was less effective for language minority groups than English groups in 1997, but the reverse pattern held for the Latino students in 1998.
This study demonstrates that test scores play an important role in predict- ing the freshman grades of language mi- nority students at UCSB. Using high school grades alone to predict college grades led to substantial prediction bias for the language minority groups. Also, for the two Other Language groups in 1998, SAT-V score was more highly cor- related with FGPA than was HSGPA. This finding suggests the possibility that lan- guage minorities who are accepted through the University of California’s “4% Plan,” which provides for automatic ad- mission of students in the top 4% of their high schools, may not perform as well as anticipated at the university.
A more general conclusion that can be drawn from this study is that com- bining native and non-native speakers of English can obscure important in- formation about test validity. For exam- ple, consider the regression results in Table 4 for the three Asian-American groups in 1998. In nearly every regres- sion model, overprediction occurred for the Other Language and Bilingual groups, whereas underprediction oc- curred for the Englishgroup. These dis- tinctions would have been entirely obscured if these groups had been com- bined into a single “Asian-American” category.
A key drawback of the current analy- ses is the absence of specific language information. Data were not available on the primary language of the students, if it was not English. Whereas it is ex- tremely likely that the first language
14 Educational Measurement: Issues and Practice

was Spanish for Latino students, we know that the Asian/Other Language group is much more heterogeneous. In addition, the large amount of missing language and ethnicity data for the 1998 cohort complicates the interpretation of the results and makes extrapolation particularly risky.
To address these problems and to test the generalizability of the findings, Zwick and Sklar (2003) performed a subsequent study of SAT validity using nearly 5,000 students from the 1980 sophomore cohort of the High School and Beyond (HSB) survey conducted by the National Center for Education Statistics. The HSB database was cho- sen in part because it includes specific information about the respondents’ pri- mary language. Zwick and Sklar (2003) divided students into four groups based on their responses to questions about race, ethnicity, and first language spo- ken as a child. Individuals who indi- cated that they were of Hispanic origin and that their first language was Spanish were placed in the HispaniclSpanish group. BlacklEnglish, HispanielEnglish, and WhitelEnglish groups were analo- gously defined.5
In some respects, the results resem- bled those of the current study. In the combined-group regression analysis that included SAT and HSGPA, a squared multiple correlation of .22 was obtained, essentially the same as the results re- ported here. In addition, FGPA was overpredicted for Black and Hispanic students when only HSGPAwas used as a predictor. But in the HSB study, un- like the current study, overprediction was more substantial for the Hispanic/ English group than for the Hispanic/ Spanish group. Also, in contrast to the current study, substantial over- prediction remained even when SAT score was included in the prediction equation.
The regression results for the HSB data, which are fully described in Zwick and Sklar (2003), often showed substantial differences between the Hispanic/English and the Hispanic/ Spanish groups, as did the results of survival analyscs, performed to study patterns of college graduation. Post hoc analyses were conducted to explore these disparities in findings for the two Hispanic groups. Like the current re- search, the Zwick and Sklar study sup- ported the conclusion that it is essential
to consider students’ language back- ground along with their ethnicity when investigating the utility of college ad- missions criteria.
Notes We are grateful to the University of California Linguistic Minority Research Institute (UC LMRI) for supporting this project under the UC LMRI Grants Program. Opinions reflect those of the authors and do not necessarily reflect those of the grant agency. We would also like to thank Steven Velasco, Director of Institutional Research and Planning at UCSB, for supplying the data and providing consultation. A more de- tailed account of this research appears in an LMRI report (Zwick & Schlemer, 2002).
‘The test under investigation in this study was the SAT I: Reasoning Test. The SAT 11: Subject Tests were not included. Also, note that, although we use the term “Latino” in our study, we have retained the original eth- nic group labels when referring to other studies or data bases.
21n large samples, the SEE is approxi-
mately cqual to m ( S D ) ~ where R is the estimated correlation or multiple corre- lation, andSD is the estimated standard de- viation of FGPA. Pennock-Roman argues that comparing the SEES for the two stu- dent groups within an institution is more useful than comparing the correlations since the SEE takes into account the vari- ability of FGPA as well as the relation be- tween FGPA and the predictor variables. As she points out, comparisons of the SEE across institutions may be problematic since the FGPA units may not have a com- mon meaning across schools.
”he research wa,s intended as a pilot study to determine the feasibility of con- ducting this type of analysis for language groups. We also planned to use survival analysis techniques to investigate the degree to which SAT and high school grades pre- dicted degree completion, but the required data were not available. As described in the Summary, further analyses have now been conducted using a larger data set.
“The adjusted RZ value, which corrects for thc upward bias in sample estimates of multiple correlations, decreased (1997) or stayed the same (1998) when the inter- action terms were added.
"The ethnic group labels used in the HSB documentation have been retained here.
References Atkinson, R. (2001, February).Standardked
tests and access to American universities. The 2001 Robert H. Atwell Distinguished Lecture, delivered at the 83rd Annual Meeting of the American Council on Education, Washington, DC.
Atkinson, R. (2004). Achievement versus ap- titude in college admissions. In R. Zwick (Ed.), Rethinking the SAT The future of standardized testing in uniiiersity ad- missions. New York: RoutledgeFalmer,
Breland, H. M., & Duran, R. P. (1985). Assessing English composition skills in Spanish-speaking populations. Educa- tional and Psychological Measurement,
Bridgeman, B., McCamley-Jenkins, L., & Ervin, N. (2000). Predictions offreshman grade-point average f r o m the revised and recentered SAT I: Reasoning Test (Research Report No. 2000-01). New York: College Entrance Examination Board.
Cleary, T. A. (1968). Test bias: Prediction of grades of Negro and White students in in- tegrated colleges. Journal ofEducationa1 Measurement, 1968,5, 115-124.
Duran, R. P. (1983). Hh-panics’ education and background: Prediclors of college achievement. New York: College Entrance Examination Board.
Duran, R. P. (1988). Validity and language skills assessment: Non-English back- ground students. In H. Wainer & H. I . Braun (Eds.), Test Validity, pp. 105-127. Hillsdale, NJ: Erlbaum.
Fuertes, J. N., Sedlacek, W. E., & Liu, W. M. (1994). Using the SAT and noncognitive variables to predict the grades and reten- tion of Asian American university stu- dents. Measurement and Evaluation in Counseling and Development, 27, 74-84.
GBndara, P., & Lbpez, E. (1998). Latino stu- dents and college entrance exams: How much do they really matter? Hfkpanic Journal ofBehuviora1 Sciences, 20, 17-38.
Garcia, E. E., Jorgensen, R. E., &Ormsby, C. (1999). How can public universities still admit a diverse freshman class? Journal ofCollegeAdmission, 164, 5-11.
Gulliksen, H. (1987). Theory of mental tests. Hillsdale, NJ: Erlbaum.
Pearson, B. Z. (1993). Predictive validity of the Scholastic Aptitude Test (SAT) for Hispanic bilingual students. Hispanic Journal of Behavioral Sciences, 15,
Pennock-Roman, M . (1990). Test validity and language background: A study of Hispanic American students at s ix uni- versities. New York: College Entrance Examination Board.
Pennock-Roman, M. (1993). The sta.tus of research on the Scholastic Aptitude Test (SAT) and Hispanic students in postsec- ondary education. In B. R. Gifford (Ed.), Policy perspectives on educational test- ing (pp. 75-115). Boston: Kluwer.
Ramist, L., Lewis, C., & McCamley-Jenkins, L. (1994). Student group dflerences in predicting college grades: Sex, language, and ethnic groups (Research Report No. 93-1). New York: College Entrance Examination Board.
pp. 15-23.
45, 309-318.
342-356.
Spring 2004 15

Reynolds, C. R. (1982). Methods for detect- ing construct and predictive bias. In R. A. Berk (Ed.), Handbook of methods f o r detecting test bias. Baltimore: Johns Hopkins University Press.
Sue , S., & Abe, J. (1988). Predictors of academic achievement among Asian American and Whitestudents (Report No. 88-11). New York: College Entrance Examination Board.
University of California. (April 1998). “1998’s admissions figures make visible the impact affirmative action had on UC.”
Notice> A Publication of the Academic Senate. 22(6), 1,4.
Young, J. W. (2001). Dgerential validitg) dgerential prediction, and college ad- missions testing: A comprehensive re- view and analysis (Research Report No. 2001-6). NewYork: The College Board.
Zwick, R. (2002). Fair game? The use oj standardized admissions tests in higher education. New York: RoutledgeFalmer.
Zwick, R., & Schlemer, L. (April 2002).How well does the SATpredict college grades for language minoritg studentsZA study
of two freshman cohorts at UC Santa Barbara (University of California Lin- guistic Minority Research Institute Report series). Retrieved April 15, 2002, from www.lmri.ucsb.edu
Zwick, R., & Sklar, J. (2003). Do SATscores and high school grades predict college success?A stud3 of collegegrades and de- gree completion in four language and ethnic groups. Final report, American Educational Research Association Grants Program, University of California, Santa Barbara.
16 Educational Measurement: Issues and Practice