Sardar Patel University
166
-
Upload
khangminh22 -
Category
Documents
-
view
1 -
download
0
Transcript of Sardar Patel University


28th National Conference on Agricultural Marketing
i
Welcome………………….. Welcome to the 28th Annual Conference of the Indian Society of Agricultural Marketing at Vallabh Vidyanagar, Anand. This conference has a special significance for us because it is being organized when the Agro-Economic Research Centre has completed the 53rd year of its working at Vallabh Vidyanagar. We have great pleasure in presenting this Souvenir Volume to the distinguished delegates and other invitees to this Conference. As the people of this region are known for their initiative and enterprise, an attempt has been made here to introduce some of the major institutions working for the cause of rural development in this area. It is hoped that these profiles would indicate how really worthwhile results could be achieved by the people given the vision and a right sense of direction and purpose. Indeed the work of promoting a complex of institutions in and around Vallabh Vidyanagar has been of a pioneering nature. This has been achieved mainly through conscious and planned efforts backed up by sustained hard work. Organization of this Conference has become possible mainly because of the joint efforts of a complex of institutions working in and around Vallabh Vidyanagar such as Agro-Economic Research Centre and PG Department of Economics of the Sardar Patel University, Dept. of Agricultural Economics (BACA) & International Agri-Business Management Institute of Anand Agricultural University, Anand. We gratefully acknowledge the excellent support and cooperation that we have received from various individuals and institutions in organizing this Conference and in preparing this Souvenir Volume.
Editors

28th National Conference on Agricultural Marketing
ii
The Conference is supported by
Ministry of Agriculture,
Govt. of India
Nice Steel Furniture Charutar Vidya Mandal
Mohini Caterers & Mohini Corner White Wagon Pvt. Ltd.
Apollo Munich Health Insurance Adhya Shakti Travels
~) B]rv a[Ãy&m)n)ym a[ºD p).v).s). Di[r~) B]rv a[Ãy&m)n)ym a[ºD p).v).s). Di[r~) B]rv a[Ãy&m)n)ym a[ºD p).v).s). Di[r~) B]rv a[Ãy&m)n)ym a[ºD p).v).s). Di[r Brick Publications
Nishi Techno System Lynx Communications Systems Pvt. Ltd. R. R. Computer & New Regal Electricals
Jaiswal Enterprise D. N. Mistry
Fabri Circle Interior Combination Verma Bag ™
Dena Bank

28th National Conference on Agricultural Marketing
iii
Contents
Messages Committees
About…….
Sardar Patel University, Vallabh Vidyanagar
3
About Agro-Economic Research Centre, Vallabh Vidyanagar
17
Anand Agricultural University, Anand
23
Charutar Vidya Mandal, Vallabh Vidyanagar
29
Charutar Arogya Mandal, Karamsad
31
Institute of Rural Management Anand (IRMA)
35
Gujarat Cooperative Milk Marketing Federation Ltd, Anand
39
Sardar Patel Education Trust, Anand
43
Gujarat State Agricultural Marketing Board, Gandhinagar
45
Articles…….
Agricultural Performance in Gujarat: Recent Experiences by Mrutyunjay Swain, S.S. Kalamkar and Kalpana Kapadia
47
Diversification of Cropping Pattern during Recent Decade in Gujarat by V. K. Gondalia and Y.C. Zala
71
Water Resources Management in Gujarat by S. S. Kalamkar
91
Oilseeds Economy of Gujarat: Growth Determinants & Challenges by Mrutyunjay Swain
119
Announcements……. 145
Advertisements……..
147

28th National Conference on Agricultural Marketing
iv

28th National Conference on Agricultural Marketing
Dr. Harish Padh
The globalisation of Indian agriculture has resulted in the need for the production of export-oriented quality products having competitive advantage. Introduction of reform in agricultural marketing is structure. The linkage between agribusiness firms and farmers isof research and policy in the wake of the new economic environment which emphasizes competitiveness not only in price but also in quality. An important element of this quality improveof raw materials, which is prone to problems of nonand lack of appropriate timing. Indian Society of Agriculton Agricultural Marketing on these themes, state agricultural acts, role of women in agricultural marketing and agribusiness initiatives in Gujarat. Agrohost this national conference in our University campus along with of Economics, SPU, Vidyanagar; Department of Agricultural Economics, BACA, AAU & Dept of ABE&P, IABMI, AAUcomplement the AERC staff
I am certain that Conference will be well attended by the academicians and researchers and they will be able to address the marketing issues of the country and serve as an appropriate forum for discussing their concerns on marketing of agricultural produce.
I extend a hearty welcome to the participants of the conference and wish the organizers all the success.
Place: Vallabh VidyanagDate: 28.11.2014
National Conference on Agricultural Marketing
v
Sardar Patel University,Vallabh Vidyanagar, Anand
MESSAGE
of Indian agriculture has resulted in the need for the production of oriented quality products having competitive advantage. Introduction of reform
in agricultural marketing is also need of the hour to bring the requisite changes in its linkage between agribusiness firms and farmers is
of research and policy in the wake of the new economic environment which competitiveness not only in price but also in quality. An important
element of this quality improvement and cost reduction paradigm is the procurement of raw materials, which is prone to problems of non-availability, low quality, high cost and lack of appropriate timing. In this context, it is appropriate and relevant that the Indian Society of Agricultural Marketing is organizing the 28th National Conference on Agricultural Marketing on these themes, viz., interface of organized re
acts, role of women in agricultural marketing and agribusiness Agro-Economic Research Centre of our University is
host this national conference in our University campus along with of Economics, SPU, Vidyanagar; Department of Agricultural Economics, BACA, AAU
Dept of ABE&P, IABMI, AAU, AAU, Anand during December 4complement the AERC staff and other organizers.
I am certain that Conference will be well attended by the academicians and researchers and they will be able to address the marketing issues of the country and serve as an appropriate forum for discussing their concerns on marketing of
extend a hearty welcome to the participants of the conference and wish the all the success.
Vallabh Vidyanagar (Harish Padh
Vice Chancellor, Sardar Patel University,
Vallabh Vidyanagar, Anand
of Indian agriculture has resulted in the need for the production of oriented quality products having competitive advantage. Introduction of reform
need of the hour to bring the requisite changes in its linkage between agribusiness firms and farmers is an important topic
of research and policy in the wake of the new economic environment which competitiveness not only in price but also in quality. An important
ment and cost reduction paradigm is the procurement availability, low quality, high cost
n this context, it is appropriate and relevant that the National Conference
nterface of organized retailing and acts, role of women in agricultural marketing and agribusiness
Economic Research Centre of our University is pleased to host this national conference in our University campus along with P.G. Department of Economics, SPU, Vidyanagar; Department of Agricultural Economics, BACA, AAU
during December 4-6, 2014. I
I am certain that Conference will be well attended by the academicians and researchers and they will be able to address the marketing issues of the country and serve as an appropriate forum for discussing their concerns on marketing of
extend a hearty welcome to the participants of the conference and wish the
Harish Padh)

28th National Conference on Agricultural Marketing
vi
Vice Chancellor Anand Agricultural University,
Anand
Dr. N.C. Patel
MESSAGE
It gives me immense pleasure to know that the 28th National Conference on Agricultural Marketing is jointly organized by Indian Society of Agricultural Marketing & Agro-Economic Research Centre, Sardar Patel University, Vallabh Vidyanagar, Anand in Collaboration with P.G. Department of Economics, SPU, Vidyanagar; Department of Agricultural Economics, BACA, AAU & International Agribusiness Management Institute, AAU, Anand during December 4-6, 2014.
All the three themes selected for the conference viz., interface of organized retailing and state agricultural acts, role of women in agricultural marketing and agribusiness initiatives in Gujarat State are important as exhibiting best Agro GDP ranging from 9.6 to 12.4 per cent and also very well in the line with the dynamic need of the farmers. Marketing of the produce is the key factor today for the farm produce in our country and the same is true after first green revolution since 1960s and thereafter whenever the agricultural production was an overriding objective since half century. This necessitates to be analyzed and understood mainly from the perspective of existing rules and regulations which may require some modifications to reap up the benefits at farmers end. Significance of women in agriculture in general and in agricultural marketing in particular is poorly documented as also underestimated in the country. The present conference will discuss such issues to help the policy makers.
Studies in the recent past, conducted by renowned institutions including International Food Policy Research Institute and some researchers have amply tried to establish that Gujarat model of agriculture development is now the light house for other states in the country. This conference, by choosing one of its themes on agribusiness initiatives in Gujarat, will provide opportunity to the august participants to understand Gujarat model with focus on agribusiness and suggest how far this can be replicated in other states to uplift India’s Agricultural GDP.
I am sure that the proceedings of the conference will be of immense help to the planners, policy makers, academicians, students & all those interested in the agricultural marketing. I wish the conference a grand success.
Place: Anand Date: 10.11.2014 (N C Patel)

28th National Conference on Agricultural Marketing
Dr. S. S. Kalamkar Professor & Director
I am extremely happy in welcoming you all to theIndian Society of Agricultural Marketing at our University Campus, iwith P. G. Department of EconomicsAAU, Anand and Dept of ABE&P, IABMI, AAU2014.
I hope that the conference will provide ample opportunities and excellent platform to academicians, researchers, policy makers country to review the selected for this conference
I take this opportunity to thank Dr. Harish Padh, our University and Chairman of AERC, Vorganize this conference. I am also highly thankful to Dr. Mahesh Pathak, Adviser, AERC for his guidance and support in organizing this event. I thankSociety of Agricultural Marketingin Vallabh Vidyanagar.Department of Agricultural Economics, BACA, Anand aAnand and Dept of ABE&P, IABMI, AAUsupport and cooperation
Last but not least I am highly thankful to all the committee members of this conference and my staff, friends from academic community, directly and indirectly in organizing this Conference.
Place; Vallabh Vidyanagar Date: 28.11.2014
National Conference on Agricultural Marketing
vii
From the Desk of the Organizing
I am extremely happy in welcoming you all to the 28th Annual Conference of the Indian Society of Agricultural Marketing at our University Campus, iwith P. G. Department of Economics, Department of Agricultural Economics, BACA,
Dept of ABE&P, IABMI, AAU, AAU, Anand during December 4
I hope that the conference will provide ample opportunities and excellent academicians, researchers, policy makers and corporate managers in our
selected for this conference.
I take this opportunity to thank Dr. Harish Padh, HonorableUniversity and Chairman of AERC, Vallabh Vidyanagar for giving consent to
nference. I am also highly thankful to Dr. Mahesh Pathak, for his guidance and support in organizing this event. I thank
Society of Agricultural Marketing for giving us an opportunity to hostanagar. I thank P.G. Department of Economics SPU, VVN;
ricultural Economics, BACA, Anand and Agricultural University, Dept of ABE&P, IABMI, AAU, AAU, Anand all for their special interest
and cooperation in organizing this Conference.
Last but not least I am highly thankful to all the committee members of this conference and my staff, friends from academic community, directly and indirectly in organizing this Conference.
allabh Vidyanagar (S. S. Kalamkar)
From the Desk of the Organizing Secretary
Annual Conference of the Indian Society of Agricultural Marketing at our University Campus, in collaboration
, Department of Agricultural Economics, BACA, during December 4-6,
I hope that the conference will provide ample opportunities and excellent and corporate managers in our
Honorable Vice Chancellor of for giving consent to
nference. I am also highly thankful to Dr. Mahesh Pathak, Hon. for his guidance and support in organizing this event. I thank Indian
for giving us an opportunity to host this conference P.G. Department of Economics SPU, VVN;
nd Agricultural University, all for their special interest,
Last but not least I am highly thankful to all the committee members of this conference and my staff, friends from academic community, who have helped
(S. S. Kalamkar)

28th National Conference on Agricultural Marketing
1
Committees
Conference Advisory Committee: Dr. Harish Padh, Vice Chancellor, SPU, VVN Dr. N. C. Patel, Vice Chancellor, AAU, Anand Dr. Y. K. Alagh, Chancellor, Central University, Gujarat Dr. V. S. Vyas, Former Member, PM Economic Advisory Council Dr. R. Radhakrishana, President, ISAM Dr. P. K. Joshi, Director South Asia, IFPRI Dr. S. S. Acharya, Former Chairman, CACP, GOI Dr. Mahesh Pathak, Former, Chairman, APC, GOG Dr. S. S. Kalamkar, Director, AERC, SPU (Convener)
Conference Organizing Committee
Dr. H. P. Trivedi, Dean, Faculty of Arts, SPU, VVN Dr. Mohan Patel, Registrar/OSD, SPU, VVN Dr. T. Satyanarayana, Hon. Secretary, ISAM Dr. D. J. Chauhan, Head, Dept of Econ, SPU Dr. Y. C. Zala, Head, Dept of Agril. Econ, BACA, AAU Dr. R. S. Pundir, Head, Dept of ABE&P, IABMI, AAU Dr. S. S. Kalamkar, Director, AERC, SPU (Convener)
Reception Committee:
• Dr. Harish Padh, Vice Chancellor, SPU, VVN • Dr. N. C. Patel, Vice Chancellor, AAU, Anand • Dr. Mohan Patel, Registrar/OSD, SPU, VVN • Dr. D. J. Chauhan, Head, PG Dept of Econ., SPU, VVN • Dr. Y. C. Zala, Head, Dept of Agril. Econ., AAU, Anand • Dr. R. S. Pundir, Asso. Prof. Dept of ABE&P, IABMI, AAU • Dr. S. S. Kalamkar, Director, AERC, SPU, VVN
Souvenir Committee:
• Dr. S. S. Kalamkar • Dr. D. J. Chauhan • Dr. Y. C. Zala • Dr. R. S. Pundir • Dr. M. N. Swain • Dr. S. R. Bhaiya • Shri Deep Patel
Accommodation Committee • Dr. S. R. Bhaiya • Shri Gopal Machhi • Shri R. I. Patel • Shri T. B. Parihar • Shri Manish Makwana • Shri J. N. Singh • Shri Hemal Padhiyar • Shri Manishkant Ojha
Publication Committee: • Dr. S. S. Kalamkar • Dr. Y. C. Zala • Dr. Satyanarayana (ISAM) • Shri V. K. Gondaliya (AAU) • Dr. K. S. Jadhav (AAU) • Shri Deep Patel • Shri Rupesh Mistry • Shri Mihir Rana
Food Committee • Shri Gopal Machhi • Shri R. I. Patel • Shri D. N. Thakkar • Shri Manish Makwana

28th National Conference on Agricultural Marketing
2
Transport Committee • Dr. S. R. Bhaiya • Shri Gopal Machhi • Shri Brijesh P. Pandya • Shri Hitesh Makwana • Shri Mihir Rana • Shri Jaswant N. Singh • Mr. Faruk G. Vahora • Shri Manishkant Ojha • Shri T. B. Parihar • Shri N. G. Chauhan • Shri Kalpesh Dhabi
Auditorium Arrangement • Dr. Mrutunjay Swain • Dr. Sunil Singh • Ms. Kalpana Kapadia • Shri Vinod Parmar • Shri Rupesh C. Mistry • Shri Mikin S. Patel • Ms. Bhoomika S. Padhiyar • Ms. Priyanka J. Patel
Technical Session I • Dr. S. R. Bhaiya • Dr. P. K. Agarwal • Shri Rupesh C. Mistry • Shri Thansingh Parihar
Technical Session II • Dr. Ganga Devi • Dr. Rutumbhara Singh • Shri Mikin S. Patel • Shri Vinod Parmar
Technical Session III
• Dr. Mrutunjay Swain • Dr. K. S. Jadhav (AAU) • Ms. Kalpana Kapadia • Mr. Faruk G. Vahora
Banner display, etc • Shri Manish Makwana • Shri N. G. Chauhan • Shri Kalpesh Dhabi
Newspaper, TV Coverage, Entertainment Programme
• Shri Deep Patel • Shri Mihir Rana
Photography Arrangements
• Shri Vinod Parmar • Shri Thansingh Parihar
Distribution of Kit/Bag
• Shri B. A. Pathak • Shri A. M. Patel • Shri Bhavesh Solanki
Anchor/Announcements • Shri Brijesh P. Pandya • Shri Thansingh Parihar
Registration Fee Collection, Distribution of receipt
• Shri D. N. Thakkar • Shri P. J. Patel • Shri N. J. Amin • Ms. Priyanka J. Patel
Certificate distribution • Shri P. J. Patel • Shri Bhavesh Solanki • Shri Deep Patel • Ms. Kalpana Kapadia • Ms. Priyanka J. Patel
Overall Coordination
Dr. S. S. Kalamkar Dr. S. R. Bhaiya

28th National Conference on Agricultural Marketing
3
Sardar Patel University, Vallabh Vidyanagar
This University was established on 15 December 1955 by an Act of the Legislative Assembly of the then Bombay Province and survived on its own for 13 long years when it received recognition as a university by the UGC under the Sections 2f and 12 (B) of the UGC Act, vide their letter No. F.13-7/68 (CD) dated 9 October 1968.
Motto: “Shīl vritta phalam shritām: Character and Conduct are the Fruits of Learning.”
Vision To keep in pursuit of academic excellence and regeneration of rural Indian life with the application of the study and research in all the disciplines of knowledge in concurrence with the modern global developments. Mission To achieve global standards of quality through innovative teaching and learning, quality research, and enhanced developmental activities by imparting high class customized academic and vocational training, striving to develop citizens with knowledge, skills, attitudes and values with a view to effectively contribute towards national development through societal transformation, industrial growth and rural development. Other Distinctive Features of the University
� 09 of the 25 Postgraduate Departments in the University identified and funded
under UGC programmes such as SAP (DRS), COSIST, FIST etc. � The first and the only university in Gujarat and one of the 17 universities in the
country to gain the status of “Centre for Excellence in Applied Polymers” from the UGC in 2004-2009.
� The first university in Gujarat to sign an MoU with Pennsylvania State University
and offer an Integrated MSc (Information, Science and Technology from the academic year 2009-10.
� The first among the universities in Gujarat and Rajasthan to gain accreditation
from the NAAC in 2000, re-accreditation in 2009, and enhanced grade points on a successful appeal to NAAC in 2011.
� One of the first two universities in the country to have signed a Memorandum of
Understanding (MoU) with Prasar Bharati for the establishment of a Community Radio Station (that has been functioning since 2005).

28th National Conference on Agricultural Marketing
4
Some of the Other Achievements and Features of the University
� Engaged in the pursuit of academic excellence and regeneration of rural Indian
life through study of and research in contemporary disciplines like IT, Computer Applications, Genetics, Materials Science, Nano Technology etc.
� Has a constituent college alongside 26 Postgraduate Departments and 91
affiliated colleges/institutions. � Engaged in the study of and research in 11 Faculty Disciplines like Arts,
Commerce, Management, (Structural) Engineering, Pharmacy, Medicine, Homeopathy, Home Science, Law, and Education. Postgraduate and Undergraduate Degree Courses, PG Diploma Courses, Diploma Courses and Advanced Certificate Courses are on offer in all these faculty disciplines.
� One of the special features of the University are supportive services like Central
Library, University Scientific Instrumentation Centre (USIC), Agro-Economic Research Centre, Sardar Patel Renewable Energy Research Institute (SPRERI), International Students Centre (ISC), Computer Centre (with UGC-INFONET connectivity), University Museum, University Health Centre, University Press, Community Science Centre, University Canteen etc. This helps in satisfying the R&D needs of the University and Industry.
� This is the first and the only university in India to publish a collection of 30
volumes of scholarly works on all aspects of knowledge of the world and experience under the title “Gnan Gangotri” in Gujarati.
A. Chairs The University has established the following chairs: o MBA Chair (Sponsor: Corporation Bank) o Bhaikaka Chair o Sri Aurobindo Chair of Integral Study o Dr Baba Saheb Ambedkar Chair o Shri Mota Chair of Extension of Educational Thinking o CVM Centre for Gandhian Studies o Sardar Patel Chair o UGC Gandhian Studies Centre o Sardar Vallabhbhai Patel Studies Centre
These chairs have been established to bring in community orientation to the activities undertaken by the University. The University (a) has provided infrastructural facilities for the establishment of Kendriya Vidyalaya (Central School) on the University Staff Colony campus; (b) supports a small organization called “Sanskar Mandal” to carry out community orientation activities throughout the year; and (c) arranges endowment lectures for the same purpose.

28th National Conference on Agricultural Marketing
5
B. Centes Centre of Excellence in Applied Polymers and Related Areas The University had set up a Centre for Excellence in Applied Polymers and Related Areas with recognition from the UGC with a generous support of Rs.5 crore to utilize the existing potential and strengths of faculty members from diverse fields with the aim of: (a) developing high performance polymers for defence, atomic energy, electronics, transport and consumer, and public and public systems-related industries; (b) modelling and computer simulation of synthesis and structure of new polymers; (c) teaching and training; (d) characterizing, testing and evaluating; and (e) developing optimal solutions for industrial and allied problems. The participating Departments are those of Chemistry, Biosciences, Computer Science, Physics and Materials Science. It completed 5 years in 2009. We have now applied to the UGC under University with Potential for Excellence (UPE) recently. UGC Centre for Advanced Studies in Carbon Composites and Carbon Nano Material GUJCOST Centre of Excellence in Nano Science and Materials Recognizing the research achievement of the Department of Materials Science in the area of carbon related research, the UGC has accorded the Department the status of Centre for Advanced Studies in Carbon Composites and Carbon Nano Materials. The Government of Gujarat has also accorded the Department the status of a Centre of Excellence in Nano Science and Materials. We propose to strengthen the activities of the Department to extend the work on application of Nano Materials in Composites and other advanced areas of strategic importance under the programme. University Computer Centre The computer centre of Sardar Patel University is the central hub for providing software and hardware solutions to the entire campus. All the major tasks of various sections like Establishment, Examination, Academic, USIC and Accounts are computerized with the help of the Computer Centre. Payroll processing, Examination Results Processing (Pre, On and Post), Budget preparation, major report preparation, Centralized Admission process, etc. are some of the key activities at the computer centre. Internet connectivity under UGC-Info net is provided to various Departments and sections of the University by the computer centre. It includes new connections, maintenance of existing connections and anti-virus solutions. Apart from the regular MIS activities, the computer centre provides assistance in purchasing of computer hardware and software to the entire university. The computer centre conducts practical for the postgraduate students of Departments of Bio-Sciences and Home Sciences. The same facility is extended to BEd students also. The computer centre also conducts training and orientation programmes for Teaching faculty and Non-teaching staff.

28th National Conference on Agricultural Marketing
6
Community Science Centre We believe that a Community Science Centre (CSC) is a common place where children, their teacher and general citizen can come and know about Science and Technology. We perceive such a centre as one that can become an oasis of knowledge, information and public awareness by providing us with a common platform for discussing issues related to Science and Technology. The working of the CSC is generally informal and usually it aims to strengthen science education through various activities. The general objectives of the CSC in the University are (1) to carry out activities that motivates the students of school and colleges towards a sound learning of science; (2) to inculcate broad scientific view, love for nature and care for the environment in the society in general; (3) to provide a forum for healthy discussion on aspects of education, training and researches in Science and Technology; and (4) to celebrate specific occasions like National Nutritional Week, Wild Life Week, National Science Day, National Technology Day etc with appropriate programmes. Its functional objectives are (a) to promote dissemination of knowledge in science and Technology to our rural as well as urban communities, particularly to children in an entertaining manger; (b) to communicate to our society, the impact of these scientific developments; (c) to give suitable programmes and activities for students, teachers and common public; and (d) to collaborate with other organizations and institutions on specific programmes. International Students Centre High quality of education, need-based specialized contemporary programmes and a highly professional work culture in self-financed institutes and programmes have started attracting a large number of students from outside Gujarat. The International Students Centre (ISC) of this University was founded in June 2004 in the academic year 2004-05. It was established by the University: (a) to assist the International Student Community by providing information about the various courses offered, admission procedure, eligibility criteria, fees charged etc, and (b) to arrange for their admissions, help them settle down quickly and happily in their studies, and take care of their welfare. The University attracts quite a good number of foreign students every year. Since its inception, the ISC coordinates all the activities related to the admission of international students through a Single Window System. The ISC also coordinates with Indian Council for Cultural Relations (ICCR), Ministry of External Affairs (MEA), and with different Embassies and Consulates for various purposes including assisting the international students to obtain Student Visa, Scholarships etc. The ISC participated in PIHEAD Programme at the Higher Education Fair organized jointly by UGC and FICCI in Kenya, Mauritius, and Ethiopia etc (representative: Professor Narsimhachari) and in Sudan (representative: the late Professor R K Prabhakar) in 2004-05. Professor H J Jani represented the University in such a Fair organized in Mauritius in 2005-06. Professor J H Khan is the current Honorary Director, International Students Centre in the University.

28th National Conference on Agricultural Marketing
7
This Centre has been handling admissions to foreign/NRI/NRI-Sponsored students under a single-window system since its inception in 2004. The number of students had increased over a period of time. Centre for Training and Research in Language and Communication The Centre for Training and Research in Language and Communication (CTRLC) was set up along with the ISC to complement the work of the latter. Catering to the development of Communication Skills in English has a two-fold aim: (1) to provide training in language and communication to foreign students, various sections of the society such as students from academic institutions, personnel drawn from corporate organizations and industries etc so as to help them develop fluency and accuracy in language use and to overcome the problems faced in communication, and (2) to engage in further research in language and communication on the basis of the feedback it gets on the effectiveness of its programmes through its faculty and trainees on the one hand and client organizations on the other. Established in 2004, the Centre has trained three batches of a total of 29 students on a three-month Advanced Certificate Course in Communication Skills in English, besides training 18 Thai and 2 Chinese scholars from the ISC; 11 Doctors and 03 Doctors’ spouses on a request from Anand Consultant Doctors’ Association, Anand; 16 members of the mid-level technical and managerial staff of IDMC, Vitthal Udyognagar. Today, it also serves as a centre for imparting training in Academic Writing and Presentation Skills to MPhil and PhD scholars under CELT Project – an initiative taken by the Honourable Vice Chancellor of the University. Centre for Excellence under the Government of Gujarat The Department of Political Science was awarded a Centre for Excellence by the Government of Gujarat for a project of Research, Writing and Publication on the theme Ethics in Indian Politics and Public Administration with Special Reference to the Lives, Thoughts, and Contributions of Mahatma Gandhi, Sardar Patel, Vitthalbhai Patel and H M Patel. Centre for Canadian Studies The University has recently established a Centre for Canadian Studies as a collaborative initiative taken by the Departments of English and Political Science of the University. While the Department of English has been given the responsibility of coordinating the activities of the Centre, all Departments of the University participate in the activities undertaken by the Centre. The Department of English has taken up studies in Multiculturalism. Women’s Studies Centre The establishment of the Women’s Studies Centre in the Department of Home Science was made possible in the X-Plan period thanks to a generous grant of Rs.50 lac vide UGC letter No: C/X-Plan/WS/Home Sci./7518 dated 15 February 2005. The Centre has devoted itself to field studies, organised seminars and expert lectures on various aspects of women’s studies, and is currently in the process of getting two

28th National Conference on Agricultural Marketing
8
books commissioned by it on history translated from Gujarati into English. The Gujarati and the English versions of the books will be published by the University Press at Sardar Patel University. The centre aims at capacity building in the educated, employed woman with regard to managerial abilities such as communication skills, administrative skills, confidence building etc and along with this facilitating support systems such as research, day-care-centres, old age homes etc. on one hand and on the other, the centre will focus upon entrepreneurship skill building in unemployed women from a slighter wider age group such as adolescents, college girls, housewives and others from different SES. The Centre has identified two categories, namely the educated and employed women and the unemployed women, college goers, teens etc ranging from the literate to the illiterate. Computer literacy has also been identified as an essential skill, which needs to be imparted to women. Centre for Diaspora Studies The Centre for Diaspora was established in the Department of Sociology in the X-Plan period thanks to a generous grant of Rs.10 lac for the period up to 31 March 2007. The Centre devoted itself to field studies, and expert lectures covering the Indian Diaspora, and published monographs through the University Press at Sardar Patel University. The Centre organised (a) International Seminar on Indian Diaspora sponsored jointly by the UGC and ICSSR on 4-5 January 2005; and (b) International Conference on Indian Diaspora Profile, Position Diaspora Profile, Position and Problems of Indian Diaspora 21-22 January 2006. Both the Seminar and Conference attracted a large number of delegates from abroad. It completed Phase-II on 31 March 2014. Agro-Economic Research Centre for Gujarat and Rajasthan (AERC) The Ministry of Agriculture, Government of India established AERC at Vallabh Vidyanagar as an associated institution of Sardar Patel University in 1961. The centre has been functioning in close collaboration with the Department of Economics, Sardar Patel University ever since its inception. It has a full-time Professor appointed exclusively to guide and supervise its activities as Director. This association has been mutually beneficial to the Centre and the Department, with the result that it has helped the Department strengthen its teaching and research in Economics substantially. The Ministry of Agriculture, Government of India has also assigned to the AERC and the Department of Economics, Sardar Patel University a Cell called the Cost of Cultivation of Principal Crops (CCS) in 1970. It has played a vital role in helping shape the Agricultural Policies of the Government of Gujarat and Government of India. UGC-NET/SLET Training Centres The UGC, New Delhi has sanctioned two Coaching Centres for NET/NET-JRF for students from SC/ST and Minority Communities to prepare them for National Eligibility Test (NET) so that sufficient number of candidates are available for selection of Lecturer in the University System under X – Plan. Besides this, the University also has UGC Remedial Coaching Centre for SC/ST and Minorities.

28th National Conference on Agricultural Marketing
9
C. Cells Internal Quality Assurance Cell The university has instituted an Internal Quality Assurance Cell (IQAC) with the following objectives, roles and functions assigned to it, under the Chairmanship of the Vice Chancellor. The objectives of the IQAC are two-fold: (a) To ensure continuous improvement in the entire operations of the institutions, and (b) To assure stakeholders connected with higher education – namely students, parents, teachers, staff, would-be employers, funding agencies and society in general – of the accountability of the institution for its own quality and probity. It looks into/provides for/takes steps to foster (i) timely, efficient and progressive performance of academic, administrative and financial tasks; (ii) the relevance and quality of academic and research programmes; (iii) equitable access to and affordability of academic programmes for various sections of the society; (iv) optimization and integration of modern methods of teaching and learning; (v) the credibility of evaluation procedures; (vi) the adequacy, maintenance and proper allocation of support structure and services; and (vii) research sharing and networking with other institutions in India and abroad. Some of the functions being performed by the IQAC are: (a) development and application of quality benchmarks/parameters in various activities of the institution; (b) dissemination of information on quality aspects; (c) organising discussions, workshops, seminars and promotion of quality circles; (d) recording and monitoring quality measures of the institution; (e) working as a nodal agency of the institution for quality relation activities; and (f) preparing the Annual Quality Assurance Report and such other reports as may be decided from time to time. University-Industry Interaction Cell The University-Industry Interaction Cell (U&I Interaction Cell) has been established to promote co-operation amongst Faculty members of the University and the leaders of the Industry to achieve technical proficiency and excellence. The U&I Interaction Cell works with the following specific objectives: (a) to create data base on Need Analysis of Industries in the state; (b) to create data base on expertise/facilities on the campus; (c) to coordinate R & D projects/consultancy/ sponsored projects/problem solving between the University Departments and Industries in the area of Product/Process development and technology transfer; (d) to assist in signing of MoU, promote patent awareness and development of IPR/Patents by the University faculty based on their products and processes; (e) to help testing material characterization; (f) to offer training programmes relating to professionally oriented fields for small/medium scale industries; and (g) to keep liaison with various funding agencies and government organizations. Environment Conservation and Management Cell Sardar Patel University is the first university in the state to frame its Environment Policy and constitute an Environment Conservation and Management Cell, which is actively pursuing the goals and action, programmes detailed in the policy. The highlights of the policy include: environment as a part of the 3-dimensional activities

28th National Conference on Agricultural Marketing
10
of the university; motivating senior students to carry out small projects of study on data collection and scientific analysis, etc; motivating departments/institutions to take up environmental research, through major and minor projects with funding from various agencies; joining hands with other universities/institutions and also NGOs for education, training and research on environmental aspects etc. SC/ST Cell Our SC/ST Cell, constituted in conformity with the norms laid down by the UGC, has initiated programmes to implement the reservation policy for weaker sections (ie, SC/ST) in the University and colleges so as to provide special facilities to students from these communities for their betterment and welfare as per instructions/orders by the Government of India. The Cell takes necessary steps to display all Notifications/Circulars on all the Notice Boards and provides guidance to the students belonging to SC/ST. It is actively engaged in strictly following and implementing important decisions taken by the University Standing Committee for SC/ST. Besides this, it is involved in the administration of government scholarship to students under these categories. D. Other Facilities NBHM Regional Mathematics Library In recognition of the committed efforts of the Department of Mathematics in Research, Teaching and Extension, the National Board of Higher Mathematics, Department of Atomic Energy, Government of India has set up a Regional Mathematics Library for Higher Mathematics in the Department of Mathematics. This is a National facility created on the campus. This library caters to the needs of Mathematicians in the Western Region. EDUSAT (CEC- UGC, New Delhi): Higher Education Programme and EDUSAT (Gujarat Government): College to Career Programme Sardar Patel University is one of the 58 Institutes of Higher Education of India to be connected with EDUSAT in the first phase. It was inaugurated at CEC, New Delhi on 27 July 2005. The University provides the facility of EDUSAT to the teachers and students at Computer Centre. The College to Career Programme initiated by the Department of Science and Technology (DST), State Government of Gujarat, and Department of Technical Education, State Government of Gujarat, implemented through Gujarat Informatics Ltd (GIL), a State Government of Gujarat informatics company, enables online case-based training on the popular technologies in computer science i.e., JAVA Technology and DOT NET Technology to the final year students of the various BE and MCA institutes within the state of GUJARAT. UGC-Infonet Programme Internet connectivity has been provided at Sardar Patel University, Vallabh Vidyanagar by the UGC, New Delhi with a grant of Rs.25 lac in collaboration with ERNET and INFLIBNET under the UGC Infonet programme. The university has

28th National Conference on Agricultural Marketing
11
been provided internet connectivity of 512 kbps SCPC through VSAT. This programme is bringing qualitative changes in academic infrastructure through resource sharing, access to e-journals, e-learning and helping us in linkages with other Academic and Research Networks the world over. Bhaikaka Library: the Central Library A unique feature of the library system in Sardar Patel University is that there is a Central Library (Bhaikaka Library) with satellite libraries in the form of departmental libraries in each department. Named after the illustrious founder of the educational township as well as the University, Shri Bhaikaka, Bhaikaka Library came into existence in 1957, with the purchase of 3000 books. The present Library building was inaugurated by the Late Prime Minister, Shri Lal Bahadur Shastri on 31 October 1964. It has two large reading rooms with a capacity to seat 750 students. The stack area, divided into four parts, has the capacity of up to 3,00,000 documents like books, periodicals, theses, dissertation, Reference Books, CDs, DVDs, Video and Audio Cassettes, books donated to the library etc. its membership is open to students, teaching staff non-teaching staff not only in the university departments but also those in affiliated colleges. Computer automation has been initiated with 2,60,000 of the books in the acquisition entered in the computer using SOUL software. Bar-Codes enable the issue counter to scan a document before issuing it out. Facilities like Reading Room, Internet, Women’s Reading Room., Inter-Library Loan Services, Photocopiers, Reference Services and Online Public Access Catalogue (OPAC). One can access UGC-INFONET journals. The Library subscribes to 208 Indian and 115 International Journals, making it a total of 323 Journals in all. Its Publication Section publishes 7 Journals and a Monthly University Newsletter. It has published 158 books so far. This is over and above the departmental library in almost all departments caters to the specific needs of respective department. NSS/NCC The university has National Service Scheme (NSS) in 22 affiliated Colleges. The main aim of National Service Scheme is to extend dimensions to the Higher Education System and orient the students youth to community services while they are studying in education institutions. NSS activities have been divided in two major groups; they are regular NSS activities and Special Camping Programmes. NCC is short for National Cadet Corps and there is a sizeable section of students in the University enrol in it. Learn and Earn Scheme A Learn and Earn Scheme has been introduced for students studying in Sardar Patel University or those residing in the University Hostels. It allows such to take up assignments like administrative work of various kinds like supervision of the reading rooms/halls in Bhaikaka Library, work related to computers like word processing, and such other administrative work in their spare time over and above their academic work with the aim of enabling young men and women to raise economic output on their own while reading toward their respective degrees.

28th National Conference on Agricultural Marketing
12
Free-Studentships in Self-finance Programmes The total number of free-studentships available in each department is 5% of the total strength of the department. Free-studentships are awarded to the postgraduate students reading for their Master’s degree, who are otherwise not eligible for the Economically Backward Class Free-studentships or Scholarships for the Scheduled Caste, Scheduled Tribe and other Backward Class students. Apna Bazaar The university has set up a separate consumers’ cooperative society viz. Sardar Patel University Employees Consumers Cooperative Store (Apna Bazaar) to provide grocery and other items at the economic rates. Free Studentship to Wards of Cadres III and IV University Employees The wards of Cadres III and IV employees of the University who are studying in the University are reimbursed the full tuition fees in case they are under the grant-in-aid system and 50% of the tuition fees in case of those in the self-financed system. E. Support Services
• University Museum
• University Health Centre
• University Science Instrumentation Centre (USIC)
• University Press
• Community Radio Station
• University Guest Houses and Hostels
• Sardar Patel Maidan
• Employment Bureau
• Banking Services
• Postal Services
• University Canteen
• Sports and Cultural Programmes

28th National Conference on Agricultural Marketing
13
Post Graduate Department of Economics
We welcome you all to an exciting and challenging career in the field of Economics. In today’s fast changing and dynamic global economy, knowledge is the only source of power. The ability to convert information into knowledge by interpreting emerging trends is the key factor to gaining this power. The power of knowledge alone can assure rapid growth for one self as well as the country at large. The knowledge of Economics enables one to understand the subtle intricacies of the ever-changing competitive world that we live in. For a post graduate in Economics, job opportunities are plenty. Teaching at school, college and post graduate levels, applied research in government and non-governmental organizations, fast growing private sector enterprises in trade, commerce and management, banking, government agencies and departments and Civil Services like the Indian Administrative Service and Indian Economic Service. In short, for the truly worthy and hard working student, the sky is the only limit. We, the faculty members at the Department, are striving hard to prepare the students for this vibrant scenario. If you think that you have it in you to make a difference to your life and to that of others, if you think that economic change is the answer to many a social and political issue, if you believe in creating value through environmental sensitivity, this is the place for you. Come and join the Post Graduate Department of Economics to give your career the competitive edge. The University Sardar Patel University, a leading center of higher education in Gujarat State, came into existence in 1957 with the basic objective of accelerating the process of regeneration of rural economy by the application of modern arts, science and technology. The University has made noteworthy progress in the areas of UGC Infonet, FM Radio, EDUSAT etc. It has twenty four postgraduate Departments. Many of the Departments are receiving financial assistance from UGC, COSIST, DRDO, DAE, ICSSR, DST, CSIR, ICAR, ,GSBTM, ARDB, DBT, etc., for establishing centers of excellence, undertaking research and establishment of infrastructure. The National Assessment and Accreditation Council has accredited the University with four stars (����������������). The Department The Post Graduate Department of Economics is a premier Department in the Faculty of Arts. Since its inception in 1958 the Department has been giving rural bias to its programmes of Post graduate teaching, research, extension and development. It also has the advantage of having close collaboration with two of its associate institutions viz., Agro Economic Research Centre for Gujarat and Rajasthan and the Comprehensive Scheme for Cost of Cultivation of Principal Crops. Professional engagement of the faculty members in accumulation and transfer of know-how of the processes of economic change with a focus on rural development is well evident from their active participation in a wide range of research projects and advisory services. Research Grants and Assistance For academic activities in the thrust areas of Agricultural Economics, Rural Development and Environmental Economics the Department has received recognition and financial support from the government, corporate and co-operative sectors and other academic institutions. The UGC had sanctioned financial grant to the Department for its development under Special Assistance programme Phase I and II. During the X Plan period, the UGC had inducted the Department to the Department of special Assistance Phase III and had also sanctioned a library grant of Rs. Five Lakhs. To strengthen the infrastructural facilities of the Department, the UGC had also sanctioned an additional grant of about Rs. 40 lakhs under its ASIHSS (Assistance for Strengthening Infrastructure in Humanities and Social Sciences) programme. UGC has also sanctioned special Assistance Programme CAS-I for the period of 5 Years w.e.f April 1, 2011. Courses of Study The Department offers opportunities for postgraduate study at Master of Arts (M.A), Master of Philosophy (M. Phil) and Doctorate of Philosophy (Ph.D.) levels in the field of Economics. In M.A. (Economics), the students are offered core papers, elective papers in the chosen area of specialization and self study cum soft skill papers.

28th National Conference on Agricultural Marketing
14
Course Structure for M. A.
Core Courses Semester- I Semester- II
Micro Economics Micro Economics Macro Economics Macro Economics Theories of International Trade Issues of International Trade Comprehensive Viva Comprehensive Viva
Semester- III Semester- IV Economics of Development & Planning Economics of Development & Planning Theory of Public Economics Indian Public Economics - Theory & Policy Quantitative Economics Quantitative Economics Comprehensive Viva Comprehensive Viva
Elective & Interdisciplinary Courses Semester- I Semester- II
Theory of Agricultural Economics Theory of Agricultural Economics Industrial Organisation & Finance Industrial Organisation & Finance Theory of Environmental Economics Theory of Environmental Economics Central Banking Central Banking Economics of Rural Development Economics of Rural Development Theory & Practice of Co - Operation Theory & Practice of Co - Operation Research Methodology & Computer Application in Economics
Research Methodology & Computer Application in Economics
Semester- III Semester- IV Problems of Indian Agriculture Interdisciplinary Courses Industrial Labour Human Development Environmental Problems of India Environmental Protections in India Theory of Finance Socio - Economic Survey Methods Development of Co - Operative Movement In India
Research Methodology & Computer Application In Economics
Soft Skill & Self Study Courses
Semester- I Semester- II Theory & Practice of Co - Operation Employment Generation Programmes in India
Semester- III Semester- IV
Economics of Livestock Farming Indian Economy M. Phil. is a one year full time course. The study is offered partly through classroom instruction and partly through research. The students are offered two compulsory and one optional paper to be chosen from a package of five specialized areas.
Compulsory Papers Optional Papers Research Methodology Economic Theory and Public Policy Macroeconomics of Growth International Monetary Development Economics of Decision Making The Structural Development of the Indian Industrial
Economy Agriculture and Indian Economic Growth Econometrics and Computer Applications in Economics

28th National Conference on Agricultural Marketing
15
Ph.D The Ph.D Programme is based entirely on research. The prospective candidate is required to submit a research proposal before the Departmental Research Committee which takes decision about admitting the student to the course. Teaching Method This includes classroom teaching, individual and group interactions with the faculty outside the class room, lecture demonstration and seminar presentations by the students, guest lectures, workshops, debates and discussions etc. Method of Evaluation The Department makes continuous evaluation of students through internal tests, seminars, assignments, viva voce and University Examination. Infrastructure and Facilities The Department has acquired basic infrastructural facilities to help the students to enhance their skills. It is housed in a three storied building having class rooms, independent cabins for the faculty, administrative and support facilities, a seminar hall, reading room, library, computer laboratory, internet connectivity, over head projectors, multi-media projector etc. Faculty Members Faculty members at the Department consist of a congenial mix of widely experienced senior faculty members and enthusiastic young scholars as their juniors. On the whole, the multi-cultural backgrounds and multifaceted abilities of the faculty members promote an atmosphere of healthy intellectual debates and discussions, which work to the advantage of one and all of the students as well as faculty.
Faculty Designation Qualification Specialization Dr. H. P. Trivedi Professor Ph.D. Development Economics
Industrial Economics Environmental Economics Research Methodology
Dr. D. J. Chauhan Professor Ph.D Micro Economics Banking and Finance Research Methodology
Dr. N. M. Patel Associate Professor
Ph.D. Agricultural Economics Co-operation International Economics Research Methodology
Dr. D. G. Ganvit Assistant Professor
Ph.D. Macro Economics Co-operation Rural Development Research Methodology
Dr. Sonal Bhatt Assistant Professor
Ph.D. NET
Public Finance Environmental Economics Research Methodology
Shri J. K. Barot Assistant Professor
M.A. SET
Micro Economics Quantitative Economics Econometrics Research Methodology Computer Application in Economics
Dr. M. R. Patel Assistant Professor
Ph.D SET
International Economics Quantitative Economics Research Methodology Computer Application in Economics

28th National Conference on Agricultural Marketing
16
Research and Publications The Department publishes “Artha-Vikas”, a biannual journal of economic development since 1965. Articles and research papers by eminent academicians as well as young members of the teaching fraternity find a place in the journal. Research Facilities The main hub of library facilities including a huge collection of books and periodicals on a wide range of subjects of study is located at Bhaikaka Library, run by the Sardar Patel University. Besides, our students also have an access to the library of the Agro Economic Research Centre and Department’s own library and Reading Room in the building. These libraries have rich collection of text and reference books, research reports and journals in specialized areas of agricultural economics, rural economy and environmental economics. Those interested in advanced research may also take advantage of good library facilities available with the Institute of Rural Management, Anand, National Dairy Development Board, Anand, Agricultural University and Water and Land Management Institute, Hadgud (Anand) which are located in the vicinity of the campus. In addition, a computer laboratory along with internet connectivity is also available with the Department for the use of the students as well as faculty. Co-Curricular Activities For their overall development students are encouraged to participate actively in different co curricular activities such as weekly seminars, debate and elocution competitions and general knowledge tests. In addition, students are also provided opportunities to participate in the interdepartmental and University level sports meets, youth festivals, essay and debate competitions and other cultural competitions. Study/field tours are also organized to make the students familiar with other institutions and development programmes. To improve their observation and analytical power, students are guided to undertake rural surveys. Scholarships, Medals & Prizes Meritorious students may look forward to the following scholarships, merit based medals and prizes which are conferred upon. The Silver Jubilee Trust of the Gujarat Economic Association offers merit- cum-means scholarships to one student each in M.A. (Previous) and M.A (Final) ‘Prof. R. K. Amin Gold Plated Medfal’ is awarded every year to the student securing highest marks in aggregate in M.A. (Final). Late Shri Dahyabhai Tulsibhai Patel (Bakrol) Gold Medal’ is awarded to the student securing highest marks in aggregate at M.A (Perevious and Final) in the subject of Agricultural Economics. ‘Prof. V. S. Vyas Felicitation Prize’ is awarded to a student obtaining highest marks in M.A. (Previous) examination. ‘Pramukhswami Maharajs 80 Birthday Celebration Anand Vidyanagar Cash Prize’ is awarded to top two students securing highest marks in Quantitative Economics. In addition to the above prizes and awards, the Government of Gujarat provides scholarships to the students belonging to the SC, ST and OBC categories. Further, the Bidi Kamdar Sangh also offers scholarships.
For application forms and other details contact The Head The Registrar Department of Economics Sardar Patel University Opposite Nandalaya Haveli Vallabh Vidyanagar– 388 120 Sardar Patel University Phone (02692)236545/226801 Vallabh Vidyanagar– 388 120 Fax : 91-2692-236475/237258 Phone : (02692) 232208/232204 E-mail : [email protected]
Website : www.spu.vvn.edu

28th National Conference on Agricultural Marketing
17
Agro-Economic Research Centre, Vallabh Vidyanagar The Agro-Economic Research Centre (AERC) for the states of Gujarat and Rajasthan was established in July 1961 at the Sardar Patel University (SPU), Vallabh Vidyanagar by the Directorate of Economics and Statistics (DES), Ministry of Agriculture (MOA), Government of India (GOI), New Delhi. It was late Shri H.M. Patel (ICS retd.) who not only provided the vision for establishing such an Institute but also ensured the much needed support and encouragement for its growth at Vallabh Vidyanagar. AERC has been working as an associate institution of S. P. University and enjoying autonomy status in its working. The Centre has completed 50 glorious years (1961-2011) of its journey marked by both achievements and challenges. During these years, the Centre has emerged as a strong policy feedback centre of the Ministry of Agriculture, Government of India due to hard work and strong commitment of the staff in the Centre. The focus of research effort in the initial stage was on comprehensive village surveys and resurveys in order to understand the process and direction of change at the village level. Subsequently, the emphasis of research has shifted to problem oriented studies.
The Centre has by now completed 152 problem-oriented studies, 21 village
surveys and 4 village resurveys. Most of these research projects have been taken up by Centre on the recommendation of the Government of India and State Governments of Gujarat and Rajasthan. Some of the projects have also been sponsored by other national and international organizations. During its long journey, the Centre has brought remarkable improvement in every aspects of research including methodological base of the studies. The studies have come out with useful findings and policy implications for agricultural and rural development of the states of Gujarat and Rajasthan. Many seminars and conferences were organized by the Centre (jointly with Department of Economics) during these years.
Since 1970, the Centre has been also organizing the work of Comprehensive
Scheme to Study Cost of Cultivation of Principal Crops in Gujarat entrusted to the S P University by the Ministry of Agriculture, Government of India. Ever since its inception, the Centre has been working in close collaboration with the Post-graduate Department of Economics of the S. P. University and so far it has helped/supported about 35 scholars to successfully complete their Ph. D. work in agricultural economics.
The principle objectives of the Centre have been as follows:
1. To make continuous study of the change in rural economy by means of surveys of villages each year, to be repeated after an interval of five years.
2. To conduct adhoc investigation on problems of interest to the Ministry of Agriculture and Irrigation and the State Governments under their jurisdiction.
3. To undertake research on fundamental problems relating to the agricultural economy of the country, and
4. To give technical advice to the Government of India and to the State Governments on such important issues as, with mutual agreement, may be referred to the Centre.

28th National Conference on Agricultural Marketing
18
Cost of Cultivation Scheme Studies on cost of production of agricultural commodities have been of interest to research workers and policy-makers. The need for reliable and representative estimates about cost of production of agricultural crops is obvious for formulating an appropriate strategy for planned agricultural development.
In a vast country like India with marked variations in agro-climatic conditions,
it becomes essential to collect State-wise, region-wise data on cost of production of various crops on a continuous basis. Recognizing the importance of such studies, the Directorate of Economics and Statistics, Ministry of Agriculture (MoA), Government of India, evolved a permanent arrangement for collection of cost of cultivation data on a continuous and uniform basis for all important crops in the country. The Directorate of Economics and Statistics decided to establish the Comprehensive Scheme for studying the cost of cultivation of principal crops in different states of India in 1968-69. The Directorate entrusted one such cost scheme to the Sardar Patel University for collecting cost of cultivation data in Gujarat. The University entrusted this Scheme to the Agro-Economic Research Centre. Since 1970, the AERC and the Comprehensive Scheme are working together in close collaboration for serving the needs of the Directorate of Economics and Statistics of Ministry of Agriculture, Government of India. The data base generated through the “Comprehensive Scheme for Studying Cost of Cultivation of Principal Crops in Gujarat” is used not only for the primary purpose of providing cost estimates for determination of Minimum Support Prices (MSP) but for a wide variety of other important purposes like ‘Compilation of National Accounts Statistics’, Wholesale Price Indices (WPI) and research studies relating to cost of cultivation and farm income.
Up to 1982, cost of cultivation data in Gujarat were collected from 480 sample
cultivators spread over 40 clusters of villages through cost accounting method. Under the old arrangement (known as single crop approach) the clusters were changed every year retaining only a sub-sample of 10 to 20 clusters. Since 1983, the single crop approach has been replaced by crop complex approach under which the numbers of clusters have been increased from 40 to 60 thereby providing a wider and varied base for generation of reliable estimates. Now ten principal crops of Gujarat Viz., Bajra, Groundnut, Cotton, Arhar and Onion, Paddy, Wheat, Maize, and Rapeseed/Mustard and Sesamum are being studied continuously and simultaneously for three consecutive years in the same clusters of villages. At present, there is a sample of 600 cultivators (10 each from selected clusters) drawn from different size groups of holdings. The farm size groups are marginal (below 1.0 hectare), small (1.0 to 2.0 hectare), semi-medium (2.0 to 4.0 hectare), medium (4.0 to 6.0 hectare), and large (6.0 hectare and above).
The work of this Scheme is being looked after by 78 persons, out of which 60
are permanently posted in the villages spread over entire State of Gujarat. This Scheme is being fully financed by the Government of India.

28th National Conference on Agricultural Marketing
AERC Governing Body • Dr. Harish Padh
Vice Chancellor, Sardar Patel University,Vallabh Vidyanagar -
• Ms. Sangeeta Verma Economic and Statistical Adviser Directorate of Economics & Statistics, Department of Agriculture and Cooperation, Ministry of Agriculture, Government of India, Krishi Bhavan, New Delhi
• Dr. V. S. Vyas Professor Emeritus, Institute of Development Studies, Jaipur 302 004, Rajasthan; Former Member, PM
• Dr. Y. K. Alagh Professor Emeritus, Sardar Patel Institute of Economic and Social Research, Ahmedabad, 380 054; &Chancellor, Central University of GujaratGandhinagar 382 030
• Dr. Amrita Patel
Former Chairman, NDDB &Chairman, Charutar Arogya MandalGokal Nagar, Karamsad District – Anand, Gujarat
• Shri Raj Kumar, IASPrincipal Secretary, Department of Agriculture and CooperationGovernment of Gujarat, New Sachivalaya, Gandhinagar 382010, Gujarat.
• The Principal SecretaryDepartment of Agriculture, Government of Rajasthan, Sachivalaya, Jaipur 302 005, Rajasthan.
National Conference on Agricultural Marketing
19
Governing Body
Dr. Harish Padh
Sardar Patel University, -388120, Anand, Gujarat.
Ms. Sangeeta Verma Economic and Statistical Adviser Directorate of Economics & Statistics, Department of Agriculture and Cooperation, Ministry of Agriculture, Government of India, Krishi Bhavan, New Delhi -110 001.
s
Institute of Development Studies, Jaipur 302 004, Rajasthan;
PM Economic Advisory Council
Dr. Y. K. Alagh
Sardar Patel Institute of Economic and Social Research, Ahmedabad, 380 054; & Chancellor, Central University of Gujarat, Sector 30,
382 030, Gujarat.
Former Chairman, NDDB &
Charutar Arogya Mandal Gokal Nagar, Karamsad - 388 325
Anand, Gujarat
Shri Raj Kumar, IAS
Department of Agriculture and Cooperation, Government of Gujarat, New Sachivalaya, Gandhinagar –
Secretary, Department of Agriculture, Government of Rajasthan, Sachivalaya, Jaipur 302 005, Rajasthan.

28th National Conference on Agricultural Marketing
• Dr. Tushaar Shah Senior Fellow
International Water Management Institute (IWMI), C/o INREM Foundation,
Behind IRMA Mangalpura, Anand 388001, Gujarat, India
• Dr. Sudarshan Iyengar
Former Vice Chancellor,Gujarat Vidyapith, Ahmedabad - 380 014, Gujarat.
• Dr. S. S. Acharya Professor Emeritus, Institute of Development Studies, Jaipur (Raj); Former Chairman, Commission for Agriculture Cost and Prices (CACP), GOI
• Dr. D. J. Chauhan Professor and Head,Post Graduate Department of Economics, Sardar Patel University, Vallabh Vidyanagar 388 120, Anand, Gujarat
• Dr. Mahesh Pathak Honorary Advisor, Agro-Economic Research CentreSardar Patel University, Vallabh Vidyanagar 388 120, Anand, Gujarat.
• Dr. S.S. Kalamkar Director, Agro-Economic Research Centre, Sardar Patel University, Vallabh Vidyanagar 388 120, Anand,
National Conference on Agricultural Marketing
20
Dr. Tushaar Shah
International Water Management Institute (IWMI), C/o INREM Foundation, Behind IRMA Mangalpura, Anand 388001, Gujarat, India
Dr. Sudarshan Iyengar Vice Chancellor,
380 014, Gujarat.
Dr. S. S. Acharya
Institute of Development Studies, Jaipur (Raj); Former Chairman, Commission for Agriculture Cost and Prices (CACP), GOI
Dr. D. J. Chauhan Professor and Head, Post Graduate Department of Economics, Sardar Patel University, Vallabh Vidyanagar 388 120, Anand, Gujarat
Economic Research Centre University,
Vallabh Vidyanagar 388 120, Anand, Gujarat.
Dr. S.S. Kalamkar
Economic Research Centre, Sardar Patel University, Vallabh Vidyanagar 388 120, Anand, Gujarat.

28th National Conference on Agricultural Marketing
21
Distinguished Personalities Associated with Centre: The AERC, Vallabh Vidyanagar was singularly fortunate to have Dr. V. S. Vyas as its founder Director, whose pioneering efforts, has established rich traditions of research in agricultural economics. This tradition was nurtured in the subsequent phase of three and half decades by Dr. Mahesh Pathak who served as Hon. Director during 1972-2006. Another unique strength of the Centre has been the association of some of the most distinguished personalities of our Country, such as
• Shri H. M. Patel (ICS retired) • Prof. M. L. Dantwala • Dr. D. T. Lakdawala • Prof. M. V. Mathur • Dr. Amrita Patel • Prof. R. K. Amin • Dr. V. S. Vyas • Dr. Y. K. Alagh • Dr. Mahesh Pathak • Dr. Tushaar Shah • Shri J. S. Sarma • Dr. M. S. Bhatia • Shri Mahendra Desai • Dr. N. S. Jodha
• Dr. V. N. Misra • Dr. S.L. Bapna • Dr. D. S. Tyagi • Dr. B. M. Desai • Dr. Arun S. Patel • Dr. H. G. Patel • Dr. Dilip Bagchi • Dr. Sudarashan Iyenger • Dr. S. S. Acharya • Dr. Amita Shah • Dr. Surjit Singh • Dr. P. K. Singh • Dr. H. P. Trivedi • Dr. Dilip Chauhan
Director / * Hon. Director of the Centre
Name Period From To
Dr. V.S. Vyas (Founder Director) 01.07.1961 30.06.1972
Dr. Mahesh Pathak* 01.07.1972 12.09.2006
Dr. P. K. Singh* 12.09.2006 02.08.2008
Dr. H. P. Trivedi * 02.08.2008 02.05.2010
Dr. R. H. Patel 03.05.2010 09.11.2011
Dr. Rajeshree Dutta (In-charge) 09.11.2011 05.07.2012
Dr. S.S. Kalamkar 05.07.2012 Till date
Honorary Joint Director
Dr. H. G. Patel 14.09.1992 06.04.1993 Dr. H. F. Patel 21.10.1993 11.09.2006
Honorary Advisor
Dr. Mahesh Pathak 12/09/2006 Till date

28th National Conference on Agricultural Marketing
22
AERC Vallabh Vidyanagar at a Glance • Jurisdiction: Gujarat and Rajasthan state • Founder Director: Dr. V. S. Vyas • Sanctioned Staff Strength: 15 • Research Studies Completed for MOA, GOI: 152 • Research Studies Completed for Planning Commission, GOI: 06 • Special Cost Study for MOA, GOI: 01 • Village Surveys conducted: 21 • Village Resurveys conducted: 04 • Research Studies in Progress: 09 • Publications of the Centre: 11 (English) and 04 (Gujarati) • Seminars, Conferences, Workshops Organized (jointly with PG Department of
Economics, SPU, VVN) : 22 • Academic Activities:
o Research Studies o AERC Foundation Day Lecture Series o Invited Guest Lecture/Talk Series o H.M. Patel Memorial Lecture Series o Faculty Seminar Series o Working Paper Series o Guidance to Ph.D. Student o Teaching – ‘Certificate Course in Economic Analysis and Report
Writings’, Guest Faculty in Colleges, o Organization of Conferences/Seminar/Workshop o Training Programme for Ph.D. Student & University/College teachers
• Award/Prize o Dr. V. S. Vyas Felicitation Prize
CCS, Gujarat at a Glance
• Jurisdiction: Gujarat State • Total Sanctioned Staff Strength: 78 • Selection of Sample Villages: Stratified Random Sampling • Total No. of Agro-Climatic Zones covered in Sampling: 08 (All) • Total No. of Selected Sample Talukas : 60 • Total No. of Selected Sample Villages/ Village Clusters: 60 • Total No. of Selected Farmers: 600 • Method of Data Collection: Crop Complex Approach with Cost Accounting
Method • No. of Selected Study Crops: Total 11 crops. • Block Year under Progress: 2014-15 to 2016-17 • Activities:
o Workshop cum Training Programme for Field staff o Standing Administrative Affairs Committee (SAAC) o Best Fieldman/Agriculture Assistant’ Award o National Workshop on CCS (2014)

28th National Conference on Agricultural Marketing
23
Anand Agricultural University, Anand HISTORY In the forties, Institute of Agriculture was established at Anand by the Iron Man of India, Sardar Vallabhbhai Patel not as merely an educational institution, but as a mission, a cause, primarily conceived to revitalize agriculture, following Gandhiji’s call for village regeneration. In 1972, the Institute was taken over by Govt. of Gujarat which became one of its campuses when Gujarat Agriculture University was established. The Anand Agricultural University (AAU), carved out of the erstwhile Gujarat Agricultural University by the Government of Gujarat on 4th March, 2004. AAU provides support to the farming community in all the three facets, namely education, research and extension education activities in agriculture and all its allied fields. AAU has seven Colleges, one PG Institute, five Polytechnics and, 28 research stations and projects in middle Gujarat’s eight districts for teaching, research and extension. (I) EDUCATION
AAU imparts effective education in Agriculture and allied sciences through residential semester system of under-graduate and post graduate degree programmes, awarding degrees in seven faculties namely, Agriculture, Dairy Science, Veterinary Science & Animal Husbandry, Agriculture Engineering, Food Processing Technology & Bio Energy, Agricultural Information Technology and International Agri. Business Management. Brief description of colleges/ centers and their activities is presented below. B. A. College of Agriculture:
This is one of the oldest colleges of agriculture in the country, started in 1947. It provides degree programmes at under graduate and post graduate levels. The students who pass Std.XII examination with physics, chemistry, biology and english and entrance test conducted by the Government are eligible for admission in graduate degree programme. Two independent wings one each for agriculture and horticulture offering UG programme were also started in 2012 under B.A. College of Agriculture to cater to the needs of growing demand of students. Sheth M.C. College of Dairy Science:
This college was started in 1961. The students in the college are awarded the Degree of B.Tech. in Dairy Technology and PG degree in different branches of dairy science. The students who pass Std.XII examination with physics, chemistry, mathematics and english and JEE examination are eligible for admission in graduate degree programme. College of Veterinary Science & Animal Husbandry:

28th National Conference on Agricultural Marketing
24
The College of Veterinary Science and Animal Husbandry, Anand was established in 1964. It is playing key role in augmenting growth of livestock sector in state by producing high skilled technical manpower and conducting high quality research to address problems of livestock sector. The college offers degree programme at UG and PG levels. The students who pass Std. XII examination with physics, chemistry, biology and english and entrance test conducted by the Government are eligible for admission in graduate degree programme. College of Food Processing Technology & Bio Energy:
This college has been established during eleventh five year plan to cater the huge demand of specialized human resource for the fast growing food industry. College offers B.Tech. and master degrees in Food Processing Technology. The students who pass standard XII examination with physics, chemistry, mathematics & english and JEE examination are eligible for admission. College of Agricultural Information Technology:
The college was established in the year 2009 with a vision to harvest the fruits
of applications of Information and Communication Technology in Agriculture and allied sectors through a technically skilled workforce. The college offers a four year undergraduate residential B.Tech. (Agricultural Information Technology) degree program in Agricultural Information Technology, which is first of its kind in Gujarat state and second in the entire country International Agri-Business Management Institute:
The institute was established in 2008 and it offers two years professional P.G. degree "Master of Business Administration" in International Agribusiness (MBA-IAB) with a core focus on agribusiness and international trade. The programme is aimed to craft professional business leaders and entrepreneurs in the food and agri-business sector. The students who pass Bachelor's degree in Agriculture and allied disciplines are eligible for admission. The institute has excellent placement records (100 %) from its inception College of Agricultural Engineering and Technology:
The college has been started in July 2008 at Godhra about 90 km away from
Anand. The college offers four years B.Tech degree programme. The students who pass Std. XII examination with physics, chemistry, mathematics and english and JEE examination are eligible for admission. Institute of Distance Education, Anand:
This institute was established during 2011-12 with a prime objective to
accomplish distance education in the field of agriculture in the State. At present Masters courses in M.Sc, Agricultural Journalism and M.Sc., Agricultural Marketing

28th National Conference on Agricultural Marketing
25
are being offered. Diploma course on “Diploma in Agricultural Extension Services for Input Dealers” (DAESI) is also the most sought after programme of the institute The Anand Agricultural University also has following polytechnics within its domain.
1. Polytechnic in Agriculture at Anand and Vaso. 2. Polytechnic in Agricultural Engineering, Dahod. 3. Sheth D. M. Polytechnic in Horticulture, Vadodara. 4. Polytechnic in Food Science and Home Economics, Anand.
(II) RESEARCH Research activities of AAU focus on productivity, sustainability and improvement of the socio-economic condition of the farming community. These goals of AAU encompass newer areas such as Biotechnology and Nano technology, Organic Farming, Seed technology, Climate change, Soil Health Card, growing medicinal plants along with the conventional crops and processing of food products. It has been focused on distance hybridization on field and fruit crops including vegetable crops. High quality research like identification of genome for preventive and curative measures against infection/infestation of diseases adversely affecting higher productivity in poultry / livestock has been started in veterinary field besides different measures in animal nutrition. Emphasis is given on uplifting the standards of milk and milk products to compete at international level under the Dairy Technology research. Food Processing Technology and Bio Energy are new and promising areas in Post Harvest Technology, Food Irradiation and Bio Fuel. It has the distinction of developing an end-to-end integrated processing plant. The university has ultra modern laboratories with sophisticated instruments and excellent trained research staff besides well managed farms at different locations. Anand Agricultural University has developed and released three poultry breeds for commercial exploitation viz., Anand Commercial Layer for commercial egg production, Anand Synthetic White Leghorn for higher egg weight and Anand Bentamized White Leghorn for better feed efficiency. Key technologies developed at the University includes Anubhav Liquid Biofertilizer Technology, Yield Improvement in Paneer Making Processes, Date Palm Tissue Culture Technology, Technology for Production of Ready to Puff Rice. (III) AGRICULTURAL EXTENSION The Directorate of Extension Education has to plan, coordinate, organize and guide the extension education programs in the university and to ensure efficient working of the extension education activities in close coordination with the development departments, voluntary and private organizations. The Extension Education Council recommends the extension education programmes of the university.

28th National Conference on Agricultural Marketing
26
The Directorate of Extension Education has a Zonal Research and Extension Advisory Committee which comprises the Director of Extension Education, Director of Research, Deans of the faculties, Crop and Subject Matter Specialists, members of development departments, co-operative sectors, industries and progressive farmers. The Directorate also has Extension Education Institute which imparts the extension training to improve upon the job performance of middle level functionaries of various development departments of western zone states of the country. The University also has started T&V training centres to impart the training to the extension personnel of the Department of agriculture. The AAU also has started following six certificate courses. � Food Processing
Technology � Organic Farming � Weed
Management �
� Integrated Pest Management
� Medicinal & Aromatic plants
� Seed Production
Path Breaking Activities of the University: Soil Health Card AAU has the distinction of developing the Soil Health Card for the entire State with headquarters at AAU Anand. The card is a result of soil health data collected from farmers fields across Gujarat. An exclusive software providing a decision support to any farmer across the State is achieved just by logging at the specially created website. It is an endeavor to put crop knowledge at the farmers fingertips. The12th National Award was conferred upon Anand Agricultural University for e- Governance (2008-09) by the Department of Administrative Reforms & Public Grievances, jointly with Department of information Technology, Government of India, New Delhi, on 12th February, 2009 at GOA for its contribution in the field of Outstanding performance in Citizen-Centric Service Delivery. Krushi Mahotsav The Government of Gujarat started a new programme called KrushiMahotsavin 2005 for connecting the farmers with agricultural scientists in order to have a sincere and faithful interaction. This one month long programme is organized every year during the month of May and June. So far sevenKrushiMahotsavshave been organized in the state. The programme has the following objectives: (i) Creating awareness amongst the rural masses regarding scientific innovations in crop production practices, farms implements, water conservation, irrigation methods, animal husbandry etc. and taking these innovations to the farming community through the concept of people's participation. (ii) Bringing agricultural and rural development programmes at village level for the betterment of peasants implemented by various State Government Organizations and thereby to create an atmosphere to motivate the farmers for their participation in such programmes. (iii) The ultimate objective of the whole programme is to make the farmer's income double in a span of five years.

28th National Conference on Agricultural Marketing
27
DEPARTMENT OF AGRICULTURAL ECONOMICS B. A. COLLEGE OF AGRICULTURE
ANAND AGRICULTURAL UNIVERSITY ANAND
The Department of Agricultural Economics is an integral and one of the
important parts of the B.A. College of Agriculture, AAU, Anand established in 1947. The department is engaged in all the three designated functions of teaching, research and extension in the field of agricultural economics discipline. It imparts teaching to undergraduate as well as post graduate level. Different courses related to agricultural economics have been taught in Agriculture, Veterinary and Animal Husbandry and Information Technology faculties by this department. The department undertakes research on socio economic problems of the farming community of the state in general and Middle Gujarat Agro climatic Zone in particular. The thrust area of research includes cost of cultivation for major crops, Market prices and market arrivals, economic viability of different technology, financial problems of farmers, farm credit, agro-business economic aspect etc. The findings and suggestions/ recommendations emerged from the departmental research projects are highly useful for the policy formation for government machinery. The department is also involved in different extension activities such as organising regional as well as national seminars, training programmes and delivering talks/lectures at different institutes.
1. Teaching: UG Teaching: No of courses offered in Agriculture Faculty: 10
(22 Credit Hours), PG Teaching: No of courses offered: 23 (40 Credit Hours).(In addition to these courses, other courses are taught in faculty of Horticulture, Information Technology, Veterinary and Animal Husbandry and at polytechnic colleges.) M.Sc. (Agri.) and Ph.D. degree awarded 57 (Master Level)+3 (Ph.D. Level) = 60.
2. Major Area of Research: Cost of production of crops, , Marketing of Agricultural Produce, Agricultural Finance, Socio economic status and problems, Scope of Marketing in context to WTO’s agreement on Agriculture, Problem of Agricultural Export, economic viability of different technology, agro-business economic aspect etc.
3. Research Projects: 4 (Total four permanent Projects (i) Research in agricultural economics (BH. 5018) (ii) Farm Cost Studies (B. H. 5018-1) (iii) The Scheme for Creating Permanent Machinery for Studying the Cost of Cultivation/ Production of Principal Crops Grown in Gujarat State (B. H. 18053) (iv) Establishment of WTO Cell at Anand (BH. 10946):
4. Facilities Available : Well Furnished Department with total 11 Rooms, AC Conference Room with LCD projector along with PA system and Plasma Display Panel, AC Computer Laboratory, Practical Class Room with LCD projector, Multimedia Projector, Departmental Library, Pantry room for staff with refrigerator, RO system, Desktop Computers: 18, Laptops: 4, Digital Copier (Zerox Machine): 1, Black and white printers: 9 Colour printer: 1, Motor Cycle for supervising field staff (Survey work)

28th National Conference on Agricultural Marketing
28
5. Publication: Books :4 Chapters in Book : 10 Popular Articles:50 Research
Papers: 70 Bulletins : 13 , Technical Reports- 40
6. Contribution in other activities: One day/two days training programmes for farmers, farm women and agri entrepreneurs organized: 20, Regional seminar organized: 4 National Seminar Organized: 1, Internship training to the students of colleges of rural studies., Transfer of technology through Krushi Mahotsav
Dr. Y. C. Zala Professor & Head Department of Agricultural Economics B. A. College of Agriculture Anand Agricultural University Anand: 388110 (M) 91-9409011661, (O) 02692-264950 Email: [email protected] Photographs

28th National Conference on Agricultural Marketing
29
Charutar Vidya Mandal, Vallabh Vidyanagar
Shri S.M. Patel Hon. Secretary, C.V.M
Inspired by Sardar Patel, Bhailalbhai Patel, an engineer of eminence
endearingly called ‘Bhaikaka’, and Bhikhabhai Patel, an esteemed educationist, popularly called ‘Bhikhabhai Saheb’, resolved to plant a township of education in a place where highwaymen held sway. They did so in order to make education available at the doorstep of the villagers who were sunk in squalor, abject poverty, illiteracy and superstition. The duo convinced the landowners how their donation of land would bear fruit when they would be able to worship the twin goddesses of knowledge and wealth.
Bhaikaka and Bhikhabhai, the bravehearts, lived in a hut and installed
themselves in their ‘office chamber’, with Lord Brahma, the Super Creator, inspiring the two creators, under a mango tree. They established in 1947 Vitthalbhai Patel Mahavidyalaya (Arts & Science College), the first college, despite a lot of problems, mostly financial. The following year, came up Birla Vishwakarma Mahavidyalaya (College of Engineering). Bhikhabhai Jivabhai Vanijya Mahavidyalaya (Commerce College) succeeded it in 1950. Bhaikaka and Bhikhabhai did not stop there. They founded Sardar Vallabhbhai Vidyapeeth (now Sardar Patel University) only eight years after the birth of first college and Bhaikaka led the university as the founder Vice-Chanceller. Thirteen years after the establishment of Vallabh Vidyanagar Bhaikaka entered active politics and handed over the reins of administration of the Mandal to Shri H M Patel, an ICS officer of great renown.
H.M.Patel provided able leadership to the Mandal for three decades and a
half. He established several colleges and added to the facilities for students and staff. He played a prominent role in the affairs of the university. He founded Vitthal Udyognagar with a view to arresting the exodus of the educated rural youth to cities in search of livelihood. In order to improve the health of rural population he set up an ultramodern hospital and medical college near Karamsad, Sardar Patel’s native village. Like Bhaikaka, he too entered active politics to root out corruption in public life and to ensure rule of law. After Shri H.M.Patel’s sad demise, Dr. C.L.Patel, the present Chairman, came forward to serve the Charutar Vidya Mandal
Dr. C.L.Patel, the man who acts as fast as he thinks, has added in quick
succession new institutions of education and new courses of study, some of which are unconventional. Not only this, he created a new, well-planned campus, New Vallabh Vidyanagar which boasts of, in addition to colleges of Engineering, another college of Engineering for women, Pharmacy and Biotechnology, a college of Ayurveda and Ayurvedic hospital, a College of Commerce and Management and a College of Architecture and Interior design. Keeping pace with the changing times he has established new schools, refurbished the already existing hostels and college buildings and constructed new hostels, staff quarters and sports complex, all this within a short span of twenty years. The secret of Dr. C.L.Patel’s visionary stewardship lies in the fact that he has deep faith in God and that academicians,

28th National Conference on Agricultural Marketing
30
donors and institutions have immense faith in his practical idealism. Recipient of numerous he never rests. He marches ahead and scales greater heights.
It is noteworthy that Birla Vishwakarma Mahavidyalaya (Engineering College)
celebrated its Diamond Jubilee in the august presence of Dr. A P J Abdul Kalam, former President of India, and Shri Narendra Modi, Chief Minister of Gujarat. Dr. Kalam greeted the college for completing sixty years of commendable educational mission. He observed how Bhaikaka and Bhikhabhai, the great visionaries, and G.D. Birla, the generous donor, have made significant difference in the socio-economic condition of the area and thereby of the country by establishing a beautiful educational complex like Vallabh Vidyanagar and a renowned engineering college like BVM. Shri Narendra Modi paid rich tribute to the founders in creating Vallabh Vidyanagar and the college. In its sixty years the college has contributed a great deal to the progress of the Gujarat State and the country, he added.
The Vision of CVM is too add significantly to our enduring civilization tradition
of pioneering excellence in learning, knowledge, enlightenment and self-realization, in a University relevant context.
CVM is dedicated to the perpetuation of our Founders’ Vision of providing the
infrastructure facilities, operating conditions and overall environment conducive to the education of young scholars, alongwith the desired physical , mental and character building inputs; we firmly renew our commitment to providing value added, globally relevant Education with an emphasis on the Techno-Management domain, to ensure that our scholars fruitfully exercise their knowledge, skills and values in the global economy.

28th National Conference on Agricultural Marketing
31
Charutar Arogya Mandal, Karamsad An outcome of a dream cherished by late Dr. H M Patel, a former Union Finance and Home Minister, Charutar Arogya Mandal (CAM) is a registered society and a public trust established as a 136 bedded hospital in 1981 with the primary focus of catering to the health care needs of women and children of the Charutar region (comparing Anand and Kheda districts). This noble initiative has today, grown into its philosophy to provide quality health care, quality medical & paramedical education and carry out medical research. A 100 acre, well developed, lush green campus comprises of a 550 bed hospital, Shree Krishna Hospital , state-of –the-art Cancer Centre with facilities for Chemotherapy and Radiation, a modern Cardiac Centre, a Bone Marrow Transplant Unit Which is expected to open shortly, Ramanbhai Gokal Privilege Centre – a sophisticated facility for personalized medical care and att6ension, a medical college with bachelors and masters degree programmes , a nursing providing diploma and degree in Nursing, a Medical Laboratory Technology institute offering graduate and postgraduate medical laboratory courses and fellowship programmes. Patient Care: Shree Krishna Hospital
The hospital is a 550 bedded multi-specialty set up with all kinds of
diagnostics and treatment facilities supported with a modern Trauma Centre, Operation Theatres, Intensive Care Units, Dialysis, wards etc. The hospital can boast of the quality of care provided here which is accorded with the accreditations to its kitty, the NABH for hospital, Blood Bank and Imaging Services and the NABH for its Laboratories. Ramanbhai Gokal Privilege Centre
The recent opening of the Ramanbhai Gokal Privilege Centre, an exclusive
facility to deliver medical care and attention in a more personalized manner on out-patient and indoor basis. Our comprehensive health check-up programme, Hello-Health is a preventive health check-up programme adds to the range of patient care facilities at the hospital operated through this modern set-up. A range of services in Neurology, Nephrology, Pulmonolgy, Diebetology, Neuro-interventional procedure, Neurosurgery Gastroenterology, Endoscopic Procedure , Pediatric Surgery, Plastic Surgery, Vascular Surgery, Urology, Spine Surgery, Joint Replacement, Arthroscopy, Shoulder Replacement, Hand Reconstructive Surgery, Cochlear Implant, etc are provided through the Privilege centre. Manibhai Shivabhai Patel Cancer Centre
The Mandal has been battling with the deadly disease of cancer for over last
two decades. The Manibhai Shivabhai Patel Cancer Centre has played a pivotal role in reviving the spirits of cancer victims with its modern treatment facilities including
28th National Conference on Agricultural Marketing
32
state-of-the-art facilities for Radiation Therapy, Radio surgery and Chemotherapy. A panel of experts specialized in onco surgeries provide their services at the centre. Bhanubhai & Madhuben Patel Cardiac Centre
Our modern cardiac centre has earned its repute for treating the most
complicated congenital cardiac conditions in newly born, infants and adults with success. The diagnostics and therapeutic infrastructure at the centre competes with the best of its kind across the nation. Complete with facilities of a Cath Lab, Operation Theatres separates ICUs and step-down ICUs for adults and children. The centre is manned by dedicated team of experts including Interventional Cardiologists, Pediatric Interventional Cardiologist, Cardio Thoracic Surgeon, Pediatric Cardiac Surgeon, Intensivists, Pediatric Intensivists, Neonatologists and trained paramedical staff. Shri Dinesh J Patel Centre For Bone Marrow Transplant
An upcoming facility: The hospital is soon to extended services of stem Cell
Transplant with the functioning of Shri Dinesh J Patel Centre for Bone Marrow Transplant. To be headed by the experts of field and with latest infrastructure the centre would one of the very few in the state providing transplants of stem cell, a promising medical technology to cure blood cancers, thalassemia, serious anemia and other blood related diseases. Extension Centres: Shree Krishna Hospital’s extension to community includes seven health centre located in the smaller towns of the Kheda and Anand district which includes Sevaliya, Bhadaran, Petlad, Bhalej, Ardi, Agas, Anand Agriculture University and GIDC. Social Security Programme (Krupa): A social security programme run by the Mandal, Krupa is s unique programme which provides hospitalization benefits worth Rs 5000/- with a nominal subscription fee of just Rs 99. The total membership base of the programme as on date is close to 45,000. A family floater scheme, Krupa parivaar is a recent addition to this programme which provides hospitalization benefit worth Rs. 20,000 to a family four on a single annual premium of Rs. 499. Medical Education: Pramukhswami Medical College: Pramukhswami Medical College (PSMC) was established in 1987, affiliated to the Sardar Patel University it has been accorded recognition by the Medical Council of India (MCI). With intake of 100 students every year. PSMC differs from other medical colleges in the way the curriculum is designed. It lays more emphasis on

28th National Conference on Agricultural Marketing
33
integrated teaching and learning, making it the only medical college in the country , where different faculties ( Pre-clinical and clinical) come together to teach the students a given topic or system in an integrated fashion, thereby ensuring that the information given is neither fragmented nor repetitive but is complete and thorough in every way. It comes as a matter of pride to us that since 2010, PSMC has became one of the 11 amongst 330 medical colleges in India to be accorded the status of a Regional Training Centre for Medical Education Technologies by MCI. Further to this, the PSMC has also been accorded the recognition of being the first education centre of FAIMER in India. H.M Patel Institute of Postgraduate Studies: The HM Patel Institute of post Graduate studies (HMPIPGS) run three year degree courses in Anesthesiology, Community Medicine, Dermatology, Venereology and Leprossy, General Medicine, General Surgery, Obstetrics and Gynecology, Ophthalmology, Orthopedics’, Otorhinolaryngology, Pediatrics, Pathology, Radio diagnosis, Respiratory Medicine, Pharmacology, Biochemistry and Microbiology. Two year diploma courses are conducted in Anesthesiology (DA), Dermatology, Venereology and Leprosy ( DDVL), Obstetrics and Gynecology (DGO), Public Health (DPH), Ophthalmology (DO), Orthopedics (D.Ortho), Otorhinolaryngology (DLO), Pathology (DCP), Pediatrics (DCH), Industrial Hygiene (DIH), Radio-diagnosis (DMRD), Tuberculosis & Respiratory Medicine (DTCD) and Microbiology (D-Micro). In addition, a two year postgraduate degree course-MSc (Medical) after MBBS is also available in for Anatomy, Physiology, Biochemistry, Microbiology and Pharmacology. Doctor of Philosophy (PhD) courses are available in the departments of Anatomy, Physiology, Biochemistry, Microbiology, Pharmacology and Preventive & Social Medicine. GH Patel School of Nursing: To ensure that the treatment facilities of Mandal get efficient nursing care, the GH Patel School of Nursing was established in the year 1980. This school not only helps us prepare them to meet our superior quality standards, but also mould them to have the required sensitivity and right attitude towards the rural folk that forms the majority of our patient populace. GHPSN is affiliated to Sardar Patel University and is recognized by Gujarat Nursing Council for its 25 Seats in GNM and 30 seats for B.Sc Nursing. KM Patel Institute of Physiotherapy: KM Patel Institute of Physiotherapy (KMPIP) was started in 1999. It offers 30 seats for its 4.5 years Bachelor of Physical Therapy (BPT) course and five seats for the two year Master of Physical Therapy (MPT) course; both affiliated to the Sardar Patel University. The institute also facilitates PhD programs in Physiotherapy under the Faculty of Medicine, Sardar Patel University. The institute has been recognized by the Indian Association of Physiotherapists, which is the only official national body for physiotherapists in India and is a member of world Confederation for Physical Therapists. The National Accessment and Accrediation Council (NAAC) has accrediated KMPIP with ‘B’ Grade.

28th National Conference on Agricultural Marketing
34
Smt. LP Patel Institute of Medical Laboratory Technology: Smt LP Patel Institute of Medical Laboratory Technology is established to provide training to the prospective candidates who desire to pursue their post- BSc career in the field of medical diagnostics as laboratory personnel in hospitals, clinical laboratories and medical research centres. The Institute, through its post-graduate programmes, DMLT & MSc Medical Technology ( in clinical Laboratory Technology), provides a unique opportunity to candidates to acquire not only knowledge and skill in the Laboratory techniques; but also to sharpen the edge in laboratory –based research by undertaking an in-house research project as a compulsory PG dissertation in MSc programme. The Institute has also introduced graduate courses, BSc-Medical Technology, to impart training to the students in a variety of specializations such as Clinical Laboratory Technology, Imaging Technology, Respiratory Care Technology, Radiotherapy Technology and Operation Theratre & Anaesthesia Technology. Student are Trained in respective department at shree Krishna Hospital.

28th National Conference on Agricultural Marketing
35
Institute of Rural Management Anand (IRMA) Flyer The Institute of Rural Management Anand (IRMA), also known as the “House that Kurien built”, boasts a verdant sixty-two acre campus set against a near bucolic backdrop. Launched in 1979 at Anand (Gujarat) IRMA happens to be a front runner in rural management education and has striven “to promote sustainable, eco-friendly and equitable socio-economic development of rural people through professional management of their institutions...”since its inception. Academic courses
Figure 1.
IRMA’s flagship Programme in Rural Management (PRM) equips students with skills to assume responsibilities associated with challenges besetting rural cooperatives and development organizations. A two-year fully residential programme leading to a Postgraduate Diploma in Rural Management (PGDRM), PRM is recognized as equivalent to a Master’s degree by the Association of Indian Universities (AIU) and has been approved by the All India Council for Technical Education (AICTE). Those dedicated to scholarship, research or teaching in specialized areas of rural management apply to the FPRM or Fellow Programme in Rural Management, which has a minimum residency requirement of three years. FPRM is approved by the AICTE as a fellow programme in rural management. PRM Curricular Structure
Sr. No.
Activity Major Emphasis Credits Duration
0. Remedial Classes (for select weak students)
Nil 1 week
1. Induction /Orientation (including village stay of 5 days)
Inculcates Institutional values & principles; Exposure to villages
Nil 1 week plus
2. Classroom term 1 Foundation courses 6.5 12 weeks
3. Village Fieldwork Segment (VFS)
Firsthand experience of village life and development of skills to interface with rural communities while deepening the experiential knowledge of rural realities
3 8 weeks

28th National Conference on Agricultural Marketing
36
Sr. No.
Activity Major Emphasis Credits Duration
4. Classroom Term 2 Functional area plus development courses
7 13 weeks
5. Classroom Term 3 Functional area plus integrative development courses
7 13 weeks
6. Development Internship Segment (DIS)
Understanding the philosophy and practice of development interventions
3 8 weeks
7. Classroom Term 4 Integrative and specialization courses
7 13 weeks
8. Management Traineeship Segment (MTS)
Developing practical skills and gain a realistic idea of the managerial functions of rural organizations
4 9 weeks
9. Classroom Term 5 Integrative and specialization courses
6.5 13 weeks
Total 44 90 weeks
Note: 1 credit is equivalent to 30 contact sessions of 70 minutes each and 80-90 hours of work (studies, preparations, assignments etc.) outside the class.
FPRM Curricular Structure
Sr. No.
Activity Major Emphasis Credits Duration
1. Induction /orientation (including village stay of 5 days)
Inculcates institutional values & principles; exposure to villages
Nil 1 week plus
2. Classroom term 1 Foundation courses 6.5 12 weeks
3. Village Fieldwork Segment (VFS)
Firsthand experience of village life and development of skills to interface with rural communities while deepening the experiential knowledge of rural realities
3 8 weeks
4. Classroom Term 2 Functional area plus development courses
7 13 weeks
5. Classroom Term 3 Functional area plus integrative development courses
7 13 weeks
6. Development Internship Segment (DIS)
Understanding the philosophy and practice of development interventions; case study of an organization & its environment
3 8 weeks
7. Classroom Term 4 Doctoral-level courses 6 12 weeks 8. Classroom Term 5 Doctoral-level courses;
preparation & presentation of thesis proposals
4 13 weeks
9. Classroom Term 6 Additional courses / readings, if any as determined by TAC Comprehensive Qualifying Examinations; finalization of thesis proposal
13 weeks
10 Fieldwork, thesis writing and submission 1-2 years

28th National Conference on Agricultural Marketing
37
Placement IRMA’s placement record is impeccable with 100% placement. The Campus Placement Programme for each graduating batch ensures that all the students secure meaningful and challenging career opportunities.
Management Development Programmes
IRMA also conducts training programmes for working professionals that help
them upskill and progress in their careers. IRMA’s sought-after Management Development Programmes (MDPs) have benefited executives and managers alike in enterprises including cooperatives, not-for-profit organizations, and government and semi-government organizations engaged in rural development through both open and custom-designed short and long-term MDPs.
Another core programme, geared entirely towards the management of
voluntary organizations, has become an important IRMA signet over the years. Popularly known by its acronym, VOLAG-MAP, the Management Appreciation Programme for Voluntary Agencies is targeted at senior functionaries of voluntary agencies. Participants usually hail from voluntary organizations of developing countries. IRMA has trained more than 500 participants in over 180 NGOs through VOLAG-MAP for the last twenty-odd years. Centres of Excellence
In order to create a facilitating environment for knowledge enhancement IRMA has set up five Centres of Excellence approved by the Government of India. These are:
1. Centre for Sustainable Livelihoods 2. Centre for Rural Infrastructure and Corporate Social Responsibility 3. Centre for Social Entrepreneurship and Enterprises 4. Centre for Public Policy and Governance 5. Centre for Rural Dynamics
1. Cooperative
s and associated
22%
2. Government
Agencies
22%
3. NGO
11%
4. Agri and
Micro Finance
15%
5. Agribusiness
and technology
27%
6. Social
Entrepreneurs
3%
IRMA Placement 2014

28th National Conference on Agricultural Marketing
38
Figure 3.
Grameen Gyan Kosh (GGK)
A repository of knowledge catering to the rural sector this web-based portal is
committed to knowledge creation commissioned in the form of books, monograph, e-sources, new forms of data, films/documentaries on emerging sectors on which knowledge is limited.
Research & Consultancy
Research work is conducted at IRMA by faculty members, visiting fellows, and
students. Students’ research work is mostly available in the form of reports that are prepared on the basis of work undertaken during fieldwork, Development Internship Segment, and Management Traineeship Segment. The research work conducted by IRMA’s faculty is mostly in response to the needs expressed by client organizations that include rural producers’ organizations, government bodies, NGOs, funding agencies, and other development organizations. Our faculty also conducts research in the areas of their professional interest. Much of IRMA’s research is in the form of consultancy, which is undertaken for its client organizations that bear the expenses. Our faculty members provide consulting services to a large number of national and international organizations including the National Dairy Development Board, Gujarat Milk Marketing Federation, NABARD, World Bank, Ford Foundation, Swiss Development Corporation, among many others.

28th National Conference on Agricultural Marketing
Gujarat Cooperative Milk Marketing Federation The Gujarat Cooperative Milk Marketing Federation Ltd, Anand (Amul) is the largest food products marketing organisation of India. It is the apex organization of the Dairy Cooperatives of Gujarat. This cooperatives and its success has not only been emulated in India but serves as a model for rest of the World. Over the last Six and a half decades, Dairy Cooperatives in Gujarat have created an economic network milk producers with millions of consumers in India and abroad through a cooperative system that includes 17,025 Village Dairy Cooperative Societies (VDCS) at the village level, affiliated to 17 District Cooperative level and GCMMF at the State level. These cooperatives collect on an average 150 Lakhs Liters of milk per day from their producer members, more than 70% of whom are small, marginal farmers and landless labourers and iof tribal folk and people belonging to the scheduled castes. Ever since the movement was launched SixtyCooperatives have brought about a significant social and economic change to our rural people. The Dairy Cooperatives have helped in ending the exploitation of farmers and demonstrated that when our rural producers benefit, the community and Nation benefits as well.
socially as well as democratically. Business houses create profit in order to distribute it to the shareholdersploughed back to farmers through the District Unions as well as the village societies. This circulation of capital with value addition within the structure not only benefits the final beneficiary – the farmer village community. This is the most significant contribution the Amul Model cooperatives, of which, the Federation is the apex body, has made in building the Nation. Today Amul is a symbol of many things. Of highprices. Of a vast co-operative network. Of the triumph of indigenous technology. Of the marketing savvy of a farmers' organisation. Above all, it has emerged as the most successful model of dairy development. The turnover of GCMMF (AMUL) during 2013the products, produced by the district milk unions in 54 dairy plants, under the renowned AMUL brand name. The combined processing capacity 240 Lakhs Liters Per Day, with Six dairy plants having processing capacity in excess of 10 Lakhs Liters Per Day. The farmers of Gujarat own the largest state of the art
National Conference on Agricultural Marketing
39
Gujarat Cooperative Milk Marketing Federation
The Gujarat Cooperative Milk Marketing Federation Ltd, Anand (Amul) is the largest food products marketing organisation of India. It is the apex organization of the Dairy Cooperatives of Gujarat. This State has been a pioneer in organizing dairy cooperatives and its success has not only been emulated in India but serves as a model for rest of the World. Over the last Six and a half decades, Dairy Cooperatives in Gujarat have created an economic network that links more than 3.5 million village milk producers with millions of consumers in India and abroad through a cooperative system that includes 17,025 Village Dairy Cooperative Societies (VDCS) at the village level, affiliated to 17 District Cooperative Milk Producers’ Unions at the District level and GCMMF at the State level. These cooperatives collect on an average 150 Lakhs Liters of milk per day from their producer members, more than 70% of whom are small, marginal farmers and landless labourers and include a sizeable population of tribal folk and people belonging to the scheduled castes.
Ever since the movement was launched Sixty-eight years ago, Gujarat’s Dairy Cooperatives have brought about a significant social and economic change to our
ople. The Dairy Cooperatives have helped in ending the exploitation of farmers and demonstrated that when our rural producers benefit, the community and
The Gujarat Cooperative Milk Marketing Federation Ltd. cannot be viewed simbusiness enterprise. It is an institution created by the milk producers themselves to primarily safeguard their interest economically,
socially as well as democratically. Business houses create profit in order to distribute it to the shareholders however, in the case of GCMMF the surplus is ploughed back to farmers through the District Unions as well as the village societies. This circulation of capital with value addition within the structure not only benefits the
the farmer – but eventually contributes to the village community. This is the most significant contribution the Amul Model cooperatives, of which, the Federation is the apex body, has made in building the
Today Amul is a symbol of many things. Of high-quality products sold at reasonable operative network. Of the triumph of indigenous technology. Of
the marketing savvy of a farmers' organisation. Above all, it has emerged as the cessful model of dairy development.
The turnover of GCMMF (AMUL) during 2013-14 was Rs. 18143 crores. It markets the products, produced by the district milk unions in 54 dairy plants, under the renowned AMUL brand name. The combined processing capacity 240 Lakhs Liters Per Day, with Six dairy plants having processing capacity in excess of 10 Lakhs Liters Per Day. The farmers of Gujarat own the largest state of the art
Gujarat Cooperative Milk Marketing Federation, Anand
The Gujarat Cooperative Milk Marketing Federation Ltd, Anand (Amul) is the largest food products marketing organisation of India. It is the apex organization of the Dairy
State has been a pioneer in organizing dairy cooperatives and its success has not only been emulated in India but serves as a model for rest of the World. Over the last Six and a half decades, Dairy Cooperatives
that links more than 3.5 million village milk producers with millions of consumers in India and abroad through a cooperative system that includes 17,025 Village Dairy Cooperative Societies (VDCS) at the
Milk Producers’ Unions at the District level and GCMMF at the State level. These cooperatives collect on an average 150 Lakhs Liters of milk per day from their producer members, more than 70% of whom
nclude a sizeable population
eight years ago, Gujarat’s Dairy Cooperatives have brought about a significant social and economic change to our
ople. The Dairy Cooperatives have helped in ending the exploitation of farmers and demonstrated that when our rural producers benefit, the community and
The Gujarat Cooperative Milk Marketing Federation Ltd. cannot be viewed simply as a business enterprise. It is an institution created by the milk producers themselves to primarily safeguard their interest economically,
socially as well as democratically. Business houses create profit in order to however, in the case of GCMMF the surplus is
ploughed back to farmers through the District Unions as well as the village societies. This circulation of capital with value addition within the structure not only benefits the
but eventually contributes to the development of the village community. This is the most significant contribution the Amul Model cooperatives, of which, the Federation is the apex body, has made in building the
quality products sold at reasonable operative network. Of the triumph of indigenous technology. Of
the marketing savvy of a farmers' organisation. Above all, it has emerged as the
14 was Rs. 18143 crores. It markets the products, produced by the district milk unions in 54 dairy plants, under the renowned AMUL brand name. The combined processing capacity of these plants is 240 Lakhs Liters Per Day, with Six dairy plants having processing capacity in excess of 10 Lakhs Liters Per Day. The farmers of Gujarat own the largest state of the art

28th National Conference on Agricultural Marketing
40
dairy plant in Asia – Mother Dairy, Gandhinagar, Gujarat - which can handle 35 Lakhs Litres of milk per day and process 160 MTs of milk powder daily. All its products are manufactured under the most hygienic conditions. All dairy plants of the unions are ISO 9001 and HACCP certified. GCMMF (AMUL)’s Total Quality Management ensures the highest quality of products right from the starting point (milk producer) through the value chain until it reaches the consumer. But, all this did not happen overnight. It took years of relentless struggle, vision and commitment to reach where we are today. The seeds of this unusual saga were sown more than 68 years back in Anand, a small town in the state of Gujarat in western India. The exploitative trade practices followed by the local trade cartel triggered off the cooperative movement. Angered by unfair and manipulative practices followed by the trade, the farmers of the district approached the great Indian patriot Sardar Vallabhbhai Patel (who later became India’s first Dy. Prime Minister) for a solution. He advised them to get rid of middlemen and form their own co-operative, which would have procurement, processing and marketing under their control. In the summer of 1946, the farmers of this area went on a milk strike refusing to be cowed down by the cartel. Under the inspiration of Sardar Patel, and the guidance of nationalistic leaders like Morarji Desai and Tribhuvandas Patel, they formed their own cooperative in December 1946. This co-operative, the Kaira District Co-operative Milk Producers Union Ltd. ultimately went on to become the role model for India’s dairy co-operative movement. The birth of Amul at Anand provided the impetus to the cooperative dairy movement in the country. The Cooperative was further developed & managed by Dr. V Kurien along-with Shri H M Dalaya. The first modern dairy of the Kaira Union was established at Anand (which popularly came to be known as AMUL dairy after its brand name). Indigenous R&D and technology development at the Cooperative had led to the successful production of skimmed milk powder from buffalo milk – the first time on a commercial scale anywhere in the world. The foundations of a modern dairy industry in India were thus laid since India had one of the largest buffalo populations in the world. The success of the dairy co-operative movement spread rapidly in Gujarat. Within a short span five other district unions – Mehsana, Banaskantha, Baroda, Sabarkantha and Surat were organized. In order to combine forces and expand the market while saving on advertising and avoid a situation where milk cooperatives would compete against each other it was decided to set up an apex marketing body of dairy cooperative unions in Gujarat. Thus, in 1973, the Gujarat Co-operative Milk Marketing Federation was established. The Kaira District Co-operative Milk Producers’ Union Ltd. which had established the brand name AMUL in 1955 decided to hand over the brand name to GCMMF (AMUL). With the creation of GCMMF (AMUL), we managed to eliminate competition between Gujarat’s cooperatives while competing with the private sector as a combined stronger force. GCMMF (AMUL) has ensured remunerative returns to the farmers while providing consumers with quality products under the brand name AMUL.

28th National Conference on Agricultural Marketing
This was possible due to the dedicated and committed leadersChairman of AMUL, Tribhuvandas Patel and the vision and professionalism of the father of the White Revolution, Dr. Verghese Kurien who worked as a professional manager at AMUL.
Dr. Verghese Kurien, the World Food Prize and the MagsaysaRevolution, which helped India emerge as the largest milk producer in the world. His professional life has been dedicated to empowering Indian farmers through cooperatives. Dr. Kurien’s vision has helpefoundation of democratic enterprises at the grass roots and shown the way to ensure economic justice is with people’s
participation. He believes that by placing technology and professional management in the hands of the farmers, the standard be improved. The three-tier ‘Amul Model’ in which Village Dairy Cooperative Societies procure milk, district level Milk Union process the milk and State level Federation sales milk and milk products has been ithe country. As per the assessment report of the World Bank on the Impact of Dairy Development in India, the ‘Anand Pattern’ has demonstrated the following benefits: • The role of dairying in poverty • The fact that rural development involves more than agricultural production• The value of national ‘ownership’ in development• The beneficial effects of higher incomes in relieving the worst aspects of poverty• The capacity of dairying to create jobs• The capacity of dairying to benefit the poor at low cost• The importance of commercial approach to development• The capacity of single• The importance of getting government out of commercial enterprises• The importance of market failure in agriculture• The power & problems of participatory organisations AMUL Brand Building: AMUL is derived from the Sanskrit word ‘denotes and symbolizes the pride of short, catchy and can effectively be used as an acronym for Anand Milk Union Ltd.
value for their hard earned money. It represents the national commitment for self
National Conference on Agricultural Marketing
41
This was possible due to the dedicated and committed leadersChairman of AMUL, Tribhuvandas Patel and the vision and professionalism of the father of the White Revolution, Dr. Verghese Kurien who worked as a professional
Dr. Verghese Kurien, the World Food Prize and the Magsaysay Award winner, is the architect of India’s White Revolution, which helped India emerge as the largest milk producer in the world. His professional life has been dedicated to empowering Indian farmers through cooperatives. Dr. Kurien’s vision has helpefoundation of democratic enterprises at the grass roots and shown the way to ensure economic justice is with people’s
participation. He believes that by placing technology and professional management in the hands of the farmers, the standard of living of millions of our poor people can
tier ‘Amul Model’ in which Village Dairy Cooperative Societies procure milk, district level Milk Union process the milk and State level Federation sales milk and milk products has been instrumental in bringing about the White Revolution in the country. As per the assessment report of the World Bank on the Impact of Dairy Development in India, the ‘Anand Pattern’ has demonstrated the following benefits:
The role of dairying in poverty reduction The fact that rural development involves more than agricultural productionThe value of national ‘ownership’ in development The beneficial effects of higher incomes in relieving the worst aspects of povertyThe capacity of dairying to create jobs The capacity of dairying to benefit the poor at low cost The importance of commercial approach to development The capacity of single-commodity projects to have multi-dimensional impactsThe importance of getting government out of commercial enterprises
e importance of market failure in agriculture The power & problems of participatory organisations
AMUL is derived from the Sanskrit word ‘AMULYA’ which means priceless. It denotes and symbolizes the pride of swadeshi (nationalistic) production. It is also short, catchy and can effectively be used as an acronym for Anand Milk Union Ltd.
AMUL stands for a set of values. AMUL today is not only a brand name. It is much beyond that. It represents the spirit of the true Indian the spirit of the consumers’ faith in the country’s most recognizable brand. AMUL to a consumer is a top class quality product at a reasonable price. The consumer sees AMUL as a guarantor of assured quality and of
d earned money. It represents the national commitment for self
This was possible due to the dedicated and committed leadership of the founder Chairman of AMUL, Tribhuvandas Patel and the vision and professionalism of the father of the White Revolution, Dr. Verghese Kurien who worked as a professional
Dr. Verghese Kurien, the World Food Prize and the y Award winner, is the architect of India’s White
Revolution, which helped India emerge as the largest milk producer in the world. His professional life has been dedicated to empowering Indian farmers through co-operatives. Dr. Kurien’s vision has helped to lay the foundation of democratic enterprises at the grass roots and shown the way to ensure economic justice is with people’s
participation. He believes that by placing technology and professional management of living of millions of our poor people can
tier ‘Amul Model’ in which Village Dairy Cooperative Societies procure milk, district level Milk Union process the milk and State level Federation sales milk
nstrumental in bringing about the White Revolution in the country. As per the assessment report of the World Bank on the Impact of Dairy Development in India, the ‘Anand Pattern’ has demonstrated the following benefits:
The fact that rural development involves more than agricultural production
The beneficial effects of higher incomes in relieving the worst aspects of poverty
dimensional impacts The importance of getting government out of commercial enterprises
which means priceless. It production. It is also
short, catchy and can effectively be used as an acronym for Anand Milk Union Ltd.
AMUL stands for a set of values. AMUL today is not only a brand name. It is much beyond that. It represents the spirit of the true Indian farmer. It reflects the spirit of the consumers’ faith in the country’s most recognizable brand. AMUL to a consumer is a top class quality product at a reasonable price. The consumer sees AMUL as a guarantor of assured quality and of
d earned money. It represents the national commitment for self-

28th National Conference on Agricultural Marketing
42
reliance and development of human resources and values based on sustainable developmental process. It has made an enormous difference in the lives of millions of farmers bolstering their livelihoods and offering steady income in regions where agriculture still depends on rainfall and the gamble of monsoons. Today AMUL is The Taste of India, and is available in every nook and corner of the country. Wherever you go, whether it is the fashionable trendy malls or the corner mom-n-pop stores, you are bound to find some AMUL product or the other. AMUL is also the largest exporter of dairy products in the country. AMUL is available today in over 46 countries of the world. We are exporting a wide variety of products which include Whole and Skimmed Milk Powder, Cottage Cheese (Paneer), UHT Milk, Clarified Butter (Ghee) and Indigenous Sweets. The major markets are USA, West Indies, and countries in Africa, the Gulf Region, and our SAARC neighbours, Singapore, The Philippines, Thailand, Japan and China. We have demonstrated that if a level playing field is granted, Indian dairy products are successful in the global market. Growth in consumer pack exports has been creditable and we have consolidated our exports of UHT milk in particular. AMUL is a matter of pride to every Indian .Our nation takes pride in AMUL as proof that our own Indian vision, backed by hard work, management skill and honest capable leadership can achieve miracles.

28th National Conference on Agricultural Marketing
43
Sardar Patel Education Trust, Anand The title of trust itself commemorate Late Shri Vallabhbhai Patel, the Iron man of India world famous as SARDAR PATEL. We believe in his ideology and try to do some good for society at large. The trust is registered as public trust in 1969, catering to the needs of the community through 15 educational institutions under its umbrella, from K. G. to Doctorate & Research in various discipline/faculties which covers Arts, Commerce, Education, IT / Computer Science and Management, Social welfare etc. for last 44 years. We venture out in the field of Paramedical and Science under the title B. N. Patel Institute of Paramedical and Science launched successfully in 2010. Kidney (HEAMO) dialysis center has been started in April 2010. We have state of the art modern dialysis center equipped with latest technology dialysis machinery. We offer dialysis services to kidney failure patients on a subsidized rate. Our intention was to impart education in the field of dialysis technology and prepare dialysis technicians. To support the dialysis process we also have full fledge clinical laboratory to carry out required investigations for dialysis. Students are provided practical training on our dialysis centre. Since kidney failure cases are increasing day by day there is need of such dialysis centre to serve the people at large. With increase in number of dialysis centre, requirement of dialysis technicians also increases. Now the dialysis technicians are in demand within the country as well as abroad. Thus, future of dialysis technician is very bright & after undergoing the course successfully all the students will get job through placement with a very good salary package. We are proud to have on our campus 11000 plus students undergoing education in various faculties. We have around 350 well qualified, experienced and dedicated teaching faculties imparting quality education and 150 administrative staff to take care of office administration. SPET believe in services to humanity and so provides social services to the society through its paramedical division. It has a fully fledged fully equipped Dialysis Centre, Digital X-Ray and Mammography Centre, Clinical Lab, Physiotherapy and Laser Centre, Fitness Centre etc. Gujarat Kidney Foundation – Ahmedabad and Infocus Radiology Centre – Ahmedabad provide their technical expertise to this institute. SPET has also joined hands with the Zydus Hospital – Anand, a full fledge 250 bed modern multi utility hospital for Operation Theatre, paramedical training and support services in the field of education and social cause. SPET with a noble motto to develop world class and well equipped dental lab facility in the milk city has set up B. N. Patel Dental CAD/CAM Lab Tech Institute with high tech equipment for the lab has been imported from Amman Girrabach (Germany) to provide prompt & quality dental services. We have successfully established a Dental CAD-CAM Lab and commenced production of crowns, bridges, tooth etc. as a part of academic activities and training programs for CAD-CAM technicians. We serve the community at large on a various platform through our paramedical division, where it has undertaken various health check-up camp for students, senior citizens, police officers and employees of collectorate office. Paramedical Division has also undertaken above 500 free mammography for women.

28th National Conference on Agricultural Marketing
44
The vision of Shri B. N. Patel, Managing Trustee-Secretary is to provide education facility to Girl Child on our campus free of cost as a part of our community services. The SPET Parivar is committed to achieve such goals in the interest of education and social services.
NRG Centre, Anand Managed by Sardar Patel Education Trust Gujarat State Non-Resident Foundation (GSNRGF) is a State Government grant in aid society engaged in the work of live interaction with Non-Resident Gujaratis spread all over the World. Sardar Patel Education Trust is registered as a Public Trust working for the development of education and society. GSNRGF considered and granted NRG Centre to Sardar Patel Education Trust to provide services to Non Resident Gujaratis, in particular to provide services in the form of a help desk centre at Anand. The NRG Centre is working for NRGs and provide assistance. During the year 2012-13, a high level delegation of Punjab Government headed by the Secretary, NRI Division visited NRG Centre, Anand. Their visit was to understand functioning of NRG Centres in Gujarat so as to replicate & start NRG Centers’ in the state of Punjab. Shri B. N. Patel, Managing Trustee and Secretary along with Shri Rajesh B. Patel, Vice Chairman, NRG Centre welcome the delegates and provided desired information. The delegation appreciated the activities of NRG Centre and cooperation extended during their visit. Another delegation from State Bank of India, NRI division headed by the Chief Manager visited NRG Centre, ANAND. They have appreciated the efforts being made by the NRG Centre for NRGs. They have offered their services as and when required. NRG Centre ,ANAND and Gujarat State Non-Resident Gujaratis Foundation (GSNRGF), Gandhinagar jointly organized one seminar on “NRI Marriages and Gujarat Card” on 22nd Feb. 2013 at Chanchalbaa Auditorium. Shri Bhikhubhai N. Patel Managing Trustee & Secretary presided over the function. The seminar was well received by the delegates and the gesture of NRG Centre was appreciated.

28th National Conference on Agricultural Marketing
45
Gujarat State Agricultural Marketing Board, Gandhinagar The Board has been established in 1985 as per the provisions contained in section 34 and 34 A (1) of the Gujarat Agricultural Produce Market Act, 1963. → CONSTITUTION The Board consists of 18 members as below:-
(A) Chairman to be nominated by State Government (B) Nine Agriculturist members (C) Three Trader Members to be elected by Market Committees situated at
various places of the State (D) The Secretary of Agriculture Department (E) Secretary of Cooperation Department (F) Registrar of Cooperative Societies (G) The Director of Agricultural Marketing (H) The Agricultural Marketing Adviser from Govt. of India, Faridabad (I) The Managing Director – Ex-Officio are other nominated Members on the
Board → FUNCTION The main functions of the Board are:-
� To co-ordinate the working of the market committee for developing the market yard/sub-yard.
� To undertaken the State level planning of the development of agricultural produce market subject to directions of the State Government.
� To administer the Development Fund. � To supervise and guide the market committees on request in respect of the
preparation of plans as also the construction of infrastructural facilities in the market yards.
� To assist, undertaken collection, compilation and publication of market intelligence and statistics as also to promote market survey and conduction research in the field of agricultural marketing.
� To promote and undertaken grading and standardization of agricultural produce.
� To arrange and organize seminars, workshops, camps, conferences and exhibitions in the state on agricultural marketing.
� To grant subsidy and loans to needy market committees for the purpose of this Act.
� To provide technical and legal assistance to the market committee on request. � To promote and assist marketing of agricultural produce in areas where there
is no regulation of market under this Act.

28th National Conference on Agricultural Marketing
46
→ ACTIVITIES EXECUTED AND UNDERTAKEN BY THE BOARD
1. Training to employees and office bearers of APMCs. 2. Participation in state level, national level exhibitions and seminars. 3. In past the Board undertook foreign tours of Israel, USA and European
countries. 4. Organized seminar on the impact of WTO on agricultural marketing in April,
2001 at Tithal, District – Valsad. 5. Organized state level discussion on new fronts of APMCs Model Act in the
presence of Hobn’ble Chief Minister, Gujarat State. 6. Central assistance the Board in collaboration with the Cotton Corporation of
India Ltd. has implemented to improvise infrastructure facilities like providing fire fighting to equipments, auction platforms for cotton, open shed, canteen, compound wall, providing fodder for cattle of farmers & rest house for the farmers for selected six to eight APMCs every year. During last 3 year Board has been able to get approved 33 projects to TMC at an investment of Rs. 60 crores and ranks. First in all over the country.
7. Computer network connection to APMCs in “Agmarknet” scheme to provide computers with the help of Directorate of Agricultural Marketing, Government of India. At present all APMC cover the computer & internet facilities.
8. One of the seven promoters in establishing on-line commodity exchange Board of India. Other participants are NAFED, Central Warehousing Corporation, Gujarat Agro Industries Corporation and National Institute of Agricultural Marketing (NIAM).
9. Participated in the Agmark Exhibition in Rajkot, Kadi & in Agrifair 2006 at Ahmedabad.

28th National Conference on Agricultural Marketing
47
Agricultural Performance in Gujarat: Recent Experiences
Mrutyunjay Swain, S.S. Kalamkar and Kalpana Kapadia* 1. Introduction Gujarat is the one of the fastest growing states of India. The state has adopted a novel pattern of progress with the strategic development of the key sectors like energy, industry and agriculture for which it has achieved ambitious double digit growth rate since 10th Five Year Plan period. The state constitutes about 6.2 per cent of total geographical area and 4.99 per cent of total population of India. As per Census 2011, about 3.47 crores people of the state live in rural areas forming about 57.4 per cent of its total population (GoI, 2011). About 70.5 per cent of total workers in the state are rural based. Agriculture continues to be the primary occupation for the majority of rural people in the state. About 51.8 per cent of total workers are cultivators and agricultural labourers. Thus, the agriculture in the state has been the major source of labour absorption. Moreover, agriculture provides indirect employment to large portion of population in agro-based occupations. Thus, prosperity and well being of people in Gujarat is closely linked with agriculture and allied activities.
Agriculture in Gujarat is characterized by natural disparities such as (i)
drought prone areas and lowest annual rainfall amounting to only about 345 mm at the North West end of the states; and assured and highest annual rainfall amounting to about 2500 mm at the South-East end; (ii) well drained deep fertile soils of central Gujarat and shallow and undulating soils with poor fertility in hilly rocky areas in the east; (iii) moisture starved degraded areas and low lying waterlogged and saline areas; (iv) areas prone to frequent scarcity and areas prone to frequent cyclone or floods or locusts (GoG, 2012a). Thus, output of agricultural sector in Gujarat has been largely dependent on south-west monsoon. The state frequently experiences erratic behaviour of the south-west monsoon, which can partly be attributed to geographic situation.
Agriculture and allied sector plays an important role in the State economy.
Though its contribution in NSDP has gradually declined from around 50 per cent during 1970s to around 21.6 per cent in 2010-11, agriculture still considered as a backbone of state economy. More than half of the working population in the state is still dependent on agricultural activities for their livelihood. Thus, a higher priority to agriculture will achieve the goals of reducing poverty and malnutrition as well as of inclusive growth. Since agriculture forms the resource base for a number of agro-based industries and agro-services, it would be more meaningful to view agriculture not as farming alone but as a holistic value chain, which includes farming, wholesaling, warehousing, processing and retailing.
Out of total reporting area of 19.07 million hectares, 64.18 percent area (12.24
million hectares) is covered under cultivation (GoI, 2013a). About two-third of the
* Sr. Research Officer/Assistant Professor (SS), Director and Professor, and Research Associate, respectively, at Agro-Economic Research Centre, Sardar Patel University, Vallabh Vidyanagar, Anand (388 120), Gujarat, India (E-mail:[email protected]).

28th National Conference on Agricultural Marketing
48
area of the state is under arid and semi-arid tropics, where the risk and instability in agricultural production and productivity remains quite high. However, these arid and semi-arid areas of the state have clocked high and recorded steady growth at 9.6 per cent per year in agricultural state domestic product since 1999-2000, whereas the GDP from agriculture and allied sectors has increased by less than 3 per cent at national level (2.9 percent) during the corresponding period (Shah et al., 2009). The Gujarat government has aggressively pursued an innovative agriculture development programme by liberalizing markets, inviting private capital, reinventing agricultural extension, improving roads and other infrastructure (Shah et al., 2009; Kumar et al., 2010). The mass-based water harvesting and farm power reforms in dry Saurashtra and Kachchh, and North Gujarat have helped energize Gujarat’s agriculture. These semi-arid regions have outperformed the canal irrigated South and Central Gujarat.
The six major factors that were given a concerted push by the Gujarat
government from 2002-03 onwards were: (i) a sustained programme of water conservation and management; (ii) a massive and well-coordinated extension effort; (iii) a successful overhaul of rural electricity distribution; (iv) a strong emphasis on non-food crops like horticulture, Bt cotton, castor and isabgol; (v) sustained and comprehensive support to livestock development; (vi) major revamping of agriculture-supporting infrastructure, including roads, electricity and ports (Pathak and Singh, 2007; Dholakia, 2010). However, the agriculture sector is still facing many challenges with changing environment. There is a need to examine these challenges and frame a road map to accelerate the agricultural development in the state.
In this context, this study evaluates the overall performance of agriculture in
Gujarat in the recent years and also examines the major factors/inputs that contributed to agricultural success stories in the state. The paper presents the future options, given the objectives of accelerated growth, inclusiveness and reduction of poverty. 2. Structural Transformation of Gujarat Economy Gujarat economy has undergone considerable transformation in the recent past. While manufacturing and service sectors are growing positively, whereas share of agriculture (including livestock) in the state’s NSDP is declining. The services sector contributes around 49.5 per cent in NSDP (at constant 2004-05 prices) followed by the industry (35.6 per cent), whereas agriculture sector contributes hardly 15.0 per cent during the year 2010-11. Over the last six years (2005-06 to 2010-11), the share of agriculture, industry and services sectors in the total NSDP at constant (2004-05) prices has changed from 22.2 per cent to 15.0 per cent, from 31.9 per cent to 35.9 per cent and 45.9 per cent to 49.4 per cent, respectively. Thus, there has been significant reduction in relative share of the agriculture sector in total NSDP during last six years, while the contribution of service sector has been constantly increasing. This indicates a shift from the traditional agrarian economy towards a service dominated one. More importantly, the decrease in agriculture’s contribution to NSDP has not been accompanied by a matching reduction in the share of agriculture in employment. About 11 million workers continue to be engaged in farming, out of which majority are small or marginal farmers. Therefore, increasing

28th National Conference on Agricultural Marketing
49
agricultural productivity (water, land, labour) is critical for the future of the sector in Gujarat.
Though the relative share of agriculture and allied sectors to NSDP has
declined significantly, it may be noted from Figure 1 that the absolute contribution of agriculture and allied sector has constantly grown. Agricultural NSDP at current prices has been more than doubled from Rs. 46505 crore in 2005-06 to Rs. 95268 crore in 2011-12.
The state has made a steady progress in expanding its agriculture. The state occupied 4th, 6th and 3rd position at all India level in the production of fruit, vegetable and spices, respectively (GoG, 2010a). The area under horticultural crops in the state was 14.04 lakh hectares constituting about 9.8 per cent of GCA in 2010. Gujarat is the India’s largest producer of cotton, castor, cumin and isabgul. The state is the second largest producer of sesame and groundnut in the country. The agricultural productivity of some crops in the state is highest in India as well as in the World. The productivity of mustard, castor, cotton, onion and potato is highest in the state compared to other states in India. The productivity of groundnut, bajra and banana is the second highest in India. The reliance on livestock has also increased because of risky rainfed agriculture in some parts of the state. 3. Growth Performance of Gujarat Agriculture 3.1 Overall Growth in Agriculture The growth performance of the agriculture in Gujarat has been fluctuating across the plan periods (Table 1). The compound annual growth rate of gross cropped area, total agricultural production and yield has exhibited wide fluctuations during annual plan 1990-91 to 11th Five Year Plan. The crop area, yield and production have decelerated drastically during the annual plan period (1990-91), as well as during the 9th plan period. However, during 10th Five Year Plan period, there has been a significant growth in area, yield and production, which has increased significantly at the rate of 5.27 per cent, 20.54 per cent and 14.50 per cent, respectively. Despite of
Figure 1: Sectoral Composition of NSDP at Current Price in Gujarat (2005-06 to 2010-11)
10000
30000
50000
70000
90000
110000
130000
150000
170000
190000
210000
2005-06 2006-07 2007-08 2008-09 2009-10 2010-11
Agriculture and allied
Industry
Service
Rup
ees
in c
rore
s

28th National Conference on Agricultural Marketing
50
efforts being taken by the government to achieve 4 percent rate of growth during XI FYP, the rate of growth in crop productivity was negative. The crop yield has decelerated at the rate of 1.23 percent per annum, whereas area has increased at the rate of 2.24 percent per annum. It may worth to note here that the gross cropped area has increased by almost 18.2 percent in four years period, i.e. increased from 121.1 lakh hectares in 2007-08 to 143.2 lakh hectares in 2010-11. The extent of fluctuation in agricultural production is also quite as evident from Figure 2.
Table 1: Planwise Growth in Area, Production and Yield of Major Crops in Gujarat (Per cent per annum)
Plan Period Area Production Yield
Annual Plan (1991-1992) -0.65 -17.05 -16.51
8th Five Year Plan (1992-1997) -0.06 3.73 3.79
9th Five year Plan (1997-2002) -3.00 -5.74 -2.82
10th Five year Plan (2002-2007) 5.27 20.54 14.50
11th Five year Plan (2007-2011)* 2.24 0.99 -1.23 Note: *Data up to 2010-11 has been taken into consideration Source: GoG (2011a)
If we look at the growth in gross cropped area during the last two decades (1991 to 2011) in the state, it can be seen from Table 2 that the gross cropped area was almost stagnant during first decade (1990-91 to 2000-01), whereas it increased significantly during second decade (2000-01 to 2010-11). The similar pattern has been noticed in case of crop production in the state. The agricultural production has declined from about 10.5 million tonnes (mt) in 1990-91 to 7.5 mt in 2000-01, whereas it increased significantly as high as to 25.3 mt in 2010-11. The growth in production was mainly due to both, growth in productivity associated by increase in area under the crop production. The crop yield which had registered negative growth
-400
100
600
1100
1600
2100
2600
0
5000
10000
15000
20000
25000
30000
19
90
-91
19
91
-92
19
92
-93
19
93
-94
19
94
-95
19
95
-96
19
96
-97
19
97
-98
19
98
-99
19
99
-00
20
00
-01
20
01
-02
20
02
-03
20
03
-04
20
04
-05
20
05
-06
20
06
-07
20
07
-08
20
08
-09
20
09
-10
20
10
-11
Yie
ld in
Kg/
ha
Are
a in
000
ha,
Pro
duct
ion
in 0
00 to
ns
and
Yie
ld in
Kg/
ha
Figure 2: Growth in Area , Production and Yield of all Major Crops (1990-2010)
Total area (000 ha) Production(000 MT) yield (Kg/Ha)

28th National Conference on Agricultural Marketing
51
during 1990-91 to 2000-01 (declined from 983 kg/ha in 1990-91 to 714 kg/ha in 2000-01), increased significantly during last decade period.
Considering the case of food grains production alone, the annual growth is
exhibiting quite fluctuating trend. It can be seen from the Table 3 that the food grains production in Gujarat has increased from 4.98 mt in 1990-91 to 8.21 mt in 2007-08, thereafter declined to 5.61 mt in 2009-10. However during the year 2010-11, significant increase in food grains production was recorded, i.e. 10.07 mt. The share of the state in total national food grains production has grown from 2.8 per cent in 1990-91 to 4.2 per cent in 2010-11, with ups and downs during the period.
Table 2: Area, Yield and Production of Major Crops in Gujarat during 1991-2010
Year Gross cropped area
(000 ha) All Major Crops
Area (000 ha)
Production (000 MT)
Yield (Kg/ha)
1990-91 10635 8956 10453 1167 1995-96 10996 9376 12223 1304 2000-01 10497 7745 7500 968 2005-06 11495 9148 20999 2296 2006-07 11807 9748 19617 2012 2007-08 12110 10092 24582 2436 2008-09 11571 9544 19710 2065 2009-10 11138 9057 18447 2037 2010-11 14316 10786 25319 2348
Source : GoG (2011a)
Table 3: Food grains Production in Gujarat and India (million tonnes)
Year Gujarat India % share 1990-91 4.98 176.4 2.8 2000-01 2.54 196.8 1.3 2006-07 5.88 217.3 2.7 2007-08 8.21 230.8 3.6 2008-09 6.35 234.4 2.7 2009-10 5.61 218.1 2.6 2010-11 10.07 241.6 4.2 2011-12 9.26 259.3 3.6
Source: GoG (2012b) and GoI (2013b).
3.2 Crop Specific Growth in Gujarat The major crops grown in different parts of Gujarat are bajra, wheat, jowar, maize, cotton, groundnut, rapeseed and mustard, fodder and horticultural crops (Map 1). As per the cropping pattern in Gujarat, total cereals, pulses, oilseeds, horticultural crops and fodder crops account for about 32.2 per cent, 6.7 per cent, 23.4 per cent, 10.6 per cent and 8.4 per cent of GCA, respectively in 2010-11 (Table 4). Among the cereals, wheat (11.9%), bajra (6.6%), rice (6.1%) and maize (4.3%) are the major crops. Among the oilseeds, groundnut (14.4%), caster (3.7%), rapeseeds and mustard (1.7%), sesamum (1.9%) are the major crops grown during 2010-11.

28th National Conference on Agricultural Marketing
52
Overall, the share of total cereals, total pulses, total food grains and total oilseeds in GCA has declined during last two decades; whereas the share of commercial crops such as cotton and horticultural crops has increased. Though the area under total cereals has decreased from 35.7 per cent (to GCA) in 1990-91 to 42.0 per cent in 2010-11, the share of wheat and maize in GCA has increased respectively from 5.7 per cent and 3.4 per cent in 1990-91 to 11.9 per cent and 4.3 per cent in 2010-11. However, the share of bajra crop has been considerably declined from 13.1 per cent to 6.6 per cent during the corresponding period.
Map 1: Crop Distribution in Gujarat
Table 4: Change in Cropping Pattern in Gujarat
Major crops 1990-91 2000-01 2010-11
Area (000' ha)
% of GCA Area (000' ha)
% of GCA
Area (000' ha)
% of GCA
Rice 623.0 (5.9) 583.5 (5.6) 808.0 (6.1)
Bajra 1394.3 (13.1) 989.2 (9.4) 873.0 (6.6)
Wheat 608.7 (5.7) 286.1 (2.7) 1589.0 (11.9)
Maize 366.2 (3.4) 382.9 (3.6) 566.0 (4.3)
Total cereals 3799.8 (35.7) 2435.6 (23.2) 4014.4 (30.2)
Tur 428.9 (4.0) 317.9 (3.0) 277.0 (2.1)
Total pulses 948.7 (8.9) 634.6 (6.0) 890.1 (6.7)
Total food grains 4748.5 (44.7) 3070.2 (29.2) 4904.5 (36.9)
Sesamum 237.0 (2.2) 356.9 (3.4) 251.1 (1.9)
Groundnut 1826.1 (17.2) 1744.8 (16.6) 1922.0 (14.4)
Rapeseed-mustard 348.6 (3.3) 186.6 (1.8) 222.7 (1.7)
Castor 384.9 (3.6) 458.6 (4.4) 490.6 (3.7)
Total oilseeds 2818 (26.5) 2746.9 (26.2) 3110.0 (23.4)
Cotton 1041.6 (9.8) 1615.4 (15.4) 2623.0 (19.7)
Tobacco 141.6 (1.3) 87.8 (0.8) 148.0 (1.1) Horticultural crops 337.4 (3.2) 593.34 (5.7) 1404.0 (10.6)
Fodder crops 1325.1 (12.5) 1371.1 (13.1) 1111.8 (8.4) Other crops 222.6 (2.1) 1012.3 (9.6) 0.0 (0.0) All crops 10634.8 (100.0) 10497.0 (100.0) 13301.3 (100.0)
Notes: GCA for 2010 is provisional since the area under other crops is assumed to be zero due to unavailability; Area under fodder crops in 2006-07 has been taken as proxy for the same in 2010-11; Figures in parentheses are the percentages of GCA. Sources: GoG (2011a); GoG (1994), various issues.
The share of pulses has increased slightly from 17 per cent in 1990-91 to 18 per cent in 2010-11. In case of oilseed crops, its share in GCA has increased from 15 per cent in 1990-91 to 21 per cent in 2010-11. On the other hand, the share of area under cotton in GCA has significantly increased from 9.8 per cent in 1990-91 to 19.7 per cent in 2010-11. However, share of fodder crops has remained unchanged around 15 per cent of GCA during 1990-91 and 2010-11. The share of area under horticultural crops in GCA has increased significantly from 3.2 per cent in 1990-91 to 10.6 per cent in 2010-11. It is worth to note here that the cultivation of horticulture

28th National Conference on Agricultural Marketing
53
and cotton has generated revenue of Rs. 15707 crores and Rs 12067 crores respectively during the year 2010-11 (GoG, 2011a).
3.3 Drivers of Growth in Agriculture Agricultural growth in any region can occur because of: (i) growth in crop output; (ii) diversification of agriculture towards high valued crops and livestock products; and (iii) increase in value of the given output (Bhalla and Singh, 2009). Examining these three aspects of agricultural growth in Gujarat, it reveals that the overall growth in agricultural output and yield of major crops in the state is quite impressive since 2000. Though the area under oilseeds, pulses and horticultural crops has increased in absolute term, the share of oilseeds and pulses in GCA has declined. While, the share of cash crops like cotton and horticultural crops have increased substantially during the last two decades which proves that the process of diversification of agriculture towards high value, WTO competitive and sustainable crops is in right direction. The only need is to increase the pace of diversification towards these high valued cash crops in the state. National Food Security Mission (NFSM) and the National Horticulture Mission (NHM) have also emerged as the path breaking interventions which have helped in agricultural diversification towards cash crops in the state.
The growth in dairy sector in the state has been revolutionary (which is
discussed in detail in separate section). Gujarat is the highest contributor of nation’s marine exports both in terms of quantity as well as value (GoG, 2012c). So far as the increase in value of the agricultural output is concerned, it is noteworthy that the exports and domestic prices of agricultural commodities have increased successively over the years in the state resulting in rise in the value of output. However, it is reported that the majority of small and marginal farmers don’t get remunerative prices because of constraints in marketing channels and infrastructures resulting in
Source: www.mapsof india.com

28th National Conference on Agricultural Marketing
54
lower value of their output. Farmers are unable to get Minimum Support Price (MSP) because of monopolistic behaviour of the informal buyers/ traders.
One of the key drivers of State’s agricultural growth is investment in
agriculture. It may be seen from Table 6 that about Rs 8315.6 crores was earmarked as budget outlay for agriculture and allied services for 11th Five Year Plan (FYP) period. The total budget outlay for three major heads (i.e., agriculture and allied services, rural development and irrigation and flood control) related to agriculture sector development put together was Rs. 41286.7crores which accounts for about 37.2 per cent of total budget outlay for the 11th FYP for the state of Gujarat (Table 5). The examination of expenditure of this budget outlay during the individual years reveals that the expenditure on these three key drivers of agricultural growth has been over 30 per cent. It was as high as 39.4 per cent and 45.2 per cent during 2007-08 and 2008-09 respectively. The investment in these three major sectors has fueled the growth in agriculture in the state during 2000s. Considering the case of agriculture alone, it may be seen that the its share in total annual budget outlay and expenditure was 7.4 per cent and 7.7 per cent respectively during 2009-10, that has slightly come down to about 6.9 per cent each during 2010-11.
It is worth mentioning here that the marginal returns evident in terms of poverty alleviation or accelerating agricultural growth are much lower from input subsidies than from investments in rural roads or agri-R&D or irrigation (Shenggen et al., 2008). Thus, agricultural subsidies should be targeted more towards poor farmers, public investment in agriculture should be accelerated for sustained long-term agricultural growth. This would help in expansion of irrigation facilities which is very critical for agricultural growth in Gujarat keeping in view of the fact that the major part of cultivable area is rainfed and the annual average rainfall in Gujarat is very erratic in nature. 3.4 Marketing and Warehouse Facilities As discussed in the preceding section, adequate returns on agricultural output is one of the driving forces for better agricultural growth. Better marketing channels and warehouse facilities are essential for ensuring adequate returns on agricultural output of famers. It may be seen from Table 6 that the total warehousing capacity
Sl. No.
Major Heads 11th Plan (2007-12)
Outlay Outlay Exp. Outlay Exp. Outlay Exp. Outlay Exp.1 8316 918 891 1605 1388 1746 1784 2063 2075
(7.5) (5.7) (5.7) (7.6) (6.4) (7.4) (7.7) (6.9) (6.9)2 3443 502 470 682 567 847 834 1301 1085
(3.1) (3.1) (3.0) (3.2) (2.6) (3.6) (3.6) (4.3) (3.6)3 29528 4758 4815 5605 7872 5570 5747 5670 6185
(26.6) (29.7) (30.7) (26.7) (36.2) (23.7) (24.8) (18.9) (20.6)4 41287 6178 6175 7892 9828 8163 8365 9034 9346
(37.2) (38.6) (39.4) (37.6) (45.2) (34.7) (36.1) (30.1) (31.1)5 111111 16000 15680 21000 21764 23500 23161 30000 30097
(100.0) (100.0) (100.0) (100.0) (100.0) (100.0) (100.0) (100.0) (100.0)
Annual Plan (2007-08)
Annual Plan (2008-09)
Annual Plan (2009-10)
Annual Plan (2010-11)
Table 5: Investment outlay and expenditure on agriculture and allied sectors during 11th Five Year Plan
(Rs in crores)
Source : GoG (2011a)
Agriculture & Allied Services
Rural Development
Irrigation & Flood Control
Sub Total (1+2+3)
Total

28th National Conference on Agricultural Marketing
55
under Gujarat State Warehousing Corporation (GSWC) has come down from 2.1 lakh tonnes in 2006-07 to 1.5 lakh tonnes in 2010-11. It is astonishing to find that the level of utilization of the existing warehousing capacity has been very low. The utilization has also come down from 66.9 per cent in 2006-07 to 49.6 per cent during 2010-11. It may also be noted that during the period of last five years, Corporation has recorded loss during three years. This may be due to under utilization of the storage. Table 6: Warehousing Capacity under Gujarat State Warehousing Corporation
Year Owned capacity
(MT)
Hired capacity
(MT)
Total capacity
(MT)
% of utilization
Profit (+) Loss (-)
2006-07 129373 81,011 2,10,384 66.9 (+)077.00 -
2007-08 1,29,373 10,557 1,39,930 45.9 - (-)023.17
2008-09 1,29,373 29,523 1,58,896 68.7 (+) 066.54 - 2009-10 1,35,908 39,396 1,75,304 59.7 (+) 027.10 - 2010-11 1,45,056 45,013 1,90,069 49.6 - (-) 65.46
2011-12 1,45,056 3,100 1,48,156 61.4 - - Source: Gujarat State Warehousing Corporation, Dept. of Agriculture, Govt. of Gujarat, Gandhinagar
The Gujarat State Warehousing Corporation (GSWC), whose main activity is
to build godowns and warehouses in the state (for scientific storage of agricultural produces, manures, fertilizers, agricultural implements and other notified commodities of the farmers, co-operative societies, traders, government and other institutions) is operating 201 godowns across 22 districts of the state. There are 205 market committees in 26 districts of the state, which includes 199 main yards and 201 sub-market wards (GoG, 2012b).
Gujarat Sate Seeds Corporation Ltd., established in April 1975 is primarily
engaged in production, processing and marketing of seed of more than 30 crops and 100 varieties and hybrids in almost all categories i.e. cereals, pulses, oilseeds, fibre crops, fodder, green manuring crops. It has 13 Branches across the Gujarat and one Sales Depot.
3.5 Emerging Demand-Supply Imbalances With the change in taste and preference of consumers and higher expenditure elasticity for fruits & vegetables and livestock as compared to cereals, there is an increasing pressure on the prices of such high value perishable commodities. The per capita monthly consumption of cereals in the rural areas of India has declined from 14.80 kg in 1983-84 to 12.11 kg in 2004-05 and further to 11.35 kg in 2009-10. In urban areas of the country, it has declined from 11.30 kg in 1983-84 to 9.94 kg in 2004-05 and to 9.37 kg in 2009-10 (GoI, 2012a). Similarly, the per capita monthly consumption of total cereals in Gujarat state has also marginally declined from 10.19 kg in 1999-2000 to 10.06 kg in 2004-05; whereas the per capita monthly consumption of fruits and vegetables has increased from 0.1 kg and 4.08 kg in 1993-94 to 0.4 kg and 5.23 kg in 2004-05 respectively (NSSO, 1993; 2000; 2004). The consumption of cereals and pulses has grown by 5 per cent and 4 per cent respectively during the period 1996-97 to 2002-03. On the other hand, consumption

28th National Conference on Agricultural Marketing
56
of dry fruits, fresh fruits and beverages has increased by 38 per cent, 11 per cent, 14 per cent, respectively during the same period (Robo India, 2005). Thus, there has been increase in demand for agro-processed foods in the state. Though the state has made remarkable progress in agro-processing and agricultural exports, the agricultural production basket in the state is still not fully aligned to the emerging demand patterns. 3.6 Water Resources Development The state divides naturally into three regions: (i) Gujarat mainland, (ii) Saurashtra and (iii) Kachhch. Water resources in Gujarat are concentrated primarily in the southern and central part of the mainland. Saurashtra and Kutch region in the northern mainland with exceptionally high irrigation needs, have limited surface and groundwater resources. A significant percentage of the water in the state (both surface and groundwater) is consumed by the agricultural sector for irrigation purposes. The major rivers flowing in Gujarat are Narmada, Sabarmati, Tapi, Purna, Damanganga, Rukmavati etc. As presented in Table 7, the ultimate irrigation potential through the surface water is assessed at 39.40 lakh hectares which includes 17.92 lakh hectares through Sardar Sarovar Project. Similarly in respect of ground water resources, it is estimated that about 25.48 lakh hectares (24.7% of NSA) can be irrigated. Thus, total ultimate irrigation potential through surface and ground water is estimated to be 64.88 lakh hectares. Out of this, about 32.18 lakh hectares of irrigation potential has been created by June 2011. About 75.8 per cent of total irrigation potential created has been utilized in the state. It may be seen that the irrigation potential created and utilization through surface water has increased successively. The irrigation potential created has increased from 21.91 lakh hectares in 2007-08 to 31.31 lakh hectares in 2011-12. Similarly, the utilization of irrigation potential created has increased from 16.99 lakh hectares in 2007-08 to 23.2 lakh hectares in 2011-12. On the other hand, the irrigation potential created through ground water has declined sharply from 20.35 lakh hectares in 2007-08 to 0.87 lakh hectares in 2011-12 resulting in overutilization by 137.9 per cent.
( In Lakh Hectares)
(cum) (%) (cum) (%) (cum) (%)
2007-08 39.41 21.91 16.99 (77.5) 25.48 20.35 20.34 (100.0) 64.88 42.26 37.33 (88.3)
2008-09 39.40 23.58 17.85 (75.7) 25.48 18.17 19.57 (107.7) 64.88 41.75 37.42 (89.6)
2009-10 39.40 30.12 22.59 (75.0) 25.48 0.87 1.20 (137.9) 64.88 30.99 23.79 (76.8)
2010-11 39.40 30.78 22.72 (73.8) 25.48 0.87 1.20 (137.9) 64.88 31.65 23.92 (75.6)
2011-12 39.40 31.31 23.20 (74.1) 25.48 0.87 1.20 (137.9) 64.88 32.18 24.40 (75.8)
Table 7: Water Resources Development in Gujarat
Note: Figures in parentheses are the percentages of totalpotential created in the respective category.
Source: GoG (2012b), various issues ( 2007-08 to 2011-12)
Ultimate Irrigation Potential
Irrigation Potential
created upto June 2011
(cum)
Ultimate Irrigation Potential
Irrigation Potential created
upto June 2011 (cum)
Ultimate Irrigation Potential
Irrigation Potential created
upto June 2011 (cum)
Year
Maximum Utilisation upto
June 2011
Maximum Utilisation upto
June 2011 (cum)
Maximum Utilisation upto June
2011 (cum)
TotalGround WaterSurface Water
The Government of Gujarat has been giving due attention to accelerate the
pace of water resources development in the state so as to increase the net water

28th National Conference on Agricultural Marketing
57
availability by creating additional storage, completion of ongoing projects, improvement in water use efficiency, bridging the gap between the potential created and its utilization, restoration and modernization of old irrigation system, conjunctive use of ground and surface water, promoting participatory irrigation management, large scale people's participation in water conservation programmes and inter-basin transfer of water (GoG, 2012b).
A water conservation scheme called "Sardar Patel Participatory Water
Conservation Scheme" (SPPWCS) is being implemented by the State Government through which a total of 69433 check dams have been constructed. Out of this, 5980 check dams and 1490 check dams have been constructed respectively during 2010-11 and 2011-12. Thus, under various programmes, a total of 147305 check dams have been constructed in the state so far (GoG, 2012b). In North Gujarat and other area of the State, where suitable sites are not available for the construction of check dams, deepening of existing ponds / tanks have been promoted with financial contribution ratio of 90:10 (Government: Beneficiaries). During the year 2010- 11 and 2011-12 (up to Nov-11), about 738 and 425 ponds respectively have been deepened by Water Resources Department.
For promoting Participatory Irrigation Management in the state, the
government has passed "Gujarat Co-Operatives and Water Users Participatory Irrigation Management Act-2007". Under this scheme, 51308 ha and 18630 ha area has been covered during 2010-11 and 2011- 12 respectively. Approximately 427156 ha area has been covered under this scheme till 2011-12 (GoG, 2012a).
3.7 Farm Inputs and Management
Seeds and Fertilizer Seed is considered to be a catalyst of change in agriculture. The Green Revolution adopted in India during the late sixties and early seventies bears witness to this truth. And lately, during the decade of 2000s, Bt cotton seeds and hybrid maize seeds have shown spectacular results, particularly in Gujarat (GoI, 2012b). There has been an impressive growth in certified seed distribution in case of majority of selected crops except bajra and sesamum. The HYV seed distribution has declined by 59.6 per cent and 36.7 per cent respectively for these two crops (bajra and sesamum) during 2013-14 over 2003-04 (Table 8). The abundant availability of quality/certified seeds for the majority of crops has helped in enhancing agricultural production and productivity in the state. There has not been any major change in seed rate and seed multiplication rate (SMR) during last decade (2003-04 to 2013-14). The seed rates and SMR have been at the reasonable levels.
The major concern has been on the front of improvement in seed replacement rate (SRR). The growth in SRR for HYV cotton, maize, bajra, sesamum and castor has been quite good. The SRR for all these crops have been around 100 per cent. However, in the case of variety groundnut and variety cotton which are the pride of Gujarat, SRR has been as low as 10.0 per cent and 65.0 per cent respectively. The SRR of moong, urid and arhar has also been very low (37%, 40%, 33%, respectively) during 2013-14. Among Rabi and Summer crops, wheat, gram and

28th National Conference on Agricultural Marketing
58
summer groundnut have performed poorly in terms of SRR. The SRR of wheat, gram and summer groundnut has been 33 per cent, 27.5 per cent, 10 per cent, respectively during the corresponding period. Thus, the SRR of majority crops in the state need further improvement. Table 8: Seed Distribution, Seed Rate and SRR in Gujarat: Kharif and Rabi Seasons
of 2003-04 & 2013-14 Sl. No
Crop
Hybrid/Variety
2003-04 2013-14 Total area sown
(lakh ha)
Seed Multiplication Ratio (SMR)
Seed Rate
(Kg/ha)
Seed Distribu
tion (Qtls)
Seed Replace
ment Rate (%)
Total area sown
(lakh ha)
Seed Multiplica
tion Ratio
(SMR)
Seed Rate (Kg/h
a)
Seed Distribu
tion (Qtls)
Seed Replacement Rate (%)
A Kharif Crops
1 Paddy Variety 6.9 0.10 30 40850 19.73 7.99 0.10 30 91150 38.03 2 Maize Hybrid 0.52 0.10 10 4362 100 3.49 0.10 20 69800 100 3 Bajra Hybrid 0.1 0.18 3.75 31903 100 3.44 0.25 3.75 12900 100
4 Moong Variety 9.22 0.08 20 10329 23.8 1.28 0.06 20 9472 37 5 Urid Variety 2.17 0.06 20 3968 17.4 0.88 0.06 20 7040 40 6 Arhar Variety 1.14 0.06 20 2398 10.41 2.39 0.06 20 15775 33 7 Groundnut Variety 3.2 0.05 125 25729 1.25 16.6 0.05 155 257400 10
8 Sesamum Variety 19.69 0.11 2.5 4661 42.86 1.18 0.11 2.5 2950 100 9 Castor Hybrid 4.35 0.08 5 27971 100 6.25 0.08 5 31250 100
10 Cotton (hyv) Hybrid 2.99 0.11 2.5 23078 100 21.75 0.11 2 43500 100 11 Cotton (var) Variety 6.71 0.11 10 19367 19.76 5.16 0.11 10 33542 65 B Rabi Crops 12 Wheat Variety 7.07 1:20 100 156025 22.07 15 1:20 100 495000 33 13 Gram Variety 1.81 1:25 50 1816 2.01 2.47 1:25 60 40750 27.5 14 Mustard Variety 2.81 0.25 2.5 6606 94.04 2.82 0.25 2.5 7050 100 C Summer Crops
15 Bajra Hybrid 0.45 1;200 3.75 6525 100 4.43 1;200 3.75 16612 100 16 Moong Variety 0.37 1:25 20 1553 30.51 0.22 1:25 20 4400 100 17 Gr’nut Variety 0.91 1:10 125 5037 6.07 2.79 1:10 155 43245 10
Source: Department of Agriculture, Government of Gujarat.
Table 9: Fertilizer Consumption in Gujarat State Year 1980-81 to 2013-14
( In 000' tonnes) Sr. No
Year Nitrogenous (N)
Phosphate (P2O5)
Potassic (K2O)
Total NPK Per Ha Consumption of NPK (Kg/Ha)
1 1980-81 204.12 117.22 0.00 356.86 32.58 (57.2) (32.8) (0.0) (100.0)
2 1990-91 430.75 217.15 58.49 706.39 67.26
(61.0) (30.7) (8.3) (100.0)
3 2000-01 498.96 195.67 56.01 750.64 69.56
(66.5) (26.1) (7.5) (100.0)
4 2010-11 1241.22 518.00 179.94 1939.16 138.08
(64.0) (26.7) (9.3) (100.0)
5 2011-12 1183.30 417.02 132.74 1733.06 132.59
(68.3) (24.1) (7.7) (100.0)
6 2012-13 1007.70 257.82 76.46 1341.97 108.99
(75.1) (19.2) (5.7) (100.0)
7 2013-14 (est.) 1234.17 403.03 114.89 1752.08 127.65 (70.4) (23.0) (6.6) (100.0)
CAGR (1980-81 to 1990-91) 7.75 6.36 NA 7.07 7.52 CAGR (1990-91 to 2000-01) 1.48 -1.04 -0.43 0.61 0.34 CAGR (2000-01 to 2010-11) 9.54 10.23 12.38 9.96 7.10
CAGR (1980-81 to 2013-14) 5.78 3.93 NA 5.10 4.36 Note: Figures in parentheses are the percentages of total. Sources: (1) Statistical Outline of Gujarat (1980-81 to 1990-91); (2) Statistical Abstract 2009, Directorate of Economics and Statistics, Govt. of Gujarat; (3) unpublished data, Dept. of Agriculture, Govt. of Gujarat.

28th National Conference on Agricultural Marketing
59
Fertilizer is another important input for crop growth and increasing productivity. It may be noted from Table 9 that the overall consumption of NPK has increased from 3.57 lakh metric tonnes in 1980-81 to 19.39 lakh metric tonnes in 2010-11, implying an increase by 5.4 times. The NPK consumption per hectare of GCA has also increased by 16.5 per cent from 32.6 kg in 1980-81 to 138.1 kg in 2010-11. It is worth mentioning that the per hectare consumption of fertiliser has declined thereafter to 109.0 kg in 2012-13. The decline in fertiliser consumption during the later period may be partly due to increased awareness generated by the Soil Health Card (SHC) programme in the state about the negative consequences of application of overdoses of fertiliser and positive effects of balanced fertiliser application on soil health. Farm Mechanization There is a strong correlation between farm mechanization and agricultural productivity. States with a greater availability of farm power show higher productivity as compared to others (GoI, 2012a). Among various types of farm machinery, tractors, power tillers and diesel engines and electric motors are the major ones. India is the largest manufacturer of tractors in the world, accounting for about one-third of the global production. The pace of farm mechanization has been satisfactory during last couple of decades. The share of agricultural workers and draught animals have come down from 63.5 per cent in 1971-72 to 13.67 percent in 2009-10 whereas that of tractors, power tillers and diesel engines and electric motors has gone up from 36.51 per cent to 86.33 per cent during the same period in India (Singh et al.,2011).
The sale of tractors and power tillers has increased from 296.1 thousands and 22.3 thousands in 2005-06 and further to 545.1 thousands and 55 thousands in 2010-11 respectively in India. Out of the total sale of tractors, central states of Madhya Pradesh and Gujarat accounts for 21 per cent. The electric power consumption is one of the major aspects of the farm mechanization. Compared to 20.43 per cent of total power consumption in agriculture in India, Gujarat consumes about 36.75 per cent of its total electricity for agriculture alone (GoI, 2011a). Similarly, the use of ploughs and carts has been reduced by 2.68 per cent and 6.25 per cent respectively between 1997 and 2003 in Gujarat (Table 10).
Table 10: Agricultural Implements in Gujarat
(Figures in ‘00’)
Details Year % Change in
1997 2003 2007 2003 over 1997
Ploughs 17673 (15.8) 17199 (14.6) 17835 (14.7) -2.68
Carts 5711 (5.1) 5354 (4.5) 4527 (3.7) -6.25
Oil Engines with Pump sets (used for Irrigation)
3672 (3.3) 4367 (3.7) NA 18.93
Electric Pump/ Sub-mersible pump set used for Irrigation
4072 (3.6) 4683 (4.0) NA 15.00
Tractors (used for agricultural purpose)
1221 (1.1) 1476 (1.3) NA 20.88
Notes: Figures in parentheses is the number per ha of GCA in respective years; NA- Not Available.
Source: GoG (2011a).

28th National Conference on Agricultural Marketing
60
On the other hand, the use of tractors, oil engines with pump sets and electric pump sets for agriculture purpose has increased considerably by 20.88 per cent, 18.93 percent and 15.0 per cent respectively during the same period (GoG, 2012d). Seed-cum-fertilizer drill, zero till drill, lazer levelers and various farm implements and tools need to be popularized along with bullock drawn implements for small and marginal farmers. Seed dressers, sprayers, weeding implements, and other drudgery reduction implements are to be popularized. Custom hiring system is to be promoted and popularized using the concept of Agri-Clinics. Irrigation Provisions The technological intervention in terms of adoption of more HYV crops has undoubtedly increased the yield levels in the state. The rapid adoption of these HYV crops was mainly facilitated by increase in irrigation coverage and more fertilizer application. Out of 103.0 lakh hectares of net sown area, about 43.4 lakh hectares are irrigated land (Table 11). So, about 42.1 per cent of net sown area in the state is irrigated (TE 2009-10). The gross cropped area of the state was about 116.3 lakh hectares in TE 2009-10, out of which only 52.5 lakh hectares (5.1%) was irrigated. The cropping intensity in the state has marginally declined while irrigation intensity has increased. The cropping intensity has declined from 115.0 per cent in TE 1983-84 to 112.9 per cent in TE 2009-10, whereas the irrigation intensity has increased from 119.0 per cent in TE 1983-84 to 121.0 per cent in TE 2009-10.
Table 11: Changes in Gross Cropped Area and Gross Irrigated Area (TE 1983-84 to TE 2009-10) in Gujarat
Indicators TE 1983-84 TE 1993-94 TE 2003-04 TE 2009-10
GCA (000 ha) 11034.0 10744.7 10947.6 11632.7 GIA (000 ha) 2644.8 3269.9 3773.7 5248.7 NSA (000 ha) 9592.7 9440.6 9670.3 10302.0 NIA (000 ha) 2222.2 2518.2 3142.7 4336.0 NIA as % of NSA 23.2 26.7 32.5 42.1 GIA as % of GCA 24.0 30.4 34.5 45.1 Crop intensification effects GCA - NSA 1441.3 1304.1 1277.3 1330.7 GIA - NIA 422.6 751.8 631.0 912.6 Cropping intensity (%) 115.0 113.8 113.2 112.9 Irrigation intensity (%) 119.0 129.9 120.1 121.0
Area expansion effects
Indicators TE 1983-84 to 1993-94
TE 1993-94 to 2003-04
TE 2003-04 to 2009-10
TE 1983-84 to 2009-10
Change in GCA -289.3 202.9 685.1 598.7 Change in GIA 625.1 503.7 1475.0 2603.9 Change in NSA -152.1 229.7 631.7 709.3 Change in NIA 296.0 624.5 1193.4 2113.9 Notes: GCA: Gross cropped area, NSA: Net sown area, GIA: Gross irrigated area, NIA: Net irrigated area, TE: Triennium Ending.
Sources: GoG (2009), various issues (1980-81 to 1999-2000); GoG (2003), various issues (2002-03 to 2006-07); GoG (2011a).

28th National Conference on Agricultural Marketing
61
Gujarat farmers rely on different sources of irrigation that include canals, tube wells, open wells and tanks. It may be noted from Figure 3 that the share of canal irrigated area has remained unchanged at the level of 19 per cent during the year 1990-91 and 2000-01. The combined irrigated area through tube wells and open wells has slightly declined from 79 per cent in 1990-91 to 76 per cent in 2009-10. However, the tube wells and open wells have been the major sources of irrigation in the state. Thus, the pressure on groundwater exploitation has considerably increased in Gujarat. In fact, ground water has been over utilized in the state.
Labour and Agricultural Wages The total working population in Gujarat was 212.55 lakh that constitutes about 5.3 per cent of total working population in India (Census 2001). About 68.1 per cent of total working population in the state was male workers. As discussed earlier, the total number of cultivators in the state was 58.03 lakhs constituting about 27.3 per cent of total working population in the state, as compared to 31.65 per cent of total working population at all-India level. Cultivators in rural areas were 56.97 lakhs in number. Among the cultivators, about 19.0 lakhs are women constituting about 32.7 per cent of total cultivators in the state. The state’s share in total number of cultivators in India is about 4.56 per cent. On the other hand, the total number of agricultural labourers in Gujarat was 51.62 lakhs, out of which, 26.52 lakhs were women constituting about 51.4 percent of total agricultural labourers in the state. The agricultural labourers constitute about 24.3 per cent of total workers in the state as compared to 26.55 per cent at all-India level.
As far as the prevailing agricultural wages is concerned, the minimum
agricultural wages for all operations was Rs 100 in 2010 that has increased to Rs 135 with effect from January 2011. However, the actual wage rates for agricultural works vary from Rs 150 to Rs 200 per man days in different parts of the state. Especially after implementation of Mahatma Gandhi National Rural Employment Guarantee Act (MNREGA) in 2006, the availability of farm labourers has been
Figure 3: Irrigation Coverage by Sources in Gujarat (1991 and 2009)
Tubewell and Open wells, 79.2
%
Canals, 19.4%
Tanks, 1.3%
Others, 0.1%
(1990-91)
Tubewell and Open wells Canals Tanks Others
Tubewell, 26%
Open well, 51.0%
Canals, 19.0%
Tanks, 1.0%Others, 3.0%
(2009-10)
Tubewell Open well Canals Tanks Others

28th National Conference on Agricultural Marketing
62
reduced considerably (Shah et. al, 2011), mainly at the time of intercultural operations and harvesting of the crops. However, the wage rates for agricultural labourers for various agricultural operations have significantly increased after implementation of MNREGA in the state. Credit and Insurance Credit availability and agricultural insurances are important drivers of growth in agriculture. However, the formal credit is readily available to elite class people such as large and wealthy farmers who are trusted by the institutional lenders because of their greater repayment capacity. On the other hand, the access of poor marginal and small farmers to institutional credit is quite limited (Swain, 2001; Swain and Swain, 2007). If we look at the disbursement of institutional credit in rural Gujarat, there have been some programmes such as the Rashtirya Krishi Vikas Yojana (RKVY), Kisan Credit Card Scheme (KCC) and Agricultural Technology Management (ATMA) programme, through which credit has been made available to farmers in the state. It is evident from Table 12 that about Rs 60258 lakh has been spent under RKVY during last five years, out of which Rs 37142 lakh has been spent during the year 2010-11.
Table 12:Credit Disbursed under Rashtirya Krishi Vikas Yojana (RKVY) (Rs. in lakhs)
Year Earmarked Grant Grant Released by GoI
Expenditure Expenditure as a % of grant 2007-08 5151.0 4761.0 4761.0 100.0 2008-09 24339.0 24339.0 22654.3 91.1 2009-10 38619.0 38619.0 27652.3 71.6 2010-11 38863.0 38863.0 37142.8 95.6 2011-12* 50090.0 25000.0 33100.0 132.4
Total 100754.0 89472.0 60258.0 95.2 Note: * Up to August 2011. Source: GoG (2011b).
The analysis on the progress and composition of agricultural credit disbursed
by different sources under KCC scheme reveals that the total number of cards issued and amount sanctioned under the scheme has increased from 216.8 thousands and Rs 4454.6 crores in 2007 to 22,622 and Rs 43723 crores in 2010 respectively (Table 13). Out of this Rs 43723 crores, commercial banks and cooperative banks disbursed Rs. 22622 crores (51.7%) and Rs. 18457 (42.2%), respectively.
Table 13: Credit Disbursed under Kisan Credit Card Scheme (KCC) in Gujarat
(Rs. in Crores and Number of Cards Issued in '000) Year
Co-operative Bank Regional Rural Banks Commercial Banks Total Cards issued
Amount Sanctioned
Cards issued
Amount Sanctioned
Cards issued
Amount Sanctioned
Cards issued
Amount Sanctioned
2007 65.0 3314.9 25.9 286.3 125.8 853.4 216.8 4454.6
2008 2.5 97.0 22.4 425.4 120.4 1083.9 145.3 1606.3
2009 1182.0 18378.0 242.0 25902.0 1377.0 20712.0 2801.0 41680.0
2010 1206.0 18457.0 248.0 2644.0 1543.0 22622.0 2997.0 43723.0
2011 61.0 389.0 11.0 100.0 171.0 1840.0 243.0 2329.0 Source: rbidocs.rbi.org.in

28th National Conference on Agricultural Marketing
63
4. Agricultural Research, Education and Extension With a view of rising population pressure on land, there is lesser chance of increasing area under cultivation substantially to increase the agricultural production. Thus it is highly desirable to increase the crop productivity through use of befitting technologies for developing better crop varieties, better methods of cultivation and better methods of reduction in cost of cultivation. Considering the growing importance of agricultural research for inclusive growth and development, the State Government has accorded highest priority to enhance productivity and production through improved research and value addition.
There are 4 State Agricultural Universities (SAUs), 28 Krishi Vigyan Kendra
(KVKs) and 10 agricultural research centres located at various parts of the state those are involved in R&D activities concerning agriculture sector in the state. The state-specific agricultural research systems have been revisited and reoriented to achieve desired goals for sustainable agriculture.
As far as the quality and availability of extension services is concerned, there
has been noticeable progress in the state. To strengthen the extension education system in the state, the Extension Education Institute (EEI) was established in 1962 in Anand which is one of the four premier institutes for training of extension personnel in India. With the advent of green revolution in 1970s, the extension set up of the state was reorganized under National Agriculture Extension Project. The extension functionaries were made more specialized in agricultural technologies with full attention towards agricultural development through training and visit system. Afterwards, the extension workers have taken up a holistic farming system approach to fulfill the requirements of the farmers in the state under the broad based extension system that maintains close linkages and co-ordination with the line department and helps in need based and location specific production. As part of the system, the centrally sponsored scheme “Support to State Extension Programmes for Extension Reforms” is an ongoing scheme being implemented since 2005-06. Under the scheme, Agriculture Technology Management Agency (ATMA) is responsible for coordination and management of agricultural extension related work. The State has also launched the state wide project namely Soil Health Card (SHC) Programme in May 2006, with which soil samples have been drawn and analyzed and soil health card have been provided to the concerned farmers in the state. Based on soil health status, farmers have been advised to grow the suitable crops and recommended fertilizers. So far (by March 2013), a total of 51.7 lakh soil health cards have been generated and given to farmers. Out of which, 14.3 lakh soil health cards have been distributed in 2013-14 alone (Table 14). The programme has generated alternative crop planning and recommendations for 229 Talukas and 24324 villages and generated all Takulas and Villages Model Action Plans (GoG, 2014).

28th National Conference on Agricultural Marketing
64
Table 14: Progress in Soil Health Card Programme in Gujarat
Year Soil Testing Laboratories (STL) under
Number of soil testing laboratories (STL)
Annual analyzing capacity
No. of sample
analyzed
Capacity Utilized
(%)
No. of dist.
having STL
No. of SHCs made
available to
farmers
Static Mobile Total
1 2 5 6 7 8 9 10 11 14
2013-14
(i) State Government 20 2 22 220000 151400 69 21 273868 (ii) Public Undertaking Sector 81 0 81 810000 384915 47 24 1157488
(iii) Private Sector 0 0 0 0 0 0 0
(iv) Total 101 2 103 1030000 536315 55 1431356 2012-13
(i) State Government 20 2 22 220000 278931 127 21 900095 (ii) Public Undertaking Sector
81 0 81 810000 607421 75 24 1100000
(iii) Private Sector 0 0 0 0 0 0 0
(iv) Total 101 2 103 1030000 886352 2000095
2011-12
(i) State Government 20 2 22 220000 136408 62 21 1279968 (ii) Public Undertaking Sector 81 0 81 810000 353625 44 24 706241
(iii) Private Sector 0 0 0 0 0 0 0 1165000
(iv) Total 202 4 206 2060000 490033 48 3151209 2010-11 (i) State Government 18 2 20 200000 661249
* 331 19 1200000 (ii) Public Undertaking Sector
70 0 70 700000 1317566 #
188 $ 24 558000
(iii) Private Sector 0 0 0 0 0 0 0 600000
(iv) Total 290 6 296 2960000 490033 0 24 2005-
06 (i) State Government 16 4 20 184000 184893 0 18 250000 (ii) Public Undertaking Sector 3 1 4 50000 138089 209 0 250000
(iii) Private Sector 0 0 0 0 0 0 0
(iv) Total 19 5 24 234000 322982 311 18 500000
Source: GoG (2014)
Krushi Mahotsav (Farmers’ Fair), an annual event since 2005, has further
strengthened the agricultural extension in the state. The critical components of the Mahotsav include Krushi Mela, Exhibition Seminars/Talks and distribution of agricultural kits to the farmers. Experts from agricultural universities directly interact with farmers at the village level and area specific and crop specific issues and concerns of farmers are attended to. There are two kinds of schemes are implemented at the time of Krushi Mahotsav. They are individual beneficiary scheme and community beneficiary scheme. Under individual beneficiary scheme, the farmers are distributed agriculture kits, horticulture kits, animal husbandry kits, Soil Health Cards, Kishan Credit Cards, animal health check up and vaccination, provision of drip irrigation and tree sapling etc. under the community beneficiary scheme, the farmers community are benefitted by provision of check dams, village ponds, watersheds, establishment of new milk co-operative societies and new credit co-operative societies and creation of model farms. During Krushi Mahotsav 2012, the number of farmers benefitted by agriculture kits, horticulture kits, animal husbandry kits, Soil Health Cards were 1.54 lakhs, 1.3 lakhs, 0.89 lakhs and 3.36 lakhs respectively. About 56 lakh farmers were benefitted by animal vaccination programme during the Mahotsav (GoG, 2012e). About 4196 check dams, 2784

28th National Conference on Agricultural Marketing
65
village ponds and 1266 watersheds have been created during Krushi Mahotsav 2012. As a result of this programme, the state has achieved impressive growth. The Mahotsav has also led to heightened awareness amongst farmers about the advantages of scientific farming and animal husbandry, benefits of drip irrigation and built a bridge between agri-scientists and the farming community in the state. 5. Animal Husbandry, Dairying and Fisheries Animal Husbandry is not only a subsidiary source of livelihood in rural Gujarat, it is a major economic activity, especially in the arid and semi-arid regions of the state. This sector plays a vital role in the rural economy of the state and has significant impact on employment generation for marginal, sub-marginal and landless farmers. The Eighteenth Livestock Census (2007) of India has placed total livestock population at 529.7 million and total of poultry birds at 648.8 million (GoI, 2009), out of which, there are 235.15 lakhs livestock (4.44%) and 133.52 lakhs poultry (2.06%) in the state of Gujarat. It may be seen from Table 15 that the milk production in the state has increased by 17.8 per cent (from 7911.73 thousand tonnes in 2007-08 to 9320.84 thousand tonnes in 2010-11). The growth in egg production has been better compared to milk production in the state. The egg production in the state has increased by 60.7 per cent from 8256.34 thousand tonnes in 2007-08 to 1269.23 thousand tonnes in 2010-11. The wool production has declined by 2.6 per cent during the corresponding period.
Table 15. Performance of Dairy Sector in Gujarat
Year Milk Production Eggs Production Wool Production ('000 Tonnes) (In Lakh No.) ('000 Kgs.)
2007-08 7911.73 8256.34 2996.00
2008-09 8387.18 12675.22 2854.00
2009-10 8842.84 12761.94 2918.67
2010-11 9320.84 13269.23 2917.91 Source: GoG (2012b).
Examining the performance of dairy sector in 2011-12 in Gujarat reveals that,
about 52.9 per cent and 70.1 per cent of the milk procurement and marketing targets for 2011-12 were achieved by December 2011(Table 16). The performance in terms of revival of societies and artificial and natural insemination has been good during the year 2011-12.
Table 16: Achievement of Dairy Sector in 2011-12
Activity Unit Target Achievement 2011-12 2011-12 (Up to Dec., 2011)
Milk Procurement Lakh Kg. 7,790 4,118 (52.9)
Milk Marketing Lakh litre. 6,168 4,322 (70.1)
Cattle Feed Sale 000' MT 263 133 (50.6)
Revived Societies Number 588 488 (83.0)
New Societies Number 898 141 (15.7)
A.& N.I. 000' Number 453 467 (103.1) Notes: AI- Artificial and natural Insemination; Figures in parenthesis are percentage to target. Source: GoG (2012b)

28th National Conference on Agricultural Marketing
66
The data presented in Table 17 says that the total fish production and its value in the state has increased by 41.9 per cent and 911.5 per cent during last two decades(1990-91 to 2010-11). Gujarat is the highest contributor of nation’s marine exports both in terms of quantity as well as value. Gujarat holds the highest share in total fish production in the country with 22.35 per cent share during 2006-07. Gujarat contributes 30.71 per cent to nation’s marine exports in quantity and 15.12 per cent as revenue. Gujarat exports more than 50 per cent of its marine product to China (GoG, 2012b).
Table 17: Marine and Inland Fish Production
Year Fish Production (in tonnes) Value (Rs. crores) Marine Inland Total
1990-91 500462 45687 546149 410.39 2000-01 620474 40261 660735 1374.1 2007-08 680848 78780 759628 2844.01 2008-09 683855 82047 765902 3063.23 2009-10 687445 84071 771516 3493.74 2010-11 688930 85972 774902 4151.05 2011-12 692488 91231 783719 4198.28 2012-13 6933500 92586 786086 4210.96 Source: GoG (2012b) and other issues
6. Post Harvest Management and Value Addition Agriculture has become demand driven rather than supply driven. It is essential to produce and process agricultural commodities keeping in view the changing pattern of taste and preferences. Though increase in agricultural production and productivity is the priority of the agriculture sector today, improved post-harvest handling and processing is essential to ensure high-quality products and further value addition. Value of agricultural output can be increased considerably by following improved methods of post harvest practices.
The agricultural food industry contributes nearly 35 per cent to GDP in India
which is the second largest producer of food next to China. India is one of the largest producers of cereals and milk, cotton, fish, and psyllium husk; 2nd largest producer of rice, wheat, sugar, fruits and vegetables. The food processing industry in India ranks fifth in size, growing at 7 per cent annually.
Gujarat stands fourth in the country in terms of per capita agricultural output.
The horticulture sector is the supplier for large number of agro based industries which has high avenues for generation of skill full employment and self employment opportunities both in rural and urban areas of the state. Better technology for post harvest management and market linkages are essential for increase in revenue from agro-products. The present scenario of existing and potential market linkages in the state reveals that there are no food parks in the state. Two food parks are planned at Hazira and Dahej. There are two Agri-Export Zones (AEZs) in the state. One is for mango and vegetables and another for onions. The AEZ for mangos and vegetables is in central and southern Gujarat where about half of total mango production is produced. There are about 25 processing units and 100 cold storages in the region

28th National Conference on Agricultural Marketing
67
(GoG, 2012b). Exports from this region are primarily to Middle East and UK. The AEZ for onions has about 18 units out of which about 6 are HACCP certified. Onions in this zone are primarily exported in the dehydrated form to Europe and USA.
There are about 20 value addition centres (cold), 70 grading centres in the
state. The processing units exist primarily for mango pulp, pickles, tomato ketchup, dehydration of onion and tutti –frutti. There are around total 16,400 food processing units in the state, out of which the total number of registered processing units is 56 with a capacity of 11.78 lakh quintals. Among these processing units, oilseeds processing, milk processing units, fruits and vegetable processing units and fish processing units are major ones. There are 185 cold storages in Gujarat having total capacity of 8.1 lakh metric tonnes, used primarily for potatoes and vegetables. The key issues with low level of processing in the state are poor post harvest infrastructure. It is estimated that Rs. 800 crores per annum are lost due to lack of post harvest infrastructure and processing (GoG, 2012b). The post harvest loss for various fruits and vegetables is between 25 per cent and 30 per cent. Thus it is import to strengthen and expand the existing post harvest infrastructure and processing units. 7. Conclusions The growth performance of agriculture in the state has been satisfactory during the last five years period during which agricultural NSDP at current prices has been more than doubled. However, there are many challenges to be addressed systematically so as to accelerate the agricultural growth in the state. Some of the major challenges for agriculture sector in Gujarat include the expansion of irrigation provisions through developing micro-level water resources such as check dams, village tanks, farm ponds and recharging of wells under various water conservation programmes in rainfed areas of the state, ensuring efficient water management through micro-irrigation systems, reducing wide fluctuation in agricultural output, productivity and prices, checking distress sales of agricultural output and rising cost of cultivation, increasing agricultural exports and up-scaling of farm-validated modern technologies and agricultural Innovations. There is a need of proper institutional mechanisms and organizational and management (O&M) reforms for overcoming the felt constraints coming in way of the farm prosperity in the state.
The improvement in water use efficiency is urgently required for irrigation
expansion and for reducing the excess pressure on ground water in water stressed areas of the state. More priority should be laid upon rain water harvesting and effective water management through promotion of micro-irrigation methods, while efforts should be made to bring more area under canal irrigation through expansion of irrigation network from neighbouring states.
Especially after implementation of MNREGA in 2006, the availability of farm
labourers has been reduced considerably mainly at the time of intercultural operations and harvesting of the crops. The process of streamlining the convergence of MNREGA with other programmes like Rastriya Krishi Vikas Yojana, National Horticulture Mission, and National Agricultural Development Programme etc., may

28th National Conference on Agricultural Marketing
68
be stepped up, so that the problem of unavailability of labour and infrastructure could be eased.
In the liberalized environment, it is necessary to formulate strategies so as to
enable our farmers to compete in international markets and to cope with the situation of frequent price fluctuations. Strengthening and further improvement in agricultural information system, market linkages, research and extension services are essentially required.
Gujarat is one of the leading states in export of processed foods and high
value products, which is a promising area for increasing revenue from agriculture sector. Thus, emphasis must be given to further development and expansion of agro-processing units and Agri-Export Zones in the state. The farmers should be made aware about various improved cultivation practices required for high quality cash crops and about available incentives/schemes/programmes. The processors should be well trained on various food safety measures and quality standards, adherence to sanitation and phyto-sanitation (SPS) standards and measures for minimizing the export rejections. References
Bhalla, G. S and Gurmail Singh (2009), ‘Economic Liberalization and Indian Agriculture: A State-wise Analysis’, Economic and Political Weekly, Vol. 46, No. 52, pp-34-44, December 26.
Dholakia, R.H. (2010), Has Agriculture in Gujarat Shifted to High Growth Path? in Dholakia, R.H. and S.K. Dutta (eds), ‘High Growth Trajectory and Structural Changes in Gujarat Agriculture’, Centre for Management in Agriculture, IIM Ahmedabad, pp.1-19
GoG (1994), Season and Crop Report for 1990-91, Directorate of Economics and Statistics, Government of Gujarat.
GoG (2010a), National Conference on Kharif Camping-2010, Department of Agriculture and Cooperation, Government of Gujarat.
GoG (2011a), Gujarat Agriculture Statistics at a Glance 2010-11, Directorate of Economics and Statistics, Government of Gujarat.
GoG (2011b), National Conference on Rabi Camping-2011, Department of Agriculture & Cooperation, Government of Gujarat, 14-15 September.
GoG (2012a), State Agriculture Profile, (http://agri.gujarat.gov.in/informations /state _agri_profile.htm, Accessed on 25th September), Government of Gujarat.
GoG (2012b), Socio- Economic Review, 2011-12, Gujarat State, Directorate of Economics and Statistics, Government of Gujarat.
GoG (2012c), Sector Profile: Food & Agri Business, (http://www.vibrantgujarat. com/images/pdf/food-agro-details.pdf, Accessed on 20th September 2012), Government of Gujarat.
GoG (2012d), Gujarat Agriculture Competitiveness Project, Department of Agriculture, Government of Gujarat, January.
GoG (2012e), Krushi Mahotsav 2012: Achievements at a Glance, Central Monitoring Cell, Department of Agriculture and Cooperation, Government of Gujarat, Gandhinagar.

28th National Conference on Agricultural Marketing
69
GoG (2014), ‘West Zone Conference on Fertiliser, Kharif- 2014, Gujarat State’, Department of Agriculture, Government of Gujarat, Gandhinagar.
GoI (2009), Livestock, Poultry, Agricultural Machinery Implements and Fishery Statistics, 2007, Summary Report, Ministry of Agriculture, Government of India, New Delhi.
GoI (2011), Provisional Population Totals, Office of the Registrar General and Census Commissioner, Government of India, New Delhi.
GoI (2012a), State of Indian Agriculture 2011-12, Department of Agriculture and Cooperation, Ministry of Agriculture, Government of India, New Delhi.
GoI (2012b), Economic Survey 2011-12, Ministry of Finance, Government of India, New Delhi.
GoI (2013a), Agricultural Statistics at Glance 2013, Directorate of Economics and Statistics, Government of India
GoI (2013b), Economic Survey of India, 2012-13, Ministry of Finance, Government of India
Kumar, Dinesh M., A. Narayanamoorthy, O.P. Singh, M.V.K. Sivamohan, Manoj Sharma and Nitin Bassi (2010), Gujarat’s Agricultural Growth Story: Exploding Some Myths, Occasional Paper No. 2-0410, Institute for Resource Analysis and Policy, Hyderabad.
NSSO (1993), National Sample Survey (NSS), 50th Round, 1993-94, National Sample Survey Office, New Delhi.
NSSO (2000), National Sample Survey (NSS), 55th Round, 2004-05, National Sample Survey Office, New Delhi
NSSO (2004), National Sample Survey (NSS), 61st Round, 2004-05, National Sample Survey Office, New Delhi
Pathak, M.T. and P.K. Singh (2007), Frontiers of Agricultural development in Gujarat, in Dholakia, R. (Ed.), Frontiers of Agricultural Development in Gujarat, Indian Institute of Management, Ahmedabad
Robo India, (2005), National Horticulture Mission: Revised Action Plan for Gujarat, Prepared for Ministry of Agriculture, Government of India, October.
Shah, Tushar, Ashok Gulati, Hemant P, Ganga Shreedhar, R C Jain (2009), ‘Secret of Gujarat’s Agrarian Miracle after 2000, Economic and Political Weekly, Vol.46, No.52, pp- 45-55, December 26.
Shenggen F, A. Gulati and S. Thorat (2008). Investment, Subsidies and Pro-poor Growth in Rural India. Agricultural Economics. Vol. 39, pp-163-170.
Singh, S.P., R.S. Singh and S. Singh (2011), Sale Trend of Tractors & Farm Power Availability in India, Agricultural Engineering Today, Vol.35, No.2, , pp-31-44.
Swain, M. (2001), Rural Indebtedness and Usurious Interest Rates in Eastern India: Some Micro Evidence, Journal of Social and Economic Development, Vol.3, No.1, pp-122-43.
Swain, M. and M. Swain (2007), ‘Rural Credit Market Imperfections in Drought Prone Bolangir District of Odisha: Some Critical Issues and Policy Options’, Artha Vijnana, Vol. 49, No. 3 & 4, Sept.- Dec., pp.223-254.

28th National Conference on Agricultural Marketing
70
Websites visited:
www.mapsofindia.com, Accessed on 15th September 2012
http://agri.gujarat.gov.in, Accessed on 15th September 2012
http://www.namoleague.com/forum/cm-blogs-on-krishi-mahotsav-agrorevolution-by-reaching-farmers-at-their-doorsteps, Accessed on 20th September 2012
www.rbidocs.rbi.org.in/rdocs/publications/PDFs/89068.pdf, Accessed on 20th September 2012
http://www.aicofindia.com; Accessed on 15th September 2012.

28th National Conference on Agricultural Marketing
71
Diversification of Cropping Pattern during Recent Decade in Gujarat
V. K. Gondalia and Y.C. Zala1
1. Introduction: Agriculture in India is subject to a high degree of risks which include production risk as well as price risk. Diversification helps to reduce these risks and therefore it is usually viewed as an effective risk management strategy. Crop diversification means growing of a variety of crops involving intensity of competition among field crops for arable land. It is started in early eighties in India with introduction of HYVs along with new farm technologies and it has picked up momentum over the recent past. Today, farmers are very quick to diversify into higher value crops as market opportunities and rural infrastructure developed.
Crop diversification has lot of benefits such as food & nutrition security, income growth, employment generation, judicious use of land, water and other farm resources, sustainable agricultural development and environmental improvement. It accommodates more and more rewarding crops. This is particularly important for the small farmers who strive to make their farms viable. The level of diversification of crop enterprises reflects the extent of economic development in the rural area. Looking to the importance of crop diversification under the changing scenarios, this study was undertaken to examine the growth rate and instability of area, production and yield and the extent of diversification of major crops of Gujarat during resent decade. 2. Analytical Approach 2.1 The Data To achieve the objectives of the study, time series data on area, production and productivity of major crops of Gujarat State were collected from the website of Department of Agriculture and Cooperation, Government of Gujarat, Gandhinagar (www.agri.gujarat.gov.in) for the period from 2001-02 to 2011-12. The data were compiled and analysed using following statistical tools. 2.2 Compound Growth Rate (CGR) The CGR was calculated by fitting the exponential function given below: Y= a bt …………………………………………………………(1) Where, Y= area/production/productivity a = constant; b= regression co-efficient; t= time variable
1 Department of Agricultural Economics, B. A. College of Agriculture, Anand Agricultural University Anand- 388 110.

28th National Conference on Agricultural Marketing
72
Further, natural log on both the sides of eq-(1) was taken to convert it in to linear form. Log Y = log a + t log b ……………………………………….… (2) and, CGR (%) was work out using following formula: CGR (%) = (antilog of b-1) x 100 2.3 Instability Index The simple co-efficient of variation (CV) often contains the trend component and thus over estimates the level of instability in time series data characterized by long-term trends. To overcome this problem, the Cuddy Della Valle Index was used to correct the CV by: Instability Index (II) = CV x √(1-R2) Where, CV = co-efficient of variation and R2 = co-efficient of determination from a time trend regression adjusted by the number of degrees of freedom. 2.4 Classification of CGR and II Both CGRs and Instability Indices were classified as under:
a) The CGRs were mainly classified in two groups i.e. negative and positive CGR.
b) The positive CGRs and Instability Indices were further classified into three groups as under.
Sr. No. CGRs and II Classification 1 Low Up to Mean – Standard Deviation 2 Medium Between Mean ± Standard Deviation 3 High Greater than Mean + Standard Deviation
The high growth and low instability are prerequisites for sustainable agricultural performance. Since the magnitude of growth and instability in crop production has serious implications for policy makers, the growth and level of instability in area, production and productivity of major crops of Gujarat State were estimated. 2.5 Crop Diversification Indices There are several indices which explain either concentration or diversification of activities in a given time and space by a single quantitative indicator. Important indices used to study the crop diversification are as under:

28th National Conference on Agricultural Marketing
73
2.5.1 Herfindahl Index (HI) It is a sum of the square of acreage proportion of each crop in gross cropped area. It can be calculated as under: N Area under ith crop HI = ∑ Pi2 Where, Pi = ----------------------- i=1 Gross cropped area N = Number of crops It is a measure of concentration. The value of HI is bounded by zero (perfect diversification) and one (complete specialization). The value of HI approaches to zero when N becomes large and assumes one when only one crop is cultivated. Since HI is a measure of concentration, it is transformed by subtracting it from one i.e., 1-HI. The transformed value of HI will avoid confusion to compare it with other indices. Thus, transformed HI will increase with increase in diversification. 2.5.2 Entropy Index (EI) This index is widely used to measure diversification. It can be worked out as under: N EI = ∑ Pi * ln(Pi) i=1 Unlike HI, the Entropy Index increases with increase in diversification. The upper value of the index can exceeded one when the number of crops is higher than the value of logarithm’s base. It reaches a maximum value of ln(N) and reaches a minimum value of zero when there is only one crop i.e. in case of specialization. The limitation of EI is that it’s upper value is not fixed. Since the upper limit of EI is log (N) (which depends on N), it cannot be used to compare the degree of diversification in different locations where different number of crops are grown. This limitation overcome by modified Entropy Index. 2.5.3 Modified Entropy Index (MEI) This index can be defined as under: N MEI = - ∑ Pi * Log N (Pi) i=1 Hence MEI is same as EI except that the base of the logarithm is N. It takes a maximum value of one in case of perfect diversification and it attains a value zero in case of complete specialization. The MEI is superior to EI as it provides an uniform and fixed scale. The limitation of MEI is that it measures deviation from equal distribution among existing crops only and does not incorporate the number of crops involved in it. Therefore, it can be used to compare different situations with equal number of crops only.

28th National Conference on Agricultural Marketing
74
2.5.4 Composite Entropy Index (CEI) This index possesses all desirable properties of MEI and is used to compare diversification across situations having different and large number of crops since it gives due weight to the number of crops. The formula to calculate CEI is as under: N CEI = - ∑ Pi * Log N (Pi) * {1- (1/N)} or CEI = MEI * {1- (1/N)} i=1 The CEI has two components viz., distribution and number of crops or diversity. The value of CEI increases with increase in number of crops or activities. The value of CEI ranges between zero and one. A summary of the four different measures of crop diversification is given in Table 1. Table 1: Characteristics/features of different measures of crop diversification
Sr. No.
Index Measures of Value at perfect diversification
Value at perfect concentration
Is ranking possible?
1 HI Concentration 0 1 No 2 EI Diversification ln(N) 0 No 3 MEI Diversification 1 0 Yes 4 CEI Diversification 1 0 Yes
The above four different measures of crop diversification were used in the present study. 3. RESULTS AND DISCUSSION 3.1 Growth Rates and Instability Indices The compound growth rates (CGRs) and Instability Indices (IIs) were worked out for area production and productivity of major crops of Gujarat state for the period from year 2001-02 to 2011-12 and presented as under. 3.1.1 CEREALS Rice, Jowar, Bajra, Maize and Wheat are the important cereal crops grown in Gujarat. Ragi and Small Millets are also grown in some part of the State. The CGRs and Instability Indices for area, production and productivity of these crops are presented in Table 2. Rice In Gujarat, rice is grown in kharif as well as in summer season. In kharif season, though it is grown in irrigated as well as un-irrigated conditions, only irrigated rice showed significant CGR in area (3.04%) and production (3.95%) in last decade. Ultimately, total kharif rice also recorded a slightly lower but statistically significant
28th National Conference on Agricultural Marketing
75
increase in area and production by 1.63% and 3.02% respectively. Summer rice, particularly showed very high increase in area (17.54%) and production (17.38%) due to assured irrigation but it was associated with very high instability as well i.e. 46.27% and 48.72%, respectively reflecting very high fluctuations over the years. Overall, the area, production and productivity of total rice were significantly increased by 2.05%, 5.38% and 3.27% annually, respectively. Wheat Wheat is grown under irrigated as well as un-irrigated conditions in Gujarat. In case of irrigated wheat, the area and production were annually significantly increased by 9.08% and 10.32%, respectively. This may be due to increase in rainfall and irrigation facility during last decade in the State. The changes in un-irrigated wheat were found non-significant. The total wheat reported significant increase in area (11.55%), production (14.84%) and yield (2.94%) in last decade. Maize The area, production and productivity of maize crop did not show any significant change during the study period. Bajra Bajra is grown in kharif and summer season. The area and production of kharif bajra were significantly decreased by 8.79% and 9.21% annually due to uncertainty of monsoon, while summer bajra showed very high increase in area (11.82%) and production (14.06%) annually. These high growth rates of summer bajra were also associated with high instability indices i.e. 29.13 % and 30.36%, respectively. It was also found a low but significant increase in productivity (2% annually) and reduction in the area under total bajra crop by about 4% annually. Jowar In Gujarat, Jowar is grown in kharif as well as rabi season. The kharif jowar did not reported any significant change while, rabi jowar showed significant increase in production (5.15%) and productivity (4.81%) which may be due to assured irrigation in rabi season. Like total Bajra, the area under total jowar was also decreased by about 4% annually Ragi Ragi is a minor crop for Gujarat state. Its area and production significantly decreased during last decade by 4.86% and 6.95% annually, respectively. It may be replaced by high value crops.

28th National Conference on Agricultural Marketing
76
Small millets Small millets are grown in kharif as well as rabi season. Out of which only rabi small millets showed significant increase in production by 31.27% annually. Total Cereals The area of kharif cereals was significantly decreased by about 3%, while area under rabi and summer cereals reported significant increase by about 13% annually. The production and productivity of rabi as well as summer cereals also showed significant positive growth. It means the cereals crops were partially shifted from kharif season to more reliable rabi and summer season for assured production. Overall, the total cereals reported positive compound growth in area (1.95%), production (5.97%) and productivity (3.95%) during last decade. Table 2: CGRs and Instability Indices in Area, Production and Productivity of Major Cereal Crops of Gujarat State during 2001-02 to 2011-12
Crop Area Production Productivity CGR% II CGR% II CGR% II
Rice • Kharif-irri.# 3.04** 5.09 3.95** 8.50 0.88 7.16 • Kharif-un-irri.# -0.78 4.20 0.00 12.03 0.78 11.09 • Kharif total# 1.63* 3.97 3.02* 8.28 1.37 6.30 • Summer 17.54* 46.27 17.38* 48.72 -0.15 6.50 • Total Rice 2.05** 5.60 5.38** 11.48 3.27** 8.51 Jowar • Kharif# -1.69 23.92 -3.12 22.66 -1.47 10.69 • Rabi # 0.32 5.45 5.15** 7.26 4.81** 7.80 • Total Jowar -3.98* 18.11 -2.37 14.53 8.27 29.26 Bajra
• Kharif # -8.79** 7.04 -9.21** 22.36 -0.46 18.05 • Summer# 11.82** 29.13 14.06** 30.36 2.00** 3.10 • Total Bajra -3.95** 10.45 -0.71 22.10 3.37 15.46 Maize -0.03 9.95 -1.93 37.30 -1.89 31.79 Ragi -4.86** 10.08 -6.95** 16.36 -2.20 17.26 Wheat • Irrigated# 9.08** 15.78 10.32** 23.06 1.13 8.35 • Un-Irrigated# -3.10 28.66 -0.41 34.31 2.77 12.39 • Total Wheat 11.55** 17.02 14.84** 23.53 2.94* 9.40 Small Millets
• Kharif -4.34 53.27 -1.76 82.26 2.67 29.45 • Rabi 15.07 52.24 31.27* 56.18 14.08 29.29 Total Cereals • Kharif -3.06** 2.72 -1.48 16.13 1.63 14.21 • Rabi 12.71** 18.14 15.52** 24.02 2.49* 8.70 • Summer 13.27** 33.52 15.16** 35.16 1.67** 3.35 • Total Cereals 1.95* 8.86 5.97** 18.47 3.95** 10.63
* Significant at 5% level, ** Significant at 1% level, @ Results pertained to the year 2005-06 to 2011-12. # Results pertained to the year 2003-04 to 2011-12

28th National Conference on Agricultural Marketing
77
3.1.2 PULSES Tur, Mung, Math, Udid, and Gram are the important pulse crops grown in Gujarat. The CGRs and Instability Indices for area, production and productivity of these crops are presented in Table 3. Table 3 : CGRs and Instability Indices in Area, Production and Productivity of Major Pulse Crops of Gujarat State During 2001-02 to 2011-12
Crop Area Production Productivity CGR% II CGR% II CGR% II
Tur -2.43** 8.03 2.19 9.79 4.73** 12.68 Mung# 2.68 16.19 1.23 26.79 -1.39 17.38 Math -4.16 20.38 -2.48 43.00 1.76 33.68 Udid -0.54 7.51 2.72 19.32 3.29 16.99
Other Pulses (kharif)# 5.96* 16.56 6.76 21.66 0.74 15.26 Gram 13.08** 25.28 20.79** 30.04 6.81** 11.81 Other Pulses (rabi)# 24.41** 22.49 30.34** 32.23 4.78 19.66 Total Pulses • Kharif -0.44 5.25 0.01 12.85 0.46 10.30
• Rabi 14.50** 24.10 21.87** 29.35 6.43** 11.88 • Total Pulses 1.60 8.15 5.53** 14.95 3.87** 11.74
* Significant at 5% level, ** Significant at 1% level, @ Results pertained to the year 2005-06 to 2011-12. # Results pertained to the year 2003-04 to 2011-12
Tur Tur contributes about 20 percent in total pulse production in the country. It is an important crop of kharif pulses grown in Gujarat state. Its area significantly decreased by 2.43% while its productivity increased by 4.73% annually. It was found that the area of tur had been replaced by other long duration commercial crop like cotton. Gram Gram is a prominent pulse crop of Gujarat grown in rabi season. Its area, production and productivity were significantly increased by 13.08%, 20.79% and 6.81% annually, respectively but these growth rates of area and production were also accompanying with high instability indices. Mung, Math and Udad The area, production and productivity of mung, math and udad crop in Gujarat state did not show any significant changes in last decade. Other kharif pulses Other kharif pulses occupied comparatively very less area but they showed significant compound growth rate (5.96%) annually. Soyabeen may be one of them which is newly introduced crop in tribal pockets of middle Gujarat.

28th National Conference on Agricultural Marketing
78
Other rabi pulses Other rabi pulses showed significant increase in area (24.41%) and production (30.34%) annually during last decade in Gujarat state. Total Pulses Total pulses grown in kharif season did not show significant change but rabi pulses showed significant increase in area (14.50%), production (21.87%) and productivity (6.43%) in last decade because of assured irrigation and other favourable situations in rabi season as compare to kharif. Overall, the total pulses showed significant increase in production (5.53%) and productivity (3.87%) but it could not show significant increase in area due to downtrend reported by tur which is the major kharif pulse crop in Gujarat. 3.1.3 Oilseed Crops Groundnut, Sesamum, Rapeseed-Mustard, and Castor are the important oilseed crops grown in Gujarat. The CGRs and Instability Indices for area, production and productivity of these crops are presented in Table 4. Table 4: CGRs and Instability Indices in Area, Production and Productivity of Major Oilseed Crops of Gujarat State During 2001-02 to 2011-12
Crop Area Production Productivity CGR% II CGR% II CGR% II
Groundnut • Kharif# -2.57** 4.26 -2.79 33.94 -0.23 32.63
• Summer# 12.82* 38.29 15.04* 36.46 1.96** 3.27
• Total Groundnut -0.94* 3.76 2.67 36.24 3.64 34.25 Sesamum -4.59** 11.24 -5.98* 28.78 -1.45 23.09 Rapeseed -Mustard -0.58 20.03 1.95 25.27 2.54 11.55 Castor 6.55* 27.50 10.15** 25.63 3.38** 8.97 Total Oilseeds 0.29 4.17 3.92 27.24 3.62 25.49
Groundnut Groundnut is a major oilseed crop of Gujarat state which is mainly grown in Saurashtra region in kharif season. The area under kharif groundnut was significantly decreased by 2.57% annually in last decade. Due to good rainfall and subsequently rise in availability of seasonal irrigation during winter as well as introduction of BT Cotton, the farmers of Saurashtra region partially shifted from traditional groundnut crop to more remunerative crop like Cotton. Groundnut is also grown in summer season with assured irrigation condition. Though the contribution of summer groundnut is very small in total groundnut acreage, it showed significant increase in area (12.82%), production (15.04%) and productivity (1.96%) annually in last decade. Looking to the large area under kharif groundnut

28th National Conference on Agricultural Marketing
79
which showed negative CGR, total groundnut area also reported negative growth (-0.94%) in last decade. Castor Castor is another prominent oilseed crop after groundnut. It is also considered as an important commercial crop of Gujarat. It recorded significant rise in area (6.55%), production (10.15%) and productivity (3.38%) annually in last decade. It may be due to high demand from the various industries and subsequently good prices of the crop. Sesamum Sesamum is suitable in less rainfall region. Due to good monsoon in last decade, the acreage under sesamum decreased by 4.59% annually and subsequently its production has also decreased by 5.98% annually. Rapeseed-Mustard Though rapeseed-mustard is an important rabi oilseed crop for Gujarat, its area, production and yield did not show any significant change in last decade. Total oilseeds Looking to the cumulative area, production and yield of all oilseed crops in Gujarat, they did not show any significant change in last decade as some reduction reported by groundnut was countered by rise in castor crop. 3.1.4 Cash Crops Cotton, Tobacco, Sugarcane, Cumin, Fennel, Isabgul, Potato, Onion, Garlic, Chillies, Guar seed and Banana are the important cash crops grown in Gujarat. The CGRs and Instability Indices for area, production and productivity of these crops are presented in Table 5. Cotton Gujarat has rapidly emerged as India's largest cotton producing state because of adoption of Bt cotton by the farmers of Gujarat with increased use of irrigation. At present, Cotton ranks the first position in area. It is grown in both irrigated as well as un-irrigated conditions. The area under un-irrigated cotton has significantly decreased by 4.58% annually because of good rainfall in last decade. Ultimately, the area as well as production of irrigated cotton significantly increased by 15.06% and 13.41% annually respectively. The overall result of total cotton showed annually significant rise in area (5.95%), production (18.01%) and yield (11.35%). Reduction in un-irrigated acreage which generally yields less and its replacement by irrigated cotton which gives higher yield finally resulted in a significant rise in yield of total cotton.

28th National Conference on Agricultural Marketing
80
Tobacco No significant change in area, production and yield was observed in tobacco crop in last decade. Even though lot of warning was publicized for the use of various tobacco products in India, the area and production of tobacco crop could not be reduced. Sugarcane Sugarcane also did not show any significant change in area, production and productivity in last decade in Gujarat. Though the irrigation facility has increased and ultimately gross cropped area of the State has also increased, it failed to increase the area under sugarcane. It may be because sugarcane is a long duration crop while farmers had options of growing vegetables, spices and other cash crops which give high economic returns in short period. Cumin Cumin is an important high value spice crop and its area, production and yield have significantly increased by 8.00%, 13.51% and 5.10% annually, respectively. This is due to its high demand in local as well as export market. Fennel Fennel is a minor commercial crop for Gujarat. The yield of fennel crop showed a low but significant rise of 1.82% annually. This small rise in productivity could not help to increase its area and production which might be due to its limited demand as a minor spice. Isabgul Isabgul is a medicinal crop for Gujarat. Its area as well as production was decreased by 11.34% and 10.45% annually, respectively. Though isabgul has a high medicinal value, its uses are limited. Therefore, it might be replaced by high value crop like cumin. Potato Potato is an important vegetable crop which showed significant rise in area (7.83% annually) and subsequently its production also reported significant rise (6.49% annually). This might be because of the increased demand for potato and also because potato was competent to give good returns in very short period of about three months. Onion Like potato, onion is also a very important vegetable crop and its area and production were also increased by 7.82% and 7.88% annually respectively.

28th National Conference on Agricultural Marketing
81
Garlic Garlic is an important spice crop. The area under this crop was increased by 12.03% annually. It might be because of its demand as raw product by consumers as well as processing industries for export. Chillies The area, under chillies was decreased significantly by 9.30% and subsequently its production also decreased by 8.88% annually. Guar seed Guars seed area was decreased by 7.43% annually. It might be because of its suitability in less rainfall area while Gujarat has reported good rainfall during last decade. Banana Banana is considered as horticultural crop as well as field crop. Its area as well as production was decreased by 3.95% and 3.04% annually during last decade in Gujarat. It might be because of being long duration crop, farmers have shifted to short duration crops like vegetables, spices and other cash crops. Table 5: CGRs and Instability Indices in Area, Production and Productivity of Major Cash Crops of Gujarat State During 2001-02 to 2011-12
Crop Area Production Productivity CGR% II CGR% II CGR% II
Cotton • Irrigated# 15.06** 9.53 13.41** 13.35 -1.43 8.91 • Un-irrigated# -4.58* 13.22 -3.72 21.45 0.60 14.20
• Total Cotton 5.95** 5.77 18.01** 21.25 11.35** 21.36 Tobacco 0.94 46.52 1.12 51.81 0.18 7.99 Sugarcane -1.86 10.90 -2.09 10.43 -0.23 7.73 Cumin 8.00** 12.92 13.51** 18.50 5.10** 12.17 Fennel -1.31 34.16 0.48 36.72 1.82* 7.01 Isabgul -11.34** 26.36 -10.45** 29.52 1.02 11.77 Potato 7.83** 16.81 6.49** 20.94 -1.26 9.67 Onion 7.82* 23.93 7.88* 27.45 0.06 6.64 Garlic 12.03* 35.58 11.43 40.39 -0.53 7.86 Chillies -9.30* 53.23 -8.88* 51.88 0.19 3.01 Guar seed -7.43** 9.57 -7.11 40.89 0.34 31.44 Banana -3.95** 8.62 -3.04** 7.51 0.87 4.89
3.1.5 Horticultural Crops Horticulture comprises of fruits, vegetables, flowers and spices. The results for these crops were based on the data of period from year 2005-06 to 2011-12. The CGRs and Instability Indices for area, production and productivity of these crops are presented in Table 6.

28th National Conference on Agricultural Marketing
82
The results showed 4.07 to 14.65% rise in area, 8.11 to 21.82% rise in production and 2.85 to 8.74% rise in productivity, annually. All CGRs were found significant. Overall horticulture showed significant increase in area, production and productivity by 4.69%, 8.68% and 3.81% annually, respectively. This might be because of many reasons like high demand for fruits and vegetables, due to health and nutritional awareness and considerable increase in the income of consumers, intensive R and D programmes implemented by various government agencies and development of food processing industries. Table 6: CGRs and Instability Indices in Area, Production and Productivity of Major Horticultural Crops of Gujarat State during 2005-06 to 2011-12
Crop Area Production Productivity
CGR% II CGR% II CGR% II
• Fruits 4.71** 1.33 8.66** 3.43 3.77** 2.72
• Vegetables 5.12** 5.82 8.11** 7.61 2.85** 2.33
• Flowers 14.65** 2.87 21.82** 10.35 6.26* 9.55
• Spices 4.07* 7.00 13.16** 11.90 8.74* 10.49
Total horticulture 4.69** 3.12 8.68** 4.32 3.81** 4.34
* Significant at 5% level, ** Significant at 1% level,
3.2 Classification of Crops All the crops under study with significant CGRs were classified in two groups i.e. negative and positive CGR and presented in Table 7. Table 7: Classification of Crops According to their Positive / Negative Significant CGR
Particulars Positive CGR Negative CGR
Area Kharif crops Rice (irri), Cotton (irri), Castor Cotton (un-irri), Bajra, Ragi,
Tur, Groundnut, Sesamum, Guar, Banana
Rabi crops Wheat (irri.), Gram, Potato, Cumin, Onion, Garlic
Chillies, Isabgul
Summer crops Rice, Bajra, Groundnut - Horticulture Fruits, Vegetables, Flowers, Spices -
Production
Kharif crops Rice (irri), Castor, Cotton (irri) Bajra, Ragi, Mung, Sesamum, Banana
Rabi crops Jowar, Wheat (irri.), Gram, Potato, Cumin, Onion
Chillies, Isabgul
Summer crops Rice, Bajra, Groundnut - Horticulture Fruits, Vegetables, Flowers, Spices -
Productivity Kharif crops Cotton, Castor, Tur - Rabi crops Wheat, Jowar, Gram, Cumin, Fennel - Summer crops Bajra, Groundnut - Horticulture Fruits, Vegetables, Flowers, Spices -

28th National Conference on Agricultural Marketing
83
The crops with positive CGR were further categorized into low, medium and high CGR groups with their respective low, medium and high Instability Indices. This classification aims to identify crops having most desirable category i.e. High CGR with Low II. The least desirable category is Low CGR with High II. The results are presented in Table 8. The results revealed that in all three parameters viz., area, production and productivity, not a single crop was found fit for the most desirable category i.e. High CGR with Low Instability Index. A few crops were found in the category of High CGR with Medium Instability Index as well as a few crops were found in the category of Medium CGR with Low Instability Index. Majority crops were found in the category of Medium CGR with Medium Instability Index. Table 8: Classification of Positive and Significant CGRs along with their respective categories of Instability Indices
CGR Instability Index Low Medium High
Area
High - Cotton (irri) Summer Rice Medium Fruits, Flowers
Total Cotton, Castor, Wheat (irri.), Total Wheat, Gram, Potato, Cumin, Onion, Summer Bajra, Vege., Spices
Garlic, Summer Groundnut
Low Kharif Rice Total Rice -
Production
High - Gram, Flowers - Medium Fruits, Vegetables,
Cotton (irri), Total Cotton, Wheat (irri.), Total Wheat, Castor, Potato, Cumin, Onion, Summer Bajra, Spices
Summer Rice
Low Kharif Rice, Rabi Jowar
Total Rice Summer Groundnut
Productivity
High - Gram, Spices Total Cotton Medium Summer
Groundnut, Summer Bajra, Fruits, Vegetables
Castor, Tur, Total Wheat, Rabi Jowar, Cumin, Total Rice, Total Cereals, Total Pulses, Flowers
-
Low - Fennel -
3.3 Shifts in Cropping Pattern To know the shift in cropping pattern, temporal changes in acreage under different crops (season-wise) was worked out and the results are presented in Table 9. Kharif Season The results revealed that the number of crops showed negative change in their area while a few crops had showed positive change. Among the positive change group, irrigated cotton ranked first with an addition of 1292900 ha, followed by castor

28th National Conference on Agricultural Marketing
84
(249300 ha), irrigated rice (74800 ha), tobacco (20600 ha) and other pulses (13000 ha). Among the negative change group, bajra ranked first with decrease of 426700 ha, followed by groundnut (-278500 ha), unirri-cotton (-237000 ha), guar (-118900 ha), sesamum (-108800 ha) and a few more crops like maize, tur, sugarcane, jowar, mung, math, rice (unirri), udid, banana, ragi and small millets. The overall change in kharif was positive with actual increase of 175500 ha which showed 2.25% rise in area. Table 9: Changes in Cropping Pattern in Gujarat State during the years 2001-02 to 2011-12
(Area in ‘00 ha) Positive Change Negative Change
Crop Avg. (01-02
to 03-04)
Avg. (09-10
to 11-12)
Actual change
Change (%)
Crop Avg. (01-02
to 03-04)
Avg. (09-10
to 11-12)
Actual change
Change (%)
KHARIF Cotton (irri) 6710 19639 12929 192.68 Bajra 9007 4740 -4267 -47.37 Castor 3473 5966 2493 71.79 Groundnut 19128 16343 -2785 -14.56 Rice (irri.) 3896 4644 748 19.20 Cotton (unirri) 9700 7330 -2370 -24.43 Tobacco 1023 1229 206 20.18 Guar 2475 1285 -1189 -48.06 Other Pulses 197 327 130 65.99 Sesamum 3626 2538 -1088 -30.00 Sub Total 15299 31805 16506 - Maize 4845 4071 -774 -15.98 Tur 3253 2626 -627 -19.28 Sugarcane 2316 1941 -375 -16.20 Jowar 1221 855 -366 -30.00 Mung 2068 1810 -258 -12.49 Math 459 302 -157 -34.25 Rice (unirri) 2618 2483 -135 -5.16 Udid 1100 987 -113 -10.24 Banana 323 229 -94 -29.21 Ragi 254 170 -85 -33.29 Small Millets 236 168 -68 -28.95 Sub Total 62629 47878 -14751 - Total (kharif) 77928 79683 1755 2.25
RABI Wheat (Irri.) 6778 12063 5285 77.97 Isabgul 400 142 -257 -64.39 Cumin 1605 2796 1190 74.15 R/Mustard 2330 2154 -176 -7.54 Gram 846 1825 979 115.76 Wheat (UnIrri.) 817 661 -156 -19.09 Potato 341 601 260 76.42 Chillies 208 82 -126 -60.64 Onion 345 596 251 72.66 Fennel 274 258 -16 -5.95 Small Millets 103 311 208 202.27 Sub Total 4029 3297 -731 - Other Pulses 51 231 180 352.29 Garlic 144 287 142 98.61 Jowar 505 523 18 3.50 Su Total 10718 19233 8513 - Total (Rabi) 14747 22530 7782 52.78
SUMMER Bajra 1705 3299 1594 93.47 Groundnut 906 1759 853 94.19 Rice 239 617 378 158.02 Sub Total 2850 5675 2825 - Total (Summer) 2850 5675 2825 99.12 Grand Total (annual)
95525 107888 12362 12.94
HORTICULTURE Vegetables 3860 4635 775 20.09 Spices 4542 5212 670 14.75 Fruits 3096 3708 611 19.74 Flowers 84 145 61 72.04 Total Horti. 11583 13700 2117 18.28

28th National Conference on Agricultural Marketing
85
Rabi Season In rabi season only a few crops showed negative change while large number of crops showed positive change. Among negative change group, isabgul ranked first with decrease of 25700 ha) followed by rapeseed mustard (-17600 ha), un-irrigated wheat (-15600 ha), chillies (-12600 ha) and fennel (-1600 ha). Among the positive change group, irrigated wheat ranked first with increase of 528500 ha, followed by cumin (1190), gram (97900 ha), and a few other crops like potato, onion, small millets, other pulses, garlic, and jowar. The overall change was found positive with an increase of 778200 ha which accounted about 52.78% rise in area. Table 10: Change in Total Acreage of Major Crops of Gujarat during Last Decade
Area in ‘00 ha
Rank (old) Crop
Avg. (01-02 to 03-
04)
Avg. (09-10 to 11-
12)
Actual change
Change (%)
Rank (new)
1 Groundnut 20034 18102 -1932 -9.64 2 2 Cotton 16410 26969 10559 64.34 1 3 Bajra 10712 8039 -2673 -24.95 4 4 Wheat 7595 12724 5129 67.53 3 5 Rice 6753 7744 991 14.67 5 6 Maize 4845 4071 -774 -15.98 7 7 Sesamum 3626 2538 -1088 -30.01 10 8 Castor 3473 5966 2493 71.78 6 9 Tur 3253 2626 -627 -19.27 9 10 Guar seed 2475 1285 -1190 -48.08 16 11 Rapeseed-M 2330 2154 -176 -7.55 11 12 Sugarcane 2316 1941 -375 -16.19 12 13 Mung 2068 1810 -258 -12.48 14 14 Jowar 1726 1378 -348 -20.16 15 15 Cumin 1605 2796 1191 74.21 8 16 Udid 1100 987 -113 -10.27 18 17 Tobacco 1023 1229 206 20.14 17 18 Gram 846 1825 979 115.72 13 19 Math 459 302 -157 -34.20 23 20 Isabgul 400 142 -258 -64.50 28 21 Onion 345 596 251 72.75 20 22 Potato 341 601 260 76.25 19 23 Small Millets 339 479 140 41.30 22 24 Banana 323 229 -94 -29.10 26 25 Fennel 274 258 -16 -5.84 25 26 Ragi 254 170 -84 -33.07 27 27 Other pulses 248 558 310 125.00 21 28 Chillies 208 82 -126 -60.58 29 29 Garlic 144 287 143 99.31 24
Total 95525 107888 12363 12.94
Summer Season In summer season none of the crop reported negative change. Three crops which were found responsible for rise in area were bajra (159400 ha), Groundnut (85300 ha) and Rice (37800 ha) which resulted into 12.94% rise.

28th National Conference on Agricultural Marketing
86
Horticulture All components of horticulture showed positive changes in area during last decade. The area under vegetables, spices, fruits and flowers were increased by 20.09%, 14.75%, 19.74% and 72.04%, respectively with an overall rise of 18.28%. Overall Change The change in total acreage of major crops and their ranks during last decade were worked out and presented in Table 10. In Gujarat state, total 29 crops were identified as major field crops and out of which groundnut ranked first with highest acreage (2003400 ha) at the beginning of last decade. Its area declined and reached to second position at the end of decade while cotton occupied the first rank with highest acreage (2696900 ha). Similarly, bajra declined from third to fourth position while wheat improved from fourth to third position during last decade. Rice retained its fifth rank with slight improvement in acreage and maize went from sixth rank to seventh position. Other crops which showed increase in acreage include castor (71.78%), cumin (74.21%), tobacco (20.14%), gram (115.72%), onion (72.75%), potato (76.25%), small millets (41.30%), and garlic (99.31%). The remaining crops reported decline in area during last decade. 3.4 Diversification Four measures viz., Herfindahl Index (HI), Entropy Index (EI), Modified Entropy Index (MEI) and Composite Entropy Index (CEI) were used to measure crop diversification. For better understanding, the whole Gujarat was divided into four regions viz., Saurashtra, North Gujarat, Middle Gujarat and South Gujarat. The diversification indices for first triennium (average of 2001-02 to 03-04) and last triennium (average of 2009-10 to 2011-12) and their temporal changes for all different regions as well as the State as a whole were worked out and the findings are presented in Table11. North Gujarat The results revealed that the extent of diversification was found highest in North Gujarat as none of the crops was pre dominant in this region. Though it ranked first position, the extent of diversification was declined by about 3% during last decade. The values of CEI were 0.7653 and 0.7409 in first and last trienniums, respectively. Middle Gujarat Middle Gujarat occupied second rank with CEI values 0.6937 and 0.6682 in first and last trienniums, respectively. It showed 3.67% decline in diversification during last decade.

28th National Conference on Agricultural Marketing
87
South Gujarat South Gujarat with third rank reported moderate level of diversification. The values of CEI were almost same in both the trienniums (0.6553 and 0.6558) indicating no change during last decade. Saurashtra region Saurashtra region reported the lowest diversification among all regions in Gujarat state during last decade. It ranked 4th position on the basis of CEI. It was due to crops like cotton and groundnut were found very dominant over other crops. Looking to CEI, its value increased from 0.5376 in first triennium to 0.5536 in last triennium. It showed about 3% rise in diversification in this region during the last decade. Gujarat State Overall, crop diversification in Gujarat State was moderately high with CEI 0.7559 and 0.7296 in first and last trienniums, respectively. It showed 3.48% decline in diversification and moving towards specialization during last decade. Table 11. Region-wise Crop Diversification Indices, temporal changes and their Rank Region Crop
Diversification Index
Average (2001-02 to
03-04)
Average (2009-10 to
11-12)
Change (%)
Rank based on CEI
North Gujarat 1-HI 0.8876 0.8862 -0.15 1 EI 2.5380 2.4571 -3.19
MEI 0.7986 0.7732 -3.19 CEI 0.7653 0.7409 -3.19
Middle Gujarat 1-HI 0.8769 0.8668 -1.15 2 EI 2.3742 2.2870 -3.67
MEI 0.7204 0.6939 -3.67 CEI 0.6937 0.6682 -3.67
South Gujarat 1-HI 0.8488 0.8384 -1.23 3 EI 2.1481 2.1496 0.07
MEI 0.6851 0.6856 0.07 CEI 0.6553 0.6558 0.07
Saurashtra 1-HI 0.7347 0.7593 3.35 4 EI 1.8027 1.8562 2.97
MEI 0.5600 0.5767 2.97 CEI 0.5376 0.5536 2.97
Gujarat State 1-HI 0.8885 0.8765 -1.35 - EI 2.5871 2.4971 -3.48
MEI 0.7849 0.7577 -3.48 CEI 0.7559 0.7296 -3.48
HI = Herfindahl Index, EI = Entropy Index MEI = Modified Entropy Index, CEI = Composite Entropy Index

28th National Conference on Agricultural Marketing
88
4. Policy Implications a) Decline in area of some food-grain crops like bajra, jowar, and maize, some pulse
crops like tur, mung and udid and oilseeds like groundnut and sesamum is a serious concern and needs proper attention by the government.
b) Cotton has emerged as dominant crop in Gujarat State during recent decade and
therefore its marketing and export becomes more crucial. A suitable export policy is required for benefit of cotton growers.
c) The increased area, production and productivity of horticultural crops have
resulted into wide scope for its processing and export. Suitable policy measures are required to tap this new opportunity.
d) Decline in diversification needs more attention towards other measures like crop
insurance, value addition, minimum support price, future trading, contract farming, etc for better risk management.
**************

28th National Conference on Agricultural Marketing
89
APPENDIX Appendix – 1 Annual Compound Growth Rate (CGR% ) of Major Crops during Recent Decade in Gujarat
Rank Crop Area Production Productivity
1 Cotton 5.95** 18.01** 11.35** 2 Groundnut -0.94* 2.67 3.64 3 Wheat 11.55** 14.84** 2.94* 4 Bajra -3.95** -0.71 3.37 5 Rice 2.05** 5.38** 3.27** 6 Castor 6.55* 10.15** 3.38** 7 Maize -0.03 -1.93 -1.89 8 Cumin 8.00** 13.51** 5.10** 9 Tur -2.43** 2.19 4.73** 10 Sesamum -4.59** -5.98* -1.45 11 Rapeseed-Mustard -0.58 1.95 2.54 12 Sugarcane -1.86 -2.09 -0.23 13 Gram 13.08** 20.79** 6.81** 14 Mung 2.68 1.23 -1.39 15 Jowar -3.98* -2.37 8.27 16 Guar seed -7.43** -7.11 0.34 17 Tobacco 0.94 1.12 0.18 18 Udad -0.54 2.72 3.29 19 Potato 7.83** 6.49** -1.26 20 Onion 7.82* 7.88* 0.06 - Horticultural crops 4.69** 8.68** 3.81**
Appendix - 2 Major Changes in Cropping Pattern of Gujarat State during Recent Decade
(Area in ‘000 ha) Rank Crop Average
(01-02 to 03-04) Average
(09-10 to 11-12) Change (Actual)
Change (%)
1 Cotton 1641 2697 1056 64.34 2 Groundnut 2003 1810 -193 -9.64 3 Wheat 760 1272 513 67.53 4 Bajra 1071 804 -267 -24.95 5 Rice 675 774 99 14.67 6 Castor 347 597 249 71.78 7 Maize 485 407 -77 -15.98 8 Cumin 161 280 119 74.21 9 Tur 325 263 -63 -19.27
10 Sesamum 363 254 -109 -30.01 Horticultural crops 1158@ 1370 212 18.28
@ Average (05-06 to 07-08)

28th National Conference on Agricultural Marketing
90
Appendix - 3 Area, Production and Productivity of Major Crops of Gujarat – 2011-12 Rank Crop Area
(‘000 ha) % to
Total Area Production (‘000 tons)
Yield (kg/ha)
1 Cotton 3003 25.47 10375* 587 2 Groundnut 1686 14.30 2717 1611 3 Wheat 1351 11.45 4072 3015 4 Castor 878 7.44 1803 2055 5 Bajra 866 7.35 1612 1861 6 Rice 836 7.08 1790 2142 7 Maize 516 4.37 787 1525 8 Cumin 371 3.14 260 700 9 Mung 266 2.25 121 455
10 Sesamum 247 2.09 116 471 11 Tur 244 2.07 258 1054 12 Gram 240 2.03 273 1139 13 Rapeseed-Mustard 208 1.76 327 1576 14 Sugarcane 202 1.71 1275** 6314 15 Tobacco 158 1.34 278 1762 16 Guar Seed 128 1.09 75 581 17 Jowar 124 1.05 140 1127 18 Udad 103 0.88 72 698 19 Potato 78 0.66 1792 23030 20 Onion 73 0.62 2119 29109
Other 217 1.84 - -
Total field crops 11793 100.00 - -
Horticultural crops
1 Spices 571 38.40 1168 2046 2 Vegetables 518 34.81 10050 19415 3 Fruit 382 25.71 7763 20307 4 Flower 16 1.07 135 8492
Total Horti. crops 1487 100.00 - -
* Prod. In ‘000 bales of 170 kg each ** Prod. in Gul

28th National Conference on Agricultural Marketing
91
Water Resources Management in Gujarat*
S. S. Kalamkar♣ 1. Introduction:
India is the second most populated country in the world with over 1.21 billion
people. It is endowed with a rich and vast diversity of natural resources; water being one of them. Water in India is intricately intertwined with the cultural fabric of the country, and has both economic and social connotations. India with 2.4 percent of the world’s total area has 16 percent of the world’s population; but has only 4 percent of the total available fresh water (Planning Commission, GOI, 2008). It has the largest irrigated area in the world, accounting for 22 per cent of global irrigated area. Increasing population, growing urbanization, and rapid industrialization combined with the need for raising agricultural production generates competing claims for water. India is currently facing a daunting set of water-related challenges. Inadequate access to water is often referred to as one of the biggest factors limiting development in India (UNICEF, FAO and SaciWATERs, 2013). In fact, urban and industrial demand for water is going up rapidly, without commensurate augmentation of supply. There are further limits on utilizable quantities of water owing to uneven distribution over time and space. In addition, there are challenges of frequent floods and droughts in one or the other part of the country. At the same time, India is depleting its groundwater at a rate far greater than natural cycles can replenish. Thus, with a growing population and rising needs of a fast developing nation as well as the given indications of the impact of climate change, availability of utilizable water will be under further strains in future with the possibility of deepening water conflicts among different user groups (MOWR, 2012). Among all water-related conflicts, inter-State2 river-water disputes3 are the most prominent, politicised and intractable. Apart from the traditional conflicts about water rights between upper and lower riparians in a river, conflicts about quality of water, people’s right for rainwater harvesting in a watershed against downstream users, industrial use of groundwater and its impact on water tables and between urban and rural users have emerged. There is also a growing and widespread sense of a water crisis, arising from estimates of the availability of water and projections of future demand (Iyer, 2011).
* This is a shorter version of keynote paper presented at 44th Annual Conference of Gujarat Economic Association (GEA), held at M. K. College of Commerce, Bharuch, Gujarat on February 15, 2014 and published in SPET Research Journal of Social Sciences, Vol. 02, No. 02, August 2014, pp. 3-29. Author thanks GEA and Editor in Chief of SPET. ♣ Agro-Economic Research Centre (Ministry of Agriculture, Govt. of India), Sardar Patel University, Vallabh Vidyanagar 388120, Anand, Gujarat (Email: [email protected]). 2 As per List-II–State list, Seventh Schedule of the Indian Constitution, water is a State subject. Therefore, water resources projects for irrigation and flood control are formulated, designed, executed, owned and operated by the State Governments. However, this is subject to the provisions of entry of List-I–Union List, wherein Union Government has been given powers to regulate and develop inter-State rivers and river valleys to the extent such regulation and development under the control of Union is declared by Parliament by Law to be expedient in public interest. Further economic and social planning has been included in List-III–Concurrent List, Item 20. The National Water Resources Council was set up in March 1983 to frame policy and coordinate action at the central level. (MOWR, 2006). 3 Such as Narmada Water Disputes Tribunal (October 1969): Gujarat, Madhya Pradesh, Rajasthan and Maharashtra; Godavari Water Disputes Tribunal (in April 1969): Andhra Pradesh, Karnataka & Maharashtra; Krishna Water Disputes Tribunal (December 2010): Andhra Pradesh, Karnataka & Maharashtra; Babhali Barrage issue 2005: Andhra Pradesh and Maharashtra; Mulla Periyar Dam issue: Kerala and Tamil Nadu; etc (http://wrmin.nic.in).

28th National Conference on Agricultural Marketing
92
With this backdrop, an attempt has been made in this paper to review the water harvesting and groundwater recharge in one of the water scarce states of India, i.e. state of Gujarat. The study is based on secondary4 data and literature collected from the different published sources such as government publications, reports, research papers/articles and related websites.
2. Water Resource Availability in India:
India has made significant progress in developing its water resources and
supporting infrastructure. The water resource potential of the country has been assessed from time to time by different agencies (MOWR, 2006). The Central Water Commission (1993) estimated the 1869 billion cubic metre (BCM) water availability in India which includes replenishable groundwater which gets charged on annual basis. Within the limitations of physiographic conditions, socio-political environment, legal and constitutional constraints, and the technology available at hand, the utilizable water resources of the country have been assessed at 1123 bcm, of which 690 bcm is from surface water and 433 bcm from groundwater sources (CWC, 1993). Harnessing of 690 bcm of utilizable surface water is possible only if matching storages are built. Trans-basin transfer of water, if taken up to the full extent as proposed under the National Perspective Plan, would further increase the utilizable quantity by approximately 220 bcm. As per Mid Term Appraisal report of XIth plan, current water use is 634 bcm (Planning Commission, 2011).
The water budget India has a highly seasonal pattern of rainfall, with 50
percent of precipitation falling in just 15 days and over 90 percent of river flows occurring in just four months. India receives annual precipitation of around 4000 km3. The total average annual flow per year for the Indian rivers is estimated as 1953 km3. The total annual replenishable groundwater resources are assessed as 432 km3. The annual utilizable surface water and groundwater resources of India are estimated at 690 km3 and 396 km3 per year, respectively (Kumar, et al., 2005). Due to seasonal, geographical and annual variation in availability of water as well as lack of adequate storage, substantial quantity of water, especially during monsoon season, remains unused and flows into sea. The Central Ground Water Board (CGWB) has estimated that it is possible to increase the groundwater availability by about 36 BCM, by taking up rainwater harvesting and artificial recharge over an area of 45 mha through surplus monsoon runoff. Thus, the groundwater availability may correspondingly increase. Today, India has the capacity to store about 253.388 BCM of water and per capita water storage capacity is about 209m3 (www.pib.nic.in) with an irrigated area of about 90 million ha (mha), and an installed hydropower capacity of about 37 Giga Watt in 2012. The live storage capacity of dams under construction and under consideration for construction by the respective state governments is 50.959 BCM and 109.673 BCM respectively. In spite of a sizeable water resource base and vast land resource, India continues to struggle to meet its water sector infrastructure requirements, including operation and maintenance costs (UNICEF, FAO and SaciWATERs, 2013). Even after constructing 4525 large and small dams, the per capita storage in the country is 209 m3 as against 5686 m3 in Russia, 3223 m3 in Australia, 2192 m3 in the United States (US), and 416 m3 of China. It may
4 All literature and data sources used are cited in the paper. The paper is heavily based on the dataset and literature taken from GOG (2013) and http://guj-nwrws.gujarat.gov.in.

28th National Conference on Agricultural Marketing
93
touch 400 m3 in India only after the completion of all the ongoing and proposed dams. The irrigation potential of the country has been estimated to be about 140 mha without inter-basin sharing of water and 175 mha with inter-basin sharing.
The Standing Sub Committee Report (CWC 2000) estimated that the total
demand for water by all sectors would surpass the total utilizable water resources by the year 2050, posing a big challenge to the country. As a consequence of the increasing demand on finite water resources to meet the varied demands of the burgeoning population, its availability is declining each passing day. While the total water resource availability in the country remains constant, the per capita availability of water has been steadily declining since 1951 due to population growth (Kalamkar, 2011). The per capita availability of water at national level has been reduced from about 5177 cubic meters in 1951 to 1,816 cubic meters in 2001 and the estimated level of 1545 cubic meters in 2011 with variation in water availability in different river basins. Given the projected increase in population by the year 2025, the per capita availability is likely to drop to below 1,000 cubic metres, which could be labeled as a situation of water scarcity5 (GOI, 2006). While on an average we may be nearing the water-stressed condition, on an individual river basin-wise situation, nine out of our 20 river basins with 200 million populations are already facing a water-scarcity condition. The water challenges for the country and particularly for its states, are manifold: a) improving and safeguarding existining drinking water supplies, b) managing water demand across competing sectors, and c) determining environmental requirements and prevention of pollutions (Raju, 2010). This clearly indicates the need for water resource development, conservation, and optimum use.
Irrigation constitutes the main use of water and is thus the focal issue in water
resources development. About 83 per cent of the total fresh water available in the country is used for irrigation. India has made considerable progress in developing irrigation infrastructure. However, irrigation efficiency is low for both surface and groundwater (GOI, 2013, p.180). The ultimate irrigation potential for the country has been estimated at about 140 mha (59 mha through major and medium irrigation projects, 17 mha through minor irrigation schemes and 64 mha through groundwater development). So far, the irrigation potential of nearly 100 mha has already been created, but only about 86 mha is being utilized, thus leaving a gap of 14 mha between created and utilized potential. This huge gap of 14 mha between irrigation potential created and utilized reduces the irrigation intensity to only 135 per cent which should have been raised to 175 per cent or more. During 2009-10, out of 192.20 mha gross cropped area in India, 44.96 percent area (86.42 mha) was under irrigation (GOI, 2012). The cropping intensity and irrigation intensity was 137.3 percent and 136.6 per cent during corresponding year. Besides low water use efficiency, there is high inequity in water use and irrigation development, let alone the fast receding aquifers and blocks6 after blocks turning ‘dark’ and ‘grey’ in certain parts of the country. Over exploitation of ground water is leading to falling water levels in many areas especially, the hard rock areas. As per CGWB (2013) latest statistic, as of March 2009, out of 5842 numbers of assessed administrative units (blocks/taluks/mandals/districts), 802 units are over-exploited, 169 units are critical, 5 A per capita availability of less than 1700 cubic metres (m3) is termed as a water-stressed condition while if per capita availability falls below 1000 m3, it is termed as a water scarcity condition. 6 Categorisation of blocks: Stage of ground water development (%) at Year 5 as a) White -< 65%; (b) Grey- > 65% but < 85%; (c) Dark- > 85% but < 100% Source: MOWR (2009).

28th National Conference on Agricultural Marketing
94
523 units are semi-critical, and 4277 units are safe. Apart from these, there are 71 assessment units which are completely saline. In fact nearly 80 percent of the blocks in Punjab and 60 percent of the blocks in Haryana have turned ‘dark’ and ‘over exploited’ (CGWB, 2013). While there is over-exploitation in some parts of the country, under-exploitation of ground resources especially in the east and northeast is a matter of concern. Water scarcity has gripped several states in India as groundwater levels continue to deplete at an alarming rate. Mercury levels are rising and large parts of the country are experiencing severe droughts. There are some problems relating to the concepts of ‘available’ and ‘usable’ water resources; and there are wide variations, both temporal and spatial, in the availability of water in the country, limiting the significance of national aggregates and averages (Iyer, 2011). The zone-wise groundwater resources availability, utilization and stage of development is presented in Table 1. While the North Zone has already developed 87 per cent of its groundwater, the East Zone has over 70 per cent of its groundwater unexploited for irrigation purposes. Considering that 70 per cent of the groundwater in the East Zone is unexploited, and the region has high poverty intensity, larger allocations and technical support should be provided by the Centre to this zone for judiciously developing and utilizing water resources towards increased, sustained and inclusive agricultural growth. Table 1: Zone-wise Ground Water Resources Availability, Utilization & Stage of Development (bcm/year)
Sr. No.
State/ Union
Territories
Net Ground Water
Availability
Projected Demand for Domestic & Industrial Uses up to 2025
Projected Demand for Domestic &
Industrial Uses up to 2025
Ground Water Availability for
Future Irrigation
Stage of Groundwater Development
(%) Irrigation Domestic &
Industrial Use Total
1 North 105.45 86.55 5.19 91.71 8.01 11.43 87 2 South 75.71 42.34 4.01 46.34 6.43 30.58 61 3 East 112.12 28.87 4.31 32.99 6.52 76.66 29 4 West 105.93 54.77 4.79 59.58 8.21 43.62 56
Total 399.20 212.53 18.29 230.62 29.16 162.28 56 Source: Central Ground Water Board, Annual Report, 2005-2006, as quoted in Planning Commission, 2007.
3. Water Resource Availability in Gujarat:
The state of Gujarat is situated on the western side of India covering an area
of 196,024 sq. km. It accounts for about six percent of the total geographical area of India and five percent of the population and accounts for about 2.6 per cent of the total fresh water resources in the country (www.gidr.ac.in). Almost one third of the coastline of the Indian sub-continent belongs to Gujarat. Gujarat has a pride place in the Indian economy. It is one of those states of India where economy has always performed better than the national average. The economic performance of the state may be considered as even more remarkable in view of the fact that the state has limited natural resources. It has limited mineral base and its water resources are scarce with most of the rivers flowing through the state having reasonable water during rainy season only. The state can be broadly divided into South, North, Saurashtra and Kachchh regions. Vast areas of the state, mainly in the central and northern Gujarat, are plain lowlands. The salient features of these regions in terms of hydrology, groundwater occurrence, agricultural practices and socio-economy are presented in Table 2. Water resources in Gujarat are concentrated primarily in the southern and central part of the mainland. Saurashtra and Kutch region in the northern mainland with exceptionally high irrigation needs, have limited surface and

28th National Conference on Agricultural Marketing
95
groundwater resources. A significant percentage of the water in the state (both surface and groundwater) is consumed by the agricultural sector for irrigation purposes. The major rivers flowing in Gujarat are Narmada, Sabarmati, Tapi, Purna, Damanganga, Rukmavati etc. The Government of Gujarat has been giving due attention to accelerate the pace of water resources development in the state so as to increase the net water availability by creating additional storage, completion of ongoing projects, improvement in water use efficiency, bridging the gap between the potential created and its utilization, restoration and modernization of old irrigation system, conjunctive use of ground and surface water, promoting participatory irrigation management, large scale people's participation in water conservation programmes and inter-basin transfer of water (GoG, 2013).
Table 2: Salient Features of the Four Regions of Gujarat
Regions Districts Features North Gujarat
Ahmedabad, Gandhinagar, Patan, Mehsana, Dahod, Banaskantha, Panchmahals and Sabarkantha.
Arid to semi-arid climate; groundwater is the main source of irrigation; deep, alluvial aquifer system that is over-exploited; enterprising farmers; highly developed dairying and dairy co-operatives.
South Gujarat
Anand, Kheda, Vadodara, Bharuch, Surat, Narmada, Navsari, Valsad and Dangs.
Humid and water-abundant part of Gujarat; large areas under canal irrigation systems such as Mahi, Ukai-Kakarapar, Karjan, Damanganga and Sardar Sarovar; conjunctive use of groundwater and canal surface water though farmer initiative; enterprising farmers; strong Dairy cooperatives.
Saurashtra Amreli, Bhavnagar, Junagadh, Jamnagar, Porbandar, Rajkot and Surendranagar.
Arid to semi-arid climate; groundwater the main source of irrigation; hard rock aquifers have poor storativity; open dug wells are the main source of irrigation; Agriculture dependent mostly on monsoon; early withdrawal of monsoon is a curse for kharif crop.
Kachchh Kachchh Arid to semi-arid climate; groundwater the main source of irrigation; limited area with tube wells in productive aquifers having poor strorativity with open dug wells are the main source of irrigation; agriculture dependent mostly on monsoon; early withdrawal of monsoon the curse of kharif crop.
Source: Jain (2012).
The main source of water for Gujarat is surface water. The State has 185 river
basins and the available quota of water in the State is 55608 million cubic meters, out of which, 38100 million cubic meters is surface water, which is only 2 per cent of the entire quota of surface water of the country (Table 3). Average per capita water availability of about 980 m3per year puts the state in the ‘water scarce’ category. Intra-state variation in per capita water availability (1570 m3 in south and central Gujarat to 414 m3 in north Gujarat) is also eye-catching (GOG, 2011). Moreover, the available quota of surface water is also not distributed properly. Gujarat, Saurashtra and Kutch have water resources of 80 per cent, 17 per cent and 3 per cent respectively. Against this, the total geographical area of these regions is 45 per cent, 33 per cent and 22 per cent respectively. The underground water resources of State are 17508 million cubic meters. The quota of available surface and underground water is used for drinking purpose, industries, agriculture and hydral power, fisheries etc. Out of which, nearly 80 per cent quota is used for agricultural production, in which irrigation also plays an important role. The state has very limited ground water resources for irrigation purposes. Open wells and tube wells forming the main sources of irrigation in the state serve primarily as sources of protective irrigation. As per latest available information, storage capacity of the State is of about 18.359 BCM, which accounts for the share of 7.25 percent in all India storage capacity (www.pib.nic.in).

28th National Conference on Agricultural Marketing
96
Table 3: Details of Water Resources of Gujarat
Region Total Water Quota (MCM)
Surface Water (MCM)
Ground Water (MCM)
Storage capacity of existing reservoirs (Except
Sardar Sarovar) (MCM)
per cent of Water
Resources
per cent of area
Central & South Gujarat 38105 31750 6355 10400 69 25
North Gujarat 6342 2100 4242 2100 11 20
Saurashtra 9723 3600 6123 2250 17 33
Kutch 1438 650 788 250 3 22 Total 55608 38100 17508 15000 100 100
Source: http://guj-nwrws.gujarat.gov.in (Accessed on January 24, 2014).
Climate and Rainfall Pattern:
Gujarat is known to be drought prone state with 70 percent of its geographical
area classified as semi-arid and arid land types. Gujarat has varying topographic features though a major part of the state was dominated by parched and dry region. Out of 8 agro-climatic zones7, five are arid to semi-arid in nature, while remaining three are dry sub-humid in nature. Broadly, Gujarat has a tropical climate viz., sub-humid, arid and semi-arid, are spread over different regions of the state. Out of total area of the state, 58.6 per cent fall under arid and semi-arid climatic zone. The arid zone contributes 24.94 per cent, while the semi-arid zone forms 33.66 per cent of the total area of the state. Gujarat has a tropical monsoon climate that ranges from sub humid to semiarid as the annual rainfall decreases northwards and westwards. Daily minimum and maximum temperatures range from 13o C to 27 o C in January and 27 o C to 41 o C in May. Extreme minimum is about 5 o C and maximum is 46 o C. The relative humidity is very high during the wet season (June-October) and low in the hot season (March-May). Winds are generally light to moderate with some increase in force during the monsoon (GOG, 2011).
Precipitation, the primary source for Gujarat's water supply varies widely from
year to year and area to area. Sometimes floods and water shortage occur in the same year. While the wettest areas are in the South, most of Gujarat's people and farmlands are in the drier Northern and Western parts of the State. The rainfall depends on the local winds which change their directions accordingly to the seasons. The average rainfall for the state during 1982-2011 was 798 mm compared to the all-India average of 1100 mm. About 95 per cent of the total annual rainfall is received during three months (July, August and September). Rainfall in the large parts of Gujarat is not only inadequate but also varies widely from year to year (Figure 1). The average of deviation of annual rainfall from long-term normal is (-) 15.43 per cent during a period of 1969-70 to 2010-11. Every year the amount of rainfall is different in different areas of Gujarat. The analysis on rainfall pattern in Gujarat reveals that the average annual rainfall over different parts of the state varies widely from 300 mm in the Western half of Kutch to 2100 mm in the Southern part of Valsad district and the Dangs. Besides, the number of rainy days in a season varies from one part of the state to another. The range is from minimum of 16 days in Kachhch to maximum of 48 days in Surat and the Dangs (GoG, 2012a). Generally, the number increase as one moves towards the eastern and the southern parts of the State (Table 4). Rainfall is the most significant source of ground water recharge
7 The distinctive features of agro-climatic zones of Gujarat state are briefly presented in Annexure I.

28th National Conference on Agricultural Marketing
97
and hence changes in the rainfall pattern leaves distinct imprint on the ground water regime of an area.
Table 4: Trends of rainfall in Gujarat
Sr. No.
Region Average Annual rainfall Rainy days
1 South Gujarat > 1100 mm 120 2 Central Gujarat 800 – 1000 mm 30 – 70 3 Saurashtra 400 – 800 mm 20 – 30 4 Kutchh < 400 mm 10 - 20
Source: http://guj-nwrws.gujarat.gov.in/downloads/water_related_issues.pdf
About two-third of the area of the state is under arid and semi-arid tropics,
where the risk and instability in agricultural production and productivity usually remain quite high. As such majority of the area of the State is rain-fed and there is acute shortage of irrigation water in this area. There are very few perennial rivers in the State (out of a total of 185 rivers) and limited facility of surface irrigation. Perennial rivers are located in 20 per cent area of the State, which accounts for 80 per cent of surface water of the State. This leads to drought every third year. The drought is such a menace that not only it eats away billions of rupees but along with it ,because of lack of surface and ground water resources, millions of cattle and shepherds have to migrate from Saurashtra, Kachchh and North Gujarat to the area of South Gujarat in search of water, food and fodder. Further, in order to mitigate scarcity, the State Government has to undertake scarcity relief works at a huge cost (GOG, 2011).
Figure 1: Rainfall Pattern in Gujarat (1969-70 to 2010-11)
4. Irrigation Potential Created and Utilised in Gujarat:
Gujarat government has played an important role in developing physical
infrastructure for agriculture, namely irrigation, power and roads (Gulati et al., 2009). The state has about 104 lakh ha under cultivation of which about 65 lakh ha is estimated to have irrigation potential through surface and groundwater sources (Parthasarthy, 2010). This indicates that through proper water resource development
0
200
400
600
800
1000
1200
1969
-70
1970
-71
1971
-72
1972
-73
1973
-74
1975
-76
1976
-77
1977
-78
1978
-79
1979
-80
1980
-81
1981
-82
1982
-83
1983
-84
1984
-85
1985
-86
1986
-87
1987
-88
1988
-89
1989
-90
1990
-91
1991
-92
1992
-93
1993
-94
1994
-95
1995
-96
1996
-97
1997
-98
1998
-99
1999
-200
020
00-0
120
01-0
220
02-0
320
04-0
520
06-0
720
07-0
820
09-1
020
10-1
1
Annual actual rainfall (mm) Annual normal rainfall (mm)
Rai
nfal
l in
mm
Source: Swain, et al., 2012.
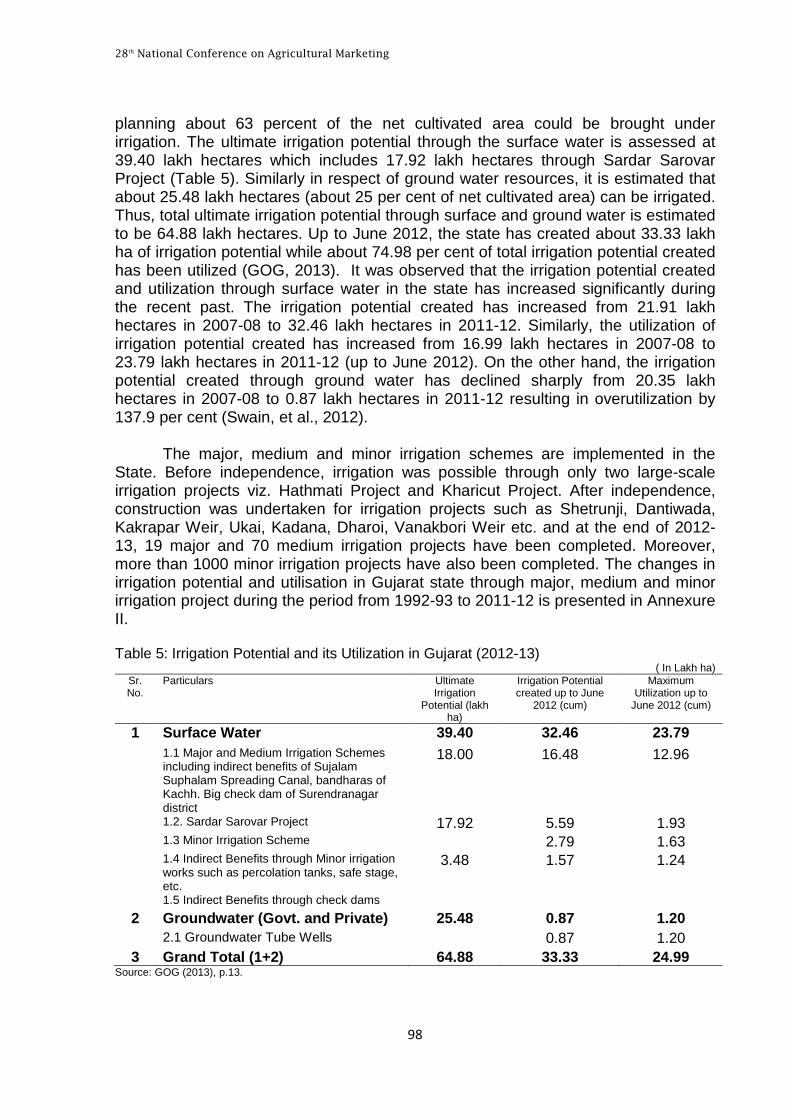
28th National Conference on Agricultural Marketing
98
planning about 63 percent of the net cultivated area could be brought under irrigation. The ultimate irrigation potential through the surface water is assessed at 39.40 lakh hectares which includes 17.92 lakh hectares through Sardar Sarovar Project (Table 5). Similarly in respect of ground water resources, it is estimated that about 25.48 lakh hectares (about 25 per cent of net cultivated area) can be irrigated. Thus, total ultimate irrigation potential through surface and ground water is estimated to be 64.88 lakh hectares. Up to June 2012, the state has created about 33.33 lakh ha of irrigation potential while about 74.98 per cent of total irrigation potential created has been utilized (GOG, 2013). It was observed that the irrigation potential created and utilization through surface water in the state has increased significantly during the recent past. The irrigation potential created has increased from 21.91 lakh hectares in 2007-08 to 32.46 lakh hectares in 2011-12. Similarly, the utilization of irrigation potential created has increased from 16.99 lakh hectares in 2007-08 to 23.79 lakh hectares in 2011-12 (up to June 2012). On the other hand, the irrigation potential created through ground water has declined sharply from 20.35 lakh hectares in 2007-08 to 0.87 lakh hectares in 2011-12 resulting in overutilization by 137.9 per cent (Swain, et al., 2012).
The major, medium and minor irrigation schemes are implemented in the
State. Before independence, irrigation was possible through only two large-scale irrigation projects viz. Hathmati Project and Kharicut Project. After independence, construction was undertaken for irrigation projects such as Shetrunji, Dantiwada, Kakrapar Weir, Ukai, Kadana, Dharoi, Vanakbori Weir etc. and at the end of 2012-13, 19 major and 70 medium irrigation projects have been completed. Moreover, more than 1000 minor irrigation projects have also been completed. The changes in irrigation potential and utilisation in Gujarat state through major, medium and minor irrigation project during the period from 1992-93 to 2011-12 is presented in Annexure II. Table 5: Irrigation Potential and its Utilization in Gujarat (2012-13)
( In Lakh ha) Sr. No.
Particulars Ultimate Irrigation
Potential (lakh ha)
Irrigation Potential created up to June
2012 (cum)
Maximum Utilization up to
June 2012 (cum)
1 Surface Water 39.40 32.46 23.79 1.1 Major and Medium Irrigation Schemes
including indirect benefits of Sujalam Suphalam Spreading Canal, bandharas of Kachh. Big check dam of Surendranagar district
18.00 16.48 12.96
1.2. Sardar Sarovar Project 17.92 5.59 1.93 1.3 Minor Irrigation Scheme 2.79 1.63 1.4 Indirect Benefits through Minor irrigation
works such as percolation tanks, safe stage, etc.
3.48 1.57 1.24
1.5 Indirect Benefits through check dams 2 Groundwater (Govt. and Private) 25.48 0.87 1.20 2.1 Groundwater Tube Wells 0.87 1.20 3 Grand Total (1+2) 64.88 33.33 24.99
Source: GOG (2013), p.13.

28th National Conference on Agricultural Marketing
99
Out of total reporting area of 18.8 million hectares, about 53 percent area was net sown during 2007-08. Very surprisingly, the share of net sown area in total reporting area has increased during last two decades. Out of about 9.97 mha of net sown area, about 4.23 mha area was net irrigated (Table 6). Thus, about 42.5 per cent of net cropped area in the state was under irrigation. It can be also observed from the table that percentage of ASMO to NSA has increased by 10.3 percent points during 1980-81 and 2007-08, whereas percentage of AIMO to NIA has increased by 16 percent points during the corresponding period. This indicates that more land was put under irrigation during recent past, may be due to availability of irrigation. Therefore irrigation intensity in the state was higher than cropping intensity.
Table 6: Details on Cropped and Irrigated Area in Gujarat
Sr. No. Item
Cropped and Irrigated Area in Gujarat (00 ha) 1981-81 1990-91 2000-01 2005-06 2006-07 2007-08
1 Total Reporting Area (TRA) 188220 188219 18118 188118 188102 188102 2 Net Sown Area (NSA) 95765 92962 94333 97222 98009 99658 3 % NSA to TRA 50.9 49.4 50.1 51.7 52.1 53.0 4 Area Sown more than Once (ASMO) 11694 13386 10637 17725 20065 22456 5 % ASMO to NSA 12.2 14.4 11.3 18.2 20.5 22.5 6 Gross Cropped Area (GCA) 107459 106348 104970 114947 118074 122114 7 Net Irrigated Area (NIA) 20026 24376 28060 39074 42376 42333 8 %NIA to NSA 20.91 26.22 29.75 40.19 43.24 42.48 9 Area Irrigated more than once (AIMO) 3318 4729 5361 8568 10411 13808 10 %AIMO to NIA 16.57 19.40 19.11 21.93 24.57 32.62 11 Gross Irrigated Area (GIA) 23344 29105 33421 47642 52787 56141 12 % GIA to GCA 21.72 27.37 31.84 41.45 44.71 45.97 13 Cropping Intensity (%) 112.21 114.40 111.28 118.23 120.47 122.53 14 Irrigation Intensity (%) 116.57 119.40 119.11 121.93 124.57 132.62
Source: GoG (2013), p. 36 and 38.
Gujarat farmers rely on different sources of irrigation that include canals, tube
wells, open wells and tanks. It can be seen from the Table 7 that though there was significant increase in area irrigated by canal and tube wells in the state (each increased by 2.1 times between 1980-81 to 2007-08) in absolute term, the share of area irrigated by canal in net irrigated area has remained unchanged at the level at about 19 per cent during the period 1980-81 and 2007-08 whereas irrigated area through tube wells and open wells has slightly declined from 79.32 per cent in 1980-81 to 78.02 per cent in 2007-08. Thus, still the tube wells and open wells have been the major sources of irrigation in the state. Districtwise data also shows that wells and tube wells are by far the dominant source of irrigation everywhere in Gujarat (Shah, et al., 2009). Surat is only district where the gross area irrigated by canals (about 67 percent) exceeds the area irrigated by wells and tube wells. Thus, the pressure on groundwater exploitation has considerably increased in Gujarat. In fact, ground water has been over utilized in the state. Also the high cost associated with groundwater irrigation is affecting profitability of agriculture (Mehta, 2012). The success of agriculture in Gujarat in recent years has been founded on groundwater irrigation, therefore, if Gujarat fails to manage its groundwater, its agrarian gains will evaporate (Shah, et al., 2009).

28th National Conference on Agricultural Marketing
100
Table 7: Area Irrigated by Sources in Gujarat State
Sr. No. Sources
Sources of Irrigation (NIA) Area in 00 ha 1980-81 1990-91 2000-01 2005-06 2006-07 2007-08
1 Govt. Canals 3668 4731 3476 7782 7892 7710 (18.32) (19.41) (12.39) (19.92) (18.62) (18.21)
2 Wells-Tubewells 15884 19301 24347 30242 33070 33027 (79.32) 79.18) (86.77) (77.40) (78.04) (78.02)
3 Tanks 409 314 153 422 398 454 (2.04) (1.29) (0.55) (1.08) (0.94) (1.07)
4 Other Sources 65 30 84 628 1016 1142 (0.32) (0.12) (0.30) (1.61) (2.40) (2.70)
Note: Figures in parenthesis are percentage to total net irrigated area. Source: GoG (2013), p. 38
5. Ground Water Resource Availability in Gujarat:
As mentioned earlier, groundwater (wells and tube wells) is the dominant
source of irrigation everywhere in Gujarat. Ground water has emerged as an important source to meet the water requirements of various sectors including the major consumers of water like irrigation, domestic and industries. The annual replenishable ground water resource of the state has been estimated as 18.43 bcm and net annual ground water availability is 17.35 bcm. The annual ground water draft is 12.99 bcm and the stage of ground water development is 75 per cent. For the control and regulation of ground water resources, the state government has constituted the Gujarat Ground Water Authority (GGWA) in 2001. Also, the Gujarat State Water Policy was issued by the state government on June 29, 2004.
Hydrogeology:
The diverse terrain conditions have given rise to different ground water situations in the State. Major part of the state is underlain by hard rock consisting of gneisses, schist, phyllites, sandstones and basalts. Remaining area in the north and central Gujarat is occupied by the soft rocks including coastal alluvium. The development of ground water from phreatic zone is mainly through dug wellsand shallow tube wells. The yield from dug wells varies from 1 to 5 lps (CGWB, 2011). The high relief areas in the eastern and north-eastern parts of the state occupied by the Deccan Traps and the Achaeans respectively have steep topographic gradients resulting in high run-off, and therefore, provide little scope for groundwater recharge. The groundwater potential in this terrain is limited. The large alluvial tract extending from Banaskantha district in the north to Surat and Valsad districts in the south constitutes the largest most potential groundwater reservoir in the state. The aquifers are extensive, thick, hydraulically connected and are moderate to high yielding. Almost the entire Saurashtra and Kachchh regions are occupied by a variety of hard and fissured formations including basalt and consolidated sedimentary formations with semi consolidated sediments along the low-lying coastal areas. The compact and fissured nature of rocks gives rise to discontinuous aquifers with moderate yield potential. The friable semi-consolidated sandstone forms an aquifer with moderate yield potential. The coastal and deltaic areas in the state form a narrow linear strip and are underlain by Tertiary sediments and Alluvium. Though highly potential aquifers occur in these areas, salinity is a constraint for groundwater development. Groundwater withdrawal requires to be strictly regulated so that it does not exceed the annual recharge and also that it does not disturb the hydro-chemical balance

28th National Conference on Agricultural Marketing
101
leading to seawater ingress. The quality of groundwater in both hard rock and alluvial terrain is, by and large, suitable except in the coastal areas, estuarine tract and the Rann where the degree of mineralisation in groundwater is rather high and salinity is common. Salinity in groundwater is also noticed in the arid and semi-arid tract (Jain, 2012). Categorisation of Areas:
The estimation of ground water resources has been carried out considering
talukas as assessment units. Based on the level of groundwater development, the assessment units have been categorised8 as safe, semi-critical, critical and over exploited. There are five major aquifers in alluvial sediments out of which the top one has dried up due to over exploitation. As per latest data available, as on March 2009, out of 223 assessment units in Gujarat, 27 have been categorized as Over-exploited, 6 as Critical, 20 as Semi- critical, 156 as Safe and 14 as Saline (CGWB, 2013). Over exploited talukas are mostly located in North Gujarat alluvial plain area (Table 8).
Table 8: Categarisation of Taluks in Gujarat
Sl. No. District
Categarisation of Talukas in Gujarat Semi-Critical Critical Over- Exploited
1 Ahmedabad Detroj Rampura, Mandal, Sanand, Viramgam
City- Dascroi, Dholka
2 Banaskantha
Danta
Palanpur Deodar, Deesa, Dhanera, Tharad, Vadgam, Kankrej
3 Gandhinagar Dehgam, Gandhinagar, Kalol, Mansa
4 Mahesana
Vadnagar Bechraji, Kadi, Kheralu, Mahesana, Satlasna, Unjha, Vijapur, Visnagar
5 Sabarkantha Prantij Vadali 6 Bharuch Amod 7 Kheda Kapadvanj, Kathlal, Kheda,
Mahemdabad
8 Vadodara Karjan, Sinor, Vadodara 9 Jamnagar Okhamandal
10 Junagarg Keshod, Sutrapada 11 Porbandar Porbandar 12 Surendranagar Muli Idar 13 Kachchh Abdasa, Rapar Bhuj, Nakhatrana Anjar, Bhachau, Mandavi 14 Patan Chanasma, Patan, Sidhpur
Talukas Assessed 223 20 6 27 Source: CGWB (2011a), p. 120.
The ground water development is quite high in the Central Gujarat in parts of Banaskantha, Patan, Mehsana, Gandhinagar, Ahmedabad, in the Western part of State in Katchh district and also in certain coastal pockets of Porbander district. As per CGWB (2011a), there has been about 17 percent increase in the assessment of annual replenishable ground water resources of 2009 as compared to 2004. This may be attributed to significant increase in recharge structures such as check dams, percolation tanks and other structures in various parts of the state. There has been
8 The stage of development was computed as gross ground water draft for all uses*100/ annual net ground water available Categorization: Over Exploited - level of GW development > 100 per cent; Critical - level of GW development between 90 and 100 per cent; Semi Critical-level of GW development between 75 and 90 per cent.

28th National Conference on Agricultural Marketing
102
about 13 per cent increase in the ground water draft estimates in 2009. While the number of taluks having totally saline water remained the same, the total number of over-exploited and critical blocks has decreased (CGWB, 2011a). As per the groundwater resource estimation completed recently for the Gujarat state for the year 2009 a noteworthy shift is seen in a large number of assessment units (Taluka) from the critical to semi-critical/safe category in the semi-arid Saurashtra region, when compared with 2002 (Table 9). Table 9: Status of Groundwater development in Gujarat State: 2002 and 2007
Region
No. of Blocks/talukas: Year-2002 No. of Blocks/talukas: Year 2007 Total Talukas
Over Exploited
Critical Semi-Critical
Safe Saline
Total Talukas
Over Exploited
Critical Semi-Critical
Safe Saline
North Gujarat 91 24 8 23 29 7 90 23 3 6 51 7 Kachchh 10 3 1 4 1 1 10 3 2 2 2 1 Saurashtra 71 2 3 32 32 2 72 1 1 4 64 2 South Gujarat 51 1 0 4 42 4 51 0 0 8 39 4 TOTAL 223 30 12 63 104 14 223 27 6 20 156 14
Source: CGWB (2011a) and http://guj-nwrws.gujarat.gov.in/downloads/water_related_issues.pdf
However, at the same time, there is significant increase in the use of electric/submersible pump sets (mostly used for groundwater) as compared to diesel pump sets (mostly used for surface water) in the state indicates heavy withdrawal of groundwater (Table 10). Table 10: Growth in Water Extraction Devices for Irrigation 1977- 2003.
Year Diesel Pump Sets (00) Electric pumpsets/Submersible pump sets (00) 1977 4221 794 1982 3920 1722 1988 4714 2908 1992 4191 3356 1997 3672 4072 2003 4367 4683 2007 NA NA
Source: GOG (2013), p- S43.
Ground Water Quality Problems
Problem of salinity ingress is being faced by Gujarat along Saurashtra and
Kachchh coast for coastline of approximately 1125 kms. The problem is severe along Una-Madhavpur stretch of Saurashtra and Maliya–Lakhpat stretch of Kachchh Region. In these stretches in select tracts intensive agricultural development and exploitation of ground water and poor recharge from upland areas has resulted into sea water ingress even up to 5 to 6 km inland causing salinity (Box 1). The factors responsible are, i) irregular and very low precipitation; ii) highly porous geological formations; iii) low natural charge; iv) poor land management; v) excessive withdrawal of water for irrigation; vi) the phenomenon of salinity ingress has adversely affected the lives of people, both on agricultural front and drinking water front (http://guj-nwrws.gujarat.gov.in). It is estimated that approximately 10.80 lakh of people of 534 villages are badly affected by salinity. About 7 lakh ha of cultivable land has become useless and about 32750 numbers of wells have gone dry.

28th National Conference on Agricultural Marketing
103
Box 1: Ground Water Quality Problems Contaminants Districts affected (in part) Salinity (EC > 3000 µS/cm at 25 ° C)
Ahmdabad, Amreli, Anand, Bharuch, Bhavnagar, Banaskantha, Dohad, Porbandar, Jamnagar, Junagadh, Kachchh, Mehsana, Navsari, Patan, Panchmahals, Rajkot, Sabarkantha, Surendranagar, Surat, Vadodara
Fluoride (>1.5 mg/l) Ahemdabad, Amreli, Anand, Banaskantha, Bharuch, Bhavnagar, Dohad, Junagadh, Kachchh, Mehsana, Narmada, Panchmahals, Patan, Rajkot, Sabarkantha, Surat, Surendranagar,Vadodara
Chloride (> 1000 mg/l)
Ahmedabad, Amreli, Bharuch, Bhavnagar, Banaskantha, Porbandar, Jamnagar, Junagadh, Kachchh, Dohad, Patan, Panchmahals, Sabarkantha, Surendranagar, Surat, Vadodara, Rajkot
Iron (>1.0 mg/l) Ahemdabad, Banaskantha, Bhavnagar, Kachchh, Mehsana Narmada Nitrate (>45 mg/l) Ahemdabad, Amreli, Anand, Banaskantha, Bharuch, Bhavnagar, Dohad, Jamnagar, Junagadh,
Kachchh, Kheda, Mehsana, Narmada, Navsari, Panchmahals, Patan, Porbandar, Rajkot, Sabarkantha, Surat, Surendranagar,Vadodara,
Source: http://cgwb.gov.in/gw_profiles/st_Gujarat.htm
Ground Water Crisis:
The North Gujarat, Saurashtra and Kachchh regions are mostly ground water
scarcity areas of the state. In north Gujarat the ground water scarcity areas cover parts of Panchmahals, Banaskantha, Mehsana, Gandhinagar and Ahmedabad districts of Gujarat. The scarcity in these areas is faced on account of erratic and scanty rainfall, high level of irrigation development and partly due to inherently saline formations. Major part of Saurashtra covering parts of Surendranagar, Jamnagar, Junagadh, Bhavnagar, Amreli and Bhavnagar district experience acute scarcity of water resources on account of fissured hydrogeological formation which have limited storage and low transmission capacity, scanty and erratic rainfall and partly due to inherent saline nature of formations and salinity ingress the along the coastal aquifers. The Kachchh district also faces acute shortage of water frequent failure of monsoon creating drought like situation, limited aerial extent of productive aquifers, high level of ground water development and also partly due to inherently salinity in the coastal aquifers.
Columbia Water Center in its on the study of the severe groundwater crisis in
the Mehsana region of Northern Gujarat and concludes that the current pattern of groundwater exploitation is both costly for the state and unsustainable for farmers, and could lead to the complete failure of agriculture in the area within a few years if left unchecked. North Gujarat is naturally endowed with one of the richest alluvial aquifers of India but its uncontrolled exploitation for irrigation has resulted in many undesirable consequences. Over-exploitation of groundwater had caused drying up of open wells and dug-cum-bored wells in alluvial parts of north Gujarat. Falling groundwater table had not only resulted in an increase in the capital cost of tube well construction but also added to variable costs of energy used for lifting water and well maintenance (Ranade and Kumar, 2004). 6. Water Conservation Measures:
After having harnessed all possible sources, the state government launched
massive drive for water conservation. The State adopted an integrated approach for efficient and sustainable water resources development and management, which is inclusive in scope (http://guj-nwrws.gujarat.gov.in). This includes:

28th National Conference on Agricultural Marketing
104
• Water Conservation • Micro irrigation management • Participatory Irrigation Management • Interlinking of rivers and inter-basin transfer of water • Strengthening of existing canal system • Salinity ingress prevention
Water Conservation
Generally, rainfall occurs for three to four monsoon months in a year.
Irrigation tanks, ponds and other micro water-sheds, known as 'small water bodies' store the run-off water and provide assured water supply throughout the year. Even from the earliest times people realised the importance of minor irrigation sources. The level of prosperity of a village directly depends upon the availability of water in minor irrigation sources. Further, 'small water bodies' contribute to ecological balance and provide water supply for rural and urban population (Sivasubramaniyan, 1994). The state government is taking up maximum work to deepening of tanks, construction of Khet talavadi, check dam, bori bundh etc. for underground water recharge. There is a good response from the farmers to types of work. Taking such type of works there is considerable increase in agriculture produces resulting in increase of revenue income and standard of living of village people is lifting up day by day.
After the famine years of 1986-87 to 1989 and irregular and scarce rainfall in
the next few years, limited system of recharge of underground water, reduction of the surface water etc., more and more underground water was required and as a result, the underground water level declined at rapid rate every year in the State. Moreover, due to failure of monsoon in 1999-2000, most of the reservoirs and dams of Kutch, North Gujarat and Saurashtra remained empty, which resulted in acute shortage of drinking water in the State. This resulted in a grave problem of supplying drinking water in the urban and rural areas of the State. The State Government, after careful consideration, undertook a massive exercise of preventing the excess rainfall water being drained in the ocean by preserving this precious water in possible areas by recharging the underground water, through construction of check dams and deepening existing tanks. By launching massive drive for water conservation and ground water recharge, the State Government has already put up nearly 6 lakh water harvesting structures depending upon soil, topography and availability of water. These include about 1.59 lakh check dams and bandharas, 2.49 lakh farm ponds (Khet talavdis), 1.25 lakh boribundhs, numerous terrace talavdis, van talavdis, sim Talavdis etc. As a result of this, the declining trend of ground water level has been arrested and improvement is visible. Water Resource Department has constructed 88312 check dams out of above. About 24,497 ponds have been deepened and thus their storage capacity has been enhanced. Further, in order to assess the quantum and extent of the ground water, about 1,200 observation points have been established (http://guj-nwrws.gujarat.gov.in).
Under the “Sardar Patel Participator Water Conservation Project” nearly
76477 check dams have been constructed up to March 2013. The said check-dams have been constructed with public private participation. It is observed that after

28th National Conference on Agricultural Marketing
105
construction of check dams, in five districts of Saurashtra, the underground water level has come up to the extent of 0.65 mtrs to 13.30 mtrs. Earlier, peoples’ groups, voluntary institutions and donors used to bear 40 percent of the expenditure and Government’s share was 60 per cent. This ratio has now been changed to 80:20 (Government: Beneficiaries). The check dams are constructed by the group or institute decided. In North Gujarat and other area of the State, where suitable sites are not available for the construction of check dams, deepening of existing ponds / tanks have been promoted on a large scale to store and conserve water and ground water recharging during monsoon with financial contribution ratio of 90:10 (Government: Beneficiaries). The objective behind this is to prepare and construct a check dam with less expenditure. As people themselves construct the check-dam, they take enough care in construction of the check dam and prevent involvement of vested interests and misappropriation of money. This scheme has also been largely welcomed by the people. Storages of Water:
Considering the extreme situation the State is facing, attention was focused
on creation of storages of water throughout the State. Storage reservoirs are vital to the exploitation of water resources for sustained development of the State. Several large projects like Ukai, Kadana, Dharoi, Bhadar, Shetrunji, Sardar Sarovar (SSP) were taken up in the Five-Year Plans along with several other major, medium projects. As per Socio-Economic Review 2012-13, out of total 202 dams with total storage capacity of 15921.04 million cubic metres, 47 dams (having storage capacity of 13089.05 million cubic metres) are in Gujarat region, 20 dams (having storage capacity of 330.55 million cubic metres) are in Kachchh region and 135 dams (having storage capacity of 2501.44 million cubic metres) are in Saurashtra region. At the end of December 2012, the gross storage in the reservoirs was 9515.56 million cubic metres, which was 59.77 percent against the total storage capacity. The reservoir gross storage by region at the end of June, September and December-2012 is shown in the Table 11.
Table 11: Reservoir Storage by Region
Region No. of Dams
Storage Capacity (in Million cubic
metres)
Gross Water Storage June 2012 (in Million
cubic metres) September- 2012
(in Million cubic metres)
December 2012 (in Million cubic metres)
Gujarat 47 13089.05 4043.6 11793.84 9313.24
Kachchh 20 330.55 65.89 119.19 85.4 Saurashtra 135 2501.44 225.68 451.36 216.92 Gujarat State 202 15921.04 4335.17 12364.39 9515.56
Source: Flood Control Cell, Gujarat Water Data Centre, Sector-8, Gandhinagar as quoted in GOG (2013, Socio-Economic Review 2012-13).
Micro-Irrigation:
Micro irrigation, comprising drip and sprinkler, has emerged as a tool for
effective management of resources which save water, fertilizer as well as electricity and distribute water evenly unlike other irrigation systems. Water use efficiency under both systems is very high as it saves substantial amount of water losses. Studies have claimed water saving of 40 – 80 percent and productivity gains up to 100 percent (Sivanappan 1994; Palanisami et al. 2011). The Government has taken up initiative for regulating water use for agriculture by spreading micro irrigation

28th National Conference on Agricultural Marketing
106
technology. Gujarat has created Gujarat Green Revolution Company (GGRC) in 2005, a special purpose vehicle to expedite the promotion of drip irrigation among farmers. GGRCL offers attractive subsidy loan to adopters, but more importantly has fast tracked and simplified the administrative procedures for accessing these. As a result, the spread of micro-irrigation technologies is more rapid in Gujarat than other states during recent years (Gulati et al, 2009; Shah et al., 2009). Any farmer can get subsidy of Rs. 60,000/- per hectare or 50 per cent of the MIS cost (derived based on crop spacing) whichever is less for any area and any crop. Tribal Farmer of tribal area can get additional 25 per cent subsidy from Tribal Department of GOG. The GGRC was instrumental in spreading micro irrigation over 70,000 hectares of land during the year 2009-10 (GOG, 2011). State Government has decided to bring all State run tube-wells in Northern Gujarat under micro irrigation so as to save ground water. As a result of this, about 245 tube-wells are connected to micro irrigation system; work is in progress on another 600 tube-wells (http://guj-nwrws.gujarat.gov.in). Many villages in Gujarat have adopted 100 per cent drip and sprinkler irrigation systems to water crops. In June 2009, more than 93 thousand farmers in Gujarat have adopted drip irrigation for their total 1.51 lakh hectare land (GOG, 2012). Rainwater Harvesting
Rapid expansion of groundwater use in the last three decades has resulted in
a steep decline in the groundwater table and led to drying up of a huge number of wells, low well productivity, rapid rise in well and pumping depths, deteriorating groundwater quality, and also salinity ingress in many areas. In response to this situation, rainwater harvesting offers a critical and promising solution to replenish and recharge the groundwater (in areas where geologic conditions are conducive). Rain is the most important source of all water and in an endless cycle, rain rejuvenates all fresh water resources. Rainwater recharges the surface sources and slowly seeps into the ground to reach and replenish the underground aquifers. In a typical setting, much of the rainwater is lost to surface flows. Rainwater harvesting for agriculture generally involves the creation of structures such as check dams, ponds, and percolation tanks to slow the flow of water, and to collect and hold limited quantities at a planned set of places along the flow path. The primary objective is to increase the percolation of the rainwater into the ground to recharge the groundwater table. This leads to a rise in the water table levels, increased supply of water in wells, and a longer period of availability of water (Gandhi and Bhoomoriya, 2011). As mentioned earlier, by launching massive drive for water conservation and ground water recharge, the State Government has already put up nearly 6 lakh water harvesting structures depending upon soil, topography and availability of water.
Rainwater harvesting is simply catching rain where it falls and using it to
storage and recharging the aquifers. With rapid urbanization, lakes, ponds and green areas that contribute to recharge have reduced drastically. Catchment areas have been paved and reclaimed for construction. Thus, rainwater is unable to seep into the ground, because the land is sealed for miles with concrete buildings and a network of roads. As a result even when the rains come, no recharge can take place. Instead, this precious rainwater rushes out through drains, nallas and flows out into rivers and to the sea. Looking to the above critical position of ground water,

28th National Conference on Agricultural Marketing
107
scarcity of water, and water requirements in future, the state government has decided a policy for rain water harvesting system to all present government buildings. Metropolitan Areas have notified rules under which no new building plan is approved without corresponding rainwater harvesting structure. The D/o Roads & Buildings have been directed to ensure that all major Govt. constructions including educational institutions had adequate rainwater harvesting facilities. The Urban Development and Urban Housing Department has issued necessary orders Gujarat Town Planning Act, 1976 to incorporate the rules for RWH. The work of rain water harvesting system is completed in 24103 SM up to the year 2012-13.This has resulted in recharging the ground water in the same area.
Participatory Irrigation Management:
Increasing conflicts among users and the unsustainable use of water in many
areas result from limited coordination among various water resource (surface and groundwater) development initiatives, and the absence of policies defining water entitlements, pricing, and inter-sectoral allocation rules; and if these policies exist, the inconsistencies among some of them. Over the past few years several high-level commissions have been appointed to deal with water management issues and also new national/state policies have been promulgated.9 However, not much of it has been implemented effectively. This divide between the problem and practice has led to extensive loss of credibility of the state apparatus for water development and management. Problem is balancing between service providers and users of all kind. Participatory Irrigation Management (PIM) is emerging as an important tool for ensuring better equity in distribution of water, which in turn also results in better operation and maintenance (O&M), better on farm management, and increased productivity. In April 1987, the Ministry of Water Resources, Governemnt of India, issued guidelines for farmers' participation in water management. In 1995, the Gujarat Government approved policy resolution for implementing PIM in the state and subsequently approved model bye-laws for irrigation cooperative societies and a model memorandum of understanding between government administration and water user association. An action plan was finalised for implementing government policy resolution on PIM. A year later, i.e. 1996, a state level working group for participatory management was formed and entrusted the responsibility for 13 pilot projects through Chief Engineer, PIM. Since then a large number of WUA have been formed and are working in various parts of the state (Gandhi and Namboodiri, 2011).
For promoting PIM in the state, the Government has decided to cover
maximum possible command area under PIM. The Government has also passed "Gujarat Cooperatives and Water Users Participatory Irrigation Management Act-2007". The Government has taken up initiative to involve beneficiaries and stakeholders in irrigation management by enacting PIM Act in 2007. Under the
9 At the national level, a number of national commissions have been constituted by the central government to review specific water policy issues as well as plan for a long-term development of the water sector. Among them, the notable ones are the Committee on Pricing Irrigation Water 1992 (for rationalization of water rates, volumetric water allocation, and system modification), Committee on Private Sector Participation in Major and Medium Irrigation Projects 1995 (documenting the rationale, feasibility, and actual state level initiatives for involving the private corporate sector, especially in the construction and modernization of irrigation schemes) and the National Commission of Integrated water Resources Development Plan 1997 (developing a national master plan for the water sector by synthesizing and updating similar plans prepared earlier by the CWC as well as investigating the economic, technical, and institutional issues in the water sector from a national perspective (ADB, 2009).

28th National Conference on Agricultural Marketing
108
provisions of this Act, Water Users' Association (WUA) is formed from amongst the beneficiary farmers in command area of an irrigation project. About 90 per cent of cost for community mobilization is borne by the Government. Rehabilitation of canals is completed by the Government before handing over to WUAs. The WUA contributes 10 per cent of the rehabilitation cost. Preference is given to WUA to carry out rehabilitation by them. A canal can be handed over to WUA even prior to rehabilitation, if the WUA so demands. Advance payment of the order of 1one third of the estimated cost is given to WUA for starting the work (http://guj-nwrws.gujarat.gov.in). Under this scheme 21215 ha has been covered during the year 2011-12 (GOG, 2013). As of today 1834 WUAs have been established in the command area of various irrigation projects and about 4.29 lakh hectare area has been served by these WUAs under PIM. The state accounts for about 12.9 percent share in total WUAs formed at the national level which covered about 3.33 percent national handed over area.
In order to improve the capabilities of the farmers in irrigation management, the irrigation department has stressed the incorporation of exposure visits for the WUA Presidents to irrigation projects with well performing WUAs within the state. The learning from the exposure visits and clarifications are put on record to be used at a later stage. These visits have improved the understanding of the WUAs on efficient water management practices; made them aware that WUA decides the area to be irrigated, prepare irrigation schedule etc.; that regular meetings and records maintenance. As quoted by Paratahsarthy (2010), the experiences so far indicates that PIM programme has resulted in changes in water allocation, distribution and management in almost all areas served by the WUAs.
Salinity Ingress prevention programme
The State has the longest sea coast line of 1600 km, which is about one third
of total coast line of India. Owing to rapid depletion in ground water, ingress of salinity ingress in coastal area has been a major threat rendering the land infertile (GOG, 2011). Recommendations were made by a High Level Committee for the constructions of tidal regulators and weirs near the ocean bank, recharge tanks, recharge reservoirs, recharge wells, check-dams and spreading channel etc. near the sea cost to prevent salinity ingress in the underground water. Realizing the danger lying ahead, the State government has taken up measures to arrest further advancement of salinity by taking up series of steps. The measures taken to prevent salinity ingress are as: 10 tidal regulators; 23 bandharas; 12 recharge reservoirs, 645 check-dams, 17 recharge tanks, 397 recharge wells, 4487 nala plugging, 100 kilometer long spreading channel and afforestation over 5867 hectares completed. Also the protection works against sea erosion in South Gujarat completed in 26 kilometer length benefitting 92,300 people residing in 4577 houses. Allocation of Rs. 200 crore has been made for salinity ingress prevention schemes of Gujarat under the States Special Needs under the 12th financial Commission. Similarly, allocation of Rs. 150 crore has been made by GOI for salinity ingress prevention scheme under 13th finance commission. During the year 2009-10, the Department constructed 4 bandharas, 905 checkdams, 2 recharge reservoirs, 54 recharge tanks, 19 kilometer long spreading channels in Saurashtra and Kachchh to arrest further advance of salinity.

28th National Conference on Agricultural Marketing
109
River Linking Projects After having exhausted all resources, inter basin transfer of water is the only
option left. National Water Policy (2002) emphasis that water should be made available to water deficit area by transfer from other areas having surplus water. Interlinking of rivers is a leading step to divert surplus water from surplus to deficit basins. The State has already taken very important and leading steps for interlinking of rivers. Some of the interlinking projects taken up are i) Harnav – Guhai Link ; ii) Sabarmati – Saraswati Link; iii) Mukteshwar –Harnav Link; iv)17 en route rivers on alignment of Narmada Main Canal and v) 21 en route rivers on alignment of Sujalam Sufalam Spreading canal. The proposed link canals are Damanganga – Sabarmati - Chorwad Link; Ukai – Gordha Link Canal and Dev – Sukhi Link Canal. Besides, the link canals related to Gujarat State have been proposed by National Water Development Agency (NWDA) working under the Ministry of Water Resources, Government of India. Sujalam Suphalam Yojana:
To bring permanent solution of the issues of water and flood in Gujarat, an
ambitious project has been undertaken by the State Government. This project, called Sujalam Sufalam, is expected to bring solution of age old problems of famine in 10 districts which do not have irrigation facilities. The state government has identified water scarce district of North Gujarat, Central Gujarat, Saurashtra and Kachchh, which are being covered under the Sujalam Suphalam Yojana (SSY). Under this scheme, water is being made available through Sardar Sarovar dam and other reservoirs, and on other, efforts are made to collect, store and recharge every drop of water to take the maximum benefits (Parathasarthy, 2010). The irrigation department data envisages that with the implementation of the project, about 4.65 lakh ha of land will benefit. Sujalam Sufalam Spreading canal is an unlined canal of 337 km length traversing through seven districts. The canal is having a capacity of carrying 2000 cubic feet per second (cusecs) of water. The canal all along its course has major structures for crossing 21 Rivers, 2 National Highways, 27 State Highways, 07 Railway lines. Besides, there are 600 other structures.
Extension, Renovation and Modernization:
Extension, Renovation and Modernization of canal system of existing major and medium Irrigation Schemes are under progress on a large scale to bridge the gap between irrigation potential created and its utilization. During the year 2012-13 (upto June, 2012), the total 7.58 lakh ha area had been planned to be covered under this scheme, out of which the works in about 2.65 lakh ha area has been completed (GOG, 2013). 7. Groundwater Recharge in Gujarat:
The state government has undertaken some unconventional initiatives in
managing the groundwater economy, which is mainstay of its irrigated agriculture. For one, the government has enthusiastically made common cause with farming communities in undertaking decentralized rainwater harvesting and groundwater

28th National Conference on Agricultural Marketing
110
recharge work. By adopting an aggressive recharge strategy that has contributed significantly to stabilizing the ground water levels and even reversing the trend of groundwater depletion, the Saurashtra region of Gujarat has become a role model for other states to follow (Jain, 2012). As discussed earlier, ground water level in the state varies considerably depending on aquifer geology, geomorphology and rainfall. South-West monsoon is the main source of ground water recharge. The shallowest level is observed in the month of August, while the deepest is observed in the month of May. As mentioned earlier, there is noteworthy change in groundwater level due to various schemes implemented by the state government. The analysis reveals that during pre-monsoon (May) water level ranges in general from 2 to 20 m bgl, while during post-monsoon (November) it varies in general from less than 1 to 10 m below ground level(bgl) (http://cgwb.gov.in). It has been noted by Gupta et al, (2011) that the average depletion of water levels in north Gujarat before the launch of this massive programme was around 3m per year, which by now would have cumulatively declined almost 20-26m, leading to a sharp rise in electric consumption for withdrawal of ground water (Fig. 2). But there has been a reported average water level rise of about 4m during recent years. The comparison of depth to water level of Post Monsoon 2008 with decadal mean Post Monsoon (1998-2007) also indicated that there was rise in water level of more than 2 m is prominent in Gujarat.
Fig. 2: Ground water level fall/rise (in metres)- 2002 and 2007
Source: Narmada, Water Resources, Water Supply and Kalpsar Department, 2009 as quoted in Gupta, Rajiv Kumar (2011).
As discussed earlier, the assessment of groundwater resources of Gujarat for
the year 2009 reveals a noteworthy shift in a large number of assessment units from critical to semi-critical/safe category in the semi-arid Saurashtra region, when compared with 2002. This is significant against the backdrop of decline of groundwater levels and groundwater depletion in large parts of the arid and semi-arid regions of the country (Jain, 2012). The Saurashtra region was facing problems of declining groundwater levels and ground water depletion prior to 2002 but in the post 2002 scenario, there has been an overall steady rise and stabilization in post monsoon ground water levels. Although, Saurashtra experienced above average rainfall during the period, the limited period available for infiltration of rainfall during the monsoon does not allow significantly enhanced recharge due to the limited storage of the underlying aquifers. The analysis of the drivers indicate that the intervention of decentralized rain water harvesting and artificial recharge to ground water taken up on a mass scale in the Saurashtra and Kachchh regions have

28th National Conference on Agricultural Marketing
prolonged the period of recharge to the aquifers during post monsoon season resulting into this miracle of stthe trend of ground water depletion
Fig. 3 presents a region wise disaggregation of the estimated contribution of
rainfall and other sources to the ground water recharge for 2002 and 2007 scenario (for details please see Jain, 2012). The districtwise groundwater resources availability, utilization and stage of development is presented as Annexure III and IV. Rainfall is the most important contributor to groundwater recharge throughout the state during the monsoon season. As a result, the impacts could be felt everywhere. Besides, in the South Gujarat region having large number of reservoirs and a large network of irrigation canals, the seepage from reservoirs and return flows from surface irrigation are major contributors to groundwater recharge. The contribution from seepage from reservoirs important in other regions of the state. Whereas in Saurashtra, North Gujarat and Kachchh regions in the state which have relatively large areas under groundwater irrigation the seepage from groundwaterdriver to groundwater recharge. However some other interventions are by their nature confined to one or more of the four regions. For example, if canal irrigation underwent major changes, its impact will be stronmuch of canal irrigation is located. Contrary to this, if the increased availability of water through canal irrigation system has been a major driver for building up of groundwater resources in Gujarat, one should not expNorth Gujarat, Saurashtra and Kachchh which have only a small share in canal irrigated area in the state. The decentralized groundwater recharge activities are concentrated in Saurashtra and Kachchh; hence its impact is more likin these regions. This implies that groundwater recharge activities which are concentrated mostly in Saurashtra, North Gujarat and Kachchh regions would reflect region specific impact on groundwater recharge if they form a dominant driverrecharge. Jain (2012) highlighted the expected influence of various drivers on groundwater recharge in different regions of Gujarat which is presented in Table 1
0
5000
10000
15000
20000
North 2002 North 2007 Saurashtra
Fig. 3: Region wise Groundwater recharge in Gujarat during 2002 and
Monsoon- Recharge from rainfall (MCM/yr.)
Monsoon- Recharge from other sources (MCM/yr.)
Non Monsoon
Total annual groundwater recharge (MCM/yr.)
Source: Plotted with data taken from Jain (2012)
National Conference on Agricultural Marketing
111
prolonged the period of recharge to the aquifers during post monsoon season resulting into this miracle of stabilizing the ground water levels and even reversing the trend of ground water depletion
Fig. 3 presents a region wise disaggregation of the estimated contribution of rainfall and other sources to the ground water recharge for 2002 and 2007 scenario (for details please see Jain, 2012). The districtwise groundwater resources
zation and stage of development is presented as Annexure III and IV. Rainfall is the most important contributor to groundwater recharge throughout the state during the monsoon season. As a result, the impacts could be felt everywhere.
h Gujarat region having large number of reservoirs and a large network of irrigation canals, the seepage from reservoirs and return flows from surface irrigation are major contributors to groundwater recharge. The contribution from seepage from reservoirs and flow irrigation to recharge is comparatively less important in other regions of the state. Whereas in Saurashtra, North Gujarat and Kachchh regions in the state which have relatively large areas under groundwater irrigation the seepage from groundwater irrigation forms the second most important driver to groundwater recharge. However some other interventions are by their nature confined to one or more of the four regions. For example, if canal irrigation underwent major changes, its impact will be strongly felt in southern Gujarat where much of canal irrigation is located. Contrary to this, if the increased availability of water through canal irrigation system has been a major driver for building up of groundwater resources in Gujarat, one should not expect to see large impacts in North Gujarat, Saurashtra and Kachchh which have only a small share in canal irrigated area in the state. The decentralized groundwater recharge activities are concentrated in Saurashtra and Kachchh; hence its impact is more likin these regions. This implies that groundwater recharge activities which are concentrated mostly in Saurashtra, North Gujarat and Kachchh regions would reflect region specific impact on groundwater recharge if they form a dominant driverrecharge. Jain (2012) highlighted the expected influence of various drivers on groundwater recharge in different regions of Gujarat which is presented in Table 1
Saurashtra
2002
Saurashtra
2007
Kachchh
2002
Kachchh
2007
South 2002 South 2007
Region wise Groundwater recharge in Gujarat during 2002 and
2007Recharge from rainfall (MCM/yr.)
Recharge from other sources (MCM/yr.)
Non Monsoon-Recharge from other sources (MCM/yr.)
Total annual groundwater recharge (MCM/yr.)
prolonged the period of recharge to the aquifers during post monsoon season abilizing the ground water levels and even reversing
Fig. 3 presents a region wise disaggregation of the estimated contribution of rainfall and other sources to the ground water recharge for 2002 and 2007 scenario (for details please see Jain, 2012). The districtwise groundwater resources
zation and stage of development is presented as Annexure III and IV. Rainfall is the most important contributor to groundwater recharge throughout the state during the monsoon season. As a result, the impacts could be felt everywhere.
h Gujarat region having large number of reservoirs and a large network of irrigation canals, the seepage from reservoirs and return flows from surface irrigation are major contributors to groundwater recharge. The contribution
and flow irrigation to recharge is comparatively less important in other regions of the state. Whereas in Saurashtra, North Gujarat and Kachchh regions in the state which have relatively large areas under groundwater
irrigation forms the second most important driver to groundwater recharge. However some other interventions are by their nature confined to one or more of the four regions. For example, if canal irrigation
gly felt in southern Gujarat where much of canal irrigation is located. Contrary to this, if the increased availability of water through canal irrigation system has been a major driver for building up of
ect to see large impacts in North Gujarat, Saurashtra and Kachchh which have only a small share in canal irrigated area in the state. The decentralized groundwater recharge activities are concentrated in Saurashtra and Kachchh; hence its impact is more likely to be visible in these regions. This implies that groundwater recharge activities which are concentrated mostly in Saurashtra, North Gujarat and Kachchh regions would reflect region specific impact on groundwater recharge if they form a dominant driver for recharge. Jain (2012) highlighted the expected influence of various drivers on groundwater recharge in different regions of Gujarat which is presented in Table 12.
South 2007 Gujarat
2002
Gujarat
2007
Region wise Groundwater recharge in Gujarat during 2002 and

28th National Conference on Agricultural Marketing
112
Table 12: Expected influence of different drivers on recharge to groundwater in Gujarat. Drivers responsible for ground
water recharge Regions likely to be affected
South Gujarat
Kachchh District
North Gujarat Saurashtra
1. Rainfall ↑↑↑↑ ↑↑↑↑ ↑↑↑↑ ↑↑↑↑ 2. Canals ↑↑↑↑ ↑ ↑↑ ↑↑ 3. Storage tanks and Ponds ↑↑↑↑ ↑↑ ↑↑↑ ↑↑↑ 4. Irrigation return flows ↑↑↑↑ ↑ ↑↑ ↑↑↑ 5. Check dams and percolation
tanks ↑ ↑ ↑↑ ↑↑↑↑
Source: Jain (2012). 8. Strategic Options:
Tenth Plan was declared as a Water Plan for focused attention on the
integrated development of water resources in the country (Planning Commission, GOI, 2007). The strategic options suggested by the many researchers are as follows:
• Water is a finite resource and it has to be shared between the various sectors
and sub-sectors optimally. There is a need to increase investments in conservation of water, improved techniques to ensure its timely supply, and improve its efficient use.
• Need to shift our focus from ‘water resources development’ to ‘water resources management’ by restructuring and strengthening existing institutions for better service delivery and resource sustainability. Planning for big water resources projects should be interdisciplinary with all environmental, ecological and human concerns internalized and thereby assessing the impacts by a concrete statute.
• State government need to be persuaded to enact /implement the suggested legislation for ground water regulation, dam safety and flood plain zoning. The central government should also take the initiative for drawing up guidelines and initiating policy changes for private sector participation in the irrigation sector.
• This needs to be pursued more vigorously with genuine empowerment of WUAs. The objective should be to cover the entire command of all major and medium projects with WUAs.
• The pricing structure for water needs a serious review to reflect the scarcity value of water. Water charges must ensure that the revenues earned by state governments cover the operation and maintenance (O&M) costs of irrigation and water supply systems.
• Stress has to undoubtedly continue on developing water resources but more emphasis now has to be laid on sustainable management of water resources for optimal production along with the completion of on-going projects and their development. Efforts need to be concentrated on the quick completion of ongoing projects, especially the old ones, and proper maintenance of the created infrastructure. The assistance programmes of the central government need to be restructured to encourage this.

28th National Conference on Agricultural Marketing
113
• Over exploitation of ground water is leading to falling water levels in many areas especially, the hard rock areas. The systematic approach to the management of ground water requires a sustainable legal framework.
• For optimal utilisation of the water resources and to ensure sustainable development, the highest standards of scientific activity have to be taken up in the sector. With this objective, research and development (R&D) efforts have to be speeded up through sponsored research as well as through invited research proposals.
• Reuse and recycling of wastewater management for irrigation without a detrimental effect on crops and the soil is another aspect that needs to be tackled in a systematic manner, in addition to the management of poor quality of groundwater, which is fairly widespread in the country.
• The allocation of water to agriculture is facing a losing battle with the industrial, domestic, power and other sectors. At the same time, there is the compulsion of enhancing agricultural production in an eco-friendly sustainable manner with limited land and water resources. There is, therefore, an urgent need of the speedy transfer of resource-efficient technology to increase the productivity of water at field and the regional level.
• The success of agriculture in Gujarat in recent years has been founded on groundwater irrigation and therefore if Gujarat fails to manage its groundwater, its agrarian gains will evaporate. Therefore, Gujarat must do a major rethink on its water resources strategy. Rational planning and utilisation of water storage is critical to sustaining the tempo of agricultural growth Gujarat has generated.
• The groundwater-irrigated agriculture in North Gujarat, Saurashtra and Kachchh is steadily building up an accumulated groundwater deficit that imposes high energy costs on the state and is also rushing towards unsustainability.
• Gujarat must consider spreading its large reservoir storage on a much larger area as a strategy of securing its agricultural future. One way of doing this is to use a portion of the surface storage for “groundwater banking”, an idea which is well-tested in Australia and the US but whose time has come in Gujarat as well (Shah, et al., 2009).
References: ADB (2009), Water Resources Development in India: Critical Issues and Strategic Options, Asian
Development Bank, February 2009. Available at http://www.adb.org/Document s/Assessments /Water /IND/ Water-Assessment.pdf, Accessed on August 18, 2011).
CGWB (2002), Ground Water Year Book, 2001-02, Central Groundwater Water Board, West Central Region, Ahmedabad, Gujarat.
CGWB (2007), Ground Water Year Book, 2006-07, Central Groundwater Water Board, West Central Region, Ahmedabad, Gujarat.
CGWB (2011), Ground Water Year Book India, 2010-11, Central Groundwater Water Board, Faridabad (http://cgwb.gov.in/documents/Ground per cent20Water per cent20Year per cent20Book-2010-11.pdf).
CGWB (2013), Ground Water Year Book India, 2012-13 (as on 31st March 2009), Central Groundwater Water Board, Faridabad.
CGWB (2011a), Dynamic Groundwater Resources of India, Central Ground Water Board, Ministry of Water Resources, Government of India, Faridabad, November.

28th National Conference on Agricultural Marketing
114
CWC (1993, 2000 and 2004), Water and Related Statistics, Central Water Commission, Ministry of Water Resources, Government of India, New Delhi.
CWC (2000), Assessment of Availability and Requirement of Water for Diverse Uses in India, Standing Sub-Committee Report, Central Water Commission, Government of India, New Delhi.
Das, Keshab (2014), Drinking Water and Sanitation in Gujarat Crisis and Response, Chapter 16, Available at http://www.gidr.ac.in/files/pdf/Chapter per cent2016.pdf, accessed on January 26, 2014.
Gandhi Vasant P. and Vaibhav Bhamoriya (2011), “Rainwater Harvesting for Irrigation in India: Potential, Action, and Performance (Available at http://www.idfc.com/pdf/report/2011/Chp-8-Rainwater-Harvesting-for-Irrigation-in-India.pdf, Accessed on Feb 3, 2014).
GOG (2011), Annual Administrative Report Year 2009-10, Narmada Water Resources Water Supply and Kalpsar Department, Government of Gujarat.
GOG (2012), Annual Plan 2012–13, Minor Irrigation, Narmada, Water Resources, Water Supply & Kalpsar, Department Government of Gujarat, Gandhinagar, January (Available at http://guj-nwrws.gujarat.gov.in/downloads/final_minor_irrigation_e_12_13.pdf, Accessed on Feb 3, 2014).
GOG (2012a), State Agriculture Profile, (http://agri.gujarat.gov.in/informations /state_agri_profile.htm, Accessed on 25th September), Government of Gujarat.
GOG (2013), Socio-Economic Review of Gujarat State 2012-2013, Directorate of Economics and Statistics, Government of Gujarat, Gandhinagar, Budget Publication No.34, February, p.13.
GOG (2013a), Irrigation in Gujarat 2011-12, Directorate of Economics and Statistics, Government of Gujarat, Gandhinagar.
GOI (2006), Report of Sub-Committee on More Crop and Income per drop of Water Advisory Council on Artificial Recharge of Ground Water, Ministry of Water Resources, Government of India, October 2006
GOI (2012), Agricultural Statistics at a Glance 2012, Directorate of Economics and Statistics, Government of , Ministry of Agriculture, Government of India, November.
GOI (2012a), State of Indian Agriculture 2011-12, Department of Agriculture and Cooperation, Ministry of Agriculture, Government of India, New Delhi
GOI (2013), Economic Survey 2012-13, Economic Division, Department of Economic Affairs, Ministry of Finance, Government of India, February, p. 180.
Gulati, Ashok; Tushaar Shah and Ganga Shreedhar (2009), “Agriculture Performance in Gujarat since 2000: Can It be a Divadandi (Lighthouse) for other States?”, International Water Management Institute and International Food Policy Research Institute, May.
Gupta, Rajiv Kumar (2011), The Role of Water Technology in Development: A Case Study of Gujarat State, India, http://www.un.org/waterforlifedecade/green_economy_2011/pdf/session_5_technology_cases_india.pdf), UN Water International Conference, Zaragoza, October3-5.
Iyer, Ramaswamy R. (2011), “National Water Policy: An Alternative Daft for Consideration”, Economic and Political Weekly, Vol. XLVI, No. 26 and 27, June 25, pp. 201-214.
Jain R.C. (2012), “Role of Decentralized Rainwater Harvesting and Artificial Recharge in Reversal of Groundwater Depletion in the Arid and Semi-arid Regions of Gujarat, India”, Water Policy Research Highlight 49, International Water Management Institute (IWMI) (www.iwmi.org/iwmi-tata/apm2012).
Kalamkar (2011), “Water Resources Management in India”, Indian Economic Journal, Special Issue on Sustainable Growth and Transformation, December 2011, pp. 1-18.
Kumar, Rakesh; R. D. Singh and K. D. Sharma (2005), “Water Resources of India” Current Science, Vol. 89, No. 5, 10 September 2005 794-811.
Mehta, Niti (2012), “Performance of Crop Sector in Gujarat during High Growth Period: Some Explorations”, Agricultural Economics Research Review, Vol. 25, No. 2, July-December, pp. 195-204.
MOWR (2006), Report of the Working Group on Water Resources for the XI Five Year Plan (2007-2012), Ministry of Water Resources, Government of India, New Delhi, December.

28th National Conference on Agricultural Marketing
115
MOWR (2009), Report of the Ground Water Resource Estimation Committee, Ground Water Resource Estimation Methodology, Ministry of Water Resource, Govt. of India, New Delhi.
MOWR (2012), National Water Policy 2012, Ministry of Water Resources, Govt. of India (Available at http://wrmin.nic.in/writereaddata/linkimages/NWP2012Eng6495132651.pdf, Accessed on January 21, 2014)
MOWR (2013), Ground Water Level Scenario in India (Pre Monsoon -2013), Central Ground Water Board Ministry of Water Resources, Govt. of India (Available at http://www.cgwb.gov.in /documents/ GROUND per cent20WATER per cent20LEVEL per cent20SCENARIO_PreM, on_2013.pdf, Accessed on February 2, 2014).
Narayanamurthy, A. and S.S. Kalamkar (2011), Participatory Irrigation Management: Evolution and Impact, Gyan Publishing House, New Delhi, 2011.
Palanisami, K., M. Kadiri, K.R Kakumanu, and S. Raman (2011), “Spread and Economics of Micro-irrigation in India: Evidence from Nine States”, Economic and Political Weekly, Vol. 46, No. 26 and 27, pp. 81-87.
Parthasarathy, R. (2010), “Role of Irrigation in the Growth Story of Gujarat”, in Ravindra h. Dholkia and Samar K. Dutta (Ed.), High Growth Trajectory and Structural Changes in Gujarat Agriculture, Indian Institute of Management, Ahmedabad
Planning Commission (2007), Report of the Working Group on Natural Resources Management Eleventh Five Year Plan (2007-2012), Volume I: Synthesis, Planning Commission, Government of India, February 2007
Planning Commission (2008), Agriculture, Rural Development, Industry, Services, and Physical Infrastructure, Vol. III, Eleventh Five Year Plan 2007-012, Planning Commission, Government of India, New Delhi.
Planning Commission (2011), Mid-Term Appraisal Eleventh Five Year Plan 2007-2012, Planning Commission, Government of India, New Delhi.
Raju, K.V (2010), “Sustainable Water Use in India: A Way Forward”, in Agriculture, Food Security, and Rural Development, Asian Development Bank, Oxford University Press.
Ranade, Rahul and M. Dinesh Kumar (2004), “Narmada Water for Groundwater Recharge in North Gujarat: Conjunctive Management in Large Irrigation Projects”, Economic and Political Weekly, July 31, pp. 3510-3513.
Shah, Tushaar, Ashok Gulati, Hemant P., Ganga Shreedhar and R.C. Jain (2009), “Secret of Gujarat’s Agrarian Miracle after 2000”, Economic and Political Weekly, Vol. XLIV, No. 52, December 26, pp. 45-55.
Sivanappan, R (1994), “Prospects of Micro-Irrigation in India”, Irrigation and Drainage Systems, Vol. 8, No. 1, pp. 49-58.
Sivasubramaniyan K (1994), “Towards Revival of Small Water Bodies”, Book review on ‘User-Friendly Irrigation Designs’ by Nirmal Sengupta; Sage Publications, New Delhi, Economic and Political Weekly July 23,1994, pp. 1936-37.
Swain, Mrutyunjay; S. S. Kalamkar and Kalpana M. Kapadia (2012), Agriculture Profile for Gujarat, Research Report No. 146 , Agro-Economic Research Centre, Vallabh Vidyanagar.
UNICEF, FAO and SaciWATERs (2013), Water in India: Situation and Prospects, (Report available at http://www.unicef.org/india/Final_Report.pdf- Accessed on January 21, 2014).
Websites visited: http://guj-nwrws.gujarat.gov.in/downloads/water_related_issues.pdf, Accessed on January 25, 2014. http://wrmin.nic.in/index1.asp?linkid=151&langid=1, Accessed on February 5, 2014 http://water.columbia.edu/research-projects/india/india-water-stress-index/ http://pib.nic.in/newsite/PrintRelease.aspx, Accessed on January 28, 2014 http://www.un.org/waterforlifedecade/green_economy_2011/pdf/session_5_technology_cases_india.p
df, Accessed on February 6, 2014. www.mowr.gov.in; http://cgwb.gov.in; www.gidr.ac.in

28th National Conference on Agricultural Marketing
116
Annexure I: Salient Features of Agro Climatic Zones of Gujarat State
Zone Climate Districts Covered Rainfall (mm)
Major Crops Soil
South Gujarat (Heavy Rain Area.)
Semi-arid to dry sub-humid
Navsari, Dang, Valsad and Valod, Vyara, songadh and Mahuva taluks of Surat.
1500 and
more
Rice, Sorghum, Ragi, Kodra, Seasamum, Pigeonpea, Groundnut,Cotton, Sugarcane, Chillies, Wheat, Gram
Deep black with few patches of coastal alluvial, laterite and medium black
South Gujarat
Semi-arid to dry sub-humid
Surat and Amod, Ankleshwar, Broach, Dekdopada, Honsot, Jhagadia, Nanded, Sagbara and Valia talukas of Bharuch.
1000-1500
Rice, Wheat, Gram, Perlmillets,Sorghum, Maize, Kodra, Ragi, Pigeonpea, groundnut, Sesamum, Castor, Cotton, Sugarcane, Chillies,
Deep black clayey
Middle Gujarat
Semi-arid
Panchmahals, Baroda and Anand, Balasinor, Borsad, Kapadvanj, Kheda, Matar, Ahmedabad, Nadiad, Petlad and Thasara and taluks of Kheda.
800-1000
Rice, Wheat, Gram, Perlmillets,Sorghum, Maize, Kodra, Ragi, Pigeonpea, groundnut, Sesamum, Castor, Cotton, Sugarcane, Potato, Rapeseed & Mustard.
Deep black, medium black to loamy sand
North Gujarat
Arid to semi-arid
Sabarkantha, Gandhinagar, Dehgam, Daskroi, Sanand talukas of Ahmedabad, Deesa, Dhenera, Palanpur, Dandta, Wadgam taluks of Banaskantha and Chanasma, Kadi, Kalol, Kheralu, Mehsana, Patan, Sidhpur, Visnagar, Vijapur taluks and Mehsana.
625-875
Rice, Wheat, Gram, Perlmillets,Sorghum, Maize, groundnut, Sesamum, Castor, Cotton, Sugarcane, Cumin, Rapeseed & Mustard.
Sandy loam to sandy
Bhal & Coastal Area
Dry sub-humid
Bhavnagar (Vallabhipur, Bhavnagar talukas), Ahmedabad (Dholka, Dhanduka talukas), and Vagra, Jambusa talukas of Bharuch.
625-1000
Rice, Pearl millets. Medium black, poorly drained and saline
South Saurashtra
Dry sub-humid
Junagadh, Ghodha, Talaja, Mahava taloukas of Bhavnagar Kodinar, Rajula and Jafrabad talukas of Amerli and Dhoraji, Jetpur, Upleta talukas of Rajkot.
625-750
Rice, Maize, Sugarcane Wheat, Gram Pearl millets ,Sorghum, Groundnut, Seasamum,Cotton, Pulses, rapeseed & mustard
Shallow medium black calcareous
North Saurashtra
Dry sub-humid
Jamnagar, Rajkot, Chotila, Limdi, Lakhtar, Muli, Sayla, Wadhwan talukas of Surendranagar and Gadheda, Umrala, Botad, Kundla, Dihor, Garidhar, Palitana talukas of Bhavnagar and Amreli, Babra, Lathi, Lalia, Kunkavav, Khamba, Dhari taluks of Amreli.
400-700
Pearlmillets, Sorghum, Groundnut, Seasamum, Castor, Cotton, Pulses.
Shallow medium black
North West Zone
Arid to semi-arid
Kutch, Rajkot, Malia Halvad, Dhrangdhra, Dasada taluks of Surendranagar, Sami and Harij taluks of Mahsana, Santhalpur, Radhanpur, Kankrej, Deodar, Vav, Tharad taluks of Banaskantha and Viramgam taluka of Ahmedabad.
250 Rice, Wheat, Gram, Perlmillets,Sorghum, Maize, Pigeon pea, groundnut, Sesamum, Castor, Cotton, Rapeseed & Mustard , barley.
Sandy and saline
Source: Directorate of Economics and Statistics, Department of Agriculture and Cooperation, Govt. of Gujarat, Gandhinagar

28th National Conference on Agricultural Marketing
117
Annexure II: Growth in Irrigation Potential and Utilisation in Gujarat State: 1992-93 to 2011-12
Sr No
Year
Total of Major and Medium Irrigation
Total of Minor Irrigation including
private wells
Total of Major, Medium & Minor
Irrigation
per cent Indicate Increase / Decrease (-) over Previous Year Irrigation
Overall
Medium, & Minor Irrigation Major & Medium Irri Minor Irrigation P U P U P U P U P U P U
1 1992-93 12.69 10.48 21.98 18.05 34.67 28.53 2 1993-94 12.90 11.14 22.02 18.07 34.92 29.21 1.65 6.3 0.18 0.11 0.72 2.38 3 1994-95 13.17 11.49 22.1 18.14 35.27 29.63 2.09 3.14 0.36 0.39 1.00 1.44 4 1995-96 13.32 11.70 22.21 18.29 35.53 29.99 1.14 1.83 0.5 0.83 0.74 1.21 5 1996-97 13.47 11.90 22.35 18.43 35.82 30.33 1.13 1.71 0.63 0.77 0.82 1.13 6 1997-98 13.65 12.11 22.47 18.53 36.12 30.64 1.34 1.76 0.54 0.54 0.84 1.02 7 1998-99 13.76 12.35 22.61 18.65 36.37 31.00 0.81 1.98 0.62 0.65 0.69 1.17 8 1999-00 13.90 12.46 22.73 18.75 36.63 31.21 1.02 0.89 0.53 0.54 0.71 0.68 9 2000-01 13.98 12.75 23.98 20.97 37.96 33.72 0.58 2.33 5.5 11.84 3.63 8.04
10 2001-02 14.04 12.87 24.94 23.92 38.98 36.79 0.43 0.94 4 14.07 2.69 9.1 11 2002-03 14.52 13.18 25.51 24.46 40.03 37.64 3.42 2.41 2.29 2.26 2.69 2.31 12 2003-04 15.97 13.86 26.55 24.99 42.52 38.85 9.99 5.16 4.08 2.17 6.22 3.21 13 2004-05 16.86 14.32 27.06 25.5 43.92 39.82 5.57 3.32 1.92 2.04 3.29 2.5 14 2005-06 17.82 14.85 27.8 26.35 45.63 41.2 5.69 3.7 2.77 3.33 3.87 3.47 15 2006-07 18.54 15.06 26.95 26.56 45.49 41.62 4.04 1.41 -3.06 0.81 -0.28 1.02 16 2007-08 19.58 15.09 27.38 27 46.96 42.09 5.61 0.2 1.6 1.66 3.23 1.13 17 2008-09 20.47 15.12 27.83 27.04 48.3 42.16 4.55 0.2 1.64 0.15 2.85 0.17 18 2009-10 20.92 15.38 29.24 27.81 50.16 43.19 2.2 1.72 5.07 2.85 3.85 2.44 19 2010-11 21.37 15.49 29.34 27.87 50.71 43.36 2.15 0.72 0.34 0.22 1.1 0.39 20 2011-12 22.07 14.9 29.37 27.87 51.44 42.77 3.28 -3.81 0.1 0 1.44 -1.36
Notes: P- Potential and U- Utilisation Source: GOG (2013a). Table III: Ground Water Resources Availability, Utilization and Stage of Development Gujarat
Sl. No.
District Annual replenishable Ground water Resource Natural Discharge During
Non Monsoon Period
Monsoon Season Non-Monsoon Season Total Recharge from
Rainfall Recharge from Other Sources
Recharge from Rainfall
Recharge from Other Sources
1 2 3 4 5 6 7 8 1 Ahmedabad 42855 9201 0 6344 58400 3183 2 Amreli 53311 11937 0 10395 75643 4390 3 Anand 36140 20410 0 22777 79327 5034 4 Banaskantha 75245 10429 0 14779 100452 7702 5 Bharuch 27267 2442 0 5872 35582 1779 6 Bhavnagar 59601 18823 0 11176 89601 4480 7 Dang 7279 769 0 148 8197 410 8 Dohad 23648 4940 0 4832 33419 1671 9 Gandhinagar 36170 4142 0 2761 43073 2154
10 Jamnagar 69388 13718 0 15797 98903 4945 11 Junagarh 108495 15514 0 16805 140814 8367 12 Kachchh 57305 14760 0 10957 83023 4426 13 Kheda 45152 18769 0 19792 83713 4532 14 Mahesana 67996 7963 0 10537 86496 5537 15 Narmada 15434 1707 0 4733 21874 1324 16 Navsari 19699 9360 0 17835 46893 2345 17 Panchamahal 38192 10648 0 16317 65157 3258 18 Patan 17698 2678 0 4051 24428 1882 19 Porbandar 13670 2137 0 1633 17440 1189 20 Rajkot 95766 24925 0 21920 142611 7415 21 Sabarkantha 79300 11717 0 23175 114192 5710 22 Surat 34638 30486 0 46970 112094 8653 23 Surendranagar 50109 4347 0 5720 60175 3296 24 Tapi 27153 6269 0 18074 51496 4636 25 Vadodara 91518 12340 0 22598 126456 6323 26 Valsad 27697 5611 0 9771 43080 2969
State Total (ham) 1E+06 276042 0 345769 1842539 107610 State Total (bcm) 12.21 2.76 0 3.46 18.43 1.08
Source: CGWB (2011), Ground Water Year Book 2010-11 (http://cgwb.gov.in/documents/Ground per cent20Water per cent20Year per cent20Book-2010-11.pdf).

28th National Conference on Agricultural Marketing
118
Table IV: Ground Water Resources Availability, Utilization and Stage of Development Gujarat
Sl. No.
District Net Ground Water
Availability
Annual Ground Water Draft Projected demand for
Domestic and Industrial uses
upto 2025
Net Ground Water Availability for
Future Irrigation Use
Stage of ground Water
Development ( per cent)
Irrigation Domestic & Industrial Water
Supply
Total
1 2 9 10 11 12 13 14 15 1 Ahmedabad 55216 49236 6851 56087 9597 6527 102 2 Amreli 71253 46242 2523 48765 3532 21479 68 3 Anand 74293 36300 4904 41204 6875 31118 55 4 Banaskantha 92749 121408 5451 126859 7638 4068 137 5 Bharuch 33803 17056 1947 19003 2729 14017 56 6 Bhavnagar 85121 49885 5394 55279 7561 27675 65 7 Dang 7787 742 541 1283 758 6287 16 8 Dohad 31748 12517 4205 16722 5547 13685 53 9 Gandhinagar 40920 64534 3038 67572 4257 0 165
10 Jamnagar 93958 57402 4305 61707 6033 30523 66 11 Junagarh 132447 85963 6573 92536 9203 37281 70 12 Kachchh 78597 67518 4058 71576 5694 9788 91 13 Kheda 79181 44546 5610 50156 7862 26773 63 14 Mahesana 80959 114465 5321 119786 7455 78 148 15 Narmada 20549 6465 1488 7953 2085 12000 39 16 Navsari 44549 23496 2224 25720 3117 17936 58 17 Panchamahal 61899 25735 5355 31090 7007 29157 50 18 Patan 22545 32396 1779 34175 2495 0 152 19 Porbandar 16251 13096 1099 14195 1618 2611 87 20 Rajkot 135196 86797 7448 94245 10344 38056 70 21 Sabarkantha 108482 80484 5385 85869 7738 20261 79 22 Surat 103441 35801 5977 41778 8369 59271 40 23 Surendranagar 56879 34027 2574 36601 3605 19247 64 24 Tapi 46861 9412 1337 10749 1824 35625 23 25 Vadodara 120133 64200 7541 71741 10566 45367 60 26 Valsad 40111 13664 2552 16216 3578 22869 40
State Total (ham) 1734928 1193387 105480 1298867 147087 531699 75
State Total (bcm)
17.35 11.93 1.05 12.99 1.47 5.32 75
Source: CGWB (2011), Ground Water Year Book 2010-11 (http://cgwb.gov.in/documents/Ground per cent20Water per cent20Year per cent20Book-2010-11.pdf).

28th National Conference on Agricultural Marketing
119
Oilseeds Economy of Gujarat: Growth Determinants and Challenges
Mrutyunjay Swain♠
1. Introduction Oilseeds sector has played a prominent role in agricultural development in India. Oilseeds are important next only to foodgrains in terms of area, production and value in the country. There has been a six times increase in oilseeds production during the period of 1950–2011 under predominantly rainfed (72%) agro-ecological conditions, which is even higher than the production increase in total foodgrains during the corresponding period (Hegde, 2009). Though growth in oilseeds area and production at national level has been impressive, a huge demand-supply gap in oilseeds and vegetable oils prevails in the country (GOI, 2013). Since there is limited scope to bring additional area exclusively under oilseeds as the demand for land for other purposes and for producing other remunerative crops will continue to rise due to population increase and rising living standards, it is crucial to search for newer approaches to expand their cultivation under different farming situations.
A wide range of oilseed crops are grown in different agro-climatic regions of
India. Among the oilseeds, groundnut which was the most important crop in triennium ending (TE) 1998-99 in the country has lost its prime position to soybean in TE 2008-09 (Sharma, 2012). Soybean is largely grown in Madhya Pradesh, Maharashtra and Rajasthan, accounting for about 95 per cent of total production in the country. Groundnut, the second most important oilseed, is mainly grown in Gujarat, Andhra Pradesh, Tamil Nadu, Rajasthan, Karnataka and Maharashtra. Gujarat, Andhra Pradesh, Tamil Nadu and Karnataka together account for 77 per cent of the area and almost 75 per cent of the production of groundnut in India (Mehrotra, 2011).
Oilseeds area and production in Gujarat state constitute about 10.8 per cent
of area and 14.5 per cent of production, respectively in India (GOI, 2013). Oilseeds are usually seen as the primary cash crop in the state where the diverse agro-ecological conditions are favourable for growing these crops. A wide range of oilseed crops are grown in different agro-climatic regions of the state. Among the oilseeds, groundnut, castor and sesamum are the major crops grown in the state. The state was the largest producer of groundnut and second largest producer of sesamum in the country in 2010-11. The area and production of groundnut in the state constituted about 30.9 per cent and 37.1 per cent share respectively in India. The state is the India’s largest producer of castor. The productivity of castor in the state is the highest not only in India but also in the world. Though the state ranks first in area and production of groundnut in India, the average productivity is relatively low as groundnut is mostly grown under rainfed conditions. Groundnut is primarily grown on the coastal belt of Saurashtra. The unirrigated dry lands of Saurashtra are so poor in fertility that except groundnut and inferior cerials, bajra and jowar, no other major
♠ Sr. Research Officer/Assistant Professor (SS), Agro-Economic Research Centre (Ministry of Agriculture, Govt. of India, New Delhi), S. P. University, Vallabh Vidyanagar 388120 (email- [email protected]).

28th National Conference on Agricultural Marketing
120
food or cash crops can be grown profitably. Groundnut cultivation in summer season is gaining popularity in the state because of high productivity under assured irrigation.
There are some factors those positively contributed to the success stories in
Gujarat. Completion of Sardar Sarovar Project on a war footing basis, consolidating the gains from the check dam program, expediting the spread of micro irrigation have helped in further diversification towards high value crops like oilseeds in the state (Dholakia, 2010). Better adoption of technology in agriculture has generated a positive impact in the state through increase in the yield per hectare. The irrigated area as a percentage of the total area under oilseeds also increased significantly during last three decades(Swain et al, 2012). Furthermore, the use of fertilizer, plant protection and agronomic practices has considerably increased during last couple of decades that has helped in increasing oilseeds production in the state.
The state has increased the oilseeds production mainly through increase in
yield since a long time. Further increase in yield and area under oilseeds, reducing the production risks, increase in irrigation coverage and water use efficiency, stability in input prices and timely supply of quality inputs in required quantity seem to play a critical role in further development of oilseeds sector in the state. Further expansion in area under oilseeds is possible through more adoption of oilseeds as inter crops and replacement of low remunerative crops. The replacement of low remunerative crops is largely dependent on the increase in irrigation coverage and irrigation efficiency. Near about 42.1 per cent of net sown area and 44.3 per cent of gross cropped area (GCA) was irrigated during 2009-10. However, only 21.5 per cent of total area under oilseeds was irrigated in Gujarat during 2003-04 (GOG, 2008). The irrigated area under groundnut was only 7.5 per cent during the corresponding year in the state.
The growth performance of oilseeds in the state has been prone to various
kinds of risk over time and across the agro-climate regions because of the erratic rainfall behaviour and periodic occurrence of drought. Several biotic, abiotic, technological, institutional and socio-economic constraints affects the realisation of the yield potential of crops which are needed to be addressed. In this context, the present study attempts to analyze the performance and potential of oilseeds sector in Gujarat and identify major problems or constraints facing the sector in the state.
2. Data and Methodology Primary and Secondary Data The secondary data on district-wise area, production, yield of major crops/crop groups, major inputs used, irrigated area under oilseeds, farm-harvest prices of selected oilseeds and competing crops and annual rainfall were analysed to examine the trends and pattern of growth of different edible oilseeds over time and across districts. In order to assess the relative role of various factors in determining the profitability and the acreage allocation between the main oilseeds and competing crops and to identify the major constraints in edible oilseed production in the state,

28th National Conference on Agricultural Marketing
121
primary data from households growing oilseeds in the selected districts were collected and analyzed. Sampling Design The present study was undertaken to generate better understanding of the specific problems and prospects of oilseeds cultivation in the Gujarat with a special focus on groundnut. The multistate, purposive sampling method was used to select the districts, blocks and farm households. At first stage, all districts growing groundnut in the state were categorized into four groups (see Table 1) such as high area and high yield (HH), high area and low yield (HL), low area and high yield (LH), and low area and low yield (LL). Since HH, HL and LH categories of districts have the potential for further increase in production of groundnut, it was decided to select at least one district each from these three categories for household survey. Accordingly, Junagadh, Rajkot and Porbandar were selected from Gujarat as HH, HL and LH category of districts respectively for the detailed study. Table 1: Criteria for Selection of Study Districts (Groundnut)
Area Yield
High Low High High area - High yield (HH) High area – Low yield (HL)
(Junagarh) (Rajkot)
Low Low area – High yield (LH) Low are – Low yield (LL) (Porbandar)
Source: Sharma, V. P. (2012) At second stage, about 25 villages from 7 blocks (Vishavadar,Una and
Manavadar of Junagarh district; Porbandar and Kutiyana of Porbandar district; Gondal and Jasdan of Rajkot district) were covered to get the desired number of sample households (250) representing different farm categories (Marginal 0-1 ha, Small 1-2 ha, Medium 2-4 ha; Large >4 ha). Among the sample farmers, 15 were marginal farmers (6%), 66 were small farmers (26.4%), 87 were medium farmers (34.8%) and 82 were large farmers (32.8%). The reference year for the household survey was 2011-12.
Data Analysis Methods and Tools The simple statistical methods like averages, percentage, coefficient of variation and compound annual growth rate (CAGR) are used for the analysis of secondary data. The CAGR was estimated by fitting a semi-log trend equation which was estimated by applying Ordinary Least Square (OLS) method and the t-test was performed to test the significance of the growth parameters. Decomposition of Output Growth of Oilseeds To measure the relative contribution of area and yield towards the total output change with respect of individual crop, the exercise on decomposition analysis was performed for major oilseed (groundnut), competing crop (cotton) and total oilseeds.

28th National Conference on Agricultural Marketing
122
Several researchers have used this model to study growth performance of the crops (Bhatnagar and Nandal, 1994; Singh, G. and S. R. Asokan (2000), Kalamkar, 2003). The analysis helped in identifying the sources of growth in output by breaking the change in production into three effects i.e., area effect, yield effect and interaction effect. (Pn-P0) = A0 (Yn-Y0) + Y0 (An - A0) + (An - A0) (Yn-Y0) ----------------- (1) ∆P = A0 ∆Y + Y0 ∆A + ∆A ∆Y ---------------------------------------------- (2) Where, P, A and Y stand for production, area and yield respectively. The subscript ‘n’ stands for the current year and subscript ‘0’ stands for the base year. The equation-2 states that, Change in production = Yield effect + Area effect + Interaction effect
The decomposition analysis was carried out mainly for three periods, i.e.,
Period I (TE1983-84 to TE 1993-94) Period II (TE1993-94 to TE 2009-10) and overall period of TE1983-84 to TE 2009-10. During Period I, the expansion of area under oilseeds was encouraged by introduction of Technology Mission on Oilseeds (TMO) in 1986 by Government of India. During Period II, the effects of trade liberalization was examined since the change in trade policy had considerably affected the domestic production and consumption pattern of major oilseeds in the country. For better understanding of the different sources of growth in output, analysis was also carried out on growth in input use during different time periods.
Log-Linear Models for Estimating Oilseeds Production Function and Acreage Allocation Response Function The attempt has been made to examine the effects of variation in major agricultural inputs on crop yield with the help of a log-linear regression model which was estimated for the main oilseed crop (groundnut) and the main competing crop (cotton) separately. The regression model was stated with a log-linear functional form due to the fact that the agricultural production function is usually assumed to follow a Cobb-Douglas type that requires a log-linear transformation for estimation of input coefficients. Thus, the estimable equation is as follows:
i 1 i 2 i 3 i 4 i 5 i
6 i 7 i 8 i i
LnY Ln A Ln AR Ln LS Ln SC Ln Ln
Ln Ln Ln
FC PC
HL ML IC e
β β β β β
β β β
= + + + + + +
+ + +
Where, Crop yield (Y) was the dependent variable and the area under the
crop (AR), Size of operational holdings (LS), Seed cost (SC), Cost of fertilizer and manures (FC), Cost of pesticide and insecticide (FC), Cost of human labour including family labour (HL), machine charges (ML), Irrigation charges (IC) were the explanatory variables.
As far as the acreage allocation between main oilseed crop and competing
crop by the sample farmers is concerned, another similar log-linear regression model was fitted. Some major factors that actually influence the farmers’ decision to allocate the available cultivable area for different crops have been taken into account as explanatory variables and the area allocated for main oilseed groundnut (At) has

28th National Conference on Agricultural Marketing
123
been considered as the dependant variable. Some price and non-price factors selected as the explanatory variables are the size of land holdings (LSt), one year lagged area of groundnut (At-1), lagged yield of groundnut (Yt-1), lagged price of groundnut (Pt-1), lagged area of cotton (ACt-1), lagged yield of cotton (YCt-1) and the lagged price of cotton (PCt-1). Thus the fitted model is as follows:
t 1 t 2 t-1 3 t-1 4 t-1 5 t-1 6 t-1 7 t-1 i LnA Ln LS Ln A Ln Y Ln P Ln AC Ln YC Ln PC eα β β β β β β β= + + + + + + + +
Identifying & Prioritizing Major Constraints for Growth in Oilseeds production Appropriate analytical techniques were used to identify and prioritize major constraints facing oilseeds production in the state. The responses of the sample farmers on the extent of severity of various constraints faced by them have been ranked by using ordinal scores from 4 to 1 (severe =4, Moderate = 3, minor = 2, not important =1). The results are displayed in the form of composite index called Oilseed Constraint Index (OCI) which has been constructed as a weighted average as presented below.
The Oilseed Constraint Index (OCI) = ( )11/ C
n
i iin W
=∑
Where, Ci = the number of farmers in a farmer category responded in favour of a particular
constraint with a particular rank score or weight (severe =4, Moderate = 3, minor = 2, not important =1). Wi = the weight attached to ith constraint takes the value ranging from 1 to 4. This reflects the severity of impacts of the concerned constraint for the sample farmers. n = the total number of farmers in a farmer category. 3. Results and Discussion
3.1 Spatial and Temporal Growth in Area, Production and Yield of Major Oilseeds Though the growth in area under some major oilseeds has been poor in Gujarat, the growth in production and yield of major oilseeds has been significant over the last three decades. Though the growth in production and yield of major oilseeds has been satisfactory since 1950s, significant level of variability in these variables has been observed over the years (Figure 1). The average annual area under total oilseeds has increased from 1545.9 thousand ha in 1950s to 2596.9 thousand ha in 1980s, that has declined to 2862.7 thousand ha in 2000s (Table 2). On the other hand, the annual production and yield of total oilseeds in the state have increased from 773.1 thousand tonnes and 500.1 kg/ha, respectively during 1950s to 3686.2 thousand tonnes and 1287.7 kg/ha, respectively during 2000s. Thus the oilseed production and yield have increased by 4.8 times and 2.6 times respectively during last six decades. On the other hand, the production and yield of all agricultural crops taken together have increased by 2.5 times and 2.3 times respectively during the corresponding period.

28th National Conference on Agricultural Marketing
Figure 2. Trends in Area, Yield and Production of Total Oilseeds in Gujarat
0.0
1000.0
2000.0
3000.0
4000.0
5000.0
6000.019
51-5
219
53-5
419
55-5
619
57-5
819
59-6
019
61-6
2
Table 2: Trends in average area, production, and yield of Oilseeds in the Gujarat State
A/P/Y 1951-52 to 1960-61
1961-1970
Mean CAGR Mean
Area (000 hectares) 1545.9 7.5 2207.3
(27.8) (9.5)Production
(’000 tonnes)
773.1 22.4 1329.0
(52.2) (26.6)Yield
(kg/ha) 500.1 13.9 602.1
(33.6) (28.6)
Area (000 hectares) 8494.5 1.7 9121.9
(4.8) (1.9)Production
(’000 tonnes)
3882.0 11.8 6192.0
(27.0) (19.8)Yield
(kg/ha) 457.0 9.9 678.8
(23.9) (18.0)Notes: (1) Figures in parentheses are the CV in per cent. (2) CAGR implies compound annual growth rate. (3) A, P and Y standsfor area, production and yield respectively.Source: GoG (2011).
National Conference on Agricultural Marketing
124
. Trends in Area, Yield and Production of Total Oilseeds in Gujarat (1951
1961
-62
1963
-64
1965
-66
1967
-68
1969
-70
1971
-72
1973
-74
1975
-76
1977
-78
1979
-80
1981
-82
1983
-84
1985
-86
1987
-88
1989
-90
1991
-92
1993
-94
1995
-96
1997
-98
1999
-00
2001
-02
2003
-04
Total Oilseeds AreaTotal Oilseeds ProductionTotal Oilseeds Yield
Table 2: Trends in average area, production, and yield of Oilseeds in the Gujarat State
62 to 1970-71
1971-72 to 1980-81
1981-82 to 1990-91
1991-92 to 2000-01
CAGR Mean CAGR Mean CAGR Mean CAGR
Total Oilseeds
-2.2 2286.7 1.9 2596.9 0.4 2894.5 -0.5
(9.5) (10.9) (11.8) (2.7)
3.0 1749.5 0.8 2126.9 -3.4 2746.0 0.0
(26.6) (39.5) (42.9) (38.1)
5.3 765.1 -1.1 819.0 -3.8 948.7 0.5
(28.6) (36.7) (39.7) (37.5) Total Agriculture Crops
0.4 9267.4 0.1 9140.1 -1.0 9122.7 -1.5
(1.9) (5.1) (9.7) (5.8)
5.4 8307.7 0.7 9920.1 -1.3 12497.8 -1.6 17747.9
(19.8) (22.9) (25.9) (25.4)
5.0 896.4 0.6 1085.3 -0.3 1370.0 -0.1
(18.0) (20.3) (21.2) (21.7) Notes: (1) Figures in parentheses are the CV in per cent. (2) CAGR implies compound annual growth rate. (3) A, P and Y stands
production and yield respectively.
(1951-52 to 2009-10)
0
500
1000
1500
2000
2500
2003
-04
2005
-06
2007
-08
2009
-10
2001-02 to 2009-10
1951-52 to 2009-10
Mean CAGR Mean CAGR
2862.7 -0.6 2391.1 1.5
(3.4) (22.1)
3686.2 -2.3 2041.0 4.8
(32.5) (60.0)
1287.7 -1.7 853.6 3.2
(30.7) (43.4)
9072.2 1.0 9035.8 0.3
(7.4) (6.6)
17747.9 5.1 9622.5 4.1
(25.8) (53.1)
1956.3 4.0 1064.9 3.8
(20.0) (50.4) Notes: (1) Figures in parentheses are the CV in per cent. (2) CAGR implies compound annual growth rate. (3) A, P and Y stands
Oils
eeds
Yie
ld (
Kg/
ha

28th National Conference on Agricultural Marketing
125
The district level analysis of area under oilseeds reveals that Rajkot (16.6%), Junagadh (14.8%), Jamnagar (13.8%), Amreli (12.0%), Bhavnagar (9.3%) and Banaskantha (8.4%) accounted for major share of total area under oilseeds in the state during TE 1993-94 (Table 3). The share of some of these districts has declined marginally during TE 2009-10. The share of Rajkot, Amreli and Bhavnagar has decreased to 14.5 per cent, 9.4 per cent and 5.0 per cent of total area under oilseeds during TE 2009-10 respectively. Some of the districts where the share of area has increased during TE 2009-10 over TE 1993-94 were Junagadh (14.9%), Jamnagar (14.5%), and Banaskantha (9.8%).
Table 3: Changing shares of area and production of oilseeds in major oilsees producing districts in the state: TE 1993-94 and TE 2009-10
( Area in 000' hectare and Production in 000' tonne) Districts TE 1993-94 TE 2009-10
Area Production Area Production
Rajkot 488.9 (16.6) 172.7 (8.0) 407.1 (14.5) 463.2 (11.9)
Junagadh 434.8 (14.8) 300.9 (13.9) 417.0 (14.9) 643.0 (16.6)
Jamnagar 404.9 (13.8) 125.9 (5.8) 407.5 (14.5) 684.6 (17.6)
Amreli 351.9 (12.0) 186.3 (8.6) 262.9 (9.4) 207.8 (5.4)
Bhavnagar 272.3 (9.3) 227.9 (10.5) 141.1 (5.0) 149.3 (3.8)
Banaskantha 246.5 (8.4) 311.2 (14.4) 274.7 (9.8) 441.1 (11.4)
Mehsana 236.0 (8.0) 302.9 (14.0) 110.9 (4.0) 177.8 (4.6)
Kutch 55.1 (1.9) 149.2 (6.9) 119.6 (6.3) 247.4 (6.4)
Sabarkantha 96.2 (3.3) 139.8 (6.5) 127.2 (4.5) 166.7 (4.3)
Surendarnagar 84.3 (2.9) 42.6 (2.0) 121.7 (4.3) 129.5 (3.3)
Patan 0.0 (0.0) 0.0 (0.0) 95.2 (3.4) 132.1 (3.4)
Porbandar 0.0 (0.0) 0.0 (0.0) 89.5 (3.2) 176.9 (4.6)
Gujarat State 2936.9 (100.0) 2165.6 (100.0) 2803.9 (100.0) 3880.4 (100.0) Note: Figures in parentheses show the district's percentage share in state total area under oilseeds and state total production. Sources: GoG (2003), various earlier issues; GoG (2011).
As far as the oilseeds production in the state is concerned, four out of six
districts having the major share of oilseed acreage are among the six major districts producing oilseeds during both the reference periods with some changes in their ranks. They were Banaskantha (14.4%), Junagadh (13.9%), Bhavnagar (10.5%) and Rajkot (8.0%) during TE 1993-94; and Jamnagar (17.6%), Junagadh (16.6%), Rajkot (11.9%) and Banaskantha (11.4%) during TE 2009-10.
The major districts growing Kharif oilseeds were Rajkot, Junagadh, Jamnagar,
and Amreli during both the reference periods, viz., TE 1993-94 and TE 2009-10. The share of Bhavnagar in total Kharif oilseeds acreage has declined from 10.6 per cent in TE 1993-94 to 5.6 per cent in TE 2009-10; whereas the share of Kutch in total Kharif oilseeds acreage has increased from 4.3 per cent in TE 1993-94 to 6.6 per cent in TE 2009-10. Thus there have been minor changes in share of the districts with respect to Kharif oilseeds acreage between the two reference periods. The major districts growing Rabi oilseeds during TE 1993-94 were Banaskantha (42.8%), Mehsana (40.1%), Sabarkantha (3.8%) and Ahmedabad (2.5%). There have not

28th National Conference on Agricultural Marketing
126
been any major changes in the share of the districts with respect to Rabi oilseeds acreage between two reference periods.
The analysis on the change in performance of individual oilseed crops in
terms of acreage and production between the two reference periods (TE1993-94 and TE 2009-10) revealed that Rajkot, Junagadh, Jamnagar and Amreli were the major districts cultivating groundnut during both the reference periods; while Banaskantha, Mehsana, Sabarkantha, Kutch and Patan emerged as the major districts producing rapeseed-mustard and castor in the state. Surendranagar, Bhavnagar, Amreli, Kachhh, Jamnagar and Rajkot were found to be the major sesamum growing districts of the state.
Irrigation provision plays a critical role in expansion and stability in production
and productivity of oilseeds. Expansion of irrigation facilities would also help in area expansion under various oilseeds in the state. However, only 22.2 per cent of total oilseeds area was irrigated in 2002-03 (GOG 2008). Banaskantha, Mehsana, Kutch, Patan, Sabarkantha and Gandhinagar were the major districts where more irrigated oilseeds were grown during both Kharif and Rabi seasons. The shares of other districts were very less ranging from 0.1 per cent to 3.9 per cent of state irrigated oilseeds acreage. It is highly desirable that irrigation facilities be expanded for further growth in oilseeds acreage and production in the state. 3.2 Growth Trends in Area, Production and Yield of Major Oilseed (Groundnut) vis-à-vis Competing Crop (Cotton) Groundnut was found to be the major oilseed crop while the cotton was found to be its major competing crop in Gujarat in TE 2009-10. The share of groundnut in total oilseeds area in the state was about 66.4 per cent in the corresponding period. As presented in Table 4, the growth in area under groundnut was considerably high during 1950s (10.3%). However, it has exhibited negative trend thereafter (except 1970s). The annual growth in area under groundnut was -2.7 per cent during 1960s that has marginally increased to 1.0 per cent during 1970s and thereafter continued to exhibit negative trend. In absolute term, the annual average area under groundnut has increased from 1245.9 thousand ha during 1950s to 2252.8 thousand ha during 1970s and thereafter continued to fall to 1879.2 thousand ha during 1990s. There has been some marginal increase in area during 2000s. The average annual production and yield of groundnut has significantly increased from 703.4 thousand tonnes and 564.6 kg/ha during 1950s to 2550.7 thousand tonnes and 1327.9 kg/ha during 2000s (see Table 7).
Particularly, the growth in production and yield of groundnut has been quite
impressive during 1980s and 2000s. However, the extent of variability in its area, production and yield has also been quite large in terms of the level of fluctuations in annual growth rates and magnitude of coefficient of variation (CV). On the other hand, the growth in area and production of the main competing crop (cotton) has been better (Figures 2 and 3). Not only the production and yield of groundnut were less, the variability in production and yield of groundnut was much larger than that of cotton. The CV of area and production of groundnut during the reference periods was higher than that of cotton.

28th National Conference on Agricultural Marketing
127
Table 4: Trends in average area, production, and yield of major oilseed (groundnut) vis-a-vis major competing crop (cotton) in the state
A/P/Y 1951-52 to 1960-61
1961-62 to 1970-71
1971-72 to 1980-81
1981-82 to 1990-91
1991-92 to 2000-01
2001-02 to 2009-10
1951-52 to 2009-10
Mean CAGR Mean CAGR Mean CAGR Mean CAGR Mean CAGR Mean CAGR Mean CAGR
Groundnut (main oilseed crop)
Area (000 hectares)
1245.9 10.3 1987.4 -2.7 2252.8 1.0 1928.8 -1.9 1879.2 -1.4 1920.8 -0.4 1868.3 1.4
(38.0) (10.9) (44.4) (12.8) (4.4) (3.8) (29.5)
Production (’000 tonnes)
703.4 25.3 1259.9 2.6 1515.9 -0.9 1435.7 -8.4 1559.1 -0.4 2550.7 -5.0 1486.4 4.2
(57.0) (26.8) (40.9) (55.0) (55.2) (41.0) (58.5)
Yield (kg/ha)
564.6 13.6 633.9 5.4 672.9 -1.8 744.4 -6.6 829.7 1.0 1327.9 -4.6 795.6 2.8
(33.5) (29.3) (49.0) (54.0) (56.3) (39.8) (53.5)
Cotton (main competing crop)
Area (000 hectares)
1561.0 4.3 1733.2 0.3 1887.8 -3.7 1257.6 -4.1 1443.8 3.7 2061.6 4.4 1650.6 1.2
(18.2) (3.0) (10.4) (18.5) (13.9) (16.8) (21.2)
Production (’000 tonnes)
1000.0 14.7 1590.4 3.8 1929.7 -5.5 1597.5 -3.1 2348.8 -0.4 5599.6 20.2 2289.2 5.0
(33.4) (10.5) (19.2) (32.9) (38.5) (45.6) (79.2)
Yield (kg/ha)
640.6 10.0 917.6 3.5 1022.2 -1.8 1270.3 1.0 1626.8 -3.9 2716.1 15.1 1386.8 3.8
(24.1) (10.3) (14.4) (26.6) (30.8) (35.4) (54.7)
Note: Figures in parentheses are the CV in per cent.
Sources: GoG (2009) and earlier issues; GoG (2011).
Over the last three decades, some districts like Rajkot, Junagadh, Jamnagar,
Amreli and Bhavnagar have dominated in terms of area and production of groundnut. These five districts accounted for about 90 per cent of total groundnut area of the state. However, the share of these major districts has marginally declined over the years. Some districts whose share in area under groundnut has remained somewhat stagnant are Mehsana, Banaskantha, Kheda, Vadodara and Bharuch. The districts with higher area under groundnut such as Rajkot, Junagadh, Jamnagar, Amreli and Bhavnagar have dominated in terms of their share in production of groundnut in the state. The district’s share in state’s total production of groundnut in Amreli, Bhavnagar and Kutch has declined from 14.5 per cent, 18.0 per cent and 9.6 per cent in TE 1993-94 to 7.7 per cent, 5.3 per cent and 4.7 per cent in TE 2009-10, respectively.
The variability in area and production of oilseeds is largely linked to availability
of irrigation facilities. The share of irrigated area under groundnut to total area under groundnut in the state has marginally increased from 8.3 per cent in TE 1993-94 to 10.5 per cent in TE 2007-08. On the other hand, the share of irrigated area under groundnut to total irrigated area of the state has declined from 5.3 per cent in TE 1993-94 to 3.8 per cent in TE 2007-08. There is a need to increase the irrigated groundnut acreage so as to enhance the groundnut production and productivity in the state.

3.3 Sources of Growth in Oilseeds Production in the State The relative contribution of area and yield towards the total change in production of total oilseeds, major oilseed (groundnut) and the major competing crop (cotton) was assessed with the help of decomposition analysis. Among the three effects i.e., area effect, yield effect and interaction effect, the yield effect was found to contribute more to the change in output during all reference periods and overall period of TE 1983-84 to TE 2009-10. The same was also found true for the study districts except Rajkot during Period I (TE 1983-84 to TE1993-94). The expansion of area under oilseeds was the major source of growth in oilseeds production in Rajkot during Period I
Figure 2: Growth in Area (‘000 ha), Yield (Kg/ha) and Production (‘000 tonnes) of Groundnut in Gujarat (1951-52 to 2009-10)
0
1000
2000
3000
4000
5000
600019
51-5
2
1953
-54
1955
-56
1957
-58
1959
-60
1961
-62
1963
-64
1965
-66
1967
-68
1969
-70
1971
-72
1973
-74
1975
-76
1977
-78
1979
-80
1981
-82
1983
-84
1985
-86
1987
-88
1989
-90
1991
-92
1993
-94
1995
-96
1997
-98
1999
-00
2001
-02
2003
-04
2005
-06
2007
-08
2009
-10
Groundnut Area
Groundnut Production
Groundnut Yield
Figure 3. Growth in Area (000 ha), Yield (Kg/ha) and Production (000 tonnes) of Cotton in Gujarat (1951-52 to 2009-10)
0
1000
2000
3000
4000
5000
6000
7000
8000
9000
1951
-52
1953
-54
1955
-56
1957
-58
1959
-60
1961
-62
1963
-64
1965
-66
1967
-68
1969
-70
1971
-72
1973
-74
1975
-76
1977
-78
1979
-80
1981
-82
1983
-84
1985
-86
1987
-88
1989
-90
1991
-92
1993
-94
1995
-96
1997
-98
1999
-00
2001
-02
2003
-04
2005
-06
2007
-08
2009
-10
Cotton Area
Cotton Production
Cotton Yield

28th National Conference on Agricultural Marketing
129
whereas the yield effects played major role during Period II and overall period in the district. The yield effects also played a dominant role for the main oilseed (groundnut) throughout the reference periods in the state (Table 5). About 110.8 per cent of growth in total oilseeds in Gujarat was due to yield effect during Period II (TE 1993-94 to TE 2009-10). As far as the main oilseed (groundnut) of the state is concerned, the yield effect accounted for 110.0 per cent to total output growth during the corresponding period. However, the area effect was dominant during the Period I (703.3%) and interaction effect played a dominant role during the Period II (35.9%) for the main competing crop (cotton) in the state. Table 5: Decomposition of output growth of main oilseed crop (groundnut) and main competing crop (cotton) in the selected districts of Gujarat
State/ Districts
Crops Effects Period I Period II Period III
(TE 1983-84 to TE1993-94)
(TE 1993-94 to TE2009-2010)
(TE 1983-84 to TE2009-2010)
Gujarat Total oilseeds Area -83.93 -5.79 4.12
Yield 171.19 110.81 93.47
Interaction 12.74 -5.02 2.41
Groundnut (main oilseed)
Area 25.97 -4.31 -28.80
Yield 81.07 109.99 148.73
Interaction -7.03 -5.68 -19.93
Cotton (main competing
crop)
Area 703.27 29.15 19.89
Yield -728.40 34.94 47.69
Interaction 125.13 35.92 32.41
Junagadh Total oilseeds Area 19.46 -3.59 -28.49
Yield 86.53 108.00 143.93
Interaction -5.99 -4.41 -15.44
Groundnut (main oilseed)
Area 28.15 0.24 -13.23
Yield 78.25 99.47 122.95
Interaction -6.40 0.30 -9.72
Cotton (main competing
crop)
Area 29.28 24.86 20.16
Yield 61.84 44.49 41.34
Interaction 8.88 30.64 38.50
Rajkot Total oilseeds Area 100.34 -9.94 -2.06
Yield -0.29 132.03 106.63
Interaction -0.04 -22.09 -4.57
Groundnut (main oilseed)
Area -26.51 -7.13 -6.77
Yield 117.96 124.75 115.94
Interaction 8.55 -17.62 -9.16
Cotton (main competing
crop)
Area -248.68 34.68 17.87
Yield 480.40 22.44 38.87
Interaction -131.72 42.89 43.27
Note: District level data on Porbandar for TE 1983-84 and TE 1993-94 was not available.
Sources: GoG (2009) and earlier issues; GoG (2011).

28th National Conference on Agricultural Marketing
130
The logical sequence of arguments brings us to know about the factors responsible for significant increase in yield during this period. The better nutrient supply through application of adequate fertilizers and pesticides, availability of quality seeds, increased input use efficiency and availability of better technological and institutional infrastructure have played a crucial role in enhancement of productivity of oilseeds and other cash crops during the corresponding period. The growth in fertilizer use and gross irrigated area was satisfactory in the state whereas the growth in irrigated area under total oilseeds was not satisfactory since the annual growth in irrigated oilseeds area was -7.3 per cent during a period of TE 1993-94 to TE 2009-10. The fertilizer use has increased in the state by annual growth of 5.1 per cent during the corresponding period.
The growth in annual prices of major oilseeds has been impressive in Gujarat.
The per quintal farm harvest price (FHP) of groundnut and sesamum, which are the major Kharif oilseeds in the state, has increased from Rs 1360 and Rs 2352 in TE1998-99 to Rs 2318 and Rs 5272 in TE 2009-10, respectively. Similarly, the per quintal price of major Rabi oilseed (rapeseed-mustard) has increased from Rs 1226 in TE 1998-99 to Rs 2222 in TE 2009-10. It was good to find that the FHP of all major oilseeds was much more than their MSPs in the state. However, the extent of variability in price of groundnut was somewhat lower than that of cotton both spatially and temporally.
4. Findings from Field Survey Data 4.1 Socio-Economic Characteristics of Sample Households The primary level data analysis was conducted on 250 sample households. The average household (HH) size for entire sample was of 6.3 persons. About 68.4 per cent sample households belonged to general caste category, 30.8 per cent HHs belonged to OBC category and remaining 0.8 per cent HHs belonged to SC/ST category. The average off-farm income per sample household was Rs 43207 per annum. Near about 96.8 per cent members had crop farming as the main source of livelihood. The average number of years of schooling was 7.8 years for the sample households. The net sown area (NSA) and gross cropped area (GCA) of a sample household was found to be 3.75 ha and 4.81 ha, respectively which imply that the cropping intensity for the sample farmers was 128.3 per cent. The size of operational holding in the case of small, medium and large farmers was 1.62 ha, 3.20 ha, and 6.59 ha, respectively. As regards the land tenancy, only about 6.4 per cent of sample HHs were having leased in land constituting about 3.6 per cent of total operated area. The term of lease for about 68.8 per cent of HHs with leased-in lands was share cropping and for remaining 31.3 per cent HHs, it was fixed rent in cash. It was good to see that the area under protective irrigation was 81.9 per cent of total operated area. As far as different sources of irrigation are concerned, as high as 83.1 per cent of total operated area of sample farmers was irrigated by open well or

28th National Conference on Agricultural Marketing
131
dug wells followed by tube wells (14.6%), usually energized by electricity and/or diesel. Canal and tank and other source of irrigation had minor presence in the study area as their joint contribution was about 2.2 per cent in the case of our sample farmers. 4.2 Pattern of Production, Retention and Marketed Surplus of Oilseeds The major oilseeds cultivated by our sample households were groundnut, castor and sesamum. The main competing crop for groundnut was found to be cotton which was grown by 62% of selected farmers (124 out of 200 sample farm households). The sample farmers growing groundnut produced 39.9 quintals per household on an average, out of which 38.2 quintals of groundnut was sold at the average price of Rs 3518 per quintal (Table 6). About 1.8 quintals of groundnut (4.5%) was retained per household for household consumption and for use as seed.
Table 6: Total Oilseeds Production, Retention and Sale Pattern
(Quintals) Kharif Oilseed I (Groundnut) Kharif Oilseed 2 (Castor) Production Retention Sold Price
(Rs/q) No. of
farmers Produc
tion Retent
ion Sold Price
(Rs/q) No. of
farmers Marginal 12.7 0.5 12.2 3290 15 0.0 0.0 0.0 0 0 Small 18.3 0.9 17.4 3559 66 28.0 0.0 28.0 2875 2 Medium 35.0 1.9 33.1 3522 87 31.7 0.0 31.7 3083 3 Large 67.5 2.5 65.1 3524 82 40.1 0.0 40.1 3082 7 All farms 39.9 1.8 38.2 3518 250 36.0 0.0 36.0 3048 12
Kharif Oilseed 3 (Sesamum) Major competitive crop (Cotton) Production Retention Sold Price
(Rs/q) No. of
farmers Produc
tion Retenti
on Sold Price
(Rs/q) No. of
farmers Marginal 0.0 0.0 0.0 0 0 10.2 0.0 10.2 3775 2 Small 20.0 0.0 20.0 6000 1 16.7 0.0 16.7 4037 25 Medium 10.0 0.0 10.0 6000 1 30.9 0.0 30.9 4091 47 Large 7.0 0.0 7.0 6000 1 73.9 0.0 73.9 4131 50 All farms 12.3 0.0 12.3 6000 3 45.0 0.0 45.0 4091 124
Source: Field survey As far as the case of main competing crop (cotton) is concerned, 45.0 quintals
was produced per household, all of which was sold at the average price of Rs 4091 per quintal. No significant variation in prices of oilseeds and competing crops was observed across farm size classes. In the case of groundnut, the highest selling price was realized by the small farmers (Rs 3559 per quintal) followed by the large farmers (Rs3524). In case of main competing crop (cotton), the highest selling price was realized by large farmer (Rs 4131 per quintal), followed by the medium farmer (Rs 4091 per quintal). The lowest price was realized by marginal farmer (Rs 3775 per quintal). The output of some oilseeds like castor and sesamum and competing crop cotton was entirely sold by the farmers. All these farmers relied on certified seeds purchased from the markets for growing the same crops in next season.

28th National Conference on Agricultural Marketing
132
4.3 Comparative Economics of Cultivation of Major Oilseed vis-à-vis Competing Crop It was observed that the cultivation of the major oilseed crop (groundnut) was less profitable over the major competing crop (cotton) in the study areas. The per hectare gross value of main product and by-product of groundnut for sample farmers was estimated to be Rs 54533 and Rs 6242, respectively. The total variable cost of cultivation of the crop including material cost and labour cost was Rs 37932.6 per ha. Thus, the net income derived from cultivation of groundnut was Rs 22842 per ha (see Table 7). On the other hand, the net income derived from the cultivation of cotton was Rs 54455 per ha which was more than double of net income generated from cultivation of main oilseed groundnut (Rs 22842). That is why, the share of cotton in the GCA is gradually increasing and that of groundnut is declining.
Table 7: Cost of Cultivation &Profitability of Major Oilseeds and Competing Crops
(Rs/ha) Cost Items Main Oilseed (Groundnut)
Marginal Small Medium Large All 1. Total operational costs(TC) 46483 39848 38098 34651 37933 Yield (quintals) 16.2 14.8 15.4 15.7 15.5 Price(Rs/quintal) 3290 3559 3522 3524 3518 2. Value of main-product (Rs) 53298 52675 54233 55297 54533
3. Value of by-product (Rs) 5657 5983 6776 6002 6242
Net Income (2+3) – (1) 12472 18809 22911 26649 22842
Cost of production (TC/q) 2869 2692 2474 2208 2447 Total cost of cultivation (TC/ha) 46483 39848 38098 34651 37933 Cost Items Major Competing Crop (Cotton) 1. Total operational costs(TC) 54735 52037 42943 34003 41414 Yield (quintals) 25.5 25.7 23.0 23.7 23.4 Price(Rs/quintal) 3775 4037 4091 4131 4088 2. Value of main-product 96263 103751 94092 97893 95838 3. Value of by-product 0 50 0 51 31 Net income (2+3) – (1) 41527 51764 51149 63941 54455 Cost of production (TC/q) 2146 2025 1867 1435 1766 Total cost of cultivation (TC/ha) 54735 52037 42943 34003 41414 Source: Field survey
Furthermore, the cost of production per ha of cotton was much lower (Rs 1766)
compared to that of groundnut (Rs 2447). Among the cost components, labour charges accounted for the largest share of the total operational costs for both main oilseed crop and major competing crop. For cultivation of groundnut, total human labour and seed cost accounted for 34.8 per cent and 25.4 per cent of total operational cost, respectively. Fertilizer consumption accounted for 11.1 per cent of total operational cost of cultivation of groundnut. The overall pattern of cost of cultivation for the competing crop (cotton) was similar. However, the fertilizer and manure cost was the second highest cost component in the case of cotton. Total human labour and fertilizer consumption accounted for 48.5 per cent and 20.4 per cent, respectively of total operational cost of cultivation of cotton. The per hectare irrigation charges and seed cost for cultivation of cotton was 4.6 per cent and 10.0 per cent of total operational cost, respectively.
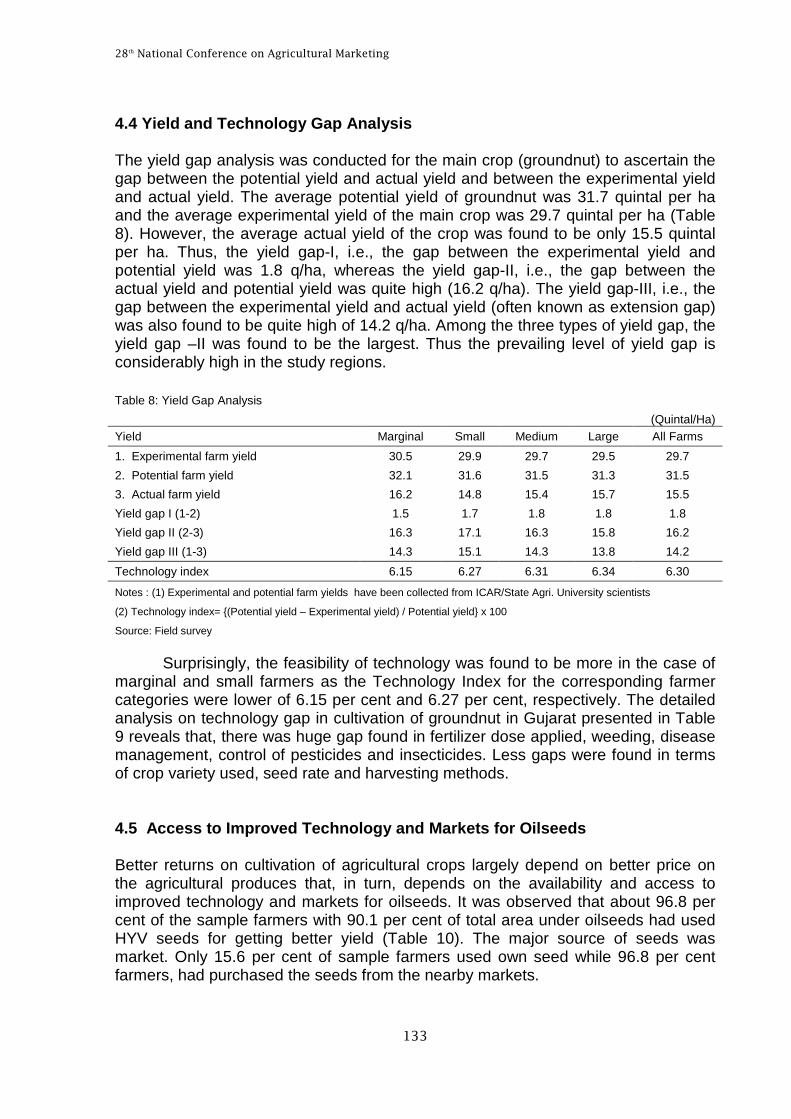
28th National Conference on Agricultural Marketing
133
4.4 Yield and Technology Gap Analysis The yield gap analysis was conducted for the main crop (groundnut) to ascertain the gap between the potential yield and actual yield and between the experimental yield and actual yield. The average potential yield of groundnut was 31.7 quintal per ha and the average experimental yield of the main crop was 29.7 quintal per ha (Table 8). However, the average actual yield of the crop was found to be only 15.5 quintal per ha. Thus, the yield gap-I, i.e., the gap between the experimental yield and potential yield was 1.8 q/ha, whereas the yield gap-II, i.e., the gap between the actual yield and potential yield was quite high (16.2 q/ha). The yield gap-III, i.e., the gap between the experimental yield and actual yield (often known as extension gap) was also found to be quite high of 14.2 q/ha. Among the three types of yield gap, the yield gap –II was found to be the largest. Thus the prevailing level of yield gap is considerably high in the study regions. Table 8: Yield Gap Analysis
(Quintal/Ha) Yield Marginal Small Medium Large All Farms
1. Experimental farm yield 30.5 29.9 29.7 29.5 29.7
2. Potential farm yield 32.1 31.6 31.5 31.3 31.5
3. Actual farm yield 16.2 14.8 15.4 15.7 15.5
Yield gap I (1-2) 1.5 1.7 1.8 1.8 1.8
Yield gap II (2-3) 16.3 17.1 16.3 15.8 16.2
Yield gap III (1-3) 14.3 15.1 14.3 13.8 14.2
Technology index 6.15 6.27 6.31 6.34 6.30
Notes : (1) Experimental and potential farm yields have been collected from ICAR/State Agri. University scientists
(2) Technology index= {(Potential yield – Experimental yield) / Potential yield} x 100
Source: Field survey
Surprisingly, the feasibility of technology was found to be more in the case of
marginal and small farmers as the Technology Index for the corresponding farmer categories were lower of 6.15 per cent and 6.27 per cent, respectively. The detailed analysis on technology gap in cultivation of groundnut in Gujarat presented in Table 9 reveals that, there was huge gap found in fertilizer dose applied, weeding, disease management, control of pesticides and insecticides. Less gaps were found in terms of crop variety used, seed rate and harvesting methods.
4.5 Access to Improved Technology and Markets for Oilseeds Better returns on cultivation of agricultural crops largely depend on better price on the agricultural produces that, in turn, depends on the availability and access to improved technology and markets for oilseeds. It was observed that about 96.8 per cent of the sample farmers with 90.1 per cent of total area under oilseeds had used HYV seeds for getting better yield (Table 10). The major source of seeds was market. Only 15.6 per cent of sample farmers used own seed while 96.8 per cent farmers, had purchased the seeds from the nearby markets.

28th National Conference on Agricultural Marketing
134
Table 9: Technology Gap (TG) in Groundnut Cultivation Prevailing at Farmers' Level
Sr. No. Parameter Farmers' practices Recommended technology Gap analysis
1 Varieties GG-20, GG-37, GG-13, Deshi GG-2, GG-10, GG-11, GG-20, GG-37, GG-13
Variety gap is almost nil
2 Land preparation 2-3 ploughing before days of sowing
1 and 2 ploughing, followed by 2 or 3 harrowing
Gap is about 20 per cent.
3 Seed rate 131 kg/ha 110-125 kg/ha Gap is low
4 Fertilizers dose 1. 115 kg/ha DAP; 2. FYM: 1.1 tonnes per ha; 3. Liquid S: 1 litre/bigha in 225 litre water; 4. Ammonium sulphate: 10 kg/bigha;
N: 12.5-25, P2O5: 40-50, K2O:0 kg/ha; DAP: 56 kg/ha
Over dose of fertelizer
5 Weeding Hand picking or khurpi for removal of weed
Application of herbicide along with one or two interculture operation
High level of gap exists.
6 Disease Management
Used chemical fungicide for root rot, collar rot, tikka disease
Deep poughing (8-10 inches) seed treatment with carbendazin 0.1 @ 2g/kg seed, formulations of Trichderma harzianum or T. viridi @ 4-10 g/kg seed before sowing, application of neem or casor cake @ 250-500 kg/ha at the time of sowing
50 per cent gap with reference to recommended technology
7 Insect-pest Thrips, jassids, aphid manage by chemicla insecticides
Cowpea as trap crop reduces aphid and jassids infestation, application of malathion 0.05 or dimethoate (0.03%) or phosphamidon (0.03%) or methyl-odemeton (0.03%) or quinalphos (0.05%) or monocrotophos (0.04%). Use of predator
50 per cent gap with reference to recommended technology
8 Harvesting 10 September -10 October 10 September -10 October No gap
9 Yield 1590 kg/ha; widely varied from as low as 590 kg/ha in Rajkot to as high as 2358 kg/ha in Junagadh
Research station yield =2970 kg/ha, Potential yield = 3170 kg/ha
Wide gaps are observed.
Source: Jha, et al. (2012); Field survey (2012)
Table 10: Access to Improved Technology and Markets (% households agreed)
Marginal Small Medium Large All Farms Use of HYV Yes 100.0 90.9 98.9 98.8 96.8 No 0.0 9.1 1.1 1.2 3.2 Area under HYV (% to total area under oilseeds)
96.7 87.2 91.2 89.9 90.1
Source of seed Own 0.0 13.6 13.8 22.0 15.6 Market purchased 100.0 90.9 98.9 98.8 96.8 Use of recommended doses of fertilizers Yes 100.0 86.4 75.9 53.7 72.8 No 0.0 0.0 11.5 30.5 14.0 Don’t know 0.0 13.6 12.6 15.9 13.2 Awareness about MSP Yes 100.0 86.4 86.2 78.0 84.4 No 0.0 13.6 13.8 22.0 15.6 MSP for 2011-12 (Rs/q) 2700 2700 2700 2700 2700 Price realization ≥MSP 93.3 98.5 93.1 98.8 96.4 <MSP 6.7 1.5 6.9 1.2 3.6 Marketing problems Yes 73.3 48.5 56.3 51.2 52.8 No 26.7 51.5 43.7 48.8 47.2 Source: Field survey.

28th National Conference on Agricultural Marketing
135
Most of the sample farmers were aware about the minimum support price (MSP) of their crops that helped them in getting and bargaining for the right price of their produce. It is noteworthy that about 84.4 per cent of the sample farmers have received the price of groundnut which was higher than the prevailing MSP. It was found that the majority of farmers (72.8%) used more than recommended doses of fertilizers and pesticides. About 52.8 per cent of sample farmers stated that they faced marketing problems for selling groundnut.
4.5 Marketing Pattern of Oilseeds About 65.2 per cent of farmers cultivating groundnut have sold their output to village traders, not directly at Agricultural Produce Marketing Committee (APMC) or market yard (mandi) (Table 11). Since the distance from APMC market ward was considerably high and transportation cost was also high, they preferred to sell their output to village traders. Processing mills and commission agents were next best options for the sample farmers to sell their output. Some of the farmers (4.8% of all sample farmers) including 13.3 per cent of marginal farmers could sell their output to Government agency, i.e., National Agricultural Cooperatives Marketing Federation of India Ltd (NAFED), that procured groundnut on the commercial basis. The average price received from various sources ranged from Rs 3250 per quintal to Rs 4750 per quintal. The average price received by the sample farmers from the commission agent was the lowest of Rs 3175 per quintal. The average price of groundnut received from processing mills was Rs 3771. A majority of farmers (65.2%) sold their output to local village traders that fetched a price of Rs 3560 per quintal for the farmers. Table 11 : Sale Pattern of Major Oilseeds (Groundnut)
Particulars Marginal Small Medium Large All Farms
Agency to whom sold (% share)
Local village trader 80.0 65.2 65.5 62.2 65.2
Processing mill 0.0 16.7 20.7 18.3 16.0
Government agency 13.3 4.5 1.1 7.3 4.8
Commission agent 13.3 9.0 13.8 11.0 11.2
Private company (contract arrangement) 0.0 1.5 2.3 1.2 1.6
Others 0.0 1.5 0.0 0.0 0.4
Price received (Rs/q)
Local village trader 3404 3616 3544 3569 3560
Processing mill 0 3809 3886 3637 3771
Government agency (NAFED) 3250 3250 3250 3250 3250
Commission agent 3000 3125 3252 3123 3175
Private company (contract arrangement) 0 4250 3875 3750 3938
Others 0 4750 0 0 4750
Average distance to sale point (km) 2.0 4.6 5.5 7.0 5.6
Source: Field survey

28th National Conference on Agricultural Marketing
136
The sale of main competing crop (cotton) of sample farmers exhibited slightly different pattern. Here the local village traders purchased slightly less output from the sample farmers whereas the Government agency, i.e., Cotton Corporation of India (CCI) purchased relatively more output from the farmers. About 12.9 per cent sample farmers sold their cotton output to Government agency at CCI outlets (Table 12). About 28.7 per cent of sample farmers sold the output to local village traders at the average price of Rs 4065 per quintal. As far as the prices of cotton from different market agencies are concerned, it may be noted that the Government agency i.e., CCI offered better price (Rs 4234 per quintal) than all other market agencies. CCI has very good presence in the cotton growing areas of the state, particularly in Saurashtra area that supplies best quality cotton.
The average distance travelled by the farmers to sell their produce was 5.6
km for groundnut and 9.4 km for cotton. The average distance travelled was lowest for the marginal farmers (2.0 km for groundnut sale) since most of them had sold their output to the local village traders.
Table 12: Sale Pattern of Cotton (Main Competing Crop)
Particulars Marginal Small Medium Large All Farms
No. of cotton cultivators 2 25 47 50 124
Agency to whom sold (% share)
Local village trader 100.0 60.0 36.2 34.0 41.1 Processing mill 0.0 8.0 29.8 34.0 26.6 Government agency 0.0 12.0 14.9 12.0 12.9 Commission agent 0.0 16.0 17.0 20.0 17.7 Private company (contract arrangement) 0.0 8.0 0.0 0.0 1.6
Others 0.0 4.0 0.0 0.0 0.8
Price Received (Rs/q)
Local village trader 3775 3985 4029 4204 4065
Processing mill 0 4200 4014 4025 4031
Government agency (CCI) 0 4000 4214 4375 4234
Commission agent 0 4188 4072 4038 4150
Private company (contract arrangement)
0 0 3975 0 3975
Others 0 4000 0 0 4000
Average distance to sale point (km) 0.0 4.0 11.0 11.0 9.4
Source: Field survey
4.7 Sources of Technology and Market Information The major sources of information on seeds were found to be local input market (89.2%), specialized organizations like ICAR/SAU/KVK (71.6%) and fellow farmers (60.8%). The major sources of information on extension services were found to be specialized organizations like ICAR/SAU/KVK (84.4%), input dealers (82.4%) and fellow farmers (62.0%). Input dealers, agricultural supervisors on behalf of Department of Agriculture and specialized organizations like ICAR/SAU/KVK have

28th National Conference on Agricultural Marketing
137
played a key role in the dissemination of required information to the needy farmers. Besides, print media and commission agents also transmitted some relevant information to the sample farmers in an effective manner.
4.8 Determinants of Oilseed Production and Acreage Allocation The relative contribution and significance of the major factors (such as area under the crop, seed cost, fertilizer cost, pesticide/insecticide cost, human labour cost, bullock labour cost, machine charges and irrigation charges) to change in yield of major oilseed and competing crop grown by the sample farmers was analyzed with the help of a log-linear regression model. Only the area under groundnut,size of land holding, irrigation charges and fertiliser and manure cost were found to significantly affect the groundnut yield (Table 13).
In the case of cotton which is the main competing crop grown in the state, the
fitted regression model was overall insignificant with very low value of R2 and F statistic. The constant term A in Cobb-Douglas Production Function that stands for other exogenous factors such as technological change, exposure to weather related risks such as dry spell, drought, and pest attack etc was found to significantly influence the yield of both groundnut and cotton. Among various inputs, only the seed cost is found to significantly but negatively influence the cotton productivity. The farmers have applied more seeds than the recommended doses of seeds in order to generate more output. However. It has resulted in decrease in cotton productivity.
Table 13: Description and Results of Estimation of Production Functions (Groundnut and Cotton)
Variables Description Main oilseed (groundnut) Main competing crop (cotton)
Coefficient t-value p-value
Coefficient t-value p-value
AR Area under crop (Ha) -0.405 *** -5.058 0.000 0.091 1.297 0.197
LS Size of land holdings (Ha)
0.478 *** -2.870 0.004 -0.057 -0.738 0.462
SC Seed cost (Rs) 0.125 3.348 0.001 -0.150 *** -2.711 0.008 FC Fertiliser and manure
cost (Rs) 0.299 ** 0.668 0.505 0.008 0.249 0.804
PC Insecticides/pesticides cost (Rs)
0.063 2.134 0.034 0.008 0.590 0.556
HL Total human labour cost (Rs)
0.791 *** 1.361 0.175 0.087 0.874 0.384
ML Total machine labour cost (Rs)
0.022 5.354 0.000 0.005 0.247 0.805
BL Total bullock labour cost (Rs)
0.018 0.714 0.476 -0.005 -0.528 0.599
IC Irrigation charges (Rs/Ha)
0.072 ** 0.812 0.418 0.028 * 2.685 0.008
A (Constant) -9.955 *** 3.561 0.000 3.182 *** 0.954 3.334 Dependant Variable (Y) Groundnut yield Cotton yield R2 0.427 0.141
F observed 16.143 2.074
No. of observations ‘N’ 250 124 Note: * 10% level of significance, **5% level of significance, ***1% level of significance Source: Computed from field survey data

28th National Conference on Agricultural Marketing
138
As far as the acreage allocation between the main oilseed crop (groundnut) and competing crop (cotton) by the sample farmers is concerned, another similar log-linear regression model was fitted. Some major factors that actually influenced the farmers’ decision to allocate the available cultivable area for different crops were taken into account as explanatory variables and the area allocated for main oilseed (groundnut) was considered as the dependant variable. Only the one year lagged area under groundnut (At-1) and the lagged yield of cotton (YCt-1) were found to have statistically significant influence on the area allocated for the main oilseed crop groundnut (Table 14). Among these variables, one year lagged area under groundnut positively influenced the area allocation for groundnut, whereas lagged yield of main competing crop cotton negatively influenced the area allocation for the main oilseed.
Table 14: Description and Results of Estimation of Short-Run Area Response Function for Groundnut Variables Description Main oilseed (Groundnut)
Coefficient t-value p-value LSt Size of land holdings (Ha) 0.2059 *** 3.907 0.000 At-1 Lagged area of groundnut (Ha) 0.8115 *** 18.936 0.000
Yt-1 Lagged yield of groundnut (Qtl/Ha) -0.03 -1.223 0.222
Pt-1 Lagged price of groundnut (Rs/Qtl.) 0.0193 0.213 0.831
ACt-1 Lagged area of cotton (Ha) 0.0031 0.097 0.923 YCt-1 Lagged yield of cotton (Qtl/Ha) -0.059 * -1.664 0.097 PCt-1 Lagged price of cotton (Rs/Qtl.) 0.0055 0.398 0.691
A (Constant) -0.185 -1.583 0.115
Dependant Variable (Y) Current area under groundnut (At) R2 0.9328 F observed 479.67 No. of observations ‘N’ 250
Note: * 10% level of significance, **5% level of significance, ***1% level of significance
Source: Computed from field survey data
4.9 Constraints in Cultivation of Oilseeds Among the major technological constraints, lack of irrigation facilities, incidence of diseases, incidence of insect pests and weed infestation were the major constraints faced by the sample farmers (Table 15). These factors have affected all farmers irrespective of their categories or land holding sizes. The incidence of diseases and pests and weed infestation have affected more to marginal and small farmers. The poor quality of soils has affected more to medium farmers. Among the agro-climatic factors, excessive rain during critical stages of crop growth and the risk of crop failure/yield variability due to biotic and abiotic stresses were found as major agro-climatic constraints faced by the sample farmers. Among economic and institutional constraints, high input costs, shortage of human labour, and wide variability in crop yield were found to be major ones. The Inadequate knowledge about disease and pest management, irregular supply of power/electricity, supply of poor quality inputs were also found to create difficulties for the sample farmers.

28th National Conference on Agricultural Marketing
139
Table 15: Major Constraints in Cultivation of Oilseed Crops
(Composite index value*)
Major Constraints Marginal Small Medium Large All Farms
Technological factors
Lack of irrigation facilities 3.07 2.96 2.80 2.79 2.86
Incidence of diseases 3.21 3.12 3.01 3.12 3.09
Incidence of insect pests 3.36 3.15 3.01 3.00 3.06
Agro-climatic factors
Excessive rains 3.93 3.54 3.47 3.38 3.48
Risk of crop failure/yield variability due to biotic & a biotic stresses 3.14 3.07 2.80 2.94 2.94
Economic factors
High-input cost (diesel, fertilizers, agrochemicals) 3.29 3.43 3.24 3.35 3.33
Shortage of human labor 3.29 2.76 2.98 3.02 2.95
Price risks - fear of glut leading to low price 2.64 2.22 2.49 2.35 2.38
Institutional factors
Poor quality of inputs 2.50 2.12 2.14 2.27 2.24
Lack/Poor extension services 2.71 2.28 2.08 2.11 2.08
Inadequate knowledge about disease and pest management 2.93 1.31 2.59 2.63 2.65
Irregular supply of power/electricity 3.14 2.70 2.74 2.82 2.79
Post-harvest, marketing and value-addition
Exploitation by market intermediaries 2.21 1.57 1.61 1.54 1.61
Lack of processing facilities in the area 2.50 1.69 1.75 1.79 1.79
Inadequate storage facilities 2.71 1.91 2.03 1.91 2.00
High transportation costs 2.71 2.60 2.57 2.54 2.58
Note: *Composite index will be constructed based on weights (severe =4, Moderate = 3, minor = 2, not important =1) and number of households in each category. The higher the composite vale, the higher the severity of constraints for the sample farmers.
Source: Field survey
4.10 Farmers’ Suggestions for Improving Production and Productivity of Oilseeds The larger proportion of the sample farmers suggested to take necessary measures for alleviating the major constraints through necessary policy instruments so as to increase the production and productivity of oilseeds in the state. About 14.8 per cent of sample farmers have suggested to reduce or to stabilize the prices of chemical fertilizers, seeds and other inputs. Since the prices of agricultural inputs are rising year after year, a good number of farmers have suggested that government should provide more subsidies on fertilizer, seeds and other inputs, particularly to marginal and small farmers. A good number of farmers have also suggested to cover more farmers under subsidized credit provisions and crop insurance. Near about 18.4 per cent sample farmers expressed that they needed better pesticides/plant protection chemicals for preventing or eradicating the crop diseases. Since irrigation water was inadequate, the area under Rabi crops and summer crops was very less in the study areas. So about 19.6 per cent of respondents have suggested to expand the irrigation facilities in their districts.

28th National Conference on Agricultural Marketing
140
Since the farmers normally used electric pump sets for lifting water, availability of electricity for reasonable duration is essential. About 13.2 per cent of sample farmers suggested that electricity should be made available on regular basis for longer duration and low voltage problem should be resolved. A large number of sample farmers faced the problems of crop damage by blue bull (Nilgai) and pigs. So the sample farmers expressed that they need assistance for fencing in the form of subsidies that will encourage them to build boundary walls/fences so as to protect their cultivated lands from these crop damaging animals. As far as the marketing of oilseeds is concerned, the market intermediaries/middlemen enjoyed a sizeable proportion of returns on groundnut and cotton. Thus, some farmers have suggested to devise policies to check the influence of market intermediaries.
5. Conclusions and Policy Implications Oilseeds production contributes significantly to agricultural prosperity in the state. Though the growth in area under major oilseeds has been more or less stagnated, the growth in production and yield of major oilseeds has been quite impressive. The yield effect was found to play a dominant role in increasing oilseeds production in the state. However, there are number of challenges facing the oilseed sector in the state. The constraints faced and suggestions made by the sample oilseeds farmers have been highlighted in the preceding section that specifically covered the issues related to the required provisions and facilities to be created by the government to lessen the difficulties of the oilseeds growers and to encourage them to cultivate more areas under oilseeds. If some of the suggestions of the sample farmers could be considered and implemented by the policy makers, that will surely help in further increase in area and production of oilseeds in the state. Besides the farmers’ suggestions, few more issues have been discussed in the following sections that may help the policy makers to devise the policy for further expansion in area under oilseeds and to increase the production and productivity of oilseeds in the state. 5.1 Scope for Expansion of Area under Oilseeds in the State From the analysis of relative contribution of area, yield and their interaction to change in production of total oilseeds in the selected districts of Gujarat, it was observed that the yield effect contributed more to the change in output during all reference periods and the overall period of TE 1983-84 to TE 2009-10. The area under oilseeds has not increased at the satisfactorily in the state so far because of enormous pressure on land use for other agricultural and industrial activities. Though the scope of expansion of area under oilseeds in recent years looks gloomy, emphasizing irrigation expansion, more efficient use of irrigation water, checking input prices at reasonable level and offering better marketing facilities would help in further increase in area under the oilseeds in the state.
The district level analysis reveals that 7 out of 26 districts (Junagadh,
Jamnagar, Rajkot, Amreli, Bhavanagar, Porbandar and Kutch) accounted for about 91.3 per cent of total oilseeds area of the state. So, there is possibility of increasing the area under oilseeds in other districts with very thin area under these crops. The oilseeds area can also be increased in the districts with low area but high productivity. Some of this type of districts are Tapi (where oilseeds area constitutes

28th National Conference on Agricultural Marketing
141
only 7.7% of GCA of the district with oilseeds yield of 2232 kg/ha, with 0.94% of state oilseeds area), Narmada (where oilseeds area constitutes only 2.1% of GCA of the district with oilseeds yield of 1882 kg/ha, and with 0.13% of state oilseeds area), Vadodara (0.94% of state oilseeds area, oilseeds area constituting 3.5 % of district GCA with yield of 1607 kg/ha), Panchmahals (0.23% of state oilseeds area, oilseeds area constituting 1.1% of district GCA with yield of 1429 kg/ha) and Surat (0.31% of state oilseeds area, oilseeds area constituting 2.0% of district GCA with yield of 1325 kg/ha). However, there is a need of further irrigation expansion along with subsidized and sufficient power supply for agriculture in these districts to encourage more farmers to adopt these high value crops. 5.2 Scope for Enhancing Oilseeds Productivity in the State Major avenue for increase in oilseed production in the State is expected to come through increase in yield levels of these crops. The possibility in productivity enhancement in oilseed crops is probably highest among any other group of crops in the state. The study found that there is a considerable yield gap in cultivation of selected oilseeds in the state. In the case of the main oilseed crop (groundnut), the yield gap-II, i.e., the gap between the actual yield and potential yield was found to be very high (16.2 q/ha). Thus, there is a huge scope for increasing the yield of oilseeds in major parts of the state.
There were some districts where the share of oilseeds area in GCA was considerably large but the yield levels of oilseeds were very low. Some of such districts were Rajkot (oilseeds area constituting 42.2% of district GCA with yield of only 406 kg/ha), Amreli (oilseeds area constituting 38.8% of district GCA with yield of only 187 kg/ha), Junagadh (oilseeds area constituting 45.1% of district GCA with yield of only 911 kg/ha), Bhavnagar (oilseeds area constituting 18.1% of district GCA with yield of only 585 kg/ha) and Surendranagar (oilseeds area constituting 13.4% of district GCA with yield of only 869 kg/ha). These are some of the prospective districts where the increase in yield levels should be emphasized in practice by the policy makers.
Since there is limited scope for increasing area under oilseeds, a combination of land saving technologies involving high yielding varieties and hybrids and efficient crop management and nutrient management strategies need to be adopted so as to increase the yield levels. The losses due to incidence of pests and diseases need to be minimized.
5.3 Future Strategies for Oilseeds Sector in the State As discussed in previous section, the expansion of area under oilseeds should be in focus in some parts of the state, while increase in yield level should be emphasized in some targeted regions of the state. As far as the area expansion in oilseed crops in the state is concerned, oilseed cultivation in rice fallows and non-traditional areas may be emphasized by the policy makers. Besides, incorporating oilseeds in intercropping sequence and inclusion of oilseeds as a component in crop diversification plans may help in further expansion of area under oilseeds in the state.

28th National Conference on Agricultural Marketing
142
The major thrust of strategies should be on enhancement of yield of oilseeds by effective technology transfers. The diverse sources of productivity enhancement such as improved agro-techniques and improvement in input use efficiency and effective technology dissemination are essential for further increase in yield of oilseed crops in the state. The suggested key strategies for the oilseed productivity improvement in the state are:
� Irrigation expansion through further expansion of canal command area and to
promote efficiency in water use through protective irrigation such as drip and sprinkler and other micro irrigation techniques
� Ensuring the timely availability of quality/certified seeds of improved varieties � Providing incentives to promote balanced crop nutrition � Supporting farmers to use more resource conservation technologies and
precision farming technologies � Providing incentives/subsidies for fencing so as to help farmers protect their
crop from crop damaging animals � Providing better extension services by hiring more extension personnel and
equipping them with necessary skill set through proper training. Removing the marketing constraints is crucial for encouraging the farmers to
adopt more oilseed crops in their crop allocation. For reducing the level of market constraint, some policy initiatives are essential. The major functional areas of policy backing are:
� Reducing the distress sale by limiting the influence of the market
intermediaries in deciding the farm harvest price actually offered to the farmers
� Effective market interventions for oilseeds and edible oils by increasing the volume of procurement by NAFED and CCI
� Creating necessary rural and marketing infrastructures such as processing units and market wards etc.
� Favourable trade policy The State Government has taken some useful measures for reducing the
market constraints in the state. However, there is a need of radical changes in the policy front to enable the traditional oilseeds processing sectors to increase their efficiency and capacity utilization. Implementation of decontrolling of traditional oilseeds processing from small scale sector would help in this direction. The effective market interventions like price support system, price signaling etc. have to be strengthened. There is an urgent need to invent and popularise oilseed varieties, which require less water and have more productivity and at the same time are affordable to farmers. Acknowledgements: This is a part of the project report carried out for the Ministry of Agriculture, Govt. of India. The author acknowledges with thanks the support of the Ministry and Coordinator of the project (Dr. Vijay Paul Sharma, Centre for Management of Agriculture, IIM Ahmedabad). Author wishes to thank Dr. S. S. Kalamkar (Director, AERC) and Dr. Mahesh Pathak (Hon. Adviser, AERC) and anonymous referee for their useful comments on the earlier draft of the paper. Author thanks the research team comprising of Mrs. Kalpana K. Kapadia (Research Associate), Mr. Manish Kant Ojha (Research Associate), Mr. Natwar Chauhan (Research Fellow) and Mr. Himanshu Parmer (Research Fellow) for their assistance in data collection, compilation and tabulation. Usual disclaimers applies.

28th National Conference on Agricultural Marketing
143
References Bhatnagar, S. and D.S. Nandal (1994), ‘Growth in Wheat in Haryana’, Agricultural Situation
in India, 49 (1): 75-78. Dholakia, R.H. (2010), Has Agriculture in Gujarat Shifted to High Growth Path? in Dholakia,
R.H. and S.K. Dutta (eds), ‘High Growth Trajectory and Structural Changes in Gujarat Agriculture’, Centre for Management in Agriculture, IIM Ahmedabad, pp.1-19
GOI (2013), ‘State of Indian Agriculture 2012-13’, Department of Agriculture and Cooperation, Ministry of Agriculture, Government of India.
GOG (2003), Annual Season & Crop Reports, 2002-03, Krishi Bhavan, Government of Gujarat, Gandhinagar.
GOG, 2008, Irrigation in Gujarat 2008-09, Directorate of Economics and Statistics, Government of Gujarat, Gandhinagar.
GOG (2009), Agriculture Statistics of Gujarat, 2009-10, Directorate of Economics and Statistics, Government of Gujarat, Gandhinagar.
GOG (2011), Gujarat Agriculture Statistics at a Glance 2010-11, Directorate of Economics and Statistics, Government of Gujarat
Hegde, D. M., Can India Achieve Self-Reliance in Vegetable Oils? In National Symposium on Vegetable Oils Scenario: Approaches to Meet the Growing Demands, 29–31 January 2009, pp. 1–15.
Jha, G. K., S. Pal, V.C. Mathur, G. Bisaria, P. Anbukkani, R.R. Barman and S. K. Dubey (2012), Edible Oilseeds Supply and Demand Scenarios in India: Implications for Policy, Division of Agricultural Economics, IARI, New Delhi.
Kalamkar, S. S. (2003), ‘Agricultural Development and Sources of Output Growth in Maharashtra State’, Artha Vijnana, 45 (3-4):297-324.
Mehrotra, Nirupam (2011), Commodity Specific Study: Groundnut, National Bank for Agriculture and Rural Development, Mumbai.
Sharma, V. P. (2012), ‘Problems and Prospects of Oilseeds and Oil Palm Production in India’, A Proposal Paper, Indian Institute of Management, Ahmedabad.
Singh, G. and S. R. Asokan (2000), ‘Competitiveness of Indian Oilseeds under WTO’, Artha Vijnana, 42(3): 240-249.
Swain, M., S .S. Kalamkar and Kalpana Kapadia (2012), ‘State of Gujarat Agriculture 2011-12’, AERC Report No. 146, Agro-Economic Research Centre, S. P. University Vallabh Vidyanagar.

28th National Conference on Agricultural Marketing
144

28th National Conference on Agricultural Marketing
145
45th Annual Conference of Gujarat Economic Association
(February 13-15, 2015)
jointly organized by
Agro-Economic Research Centre, Sardar Patel University, Vallabh Vidyanagar, Anand, Gujarat
& Gujarat Economic Association (GEA)
THE CONFENERCE The 45th Annual Conference on Gujarat Economic Association (GEA) will be held under the auspices Sardar Patel University (SPU), Vallabh Vidyanagar, Anand, Gujarat on 13-15 February, 2015. Prof. A. A. Shaikh, Former Principal, Nav Gujarat Arts and Commerce College, Ahmedabad and Visiting Faculty, Indian Institute of Management (IIM), Ahmedabad has kindly consented to deliver the Presidential Address at the Conference. The conference will discuss the following two themes: Theme (I) Millennium Development Goals: Achievements and Implications Theme (II) History of Economic Thoughts: Relevance to World Economic Order DELEGATES REGISTRATION
All the participants of the Conference and their accompanying members should be the registered delegates. Only the registered delegates are entitled to get the lodging (Non AC- sharing basis), boarding (Veg. food) and other facilities on the first come first serve basis. The participants are requested to register for the Conference on or before February 3, 2015 by paying Registration fee in the form of Demand Draft/pay order / multicity cheques, in favour of ‘Agro-Economic Research Centre’, payable at Vallabh Vidyanagar or Anand, Gujarat. Registered members will be provided with background material of conference and accommodation.
Details On or before 03.02.2015 After 03.02.2015 & Spot registration Members 400/- 600/- Accompanying person 400/- 600/- PG Student 200/- 300/-
for more information please contact
Organizing Secretary Dr. S. S. Kalamkar, Director & Professor
Organizing Joint Secretary Dr. S. R. Bhaiya, Field Officer, CCS

28th National Conference on Agricultural Marketing
146

28th National Conference on Agricultural Marketing
147
Post Graduate Department of Economics & Agro-Economic Research Centre of Sardar Patel University
invites you to
2nd H. M. Patel Memorial Lecture
on
11th February 2015
Dr. V. S. Vyas Former Member,
Economic Advisory Council to the Prime Minister will deliver the Memorial Lecture
Dr. Harish Padh Vice-Chancellor,
Sardar Patel University, Vallabh Vidyanagar would preside over the function
------------------------------------------------------------------------------------------------------------------
Dr. S.S. Kalamkar Dr. D. J. Chauhan Director and Professor Agro-Economic Research Centre, Sardar Patel University
Prof. and Head, PG Dept of Econ, SPU & Convener, HM Patel Memorial Lecture

28th National Conference on Agricultural Marketing
147

28th National Conference on Agricultural Marketing
148
ADHYA SHAKTI TRAVELS
Qualis, Tavera, Inova, Vista,
Indica, Indigo & Cruzer, Winger A/C. Non A/C Available.
A-3, Aden Avenue, Anand Sojitra Road,
Nr. Sejal Service Staion, ANAND – 388 001.
Jagdish Chawda M. 97238 22672 (O) 99048 22672
Apollo Munich Health Insurance
Apollo Munich Health Insurance Co. Ltd. 302, Chitraksh Complex, 19 , Punitnagar
Society, Near Vaccine Cross Road, off old Padre Road, Vadodara – 390015.
Tel : +91 -265 – 6536572 – 76, [email protected]
www.apollomunichinsurance.com Jayesh shah
Branch Manager +91 - 7600782129
JAISWAL ENTERPRISE
Exclusive stationary Supplier |
Computer Consumable Products
GF/10, Peredise Complex, Near Rajeshri Talkies, Sayajigunj,
Station Road, Vadodara – 5, Ph : 0265 – 3010715
Sailesh Jaiswal M : 9240 29159
“ Shree Guru Krupa” “Sat Bava Shaji”
Sine 1961
VERMA BAG ™ The Original
VERMA GENERAL STORES All Kind Of Quality Good…..
Trolley Bag | Laptop Bag | Belt | Air Bag |
School Bag | Chain Bag | Sleeping Bag | Ladies Purse | Rain Coat | Executive Bag |
Umbrella |
Corner shop at Tunki Gali, Near Railway Godi, Station Road, Anand – 388001 (Guj)
Ph : (02692) 242107
T Varma Divyesh Varma 93750 34500 98253 49436

28th National Conference on Agricultural Marketing
149
i i hr) ú iii i hr) ú iii i hr) ú iii i hr) ú ii
~) B] rv ~) B] rv ~) B] rv ~) B] rv a[ Ãy& m)n)y ma[ Ãy& m)n)y ma[ Ãy& m)n)y ma[ Ãy& m)n)y m
a[º D p). v).s).a[º D p). v).s).a[º D p). v).s).a[º D p). v).s). Di[ rDi[ rDi[ rDi[ r
D)lr : s)ºT[x, kiki, mi$(t k>pn)ni p)v)s) D)lr : s)ºT[x, kiki, mi$(t k>pn)ni p)v)s) D)lr : s)ºT[x, kiki, mi$(t k>pn)ni p)v)s) D)lr : s)ºT[x, kiki, mi$(t k>pn)ni p)v)s) Di[r, a[Ãy&m)n)ym s[kSn, piT [<Sn, AlieD)>g Di[r, a[Ãy&m)n)ym s[kSn, piT [<Sn, AlieD)>g Di[r, a[Ãy&m)n)ym s[kSn, piT [<Sn, AlieD)>g Di[r, a[Ãy&m)n)ym s[kSn, piT [<Sn, AlieD)>g
v)ºDi[, l[m)n[T[D d rviÔv)ºDi[, l[m)n[T[D d rviÔv)ºDi[, l[m)n[T[D d rviÔv)ºDi[, l[m)n[T[D d rviÔ
4 4 4 4 ---- Æyim ¼lizi, y&ki[ b[>kn) sim[, Æyim ¼lizi, y&ki[ b[>kn) sim[, Æyim ¼lizi, y&ki[ b[>kn) sim[, Æyim ¼lizi, y&ki[ b[>kn) sim[, (vFingr,(vFingr,(vFingr,(vFingr, J. aiN>dJ. aiN>dJ. aiN>dJ. aiN>d
h)rilil g&j<rh)rilil g&j<rh)rilil g&j<rh)rilil g&j<r
97140 62480 97140 62480 97140 62480 97140 62480
Fabri Circle
Interior Combination
Curtains | Mattress | Tapestry | Carpets | Wall Paper | Bed Linen | Home Linen
A, Gurukrupa, Walmi Road,
Hadgud - 388 110.
Dineshbhai M : 97252 99075

28th National Conference on Agricultural Marketing
150
MOHINI CATERERS &
MOHINI CORNER Redefining taste
Expert in Food Catering for All Occasions
8, Mohini Corner, Navarang Apartments, Near University Circle,
Vallabh Vidyanagar – 388120 Phone : (02692) 229 842, 233755
Ketan Macchi
Mobile : 98245 34838

28th National Conference on Agricultural Marketing
151
Nice Steel Furniture
b[>k ai [f eº D)yi si m[, tiAk>d ATi [s< si mb[>k ai [f eº D)yi si m[, tiAk>d ATi [s< si mb[>k ai [f eº D)yi si m[, tiAk>d ATi [s< si mb[>k ai [f eº D)yi si m[, tiAk>d ATi [s< si m [, [, [, [, AT[ Sn ri[ D, aiN> d AT[ Sn ri[ D, aiN> d AT[ Sn ri[ D, aiN> d AT[ Sn ri[ D, aiN> d –––– 388 001.388 001.388 001.388 001.
fi[ n : {02692} 258127fi[ n : {02692} 258127fi[ n : {02692} 258127fi[ n : {02692} 258127
[email protected] www.nicesteelfurniture.com
(nm [P pT [l(nm [P pT [l(nm [P pT [l(nm [P pT [l 98797 7500398797 7500398797 7500398797 75003

28th National Conference on Agricultural Marketing
152
BRICK PUBLICATIONS
Publishers & Distributors
B/23, Nilkanth Bunglows, Near Yamuna Park, Nana Bazar,
Vallabh Vidyanagar – 388120
Ph : (02692) 229567
Mo : 94275 49183
E-mail : [email protected]
R. R. Computer & New Regal Electricals
All Type of Laptop & Desktop Repairing, Installation, Data –
recovery, Sales & Services, Lane Wiring & Net working
All Electrical Materials, Maintenance,
Open & Concealed Wiring
Near Jain Derasar, Ranchhod Nagar, Nana Bazar, Vallabh Vidyanagar
Pin – 388120 [email protected]
JAVAD ALTAF
+91 99043 55408 +91 99044 67769
LYNX EMPOWERING
BUSINESS
Lynx Communication Systems Pvt. Ltd.
Ahmedabad | Vadodara | Mumbai
Sales & Service : 201 Anand Apartments, B/h. Express Hotel, Off. R.C. Dutt Road, Alkapuri, Vadodara – 390 007, Gujarat,
T : 0265 2323 209, 3087772; F : 0265 2336 525
www. lcspl.com
Bhavesh Patel Sales Executive +91 9662508060 [email protected]
p\iEm pnGT
giD< n
A Family Restaurant
Anand Lambhvel Road, Anand – 388 001.
JUGAL
(M) 98253 49501

28th National Conference on Agricultural Marketing
153

28th National Conference on Agricultural Marketing
154


Agro-Economic Research CentreFor the states of Gujarat and Rajasthan
(Ministry of Agriculture, Govt. of India)H. M. Patel Institute of Rural Development,Opp. Nandalaya Temple, Post Box No. 24,
Sardar Patel University,Vallabh Vidyanagar 388 120, Dist. Anand, Gujarat.Ph. No. +91-2692-230106, 230799; Fax : +91-2692-233106Email : [email protected]; [email protected]
Website : www.aercspu.ac.in