
PRAJÑĀ - Sardar Patel University
178
PRAJÑĀ Volume 18, 2010 ISSN 0975 – 2595 Journal of Pure and Applied Sciences SARDAR PATEL UNIVERSITY VALLABH VIDYANAGAR Gujarat – 388 120, INDIA www.spuvvn.edu
-
Upload
khangminh22 -
Category
Documents
-
view
1 -
download
0
Transcript of PRAJÑĀ - Sardar Patel University

PRAJÑĀ Volume 18, 2010
ISSN 0975 – 2595
Journal of Pure and Applied Sciences
SARDAR PATEL UNIVERSITY VALLABH VIDYANAGAR Gujarat – 388 120, INDIA
www.spuvvn.edu

PRAJÑĀ - Journal of Pure and Applied Sciences (Abbreviation: PRAJÑĀ - J. Pure & Appl. Sci.)
Patron Prof. Harish Padh
Vice-Chancellor
Managing Editor
Prof. T. V. Ramana Rao B. R. D. School of Biosciences
Sardar Patel University Vallabh Vidyanagar, Gujarat – 388 120
Editorial Board
Prof. S. J. Bhatt Prof. Rema Subhash
Prof. D. K. Raval Dept. of Mathematics
Prof. K. N. Joshipura Dept. of Physics
Prof. K. S. Rao Dept. of Biosciences [email protected]
Dept. of Home Science [email protected]
Prof. Satish Manocha Dept. of Material Science
Prof. Darshan Choksi Dept. of Computer Science
Department of Chemistry [email protected]
Prof. D. Lakshminarayana Department of Electronics
Prof. Ashok Shanubhogue Department of Statistics
Since 1991 Sardar Patel University has been regularly publishing the PRAJÑĀ - Journal of Pure and Applied Sciences with an aim of providing a platform to Academicians, Researchers and Scientists for the rapid dissemination of original scientific work carried out in the University departments, Affiliated Colleges and Research Laboratories located in Gujarat. All articles published in PRAJNA are deemed to reflect the individual views of the authors and not the
official points of view of the Sardar Patel University.
A Peer Reviewed Journal
Indexed in Indian Science Abstracts
Published by the Registrar, Sardar Patel University, Vallabh Vidyanagar, Gujarat – 388 120
Printed at Sardar Patel University Press, Vallabh Vidyanagar, Gujarat – 388 120

PRAJÑĀ - Journal of Pure and Applied Sciences
Volume 18, December 2010 An Official Publication of
Sardar Patel University Vallabh Vidyanagar, Gujarat – 388 120, INDIA
www.spuvvn.edu E-mail: [email protected]

Sardar Patel University
is grateful to
Prof. Vithalbhai A. Patel,
Humboldt State University, Arcata, Califonia, USA,
whose generous donation to organize academic activities
in the name of Shri Ishwarbhai Ambalal Patel (Shertha) helped
to meet a part of the publication cost of PRAJÑĀ Journal.
* * * * * * * * * * *
The Editorial Board of PRAJÑĀ is grateful to all those experts who
rendered their valuable services as referees for reviewing
the papers received for this volume of the Journal.
* * * * * * * * * * *
The computational assistance received from Mr. Jay B. Pandya,
a Doctoral Research Student of Biosciences Department, for making of
this volume of PRAJÑĀ Journal is also gratefully acknowledged.

I
PRAJÑĀ - Journal of Pure and Applied Sciences Vol.18 December, 2010 ISSN 0975 - 2595
FROM THE DESK OF PATRON AND VICECHANCELLOR
As the University has, besides the learning and teaching programmes,
its commitment to research and it has twin obligations of putting before
academic community the new findings of its faculty and providing its
faculty members a vehicle for expression of their new ideas. In that context,
it is a matter of proud for all of us at Sardar Patel University that way
back in 1991 it has started a Journal of Pure and Applied Sciences -
‘PRAJNA’ (a Sankrit word, having the meaning of ‘Wisdom’ or
‘Consciousness’) with an aim to provide a platform for disseminating of
scientific research carried out at its Post-Graduate Science Departments and
since then it has been regularly publishing the journal. I am happy to learn
that the 18th Volume of PRAJNA is getting ready soon for its release. Also I
am glad to know that there is an overwhelming response to PRAJNA, which
has been reflected in the number of papers received for publication.
As the Editorial Board of PRAJNA decided to widen the scope of the
Journal to National level from the next issue onwards, I am confident that
with rich experience coupled with dedication, the members of Editorial
Board will bring out PRAJNA at par with international journals.
I wish the Editorial Board of PRAJNA all success in all its endeavours.
Sardar Patel University Dr. Harish Padh Vallbh Vidyanagar Vice-Chancellor

EDITORIAL
A critical aspect of the scientific process is the reporting of new results in
scientific journals in order to disseminate that information to the larger community of
scientists. Communication of one’s results contributes to the pool of knowledge within
his/her discipline (and others!) and very often provides information that helps others
interpret their own research results. So publication in a reputable, peer reviewed
journal should be the goal of every researcher, as this provides the most effective and
permanent means of disseminating information to a large audience. However, one of
the most important and least understood decisions made in the course of publishing a
scientific article is the choice of a journal. The decision determines the audience
reached, the context in which scholarly work is presented, and the time it takes to
achieve formal publication. At best, the right choice of a journal results in the rapid
publication of an article that achieves the exposure it deserves. Keeping these points in
view, since 1991 Sardar Patel University has been regularly publishing the ‘PRAJNA –
Journal of Pure and Applied Sciences’ with an aim of providing a platform initially to
the researchers of its Post-graduate Science Departments for the dissemination of their
original scientific work. Due to the sincere efforts put up by the past Members of
Editorial Board of PRAJNA for continuous improvement of the quality of the journal,
subsequently the scope of the journal has been widened to all the researchers of Post-
graduate Departments and Affiliated Colleges of Universities and Research
Laboratories located in Gujarat State.
Keeping in view the concerns about paucity of sufficient and good journals in
India in which scholars could publish their research papers and looking into the
overwhelming response to PRAJNA from the researchers from several Institutions and
R & D Laboratories of Gujarat state and also many enquiries and requests from several
other parts of our country, the present Editorial Board of PRAJNA has decided to
widen the scope of PRAJNA to National level from the next issue (Volume 19). It is
envisaged that this will give a good impact and boost to PRAJNA. This will help our
young scientists to publish their results in a short time and also get a good impact
factor for our journal.
Solicit your patronizing encouragement for our endeavors.
Editorial Board PRAJNA – Journal of Pure and Applied Sciences

PRAJÑĀ - Journal of Pure and Applied Sciences, Vol. 18: 1 - 4 (2010) ISSN 0975 - 2595
VARIABILITY AND CORRELATION STUDIES ON BULB YIELD, MORPHOLOGICAL AND STORAGE CHARACTERS IN ONION (Allium cepa L.)
A. P. Trivedi* and K. N. Dhumal
Directorate of Medicinal and Aromatic Plants Research, Boriavi – 387 310, Dist. Anand, Gujarat.
ABSTRACT
The field experiments were carried out at National Research Centre for Onion and Garlic, Rajgurunagar, Pune during late kharif 2002 and 2003 to evaluate some onion germplasm lines against the commercial varieties/ hybrids for improvement in bulb yield. So improvement in bulb yield, selection pressure can be exercised for the genotypes possessing maximum bulb weight having maximum number of ‘A’ grade
ulbs with physiological loss in weight which were contributing towards total losses in onion during storage. b Key words: Genotypes, onion and yield. INTRODUCTION
Onion is a commodity of masses and used in the
preparation of pickle, salads, condiments and all types of vegetarian and non-vegetarian dishes. Besides fresh consumption, onion provides very good raw material for processing industries as it is processed in the form of dehydrated powder, rings and in vinegar. The productivity of onion in India is far below than that of western countries. Hence, immediate attention needs to be given to improve the productivity of onion. Along with this uniformity in size, shape and colour of bulb, storage life and export qualities should be improved.
To improve the productivity through genetic improvement
needs information like extend of variability and association between the characters. Hence, in the present study an attempt was made to evaluate some onion germplasm lines against the commercial varieties/ hybrids, so as to find the good performing germplasm, variability available and correlation
etween the yield, morphological and storage characters. b MATERIALS AND METHODS
The field experiment was conducted during the late kharif (rangda) seasons of 2002 and 2003 at National Research Centre for Onion and Garlic, Pune, Eighteen genotypes and four check varieties of onion maintained in genetic resource section in the institute were evaluated by using random block design with hree replication. t
The 15 cm distance was kept between the row and 10 cm
distance was kept within the plants. The each row contains 200 plants. Observations was recorded on randomly selected 10 plants on number of leaves, plant height(cm), average bulb weight(gm), dry matter of bulb(%), equatorial and polar diameter(cm), T.S.S. percentage of total losses, losses due to rotting and sprouting, percentage physical loss of weight and
ulb yield(t/ha). b
The seeds were sown in nursery during July, on raised bed (3 x 1m) in raw and the cultural operations were carried out as per normal recommended practices. The 45 days old healthy seedlings were transplanted in August in the flat bed. The recommended basal dose of N.P.K. (50-50-50) fertilizer was given at the time of transplanting and the remaining 50 kg of nitrogen was given in two splits as top dressing at 30 and 60 days after transplanting. The harvesting of bulbs was done in
January and the bulbs were kept in storage in plastic crates. The stored bulbs were checked after 15 days for recording various parameters. The observations on plant height, number of leaves, polar diameter, equatorial diameter, neck thickness, total soluble solids, bulb weight, dry matter of bulb, percentage of A, B and C grade bulbs, bolters, doubles, and bulb yield were recorded. Observations on stored bulbs were recorded at 30 days intervals for the storage losses, due to rotting, sprouting, physiological loss in weight (PLW) and total losses. At each observation rotted and sprouted bulbs were discarded after recording the data. The data obtained for the characters A,B and C grade bulbs, bolters, doubles, total storage losses, sprouting losses, rotting losses, and physical losses in weight were recorded in percentage. These data were angularly ransformed and subject to the statical analysis. t
The analysis of variance and performance of the varieties
and character association were calculated separately and resented in the tables separately [1]. p
R
ESULTS AND DISCUSSION The analysis of variances indicated that significant
differences were observed for bulb yield, polar diameter and T.S.S. of the onion bulbs. The remaining attributes have not showed any differences among the genotypes tested. The yield performance of 18 genotypes and four check varieties ranged from 240.00 to 532.50.q/ ha. (Table - 1)
The NRCOG-593 had the best yield followed by NRCOG-
574 (447 q/ha). NRCOG-593 has recorded significantly higher yield than the best control varieties Basawant-780 and N-2-4-1where NRCOG-574 was superior in yield over one check variety i.e. DPS-1029 (375.00 q/ha)
Maximum TSS was recorded in NRCOG-596 (15.17%),
which was followed, by NRCOG-590 (14.98%), NRCOG- 581 (14.88%), NRCOG-551 (14.34%), NRCOG-567 (14.20%), NRCOG-547 (14.14%), NRCOG-542 (14.08%) and NRCOG-598 (14.00%). All the genotypes expressed higher TSS than all check varieties. The T.S.S. values recorded in check varieties were as follows- N-2-4-1 (13.41), B-780 (13.06), Hy-3667 (9.92) and DPS-1029 (9.00).
The overall results indicated that six genotypes NRCOG-
581, 563, 539, 593, 574 and 551 recorded minimal storage losses (25.25, 27.42, 30.00, 30.37, 31.20 and 32.0 % respectively) after 180 days of storage under modified storage
* Corresponding author: [email protected]

2 PRAJÑĀ – Journal of Pure and Applied Sciences 18: 1 - 4 December
Table - 1 Performance of onion genotypes.
structure. Further the results indicated that NRCOG-581 recorded lowest storage loses (25.25%) with a yield of 18.0t/ha followed by NRCOG- 563 (27.42% / 20.0 t/ha), NRCOG-539 (30.00% /14.5 t/ha), NRCOG-593 (30.37%/36.2t/ha) and NRCOG-574 (31.20%/41.15 t/ha). Losses due to rotting ranged from 0.00 (NRCOG 594) to 50.86 (DPS-1029) of check hybrid. Further results indicated that the check variety B-780 recorded the maximum yield with storage loss of 42.68% followed by Hy- 3667 (42.2 t/ha / 73.08%), NRCOG-574 (41.5 t/ha/31.20%), NRCOG 593 (36.2 t/ha / 30.37%) and check variety N-2-4-1 (30.7t/ha / 28.00%). Post harvest losses were
minimum in NRCOG-581 (25.25%) with an yield of (18.00 t/h) followed by NRCOG-563 (27.42%/20.00 t/h), NRCOG-539 (30.00%/14.5 t/h) and NRCOG-574 (31.20%/41.5 t/h). Exotic collection and variety recorded higher storage losses i.e. DPS-1029 (90.86%) and Hy-3667 (73.08%), inspite of the fact they registered high yield potential. Ten genotypes in sprouting losses, nine in physical loss of weight were found less than general mean. Six genotypes namely, NRCOG-547, 563, 574, 581, 599 and N-2-4-1 recorded higher percent of reducing sugars.
Genotype Plant height (cms)
Number of
Leaves (cms)
Polar diameter
(cms)
Equatorial diameter
(cms)
Neck thickn
ess
T.S.S (%).
Average weight Bulb
Dry matter of
bulbs
‘A’ grade bulbs (%)
‘B’ grade bulbs (%)
‘C’ grade bulbs (%)
Doubles(%)
Bolter(%)
Total loss (%)
Rotting losses (%)
Sprouting losse s(%)
Physicaloss ofweight
l YIELD Qtl/ Ha
NRCOG-539 56.40 8.65 4.87 4.99 1.11 13.70 46.77 10.99 19.62 22.05 23.19 50.30 0.01 33.18 18.15 0.01 26.57 355.0
0 NRCOG-
542 46.30 6.70 4.61 5.40 0.60 14.08 71.97 12.11 31.49 29.23 16.40 36.90 12.12 50.73 28.77 6.57 36.89 315.00
NRCOG-547 48.45 8.25 4.75 5.38 0.75 14.14 71.64 11.73 41.11 28.19 17.17 21.22 20.79 41.42 26.71 0.01 29.02 370.0
0 NRCOG-
551 50.45 9.10 5.01 4.75 1.11 14.34 61.15 13.53 30.41 21.73 35.91 22.63 18.31 34.36 16.40 0.01 29.34 240.00
NRCOG-563 49.10 8.80 4.36 4.70 0.75 13.35 57.05 13.51 29.08 25.76 21.47 38.16 11.89 31.35 16.47 0.01 26.06 357.5
0 NRCOG-
567 50.20 10.05 4.15 4.78 0.75 14.20 51.41 11.81 21.48 30.53 25.67 38.35 16.94 53.26 43.93 0.01 23.59 300.00
NRCOG-568 52.95 8.15 4.82 5.24 0.73 13.38 68.49 12.06 30.96 28.38 28.75 17.42 25.06 39.25 16.42 11.25 31.96 330.0
0 NRCOG-
574 55.20 6.95 4.76 5.30 0.52 13.39 90.40 11.93 46.38 33.29 18.63 11.54 7.49 33.94 18.05 14.36 23.09 447.50
NRCOG-577 54.75 8.20 4.94 5.55 0.77 13.22 65.42 11.77 28.02 31.24 35.84 22.14 7.04 41.82 11.83 19.47 32.70 332.5
0 NRCOG-
580 58.95 9.90 4.83 5.33 0.67 13.96 69.21 12.15 36.62 25.81 24.23 23.19 20.70 38.42 11.97 22.21 26.57 360.00
NRCOG-581 60.20 7.80 4.40 4.60 0.82 14.88 46.62 13.07 26.69 38.63 23.23 25.18 15.68 30.17 16.96 0.01 24.10 250.0
0 NRCOG-
588 51.05 8.65 5.02 6.07 0.66 12.36 78.41 9.57 55.56 17.67 17.38 22.04 0.01 36.96 20.36 0.01 29.33 352.50
NRCOG-590 54.40 8.75 5.13 5.66 0.76 14.98 59.69 12.21 37.91 27.88 23.29 21.90 18.66 43.41 25.99 11.50 28.26 302.5
0 NRCOG-
593 50.55 6.95 4.59 5.75 0.64 13.79 85.21 11.73 32.60 25.00 27.26 29.37 15.65 33.45 13.34 9.33 28.24 532.50
NRCOG-594 49.75 9.60 5.31 5.22 0.68 13.62 67.88 12.99 40.74 20.20 19.69 29.97 17.28 38.34 0.01 10.08 36.51 330.0
0 NRCOG-
596 47.90 10.87 4.68 5.31 0.77 15.17 69.61 10.07 36.57 23.03 20.15 37.51 0.01 36.24 13.18 0.01 33.05 392.50
NRCOG-598 53.60 9.35 5.03 5.48 1.02 14.00 61.11 12.58 31.62 21.19 22.84 35.10 17.80 40.22 0.01 7.42 39.25 305.0
0 NRCOG-
599 52.90 8.50 4.96 5.20 1.00 13.45 54.03 12.19 37.45 24.30 23.72 23.03 21.14 39.24 20.89 11.52 32.08 315.00
Hy-3667 50.19 8.45 6.35 5.34 0.68 9.92 94.19 8.87 45.05 35.92 13.37 18.29 0.01 58.69 20.46 38.30 33.06 462.50
DPS-1029 48.00 8.60 6.74 5.17 1.01 9.00 76.02 10.37 36.11 35.94 15.25 28.60 0.01 72.56 45.52 0.01 39.25 375.0
0 Baswant-
780 55.19 9.05 5.36 6.26 0.77 13.06 93.29 10.99 54.74 25.00 14.34 11.54 12.35 40.80 19.00 0.01 34.46 487.50
N-2-4-1 55.05 7.80 5.21 5.29 1.11 13.41 76.02 13.60 35.49 21.56 25.69 28.79 18.60 31.93 16.41 14.18 21.96 462.00
General mean 52.33 8.59 4.99 5.31 0.80 13.43 68.89 11.81 35.71 26.78 22.02 25.53 10.99 40.90 18.94 8.12 30.06 362.4
8 ‘F’ Test - - * * - * * * * - * - - - - ** ** ** ** *
Sem± 3.46 1.21 0.21 0.29 0.09 0.48 8.67 1.12 5.51 6.00 5.48 0.33 6.05 5.75 1.95 0.91 1.59 42.33
CV 10.06 3.53 0.62 0.85 0.29 1.62 25.17 3.66 16.03 17.42 15.92 22.73 17.57 16.69 5.62 2.67 4.47 122.85

2010 Trivedi and Dhumal – Variablity and correlation 3
Table - 2 Correlation studies on morphological and storage characters in Onion
Characters
Plant height (cms)
Number of
Leaves
Polar diameter
(cms)
Equatorial diameter
(cms
Neck thickness
T.S.S. Average weight Bulb
Dry matter
of bulbs
‘A’ grade bulbs (%)
‘B’ grade bulbs (%)
‘C’ grade bulbs (%)
Doubles Bolter Total loss
Rotting losses
Sprouting losses
Physicalloss of weight
IELDtl/ Ha
Plant height 1.000
Number of Leaves -0.057 1.000 Polar diameter -0.162 0.026 1.000
Equatorial diameter -0.011 -0.112 0.246 1.000 Neck thickness 0.151 0.205 0.234 -0.322 1.000 T.S.S 0.248 0.139 -0.841* -0.143 -0.051 1.000
Ave. weight Bulb -0.210 -0.287 0.471* 0.651* -0.452* -0.487* 1.000
Dry matter of bulbs 0.244 -0.138 -0.474* -0.458* 0.251 0.547* -0.469* 1.000
A’ grade bulbs (%) -0.084 -0.029 0.405* 0.711* -0.384* -0.323 0.752* -0.433* 1.000
B’ grade bulbs (%) 0.107 -0.342 0.203 -0.296 -0.266 -0.335 0.083 -0.161 -0.150 1.000
C’ grade bulbs (%) 0.276 0.028 -0.392* -0.304 0.325 0.420* -0.454* 0.524* -0.581* -0.168 1.000 Doubles -0.243 0.248 -0.279 -0.424* 0.340 0.210 -0.579* 0.104 -0.677* -0.270 0.064 1.000 Bolters 0.214 -0.052 -0.401* -0.146 0.051 0.508* -0.274 0.733* -0.190 -0.136 0.406* -0.211 1.000 Total losses -0.447* 0.066 0.665* 0.062 -0.029 -0.699* 0.236 -0.501* 0.073 0.487* -0.397* -0.030 -0.306 1.000 Rotting losses -0.320 -0.100 0.183 -0.141 0.017 -0.353 -0.022 -0.295 -0.084 0.481* -0.258 0.043 -0.185 0.669* 1.000
Sprouting Losses 0.204 -0.170 0.358 0.158 -0.268 -0.322 0.400 -0.186 0.177 0.262 0.018 -0.377* 0.010 0.180 -0.252 1.000
Physical loss of weight -0.452 0.156 0.525* 0.332 0.049 -0.368* 0.200 -0.304 0.200 -0.065 -0.280 0.010 -0.173 0.523* -0.098 0.025 1.000 Yield -0.060 -0.263 0.273 0.526* -0.271 -0.354 0.794* -0.388* 0.462* -0.011 -0.372* -0.231 -0.281 0.017 -0.052 0.306 -0.078 1.000
At the same time ten genotypes (NRCOG- 539, 547, 563, 568, 577, 581, 593, DPS-1029 and N-2-4-1) have registered higher percentage of non-reducing sugars. Further, among the genotypes tested NRCOG- 574 showed supremacy in yield (41.5 t/ha) with a storage loss of 31.20% followed by NRCOG- 593 (36.2 t/ha, 30.37%). However the check variety B-780 recorded bulb yield 44.5 t/ha with loss of 42.68% followed by N-2-4-1 30.7 t/ha and 28.00% storage loss.
On perusal of results in Table-1 indicated that only two
genotypes (NRCOG-593 and 574) were superior in terms of yield to the tune of 53.2 and 44.70 t/ha respectively. Three genotypes NRCOG-581, 580 and 539 recorded maximum plant height. Three (NRCOG-596, 580 and 567) for number of leaves, two (NRCOG-567 and 590) for dry matter of leaves, five (NRCOG-594, Hy-3667, DPS-1029,B-780 and N-2-4-1) in polar bulb diameter, three (NRCOG-588, 593 and B-780) in equatorial diameter, six (NRCOG-539, 551, 598, 599, DPS-1029 and N-2-4-1) for neck thickness, eight (NRCOG-542, 547, 551, 567, 580, 590, 596 and 598) for TSS five (NRCOG-574, 588, 593, Hy-3667 and B-780) for bulb weight, three (NRCOG-551, 581 and N-2-4-1) for dry matter of bulb, four (NRCOG-574, 588, Hy-3667 and B-780) for percent of A grade and B grade bulbs, three (NRCOG-551, 568 and 577) for C grade bulb, five (NRCOG-574, 577, 588, Hy-3667 and B-780) for marketable yield showed supremacy in respective attributes studied. Bulb weight and percent of A grade bulbs. Selection pressure can be profitably exercised on these attributes The marketable yield was positively correlated with polar diameter, equatorial diameter, average weight of bulb, “A” grade bulb and sprouting losses, however it was negatively
correlated with neck thickness of bulb, T.S.S. (%), dry matter of bulb, “C” grade bulb and doubles bulbs.
The correlation studies were carried out for the different
morphological and post harvest characters in onion. The results are g ven in Table - 2. i
The average weight of bulb was positively correlated with
polar and equatorial diameter and marketable yield, while it was negatively correlated with neck thickness and TSS (%) of the bulbs. The polar diameter of the bulb was positively correlated with total losses, physical losses of weight and yields and negatively correlated with TSS, dry matter of bulb and bolters. While the equatorial bulb diameter was positively correlated with average weight of bulb, “A” grade bulb and yield, it was negatively correlated with dry matter and doubles of bulb.
The percentage of total soluble solids was positively
correlated with dry matter of bulb; “C” grade bulb and bolters while it was negatively correlated with average weight of bulb, total losses (%) and polar diameter. The physical loss of weight was positively correlated with polar diameter and total losses, while negatively correlated with plant height and TSS. The rotting losses of the bulb were positively correlated with “B” grade bulb and total losses while it was negatively correlated with TSS.
Total losses were positively and significantly associated
with losses due to rotting and polar bulb diameter. However, it was negatively associated with dry matter of bulb, TSS. Hence minimization of losses due to rotting and reduction in polar bulb diameter will definitely reduce the total losses. However,

4 PRAJÑĀ – Journal of Pure and Applied Sciences 18: 1 - 4 December
high TSS, high dry matter will contribute to reduce the total osses of onion bulbs [2]. l
Bulb yield had a positive significant association with plant
height, equatorial diameter, bulb weight, percentage of ‘A’ grade bulbs and yield. These results have confirmed that any improvement in these characters will have direct effect on bulb yield. Hence, exercising the selection pressure on these traits will be more effective and helpful.
It is a fact that significant association of growth attributes
such as plant height, dry matter and yield attributes like equatorial diameter and bulb weight, A grade bulb and marketable yield increases the yield potential. Any improvement in these characters will directly increase the yield potential of the genotypes. Hence, successful exploitation of selection pressure on these attributes will help in improving the genotypes. [3],[4]. While exercising the selection pressure for the above attributes, which are significantly and positively associated with the yield, must be taken into consideration for exercising selection pressure.
Polar diameter was positively associated with average
weight of bulb (0.65*), A grade bulbs (0.71*) and yield (0.62*). These results indicated that increased bulb size, and A grade bulbs will contribute for increasing the yield. [5]
Similarly polar diameter had a significant positively
association with bulb weight (0.47*), ‘A’ grade bulb (0.41*) and yield (0.43*).It was also same for equatorial diameter. Bulb weight had positive significant association with ‘A’ grade bulbs nd yield [6]. a
On perusal of above results it was seen that yield improvement could be possible by increasing equatorial diameter and polar diameter of bulb, bulb weight and percent of A’ grade bulb.[7] ‘
REFERENCES [1] Panse, V. G. and Sukhatme, P. V. (1995). Statistical
methods for agricultural workers (Ed.). Indian edition, Hans Publishers, Bombay
[2] Kallal Kumar Pramanik, Narendrasingh and Netrapal. Physiological effect of growth, yield and storage qualities of onion. Indian Journal of Agril. science 69 (2):126-129
[3] Patil J.D.; Desale, G.Y. and P. N. Kale. 1987. Correlation studies on morphological and storage characters of some onion varieties. J. Maharashtra Agric. Univ. 12 (1):114-115.
[4] Netra Pal, N. Singh and B. Chaudhary. 1988. Correlation and path coefficient studies in onion. Indian J. Hort. 45(3-4):295-299.
[5] Patil J.D. (1984). Genetic variability and correlation studies in onion (Allium cepa L.) M.Sc. Thesis, MPKV, Rahuri (M.S.)
[6] Satodiya, B. N. and S. P. Singh. 1997. Association of morphological traits of onion bulbs to storage life. Agricultural Science Digest, Karnal. 17(2): 123-125.
[7] Singh D. N., A. Nonali, P. Tripathi and A. Sahu 1995. Genetic variability and correlation in onion (Allium cepa L.). Indian J. Agric. Sci. 65(11): 793-796.

PRAJÑĀ - Journal of Pure and Applied Sciences, Vol. 18: 5 - 8 (2010)
ISSN 0975 - 2595
EFFECT OF SUCROSE, BORON, CALCIUM, MAGNESIUM AND NITRATE DURING IN VITRO POLLEN GERMINATION IN LUFFA AEGYPTICA MILL.
P. P. Prajapati and B. K. Jain1*
Biology Department, Government Science College, Gandhinagar,Gujarat.
1Botany Department, M. G. Science Institute, Navarangpura, Ahmedabad, Gujarat.
ABSTRACT
A study on in vitro pollen germination and pollen tube growth was made in Luffa aegyptica Mill. belonging to the family Cucurbitaceae. A modification of the basal medium of Brewbaker and Kwack was effected to get maximum percentage of pollen germination and tube growth in this taxon. Modified basal medium contains 10% sucrose, 50mg H3BO3, 200mg MgSO4.7H2O and 350mg Ca(NO3)2. H2O in 1000 ml distilled water. The pH of the medium was adjusted to 6.0. The maximum percentage of pollen tube growth is 96.60% and bursting of pollen grain is 3.40%. Attempts were also made to study the effects of sucrose, boron, calcium, magnesium and nitrate during in vitro pollen germination. Key words: Luffa aegyptica, sucrose, boron, calcium, pollen germination. I NTRODUCTION
Pollen grains are very specialized and complex plant cells. Pollen tube formation is a good and simple model of growth and development [1]. Thus pollen germination and growth of pollen tube are important research materials for morphological, physiology, biotechnological, ecological, evolutional, biochemical, molecular and biological studies [2]. In vitro pollen germination is an effective technique for understanding the basic [3,4] and applied aspects of pollen biology [5,6]. During in vitro pollen germination and tube growth not only the enzyme activity [7] but also the effect of Boron [8], calcium[9] , hormones[10] , light [11] and other factors were studied for different plants. Satisfactory pollen germination requires sugar, especially sucrose [12] , with other substances. It is generally known in pollen tube culture that externally supplied sugars are concerned in controlling osmotic pressure of the medium and at the same time serving carbohydrate for the growth of pollen tubes [13]. It is found that boric acid has pronounced stimulatory effect on germination and pollen tube growth [1,14]; Ca2+ plays a key role in the regulation of pollen tube growth[15]. The present study describes the development of a pollen germination media, and technique that provides high pollen germination level and improved pollen tube growth. The aim of the present study is firstly to find the suitable material for in vitro pollen germination tests for further biological studies about the effect of different kinds of chemicals such as Sucrose, Boron, Calcium and Magnesium on pollen germination and secondly to find out the concentration of sucrose, boron, calcium and magnesium required in the ulture medium for optimum pollen germination. c
MATERIAL AND METHODS
Luffa aegyptica Mill. belonging to family Cucurbitaceae is
selected for standardization of culture medium for the optimum pollen germination and tube growth. For the present study, the dehisced flowers were collected in the morning from the plants rowing in the botanical garden of the college. g
In hanging drop and sitting drop culture methods , only a
small volume of culture medium and a small quantity of pollen can be used; consequently, neither method is suitable for physiological and biochemical studies which require large amount of pollen suspension. The response of pollen in drop
cultures is often erratic. So in present work suspension culture method is followed. In his method, pollen grains in a large number are cultured in 5 ml of culture medium in watch glasses. Pollen grains are germinated in media having different concentrations of sucrose i.e. 5,10,15,20, and 25% along with different quantities of boric acid (H3BO3), calcium nitrate (Ca(NO3)2.H2O) and magnesium sulphate (MgSO4.7H2O) to find out maximum percentage of germination. Thus Brewbaker and Kwack’s basal medium is modified for in vitro pollen germination and tube growth in Luffa aegyptica. The omposition of the modified basal medium is given in Table 1. c
Table - 1 Composition of Brewbaker & Kwack medium and
Modified basal medium.
Contents
Composition of medium as per
Brewbaker & Kwack (mg/l)
Composition of medium
after modification (mg/l)
Sucrose 100,000 100,000
H3BO3 100 50
Ca(NO3)2.H2O 300 350
MgSO4.7H2O 200 200
pH 7.3 6.8 Five replicates of each treatment were noted after every 15
minutes interval up to 120 min. Later on the number of germinated pollen grains, bursted pollen grains and pollen showing tube growth i.e. elongation of pollen tube, visible under microscopic field, are counted to calculate respective percentage. Table 2 clearly indicates that in the modified basal medium the percentage of pollen germination is more as compared to that of in the medium suggested by Brewbaker and Kwack (1963). Thus the composition of modified basal medium is used in the present study.
Emergence of pollen tube from pollen grain indicates
pollen germination while elongation of tube indicates pollen tube growth. It may possible that all the germinated pollen grains do not show tube growth and hence, both the parameters are taken into the consideration in present work.
*Corresponding author: [email protected]

6 PRAJÑĀ – Journal of Pure and Applied Sciences 18: 5 - 8 December
R
ESULTS Pollen grains of Luffa aegyptica Mill. are oblate, spherical,
3-colporate with smooth exine. During germination some time pollen shows polysiphonous condition (Fig. 3). Tubes mostly grow straight (Fig. 2). During initial period of germination there is a steep increase in the length of pollen tube which slows down as the time approaches. Pollen grain of 120 min. stage of germination shows 1287 µm length. (Fig. 1)
Fig. 1 Growth of pollen tube at various stages in Luffa aegyptica Effect of Sucrose
In the basal medium containing 10% sucrose maximum percentage of germinated pollen grains is 94.50% and maximum percentage of pollen showing tube growth is also 94.50% at 60 min. stage. Whereas the percentage of bursting of pollen grain is 2.70%. After 60 min., there is a decrease in the percentage of germinating pollen and pollen showing tube growth with a simultaneous increase in the percentage of ursting pollen grains (Fig 4 -A). b
Effect of Ca (NO3) 2 (Calcium nitrate)
It is observed that if the amount of calcium nitrate is increased in the medium, the percentage of germination is also increased. Pollen grains were germinated by varying the quantity of calcium nitrate in 10% sucrose medium. Maximum germination was reported in 350mg/l calcium nitrate. At 60 min. the percentages of germinated pollen grains and pollen showing tube growth are maximum i.e. is 95.32 % and pollen bursting is minimum i.e. 3.70% Fig 4 -B). Later on as the time approaches percentage of germination decreases.
F
ig. 2: Pollen showing tube growth Fig. 3 Pollen showing three tubes
Effect of Boric acid (H3BO3):
Boric acid is used as a source of boron. The maximum number of pollen grains is germinated in the 10% sucrose medium containing 350mg Ca(NO3) 2. H2O and 50mg boric acid in 1000ml distilled water. At 60 min the percentages of germinated pollen grains are maximum (96.60%) and the percentage of bursted pollen grain is 3.40%. After 60 min., the
percentage of germinated pollen grain decreases and bursting increases (Fig. 4 -C). Effect of Magnesium Sulphate:
Maximum pollen grains were germinated in the medium
containing 10% sucrose, 50mg boric acid, 350mg calcium nitrate and 200mg magnesium sulphate. Percentage of pollen bursting is 3.40% at 60 min. (Fig. 4 -D).
5 10 15 20 25
0
20
40
60
80
100
Per
cent
age
Conc. of Sucrose (%) in BM
Effect of different concentrations of Sucrose on in vitro pollen germination and tube growh in Luffa aegyptica Mill.
% of Pollen Bursting % of Pollen Germination % of Pollen Tube Growth
0200400600800
100012001400
Leng
th o
f tu
be( i
n µm
)
15 30 45 60 75 105 120
Time in minuteTime in minute
250 300 350 400 450
0102030405060708090
100
Per
cent
age
Conc. of Ca(NO3)2 H2O in B.M. (in mg/l)
Effect of different concentrations of Ca(NO3)2 H2O on in vitro pollen germination and tube growth in Luffa aegyptica Mill.
% of Pollen Bursting % of Pollen Germination % of Pollen Tube Growth
50 100 150 200 250
0
20
40
60
80
100
Per
cent
age
Conc. of H3BO3 in B.M. (in mg/l)
Effect of different concentrations of H3BO3 on in vitro pollen germination in Luffa aegyptica Mill.
% of Pollen Bursting % of Pollen Germination % of Pollen Tube Growth
150 200 250 300 350
0
20
40
60
80
100
Perc
enta
ge
Conc. of MgSO47H2O in BM (in mg/l)
Effect of different concentrations of MgSO4 7H2O on in vitro pollen germination and tube growth in Luffa aegyptica Mill
% of Pollen Bursting % of Pollen Germination % of Pollen Tube Growth
Fig. 4 Effect of different concentrations of (A) sucrose (B) Ca(NO2) H2O (C) H2BO3 and (D) MgSO4. 7H2O on in vitro pollen germination and tube growth in Luffa aegyptica Mill. at 60 min. stage

2010 Prajapati and Jain – Effect of sucrose, boron 7
Table - 2 In vitro pollen germination in Brewbaker and Kwack (1963) and Modified basal medium in Luffa aegyptica Mill. Brewbaker and Kwack (1963) basal Medium Modified basal medium
Sr. No.
Time in
Minutes Percentage
of Germination
Percentage of
Bursting
Percentage of tube Growth
Percentage of
Germination
Percentage of
Bursting
Percentage of tube Growth
1 15 59.10 0.00 49.46 85.84 1.80 74.52 2 30 81.44 1.03 72.16 90.00 2.70 90.00 3 45 83.30 1.90 82.40 92.56 3.30 92.56 4 60 94.50 2.70 94.50 96.60 3.40 96.60 5 75 93.30 4.80 93.30 94.80 5.20 94.80 6 90 91.90 5.10 91.90 93.23 5.30 93.23 7 105 88.76 7.80 88.76 91.50 6.60 91.50 8 120 86.27 8.82 86.27 90.56 8.50 90.56
DISCUSSION
Composition of culture medium for in vitro pollen
germination as suggested by Brewbaker and Kwack[16] has not proved to be good for all plant materials and hence, in present work it has been modified for Luffa aegyptica Mill.
The modified culture medium prepared in 1000 ml distilled water contains 10% sucrose, 50 mg boric acid, 350 mg calcium nitrate, and 200 mg magnesium sulphate. pH of the medium was adjusted to 6.0. The improved medium can be useful in fundamental and applied studies on the pollen biology f Luffa aegyptica Mill.. o
Pollen grains are known to be packed with biochemicals
like sugar, starch, lipids and phytic acid [17] . These storage products get metabolized upon germination and elongation of pollen tube. Thus, they play an important role in germination and in initial stages of pollen tube growth [18, 19] . Intake of the culture medium by the pollen grains initiates mobilization of the stored substances resulting into germination of pollen grains. According to Baker and Baker [20] the required energy for the germination of pollen grains, formation of cell wall components and callose in angiosperms is provided from the nutrient reserves like starch, sugar and lipids stored in pollen
rains. g
Optimum concentration of sucrose required for maximum pollen germination varies from species to species. For example 10% in Najas marina [21] and in Tradescantia paludosa [22] , 15% in Zea mays [23] and in Avocado cultivars[24] ; 11 to 15% in Asclepiads syriaca [25] ; 30% in Catharanthus roseus [12] and in Abelmoschus esculents [26]; 50% Pistacia vera [27]and 7.5 to 20% in some sp. of Cucurbitaceae family [28] . In the present work the optimum percentage of pollen germination is reported in 10 % sucrose concentration. In Luffa aegyptica 10% sucrose in the medium limits the diffusion rate of water into the pollen and thus prevents the bursting of pollen grains.
Boron is known to stimulate pollen tube growth in higher plants [29]. It reduces bursting of pollen tubes and enhances percentage of germination [30,31]. Vasil[28] also investigated the effects of sucrose and boric acid in Cucumis melo var. utilissimus from Cucurbitaceae, and in this species, optimum germination and tube length were obtained with 20% sucrose and 0.01% boric acid. He found that boric acid concentration
higher than 0.02% was toxic for the species. In Luffa aegyptica (Cucurbitaceae) optimum germination and tube growth occurred with 10% sucrose and 50 mg/l boric acid. Requirement of higher amount of boric acid indicates that the pollen grains of Luffa aegyptica are in deficiency of boron which has to be supplied exogenously. Boric acid concentrations higher than 50 mg/l decreases pollen growth and increases bursting of pollen grain.
Calcium is another inorganic substance with notable effect on pollen tube growth. Ca2+ is an essential requirement of pollen tube growth [32]. It has been shown that calcium controls the permeability of pollen tube membrane [33]. Absence of calcium in the medium results in an increase in the membrane permeability leading to the loss of internal metabolites [34]. In the present work, the pollen of Luffa exhibited maximum pollen germination and tube growth at a higher concentration of calcium nitrate i.e. 350mg/l than that in the original Brewbaker and Kwack medium. It seems that pollen grains of Luffa aegyptica contain very small amount of calcium which may diffuse out of the pollen rapidly in the medium. Higher concentration of calcium in the medium prevents diffusion of the calcium from the pollen. Thus supplementation of calcium in the medium lead to development of straight and rigid pollen tube with vigorous growth. A positive correlation between speed of pollen tube growth and quality of the resulting progeny is also explained [35].
The role of magnesium in pollen germination and tube growth is not clear. According to Brewbaker and Kwack [16]
magnesium ions enhance the effect of calcium ions resulting in vigorous growth of pollen tube. For Luffa pollen 200 mg/l of magnesium sulphate is better for optimum germination. A
CKNOWLEDMENT One of the authors (PPP) is thankful to Ms. Pragna
Vadher, Principal, Government Science college, Gandhinagar or her kind support. f
R
EFERENCES [1] Taylor, L.P.and Hepler, P.K. (1997). Pollen germination
and tube growth. Ann. Rev. Plant Physiol. and Plant Mol. Biol. 48: 461-491.

8 PRAJÑĀ – Journal of Pure and Applied Sciences 18: 5 - 8 December [2] Dane, F., Olgun, G. and Ozlem, Dalgic (2004). In vitro
pollen germination of some plant species in basic culture medium. J. Cell Mol. Biol. Turkey. 3: 71-76.
[3] Heslop Harrsion, J. (1989). Pollen germination and pollen tube growth. Int. Rev. Cytol. 107:1-78.
[4] Mascarenhas JP 1993 Molecular mechanism of pollen tube and differentiation: The plant cell. 5: 1303-1314.
[5] Herreo, M. (1991). Pollen tube development in Petunia hybrida following compatible and incompatible intraspecific matings J. Cell Sci. 47: 365-383.
[6] Kristen, U. and Kappler, R. (1990). The pollen test system. INVITTOX, protocol No. 55: 1-7.
[7] Malik, C.P. and Singh, M.B. (1977). Dehydrogenase and isocitrate lysae activity during pollen germination in Calotropis procera. Proc.Indian. Acad. Sci. 86: 371-374.
[8] Wang, Q., Lu, L., Wu, X., Li, Y. and Lin, J. (2003). Boron influences pollen germination and tube growth in Picea meyeri. Tree Physiology. 136: 3892-3904.
[9] Iwano, M., Shiba, H., Miwa, T., Che, F.S., Takayama, S., Nagai, T., Miyawaki, A. and Isogai, A. (2004). Ca 2+ dynamics in a pollen grain and papilla cell during pollination of Arabidopsis Plant. Physiol. 136: 3562-3571.
[10] Shukla,, S.N. and Tiwari, M.N. (1973). Interactiion of growth regulators in pollen tubes elongation of Calotopis procera. Indian J. Exp. Biol. 11: 591-592.
[11] Singh, I. (1976). Studies on the physiology of pollen and pollen tube growth. M.Sc. Thesis, Punjab Agri. Univ. Ludhiana, India.
[12] Patel, V.A., Patel, D. and. Jain, B.K. (1997) In vtro pollen germination and tube growth in Catharanthus roseus L.: The effects of sucrose ,boron, calcium magnesium and nitrate. Plant strc. Morpho. (Ed.) I.L. Kothari, India pp. 129-135.
[13] Baloch, M.J., Lakho, A.R., Bhutto, H. and Solangi, M.Y. ( 2001). Impact of sucrose concentrations on in vitro pollen germination of Okra, Hibiscus esculentus. Pakistan J Biol Sci 4(4): 402-403.
[14] Feijó, J.A., Malho, R. and Obermeyer, G. (1995). Ion dynamics and its possible role during in vitro pollen germination and tube growth. Protoplasma. 187: 155-167.
[15] Steer, M.W. and Steer, J.M. (1989). Pollen tubes tip growth. New Phytol 11: 323-358.
[16] Brewbaker, J. L. and Kwack, B.H. (1963). The essential role of calcium ions in pollen germination and pollen tube growth. Amer J Bot 50: 859-865.
[17] Bertin, R.I. (1988). Lovett Doust (eds.) Plant reproductive ecology. Oxford Univ. Press, New York: 30-39.
[18] Wetzel, C.L.R. and Jensen, W.A. (1992). Studies of pollen maturation in cotton: the storage reserve accumulation phase. Sexual Plant Reprod. 5: 117-127.
[19] Stephenson, A. G., Erickson, C. W., Lau, Tc., Quesada, M. and Winsor, J.A. (1994). Pollen Pistil interactions and pollen tube growth. Stephenson, A.G., Kao T-H. (Eds.): 220-229.
[20] Baker, H. B. and Baker, I. (1979). Starch in angiosperm pollen grains and its evolutionary significance. Amer J. Bot. 66 (5): 591-600.
[21] Jain, B. K. and Shah, C. K. (1991). Histochemical study of in vitro pollen germination and tube growth in Najas marina L. Biovigyanam 17: 30-37.
[22] Tanaka, I. (1981).Studies on microspore development in Liliaceous plants. III Pollen tube development in lily pollens cultured from the uninucleate microspore stage. Plant Cell. Physiol. 22: 149-153.
[23] Pfahler, P. L. (1968) In vitro pollen germination and pollen tube growth of maize (Zea mays) pollen II pollen sucrose, calcium and boron interactions. Can J. Bot. 46: 235-240.
[24] Sahar, N. and Spiegel-Roy, P. (1984). In vitro pollen germination of Avocado pollen. Hort Science 19(6): 886-888.
[25] Kevan, P. G., Eisikowitct, D. and Rathwell, B.(1989). The role of nectar in the germination of pollen in Asclepias syriaca L. Bot Gaz 150: 266-270.
[26] Nair, P.K.K. (1974). Studies in the pollen biology of certain cultivated Malvaceae. Advances in pollen - spore research. Vol. IX (Ed.) P.K.K. Nair, Today and Tomorrows Publishers, New Delhi.
[27] Golan-Goldhirsh, A., Schmidhalter, U., Müller, M. and Oertli, J. J. (1991). Germination of Pistacia vera L. pollen in liquid medium Sexual Plant Reprod. 4: 182-187.
[28] Vasil, I. K. (1960). Studies on pollen germination of certain Cucurbitaceae. Amer. J. Bot. 47(4): 239-247.
[29] Bhandal, L.S. and Malik, C.P. (1985). Effect of boric acid on some oxido reductase and hydrolase in Crotalaria juncea pollen suspension culture. In: recent advances in pollen research (Ed.) T.M. Varghese, Allied Publishers Private Ltd., New Delhi pp. 75-81.
[30] Dabgar, Y. B. and. Jain, B. K. (2001). Effect of sucrose, boron, calcium and magnesium during in vitro pollen germination and tube growth in Abelmoschus esculentus Moench. J. Swamy Bot Club. 8: 25-29.
[31] Bhojwani, S.S. and Bhatnagar, S. P. (2005). The Embryology of Angiosperms. Vikas Publishing House Pvt. Ltd. Chapter-9, Fertilization, page: 126-149.
[32] Bendnarska, K. (1989). The effect of exogenous Ca2+ ions on pollen grain germination and pollen tube growth – investigation with the use of 45Ca2+, verapamil, La3+ and ruthenium red Plant Reprod. 2: 53-58.
[33] Dickinson, D.B. (1967). Permeability and respiratory properties of germinating pollen. Physiol. Plant 20:118-127.
[34] Shivanna, K.R. (1979). Recognition and rejection phenomena during pollen pistil interaction. Proc. Ind. Acad. Sci. 88 (B): 115-141.
[35] Delph- Lynda, F., Weining, C. and Suttivan, K. (1998). Why fast growing pollen tubes given rise to vigorous progeny. Proc. Royal Soc. London series 13 Biol. Sci. 265: 935-939.

PRAJÑĀ - Journal of Pure and Applied Sciences, Vol. 18: 9 – 12 (2010) ISSN 0975 - 2595
EFFECTS OF ENZYME SUPPLEMENTATION IN PRACTICAL DIET FOR ROHU (LABEO ROHITA) FINGERLINGS
S. S. Bhatt*, S. G. Chovatiya, A. R. Shah and J. V. Katakiya
B. R. Doshi School of Biosciences, Sardar Patel University, Vallabh Vidyanagar - 388120
ABSTRACT
The effect of pretreatment of agro-based supplementary feed with a crude fungal xylanase produced by Aspergillus foetidus (MTCC 4898) were evaluated on rohu fingerlings. The agro-based supplementary feed (defatted groundnut oil cake (GNOC) and rice bran) was treated with crude xylanase at the rate of 184 U/gm. The pretreatment of feed with xylanase resulted in a significant (P<0.05) increase in the reducing sugar content and non-significant decrease in the crude fiber content. The growth performance and chemical composition of fingerlings fed with xylanase treated diet were found to be better than fishes fed on the control diet. At the same time, mean survival of rohu fingerlings was 100%. The results of the present study indicate that xylanase treatment of supplementary feed can be effective for improving he growth of the rohu fingerlings. t
Key words: non-starch polysaccharides (NSPs), Rohu, supplementary feed, xylanase. I NTRODUCTION
Very high cost of fish meal and soybean meal has encouraged the researchers to use alternative locally available plant protein sources for fish feed. Oilseed byproducts such as rapeseed, cotton seed, sunflower and groundnut meals are being used as partial substitutes for fish meal and soybean meal [1 & 2]. Oilseed meals are rich in protein; and some of them are traditionally used as feed for farm animals. However factors like amino acid imbalance and presence of anti-nutritional factors limit the incorporation of oilcakes in aqua feed [3]. Enhancement of the nutritive value of these ingredients by processing to increase the bioavailability of nutrients and to reduce or remove anti-nutritional factors by the inclusion of appropriate additives could result in oilseed meals being incorporated at higher levels in fish feed [4].
Use of enzymes as additives in plant based feeds has
improved feed utilization in terrestrial animals. Commercial feed enzymes are routinely used in poultry and pig feed to improve nutritive value of plant based feed [5]. Cheah et al. [6] have reported significant increase in the protein content of palm kernel meal by solid state fermentation with various species of Trichoderma fungus. Endoglucanases and endoxylanases hydrolyse β-1, 4-bond in cellulose and xylan polymers respectively and reduce the size of soluble nonstarch polysaccharides (NSPs) within the digestive tract. The action of these enzymes is also supposed to aid in the release of nutrients bound by plant cell walls. In aquaculture, addition of NSP degrading enzymes to canola meal has been shown to improve growth rates of juvenile tiger prawns; and endoglucanase as well as endoxylanase enzymes could play a significant role in the utilization of plant materials in crustacean diets [7].
The present study has been undertaken to investigate the
possibility of use of crude fungal xylanase in improving the nutritional quality of practical feed of carp, mainly defalted groundnut oil cake (GNOC) and rice bran, and their influence on the growth and carcass composition of fishes. Limited information is available on the use of feed enzymes in the supplementary feed of Indian major crops (IMCs). The effects of crude fungal xylanase treated practical feed has been checked on the growth rate, survival rate and body composition
of Labeo rohita fingerlings. The findings suggest that by enhancing the nutritive value of practical diet of IMCs by enzyme treatment, growth rate of the fishes can be enhanced; nd this warrants further investigation. a
MATERIALS AND METHODS P
reparation of fish feed
Rice bran and groundnut oil cake (GNOC) were obtained from a local market, ground to fine powder and sieved before being subjected to enzyme treatment. Feed formulation contained rice bran and GNOC (1:1) as well as guar gum as a binder (2% of the feed). After pelleting, pellets were oven dried t 50°C and used as fish feed. a
Enzy tment to fish feed me production and its trea
Xylanase was produced indigenously by solid state
fermentation on corn cobs using Aspergillus foetidus MTCC 4898 [8]. Treatment of fish feed with enzyme was carried out by mixing rice bran and GNOC (1:1) with crude fungal xylanase at the rate of 66 ml / 100 g feed (v/w) with 280U per ml of enzymatic activity. This enzyme-feed mixture was incubated at 37°C for 2 h before pelleting.
E
xperimental procedure
Fingerlings of Labeo rohita were obtained from Govt. Fish Rearing Centre Navli (Dist. Anand, Gujarat). The fishes were acclimatized in a 5000-L fiberglass tank for two weeks and fed with GNOC and rice bran (1:1). For the feeding trials, duplicate groups of 25 fingerlings (mean weight 5.30±0.15g) were maintained in 150L glass aquaria. Both experimental and control feed were fed to duplicate groups of experimental and control fishes at the rate of 2% of the body weight per day in equal feedings at 09.00 and 17.00 hours. All the aquaria were cleaned and refilled with fresh water every morning. Continuous aeration in all the aquaria was maintained during experimentation. Physicochemical parameters of water viz. temperature, pH, dissolved oxygen and total organic carbon were measured at every week from all the aquaria during experimentation to maintain water quality and measured as 21.5-31.5 °C, 8.03-8.67, 6.23-8.68 mg/l and 106.7-115.1 ppm respectively [9]. Fishes in each aquarium were weighed once every week and the feeding ration adjusted accordingly. The feeding trial was conducted for 30 days.
*Corresponding author: [email protected]
PRAJÑĀ – Journal of Pure and Applied Sciences 18: 9 -12 December 10
Analyti
cal methods Feed ingredients, experimental diets, fish muscles and fish
liver were analysed according to the AOAC [10] as follows: protein (N×6.25), by micro kjeldahl digestion and distillation after acid digestion; ash, by ignition at 600 °C in a muffle furnace until a light gray or white ash was formed; crude fiber, by total dietary fiber assay kit from SIGMA (TDF-100A); lipid, by extracting the residue with 40-60 °C petroleum ether for 8 h in a Soxhlet apparatus; total carbohydrate, by Anthrone method; glycogen, by extracting with 30% KOH and the yield was determined by anthrone-sulphuric acid method. The release of reducing sugar from the xylanase treated feed and untreated feed were measured at 0 h and 2 h incubation period by DNS method [11].
D
etermination of growth parameters
Fishes were weighed once a every week and from the data of average initial and final weight, specific growth rate (SGR=loge final body weight - loge initial body weight /number of Exp. Days x 100), feed conversion ratio (FCR=feed given (gm)/fish weight gain (gm)) and survival rate (SR=final
o. of fishes/ initial no. of fishes x 100) were calculated. n S
tatistical Analysis
The data obtained were analyzed statistically by one-way analysis of variance (ANOVA). Differences between means were assessed using Duncan’s multiple range test [12]. All differences were regarded as significant at P < 0.05. R
ESULTS AND DICUSSION
In pond culture, Indian major carps (IMCs) are generally fed on a mixture of rice bran and various varieties of oil cakes. These oil cakes form the major dietary protein source in formulated feed for the carps [13]. In the present experiment to improve the nutritive value of practical feed of rohu, ground nut oil cake (GNOC) and rice bran were treated with crude fungal xylanase. Proximate composition of GNOC and rice bran is shown in the Table - 1.
Table - 1 Chemical composition of the diet (% dry matter
basis). Feed
ingredient Moisture Crude Protein
Carbo- hydrate
Lipid Crude
Fiber
Ash
Oil cake 11.18 38.37 18.63
10.83 15.8 5.59
Rice bran 9.65 15.06 39.01
14.16 8.85 8.41
Increased use of plant proteins in aquafeed has generated
interest in the use of exogenous enzyme additives in aquafeed [14]. Endogluconase and endoxylanases have been reported to play a significant role in the utilization of plant material in crustacean diets [15]. Enzyme treatment to the feed is reported to demonstrate significant improvement in the growth and feed utilization in tilapia [16].
The present study demonstrates that xylanase treatment to
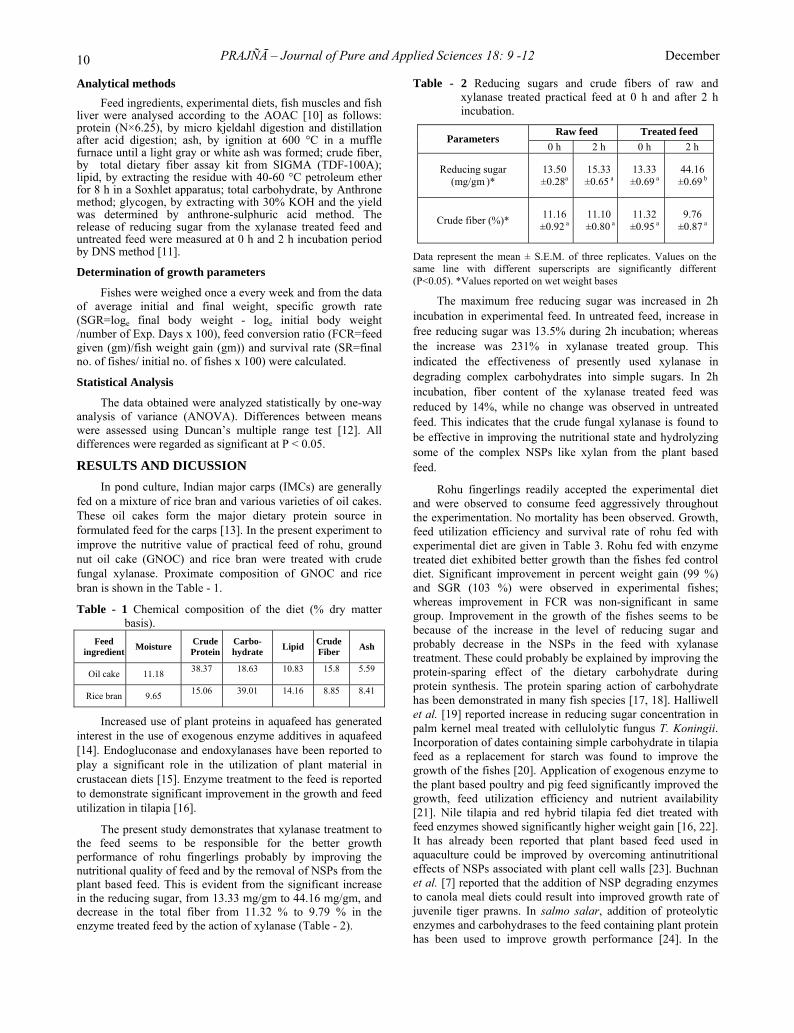
the feed seems to be responsible for the better growth performance of rohu fingerlings probably by improving the nutritional quality of feed and by the removal of NSPs from the plant based feed. This is evident from the significant increase in the reducing sugar, from 13.33 mg/gm to 44.16 mg/gm, and decrease in the total fiber from 11.32 % to 9.79 % in the enzyme treated feed by the action of xylanase (Table - 2).
Table - 2 Reducing sugars and crude fibers of raw and xylanase treated practical feed at 0 h and after 2 h incubation.
Raw feed Treated feed
Parameters 0 h 2 h 0 h 2 h
Reducing sugar (mg/gm )*
13.50 ±0.28a
15.33 ±0.65 a
13.33 ±0.69 a
44.16 ±0.69 b
Crude fiber (%)* 11.16 ±0.92 a
11.10 ±0.80 a
11.32 ±0.95 a
9.76 ±0.87 a
Data represent the mean ± S.E.M. of three replicates. Values on the same line with different superscripts are significantly different (P<0. 5). *Values reported on wet weight bases 0
The maximum free reducing sugar was increased in 2h
incubation in experimental feed. In untreated feed, increase in free reducing sugar was 13.5% during 2h incubation; whereas the increase was 231% in xylanase treated group. This indicated the effectiveness of presently used xylanase in degrading complex carbohydrates into simple sugars. In 2h incubation, fiber content of the xylanase treated feed was reduced by 14%, while no change was observed in untreated feed. This indicates that the crude fungal xylanase is found to be effective in improving the nutritional state and hydrolyzing some of the complex NSPs like xylan from the plant based feed.
Rohu fingerlings readily accepted the experimental diet and were observed to consume feed aggressively throughout the experimentation. No mortality has been observed. Growth, feed utilization efficiency and survival rate of rohu fed with experimental diet are given in Table 3. Rohu fed with enzyme treated diet exhibited better growth than the fishes fed control diet. Significant improvement in percent weight gain (99 %) and SGR (103 %) were observed in experimental fishes; whereas improvement in FCR was non-significant in same group. Improvement in the growth of the fishes seems to be because of the increase in the level of reducing sugar and probably decrease in the NSPs in the feed with xylanase treatment. These could probably be explained by improving the protein-sparing effect of the dietary carbohydrate during protein synthesis. The protein sparing action of carbohydrate has been demonstrated in many fish species [17, 18]. Halliwell et al. [19] reported increase in reducing sugar concentration in palm kernel meal treated with cellulolytic fungus T. Koningii. Incorporation of dates containing simple carbohydrate in tilapia feed as a replacement for starch was found to improve the growth of the fishes [20]. Application of exogenous enzyme to the plant based poultry and pig feed significantly improved the growth, feed utilization efficiency and nutrient availability [21]. Nile tilapia and red hybrid tilapia fed diet treated with feed enzymes showed significantly higher weight gain [16, 22]. It has already been reported that plant based feed used in aquaculture could be improved by overcoming antinutritional effects of NSPs associated with plant cell walls [23]. Buchnan et al. [7] reported that the addition of NSP degrading enzymes to canola meal diets could result into improved growth rate of juvenile tiger prawns. In salmo salar, addition of proteolytic enzymes and carbohydrases to the feed containing plant protein has been used to improve growth performance [24]. In the

2010 Bhatt et al.- Effect of enzyme supplymentation 11
present study, 100 % survival rate of fishes with xylanase addition rules out the toxic effect of crude fungal xylanase. Table - 3 Growth, feed utilization efficiencies and survival rate
in Labeo rohita fingerling.
Parameters Control diet Experimental diet
Initial weight (gm) 5.93±0.09 ns 5.37±0.04 ns
Final weight (gm) 6.76±0.07 ns 6.85±0.08 ns
Weight gain (%) 14.74±0.08 a 29.36±0.06b
SGR (%/day ) 0.32±0.01 a 0.65±0.06 b
FCR 1.98±0.06 ns 1.76±0.21 ns
SR (%) 100 100 Data represent the mean ± S.E.M. of three replicates. Values on the same line with different superscripts are significantly different (P<0.05). ns = Non significant. SGR: Specific Growth Rate. FCR: Feed Conversion Ratio. SR: Survival rate.
Proximate composition of body muscles and liver has
indicated that xylanase addition to the feed improved protein content in muscles and liver. It has also improved the deposition of glycogen in muscle (Table 4). Improvement in the deposition of protein in muscle and liver could probably be explained by improving the protein-sparing effect of dietary carbohydrate. Increase in the glycogen content in muscle suggests the role of increased level of reducing sugar in the feed. However lipid content of muscle and liver has not been influenced by the improvement in reducing sugar level of experimental diet. Though, several investigators have reported the higher level of carbohydrate in the diet with increased
eposition of lipid in the fishes [20, 25 & 26]. d Table - 4 Muscle and Liver composition of Labeo rohita after
30 days.
Data epresent the mean ± S.E.M. of three replicates. r The results of the present study indicate that rohu
fingerlings fed with practical diet treated with crude fungal xylanase shows better growth performance as compared to fishes fed with untreated diet. It has also resulted in higher deposition of protein in muscles and liver. Pretreatment of practical feed of carp, ground nut oil cake and rice bran, with indigenously produced crude fungal xylanase using corn cob has potential to improve nutritional quality of practical feed as well as growth performance of rohu. Further investigations are equired in this direction. r
ACKNOWLEDGEMENTS
The present study has been supported by University Grant
Commission (UGC) Major Research Project # F.31-228/2005 SR). This is gratefully acknowledged. (
R
EFERENCES
[1] Davies, S.J., McConnell, S. and Bateson, R.I. (1990) Potential of rapeseed meal as an alternative protein source
in complete diets for tilapia (Oreochromis mossambicus Peters). Aquaculture, 87: 145-154.
[2] El-Sayed, A.F.M. (1999) Alternative dietary protein sources for farmed tilapia, Oreochromis spp. Aquaculture, 179: 149-168.
[3] Tacon, A.G.J. (1997) Fishmeal replacers: review of antinutrients within oilseed and pulses – a limiting factor for the aquafeed Green Revolution? In: Tacon, A. & Basurco, B. (Eds) Feeding Tomorrow Fish. Cahiers Options Me´diterrane´ennes, 22: 153–182.
[4] Wee, K. L. (1991) Use of nonconventional feedstuffs of plant origin as fish feeds- is it practical and economically feasible? In: De Silva S. S. (Eds.) Fish Nutrition Research in Asia. Proc. 4th Asian Fish Nutrition Workshop, Asian Fisheries Society, Manila, The Philippines, pp. 13-32.
[5] Campbell, L.D. and Bedford, M.R. (1992) Enzyme applications to monogastric feeds: a review. Canad. J. Anim. Sci., 72: 449-466.
[6] Cheah, S.C., Ooi, L.C.L. and Ong, A.S.H. (1989) Improvement in the protein content of palm kernel meal by solid state fermentation. In: Applewhite, T.H. (Eds.), Proceedings of the World Congress on Vegetable Protein Utilization in Human Foods and Animal Feedstuffs, AOCS, Champaign, IL, pp. 96-99.
[7] Buchanan, J., Sarac, H. Z., Poppi, D. and Cowan, R.T. (1997) Effects of enzyme addition to canola meal in prawn diets. Aquaculture, 151: 29-35.
[8] Shah, A.R., and Madamwar, D. (2005) Xylanase production under solid state fermentation and its characterization by an isolated strain of Aspergillus foetidus in India. W. J. Micro., 21: 233-243.
[9] American Public Health Association (APHA-1998) Standard methods for the examination of water and wastewater, 20th edn. American Public Health Association, New York, USA.
[10] Association of Official Analytical Chemists (AOAC-1997) Official Methods of Analysis of AOAC International. AOAC International, Arlington, VA.
[11] Miller, G. L. (1959) Use of dinitrosalicylic acid reagent for determination of reducing sugar. Anal. Chem., 31: 426.
[12] Duncan, D. (1955) Multiple range tests and multiple F tests. Biometrics, 11: 1-42.
[13] Garg, S.K., Kalla, A. and Bhatnagar, A. (2002) Evaluation of raw and hydrothermically processed leguminous seeds as supplementary feed for the growth of two Indian major carp species. Aquac. Res., 33: 151-163.
[14] Ng, W.K. and Chong, K.K. (2002) The Nutritive value of palm karnal meal and the effect of enzyme supplementation in practical diets for Red Hybrid Tilapia. Asian Fish. Sci., 15: 167-176.
[15] Crawford, A.C., Richardson, N.R. and Mather, P.B. (2005) A comparative study of cellulose and xylanase activity in freshwater crayfish and marine prawns. Aquac. Res,.36: 586-592.
[16] Ng, W.K., Lim, H.A., Lim, S.L., and Ibrahim, C.O. (2002) Nutritive value of palm kernel meal pretreated with enzyme or fermented with Trichoderma koningii (Oudemans) as a dietary ingredient for red hybrid tilapia (Oreochromis sp.). Aquac. Res.,33: 1199-1207.
[17] Cho, C.Y. and Kaushik, S.J. (1990) Nutrition energetics in fish: energy and protein utilisation in rainbow trout (Salmo gairdneri). World Rev. Nutr. Diet., 61: 132–172.
Protein (mg %)
Glycogen (mg %)
Lipid (mg %)
Muscle composition Control group 13.15±0.77 0.10±0.01 1.12±0.05
Experimental group 14.82±0.47 0.21±0.07 0.97±0.04 Liver composition
Control group 5.60±0.25 4.89±0.15 8.09±0.85 Experimental group 6.03±0.57 4.15±0.14 7.25±0.57

PRAJÑĀ – Journal of Pure and Applied Sciences 18: 9 -12 December 12
[18] Erfanullah and Jafri, A.K. (1995) Growth response of fingerling Indian major carp, Labeo rohita (Ham.) to various sources of dietary carbohydrate. J. Aqua. Trop., 10: 287–296.
[19] Halliwell G., Wahab M.N.B.A. and Patel A.H. (1985) The contribution of endo-1, 4-β-D-glucanases to cellulolysis in Trichoderma koningii. J. App. Bioch., 7: 43-54.
[20] Belal, I.E.H. and Al-Jasser, M.S. (1997) Replacing dietary starch with pitted date fruit in Nile tilapia Oreochromis niloticus (L.) feed. Aquac. Res., 28: 385-389.
[21] Kitchen, D.I. (1997) Enzyme applications in corn/soya diets fed pigs. In: Lyons, T.P. and Jacques, K.A. (Eds.) Biotechnology in the Feed Industry, Nottingham University Press, U.K., pp. 101-112.
[22] Boonyaratpalin, M., Promkunthong, W. and Hunter, B. (2000) Effects of enzyme pretreatment on in vitro glucose solubility of Asian plant by-product and growth and digestibility of palm expeller meal by Oreochromis niloticus (Nile tilapia). In: Hrtingsveldt W. V. (Eds.),
Proceedings of the Third European Symposium on Feed Enzymes, TNO Voeding, The Netherlands, pp. 86-92.
[23] Francis, G., Makkar, H.P.S. and Becker, K. (2001) Antinutritional factors present in plant-derived alternate fish feed ingredients and their effects in fish. Aquaculture, 199: 197-227.
[24] Carter, C.G., Houlihan, D. F., Buchanan, B. and Mitchell, A. I. (1994) Growth and feed utilization efficiencies of sea water Atlantic salmon, Salmo salar L., fed a diet containing supplementary enzymes. Aqua. Fish. Manag., 25: 37-46.
[25] Sakthivel, M. and Bhaskaran, P. (1995) Effects of dietary carbohydrate on growth, feed conversion, protein utilization and body carcass of a common air-breathing freshwater teleost fish, Channa punctatus (Bloch). J. Aqua. Trop., 10: 119–127.
[26] Wilson, R.P. (1994) Utilization of dietary carbohydrate by fish. Aquaculture, 124: 67–80.

PRAJÑĀ - Journal of Pure and Applied Sciences, Vol. 18: 13 – 14 (2010) ISSN 0975 - 2595
SEX MODIFICATION OF CUCUMBER VEGETABLE THROUGH PGRs
R. G. Jadav, T. V. Patel, A. B. Parmar* and M. Y. Saiyad
B. A. College of Agriculture, Anand Agricultural University, Anand – 388 110
ABSTRACT
An investigation was carried out at the Main Vegetables Research Station, Anand Agricultural University, Anand during 2007. The various plant growth regulators viz., Naphthalene acetic acid (NAA-100 and 200 ppm), Gibberellic acid (GA3-10 and 20 ppm), Abscisic acid (ABA-10 and 20 ppm), Kinetin (10 and 20 ppm), Ethrel (200 and 300 ppm) were used for conversion of femaleness from male flowers. The PGRs were applied twice at two and four true leaf stages. Among them Ethrel 200 ppm was found most effective in converting femaleness, producing more number of branches and increasing the yield. The sexual differentiation is controlled by endogenous levels of auxins, which developed flowering primordia and during flowering act as anti-gibberellin substance. This anti-gibberellin effect suppressed staminate flowers and promote more number of pistillate flowers. GA3 enhanced the formation of protoplasm, promote cell division and cell elongation resulted in ncreasing plant height and vine length. i Key words: cucumber, plant growth regulators, sex modification. I NTRODUCTION
Vegetables play an important role in human diet by providing carbohydrates, protein, minerals, vitamins etc. Cucumber used as fresh fruit, slice, pickles and as cooked vegetable. It has medicinal properties like prevent constipation, in digestion, curing diabetes and jaundice. The valuable cucumber exhibits wide spectrum of sex expression, It produced much more staminate flowers than pistillate flowers. Some time it creates serious problem for increasing fruit set nd yield. a
Higher temperature and longer light period induced
maleness. An application of plant growth regulators like NAA, GA3, Ethrel, Cytokinin and ABA played an important role in sex expression, sex ratio and yield. Sulochanamma [1] reported that the foliar application of Ethrel 250 ppm increased the number of female flowers in muskmelon. Therefore the investigation has been framed for finding out appropriate PGRs with proper concentration for modification of sex and for
btaining higher yield of cucumber. o M
ATERIALS AND METHODS The investigation was carried out at Main Vegetable
Research Station, Anand Agricultural University, Anand during summer season of the year 2007. Gujarat cucumber-1 commercially grown cultivar of cucumber was selected for the present study. An experiment was laid out in Randomized Block Design with three replications. There were twelve treatments used. Among them four different plant growth regulators were sprayed in two concentrations viz. NAA (100 & 200 ppm), GA3 (10 and 20 ppm), ABA (10 and 20 ppm) and Ethrel (200 & 300 ppm). One chemical Kinetin (10 and 20 ppm) and two controls with and without water spray were used. The stalk solution of PGRs and the Kinetin chemical were prepared in mg per one liter of water. The first spray treatment was given at two true leaf stage and the second one at four true leaf stage. Ample nutrition, irrigation and plant protection measures were adopted. Number of branches emerged per plant, length of vine, female flowers and yield were measured. The collected data were statistically analysed by using analysis of variance technique described by Panse and Sukhatme [2].
RESULTS AND DISCUSSION Vegetative parameters
The data pertaining to number of branches per vine at 20 days as affected by PGRs and chemical were found to be non significant but at last harvest stage they were significantly influenced.
The response of different treatments on the number of
branches per plant at 20 days and last harvest time differed significantly. The average maximum number of branches per plant (9.87) at last harvest time was recorded in Ethrel 200 ppm treatment. It may be due to antimitotic action and Ethrel act as a gibberellin antagonist Scott and Leopold [7] and thus providing an inhibitory effect on the suppression of the apical growth of main axis and thereby increased number of branches. The findings of the present studies are in consonance with those of Pandya [3] in bottle gourd, and Rafeekher et al. [4] in cucumber. S ex expression parameters
The response of different treatments on days required for appearance of first female flower differed significantly among all the treatments, Ethrel 300 ppm was found to be most effective in reducing number of days (30.93) required for appearance of first female flower, which was followed by Ethrel 200 ppm (31.87). Early flowering of treated plants may be due to induction of tendency of femaleness in the plant and increased levels of auxins might have resulted in the early induction of female flowers. Similar findings were obtained by
ingh and Choudhary and Asghar et al. [5-6] in cucumber. S
The response of different treatments on number of female flowers per plant differed significantly. As regards the number of female flowers, the treatments Ethrel 200 ppm and 300 ppm produced maximum number of female flowers per plant (33.47 and 33.27, respectively). It may be possibly due to promotive effect on flower bud initiations.
*Corresponding author: [email protected]
PRAJÑĀ – Journal of Pure and Applied Sciences 18: 13 - 14 December 14
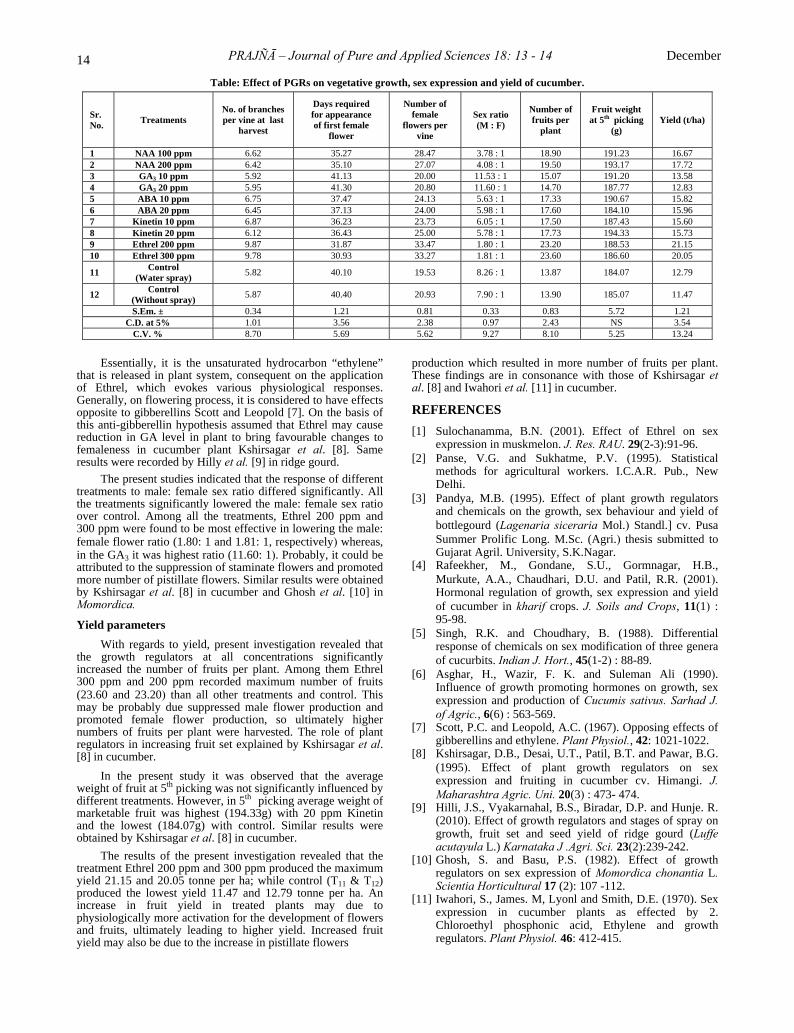
Table: Effect of PGRs on vegetative growth, sex expression and yield of cucumber.
Sr. No. Treatments
No. of branches per vine at last
harvest
Days required for appearance of first female
flower
Number of female
flowers per vine
Sex ratio (M : F)
Number of fruits per
plant
Fruit weight at 5th picking
(g) Yield (t/ha)
1 NAA 100 ppm 6.62 35.27 28.47 3.78 : 1 18.90 191.23 16.67 2 NAA 200 ppm 6.42 35.10 27.07 4.08 : 1 19.50 193.17 17.72 3 GA3 10 ppm 5.92 41.13 20.00 11.53 : 1 15.07 191.20 13.58 4 GA3 20 ppm 5.95 41.30 20.80 11.60 : 1 14.70 187.77 12.83 5 ABA 10 ppm 6.75 37.47 24.13 5.63 : 1 17.33 190.67 15.82 6 ABA 20 ppm 6.45 37.13 24.00 5.98 : 1 17.60 184.10 15.96 7 Kinetin 10 ppm 6.87 36.23 23.73 6.05 : 1 17.50 187.43 15.60 8 Kinetin 20 ppm 6.12 36.43 25.00 5.78 : 1 17.73 194.33 15.73 9 Ethrel 200 ppm 9.87 31.87 33.47 1.80 : 1 23.20 188.53 21.15 10 Ethrel 300 ppm 9.78 30.93 33.27 1.81 : 1 23.60 186.60 20.05
11 Control (Water spray) 5.82 40.10 19.53 8.26 : 1 13.87 184.07 12.79
12 Control (Without spray) 5.87 40.40 20.93 7.90 : 1 13.90 185.07 11.47
S.Em. ± 0.34 1.21 0.81 0.33 0.83 5.72 1.21 C.D. at 5% 1.01 3.56 2.38 0.97 2.43 NS 3.54
C.V. % 8.70 5.69 5.62 9.27 8.10 5.25 13.24
Essentially, it is the unsaturated hydrocarbon “ethylene”
that is released in plant system, consequent on the application of Ethrel, which evokes various physiological responses. Generally, on flowering process, it is considered to have effects opposite to gibberellins Scott and Leopold [7]. On the basis of this anti-gibberellin hypothesis assumed that Ethrel may cause reduction in GA level in plant to bring favourable changes to femaleness in cucumber plant Kshirsagar et al. [8]. Same results were recorded by Hilly et al. [9] in ridge gourd.
The present studies indicated that the response of different treatments to male: female sex ratio differed significantly. All the treatments significantly lowered the male: female sex ratio over control. Among all the treatments, Ethrel 200 ppm and 300 ppm were found to be most effective in lowering the male: female flower ratio (1.80: 1 and 1.81: 1, respectively) whereas, in the GA3 it was highest ratio (11.60: 1). Probably, it could be attributed to the suppression of staminate flowers and promoted more number of pistillate flowers. Similar results were obtained by Kshirsagar et al. [8] in cucumber and Ghosh et al. [10] in Momordica. Yield parameters
With regards to yield, present investigation revealed that the growth regulators at all concentrations significantly increased the number of fruits per plant. Among them Ethrel 300 ppm and 200 ppm recorded maximum number of fruits (23.60 and 23.20) than all other treatments and control. This may be probably due suppressed male flower production and promoted female flower production, so ultimately higher numbers of fruits per plant were harvested. The role of plant regulators in increasing fruit set explained by Kshirsagar et al. [8] in cucumber.
In the present study it was observed that the average
weight of fruit at 5th picking was not significantly influenced by different treatments. However, in 5th picking average weight of marketable fruit was highest (194.33g) with 20 ppm Kinetin and the lowest (184.07g) with control. Similar results were btained by Kshirsagar et al. [8] in cucumber. o
The results of the present investigation revealed that the treatment Ethrel 200 ppm and 300 ppm produced the maximum yield 21.15 and 20.05 tonne per ha; while control (T11 & T12) produced the lowest yield 11.47 and 12.79 tonne per ha. An increase in fruit yield in treated plants may due to physiologically more activation for the development of flowers and fruits, ultimately leading to higher yield. Increased fruit yield may also be due to the increase in pistillate flowers
production which resulted in more number of fruits per plant. These findings are in consonance with those of Kshirsagar et l. [8] and Iwahori et al. [11] in cucumber. a
REFERENCES [1] Sulochanamma, B.N. (2001). Effect of Ethrel on sex
expression in muskmelon. J. Res. RAU. 29(2-3):91-96. [2] Panse, V.G. and Sukhatme, P.V. (1995). Statistical
methods for agricultural workers. I.C.A.R. Pub., New Delhi.
[3] Pandya, M.B. (1995). Effect of plant growth regulators and chemicals on the growth, sex behaviour and yield of bottlegourd (Lagenaria siceraria Mol.) Standl.] cv. Pusa Summer Prolific Long. M.Sc. (Agri.) thesis submitted to Gujarat Agril. University, S.K.Nagar.
[4] Rafeekher, M., Gondane, S.U., Gormnagar, H.B., Murkute, A.A., Chaudhari, D.U. and Patil, R.R. (2001). Hormonal regulation of growth, sex expression and yield of cucumber in kharif crops. J. Soils and Crops, 11(1) : 95-98.
[5] Singh, R.K. and Choudhary, B. (1988). Differential response of chemicals on sex modification of three genera of cucurbits. Indian J. Hort., 45(1-2) : 88-89.
[6] Asghar, H., Wazir, F. K. and Suleman Ali (1990). Influence of growth promoting hormones on growth, sex expression and production of Cucumis sativus. Sarhad J. of Agric., 6(6) : 563-569.
[7] Scott, P.C. and Leopold, A.C. (1967). Opposing effects of gibberellins and ethylene. Plant Physiol., 42: 1021-1022.
[8] Kshirsagar, D.B., Desai, U.T., Patil, B.T. and Pawar, B.G. (1995). Effect of plant growth regulators on sex expression and fruiting in cucumber cv. Himangi. J. Maharashtra Agric. Uni. 20(3) : 473- 474.
[9] Hilli, J.S., Vyakarnahal, B.S., Biradar, D.P. and Hunje. R. (2010). Effect of growth regulators and stages of spray on growth, fruit set and seed yield of ridge gourd (Luffe acutayula L.) Karnataka J .Agri. Sci. 23(2):239-242.
[10] Ghosh, S. and Basu, P.S. (1982). Effect of growth regulators on sex expression of Momordica chonantia L. Scientia Horticultural 17 (2): 107 -112.
[11] Iwahori, S., James. M, Lyonl and Smith, D.E. (1970). Sex expression in cucumber plants as effected by 2. Chloroethyl phosphonic acid, Ethylene and growth regulators. Plant Physiol. 46: 412-415.

PRELIMINARY GIS AND REMOTE SENSING ANALYSIS
ON BANNI GRASSLANDS, KACHCHH
Jagruti Shah* and Sellamuthu Somusundaram
Gujarat Institute of Desert Ecology (GUIDE), Post Box No - 83, Opp. Changleswer Temple, Mundra Road, Bhuj - Kachchh, 370001, Gujarat, India.
ABSTRACT
The present study was carried out in Banni grassland (230 19” to 230 52” N; 690 8” to 700 11” E) of Kachchh district which spreads 2,617 km2. Land use - land cover map of Banni region was prepared using Arc GIS and ERDAS Imagine. Sub-setting of the Satellite Imageries was done using Survey of India (SoI) maps 1: 50,000 scale. Five major land use classes were identified and the Prosopis juliflora L. distribution map was prepared and it estimated that about 45 % of the total area was under Prosopis cover. Key words: land use map, GIS and remote sensing, banni grasslands, kachchh, prosopis invasion.
INTRODUCTION Once Banni was considered as the largest grassland of its
kind in Asia, but has fallen upon sad times in the last decades. The degradation of Banni area was linked to increasing salinity, growing human and livestock population, uncontrolled grazing and a large scale growth of invasive Prosopis juliflora (here after Prosopis). In addition to the anthropogenic pressure the existing arid conditions were adversely affected the grassland ecosystem functions.
Satellite Remote Sensing and Geographical Information
System have provided very useful methods of surveying, identifying, classifying and monitoring several forms of earth resources [1]. Remote Sensing data provides accurate, timely and real time information on various aspects such as size, shape and terrain of the area of interest.
Literature survey reveals that there are a few studies
existing on Banni grassland habitat mapping by using GIS and RS [4]. Jadhav et al. [2] used IRS-LISS II and TM data of the year of 88-89 and classified various habitat types. Vegetation map of Banni was prepared by GUIDE [3] using LISS III data of 1997 and 2001 and Sastry et al. [4] studied the biodiversity threat using GIS. Earlier studies predicted that Prosopis invasion in the grasslands will be 45% of the total area during 2010. Hence, this study was under taken to prepare a recent land use map of Banni grasslands and the Prosopis distribution status by using LISS III IRS – IC and 1D of June 2008.
STUDY AREA Banni is situated on the northern border of the Bhuj
Taluka (230 19” to 230 52” N; 680 56” to 700 32” E) of Kachchh district. It encompasses an area of 2,617 km2 in the fringes of Greater Rann. The plains of Banni represent an embayment between the Kachchh mainland uplift in the south, the Pachchham uplift in the north and the Wagad and Bela uplift in the east. In the southern part of Banni there is an intervening stretch of salty waste, known as Little Rann of Banni, which separates the Banni from Kachchh mainland [5]. The Banni is falling in arid climate regime therefore; temperature is high around the year and during summer (April - June) it reaches maximum of 480- 490 C. During winter temperature goes down to 80-100 C; January and February being the coldest months. The rainfall received through
southwest monsoon between June and September with an average of 317 mm per year with a coefficient of variation of 65% and droughts are a recurring phenomenon. As per 2003 Livestock census Banni grasslands support 30,000 cattle and 25,000 sheep and goat, and 48 villages mainly depended through on livestock rearing. MATERIALS AND METHODS
Data Used
In the present study Indian Remote Sensing satellite IRS – IC and 1D LISS III spatial resolution of 23.5 m was used. The Banni grassland falling in two scenes path (89 & 90) and row (55) and the cloud free data on April 2008 was procured from National Remote Sensing Agency, Hyderabad. The data was geo-referenced with Survey of India topographical maps of 41 E1, E5, E6, E9, E10, E14 and E15 at 1: 50,000 scale.
Ground Controlling Points (GCP) were collected from different parts of Banni area and it used as reference data for different vegetation. It also used for delineating different Prosopis density classes and the maximum likelihood classifier is used for processing of the satellite data.
Largely two major methods were available for data
analysis for extracting resources related information from data products namely digital image processing technique and visual interpretation technique and for this study digital image processing technique was used. Further this technique was divided in to 1, Supervised classification and 2, Unsupervised classification and for this study supervised classification method was used. The steps involved in land use land cover preparation are given in the flow chart. RESULTS
Survey of India (SoI) map was taken as a reference map of study area and both satellite imageries and toposheets were coordinated according to the earth coordinated system. For delineating Banni boundary onscreen digitization was done from SoI toposheet. Information collected from SoI toposheets and personal field visit to Banni were used as reference data for land-use land-cover classification. Sub-setting was done by using the False Colour Composites (FCC) imageries. For sub-setting ERDAS IMAGINE (9.3) and Arc GIS (9.3) were used. Later the panchayat boundaries were transferred from SoI maps and DILR (District Land Records) village maps and it was super imposed to the subset map of Banni. Base map of the
PRAJÑĀ - Journal of Pure and Applied Sciences, Vol. 18: 15 - 17 (2010) ISSN 0975 - 2595
*Corresponding author: [email protected]

16 PRAJÑĀ – Journal of Pure and Applied Sciences 18: 15 -17 2010
##
###
#
#
#
##
##
#
#
#
# #
##
#
##
#
## #
##
##
# ##
##
##
##
#
#
#
#
##
##
#
#
#
#
Misariyado Neri
Vaghura Dadhar Mota
Dadhar Nana
Madhan
Dedhiya MotaDedhiya Nana
Udai Bhojardo
Chhachhi
Lakhaba Jimri
Chhachla Bagadio
Mithadi Moti
Mithadi Nani
Mota SaradaNana Sarada
Servo
Luna Nana Luna mota
Bhitara nana
Hodka
Sarawani WadliLewali Karanwari
Dumado Udai
Tikriado Adhiang Mota
Adhiang Nani
Bhirandiyara
Reldi
Sargu MotiSaidiyado
Berdo Raiyado
Lakhara
Kharoda
Gadhado
Zarmari wandh
Sadai Wad
Ghurewali
Patgar Uddo
Dhordo
Bhitara Mota
Odma
0 10 Kilometers
N
Location Map of Banni Pachham Khadir
Rapar
Bhac hauAnjarAbdasa
Lak hpat
Nak htrana
Bhuj
Little Rannof Kachchh
Greater Rann of Kac hchh
Banni
Kachchh
GandhidhamMundraMandvi
Banni
23°10'
23°2
0'
23°20'
23°3
0'
23°30'
23°4
0'
23°40'
23°5
0'
23°50'
69°10'
69°10'
69°20'
69°20'
69°30'
69°30'
69°40'
69°40'
69°50'
69°50'
70°00'
70°00'
70°10'
70°10'
Zura#
#Bibar
#DadorVang#
#Fulai
Dhandh Rann of Banni
#Loriya
Amrapar#
#Dhori
#Lodai
#Khirsara
Baniyari
Nodhaniyano#
Udardi
Hajipir# Burkal
#
Sargu Moti #
Laiyari#
#Khavda
Gujarat Instituteof Desert Ecology
Legend
Panchyat Boundary
Main RoadKachha RoadVillage Locations#Rann of Banni
23°1
0'
Source: SoI Topo Map (1964-86),LISS III Satellite Image (1997) and DILR Maps
Fig. 1 Location Map of Banni with surrounding details
Banni area was generated and the ground truthing was done with the help of Garmin GPS 12 model. In the base map 19 panchayat boundaries, road (Kachha and Pakka) network, water bodies, settlement locations were also transferred from the SoI maps and it was confirmed with the ground truthing. The final out put map of the Banni area was generated and it was given in the figure (Figure 1).
Flow Chart of Land Use / Land Cover Map
On the basis of field observations and differences in the
tonal/colour or density variations in the imagery the land use map of the Banni region was generated. The land use pattern was classified into five major types; Prosopis dominant area,
Suaeda scrub, Prosopis with other vegetation, Grassland with sparse Prosopis and Water bodies (Figure 2). Predominant area in Banni is barren and Sueada scrub (75324.72 ha) followed by Prosopis dominant area (72073.48 ha) and Prosopis with other vegetation (55451.94 ha) (Table 1).
Fig. 2 Land use Map of Banni Grassland, Kachchh
Table - 1 Vegetation Classification of Banni grasslands by Satellite Imageries
In grasslands Cyperus sp., Dicanthium annulatum, Chloris
barbata, Creesa cretica, Aristada sp. and Sporobolus helvosus were observed. There are a few uninterrupted grass patches observed near to Dumado and Gorewali villages. During the GCP survey of these locations the rare and endemic grass Urochondra setulosus (Trin.) was recorded.
In Banni many seasonal water bodies was observed and its water spread area is mainly dependent on rainfall. Generally in Banni, many areas are low lying and during monsoon it gets filled by rainwater and act as a seasonal water bodies.
Based on the tonal colour the Prosopis density was
classified into high, medium and sparse. In high density Prosopis areas dark red colour was observed whereas in medium density class the brownish red colour was observed and in sparse Prosopis area pink tone was observed. Overall above 45 % of area in Banni is falling under Prosopis and its density varied in different parts (Figure 3). A comparative analysis was made with the previous study by GUIDE [8] and it showed that area under Prosopis dominance during 1997 was about 6 % and in 2008 it increased 27.5 % of total area and this result is clearly indicating that the grass cover has reduced and the wood land habitat (Prosopis dominant area) increased between August 1999 and April 2008. Prosopis density was high in the middle of Banni area mainly in Gorevali, Mithdi, Hodko, Lakhabo, Raiyado, Bhojardo and some part of
Major Classes Area in ha % of the total area in 2008
Prosopis Dominant area 72,073.48 27.53
Water 3,839.64 1.47 Suaeda scrub (Including Barren Land) 75,324.72 28.77
Prosopis with other vegetation 55,451.94 21.18
Grass with sparse Prosopis 55,081.74 21.04
Total area 261,771.5 100.00
STEPS INVOLVED IN LAND USE / LAND COVER
DATA AC
RECONNAISANCE SURVEYQUISITION
DATA ENHANCEMENT,
PROCESSING AND TEGRATION
DEVELOPMENT OF A CLASSIFICATION
INITIAL LAND USE/ LAND COVER CLASSIFICATION
GROUND TRUTHING
EDITING OF INITIAL LAND USE/ LAND COVER MAP
FINAL PRODUCTION OF LAND USE/LAND COVER MAP

December Shah and Somusundaram – Prelimanary GIS and remote sensing 17
Bhirandiyara panchayat area and it showed a gradual decrease in the fringe areas.
Fig. 3 Prosopis juliflora distribution in Banni Grasslands, Kachchh
DISCUSSION
Ever since the remote sensing data in the earth’s surface is available for the analysis and attempts were made to achieve classification on earth surface [6] and in this present study the Banni grassland land use pattern was prepared and five major land use forms were identified. Nagendra [7] stated that remote sensing is the valuable tool for assigning the biodiversity in a large scale area because considering that field measurements are time-consuming and costly, remotely sensed images could be used to derive the patterns of landscape. The present study also covered 2617 km2 area with different vegetation cover hence GIS and RS is the useful tool to prepare the land use land cover map.
Previous studies in Kachchh grasslands highlighted the
invasion of Prosopis in the grasslands as a major problem and in the present study also found that about 49 % area is under Prosopis. Sastry et al. [4] has estimated the Prosopis spreading speed in Banni grassland was 1.15 % of the total area and it estimated that during 2010, 45% of the total Banni area is under Prosopis and in the present study also found that the situation in true in Banni area and it shows very alarming situation for Banni grasslands. The earlier recommendations like phase wise removal of Prosopis will give a better conservation measure for the grassland restoration in Banni grasslands [8] and [9]. The present study revealed that moderate Prosopis cover was occupied about half of the Banni grassland area and this area will likely to be denser in near feature. The invasion of Prosopis woodland in the grasslands is changing the grassland ecosystem function of the area and it will have a serious impact on grassland biodiversity. As human and natural forces modify the landscape, it increasingly important to monitor and assess the alterations. As Banni grassland like pastoral land management is getting high priority in terms of grassland biodiversity as well as pastoralists. The vegetation cover changes influence management and policy decisions for the stake holders but monitoring the changes from intensive field sampling will be very difficult [10, 11].
Hence this study is more useful for conservation and management purpose of the stake holders.
ACKNOWLEDGEMENT
We thank Dr. V. Vijaykumar, Director In-charge, Gujarat Institute of Desert Ecology (GUIDE), Bhuj for his encouragement. This study was conducted as a part of a project on “Integrated grassland development in Banni” funded by the Department of Forest and Environment, Government of Gujarat. We are also thankful to Mr. Yatin Patel for his support during GCP work. REFERENCES [1] Suresh, M., Sudhakar, S., Tiwari, K.N. and Chowdary, M.
(2004) Prioritization of watershades using morphometric parameters and assessment of surface water potential using remote sensing. J. Indian Soci. Remote Sensing, 32 (3): 249 - 259.
[2] Jadhav, R. N., Kimothi, M. M. and Kandya, A.K. (1992) An approach for assessment of grassland using satellite remote sensing – A case study for semi arid region (Banni), Gujarat. In Proc. Nat. Symp. on Remote sensing for Sustainable development, pp. 37- 42.
[3] GUIDE, 2004. Vegetation cover mapping of Banni grassland using remote sensing. Gujarat Institute of Desert Ecology, Bhuj. pp. 24.
[4] Sastry, K. L. N., Thakker, P. S. and Jadhav, R. (2003) Biodiversity threat through exotic species monitoring and management using remotely sensed data and GIS techniques. In 6th annual international conference on MAP INDIA 2003 during 28-31 January 2003 at New Delhi.
[5] GUIDE and GEER, (1998) An ecological overview of Narayan Sarovar Sanctuary and adjoining de-notified areas. Gujarat Institute of Desert Ecology, Bhuj and Gujarat Ecological Education and Research Foundation, Gandhinagar. pp. 61.
[6] Kandya, A. K., Kimothi, M. M. and Jadhav, R. (1992) Image Texture processing for classification of forest types using IRS LISS II data. In Proc. Nat. Symp. on Remote Sensing for Sustainable Development, pp. 43-46.
[7] Nagendra, H. (2001) Using remote sensing to assess biodiversity. Int. J. Remote Sensing, 22: 2377 - 2400.
[8] GUIDE (1999) Ecorestoration of Banni grassland. Gujarat Institute of Desert Ecology, Bhuj. pp.79.
[9] SAC (2002) Grassland mapping in Gujarat using Remote Sensing and GIS techniques: Kachchh District, Space Application Centre, Ahmedabad. pp. 36.
[10] Busby, J. R. (2002) Biodiversity mapping and modeling. In Skidmore, A. (ed.), Environmental Modeling with GIS and Remote Sensing. Taylor and Francis: London, UK, 145–165.
[11] Kerr, J. T. and Ostrovsky, M. (2003) From space to species: Ecological applications for remote sensing. Trends in Ecology and Evolution 18, 299–305.

PRAJÑĀ - Journal of Pure and Applied Sciences, Vol. 18: 18 - 20 (2010) ISSN 0975 - 2595
MULTIPLE SHOOT REGENERATION FROM THE CALLUS CULTURE OF CENTELLA ASIATICA UNDER THE INFLUENCE OF VARIOUS
CONCENTRATIONS OF PGRS
Santoshkumar Singh*, Zankhana Rathod and O. P. Saxena
Tissue Culture Laboratory, Botany Department, University School of Sciences, Gujarat University, Ahmedabad-380 009, Gujarat, India
ABSTRACT
Plants have been important sources of medicine for thousands of years. It is estimated that approximately one quarter of prescribed drugs contain plant extracts or active ingredients obtained from plants. It is important to select, multiply and conserve the critical genotypes of medicinal plants. In vitro regeneration holds tremendous potential for the production of high quality plant based medicine. Multiple shoots were regenerated from callus obtained from node as an explant of Centella asiatica L. Urban on Murashige and Skoog’s medium supplemented with Kinetin and Indole-3-butyric acid (IBA). The callus was further subcultured on MS medium supplemented with IBA and various concentrations of kinetin to obtain the optimum shoot regeneration. The callus production was maximum on basal medium supplemented with 3 mg/l IBA + 3 mg/l kinetin and the maximum shoots were obtained on MS + 1 mg/l IBA + 3 mg/l kinetin media. MS
edium supplemented with 1mg/l to 2 mg/l IBA gave maximum root initiation in excised shoots. m Key words: Centella asiatica, callus, multiple shoots, rooting, plantlets
INTRODUCTION
Centella asiatica L. Urban (Syn. Hydrocotyle asiatica L.) of the Apiaceae family commonly known as Indian Pennywort or Mandukparni is a small creeping herb (Fig. A), common all over India growing plentifully in moist localities [8]. Centella asiatica is widely used as nervine tonic to increase the mental ability in the traditional system of Indian medicine Ayurveda. The leaves of the plant are considered beneficial in improving memory [1], however the whole plant is used as drug. An oleaginous white crystalline substance Vellarin is the active principle of the leaves [4]. The plant is also very effectively used in the treatment of eczema, epilepsy, insanity, in chronic rheumatism. It is one of the recognized drugs used for Rasayana purpose [4]. Cultivation of wild stock of medicinally important C. asiatica has been remarkably depleted and listed as threatened species [5] and an endangered species [7]. Hence there is a need to develop alternative approaches for ensuring the availability of raw material of a consistent quality from regular and viable sources. In order to increase its production, a standard protocol was developed to regenerate the plant hrough tissue culture. t
M
ATERIALS AND METHODS Young leaves and nodes were collected from C. asiatica
plants grown in Botanical Garden, Gujarat University Campus. It was thoroughly washed with running tap water followed by double distilled water. The surface of the explant was sterilized with 0.1% (w/v) systemic fungicide - bavistin and then the explant was washed with 0.1 % (w/v) HgCl2, 5% (v/v) sodium hypochlorite (NaOCl) and 5% (v/v) Tween-20 solution respectively. Finally it was rinsed 4-5 times with sterile double distilled water and used as explant for culture initiation.
Culture Media and Conditions: MS media described by Murashige and Skoog, [3] was used as basal medium throughout this investigation. According to the need of the different experiments, the formulations of MS were suitably modified. 3% Sucrose and 0.8% agar-agar were used. The culture were incubated at 25 ± 2°C under the cool white
florescent tubes. MS media was supplemented with the different concentrations (1, 2, 3, 4 mg/l) of 2, 4-D, IBA individually and in combination of 2,4-D + kinetin (in concentration of 1:1, 2:2, 3:3, 4:4 mg/l 2,4-D : kinetin) and IBA + kinetin (in concentration of 1:1, 2:2, 3:3, 4:4 mg/l IBA : kinetin) for the callus culture. After the callus initiation it was further sub-cultured on the MS media supplemented with the various combinations of 1 mg/l IBA and (1, 2, 3, 4 mg/l) kinetin in combination for the shoot regeneration. The regenerated shoots were separated from the clump of the shoots and the excised shoots were cultured on rooting media supplemented with different concentrations of IBA (1, 2, 3, 4 and 5 mg/l) for rooting. Plants with well developed roots were removed from culture medium and roots were washed with double distilled water to remove the trace of agar medium. Plantlets were transferred to plastic bags containing sterilized garden soil. The potted plants were covered with a polythin sheet to maintain the relative humidity. The potted plants were maintained inside a culture room at 25 ± 2°C for 16 hr/day illumination with cool white fluorescent light. After a week, the polythene bags were gradually removed. The plants were kept in the culture room for 2 weeks without polythin sheet cover efore transferring outside into the field. b
RESULTS AND DISCUSSION
Profuse and rapid callus initiation was obtained from the
nodal explant of C. asiatica grown on MS media supplemented with 3 mg/l IBA + 3 mg/l kinetin (Table - 1). Surprisingly 2, 4-D, which is generally helpful in initiating callus, did not respond at all for callus initiation. The proliferated callus obtained from the nodal segment was subcultured on MS medium supplemented with 1mg/l IBA + 3mg/l kinetin, 1mg/l IBA + 2mg/l kinetin, 1mg/l IBA + 3mg/l kinetin, 1mg/l IBA + 4mg/l kinetin and 1mg/l IBA + 5mg/l kinetin for the shoot initiation (Figs. B, C & Table - 2). Maximum number of the shoot formation was obtained on MS media supplemented with 1mg/l IBA + 3mg/l kinetin but higher concentration of kinetin i.e. MS + 1mg/l IBA + 5mg/l kinetin was not promoting the shoot initiation. MS media supplemented with 1mg/l to 2 mg/l IBA gave maximum root initiation in excised shoots (Fig. D, Table - 3).
*Corresponding author: [email protected]

2010 Singh et al.- Multiple shoot regeneration 19
C. asiatica Emergence of multiple Shoots from node
Shoot proliferation Rooted plantlets
Acclimatized plantlets Profusely Rooted plantlets
C
A B
D
E F

20 PRAJÑĀ – Journal of Pure and Applied Sciences 18: 18 - 20 December
100 % rooting frequency was obtained on medium supplemented with 2 mg/l IBA. The rooted plants were transferred to plastic cups (Figs. E, F) and polybags containing sterile peat and soil mixture (1:1). With 90% survival the acclimatized plantlets were successfully established in the field with only 10% mortality.
Tiwari et al., [9] developed a protocol for rapid and large-scale in vitro clonal propagation of the valuable medicinal herb Centella asiatica by enhanced axillary bud proliferation in nodal segments isolated from mature plants and could induce the optimum frequency (91%) of shoot formation as well as shoot number 4 to 5 only on synergistic combination of 22.2 μM BA and 2.68 μM NAA. However Patra et al., [6] succeeded plant regeneration from callus cultures of C. asiatica while Banerjee et al., 1999 [2] reported multiplication of C. asiatica from leaf explant. Banerjee et al., [2] also found promontory effect of IBA in rooting in C. asiatica, while IAA and lower level of sucrose was reported optimum by Patra et al., [6]. He achieved 55 to 65% survival on transfer of rooted plantlets into pots containing soil: sand: well rooted cow dung manure in the ratio of 1:1:1.
T
able - 1 Media for callus initiation
Plant Growth Regulators Basal Media 2,4-D
(mg/l) IBA
(mg/l) Kinetin (mg/l)
Rate of callus
initiation - - - - 1 - 1 - 2 - 2 - 3 - 3 - 4 - 4 - - 1 1 - - 2 2 ++ - 3 3 ++++
MS
- 4 4 + - = No callus; + = Very less callus; ++ = Less callus; +++ = Moderate callus;
++++ = Optimum callus
Table - 2 Media for shoot regen ration e
Plant Growth Regulators Basal Media IBA (mg/l) Kinetin
(mg/l)
Rate of shoot regeneration
- - - 1 1 -
1 2 +++ 1 3 ++++ 1 4 ++
MS
1 5 + - = No shoots; + = Very less shoots; ++ = Less shoots; +++ = Moderate shoots;
++++ = Optimum shoots
Table - 3 Rooting response of Centella asiatica
Plant Growth Regulators Basal Media IBA (mg/l)
Rate of root formation
1 ++++ 2 ++++ 3 ++ 4 +
MS
5 - - = No root; + = Very less root; ++ = Less root; +++ = Moderate root;
++++ = Optimum root REFERENCES [1] Bakhru, H. K. (2003) Herbs That Heal Natural Remedies
for Good Health, Orient Paperbacks, Delhi, pp.112-115. [2] Banerjee, S., Zehra, M. and Kumar, S. (1999) In vitro
multiplication of Centella asiatica, a medicinal herb from leaf explants. Curr. Sci., 76: 147-148.
[3] Murashige, T. and Skoog, F. (1962) A revised medium for rapid growth and bioassays with tobacco tissue cultures, Plant Physiol., 15: 473-497.
[4] Nadkarni, A. K. (1954) Dr. K. M. Nadkarni’s Indian Materia Medica, Third edition, Two volumes, Popular Book Depot, Bombay, Dhootapapesheshwar Prakashan Ltd., Panvel
[5] Pandey, N. K., Tewari, K. C., Tewari, R.N., Joshi, G. C., Pandey, V.N. and Pandey, G. (1993) Medicinal plants of Kumaon Himalaya, strategies for conservation. In: Dhar U (ed) Himalayan Biodiversity Conservation Strategies, Himavikas Publication, Nanital 3 pp 293-302.
[6] Patra, A., Rai, B., Rout, G. R., and Das, P. (1998) Successful plant regeneration from cultures of Centella asiatica (Linn.) Urban, Plant Growth Regulation 24:13-16.
[7] Sharma, B. L. and Kumar, A. (1998) Biodiversity of medicinal plants of Triyugi Narain (Garhwal Himalaya) and their conservation. National Conference on Recent Trends in Spices & Medicinal Plant Research, Calcutta, WB, India pp 78.
[8] Sutaria, R. N. (1958): A textbook of systematic botany, second edition, Khadayata Book Depot, Book Sellers and Publishers, Ahmedabad, pp 280-281.
[9] Tiwari, K.N., Sharma, N.C., Tiwari, V. and Singh, B.D. (2000): Micropropagation of Centella asiatica (L.), a valuable medicinal herb. Plant Cell, Tissue and Organ Culture 63:179-185.

BIOSORPTION OF HEXAVALENT CHROMIUM USING SPENT BIOMASS
OF OLEAGINOUS Pythium sp.: KINETICS STUDIES IN BATCH MODE
Kavita B., Narendra Bera and Haresh Keharia*
BRD School of Biosciences, Sardar Patel University, Vallabh Vidyanagar 388120 Gujarat, India
ABSTRACT
The effectiveness of low cost, spent biomass of oleaginous Pythium sp (solid biomass left over after extraction of oil from Pythium biomass) was evaluated for removal of Cr(VI) by biosorption as a function of time; initial Cr(VI) concentration and temperature. Batch studies indicated that Cr(VI) biosorption capacity (qeq) of spent biomass achieved equilibrium within 60 minutes under the mixing condition employed. The biosorption of Cr(VI) ions increased as the initial concentration of Cr(VI) ions increased in the aqueous solution. The maximum biosorption capacity of spent biomass at initial Cr(VI) concentration of 100, 200, 300, 400 and 500mg/L was 10.86, 20.87, 26.04, 37.17 and 45.87mg per gram of dry biomass respectively. The activation energy (Ea) of Cr(VI) adsorption by spent Pythium sp. biomass was determined using Arrhenius equation and was found to be -23.18 KJ/mole in the temperature range of 30 to 50°C. Using the equilibrium constant value obtained at different temperatures, the thermodynamics parameters of the biosorption (ΔH and ΔS) were calculated, indicating the endothermic nature of biosorption. Two kinetic models viz. the Lagergren first-order and pseudo-second-order were used to analyse the biosorption data and the results suggested that the pseudo-second-order model represented the best correlation (R2>0.9). The fitness of biosorption equilibrium data for Freundlich and Langmuir adsorption isotherm model indicated that both the models were suitable for biosorption of Cr(VI) onto low cost tested biomass. Key words: Oleaginous fungus, biosorption, kinetic models, thermodynamics, activation energy, adsorption isotherms.
INTRODUCTION
An extensive use of hexavalent chromium in various industrial processes such as electroplating, leather tanning, paints, pigments, textiles, steel fabrication and tanning industries has led to the discharge of chromium to the environment well above the trace limits [1]. The maximum permissible limit of Cr(VI) in wastewater has been recommended as 0.005mg/L by World Heath Organization (WHO). The toxicological effect of Cr(VI) originates due to the action of Cr(VI) as an oxidizing agent [2]. Inhalation and retention of Cr(VI) containing material can cause perforation of the nasal septum, asthma, bronchitis, pneumonitis, inflammation of larynx and liver and increased incidence of bronchogenic carcinoma [3 & 4]. The contact of Cr(VI) compounds with skin may lead to skin allergies, dermatitis, dermal necrosis and dermal corrosion.
Thus, the removal of Cr(VI) ions from wastewater has
become an important and widely studied area where a number of chemical and biological technologies have been developed over the years. The most conventional methods for removing Cr(VI) ions from wastewaters include, physico-chemical treatment technologies such as ion-exchange, electrodialysis, membrane filtration, reverse osmosis and chemical precipitation [5]. These methods have found limited application because they often involve high capital and operational costs.
In contrast, adsorption is an effective and widely used method for removing Cr(VI) from wastewater. In this context, natural materials like microbial biomass or waste products from industrial or agricultural operations may serve the purpose of low-cost, inexpensive biosorbents [6]. Literature survey reveals that several biological materials such as non-living biomass like coconut shell, lignin and scales of fish as well as living biomass like fungi, bacteria, algae have been investigated for the removal of Cr(VI) ions [7-10]. However, the research on Cr(VI) biosorption is still insufficient to cover the investigations of Cr(VI) biosorption using locally available and cheap biosorbents to eliminate Cr(VI) from contaminated waters.
Several species of fungi are reported for their oleaginous property [11 & 12]. Large amount of underutilized waste biomass is obtained after oil extraction and such dead fungal biomass obtained after oil extraction (referred as spent biomass) may be useful as a low cost, efficient biosorbent for Cr(VI).
Biosorption of metals from liquid waste would result in concentration of heavy metals in solid form and thus it is not the ultimate solution to the environmental concern regarding heavy metal pollution and associated toxicity. In this regards, biological detoxification would be obviously preferred over biosorption. For detoxification of Cr(VI) containing wastewaters, the only known biological mechanism is its reduction to Cr(III) which is insoluble and thereby less toxic [1]. However, for certain wastewaters such as effluents from chrome-plating industries, biosorption based removal of Cr(VI) would be preferable owing to its highly acidic pH, at which biological reduction would get severely inhibited. Therefore, we have been working on development of more effective biosorbents for removal of Cr(VI) from liquid wastewaters.
The present work reports the potential of unexploited
spent biomass of Pythium sp for removal of Cr(VI) from aqueous solution. The potential of spent biomass was evaluated as a function of time; initial Cr(VI) concentration and temperature. Further, the kinetic model (viz. the Lagergren first-order and pseudo-second-order) and adsorption isotherms (viz. Langmuir and Freundlich isotherms) were used to analyse the Cr(VI) biosorption data. MATERIALS AND METHODS Chemicals
All the chemicals/reagents used in the present study were
of analytical reagent grades belonging to the brands of Merck, Germany; Hi-Media, India and Sisco Research Laboratory (SRL), India. Preparation of Biosorbents:
For biosorption studies, spent biomass obtained after
extraction of oil from Pythium sp. cultivated under solid-state
PRAJÑĀ - Journal of Pure and Applied Sciences, Vol. 18: 21 - 26 (2010) ISSN 0975 - 2595
*corresponding author: [email protected]

22 PRAJÑĀ – Journal of Pure and Applied Sciences 18: 21 - 26 2010
condition using boiled rice (1 g per 250 mL flask) as a substrate was used. Since it was very difficult to separate the biomass from the substrate, the biomass along with substrate was dried and powdered using mortar and pestle. This powdered spent biomass was preserved in airtight polyethylene containers for further use. The uninoculated rice substrate processed similarly was used as a control. Effect of initial Cr(VI) concentration on Cr(VI) biosorption
10mg/mL of dried and ground spent biomass Pythium sp (along with unutilized solid substrate i.e. rice) was mixed with 100mL of test Cr(VI) solution. The biomass was used as such and no prior treatment was given to the spent biomass. Test solutions containing Cr(VI) ions were prepared from analytical grade potassium dichromate. The concentration of Cr(VI) prepared from stock solution ranged from 100-500mg/L. Before mixing the biomass, the pH of each test solution was adjusted to pH:1.0 by using 1N HCl. After mixing, the experimental set was kept on shaker (150 rpm) at 30°C. Samples of 1mL were collected from conical flasks at regular time intervals and were filtered through Whattman No. 1 filter paper. The filtrates were analyzed for residual Cr(VI) concentration in the solution. Effect of pH on Cr(VI) biosorption
The spent biomass (10 mg/mL) was added to 100 mL Cr(VI) solution (100 mg/L) with varying pH (pH 1.0 to 8.0). The pH of the solution was adjusted using 0.1N HCl /0.1N NaOH. At all pH values, controls without biomass addition were kept in order to compensate the effect of pH on Cr(VI). The amount of chromium adsorbed was monitored by determining residual Cr(VI) in the solution at different time intervals and subtracting it from the initial chromium. Thermodynamic Studies
Effect of temperature on Cr(VI) removal was studied by agitating 100mL of 100mg/L solution of Cr(VI) at different temperatures (25º-50ºC) for different agitation times till equilibrium was attained and then the results were analyzed to determine the rate of biosorption at different temperatures. The activation energy of the biosorption process was calculated by employing Arrhenius equation as follows
ln k = −Ea/R T + lnAo (1)
Where Ea is activation energy and Ao is constant called the Frequency factor. Value of Ea can be determined from the Slope (-Ea/R) of ln k versus 1/T plot [13]. The thermodynamic parameters of the biosorption i.e. the enthalpy change (ΔH) and entropy change (ΔS) were calculated using the Van’t Hoffs plot (ln Kc Vs 1/T) given as;
RTH
RSKc °Δ
−°Δ
=ln (2)
Where, T is the temperature in Kelvin, R is the universal gas constant (0.0083 KJ/mol) and Kc is equilibrium constant calculated as,
(3)
Here, Qeq is the amount of Cr(VI) adsorbed per unit biomass (mg/g biomass) and Ceq is the Cr(VI) concentration in solution at equilibrium [14 & 15]. Kinetics of Cr(VI) biosorption
Experimental data can be tested using kinetic models in order to investigate the mechanism of biosorption and potential rate controlling steps such as mass transport and chemical reaction processes. The commonly studied kinetic model for modelling the kinetics of Cr(VI) ion biosorption includes, Lagergren-first order and pseudo-second order rate equation [16].
Linear form of Lagergren -first order rate equation is expressed as follows;
eq
eq
CQ
Kc =
303.2log)log( 1tkqeqqq teq −=− (4)
Where, qt and qeq is sorption capacity at time t and at equilibrium respectively and k1 is pseudo-first order rate constant.
In case the biosorption follows Lagergren -first order rate
equation, a plot of log( qeq - qt ) vs t should generate straight line with intercept of log qeq and slope of –k1/2.303. Similarly, linear form of pseudo-second rate equation is expressed as
eqeqt qt
qkqt
+= 22 )(
1 (5)
Where, k2 is pseudo second order rate constant.
In case the biosorption follows pseudo-second order rate equation, a plot of t/qt vs t should generate a straight line with intercept of 1/k2qeq
2 and slope of 1/qeq. The shape (linearity) of graph and comparison of
experimental and calculated qeq values can help in deciding which kinetic model is followed by biosorption process. Another important factor which influences the kinetic model is the value of coefficient of determination; R2. A value of R2> 0.9 shows the suitability of model for describing the kinetics.
Equilibrium model for Cr(VI) biosorption
Adsorption isotherm, based on equilibrium data are basic requirements for the design of adsorption systems. Classical adsorption models (Langmuir and Freundlich isotherms) were used to describe the equilibrium between adsorbed metal ions on the spent biomass of Pythium sp (qeq) and metal ions in solution (Ceq) as a function of different Cr(VI) concentrations.
The Freundlich isotherm equation is an empirical equation
based on the biosorption on a heterogeneous surface suggesting that the binding sites are not equivalent or dependent [17], whereas Langmuir isotherm equation is based on monolayer sorption onto a surface with finite number of identical sites, which are homogeneously distributed over the sorbent surface [18]. Analysis of Cr(VI) ions
The concentration of the Cr(VI) ions was determined
spectrophotometrically after complexation of the Cr(VI) ion with 1, 5-diphenylcarbazide [19]. The absorbance was recorded

December Kavita et al. - Biosorption of hexavalent 23
at 540nm and concentration was determined from the calibration curve. RESULTS AND DISCUSSION Effect of contact time on Cr(VI) ion biosorption by spent biomass of Pythium sp.
The present study on time dependent profile of Cr(VI) biosorption by spent biomass indicated that a rapid major part of Cr(VI) biosorption occurred in the first 240 minutes of incubation (Fig. 1). There was no considerable increase in the Cr(VI) biosorption after 240 minutes. The biosorption became slow in later stage because in the initial stage of Cr(VI) biosorption, a large number of unoccupied surface sites were available for biosorption, whereas in the later stages the remaining vacant surface sites probably became inaccessible. These results are at par with the reports on two phase Cr(VI) biosorption by Mucor hiemalis and Rhizopus nigricans [20, 21].
0
2
4
6
8
10
12
0 100 200 300 400 500
Time (min)
Cr(V
I) Bi
osor
ptio
n (m
g/g)
Fig. 1 Time course for Cr(VI) biosorption using spent biomass of
Pythium sp.
Fig. 2 Effect of initial Cr(VI) ion concentration on biosorption efficiency(mg/g) of spent biomass Pythium sp. cultivated using boiled rice as substrate under solid state conditions.
Effect of initial concentration of Cr(VI) ions
Fig. 2 shows that Cr(VI) biosorption increased from
10.6 to 40.9 mg/g biosorbent with the increase in initial Cr(VI) concentration from 100mg/L to 500mg/L. The maximum biosorption of Cr(VI) was found to be 40.9 mg Cr(VI)/g of spent biomass at an initial concentration of 500mg Cr(VI)/L. The increased Cr(VI) biosorption from concentrated Cr(VI) solution can be attributed to an increase in the number of Cr(VI) ions competing for the available functional groups present on the surface of biomass [22]. This in turn would increase the higher probability of collision between Cr(VI) ions and biosorbents thereby providing the driving force to overcome all mass transfer resistance of metal ions between the aqueous and solid phase.
In order to understand the mechanism of Cr(VI) biosorption, the adsorption data were fitted to Lagergren first-order and pseudo-second order kinetic model. It was found that Cr(VI) biosorption by spent biomass follows a pseudo-second order rate kinetics (Fig. 3). The pseudo-second order kinetic model demonstrates that the metal biosorption process is dependent on the number of metal ions present in the solution as well as the free biosorption sites on the biosorbent surface. Additionally, the second order rate constant K2 and qeq calculated from the intercept and slope of the plots are summarized in Table 1. It clearly appears from the data that with increase in Cr(VI) ion concentration, value of qeq increases linearly. The theoretical qeq value shows a lot of resemblance to the experimental qeq values. The correlation coefficient (R2) for the second order kinetics were greater than 0.9 (R2>0.9) for all Cr(VI) concentration tested. Some of the very recent investigations concerning the kinetics of Cr(VI) adsorption onto various biosorbents have also reported higher correlations for pseudo-second order model [23 & 24].
Fig. 3 Linearized pseudo second-order kinetic plots at varying initial concentrations of Cr(VI) ions (100-500 mg/L).
0
5
10
15
20
25
30
35
40
45
50
0 100 200 300 400 500
t (min)
t/q (
mg.
min
/g )
100ppm 200ppm 300ppm 400ppm 500ppm
0
5
10
15
20
25
30
35
40
45
0 100 200 300 400 500Time (min)
Cr(V
I) Bi
osor
ptio
n (m
g/g)
100ppm 200ppm 300ppm 400ppm 500ppm

24 PRAJÑĀ – Journal of Pure and Applied Sciences 18: 21 - 26 2010
Table - 1 Pseudo-second order kinetic parameters for Cr(VI) biosorption at varying initial concentrations of Cr(VI) ions.
Kinetic Parameters
qeq; (mg/g) Cr(VI); mg/L
Experimental Calculated. K2;
(g/mg.min) R2
100 10.6 ± 0.476 10.8 0.00529 0.9955 200 20.2 ± 0.765 20.8 0.001582 0.9893 300 26.03 ± 0.290 26.04 0.00095 0.9726 400 35.04 ± 3.3 37.17 0.000493 0.9711 500 40.9 ± 1.83 45.87 0.000318 0.9508
Effect of pH and Temperature
The Cr(VI) biosorption was found to be maximum at pH1.0 and remained fairly constant upto pH 6.0, while biosorption efficiency decreased significantly with further increase in pH upto 8.0 (data not shown). The increase in adsorption with decrease in pH may be due to protonation of functional groups involved in biosorption of negatively charged chromate ions. At alkaline pH the overall charge on the biosorbent surface would become negative and consequently due to respective charge repulsion of negatively charged Cr ions like HCrO4
- , Cr2O72-, CrO4
2-, resulting into lower adsorption efficiency [20]. Hence, electrostatic attraction probably plays an important role in biosorption of negatively charged chromium ions at low pH. Additionally, the dominant form of Cr(VI) at pH 1.0 is the acid chromate ion species (HCrO4
-) and increasing pH shifts the concentration of HCrO4-
to other forms, CrO42- and Cr2O7
2-. Since there is an increase in sorption of Cr(VI) as pH decreases to 1.0, it may be suggested that HCrO4
- is the active form of Cr(VI) which is being absorbed by the acid treated fungal biomass.
Temperature plays a critical role in biosorption of metal ions. Temperature, under certain range can have an influence (positive/negative) on the biosorption of metal ions [10]. Fig. 4 shows the effect of temperature (25-50°C) on the biosorption of Cr(VI) by the spent biomass of Pythium sp. as a function of time. The Cr(VI) biosorption efficiency(mg/g) of the biosorbent increased with increase in temperature from 25–50ºC. However the initial rate of biosorption was found to decrease with increase in temperature. The initial rate of Cr(VI) biosorption decreased drastically with increase in temperature from 25ºC to 30ºC, while it decreased slowly and linearly with further increase in temperature upto 50ºC. This may be due to presence of two types of biosorbents in spent biomass, viz. fungal biomass and residual substrate.
Based on the values of initial biosorption rates obtained at
these five different temperatures, the activation energy (Ea) from the Arrhenius equation was found to be -23.18 KJ/mole (Fig. 5). This suggested that rate of Cr(VI) biosorption was not significantly influenced by process temperature in the temperature range of 30-50ºC. The reactions exhibiting these negative activation energies may be considered as typically barrierless reaction. Such reaction either relies on the capture of the molecules in a active site or the biosorption of Cr(VI) on spent fungal biomass may follow a two step reaction and might involve a transition where rate constants show different dependence on temperature resulting in net negative activation energy [25]. This observation can be further substantiated by the fact that the spent biomass used in the present study consisted of both substrate and biomass and both of these can contribute in biosorption process through different dependence on temperature.
Fig. 4 Effect of temperature (25-50ºC) on Cr(VI) biosorption efficiency (mg/g) of spent biomass Pythium sp. cultivated using boiled rice as substrate under solid state conditions.
Fig. 5 Arrhenius plot for Cr(VI) biosorption using spent biomass of Pythium sp.
Temperature dependence of the biosorption process is
associated with several thermodynamic parameters. The values of ΔS and ΔH for Cr(VI) biosorption using spent biomass were calculated from slope and intercept of the Vant Hoff’s plot (Figure not shown). The positive value of ΔH (13.56KJ/mol) suggests the biosorption process as a net endothermic process. Likewise, the positive value of ΔS (0.034kJ/mol) reflects the affinity of Cr(VI) for the biosorbent used [14 & 15]. In addition, positive value of ΔS also shows an increasing randomness at the solid/liquid interface during the biosorption of Cr(VI) on tested biomass. Analysis of adsorption isotherm:
The purpose of adsorption isotherm is to relate the metal concentration adsorbed on the sorbent with metal concentration
4
4.5
5
5.5
6
6.5
7
7.5
8
8.5
9
9.5
0 20 40 60 80 100 120Time (min)
Cr(V
I) Bi
osor
ptio
n (m
g/g)
25ºC 30ºC 35ºC 40ºC 50ºC
y = 2793.4x - 11.63R2 = 0.9289
-3.2
-3
-2.8
-2.6
-2.4
-2.2
-20.00305 0.0031 0.00315 0.0032 0.00325 0.0033 0.00335
ln K1/
T (k
)

December Kavita et al. - Biosorption of hexavalent 25
in the bulk solution. The analysis of the isotherm data is important to develop an equation that accurately represents the biosorption results. The isotherm can be described by several sorption isotherm models, of which Langmuir and Freundlich are the most widely referred equation. Both Langmuir and Freundlich isotherm models were evaluated to examine Cr(VI) biosorption with increasing concentration of Cr(VI). Fig. 6 shows typical linearized plots of Langmuir and Freundlich isotherm models for increasing concentration of Cr(VI). The linear plots of Ceq/q versus Ceq and ln qeq versus ln Ceq confirmed that adsorption follows both Langmuir and Freundlich adsorption model.
Fig. 6 Assessment of Cr (VI) biosorption by (A) Langmuir isotherm, (B) Freundlich isotherm at varying initial Cr(VI) ion concentration (100 – 500mg/L).
The correlation coefficients (R2) of both the isotherm were greater than 0.9 (R2 > 0.9) indicating a good mathematical fit. This in turn suggests the presence of two different binding sites with two different mechanisms. As mentioned earlier, the biosorbent employed in present study is a mixture of fungal biomass and residual solid substrate. Thus it is obvious, that two different components represent two different types of metal
binding sites and each may differ in the way it interacts with the metal ions.
The Langmuir and Freundlich adsorption constants calculated from the corresponding isotherms are presented in Table 2. Freundlich isotherm constants Kf and n was calculated as 8.3 and 1.13 respectively. The high magnitude of Kf and n illustrate high adsorption capacity of biomass. Likewise, Langmuir constants related to bonding energy of the adsorption (b) and maximum adsorption capacity (Q) were calculated as 0.0081 and 32.05 mg/g respectively.
Table - 2 Cr(VI) biosorption isotherm parameters for Cr(VI) biosorption by spent biomass of Pythium sp.
Freundlich Isotherm Constants Langmuir Isotherm Constant
y = 0.5357x + 1.343R2 = 0.9721
0
0.5
1
1.5
2
2.5
3
3.5
4
3 3.5 4 4.5 5 5.5 6ln Ceq
ln q
eq
A
y = 0.031274x + 3.847233R2 = 0.9355
0
2
4
6
8
10
12
14
0 50 100 150 200 250 300Ceq
Ceq
/qeq
B
n Kf,; mg/g R2 b Q; mg/g R2
1.86 3.83 0.9721 0.0081 32.05 0.9355
Further, based on the linearity of the isotherms it can be hypothesized that spent biomass of Pythium sp. offers two different binding sites, which contribute in Cr(VI) binding differently. Adsorption of Cr (VI) at one site is a complex-process involving multilayer, interactive or multiple site type binding which follows Freundlich isotherm and at the same time, the other type of binding sites follow Langmuir isotherm, which is based on monolayer sorption onto surface with finite number of identical sites, which are homogeneously distributed over the sorbent surface [26]. The adsorption studies with only Pythium sp. biomass suggests that it follows Freundlich isotherm for Cr(VI) biosorption [27]. Thus it may be further extrapolated that residual rice substrate probably follows Langmuir isotherm for Cr(VI) biosorption.
CONCLUSION
Spent biomass obtained after extraction of oil from Cr(VI) tolerant Pythium sp. was used for biosorption of hexavalent chromium. The biosorption was found to follow pseudo-second order kinetics. The thermal kinetics suggests that biosorption in this case may be a endothermic two-step process with net negative activation energy for Cr(VI) sorption. Moreover, the biosorption followed both Langmuir and Freundlich isotherm models suggesting the presence of two different types of binding sites with two different mechanisms. ACKNOLEDGEMENT
Authors are thankful to Department of Science and Technology (DST) and University Grant Commission (UGC), New Delhi for financial assistance. REFERENCES [1] Mcgrath, S. P. and Smith, S. (1990) Chromium and nickel.
In Heavy Metals in Soils (Ed. Alloway, B. J.), Wiley, New York. pp 125-150.
[2] Papp, J. F. (1985) Chromium. Mineral Facts and Problems. In Bureau of Mines Bulletin 675 (Ed. Knoerr, A. W.), U.S. Government Printing Office, Washington. pp 139-153.
[3] Costa, M. (1997) Toxicology and Carcinogenicity of Cr(VI) in animal models and humans. Critical Reviews in Toxicology, 27: 431-442.
[4] Venitt, S. and Levy, L. S. (1974) Mutagenicity of chromate in bacteria and its relevance to chromate carcinogenesis. Nature, 250: 493-495.

26 PRAJÑĀ – Journal of Pure and Applied Sciences 18: 21 - 26 2010
[5] Losi, M. E., Amrhein, C. and Frankenberger, W. T. (1994) Factors affecting chemical and biological reduction of hexavalent chromium in soil. Environmental Toxicology and Chemistry, 13:1727-1735.
[6] Saha, B., and Orvig, C. (2010) Biosorbents for hexavalent chromium elimination from industrial and municipal effluents. Coordination Chemistry Reviews (In Press).
[7] Gupta, V. K., Shrivastava, A. K. and Jain, N. (2001) Biosorption of Cr(VI) from aqueous solutions by green algae Spirogyra species. Water Research, 35: 4079- 4085.
[8] Srividya, K. and Mohanty, K. (2009) Biosorption of hexavalent chromium from aqueous solutions by Catla catla scales: Equilibrium and kinetics studies. Chemical Engineering Journal, 155: 666-673.
[9] Pino, G. H., Mesquita, L. M. S., Torem, M. L. and Pinto, G. A. S. P. (2006) Biosorption of cadmium by green coconut shell powder. Minerals Engineering, 19: 380-387.
[10] Khambhaty, Y., Mody, K., Basha, S. and Jha, B. (2009) Biosorption of Cr(VI) onto marine Aspergillus niger: Experimental studies and pseudo-second order kinetics. World Journal of Microbiology and Biotechnology, 25:1413-1421.
[11] Gandhi, S. R. and Weete, J. D. (1991) Production of the polyunsaturated fatty acids arachidonic acid and eicosapentaenoic acid by the fungus Pythium ultimum. Journal of General Microbiology, 137: 1825-1830.
[12] Stredansky, M., Conti, E. and Salarios A. (2000) Production of polyunsaturated fatty acids by Pythium ultimum in solid-state cultivation. Enzyme and Microbial Technology, 26: 304-307.
[13] Aksu, Z. (2005) Application of biosorption for the removal of organic pollutants: A review. Process Biochemistry, 40: 997-1026.
[14] Aydin, Y. A. and Aksoy, N. D. (2009) Adsorption of chromium on chitosan: Optimization, kineics and thermodynamics. Chemical Engineering Journal, 151: 188-194.
[15] Ucun, H., Bayhan, Y. K. and Kaya, Y. (2008) Kinetic and thermodynamic studies of the biosorption of the Cr(VI) by Pinus sylvestris Linn. Journal of Hazardous Materials, 153: 52-59.
[16] Farooq, U., Kozinski, J. A., Khan, M. A. and Athar, M. (2010) Biosorption of heavy metal ions using wheat based
biosorbents- A review of the recent literature. Bioresource Technology, 101: 5043-5053.
[17] Freundlich, H. M. F. (1906) Uber die adsorption in lasungen. The Journal of Physical Chemistry, 57: 385-470.
[18] Langmuir, L. (1916) The constitution and fundamental properties of solids and liquids. Journal of American Chemical Society, 38: 2221- 2229.
[19] Anon (1998) Metals: Standard Methods for Determination of Water and Waste Water, (20th Ed. Clesceri, L.S., Greenberg, A.E. and Eaton, A.D.) Part 3000, Washington, D.C., American Public Health Association, pp. 65 – 68.
[20] Tewari, N., Vasudevan, P. and Guha, B.K. (2005) Study of biosorption of Cr(VI) by Mucor hiemalis. Journal of Biochemical Engineering, 23:185-192.
[21] Bai, S. R. and Abraham, T. E. (2001) Biosorption of Cr(VI) from aqueous solution by Rhizopus nigricans. Bioresource Technology, 79: 73-81.
[22] Bayramoglu, G., Celik, G., Yalcin, E. and Arica, Y. M. (2005) Modification of surface properties of Lentinus sajor-caju mycelia by physical and chemical methods: evaluation of their Cr(VI) removal efficiencies from aqueous medium. Journal of Hazardous Materials, 119: 219-229.
[23] Ye, J., Yin, H., Mai, B., Peng, H., Qin, H., He, B. and Zhang, N. (2010) Biosorption of chromium from aqueous solution and electroplating waste waster using mixture of Candida lipolytica and dewatered sewage sludge. Bioresource Technology, 101: 3893-3902.
[24] Arica, M. Y., and Bayramoglu, G. (2005) Cr(VI) biosorption from aqueous solutions using free and immobilized biomass of Lentinnus sajor-caju: preparation and kinetic characterization. Colloids and surfaces A: Physicochem. Enng. Aspects, 253: 203-211.
[25] Muench, J. L., Kruuv, J. and Lepock, J. R. (1996) A two step reversible-irreversible model can account for a negative activation energy in an Arrhenius plot. Cryobiology, 33:253-259.
[26] Wang, J. and Chen, C. (2009) Biosorbents for heavy metals removal and their future. Biotechnology Advances, 27:195-226.
[27] Kavita, B., Limbachia, J. and Keharia, H. (2010) Hexavalent chromium sorption by biomass of chromium tolerant Pythium sp. Journal of Basic Microbiology (In Press).

A PRELIMINARY STUDY ON COCCINIA INDICA FRUIT MUCILAGE EXTRACT
AS COAGULANT-FLOCCULENT FOR TURBID WATER TREATMENT
Varsha Patale and Punita Parikh*
Department of Botany, Faculty of Science, M. S. University of Baroda, Vadodara, Gujarat - 390 002
ABSTRACT Lab scale experiments were conducted to investigate the efficiency of mucilage isolated from the fruits of Coccinia indica as flocculent for the treatment of turbid water samples containing synthetic turbidity of kaolin. Jar test experiments at optimum pH and time were carried out for 10, 25, 50, 75 and 100 (NTU) levels of turbidity in the flocculent dose range, of 0.1 mg, 0.2 mg, 0.4 mg, 0.8 mg, 1.2 mg, 1.6 mg and 2.0 mg/l. The flocculation efficiency of C. indica fruit mucilage (also known as Kundoor mucilage) at different turbidity levels and the effects of flocculent dose on percent removal of turbidity are reported. At all the experimental turbidity levels, the increased flocculent dose increased the percentage of turbidity removal upto a certain level, beyond which further increase in dosage showed a decreasing trend in the removal. The optimum dose of the flocculent in the present study was found to be 0.4 mg/l. C. indica mucilage has higher efficiency in removing high turbidity in comparison with low turbidity. Highest turbidity removal (94%) was obtained with very high i.e. 100 NTU initial turbidity. The mucilage of C. indica fruit is an ecofriendly and low cost anionic polysaccharide capable of reducing suspended particles helps in lowering turbidity of water/wastewater through flocculation process. Key words: coagulant, Coccinia indica, flocculation, kaolin, turbidity.
INTRODUCTION Growing population, increased economic activity and
industrialization has not only created an increased demand for fresh water but also resulted in severe misuse of these natural resources. Water resources all over the world are threatened not only by over exploitation and poor management but also by ecological degradation. The cost of water treatment is increasing and the quality of river water is not stable due to a suspended and colloidal particle load caused by land development and high storm runoff during rainy season, such is experienced in a country like India. About 1.2 billion people still lack safe drinking water and more than 6 million children die from diarrhea in developing countries every year. In many parts of the world, river water that can be highly turbid is used for drinking purposes. World Health Organization (WHO) has set the guideline value for the residual turbidity in drinking water at 5 Nephelometric Turbidity units (NTU) [1].
As identified by the United States Environmental Protection Agency (USEPA), turbidity is a measure of the cloudiness of water; it is used to indicate water quality and filtration effectiveness. High turbidity levels are often associated with higher levels of disease-causing microorganisms such as viruses, parasites and some bacteria in the water. These organisms can cause symptoms such as nausea, cramps, diarrhoea and headaches [2]. Water-borne infectious diseases caused by viruses, bacteria, protozoa and other microorganisms are associated with outbreaks and background rates of diseases in developed and developing countries worldwide[3].
Developing countries pay a high cost to import chemicals
including polyaluminium chloride and alum [4, 5] for water purification. This is the reason why these countries need low cost methods requiring low maintenance and skill. Nowadays, polyaluminium chloride is widely used in water treatment plants all over the world. Polyaluminium chloride and alum add impurities such as epichlodine are carcinogenic [6, 7]. Aluminium is regarded as an important poisoning factor in dialysis encephalopathy. Aluminium is one of the factors which might contribute to Alzimer disease [8, 9]. Aluminium reaction
with water alkalinity reduces water pH and its efficiency in cold water [10, 11]. However some synthetic organic polymers such as acrylamide have neurotoxicity and strong carcinogenic effect [6, 8]. Coagulation has been subject of much research, most of which has been related to coagulation in the context of water treatment. Inorganic coagulants such as alum in combination with lime have been conventionally used for removal of turbidity from surface waters. The sludge formed from such treatment poses disposal problems because of its aluminium content and tend to accumulate in the environment and also because of large volume [12]. Therefore, it is desirable that other cost effective and more environmentally acceptable alternative coagulants be developed to supplement if not replace alum, ferric salts and synthetic polymers. In this context, natural coagulants present viable alternatives for developing countries [13, 14].
Natural macromolecular coagulants are promising and
have attracted the attention of many researchers because of their abundant source, low price, multi-purposeness and biodegradation [10, 13, 15]. Okra, Rice, Moringa olifera and chitosan are natural compounds which have been used in turbidity removal [16, 17, 18]. The present study used a coagulation-filtration test using Coccinia indica mucilage extract as coagulant for water treatment and as flocculent aid for wastewater treatment. MATERIALS AND METHODS
In coagulation experiments, samples of turbid water were prepared by adding kaolin into distilled water. 10 gm of measured kaolin powder (Fluka Company) was dried in an oven with the temperature 105ºC for 5 hours. After that it was removed from the oven and was embedded in desiccators for half an hour. Then 100 ml of distilled water was added to the kaolin powder. Suspension was kept at room temperature for 24 hours and was completely mixed for 20 minutes by an electrical blender. The suspension was kept in stable conditions for 4 hours in order to settle coarser particles. One litre of supernatant was transferred to erlenmayer flask and was kept as stock solution [19, 20.] From this stock solution, desired
PRAJÑĀ - Journal of Pure and Applied Sciences, Vol. 18: 27 - 30 (2010) ISSN 0975 - 2595
*Corresponding author: [email protected]

28 Patale and Parikh – A preliminary study on Coccinia indica 2010
experimental turbidities of 10 NTU, 25 NTU, 50 NTU, 75 NTU and 100 NTU were generated.
To obtain Coccinia indica mucilage extract (also known
as Kundoor mucilage), the fruits were thoroughly washed with water, cut into pieces and then soaked in distilled water overnight. The mucilaginous extract was filtered through muslin cloth. It was precipitated from the extract by addition of alcohol. The precipitate was washed with acetone 2-3 times and finally dried by keeping in oven at 40º C for 24 hours. It is easily soluble in water. The filtered extracted was then used in the experiment [13, 14] after optimizing the pH and time of contact between the flocculent and suspended particles in the solution (unpublished data). Jar test method as described in [21] on Flocculator was carried out on experimental turbid water samples with 0.1 mg, 0.2 mg, 0.4 mg, 0.8 mg, 1.2 mg, 1.6 mg and 2.0 mg/l mucilage extracts of Coccinia indica. The speed of fast and slow mix was respectively 180 rpm for 10 minutes and 40 rpm for 20 minutes and the settling time was considered to be 1 hour. The final turbidity of each test sample was measured by digital Nephelo turbiditymeter. RESULTS
The result of effect of different dosage of C. indica mucilage at 10 NTU is represented in Fig 1. Initially as the dose increased from 0.1 to 0.4 mg/l, the % removal of turbidity from the test solution also increased. But thereafter with the increase in the dosage, there is a decline in the removal. Maximum turbidity removal was reported at 0.4mg/l dose of C. indica mucilage. Similar results were obtained with the test solutions of 25, 50, 75 and 100 NTU turbidities (Fig 2, 3, 4 and 5). Moreover, in high turbid test solution i.e. 100 NTU the percentage of removal was the highest as compared to low turbid solutions. Therefore C. indica mucilage extract was found to be effective in the treatment of high turbid waters. From the graphs it is clear that all the experimental dosage of C. indica mucilage can more or less remove turbidity from the test solutions.
Fig. 1 C. indica fruit mucilage extract at different dose in 10 NTU solutions.
Fig. 2 C. indica fruit mucilage extract at different dose in 25 NTU solutions
Fig. 3 C.indica fruit mucilage extract at different dose in 50 NTU solutions
Fig. 4 C. indica fruit mucilage extract at different dose in 75 NTU solutions
0%
10%
20%
30%
40%
50%
60%
70%
80%
Tur
bidi
ty r
emov
al %
Dose mg/l
0.1 mg/l 0.2 mg/l 0.4 mg/l 0.8 mg/l 1.2 mg/l 1.6 mg/l 2.0 mg/l
0%
10%
20%
30%
40%
50%
60%
70%
80%
90%
Tur
bidi
ty r
emov
al %
Dose mg/l
0.1 mg/l 0.2 mg/l 0.4 mg/l 0.8 mg/l 1.2 mg/l 1.6 mg/l 2.0 mg/l
81%
82%
83%
84%
85%
86%
87%
88%
89%
90%
Tur
bodo
ty r
emov
al %
Dose mg/l
0.1 mg/l 0.2 mg/l 0.4 mg/l 0.8 mg/l 1.2 mg/l 1.6 mg/l 2.0 mg/l
0%
10%
20%
30%
40%
50%
60%
70%
80%
90%
Turb
idity
rem
oval
%
Dose mg/l
0.1 mg/l 0.2 mg/l 0.4 mg/l 0.8 mg/l 1.2 mg/l 1.6 mg/l 2.0 mg/l

29 PRAJÑĀ – Journal of Pure and Applied Sciences 18: 27 - 30 December
Fig. 5 C. indica fruit mucilage extract at different dose in 100 NTU solutions
Dosage was one of the most important parameters that
have been considered to determine the optimum condition for the performance of C. indica fruit mucilage in coagulation and flocculation. There are several researches which reported that initially, with an increase in the dose of plant material (flocculent) the percentage removal of turbidity increases, but after a certain dose, a decreasing trend in removal is seen with an increase in the dose of the flocculent [22, 23, 24]. The behaviour could be explained by the fact that the optimal dose of flocculent in suspension causes larger amount of solid to aggregate and settle. However an overoptimal amount of flocculent would cause the aggregated particles to re-disperse in the suspension and would also disturb particle settling. Our results are in agreement with the previous reports. The optimum dose of the C. indica fruit mucilage in the present study was found to be 0.4 mg/l.
The present study also showed that the fruit extract of C.
indica mucilage has higher efficiency in removing high turbidity in comparison with low turbidity. Highest turbidity removal (94%) was obtained with very high i.e. 100 NTU initial turbidity whereas the lowest turbidity removal of 82% was observed with water containing initial turbidity of 10 NTU. The coagulation efficiency of C. indica mucilage in the current study was found to be dependent on initial turbidity of water samples. This type of results had been obtained by several researchers [25, 26, 27]. Hence it is concluded that the turbidity removal is influenced by the initial turbidity of the test solutions.
The use of plant materials as natural coagulants-
flocculants to clarify turbidity of wastewaters is of common practice since ancient times. Natural anionic polysaccharide present in C. indica mucilage is found to be a very effective flocculent capable of removing almost 94 % of suspended solid from turbid water samples. A very low flocculent concentration of 0.4 mg/l was capable of removing appreciable amount of suspended particles. There are several reports which suggest that natural water-soluble polysaccharides have capability of flocculating small particles and of causing turbulent drag reduction. These properties have been ushered in their novel applications in agriculture, in effluent treatment and mineral beneficiation. Natural polymers such as starch, sodium alginate, amylopectin, guar gum, xanthan gum, kendu gum, chitosan, okra mucilage and psyllium mucilage [28] find extensive application as flocculants. These anionic polymers present in the mucilage make larger flocs with the suspended
particles in the wastewater by bridging mechanism, finally settled them down and can be easily removed from turbid waters. The possibility of industrial application of this biodegradable flocculent to clarify turbid wastewater may be explored to evaluate their full potential. ACKNOWLEDGEMENT
The present study has been financed by University Grant
Commission, New Delhi, India. The authors are thankful to University Grant Commission for their financial sport.
REFERENCES [1] McConnachie, G. L., Folkard, G.K., Matawali, M. A. and
Surtherland, J.P. (1999) “Field trials of appropriate hydraulic flocculation process” J. Water Research, 33 (6): 1425-1434.
[2] Retrieved October 24, 2008. http//www.epa.gov/safewater /contaminants/index.html.
[3] Retrieved October 24, 2008. http://www.who.int/water_ sanitation_health/dwq/infectdis/en/index.html.
[4] Ghebremichael, K. A. (2004) Moringa seed and pumice as natural alternative materials for drinking water treatment. Ph. D. Thesis, Royal Institute of Technology, Stockholm, Sweden.
[5] Yarahmadi, M., Hossieni, M., Bina, B., Mahmoudian, M. H., Naimabadie, A. and Shahsavani, A. (2009) “Application of Moring olifera Seed Extract and Polyaluminium Chloride in Water Treatment” J. World Applied Sciences Journal, 7 (8) : 962-967.
[6] Ghebremichael, K. A., Gunaratna, K. R., Henriksson, H., Brumer and Dalhammar, G. (2005) “A simple purification and activity assay of the coagulant protein from Moring olifera seed” J. Water Research, 39 (11): 2338-2344.
[7] Muyibi, S. and Alfugara, M. S. (2003) “Treatment of surface water with Moring olifera seed extract and alum- a comparative study using a pilot scale water treatment plant” Intern. J. Environ. Studies, 60 (6): 617-626.
[8] Okuda, T., Baes, A. U., Nishijima, W. and Okada, M. (1999) “Improvement of extraction method of coagulation active components from Moring olifera seed” J.Water Research, 33 (15): 3373-3378.
[9] Sharma, P., Kumari, P., Srivastava, M. M. and Srivastava S. (2006) “Removal of cadmium from aqueous system by shelled Moringa oleifera Lam. Seed powder” Bioresource Technol. 97 (2): 299-305.
[10] Katayon, S., Megat, M. N., Asma, M., Ghani, L. A. A. and Suleyman, A. M. (2005) “Effect of storage conditions of Moring olifera seeds on its performance in coagulation” J. Bioresource Technology, 97 (13):1455-1460.
[11] Santos, A. F. S., Argolo, A. C. C., Coelho, L. C. B. B. and Paiva, P. M. G. (2005) “Detection of water soluble lectin and antioxidant component from Moring olifera seeds”. J. Water Research, 39: 975-980.
[12] Divakaran, R. and Pillai, V. N. S. (2001) “Flocculation of Kaolinite suspensions in water by Chitosan”. J. Water Research. 35 (16): 3904-3908.
[13] Ndabigengesere, A. and Narasiah, K. S. (1998) “Use of Moringa olifera seed as a primary coagulant in wastewater treatment”. J. Environmental Technology, 19: 789-800.
[14] Muyibi, S., Megat, M. and Loon, L. (2002) Effects of Oil Extraction from Moring olifera seeds on coagulation of turbid water” J. Environ. Studies, 59 (2): 243-254.
0%
10%
20%
30%
40%
50%
60%
70%
80%
90%
100%
Turb
idity
rem
oval
%
Dose mg/l
0.1 mg/l 0.2 mg/l 0.4 mg/l 0.8 mg/l 1.2 mg/l 1.6 mg/l 2.0 mg/l

30 Patale and Parikh – A preliminary study on Coccinia indica 2010 [15] Okuda, T., Bases, A. U., Nishijima, W. and Okada, M.
(2001) “Isolation and Characterization and Coagulant extracted from Moringa olifera seed by salt solution”. J. Water Research, 35 (2): 405-410.
[16] Diaz, A., Rincon, N., Escorihuela, A., Fernandez, N., Chacin, E. and Forster, C. F. (1999) “A preliminary evaluation of turbidity removal by natural coagulants indogenous to Venezuela”. J. Process Biochem. 35: 391-395.
[17] Ozacar, M. and Sengil, A. (2002) “The use of tannins from Turkish acorns (valonia) in water treatment as a coagulant aid”. Turkish J. Eng. Env. Sci, 26: 255-263.
[18] Roussy, J., Vooren, M. and Guibal, E. (2004) “Chitosan for the coagulation and flocculation of mineral colloids”. J. Disp. Sci. Techno, 25 (5): 663 677.
[19] Yarahmadi, M., Hossieni, M., Bina, B., Mahmoudian, M. H., Naimabadie, A. and Shahsavani, A. (2009) “Application of Moring olifera Seed Extract and Polyaluminium Chloride in Water Treatment” J. World Applied Sciences Journal, 7 (8): 962-967.
[20] Zhang, J., Zhang, F., Luo, Y. and Yang, H. (2006) “A prelimary study on cactus as coagulant in water treatment” J. Process Biochem, 41 (3): 730-733.
[21] Muyibi, S. A., Abbas, S. A., Noor, M. J. M. M., Ahmadon, F. R. (2003) "Enhanced coagulation efficiency of Moringa oleifera seeds through selective oil extraction," IIUM Engineering Journal, 4 (1): 1-11.
[22] Mishra, A., Srinivasan R., Bajpai, M. and Dubey, R. (2004) “Use of polyacrylamide-grafted Plantago psyllium mucilage as a flocculant for treatment of textile wastewater”. Colloid and Polymer Science, 282: 722-727.
[23] Mishra, A., and Bajpai, M. (2005) “Flocculation behaviour of model textile wastewater treated with a food grade polysaccharide”. J. Hazard Mater, 14: 118 (1-3):213-7.
[24] Chaudhuri, M. and Khairuldin, P. S. A. B. (2009) “Coagulation-Clarification of Coloured Water by Natural Coagulant (Moringa oleifera) Seed Extract.” Nature Environment and Pollution Technology, 8 (1):137-139.
[25] Diaz, A., Rincon, N., Escorihuela, A., Fernandez, N., and Forster, C.F. (1999) “A preliminary evaluation of turbidity removal by natural coagulants indigenous to Venezuela”. Process Biochemistry 35 (3): 391-395.
[26] Nkurunziza, T., Nduwayezu, J. B., Banadda, E. N., Nhapi, I. (2009) “The effect of turbidity levels and Moringa oleifera concentration on the effectiveness of coagulation in water treatment”. Water Sci. Technol, 59 (8):1551-1558.
[27] Konstantinos, A., Dimitrios, K. and Evan, D. (2009) “Flocculation behavior of mallow and okra mucilage in treating wastewater’. Desalination, 249 (2): 786-791.
[28] Mishra, A., Yadav, A., Agarwal, M. and Bajpai, M. 2004 “Fenugreek mucilage for solid removal from tannery effluent” Reactive and Functional polymers, 59 (1): 99-104.

NUPTIAL NECTARIES IN SOME SPECIES OF BIGNONIACEAE
Mafatlal M. Kher, M. Nataraj*, Asha Joshi and Monika Patel
B. R. Doshi School of Biosciences, Sardar Patel University, Vallabh Vidyanagar 388120
ABSTRACT
The floral and extra floral nectaries are characteristic feature of the family Bignoniaceae. The floral nectaries in Millingtonia hortensis (L.), Stenolobium stans (L.), Tabebuia pallida (Lindl.) and Tabebuia argentea (Britt.) observed as disk surrounding the base of the ovary. The time of secretion and positioning of anther in the opened flowers are conducive for cross pollination. Key words: Nuptial nectary, Millingtonia hortensis (L), Stenolobium stans (L), Tabebuia pallida (Lindl.), Tabebuia argentea
(Britt.), Starch, Phloem.
INTRODUCTION
Nectaries are specialized secretory glands which secrete sweet watery fluid rich in amino acids, minerals and small amount of organic compounds known as nectar. Nectaries are involved in plant animal interactions and therefore it bears great ecological significance [10]. The floral and extrafloral nectaries are characteristic features of the family Bignoniaceae. It has been reported that nuptial nectaries play a key role in pollination biology of Bignoniaceae (1 & 8).
According to Rivera [11] there are two types of nuptial
nectaries found in Bignoniaceae. a) Nonsecretory or vestigial nectaries: These are non
functional nectaries, though they resemble functional nectaries in their external morphology. Vestigial type of nuptial nectaries are found in Cyclostoma callistegioides, C. binatum and [11] in Lundia sp. [8]. In case of Lundia sp the process of nectar secretion is performed by secretory trichomes which are found on the inner side of the corolla tube.
b) Secretory nectaries: These are also of two types (I)
Annular nectaries: It is an enlarged ring surrounding the base of the ovary and generally five lobed structures. In longitudinal sections a groove or a furrow is clearly observed dividing nectariferous tissues from the base of the ovary. These types of nectaries are reported in Kigelia pinnata, Bignonia illicium and Tecomaria capensis [13, 14 & 15], while in some cases, the ovary is raised from the secretory tissue on a long axis. It is found in Arrabididaea coralline and Dolichandra cynanchoides [11]. (II) Tubular: It is an enlargement of floral axis. In longitudinal section it appears to be a cylindrical structure without any grooves or furrow [11]. This type of nectaries are observed in Cuspidaria convolute; Monsoa difficilis; Jacaranda micrantha [11].
In the present paper the histological and histochemical
characteristics of nuptial nectaries in Millingtonia hortensis, Stenolobium stans, Tabebuia pallida and Tabebuia argentea of Bignoniaceae are reported. MATERIALS AND METHODS
Flowers of Milllingtonia hortensis, Stenolobium stans, Tabebuia pallida and T. argentea were collected fresh from Sardar Patel University campus and fixed on the spot in FAA [70% ethanol/acetic acid/formaldehyde, 18: 1: 1 (v/v)], [7] these fixed materials were dehydrated in a graded ethanol series and embedded in paraffin wax. Serial longitudinal
sections of 12µm thickness were cut using a rotary microtome (Sipcon India SP-1120/Sp-1120 A) and stained with PAS (Periodic Acid Schiff’s) reagent [9] and observed and photographed under Nikon microscope (Nikon, Japan 113615) fitted with Donpish CCD camera. RESULTS AND DICUSSION
Nuptial nectaries at the maturity observed as annular ring around the ovary in all the four species studied. In S. stans, M. hortensis and T. argentea nectary and ovary are at the same level (Fig. A, B & D) while in T. pallida ovary is raised above the nectary.(Fig. C). A group of parenchymatous cells on the rim of the torus by continuous cell divisions give rise to nuptial nectary. In early stages it appears as a protuberance around the base of the ovary (Fig. J). Nuptial nectaries showed two distinct regions viz. epidermis and secretory parenchyma with vascular connection.
The epidermis is single layered composed of compactly arranged tubular cells, interrupted often by wide open stomata in the apical portion. In S. stans.and M. hortensis a prominent stomatal chamber was found (Fig. F & H), while in T. pallida and T. argentia such chambers were absent. The stomata were either raised as in M. hortensis and S. stans.(Fig. F & H), or at the level of epidermis as in T. pallida and T. argentea (Fig. G & E) Secretory parenchyma tissue were made of several layers of compactly arranged isodiametric cells. These cells were stained densely with PAS reagent indicating all parenchymatous cells are secretory without any ground parenchyma tissue. In all the presently studied four plant species the secretory cells were compact with out any inter cellular spaces with starch grains before the secretion. But during the process of nectar secretion the density of starch grains is decreased (Fig. K). In the vasculature, only phloem strands were found in the secretory tissue (Fig. K & L). The vasculature is connected to the ovarian vascular bundles (Fig. B & I). The secretion of nectar which was observed prior to flowering got accumulated in corolla tube.
Flowering phenology in M. hortensis, S. stans, T. pallida
and T. argentea is annual and similar to the cornucopia type proposed by Gentry [5 & 6] in which flowering occurs for several weeks and produce large number of flowers each day. According to a topographical classification explained by Fahn [3], annular secretory nectaries found in Bignoniaceae would fall under type 4 in which nectary have formed as a disk surrounding the base of the ovary. Anatomical characteristics
PRAJÑĀ - Journal of Pure and Applied Sciences, Vol. 18: 31 - 33 (2010) ISSN 0975 - 2595
*Corresponding author: [email protected]

32 PRAJÑĀ – Journal of Pure and Applied Sciences 18: 31 - 33 December
* - Nectary lobe, VS - Vascular strands, NM - Nectary meristem, OV- Ovary, A - Anther, P - Petal, S – Sepal . Figure - A, E, I and K Tabebuia argentea ., Figure- B, F and J Stenolobium stans., Figure - C and G Tabebuia pallida., Figure- D, H and L Millingtonia hortensis

2010 Kher et al. – Nuptial nectaries 33
of nectary found in M. hortensis and T. pallida are similar to those of Kigelia pinnata [13] and T. serratifolia [16]. In some species of Bignoniaceae having vestigial nectary, the process of nectar secretion is performed by glandular trichomes present on the petal base [8]. However all the four species presently studied are found to have functional nectaries.
The presence of wide open stomata and prominent intercellular spaces in secretory parenchymatous tissue is the characteristic feature of floral nectaries [3]. In all the four species studied here, the presence of ground parenchyma region was not observed but it is a characteristic feature of Eccremocarpus scaber [1] of Bignoniacae. The stomata found on the epidermis of nectary are either raised above the epidermal layer or are in the same level. The raised stomata, which is a characteristic feature in Tecomaria capensis [15], Tabebuia aurea, T. chrysotricha, T. nodosa and T. ochracea [11], was also observed in M. hortensis and S. stans, but in T. pallida and T. argentea the stomata is present at the level of epidermal cells. Stomata have been always found on the apical portion of the nectary, which corresponds to the region of secretory activity in the nectary. The apical location of stomata has been noted in Bignoniaceae and other families [2 & 4]. The stomata in the nectaries are nonfunctional as in Vicia faba[2].In the present study, all are the four species showed completely opened stomata. . Initially when the nectary is immature, no intercellular space is observed in secretory parenchyma, but loosely arranged cells with prominent intercellular space were found on its maturity. This indicates that during secretory stage, the breaking down of stored starch grains leads to the production of nectar atleast partially and cells becoming less compact resulting in the formation of the intercellular spaces. Starch stored in secretory parenchyma at the pre-secretory stage can be utilized both as a source of energy for highly metabolic processes and as a source of sugars for nectar synthesis [10 & 12]. The nectar is accumulated in these spaces before exuding through stomata. Similar observations have been made in floral nectaries of other Bignoniaceae members [13, 14 & 15]. The tubular corolla present in these which stores the nectar and the position of anthers at the mid way of corolla are well suited for promoting cross pollination [15]. REFERENCES [1] Belmonte, E., Cardemil, L. and Arroyo, M.T.K. (1994)
Floral nectary structure and nectar composition in Eccremocarpus scaber (Bignoniaceae), a Hummingbird-
pollinated plant of central Chile. American Journal of Botany 81(4): 493-503
[2] Davis, A. R. and Gunningm, B. E. S. (1992) The modified stomata of the floral nectary of Vicia faba L. - Development, anatomy and ultrastructure. Protoplasma 164: 134–15
[3] Fahn, A. (1979) Secretory Tissues in Plants. London Academic Press Inc. (London), pp51-111.
[4] Galetto, L. (1995) Nectary structure and nectar characteristics in some Bignoniaceae. Plant Systematics and Evolution 196: 99–121
[5] Gentry, A. H. (1974) a. Coevolutionary patterns in Central American Bignoniaceae. Biotropica. 6: 64-68.
[6] Gentry, A. H. (1974) b. Flowering phenology diversity in tropical Bignoniaceae. Annals of the Misssouri Botanical Garden 61:728-759.
[7] Johansen, D. A. (1940) Plant Microtechnique McGraw-Hill Books (New York).
[8] Lopes, A.V., Vogel, S. and Machado, I. C. (2002) Secretory trichomes, a substitutive floral nectar source in Lundia A. DC. (Bignoniaceae), a genus lacking a functional disc. Annals of Botany 90:169-174
[9] McManus, J. F. A. (1948) Histological and histochemical uses of periodic acid. Stain Technology 26: 99–108.
[10] Nepi, M., Ciampolini, F. and Pacini, E. (1996) Development and ultrastructure of Cucurbita pepo nectaries of male flowers. Annals of Botany 78: 95-104.
[11] Rivera, G. L. (2000) Nuptial nectary structure of Bignoniaceae of Argentiana. Darwiniana 38: 227-239.
[12] Sawidis, T. (1998) .The subglandular tissue of Hibiscus rosa- sinensis nectaries. Flora 193: 327-335.
[13] Subramanian, R. B. and Inamdar, J. A. (1985) Occurrence, structure, ontogeny and biology of nectaries in Kigelia pinnata DC. The Botanical Magazine, Tokyo 98: 67-73.
[14] Subramanian, R. B. and Inamdar, J. A. (1986) Nectaries in Bignonia illicium L.- Ontogeny, structure and functions. Proceedings of the Indian Academy of Sciences 96: 135-140.
[15] Subramanian, R. B. and Inamdar, J. A. (1989) The structure, secretion and biology of nectaries in Tecomaria capensis Thunb (Bignoniaceae). Phytomorphology 39: 69- 74.
[16] Thomas, V. and Dave, Y. (1992) Structure and biology of nectaries of Tabebuia serratifolia Nichols (Bignoniaceae) Botanical Journal of the Linnean Society 109: 395-400.

ANALYSIS OF CERTAIN BIOCHEMICAL CHANGES ASSOCIATED WITH GROWTH AND RIPENING OF PUMPKIN FRUIT IN RELATION TO ITS SEED DEVELOPMENT
Jay B. Pandya and T. V. Ramana Rao*
B. R. Doshi School of Biosciences, Sardar Patel University, Vallabh Vidyanagar, Gujarat – 388 120
ABSTRACT
A correlative study on biochemical changes during fruit ripening and seed development in Cucurbita moschata Duch. (Pumpkin) has been carried out. The pumpkin fruit was collected at its three successive developmental stages viz. mature, pre-ripened and ripened fruit and subjected it for its biochemical analysis. The obtained results showed that with the advancement of fruit maturation, the amount of pigments (total carotenoids, lycopene), total sugars and non-reducing sugars, proteins and phenols increase significantly, while that of reducing sugars decrease. In contrast, a declining trend of total sugars, reducing and non-reducing sugars, proteins and phenols occurs in the maturing seeds. The sequential developmental stages of pumpkin fruit and its seeds show variations in the amount of their minerals. However, the pumpkin fruit with its advancement towards maturation and ripening, show significant accumulation of fibre content, while a large amount of oil get stored in its seeds. This reveals a positive interdependent developmental relationship between the fruit and seed of pumpkin. Moreover, the present study also indicates that the development of seed may possibly have an active role in the ripening of fleshy fruits. Key words: composition, Cucurbita moschata, development, fleshy fruit, physiology.
INTRODUCTION
It is known from the earlier studies that a possible
endemic. The species is cultivated as an annual or perennial crop, cultivated for its edible fruibts, which are either used as esculents or ornamentals [1]. The fruits of pumpkin are largely used as medicine in various parts of the world for various ailments. It is a gentle and safe remedy for a number of complaints, especially as an effective tapeworm remover for children and pregnant women for whom stronger acting and toxic remedies are unsuitable [2]. The seeds are mildly diuretic and vermifuge; complete seed, together with the husk, is also used to remove tapeworms. The seed, which is known to contain high amount of zinc, has been used in the early stages of prostate problems [3].
The present study has been carried out to understand the
biochemical changes associated with the growth and ripening of pumpkin fruit in relation to its seed development. MATERIALS AND METHODS
The fruits of pumpkin were collected at their three
sequential developmental stages i.e. mature, pre-ripened, and ripened (Fig. 1). After recording the measurements (length and diameter) of these fruits (Mature 15.4 cm x 18.9 cm,
Pre- ripened 20.3 cm x 23.6 cm, Ripened 25.3cm x 21.7 cm), they were subjected for their biochemical analyses:
Fig. 1 Fruits of pumpkin at their successive stages of growth and
ripening
The estimation of pigments such as carotenoids and lycopene were estimated as per the method of Tomes [4]. Following the method of Thimmaiah [5], the amount of total sugars, reducing and non-reducing sugars, protein and phenols were estimated. The oil content of the seeds was measured using Soxhlet apparatus extraction method and crude fibre from fruit pulp was estimated by gravimetric method of Mazumdar and Majumder [6]. The minerals such as Zn, Cu and Mn were estimated by using Atomic absorption spectrophotometer (Nova 400) following the method of Berwal et al. [7], while iron, calcium and phosphorous were estimated using Inductive coupled plasma spectrophotometer at SICART, Vallabh Vidyanagar, Gujarat, INDIA. Using HPTLC the profiling of sugars was done following the method of Daniel [8], while that of amino acids, using the method of Jayaraman, [9]. The data obtained from the present study, were subjected for their statistical analysis, using DMRT (Duncan’s Multiple Range Test) by IRISTAT software V. 3.0. [10].
PRAJÑĀ - Journal of Pure and Applied Sciences, Vol. 18: 34 - 39 (2010) ISSN 0975 - 2595
competition occurs between the growth of the fruit and seed development. Moreover, seeds have been reported to have strong influences on the growth of fleshy fruits, ranging from strongly promotive to inhibitory effects, depending upon the stage of fruit. In view of these observations, the present study has been undertaken to elucidate the biochemical relationship between the growth and ripening of a fleshy fruit of Cucurbita moschata Duch. with the development of its seed.
Cucurbita moschata is an ancient crop of Americas and its
fruits are commonly called pumpkin or squashes, which belongs to the family Cucurbitaceae, also known as the gourd family. In India, the family Cucurbitaceae is represented by nearly 34 genera and 108 species, of which 38 species are
Mature Pre-ripened Ripened
*Corresponding author: [email protected]

2010 Pandya and Ramana Rao – Analysis of certain biochemical changes 35
RESULTS AND DISCUSSION Qualitative and quantitative changes in the pigments of Pumpkin fruit
Color changes in fruit are one of the primary indicators demonstrating the maturity and ripening of fruits. The amount of total carotenoids in the presently studied fruit increased successively by more than one fold from 0.25 mg/100gm at mature stage to 0.35 mg/100gm at pre-repined stage and further increased by more than four fold until ripening (1.50 mg/100gm) (Fig. 2, Table - 1). The amount of lycopene content in the presently investigated pumpkin fruit was recorded to be 0.38 mg/100gm at the mature stage, but it decreased to 0.32 mg/100gm at the pre-ripened stages followed by a sharp increase of more than three fold to the level of 1.01 mg/100gm during ripened stage (Fig. 2, Table - 1). Thus the results of the presently studied pumpkin fruit are in accordance with the results obtained by Dutta et al. [11], who reported carotenoid in the pumpkin fruit to be around 0.43 mg/100gm, while Karkleliene et al. [12] observed huge variations in the amount of carotenoids among the various pumpkin cultivars.
Fig. 2 Total carotenoids and lycopene in fruit Qualitative and quantitative changes in the sugars of pumpkin’s fruit and seed at their successive stages of development
The biochemical analysis of the presently studied pumpkin fruit revealed that the amount of total sugars gradually improved significantly by about two folds in their content from the mature stage to ripened stage (i.e. 6.68 to 12.71 mg/gm) (Fig. 3, Table - 1), while the amount of sugars in the seeds of pumpkin decreased by more than two fold from 22.01 at mature stage to 9.11 mg/gm at the ripened stage (Fig. 4, Table - 1). Also the amount of reducing sugars in the pumpkin fruit increased by more than two folds from mature stage to the ripened stage (i.e. 1.98 to 4.10 mg/gm) (Fig. 3, Table - 1), whereas in case of seeds the amount of reducing sugars decreased by more than two fold from mature stage to ripened stage (10.35 to 4.61 mg/gm) (Fig. 4, Table - 1). Similarly, the amount of non-reducing sugars in the pumpkin fruit showed insignificant increase from mature stage to the pre-ripened stage (4.68 to 4.92 mg/gm) but thereafter showed a significant increase by more than one fold until the onset of ripening measuring 8.59 mg/gm (Fig. 3, Table - 1). On the other hand amount of non-reducing sugars of seed, decreased during their stages i.e. from mature stage to ripened stage (11.65 to 4.45 mg/gm) (Fig. 4, Table - 1). It is apparent from the flavor of different fruits that their sugar content varies widely. The
total soluble sugars in the presently worked out fruit of pumpkin showed tremendous increase in their quantity. It was found that the reducing sugars increase during the present study and are in accordance to the results obtained by Pruthi [13]. This could be attributed to the hydrolysis of starch, which gets accumulated during the early stages of growth. But during the later stages of development i.e. ripening, the amounts of sugars tend to increase due to high activity of enzymes such as α-amylase, β-amylase and starch phosphorylase [14]. In contrast the amount of total sugar content decreased in the seed, which may be due to the accumulation of sucrose into starch and such variations, has been observed by Karkleliene et al. [12] in various cultivars of pumpkin. Also starch serves as a reserve material and also as a source of nutrition needed by the seed during the germination [15].
Fig. 3 Changes in sugar content of fruit
Fig. 4 Amount of sugars in seeds Proteins alteration in pumpkin fruit and seeds
As per the presently carried out biochemical analysis of pumpkin fruit, the total protein content of it is found to have a gradual increase in their content from 28.72 mg/gm at its mature to 56.68 mg/gm at the ripened stage which is more than one fold (Fig. 5, Table - 1). In contrast, the amount of total protein content of pumpkin seed decreased from 206.97 mg/gm at the mature stage to the tune of 101.72 mg/gm at the ripened stage, which shows the decrease of protein in the developing seed by more than one fold (Fig. 5, Table - 1). Proteins are the principle constituents of cell protoplasm and chiefly function to act as essential component of structural material. The net change in the amount of protein was observed to increase during maturation and ripening of pumpkin fruit. The net increase in the amount of proteins could be due to the metabolic processes within the plant cells, which continues even after harvest by using the free amino acids. Also the reduced activity of enzymes such as protease also helps the fruit in accumulating the proteins during the later stages of ripening [14]. In contrast seeds exhibited a sharp decrease in
Sugars in fruit
0
2
4
6
8
10
12
14
Mature Pre-ripened Ripened
Developmental stages
mg
/ gm
Reducing Non-reducing sugars Total sugars
Total carotenoids and lycopene
00.20.40.60.8
11.21.41.6
Mature Pre-ripened RipenedDevelopmental stages
mg
/ 100
gm
Sugars in seed
0
5
10
15
20
25
Mature Pre-ripened RipenedDevelopmental stages
mg
/ gm
Reducing Non-reducing sugars Total sugars
Total carotenoids Lycopene
Total carotenoids and lycopene
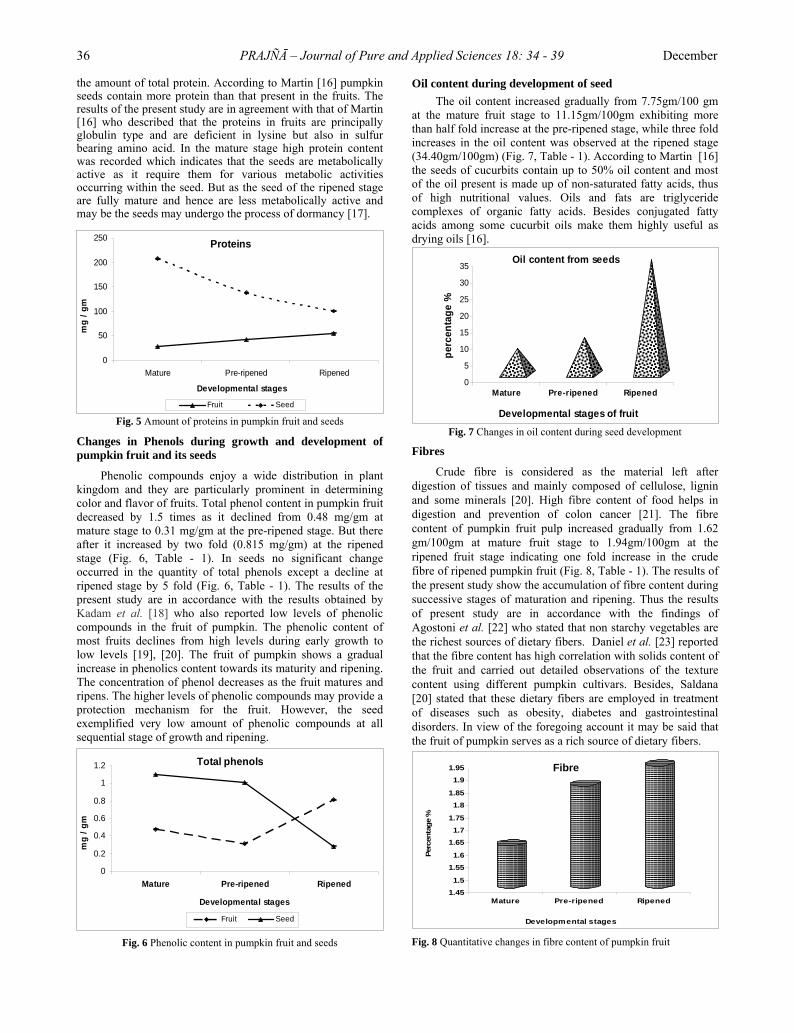
36 PRAJÑĀ – Journal of Pure and Applied Sciences 18: 34 - 39 December
the amount of total protein. According to Martin [16] pumpkin seeds contain more protein than that present in the fruits. The results of the present study are in agreement with that of Martin [16] who described that the proteins in fruits are principally globulin type and are deficient in lysine but also in sulfur bearing amino acid. In the mature stage high protein content was recorded which indicates that the seeds are metabolically active as it require them for various metabolic activities occurring within the seed. But as the seed of the ripened stage are fully mature and hence are less metabolically active and may be the seeds may undergo the process of dormancy [17].
Changes in Phenols during growth and development of pumpkin fruit and its seeds
Phenolic compounds enjoy a wide distribution in plant
kingdom and they are particularly prominent in determining color and flavor of fruits. Total phenol content in pumpkin fruit decreased by 1.5 times as it declined from 0.48 mg/gm at mature stage to 0.31 mg/gm at the pre-ripened stage. But there after it increased by two fold (0.815 mg/gm) at the ripened stage (Fig. 6, Table - 1). In seeds no significant change occurred in the quantity of total phenols except a decline at ripened stage by 5 fold (Fig. 6, Table - 1). The results of the present study are in accordance with the results obtained by Kadam et al. [18] who also reported low levels of phenolic compounds in the fruit of pumpkin. The phenolic content of most fruits declines from high levels during early growth to low levels [19], [20]. The fruit of pumpkin shows a gradual increase in phenolics content towards its maturity and ripening. The concentration of phenol decreases as the fruit matures and ripens. The higher levels of phenolic compounds may provide a protection mechanism for the fruit. However, the seed exemplified very low amount of phenolic compounds at all sequential stage of growth and ripening.
Fig. 6 Phenolic content in pumpkin fruit and seeds
Oil content during development of seed The oil content increased gradually from 7.75gm/100 gm
at the mature fruit stage to 11.15gm/100gm exhibiting more than half fold increase at the pre-ripened stage, while three fold increases in the oil content was observed at the ripened stage (34.40gm/100gm) (Fig. 7, Table - 1). According to Martin [16] the seeds of cucurbits contain up to 50% oil content and most of the oil present is made up of non-saturated fatty acids, thus of high nutritional values. Oils and fats are triglyceride complexes of organic fatty acids. Besides conjugated fatty acids among some cucurbit oils make them highly useful as drying oils [16].
Changes in oil content during seed development
Fibres
Crude fibre is considered as the material left after digestion of tissues and mainly composed of cellulose, lignin and some minerals [20]. High fibre content of food helps in digestion and prevention of colon cancer [21]. The fibre content of pumpkin fruit pulp increased gradually from 1.62 gm/100gm at mature fruit stage to 1.94gm/100gm at the ripened fruit stage indicating one fold increase in the crude fibre of ripened pumpkin fruit (Fig. 8, Table - 1). The results of the present study show the accumulation of fibre content during successive stages of maturation and ripening. Thus the results of present study are in accordance with the findings of Agostoni et al. [22] who stated that non starchy vegetables are the richest sources of dietary fibers. Daniel et al. [23] reported that the fibre content has high correlation with solids content of the fruit and carried out detailed observations of the texture content using different pumpkin cultivars. Besides, Saldana [20] stated that these dietary fibers are employed in treatment of diseases such as obesity, diabetes and gastrointestinal disorders. In view of the foregoing account it may be said that the fruit of pumpkin serves as a rich source of dietary fibers.
Fig. 8 Quantitative changes in fibre content of pumpkin fruit
Fig. 5 Amount of proteins in pumpkin fruit and seeds
Proteins
0
50
100
150
200
250
Mature Pre-ripened Ripened
Developmental stages
mg
/ gm
Fig. 7
Fruit Seed
Total phenols
0
0.2
0.4
0.6
0.8
1
1.2
Mature Pre-ripened Ripened
Developmental stages
mg
/ gm
Fruit Seed
0
5
10
15
20
25
30
35
perc
enta
ge %
Mature Pre-ripened Ripened
Developmental stages of fruit
Oil content from seeds
1.451.5
1.551.6
1.651.7
1.75
1.81.85
1.91.95
Perc
enta
ge %
Mature Pre-ripened Ripened
Developmental stages
FiberFibre

2010 Pandya and Ramana Rao – Analysis of certain biochemical changes 37
Table - 1 Quantitative analysis of biochemical changes during growth and development of pumpkin fruit in relation to its seed
development
Table - 2 Quantitative analyses of changes in minerals associated with growth
and ripening of pumpkin fruit in relation to its seed development (ppm/gm dry wt.).
( N. D. - Not detected) Minerals during growth of pumpkin fruit and development of it seeds
The analysis of minerals present in pumpkin fruit reveals that iron and copper decreased from the mature fruit stage to ripened stage, while phosphorus, calcium and zinc have been found increasing. In contrast, the amounts of iron and zinc were found to increase in the seeds from mature fruit to its pre-ripened stage but eventually they decline in the seeds of ripened fruit, while gradually phosphorous, calcium and copper increase in their quantity from the fruit of mature stage to its ripened stage (Table – 2). Recently, Hamed et al. [24] has observed calcium, potassium, sodium, phosphorous, iron, magnesium, zinc and cobalt to be present in the seeds of pumpkin. Minerals are essential elements, needed for good health. Copper is a necessary element which acts as a co-factor for various oxidative enzymes remained at lower levels during the maturation and ripening of pumpkin fruit and seed. A macro-element, phosphorous, helps in the growth and metabolic process including cell division, cell expansion, respiration and photosynthesis [25]. Calcium, which is known to play an important role in plant growth and development, primarily, because it is required both in cell division and cell elongation, was also observed to increase in the seed as well as
fruit with their development [26]. The results of the present study indicate that the fruit of pumpkin contained only reasonable amounts of Cu, Mn and Zn while good sources of some other minerals, especially P, Ca and Fe. Similar observations have been reported earlier by [27, 28, 29].
Characterization of sugars and amino acids
The Characterization of sugars and amino acids with an aid of HPTLC revealed that six sugars and seven amino acids were present at the ripened stage. The sugar include from mature to ripen stage; sucrose (36 - 420 μg/gm F.W.), ribose (500 – 1400 μg/gm F.W.) and fructose (490 - 300 μg/gm F.W.); while three sugars were not identified (Fig. 9). The results of the present study suggest that the main source of these sugars is starch which serves as a reserve material and also as a source of nutrition needed by the seed during the germination [17] and hence the presence of various sugars are observed according to the anabolism or catabolism process that may take place according to the developmental stage of the fruit. In case of amino acids, aspartic acid (800 - 170 μg/gm F.W.), glutamic acid (1200 - 70 μg/gm F.W.) and tyrosine (2100 - 800 μg/gm F.W.) were identified, while presence of four unknown amino acids was recorded (Fig. 10). The amount of free amino acids in relation to metabolic changes during growth and ripening process are fundamentally important in understanding and controlling the ripening behavior of fruits, but has received little attention [30].
Developmental stages of fruit and seed
Fruit Seed Biochemical metabolites
Mature Pre-ripened Ripened Mature Pre-ripened Ripened
Total Carotenoids (mg/100gm) 0.25 ± 0.051a 0.35 ± 0.005a 1.50 ± 0.005b - - -
Lycopene (mg/100gm) 0.38 ± 0.008b 0.32 ± 0.004a 1.01 ± 0.005c - - -
Total sugars (mg/gm) 6.663 ± 0.017a 7.322 ± 0.047b 12.718 ± 0.017c 22.010 ± 0.160c 19.228 ± 0.018b 9.114 ± 0.065a
Reducing sugars (mg/gm) 1.982 ± 0.006c 2.402 ± 0.011b 4.100 ± 0.013a 10.35 ± 0.342c 8.509 ± 0.071b 4.615 ± 0.057a
Non-reducing sugars (mg/gm) 4.683 ± 0.022a 4.920 ± 0.054a 8.595 ± 0.003b 11.65±0.479c 10.71 ± 0.084b 4.497 ± 0.104a
Proteins (mg/gm) 28.72 ± 0.121a 42.72 ± 0.601b 56.68 ± 0.102c 206.97 ± 0.204c 137.42±0.202b 101.72 ± 0.611a
Phenols (mg/gm) 0.486 ± 0.005b 0.314 ± 0.005a 0.815 ± 0.007c 1.107 ± 0.002b 1.018 ± 0.003b 0.282 ± 0.004a
Oil (%) - - - 7.75 11.15 34.40
Fibre (%) 1.62 1.86 1.94 - - -
Stages of fruit growth and ripening Fe P Ca Cu Zn Mn
Fruit 54.520 2245.5 2118.1 10.137 N.D N.D Mature Seed 35.72 6030.1 1125.3 N.D 27.17 N.D Fruit 43.320 3106.1 3080.0 N.D N.D N.D Pre-ripened Seed 104.0 7692.6 1491.8 N.D 77.27 N.D Fruit 28.202 3198.5 2278.6 N.D 8.165 N.D Ripened Seed 85.846 10563.0 1434.8 6.022 5.65 N.D

38 PRAJÑĀ – Journal of Pure and Applied Sciences 18: 34 - 39 December
Fig. 9 Characterization of sugars with an aid of HPTLC
Fig. 10 Characterization of amino acids with an aid of HPTLC
[ F. W. - Fresh Weight, Std - Standard, Mat - Mature, Pre - Pre-ripened, Rip - Riened, Hyp - Hydroxy proline, Leu - Leucine, Phe - Phenylalanine, Iso - Isoleucine, Try - Tryptophan, Pro - Proline, Thr = Threonine, Ala - Alanine, Glu - Glutamic acid, Asp - Aspartic acid, Ser – Serine] CONCLUSION
Looking into the compositional changes associated with
the development of pumpkin fruit and its seed, it can be said that fruit serves as a nourishing tissue for the growth and development of seeds. The fruit provides the nutrition to the developing seeds, while seeds accumulate starch / oil as storage reserves to become less metabolically active and enters the dormancy. As fruits show accumulation or synthesis of various storage products, seeds on the other hand show declining trend of their compositional constituents, the present study indicates an inverse relationship between the fruit ripening and seed development. Hence the fruits protect and nurture seeds until they are fully mature and later help the plant in the dispersal of seeds.
REFERENCES [1] Nayar, N. M. and More, T. A. (1998) Cucurbits, Oxford &
IBH Publishing Co. Pvt. Ltd., New Delhi, pp. 1 – 340. [2] Chevallier, A. (1996) The Encyclopedia of medicinal
plants. Dorling Kindersley, London. [3] Plants For A Future (Edible, medicinal and useful plants
for a healthier world) http://server9.web-mania.com/ users/pfafardea/database/plants.php?cucurbita+pepo.
[4] Tomes, M. S. (1968) Temperature inhibition of carotene synthesis in tomato. Botanical Gazette, 124: 180 – 185.
[5] Thimmaiah, S. K. (1999) Standard methods of biochemical analysis. Kalyani Publishers, New Delhi, pp. 49 – 310.
[6] Mazumdar, B. C. and Majumder, K. (2003) Methods on physico-chemical analysis of fruits. Daya Publishing House, Delhi, pp. 93 - 139.
[7] Berwal, J. S., Grewel, R. B., Kapoor, C. M. and Garg, M. K. (2004) Practical methods in food analysis. Agrotech Publishing Academy, Udaipur, India, pp. 64 – 77.
[8] Daniel, M. (1991) Methods in plant chemistry and economic botany. Kalyani Publishers, New Delhi, pp. 44 – 45.
[9] Jayaraman, J. (1981) Laboratory manual in biochemistry, Wiley Estern Limited, New Delhi, pp. 66 - 67.
[10] Bliss, C. I. (1969) Statastical methods for research in natural sciences. Statastics in biology, McGraw Hill Book Company, New York, pp. 558.
[11] Dutta, D., Chaudhri, U. R. and Chakraborty, R. (2008) Degradation of total carotenoids and texture in frozen pumpkins when kept for storage under varying conditions of time and temperature. International Journal of Food Sciences and Nutrition. iFirst article, 1-10.
[12] Karkleliene, R., Viskelis, P. and Rubinskiene, M. (2008) Growing, yielding and quality of different ecologically grown pumpkin cultivars. Scientific works of Lithuaniun Institute of horticulture and Lithuaniun University of agriculture. Sodininkystte Ir Darzininkyste. 27 (2): 401 – 410.
[13] Pruthi, J. S. (1963) Physiology, chemistry and technology of passion fruit. Advances in Food Research, 12: 203 – 282.
[14] Stanley, J. K. (1998) Post harvest physiology of perishable plant products, CBS Publishers and Distributors, New Delhi, pp. 43 – 256.
[15] Bhattacharya, A., Nagar, P. K. and Ahuja, P. S. (2002) Seed development in Camellia sinensis, Seed Science Research, 12: 39 - 46.
[16] Martine, F. W. (1984) Cucurbit seeds as possible oil &protein sources. Echo technical note. http://echonet.org/tropicalog/technotes/cucurbit.pdf
[17] Finnie, C., Maeda, K., Ostergaard, O., Bak-Jensen, K. S., Larsent, J. and Svensson B. (2004), Aspects of the barley seed proteome during development and germination. Biochemical Society Transactions, 32: 517 - 519.
[18] Kadam, S. S., Kute, L. S., Lawande, K.M. and Sakunkhe, D. K. (2006) Changes in Chemical Composition of Winged Bean (Psophocarpus tetragonolobus L.) during Seed Development. Journal of Food Sciences, 47(6): 2051 - 2053.
[19] Mann, S. S. and Singh, B. (1990) Some aspects of developmental physiology. Acta Horticulture, 279: 155 - 158.
[20] Saldanha, L. G. (1995) Fibrein diet of U.S. children: Results of national survey. Pediatrics, 96: 994 - 996.
[21] UICC / WHO (2005) Global action against cancer NOW. Geneva: UICC and WHO publication department.
[22] Agostoni, C., Riva, R. and Giovannini, M. (1995) Dietry fibre in waning foods of young children. Pediatrics, 96: 1000 - 1005.
[23] Daniel, A. L., Brecht, J. K., Sims, C. A. and Maynard, D. N. (1995) Sensory analysis of bush and vining types of tropical pumpkin. Preceding of Florida state Horticulture Society, 108: 312 – 316.
[24] Hamed, S. Y., El Hassan, N. M., Hassan, A. B., Eltayeb, M. M. and Babiker, E. E. (2008) Nutritional evaluation and physiochemical properties of processed pumpkin

2010 Pandya and Ramana Rao – Analysis of certain biochemical changes 39
(Telfairia occidentalis Hook) seed flour. Pakistan Journal of Nutrition, 7 (2): 330 – 334.
[25] Verma, L. R. and Joshe, V. K. (2000) Post harvest technology of fruits and vegetables: Handling, processing, fertmentation and waste management. Vol. 1. General concepts and principles, Indus publishing company, New Delhi, pp. 85.
[26] Poovaiah, B. W. and Reddy, A. S. N. (1987) Calcium messenger system: Role of protein phosphorylation and inositol phospholipids. Physiologia Plantarum, 69: 569 – 573.
[27] Alfawaz, M. A. (2004) Chemical composition of oil characteristics of pumpkin (Cucurbita maxima) seed
kernels. Research Bulletin No. (129), Food Sciences & Agriculture Research Center, King Saud University, pp. 5 - 18.
[28] El-Adwy, T. A. and Taha, K. M. (2001) Characteristics and composition of different seed oils and flours. Journal of Agriculture and Food Chemistry, 74: 47 – 54.
[29] Lazos, E. (1986) Nutritional, fatty acids and oil characteristics of pumpkin and melon seeds. Journal of Food Sciences, 51: 1382 - 1383.
[30] Burroghs, L. F. (1970) Amino acids. In: Hulme A. C. (Ed.) The Biochemistry of fruits and their products, Academic press, New York, Vol. 1 pp. 147 - 158.

DEVELOPMENT OF VASCULAR CAMBIUM IN THE LEAF RACHIS OF
KIGELIA AFRICANA (LAM.) BENTH
Vinay R. Patel, Rekha B. Rohit, Pramod Sivan, Sushil S. Kajal and K.S. Rao*
B. R. Doshi School of Biosciences, Sardar Patel University, Vallabh Vidyanagar, Gujarat-388120
ABSTRACT
The structural changes during the vascular cambium development from procambium in the leaf rachis of Kigelia africana bearing leaflets of different developmental stages (young, mature and old rachis) were investigated. The different regions from the internodes of rachis bearing young, copper brown coloured leaves revealed the sequential stages of cambial development. Terminal region of the rachis showed developing procambium along with protoxylem and protopholem derivatives, middle regions exhibited the development of interfascicular cambium whereas basal region showed complete ring of vascular cambium with secondary phloem derivatives. Rachis bearing brownish coloured leaflets showed an active cambium with both secondary xylem and phloem derivatives indicating bidirectional cambial growth. Rachis with fully matured dark green leaflets was characterized by the presence of dormant cambium surrounded by mature xylem and phloem elements and occurrence of calcium oxalate crystals in the phloem parenchyma cells. The study also describes the pattern of vascular cambial development in the leaf rachis of Kigelia, a deciduous tree and it was compared with development of vascular cambium in the leaves of conifers and evergreen dicotyledons. Influence of leaf maturity on cambial activity and secondary xylem development is discussed.
Key words: Vascular cambium development, leaf rachis, Kigelia africana, pattern of secondary growth
INTRODUCTION
In all plants, efficient delivery of water dissolved nutrients and transfer of fixed carbon are vital for plant survival. Plants solve this problem through the development of an integrated network of veins (the vascular system) that interconnect all parts of the plant. These vascular tissues are differentiated from the meristematic cells: - i.e. procambial cells during primary growth and the vascular cambium during secondary growth. Procambium is the primary vascular meristem that is segregated from the shoot apical meristem to become the leaf traces or vascular bundles that unites leaves with stem during elongation or primary phase of growth. Leaf vein design is fast expressed as a pattern of procambial strands that extends from slim vascular bundle into leaf parenchyma to form primary vein followed by basipetal areas of secondary vein as continuous loops [3]. Procambial cells are characterized by their elongated shape, lack of vacuolation and formation of narrow files [10, 15, 17). Although structural aspects and origin of procambium followed by sequential development of vascular cambium in shoots and roots of many plants have been studied in detail by earlier workers (8, 9, 10, 18), meagre information is available on the pattern of cambial development in lateral organ like leaves. Tremendous growth of trees is directly related to their extensive canopy, which forms the nutritional source for their growth and development. Thus, it is important to study the development of vascular tissues in leaves. Considering the complexity of identifying cambial initials, it is necessary to study the leaves thoroughly in the process of ontogenesis, with constant comparison of separate stages of the vascular system development. Therefore, it is envisaged that the present study would elucidate the sequential stages in the development of vascular cambium. MATERIALS AND METHODS
Actively growing and mature current year’s leaves were collected from Kigelia africana, growing in the premises of B R Doshi School of Biosciences, Sardar Patel University, Vallabh Vidyanagar (22°34’ N, 72° 56’E). The intermodal
regions of rachis were categorized into three developmental stages based on the age of the leaflets that is indicated by their colour; young with copper brown coloured leaflets, immatureness with brownish green leaflets and old rachis bearing dark green coloured leaflets. Terminal, middle and basal part of the leaf rachis from different internodes of growing shoot were collected to study the development of the vascular cambium. Samples were fixed in FAA (Formaldehyde- Acetic Acid- Alcohol) immediately after removal from the growing shoots. These samples were dehydrated in Tertiary Butyl Alcohol (TBA) series and embedded in paraffin wax [2]. Transverse sections of 10 to 12 µm thick were cut by rotary microtome (Zeus) and stained with Toluidine Blue (prepared in Benzoate buffer, pH 4.2) for the general histological studies [5]. After passing through ethanol xylene series sections were mounted in DPX. Stained sections were observed and important results were photomicrographed by using Nikon Microscope attached with R CCD-3 camera. RESULTS AND DISCUSSION
In majority of trees defoliation starts in January, and continues till the first week of February. Defoliation is concomitantly followed by swelling of the terminal bud is observed in one year old shoots. Sprouting of young shoots along with brown coloured leaflets continues till the end of February. Shoot produced in the beginning develops brown coloured leaves which later turn into green after completion of shot growth.
Terminal, middle and basal part of the leaf rachis of
brown colored leaves obtained from actively growing of shoots revealed different stages of cambial development. During the sequential transition from procambium to vascular cambium, primary xylem and primary phloem occur first at the tip of elongating leaf rachis while secondary xylem and phloem occurs later towards the base gradually. Similar basipetal pattern of vascular development has been reported in the needle of Pinus strobilus (12). Vascular bundle with distinct fascicular cambium and its early derivatives were observed in
*Corresponding author: [email protected]
PRAJÑĀ - Journal of Pure and Applied Sciences, Vol. 18: 40 - 43 (2010) ISSN 0975 - 2595

2010 Patel et al. – Development of vascular cambium 41
FIGURE: Transectional views of the leaf rachis showing cambial development. A. Terminal part of the leaf rachis showing interfascicular parenchyma cells (arrow head) between adjacent vascular bundles. Primary vascular
bundles with the new fascicular cambium (arrows). (Bar=100 µm). B. The terminal part of leaf rachis with copper brown color leaflets showing the tracheary element formed from fascicular cambium (arrow) from. Note the newly differentiating tracheary elements (arrowhead) (Bar=50 µm). C. The middle part of the leaf rachis showing development of inter fascicular cambial cells (arrows) by tangential divisions of interfascicular parenchyma cells (Bar=100 µm). D. Basal part of leaf rachis showing complete differentiation of interfascicular cambial segment (arrow) which is joined with fascicular cambium the base of leaf rachis (Bar=100 µm). Arrow head shows the differentiated metaxylem tracheary element. E. Base of leaf rachis showing newly developed primary phloem elements (arrow) from the cambium (Bar=50 µm). Leaf rachis of green colored leaflets showing a ring of vascular cambium (arrow) with differentiating xylem & phloem. (Bar= 200µm).

42 PRAJÑĀ – Journal of Pure and Applied Sciences 18: 40 - 43 December
the terminal part of the leaf rachis. The fascicular cambium was composed of 2-3 layers of isodiametric cells. Procambium consists of cells with smaller elements, which appear first in the periphery of central ground meristems consisting of two to three procambial cells in the fascicular region of the cambium [18]. Vascular bundles in the terminal part of the rachis were separated by radially elongated interfascicular parenchyma cells (Fig.A). The first formed protoxylem element was followed by differentiation of metaxylem trachery elements (Fig.B). Differentiation of protoxylem from procambium of stem is usually endarch or centrifugal [7]. In the middle part of leaf rachis, the interfascicular parenchyma cells underwent repeated periclinal divisions leading to the development of a layer of interfascicular cambium (Fig.C). Protoxylem differentiation was followed by development of metaxylem elements. Maturation of metaxylem elements in the vascular bundle was evident from their thick lignified secondary walls with larger diameter as compared to protoxylem elements. At this stage, meristamatic in nature and underwent periclinal divisions leading to the development of interfascicular cambium [8].
In the basal part of the rachis the fascicular cambium joined with the interfascicular cambium and gave rise to the vascular cambium and thick walled metaxylem elements (Fig.D). At this stage, protopholem bundles appeared more distinct with well- developed sieve elements close to the newly formed cambial ring (Fig.E). However, no secondary growth was observed in the basal part of rachis bearing brown colored leaflets. In majority of angiosperms, the protoxylem differentiation occurs acropetally into the leaf primodia and is continuous with existing phloem in the axis [9]. The protoxylem on the other hand, usually differentiates first at the base of the leaf primodium at its junction with the axis and basipetally into stem, and therefore, xylem is initially discontinuous [7]. The continuous structure of phloem elements during initial stage itself might be related to translocation of nutrients and other substances to procambium or parenchyma to support their meristamatic activity in Kigelia. Though basal part of the rachis bearing brown colored leaflets rachis did not exhibit prominent secondary growth, the same region of rachis became brownish green leaflets showed a ring of xylem with vessel, fibres and parenchyma cells (Fig. 1F). This shows that physiological maturity of vascular cambium is closely associated with maturity of leaves. Cambial activity is far easier to make for the xylem elements than for the phloem elements, because of definite structure of the tracheary elements, their relative longevity and of the considerable volume which is occupied by the xylem (21). Production of xylem in the coniferous needle is limited by an unidentified trachied differentiation factor (19, 20). Ewers and Aloni suggested that this factor is produced in young leaves but not in older leaves and therefore xylem production is limited in the former (12). Cambial cell division and xylem differentiation have been closely related to phytohormonal signals [1, 4, 14]. Possibly, the brownish green colored leaflets provide more auxin which is reported to boost xylem differentiation [13]. On the other hand, cambium in the rachis bearing fully matured green leaflets was dormant with 2-3 layers of thick walled cambial cells. The reports on secondary growth pattern in the leaves of evergreen dicotyledons are controversial. Elliot (6) reported well differentiated secondary xylem with distinct growth rings while there was no secondary phloem in some species. On the other hand, Frank (13) reported both, secondary
xylem and secondary phloem development in the leaves of Ilex aquifolium. Based on the study of cambial activity in the leaves of five species each of deciduous and evergreen trees, Shtromberg (21) suggested that the cambium is either altogether absent or does not show any noticeable activity in the leaves of deciduous trees while evergreen species showed considerable cambial activity. On the contrary, the present studies shows that the secondary growth producing a considerable amount of secondary xylem and phloem after leaf maturation. This growth pattern observed in rachis is similar to the pattern in shoots.
Cambia initials in the mature leaves of Pinus produced
secondary phloem but no xylem production was observed indicating unidirectional vascular cambium in the first growing season, while bidirectional growth begins with the next season (11). In Kigelia, although copper brown leaflets showed more phloem production and no secondary xylem immediately after the development of vascular cambium, the rachis bearing mature, brownish green coloured leaflets showed secondary xylem production. In Pinus leaves, the transition from uni-to-bidirectional cambial growth phase is about one year (11) whereas in Kigelia, this transition period is about one week. Therefore, we hypothesize that a common pattern of vascular development exists in both conifers and angiosperms particularly in dicots. However, the transition from uni-to-bi directional cambial growth would be faster in the leaves of dicots as compared to conifers.
Phloem parenchyma cells near the dormant cambium of
rachis bearing dark green older leaves showed the presence of needle shaped crystals of calcium oxalate (Fig. G). Crystals formation is a mechanism to regulate calcium level in plants organs [16]. Crystals in plants may function as a means of removing the calcium oxalate which may otherwise accumulate in toxic quantities. In addition, it has been suggested that the crystals serve purely as structural supports or as a protective device against foraging animals.
In conclusion, the present study reveals the patterns of
vascular cambial development from procambium in the leaf rachis of Kigelia africana. The development of cambium and xylem differentiation found to be directly related to the leaf maturity. The developmental aspects show many similarities with that of conifers especially in their uni- to-bidirectional growth transition. However, the confirmation of this view needs further detailed investigation on comparison of pattern of vascular differentiation in the leaves of more dicotyledonous tree species. REFERENCES [1] Aloni, R. (1987) Differentiation of Vascular Tissues. Annua
lReview of Plant Physiology. 38: 179-204. [2] Berlyn, G. P. and Mikshe, J. P. (1976) Botanical
Microtechnique and Cytochemistry. Iowa State University Press, Iowa.
[3] Busse, J. S. and Evert, R. F. (1999) Vascular differentiation and transition in the seedling of Arabidopsis thaliana (Brassicaceae). International Journal of Plant Sciences.
160: 241– 251. [4] Cano- Delgado A, Ji- Young Lee, and Taku Demura
(2010)Regulatory Mechanisms for Specification and Patterning of Plant Vascular Tissues. Annual Review of Cell Developmental Bioogyl. 26: 12.1-33.

2010 Patel et al. – Development of vascular cambium 43
[5] Cheadle, V. L., Goffords, E. M. and Esau, K. (1953). A staining combination for phloem and contiguous tissue, Stain Technology. 28: 49-53.
[6] Elliot, J. H. (1937) The development of the vascular system in evergreen leaves more than one year old. Annals of Botany. N.S.1:107-127
[7] Elizabeth G. Cutter (1971) Plant Anatomy: Expriment and Interpretation; Part 2 Organs. Edward Arnold, London
[8] Esau, K. (1943) Vascular Differentiation in Vegetative Shoots Linum: III, The Origin of the Bast Fibers. American Journal of Botany. 30: 579-86
[9] Esau, K. (1954) Primary vascularization in Plants. Biological Reviews of the Cambridge Philosophical Society. 29: 49-86.
[10] Esau, K. (1965) Vascular Differentiation in Plants. Holt, Rinehart & Winston, New York.
[11] Ewers, F.W. 1982. Development and cytological evidence for mode of origin of secondary phloem in needle leaves of Pinus longaeva and P. flexili. Bot.Jahrb.Syst. 103 (1):59-88
[12] Ewers, F. W. and Aloni. R. 1987. Seasonal secondary growth in needle leaves of Pinus strobilus and Pinus brutia. American Journal of Botany. 74(7):980-987
[13] Frank, A. B. 1964. Ein beitry zur kenatiinsl de ne flasibundel. Bot. Zeitung. 22:144-154
[14] Fukuda H. (2004) Signals that control plant vascular cell differentiation. Nature Reviews Molecular Cell Biology 5: 379-391
[15] Mattsson J., Sung Z. R. and Berleth, T. (1999) Responses of plant vascular systems to auxin transport inhibition. Development 126: 297–299.
[16] Mazen, A. M. A., Zhang, D. and Franceschi, V. R.. (2003) Calcium oxalate formation in Lemna minor: Physiological and ultrastructural aspects of high capacity calcium sequestrstion. New Phtology, 161: 435-448
[17] Nelsona, T. and Denglerb, N. (1997) Leaf Vascular Pattern Formation. The Plant Cell, 9: 1121-1135.
[18] Nobuo, Y., Yujiro, T., and Toshinago, I. (1986) Development of vascular cambium and wood formation in the shoot of young spruce (Picea jezoensis Var. hondoensis). IAWA Bulletin. 7(1): 21-30.
[19] Savidge, R. A. and Wareing, P. F. (1981) A trachied differentiation factor from pine needles. Plant, 153:395-404
[20] Savidge, R. A. (1983). The role of plant hoprmones in higher plant cellular differentiation. II. Experiments with the vascular cambium, and sclerid and trachied differentiation in the Pine. Pinus contota. Hiostochemistry Journal, 15: 447-466
[21] Shtromberg, A. Y. (1958). Cambium activity in leaves of several woody dicotyleonous plants. Dokl. Akad. Nauk. SSSR. 124: 699-702

PRAJÑĀ - Journal of Pure and Applied Sciences, Vol. 18: 44 - 49 (2010)
ISSN 0975 - 2595
HYDROXYETHYLMETHACRYLATE-GRAFT-CARBOXYMETHYL CHITOSAN-GRAFT PHA (HEMA-g-CMCH-g-PHA): SYNTHESIS,
CHARACTERIZATION AND BIODEGRADATION
Deval Patel, Rachana Bhatt, Hiral Patel, Kamlesh Patel and Ujjval Trivedi*
BRD School of Biociences, Sardar Patel University,Vallabh Vidyanagar - 388120
ABSTRACT
Chemical modifications of polyhydroxyalkanoates are important to improve the properties and increase the applicability of PHAs in different fields. In the present study using grafting method, the graft of PHAMCL produced by Comamonas testosteroni was synthesized using acrylic acid and O- carboxymethylchitosan as a backbone. Successful synthesis of HEMA-g-CMCH-g-PHA was confirmed by FTIR analysis. Thermal properties of the synthesized graft were studied by Thermo Gravimetric Analysis and Differential Scanning Calorimetry. Degradation studies of PHAMCL, CMCH and HEMA-g-CMCH-g-PHA were carried out using bacterial isolate Burkholderia cepacia 202 and fungal isolate Aspergillus fumigatus 202 for 15 days. Different parameters such as extracellular protein concentration, growth of organism and % weight loss of polymer were studied to correlate it to its degradation. Aspergillus fumigatus 202 was found to degrade 94% of CMCH
nd 84% of HEMA-g-CMCH-g-PHA in 15 days at static condition. a Key words: acrylic acid, biodegradation, chemical modification, HEMA-g-CMCH-g-PHA, PHAMCL
I NTRODUCTION
The increased sensitivity to ecological problems will have a major impact in the future on the disposal of plastic articles. Polymer and plastic industries may be forced to explore the production of biodegradable polymers as an alternative to traditional plastics. Poly(3-hydroxybutyrate) was identified as an intriguing bacterial inclusion body more than seven decades ago [1] and is now classified as one of the many different types of bacterial polyesters with common name polyhydroxyalkanoates (PHA). These polymers are accumulated intracellularly to the level as high as 90% of cell dry weight under condition of nutrient stress and act as a carbon and energy reserve material [2]. Polyhydroxyalkanoates are a kind of polymer having similar mechanical properties to those of polypropylene with the additional advantage of being completely biodegradable and biocompatible [3]. The monomer composition of the PHA depends on the bacterial strain as well as the carbon sources supplied [4]. PHAMCL are elastomeric but have very low mechanical strength which limit the application of these PHAs. The physical and mechanical properties of these PHAs need to be diversified and improved for packaging materials, biomedical applications, tissue engineering and other specific applications [5]. Both biological and chemical modifications are carried out to improve polymer properties. Chemical modifications include blending, grafting, cross linking, epoxidation etc. Insertion of an additional different polymer segment into an existing polymer backbone or as the side chain of an existing polymer yields blocks or graft opolymer respectively [6]. c
The natural polymers that have attracted great attention
recently are polyhydroxyalkanoates and chitosan. Chitosan is a liner polymer composed of β-1,4-linked glucosamine residues [7]. It is prepared commercially by alkaline deacetylation of chitin. Chitosan has some advantages due to its nontoxicity, biodegradability and it is environmental friendly. It is a biocompatible material that breaks down slowly to harmless products that are absorbed completely in body [8]. Carboxymethylation of chitosan provides attractive sites for further chemical modifications such as grafting, hydrolysis and
oxidation. Hybridization of natural polymers with synthetic polymers is of great interest because of their application to biomedical and biodegradable materials [9]. Acrylic acid is a synthetic monomer which undergoes reactions characteristics of both unsaturated acids and aliphatic carbolic acids or esters. The β carbon atom of acrylic acid polarized by carbonyl group, behaves as an electrophile; and favours the addition of large variety of nucleophiles and active hydrogen compounds to the vinyl group. Acrylic acid and its esters are used in the production of coatings, adhesives, elastomers, super absorbent polymers and flocculants. Considering these facts the present study has been deal with the synthesis of graft with chitosan, PHA and acrylic acid as these materials having applications in different fields.
The ability to degrade PHA is widely distributed among bacteria as well as fungi, and depends on the secretion of specific PHA depolymerase and also on the physiochemical nature of the PHA itself [10]. In the cell, PHA forms amorphous granules which can be degraded by the PHA-accumulating organism itself. After PHA is extracted from the cell, it can be enzymatically degraded by extracellular PHA epolymerase [11]. d
MATERIALS AND METHODS Microorganisms and culture media
Comamonas testosteroni as a PHAMCL producer in this
study, was reported to accumulate PHB and PHAMCL [12,13]. C. testosteroni produced PHAMCL utilizing coconut oil as sole carbon source. The medium used for PHAMCL production was Bushnell Haas mineral salt medium (Hi-Media,India), which contained (g/l of distilled water) MgSO4 0.2, CaCl2 0.02, KH2PO4 1, K2HPO4 1, NH4NO3 1 , FeCl3 0.05 and 1% w/v coconut oil purchased from the local market.
For degradation studies, a bacterial culture Burkholderia
cepacia 202 and a fungal culture Aspergillus fumigatus were used. Both these organisms are reported to be degraders of PHAs [14]. The medium used for the degradation studies was Bushnell Haas mineral salt medium with synthesized polymer s a carbon source [14]. a
*Corresponding author: [email protected]
2010 Patel et al. - Hydroxyethylmethacrylate-graft-carboxymethyl 45
P
HAMCL production and extraction Inoculum was prepared by growing C. testosteroni cells in
Nutrient Broth at 30 ºC overnight on a rotary shaker at 150 rpm. The overnight grown culture was centrifuged and the pellet was washed twice with sterile normal saline. The cells were then transferred to 50 ml of production media containing 1% w/v coconut oil and incubated overnight at 30 ºC on a rotary shaker at 150 rpm. Five ml broth was centrifuged and cell pellet was suspended in 5 ml normal saline to measure the OD660 for monitoring the growth. This cell suspension was
sed as an inoculum for PHAu MCL production.
After the 48 h of incubation on a rotary shaker at 150 rpm at 30 ºC, the cells were harvested from the production media by centrifugation at 8000 rpm for 10 min. The pellet was washed with acetone thrice and dried overnight at room temperature. PHA was extracted from dried cell mass by overnight chloroform extraction at 30 ºC at 200 rpm on rotary shaker and then cell mass was removed by filtration through Whatman No. 1 filter paper. Chloroform extract was concentrated by evaporating chloroform. PHA was precipitated by adding cold methanol drop wise and purified PHA was obtained by epeating this step three times. r
S
ynthesis of HEMA-g-CMCH-g-PHA O-carboxymethylchitosan (CMCH) was prepared
according to the method described by Chen and Park [15], where chitosan: sodium hydroxide: isopropanol were mixed in the ratio 10 g:13.5 g:100 ml in the flask. Chitosan was allowed to swell and alkalize at room temperature for 1 h. The monochloroacetic acid dissolved in isopropanol was added drop wise into the reaction mixture for 30 min and then allowed it to react at 55 ºC for 4 h. The reaction was stopped with acetic acid and carboxymethylchitosan obtained as a solid product which was separated by filtration. Desalting was done by rinsing the CMCH with 80-90% ethanol.
For preparation of HEMA-g-CMCH-g-PHA graft, first grafting was carried out between CMCH and PHA in the ratio of 2 g:0.5 g. For this CMCH was stirred in 120 ml double distilled water with slow stream of nitrogen for 30 min at room temperature to remove dissolved oxygen and then 2M ceric ammonium nitrate prepared in 0.3M HNO3 was slowly added over a period of 20 min. PHA was dissolved in dichloromethane and half of PHA added drop wise for 20 min. In the next step, after the incubation of 30 min, remaining half PHA solution was added with 1.5 ml of acrylic acid. Grafting reaction was allowed to occur at constant stirring at 40 ºC for 5 h and product was dried under vacuum. Characterization of PHAMCL, CMCH, and HEMA-g-CMCH-g-PHA
Infrared spectra of PHAMCL, CMCH and HEMA-g-CMCH-g-PHA were recorded with a Perkin Elmer, Fourier-transform infrared spectrometer. Thermal stability of all three polymers was determined by Thermo Gravimetric Analysis (TGA) (Universal V2.6D, TA instrument) with heating rate of 10 ºC. The synthesized polymers were also characterized by
ifferential Scanning Calorimetry (DSC). D Biodegradation of HEMA-g-CMCH-g-PHA
Biodegradation studies of all three polymers PHAMCL, CMCH, HEMA-g-CMCH-g-PHA were carried out using one bacterial isolate B. cepacia 202 and one fungal isolate A. fumigatus 202. Graft (0.5g) was kept in a 250 ml Erlenmeyer flask containing 100 ml BHM. The flasks were inoculated with B. cepacia 202 (1.0 initial OD660) and incubated at 37 ºC under static condition as well as shaking conditions (150 rpm). Similarly flasks were inoculated with 106 spores/ml of A. fumigatus 202. Samples of 2 ml each were removed at an
interval of two days for a period of 15 days and analyzed for growth (OD660) and extracellular protein concentration [16]. % weight loss of the polymer in each flask was determined after 15 days [14,17].
R
ESULTS AND DISCUSSION It is known from the earlier reports [13] that C.
testosteroni accumulates PHAMCL when grown it on vegetable oil [13]. The present study reports PHAMCL accumulation upto 83% (w/w) of dry cell mass when C. testosteroni was grown on coconut oil (1% w/v) as a sole carbon sorce. The PHAMCL thus produced has been used for further grafting reactions with an im of getting a chemically modified product. a
Various PHAMCL bearing different functional groups in the
side chain has been synthesized by some organisms, including Pseudomonas oleovorans and Pseudomonas putida, when they are grown with substrates containing the corresponding chemical structure [18]. PHAMCL with functional groups are of great interest, because the functional groups can improve the physical properties. Moreover, some functional groups can be modified by chemical reactions to obtain more useful polymer and extend the potential application of PHAMCL as environmentally biodegradable polymers as well as functional biomaterials for biomedical uses. Therefore, attempts to modify the properties of PHAMCL by chemical and physical methods such as blending, crosslinking, and graft copolymerization, have attracted a great deal of interest. As chitosn has reactive amino and hydroxyl group, acrylic acid also has two functional groups [19]. The carbonyl group of β carbon atom of acrylic acid behaves as an electrophile; favouring addition of large variety of nucleophiles and active hydrogen compounds. Therefore it has been used in this study for grafting on to a
HA chain. P
In the present study grafting of PHAMCL with chitosan and acrylic acid was carried out and PHAMCL, CMCH and HEMA-g-CMCH-g-PHA were analysed for their thermal stability and
iodegradability. b Characterization of PHAMCL, CMCH and HEMA-g-
MCH-g-PHA C
Very few studies on grafting of PHA with chitosan and acrylic acid have been carried out. Yalpani et al. [20] and Arslan et al. [8] developed graft of PHA onto chitosan and cellulose. PHAMCL was graft polymerized with various polymers like polyisoprene, acrylic acid, methyl methacrylate [21] and vinyl monomer. PHB-g-PI has much better ductility and tenacity than homo-PHB [22]. Mainly the acrylic acid was grafted with the synthetic polymers such as polystyrene, olyethylene [23]. p
Infrared Spectroscopic analysis of PHAMCL, CMCH and
HEMA-g-CMCH-g-PHA polymers were analyzed from 400 to 4000 cm-1 by Perkin-Elmer Spectrum GX. Analysis of IR spectra of PHAMCL (Fig. 1) and HEMA-g-CMCH-g-PHA (Fig. 3) showed the presence of some of the additional peaks at 3427.86 cm-1, 1738.24 cm-1 and 517.48 cm-1. When IR spectrum of HEMA-g-CMCH-g-PHA (Fig. 3) was compared with that of CMCH (Fig. 2), the presence of additional peak at 1159.44 cm-1 and loss of peak at 2103.32cm-1 was observed. The predominant peak at 1738.24 cm-1 was observed in the IR spectrum of graft (Fig. 3), which shows C=O stretching, indicating the insertion of acrylic acid into the graft. This confirms the grafting has occurred successfully with PHAMCL, CMCH and acrylic acid. Presence of additional functional group provides the attractive site for further modification and increase the graft applicability. Grondahl et al. [24] reported the graft copolymerization of acrylic acid (AAc) onto PHBV by

46 PRAJÑĀ – Journal of Pure and Applied Sciences 18: 44 - 49 December
gamma-irradiation to induce surface hydrophilicity of PHBV for biomedical applications. Graft copolymers of acrylic acid on cellulosic materials [25] and PHBV [26] have been studied. For the foregoing account it is clear that, this is the first report on grafting of PHA with both chitosan and acrylic acid.
Fig. 1 FTIR of PHAMCL produced by C. testosteroni.
Fig. 2 FTIR of CMCH Thermo gravimetric analysis of HEMA-g-CMCH-g-PHA
was carried out by Perkin-Elmer TGA-7 DSC-PYRIS-1 DTA-7 instrument with the heating rate of 10 °C. The change in the thermal properties of PHAMCL after grafting can be observed from the thermal analysis of both. Thermo gravimetric analysis (TGA) of the PHAMCL (Fig. 4) obtained from C. testosteroni revealed that the polymer was stable up to 233.15 °C with weight loss of 4.39%; thereafter the thermal decomposition started which showed weight loss of 74.28% at 299.37 °C, whereas the polymeric graft showed about 29% weight loss at same temperature and 50% weight loss was observed at 280.57 °C for PHAMCL.
Fig. 3 FTIR of HEMA-g-CMCH-g-PHA
The 3.07% weight loss of HEMA-g-CMCH-g-PHA (Fig. 6) at 100 °C was due to the moisture content present in the sample. 50% weight loss was observed at 425 °C and at 550 °C, the observed weight loss was 62.94%. Average % weight loss observed at every 50 °C rise in temperature was 6.77. Decreased thermal stability was reported by Arslan et al. [8] while grafting polyhydroxyoctanoate (PHO) onto chitosan. In contrast, due to grafting of PHAMCL with CMCH and acrylic acid the thermal stability of PHAMCL (Fig. 4) and CMCH (Fig. 5) increased for HEMA-g-CMCH-g-PHA (Fig. 6). The increased thermal stability helps in applying the polymer for preparation of articles which require higher temperatures for proper molding.
Differential scanning calorimetric (DSC) thermo gram of PHAMCL (Fig. 7) depicted the thermal stability of native PHAMCL between 230-240 °C which confirmed the results of TGA analysis. The melting point of PHAMCL was 50 °C which was similar to the reported Tm range between 39 °C to 61°C [27]. DSC thermogram of HEMA-g-CMCH-g-PHA (Fig. 8) didn’t show any sharp Glass Transition (Tg). Endotherm up to the temperature 180 °C was observed. At around 205 °C peak shows high temperature decomposition or reaction which may have resulted in two extra endotherm at 220 °C and 264 °C. This high temperature decomposition might be attributed by acrylic acid present in the graft. Integral Procedural Decomposition Temperature (IPDT) was 250 °C. Single endotherm from 50 °C to 74.90 °c for CMCH-g-PHA was eported by Bhatt et al [14]. r
Biodegradation of PHAMCL, CMCH and HEMA-g-CMCH-g-PHA
Many bacteria as well as fungi have the ability to degrade PHA [28]. Biodegradation of polymers by microorganisms is catalysed by extracellular, degradative enzymes that produce water soluble, low molecular weight products from the macromolecular substrate. The extracellular PHB depolymerase of A. fumigatus was found to have a broad hydrolytic activity towards bacterial and synthetic aliphatic polyesters. Bacterial poly(3-hydroxybutyrate) and poly(3-hydroxybutyrate-co-3-hydroxyvalerate) were found to be readily degraded by microorganisms in marine, sewage sludge, soil and compost ecosystems [29]. CMCH is also a biodegradable polymer derived from chitin through chitosan [30]. CMCH and acrylic acid both possess versatile groups responsible for the biodegradation. Dave et al. reported the degradation of acrylic acid by fungi [31]. Biodegradability and antibacterial activity of PHB and PHBN membranes grafted with acrylic acid, chitosan and chitooligosaccharide were assessed by Hu et al. [32]. Fig. 4 Thermo gravimetric analysis of PHAMCL produced by
C. testosteroni.

2010 Patel et al. - Hydroxyethylmethacrylate-graft-carboxymethyl 47
Fig. 5 Thermo gravimetric analysis of CMCH
Fig. 6 Thermo gravimetric analysis of HEMA-g-CMCH-g-PHA
Fig. 7 DSC thermo gram of PHAMCL produced by C. testosteroni.
Fig. 8 DSC thermo gram of HEMA-g-CMCH-g-PHA
0%
20%
40%
60%
80%
100%
PHA CMCH HEMA-g-
CMCH-g-PHA
Rsi
dual
pol
ymer
Polymer
shaking conditionstatic condition
a
0%
20%
40%
60%
80%
100%
PHA CMCH HEMA-g-CMCH-g-
PHAR
esid
ual p
olym
er
Polymer
shaking condition
static condition
b
Fig. 9 Degradation of HEMA-g-CMCH-g-PHA graft polymer after fifteen days (a) B. Cepacia 202; (b) A. fumigatus 202.
0
0.1
0.2
0.3
0.4
0.5
0.6
0 5 10 15 20
Time (days)
OD
at 6
60nm PHA
CMCHGraft
a
Fig. 10 (a) Growth of B. cepacia 202 on polymer under shaking condition
0
0.1
0.2
0.3
0.4
0.5
0.6
0.7
0.8
0.9
0 5 10 15 20
Time (Days)
OD
at 6
60nm PHA
CMCHGraft
b
Fig. 10 (b) Growth of B. cepacia 202 on polymer under static condition

48 PRAJÑĀ – Journal of Pure and Applied Sciences 18: 44 - 49 December
0
50
100
150
200
250
300
0 5 10 15 20
Time (Days)
Prot
ein
conc
. (ug
/ml)
PHACMCHGraft
Fig. 11 Extracellular protein profile of B. cepacia 202 under (a) shaking condition; (b) static condition
The increase in growth of the B. cepacia 202 (Fig. 10 a,b) using PHA
Fig. 12 (a) Extracellular protein profile of A. fumigatus 202 under
shaking condition Fig. 12 (b) Extracellular protein profile of A. fumigatus 202 under static
condition
The graft synthesized from biodegradable material may
also be biodegradable and eco-friendly. Moreover CMCH-g- PHAMCL was insoluble in various solvents [14] and had high thermal stability which proved it to be an industrially viable polymer. Among all the three polymers; CMCH, PHAMCL and HEMA-g-CMCH-g-PHA; weight loss of CMCH was maximum followed by that of graft and least weight loss was bserved in pure PHAo MCL polymeric samples (Fig. 9 a,b).
Carboxymethylchitosan, derived from chitosan, showed the highest degradation (94% weight loss) by both fungal and bacterial cultures. HEMA-g-CMCH-g-PHAMCL was also degraded by both fungi as well as bacteria, but the extent of degradation was less as compared to pure CMCH. This might be attributed to the insertion of PHAMCL and acrylic acid onto CMCH which resulted into blockage of few carboxyl groups where PHAMCL and acrylic acid might be grafted. Least degradation, ranging from 6% - 18 % weight loss was observed in case of PHAMCL, this might be due to presence of long aliphatic chains in the structure of PHAMCL. From the results of % weight loss it can be concluded that static conditions may be more suitable for degradation studies as it would be economically more feasible. We obtained increase in % weight loss in static condition than the % weight loss reported in
iodegradation studies earlier by Bhatt et al. [14]. b
MCL, CMCH and HEMA-g-CMCH-g- PHA as a sole source of carbon, checked in terms of OD660 showed that the polymers supported the growth of B. cepacia 202 during its degradation. Increase in growth proved to be an indirect ndication for the biodegradation of the graft. i
Along with the weight loss, extracellular protein content was also determined, considering that the concentration of protein can be attributed to the concentration of enzymes which are responsible for the degradation of the polymer. B. cepacia 202 showed increase in extra cellular protein concentration up to 243.6 µg/ml under static and 183.6 µg/ml under shaking condition and A. fumigatus 202 showed highest protein concentration up to 135.6 µg/ml under shaking and up to 167.4 µg/ml under static conditions. This support the results of % weight loss experiment. Increase in the growth as well as extracellular protein concentration (Fig. 11 a,b and 12 a,b) in media containing PHAMCL, CMCH and HEMA-g-CMCH-g- PHA proved their degradation by B. cepacia 202 and A. Fumigatus 202. C ONCLUSION
Grafting of acrylic acid and chitosan to PHAMCL increase the avaibility of functional group on graft and widen the application range of medium chain length polyhydroxyalkanoates by altering its thermal properties and lso lead to synthesis of biodegradable material. a
A
CKNOLEDGEMENT
Authors gratefully acknowledge the invaluable guidance of Dr. Vijaykumar Sinha and Dr. Deepak Mishra, Indurstrial Chemistry Department, V.P. & R.P.T.P. Science College, Vallabh Vidyanagar for the present work.
Thanks are also due to the Sophisticated Instrumentation Centre for Applied Research & Testing (SICART), Charutar Vidya Mandal, Vallabh Vidyanagar for providing facilities for polymer characterization work.
0
20
4060
80
100
120
140160
180
200
0 5 10 15 20
Time (Days)
Prot
ein
conc
.(ug/
ml)
PHACMCHGraft
a
b
-20
0
20
40
60
80
100
120
140
160
0 5 10 15 20
Time (Days)
prot
ein
conc
.(ug/
ml)
PHACMCHGraft
a
-20
0
20
40
60
80
100
120
140
160
180
0 5 10 15 20
Time (Days)
Prot
ein
conc
. (ug
/ml)
PHACMCHGraft
b
2010 Patel et al. - Hydroxyethylmethacrylate-graft-carboxymethyl 49
REFERENCES [1] Lemoigne, M. (1926) Products of dehydration and of
polymerization of β-hydroxybutyric acid. Bulletin de la Société de Chimie Biologique, 8:770-782.
[2] Madison, L.L., Huisman, G.W. (1999) Metbolic engineering of poly(3-hydroxyalkanoates):from DNA to plastic. Microbiology and Molecular Biology Reviews, 63:21-53.
[3] Reddy, C.S.K., Ghai, R., Rashmi, V., Kalia, C. (2003) Polyhydroxyalkanoate: An overview. Bioresource Technology, 87:137-146.
[4] Mergaert, J., Schirmer, A., Hauben, L., Mau, M., Hoste, B., Kersters, K., Jendrossek, D., Swings, J. (1996) Isolation and identification of poly(3-hydroxyvalerate)- degrading strain of Pseudomonas lemoignei. International Journal of Systematic Bacteriology, 46:769-773.
[5] Hazer, B. (2003) Chemical modification of synthetic and biosynthetic polyesters. Biopolymers, 10:181-208.
[6] Nuyken, O., Weidner, R. (1986) Graft and block copolymers via polymeric azo initiators. Advances in Polymer Science, 145:73-74.
[7] Yun, C., Amakata, D., Matsuo, Y. Matsuda, H., Kawamukai, M. (2005) New chitosan degrading strains that produce chitosanases similar to ChoA of Mitsuaria chitosanitabida. Applied and Enviromental Microbiology, 71:5138-5144.
[8] Arslan, H., Hazer, B., Yoon, S. C. (2007) Grafting of poly(3-hydroxyalkanoate) and linoleic acid onto chitosan. Journal of Applied Polymer Science, 103:81-89.
[9] Aoi, K., Takasu, A.,Okada, M. (1997) New chitin-based polymer hybrids. 2. Iimproved miscibility of chitin derivatives having monodisperse poly(2-methyl-2-oxazoline) side chains with poly(vinyl chloride) and poly(vinyl alcohol). Macromolecules, 30:6134-6138.
[10] Zhila, N.O. (2007) Degradation of Polyhydroxyalkanoates in eutrophic reservoir. Polymer Degradation and Stability, 92:580-586.
[11] Hiraishi, T., Hirahara. Y., Doi, Y., Maeda, M., Taguchi, S., (2006) Effect of mutation in the substrate-binding domain of poly[(R)-3-hydroxybutyrate] (PHB) depolymerise from Ralstonia pickettii T1 on PHB degradation. Applied and Environmental Microbiology, 72:7331-7338.
[12] Thakor, N.S., Patel, M.A., Trivedi, U.B., Patel, K.C. (2003) Production of PHB (Poly β hydroxybutyrate) by Comamonas testosteroni during growth on naphthalene. World Journal of Microbiology and Biotechnology, 19:185-189.
[13] Thakor, N., Trivedi, U., Patel, K.C. (2005) Biosynthesis of medium chain length Poly (3- hydroxyalkanoates) (mcl-PHAs) by Comamonas testosteroni during cultivation on vegetable oils. Bioresource Technology, 96:1843-1850.
[14] Bhatt, R., Panchal, B., Patel, K., Sinha, V.K., Trivedi, U. (2008) Synthesis, characterization and biodegradation of CMCH -g- Mcl-PHA. Journal of Applied Polymer Science, 110:975-982.
[15] Chen, X., Park, H. J. (2003) Chemical characteristics of O-carboxymethylchitosan related to the preparation conditions. Carbohydrate Polymers, 53:355-359.
[16] Lowry, O.H., Rosebrough, N.J., Farr, A.L., Randall, R.J. (1951) Protein measurement with the Folin phenol reagent. Journal of Biological Chemistry, 193:265-275.
[17] Ramsay, B.A., Langlade, V., Carreau, P.J., Ramsay. J.A. (1993) Biodegradability and mechanical properties of poly-(β-hydroxybutyrate-co-β-hydroxyvalerate)-starch blends. Applied and Environmental Microbiology, 59: 1242-1246.
[18] Kim, D.Y., Kim, Y.B., Rhee, Y.H. (2000) Evaluation of various carbon substrates for the biosynthesis of polyhydroxyalkanoates bearing functional groups by Pseudomonas putida. International Journal of Biological Macromolecules, 28:23-29.
[19] Dutta, P.K., Dutta, J., Tripathi, V.S. (2004) Chitin and chitosan: chemistry, properties and applications. Journal of Scientific & Industrial Research, 63:20-31.
[20] Yalpani, M., Marchessault, R.H., Miorin, F.G., Monastrios, C.J. (1991) Synthesis of Poly (3-hydroxyalkanoate) (PHA) conjugates: PHA-carbohydrate and PHA-synthetic polymer conjugates. Carbohydrate Polymers, 24:6046-6049.
[21] Eroglu, M. S. Caykara, T., Hazer, B. (1998) γ- Ray induced graft copolymerization of methyl methacrylate onto poly(β-hydroxynonanoate). Polymer Bulletin, 41:53-60.
[22] Jiang, T., Hu, P. (2001) Radiation-induced graft polymerization of isoprene onto polyhydroxybutyrate. Polymer Journal, 33:647-653.
[23] Subramaniam, S., Lee, S. (1999) Polystyrene-graft-acrylic acid as compatibilizer of polystyrene/nylon 6,6 blends. Polymer Engineering and Science, 39:2274-2281.
[23] Grondahl, L., Chandler, T. A., Trau, M. (2005) Polymeric grafting of acrylic acid onto poly (3-hydroxybutyrate-co-valerate): surface functionalizaton for tissue engineering applications. Biomacromolecules, 6:2197-2203.
[24] Okieimen, E.F., Ebhoaye, J.E. (1986) Grafting acrylic acid monomer on cellulosic materials. Journal of Macromolecular Science, 23:349-353.
[25] Bahari, K., Mitomo, H., Enjoji, T., Hasegawa, S., Yoshii, F., Makuuchi, K. (1997) Modified poly(3-hydroxybutyrate-co-3-hydroxyvalerate) using hydrogen bonding monomers. Applied Macromolecular Chemistry and Physics, 250:31.
[26] Witholt, B., Kessler, B. (1999) Perspectives of medium chain length poly (hydroxyalkanoates), a versatile set of bacterial bioplastics. Current Opinion in Biotechnology, 10:279-285.
[27] Jendrossek, D., Handrick, R. (2002) Microbial degradation of polyhydroxyalkanoates. Annual Review of Microbiology, 56:403-432.
[28] Scherer, T. M., Fuller, R.C., Lenz, R. W., Goodwin, S. (1999) Hydrolase activity of an extracellular depolymerase from Aspergillus fumigatus with bacterial and synthetic polyesters. Polymer Degradation and Stability, 64:267-275.
[29] Zohuriaan, M.J. (2005) Advances in chitin and chitosan modification through graft copolymerization: A comprehensive review. Iranian Polymer Journal, 14: 235
[30] Dave, H., Ramakrishna C. ,Desai J. D. (2000) Degradation of acrylic acid by fungi from petrochemical activated sludge. Biotechnology Letters, 18:963-964.
[31] Hu, S. G., Jon, C. H., Yang, M. C. (2003) Antibacterial and biodegradable properties of polyhydroxyalkanoates grafted with chitosan and chitooligosaccharides via ozone treatment. Journal of Applied Polymer Science, 88:2797-2803.

PRAJÑĀ - Journal of Pure and Applied Sciences, Vol. 18: 50 - 53 (2010) ISSN 0975 - 2595
NON-STRUCTURAL CARBOHYDRATE, PROTEIN AND MINERALS FROM SOME NON-CONVENTIONAL SEEDS OF SEMI-ARID REGION OF GUJARAT
Manisha Sharma* and Bharat Pandit1
Directorate of Medicinal and Aromatic Plants Research, Boriavi 387310, Gujarat 1Department of Life Sciences, Bhavnagar University, Bhavnagar 364 002, Gujarat
ABSTRACT
Seeds of eleven non conventional plants were selected for the study on the basis of its frequent use by tribal and rural community of semi-arid region of Gujarat. All reported seeds were analyzed for its non structural carbohydrate, protein and minerals like Ca, Mg, Na, K, and Fe. Total carbohydrate ranged from 0.71-33.07 mg/g in Paspalum scrobiculatum L and Citrullus lanatus respectively. Total protein was high in seeds of Cucumis melo (62.11 mg/g) and was low in Paspalum scrobiculatum (8.79 mg/g). Ca was high in H. vulgare (8.0 mg/g) and was low in Seteria italica (4.12 mg/g), Mg was high in Echinocloa colonum (36.24 mg/g) and was low in Echinocloa frumantacea (20.54 mg/g). Seeds of Nymphaea pubescens contained highest Na i.e. 0.29 mg/g amongst all reported plant species. While K was high in seeds of Paspalum crobiculatum (0.8 mg/g) and was low in Echinocloa colonum (0.04 mg/g). Seeds of all reported plant species contained very low amount of Fe. s
Key words: minerals, nonstructural carbohydrates,non-conventional plants, protein INTRODUCTION
According to WHF, 2005 [19] tropical countries are blessed with a diversity of foodstuffs which play a basic role in nutrition and healthy body development. Unfortunately an estimated 789 million people in developing countries still suffer from malnutrition especially infants and children of rural areas. Malnutrition can be tremendously reduced with an increase use of foods rich in energy, proteins, iron and vitamin A most especially those from the rural and tribal environment. Owing to diverse agroclimatic conditions India is endowed with a wide variety of plants both wild growing and domesticated, which contribute to the diet of its people. Depending upon certain factors like, availability, socio-economic conditions, tradition, taste and culture, some of these foods are regularly consumed in the form of staple foods whereas other are taken less frequently or on certain occasions are known as indigenous plants, under-utilized plants, famine food plants or non-conventional plants [4 and 9]. These non-conventional plants are valuable sources of nutrients in rural areas where exotic species are limited and thus contributes substantially to protein, minerals and vitamin intakes [11]. Tribal people use major component of diets providing the bulk of nutritional requirements. Which posses constitutes essential components of the meal by contributing protein, vitamins, iron, fiber, ascorbic acid and other minerals which are usually in short supply in the diet of urban people [12]. Most of the non-conventional plants are weedy, semi cultivated plant species which require very little input and management. Though they are very important are neglected by scientific and developmental system. Tribal people use most of these plants without any scientific knowledge and its nutritional value which may ever cause some health problem and malnutrition. Hence, scientific study was needed to enlighten nutrient contents of non-conventional plant foods to overcome malnutrition and therefore the study was conducted with an objective to analyze and quantify nutrient composition available in seeds of twelve non-conventional plants found in semi-arid region of Gujarat.
Nutritional contribution and nutritive value of most
common foods have been extensively studied but, there is practically no information on nutritive value of some of these
non-conventional foods which may contribute significant utrient intake of local population [4]. n
MATERIAL AND METHODS Source of plant material
The seeds of the total eleven plant species were taken to
carry out this study (2004-06) for which detail is mentioned in Table 1. They were collected from the field. Seeds of selected plant species considered in the present study are primarily used in form of flour or in raw state to mix with other flour or cook separately to prepare different dishes respectively. Identification of collected plants was done by local flora [16]. Uses of the plants were recognized by folklore and by book [1] and from Freedman’s “Famine Food” database (2003).
Table - 1 List of the selected plant species Sr. no. Scientific name Family
1. Amaranthus peniculatum L. Amaranthaceae
2 Citrullus lanatus Thunb, Mat and NaK. Cucurbitaceae
3. Cucumis melo L. Cucurbitaceae
4. Carvia callosa (Nees.) Bremek Acanthaceae
5. Eleusine coracana L. Gaertn. Poaceae
6. Echinocloa frumantacea Link. Poaceae
7. Echinocloa colonum L., Link. Poaceae
8. Hordeum vulgare L. Poaceae
9. Nymphaea pubescens Willd., Hk. F and Th. Nymphaeaceae
10. Paspalum scrobiculatum L. Poaceae
11. Seteria italica L., P. Beauv Poaceae
All collected seed samples were taken to the laboratory in dried form. They were ground, sieved through 60 mm meshes and stored in air-tight polythene bags under room temperature condition for further biochemical analysis.
Analysis of total carbohydrate was done following method given by Mahadevan and Sridhar [10] and was calculated by ddition of total sugar and total starch. a
* Corresponding author: [email protected]

2010 Sharma and Pandit – Non-Structural carbohydrate 51
Analysis of total sugar was done following Nelson’s method [15]. Procedure for analyzing reducing sugar was same as total sugar without hydrolysis and neutralization following Nelson’s method [15]. Non-reducing sugar was analyzed by subtraction of reducing sugar from total sugar [10]. Total starch was calculated following conversion factor of 0.9 to total sugar [10]. Total protein analysis was done following Lowry’s
ethod [8]. m M
ineral analysis
Analysis of minerals like Ca and Mg was done following method of Trivedi and Goel [18]; Na and K was done following Flame photometer method and Fe by AOAC manual [2]
Sample preparation for minerals was done by tri-acid
igestion method following Trivedi and Goel [18]. d S
tatistical analysis
All tests were performed in five replicates and statistical analysis was carried out using statistical software MSTAT 4.0 C package for computers (Michigan State University, USA) oftware following the method of Gomez and Gomez [5]. s
R
ESULTS AND DISCUSSION
According to Recommended Dietary Allowance (RDA) minimum 100 gm carbohydrate is required for body to perform normal functions. Highest carbohydrate was recorded in seeds of C. lanatus (table 2) but the recorded value is lower than reported by Gupta and Kanodia (40 mg g-1) [6] and other conventional seeds like wheat (626 mg g-1), pearl millet (675 mg g-1) and rice (750 mg g-1) [3, 13]. Seeds of A. peniculatum possess second highest value of carbohydrate, which was lower than seeds of A. gangaticus (70.3 mg g-1) reported by Katewa [7]. Recorded value was lower than reported by Aykroyd et al. [3 and 17] i.e. 62.7 g g-100. Recorded value of carbohydrate content of Citrullus lanatus was lower than reported elsewhere [17] i.e. 45 mg g-1. The seeds are eaten as appetizer. They are roasted, ground and added to sauces and soups to enrich their flavor and consistency. Recorded value of carbohydrate content of H. vulgare was higher than reported elsewhere [17] i.e. 6.3 mg g-1. The All India Co-Ordinate Barley Improvement Project has released a number of improved varieties of barley which may be more nutritious than the wild plant. Seeds of remaining plants species possess moderate to low carbohydrate contents but can incorporate in the diet to improve quantity and quality of food during famine. Protein content in seeds of reported plant species is in good proportion. Seeds of C. melo possess highest protein content amongst all reported plant species (Fig. 1), which is higher than rice (50 mg g-1) and was close to bengal gram (70 mg g-1), blak gram (78 mg g-1) and green gram (75 mg g-1) [7] In Rajasthan during scarcity dried fruit rind and seeds are used in curries [17]. C. lanatus possess second high protein content which is close to rice [13]. Recoded value of protein from C. lanatus was higher than reported in The Wealth of India [17] i.e. 19.7 mg g-1. The seeds are used as a protein supplements in Nigeria. They are parched and eaten with other grains [17]. Protein content of E. coracana was lower than its other improved varieties like JNR 852 and JNR 981 i.e 42 and 39 mg g-1. The grain of E. frumantacea contain higher protein content than reported in The Wealth of India [17] i.e. 9.6 mg g-1. Protein content of S. italica was lower than reported elsewhere (12.3 mg g-1) [17]. Remaining plant species contain moderate to low protein content.
Ca is major constituent of bones and teeth together with phosphorus. Result reveled that all reported plant species supplies excellent quantity of Ca (table 3), which is higher than conventional grain like wheat (0.48 mg g-1), rice (0.1 mg g-1), pearl millet (0.26 mg g-1) and pulses like Bengal gram (2.02 mg g-1) and Soya bean (3.02 mg g-1) [13]. Ca content of A. paniculatum was higher than Aykroyd et al. [3] and [17] i.e. 2.2 mg g-1. Ca content of C. lanatus was also higher than reported by Aykroyd et al. [3] and [17] i.e. 1 mg g-1. Ca content of E. frumantacea was lower than reported by Aykroyd et al. [3] i.e. 22 mg g-1. Seeds of S. italic contain higher Ca content than reported by Aykroyd et al. [3] i.e. 3.1 mg g-1. Mg content was also very high in seeds of reported plant species (Table 3) than conventional grain. Mg plays very important role in human immune system. It is required in plasma and extracellular system. It is required in many enzyme-catalyzed reactions; especially those in which nucleotides participate where the reaction species is the magnesium salt e.g. Mg ATP-2. Lack of Mg is associated with abnormal irritability of muscles and convulsions and excess Mg with the central nervous system. According to Narasinga et al, [14] RDA of Mg for man and woman is 400 mg day-1, hence, results revealed that all reported plant species fulfills the same if taken in proper amount. There are no RDA standards for minerals like Na and K, because requirement of both of these element is fulfills by common salts in food. But person who do rigorous exercise or work in the hot place and during hot season, one who perspires profusely extra amount of salt is required. Its deficiency may cause cramps of muscles, headache, tiredness and sickness. Seeds of N. pubescens possess highest Na amongst all reported plant species (table 3). Which is closer to wheat (0.2 mg g-1) and higher than pearl millet (0.15 mg g-1), maize (0.16 mg g-1) and barley (0.11 mg g-1) but it is lower than rice (0.8 mg g-1) [3]. Na of S. italica was lower than reported elsewhere (4.4 mg g-1) [3 and 17].
Fig. 1 Total Protein content (mg g-1 of dry wt) of seeds of selected non-conventional plants. (Each data is a mean n=5 ± signifies SD)
K was high in seeds of P. scrobiculatum amongst all
reported plant species (table 3), but it was higher than reported by Katewa [7] i.e. 0.04 mg g-1. Reported all plant species possess low iron content but can incorporate in diet by mixing
ith other grain or pulses to improve quantity and taste. w
Amaranthus seeds are highly nutritious and combination of seeds with other grains gives an excellent protein content, batter than milk. The protein and Ca content of E. colonum is greater than other major cereals. Seeds of Citrullus lanatus and Cucumis melo provides excellent source of protein and major minerals. Seeds of N. pubescens eaten in times of scarcity by mixing with other grains. But it produce toxic effects when consumed in excessive quantity [17]. The grain of P. scrobiculatum because of low carbohydrate content was useful

52 PRAJÑĀ – Journal of Pure and Applied Sciences 18: 50 – 53 December
Table - 2 Nonstructural carbohydrate contents (mg g-1 of dry weight) of seeds of selected non-conventional plants.
Each data is a mean n=5 ± signifies SD
Table - 3 Minerals contents (mg g -1 of dry weight) of seeds of selected non-conventional plants.
Plant species Ca (mg g-1)
Mg (mg g-1)
Na (mg g-1)
K (mg g-1)
Fe (mg 100g-1)
A. peniculatum 5.6±0.10 25.36±0.10 0.006±0.002 0.34±0.02 0.165±0.002
C. lanatus 4.66±0.41 27.62±0.45 0.009±0.002 0.41±0.11 0.009±0.003
C. melo 7.12±1.04 21.06±0.51 0.006±0.002 0.33±0.03 0.007±0.002
C. callosa 4.56±0.32 25.26±0.09 0.073±0.004 0.38± 0.02 0.019±0.002
E. coracana 7.26±0.20 23.33±0.35 0.005±0.002 0.34±0.04 0.319±0.002
E. frumantacea 5.55±0.29 20.54±0.28 0.0063±0.002 0.21±0.01 0.074±0.002 E. colonum 6.48±0.31 36.24±0.25 0.004±0.002 0.04±0.01 0.162±0.001 H. vulgare 8.0±0.2 23.38±0.02 0.004±0.002 0.28±0.02 0.013±0.003 N. pubescens 7.21±0.11 24.34±0.68 0.29±0.02 0.48±0.005 0.074±0.004 P. scrobiculatum 5.66±0.23 24.37±0.88 0.007±0.001 0.8±0.02 0.044±0.002
S. italica 4.12±0.10 23.48±0.47 0.0056±0.002 0.25±0.01 0.127±0.001 Each data is a mean n=5 ± signifies SD
to diabetic patient and for calorie conscious people, and used as substitute of rice. The grains have often been reported to cause poisoning of men and animal when used as a food. Storage of grain over a number of years is said to diminish the poisonous roperties [17]. p
CONCLUSION
Study revealed that seeds of Amaranthus peniculatum, Citrullus lanatus Cucumis melo, Echinocloa frumantacea, Echinocloa colonum and Hordeum vulgare are rich in carbohydrate, while seeds of all plant species are rich in protein, Ca, and Mg. Seeds of Nymphaea pubescens and Carvia callosa rich in Na and K but all species contain very low amount of Fe. Study also revealed that if reported all species incorporated in diet, person can overcome from
alnutrition and other health problems. m R
EFERENCES [1] Agarwal, V.S. (1986) Economic Plants of India. Kailash
Prakashan, Culcutta. [2] A.O.A.C. (1995) Association of Official method of
Analytical Chemists, Washington,DC.
[3] Aykroyd, W. R., Gopalan, C. B. V. and Balasubramanian, S. C. (1966) Nutritive value of Indian Foods and the Planning of Satisfactory Diets, Indian Council of Medical Research. Special report series No. 42.
[4] Duhan. A, Chuhan, B. M. and Punia, D. (1992) Nutritional value of some non-conventional plant foods of India. Plant Food for Human Nutrition; 42: 193-200.
[5] Gomez, A. A. and Gomez, K. A. (1976) Statistical Procedure for Agricultural Research. John Wiley and Sons, Singapore, .pp 684.
[6] Gupta, R. K. and Kanodia, K. C. (1968) Plants used during scarcity and famine periods in the dry regions of India. Journal d’ Agriculture tropicale et de Botanique; 15: 265-285.
[7] Katewa. S, S. (2003) Contribution of some wild food plants from forestry to the diet of tribals of southern Rajasthan. Indian Forester, 129(9): 1117-1131.
[8] Lowry, O. H., Rosebrough, N. J., Farr, A. L. and Randall, R. J. (1951) Protein measurement with folin phenol reagent. J. Biol. Chem; 193: 265-275.
[9] Lyimo, M., Temu, R. P. C. and Mugula, J. K. (2003) Identification and Nutrition composition of indigenous
No. Plant species Total sugar (mg g-1)
Reducing sugar (mg g-1)
Non-reducing sugar
(mg g-1)
Total starch (mg g-1)
Total Carbohydrate
(mg g-1) 1. A. peniculatum 12.58±0.78 0.39±0.02 12.19±0.75 11.33±0.70 23.91±1.48 2. C. lanatus 17.41±0.12 10.64±0.23 6.69±0.13 15.66±0.11 33.07±0.23 3. C. melo 10.37±0.23 3.24±0.07 7.13±0.18 9.33±0.20 19.70±0.44 4. C. callosa 5.18±0.27 0.47±0.03 4.71±0.26 4.66±0.24 9.84±0.52 5. E. coracana 1.33±0.12 0.23±0.01 1.25±0.14 1.33±0.11 2.8±0.23 6. E. frumantacea 6.67±0.1 0.63±0.1 6.83±0.12 7.50±0.12 14.18±0.12 7. E. colonum 8.21±0.4 3.23±0.09 4.99±0.49 7.39±0.36 15.60±0.77 8. H. vulgare 7.46±0.67 0.63±0.02 6.83±0.68 6.71±0.60 14.18±1.27 9. N. pubescens 4.00±0.08 2.37±0.12 1.63±0.04 3.6±0.07 7.60±0.16 10. P. scrobiculatum 0.37±0.07 0.19±0.004 0.18±0.07 0.33±0.06 0.71±0.13 11. S. italica 3.93±0.06 0.75±0.04 3.18±0.02 3.53±0.05 7.46±0.12
2010 Sharma and Pandit – Non-Structural carbohydrate 53
vegetables of Tanzania. Plant Food for Human Nutrition; 58: 82-92.
[10] Mahadevan, A. and Sridhar, R. (1996) Methods in Physiological Plant Pathology (Forth Edition). Shivkami Publications, Chennai.
[11] Mazava, N. A. (1995) Traditional vegetables in Tanzania. Paper presented at 1st National Reserch Planning Workshop Aiush, Tanzania.
[12] Mosha, T. C. and Gaga, H. E. (1999) Nutritive value and effect of blanching on trypsin and chynotrypsin inhibitor activities of selected leafy vegetables. Plant Food for Human Nutrition; 54: 271-283.
[13] Mudambi, S. R. and Rajagopalan, M. V. (1990) Fundamentals of Foods and Nutrition. Wiley Easterm Limited.
[14] Narasinga Rao, B. S, Deosthale, Y. G. and Pant, K. C. (1989) Nutrient Composition of Indian Foods. Natl, Instt. Of Nutrition, Hyderabad, India. pp.94
[15] Nelson, N. A (1944) Photometric Adaptation of Somogyi method for the determination of glucose. J. Biol. Chem; 152: 375.
[16] Shah, G. L. (1978) Flora of Gujarat State. University Press, Sardar Patel University, Vallabhvidhya Nagar, Gujarat.
[17] The Wealth of India (2006-2007) A dictionary of Indian raw materials and Industrial product, National Institute of science Communication and information resources, CSIR, New Delhi.
[18] Trivedi, R. K. and Goel, P. K. (1987) Practical methods in Ecology and Environment Science. Enviromedia Publications.
[19] WHF. (2005) World Hunger Facts, World Hunger Education Service. In FAO World Food Summit Progress Report September 2004. FAO publications, Rome.

ANTIBACTERIAL ACTIVITY OF METHANOLIC AND ACETONE EXTRACT OF SOME MEDICINAL PLANTS USED IN INDIAN FOLKLORE MEDICINE
J. P. Patel*
Department of Biology, V.P. & R.P.T.P. Science College, Vallabh Vidyanagar-388120
ABSTRACT
Antibacterial study of methanolic and acetone extracts of crude and treated (with 50 % lead acetate) extracts of medicinal plants viz, Alstonia scholaris Linn. R.Br. (Stem bark, Apocynaceae), Achyranthus aspera Linn. (Whole plant, Acantheceae), Moringa oleifera Lam. (Leaves, Morinaceae), Tinospora cordifolia (Stem, Menispermaceae), and Enicostema hyssopifolium (Willd) (Stem, Gentianaceae) was carried out. Extractive values in methanol were found to be higher than the extractive value in acetone, for all plants. All the extracts of the plants selected for the present study were tested for their antimicrobial activity at 40-mg/ml concentrations against eight strains of bacteria, by agarwell-difusion test. Acetone extract was found to be more active as compared to that of methanol extract. The phytochemical analysis of crude and treated extracts of all the currently studied plants revealed that to contain more or less similar type of chemical constituents (except protein and carbohydrate). The eight strains of bacteria were selected for antibiotic susceptibility against standard antibiotics like Ampicillin (10µg), Tetracycline (25µg), Gentamicin (30µg), Co-Trimoxazole (25µg), Amikacin (10µg), by Octadisc. Key words: antibacterial activity, medicinal plants, infectious diseases.
INTRODUCTION
Plants are invaluable sources of pharmaceutical products [1] and plants are recognized for their ability to produce a wealth of secondary metabolites and mankind has used many plant species for centuries to treat a variety of diseases [2]. Despite the wide availability of clinically useful antibiotics and semisynthetic analogues, a continuing search for new anti-infective agents remains indispensable because some of the major antibacterial agents have considerable drawbacks in terms of limited antimicrobial spectrum or serious side effects [3]. The negative health trends call for a renewed interest in infectious disease in the medical and public health communities and renewed strategies on treatment and prevention. Proposed solutions are outlined as a multi-pronged approach that includes: prevention, (such as vaccination); improved monitoring; and the development of new treatments. It is this last solution that would encompass the development of new antimicrobials [4]. There is an urgent need to discover new antimicrobial agents for human and veterinary therapeutic uses, as resistance to current drugs increases in severity and extent [5 & 6]. The identification of new natural products with antimicrobial activity, extraction methods, and hopefully new modes of action, is one of the ways of tackling this problem. Lack of scientific knowledge has often constituted a major constraint to consider the use of traditional herbal remedies in conjunction with or as an affordable alternative to orthodox medical treatment. In the present study, the methanolic and acetone extracts of five plants (traditionally used in many diseases) are studied for their antimicrobial activity in crude form and after treatment with 50 % lead acetate. MATERIALS AND METHODS Plant material
Authentic (powder) samples of Alstonia scholaris Linn.
R.Br. (Apocynaceae) Stem bark; Achyranthus aspera Linn. (Acantheceae) whole plant; Moringa oleifera Lam. (Morinaceae) Leaves -, Tinospora cordifolia (Menispermaceae) Stem-, and Enicostema hyssopifolium (Willd) (Gentianaceae)
whole plant, were collected from Bapalal Botanical Vaidya Research Center, Surat (Gujarat). Extraction
Plant material was dried at 60 ºC and made it powdered.
For each species four grams air dried powdered material was placed in a mortar and pestle and macerated with 100 ml of analytic grade solvents (methanol and acetone). Transferred the extracts in to a glass stoppered conical flask and shaken frequently and then allowed it to stand for 18 hours. Filtered the extracts by Whatman No. 1 filter paper, and transferred 25 ml filtrate to a flat- bottom dish and evaporated the solvent on a water bath. Dried it at 105 oC for 6 hours and cooled it in a desiccator for 30 minutes, following then, the prepared sample was weighed without any delay and calculated the content of extractable matter in mg/g of air-dried material [7]. Crude extract (10 ml) treated with 200µl of 50 % lead acetate (Hi-media, Mumbai), mixed properly and precipitated by centrifugation (REMI, India) at 10000 rpm for 15 min. Care fully removed the supernatant in watch glass and evaporated it at room temperature, dried at 105 oC for 6 hours and cooled in a desiccator for 30 minute. Extracts were dissolved in 90 % DMSO to concentration 40 mg/ml were used for antimicrobial activity. Phytochemical Screening
Crude extract in methanol (M1), and acetone (A1) and after treating it with 50 % lead acetate (M2) and (A2) respectively, of all the plants selected for the present study were subjected for their qualitative phytochemical screening of proteins, carbohydrates, saponins, tannins, glycosides, alkaloids, flavanoids, terpenoids, steroids and fixed oil, as per the method sited by Harborne [8]. Procured Bacterial Strain
Test organisms used in this study were collected from the
Department of Biosciences, Sardar Patel University, Vallabh Vidyanagar, Gujarat. The Gram-positive bacteria are Staphylococcus aureus (ATCC9144) (SA), Micrococcus luteus
PRAJÑĀ - Journal of Pure and Applied Sciences, Vol. 18: 54 - 58 (2010) ISSN 0975 - 2595
* Corresponding author: [email protected]

2010 Patel – Antibacterial activity of methanolic 55
(ATCC4698) (ML), Klebsiella pneumoniae (ATCC15380) (KP), Bacillus subtilis (ATCC 6051) (BC), and Gram-negative bacteria are Pseudomonas aeruginosa (ATCC25668) (PA), Enterobacter aerogens (ATCC13048) (EA), Salmonella typhi (NCTC 8394) (ST) and Salmonella paratyphi- A (SPA). Strains were maintained on nutrient agar. Agar diffusion Assay
Antimicrobial screening was done using agar well diffusion method [9]. For this, 25 ml of sterile Mueller –Hinton Agar No.2 (Hi-media), was poured in sterile autoclaved Petri plates, before pouring 100µl of activated culture of microorganism was added, and then allowed to solidify completely. The wells were prepared with the help of sterile 10 mm diameter cork-borer. Then 100 µl of prepared plant extract (40 mg/ml) solution were poured into the wells. Then the plates were sealed with plasticine and transferred to the refrigerator to diffuse out for 30 min. The plates were then incubated in the incubator at 37 oC for 24 hrs. Triplicate plates were prepared for each treatment and the average zone of inhibition excluding well, were recorded. 90% DMSO was used as negative control, and 0.01mg/ml tetracycline was used as positive control. Inoculum turbidity was maintained constant throughout the experiment to 0.8 OD at 660 nm. Level of turbidity is equivalent to approximately 1 × 10⁸ CFU/ml. Antibiotic susceptibility of selected bacterial strains
Susceptibility of selected bacterial strain was measured against standard antibiotics viz. Ampicillin(10µg), Tetracycline(25µg), Gentamicin(30µg), Co-Trimoxazole (25µg), Amikacin(10µg) by octadisc (Hi-media, Mumbai). Twenty ml of sterilized nutrient agar seeded with activated bacterial culture was poured in petri dish, allowed to solidify and octadisc was placed gently on surface by pointed forceps. Seal the plates with plasticine and incubate in the incubators at 37 oC for 48 hrs. RESULTS Extractive value
The results of extractive value in acetone and methanol are shown in Fig. 1. All the plants tested under study showed higher percentage of extraction in methanol than that of acetone. The yield for selected plants in acetone was found in the order of E. hyssofolia (7.11 %)> A. scholaris (2.50 %)> T. cordifolia (1.82%)> M. oleifera (1.22 %) > A.aspera (0.46 %), while in methanol yield was in the order of E. hyssofolia (26.5 %)> A.scholaris (18.5 %)> M. oleifera (6.36%)> T. cordifolia (3.47 %) > A. aspera (3.05 %).
Phytochemical screening
Results of phytochemical screening of methanolic extract
of all plants in crude (M1) form and after treatment with 50 % lead acetate (M2) are shown in Table 1. Results for crude acetone extract (A1), and after treatment with 50 % lead acetate (A2) are shown in Table 2. Alkaloids were present in M1 extract of E. hyssofolia, A. scholaris, T. cordifolia, M. oleifera, A. aspera (Table 1), while absent in A1 extracts of E. hyssofolia, A. scholaris, T. cordifolia (Table 2). Primary metabolites like carbohydrate and protein were detected in both M1 and A1 extract of all selected plants, and absent in M2 and A2 extract. Steroids were present only in both crude extract (M1 and A1) of A. scholaris (Table 1, 2). M1 extract of A.scholaris, M. oleifera and E. hyssofolia were showed positive
result for glycoside (Table 1), while glycoside was present in all A1 extract of all plants (Table 2). Both M1 and A1 extract of all five plants were showed presence of flavanoids (Table 1, 2). But M2 and A2 extracts of M. oleifera and E. hyssopifolium were only showed presence of flavanoids (Table 1 & 2). Saponin was detected in M1, M2, A1, A2 extracts of all plants (Table 1, 2). Terpenoids were absent in M1 extract of A. aspera (Table 1), while positive for the A1 extract (Table 2). Other all plants were positive for the presence of terpenoids in crude (M1, A1) as well as treated (M2, A2) extracts (Table 1, 2). Crude extract (A1) of A. scholaris and M. oleifera were only positive for the tannin (Table 2). Fixed oil was detected in any types of extracts in all selected plants. Antimicrobial activity
Results of comparative antimicrobial activity of M1 extract and M2 extracts of all plants are recorded in Table 3, and results of A1 and A2 are shown in Table 4. M1and M2 extracts of all plants were completely inactive against BS (Table 3). M1, M2 extracts of M. oleifera was found most active extracts as only BS and KP only were not inhibited by extract (Table 3). In methanolic extract highest inhibition (10mm) was shown by A. scholaris against ML (Table 3). Highest zone of inhibition (22mm) was observed by A2 extracts of A.scholaris against EA. KP was completely resistant towards acetone extracts (A1, A2) of E.hyssofolia, A.scholaris, T.cordifolia, M. oleifera, A.aspera (Table 4). BS, EA, and SA were found sensitive to A1 and A2 extracts of all plant (Table 4). Moderate kind of sensitivity was observed in ML and SPA, and least activity found in PA and ST, against A1 and A2 extract (Table 4). One strong observation was observed in present study was that in all plants A2 and M2 extract showed higher antibacterial activity than the A1 and M1 at same concentration (40mg/ml) respectively. All strain of bacteria was susceptible to positive control, and DMSO 90 % as negative control was not inhibiting any bacterial strain. Antibiotic susceptibility of bacterial strains
Results of antibiotic susceptibility of the selected bacterial
strains are shown in (Graph.2). ML was more susceptible to all antibiotics. EA, PA, and SA were completely resistant to co-trimoxazole (25 µg/disc). STB was also showed negligible inhibition (4mm) against co-trimoxazole (Graph 2). Highest susceptibility (22mm) was found in KP against tetracycleine (25 µg/disc). Amphicillin at 10µg/disc was showed negligible activity against EA (2mm), STB (4mm), PA (2mm), and SA (2mm). DISCUSSION
The higher yield of the methanol extracts compared with the acetone extracts suggests that the secondary metabolites of plants were more soluble in methanol than that of acetone. In the present study cold maceration was used to extract secondary metabolite. That may be reason for low yield of extracts, also the maceration [10] and cold extraction [11 & 12] have been generally reported to give lower yield of plant extracts as compared to hot and soxhlet extractions. Mostly both (acetone and methanolic) types of extractions yield same type of phytochemicals like alkaloids, saponins, glycosides, flavanoids, tannins, and terpenoids as particular to different plants. And the compounds such as tannin [13, 14], glycosides [15], Saponins [16], trerpenoids and flavanoids, [17] and Alkaloids [18] were well defined as antimicrobial agents in plants.
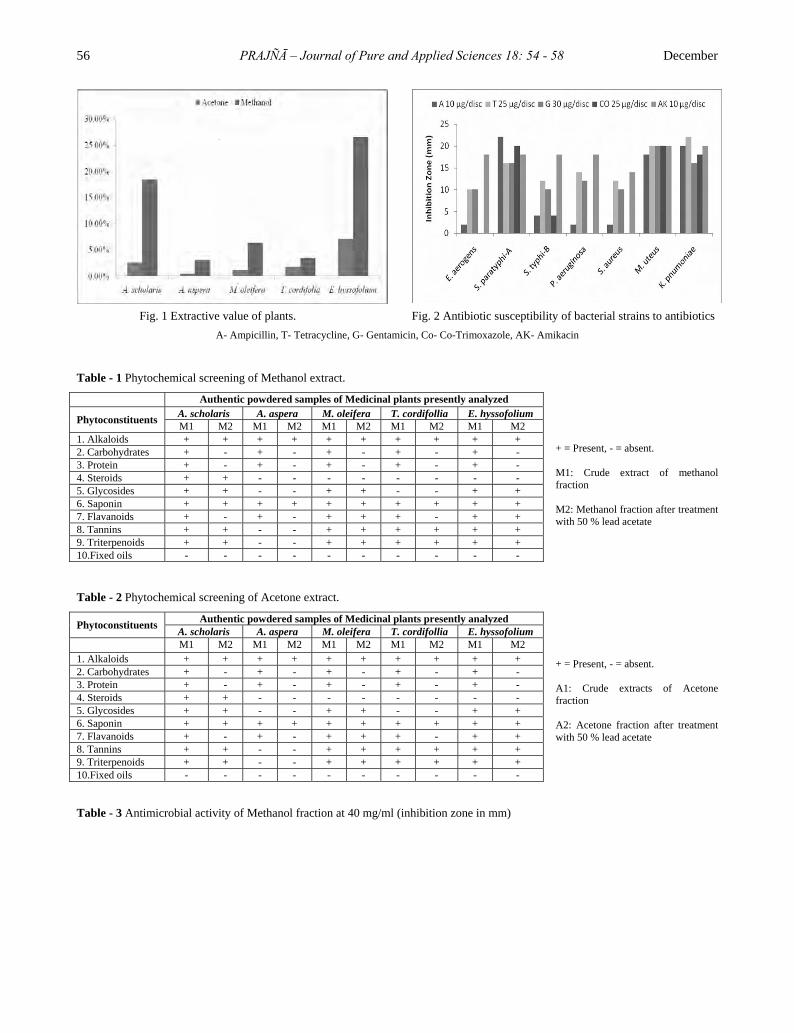
56 PRAJÑĀ – Journal of Pure and Applied Sciences 18: 54 - 58 December
Fig. 1 Extractive value of plants. Fig. 2 Antibiotic susceptibility of bacterial strains to antibiotics
A- Ampicillin, T- Tetracycline, G- Gentamicin, Co- Co-Trimoxazole, AK- Amikacin
Table - 1 Phytochemical screening of Methanol extract.
+ = Present, - = absent. M1: Crude extract of methanol fraction M2: Methanol fraction after treatment with 50 % lead acetate
Table - 2 Phytochemical screening of Acetone extract.
+ = Present, - = absent. A1: Crude extracts of Acetone fraction A2: Acetone fraction after treatment with 50 % lead acetate
Table - 3 Antimicrobial activity of Methanol fraction at 40 mg/ml (inhibition zone in mm)
Authentic powdered samples of Medicinal plants presently analyzedA. scholaris A. aspera M. oleifera T. cordifollia E. hyssofolium Phytoconstituents M1 M2 M1 M2 M1 M2 M1 M2 M1 M2
1. Alkaloids + + + + + + + + + + 2. Carbohydrates + - + - + - + - + - 3. Protein + - + - + - + - + - 4. Steroids + + - - - - - - - - 5. Glycosides + + - - + + - - + + 6. Saponin + + + + + + + + + + 7. Flavanoids + - + - + + + - + + 8. Tannins + + - - + + + + + + 9. Triterpenoids + + - - + + + + + + 10.Fixed oils - - - - - - - - - -
Authentic powdered samples of Medicinal plants presently analyzedPhytoconstituents A. scholaris A. aspera M. oleifera T. cordifollia E. hyssofolium M1 M2 M1 M2 M1 M2 M1 M2 M1 M2
1. Alkaloids + + + + + + + + + + 2. Carbohydrates + - + - + - + - + - 3. Protein + - + - + - + - + - 4. Steroids + + - - - - - - - - 5. Glycosides + + - - + + - - + + 6. Saponin + + + + + + + + + + 7. Flavanoids + - + - + + + - + + 8. Tannins + + - - + + + + + + 9. Triterpenoids + + - - + + + + + + 10.Fixed oils - - - - - - - - - -

2010 Patel – Antibacterial activity of methanolic 57
M1:-Methanol M2:- Methanol fraction after treatment of 50 % lead acetate, - : no inhibition zone
Table - 4 Antimicrobial activity of acetone fraction at 40 mg/ml (inhibition zone in mm)
A1:-Acetone, A2:- Acetone fraction after treatment with 50 % lead acetate, - : no inhibition zone
A1 extracts were found more active than M1 extract, which indicates that active component of plants extracted more may get extracted in very low concentration in methanol, as solubility of compound depends upon the polarity of extraction solvent [19] and [20]. High sensitivity of Gram- positive bacteria (except KP) than the Gram-negative bacteria, for selected plant extracts (M1, M2, A1, A2) was found in the present study. The high resistance of gram-negative bacteria could be because of the phospholipid membrane in addition to the inner peptidoglycan layer, which makes the cell more impermeable for exogenous molecules [21].
Methanolic extract of A. aspera was inactive against BS, EA, KP, PA, and SPA, while acetone extract is active against BS and KP. These findings are in accordance with the findings of Jigna et al. [22]. Acetone extract of A. scholaris was more active than that of methanol extract, results thus indicate active components in A. scholaris were more soluble in relatively non-polar solvent, as reported by Khan et al. [23], that butanol fraction has broad spectrum of antibacterial activity. Goyal et al. [24] reported that alkaloids, sterols alkenes, are key antimicrobial agents in A. scholaris and their results matching with our findings. M. oleifera was most active plant among the plants selected for the present study. Activity of plant is attributed to the presence of saponins, tannins, alkaloids and phenols [25]. Acetone extracts of M. oleifera only show the antimicrobial activity against the ST and STA. Similar results were observed by Doughari et al. [26] for Salmonella typhi. Both bacteria are causative agents of the Typhoid fever and recent years there has been a rapid rise in multidrug resistance by ST all over the world [27, 28 & 29]. A2 extract of M. oleifera can be used to developed antityphoid agent. Activity of methanolic and acetone extract of E.hyssofolium was attributed to the presence of flavanoids as a major constituent in E. hyssofolium [30]. Singh et al. [31] reported the presence of terpenoids and glycosides in T. cordifolia. These components are the responsible agents for the antibacterial activity of these plants [32].
M2 and A2 extracts of all plants were more active than that of their crude extract (M1, A1), phytochemical screening
revealed that carbohydrates and proteins were absent in M2 and A2, while these
present in higher concentration in crude extract, which may be interfered in diffusion of active component. Moreover the differences of antimicrobial activity of extracts were difficult to speculate; however, many antibacterial agents may exhibit their action through inhibition of nucleic acids, proteins and membrane phospholipids biosynthesis [33]. Extract with analytical grade acetone gave a relatively wide spectrum of antimicrobial activity (37.5% – 87.5%) against the test bacterial strains compared to methanol
extract (12.5 % - 75 %). The relatively wider spectrum of activity of the acetone extracts over the methanol extracts is difficult to explain since all the extracts contained the metabolites, though not in the same proportions. Perhaps, the active principles were more soluble in analytical acetone than in methanol solvents.
Antibacterial alternative for selected bacterial strains ware always in focus because of its infectious nature and bacteria has ability to develop the genetic ability to transmit and acquire resistance to drugs, which are utilized as therapeutic agents [34]. Several earlier studies indicated the usefulness of plant for control of resistant strains of bacterial like S. aureus [35] and P. aeruginosa [36, 37 & 38]. Among the plants selected for the present study the acetone extract of A. scholaris and M. oleifera can be used for the new antibacterial agent, for EA, SA and ML. REFERENCES [1] Olalde Rangel, J.A. (2005) The systemic theory of living
systems and relevance to CAM. Part I: The theory. Evid Based Complement Alternat Med, 2: 13–18.
[2] Cragg, G.M., Boyd, M.R., Khanna, R., Kneller, R., Mays, T.D., Mazan, K.D., Newman, D.J. and Sausville, E.A. (1999) International collaboration in drug discovery and development: the NCI experience. Pure Appl Chem. 71: 1619-1633.
[3] Olila, D., Olwa-Odyek and Opuda-Asibo, J. (2001) Antibacterial and antifungal activities of extracts of Zanthoxylum chalybeum and Warburgia ugandensis,
Plants BS EA KP ML PA SA ST SPA M1 - - 2 6 2 - - - A.scholaris M2 - - 4 10 5 - - - M1 - - - 2 - 4 2 - A. aspera M2 - - - 5 - 8 6 - M1 - 4 - 2 4 2 2 2 M.oleifera M2 - 8 - 5 9 7 6 6 M1 - 2 - - - - - - T. cordifolia M2 - 7 - - - - - - M1 - - - - - - 2 - E. hyssofolium M2 - - - - - - 6 -
Plants BS EA KP ML PA SA ST SPA A1 6 20 - 10 - 4 - - A. scholaris A2 8 22 - 14 - 7 - - A1 4 4 - 2 - 3 - - A. aspera A2 7 8 - 4 - 4 - - A1 7 8 - 10 6 10 6 2 M.oleifera A2 9 12 - 13 9 13 10 5 A1 2 5 - - - 5 - 8 T. cordifolia A2 6 9 - - - 10 - 12 A1 4 6 - - - 7 - - E. hyssofolium A2 8 9 - - - 10 - -

58 PRAJÑĀ – Journal of Pure and Applied Sciences 18: 54 - 58 December
Ugandan medicinal plants, African Health Sciences, 1(2):66-72.
[4] Fauci, A. (1998) New and reemerging diseases: The importance of biomedical research. Emerging Infectious Diseases. (www.cdc.gov/ncidod/EID/vol4no3/fauci). 4: 3.
[5] Robert, A. and Meunier, B. (1998) Is Alkylation the Main Mechanism of Action of the Antimalarial Drug Artemisinin ? Chem. Soc. Rev., 27: 273-279.
[6] Setti, E.L. and Micetich, R.G. (1998) New Trends in Antimicrobial Development. Current Medicinal Chemistry, 5:101-113.
[7] WHO (2002) Geneva, Quality Control Method for Medicinal Plant Materials, New Delhi, 51:30.
[8] Harbone, J.B. (1984) Phytochemical Methods – A Guide to Modern Techniques of Plant Analysis 2nd Edition. (Chapman and Hall London. New York).
[9] Perez, C., Paulin Mand and Bazerque, P. (1990) An antibiotic assay by the well agar method. Acta. Biological Medicine Experitimentalis, 15:113-115.
[10] Ibrahim, M.B., Owonubi, M.O. and Onaolapo J.A. (1997) Antimicrobial effects of extracts of leaf, stem and root-bark of Anogiessus leicarpus onStaphylococcus aureus NCTC 8190, Escherichia coli NCTC 10418and Proteus vulgaris NCTC 4636. J. Pharmaceutical Res. Dev. 2:20-26.
[11] Okeke, M.I., Iroegbu, C.U., Eze, E.N., Okoli, A.S. and Esimone, C.O. (2001) Evaluation of extracts of the root of Landolphia owerrience for antibacterial activity. J. Ethnopharmacol. 78: 119-127.
[12] Okoli, A.S., Okeke, M.I., Iroegbu, C.U. and Ebo, P.U. (2002) Antibacterial activityof Harungana madagascariensis leaf extracts. Phytother. Res. 16:174-179.
[13] Scalbert, A. (1991) Antimicrobial properties of tannins. Phytochemistry 30 : 3875-3883.
[14] Aboaba, O.O., Smith, S.I. and Olude, F. O. (2006) Antibacterial effect of edible plant extract on Escherichia coli 0157:H7, Pakistan Journal of Nutrition, 5 (4) : 325-327.
[15] Aboaba, O. O. and Efuwape, B.M.(2001) Antibacterial properties of some Nigerian spices. Bio. Res. Comm., 13: 183 - 188.
[16] Hostettman, K and Nakanishi, K. (1979) Moronic acid, a simple triterpenoid keto acid with antimicrobial activity isolated from Ozoroa mucroanta. J. Med. Plant Res. 31: 358-366.
[17] Leven, M., VandenBerghe, D.A., Mertens, F., Vlictinck, A and Lammens, E. (1979) Screening of higher plants for biological activities/- antimicrobial activity. Plant. Med., 36: 311-321.
[18] Damintoti Karou1, Aly Savadogo, Antonella Canini, Saydou Yameogo, Carla Montesano, Jacques Simpore, Vittorio Colizzi and Alfred S. Traore. (2005) Antibacterial activity of alkaloids from Sida acuta. African Journal of Biotechnology. 4 (12): 1452-1457.
[19] Eloff, J.N. (1998) Which extractan should be used for screening and isolation of antimicrobial components from plants. J. Ethanopharmacol., 60: 1-8.
[20] Cowan, M. M. (1999) Plant product as antimicrobial agents, Clin.Microbiol.Rev. 12: 564-582.
[21] Nikaido, H and Vaara M. (1985) Molecular basis of bacterial outer membrane permeability, Microbiological Reviews, 1:1-32.
[22] Jigna, P., Rathish, N and Sumita, C. (2005) Priliminary screening of some folklore medicinal plants from western India for potential antimicrobial activity, Inian J. Pharmacol., 37(6): 408-409.
[23] Khan, M.R., Omoloso, A.D and Kihara, M. (2003) Antibacterial activity of Alstonia scholaris and Leea tetramera. Fitoterpia 74(7-8): 736-40.
[24] Goyal, M.M. and Varshney, A. (1995) Effects of natural products isolated from three species of Alstonia on some gram-positive and gram-negative bacteria. Indian Drugs 32(2): 69-72.
[25] Clark, W.S. (1981) Antimicrobial activities of phenolic constituents of Magnolia grandiflora L. J. Pharm. Sci. 70: 951-952.
[26] Doughari, J.H., Pukuma, M.S. and De N. (2007) Antibacterial effects of Balanites aegyptiaca L. Drel. and Moringa oleifera Lam. on Salmonella typhi, African Journal of Biotechnology , 6 (19): 2212-2215.
[27] Chin, N.T., Perry, C.M., Ly, N.T., Ha, H.D., Thong, M and Diep, T.S. (2002) Randomized controlled comparison of azithromycin and ofloxacin for treatment of multidrug resistant or nalidixic acid resistant enteric fever. Antimicrob. Agents Chemother. 44: 1855-1859.
[28] Benoit, D., Renand, L., Daniele, M., Ame, B., David, B., Michael, R.M., Elisabeth, C and Anel, C. (2003) Variant Salmonella genomic island 1 antibitotic gene resistance cluster in Salmonella enterica Albany. Emerg. Infect. Dis. 9(5):585-591.
[29] Abdullah, W.B., Anowa, H., Doli, G., Amina, T.S., Kamrun, N., Korshed, A., Neor, A., Aliya, N., Balakrish, N., Stephen, L and Robert B. (2005) Bacteremic typhoid fever in children in an urban slum, Bangladesh. Emerg. Infect. Dis. 11(2): 326-329.
[30] Ghosal, S and Jaiswal D.K. (1980) Chemical constituents of Gentianaceae XXVIII:Flavonoids of Enicostema hyssopifolium (Willd.) Verd. J. Pharm Sci. 69(1): 53-56.

PRAJÑĀ - Journal of Pure and Applied Sciences, Vol. 18: 59 - 62 (2010) ISSN 0975 - 2595
A STUDY ON NYLON-66/ABS BLENDS PREPARED BY PHYSICAL BLENDING
Neetha John1* and Vikram R. Singh
Sophisticated Instrumentation Center for Advanced Research & Testing (SICART),
Vallbh Vidyanagar – 388 120, Gujarat 1J. J. Murphy Research Center, Rubber Park Pvt. Ltd., Valayachiragara, Ernakulam – 683556, Kerala.
ABSTRACT
Engineering plastics are expanding their applications in the immerging world replacing metal components and reducing weight and amongst most two of them are selected to study their blending behavior. Nylon-66(N-66) and Acrylonitrile butadiene styrene (ABS) co- polymer were blended in basic conventional manner i.e. simple physical melt blending in various proportions. The reason for blending both the polymers is to study their morphology, miscibility and compatibility of blends at various ratios. Blends were studied for mechanical properties i.e. tensile strength, flexural strength, izod impact strength, etc. Blend with optimized level of mechanical property was studied for thermal properties by differential scanning calorimeter (DSC) and thermo gravimetric analysis (TGA). The morphology was studied by scanning electron
icroscopy (SEM). m Key words: Polymer blends, physical blending, Nylon-66, ABS. I NTRODUCTION
The polymer blends which is completely miscible to give a homogeneous single phase exhibit excellent properties and proportional to the ratio of two polymeric components [1-2]. For immiscible and incompatible blends, since their interfacial tension is higher and the interface between them is very sharp, the thickness of their interfacial layer is very small [3]. Quality of a polymer blend depend upon the type of disperses phases, adhesion and cohesion between the phases and the morphology of the system [4-7]. Molecular miscibility and compatibility are two important properties of polymeric components [8-11]. However simple blends of immiscible polymers generally exhibit poor mechanical properties that stem from the unfavourable interactions between their molecular segments. This is manifested as a coarse, unstable phase morphology that develops during melt processing and weak interfaces between he phases in the solid states. t
Interest in blends of Nylon-66 with ABS stems from the
possibility of combining the desirable characteristics of both of these materials. Blends of N-66 with ABS materials are of significant commercial interest. Nylon-66 provide good strength, stiffness and resistance to non-polar Nylon-66olvents, whereas ABS materials provide toughness and low cost. Although simple blends of Nylon-66 and ABS exhibit poor mechanical properties, their properties can be greatly improved, often with synergistic effects, through appropriate compatibilization. [12]
Nylon-66 (N-66) being a versatile engineering plastic
lacks some properties like difficulty in processing, moisture absorption, dimensional instability, sharp melting, lower impact which decreases its area of applications. But it gives superior tensile strength, self lubrication, wear resistance. At this juncture blending with ABS can lead to overcome the limitation and widening the application of Nylon-66. As the chemical resistance of both the polymers is appreciably good they can also be used in biomedical implants, e.g. knee caps; limbs [13-14].
As Nylon-66 and ABS both are leading engineering
material used in various applications and up to a certain extent
have replaced metals too. Although they have good structural, chemical and mechanical properties, they both tend to have few disadvantages individually.
Most of the work performed was focused on Nylon-6 and
its blend with other polymeric materials. The basic reason for the same is the ease of processing Nylon-6 with other polymers as compared to Nylon-66. Nylon-6 having lower processing temperature compared to Nylon-66 allows better control over processing of the material.
Our work deals with the blending of Nylon-66 and ABS in
various proportions to study the miscibility between the two polymers and the properties. The blends of Nylon-66and ABS are then studied for various mechanical properties, thermal properties, and chemical properties [15-16]. M
ATERIALS AND METHODS Materials Used: Nylon-66(N-66) – Dupont, Grade – Zytel – EPL-02-2E-30 A
BS – Bayer ABS Ltd., Grade – Absolac – 300
Blending Process
As known both Nylon-66 and ABS are hydrophilic in nature and tend to absorb atmospheric moisture. Thus to remove the humidity both the polymers were preheated up to 90ºC for 6 hrs. The preheated material was then weighed in various blend ratios from 5 parts of ABS to 60 parts of ABS in Nylon-66. The blending was done using pelletizer at the processing temperature of material having higher processing temperature. The blends are extruded as strands in cut to form granules. The granules are dried off as were passed through water for cooling. The formed granules are preheated before they can be moulded in the Injection Moulding Machine to form test specimens for tensile, flexural and impact strength.
The blends were tested for mechanical properties as
tensile strength, tensile modulus, % elongation [ASTM D 638]; flexural strength, flexural modulus [ASTM D 790]; izod impact strength [ASTM D 265]; Rockwell hardness [ASTM D 758]; water absorption [ASTM D 570]; Flame resistance [ASTM D 635] and electrical properties [ASTM D 6257], [17-19]. From all the above properties, the optimized blend ratio was obtained
*Corresponding author: [email protected]

60 PRAJÑĀ – Journal of Pure and Applied Sciences 18: 59 - 61 December
and its thermal properties were studied using differential scanning calorimeter (DSC), make – Perkin Elmer; model – Pyris 1 and thermo gravimetric analysis (TGA), make – Perkin Elmer; model – Pyris 1. The phase morphology of the optimized blend ratio of was studied using the scanning electron microscopy (SEM) make – Philips, Netherlands;
odel – ESEM EDAX XL 30. m R
ESULTS AND DISCUSSION The mechanical properties of Nylon-66/ABS blends from
5 parts to 60 parts of ABS measured are tensile strength, % elongation, tensile modulus, flexural strength, flexural modulus, izod impact strength and rockwell hardness as shown in fig. 1-7. In all the graphs we can see a similar sort of trend. The Tensile strength, flexural strength, izod impact strength and Rockwell hardness increase up to 30 parts of ABS and then tends to decrease (Fig.1,.4, 6,.7). A constant increase was observed in tensile modulus and flexural modulus (Fig. 3, 5),
hereas there is a constant decrease in % elongation (Fig. 2). w
Fig. 8(a-c) shows water absorption of various blend ratios under different conditions. Off all the three graphs it can be clearly interoperated that as the proportion of ABS increases in the blend the amount of water absorption tends to decrease. As the properties of blends were best observed at 30 parts of ABS in Nylon-66 it is further tested for electrical properties i.e.
olume and surface resistivity (Table - 1). v Table - 1 values of volume resistivity and surface resistivity
30 parts of ABS in N-66/ABS blends.
Sample Volume Resistance Ohm/mm
Surface Resistance Ohm
30 parts of ABS in
N-66/ABS blend
34 X 1013 54 X 1011
The thermal behaviour was studied for the blend
composition which has showed most enhanced performance of all the blend compositions. The best enhancement was obtained in 30 parts of ABS in Nylon 66 blend. The DSC and TGA of blend are shown in Figs. 9 and 11 respectively. Both thermal studies show the behaviour of blend without using any aid for the enhancement of the blend compatibility. DSC and TGA are used as references when studying the effect of different aid for improving the blend compatibility.
Scanning electron micrograph (Fig. 11) reveals the
morphological characteristics of the blends. The N-66 forms the continuous phase in which the ABS spheres are well dispersed. The dispersed ABS phase has least compatibility
hen there is less interphase miscibility. w C
ONCLUSION
The main purpose is to study behaviour of Nylon 66 when ABS is incorporated by blending in various ratios from 5 parts to 60 parts by just physical blending without any sort of aid for enhancing blend compatibility. The behaviour of the blend was studied using Tensile Strength, % Elongation, Tensile Modulus, Flexural Strength, Flexural Modulus, Izod Impact Strength, Rockwell Hardness, Water Absorption and Flame Resistance. The major properties like Tensile Strength, Flexural Strength Izod Impact Strength and Rockwell Hardness were maximum in 30 parts of ABS in Nylon 66 blend. An increasing trend was observed in all the above three properties measured up to 30 parts of ABS in Nylon 66 then the properties starts to decrease. In other properties which were measured the overall enhancement was observed in 30 parts of ABS in Nylon 66.
Fig. 1: Tensile Strength of N-66/ABS blends.
Fig. 2: % Elongation of N-66/ABS blends.
Fig. 3: Tensile Modulus of N-66/ABS blends.
Fig. 4: Flexural strength of N-66/ABS blends.
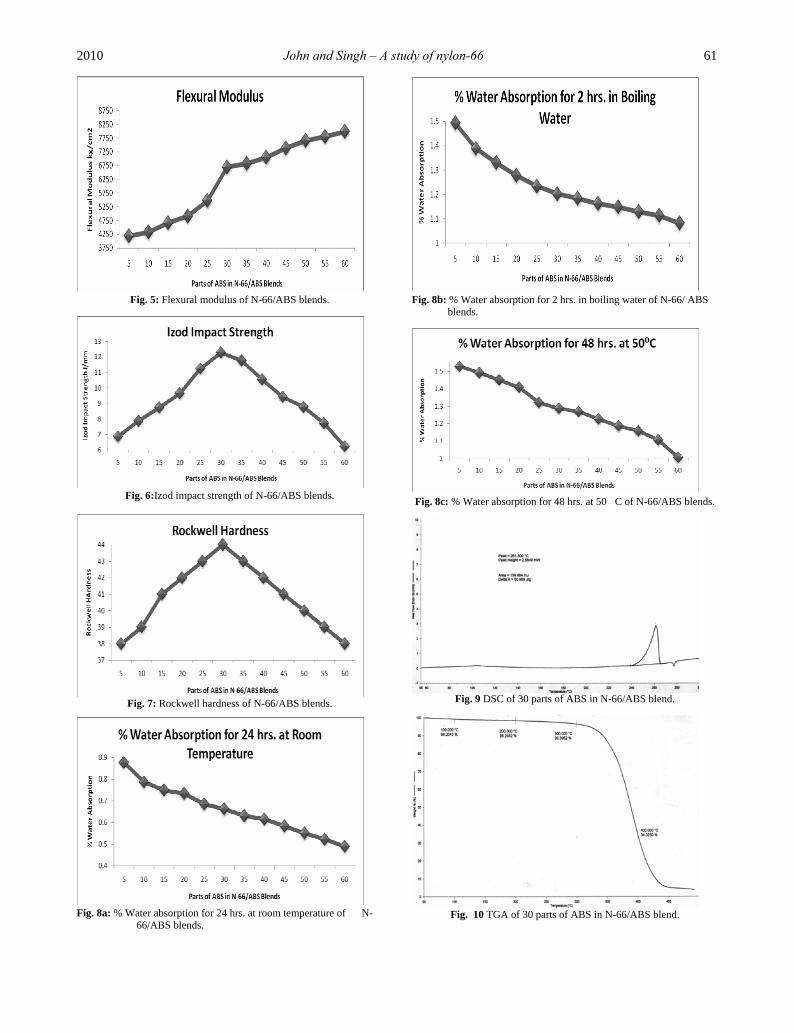
2010 John and Singh – A study of nylon-66 61
Fig. 5: Flexural modulus of N-66/ABS blends.
Fig. 6:Izod impact strength of N-66/ABS blends.
Fig. 7: Rockwell hardness of N-66/ABS blends.
Fig. 8a: % Water absorption for 24 hrs. at room temperature of N-66/ABS blends.
Fig. 8b: % Water absorption for 2 hrs. in boiling water of N-66/ ABS
blends. Fig. 8c: % Water absorption for 48 hrs. at 50C of N-66/ABS blends.
Fig. 9 DSC of 30 parts of ABS in N-66/ABS blend.
Fig. 10 TGA of 30 parts of ABS in N-66/ABS blend.

62 PRAJÑĀ – Journal of Pure and Applied Sciences 18: 59 - 61 December
Fig. 11 SEM of 30 parts of ABS in N-66/ABS blend. R
EFERENCES [1] Paul, D. R., Barlow, J. W. (1980) Polymer Blends (or
Alloys) J. Macromol. Sci. – Rev. Macromol. Chem., 18: 109 - 168.
[2] Utracki, L. A. (2000) Polymer Blends, Rapra Review, 11: 1 - 170.
[3] Bose, S., Bhattacharya, A. R., Kodgire, P. V., Mishra, A. (2007) Fractionated crystallization in PA6/ABS blends: Influence of a reactive compatibilizer and multi wall carbon nanotubes, Polymer, 48: 356 - 362.
[4] Paul, D. R., Newman S. (1978) Polymer blends, Academic Press, New York, pp 1 - 435.
[5] Kryszewski, M., Gateski, A., Martuscelli, E. (1979) Polymer Blends Processing, Morphology, and Properties; Plenum Press, New York, pp. 1 - 287.
[6] Olabisi, O., Robeson, L. M., Shaw, M. T. (1979) Polymer –Polymer Miscibility; Academic Press, New York, pp. 1 - 898.
[7] Barlow, J. W., Paul, D. R. (1981) Polymer Blends and Alloys—A Review of Selected Considerations, Polymn. Eng. Sci., 21: 985 - 996.
[8] Gould, R .F. (1971) Multi component Polymer System; American Chemical Society Publication, pp. 1 - 272.
[9] Shelson, R. P., (1982) Composite Polymeric Materials; Applied Science Publications, London, pp. 1 - 213.
[10] Joseph, R., George, K. E., Francis, D. J., Thomas, K. T. (1987) Polymer - Solvent Interaction Parameter for NR/SBR and NR/BR Blends, Polymeric Materials; 12: 29 - 34.
[11] Guthrie, J. T., Squires L. J. (1984) The effect of organic nitriles on the radiation induced polymerization of styrene, J. Polymn. Sci., 22: 135 - 144.
[12] Kudva, R. A., Keskkula, H., Paul, D. R. (2000) Fracture behaviour of nylon 6/ABS blends compatibilized with an imidized acrylic polymer; Polymer; 41: 335 - 349.
[13] Brydson, J. A. (1995) Plastics Materials; Butterworth London, pp. 1 - 920.
[14] Brydson, J. A. (1994) Speciality Rubbers, Rapra Review, 74: pp. 1 - 105.
[15] John, N., Singh, V. R. Blends of Nylon-66 with chemically modified ABS (m-ABS) using novel method of UV Irradiation, Polymer – Plastics Tech. And Engg., (In press).
[16] John, N., Singh, V.R. N-66/m-ABS blends by chemically grafting long chain compounds on butadiene region of ABS using novel method of UV irradiation technique; Intern. J. of Polym. Mat., (In press).
[17] Annual Book of ASTM Standards (2003) ASTM International, Sec. 8, 8.01, 8.02, 8.03.
[18] Shah, V. (1984) Handbook of Plastics Testing Technology, John Wiley & Sons Inc., pp. 1 - 527.
[19] Brown, R. P. (1988) Handbook of Plastics Test Methods, Longman Scientific & Technical, pp. 1 - 442.

SYNTHESIS, CHARACTERIZATION AND APPLICATION OF SOME NEW
HOT BRAND BISAZO REACTIVE DYES ON VARIOUS FIBRES
Divyesh R. Patel, Jigna A. Patel and Keshav C. Patel*
Department of Chemistry, New Synthetic Organic Chemistry Research Laboratory,
Veer Narmad South Gujarat University, Surat-395 007, Gujarat (India)
ABSTRACT
The aim of the present study was to synthesize new dyestuffs based on 4,4’-methylene-bis(o-nitro aniline) derivatives in order to achieve good dyeing and fastness properties. The use of 4,4’-methylene-bis(o-nitro aniline) (1) as tetrazo component and ten different acid compounds as coupling components furnished a series of ten novel bisazo reactive dyes (5a-j), which were characterized by elemental analysis and different spectrometric technique like UV-Vis, IR and 1H NMR. The dyeing performance of these dyes was assessed on silk, wool and cotton fabrics. The dyed fabric showed moderate to very good light fastness and good to excellent washing and rubbing fastness properties. The dye bath exhaustion and fixation were found to be good and acceptable. Key words: 4, 4’-methylene-bis (o-nitro aniline), Bisazo reactive dyes, Cotton fabrics; Fastness propertie, Exhaustion; Fixation.
INTRODUCTION
Reactive dyes are coloured compounds which contain one or two groups capable of forming covalent bonds between a carbon and phosphorus atom of the dye ion or molecule and oxygen, nitrogen or sulphor atom of the hydroxyl, an amino or a mercapto group of the substrate. Such covalent bonds are formed with the hydroxyl group of the cellulose fibre, with the amino, hydroxyl and mercapto group of the protein fibre and with the amino group of polyamides [1]. These dyes are generally used on higher value clothes, which are normally mercerized [2]. Reactive dyes containing cyanuric chloride molecule play an important role in the synthesized dyes. It is a key component in the dyestuff having two reactive groups in their structure, which gives good fixation yields, excellent wet fastness, brilliant shades and simple application techniques in textile printings.
It can also be easily understood that dyes with two
reactive groups give a good fixation yield than dyes with one reactive group for it one of the two dye-fibre bond is hydrolyzed and one is still left for fixation [3, 4]. They give excellent solubility, higher degree of fixation, good lavelling and good to excellent fastness properties. Ayyangar et al [5, 6]
reported that bisazo dyes are tinctorially stronger than mono azo dyes. Patel et al [7-10] synthesized bis azo reactive dyes giving good fastness properties on various fibres.
The objectives of the current investigation were to
synthesize and evaluate tinctorially strong, bright reactive dyes which could be applied to cotton by exhaust dyeing method. To these effect ten hot brand bis azo reactive dyes (5a-j) were synthesized by coupling a series of diazotized bisazo methylene derivative with various m-toludino cyanurated coupling components. MATERIALS AND METHOD
All of the chemicals and various coupling components used were of commercial grade and were further purified by recrystallisation and redistilled before use. The solvents used were spectroscopic grade. Melting points were determined by open capillary method and are uncorrected. Purification of the dyes was carried out by TLC [11]. The visible absorption spectra were recorded on a Beckman DB-GT Grating
Spectrophotometer. The elemental analyses were carried out on a Carlo Erba Elemental Analyser 1108. Infrared spectra were recorded on a Perkin-Elmer model 881 spectrophotometer scanning between 4,000 to 400 cm-1 using KBr pellets. PMR spectra on a Brucker DRX-300 (300 MHz FTNMR) instrument using TMS as internal standard and DMSO as solvent. The light fastness was assessed in accordance with BS: 1006-1978 [12]. The rubbing fastness test was carried out with a Crockmeter (Atlas) in accordance with AATCC-1961 [13] and the wash fastness test in accordance with IS: 765-1979 [14]. Synthesis of 4, 4’-methylene-bis-(o-nitro aniline) (1) [15]
O-nitro aniline (13.9 g, 0.1 mole) was dissolved in water (125 ml) and 36.5% hydrochloric acid (25 ml) at 50 °C. The reaction mixture was then reacted with 3% aqueous formaldehyde (35ml) solution at 60 °C with stirring for an hour and neutralized with 10% sodium hydroxide, yellowish precipitate of compound (1) was filtered, washed with hot water, dried and recrystalized from acetic acid. Yield 85%, m.p. 190°C, IR (KBr): νmax (cm-1) 3515, 3425 (Asym. and sym., N-H stretching), 2945 (C-H stretching), 1185, 1040 (Asym. and sym., S=O stretching). 1522, 1342 (Asym. and sym., N=O stretching). Elemental analysis: Found C-54.10%; H-4.12%; N-19.35%; C13H12O4N4 (MF requires C-54.17%; H-4.20%; N-19.44%). 1H NMR (DMSO-d6) (chemical shift in δ ppm): 3.24 δ (4H, s, -NH2), 1.23 δ (2H, s, -CH2), 7.12 δ-7.93δ (6H, m, Ar-H). Tetrazotisation of 4, 4’-methylene bis-o-nitro aniline (2)
Compound (1) (1.44 g, 0.005 mole) was suspended in H2O (60 ml). Hydrochloric acid (0.36 g) was added dropwise to this well stirred suspension. The mixture was gradually heated up to 70°C, till clear solution obtained. The solution was cooled at 0-5°C in an ice bath. A solution of NaNO2 (0.6 g) in water (4 ml) previously cooled to 0°C, was then added over a period of five minutes with stirring. The stirring was continued for an hour, maintaining the same temperature, with positive test for nitrous acid on starch iodide paper. After just destroying excess of nitrous acid with required amount of a solution of sulphamic acid the clear tetrazo solution (2) at 0-5°C was obtained and used for subsequent coupling reaction.
PRAJÑĀ - Journal of Pure and Applied Sciences, Vol. 18: 63 – 67 (2010) ISSN 0975 - 2595
*corresponding author: [email protected]

64 PRAJÑĀ – Journal of Pure and Applied Sciences 18: 63 - 67 December
Preparation of m-toluidino cyanurated H-acid (4a) This involves two steps. (i) Preparation of cyanurated H-acid (3a)
Cyanuric chloride (1.85 g, 0.01 mole) was stirred in
acetone (25 ml) at a temperature below 5°C for a period of an hour. A neutral solution of H-acid (3.19 g, 0.01 mole) in aqueous sodium carbonate solution (10% w/v) was then added in small lots in about an hour. The pH was maintained neutral by simultaneous addition of sodium carbonate solution (1% w/v). The reaction mass was then stirred at 0-5°C for further 4 hours then clear solution was obtained. The cyanurated H-acid solution (3a) was used for subsequent coupling reaction.
(ii) Condensation with m-toluidine
The temperature of ice-cooled well stirred solution of
cyanurated H-acid (3a) (4.67 g, 0.01 mole) was gradually raised to 45°C for half an hour. To this cyanurated H-acid the m-toluidine (1.07 g, 0.01 mole) was added dropwise at same temperature, during a period of 30 minutes, maintaining the pH neutral by simultaneous addition of sodium bicarbonate solution (1%w/v). After the addition was completed, stirring was continued for further 3 hours. The m-nitro anilino cyanurated H-acid solution (4a) thus obtained was subsequently used for further coupling reaction.
Preparation of the dye 5a
To an ice cold and well stirred solution of (4a) (5.53 g, 0.01 mole) a freshly prepared solution of tetrazo solution (2) as previously prepared was added dropwise over a period of 10-15 minutes. The pH was maintained at 7.5 to 8.5 by simultaneous addition of sodium carbonate solution (10% w/v). During coupling the purple solution was formed. The stirring was continued for 3-4 hours, maintaining the temperature below 5°C. Sodium chloride (12g) was then added and the mixture was stirred for an hour. The solid violet dye (5a) separated out was filtered washed with minimum amount of acetone and dried at room temperature. Yield 82 %.
Following the above procedure other reactive dyes (5b-j)
were synthesized using various m-toluidino cyanurated coupling components such as J-acid (4b), N-methyl-J-acid (4c), N-phenyl-J-acid (4d), Bronner acid (4e), Gamma acid (4f), K-acid (4g), Tobias acid (4h), Peri acid (4i) and Laurent acid (4j) respectively.
All the synthesized dyes and characterization data were
recorded in Table - 1. RESULTS AND DISCUSSION Preparation of dyes
4, 4’-methylene-bis (o-nitro aniline) (1) was tetrazotised
satisfactorily at 0-5°C by sodium nitrite and HCl. In order to determine the end point of diazotization, it was essential to check the presence of unreacted diazo component on TLC by sampling the diazotization mixture. The diazonium salt solution was used immediately since this decomposed on standing, even when cold. Subsequent coupling reactions took place readily on adding the resulting diazonium salt continuously to the solution of coupling component. However 80-85% yield of the dye was usually obtained by careful addition of the diazonium salt solution at 0-5°C to a solution of the coupling component in sodium bicarbonate. The pH of the reaction mixture was
adjusted to approximately 7.5-8.5 by addition of 10% sodium carbonate solution slowly below 5°C. Dyeing of fibre
The dyeing of fibres was carried out according to literature
reported procedure [16]. These dyes gave pink, red, orange and yellow hues with brighter and deeper shades with high tinctorial strength and excellent levelness on the fabric. The variation in the hues of the dyed fabric results due to the alternation in the coupling components.
Physical properties of the dyes
The purity of all the dyes was checked by TLC using n-butyl acetate: methanol: water (7.5: 2.0: 0.5 v/v) as the solvent system. When absorbed on silica gel-G plates, the dyes produced orange-yellow colours. The Rf value of all the dyes are shown in Table 1.
Spectral properties of the dyes
Absorption maxima of dyes 5a-j are shown in Table - 4. As far as absorption maxima are concerned, λmax value is directly proportional to the electronic power of the substituents in the coupled ring system. The value of the logarithm of the molar extinction co-efficient (log ε) of the dyes (In both medium) were in the range of 4.12-4.65, consistent with their high intensity of absorption. The introduction of electron donating or electron attracting groups at suitable positions in the coupled ring affect the absorption characteristics of the dyes.
Compound 5b have λmax value 465 nm but 5c have λmax
482 nm due to the introduction of auxochrome like -CH3 group in 5c which increase the absorption maxima towards longer wavelength hence increase in the depth of shade. So there is a difference in λmax is about 17 nm between 5b and 5c. Compound 5d having λmax 495 nm, so there is a difference between 20 nm between the λmax value of 5d and 5b due to the introduction of phenyl ring which causes resonance effect for deepening of colour. Compound 5g have same structure as 5a but lower λmax then 5a because the vicinity of -NH- and -SO3Na group in 5g hence electron oscillation is fast in 5g as compared to 5a. Other compounds such as 5h, 5i and 5j have lower λmax than 5a and 5b due to the bathochromic effect of -OH group in 5a and 5b compounds which increase the wavelength and shift the absorption towards higher wavelength. IR and 1H NMR spectra of dyes
The IR spectra [17] of dyes (5a-j) in general show
characteristic broad band at 3400-3505 cm-1 indicating O-H and N-H stretching vibration of amino and hydroxyl group. The band at 2990-3015 cm-1 shows C-H stretching vibration of methyl group. The bands at 1540-1560 cm-1, 1365-1405 cm-1, 815-855 cm-1 are due to the C-N stretching vibration of cyanuric chloride molecule. Azo group is confirmed by the stretching vibration at 1590-1625 cm-1. The sulfone-sulfonate and chloro group is confirmed by stretching vibration at 1030-1160 cm-1 and 760-780 cm-1. The nitro group (both asym. and sym. stretching vibration) is confirmed at 1360-1520 cm-1(Table - 2). The 1H NMR spectra [18] of representative dye showed all the signals (Table - 3). Exhaustion and fixation study
The percentage dyebath exhaustion and fixation of the
dyed fabrics was determined according to the known method [8].

2010 Patel et al. – Synthesis, characterization and application 65
Table-1 Characterization table of dyes (5a-j)
% C % H % N Dye No. Various
m-Toluidino cyanurated coupling components (R)
Molecular Formula
Mol. Weight
gm/mole
Yield (%)
Found Req.
Found Req.
Found Req.
aRfValue
5a H-acid (4a) C53H34O18N16S4Cl2Na4 1474 82 43.11 43.18
2.25 2.32
15.11 15.20
0.42
5b J-acid (4b) C53H36O12N16S2Cl2Na4 1270 75 50.06 50.12
2.80 2.86
17.58 17.65
0.38
5c N-methyl J-acid (4c) C55H40O12N16S2Cl2Na2 1298 78 50.81 50.89
3.04 3.11
17.20 17.27
0.45
5d N-phenyl J-acid (4d) C65H44O12N16S2Cl2Na2 1422 80 54.83 54.90
3.03 3.12
15.71 15.76
0.36
5e Bronner acid (4e) C53H36O10N16S2Cl2Na2 1238 75 51.34 51.42
2.82 2.93
18.02 18.10
0.34
5f Gamma acid (4f) C53H36O12N16S2Cl2Na4 1270 85 50.02 50.12
2.78 2.86
17.58 17.65
0.38
5g K-acid (4g) C53H34O18N16S4Cl2Na4 1474 85 43.13 43.18
2.25 2.32
15.12 15.20
0.40
5h Tobias acid (4h) C53H38O4N16Cl2 1034 80 61.50 61.57
3.61 3.70
21.60 21.68
0.42
5i Peri acid (4i) C53H36O10N16S2Cl2Na2 1238 78 51.33 51.42
2.85 2.93
18.02 18.10
0.40
5j Laurant acid (4j) C53H36O10N16S2Cl2Na2 1238 75 51.35 51.42
2.83 2.93
18.03 18.10
0.38
aDetermined by TLC using n-butyl acetate:methanol:water (7.5: 2.0: 0.5 v/v) solvent system on Silica gel-G F254 TLC plate. Table-2 IR spectra of dyes (5a-j) Dye No. IR (KBr): νmax (cm-1)
5a 3400-3505 (O-H & N-H), 3015 (C-H), 1555, 1385, 845 (C-N), 1605 (N=N), 1160, 1030 (S=O, asym. & sym.), 1525, 1360 (N=O, asym.
& sym.), 775 (C-Cl).
5b 3420-3505 (O-H & N-H), 2995 (C-H), 1540, 1405, 840 (C-N), 1605 (N=N), 1165, 1045 (S=O, asym. & sym.), 1525, 1345 (N=O, asym.
& sym.), 770(C-Cl).
5c 3410-3490 (O-H & N-H), 3005 (C-H), 1550, 1380, 825 (C-N), 1615 (N=N), 1155, 1050 (S=O, asym. & sym.), 1525, 1340 (N=O, asym.
& sym.), 760 (C-Cl).
5d 3415-3500 (O-H & N-H), 2990 (C-H), 1545, 1385, 855 (C-N), 1595 (N=N), 1170, 1045 (S=O, asym. & sym.), 1540, 1355 (N=O, asym.
& sym.), 765 (C-Cl).
5e 3410-3490 (O-H & N-H), 3025 (C-H), 1540, 1375, 835 (C-N), 1600 (N=N), 1150, 1015 (S=O, asym. & sym.), 1515, 1340 (N=O, asym.
& sym.), 775 (C-Cl).
5f 3405-3510(O-H & N-H), 3005 (C-H), 1550, 1375, 840 (C-N), 1590 (N=N), 1190, 1045 (S=O, asym. & sym.), 1540, 1355 (N=O, asym.
& sym.), 760 (C-Cl).
5g 3405-3495 (O-H & N-H), 2995 (C-H), 1560, 1385, 845 (C-N), 1605 (N=N), 1182, 1035 (S=O, asym. & sym.), 1535, 1350 (N=O, asym.
& sym.), 770 (C-Cl).
5h 3415-3505 (O-H & N-H), 3010 (C-H), 1542, 1380, 835 (C-N), 1615 (N=N), 1175, 1045 (S=O, asym. & sym.), 1530, 1342 (N=O, asym.
& sym.), 772 (C-Cl).
5i 3425-3490 (O-H & N-H), 2990 (C-H), 1530, 1365, 830 (C-N), 1600 (N=N), 1170, 1062 (S=O, asym. & sym.), 1520, 1348 (N=O, asym.
& sym.), 765 (C-Cl).
5j 3405-3495 (O-H & N-H), 2995 (C-H), 1540, 1385, 815 (C-N), 1595 (N=N), 1155, 1024 (S=O, asym. & sym.), 1522, 1342 (N=O, asym.
& sym.), 780 (C-Cl).

66 PRAJÑĀ – Journal of Pure and Applied Sciences 18: 63 - 67 December
Table - 3 1H NMR spectra of dyes (5a-j)
Dye No. 1H NMR (DMSO-d6) (chemical shift in δ ppm)
5a 2.32 (2H, s, -CH2), 1.25 (6H, s, -CH3), 3.60 (2H, s, -OH), 4.75 (4H, s, -NH), 7.05-8.12 (20H, m, Ar-H).
5b 2.25 (2H, s, -CH2), 1.32 (6H, s, -CH3), 3.58 (2H, s, -OH), 4.82 (4H, s, -NH), 6.95-8.05 (22H, m, Ar-H).
5c 2.40 (2H, s, -CH2), 1.20 (6H, s, -CH3), 3.62 (2H, s, -OH), 4.65 (2H, s, -NH), 2.58 (6H, s, N-CH3), 6.98-8.22 (22H, m, Ar-H).
5d 2.15 (2H, s, -CH2), 1.18 (6H, s, -CH3), 3.68 (2H, s, -OH), 4.80 (2H, s, -NH), 6.90-8.15 (32H, m, Ar-H).
5e 2.30 (2H, s, -CH2), 1.28 (6H, s, -CH3), 4.68 (4H, s, -NH), 6.95-8.05 (24H, m, Ar-H).
5f 2.35 (2H, s, -CH2), 1.32 (6H, s, -CH3), 3.62 (2H, s, -OH), 4.85 (4H, s, -NH), 6.92-8.10 (22H, m, Ar-H).
5g 2.28 (2H, s, -CH2), 1.20 (6H, s, -CH3), 3.52 (2H, s, -OH), 4.72 (4H, s, -NH), 7.05-8.10 (20H, m, Ar-H).
5h 2.42 (2H, s, -CH2), 1.35 (6H, s, -CH3), 4.75 (4H, s, -NH), 7.10-8.15 (26H, m, Ar-H).
5i 2.32 (2H, s, -CH2), 1.25 (6H, s, -CH3), 4.70 (4H, s, -NH), 6.95-8.10 (24H, m, Ar-H).
5j 2.38 (2H, s, -CH2), 1.22 (6H, s, -CH3), 4.62 (4H, s, -NH), 7.08-8.16 (20H, m, Ar-H).
Abbreviations: s, singlet; d, doublet; t, triplet; m, multiplet. Table - 4 Exhaustion and fixation data of dyes (5a-j)
(%)Exhaustion (%) Fixation Dye No.
Shade on dyed fibre
λmax nm
(water)
λmax nm (H2SO4)
Log ε
(Water)
S W C S W C
5a Purple 530 512 4.65 69.55 66.37 69.62 89.14 90.39 87.38 5b Yellow 465 442 4.32 67.95 70.90 73.02 90.50 93.08 87.64 5c Light orange 482 475 4.38 72.40 67.22 70.57 91.30 91.48 86.43 5d Red 495 480 4.12 75.65 66.72 64.28 87.40 88.42 87.44 5e Yellow 450 422 4.22 69.95 64.55 68.22 89.90 85.97 86.62 5f Dark Yellow 460 462 4.18 78.05 70.80 65.02 86.16 88.00 90.73 5g Light Purple 510 505 4.55 72.10 67.55 68.07 85.14 91.78 88.87 5h Yellow 435 405 4.60 69.00 71.20 66.62 88.41 89.60 83.16 5i Light Yellow 430 415 4.35 74.05 65.10 72.00 87.40 84.48 86.48 5j Yellow 442 425 4.32 67.65 64.12 67.90 93.00 88.88 89.83
Abbreviations: S-Silk, W-Wool, C-Cotton Table - 5 Fastness properties of dyes (5a-j).
Light fastness Wash fastness Rubbing fastness
Dry Wet
Dye No.
S W C S W C S W C S W C
5a 6 3-4 5 5 4 3-4 4 4 4-5 5 5 3-4 5b 4-5 5 3-4 3 4-5 3 5 3 3 3-4 3-4 4 5c 5 5-6 6 4 3 4-5 3 3-4 3 4 4 4-5 5d 4 6 4 3-4 4 5 4-5 5 3 3 3-4 5 5e 4-5 4 3 4 3-4 4 3 4-5 3-4 3-4 4 3 5f 3 3-4 5 3-4 5 4 4 5 3 4-5 4-5 4 5g 3 6 5 4-5 3 3-4 5 4 4-5 4 4 4-5 5h 5-6 3 4-5 4 4-5 5 5 4-5 5 5 5 3 5i 4 5-6 3 5 4-5 4 3-4 3 3 4-5 4-5 4-5 5j 5-6 5 4-5 3 4 4 3-4 4 4-5 3 5 5
Abbreviations: S-Silk, W-Wool, C-Cotton Light fastness: 1-poor, 2-slight, 3-moderate, 4-fair, 5-good, 6-very good. Wash & Rubbing fastness: 1-poor, 2-fair, 3-good, 4-very good, 5-excellent.

2010 Patel et al. – Synthesis, characterization and application 67
The percentage exhaustion of 2% dyeing on silk fabric ranges from 67-78% for wool fabric ranges from 64-72% and for cotton fabric ranges from 64-73 % and the percentage fixation of 2% dyeing on silk fabric ranges from 85-93%, for wool fabric ranges from 84-93% and for cotton fabric ranges from 83-90 % (Table - 4).
From the data summarized in Table - 4 showed that dye 5f
exhibit maximum exhaustion on silk fibre, dye 5h exhibit maximum exhaustion on wool fibre and dye 5b exhibit maximum exhaustion on cotton fibre. While for fixation dye 5j exhibit maximum fixation for silk fibre, 5b exhibit maximum fixation for wool fibre and 5f exhibit maximum fixation for cotton fibre.
Fastness properties
The light fastness of all the dyes rating 3-6 for silk, wool and cotton fabrics, which shows light fastness moderate to very good for silk, wool and cotton. The wash fastness and rubbing fastness of all the dyes rating 3-5 for silk, wool and cotton fabrics, shows wash fastness and rubbing (dry and wet) fastness of all the dyes good to excellent (Table - 5). CONCLUSION
A series of hot brand bisazo reactive dyes based on 4, 4’-
methylene-bis (o-nitro aniline) have been synthesized by conventional method. The main advantage of bisazo dyes is that they contain two reactive groups, if one is hydrolyzed then other is still left for fixation and also it is used as a substitute against benzidine dyes having carcinogenic properties. These dyes give mostly purple, red, orange and yellow colour shades on different fabrics having good fastness properties. The remarkable degree of levelness after washing indicates the good penetration and affinity of these dyes to the fabrics. Exhaustion and fixation of these dyes are very good and indicate that the dyes have good affinity and solubility with the fabrics.
Acknowledgement
Authors are thankful to The Head, Department of Chemistry, Veer Narmad South Gujarat University, Surat for providing research facilities; SAIF, Chandigarh for providing spectral and analytical data and Atul Ltd, Valsad for providing chemicals, dyeing facility and fastness tests. REFERENCES
[1] Zollinger, H. (1991) Color Chemistry, 2nd Edition, VCH, Weinheim.
[2] Shah, K. M. (1994) Hand Book of Synthetic Dyes and Pigments, Vol-I, Multi-Tech. Publishing Co., Mumbai.
[3] Bredereck, K. and Schumacher, C. (1993) Structure reactivity correlations of azo reactive dyes based on h-acid: i. nmr chemical shift values, pka values, dyestuff aggregation and dyeing behaviour. Dyes and Pigments, 21: 23-43.
[4] Mokhtari, J., Phillips, D. A. S. and Taylor, J. A. (2005) Synthesis and evaluation of a series of trisazo hetero bi-functional reactive dyes for cotton. Dyes and Pigments, 64(2): 163-170.
[5] Ayyangar, N. R., Jadhav, G. S., Joshi, S. V. and Srinivasan, K. V. (1987) The Use of ortho- cumidine as a dyestuff intermediate: Part 1: Monoazo and disazo solvent dyes. Dyes and Pigments, 8(4): 301-313.
[6] Ayyangar, N. R., Lahoti, R. J., Srinivasan, K. V., Daniel, T. and Venkataramaih, H. K. (1991) Phenyl 3-aminobenzenesulphonates: New intermediates for arylazopyridone disperse dyes. Dyes and Pigments, 17(4): 279-286.
[7] Patel, P. C., Rana, U. N., Patel, K. C. and Patel, S. K. (2002) Water soluble fluorine containing reactive dyes: Their synthesis and application on various fibres. Asian Journal of Chemistry, 14(1): 265-271.
[8] Patel, R. S. and Patel, K. C. (2005) Studies on synthesis of some hot brand reactive dyes and their application on silk, wool and cotton. Colourage, 52(5): 45-50.
[9] Patel, A. L., Patel, N. B., Patel, B. M. and Patel, K. C. (2007) Synthesis, characterization and application of hot brand reactive dyes on various fibres. Asian Journal of Chemistry, 19(1): 67-72.
[10] Patel, D. R., Patel, J. A. and Patel, K. C. (2009) Synthesis and evaluation of a series of symmetrical hot brand bis azo reactive dyes using 4,4’-methylene-bis-metanilic acid on various fibre. Journal of Saudi Chemical Society 13: 279-285.
[11] Fried, B. and Sharma, J. (1982) Thin Layer Chromatography: Technique and Application, Marcel Dekker, New York-Basel.
[12] Standard test method BS 1006 UK (1978): ISO 105 India (1994).
[13] AATCC Test Method (1961) 8. [14] Indian Standard ISO 765 (1979). [15] Nafziger, J. L. (1985) Process for preparing polyamines
with ion exchange resin catalysts, USP 4554378. [16] Shenai, V. A. (1973) Chemistry of Dyes and Principles of
Dyeing, Sevak Publication, Mumbai. [17] Colthup, N. B., Daly, L. H., and Wiberley, S. E. (1991)
Introduction to Infrared and Raman Spectroscopy, 3rd ed., Academic Press, New York.
[18] Bassler, G. C., Silverstein, R. M. and Morrill, T. C. (1991) Spectrophotometric Identification of Organic Compounds, 5th Ed. Wiley, New York.

SYNTHESIS & CHARACTERIZATION OF Cu(II) COMPLEXES DERIVED FROM ACYL PYRAZOLONE & 2-AMINO PHENOL
N. P. Moorjani, K . M. Vyas and R. N. Jadeja*
Department of Chemistry, Faculty of Science, The Maharaja Sayajirao University of Baroda,
Vadodara-390 002, Gujarat, India
ABSTRACT
A series of tridentate pyrazolone-based Schiff bases were synthesized by the interaction of 4-acyl/aroyl pyrazolones with 2-Amino Phenol in an ethanolic medium. All of these ligands were characterized on the basis of elemental analysis, infrared (IR) and 1H-NMR data. Nuclear magnetic resonance (NMR) suggests the amine-one form of ligand in solution at room temperature. Copper Schiff-base complexes [Cu2(L)2], have been prepared by the interaction of the aqueous solution of copper acetate monohydrate with hot ethanolic solution of the appropriate ligand. The resulting complexes have been characterized by elemental analysis, metal content determination, molar conductance, fast atom bombardment mass spectra, magnetic measurements, thermogravimetric analysis (TGA), IR and electronic spectral studies. Suitable square planar structure is proposed for these complexes. Key words: Acyl pyrazolones, Copper complexes, Schiff bases, Spectral studies
INTRODUCTION The chemistry of pyrazolone derivatives has attracted
much attention because of their interesting structural properties and applications in diverse areas [1-4]. They are useful reagents for the extraction and separation of various metal ions [5, 6]. They can also be used in laser materials, as 1H NMR shift reagents, in chromatographic study and in the petrochemical industry [7, 8]. Many of these ligands exhibit keto enol tautomerism and because of this they show interesting structural and spectroscopic properties which have been the subject matter of many reports [9]. β-diketones have played and continue to play a key role in coordination compounds that have found wide application in several fields, from new materials to catalysts [10], as precursors for CVD in the microelectronic industry and as potential antitumourals [11]. Even the simplest pyrazolone-5 derivatives for instance, antipyrine and amidopyrine are well-known analgesics and widely used in medicine. Pyrazolone derivatives are also used as starting materials for the synthesis of biologically active compounds and for the construction of condensed heterocyclic systems [12]. Among these ligands, acyl pyrazolones have been studied extensively owing to their effective properties with respect to extracting metal ions [13]. On the other hand pyrazolone-based Schiff base chemistry is less extensive.
Pyrazolyl and pyrazolyl-derived ligands can form relevant coordination compounds with different metal ions. Copper complexes have been extensively studied, especially dinuclear and polynuclear species, as mimics of the proteins hemocyanin and tyrosinase or as compounds with interesting catalytic and magnetic properties [14]. In most of these complexes, copper ions are linked by N, N’-bridging pyrazolato anions, or coordinated by one nitrogen atom of the pyrazole ring. However, recently an unusual coordination mode of this type of ligand was described, where nitrogen atoms of the pyrazole rings are not bound to copper, but involved in strong intramolecular hydrogen bonds.
Recently, some Schiff bases from 3-methyl-1-(4’-
methylphenyl)-2-pyrazoline-5-one and aromatic amines were
prepared and their molecular structures were determined. These ligands can exist in three tautomeric forms: keto-imine, imine-ol and keto-amine, although the ketoamine form is predominant in the solid state. Their corresponding mononuclear copper(II) complexes were also prepared and characterized by spectroscopic techniques, indicating a tetragonal geometry around the copper(II) ion, N,O coordinated [15].
We were interested to synthesis a new series of
pyrazolone-based Schiff base ligands, which can form stable neutral complexes with Cu(II) metal ions and may find some application in solvent extraction chemistry. With this view we have synthesized a series of ligands by condensation of acyl pyrazolones with 2-amino phenol. The reaction of these ligands in alcoholic medium with copper acetate resulted the novel square planar complexes, which were then characterized by various spectral techniques. MATERIALS AND METHODS
All the chemicals used in the present study were of best quality. Dioxane was obtained from Sisco Chem. Pvt Ltd, Mumbai and used after purification. Calcium hydroxide and acetyl chlorides were supplied by Suvidhinath Labs, Baroda. 2-aminophenol was obtained from LOBA Chem. Pvt. Ltd., Mumbai. Ethanol was obtained from Baroda Chemicals Industry Ltd., Baroda and Benzoyl chloride was obtained from Gayatri Minaral and Chemicals, Baroda. In preparation of metal complexes of Cu(II), copper acetate was used.
Physical measurements
Elemental analyses (C, H, and N) were performed on a model 2400 Perkin-Elmer elemental analyzer. Infrared (IR) spectra were recorded on a Perkin Elmer FT-IR spectrum RX 1 spectrometer as KBr pellets. NMR was recorded on a model 400 Bruker FT NMR. The electronic spectra were recorded on a model Perkin Elmer Lambda 35 UV-VIS spectrometer. A simultaneous TG/DTA was recorded on EXSTAR6000 TG/DTA6300 model. A FAB mass spectrum was recorded on a Jeol SX 102/Da-600 mass spectrometer at room temperature using m-nitro benzyl alcohol as a matrix and Argon/Xenon as the FAB gas. Specific conductivity of the complexes was
PRAJÑĀ - Journal of Pure and Applied Sciences, Vol. 18: 68 - 72 (2010) ISSN 0975 - 2595
*Corresponding author: [email protected]

2010 Moorjani et al. – Synthesis and characterization 69
measured on a model Elico CM 180 conductivity meter. Magnetic moments were measured on Gouy balance. Synthesis of ligands The ligands used in the present study were prepared in two steps as follows: 1. Preparation of the 4-acetyl/benzoyl-2-pyrazolin-5-ones 2. Preparation of Schiff-bases Preparation of the 4-acetyl/benzoyl-2-pyrazoline-5-ones Preparation of 4-acetyle-3-methyl-1-phenyl-2-pyrazoline-5-one
3-Methyl-1-phenyl-2-pyrazoline-5-one (17.4g, 0.1mol) was dissolved in hot dioxane (80cm3) in a flask equipped with a stirrer, separating funnel and reflux condenser. Calcium hydroxide (14.81g, 0.2mol) was added to this solution, followed by acetyl chloride (10ml) added drop wise with precaution, as this reaction was exothermic. During this addition the whole mass was converted into a thick paste. After the complete addition, the reaction mixture was refluxed for two hour and then it was poured into cold dilute hydrochloric acid (200cm3, 2M). The coloured crystals thus obtained were separated by filtration, washed with water and dried. Yield 60%, M.P.630C. Preparation of 4- acetyle-3-methyl-1-(3’-chloro phenyl)-2-pyrazoline-5-one
It was prepared analogously from 3-methyl-1-(3-chloro phenyl)-2-pyrazoline-5-one (20.85 g, 0.1 mol).Yellow crystals were obtained. Yield 89%, M.P. 720C. Preparation of 4- acetyle-3-methyl-1-(4’-methyl phenyl ) -2-pyrazoline -5-one
It was prepared analogously from 3-methyl-1-(4’-methylphenyl)-2-pyrazoline-5-one (20.1g, 0.1mol). Yellow crystals were obtained. Yield 74.75%, M.P.910C. Preparation of 4-benzoyl-3-methyl-1-(4’-methylphenyl)-2-pyrazoline-5-one
It was prepared analogously from 3-methyl-1-(4’-methyl phenyl)-2-pyrazoline-5-one (20.1g, 0.1mol) and instead of acetyl chloride, benzoyl chloride (10ml) was taken. Yellow crystals were obtained. Yield 88%, M.P. 1060C. Preparation of 4-benzoyl-3-methyl-1-phenyl-2-pyrazoline-5-one
It was prepared analogously from 3-methyl-1-phenyl-2-pyrazoline-5-one (17.4g, 0.1mol) and instead of acetyl chloride, benzoyl chloride (10ml) was taken. Yellow crystals were obtained. Yield 86%, M.P. 930C.
These can be summarized in a following reaction scheme:
N
N
CH3
O+ Ca(OH)2 + CH3COCl/C6H5COCl
DioxaneReflux
Ca-complex
2M HCl
N
N
CH3
O
C
O
CH3/C6H5CH3/H
Cl/H
CH3/H
Cl/H
Preparation of Schiff bases
An identical procedure has been adopted in the preparation of all the Schiff bases used in the present study. The Schiff bases were prepared by refluxing 5-ones and 2-aminophenol in ethanol for two hours. The Schiff bases thus obtained were filtered and dried. The physical properties of ligands are given in the Table-1.
The reaction can be summarized in following scheme:
N
N
CH3
O
C
O
CH3/C6H5
+Ethanol
Reflux N
N
CH3
O
C
C6H5/H3C
NH2N
HO
OH
CH3/H
Cl/H
CH3/H
Cl/H
Synthesis of complexes
The appropriate ligand, dissolved in hot ethanol was added drop wise into an aqueous solution of copper acetate monohydrate with stirring. Ligand:Metal ratio was 1:1. After the complete addition, the reaction mixture was refluxed for two hour. Then cool it to room temperature. During this period, a light greenish microcrystalline solid was separated, which was isolated by filtration, washed with hot water with several times till colourless filtrate comes followed by one little wash of ethanol and dried. This can be summarized in following reaction:
N
N
CH3
O
C
C6H5/H3C
N
Ethanol,RefluxCu-complex
OH
Copper acetate
Cl/H
CH3/H RESULTS AND DISCUSSION
Characterization of ligands
Analytical data Analytical data of ligands are listed in Table - 1. All the
ligands gave satisfactory elemental analysis, which are in close agreement with the empirical formula of the respective ligand.
Table - 1 Analytical data of ligands No. Ligands M.P.(0C) %C %H %N Yield(%) 1. AP-
AP 224 70.28
(70.34) 5.54
(5.57) 13.63
(13.67) 75.86
2. AMC-AP
195 62.02 (63.24)
4.57 (4.72)
12.13 (12.29)
82.22
3. APT-AP
189 70.01 (71.01)
5.75 (5.95)
13.00 (13.07)
63.78
4. BPT-AP
233 73.45 (75.18)
5.28 (5.52)
10.48 (10.96)
74.42
5. BP-AP
280 74.11 (74.78)
4.96 (5.18)
11.38 (11.37)
56.99

70 PRAJÑĀ – Journal of Pure and Applied Sciences 18: 68 - 72 December
Infrared spectra All Ligands show sharp band at ~1600 cm-1. This band is
due to υ(C=O) coordinated + υ(C=O). There is some contribution from aromatic vibrations and also azomethine υ(C=N) at ~1620 cm-1. The ligands also show band at ~3000 cm-1 which may be due to υ(O-H). The IR data of ligands are presented in Table - 2. Table - 2 Relavant IR frequencies (cm-1) for the ligands
No. Ligands υOHυC=O(coord.)+υC=O
υC=N (cyclic)
1. AP-AP 3060 1621 1581 2. AMC-AP 3060 1625 1580 3. APT-AP 3028 1611 1583 4. BPT-AP 3164 1618 1588 5. BP-AP 3232 1614 1585
The 1H NMR spectra
1 Proton numbering scheme for H NMR
The important NMR data of the ligands are listed in Table
3 and Table 4.The 1H NMR spectra of these three ligands were recorded in CDCl3 at room temperature. The signals are due to methyl a proton (two CH3 for AMC-AP and three CH3 for APT-AP, BPT-AP) appears as singlet. The singlet corresponds to highest δ value 2.343ppm is assigned to the toluoyl protons while the other singlet in the region δ1.522-2.327ppm is due to other methyl groups. In the aromatic region, a few doublets and in a few cases some overlapping doublets/multiplets are observed. The appearance of multiplet is mainly because of the different substituent at meta and para positions of the one of the two benzene rings [15]. Here, Hh proton appears at highest δ value in case of BPT-AP while in other two cases He proton resonates at highest δ value. The all signals due to aromatic protons of ligands are assigned and are depicted in Table 4. Another singlet in much low field region corresponding to one proton for all compounds is observed in the range of δ 12.368-12.716ppm. This signal disappeared when a D2O exchange experiment was carried out. It can be assigned either to OH or NH, in either case it is strongly deshielded because of hydrogen bonding with other atom (N/O). It may be noted that the integration of this signal perfectly matches with one proton and there is no other fragment(s) of this signal, which suggests that only one tautomeric form of the ligands exits in solution under the experimental conditions. We have not done any temperature dependent experiments comparing with the solid state study. We prefer to assign this signal to NH; however, assignment of this peak to OH cannot be ruled out provided solid state structural evidence is not considered [15].
Table - 3 1H NMR spectral data for the aliphatic protons
No. Ligands Methyl protons (δ ppm)
Aryl protons (δ ppm)
-OH/-NH (δ
ppm)
1. AMC-AP
2.327 singlet
3H
2.098 singlet
3H
[6.907-8.058]
multiplet 8H
12.368 single
1H
2. APT-AP
2.382 singlet
3H
2.343 Singlet
3H
2.186 singlet
3H
[6.914-7.843]
multiplet 8H
12.513 singlet
1H
3. BPT-AP
2.335 singlet
3H
1.522 singlet
3H
[6.223-7.917]
multiplet 13H
12.716 singlet
1H
Table - 4 1H NMR spectral data for the aromatic protons Ligands Ha Hb
Hd Hc He Hf Hg Hh Hi Hj
AMC-AP
6.928 d
J=7.5
7.020 t
J=6.5
7.110 d
J=7.5
8.058 s
7.925 d
J=7.5
7.687 s _ _ _
APT-AP
7.058 d
J=7.5
6.941 M
7.203 m
7.835 d
J=8
7.203 m _ _ _
BPT- AP
6.223 s
6.395 d
J=8.5
6.686 s
7.357 s
7.188 d
J=7.5
7.766 d
J=7.5
7.587 m
7.1 s
Characterization of complexes Analytical data Table - 5 Analytical data and physical properties of complexes No. Complexes Colour Yield
(%) M.P. (°C)
Cu Estimation (%)
ΛMb
(Ω-1 cm2
mol-1)
µeff (BM)
1. [Cu2(AP-AP)2]
Majestic Mountain
67.67 >260 15.35 (15.99)
16.0 1.3
2. [Cu2(AMC-AP)2]
Autumn Gold
75.63 >260 14.99 (15.04)
3.0
1.3
3. [Cu2(APT-AP)2]
Green Gold
57.68 >260 14.56 (15.81)
2.0 1.4
4. [Cu2(BPT-AP)2]
Ming Jade
74.52 >260 11.04 (13.69)
2.0 1.3
5. [Cu2(BP-AP)2]
Green
59.33 >260 12.84 (14.12)
1.0 1.4
The conductance of complexes in DMF show values from
1 to 16 Ω-1cm2 mol-1 indicating non-electrolytic nature of complexes [16]. Infrared spectra The important IR frequencies of the complexes are summarized in table 6. The strong band at 1610-1625 cm-1, for υ(C=N) azomethine of the ligand is shifted to lower frequency 1583-1591 cm-1, suggesting coordination of the azomethine nitrogen to the metal ion. The new band appeared in the spectra of complexes in the range 562-573 cm-1 is probably due to the formation of M-N bond. The presence of coordinating water molecule was also supported by thermo gravimetric study.

2010 Moorjani et al. – Synthesis and characterization 71
Table - 6 Relevant IR frequencies (cm-1) for the complexes
Complexes υC=N(coord.)+ υC=O υC=N
(cyclic)
υM-N
[Cu2(AP-AP)2] 1591(s,s) 1566(s,s) 568(s,s)
[Cu2(AMC-
AP)2]
1589(s,s) 1564(s,s) 567(s,s)
[Cu2(APT-AP)2] 1591(s,s) 1565(s,s) 562(s,s)
[Cu2(BPT-AP)2] 1588(s,s) 1556(s,s) 565(s,s)
[Cu2(BP-AP)2] 1583(s,s) 1560(s,s) 573(s,s)
Abbreviations: br = broad, s = strong, m = medium Magnetic Measurement
The complexes of Cu(II) exhibit subnormal magnetic measurement and it can be attributed to the magnetic interaction between the metals present in a dimeric structure [17]. Magnetic measurements are shown in Table 5. Thermal analysis
The TG-DTA-DTG curve of one of the complexes is shown in Fig. 1. The TG curve follows the decrease in sample mass with increase in temperature. In the present investigation, heating rates were suitably controlled at 10°Cmin-1 and mass loss followed up to 50-600°C. From the TG curve the mass loss for the complex was calculated. The mass loss occurred at 290°C corresponds to the loss of 3.7% (calc. 3.2%) for two methyl groups. This process is accompanied by exothermic process at 326°C in the DTA curve of the complex. The mass loss occurred at 519°C corresponds to the loss of 84.5% (calc. 84.1%) for two ligand molecules. This process is accompanied by small exothermic process at 500°C in the DTA curve of the complex.
Fig.1 The TG curve of the complex Cu(AMC-AP)2 Electronic spectral studies
The electronic spectra of all the complexes were recorded in DMF and the data are presented in Table 7. For square planer copper (II) complexes, the expected transitions are 2B1g →2A1g and 2B1g→2Eg with the respective absorption at 505-520 and 665-650 nm. In general, due to J-T distortions, square planar Cu(II) complexes give a broad absorption band between 600-700 nm and the peak at 505-520 nm merges with the broad band [18]. The Λmax value of 602 nm for the present Cu(II) complex indicates square planar geometry.
Table - 7 Electronic spectral data of complexes
Complexes d-d
maxima (nm)
d-d maxima (cm-1)
ε (molar
absorptivity) [Cu2(AP-AP)2] 519 19268 30
[Cu2(AMC-AP)2] 520 18519 32 [Cu2(APT-AP)2] 515 19417 52 [Cu2(BPT-AP)2] 665 15038 37 [Cu2(BP-AP)2] 505 19802 27
Mass Spectra
The FAB Mass spectrum of the complex [Cu2(AMC-AP)2] was recorded in m-nitro benzyl alcohol as a matrix. The isotropic peak can be observed at m/z =807, which is corresponding to the complex. The FAB mass spectrum of the complex [Cu2(AMC-AP)2] is shown in Fig. 2 and the fragmentation pattern for complex [Cu2(AMC-AP)2] is shown below:
Fig.2 The FAB-Mass spectra of the complex Cu2(AMC-AP)
NN
CH3
O
C
H3C
NO
Cu CuN
N
CH3
O
C
CH3
NO
(-2CH3,
Cl
Cl
(-2Cl(-C6H5
-C6H5Cl
NNH
CH3
O
C
H3C
NO
Cu
NN
CH3
O
C
H3C
NO
Cu
Cl
NNH
O
HC
NO
Cu-CH3
-Cu(C7H4NO)
NNH
OH
m/z=94(93.94)
m/z=807(808.64)
m/z= 403(403.54)
-112.55
m/z=291(290.99)
-15.03
m/z= 276(275.96)
-182.02
-77.10)-70.90)-30.06)
NN
O
C
H3C
NO
Cu Cu
N
HN
O
C
CH3
NO
m/z=631(630.58)-Cu(C18H15N3O2)
-404(403.54)
Fragmentation pattern for complex [Cu2(AMC-AP)2] CONCLUSION
IR data suggests the O, N, O coordination nature of the ligands. In the NMR spectra of ligands, the integral intensities of each signal are found to agree with the number of different types of protons present. The observed molar conductances in DMF solution of these complexes are consistent with non-electrolytic nature of the complexes. The elemental analysis of ligands as well as of complexes supports the proposed structure which is depicted below.

72 PRAJÑĀ – Journal of Pure and Applied Sciences 18: 68 - 72 December
NN
CH3
O
C
C6H5/H3C
NO
Cu Cu
NN
CH3
O
C
CH3/C6H5
NO
Cl/H
Cl/H
CH3/H
CH3/H
Common suggested structure for the Copper(II) complexes
REFERENCES [1] Mehrotra, R. C., Bohra, R. and Gaur, D. P. (1978)
Synthetic, chemical spectroscopic (infrared and electronic) and magnetic studies on dizirconiumenneaisopropoxide complexes of iron(II) , Metal β-diketonates and Allied Derivatives. Academic Press, New York.
[2] Elmorsi, M. A. and Hassanein, A. M. (1999) Corrosion inhibition of copper by heterocyclic compounds. Corros. Sci. 41: 2337-2352.
[3] Yang, L., Jin, W. and Lin, J. (2000) Synthesis, crystal structure and magnetic properties of novel dinuclear complexes of manganese, cobalt and nickel with 4-acetylbispyrazolone. Polyhedron 19: 93-98(6).
[4] Peng, B., Liu, G., Liu, L., Jia, D. and Yu, K. (2004) Crystal structure and spectroscopic study on photochromism of 1-phenyl-3-methyl-4-benzal-5-pyrazolone 4-ethylthiosemicarbazone. J. Mol. Struc. 692: 217-222.
[5] Tong, A., Akama, Y. and Tanaka, S. J. (1989) Reversed-phase high-performance liquid chromatography of aluminium(III) and indium(III) with 1-phenyl-3-methyl-4-benzoyl-5-pyrazolone. J. Chromatogr. 478: 408.
[6] Akama, Y., Tang, A., Ishima, S. and Kaijitani, M. (1992) Determination of Indium in Metallic Zinc by Flame Atomic Absorption Spectrometry after Extraction with 1-Phenyl-3-methyl-4-benzoyl-5-pyrazolone. Anal. Sci. 8: 41.
[7] Samelson, H. and Lempicki, A. (1963) Fluorescence and Lifetimes of Eu Chelates. J. Chem. Phys. 39: 110-112.
[8] Charles, R. G. and Riedel, E. P. (1966) Properties of some europium laser chelates derived from benzoyltrifluoroacetone. J. Inorg. Nucl. Chem. 28: 3005.
[9] Akama, Y., Tong. A., Matsumoto, N., Ikeda, T. and Tanaka, S. (1996) Raman spectroscopic study on keto-enol tautomers of 1-phenyl-3-methyl-4-benzoyl-5-pyrazolone. Vib. Spectrosc. 13: 113.
[10] (a) Dobrzynski, P., Kasperczylk, J. and Bero, M. (1999) Application of Calcium Acetylacetonate to the Polymerization of Glycolide and Copolymerization of Glycolide with ε-Caprolactone and L-Lactide. Macromolecules 32: 4735; (b) Bero, M., Kasperczylk, J. and Dobrzynski, P. (1999) Polym. Bull. 42: 131.
[11] Keppler, B. K., Friesen, C., Vongerichten, H., Vogel, E., in: B.K. Keppler (Ed.), Metal Complexes in Cancer Chemotherapy, VCH, Weinheim, 1993 pp. 297–323.
[12] Gelin, S., Chantegrel, B. and Nadi, A. I. (1983) Synthesis of 4-(acylacetyl)-1-phenyl-2-pyrazolin-5-ones from 3-acyl-2H-pyran-2,4(3H)-diones. Their synthetic applications to functionalized 4-oxopyrano[2,3-c]pyrazole derivatives. J. Org. Chem. 48: 4078.
[13] Yand, L., Jin, W. and Lin, J (2000) Synthesis, crystal structure and magnetic properties of novel dinuclear complexes of manganese, cobalt and nickel with 4-acetylbispyrazolone. Polyhedron 19: 93.
[14] (a) Sharma, S., Barooah, N. and Baruah, J. B. (2005) Tris(3,5-dimethylpyrazole)copper(II) nitrate: as an oxidation catalyst. J. Mol. Catal. A: Chem. 229: 171. (b) Schuitema, A. M., Aubel, P.G., Koval, I.A., Engelen, M., Driessen, W. L., Reedijk, J., Lutz, M. and Spek, A. L. (2003) Dinuclear copper(II) complexes of four new pyrazole-containing macrocyclic ligands are active catalysts in the oxidative coupling of 2,6-dimethylphenol. Inorg. Chim. Acta, 355: 374.
[15] Jadeja, R. N., Shah, J. R., Suresh, E. and Paul, P. (2004) Synthesis and structural characterization of some Schiff bases derived from 4-[(aryl)iminoethyl]-3-methyl-1-(4′-methylphenyl)-2-pyrazolin-5-one and spectroscopic studies of their Cu(II) complexes Polyhedron 23: 2465.
[16] Geary, W. J. (1971) The use of conductivity measurements in organic solvents for the characterisation of coordination compounds. Coord. Chem. Rev. 7: 81.
[17] Mahapatra, B. B. and Nilanchala, P. (2009) Polymetallic complexes Part-LXXXXIII: O,O,N,O and O,O,N donor azodye dimeric complexes of Co(II),Cu(II),Zn(II),Cd(II) and Hg(II).Journal of the Indian Chemical Society 86: 518-523.
[18] Lever, A. B. P. (1984) Inorganic Electronic Spectroscopy. Elsevier, Amsterdam pp. 417, 448, 452.

CORROSION INHIBITION OF Al-PURE BY ANILINE-N-BENZYLIDENE (ANB)
A SCHIFF BASE AS INHIBITOR IN HYDROCHLORIC ACID.
A. S. Patel, V. A. Panchal and N. K. Shah*
Chemistry Department, School of Sciences, Gujarat University, Ahmedabad, Gujarat – 380 009
ABSTRACT
The corrosion behavior and mechanism of ANB with different concentrations in hydrochloric acid was studied by chemical method (weight loss) and electrochemical technique (galvanostatic polarization). The inhibition efficiency of ANB increased as the concentration of ANB increased. At the optimum concentration of 0.001% of ANB, it gives inhibition of 56.4% and 0.5% concentration gives 99.0% inhibition and maximum inhibition, i.e.; 99.9% is achieved at 1.0% concentration. The inhibitor is found to be an excellent corrosion inhibitor from the results obtained. The adsorption of this compound on the metal surface is found to obey Langmuir isotherm. The inhibition action depends on the chemical structure, concentration of the inhibitor and the concentration of the corrosive medium. Galvanostatic polarization data indicates that this inhibitor is of mixed type with predominant effect on cathode. The better efficiency of ANB is due to presence of an iminic group (>C=N–). Results obtained from the chemical method and electrochemical technique is in good agreement with each other. Key words: Corrosion, Al-Pure, ANB, Weight loss, Galvanostatic polarization.
INTRODUCTION Aluminium and its alloys are widely used in many
industries such as reaction vessels, pipes, machineries, chemical batteries, automobiles, food handling, building, electrical transmission, etc [1] because of its low cost, light weight, high thermal and electrical conductivity [2]. When aluminium exposed to air, a layer of aluminium oxide forms almost ins layer has exce t to most acid
ckling of
aluminium ching of aluminium dissolve the metal to a considerable extent. It is, therefore, desirable to inhibit the solution used for pickling which can be done by the use of inhibitors, which is one of the best known methods for the protection of corrosion [1]. Inhibitors for the corrosion of metals are chemical compounds, when present in small quantities in an aggressive medium, inhibit corrosion by bringing about changes in the surface condition of a metal. This process can be associated either with adsorption of the inhibitor or the formation of difficulty–soluble films which, however, are significantly thinner than protective coatings [4].
From the literature survey [5 - 7], it is observed that
among all the inhibitors studied so far Schiff bases are found to be very effective. Schiff base as an inhibitor is synthesized from relatively two basic materials (amine and aldehyde) and the inhibition depends upon formation of a chemically adsorbed film and forming a complex with the metal surface. The ability of the inhibitor is to form a long lasting film and it depends upon its chemical structure and interaction with the corrosive environment [8].
In the present work, Aniline-N-benzylidene (ANB) has
been reported as corrosion inhibitor for Al-Pure in hydrochloric acid. Both weight loss and galvanostatic polarization methods were used in the evaluation of ANB.
MATERIALS AND METHODS Synthesis of Schiff base
The Schiff base was synthesize by condensation of benzaldehyde with aniline in the presence of ethyl alcohol as per the procedure described by Jaeger [9]. ANB (light yellow crystalline product, m.p., 52°C, registry number, 538-51-2) is insoluble in water but soluble in ethanol. The structure of the inhibitor is shown below:
Aniline-N-benzylidene (ANB) Preparation of specimens
Rectangular specimens of Al-Pure, of size 6 cm × 3 cm (thickness 0.050 cm), with a small hole of ~2 mm diameter just near one end of the specimen were used for the determination of the corrosion rate. The specimens were polished using successively “0” to “0000” Oakey emery paper. The final polishing was done using jewelers rough, which gave a mirror-like finish. The specimens were finally degreased by A.R. carbon tetrachloride (sulphur free). The test specimens were exposed to 1.0 M and 2.0 M hydrochloric acid solutions, containing addition of ANB in the range 0–1.0%. One specimen only was suspended by a Pyrex glass hook in each beaker containing 230 ml of the test solution which was open to the air at 35° ± 0.5°C (unless otherwise specified) to the same depth of about 1.3 cm below the surface of the liquid. Polarization measurements
For polarization studies, metal coupons of circular design, diameter 2.802 cm with a handle 3 cm long and 0.5 cm wide were used. The handle and the back of the coupon and of the auxiliary platinum electrode were coated with Perspex leaving only the circular portion of the specimen exposed of apparent surface area, 6.156 cm2. The solution, 80 ml in each limb, was contained in an H–type Pyrex glass cell with the Luggin capillary as near to the electrode surface as possible and a
PRAJÑĀ - Journal of Pure and Applied Sciences, Vol. 18: 73 - 75 (2010) ISSN 0975 - 2595
tantaneously on the surface of aluminium. Thisllent resistance to corrosion. It is fairly resistanand alkali solution because of its amphoteric nature.
Solutions of hydrochloric acid, when used for pi or in chemical and electrochemical et lithographic plates or condenser films [3],
* Corresponding author – [email protected]

74 PRAJÑĀ – Journal of Pure and Applied Sciences 18: 73 - 75 December
porous partition to separate the two compartments. The potential was measured against a saturated calomel reference electrode (SCE). Galvanostatic polarization data were obtained with Wenking Potentioscan POS 73. In these experiments, the current density was varied in the range of 2 × 10⁻⁴ to 3.25 × 10⁻⁴ A cm-2. RESULTS AND DISCUSSION Effect of inhibitor concentration
To study the effect of inhibitor concentration on inhibitive
efficiency of the inhibitor, weight losses were determined in 1.0 M and 2.0 M hydrochloric acid containing various concentrations of inhibitor at 35° ± 0.5°C for exposure periods of 60 minutes and 15 minutes respectively. The inhibitor efficiency (%) was calculated as follows: Inhibitor efficiency (%) = X 100 [1] where Wu = weight loss in uninhibited acid, and Wi = weight loss in inhibited acid.
The results given in Table-1, show that a specimen of Al-Pure when immersed in plain acid suffers a weight loss of 2300 mgdm-2 in 1.0 M HCl for an exposure period of 60 minutes and 4236 mgdm-2 in 2.0 M HCl for an exposure period of 15 minutes, with evolution of hydrogen.
Table - 1 Effect of inhibitor concentration on weight loss and
inhibitor efficiency for Al-Pure in 1.0 M and 2.0 M hydrochloric acid. (Temperature : 35±0.5o C)
1.0 M HCl
Exposure period : 60 min.
2.0 M HCl Exposure period : 15
min.
Inhibitor concentration
% (W/V) Weight loss
(mg/dm2)
Inhibitor efficiency
(%)
Weight loss
(mg/dm2)
Inhibitor efficiency
(%) Nil (HCl only)
2300 - 4236 - Aniline-N-benzylidene(ANB)
0.001 1003 56.4 732 82.7 0.005 894 61.1 596 85.9 0.05 461 80.0 230 94.6 0.10 260 88.7 138 96.7 0.50 22 99.0 16 99.6 0.80 8 99.7 11 99.7 1.00 3 99.9 5 99.9 Addition of small quantities (viz., 0.001%) of inhibitor to
1.0 M HCl show low inhibition (56.4%) toward the corrosion of Al-Pure in the use of ANB. As the concentration of the inhibitor is increased, the weight loss due to corrosion decreased and almost (99 – 100%) protection could be achieved with 0.5 – 1.0% of the inhibitor concentration.
Here also, in 2.0 M HCl, as the concentration of the Schiff base is increased, it confers more protection and at 0.05% inhibitor concentration the inhibition is found to be 94.6% and at 0.5% concentration, it confers 99.6% protection. This shows that the inhibitor is effective in higher concentration of the acid. From the results, it appears that the presence of iminic group (>C=N–) in the molecule plays a significant role in conferring the good inhibition.When plot of log (θ /1-θ) vs log Cinh (inhibitor concentration) was drawn (Figure-1), straight line was obtained indicating that the ANB was adsorbed onto the metal surface following Langmuir isotherm [10].
Cinh = θ / K (1-θ) [2]
where, θ is the fraction of the area covered by the inhibitor.
Fig. 1 Langmuir plot for ANB in 1.0 M hydrochloric acid at 35°C. Galvanostatic polarization measurement
The effect of current density on the cathode and anode potentials of Al-Pure in 1.0 M HCl, plain as well as inhibited is shown in Figure-2. A specimen of Al-Pure immersed in 1.0 M HCl develops of corrosion potential of –843 mV (SCE). In acid containing effective concentration of the inhibitor the weight loss due to corrosion is decreased considerably but the corrosion potential remains almost constant. This shows that the inhibitor is adsorbed quite generally on the metal surface and covers both, the anodic as well as the cathodic regions. It is also observed that with lower inhibitor concentration the potentials are less negative but as the inhibitor concentration is increased the potentials become more negative. This suggests that first the inhibitor is adsorbed on the anodic sites and as its concentration increases the cathodic sites are also covered. Galvanostatic polarization curves show negligible anodic but significant cathodic polarization in plain as well as inhibited acid.
Fig. 2 Effect of current density on the cathode and anode potentials of Al-Pure in 1.0 M hydrochloric acid alone and in the presence of ANB.
A ... Cathodic potential in 1.0 M hydrochloric acid alone х.....х Anodic potential in 1.0 M hydrochloric acid alone ♦.....♦ Cathodic potential with 0.001% ANB ..... Anodic potential with 0.001% ANB B ... Cathodic potential in 1.0 M hydrochloric acid alone х.....х Anodic potential in 1.0 M hydrochloric acid alone ♦.....♦ Cathodic potential with 0.5% ANB ..... Anodic potential with 0.5% ANB
0.8
1.0
1.2
1.4
-2.30 -2.20 -2.10 -2.00 -1.90
log
(θ/1
-θ)
log Cinh (mole/l)
u
iu
WWW −
-1090
-990
-890
-790
-690
-4 .0 -3.5 - 3.0 -2 .5 -2.0 -1 .5 -1.0
-1490-1390
-1290-1190
-1090
-990-890
-790-690
-4 .0 -3 .5 -3.0 -2.5 -2 .0 -1.5 -1 .0
B
log ІIІ (Acm-2)
Pote
ntia
l mV
(vs.
SCE)
A

2010 Patel et al. – Corrosion inhibition of 75
Table – 2 Tafel parameters
Tafel slope b Corrosion current, Acm-2, from Inhibitor efficiency (%) from Inhibitor and its concentration
(%) Anodic V/decade
Cathodic V/decade
Extrapolation of cathodic Tafel line
at ECorr
Extrapolation of anodic Tafel line at
ECorr
From (4)
From (5)
Weight loss data
(60 min)
1 2 3 4 5 6 7 8
1 M HCl Blank 0.113 0.120 4.467 x 10⁻³ 3.311 x 10⁻³ - - -
ANB 0.001% 0.033 0.150 1.621 x 10⁻³ 1.737 x 10⁻³ 61.1 20.6 56.4
ANB 0.5% 0.076 0.118 1.621 x 10⁻⁶ 2.229 x 10⁻³ >99.9 32.7 99.0
The Tafel parameters and inhibitor efficiencies calculated
from the polarization data are given in Table-2. The inhibition efficiencies obtained by extrapolation of the cathodic Tafel line to corrosion potential agree well with those calculated from weight loss data. This suggests that in presence of ANB, both cathode and anode are polarized to a greater extent. ANB thus appears to be mixed type inhibitor with predominant action on the cathode.
Mechanism of inhibition
In general, most of the organic corrosion inhibitors are compounds with at least one polar unit having atoms of nitrogen, sulphur, oxygen and in some cases selenium and phosphorous. The polar unit is regarded as the reaction centre for the establishment of the adsorption process. In such a case the adsorption bond strength is determined by the electron density on the atom acting as the reaction centre and by the polarisability of the functional unit. Thus polar organic compounds acting as corrosion inhibitors are chemically adsorbed on the surface of the bulk metal, M, forming a charge transfer complex between the polar atom/ atoms and the metal: M + RnX ↔ M : XRn [3]
According to Aramaki et al. [11], the metal and the compound are Lewis acid and base respectively and hence the stability of the adsorption bond is closely related to the hard and soft acids and bases principle. The bulk metal is classified as the soft acid and a molecule or ion of the soft base is readily chemisorbed on the metal surface by forming a stable donor-acceptor bond. Those inhibitors which are in a distinct ionic form may also get attached to the metal surface of opposite polarity through electrostatic attraction. The adsorbed monolayer will then block the dissolution of the metal. The size, shape and orientation of the molecule, and the electronic charge on it, will determine the degree of adsorption and hence the effectiveness of the inhibitor.
ANB contains seven conjugated double bonds (three in
each of the aromatic ring and one in the iminic group) and have three anchoring sites (one iminic >C=N–, and two aromatic rings). The plot of log θ /1-θ vs log Cinh shows that ANB function through adsorption following Langmuir adsorption isotherm. It appears that there are three anchoring sites through which the molecule can get adsorbed on the metal surface: the iminic group (>C=N–) and the delocalized π–electrons of the two aromatic rings. If it is assumed that when a compound form onium ion in acidic media and move to the cathodic region than the adsorption will take place through the iminic nitrogen and the delocalized π–electrons of the benzene moiety [12, 13], then a compound show good protection.
ANB confers good protection to Al-Pure in hydrochloric
acid when present in sufficient amount and function through adsorption on the metal surface. Galvanostatic polarization data have shown that the action of ANB is of mixed type inhibitor with predominant effect on cathodic region.
CONCUSION 1. ANB confers more than 99% protection to Al-Pure in
hydrochloric acid at 0.5% inhibitor concentration. 2. The adsorption follows Langmuir isotherm. 3. Galvanostatic polarization measurement shows that the
inhibitor is of mixed type with predominant effect on the cathodic region.
4. The presence of seven conjugated double bonds including an iminic group appeared to be the main factor enhancing chemisorption of an inhibitor.
REFERENCES [1] Abdallah M. (2004) Antibacterial drugs as corrosion
inhibitors for corrosion of aluminium in hydrochloric solution, Corrosion Science, 46: 1981- 1996.
[2] Elewady G. Y., El- Said I .A., Fouda A. S. (2008) Anion Surfactants as Corrosion Inhibitors for Aluminium Dissolution in HCl solutions, Int. J. Electrochemical Science, 3 : 177-190.
[3] Trivedi, P. T. (2009) Inhibition of the Corrosion of Aluminium- Magnesium Alloy in Hydrochloric Acid, Ph.D. Thesis, Chemistry Department, Gujarat University, Ahmedabad, India.
[4] Kuznetsov Yurii I. (1996) Organic Inhibitors of Corrosion of Metals, A Division of Plenum Publishing Corporation, pp .
[5] Agrawal Y. K., Talati J. D., Shah M. D., Desai M. N., Shah N. K. (2004) Schiff bases of ethylenediamine as corrosion inhibitors of zinc in sulphuric acid, Corrosion Science, 46: 633-51.
[6] Desai M. N., Talati J. D., Shah N. K. (2003) Ortho-substituted aniline-N-salicylidenes as corrosion inhibitors for zinc in sulphuric acid, Indian J. of Chem., 42A : 3027.
[7] Talati J. D., Desai M. N., Shah N. K. (2005) Ortho-, meta-, para-aminophenol-N-salicylidenes as corrosion inhibitors of zinc in sulphuric acid, Anti-Corros. Methods and Materials, 52 : 108-17.
[8] Clubley B. G. (1990) Chemical Inhibitors for Corrosion Control, The Royal Society of Chemistry, pp 21.
[9] Jaeger F.M. (1920) Some condensation products of aromatic aldehydes and amines, Proceedings of Acad. Sci., Amsterdam, 23 : 74-83.
[10] Brubaker G. R., Phipps P .B. P. (1979) Corrosion Chemistry, American Chemical Society, Washington, DC, pp 293.
[11] Aramaki K, Mochizuki T and Nishihara H, Proc 10th International Congress on metallic Corrosion (Madras, India, Oxford and IBH New Delhi), 1987, 2759.
[12] Hackermann N. (1954) Adsorption of polar organic compounds on steel, Ind. Eng. Chem., 46 : 1481-5, 553.
[13] Mudaliar, G. V. (2007) Organic Corrosion Inhibitors, Ph.D. Thesis, Chemistry Department, Gujarat University, Ahmedabad, India.

THE COMPLETE BIOMETRIC SYSTEM
Hiren D. Joshi*
Dept. of Computer Science, Rollwala Computer Centre, Gujarat University, Ahmedabad
ABSTRACT
The Complete Biometric System is a biometric facilitated third-party authentication system. It tries to address most of the major issues faced by current biometric industry. This paper describes a system that hides all the complexities of biometrics and provides biometric technology, vendor and platform independent authentication. It also introduces two new ideas: many-to-many mapping reduces the Total Cost of Ownership (TCO) while Device-Hierarchy implement in depth security. It achieves biometric vendor, technology and platform independence through the BioAPI specification (the Defacto standard for Biometrics). However it sets it sights far beyond the BioAPI. The system is able to overcome the issues relating to integration of biometrics in an enterprise level network which is one of the biggest problems faced by the biometric industry. It is also designed to provide a simple development environment that does not require complex data structures, pointers and memory management inherent to the BioAPI. Key words: biometric, BioAPI, biometric service, device hierarchy, provider, networking, security.
INTRODUCTION
Biometrics is an open-ended set of technologies based on the measurement of some unique physical characteristics of human beings for the purpose of identifying an individual or verifying identity. Simply saying “your body is your password”. Biometrics is today’s prime technology when it comes to access control, especially in medium to large-scale organisations. At present technology is matured enough and has proven it is the current best when tight security is the main concern. It is convenient to use, up to a certain level publicly accepted and more importantly affordable. Users have all forms of biometrics technologies (Fingerprint, Iris, Retina, Facial, etc.) to choose from, based on the required level of security and available budget constrains.
With such a value proposition it is not widely used
due to the low level of deployment of biometrics. The reason is the difficulty of integration with in a networked environment at a low cost. This paper describes a concept and its implementation to integrate biometric technology at low cost with less effort while enforcing in-depth security [1]. Biometric integration
The difficulty of integration is the major factor withholding the market for biometrics and its large-scale deployment. Most of the time it is too hard, too costly and some times impractical as well. It does not easily fit into today’s complex enterprise level networks. There are very few solutions that meet up this challenge, even those solutions are either limited to a specific biometric technology, vendor or platform.
If any organization moves into biometrics for access
control, according to the current standard practice it is required to install same type of device from the same vendor all over the organization. This raises three concerns:
1. It is required to have a dedicated device for each and
every doorstep and on each host (PC/Server). 2. Organizations have to stick with the same type of
biometric devices regardless of required level of security.
3. Organizations are in a dilemma when they scale up (i.e.
integrationproblems, tight dependence on a particular vendor, inability to go forward with latest technology developments due to backward compatibility issues, etc.).
From the application developer point of view they need to
master a specific SDK (Software Development Kit) provided by its device vendor. Typically this requires thorough knowledge of C/C++ or even Assembly, which is very inconvenient for an average level developer.
Previous work
According to a web based survey it seems that the Complete Biometric System (referred as Complete BioSys) is unmatched. There were several security solutions that are related and worth mentioning here.
The Independent Security Server – by Info Data, Inc.
Provides means to identify a person based on any biometric characteristics. They have developed BSP (Biometric Service Provider) libraries for all the popular products therefore it is compatible with all major biometric scanners. Hence users have to rely on Info Data, Inc. [3] to provide compatibility with what ever the biometric device they buy.
The WhoIsIt biometric server for e-Commerce
This is basically an application server hosted in the Internet where a client system sends a biometric template to be verified. On success any secret (goods) that is stored for that particular user can be retrieved. WhoIsIt biometric server needs to be aware of the underlying technologies and the users are restricted to the vendors in commercial agreement with them [4].
Even in these systems it is obvious that the problems of vendor, platform and technology dependence are still present up to a certain level.
The BioAPI specification [2,5] could be considered the
Defacto industry standard framework for biometrics. It defines how application developers and device vendors communicate with each other through a standard framework. The BioAPI is defined to overcome the problems of technology, platform and vendor dependencies. There is a freely available reference implementation of the BioAPI as well.
PRAJÑĀ - Journal of Pure and Applied Sciences, Vol. 18: 76 - 79 (2010) ISSN 0975 - 2595
*Corresponding author: [email protected]
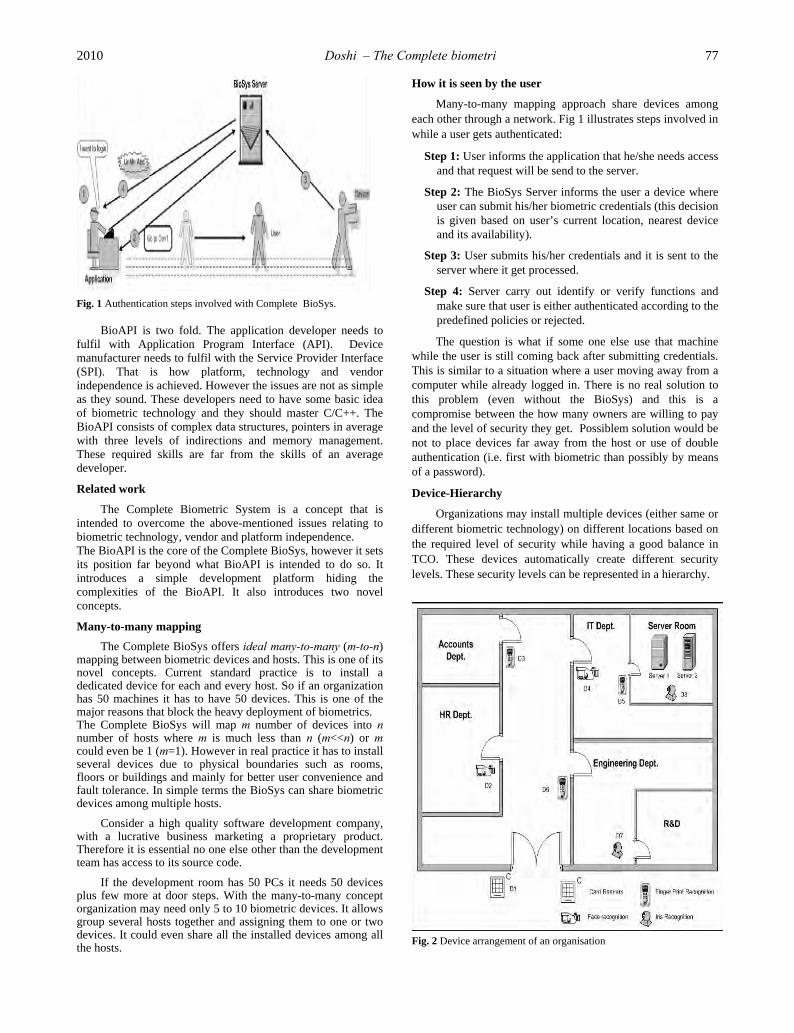
2010 Doshi – The Complete biometri 77
Fig. 1 Authentication steps involved with Complete BioSys.
BioAPI is two fold. The application developer needs to fulfil with Application Program Interface (API). Device manufacturer needs to fulfil with the Service Provider Interface (SPI). That is how platform, technology and vendor independence is achieved. However the issues are not as simple as they sound. These developers need to have some basic idea of biometric technology and they should master C/C++. The BioAPI consists of complex data structures, pointers in average with three levels of indirections and memory management. These required skills are far from the skills of an average developer. Related work
The Complete Biometric System is a concept that is intended to overcome the above-mentioned issues relating to biometric technology, vendor and platform independence. The BioAPI is the core of the Complete BioSys, however it sets its position far beyond what BioAPI is intended to do so. It introduces a simple development platform hiding the complexities of the BioAPI. It also introduces two novel concepts. Many-to-many mapping
The Complete BioSys offers ideal many-to-many (m-to-n) mapping between biometric devices and hosts. This is one of its novel concepts. Current standard practice is to install a dedicated device for each and every host. So if an organization has 50 machines it has to have 50 devices. This is one of the major reasons that block the heavy deployment of biometrics. The Complete BioSys will map m number of devices into n number of hosts where m is much less than n (m<<n) or m could even be 1 (m=1). However in real practice it has to install several devices due to physical boundaries such as rooms, floors or buildings and mainly for better user convenience and fault tolerance. In simple terms the BioSys can share biometric devices among multiple hosts.
Consider a high quality software development company, with a lucrative business marketing a proprietary product. Therefore it is essential no one else other than the development team has access to its source code.
If the development room has 50 PCs it needs 50 devices
plus few more at door steps. With the many-to-many concept organization may need only 5 to 10 biometric devices. It allows group several hosts together and assigning them to one or two devices. It could even share all the installed devices among all the hosts.
How it is seen by the user
Many-to-many mapping approach share devices among each other through a network. Fig 1 illustrates steps involved in while a user gets authenticated:
Step 1: User informs the application that he/she needs access
and that request will be send to the server. Step 2: The BioSys Server informs the user a device where
user can submit his/her biometric credentials (this decision is given based on user’s current location, nearest device and its availability).
Step 3: User submits his/her credentials and it is sent to the
server where it get processed. Step 4: Server carry out identify or verify functions and
make sure that user is either authenticated according to the predefined policies or rejected.
The question is what if some one else use that machine
while the user is still coming back after submitting credentials. This is similar to a situation where a user moving away from a computer while already logged in. There is no real solution to this problem (even without the BioSys) and this is a compromise between the how many owners are willing to pay and the level of security they get. Possiblem solution would be not to place devices far away from the host or use of double authentication (i.e. first with biometric than possibly by means of a password). Device-Hierarchy
Organizations may install multiple devices (either same or different biometric technology) on different locations based on the required level of security while having a good balance in TCO. These devices automatically create different security levels. These security levels can be represented in a hierarchy.
Fig. 2 Device arrangement of an organisation

78 PRAJÑĀ – Journal of Pure and Applied Sciences 18: 76 -79 December
Fig. 3 Device hierarchy for the organization given in Fig 2
Fig. 2 illustrates a imaginary organization that has installed different devices based on their security requirement. They have installed card reader at the entrance and placed more secure fingerprint and iris systems at places like Server room, Engineering and R&D. Such an arrangement will result in different security levels which ould be mapped into a logical hierarchy such as Fig 3. Knowledge of this hierarchy (referred as Device-Hierarchy by the authors) could be used to gain in-depth security.
In reality, Device-Hierarchy is automatically created when
multiple devices are installed with different access levels. It is already there but the problem is no one sees it; therefore no one makes use of this hierarchy to gain tighter security. According to the defence in-depth approach an organization should have security from its doorstep to the server room. Today all these security measures are there with different access levels. However the problem is these cecurity measures are independent so bypassing one layer is possible. Device-Hierarchy tries to integrate all these levels together in order to enforce tighter security.
When multiple levels of security measures exist a user has to get authenticated through several devices in a specific order. Consider an example where the system administrator is going to the server room starting from the main entrance. First he/she has to get authenticated using the card reader at the entrance. Then he/she is required to use the facial recognition system at the IT department. Then if the administrator needs to go into the server room he/she has to get authenticated through the fingerprint device as well. The path followed by the system administrator can be represented by a specific branch in a tree which represents the Device Hierarchy (Fig 3). The branch includes device D1, D4 and D5.
From the system administrator’s point of view he/she does not need to remember any of these devices or specific paths. These things happen naturally when people move around within an organization.
This type of path tracking and path enforcement will make
sure that users are not allowed to access any resources unless
he/she has entered what ever the place according to the accepted route (branch in the tree). Consider a case where an authorized person is being able to get into the server room through the roof of the organization (or by any other means) and trying to access one of the servers in the server room. If the unauthorized person is able to provide a valid username, password combination or is able to forge the biometric device attached to the server there is nothing to stop him/her from accessing the server. However according to the concept of Device-Hierarchy the unauthorized person has violated the hierarchy (i.e. not gone through the accepted path). He/she has directly used device D8 without getting authenticated through devices D1, D4 and D5. In this case the Complete BioSys will not allow any access to the server, although the submitted credentials for the device D8 is correct, since the Device Hierarchy is being violated.
Enforcement of such a policy would result in-depth
security from the doorstep to servers. Tracking employees (specially the IT support staff) in a
large organization could be real problem. Being aware of the Device-Hierarchy will enable the possibility of tracking users. Based on the last authenticated device, a probable location within the organization can be identified. All this is possible since the administrator can configure the Complete BioSys with a map of the organization’s floor arrangement (something similar to Fig 2). Several maps could be used if the organization spans several building, multiple floors or if it is too dense to put everything in a single map.
Whatever technologies come and go passwords will
remain so many years to come, although it is easily forgettable by the users or guessable by others. Therefore the BioSys also supports password-based authentication.
Although having all those features the Complete BioSys
will not be complete if standard practices of network management, administration are not combined with security. Its design highly encourages such security precautions.
Fig. 4 Components of BioSys and their intercommunication Design and implementation
The Complete BioSys consist of several components that are interconnected to each other (Fig 4). The BioSys Server is the central point of communication and it performs all the

2010 Doshi – The Complete biometri 79
administrative, management, policy enforcement and image processing tasks [6].
The Complete BioSys make use of BioAPI and it enables
plug & play biometric components. The BioAPI was wrapped by adding another layer in-between the BioSys Server and the BioAPI.
This in-between layer (referred as the BioAPI Wrapper)
was essential since the BioAPI reference implementation is written in C/C++. It was not directly accessible through Microsoft .Net C# as the BioAPI deals with multiple levels of indirections of pointers and union types. Therefore it was essential to have such a layer. By doing so it did made the task of the BioSys development much easier and the authors were able to make it even simple for the application developer to work with the BioSys rather than with the BioAPI.
To make development as simple as possible web services
[5, 7, 8] can be used. Web services allow high level programming module with platform independence, centralised control with sufficient scalability. Use of web services (referred as the BioSys Service) makes it suitable for an enterprise level networked environment, which only requires application clients to support SOAP and HTTP messaging. Therefore any programming language supports SOAP and HTTP can be used to develop applications that make use of the BioSys. Use of web services allows the BioSys to extend beyond a LAN or Intranet into the public Internet. This is useful in cases where remote users and mobile users want to get authenticated using biometrics.
Use of web services allows applications and console (is a
separate application where all the administrative things is done) to be of any platform but only the server to be limited to a specific platform. Web service was developed using Microsoft .Net C# and currently will only work with Microsoft IIS.
Microsoft .Net C# was selected not just because it supports Web services, there were two other concerns.
1: it was not possible to use other languages (other than
C++) to access complex data structures and pointers that the BioAPI extensively requires. Even support of C# is limited up to a certain level.
2: Performance.
It is unrealistic to ask a biometric device to support web service and send whatever it captures to the server for the processing. It is highly encouraged that image processing be carried out in the BioSys Server since it is secure doing it at the server and it will reduce the processing overhead of the device (most devices do have limited processing power). Device makes use of socket connection when communicating with the server. System should also support RS232/485 protocols if it to be commercially successful.
The Console is a separate management station, which can either reside on the same machine as the server or in a different host. It is the place where all the policies are defined and monitoring is done. All the user information, management policies, login and user biometric records are stored in a centralised database and could be extended to distributed databases if required. The future
The Complete Biometric system only supports some of the very basic network and security practices. It should be redesigned to addressing security from bottom-up to clear high-
level of security. This is not because the current design is bad it is because security should never be a separate layer; it should be an integral part of the whole system. These things were left out in the prototype due to resource limitations.
Current biometric infrastructure of an organization consists of lots of non-BioAPI compliant devices. If these devices can be transferred to become BioAPI compliant it would reduce a lot of reinvestment. BCB Generator (BioAPI Compliant BSP Generator) is such an approach where it tries to automate the processes which could transform non BioAPI device to become BioAPI compatible.
The Complete BioSys can be easily extended to the public internet with enhanced security since it is already exposed as a web service. As with many biometric systems the Complete BioSys can also be used as a time and attendance system that could directly integrate with a payroll system. Necessary data is already available within the system and it is just a matter of organizing them.
The BioSys could also extend into a ticketing system like Kerberos or integrate with Domain management system such as Microsoft Active Directory [9]. In order to enhance security certain vendors uses a combination of biometric technologies (example: face, lip movement and voice combined recognition system). The Complete BioSys could support such mechanisms as well.
CONCLUSION
Since the Complete BioSys is a Proof of concept there are no measurable results. It has proven that biometric integration can be made flawless and effortless while enforcing management and security practices. It offers a biometric enabled third-party authentication which is platform, vendor and biometric technology independent. It also reduces the TCO considerably and enforces tighter security with two unique features.
This solution would be more suitable for a medium to large-scale organization that has stringent security requirements and need to install many biometric devices.
REFERENCES [1] Universal BioSys web site http://www.biosys.net.tc [2] The BioAPI Consortium, “BioAPI Specification Version
1.1”, 16th March 2004.http://www.bioapi.org [3] The Independent Security Server, developed by Info Data,
Inc.http://www.infodatany.com/independentsecurityserver.htm
[4] The WhoIsIt biometric server for E-commerce http://www.qvbiometrics.com/E_Metrics_server.htm
[5] De Silva S. M. R. P , Weerasinghe P. W. H. D, Bandara H. M.N. D, “Universal BioSys - A literature review” http://www.cse.mrt.ac.lk/~ravids/literal.html
[6] De Silva S. M. R. P, Weerasinghe P. W. H. D, Bandara H. M.N. D, “Universal BioSys”, final project report. http://www.cse.mrt.ac.lk/~ravids/literal.html
[7] Lakshmi Ananthamurthy,” Introduction to Web Service” http://www.developer.com/services/article.php
[8] Heather Kreger, IBM Software Group, May 2001, “Web Services Conceptual Architecture (WSCA 1.0) http://www.306.ibm.com/software/solutions/webservices/pdf/WSCA.pdf
[9] Microsoft, “Active Directory Overview” http://www.microsoft.com/windows2000/server/evaluation/features/dirlist.asp

PREVALENCE OF ANEMIA IN PTC GIRLS FOLLOWED
BY SUPPLEMENTATION OF DATE BALL
Dharmistha Jadeja and Gayatree Jadeja*
Smt. Kamlaben P. Patel College of Home Science, Near Sardar Baug, Anand, Gujarat – 388 001
ABSTRACT
Iron deficiency is defined as decreased total iron body concentration. Iron deficiency anemia is the most common form of anemia. The present study was planned to perform in three parts to fulfill the objectives like pilot study that is prevalence rate of anemia in PTC girls (n=92), product development and supplementation of iron rich Date ball to the anemic girls for find out the bioavailability of nutrients. The present study indicated that 76% girls were anemic due to iron deficiency. When they were fed with the iron rich product i.e., Date ball for 21 days their hemoglobin content had increased and urinary calcium and creatinine content were decreased. Thus the product indicates a product shows the positive effect in anemic girls. Therefore it may be concluded that for prevention of anemia it is very essential to modify the meal that it provides the maximum amount of bioavailable iron. Key words: Bioavailability, Hemoglobin, Iron deficiency anemia, Supplementation.
INTRODUCTION
Nutritional status is the condition of health of an individual as influenced by nutrient intake and utilization in the body. In developing countries like India various forms of malnutrition affect a large segment of population and both macro and micronutrient deficiencies are of major concerns. In developing world, approximately 146 million children are underweight. Out of these, 57 million children live in India [1] and over 90% Indian women, adolescent girls and children are anemic [2-4], indicating that the health of children is dependent upon food intake that provides sufficient energy and nutrients to promote optimal physical, social, cognitive growth and development. Inadequate energy and nutrients have a variety of poor outcomes including growth retardation, iron deficiency anemia, poor academic performance and development of psychosocial difficulties. It was reported that, etiology of linear growth retardation is multi-factorial but has been explained by three major factors: poor nutrition, high levels of infection and problematic mother-infant interaction, which is closely related to the socio-economic status of the family [5].
Iron deficiency anemia is due to decrease in the number of
red cells in the blood caused by too little iron. Iron deficiency anemia is the most prevalence micro nutrient deficiency in the world. In normal individuals there is a complementary relationship between the nutrient intake and the nutritional status. The amount of nutrient absorbed from the diet must be enough to overcome the need for that nutrient and it must play its metabolic role in the body.
This nutritional equation may be thrown off balance by insufficient intake or absorption of nutrient and by increased needs or losses. Any one or combinations of reasons result in reduced availability of the nutrient to the body. The body when faced with this situation initially uses its own reserves. After the exhaustation of its reserves, if the nutrient intake still remains inadequate the function in which the nutrient is active is affected. In case of iron, its deficiency results in lowered hemoglobin level and this condition is known as iron deficiency anemia. This is an actually the last stage of iron deficiency and it represent the end point of a long period of iron deprivation.
The objectives of the present study were (i) to carryout the study to know the prevalence of anemia in PTC Girls of Anand Peoples Medicare Society campus, Anand (ii) to develop an iron rich product and its nutritional assessment (iii) supplementation of experimental products (30 g date ball per day) to the anemic girls followed by clinical assessment. (iv) to assess the calcium and creatinine level in blood and urine samples of these girls. MARERIALS AND METHODS
The experiment was divided into three parts including the pilot study, product development and supplementation of product to the anemic girls.
The first part deals with the prevalence rate of anemia in
92 PTC girls of Anand Peoples Medicare Society campus to assess the nutritional status of adolescent girls using clinical assessment such as blood and urine analysis. The hematological auto analyzer was used for blood analysis. Further factors such as general information, medical information, and dietary information were studied for their influence on nutritional status. Hemoglobin (Sahli’s method), serum calcium (Arsenzo III Kit method) [6] urinary calcium (Arsenzo III Kit method) [6], serum creatinine [7] and urinary creatinine [8] level were estimated at the beginning and at the end of the feeding trial as an indicator of body iron and calcium status.
The second part of the study deals with the development
of different proportion based product prepared with the objective of increasing available iron in the daily diet of adolescent girls. Recipe as “Date ball” was initially selected randomly by variation in ingredient levels. From these the experimental product was selected. The experimental product was analyzed for the nutritional parameters i.e. fat (Soxhlet method), protein (Kjeldhal method, 1965), Iron [9], Calcium [10] and phosphorus [11]. For standardization of experimental product, incorporation of different proportion of ingredients was used. Five different combinations were tried for Date ball preparation. All the experiment products were tested by the selected panel members. The final experimental Date ball was selected on the basis of its sensory score and also the product which has highest nutritive value.
PRAJÑĀ - Journal of Pure and Applied Sciences, Vol. 18: 80 - 82 (2010) ISSN 0975 - 2595
* Corresponding author: [email protected]

2010 Jadeja and Jadeja – Prevalence of anemia 81
The third part of the study deals with the supplementation of experimental product to the selected anemic girls and then biochemical analysis of their blood and urine samples was performed.
Based on the pilot study data (part 1), 26 anemic girls (Hb<10g/dl) were selected as experimental subjects after obtaining their willing consent. They were requested to follow the general pattern of diet without much variation during the experiment feeding period. Subjects were then fed 15 gm of two Dates balls (which would be consumed in one serving as a snack) during day time for 21 days. Hemoglobin, serum calcium and urinary calcium, serum creatinine and urinary creatinine level were estimated at the beginning and at the end of the feeding trial as an indicator of bioavailability of iron and calcium status. The statistical analysis was performed using the SPSS software. RESULTS AND DISCUSSION
In the first part of the blood and urine samples of study total 92 girls were clinically analyzed. The hemoglobin results indicated that around 70 (76%) girls were anemic and 22 (24%) girls were found normal. The average hemoglobin value of 70 girls was 10.079 g/dl which was indicating the anemic condition due to nutrient deficiency, while 22 girls had the normal range of hemoglobin value that was 12.650 g/dl. Thus there was a highly significant difference (**p<0.01) as compared to the normal girls. Serum calcium and creatinine values were slightly higher in the anemic girls compared to that of normal girls and there was no significant difference between the two groups. Urinary calcium values were slightly lower in the anemic girls compared to normal girls, while the urinary creatinine values were slightly higher in the anemic girls compared to normal girls. (Fig. 1)
study Out of 70 anemic girls, 15 girls had low RBC value which
indicates that the subjects are suffering from iron deficiency anemia. The monocyte values were in the range of 7.7 to 10.7%. The anemic subjects 49 out of 70 shows the higher range i.e. more than 8% which was responsible for iron deficiency anemic condition. The haematocrit values were lower than the normal range in 54 anemic girls out of total 70 anemic subjects which may be due to the iron deficiency. The
mean cell volume (MCV) 50 out of 70, mean cell hemoglobin (MCH) 52 out of 70 and mean corpuscular hemoglobin concentration (MCHC) 48 out of 70 subjects shows the lower values compared to normal range. The clinical research suggests that the lower MCV value is responsible for the iron deficiency anemia. The blood red cell distribution width (RDW) values were higher in 67 anemic girls which indicate that the anemic condition is due to the iron deficiency. The mean platelet volume (MPV) and platelet (PLT) values were normal in both groups and it has no relation with the anemic condition. The plateletcrit (PCT) values were higher than the normal range in 67 anemic girls and it was responsible for the anemic condition. So the blood parameter and higher or lower values of hemoglobin were suggested that the anemic condition in most of the 70 girls may be due to the iron deficiency.
As a part of pilot study the questionnaire was also filled up
by the subjects. The questionnaire contained the common questions collected to their food habit and suffering from any clinical symptoms. The hemoglobin value of anemic girls indicated that 47% of girls were suffering from headache, 67% of girls were suffering from fatigue and 9% of girls were suffering from anorexia.
Results of pilot study suggested that the anemic condition
in 70 girls was due to iron deficiency. So the second part of the study was planned with the objective of developing the iron rich product. The date ball was selected as an iron rich product. Initially different combinations of all ingredients were tried theoretically with respect to nutrient content. The best combination which contained all the nutrients in the higher amount was selected as an experimental product. Table 1 gives the nutrient content of experimental Date ball. The analyzed value of fat, calcium, phosphorus, iron and protein were almost similar to the theoretical value. Slightly higher or lower values were due to the varietals difference in the ingredients. According to Recommended Dietary Allowances (RDA) requirement 30% of fat, 14.1% of calcium, 9% phosphorus, 7.5% of iron, 4.77% of protein requirement per day was fulfilled by the experimental product. Table - 1 Ash, fat, calcium, phosphorus, iron and protein
content of experimental product.
No. Parameter Theoretical analytical 30 g/day RDA/day
Fig. 1 Clinical parameters of normal and anemic PTC girls during pilot
12.7
9.4
2
0.43
1.9
10.19.6
2.3
0.41
2.19
0
2
4
6
8
10
12
14
Hemoglobine(gm/dl)
SerumCalcium(mg/dl)
SerumCreatinine
(mg/dl)
UrinaryCalcium
(gm/24 hr)
UrinaryCreatinine(gm/24 hr)
Normal Anemic
1. Ash (gm %) - 5.667
±0.981 - -
2. Fat (gm %) 19.890 19.568
±1.006 4.467 15-20
3. Calcium (mg %) 281.800 277.500
±3.118 84.54 600
4. Phosphorus (mg %) 204.250 185.000
±2.357 61.275 700
5. Iron (mg %) 4.217 4.000
±0.128 1.275 17
6. Protein (gm %) 9.545 11.550
±1.189 2.863 60
Mean of 3 replications ± SEM After product development study the developed date ball
was supplemented to the selected anemic girls. The hemoglobin value of after supplementation was increased in 80% girls compared to the before supplementation and it shows highly significant difference. Serum calcium values did not show much difference either before or after supplementation. The clinical research also suggests that the iron rich supplementation did not change the normal Serum calcium level. Serum creatinine values were found to get decreased after

82 PRAJÑĀ – Journal of Pure and Applied Sciences 18: 80 - 82 December
supplementation, and it shows highly significant difference compared to initial value. The clinical research was also in support that when the calcium absorption is increased the serum creatinine level decreases. Urinary calcium and creatinine values were lowered after supplementation and it indicated that the calcium absorption was increased and excretion was decreased (Fig. 2).
Fig. 2 Comparison of clinical parameters of anemic girls with respect to before and after supplementation
SUMMARY AND CONCLUSION
Iron deficiency anemia is the most prevalent micro nutrient deficiency in the world. The present study was planned to perform in three parts to fulfill the objectives like pilot study for find out the prevalence rate of anemia in PTC girls, product development and supplementation of iron rich Date ball to the anemic girls for finding the bioavailability of nutrients. The hemoglobin value of all subjects were categorized for the anemic (Hb<12 g/ dl) and non-anemic girls ( Hb>12 g/dl). The blood parameter of anemic and non-anemic groups was analyzed and the RBC (red blood cell) WBC (white blood cell) and lymphocyte range were normal in both groups. Monocyte value in anemic group was higher. HCT (hematocrit), MCV (mean cell volume), MCH (mean cell hemoglobin), MCHC (Mean corpuscular haemoglobin concentration) values was lower in anemic group and RDW (Red cell distribution width) and PCT (Plateletcrit) values in anemic group was higher than the normal range.
Part 1 study indicated that 76% girls were anemic due to
iron deficiency so the second part of the study was dealt with the product development. Dates ball which contain all the nutrients in higher amount were selected as an experimental product.
The third part of the study was carried out for the supplementation of iron rich product to the 26 selected anemic girls (Hb<10g/dl). The experimental subjects were fed two Dates ball (30 gm) per day for 21 days and after supplementation the clinical analysis of blood and urine were estimated.
The hemoglobin values after supplementation was
increased in 80% girls which indicated that the iron bioavailability was increased by the anemic girls. In serum calcium values there was not much more difference after supplementation and serum creatinine values were decreased after supplementation. The urinary calcium and creatinine values were decreased after supplementation which indicated that the calcium absorption has increased.
Recent studies indicate that the intervention lead to
decrease in the severity of anemia but incidence of anemia still remains very high. Therefore it is now very essential that a basic change in the dietary pattern be made in the meal is so modified that it provides the maximum amount of bioavailable iron. REFERENCES [1] UNICEF, (1997), Nutritional anemia is South Asia.
Malnutrition in South Asia- A regional profile.” Rosa Publications, 75-83.
[2] Chandrika, S, (2006), Childhood and adolescent anemia in India. The Hindu Times Newspaper, 5.
[3] Thatcher, R. W,( 1998), Maturation of the human frontal lobes: Physiological evidence for staging. Nutrition, Brain and Dev Neuropsychol., 7: 397-419.
[4] Amerithaveni, M. and C. W. Barikor, (2002). Nutritional status of Meghalayan pre-school children, Thailand. J. of Nutr. and Dietetics, 32: 262.
[5] Waterlow, J. C, (1994) Introduction, causes and mechanisms of linear growth retardation (stunting).” Eur. J. Clin. Nutr., 48(1): S1-4.
[6] Bishop, M. L., Dubeb-Von Laufen, J. L. , Burtis, Carl Aa and Ashwood,. xxx Titz 110, 61.
[7] Masson, P., Ohlsson, P., and Bjorkhem I. (1981). Combined enzymic-Jaffe method for determination of creatinine in serum. Clinical Chemistry, 27: 18-21.
[8] Bonses, R. W. and Taussky, H. H. (1945) On the colorimetric determination of creatinine by the jaffe reaction, Journal Biol. Chem., 158: 581
[9] Ramsay, W. N. M., Method of Iron estimation, Journal of Biochemistry, 17, C.F.Varley, H.(1969): practical clinical Biochemistry, 4th edition.
[10] Clark, F. P. and Collip, J. B. (1925) Determination of calcium by titrimetric method. Journal Biol. Chem., 63: 461-464.
[11] Fiske C. H. and Subbrow Y. (1925), Colorimetric determination of phosphorus, Journal Biol. Chem., 66: 375-400
8.7
10.1
2.5
0.45
2.3
1010.7
0.98
0.09
0.94
Hb (g/dl) SerumCalcium(mg/dl)
Serumcreatinine
(mg/dl)
Urinarycalcium(g/day)
Urinarycreatinine
(g/day)
Before After
AWARENESS OF THE MANAGERS OF THE INDUSTRIES REGARDING
ENVIRONMENTAL RESPONSIBILITIES: A STUDY
Sarjoo Patel* and Drashti Shah
Department of Family and Community Resource Management, Faculty of Family and Community Sciences, The Maharaja Sayajirao University of Baroda, Vadodara – 390 002,INDIA
ABSTRACT
The industries are the key elements of any area responsible for the cause and the changes faced in the environment and the cycle of atmosphere. EEnnvviirroonnmmeennttaall ddeeggrraaddaattiioonn hhaass aassssuummeedd aallaarrmmiinngg ddiimmeennssiioonnss ttooddaayy.. TThhiiss hhaass mmaaddee eennvviirroonnmmeennttaall mmaannaaggeemmeenntt aa ssppeecciiaalliizzeedd ffiieelldd wwhhiicchh iiss bbeeyyoonndd tthhee ssccooppee ooff ggoovveerrnnmmeenntt.. EEnnvviirroonnmmeenntt iiss aa gglloobbaall iissssuuee uunnrreellaatteedd ttoo nnaattiioonnaall bboouunnddaarriieess.. IItt rreeqquuiirreess aa sseett uupp tthhaatt iiss aabboovvee tthhee nnaattiioonnaall ccoonncceerrnnss aanndd tthhee uunniivveerrssaall nnaattuurree.. Industries have to adopt clean technologies and bring about implementation in management practices. It is the duty of the industries to cover the environmental implications of the industrial operations. Government and industries should take into consideration environmental responsibilities and follow the laws, rules and regulations for the betterment of environment. EEffffeeccttiivvee aanndd eesssseennttiiaall eennvviirroonnmmeennttaall mmaannaaggeemmeenntt ssttrraatteeggiieess ccaann oonnllyy bbee aacchhiieevveedd iiff hhuummaannss wwiillll ccuullttiivvaattee pprraaccttiicceess tthhaatt wwiillll ssuussttaaiinn tthhee eennvviirroonnmmeenntt ffrroomm tthhaatt wwhhiicchh ddeepplleettee aanndd ddeeggrraaddee iitt.. TThhee bbeenneeffiittss ooff eennvviirroonnmmeennttaall rreessppoonnssiibbiilliittyy iinncclluuddee aa ddeeccrreeaassee iinn tthhee ccoosstt ooff ooppeerraattiioonnss dduuee ttoo iimmpprroovveedd pprroodduuccttiioonn yyiieellddss,, ddeeccrreeaassee iinn ccoossttss aassssoocciiaatteedd wwiitthh eemmppllooyyeeeess,, mmiinniimmiizzaattiioonn ooff mmaatteerriiaall aanndd eenneerrggyy uussee,, ddeeccrreeaassee iinn eexxcceessss ppaacckkaaggiinngg aanndd wwaassttee tthhaatt nneeeeddss ssaaffee ddiissppoossaall.. AAnn eennvviirroonnmmeennttaallllyy rreessppoonnssiibbllee ccoommppaannyy hhaass lleessss rreegguullaattoorryy rriisskkss aanndd nneeeedd nnoott ttoo bbee ccoonncceerrnneedd aabboouutt nnoonn--ccoommpplliiaannccee rreessuullttiinngg iinn pprroodduuccttiioonn,, ffiinneess,, nneeggaattiivvee ppuubblliicciittyy,, aa ssuubbsseeqquueenntt ccoossttllyy ppuubblliicc rreellaattiioonnss ccaammppaaiiggnn.. IInndduussttrriieess aarree tthhee kkeeyy eelleemmeennttss tthhaatt iinnfflluueennccee ootthheerr ssyysstteemmss.. Taking all this into consideration a study was conducted to study the practices of the respondents regarding responsibilities for Community and also to find out their awareness regarding General Environmental Conditions and Laws, Rules & Regulations laid by Government for Chemical and Plastic Industries. The findings of the study which is undertaken will be helpful and beneficial to all those individuals who may or may not be aware about the practices which should be carried out for environmental responsibilities and for community and general environmental conditions and laws, rules & regulations laid by Government. This may prove as a “lighthouse” guiding them through unknown waters and the hidden dangers. Descriptive research design was planned for conducting the present study. The study had two sets of variables, independent and dependent variables. The sample of the study consisted of 120 industries, 60 each from Chemical and Plastic industries were selected from Makarpura G.I.D.C, Nandesary, Waghodia G.I.D.C., Pratapnagar, Ranoli, Padra, Chhani ect. areas of Vadodara City. The questionnaire was used as an instrument to gather the information from the respondents. The data were analyzed employing descriptive as well as relational statistics. Descriptive statistics of percentage, frequency and mean were applied. Analysis of Variance (ANOVA),‘t’ - test, Scheffe’s test and coefficient of correlation were computed to test the relationship between selected variables. Key words: environment and social responsibility practices, awareness, environmental responsibilities, industries.
INTRODUCTION
Environmental degradation has assumed alarming dimensions today. This has made environmental management a specialized field which is beyond the scope of government. Environment is a global issue unrelated to national boundaries. It requires a set up that is above the national concerns and the universal nature. The reasons for the situation of degradation of environment and its conditions are growing world population, depletion of natural resources and pollution which have led to ecological crisis those endangering natural systems of which humans are part. This is directly the result of the pollutants spewed by the human being into environment. Whichever way environmental degradation is categorized, it is glaring that the most environmental damage is the resultant effect of environmental problems. Though the earliest procedure of pollution generated by life forms would have been a natural function of existence, but now- a-days careless handling of pollution and contamination of our resources such as rivers, lakes, streams and underground resources have impaired the quality of environment. Today, people have stopped to consider that they are the polluter, when they do those activities which interfere with the natural activities and, the way they pollute the environment. Thus, there is enough evidence of increasing deterioration of the environment in some forms on a world wide scale. This condition, although primarily caused by relatively small number of nations, affects all the humanity [1]. Environment has its own limit as well as capacities to disperse,
degrade, absorb or otherwise dispose off unwanted waste in the natural sinks of the atmosphere. As the population expanded, urbanization and industrialization increased, resulting in large amount of waste, of all kinds, ever increasing beyond the nature’s capacity, presents a daunting and serious problem. Major problem which occur in environment is of pollution. Pollution is a special case of habitual destruction; it is chemical destruction rather than the more obvious physical destruction [2]. Garbage, apart from gaseous and liquid wastes, is increasing with the human population, industrialization and with the changing life-style which is turning towards “throw-away culture”. Although the problem has been around for years, it seems to be getting worse. Americans discard 3.6 pounds per capita every day, which was 4.5 pounds per capita per day by the year 2000 [3]. The problem is where to put it all. Majority goes into land fill (dumps), which pose health problems apart from being a breeding place for pests and micro organisms. Moreover, much of the garbage is made of materials that do not breakdown easily or quickly, such as plastic. Some waste materials are toxic in nature, such as batteries, as these contain lead.
Poisoned rivers, poisoned seas, poisoned soils and poisoned air. The polluting tide has upset the natural environmental balance. It now threatens to upset the delicate chemistry of our own biochemistry [4].
Thus, there are enough evidences of increasing
deterioration of the environment in some forms on a world
PRAJÑĀ - Journal of Pure and Applied Sciences, Vol. 18: 83 – 87 (2010) ISSN 0975 - 2595
*Corresponding author: [email protected]

84 PRAJÑĀ – Journal of Pure and Applied Sciences 18: 83 - 87 December
wide scale. It is true that the problems of environment can be solved only through pollution prevention. Pollution prevention can pay through saving resources, recycling materials at a lower cost than using new materials, and reducing clear up costs [5]. The industries are the key elements of any area responsible for the cause and the changes faced in the environment and the cycle of atmosphere [6]. One of the major provisions of Indian State Policy is to maintain environmental standards along with promoting economic growth. However, the same becomes difficult. Industrial Development is imperative; however, proper precautionary measures for pollutions and arrest of associated problems are also essential. Today, many companies have accepted their responsibility to do no harm to the environment [7]. Industries are complying with regulatory standards and norms, by adopting clean technologies and bring about implementation in management practices. For the betterment of environment, commitment and voluntary initiatives of industry for responsible care of environment is important. Indian Corporates in the contemporary times have taken full advantage of this ‘not so strict’ environmental control by the government and have been successful in maximizing profits for themselves. However, over the last few years the Indian Corporates are realizing that it is in their favour that they adhere to their environmental responsibility and grow in a manner that is more sustainable. Indian Industries have opened up post reforms that took place in the country allowing freedom from strict rules and regulations that had made working of Indian Industries very difficult. In this post reform scenario, Indian industries have widely increased the production capacities and basic infrastructure leading to increasing amount of pollution.” With the increasing liberalization and globalization of the Indian Economy it seemed almost axiomatic to assume that the greening of India would only be successful if it was made into a paying proposition in commercial terms”. Corporate environmentalism in older industrial countries is being encouraged by economic, political and industrial organizational factors [7]. Corporate Environmental Responsibility (CER) encompasses the voluntary actions and measures of companies to contribute to a cleaner environment (European Commission, 2001). Globally, the concept of Corporate Environmental Responsibility (CER) is moving from a fringe consideration to a core business issue and a permanent part of business management [8].
In today’s world, corporate responsibility is an essential part of business. Companies face, in addition to all the time tightening legislation, pressure to act more responsible from other stakeholders groups such as customers and investors [9]. Corporations are beginning to respond to expectations of corporate responsibility by asking what is good for the environment, society and business, as well as how performance can be measured and evaluated. At various National levels government regulations, society pressure groups and green consumer pressure; these developments are reawaking corporate attention to strategic and competitive role of environmental responsibility to corporate survival. However, within the developing nations, the understanding is somewhat different mainly because of weak government regulations and lack of organized pressure groups and consumer awareness to influence corporate behavior [9]. It is also seen that the roles of sectors have been changed, with the private sector becoming an active partner in environmental protection.
Many governments and businesses are now realizing that environmental protection and economic growth are not always conflicts. For planning, promotion, co-ordination and overseeing the implementation of the environmental forest programmes, Central Government of India has Ministry of Environment and Forests (MoEF) as an agency in the administrative structure. It has formed some legislation on Environments, Forests and Wildlife for industries and corporate. Thus, industries have to adopt clean technologies and bring about implementation in management practices. It is the duty of the industries to cover the environmental implications of the industrial operations. Government and industries should take into consideration environmental responsibilities and follow the laws, rules and regulations for the betterment of environment. Effective and essential environmental management strategies can only be achieved if humans will cultivate practices that will sustain the environment from that which deplete and degrade it. The benefits of environmental responsibility include a decrease in the cost of operations due to improved production yields, decrease in costs associated with employees, minimization of material and energy use, decrease in excess packaging and waste that needs safe disposal. An environmentally responsible company has less regulatory risks and need not to be concerned about non-compliance resulting in production, fines, negative publicity, a subsequent costly public relations campaign. Industries are the key elements that influence other systems. The findings of the present study may prove beneficial to various people concerned with this field. It will be helpful and beneficial to all those individuals who may or may not be aware about the practices those are followed by the industries for community and extent of awareness regarding general environmental conditions and laws, rules & regulations laid by Government. This may prove as a “lighthouse” guiding them through unknown waters and the hidden dangers. The findings will prove to be a boon to the industries and those employees who wish for the betterment of environment. The findings will help in a proper and meticulous planning by the individuals as well as by the industries. The findings of the study will enrich the research data base for the libraries, documentation centers and related institutes at National and International level. The findings of the present study will be helpful to the students to get knowledge about Corporate Responsibilities, Practices carried out by the Chemical and Plastic Industries for Community and awareness of Industries regarding general environmental conditions and Laws, Rules & Regulations laid by Government.
Considering all the above factors this research was designed with the following objectives: 1) To gather the background information of selected
Chemical Industries and Plastic Industries.
2) To find out the practices followed by the managers of the industries to carry out their environmental responsibilities towards the community.
3) To find out the awareness of respondents of the industries
regarding general environmental conditions and laws, rules & regulations laid by the Government.
4) To study the relationship between selected variables.
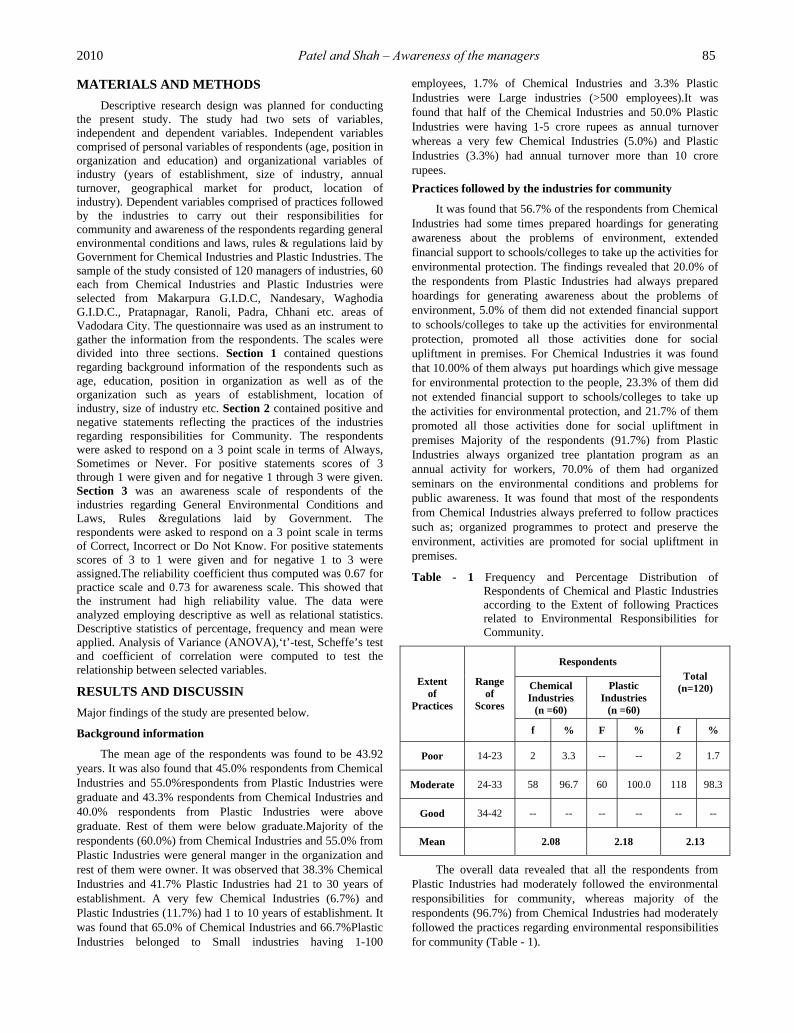
2010 Patel and Shah – Awareness of the managers 85
MATERIALS AND METHODS
Descriptive research design was planned for conducting the present study. The study had two sets of variables, independent and dependent variables. Independent variables comprised of personal variables of respondents (age, position in organization and education) and organizational variables of industry (years of establishment, size of industry, annual turnover, geographical market for product, location of industry). Dependent variables comprised of practices followed by the industries to carry out their responsibilities for community and awareness of the respondents regarding general environmental conditions and laws, rules & regulations laid by Government for Chemical Industries and Plastic Industries. The sample of the study consisted of 120 managers of industries, 60 each from Chemical Industries and Plastic Industries were selected from Makarpura G.I.D.C, Nandesary, Waghodia G.I.D.C., Pratapnagar, Ranoli, Padra, Chhani etc. areas of Vadodara City. The questionnaire was used as an instrument to gather the information from the respondents. The scales were divided into three sections. Section 1 contained questions regarding background information of the respondents such as age, education, position in organization as well as of the organization such as years of establishment, location of industry, size of industry etc. Section 2 contained positive and negative statements reflecting the practices of the industries regarding responsibilities for Community. The respondents were asked to respond on a 3 point scale in terms of Always, Sometimes or Never. For positive statements scores of 3 through 1 were given and for negative 1 through 3 were given. Section 3 was an awareness scale of respondents of the industries regarding General Environmental Conditions and Laws, Rules ®ulations laid by Government. The respondents were asked to respond on a 3 point scale in terms of Correct, Incorrect or Do Not Know. For positive statements scores of 3 to 1 were given and for negative 1 to 3 were assigned.The reliability coefficient thus computed was 0.67 for practice scale and 0.73 for awareness scale. This showed that the instrument had high reliability value. The data were analyzed employing descriptive as well as relational statistics. Descriptive statistics of percentage, frequency and mean were applied. Analysis of Variance (ANOVA),‘t’-test, Scheffe’s test and coefficient of correlation were computed to test the relationship between selected variables. RESULTS AND DISCUSSIN Major findings of the study are presented below. Background information
The mean age of the respondents was found to be 43.92 years. It was also found that 45.0% respondents from Chemical Industries and 55.0%respondents from Plastic Industries were graduate and 43.3% respondents from Chemical Industries and 40.0% respondents from Plastic Industries were above graduate. Rest of them were below graduate.Majority of the respondents (60.0%) from Chemical Industries and 55.0% from Plastic Industries were general manger in the organization and rest of them were owner. It was observed that 38.3% Chemical Industries and 41.7% Plastic Industries had 21 to 30 years of establishment. A very few Chemical Industries (6.7%) and Plastic Industries (11.7%) had 1 to 10 years of establishment. It was found that 65.0% of Chemical Industries and 66.7%Plastic Industries belonged to Small industries having 1-100
employees, 1.7% of Chemical Industries and 3.3% Plastic Industries were Large industries (>500 employees).It was found that half of the Chemical Industries and 50.0% Plastic Industries were having 1-5 crore rupees as annual turnover whereas a very few Chemical Industries (5.0%) and Plastic Industries (3.3%) had annual turnover more than 10 crore rupees.
Practices followed by the industries for community
It was found that 56.7% of the respondents from Chemical Industries had some times prepared hoardings for generating awareness about the problems of environment, extended financial support to schools/colleges to take up the activities for environmental protection. The findings revealed that 20.0% of the respondents from Plastic Industries had always prepared hoardings for generating awareness about the problems of environment, 5.0% of them did not extended financial support to schools/colleges to take up the activities for environmental protection, promoted all those activities done for social upliftment in premises. For Chemical Industries it was found that 10.00% of them always put hoardings which give message for environmental protection to the people, 23.3% of them did not extended financial support to schools/colleges to take up the activities for environmental protection, and 21.7% of them promoted all those activities done for social upliftment in premises Majority of the respondents (91.7%) from Plastic Industries always organized tree plantation program as an annual activity for workers, 70.0% of them had organized seminars on the environmental conditions and problems for public awareness. It was found that most of the respondents from Chemical Industries always preferred to follow practices such as; organized programmes to protect and preserve the environment, activities are promoted for social upliftment in premises.
Table - 1 Frequency and Percentage Distribution of
Respondents of Chemical and Plastic Industries according to the Extent of following Practices related to Environmental Responsibilities for Community.
Respondents
Chemical Industries
(n =60)
Plastic Industries
(n =60)
Total (n=120) Extent
of Practices
Range of
Scores f % F % f %
Poor 14-23 2 3.3 -- -- 2 1.7
Moderate 24-33 58 96.7 60 100.0 118 98.3
Good 34-42 -- -- -- -- -- --
Mean 2.08 2.18 2.13
The overall data revealed that all the respondents from Plastic Industries had moderately followed the environmental responsibilities for community, whereas majority of the respondents (96.7%) from Chemical Industries had moderately followed the practices regarding environmental responsibilities for community (Table - 1).

86 PRAJÑĀ – Journal of Pure and Applied Sciences 18: 83 - 87 December
Awareness of the respondents of Chemical Industries and Plastic Industries regarding the General Environmental Conditions and Laws, Rules & Regulations Laid by Government
This section deals with awareness regarding general environmental conditions and laws, rules & regulations laid by Government. The respondents were asked about the awareness regarding general environmental conditions and laws, rules & regulations laid by Government for environment. The statements asked to respondents about the awareness regarding general environmental conditions and laws; rules & regulations laid by Government for Chemical Industries and Plastic Industries were same. It was found that majority of them from Chemical Industries (93.3%) were aware about water pollution due to house hold waste, 90.0% of the respondents were aware about urbanization is one of the major cause for polluting urban environment, whereas for Plastic Industries, it was found that 93.3% of the respondents were not aware about increasing Green House Effect is resulting in rapid Global warming i.e. rise in temperature of the earth. It was also highlighted that equal number of the respondents (5.0%) from Chemical Industries and Plastic Industries were aware about the high rise buildings have adverse impact on quality of environment, more people living in urban areas are having hearing problems due to noise pollution than people living in rural areas, the temperature of the entire earth is rising. The data revealed that equal percentage of the respondents (3.3%) from Chemical Industries and Plastic Industries were not aware about ozone layer is depleting, recycling of waste is becoming “a must” for the sustainable development of the country. It was observed that respondents from Chemical Industries were highly aware about the general environmental conditions such as, urbanization is one of the major causes of polluting urban environment, ozone layer is depleting, and recycling of waste is becoming “a must” for the sustainable development of the country, whereas for Plastic Industries, respondents were highly aware about the general environmental conditions like, urbanization is one of the major causes of polluting urban environment, increasing deforestation is disturbing ecological balance, water sources near industries are more polluted than those which are away from industries.
From the data, it was found that all the respondents form Chemical Industries (100.0%) had medium extent of awareness regarding general environmental conditions. For Plastic Industries more than half of the respondents (58.3%) had moderate extent of awareness and little less than half of the respondents (41.7%) had high extent of awareness regarding general environmental conditions. None of them had low extent of awareness regarding general environmental conditions. (Table-2)
For the chemical industries it was seen that slightly more
than half of the respondents were aware about the laws, rules & regulations laid by Government such as industry gets area or location where all the waste materials are disposed (63.3%), Consent for the use of any fuel needs to be taken from the Government (51.7%) . For Plastic Industries it was found that mostly all the respondents were aware about Checking of all waste effluents are to be done before disposal (95.0%) whereas for Chemical Industries 75% were aware about checking of all waste effluents are to be done before disposal.
Table - 2 Frequency and Percentage Distribution of Respondents of Chemical Industries and Plastic Industries according to the Extent of Awareness regarding General Environmental Conditions
Respondents
Chemical Industries
(n =60)
Plastic Industries
(n =60)
Total (n=120)
Scores for
Awareness
Range of
Scores
f
%
f
%
f
%
Low extent 46-76 -- -- -- -- -- --
Medium extent 77-107 60 100
.0 35 58.3 95 79.
2 High extent 108-138 -- -- 25 41.
7 25 20.8
Mean 1.78 2.05 1.92
It was also observed that the respondents from Chemical Industries were highly aware about general environmental conditions such as, introduction of technical changes in the production process to minimize the quantity of waste, all changes in disposal methods are done as suggested by government, various wastes are given appropriate treatment by the industry before the disposal, responsibility of industry for enforcement of pollution control measures”.
For Plastic Industries, it was seen that the respondents
were highly aware about general environmental conditions such as, follow up of particular method given by government is important for waste disposal to prevent the effects of pollution” “industry is responsible for the quality and quantity of waste generated”,” consent for the use of any fuel is to be taken from the government” and “government recommends a person who checks all the tools, equipments and machines in the industry”, Table - 3 Frequency and Percentage Distribution of
espondents of Chemical and Plastic Industries according to the Extent of Awareness regarding Laws, Rules & Regulations laid by Government
Respondents
Chemical Industries
(n =60)
Plastic Industries
(n =60)
Total (n=120) Scores
for Awareness
Range of
Scores f % f % f %
Low extent 19-31 -- -- 2 3.3 2 1.7
Medium extent 32-44 41 68.3 58 96.7 99 79.2
High extent 45-57 19 31.7 -- -- 19 15.8
Mean 2.46 2.42 2.44 From the result it was revealed that a high majority
(96.7%) of the respondents from Plastic Industries and 68.3% respondents from Chemical Industries had awareness at medium level. None of the respondents from Chemical Industries had low extent of awareness. (Table - 3) whereas none of the respondents from Plastic Industries had high extent of awareness regarding laws, rules & regulations laid by Government.

2010 Patel and Shah – Awareness of the managers 87
Testing of Hypotheses
The hypotheses for the present investigation were tested using appropriate statistics. The hypotheses formulated were changed to null form and subjected for statistical analysis for which analysis of variance (ANOVA), Scheffe’s test, ‘t’-test and Pearson’s Product Moment Correlation Co-efficient were computed to find out the variance in practices and awareness due to selected personal and organizational variables.
Practices: The ‘F’-test was computed to find out variation for the practices regarding Responsibilities for Community by their education, years of establishment, size of the Industry, annual turnover, geographical market for the product, location of industry and t-test was calculated to find out the difference in the age of the respondents and position of respondents in organization due to their practices. It was revealed that practices regarding Responsibilities for Environment significantly differ by years of establishment at 0.01 level for Plastic Industries. Further Sheffe’s test was applied for finding significant difference in various levels. It is proved that years of establishment of Plastic Industries has an effect on the practices regarding responsibilities for community. The results of Scheffe’s test revealed that the industries having 1-10 years of establishment differed significantly in their practices regarding Responsibilities for community from those who had 21-30 years of establishment.
Awareness: The ‘F’-test was computed to find out variation for the awareness regarding General Environmental Conditions and Laws, Rules & Regulations laid by Government by their education, years of establishment, size of the Industry, annual turnover, geographical market for the product, location of industry and t-test was calculated to find out the difference in the age of the respondents and position of respondents in organization due to their extent of awareness.. However, from findings it was revealed that awareness regarding General Environmental Conditions and Laws, Rules & Regulations laid by Government did not differ by their education, years of establishment, size of the Industry, annual turnover, geographical market for the product and location of industry; further t-test was calculated to find out the difference in the age of the respondents and position of respondents in organization due to the extent of awareness of the respondents.
Correlation: Computation of coefficient of correlation revealed that there is correlation between awareness regarding general environmental conditions and laws, rules & regulations laid by Government for Chemical (r=0.743) and Plastic (r=0.338) Industries respectively at 0.03 level and at 0.01 level.
CONCLUSION
It was concluded from the present study that the industries did not follow the practices regarding environment protection for the community to a great extent so a booklet was developed for industries to give guidelines regarding Corporate Social Responsibilities for environmental protection and sustainable development. It included certain guidelines which can help the industries to improve their practices for environment and society to generate awareness about their responsibilities towards a healthy environment. REFERENCES [1] Shukul, M. 1995 Home makers’ environmentally
concerned awareness, buying and consumption behavior in relation to selected consumer goods, Unpublished Doctoral Thesis, Department of Home Management, Faculty of Home Science, M. S. University of Baroda.Vadodara.
[2] Ajayi, D. and Adesina, D., 2005 Men’s Natural Environment, Ibadan, pp. 139-146. http://www.krepublishers.com/02-Journals/JHE/JHE-23-0-000-000-2008-Web/JHE-23-2-000-000-2008-Abst-PDF/JHE-23-2-101-08-1747-Okafor-E-E/JHE-23-2-101-08-1747-Okafor-E-E-Tt.pdf,
[3] Kannan, Krishnan 1991) “Fundamentals of Environmental pollution”, S. Chand and Company Ltd., New Delhi, pp.3-10.
[4] Mohd Idris, E.S.M. “Environment Crisis and Sustainable Development”, Preface, Bahuguna, S.et.al. (Ed.), (Natraj Publishers), New Delhi, (1992)
[5] Eden, S., “Environmental Issues and Business Implications of Changing Agenda”, John Wiley and Sons, Chickester.http://www.unrisd.org/ 80256B3C005BCCF9/ (httpAuxPages)/499702617578038780256B5E0032615B/$file/perry.pdf (1996)
[6] Mahajan, N. “Living life as inquiry”, (Prakash Publications), New Delhi. (2007)
[7] Levy, D. “Environment management as political sustainability”, Organization and Environment, 10(2), pp.126-147. http://www.unrisd.org/80256B3C005BCCF9 /(httpAuxPages)/499702617578038780256B5E0032615B/$file/perry.pdf (1997)
[8] Holme, R. and Watts, P. “Corporate social responsibility: Making good business sense”.http://www.pollutionprobe. org/Reports/cerreport.pdf (2000)
[9] Jungman, K. “Corporate environmental responsibilities”, London.http://www.frenchsif.org/pdf/prix-FIR/edition 2008/summary-MasterThesis-Jungman.pdf (2007)
[10] Ngwakwe, C. “Environmental Responsibility and Firm Performance: Evidence from Nigeria”, Cape Town. http://www.waset.org/journals/ijhss/v3/v3-2-11.pdf (2008)

ACTIVATED CARBON FROM WASTE BIOMASS OF PSYLLIUM HUSK: EFFECT OF STEAM ACTIVATION ON SURFACE CHARACTERISTICS
S. Manocha*, Ajay J. Chavda, Paramvirsinh D. Punvar and Kalpesh Patel
Department of Materials Science, Sardar Patel University, Vallabh Vidyanagar-388 120, Gujarat
ABSTRACT
Psyllium Husk, commonly known as Sat-Isabgol is a biomass of medicinal value from Plantago ovate plant. Clean Psyllium husk is produced through winnowing process. Khakha powder is generated as a waste material from winnowing process. It is a cellulosic mass and hence can be used as carbon precursor. Khakha powder was pyrolyzed and subjected to steam activation. The carbonization and steam activation were done in N2 atmosphere at 800 0C with different steam flow rate from 0.2 to 0.5 ml/min. The maximum BET surface area was obtained at a steam flow rate 0.3 ml/min. The SEM micrographs showed that with increase in steam flow rate, volume of pores increase and pores were uniformly distributed. It was found that the single step carbonization-activation process produced high surface area and good surface properties than that of two step carbonization and activation process. Key words: activated carbon, carbonization, steam activation, surface area, khakha Powder
INTRODUCTION
Every country worldwide has a large amount of low commercial value, humid (~50% water content) agro forestry residues. Most of these do not find economic utilisation and market. To obtain energy through combustion of these waste materials without pollution is difficult and expensive. However, since these are carbonaceous materials are good source of carbons and activated carbons. With development of several new, efficient, low pollution technologies, the techno-economical viable concept to produce activated carbon from these precursors can be explored. The application of activated carbon mainly depends on the size and distribution of pores.
Activated carbon, a widely used adsorbent, is mainly composed of carbonaceous material with high surface area and porous structure [1]. Raw materials for its production are chosen depending on their price, purity, potential extent of activation and stability of supply [2]. For adsorption from gas phase mainly microporous carbon is used whereas, mesoporous carbon is advantageous for liquid phase application. Numerous studies have been devoted to preparation of low-cost high quality carbon adsorbents for treatment and purification of water, air as well as various chemical and natural products [1, 3]. The raw materials being used are usually carbonaceous materials like wood [4], coal [5], nut shells [6], husks [7] and most agricultural by-products materials [1, 3, 8]. In the present study, Khakha powder, a bio waste obtained through winnowing of Psyllium Husks was used which was derived from the seeds of plant called ‘Plantago ovata’. In India it is known as Sat-ISABGOL and in international market it is known as Ispaghula. The upper layer is called Psyllium Husks. It is cleaned by winnowing system. Psyllium Husk or Sat Isabgol has medicinal value while the powder obtained through winnowing is a waste biomass. Since this is a carbonaceous material, results in porous carbon on pyrolysis under inert atmosphere. Activation of cellulosic derived carbon is carried out to enhance the diameter and volume of the clogged pores which are created during carbonization process and to create some new porosity and readily assessable pore structure and very large internal surface area. The nature of precursor and method of activation, both have strong influence on the pore structure and adsorption capacity of resulting activated carbon.
Apart from the raw materials, the characteristics of activated carbon largely depend on the activation method employed. The physical activation by the action of steam results in the development of porous structure and the extensive internal surface area [3]. Steam is preferred for activation because the water molecule has smaller dimensions than carbon dioxide molecule, and consequently the use of steam leads to:
• Faster diffusion into the porous network; • Easier access into the micropores; • A faster reaction rate, i.e. approximately three times faster
than carbon-carbon dioxide reaction at a temperature of 8000C and a pressure of 10 kPa [9].
In the present work, studies were performed on pyrolysis
of Khakha powder, a waste biomass from winnowing of Psyllium Husk, and activation of the resulting carbon mass. Activation has been carried out in two ways, i.e. single step, carbonization at 800°C followed by steam activation and in two steps, i.e. carbonized samples were stem activated at 800°C. MATERIALS AND METHODS
The activated carbons were prepared by using the commercially available Khakha powder. The powder was dried and pyrolyzed. Activated carbons were prepared by using two different routes. In first method, the weighed amount of raw materials was carbonised at 800°C in a furnace in nitrogen atmosphere for one hour. The char obtained was activated with steam at 800°C with varying flow rate of steam, i.e. 0.3, 0.5 and 1.0 ml/min. In second method, the weighed amount of raw materials was carbonised at 800°C in nitrogen atmosphere. After one hour hold time, the steam was passed with varying flow rates, i.e. 0.3, 0.5 and 1.0 ml/min. This way both carbonization and activation were performed in single step. The activation was carried out with steam. The flow rate of steam was controlled. Characterization
The activated carbon prepared were characterized for
moisture contents of Khakha powder, ash content, carbon content, silica content etc using chemical methods and surface area of the activated carbon using nitrogen adsorption isotherms.
PRAJÑĀ - Journal of Pure and Applied Sciences, Vol. 18: 88 - 91 (2010) ISSN 0975 - 2595
*Corresponding author: [email protected]

2010 Manocha et al. – Activated carbon from waste biomass 89
Moisture Content
The green samples were accurately weighed and kept in oven at 1000C for 24 hour. The % moisture content was calculated using following formula: Carbon Content and Volatile Content
Known amount of samples were taken in silica crucible. The crucibles containing the samples were kept in furnace for carbonization up to 8500C in N2 atmosphere. The % carbon content and % volatile content were calculated using following formula:
Volatile content (%) = 100 -- Carbon content (%) Ash Content and Silica Content
The weighed amount of carbon sample was heated in the furnace at 8000C in air to oxidise the carbon to carbon dioxide, leaving behind inorganic content as ash in the sample.
The ash residue obtained after oxidation was dissolved in HF (Hydrofluoric acid) for overnight to find out the silica content. Surface Characteristics
The surface characteristics i.e., surface area, pore size,
pore size distribution were determined by BET, Micromeritics Gemini-2375 Instruments. The samples were cleaned at 1000C in presence of Ar gas for 1 hour and at 2500C for 12 hours. The N2 adsorption was studied al liquid nitrogen temperature (-1960C). The surface morphology was studied by using HITACHI S - 3000N Scanning Electron Microscope.
The % micro pores were determined with the help of BET
apparatus results and calculated using following formula:
RESULTS AND DISCUSSION
The moisture content in Khakha powder was found to be in the range of 8 - 10 %.
On pyrolysis of Khakha powder (CKP) a wt loss of 65% was observed. The volatile content, carbon content, ash content and silica content in Khakha powder is shown in Fig. 1. The ash content in CKP was 15%, yielding about 12 % carbon content. The result showed that the total inorganic material in CKP is about 23%.
The carbonized CKP was activated with steam at 800°C at varying flow rate of steam. The percentage carbon yield in two step steam activation process (i.e. activation followed by carbonization) at different flow rate of steam is shown in Fig. 2.
On activation, some carbon atoms get oxidised to carbon dioxide and get removed leaving behind highly porous structure. When activation is carried out with steam at high flow rate, bunt off is higher and carbon percentage obtained get reduced. The activation process can also be accelerated by impurities present in the char as such, resulting in a more macroporous carbon. Therefore, as the steam flow rate increases at high temperature, the carbon yield decreases. The surface characteristics of activated carbon were studies by BET method. The nitrogen adsorption isotherms are given in Fig 3.
Though, samples are invariably microporous, these
adsorption isotherms shows very interesting results. Fig. 3 shows that as the steam flow rate is increased from 0.1 to 0.3ml/min, the volume of nitrogen adsorbed is increased and shape of isotherm changes to type I with characteristic H4 hysteresis loop. This is an indication of the start of the development of mesopores in the sample. The adsorption in the macropores is insignificant while the micropores have large internal surface area and contribute significantly to adsorption. Since average micropore area increases due to activation process, adsorption capacity of carbon also gets increased.
On further increase in flow rate from 0.3 to 0.5ml/min, the
oxidation is fast and also diffusion, it appears that inorganic
Moisture content (%) = Weight loss (gm)
Original Weight of green sample (gm)
X 100
Carbon content (%) = Weight after carbonization (gm)
Weight before carbonization (gm) X 100
Ash content % = Weight after oxidation of carbon sample (gm)
Weight before oxidation of carbon sample (gm) X 100
Silica Content % = Weight after HF treatment of carbon sample (gm)
Weight before HF treatment of carbon sample (gm) X 100
% Micro pore = Micro pore area
BET surface area X 100
%
Fig. 1 Constituents of Khakha powder in %
Fig. 2 % carbon yield after steam activation at different steam flow rate of Khakha powder
0.20 0.25 0.30 0.35 0.40 0.45 0.5050
55
60
65
70
75
AKP - Two Step Act
% C
arbo
n yield
Steam flow rate, ml/min

90 PRAJÑĀ – Journal of Pure and Applied Sciences 18: 88 - 91 December
Fig. 3 Nitrogen adsorption isotherm of Activated Khakha powder, (at -1960C)
impurities present act as catalyst and at higher steam flow rate the pores are created and destroyed owing to coalescence and transition of larger pores into small new pores.
Fig. 4 shows the variation in surface area and micropore
area with steam flow rate using single step activation of AKP (activated Khakha powder), the BET surface area i.e. 537.03 m2/g was almost similar than that of two step activation.
Fig. 4 Effect of steam flow rate on BET surface area
The BET surface area and percentage micropore decreases with increase in steam flow rate after 0.3 ml/min as shown in the Fig. 3 and Fig. 4 respectively. This shows that the steam flow rate has direct effect on surface area and micropore area.
Table 1: change in average pore diameter with different steam rate for AKP
The Table 1 shows that average pore diameter lies in the range of 1.9 to 6.4 nm at different steam rate. It clearly shows that with increasing the steam rate i.e. 0.2 to 0.5 ml/min, some of the micropores get converted to mesopores. Because the amount of inorganic matter present in khakha powder is higher this increases the kinetic reactivity of steam. But as the steam rate increases from 0.3 to 0.5 ml/min, more meso pores get converted into micropore because at higher steam rate the pores are created and destroyed owing to coalescence and transition of larger pores in to small new pores.
Fig. 5 Effect of steam flow rate on % micropore.
Fig. 6 Effect of steam flow rate on percentage micropore volume
Fig. 5 and 6 show that as the steam rate increases in activation process, the overall percentage micropores decreases and the micropore volume increases. These results indicate that widening of micropores start on activation and these get converted into mesopores. In other words the microporosity is very sensitive to the change in steam activation rate. From Fig. 4, 5 and 6 it is concluded that the steam flow rate during activation process play an important role in controlling the BET surface area, percentage micropore and micropore volume of activated carbons.
Fig. 7 shows the SEM micrograph of AKP. As seen from
the Fig., the activation process removes the disorganized carbon, exposing the aromatic sheets to activation agents and leads to development of microporous structure.
Act step, Khakha Powder
Steam flow rate, ml/min
Ave. Pore diameter, by BET,
nm
Two step 0.2 2.01
Two step 0.3 6.45
Two step 0.5 1.97
0.0 0.2 0.4 0.6 0.8 1.0
100
200
300
400
500 AKP 0.2 ml/min - Two step AKP 0.3 ml/min - Two step AKP 0.5 ml/min - Two step
Volu
me
Adso
rbed
cm³/g
STP
Relative Pressure (P/Po)
0.20 0.25 0.30 0.35 0.40 0.45 0.5065
70
75
80
85
90
AKP - Two Step Act
% M
icro
por
e
Steam Flow Rate, ml/min
0.20 0.25 0.30 0.35 0.40 0.45 0.50300
350
400
450
500
550
BET surface area(m2/gm) - Two Step Act Micro pores area(m2/gm) - Two Step Act
Steam flow rate, (ml/min)
0.20 0.25 0.30 0.35 0.40 0.45 0.500.13
0.14
0.15
0.16
0.17
0.18
Steam Flow Rate, ml/min
Mic
ropo
re V
olum
e, c
m3 /g
AKP - Two Step Act

2010 Manocha et al. – Activated carbon from waste biomass 91
Fig. 7 SEM image of carbonized and steam activated Khakha powder at (A) 50 μm and (B) 10 μm
With increase in steam flow rate, volume of pores
increases and pores are finely distributed on the surface of activated carbon. The cell structures in both the samples are found to be quite different. There is presence of solid mass within the pores and this solid mass reacts with steam during activation process and acts centre for creation of pores with them. These also contribute to the mesoporosity generation in the samples during activation process.
In the early stage of activation, less than 10 % burn-off
take place. The disordered carbon is removed and the aromatic sheet gets exposed and creates a reaction with the activation agent, leading to the development of microporous structure. The blocked pores formed during the carbonization step are opened in this stage. For the next stage, the reaction widens the existing pores or formation of the large size pores by the complete burnout of the walls between the adjacent pores, leading to the transition of the microporosity to mesoporosity or macroporosity and hence the lowering in the micropore volume and surface area. Although the precise mechanism of the activation process is not fully understood, the major mechanism involved may be viewed as the gasification reaction between carbon atoms contained in the carbonized product and the activating agent. Each carbon atom in the char has different reactivity depending on their arrangement and position. The carbon atom located at the edge and boundary of aromatic sheet or at defect positions and dislocations or discontinuities will have higher reactivity.
CONCLUSION In present studies it is seen that the activation burn off
depends on steam flow rate at same temperature. The activation burn off occurred due to oxidation of carbon by steam. This reaction takes place on the outer surface as well as in the micro-meso surface. The reaction on the surface generated new pores and the reaction inside results in the widening of the size of the pore.
Thus by optimizing the activation conditions such as
temperature, flow rate of steam and type of reaction, sample with controlled surface area and pore size can be produced. In case of AKP, the maximum BET surface area was found about 539.77 m2/g with activation burn off about 38.73 % for two step activation.
Finally it is concluded that for the production of activated carbon from Psyllium Husks derived waste biomass i.e. Khakha powder, the one step activation process is cost affective, less time consuming and mainly energy saving process. It also increases surface properties as compared to multi step activation. REFERENCES [1] Abdel-Nasser A. and Al-Hendawy. (2005) Surface and
adsorptive properties of carbon prepared from biomass. Applied Surface Science, 252: 287-295.
[2] Kim, D. S. (2004) Activated carbon from peach stones using phosphoric acid activation at medium temperatures. J of Environ Sci Health, 5:1301-1318.
[3] Budinova, T., Ekinci, E., Yardin, F., Grimm, A., Bjornbom, E., Kimkova, V. and Goranova, M. (2006) Characterization and application of activated carbon produced by H3PO4 and water vapour activation. Fuel Process Technol, 80: 899-905.
[4] Ahmad, A. L., Loh, M.M. and Aziz, J. A. (2006) Preparation and characterization of activated carbon from oil palm wood and its evaluation on methylene blue adsorption. Dye and Pigments; 20:1-10.
[5] Luzano-Castello, D., Alcaniz-Monge, J., Cazorla-Amoros, D., Linares-Solano, A., Zhu, W., Kapteijn, F. and Moulijn, J. A. (2005) Adsorption properties of carbon molecular sieve prepared from an activated carbon at pitch pyrolysis. Carbon, 43:1643-1651.
[6] Lua, A. C., Yang, T. and Guo, J. (2004) Effects of pyrolysis conditions on the properties of activated carbons prepared from pistachio-nut shells. J Anal. Appl. Pyrolysis, 72: 279-287.
[7] Baquero, M. C., Giraldo, L., Moreno, J. C., Suarez-Garcia, F., Martinez-Alonzo, A. and Tascon, J.M.D. (2003) Activated carbons by pyrolysis of coffee bean husks in presence of phosphoric acid. J Anal. Appl. Pyrolysis, 70: 779-784.
[8] Duran-Valle, C. J., Gomez-Corzo, M., Pastor-Villegas, J. and Gomez-Seranno, V. (2005) Study of cherry stone as raw material in preparation of carbonaceous adsorbents. J Anal. Appl. Pyrolysis, 73: 59-67.
[9] Walker, P.L., Jr. Rusinko, F., Jr and Austin, L.G., (1959) Gas reactions of carbon, Advances in Catalysis, Academic Press, New York, Vol.11: 133-221.
A
B

OXIDATION-REDUCTION OF NATURAL GRAPHITE- A STEP
TOWARDS SYNTHESIS OF GRAPHENE
L. M. Manocha*, Hasmukh Gajera, Vishal Mankadia and S. Manocha
Department of Materials Science, Sardar Patel University, Vallabh Vidyanagar
ABSTRACT
Carbon has been of great scientific and technological interest over all civilizations, mainly because of its application of its own but also in development of products through combinations with other elements. This interest is mainly due to the numerous structures it can be formed of. The latest interests are nanocarbons, mainly carbon nanotubes and graphene. Studies have been performed on wet oxidation of graphite, followed by exfoliation and reduction in order to synthesise graphene. Acid route has been followed for oxidation whereas reduction has been carried out in aqueous medium as well as in DMF. The reactions have been followed using FTIR, TGA and Raman spectroscopy. Reduction of exfoliated graphene oxide sheets in water with hydrazine results in a material with characteristics that are comparable to those of pristine graphite. Key words: carbon, graphite carbon nanomaterials, graphene, graphite oxide.
INTRODUCTION
Carbon occupies very important place in the periodic table. Depending upon its electronic (sp, sp2 or sp3) configuration, it exists in various allotropic forms, amorphous carbons, two dimensional layered graphite or 3D networked
again vary
from m her elements. Therefor commercial intere w forms. The last llerenes and carbon nanotub the so called graphiti bondings are well
ations. All properti ductivities of Graphite p s) are greater than pe operties of the bulk graphite ers (Fig. 1). The bonds b e very strong. However, the d e forces between two laye this, graphite layers can eas eparated from each other to ge ill last decade, these graphen modynamically unstable and h aphene sheets were not explored has generated interest in of single wall carbon nanotub ation of single
two-dimensional material constituting a n layers of carbon atoms arranged in six-member rings. It is distinctly different from carbon nanotubes (CNTs) and fullerenes, and exhibits unique properties which have fascinated the scientific community.
As also shown in Fig. 1, it can be wrapped up into 0D fullerenes, rolled into 1D nanotubes or stacked into 3D graphite [1]. Graphene, promises a diverse range of applications from composite materials to quantum dots [2-4]. Graphene and chemically modified graphene (CMG) are promising candidates as components in applications such as energy-storage materials, ‘paper-like’ materials [8] polymer
composites, liquid crystal devices and mechanical resonators, field-effect transistors (FET), supercapacitor electrode applications [7], hydrogen storage and biomedical applications, due to its excellent properties [3-5]. Ideally graphene is a single-layer material, but graphene samples with two or more layers are being investigated with equal interest. Fig. 1 Schematic of a graphite structure consisting of three graphene
layers, and Graphene: the parent of all graphitic forms, fullerenes, carbon nanotubes and graphene.
Although single-layer graphene and bilayer graphene were
first obtained by micro-mechanical cleavage in 2004 at the Centre for Mesoscopic and Nanotechnology of the University of Manchester, UK, directed by A K Geim [1]. Graphene was initially isolated by mechanical exfoliation, peeling off the top surface of small mesas of pyrolytic graphite [3-5], a method which is not suitable for synthesis of single-layer graphene or of few-layer graphene (FG). Among other methods and procedures for large-scale synthesis, exfoliation of natural
PRAJÑĀ - Journal of Pure and Applied Sciences, Vol. 18: 92 – 97 (2010) ISSN 0975 - 2595
diamond. All these forms posses distinct properties andapplications, industrial to high tech. Applications
onolithic to composites products with ote, there has been both scientific as well as
st in this material as well as exploring ne two decades discoveries have been the Fu
es. Of all these, the planar orc structures with predominantly sp2
studied and also find many practical applices, mechanical, thermal and electrical con
arallel to the sheets (graphene sheetrpendicular to the sheets. However, the pr
are marked by the stacking of the layetween atoms within a layer ar
elocalized ¼ orbitals make thrs of graphite very weak. Because of
ily be shifted against each other or st individual graphene sheets. T
e layers were thought to be therence getting individual gr
. However, the current nanotechnologycarbon nanomaterials. The existence
es evolved interest in explorgraphene sheets. Graphene is
ew nanocarbon comprising
*Corresponding author: [email protected]

2010 Manocha et al. – Oxidation-reduction of natural graphite 93
graphite is the most convenient technique. The natural graphite could be as such or that containing any oxygen functionalities. Latter involves the exfoliation of graphite oxide (GO) followed by reduction. Several methods have been described in the literature for preparation of oxidized graphite or so called graphite oxide [6] Graphene and Chemical modification of graphene oxide, which is generated from graphite oxide (GO) has been a promising route to achieve mass production of CMG platelets [7,8]. Though GO has a history that extends back many decades to some of the earliest studies involving the chemistry of graphite, the interest in oxidation of graphite and its reduction is regenerated due its versatility in production of graphene in large scale at comparatively low price. Present studies were performed to evolve methods wherein the natural graphite flakes have been chemically treated followed exfoliation to yield grapheme [7,9]. All these studies have been followed using spectroscopic techniques and thermal analysis. MATERIALS AND METHODS
Materials The natural graphite flakes (particle size – 400 um) was
used as the starting material for preparation of graphene. For this process other chemical reagents used were sulfuric acid (H2SO4) (Ranbaxy fine chemical), Potassium persulphate (K2S2O8) (Loba chemicals) Phosphorus pentoxide (P2O5) (Sigma – Aldrich,), Potassium Permanganate (KMnO4) (Samir Tech chem.), Hydrogen peroxide (H2O2) (RFCL), Acetone (Qualingens fine chem), Dimethyl Formamide (DMF) (Qualingens), Hydrazine Hydrate (H6N2O) (RFCL). Synthesis of Graphene
The preparation of graphene involves three key steps. a) Oxidation of starting material (Graphite flakes) to
synthesize Graphite Oxide (GO). b) Thermal expansion or Exfoliation of the as – prepared
Go to obtain TEGO/EGO. c) Reduction and dispersion of resulting EGO to produced
graphene. Synthesis of graphite Oxide (GO)
The employed method consists of two steps. (i) Pre
Oxidation of Graphite, (ii) Oxidation of POG (Pre – Oxidized Graphite).
Sulfuric acid (H2SO4), potassium pursulphate (K2S2O8)
and phosphorus pantoxide (H2O5) were mixed and stirred at room temperature till clear solution was obtained. In this mixture K2S2O8 and P2O5 were added slowly and stirred till clear solution was obtained, Graphite flakes were added slowly in this mixture. After this addition, mixture was stirred for 4 – 5 hrs at 80oC. After stirring for 4 – 5 hrs, dilution of this solution was carried out. For this process distilled water was slowly added to above solution keeping temperature below 10oC. Reaction flask was immersed in ice bath for dissipation of heat in exothermic reaction that occurred during addition of water. Finally, the resulting suspension was filtered and washed with distilled water up to neutral pH and dried it in oven at 100oC for 1 – 1.5 h to obtain Pre – Oxidized Graphite (POG). Oxidation of POG
Sulfuric acid and potassium permanganate were mixed and stirred at a 10oC for half an hour. Pre – Oxidized Graphite (POG) was added slowly and stirred for 1 hour in ice bath followed by stirring at room temperature for 24 h. Distilled
water was added to the solution. Reaction flask was immersed in ice bath to control the temperature below 10o C. An exothermic reaction occurred during addition of water. This solution was treated with H2O2 to reduce residual permanganate to soluble manganese ions. The solution became bright yellow colored after reduction. After this process, this suspended solution was washed with distilled water by centrifugation decantation till neutral pH obtained. Finally the resulting suspension Graphite Oxide slurry (GO) was obtained. Exfoliation of Graphite Oxide
The as prepared GO was exfoliated using ultrasonication
method to synthesize Exfoliated Graphite Oxide (EGO) or Graphene Oxide.
Thermal Expansion of Graphite Oxide
The Graphite oxide was thermally expanded to form TEGO by rapidly heating it in a furnace shown in Fig. 2. The nitrogen gas was flushed in the quartz tube containing graphite oxide which was then rapidly moved in to the middle heating zone of the furnace already heated to 220o C.
Fig. 2 Experimental setup for synthesis of TEGO Reduction and Dispersion of Graphene Oxide
Reduction of Graphene Oxide in Water
In typical procedure GO slurry was loaded in a round
bottom flask to which was added distilled water yielding an inhomogeneous yellow solution. This solution was sonicated by using ultrasonic bath cleaner until it became clear without any visible particulate matter in solution (45 min – 1 h). To obtain homogeneous dispersion of exfoliated graphite oxide (Graphene Oxide) in water Hydrazine Hydrate was added to this solution and solution was heated at 100oC in paraffin bath for 24 h. The reduced GO (r - GO) gradually precipitated out as a black solid on the surface. This product was isolated by filtration over a medium fritted glass funnel. It was washed with distilled water (10 × 150 ml) up to neutral pH and dried at 100oC in oven for 3 h. Reduction of GO in DMF
In this experiment, Graphite Oxide (30 mg) was loaded in
reaction flask containing 10 ml water. This solution was sonicated for 1 h to obtained homogeneous dispersion of exfoliated GO (Graphene Oxide). Addition of Dimethyl Formamide (DMF, 90 ml, volume ratio DMF/H2O = 9) yielded the light – brown suspension of graphene oxide (EGO). The suspension was quite stable. To the graphite Oxide suspension,

94 PRAJÑĀ – Journal of Pure and Applied Sciences 18: 92 - 97 December
Hydrazine Hydrate was added and stirring was done on magnetic stirrer by using Teflon coated magnetic bar for 12 h at 80oC. Finally, the reduced graphene oxide was obtained as black colloidal suspension in Dimethyl Formamide (DMF). Characterization of GO and r–GO
Electrical Conductivity measurement of GO and r – GO
The electrical conductivity of graphite flakes, Graphite Oxide, Reduced Graphite oxide was measured by Keithley – 6182 AC/DC current source – Nanovoltmeter (Fig. 3). In this experiment samples were used in powder form.
Fig. 3 Sample holder and set up for measurement of electrical conductivity
Thermogravimetric study
Thermogravimetric analysis (TGA) is performed on samples to follow oxidation reaction, to determine the extent of oxidation of graphite, reduction process etc. TGA was done from room temperature to 800oC at a heating rate of 5oC per min.
Fourier Transform Infrared Spectroscopy (FT – IR) Study
SHIMDZU 8300 FTIR spectrometer was used to study the type of chemical groups present in GO and r-GO.
Surface area measurement
The surface characterization, e. g. surface area, pore size, pore size distribution were determined by using BET apparatus 2375 Gimini Micromeritics. The nitrogen gas adsorption measurement was carried out at liquid nitrogen temperature.
Raman spectroscopic study
Raman scattering is a fast and non destructive technique
that provides a direct insight on the electron – phonon interactions, which implies a high sensitivity to electronic and crystallographic structures. It has been extensively applied to the structural investigation of carbon materials such as carbon nanotubes and graphene. Raman spectra of graphite and its compounds were taken on Renishaw Raman microscope using 514 laser as excitation source.
RESULTS AND DISCUSSION Exfoliation of GO in water
Exfoliation of GO in water showed the hydrophilic nature
of the oxygenated graphene layers and its easy exfoliation in aqueous media. As a result, GO readily formed stable colloidal
suspensions in water. These sheets are, however, different from graphitic nanoplatelets or pristine graphene sheets due to their low electrical conductivity. Moreover, the resulting sheets, by TEM analysis, were found to be about 1 nm thick leading to a conclusion that complete exfoliation of GO to individual graphene oxide sheets was achieved under these conditions. These are different than pure graphene sheets which are smaller in thickness. Graphene oxide sheets are expected to be ‘thicker’ due to the presence of covalently bound oxygen and the displacement of the sp3 hybridized carbon atoms slightly above and below the original graphene plane. Reduction of exfoliated GO
During the hydrazine reduction of graphene oxide sheets
dispersed in water, the brown-colored dispersion turned black and the reduced sheets aggregate and eventually precipitate. The precipitation of the reduced sheets occurred, presumably due to their becoming less hydrophilic as a result of oxygen removal and thus increased incompatibility with the aqueous medium. As dissolution of the reduced sheets decreases, the inter-sheet hydrophobic interactions cause them to aggregate as well as adhere to the hydrophobic surface. The main purpose of reduction of EGO was to obtain graphene from the graphene oxide. Hydrazine is known to open epoxide rings readily and to form hydrazino alcohols. Though, such a reaction pathway is possible in GO upon hydrazine treatment, there are other complementary reactions resulting in oxygen removal. It is possible, however, that the initial derivative produced by the epoxide opening with hydrazine reacts further via the formation of an aminoaziridine moiety which would then undergo thermal elimination of diimide to form a double bond. Such a reaction might be further driven in GO by re-establishment of the conjugated graphene network.
Electrical conductivity studies of as such graphite, GO and r – GO
To determine the extent to which the chemical reduction
of exfoliated GO restores the electrical properties of the graphitic network, the measurement of electrical conductivity of compressed-powder samples of the pristine graphite, GO, and the reduced GO at room-temperature were made. In this study samples were used in the powder form. The electrical conductivity was found to decrease after oxidation but an increase in the conductivity was found after reduction. The conductivity of the r–GO was more than that of the GO because of the restoration of the sp2 network of the graphitic plane by reduction of GO. The value of the electrical conductivity of the graphite flake, GO and r – GO are 0.6713 Ω-1 m-1, 0.0040 Ω-1 m-1 and 0.0245 Ω-1 m-1 respectively. Raman spectroscopic study
A typical Raman spectrum of Graphite flakes, Pre –
Oxidized Graphite and Graphite Oxide is shown in Fig. 3. The significant structural changes occurring during the chemical processing from pristine graphite to GO, and then to the reduced GO, are also reflected in their Raman spectra. The Raman spectrum of the pristine graphite, as expected, displays a prominent G peak as the feature at 1584 cm-1 and at 2656 cm-1, historically named G’, since it is the second most prominent peak always observed in graphite samples. In the Raman spectrum of GO, the G band is broadened and is found to be shifted to 1604.8 cm-1. In addition, the D band at 1373.28 cm-1 becomes prominent, indicating the reduction in size of the in-plane sp2 domains, possibly due to the extensive oxidation. The Raman spectrum of the Pre – Oxidized Graphite (POG) also contains both G and D bands at 1584 and 1317 cm-1 respectively with an increased D/G intensity ratio in GO compared to that in the POG spectrum. This change suggests a decrease in the average size of the sp2 domains in GO.

2010 Manocha et al. – Oxidation-reduction of natural graphite 95
Fig. 3a
Fig. 3b TGA studies of GO and r – GO
GO is thermally unstable and starts to loose mass upon
heating even below 100o C, the major mass loss occurs at near 220o C, presumably due to pyrolysis of the labile oxygen-containing functional groups, yielding CO, CO2, as seen in Fig. 4. Hence, the thermal decomposition of GO can be accompanied by a vigorous release of gas, resulting in a rapid thermal expansion of the material. This is evident by both large volume expansion and a larger mass loss (from flying GO debris in the TGA instrument) during a more rapid heating regime.
Fig. 3c
Fig. 3 (a, b, c) Raman spectrum of (a) Graphite (b) Pre-oxide Graphite (PGO) and (c) Graphite oxide (GO).
Fig. 4 (a).TGA spectrum of Pre - Oxidized Graphite (POG)
Fig. 4 (b) TGA spectrum of Graphite Oxide (GO) On the other hand, the removal of the thermally labile
oxygen functional groups by chemical reduction results in much increased thermal stability for the reduced GO. Apart from a slight mass loss below 100o C, which can be attributed to the loss of adsorbed water, no significant mass loss is detected when this material is heated up to 600o C. TGA curve of Pre – Oxidized Graphite and graphene oxide exhibits peak at 230o C, which correspond to 10% and 30 % weight losses respectively. These peaks are attributed to the removal of oxygen containing groups (second peak). But in case of the r – GO, there was very small peak observed at 220oC because of the removal of oxygen containing groups from the Graphene oxide layer. It means that during the reduction of Graphene Oxide large amount of oxygen containing functional groups are removed, but there were some groups still present on graphene oxide plane.
FT – IR Study of GO and r – GO
An additional tool for the characterization of graphene oxide is FTIR spectroscopy. Fig. 5 shows FTIR spectra of graphite, GO and r-GO. Graphene oxide exhibits the following characteristic IR features. Strong band observed at ~ 3440 cm-1 attributed to the hydroxyl stretching vibrations of the C-OH groups, doublet near ~2925 cm -1 and ~2855 cm -1attributed to the CH2 or CH3 groups, a weak peak in between 1610 - 1627 cm-1 assigned to the C=O stretching vibrations of the-COOH groups, a weak peak at 1396 cm-1 assigned to the O-H deformations of the C-OH groups, and a strong band at 1050 - 1095 cm-1 attributed to C-O stretching vibrations. FT – IR

96 PRAJÑĀ – Journal of Pure and Applied Sciences 18: 92 - 97 December
Fig. 4 (c) TGA spectrum of reduced Graphite Oxide (r - GO) spectrums of Graphite flakes, POG, GO, r – GO at room temperature and r – GO heated at 100o C as shown in below figures respectively. Fig. 5 shows FTIR spectra of graphite, GO, POG and r-GO. The FTIR spectra of POG and GO show band corresponding to C=O stretching vibration of the –COOH group stronger than for graphite because of the oxidation reaction of graphite which generate acidic functional groups. The –OH band of POG and GO sample are also stronger and broader than for the GF sample and a weak band at 1396 cm-1 assigned to the O-H deformations of the C-OH groups was observed in POG and GO sample. In case of reduced graphene oxide, a weak shoulder at 3430 - 3440 cm-1 attributed to the hydroxyl stretching vibrations of the C-OH groups was absent and a weak band at 1396 cm-1 assigned to the O-H deformations of the C-OH groups was also absent. A weak band at 1610 - 1627 cm-1 assigned to the C=O stretching vibrations of the-COOH groups disappeared in the r–GO spectrum. Absence of these groups in r–GO sample are because reduction reaction between hydrazine hydrate and graphene oxide so that these groups get removed from the graphene oxide. But after reduction some new functional groups were attached to the graphene plane such as –NH2 groups at 1541 cm -1 and -C=N group at 1681.8 cm -1.
Fig. 5a Surface area study
Surface area measurement of the reduced GO sheets and exfoliated GO sheets via nitrogen gas absorption yielded a surface area value of 382 m2/g, 466 m2/g respectively. This high specific surface area is partially an indication of the degree of GO exfoliation. However, it is still lower than the theoretical specific surface area for completely exfoliated and isolated
Fig. 5b (POG)
Fig. 5c
Fig. 5d Fig. 5 FT - IR spectrum of (a) graphite, (b) POG, (c) GO and (d) r-GO
graphene sheets (2,620 m2/g), But after reduction of Graphene oxide the surface area of that r – Go was 415 m2/g this is due to the agglomeration of the graphene oxide sheets upon reduction.While this agglomeration can result in the partial overlapping and coalescing of the reduced sheets and lowering the surface area of the bulk materials, the crumpled 3-dimensional structure of the sheets still leaves many exposed surfaces. CONCLUSION
The graphene sheets have been synthesized by a fast method through oxidation-reduction technique using graphite flakes as a starting material.

2010 Manocha et al. – Oxidation-reduction of natural graphite 97
Reduction of exfoliated graphene oxide sheets in water with hydrazine results in a material with characteristics that are comparable to those of pristine graphite.
The characterization of the reduced GO indicates that the
hydrazine treatment results in the formation of unsaturated and conjugated carbon atoms, which in turn imparts electrical conductivity.
As such, reduced graphene oxide sheets may find use in a
variety of applications such as hydrogen storage and as an electrically conductive filler material in composites. REFERENCES [1] Geim, A. K. and Donald, A. H. (2007) Graphene:
Exploring carbon flatland. Phys. Today, 60: 35-41 [2] Geim, A. K. and Novoselov, K. S. (2007) The rise of
Graphene. Nature Mater., 6: 183-191 [3] Stankovich, S., Dikin, D. A., Dommett, G. H. B.,
Kohlhaas, K. M., Zimney, E. J., Piner, R. D., Nguyen, S. T. and Ruoff, R. S. (2006) Graphene-based composite materials. Nature, 442: 282-286
[4] Novoselov, K. S., Jiang, Z., Zhang, Y., Morozov, S. V., Stormer, H. L., Zeitler, U., Maan, J. C., Boebinger, G. S., Kim, P. and Geim, A. K. (2007) Room temperature quantum hall effect in graphene. Science, 315: 1379-1379
[5] Park, S., and Rouff, R. S. (2009) Chemical methods for the production of graphenes. Nature Nanotech., 4: 217-224
[6] Ponomarenko, L. A., Schedin, F., Katsnelson, M. I., Yang, R., Hill, E. W., Novoselov,K. S. and Geim, A. K. (2008) Chaotic Dirac billiard in graphene quantum dots. Science, 320: 356-358
[7] Stoller, M. D., Park, S., Zhu, Y., An, J. and Rouff, R. S. (2008) Graphene-based ultra capacitors. Nano Lett., 8: 3498-3502
[8] Park, S., Lee, K. S., Bozoklu, G., Cai, W., SonBinh, T. N. and Ruoff, R. S. (2008) Graphene oxide papers modified by divalent ions enhancing mechanical properties via chemical cross-linking. ACS Nano, 2: 572-578
[9] Ramanathan, T., Abdala, A. A., Stankovich, S., Dikin, D. A., Herrera-Alonso, M., Piner, R. D., Adamson, D. H., Schniepp, H. C., Chen, X., Ruoff, R. S., Nguyen, S. T., Aksay, I. A., Prud'Homme, R. K. and Brinson, L. C. (2008) Functionalized graphene sheets for polymer nanocomposites. Nature Nanotech., 3: 327-331

PRAJÑĀ - Journal of Pure and Applied Sciences, Vol. 18: 98 – 101 (2010) ISSN 0975 - 2595
DEVELOPMENT OF RETICULATED CARBON FOAM: AN ATTRACTIVE MATERIAL
Satish M. Manocha* and Kalpesh Patel
Department of Materials Science, Sardar Patel University, Vallabh Vidyanagar – 388 120
ABSTRACT
Reticulated vitreous carbon foams are an open pore foam material composed solely of vitreous carbon having highly interconnected porosity. Carbon foams were synthesized using commercially available polymeric foams as templates and thermosetting phenolic resin as carbon source in the present work. The preforms were fabricated by impregnated polymeric foam with resin followed by carbonization at different temperatures up to 1400 0C in inert atmosphere to form carbon foam. The changes in density and porosity of carbon foam were determined. Surface morphological studies were carried out using SEM (Scanning electron microscope) which showed that the pores were uniformly distributed and highly interconnected throughout the structure. At 1400 0C, the foams retained their compactness and the compressive strength of the carbon foam was 0.23 MPa and it was found that the compressive strength and Modulus of carbon foam increases with ncrease in heat treatment temperature. i Key words: compressive strength, porosity, reticulated carbon foam, resin, template. INTRODUCTION
Various types of ultra-lightweight porous carbons have been reported in the literature including xerogels [1] to aerogels [2] and carbon foams [3]. Carbon foams have attracted great attention recently because of their light weight and tailorability of their physical properties over a wide range of applications [4–7]. The type of carbon foams depend on the raw material (precursor) used and the manufacturing process employed. The major categories are: reticulated vitreous carbon foam (RVC), graphitic carbon foam and non-graphitic carbon foam. Reticulated carbon foam consists of interconnected voids surrounded by a web of carbon struts.
The attractive applications of carbon foams involve thermal managements, electrodes, catalyst supports and filters owning to their novel features such as adjustable thermal-conductivity and electrical conductivity, high porosity, low thermal expansion Coefficient, high-temperature tolerance, etc. [7–9]. Carbon foams also find their way to act as Radar absorbing materials, mainly due to their well matched impedance, high durability, light-weight, and effective EM wave absorbing capability [10]. Due to the larger pore sizes as well as fully open pore structure, the permeability is usually high in reticulated carbon foams.
One of the current interests in carbon foam applications is
in the Power Technology, wherein a battery is comprised of electrical current collectors composed of reticulated vitreous carbon covered with a thin layer of a lead tin alloy. The current collectors create up to four times higher surface area for electrochemical reactions to take place compared to those in a typical lead acid battery, resulting in a battery with higher efficiency and higher capacity meaning more electricity generation [11]. Moreover, the carbon foam can be shaped according to the requirement. The machinability of carbon foam is also convenient. These can be tailored to have low or high thermal conductivity with a low CTE and density. These foams have high modulus but low compression and tensile strength. Foams of C, Si, and SiC are being investigated by various commercial organizations [12,13] for similar applications at higher temperatures.
Carbon foams were first obtained in the late 1960s as reticulated vitreous carbon foams [14]. RVC is synthesized by
carbonizing precursor foam which is impregnated by a thermosetting resin. Open cell polyurethane foams are commonly used as precursors. Open cell foams are those in which the foam lamellae separating neighbouring cells are all ruptured, resulting in a structure comprising a network of struts with continuous air passages. The impregnating resins used are generally phenolic resins, epoxy resins or furfuryl alcohol. The carbonization rate of furfuryl alcohol impregnated polyurethane foams could be higher than that for foams infused with phenolic and epoxy resins [15]. In the present work carbon foam has been synthesized by template route. Open cell polyurethane foams were used as precursors or templates and
henolic resins as carbon source. p MATERIALS AND METHODS
The overview of the template route for making carbon foam is shows in Fig. 1. The cleaned PU foams were impregnated with phenolic resin. Impregnated PU foams were cured at 150 oC and were heat treated in inert atmosphere at different temperature up to 1400oC to study the pyrolysis behaviour of foam. Up to 1000oC the foams were heat treated in N2 atmosphere at slow heating rate 25oC/hr and those up to 1400oC were heat treated in Argon atmosphere.
Fig. 1: Overview of the preparation method
The synthesized carbon foams were characterized for different properties like the change in density and the percentage porosity (by kerosene porosity). The compressive strength and modulus of carbon foam were measured by
*Corresponding author: [email protected]
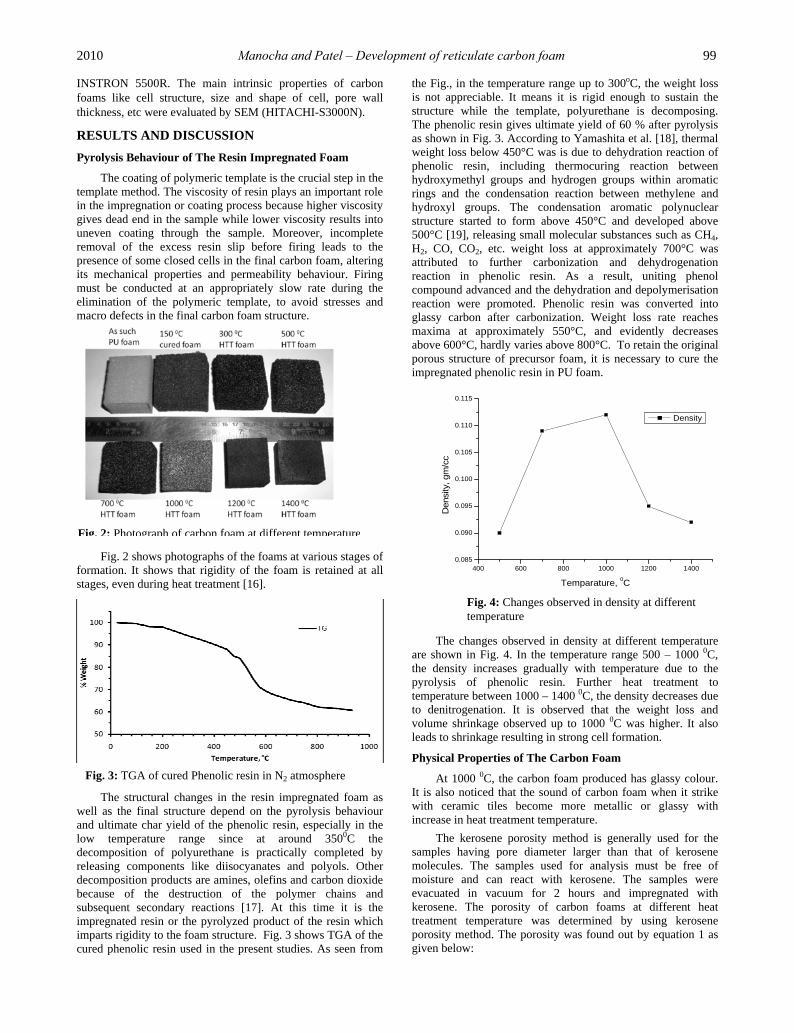
2010 Manocha and Patel – Development of reticulate carbon foam 99
INSTRON 5500R. The main intrinsic properties of carbon foams like cell structure, size and shape of cell, pore wall hickness, etc were evaluated by SEM (HITACHI-S3000N). t
R
ESULTS AND DISCUSSION Pyrolysis Behaviour of The Resin Impregnated Foam
The coating of polymeric template is the crucial step in the
template method. The viscosity of resin plays an important role in the impregnation or coating process because higher viscosity gives dead end in the sample while lower viscosity results into uneven coating through the sample. Moreover, incomplete removal of the excess resin slip before firing leads to the presence of some closed cells in the final carbon foam, altering its mechanical properties and permeability behaviour. Firing must be conducted at an appropriately slow rate during the elimination of the polymeric template, to avoid stresses and macro defects in the final carbon foam structure.
Fig. 2 shows photographs of the foams at various stages of formation. It shows that rigidity of the foam is retained at all stages, even during heat treatment [16].
The structural changes in the resin impregnated foam as
well as the final structure depend on the pyrolysis behaviour and ultimate char yield of the phenolic resin, especially in the low temperature range since at around 3500C the decomposition of polyurethane is practically completed by releasing components like diisocyanates and polyols. Other decomposition products are amines, olefins and carbon dioxide because of the destruction of the polymer chains and subsequent secondary reactions [17]. At this time it is the impregnated resin or the pyrolyzed product of the resin which imparts rigidity to the foam structure. Fig. 3 shows TGA of the cured phenolic resin used in the present studies. As seen from
the Fig., in the temperature range up to 300oC, the weight loss is not appreciable. It means it is rigid enough to sustain the structure while the template, polyurethane is decomposing. The phenolic resin gives ultimate yield of 60 % after pyrolysis as shown in Fig. 3. According to Yamashita et al. [18], thermal weight loss below 450°C was is due to dehydration reaction of phenolic resin, including thermocuring reaction between hydroxymethyl groups and hydrogen groups within aromatic rings and the condensation reaction between methylene and hydroxyl groups. The condensation aromatic polynuclear structure started to form above 450°C and developed above 500°C [19], releasing small molecular substances such as CH , H , CO, CO , etc. weight loss at approximately 700°C was attributed to further carbonization and dehydrogenation reaction in phenolic resin. As a result, uniting phenol compound advanced and the dehydration and depolymerisation reaction were promoted. Phenolic resin was converted into glassy carbon after carbonization. Weight loss rate reaches maxima at approximately 550°C, and evidently decreases above 600°C, hardly varies above 800°C. To retain the original porous structure of precursor foam, it is necessary to cure the impregnated phenolic resin in PU foam.
4
2 2
Fig. 2: Photograph of carbon foam at different temperature
400 600 800 1000 1200 14000.085
0.090
0.095
0.100
0.105
0.110
0.115
Density
Den
sity
, gm
/cc
Temparature, 0C
Fig. 4: Changes observed in density at different temperature
Fig. 3: TGA of cured Phenolic resin in N2 atmosphere
The changes observed in density at different temperature are shown in Fig. 4. In the temperature range 500 – 1000 0C, the density increases gradually with temperature due to the pyrolysis of phenolic resin. Further heat treatment to temperature between 1000 – 1400 0C, the density decreases due to denitrogenation. It is observed that the weight loss and volume shrinkage observed up to 1000 0C was higher. It also eads to shrinkage resulting in strong cell formation. l
P
hysical Properties of The Carbon Foam
At 1000 0C, the carbon foam produced has glassy colour. It is also noticed that the sound of carbon foam when it strike with ceramic tiles become more metallic or glassy with increase in heat treatment temperature.
The kerosene porosity method is generally used for the
samples having pore diameter larger than that of kerosene molecules. The samples used for analysis must be free of moisture and can react with kerosene. The samples were evacuated in vacuum for 2 hours and impregnated with kerosene. The porosity of carbon foams at different heat treatment temperature was determined by using kerosene porosity method. The porosity was found out by equation 1 as given below:

100 PRAJÑĀ – Journal of Pure and Applied Sciences 18: 98 - 101 December
(1)
Table 1: Kerosene porosity of carbon foam at different temperature
Heat treatment temp, 0C Kerosene porosity, %
150 86.26 300 78.15 500 78.08 700 76.03 1000 75.73 1200 72.32 1400 70.57
As shown in Table 1, the porosity of carbon foam
decreases as the heat treatment temperature increases because with increase in temperature the entire foam structure gets shrunk and some of the pores may get blocked with vitreous carbon.
In most solid, rigid foams, whether they are made of
carbon or not, the compressive stress-strain curves show a linear elastic region, followed by a stress plateau region [20, 21]. The present carbon foam presents a brittle failure mode undergoing successive cell wall fractures. The compressive strength and modulus of the foam heat treated at different temperature is given in Fig. 5:
Fig. 5: compressive strength of carbon foam
As shown in Fig. 5, the compressive strength and modulus of carbon foam increases with increase in heat treatment temperature due to more shrinkage resulting in strong cell formation and blocking of some pores. The compressive strength increases with relative density. The strength of carbon foam mainly depends on the type of porosity, open cell to close cell ratio, size and shape of pore, cell wall thickness, length of individual struts, area of pore junction and interconnected network of porous structure. In addition, the strength of carbon foam is also related to the properties of the precursor material, such as the viscosity of resin. However, heating rate is also an important parameter because during heating, the expansion and gas evolution of the polymer lead to significant stresses that can damage the carbon foam surface if not carefully controlled, eading to carbon struts containing macroscopic flaws. l
Weight absorbed Kerosene S
urface Morphology of the Carbon Foam % Kerosene porosity = X 100
Density of Kerosene X Volume of sample The surface morphology of carbon foam is also studied with the scanning electron microscope (SEM). Fig. 6 shows that the pores are uniformly distributed throughout the structure. It indeed shows the open cell and well organized cell structure without any cracks and defects. The pore wall thickness varies between 50 µm to 85 µm. SEM image shows that the foam cell size varies from approximately 200 µm to 500 µm. As shown in Fig. 6 (A), the pores are broken during sample preparation or machining. It also shows that all the open cell pores are highly interconnected with very less closed cell pore. The closed pores are formed in the structure due to excess resin present in foam during impregnation process.
A B
Fig 6: SEM images of carbon foam (A) and (B) shows uniform
distribution of porosity, (C) and (D) pore wall or pore boundary
It is clearly seen that the surface of carbon foam cells are
not porous. The foam cell size is relatively uniform throughout he structure. t
CONCLUSION
Reticulated vitreous carbon foams having high interconnected porosity has been synthesized by carbonizing the open cell polyurethane foams infused with phenolic resin. The pore size and total porosity of carbon foam can be controlled by using appropriate processing conditions.
ACKNOWLEDGEMENT
The authors wish to thank UGC for the financial assistance provided under Major Research Project and Research fellowship to Mr. Kalpesh Patel. Also, authors are thankful to Sophisticated Instrumentation Centre for Applied and Research Testing (SICART, Vallabh vidyanagar – 388120,
ujarat, India) for providing testing facilities. G R
EFERENCES [1] Job, N., Pirard, R., Marien, J. and Pirard, J. P. (2004)
Porous carbon xerogels with texture tailored by pH control during sol-gel process. Carbon, 42: 619-628.
[2] Biesmans, G., Mertens, A., Duffours, L., Woignier, T. and Phalippou, J. (1998) Polyurethane based organic aerogels and their transformation into carbon aerogels. J Non-Cryst Solids, 22: 564-568.
[3] Chen, C., Kennel, E. B., Stiller, A. H., Stansberry, P. G. and Zondlo, JW. (2006) Carbon foams derived from various precursors, Carbon, 44: 1535-1543.
[4] Wang, X., Zhong, J., Wang, Y., and Yu, M. (2006) A study of the properties of carbon foam reinforced by clay. Carbon, 44(8): 1560–1564.
400 600 800 1000 1200 14000.03
0.06
0.09
0.12
0.15
0.18
0.21
0.24 Comp Strength
HTT Temperature, 0C
Com
pres
sive
stre
ngth
, MPa
0
10
20
30
40
50
Comp Modulus Com
pressive modulus, M
Pa
C D

2010 Manocha and Patel – Development of reticulate carbon foam 101
[5] Mehta, R., Anderson, D. P. and Hager, J. W. (2003); Graphitic open-celled carbon foams: processing and characterization. Carbon, 41(11): 2174–2176.
[6] Mattis, D. C. (2005) Theory of ferromagnetism in carbon foam. Phys Rev B: Condens Matter Mater Phys, 71(14): 144424/1–4/5.
[7] Klett, J. W., Hardy, R., Romine, E., Walls, C. and Burchell, T. (2000) High-thermal conductivity, mesophase-pitch-derived carbon foams: effect of precursor on structure and properties. Carbon, 38(7): 953–973.
[8] Yang J, Shen Z, Xue R. and Hao Z. (2005) Study of mesophase-pitch-based graphite foam used as anodic materials in lithium ion rechargeable batteries. J Mater Sci, 40(5): 1285–1287.
[9] Klett, J. W. (2000) Process for making carbon foam. US Patent 6033506.
[10] Yang, J., Shen, Z. M. and Hao, Z. B. (2004) Microwave characteristics of sandwich composites with mesophase carbon foams as core. Carbon, 42(8–9):1882–1885.
[11] Jung, J. (2006) Improved Lead Acid Bettries, Power Technology, Inc., Houston, TX, (OTCBB: PWTC.OB, Sept. 21.
[12] Drew, M., Spradling, R. and Andrew Guch. (2003) Touchstone Research Laboratory, Triadelphia, West Virginia, Advanced Materials abd Processes, November.
[13] Matson, L. (2003) CTE Tailored Materials for Hybrid Mirror Systems, Sept. 17, AFRL/MLLN.
[14] Ford, W. (1964) Method of making cellular refractory insulating material. US Patent 3121050.
[15] Friedrich, J. M., Ponce-de-Leon, C., Reade, G. W. and Walsh, F. C. (2004) Reticulated vitreous carbon as an electrode material. J Elec Analy Chem, 561: 203–217.
[16] Manocha, S. M., Patel, K. A. and Manocha, L. M. (2010) Development of carbon foam from phenolic resin via template route, Indian J Eng Mater Sci., 17: 338 – 342.
[17] Bilbao, R., Mastral, J. F., Ceamanos, J., and Aldea, M. E. (1996) Kinetics of the thermal decomposition of polyurethane foams in nitrogen and air atmosphere. J. Anal. Appl. Pyrolysis, 37: 68-82.
[18] Yamashita, Y. and Ouchi, K. (1981) A study on carbonization of phenol-formaldehyde resin labelled with deuterium and 13C, Carbon, 19: 89-94.
[19] Hirose, T., Fan, T. X., Okabe, T. and Yoshimura, M. (2002) Effect of carbonizing speed on the property changes of wood ceramics impregnated with liquefacient wood, Mater. Lett., 52: 229-233
[20] Ashby, M. F. (2006) The properties of foams and lattices, Phil. Trans. R. Soc. A, 364: 15-30.
[21] Gibson, L. J. and Ashby, M. F. (1997) Cellular solids: Structure and Properties 2nd Ed., Cambridge Solid State Press, Cambridge university press.

SYNTHESIS AND RAMAN CHARACTERIZATION OF MULTIWALLED CARBON
NANOTUBES BY CATALYTIC CHEMICAL VAPOUR DEPOSITION
L. M. Manocha*, Arpana Basak and S. Manocha
Department of Materials Science, Sardar Patel University, Vallabh Vidyanagar
ABSTRACT
Catalytic chemical vapour deposition (CCVD) was used to synthesize CNTs, on silica substrate using xylene as carbon precursor and ferrocene as catalyst source. The carbon nanotubes are multiwall nanotubes which have been found to grow in bundles with CNTs within the bundles growing in one direction in a zig zag manner. The inner diameter of the tubes is found to decrease with total (outer) diameter of the CNTs. These CNTs have been characterized using SEM, XRD, TEM and Raman spectroscopy. The results obtained from these techniques have been interrelated. Key words: carbon nanotubes, microstructure, raman microscopy, chemical vapour deposition
INTRODUCTION
Carbon Nanotubes were first discovered in cathode deposits obtained in arc evaporation of graphite in 1991 by Iijima [1]. The techniques widely used for the synthesis of CNTs are arc discharge, laser ablation and catalytic chemical vapour deposition of certain hydrocarbons. Among these methods, catalytic chemical vapour deposition technique (CCVD) is considered more suitable in terms of purity, control of tube size and large scale production. CCVD synthesis of CNTs is carried out by the pyrolysis of hydrocarbons over nanoparticles of a catalyst such as iron, cobalt or other transition metals dispersed over a support [2-5] or finely dispersed in the reactor, floatation technique. The presence of catalyst nanoparticles are essential for the formation of nanotubes and to control the diameter of nanotubes to some extent [6]. Not only the tube diameter, but even the microstructure of the tubes is controlled by the type of precursor, catalytic particle and the processing conditions. Different authors have used different techniques. In the present work, multiwall CNTs have been synthesized by CCVD technique using pyrolysis of Xylene as carbon source and iron particles as catalyst on silica powder substrate and subsequent characterization by SEM, TEM, X-ray Diffractometer and Raman Microscope. MATERIALS AND METHODS
Multiwalled carbon nanotubes were synthesized by floating catalyst chemical vapour deposition method. The pyrolysis setup used for the synthesis of MWNTs is shown schematically in Fig. 1. The quartz boat containing the catalyst support, silica powder, was placed at the pyrolysis zone of the horizontal tube reactor. The temperature of the pyrolysis zone was monitored using a programmable temperature controller CHINO KP1000. The reactor was connected to a gas delivery system, mass flow controller NISHKO µCS3000. Mixture of Ar and H2 of the desired composition was introduced at controlled rate. The furnace was heated to a temperature of 800oC. On attainment of the desired reaction temperature, the liquid hydrocarbon, xylene, containing 1 wt% of ferrocene was injected in the reactor along with Ar containing 10% H2. After the reaction, the furnace was allowed to cool to room temperature under inert atmosphere. The growth and structure of the CNTs were studied using SEM, TEM, X-ray Diffractometer and Raman Microscope.
Fig. 1 Chemical Vapour Deposition Setup
Since the synthesized CNTs may contain large amount of
impurities such as amorphous carbon, metal and silica particles, purification was carried out using acid cleaning method, by treating the CNTs with 50% HF solution for 20 hours for the removal of Silica particles, subsequently the CNTs were treated with 1N HCl solution for 20 hrs followed by washing with distilled water [7-13]. The washed CNTs were dried at 100oC to remove moisture.
The percentage carbon yield was determined by the
change in weight. The CNTs were observed under SEM HITACHI S-3000N operated at 30 kV to study the growth of the CNTs, morphology as well as the microstructure. TEM Philips, Technai-20 operated at 200kV was used to examine the tubular nature of the CNTs and impurities, if present. Raman spectra were taken with Renishaw inVia Raman microscope using Argon ion laser at 514nm excitation. RESULTS AND DISCUSSION
Fig. 2 shows the SEM micrographs of the CNTs. As seen from Fig. 2 (a) carbon nanotubes are grown in bundles. Along with nanotube bundles, growth of carbon particles can also be seen in Fig. 2 (a) The bundles are oriented in different directions. This is because the preferred crystal directions of the catalysts required for growth of CNTs are oriented in
PRAJÑĀ - Journal of Pure and Applied Sciences, Vol. 18: 102 - 105 (2010) ISSN 0975 - 2595
*Corresponding author: [email protected]

2010 Manocha et al. – Synthesis and raman characterization 103
different directions. In catalyst floatation technique, it is difficult to have all the crystal planes oriented in one particular direction. Fig. 2 (b) shows that even within a nanotube bundles, the individual nanotubes are not perfectly aligned. These, though grow in one direction, posses wavy nature of growth. This is also evident from Fig. 2 (c) and 2 (d) which show that some of the tubes coil back. This is due to interruption of the growth by flowing gases as well as Van der Waal forces between the growing tubes.
Fig. 3 shows TEM micrographs of the purified CNTs.
TEM micrographs reveal that the CNTs are multiwall nanotubes, with outer diameter ranging from 13- 20 nm. The wall thickness ranges from 2-5 nm. No tube exhibit catalyst embedded in the tubes. This shows that the acid leaching technique removes all the metallic impurities from the nanotubes. Another characteristic TEM observation is that the inner diameter of the tube decreases with increase in outer diameter. This suggests that the outer walls are formed first and with time and concentration, the inner walls start growing.
c
a d
Fig. 2 (a - d): SEM micrographs show the dense growth of the CNTs b
a
Fig. 3 (a): TEM micrograph reveals the multiple walls of the CNTs
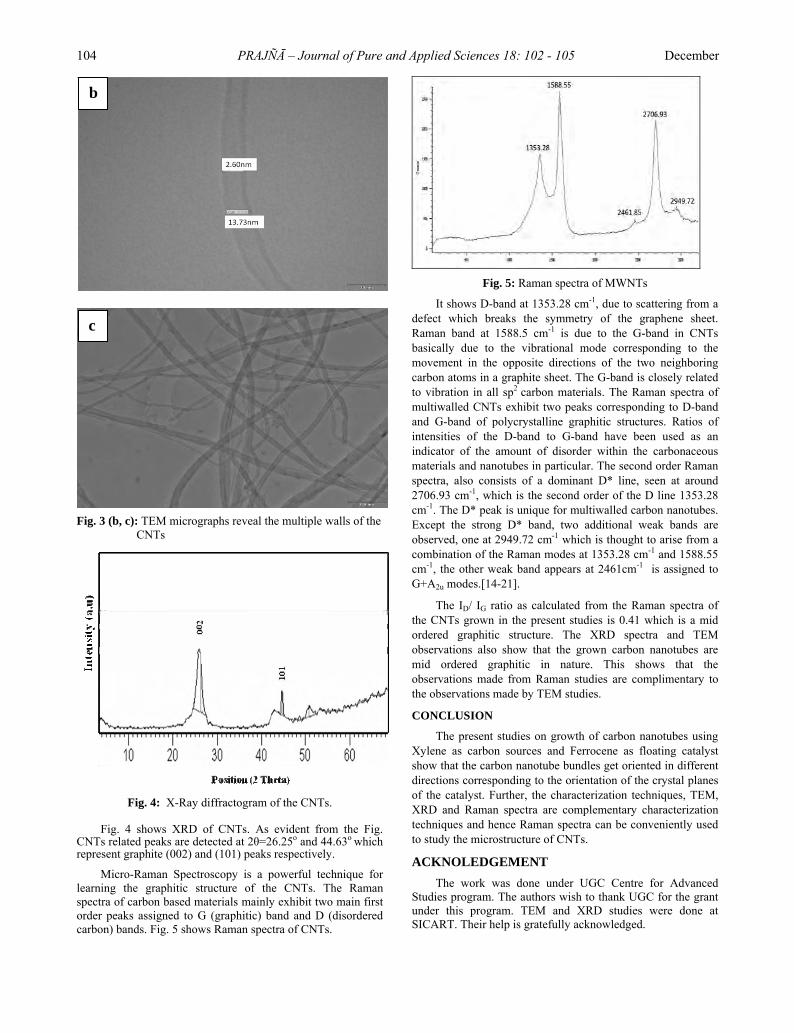
104 PRAJÑĀ – Journal of Pure and Applied Sciences 18: 102 - 105 December
Fig. 3 (b, c): TEM micrographs reveal the multiple walls of the CNTs
b
Fig. 5: Raman spectra of MWNTs
It shows D-band at 1353.28 cm-1, due to scattering from a defect which breaks the symmetry of the graphene sheet. Raman band at 1588.5 cm-1 is due to the G-band in CNTs basically due to the vibrational mode corresponding to the movement in the opposite directions of the two neighboring carbon atoms in a graphite sheet. The G-band is closely related to vibration in all sp2 carbon materials. The Raman spectra of multiwalled CNTs exhibit two peaks corresponding to D-band and G-band of polycrystalline graphitic structures. Ratios of intensities of the D-band to G-band have been used as an indicator of the amount of disorder within the carbonaceous materials and nanotubes in particular. The second order Raman spectra, also consists of a dominant D* line, seen at around 2706.93 cm-1, which is the second order of the D line 1353.28 cm-1. The D* peak is unique for multiwalled carbon nanotubes. Except the strong D* band, two additional weak bands are observed, one at 2949.72 cm-1 which is thought to arise from a combination of the Raman modes at 1353.28 cm-1 and 1588.55 cm-1, the other weak band appears at 2461cm-1 is assigned to G+A2u modes.[14-21].
The ID/ IG ratio as calculated from the Raman spectra of the CNTs grown in the present studies is 0.41 which is a mid ordered graphitic structure. The XRD spectra and TEM observations also show that the grown carbon nanotubes are mid ordered graphitic in nature. This shows that the observations made from Raman studies are complimentary to the observations made by TEM studies. CONCLUSION
The present studies on growth of carbon nanotubes using
Xylene as carbon sources and Ferrocene as floating catalyst show that the carbon nanotube bundles get oriented in different directions corresponding to the orientation of the crystal planes of the catalyst. Further, the characterization techniques, TEM, XRD and Raman spectra are complementary characterization techniques and hence Raman spectra can be conveniently used to study the microstructure of CNTs. ACKNOLEDGEMENT
The work was done under UGC Centre for Advanced Studies program. The authors wish to thank UGC for the grant under this program. TEM and XRD studies were done at SICART. Their help is gratefully acknowledged.
c
Fig. 4: X-Ray diffractogram of the CNTs. Fig. 4 shows XRD of CNTs. As evident from the Fig.
CNTs related peaks are detected at 2θ=26.25o and 44.63o which represent graphite (002) and (101) peaks respectively.
Micro-Raman Spectroscopy is a powerful technique for learning the graphitic structure of the CNTs. The Raman spectra of carbon based materials mainly exhibit two main first order peaks assigned to G (graphitic) band and D (disordered carbon) bands. Fig. 5 shows Raman spectra of CNTs.

2010 Manocha et al. – Synthesis and raman characterization 105
REFERENCES [1] Iijima, S. (1991) Helical Microtubules of Graphitic
Carbon. Nature, 354: 56 – 58 [2] Oncel, C. and Yurum, Y. (2006) Carbon Nanotube
synthesis via the Catalytic CVD Method: A Review on the Effect of Reaction Parameters. Fullerene, nanotubes and Carbon Nanostructures, 14: 17 – 37
[3] Baker, R.T.K., Barber, M.A., Harris, P.S., Feates, F. S., Waite, R.J. (1972) Nucleation and Growth of Carbon Deposits from the Nickel Catalysed Decomposition of Acetylene. J. Catal. 26: 51 – 62
[4] Baker, R.T.K., Harris, P.S., Thomas, R.B., Waite, R.J. (1973) Formation of Filamentous Carbon from Iron, Cobalt & Chromiun Catalysed Decomposition of Acetylene. J. Catal. 30: 86 – 95
[5] Rodriguez, N.M. (1993) A Review of Catalytically Grown Carbon Nanofibres. J. Mat. Res. 8: 3233 – 3250
[6] Yacaman, J., and Yoshida, M. (1993) Catalytic growth of carbon microtubules with fullerene structure. Appl. Phys. Lett. 62: 202 – 204
[7] Valand J. (2005) Studies on Role of Substrate & Carbonaceous Precursors for the Development of Carbon Nanomaterials through CVD Route. PhD Thesis, Sardar Patel University, Vallabh Vidyanagar, India
[8] Borowiak-Palen, E., Pichler, T., Liu, X., Knupfer, M., Graff, A., Jost, O., Pompe, W., Kalenczuk, R. J., and Fink, J. (2002) Reduced diameter distribution of single-wall carbon nanotubes by selective oxidation. Chem. Phys. Lett. 363: 567 – 572
[9] Kajiura, H., Tsutsui, S., Huang, H. J., and Murakami, Y. (2002) High-quality single-walled carbon nanotubes from arc-produced soot. Chem. Phys. Lett. 364: 586 – 592
[10] Farkas, E., Anderson, M. E., Chen, Z. H., and Rinzler, A. G. (2002) Length sorting cut single wall carbon nanotubes by high performance liquid chromatography, Chem. Phys. Lett. 363: 111 – 116
[11] Chiang, I.W., Brinson, B.E., Smalley, R.E. and Margrave, J.L. (2001) Purification and Characterization of Single-Wall Carbon Nanotubes, Journal of Physical Chemistry B, 105 : 1157 – 1161
[12] Moon, J.M. and An, K.H., (2001) High-Yield Purification Process of Single walled Carbon Nanotubes. Journal of Physical Chemistry B, 105 (6): 5677 – 5681
[13] Chiang, I. W., Brinson, B.E., Huang, A.Y., Willis, P.A., Bronikowski, M.J., Margrave, J.L., Smalley, R.E., Hauge, R.H.(2001) Purification and Characterization of Single-Wall Carbon Nanotubes (SWNTs) Obtained from the Gas-Phase Decomposition of CO (HiPco Process). Journal of Physical Chemistry B, 105 (35): 8297 – 8301
[14] Hai-Yan, Z. (2000) The Raman Scattering of Carbon Nanotubes in different inert gases and their pressure in arc discharge. Chinese Physics, 9: 5 – 9
[15] Manocha, L.M., Pande, R. (2010) Growth of Carbon Nanotube son SiC fabric as Reinforcement for SiC/ C Composite. Journal of Nanoscience and Nanotechnology. 10: 3822 – 3827
[16] Kastner, J., Pichler, T., Kuzmany, H., Curran, S., Blau, W., Weldon, D. N., Delamesiere, M., Draper, S., and Zandbergen, H. (1994) Resonance & Raman & Infrared Spectroscopy of Carbon Nanotubes. Chem.Phys. Lett. 221: 53 – 58
[17] Hiura, H., Ebbesen, T. W., Tanigaki, K., and Takahasi, H. (1993) Raman Studies of Carbon Nanotubes. Chem. Phys. Lett. 202: 509 – 512
[18] Kamalakaran, R., Terrones, M., Seeger, T., Kohler-Redlich, P., Ruhle, M., and Kim, Y. A. (2000) Synthesis of thick and crystalline nanotube arrays by spray pyrolysis. Appl. Phys. Lett. 77: 3385 – 3387
[19] Tuinstra, F. and Koenig, J. L. (1970) Raman Spectrum of Graphite. J. Chem. Phys. 53: 1126 – 1131
[20] Tan, P., Zhang S.L., Kwok, T.Y., Huang, F., Shi, Z., Zhou, Z., Gu, Z. (1997) Comparative Raman Study of Carbon Nanotubes Prepared by Dc Arc Discharge and Catalytic Methods. J. Raman Spectroscopy. 28 : 369 – 372
[21] Endo, M., Kim, Y.A, Fukai, Y., Hayashi, T., Terrones, M., Terrones, H., Dresselhaus, M.S. ( 2001) Comparison study of semi-crystalline and highly crystalline multiwalled carbon nanotubes. Appl Phys Lett. 79: 1531 – 1533

ENHANCEMENT OF MICROPOROSITY THROUGH PHYSICAL ACTIVATION
S. M. Manocha,* Hemang Patel and L. M. Manocha
Department of Materials Science, Sardar Patel University, Vallabh Vidyanagar
ABSTRACT
Micro porous carbons are used for the sorption/separation of light gases, where as the carbon with broad pore size is applied for removal of large organic molecules. In this work activated carbon was prepared from natural material pine wood. Pine wood monoliths were carbonized in inert nitrogen atmosphere for different intervals of times. To enhance the surface area and to develop interconnecting porosity, the pyrolysed monoliths were activated with steam at different flow rates of steam under identical conditions. It was found that flow rate of steam has profound effect on both surface characteristic and surface morphology. Surface characteristic were determined by BET method and surface morphology was seen by using SEM (scanning electron microscope). Further the flow rate of steam was optimized to retain monolith structure as well as higher surface area. Key words: Wood, Pyrolysis, Physical Activation
INTRODUCTION
Activated carbon adsorbs molecules from both liquid and gaseous phases depending upon the pore size and pore size distribution of the adsorbent. For adsorption from gas phase, mainly micro porous carbon is used whereas, meso porous carbon is applied in liquid phase process. In general both large surface area and wide pores are desirable. Large surface area allows large adsorption amounts and wide pores enhance diffusion, which influences the overall kinetics of adsorption. Two general methods are used for the preparation of activated carbon [1-3] One, the “physical activation”, consists of heating at a high temperature with steam gasification reactant e.g. H2O, CO2, O2. The other method, “chemical activation”, consists of heating at a relatively lower temperature (e.g. 5000C) with addition of dehydration agent. (e.g. H3PO4).
According to Jagtoyen M. and Derbyshire [4], and Benaddi H et al, [5] chemical activation of wood by phosphoric acid is an useful technique for obtaining activated carbon having low cost due to low heat treatment temperature but the main disadvantage of this process is the loss of some of the activating agent on the char which results in changes in surface
e
diffusion of reactants and products. [10- 12] Therefore, in the present work rate of flow of steam during activation was controlled quantitatively to study variation of pore size, micro porosity, pore volume, surface area and also surface morphology. Also this study could helps in producing desired pore size and porosity for specific applications. MATERIALS AND METHODS
Pine wood was shaped and dried for 2-4 days and subsequently, carbonized under inert nitrogen atmosphere at 750oC for 6 hour in an electrically heated furnace with slow heating rate 10oC/hr up to 350oC, 15oC/hr up to 550oC and
higher rate of 20oC/hr up to peak temperature, resulting in a crack free bio carbon template (charcoal). After pyrolysis, percentage axial, radial and tangential shrinkages were 28.47, 20.93, and 11.9 respectively. Pine wood contains 24.2% carbon and 0.38% of ash. After pyrolysis, samples were activated at 750oC in a steam atmosphere having controlled steam rate (Fig 1) to increase their surface area and micro porosity. Fig.1 is the schematic of physical activation process. The dried sample of pine wood was placed in the heating zone of electric furnace in nitrogen atmosphere. With the help of syringe pump the flow rate of steam was controlled. The smooth flow of steam and nitrogen mixture through the sample was observed by the out coming gases in to the bubbler. The thermal characterization (TGA) was carried out by using Mettler TG 50. The thermal analysis was carried out in nitrogen atmosphere at 9500C. The surface area of samples was determined by using BET 2375 (Micromeritics-Gemini) apparatus. The structure of raw, carbonized and activated wood was observed using scanning electron microscope (SEM), Hitachi S-3000N. Fig. 1 Schematic representation of physical activation process RESULTS AND DISCUSSION CARBONIZATION OF PINE WOOD
In the conversion of wood into carbon, the following stages are included: (a) desorption of adsorbed water up to 1500C, (b) splitting off of cellulose structure water between 150 and 2400C [13], (c) formation of hydrocarbon structure formed through the chain scissions, or depolymerization, and breakdown of C_/O and C_/C bonds within ring units evolving water, CO and CO2 between 240 and 4000C, (d) formation of
PRAJÑĀ - Journal of Pure and Applied Sciences, Vol. 18: 106 – 109, 2010 ISSN 0975 - 2595
chemistry. It has been noted that high specific surface area andfavorable pore structure of activated carbon contribute to effective contaminant sequestration [6, 7] and on the otherhand, surface chemistry of activated carbon also plays key roles in adsorption mechanisms and behaviors [8, 9]. All theseattributes depend on the activation agent, activation temperature and activation time.
The production of activated carbon with desired pore size distribution and surface chemistry from low cost precursor andat low a temperature is an important challenge. However, thecontrol of pore sizes in the synthesis of activated carbons is animportant aspect but not much literature is available. For agood pore development, the reaction should occur inside thpores and it must have an appropriate rate compared to the
*Corresponding author: [email protected]

2010 Manocha et al. – Enhancement of microporosity 107
aromatic polynuclear structures at 4000C and gradual development continued above 5000C [14], (e) occurrence of aromatic reactions yield network shrinkage to accommodate the excessive volume left by the evolving gases between 400 and 8000C, (f) formation of thermal induced decomposition and rearrangement reactions leaving a carbon structure above 8000C. Detailed pyrolysis behavior of pine wood was explained in an earlier paper. [15] SURFACE AREA ANALYSIS BY BET METHOD
Macro pore enable the molecule of the adsorbate to pass rapidly to smaller pore situated deeper within the particles. The adsorption in macro pore is insignificant, while the micro pore have large internal surface area and contributes significantly to adsorption. Since the average micro pore area increase due to activation process, adsorption capacity of carbon also gets increased. The pyrolysed samples were activated with steam at 7500C for one hour with different flow rate of steam varying between 0.1-0.7 ml/min. Above 0.7ml/min steam rate causes breaking of the surface material (fig.5c). The activated samples were characterized for surface area, microporosity and average pore diameters. The results are shown in Table 1.
Table - 1 Physical properties of activated carbon derived from pine wood under different steam rate.
Fig.2 shows nitrogen adsorption isotherms if activated
carbons with different flow rate of steam. All samples show type I adsorption isotherms, i.e. micro porous carbon. The volume of nitrogen adsorbed is seen to be increasing with increase in steam flow rate, being highest for sample activated by 0.7ml/min and minimum for sample activated by steam at flow rate of 0.1 ml/min. With increase in flow rate of steam, micro pore area and average pore diameter show interesting results. The percentage micro pore area decrease due to widening of pore as a result the pore diameter increase from 1.65nm to 1.92nm or increasing the flow rate from 0.1ml/min to 0.7ml/min.
The comparison of surface characteristic of activated
carbons complied in table 1 further show an increase in surface area with increasing flow rate of steam, while percentage micro porosity decreases with increasing flow rate of steam during activation process. Also surface area of activated carbon increase with increasing flow rate of steam. Steam rate having 0.3ml/min gives 654.73 m2/g as surface area and 0.5ml/min gives 710.45 m2/g as surface area. SEM
The micrograph of as such pine wood is shown in fig 3a. It shows a porous network. But the pores are not clear. These contain certain cellulosic products. On pyrolysis, the wood gets decomposed into smaller molecules, while the walls of the
struts retain their morphology. The filled mass gets highly decomposed resulting in clear pore structure (Fig 3b). The fig 4 (a) shows well distributed pores in activated carbon with flow rate of 0.1ml/min. With increasing flow rate, not only the original voids get enhanced but the carbon constituting the walls of the pores get removed resulting in formation of new pores.
Fig. 2 Nitrogen adsorption isotherms of activated carbons with different flow rate of steam.
Though the surface area of all samples increases on increasing the flow rate of steam, but due to higher flow rate, diffusion is faster resulting in collapsing of pore walls, hence the micro pores get widened and average pore diameter increase from 1.65nm to 1.92 nm, also percentage micro porosity also falls from 90 % to 79%. On further increasing steam rate gets broken the cell wall as shown in fig 4b.
Fig.5 shows the variation of pore diameter with changing the flow rate of steam. Due to high rate of oxidation beyond 0.7ml/min leads
to fracture of the materials and entire structure collapse including the pore walls (fig.4b). The surface area of material was higher but it led to the formation of meso porous structure. The average pore diameters in all samples were less than two nano meter showing microporous nature of samples. The sample activated with steam at flow rate 0.1ml/min has smaller pore volume than sample activated with steam flow rate 0.7ml/min.
Sr. No
Input steam rate (ml/min)
Activation temperature (oC)
Activation time (min)
% micro pore area (m2/gm)
Average Pore diameter (nm)
Surface area (m2/g)
1 0.1 750 60 90.56 1.65 497.697
2 0.3 750 60 87.17 1.76 654.73
3 0.5 750 60 86.50 1.78 710.45
4 0.7 750 60 79.87
1.92 721.28
(a)

108 PRAJÑĀ – Journal of Pure and Applied Sciences 18: 106 - 109 December
Fig. 3 scanning electron micrograph of (a) as such pine wood
(b) pyrolysed pine wood [Both micrographs are in axial direction]
Fig. 4 scanning electron micrograph of steam activated carbonized
pine wood with steam flow rate (a) 0.1ml/min (b) 0.7ml/min
Fig. 5 Relation of effect of steam rate verses average pore diameter CONCLUSION
Activated carbon with high percentage of micro pores and surface area can be developed by controlling the flow rate of steam during activation process. By controlling the parameters of activation process tailor made porous material can be developed from cellulosic materials. Controlling of processing parameters is very important for the production of desired porosities that could be used in specific applications e.g. for separation of light gases micro pores are used, while broad pore size pores could be used in removal of organic molecules. REFERENCES [1] Smisek, M., and Cerny, S. (1970) Active carbon
manufacture properties and applications. Elsevier Publishing Company, pp. 1-32.
[2] Bansal, R.C., Donnet, J.B., and Stoeckeli, F., (1998) Cyanide Removal by Adsorption and Biodegradation Process. Iran. J. Environ. Health, pp.27-118.
[3] Wigmans, T. (1989) Industrial aspects of production and use of activated carbons. Carbon, 27: 13-22.
[4] Jagtoyen, M., and Derbyshire, F. (1993) Some considerations of the origins of porosity in carbons from chemically activated wood. Carbon, 31: 1185-1192.
[5] Benaddi, H., Legras, D., Rouzaud, J., and Beguin, F. (1998) Influence of the atmosphere in the chemical activation of wood by phosphoric acid. Carbon, 36: 306 -309.
[6] Zimmerman, J., Ghosh, U., Millward, R., Bridges, T. and Luthy, R. (2004). Addition of carbon sorbents to reduce PCB and PAH bioavailability in marine sediments: Physicochemical tests. Bioresource Technology, 38: 5458–5464.
[7] Millward, R., Bridges, T., Ghosh, U., Zimmerman, J., and Luthy, R (2005). Addition of activated carbon to sediments to reduce PCB bioaccumulation by polycheate (Neanthes arenaceodentata) and an amphipod (Leptocheirus plumulosus). Environmental Science & Technology, 39:2880–2887.
[8] Pereira, M. F. R, Soares, S. F., Orfao, J. J. M., and Figueiredo, J.L. (2003). Adsorption of dyes on activated carbons: Influence of surface chemical groups. Carbon, 41,811–821.
0.0 0.1 0.2 0.3 0.4 0.5 0.6 0.7 0.80.0
0.5
1.0
1.5
2.0
Ave
.Por
e D
iam
eter
(nm
)
Steam Rate (ml/min)
(b)
(a)
(b)

2010 Manocha et al. – Enhancement of microporosity 109
[9] Moreno-Castilla, C. (2004). Adsorption of organic molecules from aqueous solutions on carbon materials. Carbon, 42: 83–93.
[10] Fogler, H.S (1991) Elements of Chemical Reaction Engineering Prentice-Hall, 3rd edition , pp. 67±76,
[11] Gonzalez-Vilchez, A ., Linares-Solano, J. and Lopez-Gonzales, D. (1979) The controlled reaction of active carbons with air at 350°C—I: Reactivity and changes in surface area. Carbon, 17: 441-446.
[12] Gergova, K., Galushko, A., Petrov. N. and Minkova, V., (1992) investigation of the porous structure of activated
carbons prepared by pyrolysis of agricultural by-products in a stream of water vapor. Carbon, 30: 721-727
[13] Greil, P., (2001) Biomorphous ceramics from lignocellulosics, J. Eur. Ceram. Soc. 21: 105–118.
[14] Chand, S. (2000) Carbon fibers for composites. J Mater Sci.35: 1303–13.
[15] Manocha, S., Patel, H. and Manocha, L. Effect of steam activation on development of light weight porous biomorphic SiC from pine wood precursor. (Communicated to Journal of Materials Engineering and Performance).

14 MEV NEUTRON GENERATOR FACILITIES FOR MATERIAL
RESEARCH FOR FUSION REACTORS
Surender Kumar Sharma, R. Shukla and A. Shyam
Energetics & Electromagnetics Division, Institute for Plasma Research, Gandhinagar, Gujarat – 382 428
ABSTRACT
Accelerator based neutron generator is designed for the generation of 14 MeV neutrons for carrying out the benchmark experiments for fusion blanket and shielding materials for demo fusion reactor. Deuterium ion beam current of 1mA is extracted from the Electron Cyclotron Resonance (ECR) ion source and accelerated to 300 keV and then impinging on 10 curie tritium target produces 1010, 14 MeV neutrons per second via D(T,n)He nuclear fusion reaction. The subsystem of the neutron generator is consists of ECR ion source and its power supply kept on the high voltage platform, 300 kV acceleration column and 300 kV / 10 mA DC High voltage power supply for accelerating deuterium ion, beam line and vacuum system to maintain 10-5 mbar inside the beam line and tritiated target. The Ion source is operating on the test bench and deuterium ion beam has been extracted from the ion source at 7.5kV extraction potential. Another compact sealed pulsed 14 MeV neutron generator facility has been installed with the neutron flux of 1010 neutrons per second and repetition rate of 100Hz. few experiments for explosive detection were carried out with pulsed neutrons. Key words: accelerator, acceleration column, high voltage power supply, neutron, ion source, tritium target.
INTRODUCTION
requires a tritium breeder and a neutron multiplier that can withstand high temperature and high neutron flux. Benchmark experiments can be carried out with a 14 Mev neutron generator to study the properties of blanket/shielding materials [1,2,3,4]. Neutron can also be used as a tool to detect the explosive material [5, 6, 7]. NEUTRON GENERATOR
Accelerator based neutron generator will produce continuous high neutron flux. These neutrons are produce by D + T He + n nuclear fusion reaction [8]. The sub-systems of the accelerator (Fig. 1) based neutron generator has an E.C.R Ion source housed in a high voltage dome, acceleration column, High voltage power supply, beam line, vacuum systems and target assembly. Electrical power to the dome is supplied through a dc Isolation transformer. Mono-atomic deuterium ion beam is extracted from the Ion source and then the ions are uniformly accelerated in a uniformly gradient acceleration column it then impinge on the tritium target and produces neutrons. The neutron generator operation is assisted by several auxiliary systems which ensure personal and machine safety the most relevant are the vacuum exhausts clean up unit, the experimental hall venting system, the target cooling system, the environment radiation monitoring system and the control system. The specification of neutron generator is shown in Table 1.
ION SOURCE AND HIGH VOLTAGE DECK
Deuterium ion beam of 1mA is extracted from the ECR ion source and then it is focused into the uniform grading
Fig. 1 Accelerator based neutron generator Table - 1 Specification of 14 MeV neutron generator
Neutron flux 1011 , neutrons/second
Fusion power offers the prospect of an almost
inexhaustible source of energy for future generations, but it also presents so far insurmountable scientific and engineering challenges. A lot of research is going in the world to magnetically confine the plasma in TOKAMAK. D(T, n)He nuclear fusion reaction will produce 14Mev neutrons in tokamak and blanket is required to remove these neutrons and heat generated from kinetic energy of neutrons, provide continuously supply of fuel(tritium) and protect the mechanical structure of vacuum vessel and super conducting coils from direct neutron and gamma radiation. The blanket material
Maximum Beam energy 320 KeV
Beam current at the target (D+) 1 mA
Beam spot at target (mm) 10 mm
Ion source ECR type
Extraction voltage 20 kV
High Voltage power supply 300kV/10mA
D.C Isolation transformer 350kV/5kVA
Vacuum pump 400lps
Tritium target 10 Curie
acceleration column. ECR ion source is preferred as compared to other ion source because it doesn’t require filament replacement and produces high current beam [8]. The plasma is produced inside the ion source by rf heating of the deuterium gas and it is the confined by axial and radial magnetic field produced by permanent magnets. The deuterium ions are extracted with two electrode assembly at 7.5KV. The gas flow in the ion source is regulated by needle valve. The ion source, extraction assembly, focusing element and its power supply are housed inside a high voltage deck floating at 300 kV and power to the deck power supply is fed by 350KV, 5KVA isolation transformer. The control and command signals are transmitted
PRAJÑĀ - Journal of Pure and Applied Sciences, Vol. 18: 110 - 111, (2010) ISSN 0975 - 2595
* Corresponding author: [email protected]

2010 Sharma et al. – 14 MEV electron generator 111
through fiber optic to control room to ensure proper electrical isolation. ACCELERATION TUBE
The deuterium ion beam is focused into the acceleration tube (Fig. 2) after it is extracted from the ion source. The acceleration tube consists of four sections and each section is metal and ceramic bonded assembly with no organic compounds in the vacuum volume and each tube has ten insulation gaps. This is to provide uniform potential gradient for best reliability and optics consideration. The tube is fully bakable up to 2000C for contaminant free and ultra high vacuum operation. Each section is conservatively rated at 75 kV in air and 200 kV in SF6 (2 atm). Each section of the tube is connected with 1” diameter limiting electrode between the tubes and conflate flange to keep the radiation from back streaming electron as low as possible and to focus 25mm beam to the target. A multiple series of resistor string in air is used to distribute the electrostatic potential uniformly along the tube. The holding voltage of tube is 300 kV in air.
Fig. 2 Acceleration Column HIGH VOLTAGE DC POWER SUPPLY
Apart from ion source and extraction power supply on high voltage deck another high voltage power supply is used to accelerate deuterium ions. This high voltage power supply (Fig. 3) is Glassman make 300 kV dc with a maximum current of 10 mA. It is characterized by high reliability, high terminal voltage stability, low terminal voltage ripple and low voltage regulation. Operating voltage will be 200-250 kV. The high voltage power supply is connected with RS 232 port to computer for online voltage setting.
BEAM LINE AND VACUUM SYSTEM
Ultra high vacuum of the order of 10-8 torr can be achieved in the acceleration tube by turbo molecular pump with the pumping speed of 500 l/s back up with is 6 m3/hr rotary pump which is connected at the ground potential. Vacuum exhaust from the beam line is pumped outside the experimental hall in order to prevent the tritium leak inside the experimental hall. The experimental hall will have separate ventilation system. The target is kept 2m away from the acceleration tube by means of drift tube to minimize the contribution of backscattered neutrons.
TARGET ASSEMBLY
The target assemblies of neutron generator are consists of target holding, target cooling and suppression of secondary electron. The target holders are cooled with water or air. Water cooled target are used for beam current higher than
500 micro Amp. Target is kept at the distance of 4m from the floor, roof and the sidewall. Circular stationary tritiated-titanium target of 10 curie activity is used. Tritium is absorbed in the titanium layer which is later deposited on the bottom of OFHC. The beam power dissipated on the target is removed by cold water flowing in a turbulent region on the external surface of copper cup which ensure the target temperature is less than 2000C. The target is housed in a support designed to minimize the neutron scattering.
NEUTRON GENERATOR APPLICATION
Neutron generator is designed for conducting neutronics experiments in the framework of research activity on controlled thermonuclear fusion. The neutronics design of blankets and shield of next step fusion devices requires verification that the neutron cross section data sets used in the calculations are as accurate as possible and confirmation that the calculation methods used to transport the neutrons are as reliable as practical [9]. To ensure that both these criteria are met suitable experimental activity (benchmark experiments) will be conducted using this facility. Neutron induced material damage and material swelling studies, fast neutron activation analysis, neutron radiography can also be done with this neutron generator. Explosive detection experiments using neutron as a tool can also be carried out. REFERENCES [1] Sharma, S. K., Shyam, A., Kumar, R., Verma, R.,
Chaudhary, V., Lathi, D., Shukla, R. (2004) Neutron generator for TOKAMAK blanket/shielding material studies. In International conference on Portable Neutron Generators and Generator based Technologies,VNIIA, Moscow, Russia.
[2] Sharma, S. K. A. Shyam, R Kumar, R Verma, V Chaudhary, D Lathi, R Shukla (2004) 14 MeV neutron generator for blanket and shielding material studies in fusion reactors. In 19th National Symposium on Plasma Science and Technology, December, Jhansi, India.
[3] Batistani, P., Angelone, M., Martone, M., Pillon, M., Rado, V., Santamarina, A., Abidi, I., Gastaldi, B. Martini, M. and Marquette, J. P. (1995) The bulk shielding benchmark experiment at the Frascati Nuetron generator, Fusion Eng Design, 28: 504 - 514.
[4] Martone, M., Angelone, M. and Pillon, M. (1994) The 14 MeV Frascati Nuetron generator, J Nucl. Mater. J of Nuclear Material, 212-215:1661-1664.
[5] Sharma, S. K., S. C. Jakhar, R. Shukla, Shyam, A. and Rao C. V. S (2009) Explosive detection system using 14 MeV neutron source. 9th ISFNT , China..
[6] Vourvopoulos, G. and Womble, P. C. (2001), Pulsed Fast/Thermal neutron analysis: A Technique for explosive detection. “TALANTA” 54, Eiceman, G. Editor, ELSEVIER, pp. 459 - 468.
[7] Bruschini C. (2001) Commercial systems for the direct detection of explosives. Explostudy, Final Report, EPFL and VUB, Ch-1015, Lausanne, Switzerland.
[8] Liehr, M., Trassl, R. Schlapp, M. and Salzborn, E. (1992) A Low power 2.45 GHz ECR ion source for multiply charged ions. Rev.Sci.Instrum., 63: 2541-2543.
[9] Pillon, M., Angelone, M., Martone , M., and Rado, V. (1995) 14 MeV Neutron Generator. Fusion Engineering and Design, 28: 683-688.
Fig. 3 High Voltage power supply

COMPACT ELECTRON CYCLOTRON RESONANCE ION
SOURCE BASED ION BEAM GENERATION
Surender Kumar Sharma1, R. Shukla1, Erhard Salzborn2 and A. Shyam1
1Energetics & Electromagnetics Division Institute for Plasma Research, Gandhinagar, Gujarat – 382 428
2University of Giessen, Germany
ABSTRACT
A compact 2.45 GHz Electron cyclotron resonance (E.C.R.) based ion source is set up for the production of single and multiple charged ion beams. The sub-system of E.C.R. ion source has microwave system its power supplies, plasma chamber, NdFeB permanent magnets and ion extraction assembly. The gas is ionized inside the cylindrical plasma chamber, which is surrounded by the permanent magnets system. The microwave system consists of 2.45 GHz, 300 watts c-w magnetron and its power supplies for plasma generation. The extraction assembly consists of a spherical extraction aperture and a puller electrode. The source has been operated with hydrogen, deuterium, helium and nitrogen gas. Mono-atomic and multiple charges ions have been extracted from the ion source by controlling the gas pressure and microwave power inside the plasma chamber. Vacuum of the order of 10-5 to 10-6 mbar is maintained inside the plasma chamber. The ions from the plasma chamber is extracted and focused on negatively biased faraday cup. The deuterium ion beam current has been measured by measuring the voltage across the series resistor and the deuterium ion beam current signal is recorded to see the beam uniformity and stability. Deuterium ion beam current of 1 milli-ampere has been extracted at 7.5 kV extraction voltage. Key words: electron cyclotron resonance, NdFeB permanent magnet, magnetron, pierce geometry, helical antenna
INTRODUCTION
Ion source is important element in the modern day research. Its applications range from providing ion beams of hundreds of Amperes for fusion applications[1], nano-amperes for microprobe trace analysis, broad beams for ion implantation for material research, industrial polymerization, to medical and accelerator applications. The ECR Ion source can produce singly and multiple charged ion beam [2]. The advantage of ECR ion source is that it can produce ions of all elements and it doesn’t have filament as compared with penning and duo plasmatron ion source, so a stable ion beam can be produced for longer duration.
electron cyclotron resonance condition is fulfilled:
ώhf = ώcyc = (e/m) .B
Here, e and m denote the charge and mass of the electron respectively.
The plasma electrons are confined in a superposition of an axial magnetic field component (produced by permanent magnets) and the radial magnetic field of a multiple magnet. This result in a minimum-B-structure because the magnetic field has a minimum in the middle of the structure and from there increases in all directions. Therefore, a closed surface is created where the electron cyclotron resonance condition is fulfilled. Electrons passing through that surface can be accelerated resonantly. Furthermore, a high mirror ratio of the
magnetic field leads to long confinement times for the plasma electrons. They can pass the resonance region very often, gain high energies and ionize plasma atoms and ions into high charge states via successive single ionization. The ions in the plasma are not accelerated due to their large mass and remain thermal. Therefore they are not confined by the magnetic field but by the space charge potential of the electrons. This magnetic confinement, however, is not perfect and electrons can leave the plasma, for example in axial direction. Since the plasma tends to stay neutral, ions will follow the electrons. By using suitable extraction geometry and by applying a high voltage, the ions can be extracted from the ion source. Fig. 1 Schematic overview of ECR Ion source SYSTEM DESCRIPTION
The ECR ion source [3, 4, 5, 6] is consists of microwave system, plasma chamber, magnets and extraction system. The schematic overview of ECR Ion source is shown in Fig. 1. The plasma is produced inside the plasma chamber which is surrounded by the permanent magnets system. Two ring magnets produce axial magnetic mirror and a hexapole magnet produces radial magnetic field. The microwave system consists of 2.45 GHz magnetron which can deliver 300 Watts power in the continuous mode. The microwave is transported through a rectangular hollow wave guide to power circulator. A three port circulator with the dummy load is used to protect the magnetron from the reflected power. The microwave systems
PRAJÑĀ - Journal of Pure and Applied Sciences, Vol. 18: 112 - 114, (2010) ISSN 0975 - 2595
E.C.R. ION SOURCE PRINCIPLE
Electron Cyclotron Resonance (ECR) ion sources are also called hot-plasma ion sources and their operation principle is, when electrons move in a magnetic field they gyrate around the magnetic field lines due to the Lorentz force. The gyration frequency is called the cyclotron frequency ώcyc. If microwave radiation of the same frequency (ώhf) propagates into such a region, the electrons are resonantly accelerated or decelerated (depending on the phase of their transversal velocity component with respect to the electric field vector) when the
* Corresponding author: [email protected]

2010 Sharma et al. – Compact electron cyclotron 113
consists further of a combination of a high-voltage and high- vacuum window and a cross bar transition from rectangular wave guide to coaxial line with the gas inlet at the dead end of the transition. The Ion Source set up is shown in Fig. 2 and the specification of ECR Ion source is given in Table - 1.
Fig. 2 Ion source setup Table - 1 Specification of ECR Ion Source
Source type Electron–cyclotron – resonance (ECR) Ion source
Microwave frequency 2.45 GHz
Microwave power 300 watts
Cooling water cooling, min 2 l/sec
Mounting flange As required (min NW 63 CF)
Gas feed NW 10 KF or as required
Dimension
200 mm outside diameter (without microwave system)
400 mm (including HV system and vacuum isolation)
Magnets 2 NdFeB ring magnets, 1 NdFeB Hexapole magnet
MAGNET SYSTEM
The magnet system is consists of 14 permanent magnet made of NdFeB material. The magnets have the dimensions of 65 x 52 x 36.6 mm and the pole magnetic field strength is 0.45T. Six of the 14 magnets form a hexapole magnet, whose inner diameter is 65mm. The hexapole magnet is mounted between two magnet rings made by four magnets each. Two ring magnets produce axial magnetic field and a hexapole magnet produces radial magnetic field. The magnetic field distribution of the axial magnetic field in the midplane of the source is shown in Fig. 3. A maximum magnetic field of 208 mT can be obtained at a mirror ratio of 2.7. The maximum radial magnetic field inside the plasma chamber induced by the hexapole magnet is 0.5 T. Cold water is circulated with 2 liters per minutes across the plasma chamber to remove the direct heat load on permanent magnets.
MICROWAVE SYSTEM
Microwave system of the ion source is consists of 2.45 GHz magnetron, which can deliver a maximum power of 300 watts in the continuous mode. The microwave is transported through a R26 rectangular hollow wave-guide to a three-port
power circulator, which will protect the magnetron with the reflected power and the reflected microwave from plasma is absorbed without any reflection in a thick walled dummy load. The microwave systems consist further of a combination of a high-voltage and high- vacuum window and a cross bar transition from rectangular wave guide to coaxial line with the gas inlet at the dead end of the transition. At the end of the coaxial line a slow-wave structure (helical antenna) is connected which will radiate circularly polarized microwaves in axial direction. The dimensions of slow-wave structure depend on the used frequency and have a diameter of 41 mm with the distance of 27 mm between the turns for the helix antenna. After a minimum of four turns it radiates circular polarized microwave in the axial direction. The directivity increases with the number of turns. By using slow wave structure the dimensions of the plasma chamber (60 mm inner diameter and 2.5 mm wall thickness) can be reduced with respect with the smallest circular waveguide for the used frequency. The electrons in the plasma gain energy with the applied microwave power due to the electron-cyclotron-resonance and produce more ions. These ions will be extracted by applying a positive high voltage to the ion source with respect to the puller electrode.
Fig. 3 Magnetic field distribution EXTRACTION SYSTEM
The extraction system of the ion source is consists of a spherical extraction aperture with 8 mm hole and a puller electrode with 10 mm hole. The ions leave the plasma drifts through the extraction grid and are accelerated away through the immediate high voltage to the puller electrode. The puller electrode can either be operated on ground potential or floating potential. The puller electrode has a pierce geometry, which is a cylindrical pipe limited through a strongly conical tapered shutter, which suppresses the widening of the ion beam caused by the space charge effects. Extraction voltage is applied through a Glassman make 20kV high voltage power supply. All vacuum parts are sealed with rubber O-rings or CF gaskets E.C.R. ION SOURCE CHARACTERISTICS
The E.C.R. ion source has been operated on a test bench consisting of 80cm beam line. Vacuum of the order of 10-5 to 10-6 mbar is achieved inside the beam line by 400lps turbo molecular pump. The ion source has been operated with hydrogen, deuterium, helium and nitrogen gas. The deuterium gas was produced by electrolysis of heavy water and the gas flow is regulated by needle valve. The beam current measurements were done for deuterium ions. The deuterium

114 PRAJÑĀ – Journal of Pure and Applied Sciences 18: 112 -114 December
ion beam is extracted and focused on negatively biased faraday cup. The faraday cup is negatively biased 40mm diameter graphite cup placed inside the beam line at a distance of 80 cm from the extraction electrode. The negatively biased graphite cup is grounded with a 2K resistor. The voltage across the resistor is measured with a fluke make multimeter to measure the voltage across the resistor and hence beam current. The voltage signal across the resistor is also measured in the oscilloscope to see the uniformity and the stability of the ion beam (Fig. 4). The maximum extraction voltage of 7.5 kV is applied and the beam current is recorded. Deuterium Ion beam current of 1 mA has been extracted at 7.5 kV (Fig. 5). The beam was stable for longer duration.
Fig. 4 Beam current measured on oscilloscope
Fig. 5 Deuterium ion beam extraction
CONCLUSION The electron cyclotron resonance ion source was commissioned and it has been operated with hydrogen, deuterium, helium and nitrogen gas. The ion beam can be focused on material for ion implantation and DPA (Displacement per atom) studies for ion bombardment on materials. The deuterium ion beam current has been measured 1mA at 7.5 kV extraction voltage. The deuterium ion beam will be accelerated and then it will impinges on tritium target and produces neutrons by fusion reaction. System is further being upgraded to produce 5 mA deuterium ion beam current. REFRENCES [1] Ohara, Y. and co- Y. Okumura (1991) Negative ion based
neutral beam injectors. IAEA Technical Meeting, Nov. [2] Liehr, M., Trassl, R., Schlapp, M. and Salzborn, E. (1992)
A Low power 2.45 GHz ECR ion source for multiply-charged ions. Rev. Sci. Instrum, 63: 2541-2453
[3] Sharma, S. K. A Shyam, R Kumar, Verma, R., Chaudhary V, Lathi D., Shukla R.. (2006) , Ion beam extraction and beam parameter study of 2.45 GHz ECR Ion source. 2nd International conference on current development in atomic, molecular and optical physics with application (CDAMOP). March, Delhi University, INDIA.
[4] Sharma, S. K. A Shyam, R Kumar, R Verma, V Chaudhary, Lathi, D., Shukla R., (2007), 2.45 GHz ECR Ion source operating with deuterium gas for neutron generator. National Symposium Ion beam technology and application (Power Beams) September, Mumbai.
[5] Sharma, S. K. A Shyam, R Kumar, R Verma, Chaudhary, V., D Lathi and Shukla. R. (2007), Present Status of 2.45 GHz Electron Cyclotron Resonance Ion Source for Neutron Generator. 22nd National symposia on Plasma Science and technology (PLASMA). December, Ahmedabad.
[6] Sharma S. K. Shyam, A., Kumar, R., Verma, R., Chaudhary, V., Lathi, D. and Shukla R., (2005), 2.45 GHz Electron cyclotron resonance Ion source. 20th National Symposium on Plasma Science & Technology. (PLASMA). December , Cochin, INDIA.

MEAN LABELING FOR SOME NEW FAMILIES OF GRAPHS
S. K. Vaidya1* and Lekha Bijukumar2
1Saurashtra University, Rajkot-360 005, Gujarat
2Lekha Bijukumar Shanker Sinh Vaghela Bapu Institute of Technology, Gandhinagar, Gujarat
ABSTRACT
Some new families of mean graphs are investigated. We prove that the step ladder graph, total graph of path Pn are mean graphs. In addition to this we derive that two copies of cycle Cn sharing a common edge admits mean labeling. Key words: mean labeling, mean graphs, step ladder graph, total graphs.
INTRODUCTION
We begin with simple, finite, connected and undirected graph G = (V(G),E(G)) with p vertices and q edges. For all other standard terminology and notations we follow Harary [1]. We will provide brief summary of definitions and other information which serve as prerequisites for the present investigations. Definition 1.1 Let Pn be a path on n vertices denoted by (1,1),(1,2),...,(1,n) and with n-1 edges denoted by e1,e2,...,en-1 where ei is the edge joining the vertices (1,i) and (1,i+1). On each edge ei, i = 1, 2, …, n-1 we erect a ladder with n-(i-1) steps including the edge ei. The graph obtained is called a step ladder graph and is denoted by S(Tn), where n denotes the number of vertices in the base. Definition 1.2 The vertices and edges of a graph are called its elements. Two elements of a graph are neighbours if they are either incident or adjacent. The total graph of a graph G is denoted by T(G) is a graph with vertex set and two vertices are adjacent in T(G) when ever they are neighbours in G. Definition 1.3 If the vertices are assigned values subject to certain conditions then it is known as graph labeling. Graph labeling is one of the fascinating areas of graph theory with wide ranging applications. An enormous body of literature has grown around in graph labeling in last five decades. A systematic study of various applications of graph labeling is carried out in Bloom and Golomb [3]. According to Beineke and Hegde [2] graph labeling serves as a frontier between number theory and structure of graphs. For detailed survey on graph labeling we refer to A Dynamic Survey of Graph Labeling by Gallian [4]. Definition 1.4 A function f is called a mean labeling of graph G if
PRAJÑĀ - Journal of Pure and Applied Sciences, Vol. 18: 115 - 116, (2010) ISSN 0975 - 2595
( ) ( )V G E GU
: ( ) 0,1, 2,..., f V G q→ * : ( ) 1, 2,...,
is injective and the induced function f E G q→ defined as
( ) ( )*( ) ;2
f u f vf e uv += =
if ( ) ( )f u f v+ is even
( ) ( ) 1;2
f u f v+ += if ( ) ( )f u f v+ is odd
is bijective. The graph which admits mean labeling is called a mean graph.
The mean labeling is introduced by Somasundaram and Ponraj [5] and they proved the graphs , , ,n n n m m nP C P P P C× ×
rs in [6] have
1,n
etc. admit mean labeling. The same autho discussed the mean labeling of subdivision of K for 3n ≤
nW does not admit
while in [7]
they proved that the wheel the mean
labeling for . Mean labe t of some graph operations is discussed by Vaidya and Lekha [8]. In the present work three new results corresponding to mean labeling and some new families of mean graphs are investigated. MAIN RESULTS Theorem-2.1: The step ladder graph S(Tn) is a mean graph. Proof: Let Pn be a path on n vertices denoted by (1,1),(1,2),...,(1,n) and with n-1 edges denoted by e1,e2,...,en-1 where ei is the edge joining the vertices (1,i) and (1,i+1). The step ladder graph S(Tn) has vertices denoted by (1,1),(1,2),...,(1,n), (2,1),(2,2),...,(2,n), (3,1),(3,2),...,(3,n-1),...,(n,1),(n,2). In the ordered pair (i,j), i denotes the row (counted from bottom to top) and j denotes the column ( from left to right) in which the vertex occurs. Define
4n ≥ ling in the contex
: ( ( )) 0,1,2,..., nf V S T q→ as follows. 2( ,1) ( 2) ( 1)f i n n i= + − − − ; 1 i n≤ ≤
12
1 2
(1, ) ( 2) ( ) [( ) ( 1)]j j
k k
f j n n n k n k j−
= =
= + − − − − + − −∑ ∑ ; 2 j n≤ ≤
12
1 2
( , ) ( 2) ( ) [( ) ( 1)] ( 1)j j
k k
f i j n n n k n k j i−
= =
= + − − − − + − − − −∑ ∑ ;
2 , & 2i j n j n i≤ ≤ ≠ + − 2( , 2 ) 2f i n i i+ − = − ; 2 i n≤ ≤
In view of the above defined labeling pattern f is a mean labeling for the step ladder graph S(Tn). That is, S(Tn) is a mean graph. Proof: Let be the vertices of path Pn with n-1
edges denoted b According to the definition of total graph and two vertices are adjacent in T(Pn) if they are neighbours in P . Define
1 2, ,..., nv v vy 1 2 1, ,..., .ne e e −
n
: ( ( )) 0,1, 2,..., nf V T P q→ as follows.
1( ) 0f v =
( ) 4( 2) 2;if v i= − + for 2 i n≤ ≤
( ) 4 ;jf e = j for 1 2j n≤ ≤ − *Corresponding author – [email protected]

116 PRAJÑĀ – Journal of Pure and Applied Sciences 18: 115 - 116 December
( ) 4 1;jf e j= − for
Thus f provides a mean labeling for T(Pn). That is, T(Pn) is a mean graph. Illustration 2.2: The Figure 1 shows the labeling pattern for
S(T6).
Fig. 1 Illustration 2.4: The labeling pattern of T(P5) is given in
Figure 2.
Fig. 2 Theorem-2.5: Two copies of cycle Cn sharing a common edge
admit mean labeling. Proof: Let be the vertices of cycle Cn. Consider two copies of cy . Let G be the graph for two copies of cycle sharing a common edge in which is a spanning path. Then
1j n= −
1 2, ,..., nv v vcle Cn.
1 2 2 -2, ,..., nv v v( ) 2 - 2V G n= and ( ) 2 -1E G n= . To
define : ( ) 0,1,2,..., f V G q→ the following two cases are to be considered. Case 1: n is odd. Without loss of generality assumes that
1 3 12 2
n ne v v+ −= be the
common edge between two copies of Cn. ; for( ) 2( 1)if v i= − 11
2ni +
≤ ≤
( ) 2 1if v i= − ; for 32
n i n+≤ ≤
( ) 2(2 2 ) 4if v n i= − − + ; for 3 312
nn i −+ ≤ ≤
( ) 2(2 2 ) 3if v n i= − − + ; for 3 1 2 22
n i n−≤ ≤ −
Case 2: n is even. Without loss of generality assume that
2 32 2
ne v v+= n be the
common edge between two copies of Cn. ; for ( ) 2( 1)if v i= − 21
2ni +
≤ ≤
( ) 2 1if v i= −
( ) 2(2 2 ) 4if v n i= − − + ; for 3 212
nn i −+ ≤ ≤
( ) 2(2 2 ) 3if v n i= − − + ; for 3 2 22n i n≤ ≤ −
Then the above defined function f provides mean labeling for two copies of cycle sharing a common edge. Illustration 2.6: The Figure 3 shows the mean labeling pattern for two copies of C10 sharing an edge.
Fig. 3 CONCLUDING REMARKS AND FURTHER SCOPE
As all graphs are not mean graphs it is very interesting to
investigate graphs which admit mean labeling. Here we contribute three new families of mean graphs. It is possible to investigate similar results for other graph families and in the context of different labeling techniques. ACKNOWLEDGEMENT
Authors are highly thankful to anonymous referee for valuable comments and kind suggestions. REFERENCES [1] Harary, F. (1972) Graph Theory, Addison Wesley,
Reading, Massachusetts. [2] Beineke, L. W. and Hegde, S. M. (2001), Strongly
multiplicative graphs, Discuss. Math. Graph Theory, 21: 63-75.
[3] Bloom, G. S. and Golomb, S. W. (1977) Applications of numbered undirected graphs, Proceedings of IEEE, 65(4): pp. 562-570.
[4] Gallian, J. A. (2009) A dynamic survey of graph labeling, The Electronics Journal of Combinatorics, 16 #DS6.
[5] Somasundaram, S. and Ponraj, R. (2003) Some results on mean graphs, Pure and Applied Mathematical Sciences, 58: 29-35.
[6] Somasundaram, S. and Ponraj, R. (2004) On mean graphs of order < 5, J. Decision and Mathematical Sciences, 9: 47-58.
[7] Somasundaram, S. and Ponraj, R. (2003) Non existence of mean labeling for a wheel, Bulletin of Pure and Applied Sciences, 22E: 103-111.
[8] Vaidya, S. K. and Lekha, B. (2010) Mean labeling in the context of some graph operations, Int. Journal of Algorithms, Comp. and Math. 3(1): 1-8.
; for 42
n i n+≤ ≤

PRAJÑĀ - Journal of Pure and Applied Sciences, Vol. 18: 117 – 118 (2010) ISSN 0975 - 2595
A GENERALIZATION OF UNITARY DIVISOR FUNCTION
H. B. Modi* and P. B. Trivedi
Department of Mathematics, Bhavnagar University, Bhavnagar-364 022, Gujarat
ABSTRACT
A divisor d of n is called unitary divisor if d and n/d are co-prime. A unitary divisor d of n is called a - unitary divisor if it is co-prime to k. A
unitary divisor d of n is called a - unitary divisor if it is divisible by k. Let
*k#k ( )ntk
* and ( )ntk
#denote the number of -unitary and -
unitary divisor of n respectively. Here the asymptotic behaviour of
*k #k( ) ( )∑
≤
=xn
kk ntxT ** and ( ) ( )∑≤
=xn
kk ntxT ## are studied, when . αpk =
Key words: unitary divisor, square-free divisor, asymptotic behaviour.
INTRODUCTION Let and respectively denote the number of unitary and squarefree divisors of n . Then it can be easily proved that
for each .
( )nt ( )ns
( ) ( )nsnt = nLet . In 1874, Mertens proved that
( ) ( ) ( )( )( ) ( ) (1)
xxOxxxxT log22212
21log
21
+⎟⎟⎠
⎞⎜⎜⎝
⎛ ′−−+=
ζζγ
ζζ
Where ζ is classical Riemann zeta function, ζ ′ is its derivative and γ is Euler’s constant. Cohen([1]) gave a different proof of (1). Gioia and Vaidya ([2]) improved the error-term to ( )xO . That is, (2) Throughout this paper is any fixed prime and p α is any fixed positive integer. In this paper, we find asymptotic formula for ( ) ( )∑
≤
=xn
pp ntxT ##αα
and ( ) ( )∑≤
=xn
pp ntxT **αα ,
where denote the number of unitary divisor of n
which are divisible by and denote the number of
unitary divisor of which are co-prime to .
( )nt p#α
αp ( )nt p*α
n αpModi([3]) proved the case when 1,2 == αp
( ) ( ) ( )( )( ) ( )xOxxxxT +⎟⎟
⎠
⎞⎜⎜⎝
⎛−
′−−+=
32log2
22212
231log
231#
2 ζζγ
ζζ (3)
( ) ( ) ( )( )( ) ( )xOxxxxT +⎟⎟
⎠
⎞⎜⎜⎝
⎛+
′−−+=
32log
22212
232log
232*
2 ζζγ
ζζ (4)
Modi’s method with ‘2’ replaced by ‘p’ can give asymptotic
formula for and ( )xTp# ( )xTp
* . We will make some
odifications in Lemma 3 which enable us to prove: m MAIN THEOREM
( )( ) ( ) ( ) ( )
( )( )
( ) xp
pppp
xxpp
xTp ⎟⎟⎠
⎞⎜⎜⎝
⎛+−+
−′
−−+
++
=−− 1
log122212
211log
211
11# αα
ζζγ
ζζ ααα
( )xO+ (5)
( ) ( ) ( ) ( ) ( )( )( ) ( )xOx
pp
ppxx
ppxTp +⎟⎟
⎠
⎞⎜⎜⎝
⎛+
+′
−−+
++
=1
log22212
21log
21*
ζζγ
ζζα
(6)
PRILIMINARIES We use the following results.
Lemma 1: , where . 1+<≤ mm pxp ( ) ][log xxmm p==Proof is Easy.
Lemma 2: If ( ) ( )∑=
+−=
m
rr
r
p pxA
1
11 and ( ) ( )∑=
+−=
m
rr
r
p prxB
1
11 ,
where ( ) ][log xxmm p== , then
( ) ( ) ( )∑∑
( ) ( )1
11 −++
= xOp
xAp and ( )
( )( )xxO
ppxBp log1
12
−++
= .
Proof:
( ) ( )( )( )
( ) ( )nm
mm
p pOppppp
pp
xA /11
111
11
1/11
/111 1
++
=+
−+
+=
−−−−
=+
Using ( )1log][log Oxxm pp +== , we get
( ) ( )1
11 −++
= xOp
xA p
.
Now, we have
( ) ( )( )1
11 221
−−−
+−
=∑=
nnaaa
aa
aia nn
i
i for 1≠a .
Taking p
a 1−=
and mn = , we get
( ) ( )( ) ( )
( ) ⎟⎟⎠
⎞⎜⎜⎝
⎛+
+−
+−
+=−−= ∑
=
11/111
/1 221
mp
ppp
pp
ppixB mm
i
ip
.
Using ( )1log][log Oxxm pp +== , we get
( )( )
( )xxOp
pxBp log1
12
−++
=.
Lemma 3: (a) ( ) (xTx )pp** =αT .
(b)( ) ⎟⎟
⎠
⎞⎜⎜⎝
⎛=⎟⎟
⎠
⎞⎜⎜⎝
⎛=⎟⎟
⎠
⎞⎜⎜⎝
⎛= −1
#**#ααα αα
pxT
pxT
pxTxT pppp
.
Proof: (a) is clear.
(b) ( )xTp#α
= ( ) ( ) apbaxabNNba |,1,gcd,:, α=≤×∈
= ( ) ( ) 1,gcd,:, =≤×∈ bkpxkbpNNbkp ααα
*Corresponding author – [email protected]
≤≤ xnxn
T == nsntx
( ) ( ) ( )( )( ) ( )xOxxxx +⎟⎟
⎠
⎞⎜⎜⎝
⎛ ′−−+=
22212
21log
21
ζζ
ζζT γ

118 PRAJÑĀ – Journal of Pure and Applied Sciences 18: 112 -114 December = ( ) ( ) ( ) 1,gcd,1,gcd,/:, ==≤×∈ bpbkpxkbNNbk α
=⎟⎟⎠
⎞⎜⎜⎝
⎛αp
xTp*
=⎟⎟⎠
⎞⎜⎜⎝
⎛αα
pxTp
*.
Using this we get
( )xTpxT
pxT ppp
#*1
#ααα =⎟⎟
⎠
⎞⎜⎜⎝
⎛=⎟⎟
⎠
⎞⎜⎜⎝
⎛−
.
PROOF OF THE MAIN THEOREM It is clear that
( ) ( ) ( )xTxTxT pp*# −= (7)
Using Lemma 3,
( ) ⎟⎟⎠
⎞⎜⎜⎝
⎛−⎟⎟
⎠
⎞⎜⎜⎝
⎛=
pxT
pxTxT pp
##.
So
⎟⎟⎠
⎞⎜⎜⎝
⎛−⎟⎟
⎠
⎞⎜⎜⎝
⎛=⎟⎟
⎠
⎞⎜⎜⎝
⎛2
#2
#
pxT
pxT
pxT pp
.
Hence
( ) ⎟⎟⎠
⎞⎜⎜⎝
⎛+⎟⎟
⎠
⎞⎜⎜⎝
⎛−⎟⎟
⎠
⎞⎜⎜⎝
⎛= 2
#2
#
pxT
pxT
pxTxT pp
.
Continuing the process and using Lemma 1, we get
( ) ( )∑=
+⎟⎟⎠
⎞⎜⎜⎝
⎛−=
m
rr
rp p
xTxT1
1# 1.
Using (2), we get ( )
( ) ( ) ( )( )( )
( ) ( ) ( ) ( ) ( )( )( ) ( ) ( ),22212
21
2loglog
21
22212
21log
211
1
1
#
xOxxAxxBpxxxA
pxO
px
px
px
xT
ppp
m
rrrrr
r
p
+⎟⎟⎠
⎞⎜⎜⎝
⎛ ′−−+−=
⎪⎭
⎪⎬⎫
⎪⎩
⎪⎨⎧
⎟⎟⎠
⎞⎜⎜⎝
⎛+⎟⎟
⎠
⎞⎜⎜⎝
⎛ ′−−+−= ∑
=
+
ζζγ
ζζζ
ζζγ
ζζ
where and are as in Lemma 2. ( )xAp ( )xBp
Using Lemma 2, we get
( ) ( ) ( ) ( ) ( )( )( ) ( )xOx
ppp
pxx
pxTp +⎟⎟
⎠
⎞⎜⎜⎝
⎛+
−′
−−+
++
=1
log22212
211log
211#
ζζγ
ζζ
(8) Using Lemma 3(b) and (8), (5) follows. U
sing Lemma 3(a), (7) and (8), we will get (6).
REMARK Let ( )nsk
* denote the number of square-free divisors of n
which are co-prime to and let denote the number of
square-free divisors of which are divisible by .Then it can be easily shown that:
k ( )nsk#
n k
(a) ( ) ( )ntns kk** = for all Nnk ∈,
(b) If is square-free then for all k ( ) ( )ntns kk## = Nn∈
(c) If k is not square-free then for all ( ) 0# =nsk Nn∈ Hence,
( ) ( ) ( ) ( ) ( ) ( )( )( ) ( )xOx
pp
ppxx
ppnsxS
xnpp
+⎟⎟⎠
⎞⎜⎜⎝
⎛+
+′
−−+
++
== ∑≤ 1
log22212
21log
21**
ζζγ
ζζαα
( ) ( ) ( ) ( ) ( ) ( )( )( ) ( )xOx
ppp
pxx
pnsxS
xnpp +⎟⎟
⎠
⎞⎜⎜⎝
⎛+
−′
−−+
++
== ∑≤ 1
log22212
211log
211##
ζζγ
ζζ
( ) 0# =xS pα for 1≥α
REFERENCES [1] Cohen, E. (1960) The number of Unitary Divisors of an
Integer. American Mathematical Monthly, 67: 879 – 880.
[2] Gioia A. and Vaidya A. (1966) The Number of Square-free Divisors of an Integer. Duke Mathematical Journal, 33: 797 – 799.
[3] Modi H. B. (2005) The Number of Even and Odd Unitary Divisors of an Integer. Mathematics Today, 21: 59 – 62.

TEMPERATURE DEPENDENT TRANSPORT AND BARRIER PROPERTIES
OF DVT GROWN WSe2CRYSTALS AND SCHOTTKY DEVICES
Mayur Patel1*, K. D. Patel1, C. A. Patel2, K. K. Patel3, V. M. Pathak1 and R. Srivastava1
1Department of Physics, Sardar Patel University, Vallabh Vidyanagar – 388120, Gujarat, INDIA 2Smt M. G. Patel Science College, Pilvai – 382850, North Gujararat, INDIA
3Smt. S. M. Panchal Science College, Talod – 383215, North Gujarat, INDIA
ABSTRACT Single crystals of Tungsten diselenide (WSe2) have been grown using direct vapour transport technique (DVT). Measurements of thermoelectric power in temperature range 300 – 673K confirms that WSe2 possess a p-type conductivity. The Ohmic cotacts were developed using Ag-paste and the Hall effect measurements have been carried out in the temperature range 10 - 300 K to determine some essential parameters such as the hole mobility (μh), carrier concentration (n), Hall coefficient (RH). The DVT grown crystals were also used to fabricate Schottky junction with thermally evaporated Indium contacts and the diode behavior was characterized over temperature in range 200 – 310K. The thermoelectric and electrical properties variation with temperature and temperature variation of diode parameters are discussed. Key words: TMDC crystals, Thermoelectric power, Hall effect, In/WSe2 Schottky diode.
INTRODUCTION TMDC have a general formula MX2, where M is usually a
transition metal atom from group of IVB, VB, VIB of the periodic table and X is one of atoms from sulfur, selenium, or tellurium. The layered structure of TMDC can be regarded as stacking of two-dimensional X-M-X sandwiches. The bonding within each sandwiched layer is covalent, while the bonding between them is weak van der Waals type. The crystal structures of the layered TMDC are usually described as belonging to 1T, 2H, 3R, 4H2, 4Hb, 6R phases [1, 2]. TMDCs have been used for many years as solid state lubricants [3], photovoltaic/photocatalytic solar energy converters [4], Schottky and liquid junction solar cells [5, 6], catalysts in many industrial applications and in secondary batteries etc. Increasing potential for use of transition metal dichalcogenide materials in Schottky devices, photovoltaic and photoelectrochemical (PEC) solar cells is because of their inherent resistive nature to photo corrosion. They have also found use in Schottky barrier devices, photovoltaic and photoelectrochemical solar cells as a flexible electronic material in recent years [7].
Looking to potential for such diverse applications of
having opaque appearance with perfectly shining surfaces. These grown crystals were first characterized by thermoelectric
power measurement in 300 – 673K temperature range using a setup developed for this purposes. These crystals were also characterized using Hall effect measurement setup (Lakeshore - 7504) in temperature range 10 – 300K to estimate the carrier concentration, hole mobility, Hall coefficient and resistivity.
Indium thin film of 500Å thickness was deposited through a thin metal mask having area around of 0.186 cm2 on well cleaned WSe2 single crystals using vacuum evaporation technique with pressure better than 10-5 torr. Low temperature I – V characteristic of Schottky diode was measured using Keithley 2400 SMU and a liquid nitrogen cryostat in temperature range 200 – 310K.
RESULTS AND DISCUSSIONS Thermoelectric Power measurement
The variation of thermoelectric power ‘S’ for WSe2 crystals as a function of inverse temperature in the range of 300 K to 673 K is shown in Fig. 1. It is observed that TEP increases with temperature, indicating the typical semiconducting behavior of the WSe2. Moreover, the sign of TEP is found to be positive for WSe2 indicating that grown crystals possess p- type semiconducting character.
Fig. 1 Thermoelectric power variation with inverse of temperature for DVT grown WSe2 crystals.
PRAJÑĀ - Journal of Pure and Applied Sciences, Vol. 18: 119 - 122 (2010) ISSN 0975 - 2595
TMDCs, we have chosen to study WSe2 semi-conducting materials of group VI. Successful growth of single crystals of WSe2 has been reported earlier [8] for the measurements of photoelectric and electrical properties. Here we report the electrical transport properties of WSe2 crystals evaluated from the high temperature thermoelectric power and Hall effect measurements. These investigations can yield valuable information about their electronic properties. The Schottky diode, fabricated on WSe2 single crystal with Indium thin films has also been characterized to estimate the Schottky barrier parameters in the temperature range 200 – 310K. EXPERIMENTAL
The single crystals of WSe2 were grown by direct vapour transport technique using a two zone horizontal furnace. The crystals grown were found to be in the form of thin platelets
* Corresponding author: [email protected]

120 PRAJÑĀ – Journal of Pure and Applied Sciences 18: 119 - 122 December
To analyze the temperature dependence of the thermoelectric power of a p-type semiconductor, the expression given by Mohanchandra and Uchil [9] and Goldsmid [10] given below has been used:
FEkS Ae k T
⎡ ⎤= − +⎢⎣ ⎥⎦
(1)
here k is the Boltzmann constant, e is the electronic charge, A the constant determined by the dominant scattering process and EF is the separation of the Fermi level from the top of the valance band. Table - 1 shows the calculated thermoelectric parameters from these measurements.
Table – 1 Parameters from TEP measurement on DVT grown
WSe2 crystals.
Majority carrier
conductivity Type
Fermi energy
EF
( eV)
Effective Density of
State N (m-3)
Effective
Mass Mh* (Kg)
mh*/mh
Scattering Parameter
s
p - Type 0.0521 6.683 × 1024
7.600 × 10⁻³¹ 0.83 2.48
Low Temperature Hall Effect
The Ohmic nature of contacts prepared for van der Pauw geometry in case of various pairs of contacts at 300 K is shown in the Fig. 2. It is seen from here that Ag-paste contacts exhibit good Ohmic nature for both polarity in a large current range. The average van der Pauw factor for a set of four contacts is found to be 0.7. This deviation from ideal requirement of unity probably originates from the anisotropic nature of WSe2 and not from other conditions required for measurements using van der Pauw technique.
The resistivity (ρ), Hall coefficient (RH), carrier density (n)
and mobility (μ) of WSe2 single crystals were calculated from the measured I – V values under magnetic field of 3kG using the standard formula over the temperature range of 10K to 300K and the results are tabulated in Table - 2.
Fig. 2 I - V Characteristics of the Pair of ohmic contacts (12,12), (23,23), (34,34) and (41,41) prepared by Ag paste (Elteck-1228) on DVT grown WSe2 crystals.
Figs. 3 and 4 show the variation of Resistivity, Hall
Coefficient and Carrier concentration with respect to inverse of temperature. From these figures it is clearly seen that resistivity is decreasing monotonically with increasing temperature above around 90K which confirms the semiconducting nature of WSe2 crystals. The anomalous
semiconducting behavior below 90K is reflected in mobility also and seems to be related to changes in the carrier scattering mechanism. However carrier concentration is increasing with increasing temperature.
Table - 2: Hall parameters of DVT grown WSe2 crystals.
Temp. T(K)
Resistivity ρ (Ω.cm)
Carrier Density n (cm-3)
Hall coefficient RH (cm3/C)
Mobility μ(cm2/Vs)
300 2.797 1.032×10¹⁸ 6.049 2.141 290 2.918 6.554×10P17 9.524 3.266 270 3.077 2.924×10¹⁸ 2.135 0.695 250 3.309 5.443×10¹⁷ 11.47 3.464 230 3.639 1.297×10¹⁷ 48.12 13.22 210 4.259 8.187×10¹⁶ 76.25 17.91 190 5.101 5.410×10¹⁶ 115.4 22.65 170 6.557 9.967×10¹⁶ 62.63 9.632 150 8.913 2.226×10¹⁶ 280.5 31.46 130 13.02 9.088×10¹⁵ 686.9 50.85 110 18.447 9.215×10¹⁵ 677.4 2.852 90 19.734 1.147×10¹⁵ 5444 113.7 70 1.624 1.085×10¹⁵ 5754 185.7× 10²
50 1461 9.81×10¹³ 63630 183.8 30 1754 5.324×10¹² 1173×103 67.58 10 5938 2.363×10¹¹ 26420× 103 3205× 102
H 2
Fig. 4: Carrier concentration vs. 1000/T for p-WSe2 Crystals.
Fig. 3: R and ρ of p - WSe Crystals as a function of 1000/T.

121 Patel et al. – Temperature dependent transport December
I – V characteristics of In/p-WSe2 Schottky diode The nature of the I-V characteristics of one of the
In/pWSe2 Schottky diodes at different temperatures is shown in
Fig. 5 I-V Characteristic of In/pWSe2 Schottky diode at different temperatures.
Based on thermionic emission theory, the current–voltage
characteristic of a metal-semiconductor contact is given by [11]
Fig. 5.
( ) ( )0 exp 1 exp (2)s sq V IR q V IR
I IkT kTη
⎡ ⎤− − −⎡ ⎤ ⎛ ⎞= −⎢ ⎥⎜ ⎟⎢ ⎥
⎢ ⎥⎣ ⎦ ⎝ ⎠⎣ ⎦ where I is the saturation current given by, 0
* 2 00 e x p ( 3 )bqI A A T
k Tφ⎡ ⎤= ⎢ ⎥⎣ ⎦
Here symbols have their usual meaning and A* is the
Richardson constant which is equal to 27.6 Acm-2K-2 for p-type WSe2 [12]. From Eq. (2), ideality factor η and zero bias barrier height (Фb0) can be calculated using standard relationship. The flat band barrier height can also be calculated using the following equation,
( )0 1 ln ( 4Vb f b
A
NkTq N
φ η φ η⎡ ⎤
= − − ⎢ ⎥⎣ ⎦
)
where Nv and NA (=n) are effective density of states and
carrier concentration. The experimental values of η, Φb0 and Φbf were determined from intercept and slope of the forward-bias ln I vs V plot (Fig. 5) at each temperature. It is found that the value of η increased and the value of Φb0 decreased with decrease in temperature (Fig. 6).
Since current transport across the MS interface is a
temperature activated process, electrons at low temperatures are able to surmount the lower barriers and therefore current transport will be dominated by current flowing through patches of the lower Schottky barrier heights (SBH) that results in larger ideality factor [13]. Series resistance of diode is seen to be contributing in deterioration in the nature of I – V characteristics at higher voltages and the variation of series resistance is shown in Fig. 7. CONCLUSION
The single crystals of WSe2 grown by a direct vapour
transport technique are found to have a p- type (WSe2) semiconducting nature. The value of scattering parameter is nearly ≈ 2.48 which shows
Fig. 6 Variation of Φb0, Φbf and η with temperature for In/pWSe2 Schottky diode at different temperatures.
2different temperatures.
that the defect scattering dominates the charge transport mechanism in the grown crystals. The value of effective density of states is found to be around 6.68×1024
m-3. The effective mass of charge carriers mh
* was calculated and is found to be around 7.6×10⁻³¹
Kg. All these estimated parameters are in good agreement with the reported values in the literature [14-17].
The sign of Hall coefficient remains positive in the entire
range of measurement temperature, indicating the conductivity type of the crystals as p-type and it is in agreement with the TEP measurements. This again shows that the quality of ohmic contacts made for present investigations is good and stable throughout the range of reported measurements. The conductivity of the sample decreases with the temperature and thus again confirms the semiconducting nature of the grown WSe2 crystals. The measured carrier concentration at room temperature is 1.032×1018 cm–3. This is in agreement with the reported value of 3.5x1018 cm–3 [18].
In/pWSe2 Schottky diodes have been fabricated and
studied in the temperature range of 200 - 300 K for their I-V characteristics. The zero bias barrier height decreases while the ideality factor increases with temperature. The increment in series resistance with decreasing temperature also exhibits a semiconducting nature of DVT grown crystals as contacts are seen to be Ohmic.
Fig. 7 Variation of Series resistance for In/pWSe Schottky diode at

122 PRAJÑĀ – Journal of Pure and Applied Sciences 18: 119 - 122 December
ACKNOWLEDGEMENT Authors are thankful to SICART for providing technical
services to characterize materials. Financial support received in the form of UGC major research project (Grant reference no. : F33-8/2007(SR)) by Dr. K. D. Patel is thankfully acknowledged.
REFERENCES [1] Wilson, J. A. and Yoffe, A. D., (1969) The transition
metal dichalcogenides discussion and interpretation of the observed optical, electrical and structural properties. Adv.Phys.18:193-335.
[2] Friend, R. H. and Yoffe, A. D., (1978) Electronic properties of intercalation complexes of the transition metal dichalcogenides. Adv. Phys., 36: 1.
[3] Subbarao, C. V., Sunandana, C. S., Honing, J. M, and Rao, C. N., (1981) Preparation and Charectrization of materials, Acadmic Press, London, pp. 269 - 271.
[4] Tributsch, H.,(1978) Hole Reactions from d-Energy Bands of Layer Type Group VI Transition Metal Dichalcogenides: New Perspectives for Electrochemical Solar Energy Conversion, J. Electrochem. Soc, 125: 1086 - 1093.
[5] Spah, R., Lux-Steiner, M., Obergfelt, M., Bucher, E and Wagner, S., n-MoSe2/p-WSe2 heterojunctions. (1985) Appl. Phys. Lett, 47: 871 - 873.
[6] Parkinson, B. A., Furtak, T. E., Canficld, D., Kam, K. K. and Kline, G., (1980) Evaluation and reduction of efficiency losses at tungsten diselenide photoanodes, Chem. Soc, 70: 233 - 245.
[7] Deshpande, M. P., (1998) Growth, characterisation and photoelectrochemical studies of intercalated tungsten diselenide single crystals. Proceeding of Solid State Physics Symposium, 41: 97-98.
[8] Agarwal, M. K., Patcl, P. D., Patel, J. V. and Kshatriya, J. D., (1984) Electron microscopy of layered single crystals grown by direct vapour transport method. Bull. Mat. Sci., 6: 549-567.
[9] Mahanchandra, K, P. and Uchil, J., (1997) Thermoelectric power of CdS and CdSe films deposited on vibrating substrates. Thin Solid Films, 305:124 - 129.
[10] Goldsmid, H. J., (1950) Application in Thermoelectricity, Methuen Monograph, London, pp - 252-255.
[11] Rhoderick, E. H., (1988) Metal-Semiconductor Contacts. Oxford press, Clarendon 2nd edition, pp.-10-50.
[12] Klein, A., Photovoltaic properties of WSe2 single-crystals studied by photoelectron spectroscopy. (1998) Sol. Energ. Mater. Sol. Cells, 51:181-191.
[13] Hudait, M. K., Venkateswarlu, P, and Kmpanidhi, S. B., Electrical transport characteristics of Au/n-GaAs Schottky diodes on n-Ge at low temperatures (2001), Solid-State Electron. 45: 133 -139.
[14] Patel, Mayur M., (2008) Design and Fabrication of PC based Thermoelectric Power Measurement System, M.Phil dissertation, Sardar Patel University, pp. – 117.
[15] Solanki, G. K., Gujarathi, D. R., Deshpande, M. P., Lakshminarayana, D. and Agarwal, M. K., (2008) Transport property measurements in tungsten sulphoselcnide single crystals grown by a CVT technique. Crys. Res. Technology, 43(2): 179 - 185.
[16] Makhija, Deepa, Patel, Mayur M., Jani, M. S. and Jakhmola, P. R., (2008) Thermoelectric power of tungsten diselenide crystals grown by a direct vapour transport technique. Prajna' - Journal of Pure & Applied Sciences, 16: 172 - 177.
[17] Solanki, G. K., Vashi, M. N., Patel, Y. A., Unadkat, Sandip and Agarwal, M. K.; (2008) Transport property measurements in off-stoichiometric tungsten selenide single crystals grown by a dvt technique. Chalco, Lett. 5: 397 - 404.
[18] Patel, K. D., Sumesh, C. K., Mathai, Achamma John, Pathak, V. M. and Srivastava, R., (2008) Low temperature transport properties of p-wse2 single crystals. Prajna' - Journal of Pure & Applied Sciences, 16: 101-109.
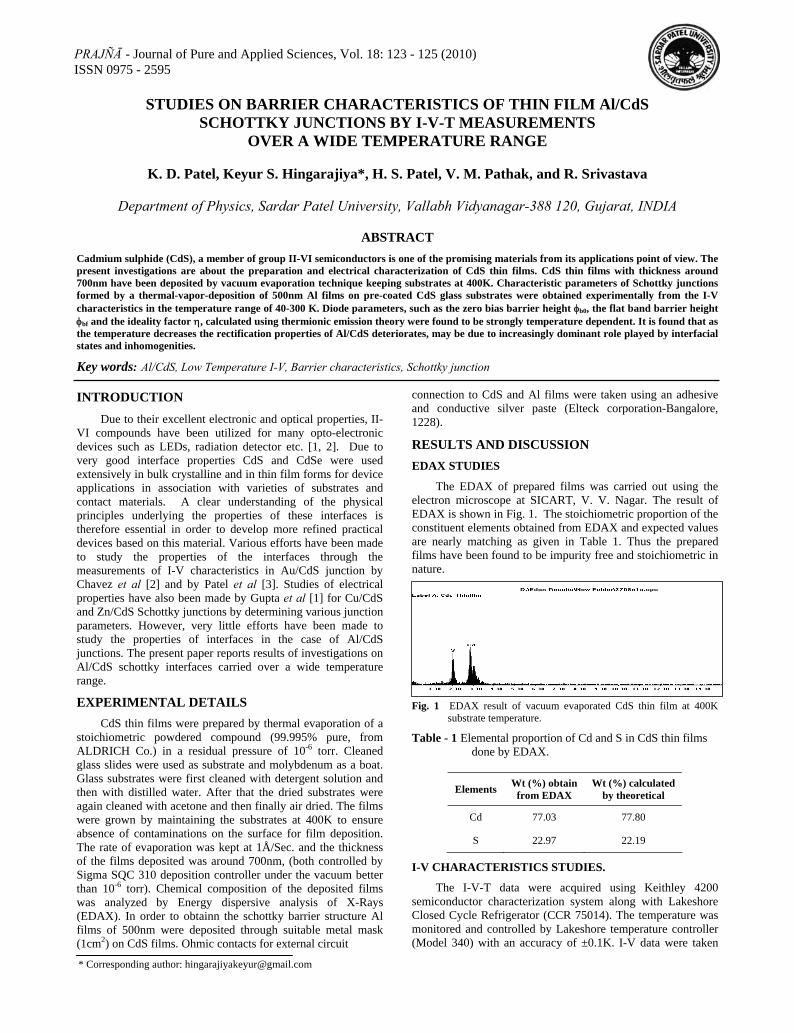
STUDIES ON BARRIER CHARACTERISTICS OF THIN FILM Al/CdS
SCHOTTKY JUNCTIONS BY I-V-T MEASUREMENTS OVER A WIDE TEMPERATURE RANGE
K. D. Patel, Keyur S. Hingarajiya*, H. S. Patel, V. M. Pathak, and R. Srivastava
Department of Physics, Sardar Patel University, Vallabh Vidyanagar-388 120, Gujarat, INDIA
ABSTRACT
Cadmium sulphide (CdS), a member of group II-VI semiconductors is one of the promising materials from its applications point of view. The present investigations are about the preparation and electrical characterization of CdS thin films. CdS thin films with thickness around 700nm have been deposited by vacuum evaporation technique keeping substrates at 400K. Characteristic parameters of Schottky junctions formed by a thermal-vapor-deposition of 500nm Al films on pre-coated CdS glass substrates were obtained experimentally from the I-V characteristics in the temperature range of 40-300 K. Diode parameters, such as the zero bias barrier height φb0, the flat band barrier height φbf and the ideality factor η, calculated using thermionic emission theory were found to be strongly temperature dependent. It is found that as the temperature decreases the rectification properties of Al/CdS deteriorates, may be due to increasingly dominant role played by interfacial states and inhomogenities. Key words: Al/CdS, Low Temperature I-V, Barrier characteristics, Schottky junction
INTRODUCTION
Due to their excellent electronic and optical properties, II-VI compounds have been utilized for many opto-electronic devices such as LEDs, radiation detector etc. [1, 2]. Due to very good interface properties CdS and CdSe were used extensively in bulk crystalline and in thin film forms for device applications in association with varieties of substrates and contact materials. A clear understanding of the physical principles underlying the properties of these interfaces is therefore essential in order to develop more refined practical devices based on this material. Various efforts have been made to study the properties of the interfaces through the measurements of I-V characteristics in Au/CdS junction by
CdS thin films were prepared by thermal evaporation of a
stoichiometric powdered compound (99.995% pure, from ALDRICH Co.) in a residual pressure of 10-6 torr. Cleaned glass slides were used as substrate and molybdenum as a boat. Glass substrates were first cleaned with detergent solution and then with distilled water. After that the dried substrates were again cleaned with acetone and then finally air dried. The films were grown by maintaining the substrates at 400K to ensure absence of contaminations on the surface for film deposition. The rate of evaporation was kept at 1Å/Sec. and the thickness of the films deposited was around 700nm, (both controlled by Sigma SQC 310 deposition controller under the vacuum better than 10-6 torr). Chemical composition of the deposited films was analyzed by Energy dispersive analysis of X-Rays (EDAX). In order to obtainn the schottky barrier structure Al films of 500nm were deposited through suitable metal mask (1cm2) on CdS films. Ohmic contacts for external circuit
connection to CdS and Al films were taken using an adhesive and conductive silver paste (Elteck corporation-Bangalore, 1228). RESULTS AND DISCUSSION EDAX STUDIES
The EDAX of prepared films was carried out using the
electron microscope at SICART, V. V. Nagar. The result of EDAX is shown in Fig. 1. The stoichiometric proportion of the constituent elements obtained from EDAX and expected values are nearly matching as given in Table 1. Thus the prepared films have been found to be impurity free and stoichiometric in nature.
Fig. 1 EDAX result of vacuum evaporated CdS thin film at 400K substrate temperature.
Table - 1 Elemental proportion of Cd and S in CdS thin films
done by EDAX.
Elements Wt (%) obtain from EDAX
Wt (%) calculated by theoretical
Chavez et al [2] and by Patel et al [3]. Studies of electrical properties have also been made by Gupta et al [1] for Cu/CdS and Zn/CdS Schottky junctions by determining various junction parameters. However, very little efforts have been made to study the properties of interfaces in the case of Al/CdS junctions. The present paper reports results of investigations on Al/CdS schottky interfaces carried over a wide temperature range. EXPERIMENTAL DETAILS
Cd 77.03 77.80
S 22.97 22.19 I-V CHARACTERISTICS STUDIES.
The I-V-T data were acquired using Keithley 4200 semiconductor characterization system along with Lakeshore Closed Cycle Refrigerator (CCR 75014). The temperature was monitored and controlled by Lakeshore temperature controller (Model 340) with an accuracy of ±0.1K. I-V data were taken
PRAJÑĀ - Journal of Pure and Applied Sciences, Vol. 18: 123 - 125 (2010) ISSN 0975 - 2595
* Corresponding author: [email protected]

124 PRAJÑĀ – Journal of Pure and Applied Sciences 18: 123 - 125 December
from 300 K down to 40 K at an interval of 20 K. The measured I-V characteristics in the temperature range 300-40 K are shown in Fig. 2.
Fig. 2 lnI-V characteristic of Al/CdS Schottky barrier in the temperature range 300-40K.
From Fig. 2 it is seen that the current under forward bias is
relatively high. These junctions also show a reduced rectification ratio 31 (V=2.5V) at 300 K, a consequence of the unsaturated current under reverse bias [4]. The diodes show an abnormal inversion of their rectification properties and the reverse-bias current is higher than the forward-bias current below 200K.
Current transport through the Schottky barrier diode is mainly due to majority carriers and obeying the thermionic emission model [5, 6] at low forward biases V. The current in such cases can be expressed as
0 e x p 1q VI Ik Tη
⎡ ⎛ ⎞= −⎢ ⎜ ⎟
⎝ ⎠⎣
⎤⎥⎦
(1)
where q is the electron charge, η is the ideality factor, k is the Boltzmann constant, T is the absolute temperature, Io is the reverse saturation current. The values of I0 were obtained by extrapolation of the low forward bias linear region of lnI-V curves to zero applied voltage and were used to calculate the zero bias barrier height φb0 from Eq. 2.
* 2
00
l nbk T A A T
q Iφ
⎛ ⎞= ⎜ ⎟
⎝
⎠
(2)
Where A is the diode area (1 cm2), A* is the Richardson constant (23.4 A/K2cm2) [6]. The ideality factor is given by
( )q d V
k T d l n Iη
⎛ ⎞= ⎜ ⎟⎜ ⎟
⎝
⎠
(3)
The ideality factor was calculated from the slope of the linear region of the forward lnI-V characteristics (fig.2.). The flat band barrier height φ is given by bf
( )0 1 n Ab f b
C
Nk T lq N
φ η φ η⎡ ⎤⎛ ⎞
= − −⎢ ⎥⎜ ⎟⎝ ⎠⎣ ⎦
(4)
Where NA is effective density of state and NC is carrier concentration.
The zero-bias barrier height φb0 decreased with decreasing
temperature and flat band barrier height φbf increased with decreasing temperature as shown in Fig. 3. Various factors can contribute to a reduction in zero bias barrier height at lower temperatures such as non homogeneity present at Al/CdS
interface, generation and recombination currents in the space charge region, the effect of the image force, and, at low temperatures, tunneling processes and thermally assisted tunneling processes from states in the forbidden gap. The ideality factor η tends to decrease showing decreasing non-ideal behavior with increasing temperature as shown in Fig 3. This behavior may be due to current transport across the Al/CdS interface as a result of a thermally activated process because at low temperatures the electrons are able to surmount the lower barriers.[7] Therefore, current transport will be dominated by current flowing through patches with a lower Schottky barrier height and a greater ideality factor. The value of ideality factor greater than unity is also associated with Fermi-level pinning at the interface [8-10] or relatively large voltage drops in interface region. Interfacial oxide layer may also be the possible cause for higher value of ideality factor [11].
Fig. 3Variation of η, φb0 and φbf with a temperature. CONCLUSIONS
Measurement of I–V characteristics of Al/CdS Schottky barriers in the temperature range 40–300K shows that low voltage I-V characteristics follow a thermionic emission mechanism under both forward and the reverse bias conditions. The diodes show an abnormal inversion of their rectification properties below 200K and the reverse-bias current is higher than the forward-bias current. The zero-bias barrier height φb0 decreases, ideality factor η increases with decrease in temperature. The changes are quite significant at lower temperatures as reflected in the flat-band barrier height φbf which is always larger than zero-bias barrier height φb0. The deviation from thermionic emission model at lower temperatures seems to be related to various kind of mechanisms e. g. inhomogenities, thermally assisted tunneling etc. ACKNOWLEDGMENTS
Authors are thankful to Sophisticated Instrumentation
Centre for Applied Research and Testing (SICART) for providing technical services to characterize materials. Financial support received in the form of UGC major research project (Grant reference No. : F33-8/2007(SR)) by Dr. K. D. Patel is thankfully acknowledged. REFERENCES [1] Gupta, Sandhya, Patidar, Dinesh, Baboo, Mahesh,
Sharma, Kananbala and Saxena, N. S. (2010) Investigation of Al Schottky junction on n-type CdS film deposited on polymer substrate. Engineering Frontiers of Optoelectronics in China, 3: 321-327.

2010 Patel et al. – Studies on barrier characteristics 125
[2] Chavez, H., Jorden, M., McClure, J. C., Lush, G. and Singh., V. P. (1997) Physical and electrical characterization of CdS films deposited by vacuum evaporation, solution growth and spray pyrolysis. Journal of Material Science: Materials in electronics, 8: 151-154.
[3] Patel, B. K., Nanda, K. K. and Sahu, S. N. (1999) Interface characterization of nanocrystalline CdS/Au junction by current–voltage and capacitance–voltage studies. Journal of Applied Physics, 85: 3666-3670.
[4] Rodrigues, A. M., Gomes H. L., Stallinga, P., Pereira, L. and Pereira, E. (2001) Electrical characterization of CVD diamond–n+ silicon junctions. Diamond Relat. Mater., 10: 858 - 860.
[5] Tung, R. T., Sullivan, J. P. and Schrey, F. (2001) On the inhomogeneity of Schottky barriers. Mater. Sci. and Eng. B, 14: 266-280.
[6] E. H. Rhoderick and R. H. Williams, (1988) Metal-Semiconductor Contacts, 2nd Ed., Clarendon, Oxford.
[7] Karadeniz, S., Tu-luo-lu, N., Sahin, M. and Safak, H. (2005) Series resistance calculation for Ag contacts on single crystal layered p-SnS and p-SnSe compound semiconductors in the wide temperature range. Micro electron. Eng., 81: 125 - 129.
[8] Brillson, L. J. (1978) Chemical reactions and local charge redistribution at metal-CdS and CdSe interfaces. Physical Review B, 18: 2431-2446.
[9] Tersoff, J. (1984) Schottky Barrier Heights and the Continuum of Gap States. Physical Review Letters, 52: 465-468.
[10] Tersoff, J. (1985) Schottky barriers and semiconductor band structures. Physical Review B, 32: 6968-6971.
[11] Pattabi, M., Krishnan, S., Ganesh and Mathew, X. (2007) Effect of temperature and electron irradiation on the I-V characteristics of Au/CdTe Schottky diodes. Solar Energy, 81: 111 - 114.

CHARACTERIZATION OF THERMALLY EVAPORATED
ZnTe THIN FILMS
K. D. Patel1, J. R. Rathod2*, H. S. Patel1, V. M. Pathak1 and R. Srivastava1
1Department of Physics, Sardar Patel University, Vallabh Vidyanagar 388 120 Gujarat INDIA,
2Dr. Jivraj Mehta Institute of Technology, Mogar-388 340, Anand, Gujarat, INDIA
ABSTRACT Thin films of ZnTe with thicknesses around 8kÅ and 10kÅ have been deposited by thermal evaporation technique on the ultrasonically cleaned glass substrates kept at 373K. The thicknesses of the films were measured using quartz crystal thickness monitor. The structure of ZnTe thin films was investigated by Transmission Electron Microscopy (TEM). This reveals that films have polycrystalline nature with cubic phase. The band tail energy was estimated from optical absorption curves. The electrical resistivity of the films has been investigated as a function of temperature using Lakeshore-7504 Hall measurement set-up. The results of all these studied parameters are presented and discussed in this paper. Key words: electrical resistivity, polycrystalline, optical characterization, Band tail.
INTRODUCTION Since last two decades, much interest has been shown in
semiconducting group II - VI compounds, especially zinc chalcogenides because of their potential towards various applications in electronics [1]. ZnTe is a compound semiconducting material with a band gap around 2.26eV at room temperature [2]. The applications such as opto refractive material for optical data processing [3], non-polarized memory switching [4] and γ-ray detectors have been found to be viable in today’s technology. In present paper, the authors report their findings regarding the thin film preparation of ZnTe and its optical as well as electrical characterization. EXPERIMENTAL
Zinc Telluride powder (99.99% pure, sigma Aldrich Chemicals Company) was evaporated from a tantalum boat under a vacuum of 5 × 10⁻⁶ torr. The ZnTe films were deposited on the ultrasonically-cleaned glass substrates maintained at 373K during evaporation. The rate of evaporation, in the range of 2-5 Ǻ/sec, was maintained to deposit films of good quality and uniform thickness. Thicknesses of the films were measured during the deposition process by quartz crystal thickness monitor (“Hind Hivac” Digital Thickness Monitor Model–DTM–101). The TEM was carried using Philips, Netherlands (Model: Tecnai 20) electron microscope. The optical absorption spectra of these films were recorded using a UV–VIS-NIR spectrophotometer (Perkin Elmer USA, Model: Lambda 19). The electrical resistivity of ZnTe thin films were investigated using software controlled Lakeshore-7504 Hall measurement set-up.
RESULTS AND DISCUSSIONS
Diffraction patterns obtained by transmission electron
microscopy on two films of thicknesses 8kÅ (Sample No. A) and 10kÅ (Sample No. B) Have been shown in Fig. 1. Using these diffraction patterns the indexing of reflections and the d-values were calculated and the results are presented in Table 1.
This table also contain the d-values obtained from standard
JCPDS data. From here it can be seen that there is a good match between the calculated d-values and the standard ones [5].
Moreover the deposited ZnTe films possess the cubic
structure [6].
Table - 1 d-values for ZnTe films.
Ring No./ Sample No.
Diameter of ring
D cm
Calculated d (=2λL/D) values
(Å)
Standard d-values
(Å)
h k l
1/A 4.648 3.536 3.523 1 1 1
2/A 6.350 2.589 2.572 1 0 2
3/A 7.770 2.115 2.159 2 2 0
4/A 10.579 1.554 1.526 4 0 0
1/B 4.660 3.527 3.523 1 1 1
2/B 6.350 2.589 2.572 1 0 2 Polycrystalline films are generally considered to consist
of crystallites joined together by grain boundaries. The grain boundary regions are disordered regions, characterized by the presence of a large number of defect states due to incomplete atomic bonding. As a result, the diffraction rings with increasing distance due to the higher lattice parameter of ZnTe are observed [7].
The optical characterization was carried to investigate the
nature of optical transmissions of carriers involved in the absorption of photons. According to the standard equation, the absorption coefficient (α) is given as, α = Aα ( hν-Eg ) r/ hν (1) where hν is photon energy, gE is the energy bandgap and Aα
is a characteristic parameter, independent of photon energy, for respective transitions. The transitions of carriers due to the incidence of photons can be assigned as direct or indirect in nature depending upon the value of r.
PRAJÑĀ - Journal of Pure and Applied Sciences, Vol. 18: 126 – 128 (2010) ISSN 0975 - 2595
* Corresponding author: [email protected]

2010 Patel et al. – Charecterization of thermally evoparated 127
The calculated values of absorption coefficient corresponding to each energy of incident photons give a good absorption edge. For r =1/2 which confirms the direct nature of the optical transitions of carriers in ZnTe thin films. The plot of (α
Fig. 1 Electron diffraction pattern for films having thicknesses 8kÅ (a)
and 10kÅ (b) respectively.
hν )2 vs hν for the films are shown in Fig..2.The intercept of a straight line, drawn from the linear portion of the (αhν) 2 vs hν plots (Fig. 2), on x-axis (energy axis) gives the values of band gap as 2.02eV and 2.0eV for films of thicknesses 8kǺ and 10kǺ respectively [8]. Thus prepared thin films of ZnTe possess direct band gap of around 2eV which is near the earlier reports [9].
Fig. 2 Plot of (αhν)2 vs hν for ZnTe thin films of thicknesses of 8kǺ
(a) and 10kǺ
Fig. 2 Plot of (αhν)2 vs hν for ZnTe thin films of thicknesses of 8kǺ
(b) respectively. The variation of resistivity as a function of temperature is
shown in Fig. 3. The plots suggest that with increase in temperature resistivity decreases for both thicknesses. This confirms the semiconducting behavior of the films. Fig. 3 Temperature dependence of resistivity of films deposited at
different thicknesses.
CONCLUSIONS
ZnTe possesses cubic structure when deposited as thin
films. It also exhibits a direct band gap around 2eV which decreases with increase in film’s thickness. The resistivity decreases as the temperature of the films increases confirming semiconducting nature. It is also seen that the resistivity decreases with increase in thickness of the films. ACKNOWLEDGEMENT
The authors acknowledge the help of Sophisticated Instrumentation Centre for Applied Research and Testing (SICART) for providing the facilities of the electron microscopy and the spectrophotometer.
REFERENCES [1] Bhumia S., Bhattacharya P, and Bose D. N. (1996 ) Pulsed
laser deposition of ZnTe thin films, Material Letters 27(6) : 307-311.
[2] Kenji Yoshino, MinoruYoneta, Takayuki Yabe, Kenzo Ohmori,Hiroshi Saito, Masakazu and Ohisihi (2003) Optical and electrical characterization of high-quality P-doped ZnTe substrates, Physica B 340–342: 254–257.
[3] G. I. Rusu, P. Prepeliţă, R. S. Rusu, N. Apetroaie, G. Oniciuc, A. Amariei (2006) On the structural and optical
(b)(a)
(b)
(a)

128 PRAJÑĀ – Journal of Pure and Applied Sciences 18: 126 - 128 December
characteristics of zinc telluride thin films, Journal of Optoelectronics and Advanced Materials, 8: 922 – 926
[7] P. Petkov A, T. Petkova B, V. Vassilev C, V. Vachkov D. (2002) Electrical and optical properties of Ag2−2xZnxTe
[4] T. Ota and K. Takashi (1973) Non-polarized memory- thin films, Materials Letters 56: 9 – 13. switching characteristics of ZnTe thin films. Solid State [8] Hossain M. S., Islam R., Khan K. A. (2010) Structural,
Elemental Compositions and Optical Properties of ZnTe:V Electronics, 16: 1089-1092. Thin Films, Chalcogenide Letters 7(1): 21 – 29.
[9] S. Velumani, Sa K Narayandass and D Mangalaraj (1977) Structural characterization of hot wall deposited cadmium selenide thin films, Semicond. Sci. Technol. 13: 1016–1024.
[5] JCPDS International centre for Diffraction Data, USA, (1997) Card No.19-1482.
[6] H. Bellakhder, A. Outzourhit, E. L. Ameziane, (2001) Study of ZnTe thin films deposited by R.F. sputtering, Thin Solid Films, 382: 30- 33.

NATIVE DEFECTS IN MoSe2 CRYSTALS GROWN
BY DIRECT VAPOR TRANSPORT
C. K. Sumesh1, K. D. Patel2, V. M. Pathak2 and R. Srivastava2
1*Department of Physics, Faculty of Technology and Engineering, Charotar University of Science and
Technology – CHANGA, Anand, - 388 421, INDIA 2Department of Physics, Sardar Patel University, Vallabh Vidyanagar, Anand, - 388 120, INDIA
ABSTRACT
The presence of native defects in crystals of MoSe2 grown by direct vapour transport has been investigated. The XRD and EDAX shows the presence of MoO2, MoO3, Se and SeO2 along with MoSe2. The formula assigned to grown crystals is MoSe2.03 accounting for excess of selenium as seen from EDAX. This excess in selenium may be attributed to the use of molybdenum in formation of MoO2 and MoO3with residual oxygen in the ampoule which outweighs slightly the use of selenium in formation of SeO2 in addition to unreacted selenium. The n-type conductivity of grown crystals can be attributed to the compensating nature of defects incorporated during growth. The extrinsic electrical behavior of MoSe2 is therefore ascribed to the presence of both donors and acceptor impurities originating from the defect structure of MoSe2 crystals. Key words: crystal growth; direct vapor transport technique, EDAX, native defects, XRD.
INTRODUCTION
The transition metal based semiconductor MoSe2 belongs to the family of dichalcogenides with a layer-type structure. MoSe2 has been studied widely for its properties and applications using growth of this material by various techniques [1-12]. Among the layered compounds, MoSe2 has been recognized as ideal model compound for the studies involving surfaces, photoreactions, adsorption phenomena and catalysis, scanning tunneling microscopy, spectroscopy and epitaxial growth of thin films [3, 5, 8]. The extremely anisotropic character of the layered compounds, built in at the atomic level, dominates all the properties of such materials, both mechanical and electrical. It opens up new opportunities for the application of layered materials [2, 4, 7, 10]. It is a well-known fact that in the layered crystals like MoSe2, the bonding within the layers is strong and primarily covalent, while that between the layers are Van der Waals bonding and thus weak enough to permit intercalation of foreign atoms or molecules into the gap between the layers [4, 6, 12].
Native or intrinsic defects are imperfections in the crystal lattice that involves only the constituent elements. They include vacancies (missing atoms at regular lattice positions), interstitials (extra atoms occupying interstices in the lattice) and antisites. Native defects can strongly influence the electrical and optical properties of a semiconductor, affecting doping, minority carrier lifetime and luminescence efficiency, and are directly involved in the diffusion mechanisms connected to growth, processing and device degradation [13-15]. Native defects are, in general, related to the compensation of the predominant acceptor or donor dopants, i.e. donor defects are easier to form in p-type material, whereas acceptor defects are easier to form in n-type material, always counteracting the prevailing conductivity. Identification of the processes controlling the incorporation of native defects during semiconductor material preparation and /or processing is of primary importance since so many electronic and structural properties critically depend on the presence of such defects. However incorporation of such defects in DVT grown crystals has been seldom dealt in detail. Present paper discuss this
aspect and its influence reflected in semiconducting behavior of DVT grown MoSe2 crystals. MATERIAL AND METHODS
Crystals of MoSe2 were grown by direct vapor transport (DVT) method inside a dual zone horizontal furnace [1, 9-12]. Highly pure molybdenum (AR 99.9%) and Selenium (AR 99.6%) elements were used as starting elements. Growth and source zone temperatures were 1030K, 1060K respectively and the duration of transport was about 72 hours. The chemical proportions of elements in grown crystals were obtained from the Energy Dispersive Analysis of X-rays (EDAX) using Phillips, Model: XL 30 ESEM. The microstructural investigations of as-grown surfaces of the crystals were done with the help of Axiotech 100 reflected light microscope (Carl Zeiss Jena, Germany make). The physical structure was studied by X-ray diffractometer (XRD) unit (Make: Phillips, Model: X’Pert MPD). The lattice parameters, hkl reflections and d spacing of the grown crystals were determined by comparison with JCPDS data as well as by using suitable software. This program facilitates for data smoothening, background subtraction, α2 elimination, peak search, indexing, and generation of simulated powder X-ray diffraction patterns. RESULTS AND DISCUSSION The grown crystals as observed under light microscope with X-20 magnification revealed the presence of hexagonal spirals on the growing faces as shown in figures 1. This microstructure showing presence of large number of crystallographically oriented spirals suggests screw dislocation mechanism of growth. In general, presence of screw dislocations in grown crystal shows characteristic property of growth from gaseous phase [16-18].
It is observed to contain 37 sharp lines of varying intensities in the diffractogram (figure 2). The analytical indexing of the pattern thus obtained was done to calculate the lattice parameters for the hexagonal layered structure. The values thus obtained are a = b = 3.280Å and c = 13.020Å. In order to affirm that these lines belong to molybdenum
PRAJÑĀ - Journal of Pure and Applied Sciences, Vol. 18: 129 - 131 (2010) ISSN 0975 - 2595
*Corresponding author: [email protected]

130 PRAJÑĀ – Journal of Pure and Applied Sciences 18: 129 - 131 December
diselenide, the d spacing and relative intensities of these lines were compared with JCPDS data for 2H-MoSe2 polytype. It is noted that 24 of the d-spacing of JCPDS data match with the present diffractogram. However relative intensities do show deviations. This deviation along with the presence of other lines, although not very prominent ones, indicate that along with 2H-MoSe2, 3R-polytype form of this compound may also be present. When analyzed in this way it is seen that three d-spacings of 3R-MoSe2 as seen from JCPDS data are present in the X-ray diffractograms of grown crystal. However, the intensity of one of the prominent line among the three for 3R-MoSe2 as given in JCPDS data sheet is down by 66%. Therefore presently grown crystals may contain only a little proportion of 3R polytype form.
Fig. 2 X-Ray diffractogram of molybdenum diselenide crystal grown by DVT technique.
Even after such analysis, 10 lines of present crystal’s
diffractogram remain to be assigned. For this JCPDS data sheets of possible elements and compounds (such as Mo, MoO2, MoO3, Se and SeO2) in present growth process was searched. Such analysis shows that none for Mo; 1out of 39 for MoO2; 1 out of 58 of MoO3; 1 out of 23 of Se and 4 out of 104 for SeO2 are present with fairly low intensity. Thus only a small amount of these may be found in present crystal resulting probably from incomplete reaction or insufficient vapour pressure during reaction and residual oxygen. It may be further
noted that the three lines which are still left, are of very low intensity and these may be considered as a part of the background. At the high temperature associated with crystal growth, the solid phase of a compound semiconductor in equilibrium with the liquid or gas can exist over a narrow but finite range of atomic composition that is with small deviation from exact stoichiometry. As the temperature drops, the extent of this so-called existence region shrinks and eventually goes to zero. As the temperature is lowered atomic diffusion rates fall and hence small deviations from stoichiometry gets frozen into the crystals. Any deviation from exact stoiciometry implies the existence of defects to accommodate imbalance. EDAX analysis was also carried out to estimate the amount of stoichiometry and confirm this kind of evolution of defects. The energy dispersive spectrum of MoSe2 is shown in figure 3. The analysis shows that there is a slight excess of selenium and with the excess of selenium the formula assigned to present crystal is MoSe2.03. This excess in selenium may be attributed to use of molybdenum in formation of MoO2 and MoO3 which outweighs slightly the use of selenium in formation of SeO2 in addition to unreacted selenium with residual oxygen in sealed ampoule.
Fig. 3 Typical EDAX of the as grown MoSe2 crystal. The electrical transport behaviour studied for the grown
crystals show n-type conductivity. Details regarding the electrical transport properties of grown crystals were explained elsewhere [19, 20]. The extrinsic electrical behavior of MoSe2 is attributed to the presence of both donor and acceptor impurities originating in defect structure of MoSe2 crystals incorporated during its growth. The n-type electrical conductivity of grown crystal is due to the compensating nature of such defects. In the case of DVT grown crystals it is very likely that selenium excess results in giving larger number of donor defects in comparison to shallower acceptor defects. CONCLUSION
In summary we have studied and discussed the evolution of native defects incorporated in the crystals of MoSe2 grown by direct vapour transport technique. The study revealed that various kinds of defects are incorporated in the crystals of MoSe2 during growth process. The n-type electrical conductivity of grown crystals is due to the compensating nature of native defects. In the case of DVT grown crystals it is very likely that selenium excess results in giving larger number of donor defects in comparison to shallower acceptor defects. ACKNOWLEDGEMENT
Authors are thankful to SICART (Sophisticated Instrumentation Centre for Applied Research and Testing) for
Fig. 1 The branching of the growth spirals on the surface of MoSe2 crystal formed by several dislocations of one and the same sign.

2010 Sumesh et al. – Native defects in MoSe2 131
providing technical services to characterize materials. Financial support received in the form of UGC major research project (Grant reference No. : F33-8/2007(SR)) by Dr. K. D. Patel is thankfully acknowledged. REFERENCES
[1] Sumesh, C. K., Patel, K. D., Pathak V. M. and Srivastava,
R. (2008) Growth, physical, structural and chemical characterization of layered semiconductor molybdenum diselenide. Journal of Ovonic Research 4: 61.
[2] Ali Hussain and Auluck, S. (2005) Band structure and optical response of 2H-Mo X2 compounds ( X=S , Se, and Te). Phys.Rev. B 7: 155114.
[3] Harpeness, R., Gedanken, A., Weissb, A. M. and Slifkin, M. A. (2003) Microwave-assisted synthesis of nanosized MoSe2. J. Mater. Chem. 13:2603.
[4] Th.Boker and Severin, R. (2001) Band structure of MoS2, MoSe2, and α-MoTe2: Angle-resolved photoelectron spectroscopy and ab initiocalculation. Phys.Rev. B 64: 235305.
[5] Huang, J. M. and Kelley, D. F. (2000) Synthesis and characterization of MoSe2 and WSe2 nanoclusters. Chem. Mater. 12: 2825.
[6] Sugai, S. and Ueda, T. (1990) High-pressure Raman spectroscopy in the layered materials 2H-MoS2, 2H-MoSe2, and 2H-MoTe2. Phys.Rev. B 26: 6554.
[7] Cohen, S. R. and Rapoport, L. (1998) The tribological behavior of type II textured MX2 (M=Mo, W; X=S, Se) films. Thin Solid Films 324: 190.
[8] Pouzet, J. and Bernede, J.C. (1994) Properties of MoSe2 thin films obtained by solid state reactions between thin films and by d.c. diode sputtering. Materials Chemistry and Physics 36: 304.
[9] Agarwal, M. K., Patel, P. D. and Gupta, S. K. (1993) Effect of doping MoSe2 single crystals with rhenium. Journal of Crystal Growth 129:559.
[10] Pathak,V. M., Patel, K. D., Pathak, R. J., Srivastava R. (2002) Improved photo conversion from MoSe2 based PEC Solar cells. Solar energy materials and solar cells, 73: 117.
[11] Agrawal, M. K., Patel, P. D. and Vijayan, O. (1983) Electrical Studies on (Mo/W) Se2, Single Crystals. Phys. stat. sol., (a) 78: 133.
[12] Evans, B. L. and Hazelwood, R. A. (1971) Optical and structural properties of MoSe2. Phys. stat. sol., (a) 4: 181.
[13] Robbins, D. J., Dean, P. J., Simmonds, P. E. and Tews, H. (1992) Deep Centers in Semiconductors, S. T. Pantelides, Yverdon: Gordon and Breach pp. 843–98.
[14] Stavola, M. (1999) Identification of Defects in Semiconductors: Semiconductors and Semimetals. Academic press, San Diego, p. 153.
[15] Walukicwicz, W. (1998) Mechanism of Fermi-level stabilization in semiconductors. Phys. Rev., B, 37: 4760.
[16] Bletskan, D. I. (2006) The growth mechanism of the layer-like and wire-like crystals AivBvi and AivB2
vi from gaseous phase. Journal of Ovonic Research, 2:137.
[17] Schonherr, E. and Stetter, W. J. (1973) Growth spirals on a GeS crystal. J. Cryst. Growth, 20(2):158.
[18] Karakostas, T. H. (1988) Planar defects in GeSe and GeS crystals, J. Meter. Sci., 23: 3099.
[19] Sumesh, C. K., Patel, K. D., Pathak V. M. and Srivastava, R.(2008) Twofold conduction mechanisms in molybdenum diselenide single crystals in the wide temperature range of 300K to 12K. Chalcogenide Letters, 5: 177.
[20] Sumesh, C. K., Patel, K. D., Pathak, V. M. and Srivastava, R. (2010) Investigation of carrier scattering mechanisms in molybdenum diselenide single crystals by hall effect measurements. Cryst. Res. Technol., 45: 957.

ELECTRICAL TRANSPORT PROPERTIES OF SOME MIXED TRANSITION
METAL DICHALCOGENIDES MoXW1-XSe2 (x = 0.3, 0.4, 0.85 & 0.9
M. P. Deshpande, Sunil Chaki*, Nilesh N. Pandya and Sagar C. Shah
Department of Physics, Sardar Patel University, Vallabh Vidyanagar, Gujarat – 388 120
ABSTRACT The mixed transition metal dichalcogenide single crystals, MoxW1-xSe2 series, taking x = 0.3, 0.4, 0.85 and 0.9 were successfully grown by direct vapor transport (DVT) techniques. The variation of resistivity with temperature was studied along perpendicular and parallel to c-axis using four probes and two probe techniques respectively. The Hall measurements at ambient temperature determined the conductivity type and carrier concentration of the as-grown crystals. The Seebeck coefficient variation with temperature was carried out. The obtained results are discussed in details. Key words: MoxW1-xSe2 (x = 0.3, 0.4, 0.85 & 0.9), resistivity, Hall Effect, thermoelectric power.
INTRODUCTION
The transition metal dichalcogenides (TMDC’s) has the general formula MX2, where ‘M’ is a transition metal (M = W, Mo) from IVB, VB and VIB group of the periodic table and ‘X’ is one of the chalcogens namely S, Se and Te. Its basic structure is loosely couple X-M-X sheets which makes the material extremely interesting, because within a layer, the bonds are strong while between the layer they are remarkably weak [1-3].
Significant optical to electrical/ chemical energy
conversion efficiencies have been obtained in solid state photovoltaic and photoelectrochemical solar cells with TMDC semiconductor-electrolyte interface [4-6]. It is essential that semiconductor surface should be non-corroding and stable under conditions of illumination and environment of electrolyte. It is also important that the chosen semiconducting materials should have a band gap in the range of 1.1 to 2.1 eV to provide good optical matching for better solar energy conversion. Materials which possess both these properties are transition metal dichalcogenides (TMDCs), like MoS2, MoSe2, WS2, WSe2, etc. Lots of work has been carried out on these TMDCs [7-19]. Literature shows that very limited amount of work has been carried out on mixed transition metal dichalcogenides like (Mo/W)Se2, thus the authors thought of growing such mixed (Mo/W)Se2 in the form of single crystals and study the transport properties. In this research paper, growth of single crystals is reported and the electrical transport properties studies on these single crystals were studied and the results are discussed in details. MATERIALS AND METHODS Crystal Growth
Among TMDC’s the compound with larger thermoelectric power, high electrical conductivity and low thermal conductivity posses excellent properties as a thermoelectric material. Number of investigators have carried out such measurements on tungsten diselenide and molybdenum diselenide single crystals, but limited literature exist on such measurements being carried out on (Mo/W)Se2 mixed single crystals. Therefore, authors have tried to see how these properties would be affected with increasing amount of molybdenum in WSe2 and henceforth concentrated on four combination in Mo W Se series, taking x = 0.3, 0.4, 0.85 and
0.9. The initial materials taken for single crystals growth were in the powder form with following purities; Mo: 99.99%, W: 99.99% and Se: 99.99%. Firstly for compound preparation, stoichiometric amounts of the powder were introduced into a thoroughly cleaned quartz ampoule. The total charge taken in each case was about 10 gm. The ampoule was sealed at vacuum of 10-5 Torr. After vacuum sealing, the mixture was thoroughly mixed by vigorous physical shaking. Then the homogeneous mixture was evenly distributed along the length of the ampoule and was placed in the furnace. The temperature of the furnace was increased slowly to avoid any explosion, which might occur due to the strong exothermic reactions between the elements. In all the cases, the ampoule was then maintained at 1073 K for 40 hours to allow the complete reaction to occur which resulted in a polycrystalline form of MoxW1-xSe2 (x = 0.3, 0.4, 0.85 and 0.9) compounds. The obtained powder compound was then transferred to another growth ampoule and sealed at vacuum of 10-5 Torr. The complete powder compound was kept at one end of the ampoule known as charge end and the other end of the ampoule is the growth end where the crystal growth takes place. The details of the temperatures of the charge zone, growth zone, growth time, rate of heating, rate of cooling and size of the single crystals for each case is tabulated in Table - 1.
The grown single crystals of MoxW1-xSe2 (x = 0.3, 0.4,
0.85 and 0.9) series were compositionally and structurally characterized by EDAX and XRD techniques respectively. The compositional and structural results were in good agreement with the reported results [20]. RESULTS Resistivity ⊥ c-axis
The resistivity variations with temperature in the range from ambient to 423 K were studied on the grown single crystals using conventional four probe method. This resistivity variation was perpendicular to c-axis (⊥ c-axis). The resistivity at each temperature was evaluated by using the formula,
x 1-x 2
sRπρ 2=
(1)
where s is the distance between two probes, and ‘R’ is the resistance between two probes. The resistivity data obtained from the above equation are plotted as a function of inverse of temperature and are shown in Fig. 1 for MoxW1-xSe2 (x = 0.3, 0.4, 0.85 and 0.9) series.
PRAJÑĀ - Journal of Pure and Applied Sciences, Vol. 18: 132 - 135 (2010) ISSN 0975 - 2595
*Corresponding author: [email protected]

2010 Deshpqande et al. – Electrical transport properties 133
Table - 1. Growth parameter of MoxW1-xSe2 (x = 0.3, 0.4, 0.85 and 0.9) single crystals.
The activation energy is determined from the above plots[Fig. 1] using equation, Ea = 2.303 x k x slope (eV) (2) where k is Boltzmann constant. For all the samples of MoxW1-xSe2 (x = 0.3, 0.4, 0.85 and 0.9), the ⊥ c-axis resistivity decreased with increase of temperature analogous to semi-conducting behavior. The activation energy values determined from the Fig. 1 is tabulated in Table 2. The values show that the activation energy increases with increase of molybdenum content. Resistivity ॥ c-axis
High temperature resistivity parallel to c-axis measurements were performed in the temperature range ambient to 773 K for all the single crystal samples, MoxW1-xSe2 (x = 0.3, 0.4, 0.85 and 0.9), by two probe method. The resistivity at each temperature was evaluated by using the formula,
Fig. 1 Logρ vs. 1/T graph for ⊥ c-axis by four probe method
tRA
=ρ (3)
where A is the area of the specimen, R is the resistance between two probes and t is thickness of the specimen. The resistivity data obtained from the above equation (3) as a function of inverse of temperature are plotted in Fig. 2 for MoxW1-xSe2 (x = 0.3, 0.4, 0.85 and 0.9).
The activation energy values were determined from the
graph of Fig. 2 with the help of equation (2) and are tabulated in Table - 2.
Here also for all the samples of MoxW1-xSe2 (x = 0.3,
0.4, 0.85 and 0.9), the ॥ c-axis resistivity decreases with increase of temperature confirming semi-conducting nature. The activation energy values determined from Fig. 2 are tabulated in Table 2. The activation energy values increases
with increase of molybdenum content, similar to the results obtained for ⊥ c-axis measurements. Fig. 2 Logρ vs. 1/T graph for ॥ c-axis measured by two probe method
Table - 2 The activation energies calculated from ॥ and c-axis
Logρ vs 1/T.
Samples
Activation Energy
(॥ c-axis )Ea
(eV)
Activation Energy
(⊥ c-axis)Ea (eV)
Mo0.3W0.7Se2 0.21 0.09 Mo0.4W0.6Se2 0.21 0.13
Mo0.85W0.15Se2 0.54 0.17 Mo0.9W0.1Se2 0.55 0.28
Here also for all the samples of MoxW1-xSe2 (x = 0.3, 0.4,
0.85 and 0.9), the ॥ c-axis resistivity decreases with increase of temperature confirming semi-conducting nature. The activation energy values determined from Fig. 2 are tabulated in Table 2. The activation energy values increases with increase of molybdenum content, similar to the results obtained for ⊥ c-axis measurements. Hall Effect
The Hall measurements were carried out on MoxW1-xSe2 (x = 0.3, 0.4, 0.85 and 0.9) single crystals employing 11 KG electromagnet. The semiconductor type and carrier concentration were evaluated for all the crystals. The obtained values are tabulated in Table - 3.
The Hall measurements showed that all the samples,
MoxW1-xSe2 (x = 0.3, 0.4, 0.85 and 0.9) are p-type in nature and their carrier concentration comes out to be of the order of 1015 cm-3.
Temperature (K) Crystals
Compound Charge zone Growth zone
Rate of heating (K s-1)
Rate of cooling (K s-1)
Time (hr.)
Crystal size (mm3)
Mo0.3W0.7Se2 1073 1423 1373 50 40 192
15 x 11 x 0.2
Mo0.4W0.6Se2 1073 1373 1323 50 40 192 17 x 14x0.2 Mo0.85W0.15Se2 1073 1363 1313 50 40 192 20x13x0.2 Mo0.9W0.1Se2 1073 1296 1246 50 40 192 12x7x0.15

134 PRAJÑĀ – Journal of Pure and Applied Sciences 18: 129 - 131 December
Table - 3 Hall data of MoxW1-xSe2 (x = 0.3, 0.4, 0.85 and 0.9) single crystals.
Samples Carrier Concentration p (cm-3) Type
Mo0.3W0.7Se2 1.52 x 10¹⁵ P Mo0.4W0.6Se2 0.16 x 10¹⁵ P
Mo0.85W0.15Se2 0.22 x 10¹⁵ P Mo0.9W0.1Se2 0.83 x10¹⁵ P
Thermoelectric Power
The thermoelectric power measurements have been carried out as a function of temperature for as grown MoxW1-xSe2 (x = 0.3, 0.4, 0.85 and 0.9) single crystals starting from ambient to 423 K with experimental set up TPSS-200, Scientific Solution, Mumbai. The variation of thermoelectric power ‘S’ for single crystals of MoxW1-xSe2 (x = 0.3, 0.4, 0.85 and 0.9) at different temperatures are shown in Fig. 3.
Fig. 3 Plot of Seebeck coefficient(S) vs. temperature (T).
It has been seen that the thermoelectric power ‘S’
increases with increase in temperature for all samples. To study the temperature dependence of the thermoelectric power of a p-type semiconductor the below expression [21] can be used,
⎥⎦⎤
⎢⎣⎡ +=
kTE
AekS F
where k is the Boltzmann cons
(4)
tant, e is the electronic charge, A is the constant determined by the dominant scattering process and EF is the separation of the Fermi level from the top of the valence band. For a small temperature range, EF is fairly constant and hence from equation (4) if thermoelectric power (TEP) is plotted against the reciprocal of temperature, a straight line is expected from where EF and A can be determined, from the slope and intercept respectively. Fig. 4 shows the variation of TEP with an inverse of temperature for MoxW1-xSe2 (x = 0.3, 0.4, 0.85 and 0.9) single crystals.
Fig. 4 Plot of Seebeck coefficient (S) vs. reciprocal of temperature
(1/T). The values of EF and A from the slope and intercept, which were determined are listed in Table 4 for each samples
respectively. The effective density of states NA for the as-grown single crystals were determined using relation,
⎥⎦
⎤⎢⎣
⎡+=
pN
AekS Aln (5)
where NA is the effective density of states and is given by,
⎥⎦
⎤⎢⎣
⎡=
∗
3
22
hkTm
N hA
π (6)
where is the effective mass of holes. Using the values of carrier concentration obtained from Hall effect measurements, the effective density of states NA for the samples of MoxW1-
xSe2 (x = 0.3, 0.4, 0.85 and 0.9) were calculated with the help of the formula,
∗hm
⎟⎠⎞
⎜⎝⎛ −=
kTENp F
A exp (7)
Here EF is the Fermi energy, k is the Boltzmann constant
and T is the room temperature. The values of effective density of states NA thus obtained are listed in Table 4 for the samples MoxW1-xSe2 (x = 0.3, 0.4, 0.85 and 0.9).Using these values of effective density of states NA in equation (6), the effective mass of holes for MoxW1-xSe2 (x = 0.3, 0.4, 0.85 and 0.9) single crystals has been calculated. Table - 4 Values of constant A, scattering parameter s, Fermi energy
EF, effective mass and effective density of states NA of
MoxW1-xSe2 (x = 0.3, 0.4, 0.85 and 0.9) single crystals.
Sample A
Fermi energy
EF(eV)
s = (5/2)-
A
NA (cm-3)
x 10-
32
(kg)
*hm
*hm
Mo0.3W0.7Se2 0.48 0.32 2.02 1.52x10¹⁵ 0.01 Mo0.4W0.6Se2 0.88 0.72 1.62 0.16x10¹⁸ 0.25
Mo0.85W0.15Se2 0.024 0.80 2.47 0.22x10¹⁵ 0.31 Mo0.9W0.1Se2 0.013 1.21 2.48 0.83x10¹⁵ 0.76
The calculated values of the scattering parameter‘s’ lies
between 1 and 3 for MoxW1-xSe2 (x = 0.3, 0.4, 0.85 and 0.9) single crystals. CONCLUSIONS 1. Large size single crystals of MoxW1-xSe2 (x = 0.3, 0.4,
0.85 and 0.9) were successfully grown by direct vapor transport technique.
2. The ⊥ c-axis resistivity measurements showed that the resistivity decreases with increase of temperature analogous to semi-conducting behavior. The activation energy values determined from the ⊥ c-axis resistivity vs. inverse of temperature showed that the activation energy values increases with increase of molybdenum content.
3. Similar results were obtained for the ॥ c-axis resistivity measurements. It also showed the resistivity decreased with increase of temperature. The activation energy values determined from the ॥ c-axis resistivity vs. inverse of temperature showed that the activation energy values increases with increase of molybdenum.

2010 Deshpqande et al. – Electrical transport properties 135
4. The Hall measurements showed that all the samples, MoxW1-xSe2 (x = 0.3, 0.4, 0.85 and 0.9) are p-type in nature and their carrier concentration comes out to be of the order of 1015 cm-3.
5. For all samples, MoxW1-xSe2 (x = 0.3, 0.4, 0.85 and 0.9) the thermoelectric power ‘S’ increase with increase in temperature. The calculated values of scattering parameter‘s’ lies between 1 and 3 for MoxW1-xSe2 (x = 0.3, 0.4, 0.85 and 0.9) single crystals.
REFERENCES
[1] Reshak, Ali Hussain and Auluck, Sushil (2005) Band structure and optical response of 2H-MoX2 compounds (X=S, Se, and Te). Phys. Rev. B, 71: 155114-155116
[2] Rocquefelte, X., Boucher, F., Gressier, P., Ouvrard, G., Blaha, P. and Schwarz , K. (2000) Mo cluster formation in the intercalation compound LiMoS2. Phys. Rev. B, 62: 2397-2400.
[3] Petkov, V., Billinge, S. J. L., Larson, P., Mahanti, S. D. Vogt, T., Rangan, K. K. and Kanatzidis, M. G. (2002) Structure of nanocrystalline materials using atomic pair distribution function analysis: Study of LiMoS2. Phys. Rev. B, 65: 092105-092109.
[4] Tributsch, H. (1978) The MoSe2 electrochemical solar cell: anodic coupling of electron transfer to d-d phototransitions in layer crystals. Ber. Bunseges Phys. Chem., 82: 169-174.
[5] Tributsch, H. (1978) Hole reactions from d-energy bands of layer type group VI transition metal dichalcogenides: new perspectives for electrochemical solar energy conversion. J. Electrochem. Soc., 125: 1086-1093.
[6] Schneemeyer, L. F., Wrighton, M. S., Stacy, A. and Sienko, M. J. (1980) n-type molybdenum-diselenide-based liquid-junction solar cells: A nonaqueous electrolyte system employing the chlorine/chloride couple. Appl. Phys. Lett., 36: 701-703.
[7] Yen P. C., Huang Y. S. and Tiong K. K. (2004) The growth and characterization of rhenium-doped WS2 single crystals. Journal of Physics: Condensed Matter, 16: 2171-2181.
[8] Hu, S. Y., Cheng, M. C., Tiong, K. K. and Huang, Y. S. (2005) The electrical and optical anisotropy of rhenium-doped WSe2 single crystals. J. Phys.: Condensed Matter, 17: 3573-3583.
[9] Mattila, S., Leiro, J. A., Heinonen, M. and Laiho, T. (2006) Core level spectroscopy of MoS2. Surf. Sci., 600: 5168-5175.
[10] Podzorov, V., Gershenson, M. E., Kloc, Ch., Zeis, R. and Bucher E. (2004) High mobility ambipolar field-effect transistors based on transition metal dichalcogenides. Appl. Phys. Lett., 84: 3301-3303.
[11] Tiong, K. K., Shou, T. S. and Ho, C. H. (2000) Temperature dependence piezoreflectance study of the effect of doping MoS2 with rhenium. J. Phys.: Condensed Matter, 12: 3441–3449.
[12] Bernede, J. C., Amory, C., Assmann, L. and Spiesser, M. (2003) X-ray photoelectron spectroscopy study of MoTe2 single crystals and thin films. Appl. Surf. Sci,. 219: 238-348.
[13] Agarwal, M. K., Patel, P. D., Patel, J. V. and Kshatriya, J. D. (1984) Electron microscopy of layered single crystals grown by direct vapor transport method. Bull. Mate. Sci. 6: 549-567.
[14] Agarwal, M. K., Patel, P. D., and Gupta, S. K. (1993) Effect of doping MoSe2 single crystals with rhenium. J. Crystal Growth 129: 559-562.
[15] Deshpande, M. P., Gupta, S. K., Agarwal, Ajay and Agarwal, M. K.(2001) Transport and optical property measurements in indium intercalated molybdenum diselenide single crystals grown by DVT technique. Synthetic Metals 123: 73-81.
[16] Agarwal, M. K., Patel, P. D. and Vijayan O. (1983) Switching in single crystals of the (Mo/W)Se2 system. Indian J. Pure and Appl. Phys. 21: 599-601.
[17] Agarwal, M. K. and Wani, P. A. (1980) Temperature dependence of electrical and thermoelectrical properties of Mo1-xWxSe2 solid solutions. Phys. Stat. Sol. (a) 62: 631-635.
[18] Agarwal, M. K., Patel, P. D. and Vijayan O. (1983) Electrical studies on (Mo/W)Se2 single crystals, Electrical resistivity Phys. Stat. Sol. (a) 78: 133-136..
[19] Agarwal, M. K., Patel, P. D. and Vijayan O. (1983) Electrical studies on (Mo/W)Se2 single crystals: Anisotropy in resistivity. Phys. Stat. Sol. (a) 78: 103-108.
[20] Shah, S. C. (2004) Characterization of as-grown mixed molybdenum/tungsten diselenide single crystals, M. Phil. Dissertation, Sardar Patel University, Vallabh Vidyanagar, India.
[21] Chaparro, A. M., Salvador, P., Coll, B. and Gonzalez, M. (1993) Electroreflectance anisotropy at the WSe2 layer semiconductor, Surf. Sci., 293: 160-164.

INFRARED SPECTROSCOPY OF CHARGE TRANSFER COMPLEXES OF ELASTIN
Pravinsinh I. Rathod, Ketan Dodia, Vishal Patel & A. T. Oza*
Department of Physics, Sardar Patel University, Vallabh Vidyanagar – 388120, Gujarat, India
ABSTRACT
Elastin, a well-known stretchable two dimensional protein, is well-known among biomolecules. In the present study, elastin and its charge transfer complexes with organic acceptors such as TCNQ, TCNE, DDQ, chloranil and iodine have been studied using FTIR spectroscopy. Elastin is a weak donor. In the infrared spectra, it is observed that there is low-frequency hopping process revealed by square-power beta density. In CT complexes, gaussians are observed in mid-IR range. Elastin-iodine, elastin-DDQ and elastin-chloranil show range of nature of transition for the transition across a band gap. Key words: Elastin, Charge transfer complexes, Infrared spectra, Hopping process, Gaussian distribution, Nature of transition
INTRODUCTION
Elastin, a two-dimensional stretchable protein [1], derives its name from elastic which has elasticity while stretching. Its unit is called desmosine [2] and is supposed to be a strong electron donor due to large number of COOH and NH2 groups. Therefore, we study macromolecule like elastin here and its charge transfer complexes with organic acceptors. Elastin works as a weak donor. EXPERIMENTAL DETAILS
Elastin is a white powder. First it was mixed with 1:1 molecular weight proportion with organic acceptors. Because elastin is a macromolecule its molecular weight is very high in amount because of very low molecular weights of acceptors, FTIR spectra did not show any change in the spectrum of elastin so elastin was again mixed with organic acceptors in equal volume proportions. This involved several-fold excess of acceptors. Acceptors selected were TCNQ(7,7,8,8,-tetracyano-p-quinodimethane), TCNE (tetracyano-p-ethylene), DDQ (2,3,-dichloro-5,6-dicyano-p-benzoquinone), chloranil(2,3,5,6-tetrachloro-p-benzoquinone) and iodine. These acceptors when large in amount reacted to form CT complexes with elastin. The CT complexes of elastin were taken in small amount (about 5%) and mixed with dry spectrograde KBr powder which was 95%. The mixtures were grinded till 5% of CT complex homogeneously dispersed into KBr powder. Circular
FIRTGS detectors. A beam splitter of the opt KBr type was used having a range of 7800-370cm-1. The spectra were recorded in purge mode. RESULTS AND DISCUSSION The FTIR spectrum of elastin is shown in Fig. 1a.
The material is transmitting in the range of 1800cm-1 to
2800 cm-1. Thus it shows that the band gap of elastin is very large and does not have band gap in IR range. Elastin is an
insulator. Between 1000 cm-1 and 1800 cm-1 there are large number of vibrational bands of elastin molecule and this range does not contain any well-defined background absorption [3] or electronic absorption envelope. However, in the low-frequency range below 900 cm-1, a square-power beta density is seen in absorption profile. This beta density indicated a low frequency hopping process present in elastin. Either a carrier hops or it does not hop. This is a Bernoulli trial of probability theory. Bernoulli trial leads to a beta density as a probability distribution function. Half-power beta density arises in a neutral compound while square-power beta density arises in a dipolar compound which is polarizable when it is stretched. The square-power beta density [4, 5] is given by
discs were prepared using a die and a manually operated compressing machine. Discs were placed in dark chamber of GXFTIR single beam spectrophotometer of Perkin Elmer Company, USA.
The spectra in the range 400-4000cm-1 were recorded using a GXFTIR single beam spectrophotometer manufactured by Perkin Elmer company, USA, having resolution of 0.15 cm-1 a scan-range of 15,000-30 cm-1, scan time 20 scans-1, an optical phase detector(OPD) velocity of 0.20cms-1 and MIRTGS and
where and in this ‘a’ is and ‘b’ is h. This function has
been fitted (Fig. 1b). initial point of the peak base widt
Fig. 1a: The FTIR spectrum of elastin.
Fig. 1b: The square power beta density in elastin.
The FTIR spectrum of elastin-TCNQ is also shown in Fig. 2a.
The CT complex remains transmitting in the range 1800cm-1 to 3000 cm-1 and does not show development of any absorption. This indicates that elastin-TCNQ also does not contain any absorption due to transition across the band gap in IR range. Thus elastin-TCNQ also is a wide-band-gap semiconductor. However, the IR spectrum contains two
PRAJÑĀ - Journal of Pure and Applied Sciences, Vol. 18: 136 – 139 (2010) ISSN 0975 - 2595
*corresponding author: [email protected]

2010 Rathod et al. – Infrared spectroscopyof charged trabsfer 137
gaussian background profiles –one in mid-IR range around 1500 cm-1 and one in low-frequency range around 700 cm-1. The gaussian bands are given by
ion, is central wave number k where is the maximum absorbptand m is the second moment of this fitted by plottin Both the gaussian profiles are fitted (Fig. 2b
Fig. 2a: The FTIR spectrum of elastin-TCNQ.
Fig. 2b: Mid-IR and low frequency Gaussian band in Elastin-TCNQ
The square-power beta density becomes gaussian distribution in the low-frequency region. This shows the charge carriers like polarons show band motion leading to gaussian distribution rather than a hopping process. This is the change incurred by TCNQ which stretches the bonds of elastin and polarons, rather than hopping among various sites of elastin, shows continuous motion. This mid-IR gaussian band shows similar band motion of polarons igh frequency range. The results should be compared eratin and it’s CTCs with organic acceptors. - kerati rotein and its CTCs show half-power beta density du constrained motion of carriers across the linear chain fibre. Here the lattice vibrations have two degrees of motion in elastin and its CTCs. The gaussian distribution results due to dispersion of vibration in two-dimensions in planar elastin.
The FTIR spectrum of elastin-TCNE is shown in Fig. 3a.
Fig. 3a: The FTIR spectrum of elastin-TCNE.
The spectrum is many respects similar to elastin-TCNQ spectrum. Again a transmitting range followed by two gaussian bands in background absorption at lower frequencies is observed. The two gaussian bands are tracked due to dispersion of polarons or a complex phonon in two-dimensions due to the force arising from TCNE molecules. The gaussian curves are fitted (Fig. 3b).
Fig. 3b: Mid-IR and low frequency gaussian band in Elastin-TCNE. The FTIR spectrum of elastin-iodine is shown in Fig. 4a.
Fig. 4a: The FTIR spectrum of elastin-iodine. This spectrum shows a range in which absorption
develops in infrared range between 1800cm-1 and 3000 cm-1. Thus the charge transfer interactions are strong enough to bring down band gap value to IR range. Thus halogens interact strongly with elastin. The mid-IR range between 1000 cm-1 and 1700 cm-1 shows a triangular type background absorption arising from imperfect nesting. The nature of transition is analyzed from Fig. 4b.
Fig. 4b: Nature of transition of elastin-iodine.
2 e distribution. This function g .
).
but in hwith -k
n is a fibrous pe to

138 PRAJÑĀ – Journal of Pure and Applied Sciences 18: 136 – 139 December
The low-frequency gaussian distribution around 600 cm-1 is also fitted which shown in Fig. 4c.
Fig. 5a: The FTIR spectrum of elastin-DDQ. There exists a range (1800-2900cm-1) in which absorption due to transition across band gap develops (Fig. 5b).
Fig. 5b: Nature of transition of Elastin-DDQ. A pronounced gaussian band is observed in the mid-IR range. This gaussian distribution is fitted as shown in Fig. 5c.
Fig. 5c: Mid-IR Gaussian band in Elastin-DDQ.
Finally, in low frequency range a Lorentzian or oscillator model is observed rather than a gaussian band or beta density. This shows presence of strong electron-phonon resonance in low-frequency range around 620cm-1.
The FTIR spectrum of elastin-chloranil is found to be
different which shown in Fig. 6a.
Fig. 6a: The FTIR spectrum of elastin-chloranil.
Fig. 6b: Nature of transition in elastin-chloranil. Here apart from absorption of light due to transition across
a band gap (Fig. 6b), a large number of repeated structures are observed. These structures can be ascribed to the oscillations in the density of states. Square-root singularity describes the shapes of these structures as found in one-dimensional systems of lattice vibrations. Such oscillations are found in magnetic field and here they seem to arise from transverse optical phonons. Thus elastin-chloranil can be used as molecular multivibrator.
The parameters of the gaussian distributions observed into CT
complexes of elastin are summarized in table 1. The values of band gaps and nature of transitions are summarized in table 2. Table - 1 The parameters of gaussian distributions observed in charge transfer complexes of elastin.
Mid-IR gaussian distribution
Low-frequency gaussian distribution
Fig. 4c: Low frequency Gaussian band in elastin-iodine. The FTIR spectrum of elastin-DDQ is shown in Fig. 5a.
Name of
complex K₀ FWHM K₀ FWHM
Elastin- TCNQ 85 1335.95 956.52 86.11 630 610.86
Elastin- TCNE 88.125 1467.3 597.89 93.125 608.69 310
Elastin- Iodine - - - 86.36 606.38 329.79
Elastin- DDQ 85.714 1423.91 663.05 - - -
Table 2: Values of band gaps and nature of transition in CT complexes of elastin. Name of the complex Absorption function Value the band gap (eV)
Elastin-iodine αhν=A(hν-
Eg±Ep)²Allowed indirect transition
0.2
Elastin-DDQ αhν=A(hν-Eg)1/2
Direct allowed transition
0.26
Elastin-chloranil αhν=A(hν-Eg) Direct allowed
transition 0.25

2010 Rathod et al. – Infrared spectroscopyof charged trabsfer 139
CONCLUSION Elastin does form complexes with organic acceptors when
the later are taken in large amount. Charge transfer interactions are strong and are sufficient enough to bring down band gap values to IR range in particularly with halogen like iodine and halogen-containing acceptors like DDQ and chloranil. This shows elastin interacts with chlorine atoms in DDQ and chloranil. The interaction is strongest in chloranil leading to the oscillations in the density of states of charge carriers. REFERENCES [1] Albert L. Lehninger (1987), Principles of Biochemistry:
CBC Publishers & Distributors, Chpt. 6,pp. 123.
[2] Roger Baurain, Jean-Franqm Larochelle, and Franqois Lamy (1976), Photolysis of Desmosine and Isodensmosine by Ultraviolet Light, Eur. J. Biochem, 67: 155-164.
[3] Jacques I. Pankov (1971) Optical process in semiconductor , Prentice-Hall, Englewood Cliffs, NJ, pp. 34.
[4] Grubbs, Frank E. (1962) Attempts to Validate Certain PERT Statistics or ‘Picking on PERT’. Operations Research 10(6), pp. 912-915.
[5] Keefer, Donald L. and Verdini, William A. (1993). Better Estimation of PERT Activity Time Parameters. Management Science 39(9), pp. 1986-1091.

SCREENING-CORRECTED ELECTRON IMPACT TOTAL AND
IONIZATION CROSS SECTIONS FOR N(CH3)3 AND P(CH3)3
Harshad Bhutadia1*, Kirti Korot2, Bobby Antony3 and Minaxi Vinodkumar1
1V. P. & R. P. T. P. Science College, Vallabh Vidyanagar-388 120, Gujarat, India
2Physics Department, Charotar Institute of Technology, CHARUSAT, Changa – 388 421, Gujarat, India 3Department of Applied Physics, Indian School of Mines, Dhanbad, JH-826004, India
ABSTRACT
In this article we report a modified calculation for total elastic, total ionization and total (complete) cross sections for Trimethylamine N(CH3)3 and Trimethylphosphine, P(CH3)3 upon electron impact at energies from circa threshold to 2000 eV. We have proposed a model which allows screening correction resulting due to the overlapping of atoms as seen by incident electrons in a complex molecule. We have employed well known Spherical Complex Optical Potential (SCOP) formalism to evaluate total elastic and total inelastic cross sections and hence, total (complete) cross sections. The ionization cross sections were derived using the Complex Optical Potential – ionization contribution (CSP-ic) method. Present results are compared with available experimental and other theoretical data wherever available and overall good agreement is observed. Present screening-corrected model shows improvement over the previous method especially at low energies.
Key words: Ionization cross sections; total cross sections; atomic overlap; screening - correction
INTRODUCTION
Electron driven processes on molecules are of great interest due to its possibilities in the investigation of various applied areas like plasma physics, semiconductor industry, micro-electronics, atmospheric sciences and pollution remediation. A well organized database on electron impact collision cross sections is essential for the modeling of such interactions in these environments. However, there is a serious void in the data, especially on ionization cross section, on many important molecular systems. Even though many scientists are involved in this area of research, collection of various cross sections by experimental measurements alone is not feasible in the time scale required by the industry. Hence, alternative theoretical methods like Spherical Complex Optical Potential (SCOP) formalism can be handy and be able to fill the gap effectively since such methods produces cross section data quickly with reasonable accuracy.
Trimethylamine N(CH3)3 or TMA is a pollutant released to the environment from various exhaust like chemical industry, marine food manufacturers and also during cremation [1]. TMA is a highly volatile organic compound with a specific pungent property. It is dangerous to human beings and other living beings alike, as it has the property of tissue corrosion and tissue penetration. TMA is also considered to be an inhibitor of DNA, RNA and protein synthesis and is believed to have serious consequences on the development of fetus in animals [2]. Hence, removal of this highly toxic and malodorous organic waste is a top priority. For this purpose electron-driven techniques are being designed and conceptualized. However, for effective designing and construction of such devices where electron sources are employed, comprehensive data on electron scattering on these molecules are required [3].
Micro-electronics and nano-scale semiconductor industry is of tremendous potential in terms of economy and research [4]. In the preparation of nanoscale structures in silicon and diamond films PH3 gas is been used as a P-doping source for long [5-8]. However, due its non-friendly nature, semiconductor industry has been looking for an alternative gas to substitute it.
Recently, trimethylphosphine, P(CH3)3 (TMP) was considered as a prospective candidate for this purpose. For an effective study on the use of this gas, it is imperative to understand the effect of TMP upon electron interaction.
In spite of importance of the study of electron impact scattering for these targets there are only limited efforts done both on theoretical and experimental fronts which has motivated us to carry out this study. Electron impact total cross sections for these molecules have been very recently reported by Shi et al [9] using additivity method and modified additivity method to take into account the geometrical screening effect for impact energies 30 to 5000 eV. Experimental investigations are very sparse and are reported for few targets only. Electron impact total cross sections for N(CH3)3 has been measured by Szmytkowski et al [3] for impact energies 0.8 eV to 370 eV. They have also calculated integral elastic cross sections using additivity rule and total ionization cross sections using Binary encounter Bethe method (BEB). For P(CH3)3, electron impact total cross sections are measured by Domaracka et al [10] and they have also reported calculations for integral elastic cross sections and total ionization cross sections. In absence of good database for molecules of applied interest the present study becomes important to supplement the void in the database. MATERIALS AND METHOD THEORETICAL METHODOLOGY
In our previous work we have described in detail the theory to calculate total (complete) cross sections including the total ionization cross sections [11-16]. Here we have given only the newly introduced screening corrected theory in detail. We have calculated all the cross sections viz. total elastic, total inelastic, total ionization and total (complete) cross sections without introducing the geometric screening correction as in our earlier papers [12-16] and have maintained the same symbols. In the present model we have subtracted the cross sections arising due to the “shadowing effect” of the surrounding hydrogen atoms to the central Carbon atom and consider the
PRAJÑĀ - Journal of Pure and Applied Sciences, Vol. 18: 140 – 144 (2010) ISSN 0975 - 2595
*Corresponding author: [email protected]

2010 Bhutadiya et al. – Screening-corrected electron 141
screening-corrected total cross section of the molecules by group additivity approach given by [17]
(1)
where, stands for the screening-corrected total cross
sections e molecule, is the total cross section calculated by multi center ach (group additivity rule) and
represents the average overlap resulting from the atoms with the central Carbon atom. These
e pair overlapping can be approximated as
,atom
T SC T OCQ Q Q= −
,T SCQ for th TQ
approatomOCQ
surrounding H averag
atom i jO C
ij
Q QQ α=
arising due to individual
where, Qi and Qj are total cross sections
ith & jth atoms, is the distance
between ith & jth atoms and [11, 17]. Now, consider two atoms which are separated by a
distance ‘ ’ from the center of each atom, and the total cross sections resulting due to their independent existence be Q1 and Q2 timate the all-orientation average screening of the first atom on the second, we can imagine that Q area is
spreaded over the total surface area
ijr2max (4 , , )ij ij i jr Q Qα π=
dr
. In order to es1
24 drπ . Hence 124 d
Qrπ
fraction of the first atom sha m, as a result that much fraction of the second exposed to incident flux or in other words
dows the second atoatom is not
124 d
Qrπ
fraction of the second atom is
not accessible to the in ux. Consequently an average overlapping of approximately
cident fl 1
224a t o m
O Cd
QQrπ
⎛ ⎞= ⎜ ⎟
⎝ ⎠ation in to account where the two
another or 24 dr
Q is to be
expected. Taking the other situ
atoms are very close to one π surfacel total atomic cross sections th
area is comparable to their individua en
can be approximated as , )atomOCQ Q Q= [11, 17].
So, in general the averaged screened cross section arising due to overlap or shadow effect is given by,
atomOCQ 1 2min (
( )1 2
21 2m ax 4 , ,
a to mO C
d
Q QQr Q Qπ
=
(2)
Now we consider the present case of the trigonal molecules
N(CH3)3 & P(CH3)3. The overlap contribution is calculated between the three H atoms and central Carbon atom. Nitrogen or Phosphorous are taken as independent scatterer as N-C (1.4510Å) [18], P-C (1.805Å) bondlengths are greater than C-H (1.1090Å) [18] bond length. We have employed chembio3D ultra software to compute these bond lengths.
Using single center approach for CH3 group, the can be approximated as
atomOCQ
1 a to m a to mNa to m i cO C
i ic
Q QQN α
= ∑ , with
( )2max 4 , ,atom atomic ic i cr Q Qα π= (3)
Here N represents the total number of atoms excluding the
central atom and are the electron impact atomic
cross sections for the pair formed by the central atom and the ith surrounding atom respectively and represents the bond distance between them. This reform takes care of the average overlap contribution and gives er representation at lower energy regime. It should be noted that present screening-correction does not take into account an molecular symmetry. Hence the present modification bond distance and atomic cross sections of individual atoms, hence may be employed to any other larger complex m lecule with ease.
Using equation (1) the expressions for the screening corrected total and inelastic cross s are respectively given by,
(4)
, (5)
Where, and represents the average
overlap correction for total and inelastic cross sections resulting from the atomic pair with the central atom.
is a measurable quantity and can have a direct
com h the available experimental data, whereas cannot be obtained directly from experiments. The
antity which is of far more practical importance is
ionization cross section, Qion. Here the does
not take care of the rotation or vibration of the , hence elastic to those processes. With this in mind let ion the total inelastic cross sections without overlap con Qinel) and with overlap corrections ( ) into its main contributions viz.
, a t o mcQ a t o m
iQ
icration a bett
yrequires only
o
ections
, ,atom
T SC T T OCQ Q Q= −
,atom
inel SC inel inel OCQ Q Q= − atom
OCTQ ,atom
OCinelQ ,
,T S CQparison wit
,inel SCQmeasurable qu
the total ,inel SCQmoleculeus partittribution (
i n e l ,S CQ
( ) ( ) ( )inel i exc i ion iQ E Q E Q E= +∑
and (6)
( ) ( ) ( )= +∑inel ,SC i exc ,SC i ion ,SC iQ E Q E Q E (7) where, the first term in both the above Equations is the sum over total excitation cross sections for all accessible electronic transitions. Hereafter we will use the screening corrected cross sections to explain our theoretical method, which is also applicable to our previous method. The second term is the total cross sections of all allowed ionization processes including all single and double ionization cross sections induced by the incident electrons. The first term arises mainly from the low-lying dipole allowed transitions for which the contributions of excitation cross sections to Qinel,SC progressively decreases faster compared to the ionization cross sections with increase of energy. This is because the peak of excitation cross sections occurs at lower energies hence while the Qion,SC is rising in the intermediate region ex e,SC∑Q
r electron impact is falling. The Qion,SC in
equation (7) fo ionization corresponds to continuum as against discrete optically allowed electronic excitation channels. Therefore typically over 100 eV or so, ionization dominates over excitation. Thus from equation (6),
( ), , ( )i n e l S C i i o n S C iQ E Q E≥ (8)
Now, in order to extract Qion,SC from , a reasonable
approximation can be evolved by starting with a ratio function, ,inel SCQ
( ),
,
( )( ) io n S C i
iin e l S C i
Q ER E
Q E= (9)
such that, 0 < R 1

142 PRAJÑĀ – Journal of Pure and Applied Sciences 18: 140 - 144 December
Since the usual complex potential calculations do not help in determining ionization contribution from the inelastic cross section, we have introduced a method based on the equation (9). In Complex Scattering Potential – ionization contribution (CSP-ic) method, the energy dependence of R (Ei) is given by the following relation [11-16].
( ) 1 ( )iR E f= − U (10)
21
ln( )1 C UCU a U⎡= − +⎢ +⎣ ⎦
⎤⎥
(11)
where the incident energy is scaled to the ionization potential I through a dimensionless variable,
iEUI
= (12)
Equation (17) involves dimensionless parameters C1, C2, and ‘a’, which are determined by imposing three conditions on the function R (Ei) as discussed in [12]. Specifically, we have 0 ≤ R 1, such that
(13)
The reason for adopting a particular functional form of
f(U) in equation (11),The dimensionless parameters C1, C2, and ‘a’, involved in equation (11) reflect the properties of the target under investigation. The three conditions stated in equation (13) are used to determine these three parameters and hence the ratio R. This method is called the Complex Scattering Potential–ionization contribution, (CSP-ic). Having obtained Qion,SC through CSP-ic, the summed excitations cross sections
Qexc,SC can be easily calculated vide equation (7).
RESULTS AND DISCUSSION
The presently calculated Qion, Qion,SC, QT and QT,SC for N(CH3)3 and P(CH3)3 are plotted along with available theoretical and experimental data in Figs. 1 – 4, the numerical values for screening corrected total ionization and total cross section are listed in Table 1. Low energy behavior of cross sections is of much scientific interest because, elastic and various electronic excitation phenomena occur around the threshold of the target.
Fig. (1) shows electron impact total ionization cross
sections for trimethylamine (N(CH3)3). We have calculated the total ionization cross sections (Qion) using multi centre approximation (group additivity rule). The ionization cross sections are reported by two methods viz. without screening corrections and with screening correction. Present data without screening correction are higher than the calculated results of Szmytkowski et al [3] using BEB method. The present screening corrected total ionization cross sections (Qion,SC) are in good accord with the theoretical investigation of Szmytkowski et al [3] using BEB method throughout the energy range.
In Fig. 2 we have compared the present total (complete)
cross sections calculated with and without screening correction with other experimental [3] and theoretical [3, 9] total cross sections. Present total cross sections without screening corrections (QT) are higher than all the other investigations available expect the theoretical investigations of Shi et al [9]
using original modified AR (additivity rule). The present screening corrected results (QT,SC) are in good agreement with the theoretical results of Shi et al [9] using new Modified AR and summed total cross sections of Szmytkowski et al [3] at intermediate energy regime. Present SC results are lower at low energy region and slightly higher at high energy region than the theoretical results of Szmytkowski et al [3] and Shi et al [3]. The QT,SC are in good agreement with the experimental results of Szmytkowski et al [3] from 30-200 eV. Present QT,SC results are slightly lower at lower energy region and slightly higher after 200 eV than the data of Szmytkowski et al [3]. In Fig. 2 the effect of screening seems to be rather drastic at low energies and it leads to decrease in the total cross sections (QT) below 30 eV. Table - 1 Numerical values of Qion,sc and Qt,sc (in Å2) for
N(CH3)3 and P(CH3)3N(CH3)3 P(CH3)3Ei(eV)
Qion,sc Qt,sc Qion,sc Qt,sc
15 01.62 39.77 02.51 83.16
⎪⎩
⎪⎨
⎧
>≅
==≤=
pi
pip
i
i
EEforEEforR
IEforER
1
0)(
20 04.10 42.56 05.80 77.34
30 08.14 41.52 10.80 64.70
40 10.32 38.89 13.34 55.95
50 11.29 36.27 14.23 50.04
60 11.67 34.15 14.42 45.89
70 11.73 32.37 14.24 42.74
80 11.61 30.74 13.90 40.04
90 11.40 29.22 13.53 37.93
100 11.16 27.91 13.17 36.09
∑
200 08.76 20.15 10.16 25.08
300 07.13 16.18 08.23 19.57
400 06.00 13.69 06.92 16.17
500 05.19 11.91 05.99 13.81
1000 03.13 07.53 03.68 07.59
1500 02.25 05.64 02.80 05.75
2000 01.77 04.58 02.22 04.78
10 100 10000
2
4
6
8
10
12
TIC
S Å
2
Ei (eV)
Present Present sc Szmytkowski
e- - N(C H 3)3
Fig. 1 Total ionization cross sections for N(CH3)3 molecule. Dashed line, Present results without screening corrections (Qion); Solid line, Present results with screening corrections (Qion,SC); Dashed dot dot line, Szmytkowski et al [3] using BEB method.

2010 Bhutadiya et al. – Screening-corrected electron 143
10 100 1000
05
1015202530354045505560657075
Ei (eV)
TC
S Å
2
present present sc szmytkowski szmytkowski theory D H Shi(om ar) D H Shi(pm ar)
N(CH 3)3
Fig. 2 Total (complete) cross sections for N(CH3)3. Dashed line, Present results without screening corrections (QT); Solid line, Present results with screening corrections (QT,SC); Stars, Szmytkowski et al [3]; Short dashed line, Szmytkowski et al [3] (summed ICS+ECS); Dashed dot dot line, Shi et al [9] using original modified AR results; Short Dashed dot line, Shi et al [9] using present modified AR results.
In Fig. (3) we have plotted electron impact total ionization
cross sections for P(CH3)3. Present total ionization cross sections without screening corrections (Qion) are higher than other theoretical results of Domaracka et al [10] using BEB method. The present screening corrected total ionization cross sections (Qion,SC) are in overall good agreement with the results of Domaracka et al [10] except at peak region. At the peak region Qion,SC are in better agreement with the BEB cross sections of Domaracka et al [10] than the Qion.
10 100 10000
2
4
6
8
10
12
14
16
TIC
S (Å
2 )
E i (eV)
present present sc D om aracka
e - P (C H 3)3
100 10000
10
20
30
40
50
60
70
80
90
100
E i (eV )
TC
S Å
2
e - - P (C H 3)3 P resent P resent sc D om aracka Exp. D om aracka theory Shi(O M A R ) Shi(PM A R )
Fig. 4 Total (complete) cross sections for P(CH3)3. Dashed line, Present results without screening corrections (QT); Solid line, Present results with screening corrections (QT,SC); Stars, Domaracka et al [10]; Short dashed line, Domaracka et al [10] (summed ICS+ECS); Dashed dot dot line, Shi et al [9] using original modified AR results; Short Dashed dot line, Shi et al [9] using present modified AR results.
CONCLUSION
We have calculated total and total ionization cross sections employing the previous formalism (SCOP & CSP-ic) and the modified method for the molecular systems N(CH3)3 and P(CH3)3. As we have expected the differences between these two methods is prominent at the low energy regime in the total (complete) cross sections and at the peak region in the total ionization cross sections. The geometrical screening correction lowers total (complete) cross sections and the effect is important below 100-200 eV. Moreover at low energy the difference in QT also is affected by the additivity rule.
The screening also lowers the total ionization cross sections and the effect is important at the peak region (near 60-70 eV). The screening corrected total ionization and total cross sections shows better agreement with available experimental and theoretical data. We must admit that the difference between on screened QT and experimental data arises also due to the limitations of model potential. The complex scattering potential - ionization contribution (CSP-ic) formalism developed by the authors [11-16] is used to derive the total ionization cross section for these targets. This method has been tested successfully for a large number of atomic and molecular targets. Present theoretical results for the total ionization and total cross sections show very good agreement with most of other theoretical investigations.
Moreover, it is also observed and confirms the established fact that the cross section increases with increase in the geometric size of the target. Also, the present method employed here provides an estimate of electronic excitations in relation to ionization cross sections in a particular target. We have not provided the data of total excitation cross sections but are available with the authors. Finally, we hope that present work may be useful as there is paucity of experimental as well as theoretical data for the present targets. ACKNOWLEDGEMENT MVK is thankful to DST, New Delhi, for Major Research Project under which part of this work is carried out.
Fig. 3 Total ionization cross sections for P(CH3)3 molecule. Dashed line, Present results with out screening corrections (Qion); Solid line, Present results with screening corrections (Qion,SC); Dashed dot dot line, Domaracka et al [10] using BEB method.
Fig.(4) shows graph for electron impact total (complete)
cross sections for P(CH3)3. The present QT is very high at lower energy region and slightly high at higher energy region than the other theoretical investigations [9, 10] and experimental results [10] except the theoretical investigations of Shi et al [9] using original modified AR. The QT,SC are in very good agreement with the theoretical results of Shi et al [9] using new modified AR and slightly higher than the summed total cross sections of Domaracka et al [10]. The present SC total cross sections (QT,SC) are higher than the experimental data of Domaracka et al [10] up to 40 eV and after 40 eV QT,SC are in very good agreement with the experimental data [10].

144 PRAJÑĀ – Journal of Pure and Applied Sciences 18: 140 - 144 December
REFERENCES [1] Tanthapanichakoon, W., Khongprasamkaln, P.,
Charinpanitkul, T., Tamon, H., Sano, N. and Okazaki, M. (1999) Removal of Trimethylamine and Ammonia Using Electron Attachment Reaction. Science Asia, 25: 57.
[2] Guest, I. and Varma, D. R. (1992) Teratogenic and macromolecular synthesis inhibitory effects of trimethylamine on mouse embryos in culture. J. Toxicol. Environ. Health, 36: 27.
[3] Szmytkowski, C., Domaracka, A., Możejko, P., and Denga, E. P. (2007) Collisions of electrons with trimethylamine N(CH3)3 molecules. Phys. Rev. A, 75: 052721.
[4] Christophorou, L. G., and Olthoff, J. K. (2004) Fundamental Electron Interactions with Plasma Processing Gases, Kluwer Academic, New York.
[5] Fukuda, Y., Shimomura, M., Kaneda, G, Sanada, N., Zavodinsky, V. G., Kuyanov, I. A. and Chukurov, E. N. (1999) Scanning tunneling microscopy, high-resolution electron energy loss spectroscopy, and theoretical studies of trimethylphosphine (TMP) on a Si(111)-(7×7) surface. Surf. Sci., 442: 507.
[6] Oleszek, G. M. (2001) Investigation of Trimethylphosphine as a source for +P31 Implantation using a Cold-Cathode Implantation System for Silicon Device Fabrication. J. Electrochem. Soc., 148: G215.
[7] Wada, H., Teraji, T. and Ito, T. (2005) Growth and characterization of P-doped CVD diamond (1 1 1) thin films homoepitaxially grown using trimethylphosphine. Appl. Surf. Sci., 244: 305.
[8] Kato, H., Futako, W., Yamasaki, S. and Okushi, H. (2005) Growth of phosphorus-doped diamond using tertiarybutylphosphine and trimethylphosphine as dopant gases. Diamond Relat. Mater., 14: 340.
[9] Shi, D. H., Sun, J. F., Zhu, Z. L. and Liu, Y. F. (2010) Total cross sections of electron scattering by molecules NF3, PF3, N(CH3)3, P(CH3)3, NH(CH3)2, PH(CH3)2, NH2CH3 and PH2CH3 at 30–5000 eV. Eur. Phy. J. D, 57: 179.
[10] Domaracka, A, Możejko, P., Denga, E. P. and Szmytkowski, C. (2007) Collisions of electrons with trimethylphosphine P(CH3)3 molecules. Phys. Rev. A, 76: 042701.
[11] Vinodkumar, M., Korot, K., Limbachiya, C., Antony, B. (2008) Screening-corrected electron impact total and ionization cross sections for boron trifluoride (BF3) and boron trichloride (BCl3). J. Phys. B: At.Mol. Opt. Phys, 41: 245202.
[12] Vinodkumar, M., Limbachiya, C., Antony, B., Joshipura, K. N. (2007) Calculations of elastic, ionization and total cross sections for inert gases upon electron impact: threshold to 2 keV. J. Phys. B: At. Mol. Opt. Phys, 40: 3259.
[13] Joshipura, K. N., Vinodkumar, M., Antony, B. K. and Mason, N. J. (2002) Theoretical total ionization cross-sections of CHX, CFX, SiHX , SiFX (X = 1−4) and CCl4 targets by electron impact. Euro. Phys. J. D, 23: 81.
[14] Joshipura, K. N, Vinodkumar, M., Limbachiya, C. G. and Antony, B. (2004) Calculated total cross sections of electron-impact ionization and excitations in tetrahedral (XY4) and SF6 molecules. Phys. Rev. A, 69: 022705.
[15] Vinodkumar, M, Limbachiya, C., Korot, K. and Joshipura, K. N. (2008) Theoretical electron impact elastic, ionization and total cross sections for silicon hydrides, SiHx (x= 1, 2, 3, 4) and disilane, Si2H6 from threshold to 5 keV. Euro. Phys. J. D, 48: 333.
[16] Vinodkumar, M, Korot, K. and Bhutadia, H. (2010) Calculations of total and ionization cross sections on electron impact for alkali metals (Li, Na, K) from threshold to 2keV. Int. J. of Mass Spectrom, 294: 54.
[17] Blanco, F. and Garcia, G. (2003) Screening corrections for calculation of electron scattering from polyatomic molecules. Phys. Lett., A 317: 458
[18] National Institute of Standards and Technology Website: http://srdata.nist.gov/cccbdb/

S-WAVE MASSES AND DECAY PROPERTIES OF D AND DS MESONS
Nayneshkumar Devlani* and Ajay Kumar Rai
Applied Physics Department, S.V. National Institute of Technology, Surat, Gujarat - 395007
ABSTRACT
Mass spectra and decay properties of D and Ds mesons are investigated in the frame work of a relativistic phenomenological quark model with a confinement potential of the typ with ν varying from 0.5 to 2.5. Apart the mass spectra, the decay constants ) and the leptonic branching fractions are calculated in this paper with different choices of ν in the range 0.5 to 2.5. Our predictions are compared with other theoretical models and experimental results. Key words: mass spectrum, decay constant, branching ratio, potential model.
INTRODUCTION
Many experimental facilities such as FOCUS (E831) at Fermilab, BELLE and CLEO, are continuously providing huge amount of data in the heavy-light mesonic sector [1 - 3].
The recent observations of the orbital excited states of
e , (
qc ; ( ) and duq /= sc mesons in particular have ignited interest in the experimental and theoretical study of charm spectroscopy.
It has long been pointed out that light-heavy mesons
mimic the hydrogenic atoms of QCD and represent a unique laboratory to test our understanding of QCD [4, 5]. Theoretically, our knowledge of hadron physics is mainly based on phenomenological quark confinement models [6 - 8], as the hadron domain generally falls in the non-perturbative regime of quantum chromodynamics.
The masses and pseudoscalar decay constan s of the
heavy-light mesons have also been estimated in t of many QCD-motivated models. These model predictions cover a wide range of values from one another [9 - 13].
ally, it is important to have reliable y constants as they are useful in many
weak processes such as quark mixing, CP violation etc.
, we present the calculations of the mass spectrum of states of
t the contex
Phenomenologic
estimates of the deca
In this paper
0=L qc ) and ( duq /=
sc mesons in the relativistic scheme with confinement potential of the form Coulomb plus power potential, with the
ecay constants onic branching fractions are
also computed.
THEORETICAL FRAMEWORK
For the study of the light-heavy bound state systems (D and DS meson), we treat relativistic motion for both the quark and the antiquark.The Hamiltonian for the case then be written as [14]
power index ν varying from 0.5 to 2.5. The d(
VPf /) of these mesons and lept
)(2222 rVmpmpH qQ ++++= (1)
where is the relative momentum of the quark-antiquark
motion and is the heavy quark mass and
p
Qm qm is the light
quark mass, is the quark-antiquark potential given as [15]
)( rV
να Arr
rV c +−=)( (2)
where is the potential parameter, ; sα being the strong running coupling constant.
In the limit that the heavy quark mass becomes infinite, the heavy-light meson behaves analogously to the hydrogen atom i.e., the heavier quark does not contribute to the orbital degrees of freedom and the properties of the meson are determined by those of the light quark [1]. Thus, we assume a trial wave function to be the form given by the hydrogenic radial wave function,
13 2
2 121
( 1 ) !( ) ( ) ( )( ) !
rl l
n l n ln lR r r e L r
n n l
μμ μ μ− +
− −
⎛ ⎞− −= ⎜ ⎟+⎝ ⎠
(3)
Here, μ is the variational parameter and is
Laguerre polynomial. For a chosen value of ν, the variational parameter, µ is determined for each state using the virial theorem. (4) We find the expectation value of H (Eq. (1)) using the equation
(5)
As the interaction potential assumed here does not contain the spin dependent part, Eq (5) gives the spin average masses of the system in terms of the power index ν. The experimental spin-averaged mass for the ground state is determined as [16] (6) where and are the experimentally measured vector and pseudoscalar meson ground state masses. We fix the parameter A, for the chosen value of ν using the experimental spin averaged mass for the ground state. Using this value of A, we calculate excited S wave masses of D and DS mesons and our results are listed in Tables (1) and (2).
The quark mass parameters used for the calculations are
VM PM
32.0=qm GeV, 42.0=sm GeV, GeV, and
we have used the strong running coupling constant αS = 0.397 for D and αS = 0.34 for DS.
PRAJÑĀ - Journal of Pure and Applied Sciences, Vol. 18: 145 - 147 (2010) ISSN 0975 - 2595
31.1=cm
α νArr
rV c +−=)(VPf /
xc αα34
=
121
+−−
llnL
rdrdV
mp
21
2
2
=
ψ ψEH =
( )PVPSA MMMM −+=43
*corresponding author: [email protected]

146 PRAJÑĀ – Journal of Pure and Applied Sciences 18: 145 - 147 December
DECAY CONSTANTS The decay constants of mesons are important parameters
in the study of leptonic, non-leptonic weak decay processes.
The decay constants of pseudoscalar ( ) and vector (mesons are obtained by prarameterizing the matrix elements of weak current between the corresponding mesons and the
(7)
(8)
where k is meson momentum, and are the polarization vector and mass ofrelativistic model, the decay constant can be expressed through the meson wave function in the momentum space as
[17].
(9) With and . In the non-relativistic
limit
Pf Vf )
vacuum as
με VM the vector meson. In the
)(, pVPΦ
1−=pλ 3/1−=Vλ
02
2
→mp
V
it reduces to the well-known relation between
and the ground state wave function at the Pf /
origin )0(/ VPψ , the Van – Royen - Weisskopf formula [18],
( )VP
VPVP M
f/
2/2
/
012 ψ=
(10)
The computed values of and for Pf Vf D and meson using eq (10) are tabulated in Tables (3) and (4) respectively. Table - 1 S wave Masses of D Meson (in GeV)
D
sD
States ν 11S0 13S1 21S0 23S1 31S0 33S1 41S0 43S1
0.5 1.914 1.997 2.187 2.208 2.332 2.343 2.440 2.447 0.9 1.874 2.014 2.290 2.341 2.561 2.591 2.784 2.806 1.0 1.865 2.018 2.312 2.371 2.615 2.651 2.870 2.897 1.3 1.841 2.031 2.367 2.452 2.768 2.825 3.133 3.176 1.5 1.827 2.038 2.399 2.502 2.871 2.941 3.323 3.377 1.7 1.815 2.045 2.430 2.548 2.976 3.060 3.527 3.592 1.9 1.805 2.052 2.461 2.594 3.088 3.184 3.752 3.827 2.0 1.800 2.055 2.475 2.616 3.144 3.245 3.868 3.947 2.2 1.790 2.060 2.500 2.653 3.250 3.362 4.097 4.185 2.4 1.784 2.068 2.533 2.698 3.375 3.497 4.366 4.462 2.5
1.780 2.069 2.547 2.713 3.426 3.552 4.484 4.585
Expt. [20] 1.869 2.010
[21] 1.868 2.005 2.589 2.692 3.141 3.226 [22] 1.874 2.006 2.540 2.601 2.904 2.947 3.175 3.208
Table - 2 S wave Masses of DS Meson (in GeV) DS
States ν 11S0 13S1 21S0 23S1 31S0 33S1 41S0 43S1
0.5 2.025 2.094 2.283 2.301 2.424 2.432 2.529 2.534 0.9 1.991 2.108 2.385 2.428 2.646 2.672 2.862 2.880 1.0 1.983 2.111 2.406 2.456 2.696 2.727 2.942 2.964 1.3 1.962 2.121 2.458 2.530 2.836 2.885 3.178 3.215 1.5 1.938 2.133 2.487 2.574 2.925 2.986 3.339 3.387 1.7 1.938 2.133 2.513 2.615 3.012 3.086 3.508 3.566 μ
μ
μγ kifkPkQQ P=)()(0
1.9 1.928 2.139 2.536 2.651 3.098 3.183 3.683 3.751 2.0 1.923 2.141 2.546 2.668 3.141 3.232 3.774 3.847
μμ
εεγ VV MfkVkQQ =),()(0 2.2 1.915 2.146 2.566 2.701 3.226 3.328 3.961 4.043 2.4 1.907 2.151 2.585 2.731 3.312 3.424 4.155 4.246 2.5 1.903 2.153 2.594 2.745 3.355 3.471 4.255 4.349
Expt. [20] 1.968 2.112
[21] 1.965 2.113 2.700 2.806 3.259 3.345 [22] 1.975 2.108 2.659 2.722 3.044 3.087 3.331 3.364
Table – 3 Pseudoscalar Decay Constants (in GeV)
D DS( )( )( )
1S 2S 3S 4S 1S 2S 3S 4S ν Pf
Pf Pf
Pf Pf Pf
Pf Pf
0.5 0.219 0.104 0.071 0.055 0.242 0.116 0.080 0.062 0.9 0.285 0.157 0.115 0.093 0.315 0.176 0.130 0.105 1.0 0.298 0.169 0.126 0.102 0.330 0.189 0.141 0.115 1.3 0.331 0.200 0.152 0.124 0.368 0.225 0.172 0.142 1.5 0.349 0.217 0.166 0.135 0.407 0.245 0.190 0.157 1.7 0.365 0.232 0.177 0.143 0.407 0.263 0.205 0.169 1.9 0.378 0.244 0.186 0.149 0.422 0.278 0.218 0.179 2.0 0.384 0.250 0.190 0.152 0.429 0.285 0.223 0.183 2.2 0.394 0.259 0.196 0.155 0.443 0.298 0.232 0.189 2.4 0.404 0.267 0.201 0.158 0.454 0.308 0.240 0.194 2.5 0.407 0.266 0.202 0.158 0.459 0.313 0.243 0.196
[11] 0.227 [0.5]
[17] 0.243± 0.025
[09] 0.230
Table - 4 Vector Decay Constants (in GeV)
D DS1S 2S 3S 4S 1S 2S 3S 4S ν
Vf Vf Vf Vf Vf Vf Vf Vf
0.5 0.224 0.104 0.071 0.055 0.246 0.116 0.080 0.062 0.9 0.297 0.159 0.116 0.094 0.326 0.177 0.130 0.106 1.0 0.313 0.171 0.126 0.102 0.342 0.191 0.142 0.116 1.3 0.352 0.204 0.153 0.125 0.385 0.228 0.174 0.143 1.5 0.375 0.222 0.168 0.136 0.431 0.250 0.192 0.158 1.7 0.394 0.238 0.180 0.145 0.431 0.269 0.208 0.171 1.9 0.412 0.252 0.189 0.151 0.451 0.285 0.221 0.180 2.0 0.420 0.257 0.193 0.153 0.460 0.293 0.226 0.184 2.2 0.434 0.267 0.199 0.157 0.476 0.306 0.236 0.191 2.4 0.448 0.277 0.204 0.159 0.492 0.318 0.244 0.196 2.5 0.453 0.276 0.206 0.160 0.499 0.323 0.248 0.198
[11] 0.249 [0.5]
[17] 0.315
[09] 0.341± 0.023
( )∫ ×⎟⎟⎠
⎞⎜⎜⎝
⎛ +⎟⎟⎠
⎞⎜⎜⎝
⎛=
21
3
321
// 22
12pE
mpEpdM
fQ
VPVP π ( ) ×
⎟⎟
⎠
⎞
⎜⎜
⎝
⎛ +
pEmpE
q
2
[ ][ ] ( )pmpEmpE
pVP
qqQQ/
2
)()(1 Φ
⎪⎭
⎪⎬⎫
⎪⎩
⎪⎨⎧
+++ λ

2010 Delwani and Rai – S-wave masses and decay 147
Table - 5 Leptonic Branching Fractions
LEPTONIC BRANCHING FRACTIONS
The leptonic branching fractions for and mesons are obtained using the formula
DS )1( 01
sD
τ×Γ=BR (11) Where is given by Quang Ho-Kim et al. [19] Γ
2 22 2( )8 q
Fq l D cq l
GD l f V mνπ
+ +Γ → = ×
;1 2
2
qDDq
l MMm
⎟⎟⎠
⎞⎜⎜⎝
⎛−
sdq ,= (12)
and 04.1=Dτ ps [18] and 04.1=sDτ ps [18]. For the
calculation of the branching fractions using the eq. (12) we employ the calculated values of the pseudoscalar decay constants obtained using our model. Results are tabulated in Table (5). RESULTS AND DISCUSSION
In the present study, our predicted masses for the ground states are in good agreement with the experimental values at
which is strongly favored by the lattice simulations. No experimental results are available for the higher excited states; so it is of least value to compare the few theoretical results which are not in mutual agreement.
The pseudoscalar and vector decay constants are
calculated and compared with other models. The estimated values are in reasonable accordance with other theoretical predictions around.
The calculated values of leptonic branching fractions are in agreement with the experimental results which can be readily seen from Table (5).
REFERENCES [1] Link J. M. et al. (FOCUS Collaboration) (2004) Measurement
of Masses and Widths of Excited Charm Mesons and Evidence for Broad States. Phys. Lett. B, 586: 11-20.
[2] Abe K. et al. (Belle Collaboration) (2004) Observation of the DsJ(2317) and DsJ(2460) in B decays. Phys. Rev. D, 69: 112002.
[3] Anderson S. et al. (CLEO Collaboration) (2000) Observation of a Broad L=1
*2D
qc State in at CLEO. Nucl. Phys. A, 663: 647-650.
[4] Rujula A. D., Georgi H. and Glashow S L (1976) Charm Spectroscopy via Electron-Positron Annihilation. Phys. Rev. Lett, 37: 785-788.
[5] Rosner J L, (1986) P Wave Mesons with One Heavy Quark. Comments Nucl. Part. Phys., 16: 109
[6] Iachello F., Mukhopadhyay N. C. and Zhang L (1991) Spectrum-generating algebra for stringlike mesons: Mass formula for qq mesons. Phys. Rev. D, 44: 898 - 914.
[7] Quigg C and Rosner J, (1979) Quantum Mechanics with Applications to Quarkonium. Phys. Rep., 56: 167.
[8] Buchm ller W. and Tye S .H. (1981), Quarkonia and quantum chromodynamics. Phys. Rev. D, 24: 132.
[9] Cvetic G et al. (2004) Decay Constants of Heavy Meson of State in Relativistic Salpeter Method. Phys. Lett. B, 596:
84-89 (and references therein). [10] Wang Guo-Li (2006) Decay Constants of Heavy Vector
Mesons in Relativistic Bethe-Salpeter Method. Phys. Lett. B, 633: 492-496 (and references therin).
[11] Patel B. and Vinodkumar P. C. (2010) Decay properties of D and Ds mesons in coulomb plus power potential (CPPν). CPC (HEP&NP), 34(9): 1497.
[12] Patel B. and Vinodkumar P. C. (2010) Decay Properties of D and Ds Mesons. arXiv: hep/ph0908.2212.
[13] Rai A.K. and Vinodkumar P.C. (2007), Decay Properties of
−0
QQ Mesons in Potential Models and Effective Field Theories. AIP Conf. Proc. 939:24.
[14] Gupta S N and Johnson J M (1995), Quantum-Chromodynamic Potential Model for Light-Heavy Quarkonia and the Heavy Quark Effective Theory. Phys. Rev. D, 51:168-175.
[15] Rai A K et al. (2002), Masses and decay constants of heavy–light flavour mesons in a variational scheme. J. Phys. G, 28: 2275.
[16] Rai A. K. et al. (2008), Properties of Q anti-Q mesons in non-relativistic QCD formalism. Phys. Rev. C, 78: 055202 (2008).
[17] Ebert D., Galkin V. O. and Faustov R. N. (1998), Mass spectrum of orbitally and radially excited heavy-light mesons in the relativistic quark model. Phys. Rev. D, 57: 5663 - 5669 [Erratum-ibid. (1999) D, 59:019902]
[18] Van Royen R. and Weisskopf V F, (1967) Hadron Decay Processes and the Quark Model. Nuovo Cimento, 50: 617.
[19] Quang Ho-Kim and Pham Xuan-Yem (1998) The particles and their interaction: Concepts and Phenomena, Springer-Verlag.
[20] Amsler C et al., (2008) Review of Particle Physics. (Particle Data Group), Phys. Lett. B, 667:1.
[21] Pierro M Di. and Eichten E. (2001), Excited Heavy-Light Systems and Hadronic Transitions. Phys. Rev. D, 64:114004.
[22] Lahde T A, Nyfalt C. J. and Riska D. O. (2000) Spectra and M1 Decay Widths of Heavy-Light Mesons. Nucl. Phys. A, 674:141-167.
ν D DS
310−×τBR 410−×μBR 810−×eBR 210−×τBR 310−×μBR 710−×eBR
0.5 0.977 1.803 0.424 6.009 2.662 0.626
0.9 0.861 2.985 0.703 5.223 4.444 1.045
1.0 0.789 3.252 0.766 5.347 4.845 1.140
1.3 0.529 3.962 0.933 5.452 5.946 1.399
1.5 1.029 5.190 7.189 1.692 0.368 4.368 −−+− → ππ*DB
1.7 0.233 4.724 1.113 5.211 7.190 1.692
1.9 0.136 5.047 1.189 4.988 7.717 1.816
2.0 0.096 5.190 1.222 4.862 7.960 1.873
2.2 0.035 5.430 1.279 4.607 8.410 1.979
2.4 0.010 5.686 1.339 4.349 8.818 2.075
2.5 0.002 5.776 1.361 4.223 9.007 2.120
Expt [20] < 2.1 4.4±0.7 6.6±0.6 6.2±0.6
[11] 4.7[0.5] 1.1[0.5] 7.4[0.5] 5.4[0.5] 1.3[0.5]
1=ν

ANHARMONIC PROPERTIES AND sp-d HYBRIDIZATION
IN BARIUM AT HIGH TEMPERATURES
N. K. Bhatt* and A. R. Jani
Department of Physics, Sardar Patel University, Vallabh Vidyanagar – 388120, Gujarat
ABSTRACT
Heavy alkaline metals are characterized by close proximity of empty d-bands to the Fermi energy EF. Effect of closeness of EF to d-bands on different physical properties is highest in barium with substantial sp-d hybridization, which is further influenced by the application of pressure and temperature. While the evanescent form of pseudopotential is sufficient to deduce physical properties at ambient condition, it is combined to mean-field potential (MFP) approach to estimate some anharmonic physical properties of Ba at finite temperatures. Ion-motional free energy (Fion), temperature variations of bulk modulus and anharmonic contribution to specific heat at constant volume are obtained. Most pronounced anharmonic property, the volume-thermal expansion is also obtained, but results overestimate the experimental data. Discrepancy in thermal expansion is discussed and rectified by including sp-d hybridization into the description but without considering the d-band filling effect. Good accordance of thermal expansion with the experimental findings reveals promising applicability of the present potential to investigate several other physical properties at high-T and high-P regime. Key words: Anharmonicity, mean-field potential, Barium.
INTRODUCTION
Close proximity of d-bands to the Fermi level (EF) in heavy alkaline metals, e.g., barium, makes their physical properties quite sensitive to external parameters like temperature and pressure [1, 2]. Unfortunately, however, finite temperatures thermophysical properties of barium are very scanty [2, 3], where the effects of anharmonicity play vital role in deciding physical properties.
Experimentally, in order to observe anharmonic effects, it
is necessary to make measurements for higher order Bragg reflections at elevated temperatures. Under these experimental conditions, the thermal diffusion scattering (TDS) contributes substantially, and is a function of both temperature and reciprocal lattice vectors. The TDS results from interactions between the incident photons and phonons present in the lattice, but the relative energy change (~ 10-2–10-3 eV) is so small that it is very difficult to separate from elastically scattered Bragg component, and, if measured, involves large uncertainty. On the other hand, theoretically, to account for anharmonicity in lattice dynamics and thereby in different thermodynamic properties is difficult due to its many-body nature, and complete ab initio computations at high temperatures pause challenges. To circumvent these practical difficulties, mean-field potential (MFP) approach is employed [4-8], which models vibrational contribution of lattice ions to the total free energy in terms of 0K cohesive energy. Robustness of the MFP approach, in conjunction with the evanescent local pseudopotential [9], has been verified and confirmed by accurate calculations of thermodynamic properties of some elemental metals at high-T and high-P. [e.g., see Ref. 1,7,8].
In view of aforesaid facts, we in the present paper
estimated some anharmonic properties at elevated temperatures for bcc-barium. It is shown that the simple evanescent potential [9] is not sufficient to account for anharmonism at high-T, and we have improved the potential by incorporating hybridization into the description.
Next section briefly discusses theory and computational
scheme. Results for some anharmonic properties including volume-thermal expansion are presented, and the discrepancy observed in thermal expansion is also discussed. Improvement
over evanescent potential is sought and examined, while important inferences are drawn in the final section.
THEORY AND COMPUTATION
For non-magnetic metals total or Helmholtz free energy can be given by
( ) ( ) ( ) ( ), ,Ω = Ω + Ω + ΩC ion eg , .F T E F T F T (1)
Here, EC represents the static energy at 0K which is calculated within the framework of pseudopotential [9] theory, corrected to second order in energy, while Feg is the free energy due to electronic excitation. The vibrational free energy due to lattice ions within the MFP formalism is given as follows [4-8].
( ) ( ) 2
, 3 ln ln , ,2 2
ion Bf
B
F T mk Tv T
k T πΩ ⎡ ⎤⎛ ⎞⎛ ⎞= − + Ω⎜ ⎟⎢ ⎥⎜ ⎟⎝ ⎠ ⎝ ⎠⎣ ⎦h
(2)
where
( ) ( ) 2,, 4 e x pf
B
g rv T r d
k Tπ
− Ω⎡ ⎤Ω = ⎢ ⎥
⎣ ⎦∫
.r
(3)
Here, g(r,Ω) is known as the mean-field potential (MFP) experienced by the lattice ions. It is given by ( ) ( ) ( ) ( )
( ) ( )
0 0 0
0 00
1, 22
1 ,2
C C C
C C
g r E a r E a r E a
r E a r E a ra
Ω = + + − −⎡ ⎤⎣ ⎦
⎛ ⎞⎛ ⎞+ + − −⎡ ⎤⎜ ⎟⎜ ⎟ ⎣ ⎦⎝ ⎠ ⎝ ⎠
(4)
where r is the distance that the lattice ion deviates from an
equilibrium position, and a0 is the lattice constant with respect to volume Ω. Now, the problem of evaluating vibrational free energy is reduced to compute one-dimensional integration in Eq. (3) only. By calculating Helmholtz free energy F(Ω,T) using Eq. (1), as an explicit function of atomic volume (≡ pressure) and temperature, it is now straight forward to obtain different anharmonic physical properties numerically.
We have used local pseudopotential due to Fiolhais et al [9] to evaluate EC in eq. (1). These authors have proposed density-parameter based evanescent form of local pseudopotential for sp-bonded metals including heavy alkaline metals. It was demonstrated that the cohesive properties at ambient condition are better compared to non-local norm-conserving pseudopotentials for some metals [9]. We have
PRAJÑĀ - Journal of Pure and Applied Sciences, Vol. 18: 148 - 150,(2010) ISSN 0975 - 2595
* Corresponding author: [email protected]

December Bhatt and Jani – Anharmonic properties and sp-d hybridization 149
combined this local potential within the MFP description to account for vibrating ionic contribution to the total free energy. Resulted lattice ion-motional free energy (Fion) is plotted in the Fig. 1. In absence of other reported data, we judge our results as follows. Figure reveals that for T > θD (where θD = 110K for Ba is the Debye temperature) Fion is non-linear, which suggests that lattice vibrations do not respond to temperature in proportion. This observation contradicts and proves that the usually taken value for F = -3k T is just the crude estimate.
Fig. temperature. Symbol in the graph is the result corresponding to Debye temperature.
Fig. 2 mpared to . Symbol
(s at 0K from
Fig. bution to ionic specific heat at constant volume.
Figs. 2 and 3 depict temperature variation of isothermal bulk modulus (BT) and anharmonic contribution to the ionic specific heat at constant volume ( . Again, downward declination near melting observ d in these properties show better account of intrinsic anharmonism. Probably, there is an elastic softening at high temperatures, which results into internal anharmonism. It was shown [1, 5] that the conventional quasiharmonic approximation (QHA) is not sufficient to incorporate true anharmonicity at and close to melting. Again due to unavailability of the experimental and ab initio results, we compared our results for BT with local pseudopotential employed within harmonic approximation (HA) based findings [10]. Discrepancy (no decrease in BT with respect to temperature) observed in results due to Pandya [10] clearly manifest inadequacy of HA at higher temperatures.
Finally, we compared present estimates for volume-
thermal expansion with the experimental results [12] in the Fig. 4. Our results largely overestimate the experimental trend and are unphysical. Re-examination of the problem reveals that the discrepancy observed in thermal expansion is due to neglect of sp-d hybridization. For barium, even at 0K there is substantial admixture of 5d-band with the Fermi energy [2]. With temperature, this overlap effect is further influenced and insisting hybridization to be included into the description [1, 2, 9]. Following Harrison’s [13] generalized OPW pseudopotential method; a parametric representation for sp-d hybridization is used. Results corresponding to improved potential (evanescent + sp-d hybridization) show good correlation with the experimental findings with maximum deviation of ~6% at T = 550K. Also, effect of hybridization on pair-potential and form factors are checked, and are found to be consistent to the prediction due to Moriarty [2] through his GPT calculations. Encouraged by these observations, we have calculated several other thermodynamic properties at high-T and high-P regime for Ba, and results will be published elsewhere.
Fig. 4 Relative volume-thermal expansion for bcc-Ba, with (broken
line) and without (continuous line) sp-d hybridization, is compared with experimental results due to Ref [12].
SUMMARY AND CONCLUSIONS
We have calculated some anharmonic properties of elemental bcc-Ba within the MFP + pseudopotential formalism. All results clearly suggest proper account of anharmonism at finite temperatures (i.e. non-linearity), which is very important,
e
ion B
1 Free energy due to vibrating lattice ions is shown as a function of
-0.06
-0.05
-0.04
-0.03
-0.02
-0.01
0
0 200 400 600 800 1000
F ion
(Ry)
Temperature (K)
0
5
10
15
20
0 200 400 600 800 1000
Isot
herm
al b
ulk
mod
ulus
(GP
a)
Temperature (K) Present estimate for BT at different temperatures is co
theoretical results (broken line) due to Pandya [10]olid diamond) represents experimental datum
Kittel [11].
3 Temperature variation of anharmonic contri
-0.9
-0.7
-0.5
-0.3
-0.1
0 200 400 600 800 1000
CV
ion-
an(J
mo
l-1K
-1)
Temperature (K)

2010 PRAJÑĀ – Journal of Pure and Applied Sciences 18: 148 - 150 150
particularly, close to melting. Local pseudopotential due to Fiolhais et al [9], which reasonably reproduces the cohesive properties at ambient condition, has expected limitations at higher temperatures. In order to improve this potential, sp-d hybridization is included. Good agreement for thermal expansion hence obtained is the confirmation to this assertion. We also conclude that the potential at high temperatures should be angle–independent, and the use of local potential is thus justified. Present results for thermal expansion also infer that barium is showing empty d-band – transition-metal character. In fact, with compression d-band progressively increases in energy [2,14] and d-band filling should be required, but is not the case at high temperatures. In contrast, hybridization is only sufficient to mimic anharmonicity at finite temperatures, as observed form results for thermal expansion. In absence of high-T study for this metal, we believe that present study may serve as guideline and means of comparison for future study. ACKNOWLEDGEMENT
The author NKB would like to express thanks for the support given by the UGC, New Delhi under the research project no. F. 34-504\2008 (SR). REFERENCES [1] Bhatt, N. K., Vyas, P. R. and Jani, A. R. (2010) High
temperature and pressure thermodynamics of strontium: A macroscopic approach. Philo. Mag., 90: 1599-1622.
[2] Moriarty, J. A. (1986) First-principles phonon spectrum in bcc Ba: Three-ion forces and transition-metal behavior. Phys. Rev. B, 34: 6738-6745.
[3] Winzenick, M. and Holzapfel, W. B. (1997) Refinement of the P-T-phase Diagram of Barium. Phys. Rev. B, 55: 101-104.
[4] Wang, Y. and Li, L. (2000) Mean-field potential approach to thermodynamic properties of metal: Al as a prototype. Phys. Rev. B, 62: 196-202.
[5] Wang, Y., Liu, Z. –K., Chen, L. –Q., Burakovsky, L., and Ahuja, R. (2006) First-principles calculations on MgO: Phonon theory versus mean-field potential approach. J. Appl. Phys., 100: 023533 (1-5).
[6] Jiuxun, S., Lingcang, C., Qiang, W., and Fuqian, J. (2005) Equivalence of the analytic mean-field potential approach with free-volume theory and verification of its applicability based on the Vinet equation of state. Phys. Rev. B, 71: 024107 (1-13); and references there in.
[7] Bhatt, N. K., Vyas, P. R., Gohel V. B., and Jani, A. R. (2007) Finite-temperature thermophysical properties of fcc-Ca. Euro. Phys. J B, 58: 61-68.
[8] Bhatt, N. K., Vyas, P. R. and Jani, A. R., and Gohel, V.B. (2005) Thermodynamic properties of lead at high temperatures and high pressures—mean-field potential approach. Physica B, 357: 259-269.
[9] Fiolhais, C., Perdew, J. P., Arraster, S. Q., MacLaren, J. M., and Brajczewska, M. (1995) Dominant density parameters and local pseudopotentials for simple metals. Phys. Rev. B, 51: 14001-14011; ibid erratum (1996) Phys. Rev. B, 53: 13193 E.
[10] Pandya, T. C. (2000) A Comprehensive Study of Physical Properties of Alkaline Earth Metals (A Pseudopotential Approach). Ph.D. Thesis, Gujarat University, India.
[11] Kittel, C. (1996) Introduction to Solid State Physics, John Wiley and Sons, New York, 7th edition, pp. 59.
[12] Touloukian, Y. S., Kirby, R. K., Taylor, R. E., and Desai, P. D. (1975) Thermophysical Properties of Matter, Plenum, New York Vol. 12.
[13] Harrison, W. A. (1969) Transition–Metal Pseudopotentials. Phys. Rev., 181: 1036-1053.
[14] Moriarty, J. A. (1994) Angular forces and melting in bcc transition metals: A case study of molybdenum. Phys. Rev. B, 49: 12431-12445; and references there in.

DISSOCIATION OF ATMOSPHERIC MOLECULES H2 AND N2 BY
ELECTRON IMPACT - NEUTRAL ATOM PRODUCTION
Siddharth H. Pandya* and K. N. Joshipura
Department of Physics, Sardar Patel University, Vallabh Vidyanagar- 388 120, Gujarat
ABSTRACT
This paper aims at the estimation of neutral atom pair generation from abundant atmospheric molecules like H2 and N2 upon electron impact. Atmospheres of Jupiter and Titan (one of Saturn’s moons) are largely comprised of H2 and N2 gases respectively. The relative atmospheric chemistry induced by neutral dissociation of H2 and N2 via energetic electrons or via photoelectrons plays an important role in these atmospheres. An attempt is made here to calculate this quantity using total dissociation cross sections for these molecules. The relevant cross sections are employed to estimate the rates for production of neutral atom pairs. While estimating productions of neutrals, cascading from higher states is considered duly, along with dissociative ionization generating a single atom per event. Key words: Electron impact, Excitation cross section, Neutral dissociation, Dissociative ionization
INTRODUCTION Molecular Hydrogen and Nitrogen are two of the most
common species found in a large variety of natural and man-made systems. Hydrogen is the most abundant molecule in the universe, and also on the planet Jupiter. Nitrogen is also an important constituent in outer planets and satellites like Titan, as also in comets etc. The ground-state dissociation energies of H2 and N2 molecules are known to be 4.49 and 7.37 in eV [1]. Therefore these molecules are dissociated not by visible light, but by appropriate UV radiation. Our interest in the present paper is on electron impact neutral dissociation of each of these molecules into ground state atomic species, as follows.
ei + H2 H + H + es (1)
ei + N2 N + N + es (2)
Here the subscripts i and s refer to the incident and the scattered electron. The threshold energy in each case is the corresponding dissociation energy. For molecular hydrogen, the very first excited electronic state is b3Σu
+, which is known, since the early days of quantum mechanics to be repulsive i. e. dissociative [2]. However, in (1) we must also include the contributions of higher electronic states cascading into the b-triplet state, thereby adding to the yield of the neutral H (1s). Complications arise in N2 where there are several excited electronic states that decay into two neutral ground state nitrogen atoms, and these excited states, i.e. valence and Rydberg, have excitation energies in the range of 11.5 to 40 eV [3]. Nonetheless, theoretical [4] and experimental [5-8] work has been done to investigate the neutral dissociation of the title molecules by electron impact.
Electron impact processes including those resulting into uncharged fragmentations, have been a subject of study in view of their importance in various planetary and solar-system objects as well as in plasma environments. The neutrals generated through electron collisions themselves being reactive, give rise to their own chemistries in the concerned environment. Therefore a lot of importance is attached to these electron induced processes.
In an environment like the upper atmosphere of a planet or a satellite, the neutral dissociation must be examined from the bulk point of view, not just an isolated inelastic scattering event.
Therefore in the present paper, we consider first the total cross sections of electron impact excitation to neutral fragments. Using these cross sections as an input along with number densities of target species, the collision frequency for neutral dissociation is obtained. As far as the impact electrons are concerned we have assumed Maxwellian energy distribution.
However, in addition to the direct dissociation processes mentioned above in (1) and (2), one must also consider the electron impact dissociative ionization of molecules, wherein a charged fragment is accompanied by a single neutral species, e.g. ,
ei + H2 H++ H(1s) + es + ej (3)
Here, subscript j refers to the electron ejected from the target molecule that is ionized. The ionization process of equation (3) occurs at energies higher than that in the previous cases vide equations (1) and (2). The latter must be properly included in any estimate of the number of neutral atom- pairs generated in a medium by electron impact. In section below we highlight our theoretical methodology for deriving electron impact neutral dissociation cross sections of the present two targets. Electron induced dissociative ionization is also included in the present calculations.
Presently our aim is to estimate the number of neutral atom pairs generated per second in a pure gas medium, as a function of incident electron energy Ei. This is done by calculating the respective electron collision frequencies from the relevant total cross sections of electron impact on a target.
THEORETICAL METHODOLOGY
In this paper we are primarily interested in the electron impact electronic excitations of the two molecules from their respective ground electronic states, vide equations (1) – (3). Our theoretical methodology is outlined separately for the two molecular targets as follows: H2 dissociation
Let us first consider the following electronic excitation of
H2, important at low incident energies,
e-i + H2 (X1Σg
+) H2*(b3Σu
+) H (1s) + H(1s) + e-sc (4)
Now, as mentioned by Yoon et al [9] that the only
available experimental data in this regard are due to Corrigan [10] who had measured total dissociation cross sections of this triplet state.
PRAJÑĀ - Journal of Pure and Applied Sciences, Vol. 18: 151 -156, (2010) ISSN 0975 - 2595
*Corresponding author: [email protected]
152 PRAJÑĀ – Journal of Pure and Applied Sciences 18: 151- 156 December
Corrigan’s results included cross section for dissociative
ionization of H2. We could not resist quoting from Corrigan’s paper [10] viz., “Cross section for dissociation of molecular hydrogen into two ground-state atoms is in effect the cross section for excitation of all triplet states regardless of whether they are bound or repulsive”. This argument is supported by the absence of radiation for triplets to singlet inter-combinations, so that electron impact excitation to any triplet state must lead eventually to dissociation. Thus the formation of two H(1s) atoms by electron impact on H2 results from direct excitation to b3Σu
+, plus, excitation to higher triplet states followed by cascading down to b3Σu
+ [4]. Near threshold, the excitation to b3Σu
+ is expected to be the main contributor to the neutral dissociation [9]. Also, a3Σg
+ (16%) and c3∏u (20%) are the two major cascading states to b3Σu
+ while e3Σg+ (6%) and d3∏u
states play only a minor (5%) role [4].
Based on the above discussion, we have presently made a comprehensive calculation for total cross sections of electron impact neutral dissociation of ground-state H2 from 10.57 to ~200 eV. The cross section contribution of the direct excitation to b3Σu
+ is calculated from the R-matrix theory by using the UK R-matrix package viz., Quantemol-N (SE) Version 3.6. In order to derive complete neutral dissociation cross sections for H2 molecule, we have also considered the cascading from higher excited states a3Σg
+ and c3∏u to the state b3Σu+. Also important
for the production of single H (1s) atom is the dissociative ionization vide equation (3).
To calculate the excitation cross sections of H2 into dissociative b-state as in (4), the ab initio R-matrix approach [11, 12] is adopted here through the Quantemol-N (SE) package Version 3.6 [13]. Experimental equilibrium geometries [14] are used for these calculations. Ground state electronic configuration of H2 in D∞h symmetry is 1σ2. However, the present calculations were performed in the reduced symmetry D2h sub-group [15]. The Basis set is defined using EMSL Basis Set Exchange [16]. Full CI has been used for the calculation of this molecule with only 2 electrons. 12 target states were employed in the close-coupling expansion method for scattering calculations. R-matrix theory is based on the partition of coordinate space into an internal region and an external region separated by a spherical boundary of radius presently set to 10 a0. This boundary is such that the molecular electron cloud is fully contained within the sphere. The short-range electron exchange and electron-electron correlation effects between the scattering electron and the target electrons are considered for this inner region. The said interactions are negligible in outer region and only long range interactions need to be considered there. The cross section for direct excitation to b3Σu
+ is denoted by Qexc (b3Σu
+).
Now, the excitation threshold for the very first state b3Σu+
is almost correctly reproduced in the package used by us, but the same is not reproduced accurately for the higher triplet states relevant to the present study. Therefore, the excitation cross sections to a3Σg
+ and c3∏u states are adopted presently from Khakoo and Trajmar [17] and Khakoo et al [18]. These cross section data, involving errors of ~20% are added together, and the sum is referred as Qexc´.
One more contributing process to the production of neutral Hydrogen H (1s) is dissociative ionization as shown by (3), which must be considered here. Recent calculations of total
electron impact ionization of H2 are due to Joshipura et al [19], but the quoted work does not spell out the contribution of dissociative ionization in the total ionization cross sections. Therefore, the required dissociative ionization cross section Qd-
ion corresponding to process (3) is adopted from the measured data of Straub et al [20].
It is thus possible to obtain overall or total neutral dissociation cross sections to be denoted by QNDiss in e- - H2 scattering. For this purpose the excitation cross sections to all the three above mentioned triplet states are added together to obtain total excitation to neutral dissociation QNexc. The neutral dissociation via process (4) including cascading produces two H (1s) atoms whereas process (3) produces only one H (1s) atom per event. Thus, in order to obtain overall or total neutral dissociation cross section QNDiss for H2 corresponding to production of a neutral atom pair, the half of the dissociative ionization cross section is added to QNexc. We have finally,
QNDiss = QNexc + Qd-ion (5)
where QNexc = Qexc(b3Σu Qexc´ (6)
The factor 1/2 in the second term of equation (5) indicates that two ionization events are required to produce a neutral hydrogen atom pair. N2 dissociation
In the case of N2 vide process (2) above, the situation is not so straightforward. Unlike H2 there is no directly repulsive state, which upon de-excitation would result into neutral dissociation of N2.The potential energy diagram for N2 is much more complicated and few repulsive states, including C3∏u are available [21]. Even these states are not enough to account for total neutral dissociation of N2. In fact any excitation to the lower-lying, non-dissociative excited states above their dissociation limits can also be taken as a contribution to direct dissociation. Thus the possible de-excitation will not only include radiative cascade to lower states, but also pre-dissociation to N atom at 12.137 and 13.329 eV energies [6]. It is seen that an important role is played by the family of 1Σu
+ and 1∏u states lying above the dissociation limit, towards the neutral dissociation of N2 molecule. Winters [5] had measured dissociation cross sections for N2 by adsorption of N atoms on nickel and molybdenum surface and using pressure decrease relation. These data also include dissociative ionization [5, 6]. Neutral dissociation of N2 was also investigated by Cosby [6], by directly detecting two N atoms, but the data of [6] are considerably lower than that of [5]. Thus Cosby [6] had recommended the weighted average of the two data sets after considering their stated error limits i.e. ±20 % for [5] and ±30 % for his data [6].
Now, our aim here is to determine overall or total cross sections for production of neural N-atom pair by the impact of electrons on N2. In view of a large number of excited states involved here, it becomes necessary to consider a cumulative quantity viz., summed total excitation cross section denoted by ∑Qexc, representing all accessible electronic excitations upon e- - impact. In recent years, the cross section ∑Qexc has been obtained approximately as a contribution to total inelastic cross section Qinel for e- - impact on a large number of atomic and molecular targets in [22-24]. This theoretical method basically determines the contribution of ionization cross section Qion, but the quantity ∑Qexc is also obtained.
+) +

2010 Pandya and Joshipura – Dissociation of atmospheric 153
The method basically starts with simultaneous elastic and inelastic electron scattering treated in a complex potential V (r, Ei) = VR (r, Ei) + iVI (r, Ei). Here, r is the radial distance from the mass-centre of the target. Further VR (r, Ei) is the real part and VI (r, Ei) is imaginary part of the total potential. The real part consists of the sum of static (Vst), exchange (Vex) and polarization (Vpol) terms, and the imaginary term is the absorption potential Vabs. The basic input in constructing all these model potentials is the target electron charge density. The complex potential enables one to calculate total (complete) cross section Q defined by,
(7)
where the first term on RHS is the total elastic cross section. Further, we have
i
T
( ) ( ) ( )T i e l i in e l iQ E Q E Q E= +
( ) ( ) ( )i iio n e x cin e l E E EQ Q Q= Σ + Σ (8) The first term in equation (8) accounts for total of all
ionization cross sections accessible energetically. The second term is of our present interest. If i is the initial molecular (ground) state and f is final state of electronic transition, and if Q(i f) is the total cross section of this transition then,
(9)
called ‘complex potential ionization contribution’ (CSP-ic) method enables us to calculate the required quantity ∑Qexc for e- - N2 scattering [22-24]. This method also offers an estimate of the neutral dissociation cross section QNDiss for N2. Specifically the idea is to subtract out total emission cross sections Qemiss of major emission lines at 95.8, 337.1 and 135.4 nm [8, 25, 26] of N2 from ΣQexc obtained by CSP-ic method. Finally as in the case of H2, we also include dissociative ionization process resulting into single neutral N atom production per event. That is to say that we consider the dissociative ionization cross section Qd-ion representing
ei + N2 N + N+ + es + ej (10)
The required cross sections Qd-ion are obtained from the experimental data of Lindsay and Mangan [27]. This leads us to the overall or total neutral dissociation cross section QNDiss for N2 corresponding to production of a neutral atom pair.
QNDiss = (∑Qexc - Qemiss) + (11)
The errors in the measured data [8], [25] and [26] are
~13.5, 25 and 22 % respectively, while those in [27] are ~6%. The difference between equation (11) for N2 and equation (5) for H2 may be noted. Neutral Dissociation Collision Frequency e--H2, e--N2 Our next task is to incorporate this microscopic quantity QNDiss to obtain macroscopic quantity i.e. effective collision frequency <νNDiss> for these molecules as in a realistic bulk medium.
If we assume incident electrons to be mono-energetic the neutral dissociation collision frequency νNDiss can be defined by,
The approach outlined above,
Qd-ion
. ( ).NDiss NDiss iN Q Eν υ=
(12)
Where, N is the number density of target molecules per cc and υ is the velocity of the incident electron.
Actually the incident electrons are in the form of the flux of precipitated electrons or the photo-electrons. Hence, considering Shkarofsky [28] with notation of Itikawa [29], the effective collision frequency <νNDiss> for the production of neutral atom pair can be defined as,
(13)
i
e
Ek T
∈ = ; reduced kinetic energy of the electrons,
where k = Boltzmann’s constant,
Te = electron temperature 1.5 E+05 0K, m = mass of electrons and Ip = Ionization potential (in unit of kTe) for the target molecule.
In equation (13), Maxwelllian distribution of energetic electrons is assumed as an approximation.
N2 gas is dominant not only in Earth’s atmosphere but also the most abundant gaseous species in Titan’s atmosphere. Similarly H2 gas is almost equally abundant in Jupiter’s atmosphere. The number density of H2 in Jupiter atmosphere is derived from analysis of the α Leo occultation experiment on board Voyager- 1 by Atreya et al [30]. They [30] had derived density profile for H2 with altitude relative to Ammonia clouds located at pressure 600mb and temperature 150 0K in Jupiter’s atmosphere. The number density for N2 in Titan’s atmosphere is obtained from globally averaged INMS (on board Cassini) profiles for N2 for thermospheric temperature 154 0K in Jupiter’s atmosphere [31]. Respective number densities of H2 and N2 as shown in Table 1 are used in equation (12) to obtain the present calculations of <νNDiss>, which indeed is a measure of the number of neutral fragment pairs of the concerned molecule. In our knowledge this is first attempt of its kind to estimate neutral atom pair production in planetary atmosphere of Jupiter and Titan.
Table – 1: H2 and N2 number density in Jupiter and Titan’s
atmosphere respectively at different altitudes
Species Altitude (km) Number density (cm-3)
50 1.7 E+14 H2 in Jupiter’s atmosphere
200 8.3 E+11
1000 5.6 E+09 N2 in Titan’ atmosphere
1200 3.1 E+08
RESULTS AND DISCUSSION
The present paper aims at two-fold purpose. Firstly we calculate the neutral dissociation cross section QNDiss of simple diatomic species like H2 and N2. In case of H2, QNDiss is calculated by adding up excitation cross sections to the states b3Σu
+, a3Σg+ and c3∏u along with the consideration of
dissociation ionization appropriately. While in the case of N2 complicated potential energy diagram with many states contributing to neutral dissociation lead us to choose our CSP-ic method to extract out QNDiss. For N2, QNDiss is obtained via subtraction of cross section for major emission lines from ∑Qexc and addition of (1/2).Qd-ion. Secondly we have performed here the calculations on the rate of neutral atom pair production via electron impact on the H2 and N2 gases in the planetary atmosphere of Jupiter and Titan respectively. Finally the desired collision frequencies are obtained through equation (13) and thereby deriving the number of neutral atom pairs generated upon electron impact. The relative abundance of these extensively studied molecules in planetary atmospheres of
( ) ( )if
e xc E Q i fQ = →Σ ∑
324
3p
NDiss NDissI
e dν νπ
∞−∈>= ∈ ∈∫<

154 PRAJÑĀ – Journal of Pure and Applied Sciences 18: 151- 156 December
Jupiter and Saturn’s moon-Titan tempted us to perform these calculations.
Hydrogen Molecule
Fig. 1 Excitation cross sections to the states b3Σu+ (solid line), c3∏u
(dashed line) and a3Σg+ (dotted line): Yoon et al [9] (star);
Nishimura and Danjo [32] (Square).
Excitation cross sections to be utilized for the neutral dissociation calculations are shown in Fig. 1. Solid curve indicates excitation to the b3Σu
+ state extracted via Quantemol-N package. Comparison is made with available recommended experimental data by Yoon et al with an error of ~±25% [9] and Nishimura and Danjo [32]. Deviation of our calculated results from the available experimental data above 13 eV can be attributed partly to our theory i. e. Quantemol calculations, and partly to experimental errors. The experimental measurement of [9] and [32] are obtained through electron energy loss spectra via spectrum integration over concerned energy loss region. Present results match within experimental errors. Dashed curve in Fig. 1 shows cross sections for excitation to the state c3∏u [17] and dotted curve shows that for excitation to a3Σg
+ state
Fig. 2 Total Dissociation cross section for H2: present QNDiss (solid line); Corrigan [10] (Star); Chung and Lin [4] (dash)
Cross section for excitation to b3Σu
+, c3∏u and a3Σg+ states are added together [4] to derive total neutral dissociation cross section QNDiss as shown in Fig. 2. Present results are compared with available theoretical [4] and experimental [10] data. Overall good agreement can be seen with both the available
data. Present results fall within the large error bars of Corrigan data.
H2 is the most abundant molecule in Jupiter’s atmosphere. Dissociation of H2 into a pair of neutral H atom via EUV or electron impact must be playing the most important role in the atmospheric chemistry of Jupiter. Based on this argument it is necessary to estimate the number of neutral atoms generated via electron impact to understand atmospheric chemistry. As an initiative we have tried to estimate this number approximately by mean of collision frequency, using equation (13).
Fig. 3 Effective neutral dissociative collision frequency <νNDiss> for electron impact upon H2 molecule in Jupiter's atmosphere: collision frequency at 50 km (solid line); collision frequency at 200 km (dashed line).
Fig. 3 shows the neutral dissociation collision frequency of
electron impact upon H2 molecule in Jupiter atmosphere. Effective <νNDiss>, corresponding to two different altitudes of 50 and 200 km relative to ammonia clouds, is shown. Number densities of H2 at respective altitudes are 1.7 E+14 per cc and 8.3 E+11 per cc [30]. The calculated frequency sharply peaks at about 14 eV at both altitudes. Fig. 4 Total Dissociation cross section for N2: present QNDiss (solid line);
Winters [5] (filled square); Cosby (recommended) [6] (filled triangle); Cosby (original) [6] (filled circle); ΣQexc (corrected) [dash].
Nitrogen Molecule
Now for electron impact on N2, total dissociation cross sections QNDiss is calculated and obtained as mentioned in theoretical methodology section. Graphically these cross
[18].

2010 Pandya and Joshipura – Dissociation of atmospheric 155
sections can be seen as is shown in Fig. 4. Solid line represents present values of QNDiss. Curve with dashed line indicate ΣQexc, obtained via CSP-ic method, corrected for emission cross sections. Winters’ [5] original data contained ionization contribution and hence corrected for the dissociation cross section is shown by filled squares in Fig. 4. Cosby [6] has performed experiment for neutral dissociation of N2. But owing to its lower values than winters’(filled circle) a recommended data set is given by Cosby [6] after considering the error involved in both the experiment is shown as filled triangle in Fig. 4.
N2 molecule is the most profuse gaseous constituent not only in Earth’s atmosphere but also in Saturn’s satellite –Titan. N2 is subjected to significant bombardment both by energetic electrons as in the case of aurora and by low energy photoelectrons produced in normal atmosphere [33, 34]. Thus role of neutral dissociation of N2 cannot be neglected in the study of their atmospheric chemistry.
An estimate of number of neutral pair generated by electron impact having energy from excitation threshold to 140 eV is shown graphically in Fig. 5. Upper curve with solid line shows effective collision frequency of electrons with ~5.6E+9/cc N2 molecule available at 1000 km altitudes of the Titan’s atmosphere and dashed curve in the lower part shows similar profile for ~3.1E+8/cc N2 molecules available at 1200 km altitudes of the Titan’s atmosphere.
Fig. 5 Effective neutral dissociative collision frequency <νNDiss> for electron impact upon N2 molecule in Titan's atmosphere: collision frequency at 1000 km (solid line); collision frequency at 1200 km (dashed line).
In case of effective collision frequency for N2, a broad
peak is observed as compared to a sharp profile for H2 as shown in the Fig. 3. This difference arises due to the dissociative ionization. For H2 the dissociative ionization has very small contribution in low energy region [9] where as for N2 there is a significant contribution from dissociation ionization above 30 eV, which effectively broadens the distribution as seen from Fig. 5. CONCLUSION
We conclude that the key finding of the present paper is
neutral pair production rate via dissociation of atmospheric
molecule H2 and N2 upon electron impact, either via externally precipitated electrons or photoelectrons. Maximum neutral pair production rate in Jupiter’s atmosphere is 5.38E+16 pairs per sec at 50 km altitude and 2.6E+14 pairs per sec at 200 km altitude and it occurs for electrons having 14 eV energy. In case of the Titan, the corresponding values are 9.92E+11 pairs per sec at 1000 km altitude and 5.49E+10 pairs per sec at 1200 km altitude for electrons having 40 eV energy. These frequencies depend on the respective cross sections of electron impact and on the number density at respective altitudes. The errors involved in the present theoretical estimates in collision frequencies are at least of the order of respective experimental data employed in deducing the cross sections. Further we have not taken into account the recombination of H+ giving neutral H, after dissociative ionization equation (3). A true picture of neutral atom production rate can emerge if one also considers the photo-dissociation of the molecules in the respective environments. ACKNOWLEDGEMENT We are thankful to the Indian Space Research Organization (ISRO-Bangalore, India) for supporting the research project under which the present work is carried out. REFERENCES [1] Herzberg, G. (1950) Molecular spectra and molecular
structure, Spectra of Diatomic Molecules, New York: Van Nostrand Reinhold.
[2] Chung,S. Lin, C. C. and Edward Lee, T. P. (1975) Dissociation of the hydrogen molecule by electron impact, Phys. Rev. A 12: 1340.
[3] Zipf, E. C. (1984) Dissociation of Molecules by electron impact, in Electron- Molecule interaction and their applications, Vol. 1, Edited by L. G. Chrostophorou, p.365, Academic Press.
[4] Chung, S. and Lin, C. C. (1978) Application of the close-coupling method to excitation of electronic states and dissociation of H2 by electron impact, Phys. Rev. A 17: 1874.
[5] Winters, H. F. (1966) Ionic adsorption and dissociation cross section for nitrogen, J. Chem. Phys. 44: 1472.
[6] Cosby, P. C. (1993) Electron-impact dissociation of nitrogen, J. Chem. Phys. 98: 9544
[7] Zipf E. C. and McLaughlin, R. W. (1978) On the dissociation of nitrogen by electron impact and by E.U.V. photo-absorption, Planet. Space. Sci. 26: 449.
[8] Ajello, J. M. James, G. K. Frenklin, B. O. and Shemansky, D. E. (1989) Medium- resolution studies of extreme ultraviolet emission from N2 by electron impact: vibrational perturbations and cross sections of the c1Σu
+ and b1Σu
+ states, Phys. Rev. A 40: 3524. [9] Yoon, J. Song, M. Han, J. Hwang, S. Chang, W. Lee, B.
(2008) Cross sections for electron collision with hydrogen molecules, J. Phys. Chem. Ref. Data 37:
[10] Corrigan, S. J. B. (1965) Dissociation of molecular hydrogen by electron impact, J. Chem. Phys. 43: 4381.
[11] Burke, P. G. and Berrington, K. A. (1993) Atomic and Molecular Processes- An R-matrix Approach, Bristol Institute of physics publishing, Bristol.
[12] Burke, P. G. and Tennyson, J. (2005) R-matrix theory of electron molecule scattering, Mol. Phys. 103: 2537.
[13] Tennyson,J. Brown, D. B. Munro, J. Rozum, I. Varambhia, H. and Vinci, N. (2007) Quantemol-N: an expert system

156 PRAJÑĀ – Journal of Pure and Applied Sciences 18: 151- 156 December
for performing electron molecule collision calculations using the R-matrix method Journal of Physics: Conference Series 86: 012001 http;//www.quantemol.com.
[14] NIST Computational Chemistry Comparison and Benchmark Database, NIST Standard Reference Database Number 101 Editor: Russell D. Johnson III http://srdata.nist.gov/cccbdb/ and reference therein.
[15] Tennyson, L. A. J. and Gillan, C. J. (1998) The UK molecular R-matrix codes, Comput. Phys. Commun. 114: 120.
[16] K. L. Schuchardt et al, (2007) Basis set exchange: A community database for computational sciences, J. Chem. Inf. Model. 47: 1045.
[17] Khakoo, M. A. and Trajmar, S. (1986) Electron impact excitation of the a3Σg
+, B1Σu+, c3∏u and C1∏u states of H2,
Phys. Rev. A 34: 146. [18] Khakoo, M. A. Trajmar, S. Mcadams, R. and Shyn, T. W.
(1987) Electron excitation cross section for the b3Σu+ state
of H2, Phys. Rev. A 35: 2832. [19] Joshipura, K. N. Kothari, H. N. Shelat, F. A. Bhowmik P.
and Mason, N. J. (2010) Electron scattering with metastable H2*(c3Πu) molecules: ionization and other total cross sections, J. Phys. B 43: 135207.
[20] Straub, H. C. Renault, P. Lindsay, B. G. Smith, K. A. and Stebbings, R. F. (1996) Absolute partial cross section for electron-impact ionization of H2, N2 and O2 from threshold to 1000 eV, Phys. Rev. A 54: 2146.
[21] Gillan, C. J. Tennyson, J. McLaughlin, B. M. and Burke, P. G. (1996) Low-energy electron impact excitation of nitrogen molecule- optically forbidden transitions, J. Phys. B 29: 1531.
[22] Joshipura, K. N. Gangopadhyay, S. Kothari, H. N. and Shelat, F. A. (2009) Total electron scattering and ionization of N, N2 and metastable excited N2
*(A3Σu+):
Theoretical cross sections, Phys. Lett. A 373: 2876. [23] Joshipura, K. N. and Gangopadhyay, S. (2008) Electron
collisions with sulfur compounds SO, SO2 and SO2AB (A, B = Cl, F): various total cross sections, J. Phys. B 41: 215205.
[24] Joshipura, K. N. Vaishnav, B. G. and d Gangopadhyay, S.
(2007) Electron impact ionization cross-sections of plasma relevant and astrophysical silicon compounds: SiH4, Si2H6, Si(CH3)4, SiO, SiO2, SiN and SiS, Int. J. Mass. Spectrom 261: 146.
[25] Ajello, J. M. and Shemansky, D. E. (1985) A re-examination of important N2 cross section by electron impact with application to the airglow: The Lyman-Birge-Hopfield band system, J. Geophys. Res. 90: 9845.
[26] Shemansky, D. E. Ajello, J. M. and Kanik, I. (1995) Electron excitation function of the N2 second positive system, Astrophys. J. 452: 472.
[27] Lindsay, B. G. and Mangan, M. A. (2003) Photon and electron interaction with atom molecules and Ions, Landolt-Bornstein Vol 1/17, Subvolume C, Edited by Y. Itikawa, Springer, New York.
[28] Shkarofsky, I. P. (1961) Values of the transport coefficients in a plasma for any degree of ionization based on a Maxwelllian distribution, Can. J. Phys. 39: 1619.
[29] Itikawa, Y. (1971) Effective collision frequency of electrons in atmospheric gases, Planet. Space Sci.19: 993.
[30] Atreya, S. K. Donahue, T. M. Festou, amd M. C. (1981) Jupiter: Structure and composition of the upper atmosphere, The Astrophys. J. 247: L43.
[31] Brown, R. H. Lebreton, Hunter Waite, J. J. (2010) Titan from Cassini-Huygens Springer, Dordrecht, ISBN 978-1-4020-9214-5.
[32] Nishimura, H. and Danjo, A. (1986) Differential cross section of electron scattering from molecular Hydrogen.II. B3Σu
+ excitation J. Phys. Soc. Japan 55: 3031. [33] Fox, J. L. and Victor, G. A. (1988) Electron energy
deposition in N2 gas, Planet. Space Sci. 36: 329. [34] Strobel, D. F. Meier, R. R. Summers, M. E. and Strikland,
D. J. (1991) Nitrogen airglow sources: Comparison of Triton, Titan, and Earth, Geophys. Res. Lett. 18: 689.

PRAJÑĀ - Journal of Pure and Applied Sciences, Vol. 18: 157 - 162 (2010) ISSN 0975 - 2595
MAGNETIC MOMENTS OF LIGHT FLAVOUR BARYONS IN A HYPERCENTRAL QUARK MODEL
Kaushal Thakkar1, Arpit Parmar1, Bhavin Patel2 and P. C. Vinodkumar1*
1Department of Physics, Sardar Patel University, Vallabh Vidyanagar, Gujarat - 388 120
2 LDRP Institutes of Technology and Research, Gandhinagar, Gujarat
ABSTRACT
The light flavour baryons are studied within the quark model using the hyper central description of the three-body system. The confinement potential is assumed as hypercentral coulomb plus power potential ( hCPPν ) with power indexν . The masses and magnetic moments of light flavour baryons are computed for different power index, ν starting from 0.5 to 1.5. The predicted masses and magnetic moments are found to attain a saturated value with respect to variation in ν beyond the power index ν > 1.0 Key words: potential model, magnetic moment, light baryons. I NTRODUCTION
Baryons are not only interesting systems to study the quark dynamics and their properties but are also interesting as simple systems to study three body interactions. In the last two decades, there has been great advancement in the study of baryon properties. The ground state masses and magnetic moments of many low lying baryons have been measured experimentally. The magnetic moments of all octet baryons ( 1
2PJ += ) are known accurately except for which has a
life time ( s compared to s for
0∑2010− 1010− −+∑ ) too
short to measure experimentally. For the decuplet baryons
( 32
PJ += ), the experimental measurements are poor as they also have very short life times due to available strong interaction decay channels. The −Ω is an exception as it is composed of three s quarks which decays via weak interaction and that make its life time longer [1]. The Δ particles are produced in scattering the pion, photon, or electron beams off a nucleon target. High precision measurements of the transition by means of electromagnetic probes became possible with the advent of the new generation of electron beam facilities such as LEGS, BATES, ELSA, MAMI, and those at Jefferson Lab. Many such experimental programs devoted to the study of electromagnetic properties of have been reported in the past few years [2-4]. The experimental information provides new incentives for theoretical study of these observables. Theoretically, there exist serious discrepancies between the quark model and experimental results particularly in the predictions of their magnetic moments [5-7]. Various attempts including lattice QCD (Latt) [8, 9, 10], chiral perturbation theory (
N →Δ
Δ
PTχ ) [11-15], relativistic quark model (RQM) [16, 17], non relativistic quark model (NRQM) [18], QCD sum rules (QCDSR) [6, 7, 19, 20], chiral quark soliton model ( QSMχ ) [21, 22], chiral constituent quark model ( CQMχ ) [23], chiral bag model ( Bχ ) [24], cloudy bag model [25], quenched lattice gauge theor [26] etc., have been tried, but with partial success. y
However, the six dimensional hyper central quark model
with coulomb plus power potential ( hCPPν ) is found to be
successful in predicting the masses and magnetic moments of baryons in the heavy flavour sector (baryon containing charm or beauty quarks) [27, 28]. Thus, it has prompted us to extend the hCPPν model in the light flavour baryonic sector. Accordingly, in this paper we compute the masses and magnetic moments of octet and decuplet baryons in the u, d, s sector. In section 2 the hypercentral scheme and a brief introduction of hCPPν potential employed for the present study are described. Section 3 describes the computational details of the magnetic moment of octet and decuplet baryons. In section 4 we discuss our results while comparing with other heoretical predictions and experimental results. t
MATERIALS AND METHODS Hypercentral Scheme for Baryons
Quark model description of baryons is a simple three body system of interest. Generally the phenomenological interactions among the three quarks are studied using the two-body quark potentials as in the case of the Isgur Karl Model [29], the Capstick and Isgur relativistic model [30, 31], the Chiral quark model [32], the Harmonic Oscillator model [33, 34] etc. The three-body effects are incorporated in such models through two-body and three-body spin-orbit terms [27, 35]. The Jacobi Co-ordinates to describe baryon as a bound state of three onstituent quarks are given by [36] c
( )1 212
r rρ = − ;( )( )( )
1 1 2 2 1 2 3
22 21 2 1 2
m r m r m m r
m m m mλ
+ − +=
+ + + (1)
Such that
1 2
1 2
2m mm
m mρ = +;
( )( )( )
2 23 1 2 1 2
1 2 1 2 3
2m m m m mm
m m m m mλ
+ +=
+ + + (2)
Here m1, m2 and m3 are the constituent quark mass parameters. In the hypercentral model, we introduce the hyper spherical coordinates which are given by the angles
( , )λ λ λθ φΩ = ; ( , )ρ ρ ρθ φΩ = (3) together with the hyper radius, x and hyper angle ξ respectively as,
*Corresponding author: [email protected]

158 PRAJÑĀ – Journal of Pure and Applied Sciences 18: 157 - 162 December
2 2x ρ λ= + ; arctan( )ρξλ
= (4)
The model Hamiltonian for baryons can now be expressed as
2 2 2
( , ) ( )2 2 2
xP P PH V V
m m mρ λ
ρ λ
ρ λ= + + = + x (5)
Here the potential is not purely a two body interaction but it contains three-body effects also. The three body effects are desirable in the study of hadrons since the non-abelian nature of QCD leads to gluon-gluon couplings which produce three-body forces [37]. Using hyperspherical coordinates, the kinetic energy operator
( )V x
2
2xPm
of the three-body system can be
written as 22 2
2 2
( , , )1 52 2
x LPm m x xx x
ρ λ ξ⎛ Ω Ω− ∂ ∂= + −⎜ ⎟⎜ ∂∂⎝
⎞⎟⎠
(6)
Where 2 ( , , )L ρ λ ξΩ Ω is the quadratic Casimir operator of the
six dimensional rotational group and its eigen functions
are the hyperspherical harmonics,
(6)O
[ ] ( , , )l lYργ ρ ρ λ ξΩ Ω
satisfying the eigenvalue relation 2
[ ] [ ]( , , ) ( 4) ( , , )l l l lL Y Yρ ργ ρ ρ λ γ ρ ρ λξ γ γ ξΩ Ω = + Ω Ω (7)
Here γ is the grand angular quantum number and it is given
by 2 l lργ ν= + + λ , and 0,1,.....ν = lρ and lλ being the
angular momenta associated with the ρ and λ variables. If the interaction potential is hyper spherical such that the potential depends only on the hyper radius x , then the hyper radial Schrödinger equation corresponds to the hamiltonian given by Eqn. (5) can be written as
( ) ( ) ( ) ( )2
2
5 4 2d d x m E V x xx dxdx γ γγ γ φ φ
⎡ ⎤+ − + = − −⎡ ⎤⎢ ⎥ ⎣ ⎦
⎣ ⎦ (8) Here, m is the reduced mass defined by [33]
2m mm
m mρ λ
ρ λ
=+
(9)
For the present study we consider the hyper central potential as the hyper coulomb plus power (( )V x hCPPν ) form similar
to the one given by [27, 28, 38] as
( ) spinV x x Vx
ντ β κ= − + + + (10)
In the above equation the spin independent terms correspond to confinement potential as in the hyperspherical co-ordinates. It belong to a generality of potential of the form
0Ar r Vα εκ− + + where and , ,A κ α ε are non negative
constants where as can have either sign. There are many attempts with different choices of
0Vα and ε to study the hadron
properties [39]. For example, Cornell potential has 1α ε= = , Lichtenberg potential has 0.75α ε= = . Song-Lin potential has 0.5α ε= = and the Logarithmic potential of Quigg and Rosner corresponds to 0α = , 0ε → [39]. Martin potential corresponds to 0α = , 0.1ε = [39] while Grant, Rosner and
Rynes potential corresponds to 0.045α = , 0ε = ; Heikkila&& , and Ono potential corresponds to Tornqusit&& 1α = ,
2 3ε = [40]. It has also been explored in the region 0 1.2α ≤ 0 1., 1 αε≤ ≤ ≤ of ε− values [41]. So it is important to study the behavior of different potential scheme with different choices of α and ε to know the dependence of their parameters to the hadron properties. The spin independent part of potential defined by Eqn.(10) corresponds to 1α = and ε ν= . Here τ of the hyper-coulomb, β of the confining term and κ are the model parameters. The parameter τ is related to the strong running coupling constant sα as [27, 28]
23 sbτ α= (11)
where b is the model parameter ( ), 14≈ 23
is the color factor
for the baryon and mβ τ= numerically in terms of
( ) 1MeV ν +are the potential parameters as employed for the
study of heavy flavour baryons [27, 28]. The strong running coupling constant is computed using the relation
( )
( )
0
00
33 21 l
12
ss
fs
nα μ
αn μα μ
π μ
=− ⎛ ⎞
+ ⎜ ⎟⎝ ⎠
(12)
where ( )0 1s GeVα μ = ≈ 0.6 is considered in the present study. To account for the mass difference between the octet and decuplet baryons, the spin dependent part of the three body interaction of Eqn. (10) is considered as [27, 35]
( )0
20
.1 .4 6
xx
i jspin s i j
i j i j
eV xm mxxσ σ
α λ λ
−
<
= − ∑r r
r r (13)
with 0x as the hyperfine parameter of the model. The six dimensional radial Schrodinger equation described by Eqn. (8) has been solved in the variational scheme with the hyper coloumb trial radial wave function given by [37]
( ) ( )( )( ) ( ) (
16 2
2 4! 22 2
2 5 4 !gxg
)gx e L gxγ γωγ ω γ
ω γψ
ω ω γ− +
−
⎡ ⎤−= ⎢ ⎥
+ + +⎢ ⎥⎣ ⎦
(14) The wave function parameter g and hence the energy eigen values are obtained by applying virial theorem for a chosen potential indexν . The baryon masses are then obtained by the sum of the quark masses with the expectation value of the Hamiltonian as
B ii
M m H= +∑ (15)
For the present calculations, we have employed the same mass parameters of the light flavour quarks (mu =338 MeV, md = 350 MeV, ms = 500 MeV) as used in [27]. We fix other parameters (b of Eqn.(11) and 0x of Eqn.(13)) of the model for each choices of ν so as to reproduce the experimental center of weight (spin-average mass) and hyper fine splitting of the octet decuplet baryons. The procedure is repeated for different choices of ν and the computed masses of octet and decuplet baryons are listed in Table (1) and Table (2) respectively.

2010 Thakkar et al. – Magnetic movements of light 159 EFFECTIVE QUARK MASS AND MAGNETIC MOMENTS OF LIGHT BARYONS
Within the baryons the mass of the quarks may get
modified due to its binding interactions with other two quarks. We account this bound state effect by defining an effective mass to the bound quarks, as given by [27, 28, 38] eff
im
1effi i
ii
Hm m
m
⎛ ⎞⎜⎜= +⎜ ⎟⎜ ⎟⎝ ⎠
∑
⎟⎟
(16)
such that 3
1
effB i
iM m
=
= ∑ .
Now the magnetic moment of the baryons are computed in terms of its quarks spin-flavour wave function of the constituent quarks as
| |B sf i i s fi
μ φ μ σ φ= ∑ r (17)
where
2i
i effi
em
μ = (18)
Here ei and iσ represents the charge and the spin of the quark constituting the baryonic state and
sfφ represents the spin-
flavour wave function of the respective baryonic state as listed in [42]. The computations are repeated for the different choices of the flavour combinations of qqq (q = u, d, s). The computed magnetic moments of the octet and decuplet baryons are listed n Table (3) and (4) respectively. i
Fig. 1 Variation of octet (a) and decuplet (b) baryon masses with
respect to potential indexν . The experimental masses of these baryons are shown with error bar. The shaded region show minimum root mean square deviation with experimental results.
Fig. 2 Behaviour of the magnetic moments of octet and decuplet
baryons with respect to potential indexν . The known experimental values are shown with error bar. The shaded region show minimum root mean square deviation with experimental results.
RESULTS AND DICUSSION The masses of octet and decuplet baryons in the hyper
spherical coulomb plus power potential ( hCPPν ) model with the different choices of potential index ν have been studied. It is found that the masses of octet and decuplet baryons obtained from the hCPPν model are in good agreement with the experimental values around the potential index 1.0ν ≈ . Fig.(1) shows the behaviour of the predicted masses of the octet (1a) and decuplet (1b) baryons with the choices of the potential index ν from 0.5 to 1.5. The experimental masses of these baryons are shown with their error bar. The trend lines here show saturation of the masses beyond 1.0ν > . The shaded regions in Fig.(1) show the neighbour hood region of ν at which the predicted masses are having minimum root mean square deviation with the experimental masses.
The computed magnetic moments of the octet and
decuplet low lying baryons are compared with the known experimental results as well as with other model predictions in Table (1) and (2) respectively. Our results for the choice of
0.7ν ≈ are found to be in agreement with the known experimental values as well as with other model predictions. The behavior of the predicted magnetic moments with potential index ν are shown in Fig.(2) of the octet (2a) and decuplet (2b) baryons. The same saturation trends beyond the potential index 1.0ν > are observed. The shaded region in Fig.(2a) corresponds to the region of ν ( 0.6 0.7ν< < ) for which the predicted octet baryon magnetic moments show minimum root mean square deviation with the experiments. The predicted magnetic moments of the decuplet baryons in the same region of ν ( 0.6 0.7ν< < ) are found to be closer to the existing experimental values of Δ and baryons. Probably, it reflects the fact that
ΩhCPPν model potential adequately represents the
three body quark-quark interactions in the baryonic sector.

160 PRAJÑĀ – Journal of Pure and Applied Sciences 18: 157 - 162 December
Table 1: Mass of Octet Baryons ( 12
PJ += )
hCPPν Baryon Octet Mass(MeV) Baryon Octet Mass(MeV)
Our Others Our Others
0.5 uud(p) 1065.68 939.00[5] uds( 0∑ ) 1344.67 1193.00[5]
0.7 967.41 938.27[43] 1239.94 1192.64[43]
1.0 931.08 866.00[44] 1203.29 1022.00[44]
1.5 924.24 938.27[1] 1195.98 1192.64[1]
0.5 ddu(n) 1067.24 939.00[5] uds( −∑ ) 1345.46 1197.00[5]
0.7 971.74 939.57[43] 1243.71 1197.45[43]
1.0 935.77 866.00[44] 1205.99 1022.00[44]
1.5 929.04 939.56[1] 1199.06 1197.45[1]
0.5 uds(Λº) 1289.26 1116.00[5] ssu(Ξº) 1420.19 1315.00[5]
0.7 1183.59 1115.68[43] 1331.65 1314.64[43]
1.0 1147.34 1022.00[44] 1297.09 1215.00[44]
1.5 1139.88 1115.65[1] 1291.43 1314.86[1]
0.5 uus( ) +∑ 1339.95 1189.00[5] ssd(Ξ¯) 1428.97 1321.00[5]
0.7 1235.98 1189.39[43] 1340.44 1321.39[43]
1.0 1198.84 1022.00[44] 1306.55 1215.00[44]
1.5 1191.50 1189.37[1] 1299.61 1321.71[1]
Table 2: Mass of Decuplet Baryons ( 32
PJ += )
hCPPν Baryon Decuplet Mass(MeV) Baryon Decuplet Mass(MeV)
Our Others Our Others
0.5 uuu( ) ++Δ 1361.68 1232.00[5] uds( *0∑ ) 1530.40 1384.00[5]
0.7 1264.17 1230.82[43] 1428.43 1384.18[43]
1.0 1228.63 1344.00[44] 1390.47 1447.00[44]
1.5 1221.21 1232.00[1] 1383.66 1383.70[1]
0.5 uud( ) +Δ 1358.30 1232.00[5] dds( *−∑ ) 1534.72 1387.00[5]
0.7 1260.78 1230.57[43] 1431.66 1387.18[43]
1.0 1223.74 1344.00[44] 1395.44 1447.00[44]
1.5 1216.33 1232.00[1] 1387.45 1387.20[1]
0.5 ddu( ) 0Δ 1360.22 1232.00[5] ssu( *0Ξ ) 1640.49 1532.00[5]
0.7 1263.77 1231.87[43] 1549.05 1531.81[43]
1.0 1228.68 1344.00[44] 1516.19 1583.00[44]
1.5 1221.25 1232.00[1] 1508.03 1531.80[1]
0.5 ddd( ) −Δ 1356.79 1232.00[5] ssd( *−Ξ ) 1641.69 1535.00[5]
0.7 1260.32 1234.73[43] 1553.10 1534.95[43]
1.0 1223.65 1344.00[44] 1519.35 1583.00[44]
1.5 1217.80 1232.00[1] 1512.23 1535.00[1]
0.5 uus( ) *+∑ 1534.60 1383.00[5] sss( −Ω ) 1804.12 1672.00[5]
0.7 1430.54 1382.74[43] 1718.22 1672.45[43]
1.0 1392.93 1447.00[44] 1678.70 1701.00[44]
1.5 1386.16 1382.80[1] 1668.16 1672.45[1]

2010 Thakkar et al. – Magnetic movements of light 161
Table 3: Magnetic moments of octet baryons in Nμ
Various models p n 0Λ +∑ 0∑ −∑ 0Ξ −Ξ
hCPPν ν =1.5 3.07 -2.04 -0.65 2.64 0.84 -0.98 -1.50 -0.55 ν =1.0 3.04 -2.07 -0.64 2.63 0.83 -0.98 -1.49 -0.55 ν =0.7 2.93 -1.93 -0.62 2.54 0.81 -0.95 -1.46 -0.54 ν =0.5 2.66 -1.76 -0.57 2.35 0.74 -0.88 -1.37 -0.51
Expt.. [1] 2.79 -1.91 -0.61 2.46 -1.16 -1.25 -0.65
QCDSR [20] 2.82 -1.97 -0.56 2.31 0.69 -1.16 -1.15 -0.64
χCQM [23] 2.8 -2.11 -0.66 2.39 0.54 -1.32 -1.24 -0.50
χPT [11] 2.58 -2.10 -0.66 2.43 0.66 -1.10 -1.27 -0.95
Latt. [8] 2.79 -1.60 -0.50 2.37 0.65 -1.08 -1.17 -0.51
CDM [46] 2.79 -2.07 -0.71 2.47 -1.01 -1.52 -0.61
QM [47] 2.79 -1.91 -0.59 2.67 0.78 -1.10 -1.41 -0.47
QM + T [47] 2.79 -1.91 -0.61 2.39 0.63 -1.12 -1.24 -0.69
BAGCHI [5] 2.88 -1.91 -0.71 2.59 0.83 -0.92 -1.45 -0.62
Dai fit A [48] 2.84 -1.87 2.46 -1.06 -1.28 -0.61
Dai fit B [48] 2.80 -1.92 2.46 -1.23 -1.26 -0.63
SIMON [49] 2.54 -1.69 -0.69 2.48 0.80 -0.90 -1.49 -0.63
SU (3) BR. [50] 2.79 -1.97 -0.60 2.48 0.66 -1.16 -1.27 -0.65
PQM [45] 2.68 -1.99 -0.56 2.52 -1.17 -1.27 -0.59
Table 4: Magnetic moments of decuplet baryons in Nμ
Various models ++Δ +Δ 0Δ −Δ *+∑ *0∑ *−∑ *0Ξ *−Ξ −Ω
hCPPν
ν =1.5 4.69 2.37 0.05 -2.34 2.61 0.29 -2.42 0.53 -1.92 -1.68
ν =1.0 4.66 2.35 0.05 -2.33 2.60 0.28 -2.40 0.53 -1.91 -1.67
ν =0.7 4.52 2.29 0.05 -2.25 2.53 0.27 -2.32 0.52 -1.87 -1.63
ν =0.5 4.19 2.12 0.05 -2.08 2.35 0.26 -2.15 0.49 -1.77 -1.56
Expt.. [1, 2, 3] 4.5 0.95±
3.5 – 7.5 1.01.32.70+− 0.00≈
LCQCD [6] 4.49 2.20 0.00 -2.20 2.70 0.20 -2.28 0.40 -2.00 -1.56
QCDSR [7] 4.39 2.19 0.00 -2.19 2.13 0.32 -1.66 -0.69 -1.51 -1.49
Latt. [8] 4.91 2.46 0.00 -2.46 2.55 0.27 -2.02 0.46 -1.66 -1.40
χPT [11] 6.04 2.84 -0.36 -3.56 3.07 0.00 -3.07 0.36 -2.56 -2.02
χPT [12] 4.00 2.10 -0.17 -2.25 2.00 -0.07 -2.20 0.10 -2.00 Input
RQM [16] 4.76 2.38 0.00 -2.38 1.82 -0.27 -2.36 -0.60 -2.41 -2.48
NRQM [18] 5.56 2.73 -0.09 -2.92 3.09 0.27 -2.56 0.63 -2.20 -1.81
χQSM [21] 4.73 2.19 -0.35 -2.90 2.52 -0.08 -2.69 0.19 -2.48 -2.27
χCQSM [23] 4.51 2.00 -0.51 -3.02 2.69 0.02 -2.64 0.54 -1.84 -1.71
χB [24] 3.59 0.75 -2.09 -1.93 2.35 -0.79 -3.87 0.58 -2.81 -1.75
EMS [51] 4.56 2.28 0.00 -2.28 2.56 0.23 -2.10 0.48 -1.90 -1.67
QCDSR [52] 6.34 3.17 0.00 -3.17

162 PRAJÑĀ – Journal of Pure and Applied Sciences 18: 157 - 162 December
R
EFERENCES [1] Amsler, C et al., (2008) Review of Particle Physics, Phys.
Lett. B 667. [2] Kotulla, M. et al., (2002), The reaction 0 'p pγ π γ→
and the magnetic dipole moments of the ( )1232+Δ resonance Phys. Rev. Lett. 89: 272001.
[3] Bosshard, A. et al., (1991), Analyzing power in pion-proton
bremsstrahlung, and the magnetic moment Phys. Rev. D 44: 1962.
(1232++Δ )[4] Yao, W. M. et al., (2006), “Review of Particle Physics” J.
Phys. G 33, 1. [5] Bagchi, M., Daw, S., Dey, M. and Dey, J. (2006), Mean-
field baryon magnetic moments and sumrules Europhys. Lett.,75: 548.
[6] Aliev, T. M. and Ozpineci, A. (2000), Magnetic moments of decuplet baryons in light cone QCD. Phys. Rev. D 62: 053012.
[7] Frank X. Lee, (1998), Determination of decuplet baryon magnetic moments from QCD sum rules. Phys. Rev. D 57: 1801.
[8] Leinweber, D. B., Draper, T. and Woloshyn, R. M. (1992), Decuplet baryon structure from lattice QCD. Phys. Rev. D 46: 3067.
[9] Cloet, I. C., Leinweber, D. B. and Thomas, A. W. (2003), Delta Baryon Magnetic Moments From Lattice QCD Phys. Lett. B 563: 157.
[10] Cloet, I. C., Leinweber, D. B. and Thomas, A. W. (2002) Physics at Japanese Hadron Facility, 125 - 135, World Scientific [arXiv:nucl-th/0211027]
[11] Geng, L. S., Camalich Martin, J., and Vicente Vacas, M. J., (2010), The lowest-lying spin-1/2 and spin-3/2 baryon magnetic moments in chiral perturbation theory Chinese Physics C 34: 21-26.
[12] Butler, M. N., Savage, M. J., and Springer, R. P. (1994), Electromagnetic moments of the baryon decuplet Phys. Rev. D 49: 3459.
[13] Meissner and Steininger, S. (1997), Baryon magnetic moments in chiral perturbation theory. Nucl. Phys. B 499: 349.
[14] Ha P. and Durand, L., (1998), Baryon magnetic moments in a QCD-based quark model with loop corrections Phys. Rev. D 58: 093008.
[15] Puglia, S. J., and Ramsay, M. J., (2000), Baryon octet magnetic moments in chiral perturbation theory: More on the importance of the decuplet Phys. Rev. D 62, 034010.
[16] Schlumpf, F. (1993), “Magnetic moments of the baryon decuplet in a relativistic quark model” Phys. Rev. D 48: 4478.
[17] Chao, K. T. (1990), Baryon magnetic moments with confined quarks. Phys. Rev. D 41: 920.
[18] Ha P. and Durand L., (1998), Baryon magnetic moments in a QCD-based quark model with loop corrections. Phys. Rev. D 58 093008.
[19] Frank X. Lee, (1998), Magnetic moments of Δ++ and Ω- from QCD sum rules. Phys. Lett. B 419: 14.
[20] Lai Wang and Frank X. Lee, (2008), Octet baryon magnetic moments from QCD sum rules. Phys. Rev. D 78: 013003.
[21] Kim, H. C., Praszalowicz, M. and Goeke, K. (1998), Magnetic moments of the SU(3) decuplet baryons in the chiral quark-soliton model. Phys. Rev. D 57: 2859.
[22] Kim, H. C., Praszalowicz, M. (2004), Magnetic moments of the exotic pentaquark baryons within the chiral quark-soliton model. Phys. Lett. B 585: 99.
[23] Harleen Dahiya, Neetika Sharma and Chatley, P. K. (2010), Magnetic moments of spin 1/2 ^+ and spin 3/2 ^+ charmed baryons AIP Conf. Proc. 1257:395-399.
[24] Hong, S. T. and Brown, G. E. (1994), Baryon-decuplet magnetic moments. Nucl. Phys. A 580:408.
[25] Krivoruchenko, M. I. (1987), Magnetic moments of Baryons. Sov. J., Nucl. Phys. A 45:109.
[26] Leinweber D. B., Draper T. and Woloshyn R. M., (1992), Decuplet baryon structure from lattice QCD. Phys. Rev. D 46: 3067.
[27] Patel, B, Rai, A. K. and Vinodkumar, P. C., (2008), Masses and magnetic moments of heavy flavour baryons in the hyper central model. J. Phys. G 35: 065001.
[28] Patel, B., Majethiya, A. and Vinodkumar, P. C., (2009), Masses and magnetic moments of triple heavy flavour baryons in hypercentral model. Pramana - J. Phys. 72, 679.
[29] Isgur, N. and Karl, G. (1978), P-wave baryons in the quark model. Phys. Rev. D 18: 4187.
[30] Godfrey, S. et al., (1985), Mesons in a relativized quark model with chromodynamics. Phys. Rev. D 32, 189.
[31] Capstick, S. and Isgur, N. (1986), Baryons in a relativized quark model with chromodynamics. Phys. Rev. D 34: 2809.
[32] Dahiya, H. and Gupta, M. (2003), Octet and decuplet baryon magnetic moments in the chiral quark model. Phys. Rev. D 67: 114015.
[33] Murthy, M. V. N. (1986), Strange baryons in the deformed model. Z. Phys. C 31: 81-86.
[34] Roberts, W. and Pervin, M. (2008), Heavy baryons in a quark model” Int.J.Mod.Phys.A 23: 2817-2860.
[35] Garcilazo, H. Vijande, J. and Valcarce, A. (2007), “Faddeev study of heavy baryon spectroscopy. J. Phys., G 34: 961-976.
[36] Bijker, R., Iachello, F. and Leviatan, A. (2000), Algebraic Models of Hadron Structure: II. Strange Baryons. Annals of Physics 284: 89-133.
[37] Santopinto, E., lachello, F., and Giannini, M. M. (1998), Nucleon form factors in a simple three-body quark model. Eur. Phys. J. A 1: 307- 315.
[38] Majethiya, A., Patel, B., and Vinodkumar, P. C. (2008), Single heavy flavour baryons using Coulomb plus a power law interquark potential. Eur. Phys. J A 38, 307.
[39] Sameer M. Ikhdair and Ramazan Sever, (2006), On solutions of the Schrödinger equation for some molecular potentials. Int. Jn. Mod. Phys. A 21: 3989.
[40] Heikkila, K., Tornquist, N. A. and Ono, S. (1984), Heavy cc and bb quarkonium states and unitarity effects. Phys. Rev. D 29: 110.
[41] Song, X. T. (1991), An effective quark-antiquark potential for both heavy and light mesons. J. Phys. G 17: 49.
[42] Contreras, J. G., Huerta, R. and Quintero, L. R. (2004), Baryon magnetic moments in SU(3) and the SU(2) flavour groups. Revista Mexicana de Fisica 50: 490.
[43] Phuoc Ha, (2008), A parametrization of the baryon octet and decuplet masses J. Phys. G 35: 075006.
[44] Mariaaline B. Do Vale et al., (1986), Revista brasileira de Fisica 16: 4.
[45] Franklin, J. (2002), Phenomenological quark model for baryon magnetic moments and beta decay ratios (GA/GV). Phys. Rev. D 66: 033010.
[46] Bae M. and McGovern J. A., (1996), Magnetic moments of the octet baryons in the colour-dielectric model. J. Phys. G 22: 199.
[47] Gupta, S. K. and Khadkikar, S. B. (1987), Precision description of the octet-baryon magnetic moments. Phys. Rev. D 36: 307.
[48] Dai, J., Dashen, R., Jenkins, E. and Manohar, A. V., (1996), Flavor symmetry breaking in the 1/Nc expansion. Phys. Rev. D 53: 273.
[49] Kerbikov, B. O. and Yu. A. Simonov, (2000), “Baryon magnetic moments in the QCD string approach” Phys. Rev. D 62: 093016.
[50] Bos, J. W. et al. (1997), The Okubo relation for the baryon magnetic moments and chiral perturbation theory. Chinese J. of Phys. C 35: 2.
[51] Rohit, D. and Verma, R. C. (2009), Magnetic moments of (JP = 3/2+) heavy baryons using effective mass and screened charge scheme. Eur. Phys. J A 42: 243.
[52] Azizi, K. (2009), Magnetic dipole, electric quadrupole and magnetic octupole moments of the Δ baryons in light cone QCD sum rules Eur. Phys. J C 61: 311.

A STATISTICAL STUDY ON SPATIAL AUTOREGRESSIVE MODELS
WITH REGIONAL RURAL POVERTY DIFFERENCE IN INDIA
Mayuri Pandya and Krishnam Bhatt
Department of statistics, Bhavnagar University, Bhavnagar-364 002, Gujarat, India.
ABSTRACT
The purposes of this paper are to study the literature concerning the spatial autoregressive models and then to examine the influences of different variables, in particular, spatial effects on the population under poverty line of different regions in India by employing 14 states data. Spatial econometrics is a subfield of econometrics that deals with spatial effects in regression models for spatial data. The subject of regional difference primarily focuses on inequality causes by factors of geography matters. This paper uses data of 1994 for 14 major states in India to explore whether spatial effects play a crucial role in Indian rural regional poverty difference in 1994. The basis findings are that the spatial error model reveals a strong positive relationship between measures of difference in population under poverty line and spatial heterogeneity. Key words: spatial econometrics, spatial effects, regional difference and spatial error.
INTRODUCTION
In regional science, space is a central concept. During the 1970s, attention was paid to a growing body of geographic science literature. Historically, spatial econometrics, first coined in the early 1970s , originates as an identifiable field in Europe because sub-country data in regional econometric models are needed to deal with and been fast developed & grown during the 1990s [1]. According to Anselin [2], spatial econometrics addresses issues causes by space in statistical analysis of regional science regressions. In other words, spatial econometrics is the combination of statistical and econometrics methods that deal with problems concerning spatial effects that usually consist of two sections, spatial dependence and spatial heterogeneity, which are causes by using spatial data such as cross-sectional data and panel data.
The subject of regional difference has recently received a great attention in literature of regional economic growth. Romer [3] and Lucas [4] are the pioneers of this field, who address the issue of long term growth of average income in regions and with comparisons among regional long term growth tracks. Same way, we study spatial effect in the analysis of regional difference of rural poverty in India in this paper. We have studied spatial autoregressive models and applied to the Indian rural poverty data for 14 major states in India in 1994. These models are used to explore and examine what determines regional rural poverty difference, and to investigate spatial effects and the other variables that influence rural poverty in India. The paper is organized in 4 sections. Spatial econometrics and spatial autoregressive models described and interpreted in section 2. In section 3 the 14 states Indian spatial data set and the specified estimate models are described to examine spatial effects on rural poverty. Section 4 contains conclusions.
2 SPATIAL ECONOMETRICS
We usually use a database that includes information locations or regional units to estimate
ocial sciences. However, the traditional econometric modeling has largely ignored or overlooked such available information. Therefore, if we want to use such valuable information in an efficient approach, we must take spatial effects into account. Spatial econometrics is the
collection of methods that deal with the peculiarities caused by spatial interaction (spatial dependence) and spatial structure (spatial heterogeneity) in the statistical analysis of regional science models for cross- sectional and panel data [2]. As stated above, traditional econometrics does not often take geographical information into account. Hence, two issues occur when the sample data set has a locational component. First, spatial dependence exists between the sample observations. Second, spatial heterogeneity occurred in residuals of the regressions.
According to theoretical studies of Anselin [2], spatial
dependence or spatial autocorrelation usually stands for dependence that often exists among the sample observations in cross-sectional data sets. In other words, the sample observations collected at one point in space are not independent on the sample observations collected at other locations. That is, we need to consider spatial dependence, if data collection associates with units such as states, provinces, countries and so on. There are rich examples concerning issues of spatial dependence such as data on population and employment, as well as other economic activities collected for location or distance. The term spatial heterogeneity is the second category of spatial effects and denotes instability or variation in relationships over space; namely, functional forms and parameters vary with location and are not homogeneous throughout the data set [2]. In general, a different relationship should hold for every point in space. 2.1 SPATIAL AUTOREGRESSIVE MODELS
This section in detail is a class of spatial autoregressive models that will be employed in the empirical applications. A general spatial autoregressive model which is well known as spatial log model is labeled as SAR in this paper and has been introduced to model cross-sectional data, is described in Anselin [2] and given by
(2.1) Where, y represents an (nx1) vector of the sample observations on a dependent variable collected at each of n locations. X contains a (n x k) matrix of exogenous variables, and β is an (k x 1) vectors of parameters associated with exogenous variables x, which reflects the influence of the explanatory variables on variation in the dependent variable y, as well as ρ is the coefficient on the spatially lagged
PRAJÑĀ - Journal of Pure and Applied Sciences, Vol. 18: 163 - 166 (2010) ISSN 0975 - 2595
concerning geographical a set of regression in s
,= ρ + XWyy β + ε
* Corresponding author: [email protected]

164 PRAJÑĀ – Journal of Pure and Applied Sciences 18: 163 - 166 December
dependent variable, W is regarded as (n x n) spatial weight matrix(CONTIGUITY matrix) Wy is the spatially lagged dependent variable.
W is a row standardized (n X n) matrix with positive
elements associated with the spatially lagged dependen le that indicates the potential interaction between contiguous positions
= 1 if location i linked to j
0 Otherwise that is, the elements of the weight matrix are derived from information on contiguity, which is defined as two sample observations sharing a common border. Model (2.1) is labeled as a “mixed regressive- spatial autoregressive model” in Anselin [2], because it combines the standard regression model with a spatially lagged dependent variable.
Another model studied in this paper is spatial error model (SEM). It provides another efficient method for dealing with the spatial data set that consists of 14 observations for states in India. The SEM model can be stated as follows:
which are t variab
where, 'W ij
,)( uXyLOG += β
(2.2) where, is the spatiλ is a coefficient on the
ally correlated errors and u is the spatial error. spatially correlated errors and W, X, as well as
β are the same as described in the SAR model. LOG(y) is the logarithm of (nx1) vector of the sample observations on a dependent variable collected at each of n locations. 3 An Empirical Application
In the previous section the study has revolved around the fundamental knowledge of spatial econometrics and spatial autoregressive models. In this section the focus will in turn be put on attempting to address such an issue as: what are the significant factors that influence rural population under poverty line in India?
Since the 1970’s, economists have investigated the effect of geography on the labour markets and poverty outcomes. Recently, it has become more and more popular to explore spatial econometrics. A good application of spatial econometric techniques is to test regional disparity on population under poverty line. 3.1 Spatial Data
According to Anselin [2], spatial data are the data
collected in space or in both space and time. For instance, our familiar data such as cross-sectional data and panel data are spatial data. However, as applying spatial data, we must consider the issue regarding the presence of self-correlation or autocorrelation. To avoid these problems, spatial autoregressive models should be employed in such a situation.
The source of the data used for the analysis is from “IFPRI research report [5]. Linkages between Government Spending, Growth, and poverty in rural India. International Food Policy Research Institute., “World Bank 1997”. From this data 14 major states in India have been selected. Here, we attempt to examine whether there is an interaction between rural poverty and spatial effects. The analysis is not only focused on spatial influence, but also interested in exploring how rural poverty is affected by other variables such as rural work-employment status, literacy rate, irrigation facilities and so on. At the state level, World Bank contains information on demography. The selected variables under study are summarized in Table - 1.
Table – 1 List of Variables used in study LABELED Dependent variable Rural Population under Poverty Line PUPL Independent variables Ratio of rural employment with total rural population. Total rural employment, which includes both agricultural and non- agricultural employment symbolized as REMP,
REMP
Total rural population TRP Rural agricultural population, includes agricultural laborers and Rural non- agricultural population that are doing non- agricultural economic activities
RAE and RANE
Production Growth is agricultural production growth index which is calculated by the authors of the IFPRI research report 110 report (International Food Policy Research Institute., “World Bank 1997”).
P-G
Percentage of villages electrified, villages having the facility of electrification, by state PVE
Road density in rural India measured as the length of roads in kilometers per thousand square kilometers of geographic area
RD
Changes in rural wages includes the percentage change in the existing wage rates CRW
Total Factor Productivity Growth index is also given in IFPRI research report 110, data source, TFP
Percentage of rural population that is literate by state, the rural literacy rate LR
Ratio of Development expenditures with total rural population. Development expenditure which includes total government spending on various rural development facilities
DEP
Ratio of Percentage of cropped area sown with high-yielding varieties with Percentage of cropped area irrigated, by state.
HYV
Percentage of cropped area irrigated that is area having irrigation facilities represented by state. IRR
Table - 2 Variable definitions in estimated models VARIABLE
TYPE LABELED
Dependent variable Logarithm of population under poverty line C LOG(PUPL)
Independent variables Ratio of rural employment with total rural population. R REMP/TRP
Ratio of rural agricultural employment with total rural employment R RAE
Ratio of rural non-agricultural employment with total rural employment
R RANE
Production growth in agriculture C P-G Percentage of villages electrified, by state C PVE
Road density in rural India C RD Changes in rural wages, by state C CRW Total factor productivity growth in Indian agriculture, by state C TFP
Percentage of rural population that is literate, by state C LR
Ratio of Development expenditures with total rural population. R DEV/TRP
Ratio of Percentage of cropped area sown with high-yielding varieties with Percentage of cropped area irrigated.
R IRR/HYV
NOTE:- C= continuous variable and R= ratio variable.
W ij
∑≠=
= n
jij
ij
ijij
WWW
1'
'

2010 Pandya aand Bhatt – A statistical study on spatial 165
All the variables (Ratio and Continuous) employed in the estimated models are in Table - 2. These variables will be examined in the empirical models in the next section as well. 3.2 MODELS AND RESULTS Our proposed model (1) for population under poverty line is as following: LOG (PUPL) = β1 (REMP/TRP) + β2(RAE) + β3(RANE) + β4(P-G) + β5(PVE) + β6(RD) + β7(CRW) + β8(TFP) + β9(LR) + β10(DEV/TRP) + β11(IRR/HYV) + ε (3.1) Where, LOG(PUPL) is an (14 × 1) vector of observations on logarithm of population under poverty line. 11 × 1) vector of parameters, and ε is an (14 × 1) vector of disturbances.
The aim of setting up the following linear regression models estimated by OLS is to filter the variables that are used in spatial autoregressive models. The test steps are as follows:
1. Build up model 1 that contains all the variables described in Table - 2.
2. Model 2 consists of the significant variables in Model1.
3. Remove the insignificant variables from Model 2 to obtain Model 3.
This procedure is done until all the independent variables
in one model are found to be statistically significant at 5% level. In our case, the experiment is carried out until step 4, which indicates that the variables in Model 4 are significant to explain reduction in dependent variable, the logarithm of population under poverty line. The results of the OLS estimation are shown in Table 3. According to the results given in Table 3, it can be seen that IRR/HYV is found to be statistically insignificant at 5% and will not be included in model 2.
Therefore, in model 2 there are 10 explanatory variables left in addition to the constant. After removing the insignificant variable RD from model 2, we gain model 3. Then, we obtain model 3 that contains these 9 significant variables and are shown in Table 3. Here, we found Production Growth and Total Factor Productivity growth are highly correlated and statistically insignificant. So, both the variables are removed and finally we got model 4 that consist of 7 significant variables.
The estimated model 4 is, LOG (PUPL) = 11.023 - 92.64 (REMP/TRP) - 0.00803 (RAE) – 1.25 (RANE) - 0.018 (PVE) -0.17 (CRW) -0.014 (LR) – 3613 (DEV/TRP) (3.2)
Hence, these variables included in Model - 4 will be used as explanatory variables in the spatial autoregressive models and model 4 is regarded as the final model for adding the spatial effects.
We will now present a set of two spatial autoregressive models to analyze the sample data. There are 14 states in the sample dataset. Our interest is to calculate the proportion of the total variation in the population under poverty line that is explained by the spatial dependence. This relies on estimating the spatial lag model (SAR) that is brought up in Section 2.1. The SAR model can be written as
(3.3)
where, LOG(PUPL)= [LOG (PUPL)1,…,LOG(PUPL)14] is a 14 dimensional vector of log of population under poverty line for 14 states the coefficient on the spatially lagged dependent variable, it denotes a estimated regression parameter, which reflects the spatial dependence characteristic in the sample data set, and measure the average influence of states on states in population under poverty line, W is 14×14 spatial weight matrix that is row-standardized and each row sum to one (see 2.1) and X represents a (14 ×7) matrix containing explanatory variables, which are used in Model 4, as well as β is the parameters that reflect the influence of the exogenous variables on variation in the dependent variable population under poverty line. Table - 3 Results of OLS estimation
Dependent variable : LOG(PUPL)
, isρ
is an (β
Variables Model 1 Model 2 Model 3 Model 4
REMP/TRP -144.36 (-2.65)
-141 (-3.43)
-136.24 (-4.10)
-92.64 (-3.15)
RAE -0.07978 (-1.24)
-0.0768 (-1.49)
-0.06852 (-1.88)
-0.00803 (-0.25)
RANE -3.165 (-1.18)
-2.75 (-2.22)
-2.57 (-2.80)
-1.2456 (-1.45)
P-G -0.006882 (-0.9)
-0.00609 (-1.17)
-0.00493 *
(-1.87) -
PVE -0.02633 (-2.26)
-0.0257 (-2.78)
-0.0249 (-3.24)
-0.017801 (-2.03)
RD -0.00000752 (-0.28)
-0.000006 *
(-0.27) - -
CRW -0.1 (-0.77)
-0.0917 (-0.92)
-0.08861 (-1.02)
-0.17124 (-1.77)
TFP 0.005203 (0.57)
0.00399 (0.77)
0.002822 *
(1.10) -
LR -0.00340 (-0.23)
-0.0045 (-0.42)
-0.00636 (-0.85)
-0.013896 (-1.71)
DEV/TRP -4412 (-1.13)
-4866 (-1.94)
0.002822 (-2.24)
-3613 (-1.36)
IRR/HYV 0.0841* (0.19) - - -
Constant 14.270 (4.80)
14.119 (5.99)
13.824 (7.35)
11.023 (7.31)
N 14 14 14 14 Adj-R2 75.1% 83.1% 87% 77%
Note:- t-statistics in parentheses. * indicates a p-value that is not statistically significant at 5% significance level. N is the number of observations.
The spatial error model (SEM) provides another efficient method for dealing with the spatial data set that consists of 14 observations for states in India. The SEM model, which is introduced in section 2.1, is stated as follows:
,)( uXPUPLLOG += β u=λW +ε
u
(3.4) where, λ is a coefficient on the spatially correlated errors and LOG(PUPL), W, X, as well as β are the same as described in the SAR model. The estimates of the SAR and SEM models are shown in Table - 4.
,)( )( εβρ ++=PUPLLOG XPUPLWLOG

166 PRAJÑĀ – Journal of Pure and Applied Sciences 18: 163 - 166 December
Table - 4 Results of spatial autoregressive model estimation
Note:- t-statistics in parentheses. N is the number of observations. * indicates a p-value that is not statistically significant at 5% significance level.
Table - 4 displays the result of both SAR and SEM as well as OLS estimation of model 4. The reason why the estimate results model 4 are shown in Table - 4 is that it is an easy and clear way to compare the model with spatial effects and without spatial effects.
In Table - 4, the adjusted R2 values of these three regressions range between 0.75 and 0.78. All coefficients of the independent variables, except rho in SAR model, are found to be statistically significant. Interpretations for the coefficients of the explanatory variables are not our chief focus here.
The SAR estimates in Table - 4 show that after taking into account the influence of the independent variables, we do not have spatial correlation in the model, since the spatial autoregressive coefficient ρ is statistically insignificant and not large at all. That is, the dependent variable LOG(PUPL) exhibits insignificant spatial dependence. This indicates that we cannot estimate the SAR model successfully. Therefore, we do believe that the OLS estimates are correct, as there are insignificant spatial autoregressive parameters in the SAR model. On the other hand, estimations in the SEM model display the results we expect, so that our analysis will be focused on comparing estimate results between SEM model and Model 4. The following three aspects are considered in particular.
Firstly, taking the spatial heterogeneity into account improves the fit of the model, as the adjusted R2 statistic rises from 0.77 in Model 4 to 0.78 in SEM model. That is, around one percent of the variation in the logarithm of population under poverty line is explained by spatial structure, because the adjusted R2 is 0.78 in SEM model that takes the spatial effect into account and 0.77 in the least-square model that ignores such an effect.
Secondly, the t-value on the spatial autocorrelation
parameter λ is 0.75, indicating that this explanatory variable has a coefficient estimate that is significantly different from zero. Equivalently, the spatial coefficient is found to be statistically significant, showing that there exists spatial
heterogeneity in the residuals of the model. However, Model 3 based on OLS ignores the spatial information that is provided by the sample dataset. CONCLUSIONS
Our purpose of this study is to focus on the theoretical
study of spatial econometrics and to explore an empirical application of spatial autoregressive models used on Indian rural poverty cross-sectional data.
Recently, spatial econometric techniques have grown rapidly and have increasingly been applied in empirical researches. In general, spatial econometrics is related to spatial statistics and is a subfield of econometrics that deals with the combination of spatial dependence and spatial heterogeneity in regression analysis. Spatial dependence relates to the fact that observations in the sample data set display correlation with regard to location in space. Spatial heterogeneity relates to the fact that the regression models that we estimate may vary systematically over space.
The basic regressions used in this paper are simply OLS
regressions of the logarithm of population under poverty line on the explanatory variables to obtain Model 4 that contains 7 significant variables and one constant. The results from the empirical investigation indicate that there are many variables that influence the rural population under poverty line. With respect to our major interest, spatial effects, we do find that in the SAR model there is a positive sign on rho, but it is not statistically significant, indicating there is no spatial dependency in the model.
However, in the SEM model lambda is found to be both
positive and significant at 5% significance level, indicating that spatial heterogeneity presents in the residuals of the model. Thus, Model 4 associated with OLS estimation is an inappropriate regression model for the sample data that are the spatial data.
The findings are that relative to model 4, the SEM model
reveals larger influences on the ratios of the development expenditure and rural employed population with total rural population and a smaller influence on literacy rate. Additionally, the proportion of employed population with total rural population has the strongest negative influences on population under poverty line in our models.
In addition, the empirical models of SAR and SEM are
selected primarily to illustrate the various spatial effects, and are not supposed to contribute to a substantive understanding of spatial patterns of population under poverty line. ACKNOWLEDGEMENT
The authors would like to thank the referee for the valuable comments and for the pain taken to read the paper thoroughly, which maid the paper published. REFERENCES [1] Anselin, L. (1999) Spatial econometrics, Bruton Center,
School of Social Sciences,University of Texas at Dallas, Richardson, TX 75083-0688.
[2] Anselin, L. (1988) Spatial econometrics: Methods and models, Kluwer Academic Publishers, Dordrecht.
[3] Romer, P. M. (1986) Increasing Returns and Long-Run Growth, Journal of Political Economy, 94(5): 1002-1037.
[4] Lucas, R. E. (1988) On the mechanics of development planning, Journal of Monetary Economics 22(1): 3-42.
[5] IFPRI research report 110, (1999) Linkages between Government Spending, Growth, and poverty in rural India. International Food Policy Research Institute., Washington, D.C.
Dependent variable : LOG(PUPL) Variables SAR SEM Model 4
Constant 10.616 (4.04)
10.673 (6.52)
11.023 (7.31)
REMP/TRP -90.77 (-2.71)
-96.20 (-3.11)
-92.64 (-3.15)
RAE -0.00567 (-0.15)
-0.01382 (-0.41)
-0.00803 (-0.25)
RANE -1.1997 (-1.24)
-1.2983 (-1.45)
-1.2456 (-1.45)
PVE -0.01703 (-1.77)
-0.00930 (-0.64)
-0.017801 (-2.03)
CRW -0.1703 (-1.61)
-0.2269 (-1.81)
-0.17124 (-1.77)
LR -0.014249 (-1.58)
-0.012485 (-1.44)
-0.013896 (-1.71)
DEV/TRP -3476 (-1.17)
-4567 (-1.50)
-3613 (-1.36)
Rho 0.066 (0.20)
- -
Lambda - 0.1493 (0.75)
-
N 14 14 14 Adj-R2 75.8% 78% 77%

GUIDELINES FOR CONTRIBUTORS The Editorial Board of ‘PRAJNA’ – Journal of Pure and Applied Sciences invites Original Research Papers in
the fields of Basic and Applied Sciences (Biosciences, Chemistry, Computer Science, Electronics Science, Home Science, Materials Science, Mathematics, Physics and Statistics) for the Next Volume of PRAJNA (December 2011), published by Sardar Patel University, Vallabh Vidyanagar, Gujarat – 388120, INDIA.
The soft copies of regular (full-length) research papers (not exceeding 15 typed pages), prepared as per the file format shown below may be submitted for publication through e-mail to Prof. T. V. Ramana Rao, Managing Editor ([email protected]) OR to a Member of the Editorial Board who represents the author’s broad research area with a cc to the Managing Editor latest by August 31, 2011.
Each manuscript must be accompanied by a statement that it has not been published elsewhere and that it has
not been submitted simultaneously for publication elsewhere. Review process: Submitted papers are peer-reviewed by two to three independent reviewers after approval by the Editorial Board. Authors are encouraged to suggest three names of expert reviewers with their e-mail IDs, but selection remains the prerogative of the Editorial Board. Articles of the following categories are also considered for publication in PRAJNA: Short Communications are limited to a maximum of two figures and one table. They should present a complete study that is more limited in scope than is found in full-length papers. The items of manuscript preparation listed above apply to Short Communications with the following differences: (1) Abstracts are limited to 100 words; (2) instead of a separate Materials and Methods section, experimental procedures may be incorporated into Figure Legends and Table footnotes; (3) Results and Discussion should be combined into a single section.
Review Articles intended to provide concise in-depth reviews of both established and new areas and summarize recent insights in specific research areas within the scope of PRAJNA are solicited by the Editorial Board from leading researchers. The manuscript of this category should be limited to 5,000 words with an abstract of no more than 250 words, a maximum of 5 tables and figures (total), and up to 50 references. Word count includes only the main body of text (i.e., not tables, figures, abstracts or references). Commentaries call attention to papers of particular note and are written at the invitation of the Editorial Board. Perspectives present a viewpoint on an important area of research and are written only at the invitation of the Editorial Board. Perspectives focus on a specific field or subfield within a larger discipline and discuss current advances and future directions. Perspectives are of broad interest for non-specialists and may add personal insight to a field. Letters are brief comments that contribute to the discussion of a research article published in the last issue of PRAJNA. Letters may not include requests to cite the letter writer's work, accusations of misconduct, or personal comments to an author. Letters are limited to 500 words and no more than five references. Letters must be submitted within 3 months of the publication date of the subject article. Also announcement of forthcoming Seminars / Conferences / Symposia / Workshops etc. will be considered for publication in PRAJNA. File format for soft copies: Texts (should be of Times New Roman with 9 point for Abstract and 11 point for other matter) and Tables, if any, must be saved in *.doc (Word) or *.rtf (rich text) format, graphs in Excel and for illustrations (diagrams, maps, drawings, etc.), the TIF format (300 dpi minimal resolution) is the most appropriate (*.TIF or *.JPEG extension). Instructions for preparation of manuscripts: 1. The paper should be written in English and neatly typed with double spacing. 2. The title of the paper and the name(s) of the author(s) be in capital letters. The name of the institution be given in
small letters below the name (s) of the author(s). 3. The ‘Abstract of the paper, in not more than 150 words, should be provided on a separate page along with 4-6
keywords. 4. The sub-titles, e.g. INTRODUCTION, should be written in capital letters.
167

5. Displayed formulae, mathematical equations and expressions should be numbered serially. Table should be with a title in addition to a serial number for it.
6. Photographs / Figures should be original with good contrast so as to be in a form suitable for direct reproduction / scanning.
7. Footnotes are not normally allowed, except to identify the author for correspondence. 8. All figures must be numbered serially as they appear in the text, and their legends / captions should necessarily be
provided. 9. References should be numbered in brackets [ ] in the order of appearance in the text. All the references in the
bibliographic list must correspond to in-text references and vice versa. Abbreviated periodical titles should follow standard subject Abstracts. Names which are not listed by any standard subject indexing organizations should be spelled out in full.
10. All references should be clear and follow the examples below: Periodical articles
[2] Sadqui, M., Fushman, D. and Munoz, V. (2006) Atom – by – atom analysis of global downhill protein folding. Nature, 442: 317 – 321.
Books [16] Stebbins, G. L. (1974) Flowering plants: Evolution above the species level, Arnold Press, London, pp. 1 –
399. Chapters from a book
[19] Schafer, H. and Muyzer, G. (2001) Denaturing gradient gel electrophoresis in marine microbial ecology. In Methods in Microbiology (Ed. Paul, J. H.), Academic Press, London, Vol. 30, pp. 425 – 468.
Thesis or other diplomas [21] Nayaka, S. (2004) The visionary studies on the lichen genus Lecanora sensu lato in India. Ph. D. Thesis,
Dr. R. M. L. Avadh University, Faizabad, India. Conference proceedings
[4] Mohapatra, G. C. (1981) Environment and culture of early man in the valley of rivers Chenab and Ravi, western sub-Himalayas. In Proceedings X Congress of IUPPS, Mexico, pp. 90 – 123.
Online documentation [9] Koning, R. E. (1994). Home Page for Ross Koning. Retrieved 26-6-2009 from Plant Physiology
Information Website: http://plantphys.info/index.html. Note: Manuscripts prepared faithfully in accordance with the instructions will accelerate their processing towards publication; otherwise it would be delayed in view of their expected re-submission.
For and on behalf of Editorial Board, PRAJNA
Prof. T. V. Ramana Rao Managing Editor, PRAJNA
B R Doshi School of Biosciences, Satellite Campus, Vadtal Road,
Sardar Patel University, VALLABH VIDYANAGAR
Gujarat – 388120 Phone: (Lab): 02692-234412 Extn. 111
Mobile: 98254 38147 Fax: 02692-237258 /236475
e-mail: [email protected] Website:www.spuvvn.edu
NOTE: This information may be kindly circulated among your colleagues.
168

Characterization of thermally evaporated ZnTe thin films K. D. Patel, J. R. Rathod, H. S. Patel, V. M. Pathak and R. Srivastava
126 – 128
Native defects in MoSe2 crystals grown by direct vapor transport C. K. Sumesh, K. D. Patel, V. M. Pathak and R. Srivastava
129 – 131
Electrical transport properties of some mixed transition metal dichalcogenides MoxW1-xSe2 (x = 0.3, 0.4, 0.85 & 0.9) M. P. Deshpande, Sunil Chaki, Nilesh N. Pandya and Sagar C. Shah
132 – 135
Infrared spectroscopy of charge transfer complexes of elastin Pravinsinh I. Rathod, Ketan Dodia, Vishal Patel and A. T. Oza
136 – 139
Screening-corrected electron impact total and ionization cross sections for N(Ch3)3 and P(Ch3)3 Harshad Bhutadia, Kirti Korot, Bobby Antony and Minaxi Vinodkumar
140 – 144
S-Wave masses and decay properties of D and Ds mesons Nayneshkumar Devlani and Ajay Kumar Rai
145 – 147
Anharmonic properties and sp-d hybridization in barium at high temperatures N. K. Bhatt and A. R. Jani
148 – 150
Dissociation of atmospheric molecules H2 and N2 by Electron impact - neutral atom production Siddharth H. Pandya and K. N. Joshipura
151 – 156
Magnetic moments of light flavour baryons in a hypercentral quark model Kaushal Thakkar, Arpit Parmar, Bhavin Patel and P. C. Vinodkumar
157 - 162
STATISTICS
A statistical study on spatial autoregressive models with regional rural poverty difference in India Mayuri Pandya and Krishnam Bhatt
163 - 166
Guidelines for contributors 167 - 168

MATERIALS SCIENCE
Activated carbon from waste biomass of Psyllium husk: effect of steam activation on surface characteristics S. Manocha, Ajay J. Chavda, Paramvirsinh D. Punvar and Kalpesh Patel
88 - 91
Oxidation-reduction of natural graphite- a step towards synthesis of graphene L. M. Manocha, Hasmukh Gajera, Vishal Mankadia and S. Manocha
92 – 97
Development of reticulated carbon foam: An attractive material Satish M. Manocha and Kalpesh Patel
98 – 101
Synthesis and raman characterization of multiwalled carbon nanotubes by catalytic chemical vapour deposition L. M. Manocha, Arpana Basak and S. Manocha
102 – 105
Enhancement of microporosity through physical activation S. M. Manocha, Hemang Patel and L. M. Manocha
106 – 109
14 Mev neutron generator facilities for material research for fusion reactors Surender Kumar Sharma, R. Shukla & A. Shyam
110 – 111
Compact electron cyclotron resonance ion Source based ion beam generation Surender Kumar Sharma, R. Shukla, Erhard Salzborn and A. Shyam
112 – 114
MATHEMATICS
Mean labeling for some new families of graphs S. K. Vaidya and Lekha Bijukumar
115 – 116
A generalization of unitary divisor function H. B. Modi and P. B. Trivedi
117 – 118
PHYSICS
Temperature dependent transport and barrier properties of DVT grown WSe2crystals and schottky devices Mayur Patel, K. D. Patel, C. A. Patel, K. K. Patel, V. M. Pathak and R. Srivastava
119 – 122
Studies on barrier characteristics of thin film Al/Cds Schottky junctions by I-V-T measurements over a wide temperature range K. D. Patel, Keyur S. Hingarajiya, H. S. Patel, V. M. Pathak, and R. Srivastava
123 – 125

Hydroxyethylmethacrylate-graft-carboxymethyl chitosan-graft pha (hema-g-cmch-g-pha): synthesis, characterization and biodegradation Deval Patel, Rachana Bhatt, Hiral Patel, Kamlesh Patel and Ujjval Trivedi
44 - 49
Non-structural carbohydrate, protein and minerals from some non-conventional seeds of semi-arid region of Gujarat Manisha Sharma and Bharat Pandit
50 – 53
Antibacterial activity of methanolic and acetone extract of some medicinal plants used in indian folklore medicine J. P. Patel
54 – 58
CHEMISTRY
A study on nylon-66/abs blends prepared by physical blending Neetha John and Vikram R. Singh
59 – 62
Synthesis, characterization and application of some new hot brand bisazo reactive dyes on various fibres Divyesh R. Patel, Jigna A. Patel and Keshav C. Patel
63 – 67
Synthesis & characterization of Cu(II) complexes derived from Acyl Pyrazolone and 2-Amino phenol N. P. Moorjani, K . M. Vyas and R. N. Jadeja
68 – 72
Corrosion inhibition of al-pure by Aniline-N-Benzylidene (ANB) a schiff base as inhibitor in hydrochloric acid. A. S. Patel, V. A. Panchal and N. K. Shah
73 – 75
COMPUTER SCIENCE
The complete biometric system Hiren D. Joshi
76 – 79
HOME SCIENCE
Prevalence of anemia in PTC girls followed by supplementation of date ball Dharmistha Jadeja and Gayatree Jadeja
80 – 82
Awareness of the managers of the industries regarding environmental responsibilities: a study Sarjoo Patel and Drashti Shah
83 – 87

Sardar Patel University Press, Vallabh Vidyanagar, Gujarat – 388 120, INDIA
PRAJÑĀ – Journal of Pure and Applied Sciences Volume 18 December 2010
CONTENTS