Sara Lee by Mark Susor
24
Sara Lee 1 Running head: SARA LEE Sara Lee Mark D. Susor Strategic Management MBA 671-D5B4 Benedictine University June 8, 2014
Transcript of Sara Lee by Mark Susor
Sara Lee 1
Running head: SARA LEE
Sara Lee
Mark D. Susor
Strategic Management MBA 671-D5B4
Benedictine University
June 8, 2014
Sara Lee 2
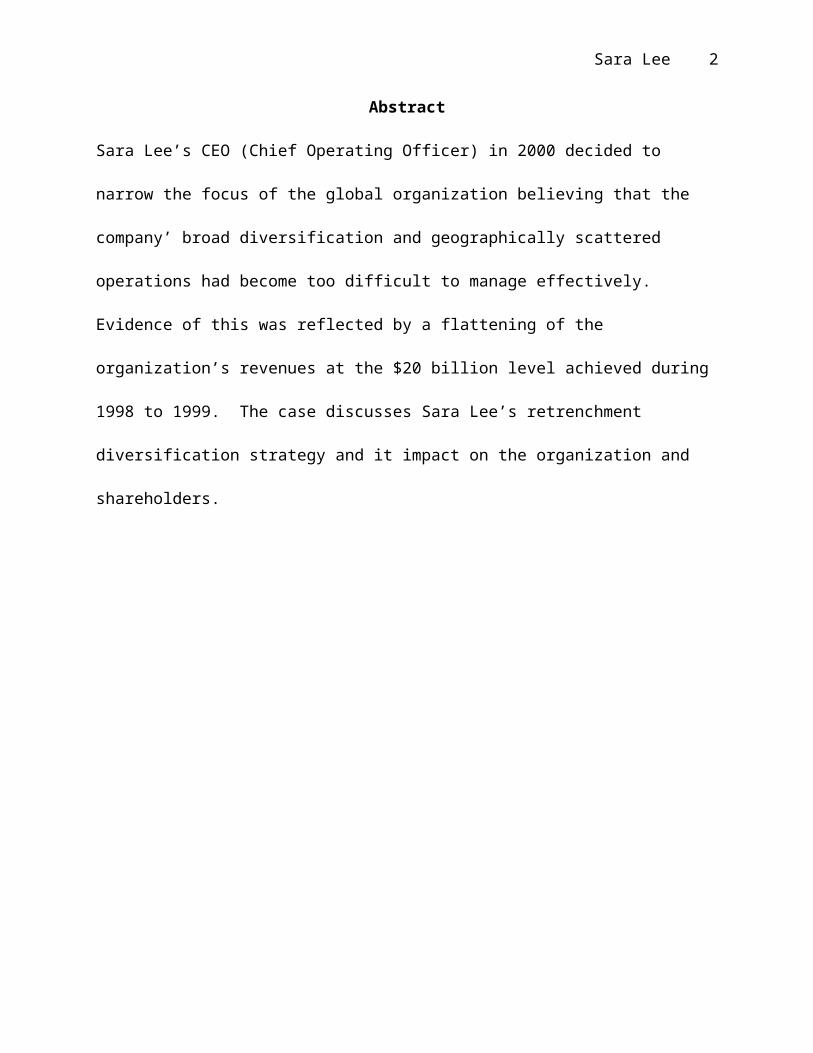
Abstract
Sara Lee’s CEO (Chief Operating Officer) in 2000 decided to
narrow the focus of the global organization believing that the
company’ broad diversification and geographically scattered
operations had become too difficult to manage effectively.
Evidence of this was reflected by a flattening of the
organization’s revenues at the $20 billion level achieved during
1998 to 1999. The case discusses Sara Lee’s retrenchment
diversification strategy and it impact on the organization and
shareholders.
Sara Lee 3
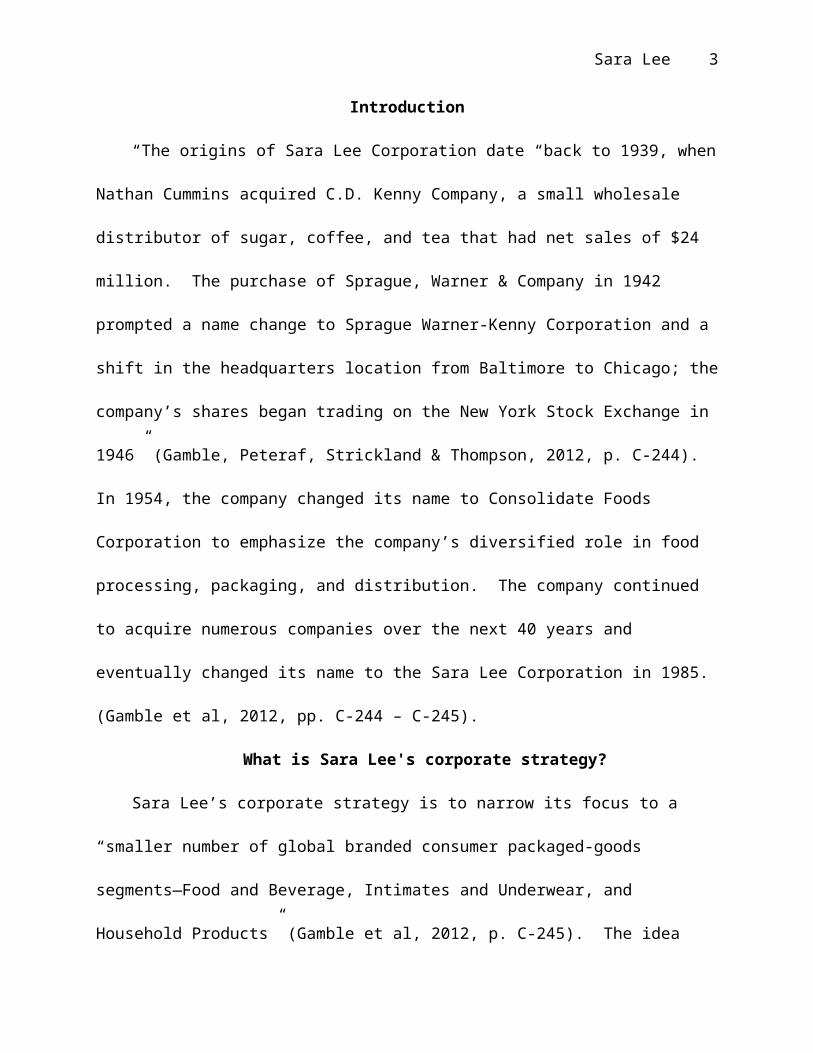
Introduction
“The origins of Sara Lee Corporation date “back to 1939, when
Nathan Cummins acquired C.D. Kenny Company, a small wholesale
distributor of sugar, coffee, and tea that had net sales of $24
million. The purchase of Sprague, Warner & Company in 1942
prompted a name change to Sprague Warner-Kenny Corporation and a
shift in the headquarters location from Baltimore to Chicago; the
company’s shares began trading on the New York Stock Exchange in
1946” (Gamble, Peteraf, Strickland & Thompson, 2012, p. C-244).
In 1954, the company changed its name to Consolidate Foods
Corporation to emphasize the company’s diversified role in food
processing, packaging, and distribution. The company continued
to acquire numerous companies over the next 40 years and
eventually changed its name to the Sara Lee Corporation in 1985.
(Gamble et al, 2012, pp. C-244 – C-245).
What is Sara Lee's corporate strategy?
Sara Lee’s corporate strategy is to narrow its focus to a
“smaller number of global branded consumer packaged-goods
segments—Food and Beverage, Intimates and Underwear, and
Household Products” (Gamble et al, 2012, p. C-245). The idea
Sara Lee 4
behind the strategy was to “concentrate its financial and
managerial resources on a smaller number of business segments in
which market prospects were promising and Sara Lee’s brands were
well positioned” (Gamble et al, 2012, p. C-243). The company set
financial goals that stated that they would grow revenues to $14
billion by fiscal 2010 and would also improve operating profit
margin from 8.1 percent in 2004 to at least 12 percent by 2010.
(Gamble et al, 2012, p. C-243). Sara Lee planned to achieve
these financial objectives by developing three competitive
capabilities in its remaining business units. The first
capability is to develop “competitive pricing, innovative new
products, and brand-building capabilities” (Gamble et al, 2012,
p. C-250); all of which are essential to pleasing consumers. The
second capability is category management leveraged through size
to win accounts with supermarkets and discount store customers.
The third key element is operational excellence, which was
critical to competitive pricing. (Gamble et al, 2012, p. C-250).
How has its retrenchment strategy changed the nature of its business lineup?
The retrenchment strategy significantly changed the nature of
Sara Lee’s business lineup. The implementation of the strategy
Sara Lee 5
began in 2005 with the divestiture of weak-performing businesses
and product categories worth $7.2 billion in revenue or 37
percent of their annual revenue. The efforts focused on
divesting 8 business units which included: Direct Selling, US
(United States) Retail Coffee, European Apparel, European Nuts &
Snacks, European Rice, US Meat Snacks, European Meats, and Sara
Lee Branded Apparel. (Gamble et al, 2012, pp. C-246 – C-250).
Once the divestiture was complete the strategy was to drive
growth via initiatives to boost sales, market shares, and
profitability of the key remaining brands. These brands included
“Sara Lee breads, bakery products, Ball Park meats, Douwe Egberts
coffees, Hillshire Farm meats, Jimmy Dean sausage, and Senseo
single-serve coffee products” (Gamble et al, 2012, p. C-243).
In 2011, after Brenda Barnes, Sara Lee CEO, stepped down
after suffering a stroke in May 2010; her interim replacement,
Marcel Smits restated the organizations strategy by stating that
the company would focus on three areas: increasing share in the
company’s most powerful brands, pursuing attractive geographic
markets, and fully capturing the benefits of Project Accelerate.
Project Accelerate was a company-wide initiatives launched in
Sara Lee 6
2008 that focused on outsourcing, supply chain efficiencies, and
overhead reduction. The project had provided $180 million in
savings as of 2010 and was expected to provide $350 to $400
million in cumulative savings by the end of fiscal 2012. Gamble
et al, 2012, p. C-241).
What is your assessment of the long-term attractiveness of the
industries represented in Sara Lee Corp.'s business portfolio?
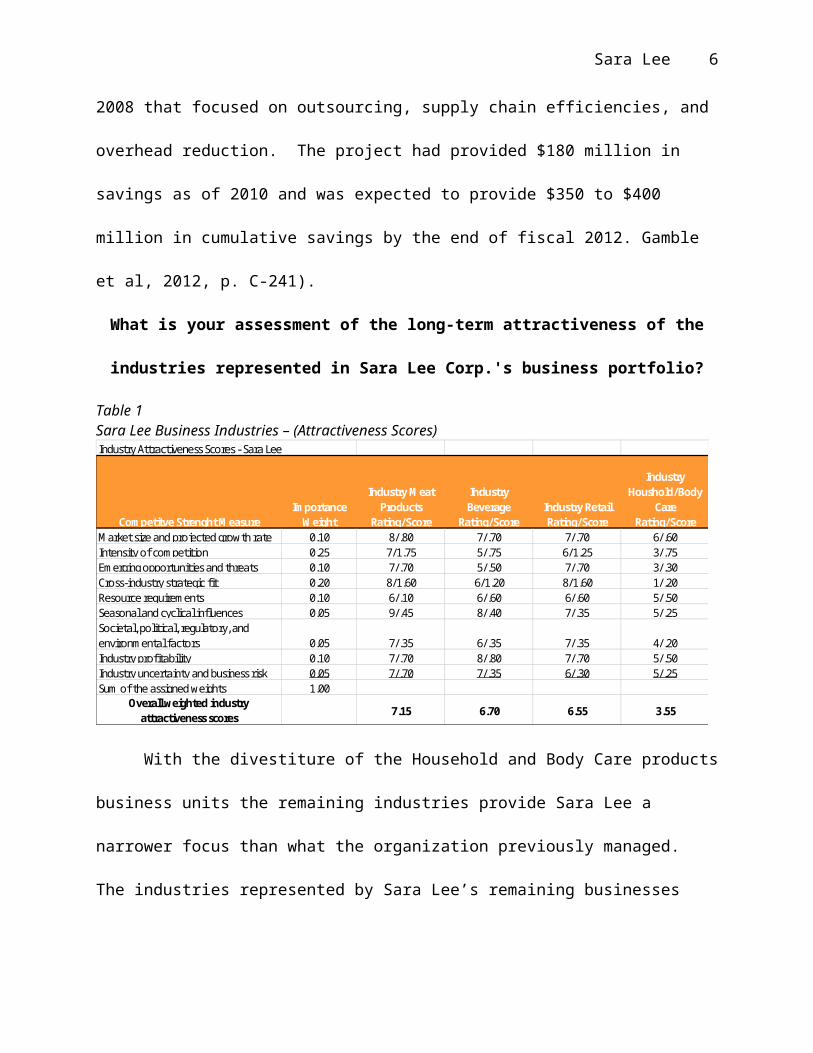
Table 1Sara Lee Business Industries – (Attractiveness Scores)Industry Attractiveness Scores - Sara Lee
M arket size and projected growth rate 0.10 8/.80 7/.70 7/.70 6/.60Intensity of competition 0.25 7/1.75 5/.75 6/1.25 3/.75Emerging opportunities and threats 0.10 7/.70 5/.50 7/.70 3/.30Cross-industry strategic fit 0.20 8/1.60 6/1.20 8/1.60 1/.20Resource requirements 0.10 6/.10 6/.60 6/.60 5/.50Seasonal and cyclical influences 0.05 9/.45 8/.40 7/.35 5/.25Societal, political, regulatory, and environm ental factors 0.05 7/.35 6/.35 7/.35 4/.20Industry profitability 0.10 7/.70 8/.80 7/.70 5/.50Industry uncertainty and business risk 0.05 7/.70 7/.35 6/.30 5/.25Sum of the assigned weights 1.00
Overall weighted industry attractiveness scores 7.15 6.70 6.55 3.55
Industry Houshold/Body
Care Rating/ScoreCom petitve Strenght M easure
Im portance W eight
Industry M eat Products
Rating/Score
Industry Beverage
Rating/ScoreIndustry Retail Rating/Score
With the divestiture of the Household and Body Care products
business units the remaining industries provide Sara Lee a
narrower focus than what the organization previously managed.
The industries represented by Sara Lee’s remaining businesses
Sara Lee 7
allow the management team to compete with products that are top
producers and maintain strong market share positions.
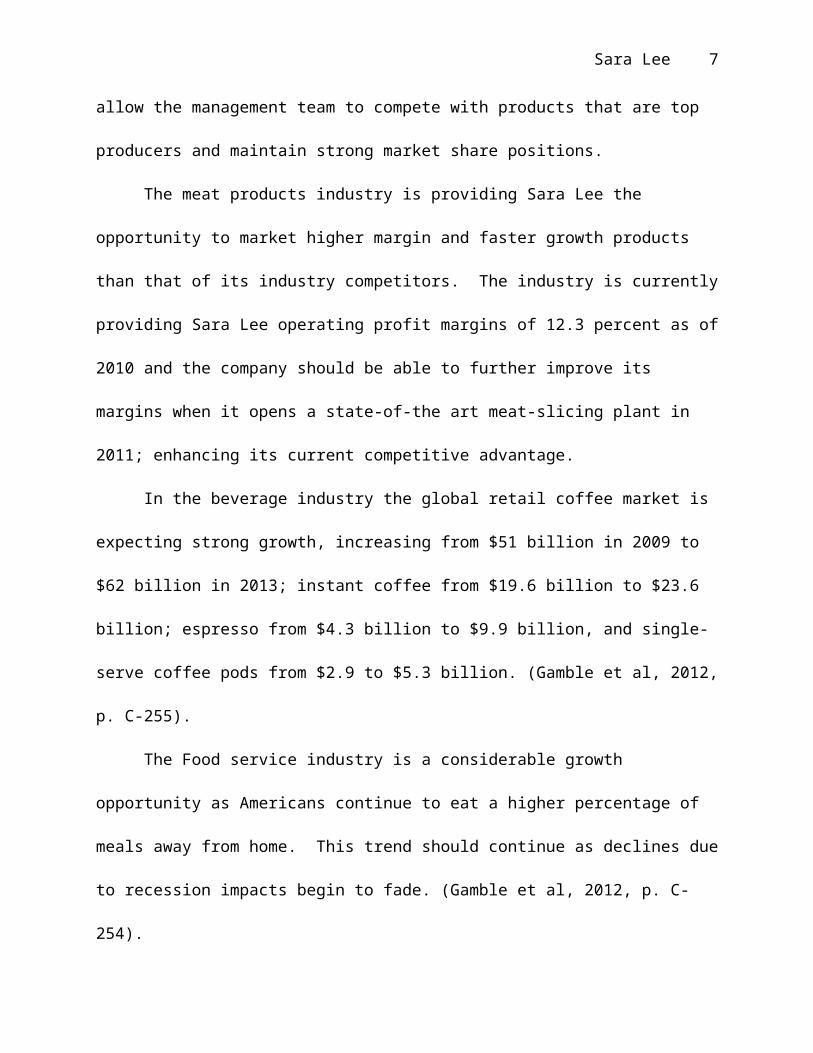
The meat products industry is providing Sara Lee the
opportunity to market higher margin and faster growth products
than that of its industry competitors. The industry is currently
providing Sara Lee operating profit margins of 12.3 percent as of
2010 and the company should be able to further improve its
margins when it opens a state-of-the art meat-slicing plant in
2011; enhancing its current competitive advantage.
In the beverage industry the global retail coffee market is
expecting strong growth, increasing from $51 billion in 2009 to
$62 billion in 2013; instant coffee from $19.6 billion to $23.6
billion; espresso from $4.3 billion to $9.9 billion, and single-
serve coffee pods from $2.9 to $5.3 billion. (Gamble et al, 2012,
p. C-255).
The Food service industry is a considerable growth
opportunity as Americans continue to eat a higher percentage of
meals away from home. This trend should continue as declines due
to recession impacts begin to fade. (Gamble et al, 2012, p. C-
254).

Sara Lee 8
What is your assessment of the competitive strength of Sara Lee
Corp.'s different business units?
After the divestiture of the 8 business units, Sara Lee
reorganized their businesses into six divisions. They included:
North American Retail division (lunch meats, breakfast sausage,
smoked sausage, frozen desserts, and single-serve coffee sold in
supermarkets and discount stores); North American Fresh Bakery
division (Breads, Buns, and Bagels sold in supermarkets); North
American Foodservice division (meat, bakery, coffee and tea sold
to food service accounts); International Beverage division
(coffee and tea products in Europe); International Bakery
division (baked goods in Europe); and the International Household
and Body Care division (insecticides, personal hygiene products,
cleaning brands sold outside the US).

Sara Lee 9
Table 2Sara Lee Business Units – (Competitive strength scores)Competitive Strenght Scores for Sara Lee's Business Units
Relative market share 0.15 8/1.05 9/1.20 8/1.05 8/1.05 4/.55 6/.75Cost's relative to competitor's costs 0.20 6/1.20 7/1.40 6/1.20 6/1.20 5/1.00 5/1.00Ability to m atch or beat rivals on key product attributes 0.05 6/.30 8/.40 7/.35 6/.30 6/.30 6/.30Ability to benefit from strategic fit with com pany's other businesses 0.20 7/1.40 9/1.80 9/1.80 7/1.40 6/1.20 0/.00Bargaining leverage with suppliers/buyers; caliber of alliances 0.05 10/.50 10/.50 10/.50 8/.40 4/.20 2/.10Brand image and reputation 0.10 8/.80 9/.90 9/.90 7/.70 6/.60 7/.70Competively valuable capabilities 0.15 7/1.05 7/1.05 7/1.05 6/.90 4/.60 4/.60Profitability relative to competitors 0.10 7/.70 7/.70 6/.60 7/.70 4/.40 5/.50Sum of the assigned weights 1.00Overall weighted com petive strength
scores 7.00 8.95 7.45 6.50 4.85 3.95
International Bakery
International Beverage
North Am erican Foodservice
International Household and Body CareCom petitve Strenght M easure
Im portance W eight
North Am erican Retail
North Am erican Fresh Bakery
The North American Retail business unit products are growing
faster than the industry and continues to show that consumers
prefer branded versus private-label brands. The businesses
market-leading brands maintained market shares that range from 14
in lunch meat to 55 percent in single-serve coffee. The division
operating profit margin improved from 9.2 percent in 2009 to 12.3
percent in 2010 and reflects the overall strength of this
business unit. (Gamble et al, 2012, p. C-251).
The North American Fresh Bakery division has shown very
strong growth increasing revenues from $91 million in 2003 to
$2.1 billion in 2008. The division owns 8.3 percent of the US
packaged bread market, highly rated brands, and considerable
Sara Lee 10
leverage with buyers and thereby the ability to exploit its
distribution channels. (Gamble et al, 2012, p. C-251).
North American Foodservice sells products to supermarkets,
food service distributors, and national restaurant chains. While
the business unit has been impacted by the recession it has been
able to maintain strong market positions in liquid coffee – 65
percent; pies – 52 percent; cakes – 19 percent; and refrigerated
dough sold to food service customers – 20 percent. The division
has also benefited from innovations developed by Sara lee’s
retail division that provide convenience for today’s busy
lifestyles. (Gamble et al, 2012, pp. C-254 to C- 255).
International Beverage also reflects considerable strength as
a Sara Lee business unit. The company’s coffee brands are highly
ranked in European and US markets. The retail coffee, instant
coffee, espresso and single-serve coffee pods market growth is
expected to remain extremely strong over the next 5 years. The
business unit’s single-serve coffee makers own 40 percent of the
European market and coffee pod sales had increased from 15,000
tons in 2004 to 28,000 tons in 2009. The business unit espresso
capsules also owned 27 percent of the Europe market in 2009.
Sara Lee 11
The International Bakery division which consisted of bread
products sold in primarily in Spain, France and Australia
accounted for 63 percent of the fresh bread sold in Spain and 12
percent of the division sales were its frozen bread product sold
in Australia. The division also generated 25 percent of its
sales from its refrigerated bread sold in France, and owned 37
percent of Spain’s packaged bread market. The division had
experienced sales declines and operating losses due to the long-
term economic recession in Spain. It had only limited success
expanding into other European countries because of the consumer’s
preference for fresh. Sara Lee was looking to turn the business
unit around by introducing new products and improving operating
efficiencies. (Gamble et al, 2012, p. C-255).
The following table provides a synopsis of the remaining
business unit’s sales an operating profit from 2008 to 2010:
Table 3Sara Lee Business Units – (Net Sales, Sales CAGR % 2008-2010, Operating Profits, Op. Profit CAGR % 2008-2010) ($ millions)
Sara Lee Corporation’s Business Units
Net Sales2008-2010
Net SalesCAGR %
2008-2010
Operating
Profits2008-2010
OperatingProfitsCAGR %
2008-2010

Sara Lee 12
North American Retail
$8,198 3.85% $748 52.39%
North American FreshBakery
North American Foodservice
$6,356
$6,151
2.44%
-7.44%
$125
-$163
-10.56%
*$224.50/Yr.
International Beverage
International Bakery
Total business segments
$9,521
$2,514
$32,624
-0.26%
-8.32%
0.11%
$1,636
-$554
$1,707
3.65%
*$166/Yr.
258.59%
*Due to negative values; utilized raw $ improvement per year.
Each of the remaining business units have shown steady sales
during the recession and all but North American Fresh bakery have
shown improvement in operating profit, with the strongest
operating profit improvement reflected by North American
Foodservice, followed by International Bakery and then North
American Retail.
What does a 9-cell industry attractiveness/business strength
matrix displaying Sara Lee's business units look like?
Table 4Sara Lee Industry attractiveness/business strength matrix

Sara Lee 13
High
M edium
Low
Industry A
rractiveness
Com petitive Strenght/M arket Position
Sara Lee 9-Cell Industry Attractiveness-Com petitive Strength M atrix
Strong Average W eak
N.A. Fresh Bakery
N.A. Foodservice
N.A. Retail
Intr'lBeverage
Intr'lBakery
Intr'lhousehold and Body Care
Does Sara Lee's portfolio exhibit good strategic fit?
Sara Lee’s portfolio exhibits a good strategic fit and it
improves with the announcement of the International Household &
Body Care divesture in 2010. The remaining portfolio of packaged
food, bakery, meat and beverage products offers numerous
opportunities to generate cost savings, cross-business transfer
Sara Lee 14
of skills, technology, or intellectual capital. There is also
the ability to transfer Sara Lee’s potent brand name to the
products offered by other business units.
What value-chain match-ups do you see?
With the corporations narrowed focus (Packaged food, meat,
bakery, and Beverage products) there are value-chain match-ups
that include opportunities to combine purchasing activities and
gain more leverage with suppliers and realize supply chain
economies. There is also the opportunity to share technology,
transfer technical skills, and combine R&D (Research &
Development. The remaining business units also offer the ability
to combine sales and marketing activities, use common
distribution channels, leverage the Sara Lee brand name, and/or
combine after sale service activities. In the manufacturing
operations and marketing there will be ample opportunity to
create new competitive capabilities and innovative products
through collaboration across the business units.
What opportunities for skills transfer, cost sharing, or brand sharing do you see?
The primary opportunities for skills transfer, cost sharing,
or brand sharing in the areas of production and marketing. By
Sara Lee 15
sharing production best practices the business units can improve
efficiencies and thereby reduce operating expense. There may
also be opportunities to consolidate production, increase plant
utilization, look for outsourcing opportunities, reduce
inventories, and improve delivery times with enhanced
transportation and logistics coordination. On the marketing side
there will be an opportunity to transfer product development
ideas and improve the innovativeness necessary to maintain
customer loyalty. There will also be an ability to share
advertisement and leverage the Sara Lee brand across each
business unit, thus further growing the brand in the marketplace
and the ability to grow in a profitable manner.
What is your assessment of Sara Lee's financial and operating
performance in fiscal years 2008-2010, the period following the
divestitures that were the core of Sara Lee's retrenchment
strategy?
The following two charts provide a financial analysis of
Sara Lee’s (Hillshire Brands Co.) for the years of the case 2007
to 2010 and an update that reflects the years 2011 to 2013.
Table 5
Sara Lee 16
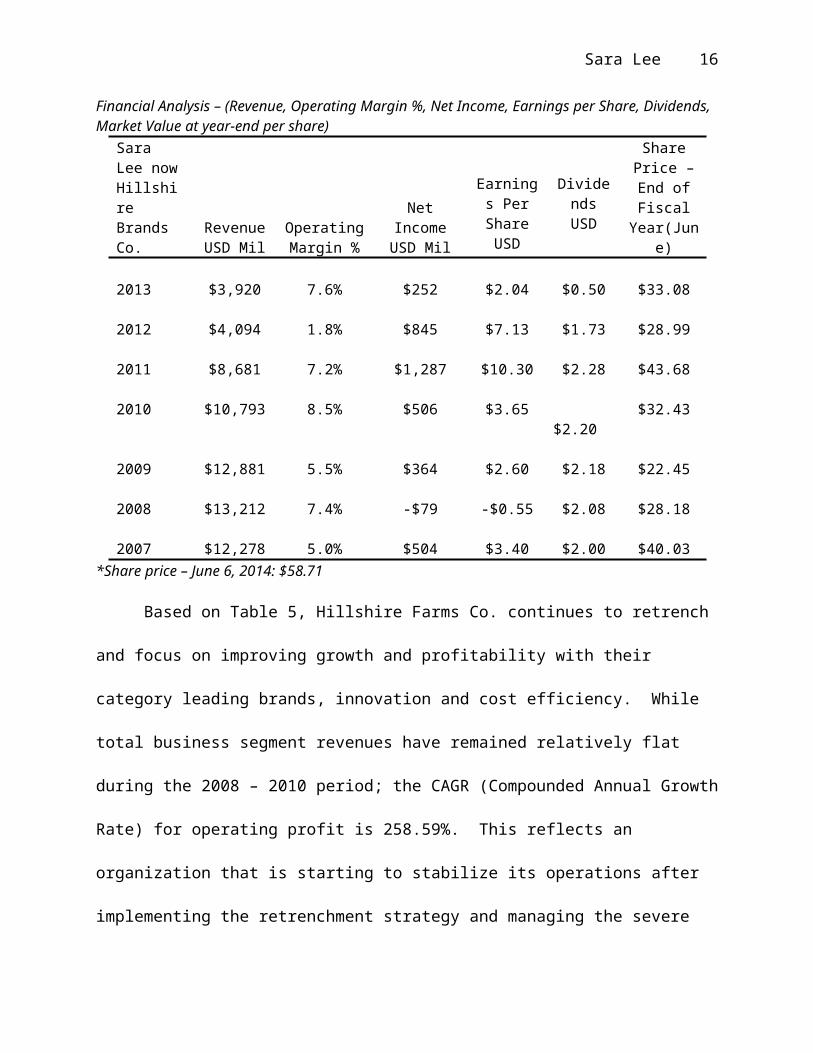
Financial Analysis – (Revenue, Operating Margin %, Net Income, Earnings per Share, Dividends, Market Value at year-end per share)
Sara Lee nowHillshire Brands Co.
RevenueUSD Mil
OperatingMargin %
NetIncomeUSD Mil
Earnings PerShareUSD
DividendsUSD
SharePrice –End ofFiscal
Year(June)
2013 $3,920 7.6% $252 $2.04 $0.50 $33.08
2012 $4,094 1.8% $845 $7.13 $1.73 $28.99
2011 $8,681 7.2% $1,287 $10.30 $2.28 $43.68
2010 $10,793 8.5% $506 $3.65 $2.20
$32.43
2009 $12,881 5.5% $364 $2.60 $2.18 $22.45
2008 $13,212 7.4% -$79 -$0.55 $2.08 $28.18
2007 $12,278 5.0% $504 $3.40 $2.00 $40.03*Share price – June 6, 2014: $58.71
Based on Table 5, Hillshire Farms Co. continues to retrench
and focus on improving growth and profitability with their
category leading brands, innovation and cost efficiency. While
total business segment revenues have remained relatively flat
during the 2008 – 2010 period; the CAGR (Compounded Annual Growth
Rate) for operating profit is 258.59%. This reflects an
organization that is starting to stabilize its operations after
implementing the retrenchment strategy and managing the severe
Sara Lee 17
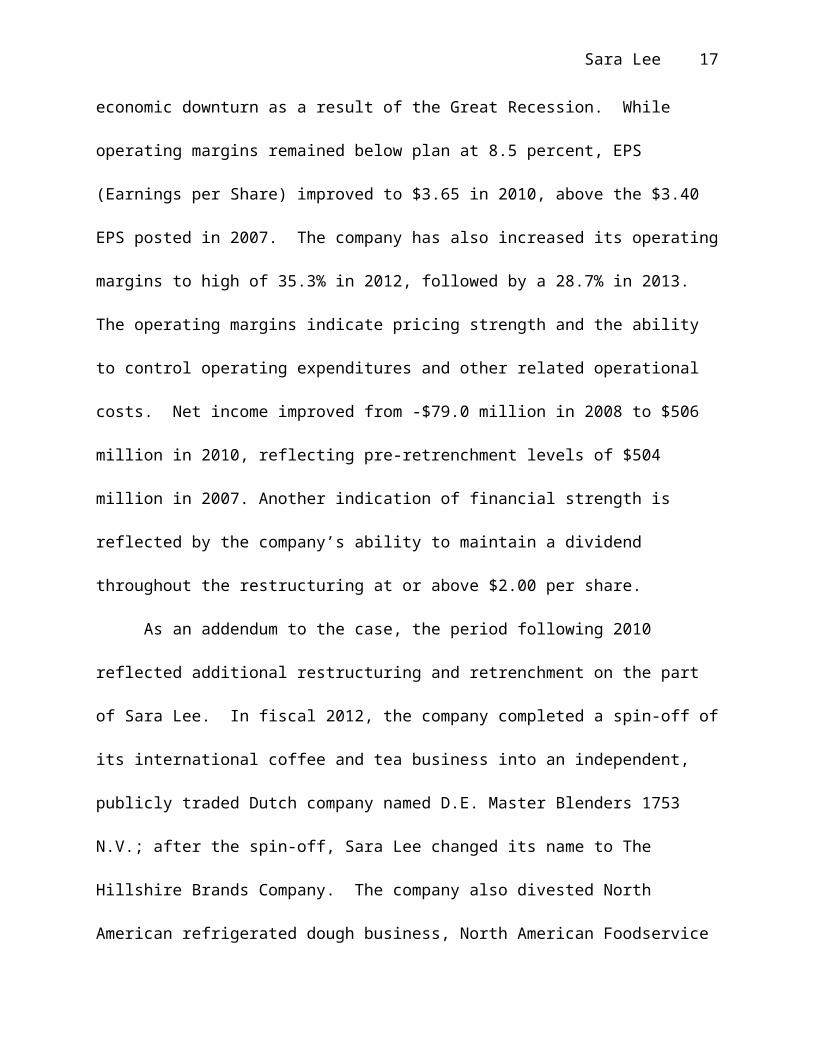
economic downturn as a result of the Great Recession. While
operating margins remained below plan at 8.5 percent, EPS
(Earnings per Share) improved to $3.65 in 2010, above the $3.40
EPS posted in 2007. The company has also increased its operating
margins to high of 35.3% in 2012, followed by a 28.7% in 2013.
The operating margins indicate pricing strength and the ability
to control operating expenditures and other related operational
costs. Net income improved from -$79.0 million in 2008 to $506
million in 2010, reflecting pre-retrenchment levels of $504
million in 2007. Another indication of financial strength is
reflected by the company’s ability to maintain a dividend
throughout the restructuring at or above $2.00 per share.
As an addendum to the case, the period following 2010
reflected additional restructuring and retrenchment on the part
of Sara Lee. In fiscal 2012, the company completed a spin-off of
its international coffee and tea business into an independent,
publicly traded Dutch company named D.E. Master Blenders 1753
N.V.; after the spin-off, Sara Lee changed its name to The
Hillshire Brands Company. The company also divested North
American refrigerated dough business, North American Foodservice

Sara Lee 18
Coffee business, Spanish Bakery and French refrigerated dough
business, and completed the sale of the North American Bakery
business. This narrowed The Hillshire Brands Company to a meat-
centric foods company. (The Hillshire Brands, 2011). Since this
further retrenchment, the company has been able to increase its
share price to $58.71 as of June 6, 2014, reflecting a 13% growth
CAGR since posting a $28.18 per share price at the end of fiscal
2008.
Table 6Key Ratios – (Net Margin %, Asset Turnover (Average), Return on Assets %, Return on Equity %, Return on Invested Capital %, Interest Coverage)
Sara Lee nowHillshire Farms Co.
NetMargin
%
AssetTurnover(Average)
Return onAssets %(ROA)
Returnon
Equity% (ROE)
Returnon
Invested
Capital %
Interest
Coverage
2013 6.43% 1.61 10.32% 70.10% 21.92% 6.33
2012 20.64% 0.68 14.10% 77.52% 31.02% 0.52
2011 14.83% 0.95 14.01% 75.00% 30.89% 5.16
2010 4.69% 1.18 5.54% 28.73% 13.69% 6.41
2009 2.83% 1.27 3.60% 15.02% 8.65% 4.46
2008 -0.60% 1.15 -0.69% -2.91% 0.66% --
2007 4.10% 0.92 3.77% 19.91% 10.00% --

Sara Lee 19
In Table 5 we see that Hillshire Farms Co. has effectively
leveraged its assets with a net margin that has increased from
single digits to a high of 20.64% in 2012, while slipping back to
6.43% in 2013 which still exceeds the net margin recorded from
2007 to 2010. Asset turnover continues to average well over 1,
with the TTM (Trailing Twelve Months) reflecting a strong 1.59.
Improved asset utilization is reflected in an ROA of 14% in 2011
and 2012, and a 10.32% in 2013; this is significantly improved
versus single digit returns that date back as far as 2004. ROE
has improved to 70+ percent in 2011 and 2012 and remains strong
at 70.10% in 2013; again this is considerably higher than the 22
percent returns experienced during the preceding 7 years. These
financial ratios indicate a company that has gone through
significant restructuring, the great recession and is now
starting to focus its remaining operations on generating long-
term value for its shareholders.
What is your overall evaluation of Sara Lee's retrenchment plan?
My overall evaluation of the Sara Lee retrenchment strategy
is that at the end of 2010 the profitability of the remaining
Sara Lee 20
business units was beginning to show promise. Improvement in
income from continuing operations before income taxes was showing
tremendous improvement in all business units with a combined
operating segment income CAGR (Compounded Annual Growth Rate) of
258.59% for the period 2008 to 2010.
The problem with assessing the organization during this time
period is that there was significant outside variable impacts as
the world was experiencing the Great Recession brought on by the
financial crisis that took place in 2008.
What evidence and/or reasons support a conclusion that Sara Lee's shareholders have
or have not benefitted from the company's retrenchment strategy?
The original retrenchment plan goal called for proceeds of
$3 billion to be generated from the selloff of the targeted
business units, $14 billion in revenues by fiscal 2010, and
operating profit margins of at least 12 percent by 2010 versus
8.1 percent in 2004. The actual results reflected $1.3 billion
in proceeds without the $2.4 billion dividend paid by the
Hanesbrands spin-off. Revenues came in at $10.73 billion versus
the $14 billion target and operating profit margin reflected
8.5%, not 12%.
Sara Lee 21
While these goals were not attained it is again difficult to
attribute the short-fall to company performance without taking
the recession into consideration. What can be stated is that the
shareowners have continued to receive a dividend payment
throughout the implementation of the retrenchment strategy and
that share price for Sara Lee (now Hillshire Farms) has shown a
13.01% CAGR for the last 6 years 2008 to 2014; increasing from
$28.18 at the fiscal end of 2008 to the current share price of
$58.71 as of June 6, 2014. (Morningstar, 2014). The company
has also provided shareholders a 70%+ ROE over the last three
years.
What actions do you recommend that Sara Lee management take
to improve the company's performance and boost shareholder value?
At the end of 2010, I would recommend that Sara Lee focus on
leveraging the resource fit in its remaining business units to
reduce operating costs, provide innovative products to the
marketplace, and leverage the Sara Lee brand. By focusing the
management team the organization can ensure that it has well
developed strategies that allow the business to grow in a
profitable manner.

Sara Lee 22
I would also recommend that the company make a decision to
devote additional resources to its International bakery Division
or divest. The company, based in Spain could present obstacles
going forward and takes company’s resources away from more
profitable opportunities.
In the Foodservice division, I would recommend additional
sharing of ideas take place with Sara Lee’s retail division and
other business to develop innovative products that can generate
growth opportunities with supermarkets, food service
distributors, and national restaurant chains. Idea sharing
between the remaining business units can lead to a competitive
advantage when it comes to bringing innovative products to the
market place.
Another recommendation would be to continue with the efforts
and initiatives started with Project Accelerate. In order to
improve operating margins and thereby provide competitive
pricing, the company will need to look for further outsourcing
opportunities, operating segment restructuring throw the sharing
of generalized services, supply chain efficiencies, and
reductions in corporate overhead. The company must make lean
Sara Lee 23
manufacturing an everyday way of life and expand the competitive
advantage they have established in the North American Retail
division when it comes to operating efficiency.
The lean manufacturing efforts will also allow the firm to
maintain competitive pricing within the US, its primary market,
and thereby establish barriers to entry in its core businesses.
By creating innovative products and improving operating
efficiencies in its remaining business units, Sara Lee can
provide long-term competitive returns to its shareholders.
Sara Lee 24
References
Gamble, J. E., Peteraf, M. A., Strickland III, A. J., & Thompson,
A. A. (2012). Crafting & executing strategy. (18th. ed.),
New York, NY: McGraw-Hill.
Morningstar, Inc. (2014, June 6). Hillshire Brands Co HSH.
Retrieved from
http://financials.morningstar.com/ratios/r.html?
ops=clear&t=HSH®ion=usa&culture=en-US
The Hillshire Brands Co. (2011). SEC Form 10-K for the Year Ended
December 31, 2011. Retrieved from
http://www.annualreports.com/Company/4341