Sapling ecology and management in multi-species ... - ZEF
145
Zentrum fürEntwicklungsforschung (ZEF) Sapling ecology and management in multi-species afforestation system on degraded cropland in the Sudano-Sahelian zone of Benin Dissertation zur Erlangung des Grades Doktor der Agrarwissenschaften (Dr. agr.) der Landwirtschaftlichen Fakultät der Rheinischen Friedrich-Wilhelms-Universität Bonn von Florent Anguilles Dèhogbé Noulèkoun aus Cana (Bohicon), Benin Bonn 2018
-
Upload
khangminh22 -
Category
Documents
-
view
2 -
download
0
Transcript of Sapling ecology and management in multi-species ... - ZEF

Zentrum fürEntwicklungsforschung (ZEF)
Sapling ecology and management in multi-species
afforestation system on degraded cropland in the
Sudano-Sahelian zone of Benin
Dissertation
zur
Erlangung des Grades
Doktor der Agrarwissenschaften (Dr. agr.)
der
Landwirtschaftlichen Fakultät
der
Rheinischen Friedrich-Wilhelms-Universität Bonn
von
Florent Anguilles Dèhogbé Noulèkoun
aus
Cana (Bohicon), Benin
Bonn 2018

1. Referent: Prof. Dr. Asia Khamzina
2. Korreferent: Prof. Dr. Meine van Noordwijk
3. Korreferent: Prof. Dr. Mathias Becker
Tag der mündlichen Prüfung: 06.07.2018
Angefertigt mit Genehmigung der Landwirtschaftlichen Fakultät der Universität Bonn

"At least there is hope for a tree: If it is cut down, it will sprout again, and its
new shoots will not fail."
The Bible, Job 14:7
“The best time to plant a tree was 20 years ago. The second best time is now.”
Chinese Proverb

ABSTRACT
Sub-Saharan Africa faces the multiple challenges of improving food security of the rapidly growing human population while halting the severe land degradation and coping with climate change impacts. Re- and afforestation of degraded lands have been recognized worldwide as cost-effective strategies to mitigate and adapt to adverse environmental changes. In this respect, the establishment phase of tree plantations is in particular decisive for the sustainability of forestation enterprises, since the early development determines long-term growth trajectories and potential yields. Through a combination of open-field experiments and modeling, this study aimed to improve the understanding of sapling eco-physiology and responses to silvicultural management of multipurpose tree species (MPTS) introduced on degraded cropland in the Sudano-Sahelian zone (SSZ) of Benin, West Africa.
Survival, above- and belowground functional traits and biomass production of five MPTS subjected to manuring (1 kg per sapling) and/or supplemental drip irrigation (0.5 L per sapling daily) were monitored over the first 15 months after planting, covering two rainy (growing) and one dry season. Based on the relative growth rates (RGRs) observed, species were classified as (i) fast-growing (Leucaena leucocephala Lam., Jatropha curcas L. and Moringa oleifera Lam.) or (ii) slow-growing (Anacardium occidentale L. and P. biglobosa Jacq.). All species successfully established on degraded cropland, albeit with differing survival rates (67-100%). The fast-growing species had the highest survival rates (94-100%). Dry-season irrigation resulted in a 10-fold reduction in the mortality of P. biglobosa, and fertilization consistently enhanced shoot growth in all species during the growing seasons. These management interventions had either insignificant or positive effects on root growth. However, belowground biomass allocation was mediated predominantly by ontogeny, which explained 86-95% of the variation in root-shoot biomass relationships.
Allometric equations based on sequential measurements of stem diameter and tree biomass (i.e., leaves, stems and roots) showed very good fits (R² > 0.93). Following the integration of these equations with field-collected climate and soil physico-chemical data in the Water, Nutrient and Light Capture in Agroforestry Systems model (WaNuLCAS), the early growth dynamics of J. curcas and M. oleifera were reproduced with acceptable accuracy and precision. Climate-growth analysis using historical climate data (1981-2016) revealed that drought (indicated by annual water deficit, length of the longest dry spell and length of the dry season), projected to increase in severity and occurrence in the SSZ, was the main climatic factor limiting sapling growth and thereby posing risks for future afforestation efforts. However, scenario analysis of rooting depth greater than the empirical values suggests that deeper rooting might be an effective adaptive trait to enhance biomass growth under extreme dry conditions, and thus reduce sapling sensitivity to drought.
Overall, all five MPTS were assessed as suitable for the afforestation of degraded cropland: the fast-growing species due to the high responsiveness of aboveground traits to silvicultural management during the rainy seasons, and the slow-growing species due to their ability to maintain growth during the dry season and to adjust to the prevailing water and nutrient stress through increased resource allocation to roots. Given the investment risks for smallholder farmers in the SSZ, the vast area of degraded croplands, and the projected increase in extreme weather events, an afforestation system that integrates silvicultural management and a diversity of species able to develop deep-penetrating root systems will have the highest potential to increase the resilience of tree plantations to the climate change and deliver expected benefits. The presented findings are relevant to local and regional decisions on land restoration and forest management in the SSZ, and might be of interest for other dryland agro-ecological zones.

Ökologie und Management von Jungbäumen unterschiedlicher Arten in
Aufforstungssystemen auf degradierten Anbauflächen in der Sudan-Sahelzone
in Benin
KURZFASSUNG
Subsahara-Afrika steht vor der vielfachen Herausforderung, die Ernährungssicherheit der schnell wachsenden Bevölkerung zu verbessern die voranschreitende Landdegradierung einzudämmen und gleichzeitig mit den Auswirkungen des Klimawandels umzugehen. Die (Wieder-)Aufforstung degradierter Böden ist in diesem Zusammenhang weltweit als kosteneffiziente Strategie anerkannt, die eine Anpassung an negative Umweltveränderung erleichtert und deren Auswirkung mindert. Dabei ist die Anpflanzungsphase für die Nachhaltigkeit der Aufforstungsvorhaben entscheidend, da in der frühen Entwicklung langfristige Wachstumsverläufe und Ertragspotenziale bestimmt werden. Durch die Kombination von Freifeldversuchen und Modellierung, versucht diese Studie das Verständnis der Ökophysiologie von Jungbäumen und der Reaktion von Mehrzweckbaumarten (MPTS) auf forstwirtschaftliches Management auf degradierten Anbauflächen in der Sudan-Sahelzone (SSZ) in Benin (Westafrika) zu verbessern.
Es wurden in dieser Studie fünf MPTS in den ersten 15 Monaten nach der Pflanzung beobachtet. Forstwirtschaftliches Management beinhaltete Düngung (1 kg pro Schössling) und/oder ergänzende Tropfbewässerung (täglich 0,5 l pro Jungbaum). Der Untersuchungszeitraum umfasste zwei Regen- (Wachstumsphasen) und eine Trockenzeit. Im Beobachtungszeitraum wurden die Überlebensrate, sowie ober- und unterirdische funktionelle Merkmale und Biomasseproduktion ermittelt. Basierend auf den beobachteten relativen Wachstumsraten (RGRs) wurden die Arten als (i) schnell wachsend (Leucaena leucocephala Lam., Jatropha curcas L. und Moringa oleifera Lam.) oder (ii) langsam wachsend (Anacardium occidentale L. und P. biglobosa Jacq.) klassifiziert. Alle Arten wurden erfolgreich auf degradierten Anbauflächen angepflanzt, allerdings mit unterschiedlichen Überlebensraten (67-100%). Die schnell wachsenden Arten hatten die höchsten Überlebensraten (94-100%). Bewässerung während der Trockenzeit führte zu einer zehnfachen Verringerung der Sterberate von P. biglobosa und Düngung erhöhte das Triebwachstum aller Arten in den Wachstumsperioden. Beide Maßnahmenhatten positive Auswirkungen auf das Wurzelwachstum, dennoch konnte 86-95% der Variation im Wurzel-Spross Biomasseverhältnis durch Ontogenese erklärt werden.
Basierend auf wiederholten Messungen des Stammdurchmessers und der Baumbiomasse (d.h. Blätter, Stämme und Wurzeln) wurden allometrische Gleichungen entwickelt, die sehr gute Anpassungen zeigten (R² > 0,93). Nach der Integration dieser Gleichungen, samt der im Feld erhobenen Klima- und bodenphysikalisch-chemischen Daten, in ein Wasser-, Nährstoff- und Lichteinfang erfassendes Agroforstsystem-Modell (WaNuLCAS), wurde die frühe Wachstumsdynamik von J. curcas und M. oleifera mit akzeptabler Genauigkeit und Präzision reproduziert. Eine Klimawachstumsanalyse unter Verwendung historischer Klimadaten (1981-2016) zeigt darüber hinaus, dass Trockenheit (gemessen am jährlichen Wasserdefizit, der Länge der längsten Trockenperiode und der Dauer der Trockenzeit), die in der SSZ an Häufigkeit und Schwere zunahm, der klimatisch wichtigste Faktor war. Trockenheit hemmt generell das Wachstum von Jungbäumen und gefährdet damit zukünftige Aufforstungsmaßnahmen. Eine Szenarioanalyse bei welcher die Wurzeltiefe größer ist als Erfahrungswerte nahelegen, deutet darauf hin, dass eine tiefere Bewurzelung ein effektives adaptives Merkmal zur Verbesserung des Biomassewachstums unter extremen

Trockenbedingungen sein könnte und somit die Empfindlichkeit von Jungbäumen gegenüber Trockenheit reduzieren könnte.
Insgesamt wurden alle fünf MPTS als geeignet für die Aufforstung degradierter Anbauflächen eingestuft: die schnell wachsenden Arten aufgrund der hohen Reaktionsfähigkeit ihrer oberirdischen Merkmale auf forstwirtschaftliches Management während der Regenzeit; die langsam wachsenden Arten aufgrund ihrer Fähigkeit, ihr Wachstum während der Trockenzeit aufrechtzuerhalten, indem sie durch erhöhtem Wurzelwachstum Wasser- und Nährstoffarmut begegnen. Angesichts des Investitionsrisikos für Kleinbauern in der SSZ, den großen Flächen degradierten Ackerlandes und des prognostizierten Anstiegs von Extremwetterereignissen sind Aufforstungssystem empfehlenswert, die das Anpflanzen von tiefwurzelnden Arten und forstwirtschaftlichem Management kombinieren. Auf diese Art kann das größte Potential erreicht werden, widerstandsfähige Baumplantagen zu etablieren, die dem prognostizierten Klimawandel standhalten und den erwarteten Nutzen erzielen. Die vorgestellten Ergebnisse sind insbesondere für lokale und regionale Entscheidungen mit Bezug auf die Rehabilitierung von degradierten Böden und die Bewirtschaftung von Aufforstungssystemen in der SSZ relevant. Auch für andere agroökologische Zonen in Trockengebieten sind die Ergebnisse von Interesse sein.

TABLE OF CONTENTS
1 GENERAL INTRODUCTION ................................................................................. 1
1.1 Problem setting ................................................................................................. 1
1.2 Afforestation of degraded cropland and its relevance for the SSZ of Benin .... 2
1.3 Research needs .................................................................................................. 3
1.4 Research objectives and structure of the thesis ............................................... 5
1.5 Description of the study area ............................................................................ 7
1.5.1 Location and demography ................................................................................. 7
1.5.2 Climate and soils ................................................................................................ 7
1.5.3 Land use and land cover .................................................................................... 8
2 MATERIALS AND METHODS ............................................................................. 10
2.1 Study sites ........................................................................................................ 10
2.2 Tree species ..................................................................................................... 11
2.3 Experimental setup .......................................................................................... 11
2.4 Field measurements and laboratory analyses ................................................ 12
2.5 Modeling approach ......................................................................................... 13
2.6 Statistical and modeling analysis ..................................................................... 13
3 RESULTS AND DISCUSSION .............................................................................. 16
3.1 Sapling growth as impacted by functional group and resource availability ... 16
3.2 Candidate tree species and silvicultural management for the afforestation of degraded cropland .......................................................................................... 17
3.3 Climate change impacts on sapling growth .................................................... 19
3.4 Methodological considerations ....................................................................... 21
3.4.1 Allometric approach for estimating tree biomass .......................................... 21
3.4.2 Process-based modelling of tree growth dynamics and climate sensitivity ... 22
4 CONCLUSIONS AND OUTLOOK ........................................................................ 24
4.1 Conclusions ...................................................................................................... 24
4.2 Outlook ............................................................................................................ 25
5 REFERENCES ..................................................................................................... 27
6 APPENDICES ..................................................................................................... 38
ACKNOWLEDGEMENTS

ACRONYMS AND ABBREVIATIONS
A/R Afforestation/Reforestation AGB Aboveground biomass ATWP Annual total wet-day precipitation AWD Annual water deficit BD Bulk density BGB Belowground biomass C Control treatment C Carbon CEC Cation Exchange Capacity CDM Clean Development Mechanism CO2 Carbon dioxide D Diameter at stem base F Fertilization treatment FEM Functional equilibrium model H Height I Irrigation treatment IF Irrigation plus fertilization treatment K Potassium Ksat Saturated hydraulic conductivity LDN Land degradation neutrality LDS Length of dry season LDSP Length of the longest dry spell MaP Month after planting MAPE Mean absolute percentage error MPTS Multipurpose tree species MRE Mean relative error N Nitrogen OM Organic matter OPT Optimal partitioning theory P Phosphorus REDD + Reducing emissions from deforestation and forest degradation, as
well as conservation, sustainable management of forests and enhancement of forest carbon stocks
RGR Relative growth rate RSR Root–shoot ratio SDG Sustainable Development Goal SSA Sub-Saharan Africa SZZ Sudano-Sahelian zone WASCAL West African Science Service Center on Climate Change and
Adapted Land Use (WASCAL) program

General introduction
1
1 GENERAL INTRODUCTION
1.1 Problem setting
In recent decades, concerns about the on-going land degradation1 have increased as the
global demands for food, feed and fuel continue to rise, while the share of productive
agricultural land is shrinking in many parts of the world (Gelfand et al. 2013; Lambin et
al. 2013; Gibbs and Salmon 2015; FAO 2017). Sub-Saharan Africa (SSA), a region with the
highest rate of poverty in the world and where the majority of the population derives
its livelihoods from subsistence agriculture, has experienced the most severe land
degradation (Nkonya et al. 2016). With a rapidly growing population, the pressure on
the land-resource base is intensifying in the region. The high levels of poverty in SSA
coupled with the increasing rate of cropland degradation constitute a serious threat to
food security, environmental health and rural livelihoods, particularly in the (semi-)arid
regions such as the Sudano-Sahelian zone (SSZ) (e.g., Eswaran et al. 2001; Bai et al.
2008).
The semi-arid SSZ is a land strip spanning from Senegal in the west to Djibouti
and Somalia in the east and located between the Sahara desert as the northern border
and the humid Guinean zone as the southern border (Appendix A1). This zone has been
an area of global concern since the early 1970s and 1980s, triggered by several severe
droughts, associated land degradation and desertification (Tucker and Nicholson 1999).
Extensive population growth, inappropriate land management and strong climatic
fluctuations are reportedly the major drivers of the degradation of agricultural and
forest lands (Herrmann and Hutchinson 2005; Karlson and Ostwald 2016).
The expansion of cropland to feed the rapidly growing population in the SSZ
comes at the cost of reduced carbon stocks in natural vegetation and soil organic matter
(e.g., Post and Kwon 2000; West et al. 2010; Vlek et al. 2017). The inherent low soil
fertility and the permanent removal of nutrients from the agricultural systems have
already resulted in severe soil nutrient mining in the SSZ (Stoorvogel and Smaling 1990;
1 Land degradation sets in when land loses its intrinsic qualities or capability to perform vital ecological and economic functions (Katyal and Vlek 2000; MEA 2005)

General introduction
2
Bationo et al. 1998). The use of organic and/or inorganic fertilizers to replenish minerals
and nutrients in cultivated soils is socio-economically barely feasible (Lamers et al.
2015a, b) because of high prices, poor enabling policies, and risks of crop failure due to
drought (Bationo et al. 2012). In the absence of appropriate land management, cropland
degradation is therefore unavoidable, eventually leading to land abandonment.
The semi-arid SSZ is characterized by a high climatic variability manifested by
large spatio-temporal fluctuations in rainfall levels and extreme weather events that
cause severe droughts and devastating floods (Nicholson 2001; Tschakert et al. 2010).
These environmental risks are likely to intensify due to climate change predicted for the
region (e.g., Ringler et al. 2010). The combined effects of low economic development,
rapid population increase, unsustainable land management practices and climate
change and variability will further exacerbate the fragility of the agricultural systems and
add to the pressure on croplands. Among the low-cost land rehabilitation options that
remain viable in the face of climate change, afforestation of degraded landscape
segments is able to meet these challenges if it is tailored to local agro-ecological settings
(Garrity et al. 2010).
1.2 Afforestation of degraded cropland and its relevance for the SSZ of Benin
In recognition of the importance of land restoration, several global initiatives such as
the Bonn Challenge2 and the Sustainable Development Goals (SDGs), in particular the
SDG 153, have emerged to support mitigation efforts. Target 2 of the SDG 15 is one of
the most important agendas recognizing the importance of afforestation and
reforestation (A/R) by aiming at substantially increasing global A/R by 2020. In addition,
A/R projects have been promoted under REDD+ and CDM for combatting land
degradation and offsetting carbon dioxide (CO2) emissions (UNFCCC 1997, 2010).
2The Bonn Challenge, launched in September 2011, is a global effort to restore 150 million ha of the world’s deforested and degraded land by 2020, and 350 million ha by 2030 (Source: http://www.bonnchallenge.org/content/challenge). 3The SDG 15 aims to “Protect, restore and promote sustainable use of terrestrial ecosystems, sustainably manage forests, combat desertification, and halt and reverse land degradation and halt biodiversity loss.”

General introduction
3
The growing interest in restoring degraded croplands using afforestation is
rooted in the demonstrated ability of tree-based land-use systems to increase
agroecosystem resilience and rural livelihoods (e.g., Garrity et al. 2010). Deep rooting
characteristics of suitable candidate species allow exploiting a large soil volume to
satisfy nutrient and water demands and maintain production under water- and nutrient-
stressed conditions. Tree-based systems can be self-sufficient in nitrogen (N) nutrition
through N2-fixation, and may enhance depleted soil nutrient stocks commonly observed
in the SSZ of Benin. Such systems can generate high quantities of organic matter which,
as soil surface residues, improve soil structure and water infiltration, and enhance
carbon storage above- and belowground (Garrity et al. 2010; Khamzina et al. 2012).
Food, fodder, fuel, fiber, bioenergy feedstock and income from timber and non-timber
products are potential socio-economic benefits of tree-based farming systems (Garrity
et al. 2010; Khamzina et al. 2012; Baumert et al. 2018) that could motivate the farmers
to embark on the pathway of afforestation. The evidence together indicates that with
appropriately selected species and silvicultural management approaches, the
conversion of degraded croplands to tree plantations can yield higher returns than the
continuous cropping of degraded lands where yield levels do not justify investments
(e.g., Djanibekov and Khamzina 2016). To assess the potential of afforestation of
degraded croplands for combatting the land degradation and increasing agroecosystem
resilience to climate change in the SSZ of Benin, several research aspects were identified.
1.3 Research needs
Practical recommendations regarding the choice of tree species for the afforestation of
degraded croplands and suitable silvicultural management options should rely on
accurate assessments of the viability and growth potential of the species, starting at the
early stages of growth. Seedling establishment and sapling growth represent the most
critical phase of the life cycle of any perennial plant, during which water and nutrient
deficiencies characteristic for degraded lands may cause mortality or compromise future
performance (e.g., Sanchez-Gomez et al. 2008; Reubens et al. 2009). Available evidence
shows that the afforestation of degraded croplands, a risky endeavor, must be preceded

General introduction
4
by a comprehensive selection of the promising candidate species based on a thorough
screening of eco-physiological characteristics (e.g., Lamers et al. 2006; Khamzina et al.
2012). Nonetheless, silvicultural measures to enhance or support early stages of growth
are seldom considered in afforestation strategies (Khurana and Singh 2004), and
seedling and/or sapling (auto-)ecology of promising woody species remains poorly
understood (Bunker and Carson 2005; Reubens 2010). Such information has not been
documented for the semi-arid SSZ of Benin, necessitating empirical research into key
growth features, in particular plant functional traits, resource-use strategies and
phenotypic plasticity in the context of afforestation of degraded drylands.
In response to environmental stressors, plants adjust biomass allocation
depending on the most limiting resource as postulated by the optimal partitioning
theory (OPT), sometimes also referred to as functional equilibrium model (FEM)
(Brouwer 1963; Bloom et al. 1985). In nutrient-poor and drought-prone environments,
roots play an essential role in the acquisition of soil-based resources, i.e. mainly water
and nutrients. Understanding patterns of resource partitioning between above- and
belowground would increase knowledge on tree responses to silvicultural management
and facilitate the selection of appropriate species for planting on degraded croplands.
However, studies on biomass allocation in the particular context of afforestation of
degraded cropland are missing for the SSZ of Benin, primarily because plant
establishment and sampling are challenging in open-field forestry experiments (e.g.,
Robinson 2004).
Determination of allometric relationships between biomass and stem diameter
could facilitate non-destructive biomass estimations and alleviate efforts associated
with repeated field biomass sampling (Brown et al. 1989). The information about the
allometry of promising afforestation and agroforestry species specific for juvenile
growth stage of trees remains to be documented for semi-arid Africa particularly
because growth trajectories of trees introduced on degraded cropland differ from those
of the same species under more favorable edaphic conditions. Realistic projections for
biomass and carbon sequestration are therefore difficult, but are key in assessing the
mitigation potential of young plantation forests (e.g., Baumert et al. 2018).

General introduction
5
Global warming necessitates the assessment of impacts of climate change and
variability on tree growth and the development on this basis of appropriate adaptation
strategies. However, the effects of increases in rainfall variability and temperature on
the early growth dynamics of trees have received little attention in general and none at
all for woody species in the SSZ of Benin. Yet such knowledge would be of major interest
to land-use planning and sustainable management of forests and tree plantations (e.g.,
Comita and Engelbrecht 2014). Field experiments aiming for such assessments remain
rare and are often costly because the existing complexities in soil–plant–climate
interactions may necessitate repeated field trials under various climatic and edaphic
conditions. Available methods such as dendrochronology frequently used to analyze
climate–growth relationships may not be suitable for assessing climate risks in the early
stages of tree growth due to the problematic features of wood anatomy such as missing,
discontinuous and false rings common in tropical species (Brienen and Zuidema, 2006;
Herrera‐Ramirez et al. 2017).
To ease some of these challenges, early indicators of long-term growth
potential and performance of woody species such as the relative growth rate (RGR)
should be considered (e.g., Shipley 2000; Lamers et al. 2006). Moreover, field
experiments could be complemented with additional assessment methods such as
process-based modeling of tree growth (e.g., van Noordwijk and Lusiana 1999; Luedeling
et al. 2016) to integrate available empirical data and broaden the site-specific results of
field experiments using scenario analysis of climate change impacts on early plant
growth and of possible physiological adaptations. A combination of these approaches
can support better-informed decisions on the selection of tree species and silvicultural
management for current and future afforestation projects.
1.4 Research objectives and structure of the thesis
The overarching goal of this study was to improve the understanding of the process of
(re-) establishing tree cover on degraded cropland in the SSZ of Benin under the
prevailing environmental stresses and silvicultural interventions. The research findings
on eco-physiology and responses of promising tree species to management are

General introduction
6
expected to support decision-making regarding the restoration of the productivity of
degraded croplands in dry areas through afforestation. In the long term, this may
contribute to climate change mitigation and improve rural livelihoods in the SSZ of Benin
and beyond.
The specific research objectives were to assess:
1. Survival and early growth responses of five MPTS grown on degraded cropland
and subjected to supplemental irrigation and manure application, focused on in
Noulèkoun et al. (2017a);
2. Effects of resource availability and ontogeny on biomass production and
allocation in the five MPTS, targeted in Noulèkoun et al. (2017b);
3. Sapling biomass allometry and potential for carbon sequestration of the five
MPTS, addressed in Noulèkoun et al. (2018a);
4. Climate sensitivity of selected MPTS in the early stages of the tree plantation
development on degraded cropland, focused on in Noulèkoun et al. (2018b).
This thesis is presented as a compilation of four scientific articles (Noulèkoun
et al. 2017a, b, 2018a, b) published in international peer-reviewed journals included in
the Science Citation Index (SCI). The thesis summary comprises a general introduction
(Chapter 1), an overview of methodologies employed in the study (Chapter 2), key
scientific findings and discussion of their contribution to general knowledge of tree eco-
physiology and management (Chapter 3), and general conclusions and implications of
the findings for further research (Chapter 4). Following are literature references and
additional materials included as separate items (Appendix A). The journal articles in their
published form along with related supplementary information are presented in
Appendix B.

General introduction
7
1.5 Description of the study area
1.5.1 Location and demography
The semi-arid Atacora region in north-western Benin (1° 00’ and 2° 00’ E and 10° 40’ and
11° 28’ N), located on the Sudano-Sahelian belt (Appendices A1 and A2), was selected
as the study area. Being part of the SSZ, Atacora is likewise exposed to land degradation
driven by deforestation and soil nutrient mining (Adegbidi et al. 1999; Mulder 2000),
which threaten the sustainability of farming systems and exacerbate rural poverty
(Saïdou et al. 2004; Wala 2005). The study was carried out in Pouri village in the
commune of Matéri, which is one of the nine communes in the Atacora region (Appendix
A2). In Matéri, one of the three study sites (Dassari Basin) of the WASCAL4 program is
located. The Atacora region has a high population growth rate (3.02% between 2002
and 2013; INSAE 2013). About 68% of the population lives in rural areas, and agriculture
and animal husbandry are the main livelihood sources (INSAE 2013).
1.5.2 Climate and soils
The climate is semi-arid, characterized by one rainy season (usually from April to
October) and one dry season (usually from November to March) (Figure 1 in Noulèkoun
et al. 2018b). The dry season is marked in the first months by strong, dry, north-east
winds locally called “Harmattan”, originating in the Sahara Desert. The annual
precipitation between 1981 and 2016 ranged from 674-1509 mm, underlining a high
inter-annual variability, which is likely to increase due to climate change. Moreover, the
inter-seasonal variability is subject to large variations (Sylla et al. 2016a, b). The long-
term (1981-2016) mean annual air temperature is 27.5°C (Figure 1 in Noulèkoun et al.
2018b), while absolute daily minimum and maximum temperatures may reach 11°C and
45°C, respectively. These temperatures are predicted to increase under future climate
conditions. The projected changes in rainfall patterns and temperature for the region
will likely influence the growth and productivity of crops and trees.
The region is characterized by fersialitic and ferralitic soils with low to
moderate inherent fertility and poor water holding capacity (Bationo et al. 1998; Azuka
4 West African Science Service Center on Climate Change and Adapted Land Use; http://www.wascal.org/

General introduction
8
et al. 2015). Generally, the soils are shallow, crusted, compacted and limited in depth by
gravelly or plinthic horizons (Saïdou et al. 2004). Because of the orographic influence on
the topography, the soils are susceptible to Harmattan-driven wind erosion during the
dry season (Röhrig 2008), while projected high rainfall intensities are likely to intensify
water erosion during the rainy season.
1.5.3 Land use and land cover
The main land-use types in the region include agricultural lands (i.e., croplands, grazing
lands, irrigated lands and fallows), forests (i.e., natural and planted forests) and
settlements.
Agriculture is of the subsistence type, mainly rainfed and predominantly
oriented towards the cultivation of sorghum (Sorghum bicolor L.), rice (Oryza sativa L.),
maize (Zea mays L.), cowpea (Vigna unguiculata L.) and yam (Dioscorea spp.) for
household consumption. Cotton (Gossypium spp.) and, to a lesser extent, tobacco
(Nicotiana tabacum L.) are principal cash crops. The practice of irrigation is in its infancy
with only 0.27% of total agricultural land classified as irrigated land in 2008 (World Bank
2008). Farms are generally small and subjected to strong cropping pressure, leading to
soil fertility decline (Callo-Concha et al. 2012). Crop production particularly suffers from
low capital inputs (e.g., low use of external inputs such as chemical fertilizers, organic
amendments, improved seeds, etc.) and environmental constraints (i.e., drought).
Consequently, yields are generally low (Igué et al. 2000; Röhrig 2008) and are expected
to continue to decline due to the projected increase in climate variability and the
adverse effects on crop yields (Sylla et al. 2016a). Overall, the low agricultural
productivity hinders reaching food security and poverty alleviation in the region.
The natural woody vegetation in the Atacora region consists of forests, and
shrub and tree savannas dominated by Parkia biglobosa (Jacq.), Isoberlinia doka Craib &
Stapf, Pterocarpus erinaceus Poir. and other tree species (Wala 2005; MEHU 2011).
According to the Benin forestry legislation (Law No. 93-009 of 2nd July 1993 on the
establishment of forests in Benin Republic), the national forest area is subdivided into
classified areas with restricted user rights and state-protected areas (MEHU 2011). The

General introduction
9
Pendjari National Park, two hunting zones (Pendjari and Atacora), and the reforestation
area of Natitingou (203 ha), all belonging to the classified forests areas, are located in
the Atacora region. Despite this prime attention to conserve forest resources, the
country lost about 13% of its natural forest cover between 1990 and 2015 at an annual
deforestation rate of 1.2% (FAO 2015).
The main driver of this land-use change is the conversion of forests and tree
savannas to agricultural lands. For instance, a recent study of the land-use and land-
cover change in the Dassari Basin in the Atacora region reported an annual rate of loss
in forest areas of 1.5% and a gain in agricultural lands of 1.8% between 2001 and 2013
(Chabi 2016). Obviously, the large-scale, national reforestation and forest enrichment
programs initiated in the 1940s (FAO 2001) and in 2013
(http://news.acotonou.com/h/61311.html) were not able to counterbalance the loss in
forest areas and fulfill the increasing demand for timber and non-timber products of the
rapidly growing population. As such, there is much scope for the introduction and use
of MPTs to restore degraded lands as well as for the development of appropriate
silvicultural options towards successful A/R planning and implementation.

Materials and methods
10
2 MATERIALS AND METHODS
2.1 Study sites
A cropping site at Pouri village (N 10°54’8.4’’ and E 1°4’47.4’’, altitude 186 m.a.s.l),
devoid of tree cover and characterized by a declined productivity, was selected for
setting up the multi-species afforestation trial (Appendix A2). The key selection criteria
included (i) land-use history, (ii) land impoverishment (judged by nutrient stocks and
crop yields), (iii) homogeneity in site conditions, (iv) site accessibility for regular field
measurements, (v) presence of natural fallow land in the vicinity of the cropland to
compare the productivity levels between afforestation and natural succession, and (vi)
willingness of the land owner to allocate cropland for afforestation (Noulèkoun et al.
2017a). The selection of the site was preceded by a reconnaissance survey in the study
area, which involved international and local forestry experts as well as local
communities. The selected cropland was originally a savanna forest converted to
agricultural land about 10 years prior to the experiment (Appendix A3). The soil at the
site is an epipetric plinthosol (WRB, 2006) characterized by a sandy-loam texture in
surface layers and clayey loam in deeper layers. At the onset of the experiment, the soil
was acidic (pH 5.5), limited at the depth of 50 cm by a lateritic concretion, and
characterized by low water holding capacity and low concentrations of macronutrients
and exchangeable cations (Appendix A4).
A second trial was established on an 8-year-old agricultural fallow land in
Dassari village (N 10°48’52.3’’ and E 1°7’53’’, altitude 196 m a.s.l), at 8-10 km from the
experimental site in Pouri (Appendix A2). The field data collected from this trial were
used to validate allometric equations (Noulèkoun et al. 2018a). The soil is a gleyic lixisol
(hyperferritic), characterized by an overall high clay content (70.6 %) particularly
increasing in the subsoil (Appendix A4). Compared to the Pouri site, the soil is deeper
and less acidic (pH 5.9) with a higher water holding capacity but lower concentration of
available phosphorus (P) (Appendix A4).

Materials and methods
11
2.2 Tree species
Five (semi-) deciduous shrub and tree species were included in the experiment: Moringa
oleifera Lam. (drumstick, small tree, Moringaceae), Leucaena leucocephala Lam.
(leucaena, medium-sized tree, Fabaceae), Jatropha curcas L. (physic nut, shrub or small
tree, Euphorbiaceae), Anacardium occidentale L. (cashew, medium-sized tree,
Anacardiaceae) and Parkia biglobosa Jacq. (African locust bean, tree, Fabaceae). The
species were selected based on reported information about their potential ability to
grow on degraded lands and socio-economic importance for local communities
(Noulèkoun et al. 2017a, 2018a).
Seedlings of the five species were raised in a tree nursery from seeds collected
from mature trees growing in the study area (Noulèkoun et al. 2018a). The seedlings
were grown in polyethylene tubes (ø=5 cm, 15 cm long) filled with a substrate of local
soil mixed with organic material. No fertilizer was applied to the seedlings in the nursery.
2.3 Experimental setup
The seedlings were planted in July 2014 on both sites at the age of 2.5-4 months. During
planting, the substrate was left attached to the roots, but the polyethylene tube was
removed. Prior to planting, the sites were ploughed, levelled, cleared of grasses and
sparse woody debris and fenced to protect the seedlings. The seedlings were planted in
manually dug pits with 30 cm radius and 15 cm depth and arranged in mono-species
plots that were randomized.
Three experimental factors expected to influence the establishment and early
growth of saplings were studied: (i) tree species (5), (ii) nutrient (1 level), and (iii) water
availability (1 level) imposed through drip irrigation (Figure 1 in Noulèkoun et al. 2017b),
and fertilization by manuring (Appendix A5). The study thus consisted of four treatments
following an increasing gradient of resource availability: control (C, neither irrigation nor
fertilization), fertilization (F), irrigation (I), and fertilization + irrigation (IF). The species
and irrigation factors were arranged in a fully factorial design with three replications
while manuring was introduced as a random nested factor (Appendix A6). The species
were randomly distributed on 30 plots, each 12 m x 8 m (Appendix A7). Each plot

Materials and methods
12
contained 48 seedlings at 2 m x 1 m spacing, resulting in an initial density of 5,000
saplings ha-1 (Appendix A6). Manual weed control was performed when needed. Neither
pesticides nor fungicides were applied in the course of the experiment.
Manure was applied during the rainy seasons at 2.5 and 11 months after
planting (MaP)), each time at the rate of 1 kg per plant (Figure 2 in Noulèkoun et al.
2017a). Manure applications supplied on average 18.7% carbon (C), 1.2% N, and 0.8% P
to the saplings in the F and IF treatments. Supplemental irrigation was implemented
during the dry season only via an adapted drip irrigation system consisting of perforated
plastic bottles positioned ca. 15 cm next to each plant (Figure 1 in Noulèkoun et al.
2017b). Irrigation water was supplied at 0.5 L per sapling per day to meet 30% of the
evaporative demand (ca. 6 mm day-1). Therefore, trees in the I and IF treatments
received in addition to 33 mm of rainfall, 105.5 mm of water during the dry season, while
those in the C and F treatments only received water from rainfall. The same
experimental layout was implemented on both sites, although the trial on the fallow
land in Dassari included only two of the five species (i.e., J. curcas and L. leucocephala).
2.4 Field measurements and laboratory analyses
Tree survival, morphological traits (i.e., height (H), stem diameter (D), rooting depth (RD)
and maximum extent of the lateral roots (RE)), aboveground biomass (AGB) and
belowground biomass (BGB) were measured on 2-6 randomly selected saplings at 5 MaP
(covering the 2014 rainy/growing season), 11 MaP (covering the 2014-2015 dry season)
and 15 MaP (covering the 2015 rainy season).
Before transplanting the nursery-grown seedlings in the plots, 10
representative individuals of each species were randomly chosen from the overall stock
to determine the mean reference values for all morphological traits and biomass
components monitored during the study period (Table 1 in Noulèkoun et al. 2017a).
Details on the subsequent field measurements and laboratory analyses are presented in
Noulèkoun et al. (2017a, b, 2018a, b).

Materials and methods
13
2.5 Modeling approach
The Water, Nutrient and Light Capture in Agroforestry Systems (WaNuLCAS) model
(version 4.3) was used to reproduce the growth dynamics of saplings of two species (J.
curcas and M. oleifera; Appendix A8). WaNuLCAS was developed by van Noordwijk and
Lusiana (1999) to improve the understanding of tree–soil–crop interactions in
agroforestry systems, with emphasis on above- and belowground interactions. The
model simulates the daily tree growth as a function of water, nutrient and light
availability at plot scale. The modeled plot is represented horizontally by four zones and
vertically by four soil layers where trees can be positioned (Figure 2 in Noulèkoun et al.
2018b). Details on the input data for WaNuLCAS as well as the description of the uptake
of above- and belowground resources by the plant as well as the water balance in
WaNuLCAS are presented in Noulèkoun et al. (2018b).
The model was calibrated with the 2-year experimental data from the F
treatment and validated with the data from the C, I and IF treatments. The validated
model with the C treatment, which represents the common, low-input silvicultural
practice in the study area, was used to perform 35 runs, each covering 2 consecutive
years over the historical climate period of 36 years (1981-2016), to quantify the strength
of relationships between annual AGB growth and climate indicators derived from the
historical climate data (Table 3 in Noulèkoun et al. 2018b). Furthermore, two soil and
rooting depth scenarios (either shallower [33.3 cm] or deeper [75 cm] than at the
experimental site) were performed under two contrasting water stress conditions
(severe and mild) to evaluate the effects of deep rooting in reducing sapling sensitivity
to extreme climate events (Noulèkoun et al. 2018b).
2.6 Statistical and modeling analysis
The methods employed to analyze the growth performance and responses of the tree
species to the silvicultural treatments over the 15-month study period are summarized
in Table 2.1. Overall statistical analyses to detect significant differences in species
responses to treatments involved the use of linear mixed-effects models and ANOVA.
For all analyses, general tests of normality and homogeneity of variance were

Materials and methods
14
conducted, and the robust standard error was used to control for any deviation from
these assumptions in the data (Noulèkoun et al. 2017a, b, 2018a). A least significance
difference (LSD) test was used to compare means when significant treatment effects
were found. A significance level of p<0.05 was used as the threshold value. The statistical
software STATA 14 (StataCorp 2015) and R version 3.4.3 (R Core Team 2017) were used
for the data analyses.
The performance of WaNuLCAS was evaluated using the goodness of fit (GOF)
procedure suggested by Loague and Green (1991) along with the coefficient of
determination (R²). To assess the climate sensitivity of sapling growth, a generic
approach was tried as an alternative to the traditional dendrochronological analysis
(Noulèkoun et al. 2018b). The approach combined: (i) the simulation of the early growth
(i.e., first two years after planting) of trees under historical climate (1981-2016) using
WaNuLCAS, (ii) the identification of the most important climate indicators driving
sapling AGB growth using linear mixed-effects models and climate sensitivity indices,
and (iii) the quantification of the effects of year-to-year climate variability on sapling
growth based on the climate indicators identified in (ii). The representativeness of the
empirical climate data vis-à-vis the long-term climate variability was assessed using
descriptive statistics (Table 3 in Noulèkoun et al. 2018b).

Materials and methods
15
Table 2.1 Summary of data analysis methods
Research objective (section 1.4)
Goal Method (source)
1 Assess the early establishment (survival) of the five MPTS
Kaplan-Meier survival analysis (Kaplan and Meier 1958)
1 Classification of the five MPTS into functional groups (fast- and slow-growing) and analysis of the plastic responses of the shoot- and root-level functional traits to treatments
Classical approach of growth analysis (Evans 1972)
2 Distinguish between ontogenetically modulated and treatment-induced shifts in biomass partitioning to belowground in the five MPTS
Clasmometric and allometric analysis (Poorter and Sack 2012; Poorter et al. 2015)
3 Establish empirical allometric relationships between plant biological traits (height, stem diameter and biomass of different tree fractions) for the five MPTS
Fitting non-linear regressions to equations derived from the conventional power–law equation (e.g., Baumert and Khamzina 2015)
4 Examine climate–growth relationships for two selected MPTS
Climate sensitivity analysis of the simulated early growth using climate sensitivity indices (Myers-Smith et al. 2015)
4 Reproduce the field-observed growth dynamics of two MPTS as well as simulate their early growth under historical climate conditions (1981-2016) and their adaptation strategy to drought
Process-based modeling and scenario analysis using WaNuLCAS (van Noordwijk et al. 1999)

Results and discussion
16
3 RESULTS AND DISCUSSION
3.1 Sapling growth as impacted by functional group and resource availability
In this study, significant interactions between species and silvicultural treatments (i.e.,
fertilization and irrigation), as reflected in morphological traits and biomass allocation,
showed that fast- and slow-growing species differed in their responsiveness to resource
availability (Noulèkoun et al. 2017a, b). In particular, the fast-growing species (J. curcas,
L. leucocephala and M. oleifera) were characterized by a more pronounced
aboveground (i.e., H, D and AGB) development and a more vigorous response to
increased resource availability during the two rainy seasons than the slow-growing
species (A. occidentale and P. biglobosa), indicating their exploitative use of resources.
In contrast, the slow growers depicted growth patterns associated with a more
conservative use of resources, thus showing a higher plastic response to the treatments
in both shoot and root morphological traits and a greater investment in belowground
development (i.e., higher root to shoot ratio, RSR) during the dry season (Noulèkoun et
al. 2017a, b, 2018a).
The comparison of intra-specific trait plasticity in response to resource
availability and the range of treatment-induced increases in traits across treatments and
assessment periods revealed an overall greater plastic response of the slow growers
compared to the fast growers (Noulèkoun et al. 2017a, b). The relatively lower plasticity
of fast-growing species than that of slow-growing species across soil resource gradients
was also reported for seedlings of nine tropical tree species grown in a shadehouse pot
experiment (Baraloto et al. 2006). While a combination of traits associated with a rapid
resource acquisition permits a quick growth across a wide environmental gradient, the
lower trait plasticity and the higher costs of ‘fast’ traits may compromise the potential
growth, particularly in resource-poor environments (Baraloto et al. 2006; Reich 2014).
Evidence from the presented studies (Noulèkoun et al. 2017a, b) about the performance
of the fast-growing species during the dry season supports the concept of this trade-off
between the rapid growth and resource availability. The slow-growing species in this
afforestation experiment appeared to tolerate resource (i.e., nutrient and water)

Results and discussion
17
deficiencies due to their conservative resource-use strategy (Noulèkoun et al. 2017 a,
b).
Although the fast- and slow-growing species showed contrasting resource-use
strategies, their adaptive responses to water and nutrient stress should accord with the
optimal partitioning theory (OPT; Poorter and Sack 2012). That is, saplings would
respond to low nutrient and water availability by allocating more carbohydrates to those
organs which support the acquisition of these resources, i.e. the roots (Bloom et al.
1985). In agreement with the OPT, the analysis of morphological trait expression
revealed that saplings exhibited longer lateral roots and deeper rooting depth in
response to nutrient and water limitation, respectively (Noulèkoun et al. 2017a). In
contrast, shifts in biomass allocation to belowground organs in response to nutrient and
water limitations were not always consistent across treatments and species, and were
mainly mediated by ontogeny. Consequently, patterns of biomass partitioning in the
tested species, after controlling for ontogeny, provided little support to the OPT
(Noulèkoun et al. 2017b). The generally modest manifestation of root-to-shoot biomass
adjustment in response to low resource availability and subsequently poorer
performance of saplings under water- and nutrient-stress conditions (i.e., control
treatment) observed in this study were also reported for juvenile trees of loblolly pine
and cottonwood genotypes in humid sub-tropical conditions (Coyle and Coleman 2005;
Coyle et al. 2008). The evidence combined indicates the need for silvicultural
interventions to support the establishment of multi-species tree plantations on
degraded cropland.
3.2 Candidate tree species and silvicultural management for the afforestation
of degraded cropland
The differential eco-physiological characteristics and responses of the tree species to
management observed in the experiment suggest that the screening of potential
candidates for the afforestation of degraded croplands should rely on a set of suitable
indicators, including survival rate, growth potential and trait plasticity. These allow the
appraisal of the species ability to establish on degraded cropland and tolerate the

Results and discussion
18
prevailing environmental stressors. In this study, the fast-growing and drought-tolerant
J. curcas, L. leucocephala. and M. oleifera showed lower mortality compared to the slow-
growing, drought-sensitive P. biglobosa (Noulèkoun et al. 2017a). No mortality was
recorded in J. curcas stands over the study period, confirming the common claim of its
suitability for reclaiming degraded lands in dry areas (Achten et al. 2010). Most of the
plant mortality peaks occurred due to water stress during the long dry season (Khurana
and Singh 2001), and the supply of even modest amounts of water dramatically reduced
the dry-season and post-planting mortality of P. biglobosa (Noulèkoun et al. 2017a).
Extending the habitat range of drought-sensitive species to degraded croplands in dry
areas may thus benefit from supplemental irrigation to curb the effect of drought stress
on their establishment (Ibid).
Given the low inherent soil fertility and the semi-arid climate conditions of the
study area, the supply of manure and water generally facilitated tree establishment and
growth. The effect of fertilization on sapling growth was overall greater than that of
irrigation and even than that of irrigation plus fertilization for some growth parameters,
e.g., biomass production (Noulékoun et al. 2017a, b), emphasizing the relatively greater
importance of nutrient over water stress for sapling growth, which is common in semi-
arid regions (e.g., Reubens et al. 2011). Moreover, the higher total shoot and root
productivity of the afforestation site compared to that of a neighboring 10-year-old
fallow (naturally revegetated by shrubs and grasses) was, next to the choice of plant
species, also due to silvicultural management (Noulèkoun et al. 2017b). Overall, the
observed increases in growth induced by fertilization and irrigation confirm the positive
effects of ‘intensive’ silviculture in overcoming environmental constraints and increasing
plantation productivity (Coyle and Coleman 2005; Coyle et al. 2016) on the degraded
cropland.
Desirable characteristics of the fast-growing species, such as high survival and
growth rates, biomass production potential and plastic responses to silvicultural
treatments during the rainy seasons make them most attractive candidates for
afforestation and certainly when farmers can afford to supply nutrients and water to the
saplings (Noulèkoun et al. 2017a, b). The slow-growing species, characterized by a slow

Results and discussion
19
initial growth, which is often associated with a long lifespan (Larcher 1995), maintained
growth under resource-poor conditions during the dry season (Noulèkoun et al. 2017a).
Although the slow-growing species did not develop as quickly as the fast growers, their
ability to adjust to stress factors would allow for extending afforestation practice to a
broader range of degraded lands (Aubrey et al. 2012; Noulèkoun et al. 2017a, b). A multi-
species afforestation system, combining fast- and slow-growing species, may therefore
help to reduce investment risks and increase the benefits of tree plantations for
smallholder farmers (Noulèkoun et al. 2017a, b).
3.3 Climate change impacts on sapling growth
Besides soil water and nutrient limitations on degraded cropland, climate change and
variability represents another influential factor for the success of afforestation.
Uncertainty surrounding climate projections challenges assessments of future impacts
of climate change on tree growth and the management decisions for forests and tree
plantations (Spittlehouse and Stewart 2003; Millar et al. 2007). Given that past climatic
variability has led to different physiological adaptations and growth strategies of species
(e.g., Cook et al. 2001; Teets et al. 2018), it is postulated that the effects of future
climatic changes on tree growth could be predicted from the analysis of species-specific
responses to past climate conditions (Friedrichs et al. 2009). The analysis of climate
sensitivity of two afforestation species (J. curcas and M. oleifera), focusing on crucial
early development stages, revealed that water deficits induced by drought (indicated by
annual water deficit [AWD]) and dry spells (indicated by the length of the longest dry
spell [LDSP]) were the main factors likely to jeopardize the success of afforestation under
the semi-arid climate conditions of Benin (Noulèkoun et al. 2018b). These water-related
indicators were likewise reported as the most important climate variables influencing
the growth of tropical tree species (e.g., Castro et al. 2015; Comita and Engelbrecht
2014).
Moreover, climate sensitivity of sapling growth to drought and the climatic
drivers with the largest explanatory power (i.e., AWD, LDSP and length of dry season
[LDS]) differed between year 1 and year 2 since tree planting for both species

Results and discussion
20
(Noulèkoun et al. 2018b). For instance, biomass growth was more sensitive to the
temporal distribution of rainfall (LDSP) in year 1, whereas variables related to the
amount of rainfall (AWD and LDS) were most influential on growth in year 2. Increasing
variability in rainfall distribution and the resulting effects on forest and plantation
productivity has received less attention in published research than the impacts of shifts
in the mean precipitation regimes (e.g., Wullschleger and Hanson 2003). The current
results demonstrate that rainfall variability expressed here by LDSP significantly limits
growth, particularly at the earliest stage (year 1) when the tree root systems only start
to develop. The impacts of reduced rainfall amounts on early growth were evidenced by
a reduction in AGB growth of 14-31% (Noulèkoun et al. 2018b). These findings suggest
that the increase in water stress and the number of consecutive dry days projected for
northern Benin through continued warming (MEHU 2011; Sylla et al. 2016a) may impose
additional constraints to afforestation efforts in the future, because of the adverse
impact on early plant growth.
Nevertheless, scenario analysis with the WaNuLCAS model showed that
increased rooting depth might be an effective adaptation to the future climate
constraints. In particular, the simulation results indicate that deep-rooted saplings
performed better in both extreme wet and dry conditions, and were less sensitive to
drought than their shallow-rooted counterparts (Noulèkoun et al. 2018b). This is
possibly caused by the ability of deep-rooted saplings to exploit soil water available in
deeper horizons, which in turn allows continued photosynthetic activity even during
drought (e.g., Hartl-Meier et al. 2014).
Given that the weather data of the experimental years (2014 and 2015)
represented one or a few of the many possible weather sequences for the study site,
their representativeness vis-à-vis the long-term (1981-2016) climate variability was
evaluated based on the most important climate indicators (AWD, LDSP, LDS and the
annual total wet-day precipitation [ATWP]). The results show that the experimental
years, particularly the year 2015, were characterized by extreme drought conditions and
less rainfall (Table 3 in Noulèkoun et al. 2018b). The observed patterns are in line with
climate change projections for West Africa (Sylla et al. 2015, 2016a). The performance

Results and discussion
21
of the saplings during the two years is therefore a conservative estimate of what can be
expected in years closer to the current average values, and is more representative of the
expected tree growth under projected climate conditions (Noulèkoun et al. 2018b).
3.4 Methodological considerations
3.4.1 Allometric approach for estimating tree biomass
The field-based results of the afforestation experiment permitted the estimation of
sapling above- and belowground biomass accumulation for each afforestation species
based on empirical relationships with easily measured dimensions of the plant stem. The
results reveal that the power law model using basal diameter (D) as the single predictor,
commonly reported as the ideal of tree allometry in many studies (e.g. Baumert and
Khamzina 2015; Kuyah et al. 2012, 2016), was not automatically appropriate for all
species tested (Noulèkoun et al. 2018a). For example, the power model with D and H as
independent variables best predicted AGB and BGB for the slow-growing species P.
biglobosa. Moreover, the incorporation of the scaling coefficient (c) of the H–D
relationships into the allometric equations showed that this coefficient could be
considered as a proxy for predicting biomass based on D for broader environmental
gradients for one of the species (J. curcas). This obviates the need for destructive
sampling and offers a good trade-off between accuracy, cost and practicability at both
local and landscape levels (Brown et al. 1989; Kuyah et al. 2012; Noulèkoun et al. 2018a).
Regression diagnostics indicated that besides R², model performance statistics
such as the mean absolute percentage error (MAPE) and the mean relative error (MRE)
should be considered when assessing allometric model fitness, because high R2 values
alone do not necessarily guarantee precise estimates (Sileshi 2014; Baumert and
Khamzina 2015). Furthermore, the predictive power of the equations developed was
influenced by the plant deciduousness, suggesting that more accurate AGB predictions
for drought-deciduous species can be obtained with equations based on woody
fractions (Baumert and Khamzina 2015; Noulèkoun et al. 2018a).
However, applying the empirical data in published allometric equations for J.
curcas resulted in substantial prediction errors (MRE up to 134%), emphasizing that

Results and discussion
22
caution must be taken when applying allometric functions to data beyond the initial
calibration ranges (Rothman 2002; Kuyah et al. 2012; Sileshi 2014; Noulèkoun et al.
2018a). The use of the generalized allometric equation developed by Brown (1997) for
dry forests, commonly applied to estimate biomass in tropical forests for carbon
accounting, led to a substantial overestimation (404% < MRE < 1235%). In contrast, the
use of globally derived RSR (e.g., IPCC default RSR) to estimate sapling BGB will result in
underestimations (Noulèkoun et al. 2018a). These findings altogether emphasize that
accurate quantification of the carbon sequestration potential of young plantations will
require site-specific and locally derived allometric models and a RSR representative of
the plant population under study (Ibid).
3.4.2 Process-based modelling of tree growth dynamics and climate sensitivity
The process-based modeling approach integrated the allometric equations with further
parameters relevant for plant-soil-atmosphere relationships and enabled the simulation
of tree growth in a young plantation system. The analysis of the model performance
based on the GOF statistics indicated the model’s ability to simulate accurately the H, D
and AGB under various silvicultural management options (Noulèkoun et al. 2018b).
However, the model overestimated D and AGB during the dry season due to its limited
capacity to account for drought-induced trunk shrinkage and litterfall. The simulation of
D and AGB is strongly influenced by litterfall in WaNuLCAS. Thus, the lack of field-
observed litterfall data for the drought-deciduous species might explain the poor
prediction of these parameters during the dry season (Walker et al. 2007). An accurate
calibration of the litterfall, however, requires data collected over a large range of
environmental gradients and from tree species of different ages (Noulèkoun et al.
2018b).
The integration of multi-source data in the common modeling framework
enlarged the scope of tree growth analysis beyond the specific settings of the
experimental site. In particular, after integrating historical climate data and calculated
climate sensitivity indices, the scenario-based modelling analysis allowed for predictions
of potential growth trajectories and tree root adaptation in response to changing

Results and discussion
23
climate (Noulèkoun et al. 2018b). This generic approach for assessing climate sensitivity
of trees presents a distinct advantage over the classic dendrochronology because it uses
the actual biomass increment rather than tree-ring widths or biomass increments
derived from tree rings (Bouriaud et al. 2005; Foster et al. 2014), thereby avoiding
challenges associated with missing tree rings in young trees or other problematic
features of wood anatomy in tropical trees (Brienen and Zuidema, 2006; Herrera‐
Ramirez et al. 2017).
However, WaNuLCAS does not yet include a direct representation of the effect
of temperature and CO2 on plant growth, nor does it account for physiological processes
associated with water stress such as cell damage (Walker et al. 2007; van Noordwijk et
al. 2011). Adding these features would allow the simulation of the effects of increased
temperature and/or CO2 on tree growth and further assessment of future climate
change effects, particularly important in drought-prone environments. Coupled with
long-term field data, this would increase confidence in the validity of the model outputs
and extend its range of applicability beyond limits recognised thus far.
In combination, field experiments and models can provide for more robust
results than experiments alone would do. However, models even with relatively modest
data requirements have to be supplied with extensive empirical data. To reap the
potential benefits from such a combination of complementary approaches, field
experiments need to be carefully planned, designed and monitored in accordance with
the demands of the model envisaged, and aim to add to and enhance the model’s
capabilities further.

Conclusions and outlook
24
4 CONCLUSIONS AND OUTLOOK
4.1 Conclusions
Re- and afforestation has been globally promoted over the last decades as a way to
revive degraded lands, achieve land degradation neutrality and improve livelihoods.
However, it often proceeds based on general recommendations not tailored to the site-
specific conditions of degraded lands, which explains the common failures of these
efforts. Therefore, there is need for a comprehensive evaluation of the growth dynamics
and performance of tree species considered in afforestation under the environmental
conditions prevalent on degraded lands using both experimental and simulation tools to
support the increasing afforestation projects.
This study contributes to such an evaluation for the SSZ of northern Benin by
enhancing knowledge on the eco-physiological processes mediating the early growth
dynamics of five tree species and identifying appropriate silvicultural practices for the
management of young plantations. The following main conclusions can be drawn:
- The mixed cultivation of fast- and slow-growing species is most promising for
reducing the risk of failure and enhancing the overall benefits from afforestation
of degraded croplands.
- Overall, the supply of the growth-limiting resources, i.e. water and nutrients,
resulted in increased survival rates and positive growth responses in the tested
species. Silvicultural management such as application of organic fertilizer and
deficit irrigation will thus benefit current and future afforestation activities.
- Sapling aboveground biomass growth responded strongly to annual water
deficit, length of the longest dry spell and length of dry season suggesting that
water availability will likely play an increasingly important role in limiting future
sapling growth. Deep rooting reduced the sensitivity of sapling growth to
extreme drought, indicating the advantage of tree genotypes with deep root
systems in the face of global warming.
- Process-based modeling allowed capitalizing on experimental field data through
their integration and synthesis, and can be used to broaden the scope of site-

Conclusions and outlook
25
and time-specific analysis of growth responses of trees to changing
environmental condtions, thus entailing significant promise for sustainable
afforestation planning.
- The combination of experiments and modeling provided a valid novel approach
particularly for assessing the impacts of climate change on the early growth of
afforestation species, and should be further developed for other relevant
applications.
4.2 Outlook
The choice of suitable tree species for the afforestation of degraded croplands based
solely on the assessment of early growth dynamics of tree species may raise concerns
about their long-term growth potential. Although the importance of the relative growth
rate as an effective early indicator of long-term growth potential of woody species
suggested that the current findings can be regarded as a proxy of further growth
(Noulèkoun et al. 2017a), studies covering later growth stages should quantify the long-
term productivity and stress tolerance of forest plantations on degraded croplands.
Silvicultural management such as thinning and pruning would also need to be explored
and adjusted to the changing needs of tree plantations, particularly when aiming to
integrate intercropping with annual crops in the longer run. Given the substantial
biomass and carbon stock in the 15-month-old afforestation system, particularly in the
N2-fixing L. leucocephala plots (Noulèkoun et al. 2017b, 2018a), the economic valuation
of the growing goods and ecosystem services, such as carbon sequestration and
biological N fixation, might reveal attractive co-benefits of afforestation (e.g.,
Djanibekov and Khamzina 2016; Baumert et al. 2018).
As global efforts on the re- and afforestation of degraded lands are rapidly
increasing, there is a need to emphasize inclusivity of local communities and social
acceptance of these land-use options. Currently, farmers in Benin hardly apply
silvicultural measures to trees believing that they would grow without additional inputs
after planting (personal communication with local farmers). Therefore, the cultivation
techniques tested in this study have to be translated into guidelines for their

Conclusions and outlook
26
communication to foresters and smallholder farmers through agricultural extension
services. Further socio-economic assessments would identify the conditions and
possible policy incentives for local farmers to adopt the afforestation and silvicultural
practices.
The aforementioned suggestions for follow-up research indicate the need for
the study of structure and function of afforestation systems taking the whole
agricultural land use mosaic and landscape connectivity into consideration. Different
scientific disciplines should therefore come together in addressing various aspects
related to the rehabilitation of degraded agricultural lands and sustainable land
management in conjunction with development researchers, land-use managers, local
communities and policy makers in both an inter- and transdisciplinary manner.

References
27
5 REFERENCES
Achten WMJ, Maes WH, Reubens B, Mathijs E, Singh VP, Verchot L, Muys B (2010)
Biomass production and allocation in Jatropha curcas L. seedlings under different
levels of drought stress. Biomass Bioenergy 34:667–676. doi:
10.1016/j.biombioe.2010.01.010
Adegbidi A, Burger K, Gandonou E, Mulder I (1999) Farmers’ Perceptions and Sustainable
Land Use in the Atacora, Benin CREED Working Paper 22. International Institute
for Environment and Development, London, United Kingdom
Aubrey DP, Coyle DR, Coleman MD (2012) Functional groups show distinct differences
in nitrogen cycling during early stand development: implications for forest
management. Plant Soil 351:219–236. doi: 10.1007/s11104-011-0946-0
Azuka CV, Igué AM, Diekkrüger B, Igwe CA (2015) Soil survey and soil classification of the
Koupendri catchment in Benin, West Africa. Afric J Agric Res 10(42):3938–3951.
doi: 10.5897/AJAR2015.9904
Bai ZG, Dent DL, Olsson L, Schaepman ME (2008) Proxy global assessment of land
degradation. Soil Use Manage 24(3):223–234. doi: 10.1111/j.1475-
2743.2008.00169.x
Baraloto C, Bonal D, Goldberg DE (2006) Differential seedling growth response to soil
resource availability among nine neotropical tree species. J Trop Ecol 22(5):487–
497. doi: 10.1017/S0266467406003439
Bationo A, Lompo F, Koala S (1998) Research on nutrient flows and balances in West
Africa: State-of-the-art. In: Smaling, EMA (ed) Nutrient balances as indicators of
production and sustainability in Sub-Saharan African agriculture. Agric Ecosyst
Environ 71:19–36
Bationo A, Waswa B, Kihara J, Adolwa I, Vanlauwe B, Saidou K (2012) Lessons learned
from long-term soil fertility management experiments in Africa. Springer,
Dordrecht, Heidelberg, New York, London. doi: 10.1007/978-94-007-2938-4

References
28
Baumert S, Khamzina A (2015) Allometric relations in Jatropha curcas production
systems of Burkina Faso. J Arid Environ 120:95–104. doi:
10.1016/j.jaridenv.2015.04.015
Baumert S, Khamzina A, Vlek PLG (2018) Greenhouse gas and energy balance of Jatropha
biofuel production systems of Burkina Faso. Energy Sustain Dev 42:14–23. doi:
10.1016/j.esd.2017.09.007
Bloom AJ, Chapin FS, Mooney HA (1985) Resource limitation in plants—an economic
analogy. Annu Rev Ecol Evol Syst 16:363–392. doi:
10.1146/annurev.es.16.110185.002051
Bouriaud O, Bréda N, Dupouey J-L, Granier A (2005) Is ring width a reliable proxy for
stem-biomass increment? A case study in European beech. Can J For Res
35:2920–2933. doi:10.1139/X05-202
Brienen RJW, Zuidema, P. A. (2006) Lifetime growth patterns and ages of Bolivian rain
forest trees obtained by tree ring analysis. J Ecol 94:481–493. doi:
10.1111/j.1365-2745.2005.01080.x
Brouwer R (1963) Some aspects of the equilibrium between over ground and
underground plant parts. Jb Inst Biol Scheikundig Onder Landbouwgewassen
1963:31–39
Brown S, Gillespie AJ, Lugo AE (1989) Biomass estimation methods for tropical forests
with applications to forest inventory data. For Sci 35(4):881–902
Brown S (1997) Estimating biomass and biomass change of tropical forests: a primer. UN
FAO forestry paper 134, Food and Agriculture Organization, Rome
Bunker DE, Carson WP (2005) Drought stress and tropical forest woody seedlings: effect
on community structure and composition. J Ecol 93:794–806. doi:
10.1111/j.1365-2745.2005.01019.x
Callo-Concha D, Gaiser T, Webber H, Tischbein B, Muuml M, Ewert F (2013) Farming in
the West African Sudan Savanna: Insights in the context of climate change. Afr J
Agric Res 8(38):4693–4705

References
29
Castro J, Zamora R, Hódar JA, Gómez JM (2005) Alleviation of summer drought boosts
establishment success of Pinus sylvestris in a Mediterranean mountain: an
experimental approach. Plant Ecol 181:191–202
Chabi A (2016) Land-use change modelling, scenarios development and impacts
assessment on CO2 and N2O emissions from vegetation degradation in the
Dassari basin, Bénin. Dissertation, Kwame Nkrumah University of Science and
Technology, Kumasi, Ghana
Comita LS, Engelbrecht BM (2014) Drought as a driver of tropical tree species
regeneration dynamics and distribution patterns. Forests and global change.
Cambridge University Press, Cambridge, pp 261–308
Cook ER, Glitzenstein JS, Krusic PJ, Harcombe PA (2001) Identifying functional groups of
trees in west Gulf Coast forests (USA): a tree-ring approach. Ecol Appl 11:883–
903. doi: 10.2307/3061123
Coyle DR, ColemanMD (2005) Forest production responses to irrigation and fertilization
are not explained by shifts in allocation. For Ecol Manag 208:137–152. doi:
10.1016/j.foreco.2004.11.022
Coyle DR, Coleman MD, Aubrey DP (2008) Above and belowground biomass
accumulation, production, and distribution of sweetgum and loblolly pine grown
with irrigation and fertilization. Can J For Res 38:1335–1348. doi: 10.1139/X07-
231
Coyle DR, Aubrey DP, Coleman MD (2016) Growth responses of narrow or broad site
adapted tree species to a range of resource availability treatments after a full
harvest rotation. For Ecol Manag 362:107–119. doi:
10.1016/j.foreco.2015.11.047
Djanibekov U, Khamzina A (2016) Stochastic economic assessment of afforestation on
marginal land in irrigated farming system. Environ Resource Econ 63(1):95–117.
doi: 10.1007/s10640-014-9843-3
Eswaran H, Lal R, Reich PF (2001) Land degradation: an overview. In: Bridges EM,
Hannam ID, Oldeman LR, Pening de Vries FWT, Scherr SJ, Sompatpanit S (eds.)
Responses to Land Degradation. Proc. 2nd. International Conference on Land

References
30
Degradation and Desertification. Oxford Press, Khon Kaen, Thailand, New Delhi,
India
Evans GC (1972) The quantitative analysis of plant growth. Blackwell Scientific
Publications, Oxford
FAO (Food and Agriculture Organization of the United Nations) (2001) L’Étude
prospective du secteur forestier en Afrique (FOSA): République du Bénin.
http://www.fao.org/3/a-x6773f.pdf. Assessed in 10/10/2017
FAO (Food and Agriculture Organization of the United Nations) (2015) Global forest
resources assessment 2015. Rome (available at www.fao.org/forest-resources-
assessment/en)
FAO (Food and Agriculture Organization of the United Nations) (2017) The state of food
and agriculture – Leveraging food systems for inclusive rural transformation.
FAO, Rome
Foster JR, D’Amato AW, Bradford JB (2014) Looking for age-related growth decline in
natural forests: Unexpected biomass patterns from tree rings and simulated
mortality. Oecologia 175:363–374. doi: 10.1007/s00442-014-2881-2
Friedrichs DA, Trouet V, Büntgen U, Frank DC, Esper J, Neuwirth B, Löffler J (2009)
Species-specific climate sensitivity of tree growth in Central-West Germany.
Trees 23(4):729. doi: 10.1007/s00468-009-0315-2
Garrity DP, Akkinifesi FK, Ajayi OC, Weldesemayat SG, Mowo JG, Kalinganire A, Larwanou
M, Bayala J (2010) Evergreen agriculture: a robust approach to sustainable food
security in Africa. Food Sec 2:197–214. doi: 10.1007/s12571-010-0070-7
Gelfand I, Sahajpal R, Zhang X, Izaurralde RC, Gross KL, Robertson GP (2013) Sustainable
bioenergy production from marginal lands in the US Midwest. Nature
493(7433):514–517. doi: 10.1038/nature11811
Gibbs HK, Salmon JM (2015) Mapping the world's degraded lands. Appl Geogr 57:12–21.
doi: 10.1016/j.apgeog.2014.11.024
Hartl-Meier C, Zang C, Büntgen U, Esper J, Rothe A, Göttlein A, Dirnböck T, Treydte K
(2014) Uniform climate sensitivity in tree-ring stable isotopes across species and

References
31
sites in a mid-latitude temperate forest. Tree physiol 35(1): 4-15.
doi:10.1093/treephys/tpu096
Herrera‐Ramirez D, Andreu‐Hayles L, Valle JI, Santos GM, Gonzalez PL (2017) Nonannual
tree rings in a climate‐sensitive Prioria copaifera chronology in the Atrato River,
Colombia. Ecol Evol 7(16):6334–6345. doi: 10.1002/ece3.2905
Herrmann SM, Hutchinson CF (2005) The changing contexts of the desertification
debate. J Arid Environ 63:538-555
Igué AM, Floquet A, Stahr K (2000) Land use and farming systems in Benin. Adapted
farming in West Africa: issues, potentials and perspectives 227, p 238
INSAE (Institut National de la Statistique et de l’Analyse Economique du Bénin) (2013)
Troisième recensement général de la population et de l’habitat. Cotonou
Kaplan EL, Meier P (1958) Nonparametric estimation from incomplete observations. J
Am Stat Assoc 53(282):457–481
Karlson M, Ostwald M (2016) Remote sensing of vegetation in the Sudano-Sahelian
zone: A literature review from 1975 to 2014. J Arid Environ 124:257-269. doi:
10.1016/j.jaridenv.2015.08.022
Katyal JC, Vlek PLG (2000) Desertification: Concept, causes and amelioration. ZEF–
Discussion Paper on Development Policy No 33. Center for Development
Research (ZEF), Bonn, Germany, p 65
Khamzina A, Lamers JPA, Worbes M, Botman E, Vlek PLG (2006) Assessing the potential
of trees for afforestation of degraded landscapes in the Aral Sea Basin of
Uzbekistan. Agrofor Syst 66:129–141. doi: 10.1007/s10457-005-4677-1
Khamzina A, Lamers JPA, Vlek PLG (2012) Conversion of degraded cropland to tree
plantations for ecosystem and livelihood benefits. In: Martius C, Rudenko I,
Lamers J, Vlek P (eds) Cotton, water, salts and soums. Springer, Dordrecht, pp
235–248. doi: 10.1007/978-94-007-1963-7_15
Khurana E, Singh JS (2004) Germination and seedling growth of five tree species from
tropical dry forest in relation to water stress: impact of seed size. J Trop Ecol
20:385–396. doi: 10.1017/S026646740400135X

References
32
Kuyah S, Dietz J, Muthuri C, Jamnadass R, Mwangi P, Coe R, Neufeldt H (2012) Allometric
equations for estimating biomass in agricultural landscapes: I. Aboveground
biomass. Agric Ecosyst Environ 158:225–234. doi: 10.1016/j.agee.2012.05.011
Kuyah S, Sileshi GW, Rosenstock TS (2016) Allometric models based on Bayesian
frameworks give better estimates of aboveground biomass in the Miombo
woodlands. Forests 7(2):13. doi: 10.3390/f7020013
Lambin EF, Gibbs HK, Ferreira L, Grau R, Mayaux P, Meyfroidt P, et al. (2013) Estimating
the world's potentially available cropland using a bottom-up approach. Glob
Environ Change 23(5):892–901. doi: 10.1016/j.gloenvcha.2013.05.005
Lamers JP, Khamzina A, Worbes M (2006) The analyses of physiological and
morphological attributes of 10 tree species for early determination of their
suitability to afforest degraded landscapes in the Aral Sea Basin of Uzbekistan.
For Ecol Manag 221(1-3), 249–259. doi:10.1016/j.foreco.2005.10.022
Lamers JPA, Bruentrup M, Buerkert A (2015a) Financial performance of fertilisation
strategies for sustainable soil fertility management in Sudano-Sahelian West
Africa 1: profitability of annual fertilisation strategies. Nutr Cycl Agroecosyst
102(1):137–148. doi: 10.1007/s10705-015-9673-x
Lamers JPA, Bruentrup M, Buerkert A (2015b) Financial performance of fertilisation
strategies for sustainable soil fertility management in Sudano-Sahelian West
Africa 2: profitability of long-term capital investments in rockphosphate. Nutr
Cycl Agroecosyst 102(1):149–165. doi: 10.1007/s10705-015-9671-z
Loague K, Green RE (1991) Statistical and graphical methods for evaluating solute
transport models: overview and application. J Contam Hydrol 7:51–73
Luedeling E, Smethurst PJ, Baudron F, Bayala J, Huth NI, van Noordwijk M, et al. (2016)
Field-scale modeling of tree–crop interactions: Challenges and development
needs. Agric Syst 142:51–69. doi: 10.1016/j.agsy.2015.11.005
MEA (Millenium Ecosystem Assessment) (2005) Dryland systems. In: Hassan R, Scholes
R, Ash N (eds) Ecosystem and well-being: Current state and trends. Washington,
DC: Island Press, pp 623–662

References
33
MEHU (Ministère de l’Environnement, de l’Habitat et de l’Urbanisme) (2011) Deuxième
Communication Nationale de la République du Bénin sur les Changements
Climatiques
Millar CI, Stephenson NL, Stephens SL (2007) Climate change and forests of the future:
managing in the face of uncertainty. Ecol Appl 17(8):2145–2151
Mulder I. (2000) Soil Degradation in Benin: Farmers’ Perceptions and Responses
Dissertation. Tinbergen Institute, Vrije Universiteit Amsterdam, Amsterdam,
Netherlands
Myers-Smith IH, Elmendorf SC, Beck PS, Wilmking M, Hallinger M, Blok D (2015) Climate
sensitivity of shrub growth across the tundra biome. Nat Clim Change 5:887. doi:
10.1038/NCLIMATE2697
Nicholson SE (2001) Climatic and environmental change in Africa during the last two
centuries. Clim Res 17:123–144
Nkonya E, Mirzabaev A, Von Braun J (2016) Economics of land degradation and
improvement: a global assessment for sustainable development. Springer, Cham
Heidelberg, New York, Dordrecht, London
Noulèkoun F, Lamers JPA, Naab J, Khamzina A (2017a) Shoot and root responses of
woody species to silvicultural management for afforestation of degraded
croplands in the Sudano-Sahelian zone of Benin. For Ecol Manag 385:254–263.
doi: 10.1016/j.foreco.2016.11.018
Noulèkoun F, Khamzina A, Naab J, Lamers JPA (2017b) Biomass allocation in five semi-
arid afforestation species is driven mainly by ontogeny rather than resource
availability. Ann For Sci 74:78. doi: 10.1007/s13595-017-0676-4
Noulèkoun F, Naab JB, Lamers JP, Baumert S, Khamzina A (2018a) Sapling biomass
allometry and carbon content in five afforestation species on marginal farmland
in semi-arid Benin. New Forest 49(3):363–382. doi: 10.1007/s11056-017-9624-2
Noulèkoun F, Khamzina A, Naab J, Khasanah N, van Noordwijk M, Lamers JPA (2018b)
Climate change sensitivity of multi-species afforestation in semi-arid Benin.
Sustainability 10(6):1–23. doi:10.3390/su10061931

References
34
Poorter H, Sack L (2012) Pitfalls and possibilities in the analysis of biomass allocation
patterns in plants. Front Plant Sci 259:1–10. doi: 10.3389/fpls.2012.00259
Poorter H, Jagodzinski AM, Ruiz-Peinado R, et al. (2015) How does biomass distribution
change with size and differ among species? An analysis for 1200 plant species
from five continents. New Phytol 208:736–749. doi: 10.1111/nph.13571
Post W, Kwon K (2000) Soil carbon sequestration and Land-Use Change: processes and
potential. Glob Change Biol 6:317–328
R Core Team (2017) R: A language and environment for statistical computing. R
Foundation for Statistical Computing, Vienna, Austria. URL https://www.R-
project.org/
Reich PB (2014) The world-wide ‘fast-slow’ plant economics spectrum: a traits
manifesto. J Ecol 102:275–301. doi: 10.1111/1365-2745.12211
Reubens B, Poesen J, Nyssen J, Leduc Y, Zenebe A, Tewoldeberhan S, Bauer H,
Gebrehiwot K, Deckers J, Muys B (2009) Establishment and management of
woody seedlings in gullies in a semi-arid environment (Tigray, Ethiopia). Plant
Soil 324:131–156. doi: . 10.1007/s11104-009-0097-8
Reubens B (2010) Woody vegetation for gully rehabilitation in northern Ethiopia: species
suitability, root structure, and seedling establishment, growth and management.
Dissertation, Catholic University of Leuven, Belgium
Reubens B, Achten WMJ, Maes WH, Danjon F, Aerts R, Poesen J, Muys B (2011) More
than biofuel? Jatropha curcas root system symmetry and potential for soil
erosion control. J Arid Environ 75:201–205. doi:10.1016/j.jaridenv.2010.09.011
Ringler C, Zhu T, Cai X, Koo J, Wang D. (2010) climate change impacts on food security in
sub-Saharan Africa: Insights from comprehensive climate change scenarios. IFPRI
Discussion Paper No. 1042. International Food Policy Research Institute (IFPRI),
Washington DC
Robinson D (2004) Scaling the depths: belowground allocation in plants, forests and
biomes. Funct Ecol 18:290–295. doi: 10.1111/j.0269-8463.2004.00849.x

References
35
Röhrig J (2008) Evaluation of agricultural land resources in Benin by regionalisation of
the marginality index using satellite data. Doctoral dissertation, University of
Bonn
Rothman KJ (2002) Epidemiology: an introduction, 2nd edn. Oxford University Press,
New York
Saïdou A, Kuyper TW, Kossou DK, Tossou R, Richards P (2004) Sustainable soil fertility
management in Benin: learning from farmers. NJAS-Wageningen J Life Sci
52(3):349–369. doi: 10.1016/S1573-5214(04)80021-6
Sanchez-Gomez D, Zavala MA, Valladares F (2008) Functional traits and plasticity linked
to seedlings' performance under shade and drought in Mediterranean woody
species. Ann For Sci 65:311–311. doi: 10.1051/forest:2008004
Shipley B (2000) Plasticity in relative growth rate and its components following a change
in irradiance. Plant Cell Environ 23(11):1207–1216. doi: 10.1046/j.1365-
3040.2000.00635.x
Sileshi GW (2014) A critical review of forest biomass estimation models, common
mistakes and corrective measures. For Ecol Manag 329:237–254. doi:
10.1016/j.foreco.2014.06.026
Spittlehouse DL, Stewart RB (2003) Adaptation to climate change in forest management.
BC J Ecosys Manage 4:1–7
StataCorp. (2015) Stata 14 Base Reference Manual. Stata Press, College Station, TX
Stoorvogel J, Smaling EM (1990) Assessment of soil nutrient depletion in sub-Saharan
Africa: 1983–2000. Main Report, No 1. The Winand Staring Center, Wageningen,
the Netherlands
Sylla MB, Giorgi F, Pal JS, Gibba P, Kebe I, Nikiema M (2015) Projected changes in the
annual cycle of high-intensity precipitation events over West Africa for the late
twenty-first century. J Clim 28:6475–6488. doi: 10.1175/JCLI-D-14-00854.s1
Sylla MB, Nikiema PM, Gibba P, Kebe I, Klutse NAB (2016a) Climate Change over West
Africa: Recent Trends and Future Projections. In Adaptation to Climate Change
and Variability in Rural West Africa. Springer, International Publishing, pp 25–40

References
36
Sylla MB, Elguindi N, Giorgi F, Wisser D (2016b) Projected robust shift of climate zones
over West Africa in response to anthropogenic climate change for the late 21st
century. Clim Change 134(1-2):241–253
Teets A, Fraver S, Weiskittel AR, Hollinger DY (2018) Quantifying climate–growth
relationships at the stand level in a mature mixed‐species conifer forest. Glob
Change Biol. doi: 10.1111/gcb.14120
Tschakert P, Sagoe R, Ofori-Darko G, Codjoe SN (2010) Floods in the Sahel: an analysis
of anomalies, memory, and anticipatory learning. Clim Change 103:471–502. doi:
10.1007/s10584-009-9776-y
Tucker CJ, Nicholson SE (1999) Variations in the size of the Sahara Desert from 1980 to
1997. Ambio 587-591
UNFCCC (1997) Kyoto protocol to the United Nations framework convention on climate
change
UNFCCC (2010) Outcome of the work of the ad hoc working group on long-term
cooperative action under the convention–policy approaches and positive
incentives on issues relating to reducing emissions from deforestation and forest
degradation in developing countries: and the role of conservation, sustainable
management of forests and enhancement of forest carbon stocks in developing
countries UNFCCC COP 16 Cancun. http://unfccc.int/2860.php
van Noordwijk M, Lusiana B (1999) WaNuLCAS, a model of water, nutrient and light
capture in agroforestry systems. Agrofor Syst 43:217–242
van Noordwijk M, Lusiana B, Khasanah N, Mulia R (2011) WaNuLCAS version 4.0,
Background on a model of water nutrient and light capture in agroforestry
systems. Bogor, Indonesia. World Agroforestry Centre (ICRAF), SEA Regional
Office, p 224
Vlek PLG, Khamzina A, Tamene L. (2017) Land degradation and the Sustainable
Development Goals: Threats and potential remedies. CGIAR Research Program
on Dryland Systems, Amman, Jordan, p 67. http://hdl.handle.net/10568/81313

References
37
Wala K (2005) La Végétation de la chaine de l’Atacora au Bénin: Diversité floristique,
phytosociologique et impact humain. Dissertation, Faculté des Sciences,
Université de Lomé, Togo
Walker A, Mutuo P, van Noordwijk M, Albrecht A, Cadisch G (2007) Modelling of planted
legume fallows in Western Kenya using WaNuLCAS. (I) Model calibration and
validation. Agrofor Syst 70:197–209
West PC, Gibbs HK, Monfred C, Wagner J, Barford CC, Carpenter SR, Foley JA (2010)
Trading carbon for food: Global comparison of carbon stocks vs. crop yields on
agricultural land. Proceedings of the National Academy of Sciences 107:19645–
19648. doi: 10.1073/pnas.1011078107
World Bank (2008) Agricultural irrigated land (% of total agricultural land) Benin.
Accessed on March 15, 2018.
http://data.worldbank.org/indicator/AG.LND.IRIG.AG.ZS?locations =BJ
WRB (2006) A Framework for International Classification, Correlation and
Communication. World Soil Resources Reports No. 103. FAO, Rome
Wullschleger SD, Hanson PJ (2003) Sensitivity of sapling and mature-tree water use to
altered precipitation regimes. In Hanson PJ, Wullschleger SD (eds) North
American Temperate Deciduous Forest Responses to Changing Precipitation
Regimes, Ecological Studies 166, Springer-Verlag, New York, pp 87–99

Appendices
38
6 APPENDICES
Appendix A1: Map of Sudano-Sahelian zone (SSZ) in West Africa. Source: Karlson and Ostwald 2016. Red marking: study location in northern Benin

Appendices
39
Appendix A2: Location of afforestation sites in the semi-arid climate zone of north-western Benin
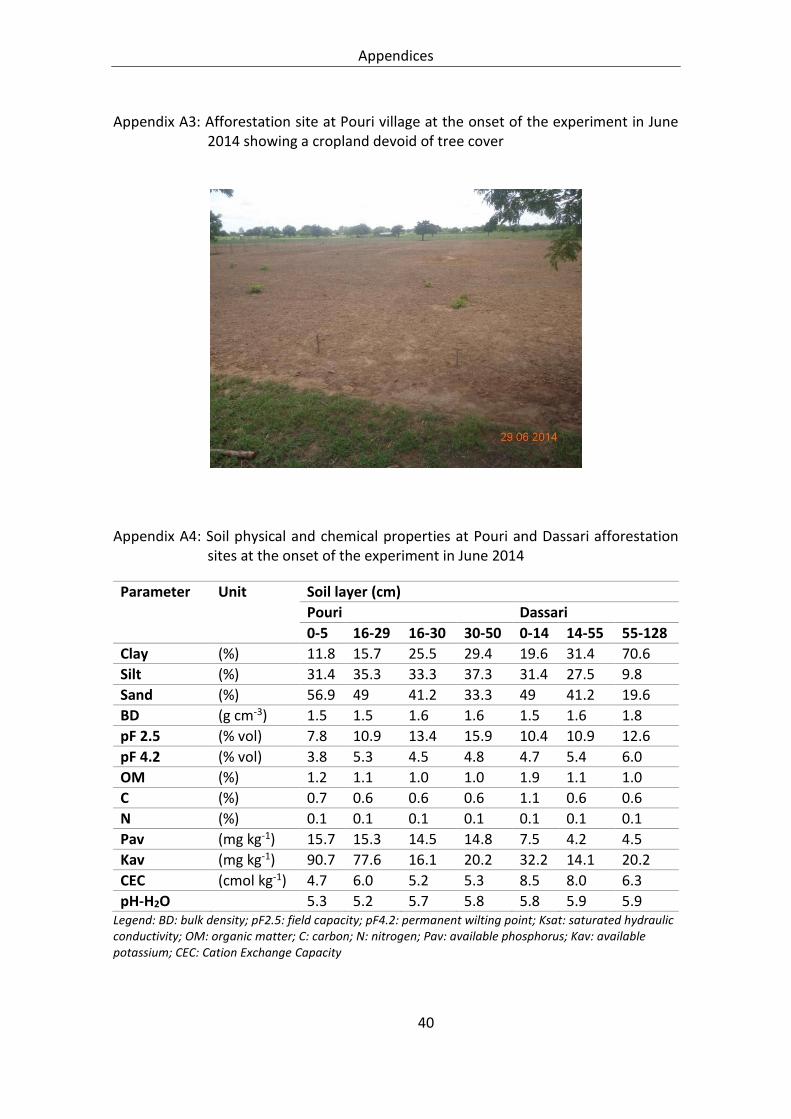
Appendices
40
Appendix A3: Afforestation site at Pouri village at the onset of the experiment in June 2014 showing a cropland devoid of tree cover
Appendix A4: Soil physical and chemical properties at Pouri and Dassari afforestation sites at the onset of the experiment in June 2014
Parameter Unit Soil layer (cm)
Pouri Dassari
0-5 16-29 16-30 30-50 0-14 14-55 55-128
Clay (%) 11.8 15.7 25.5 29.4 19.6 31.4 70.6
Silt (%) 31.4 35.3 33.3 37.3 31.4 27.5 9.8
Sand (%) 56.9 49 41.2 33.3 49 41.2 19.6
BD (g cm-3) 1.5 1.5 1.6 1.6 1.5 1.6 1.8
pF 2.5 (% vol) 7.8 10.9 13.4 15.9 10.4 10.9 12.6
pF 4.2 (% vol) 3.8 5.3 4.5 4.8 4.7 5.4 6.0
OM (%) 1.2 1.1 1.0 1.0 1.9 1.1 1.0
C (%) 0.7 0.6 0.6 0.6 1.1 0.6 0.6
N (%) 0.1 0.1 0.1 0.1 0.1 0.1 0.1
Pav (mg kg-1) 15.7 15.3 14.5 14.8 7.5 4.2 4.5
Kav (mg kg-1) 90.7 77.6 16.1 20.2 32.2 14.1 20.2
CEC (cmol kg-1) 4.7 6.0 5.2 5.3 8.5 8.0 6.3
pH-H2O
5.3 5.2 5.7 5.8 5.8 5.9 5.9 Legend: BD: bulk density; pF2.5: field capacity; pF4.2: permanent wilting point; Ksat: saturated hydraulic conductivity; OM: organic matter; C: carbon; N: nitrogen; Pav: available phosphorus; Kav: available potassium; CEC: Cation Exchange Capacity

Appendices
41
Appendix A5: First application of organic manure into the palnting hole around the stem base 2.5 months after planting

Appendices
42
Appendix A6: Experimental layout of afforestation site at Pouri village
Manuring
Leucaena leucocephala
Jatropha curcas
Moringa oleiferaParkia biglobosa
Anacardium occidentale
54m
101.5m
Irrigation
3.5m
3.5m 2m
1m

Appendices
43
Appendix A7: Aerial image showing the 30 plots in the experimental site in Pouri village, north-western Benin
Source: Google Earth Imagery (2018)

Appendices
44
Appendix A8: Afforestation site at Pouri village 15 months after planting, showing sapling of tree species Moringa oleifera (top) and Jatropha curcas (bottom)

Appendices
45
Appendix B: The scientific articles (Noulèkoun et al. 2017a, b, 2018a, b) in their published form along with their related supplementary materials:
1. Noulèkoun F, Lamers JPA, Naab J, Khamzina A (2017a) Shoot and root responses of
woody species to silvicultural management for afforestation of degraded croplands
in the Sudano-Sahelian zone of Benin. Forest Ecology and Management 385:254–
263. doi.org/10.1016/j.foreco.2016.11.018
2. Noulèkoun F, Khamzina A, Naab J, Lamers JPA (2017b) Biomass allocation in five
semi-arid afforestation species is driven mainly by ontogeny rather than resource
availability. Annals of Forest Science 74:78. doi:10.1007/s13595-017-0676-4
3. Noulèkoun F, Naab J, Lamers JPA, Baumert S, Khamzina A (2018a) Sapling biomass
allometry and carbon content in five afforestation species on marginal farmland in
semi-arid Benin. New Forests 49(3):363-382. doi.org/10.1007/s11056-017-9624-2
4. Noulèkoun F, Khamzina A, Naab J, Khasanah N, van Noordwijk M, Lamers JPA
(2018b) Climate change sensitivity of multi-species afforestation in semi-arid Benin.
Sustainability 10(6):1-23. doi:10.3390/su10061931

Forest Ecology and Management 385 (2017) 254–263
Contents lists available at ScienceDirect
Forest Ecology and Management
journal homepage: www.elsevier .com/ locate/ foreco
Shoot and root responses of woody species to silvicultural managementfor afforestation of degraded croplands in the Sudano-Sahelian zone ofBenin
http://dx.doi.org/10.1016/j.foreco.2016.11.0180378-1127/� 2016 Elsevier B.V. All rights reserved.
⇑ Corresponding author.E-mail address: [email protected] (A. Khamzina).
Florent Noulèkoun a, John P.A. Lamers a, Jesse Naab b, Asia Khamzina c,⇑aCenter for Development Research (ZEF), Bonn University, Walter-Flex-Strabe 3, 53113 Bonn, GermanybWASCAL Competence Center, 06 P.O. Box 9507, Ouagadougou, Burkina FasocDiv. Environmental Science and Ecological Engineering, Korea University, 145 Anam-Ro, Seongbuk-Gu, Seoul 02841, Republic of Korea
a r t i c l e i n f o
Article history:Received 28 September 2016Received in revised form 8 November 2016Accepted 9 November 2016
Keywords:Jatropha curcasSurvival rateTrait plasticityRelative growth rateRooting depthWest Africa
a b s t r a c t
In the Sudano-Sahelian zone of West Africa, where deforestation and cropland soil degradation occur atalarming rates, the (re-)introduction of trees on degraded lands can improve and sustain farming systemsand landscapes. The shoot and root morphological traits of five woody species introduced to degradedcropland were assessed with a particular focus on the survival, early establishment and growth of sap-lings subjected to manuring (1 kg per plant) and drip irrigation (0.5 L of water per plant per day).Functional traits of the woody above- and belowground organs of field-grown plants were monitoredfor the first 15 months after planting, covering two growing (rainy) seasons and one dry season. The highsurvival rate (>60%), combined with a very low incidence rate (<1%), for all species was evidence of suc-cessful establishment overall. The highest survival rates (94–100%) were observed in Jatropha curcas L.,Leucaena leucocephala Lam. and Moringa oleifera Lam. The mortality rate of the most drought-sensitivespecies Parkia biglobosa Jacq. could be reduced ten-fold through supplemental irrigation during the dryseason. The fast-growing L. leucocephala, M. oleifera and J. curcas had higher values for shoot-level traitsthan did the slow-growing Anacardium occidentale L. and P. biglobosa. Fertilization and irrigationenhanced the shoot growth of both the fast and slow growers during the dry and growing seasons. In con-trast, belowground development was either increased or reduced by fertilization and irrigation duringthe growing and dry seasons, but the slow growers demonstrated a more plastic response to these treat-ments than did the fast growers. Among the studied traits, the relative growth rate of plant as a whole(i.e. shoots and roots combined) exhibited the greatest plastic response to resource availability, thus sug-gesting its application in screening candidate species for afforestation efforts. Overall, the five studiedspecies were considered suitable for the afforestation of degraded croplands, while the early growthand establishment of saplings could be boosted by irrigation and a supply of manure.
� 2016 Elsevier B.V. All rights reserved.
1. Introduction
With increasing severity and to an increasing extent, croplanddegradation in sub-Saharan Africa has become a major threat tofood security, environmental health, and human well-being, par-ticularly in the drylands (Adams and Eswaran, 2000; Eswaranet al., 2001; Bai et al., 2008). To counterbalance this and ease grow-ing food deficits, the farming population is forced to place morepressure on existing land resources, including marginal croplandsthat are ill-suited for agriculture, thus accelerating environmental
degradation and lowering agroecosystem productivity (Vlek et al.,2008).
Reforestation, afforestation, and tree-based farming with multi-purpose tree species have been recognized worldwide as a meansto reverse land degradation and sustain agricultural systems(Chamshama and Nduwayezu, 2002; Garrity et al., 2010;Khamzina et al., 2012). For instance, Jatropha curcas L., a biofuelcrop, has been extensively propagated to reclaim wastelands andrestore soil productivity on marginal lands in the semi-arid tropics,although with variable success (Francis et al., 2005; Reubens et al.,2011; Baumert and Khamzina, 2015). The cultivation of nitrogen-fixing tree species, such as Faidherbia albida Del. and Leucaenaleucocephala Lam., has been widely promoted to replenish soilnitrogen and alleviate fodder deficits (Orwa et al., 2009; Garrity

F. Noulèkoun et al. / Forest Ecology and Management 385 (2017) 254–263 255
et al., 2010; SPORE, 2015; Noulèkoun et al., 2016). Species with ahigh commercial value, such as Moringa oleifera Lam., Anacardiumoccidentale L. and Parkia biglobosa Jacq., have been advocated foruse in afforestation (Edinger and Kaul, 2003), but empirical studieson their viability on degraded lands remain scarce.
Practical recommendations regarding the choice of tree spe-cies capable of productive growth on degraded croplands, whichare characterized by water and nutrient limitations, may bemore reliable with a better understanding of the functionaltraits, resource use strategies, and phenotypic plasticity of candi-date tree species. Reich (2014) postulated the coordination ofplant growth traits and resource use; rapidly acquiring a givenresource at any organ level requires the same for other resourcesat the same organ level. This coordinated trade-off betweenfunctional traits and resource use results in fast- and slow-growing plants (Reich, 2014). The fast growers are exploitativeresource competitors and show a more plastic response toincreased resource availability than do slow growers. In contrast,slow growers pursue a more conservative resource use strategy,which allows them to maintain growth under resource-poor con-ditions (Reich et al., 2003b; Reich, 2014). Therefore, understand-ing the response of plants to the supply of resources involves aconsideration of the ‘fast-slow’ plant economics spectrum whichin turn will support the assessment of site-specific silviculturalpractices aimed at the establishment of tree plantations onunproductive cropland (Aerts et al., 2007; Khamzina et al.,2008; Reubens et al., 2009).
When analyzing plant functional traits to understand the dif-ferences in growth responses to resource gradients (Chapin et al.,1993; Barbosa et al., 2014), rather than focusing on abovegroundtraits only, a whole-plant perspective is needed becauseresponses might differ above- and belowground (e.g. Khamzinaet al., 2016). For instance, variations in aboveground morpholog-ical traits related to leaves or shoots are primarily a response todifferences in light interception and the assimilation of carbon,whereas morphological changes in the roots are usuallyresponses to water and nutrient availability (Funk et al., 2007;Valladares and Niinemets, 2008; Coyle et al., 2016). The extentand pattern of changes in functional traits in response toresource availability (e.g., water, nutrients, and light) are com-monly assumed to accord with the functional equilibrium theory,which assumes that plants allocate relatively more resources toorgans that aid in the acquisition of the most limiting resource(Brouwer, 1963; Poorter et al., 2012). Because the evidence forthis growth theory predominantly stems from (very) short-term studies, usually conducted in greenhouses and under artifi-cial conditions to reduce complexity (Shipley, 2000), it is ques-tionable whether these findings apply to woody species overtime and in the field (Sack and Grubb, 2001).
Given the inherent risks for smallholder farmers on sub-Saharan African drylands who invest in afforestation, we exam-ined the functional traits of multi-purpose tree species for whichthere had been little or mixed empirical evidence to date regard-ing their suitability for planting on degraded lands. Thus, in ana-lyzing the shoot- and root-level morphological traits of fivecandidate species on degraded cropland in the Sudano-Sahelianzone of West Africa, we aimed to (i) assess plant establishmentand growth characteristics on nutrient-poor and water-limitedsoil, (ii) identify and explain species-specific responses to silvi-cultural management practices, including supplemental irrigationand manuring during the growing and dry seasons, and (iii)identify species functional traits that may serve as a proxy forlonger-term growth trends. On this basis, we identified thosetree species and silvicultural management approaches that weremost appropriate for use in the afforestation of degradedcroplands.
2. Materials and methods
2.1. Study site
The arid Atacora department in northern Benin (Fig. 1) wasselected as the study site because this region has been significantlyaffected by land degradation driven by deforestation and soil nutri-ent mining (Adegbidi et al., 1999; Mulder, 2000), threatening thesustainability of farming systems and exacerbating rural poverty(Saıdou et al., 2003).
The climate in this region is semi-arid, characterized by one dis-tinct rainy season (May to September) with a long-term averageannual rainfall of 987 mm (for 1970–2010) followed by a pro-longed dry season (September–May). Over the 15-month observa-tion period, the annual rainfall was 757 mm in 2014 and 833 mmin 2015, below the long-term annual mean (Fig. 2).
The field experiment was carried out in Pouri village (N10�5408.400 and E 1�4047.400; altitude 186 m.a.s.l) in Atacora(Fig. 1), which was selected following a four week-reconnaissance survey involving local and international forestryexperts and Pouri community members. The selection criteriaincluded (i) cropland impoverishment (judged by low nutrientstocks and crop yields), (ii) homogeneity in site conditions, (iii) siteaccessibility for regular measurements, and (iv) willingness of landowners to participate in the experiment and allocate croplands forafforestation. The area was savanna forest prior to being clear cutand then cropped with a successional three-year intercrop of eithersorghum and cowpea or maize followed by yam for about a decade.Inorganic fertilizer was applied only during the maize-cowpeaintercropping period.
The experiment was conducted on epipetric plinthosol (WRB,2006) typified by a sandy-loam texture in the topsoil and clayey-loam in deeper profiles. The soil was limited to a depth of 50 cmby lateritic concretion and characterized by low water holdingcapacity, a low concentration of NPK, low cation exchange capacity(CEC), and relatively high acidity (Supporting InformationTable S1).
2.2. Tree species and experimental design
Five woody species (Table 1) were selected due to theirreported stress tolerance and socio-economic importance for thecommunities, as determined by a search of the literature, focusgroup discussions in the community, and an inventory of dominanttree species in the study region. All species are deciduous or semi-deciduous and have a habitat range within (sub) tropical climaticzones (Table 1).
Planting material for the woody species was obtained from aforest nursery near the experimental site where seedlings weregrown in polyethylene tubes (ø 5 cm, 15 cm deep) filled with asubstrate of local soil mixed with organic material. The seedlingswere not fertilized. In July 2014, tree seedlings with an age of2.5–4 months, were transplanted from the nursery to the experi-mental plots. During planting, the polyethylene tube was removed,but the substrate left attached to the roots.
Prior to planting, the site was cleared of sparse woody vegeta-tion, ploughed, levelled, and fenced. The experiment compared acontrol treatment (with neither irrigation nor fertilization) withtree species performance under irrigation and fertilization. Thespecies and irrigation treatments were arranged according to afully factorial design with three repetitions whilst the manureapplication was introduced as a nested factor. The trial thus hada total of 30 plots (including the control plots) of 12 � 8 m2, eachcontaining 48 seedlings at a 2 m � 1 m spacing. The stand densityat planting was thus 5000 trees ha�1.

Fig. 1. Map of the climate zones and phyto-geographical districts of Benin showing the location of the afforestation site in Atacora department.
020406080100
01020304050
Air t
empe
ratu
re, T
(°C)
Rainfall Max T Min T
200
400300
Rain
fall
(mm
)
1st evaluation 2nd evaluation 3rd evaluation
1st growing season 1st dry season 2nd growing season
Fig. 2. Minimum and maximum ambient temperatures and seasonal rainfall during the study period (July 2014–December 2015) and indicated timings of plant traitevaluation.
256 F. Noulèkoun et al. / Forest Ecology and Management 385 (2017) 254–263

Table 2Variables used for the growth and morphological analyses.
Name of variable Abbreviation Unit
Relative growth rate in total biomass RGRW g g�1 month�1
lnðW2Þ � lnðW1Þ� �
/(T2 � T1)
Relative growth rate in diameter RGRD cm cm�1
month�1lnðD2Þ � lnðD1Þ
� �/(T2 � T1)
Relative growth rate in height RGRH m m�1 month�1
lnðH2Þ � lnðH1Þ� �
/(T2 � T1)
Relative growth rate in rooting depth RGRRD m m�1 month�1
lnðRD2Þ � lnðRD1Þ� �
/(T2 � T1)
Relative growth rate in lateral rootextension
RGRRE m m�1 month�1
lnðRE2Þ � lnðRE1Þ� �
/(T2 � T1)
Table 1Characteristics of the tree species included in the afforestation trial and plant size (n = 10 for each species) at the onset of the experimentation (MaP = 0) in July 2014. The droughttolerance ranking is based on an agroforestry database (Orwa et al., 2009). Inherent growth rate ranking is based on the Useful Tropical Plants Database (Fern, 2014)1, Edinger andKaul (2003)2 and Maes et al. (2009)2.
Species Family Common name Drought tolerance Inherent growth rate D H RD RE
Moringa oleifera (Lam.) Moringaceae Drumstick tree Tolerant Fast1 0.54c 0.45a 0.12c 0.05aJatropha curcas (L.) Euphorbiaceae Physic nut Very tolerant Fast2 0.99a 0.39a 0.12c 0.06aLeucaena leucocephala (Lam.) Fabaceae Leucaena Tolerant Fast1 0.38d 0.30b 0.17a 0.06aAnacardium occidentale (L.) Anacardiaceae Cashew Tolerant Slow1 0.78b 0.41a 0.17a 0.07aParkia biglobosa (Jacq.) Fabaceae African locust bean Intermediate Medium1 0.45 cd 0.27b 0.13b 0.08a
D: basal diameter (cm); H: height (m); RD: root depth (m); RE: maximum extent of lateral roots (m).One-way ANOVA was used to identify trait differences between the tree species.Means with a different letter within a column are significantly different at p < 0.05 according to the LSD post hoc test.
F. Noulèkoun et al. / Forest Ecology and Management 385 (2017) 254–263 257
Supplemental irrigation was implemented during the dry seasononly using an adapted drip irrigation system consisting of perfo-rated plastic bottles positioned ca. 15 cm next to each plant(Noulèkoun, 2017, in preparation). The saplings were irrigated ata rate satisfying 30% of the evaporative demand (equal to 0.5 L ofwater per sapling per day). In total, the saplings received105.5 mm during the dry season (November 2014–May 2015),including 5 rainfall events amounting to 33 mm. Water was notsupplied after the dry season to allow the post-irrigation effectson plants to be evaluated.
Fertilizer (manure) was applied 2.5 and 11 months after plant-ing (MaP), each time at a weight of 1 kg per plant. A hole of20 � 20 cm and 10 cm deep was dug around the plants and filledwith manure. The manure contained on average 18.7% carbon,1.2% nitrogen, and 0.8% phosphorus.
W: dry weight (g), D: basal diameter (cm); H: height (m); RD: root depth (m); RE:maximum extent of lateral roots (m), T: time (months). Subscripts refer to initialand final harvest.
2.3. Monitoring plant survival and growth traits
Just before transplanting the seedlings from the nursery to theplots, ten representative seedlings of each species were randomlychosen to determine the mean reference values for all relevantmorphological traits monitored during the study period (Table 1).
Seedling survival was assessed every fortnight by counting thenumber of living plants per plot. Dead plants were not replaced.At the beginning and end of the 2014 and 2015 growing seasons(i.e. 5, 11 and 15 MaP; Fig. 2), the height and diameter of 4–6 ran-domly selected trees per experimental plot were measured andconsequently harvested. The entire root systems were excavatedwith hand tools. Border plants were excluded from this due topotential edge effects.
Tree height (H, m), i.e. the length of the highest shoot from theground to the top was measured with a measuring tape. The diam-eter of the stem base (D, cm) was measured by taking the averageof two diameter measurements (the longest and the shortest)using a digital calliper. When ramification had occurred at the stembase, the diameter was computed according to Baumert andKhamzina (2015):
D ¼ffiffiffiffiffiffiffiffiffiffiffiffiffiffiffiffiffiffiffiffiffiXni¼1
ððdiÞ2Þvuut ð1Þ
where i represents the number of ramified stems measured at thestem base.
The maximum extent of the lateral roots (RE, m) was deter-mined by measuring the length of the longest lateral root outwardfrom the plant center using a measuring tape (Pérez-Harguindeguyet al., 2013). Rooting depth (RD, m) was measured following exca-vation. The foliage, shoots (stem and branches) and roots (coarseand fine fractions) were weighed separately with a portable scaleand dried at 75 �C until they reached a constant weight. Conse-quently, the dry weights of all shoot and root fractions were deter-
mined and summed to obtain whole-plant biomass (W, g). Onlywoody above- and belowground fractions are reported in thisstudy (Table 3) due to the focus on water and nutrient resourcelimitations and because we intended to identify indicators whichcan be more easily measured and understood by practitioners.
2.4. Data analyses
The classical approach involving harvest-interval calculationswas used for the growth analyses (Evans, 1972). Due to the inher-ent bias in Grime and Hunt’s (1975) equation for computing rela-tive growth rate (RGR) based on the destructive harvest ofseveral individuals, the relationship suggested by Hoffmann andPorter (2002) was used to estimate the RGR for the morphologicaltraits (Table 2):
RGRx ¼ lnðX2Þ � lnðX1ÞT2 � T1
ð2Þ
where RGRx is the relative growth rate, X1 and X2 are the values of
the measured trait at times T1 and T2, and lnðX2Þ and lnðX1Þ are themeans of the natural logarithm-transformed measured values attimes T1 and T2.
All statistical analyses were performed with STATA 14(StataCorp., 2015). Kaplan-Meier survival analysis was used to esti-mate seedling survival curves (Kaplan and Meier, 1958). Throughthe log rank test, the equality of the survival functions betweenspecies was assessed. Harvested plants were considered missingvalues when estimating species-specific survival rates.
A linear mixed-effects model was used to assess differences inplant growth performance with respect to fertilization and supple-mental irrigation, as well as their interaction. Because irrigationwas applied during the dry season only, a separate model was used

Table 3Significance levels (P < 0.05) of shoot (D, H, RGRD, RGRH) and root (RD, RE, RGRRD, RGRRE) traits by species, fertilization, irrigation, and their interaction effects for three assessmentperiods over the first 15 months after tree planting (MaP).
Shoot-level traits
Basal diameter (D) Height (H) Relative growth rate indiameter (RGRD)
Relative growth rate inheight (RGRH)
5 MaP 11 MaP 15 MaP 5 MaP 11 MaP 15 MaP 5 MaP 11 MaP 15 MaP 5 MaP 11 MaP 15 MaP
Species <0.001 <0.001 <0.001 <0.001 <0.001 <0.001 <0.001 <0.001 <0.001 <0.001 <0.001 <0.001Fertilization (manure) <0.001 <0.05 <0.001 <0.01 n.s. <0.001 <0.001 <0.001 <0.001 <0.01 <0.01 <0.001Irrigation (drip) n/a n.s. n.s. n/a n.s. n.s. n/a n.s. n.s. n/a n.s. <0.05Species � fertilization <0.05 <0.01 n.s. n.s. n.s. n.s. n.s. <0.001 n.s. n.s. n.s <0.01Species � irrigation n/a n.s. <0.001 n/a n.s. <0.05 n/a n.s. <0.01 n/a <0.01 <0.01Species � fertilization � irrigation n/a <0.01 n.s. n/a <0.05 n.s. n/a <0.001 n.s. n/a <0.05 <0.001Time <0.001 <0.001 <0.001 <0.001Time � species <0.001 <0.001 <0.001 <0.001Time � fertilization <0.001 <0.05 <0.001 <0.01Time � irrigation n.s. n.s. n.s. n.s.
Root-level traits
Rooting depth (RD) Maximum extent of lateralroots (RE)
Relative growth rate inrooting depth (RGRRD)
Relative growth rate inlateral root extension (RGRRE)
5 MaP 11 MaP 15 MaP 5 MaP 11 MaP 15 MaP 5 MaP 11 MaP 15 MaP 5 MaP 11 MaP 15 MaP
Species <0.001 <0.001 <0.001 <0.001 <0.001 <0.001 <0.001 <0.001 <0.001 <0.001 n.s. <0.001Fertilization (manure) n.s. n.s. n.s. n.s. <0.001 n.s. n.s. n.s. n.s. n.s. <0.05 n.s.Irrigation (drip) n/a <0.001 n.s. n/a n.s. n.s. n/a <0.001 <0.01 n/a n.s. n.s.Species � fertilization n.s. n.s. n.s. <0.001 <0.001 n.s. n.s. n.s. n.s. <0.001 <0.01 n.s.Species � irrigation n/a n.s. n.s. n/a n.s. <0.01 n/a n.s. n.s. n/a n.s. <0.001Species � fertilization � irrigation n/a n.s. n.s. n/a <0.001 <0.01 n/a n.s. n.s. n/a <0.01 <0.01Time <0.001 <0.001 <0.001 <0.001Time � species <0.001 <0.001 <0.001 <0.001Time � fertilization n.s. <0.01 n.s. n.s.Time � irrigation <0.01 n.s. <0.05 n.s.
n.s. = not significant; n/a = not applicable.5 MaP covers the first growing season; during the dry season (5–11 MaP) supplemental irrigation was applied; 11–15 MaP covers the second growing season.
258 F. Noulèkoun et al. / Forest Ecology and Management 385 (2017) 254–263
for each of the three evaluation periods: 0–5 MaP, 5–11 MaP, and11–15 MaP. The random terms in the model were plot identityand fertilization (nested within plots), whereas species, fertiliza-tion, and irrigation were the fixed terms. Furthermore, themixed-model was run by adding time to the fixed factors to assessthe trend in plant responses over the assessment period. To controlfor any deviation from the assumption of normality in the testedvariables, the robust variance estimates (robust) and unstructuredcovariance options in STATA (StataCorp., 2015) were used in themixed-model.
Because the seedlings differed in their initial age (MaP = 0), ageat transplantation was introduced into the model as a covariatecontrolling for the possible effect of age differences on plant per-formance. The inclusion of initial age only had significant effectson tree height. Additional covariates (the initial values of D, H,RD and RE) were checked, but due to the lack of significance, theywere omitted from the final model.
Differences in mean RGR between functional groups do not nec-essarily equate to simple and consistent differences in any singletrait or set of traits (Reich et al., 2003a). Thus, to rank the studiedspecies based on their growth rates, the RGR of whole-plant bio-mass (RGRw) between the initial and final harvest was used insteadof the RGR of D (RGRD), H (RGRH), RD (RGRRD) and RE (RGRRE). AnANOVA was run to test for equality in the means of RGRw betweenspecies.
An ANOVA was also employed to evaluate differences in traitplasticity, quantified as the coefficient of variation (CV, calculatedas the standard deviation over the mean) between treatments (fer-tilization and irrigation) and assessment periods (Siebenkäs et al.,2015), for morphological traits at the shoot- (D, H, RGRD and RGRH)and root- (RD, RE, RGRRD and RGRRE) level, as well as between spe-cies. Unless stated otherwise, the mean values presented are fromthe original data and expressed per tree. The estimated least signif-icance difference (LSD) is reported in this study to facilitate multi-
ple comparisons of the means in which significant treatmenteffects at a 5% level of significance are identified.
3. Results
3.1. Plant survival
The survival curves significantly differed between the five spe-cies (chi2 (4) = 233.79; p < 0.001). The overall incidence rate, whichis the measure of the frequency with which mortality occurs in agiven population and in a defined time period, was very low(0.7%, i.e. only seven dead plants would be expected in 1000 treesover 15-month period). Apart from J. curcas, which experienced nomortality over this period, the survival curves for all other speciesexhibited a decreasing trend over time (Fig. 3).
For the remaining four species, peaks in mortality wereobserved at 0.5, 6, and 7.5 MaP, with several moderate mortalitypeaks that were species-specific (Fig. 3). At 15 MaP, high overallsurvival rates were recorded for L. leucocephala (98%) and M. olei-fera (94%), whereas A. occidentale had a moderate survival rate of87%. The decline in survival over time was most pronounced inP. biglobosa, which had the lowest survival rate (67%) and severalmortality peaks. Except for M. oleifera, no mortality was recordedduring the second growing season. Supplemental irrigation signif-icantly increased the survival of P. biglobosa saplings (P = 0.014,data not shown), for which the mortality rate at 11 MaP was tentimes higher in non-watered plots.
3.2. Species performance
The RGRw for the entire study period was significantlyhigher for L. leucocephala, M. oleifera and J. curcas compared toA. occidentale and P. biglobosa (Fig. 4). Of the three fast-growing
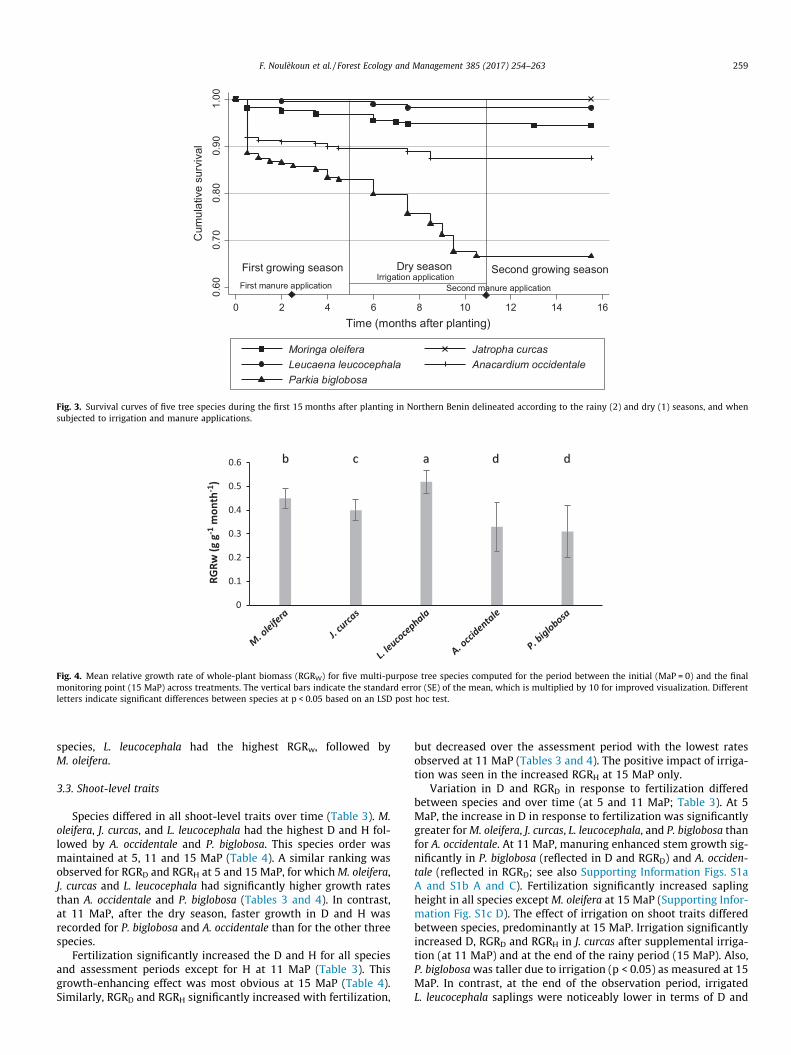
First manure application Second manure applicationIrrigation application
First growing season Dry season Second growing season
0.60
0.70
0.80
0.90
1.00
Cum
ulat
ive
surv
ival
0 2 4 6 8 10 12 14 16Time (months after planting)
Moringa oleifera Jatropha curcasLeucaena leucocephala Anacardium occidentaleParkia biglobosa
Fig. 3. Survival curves of five tree species during the first 15 months after planting in Northern Benin delineated according to the rainy (2) and dry (1) seasons, and whensubjected to irrigation and manure applications.
b c a d db c a d d
0
RGRw
(g g
-1 m
onth
-1)
0.1
0.2
0.3
0.4
0.5
0.6
Fig. 4. Mean relative growth rate of whole-plant biomass (RGRW) for five multi-purpose tree species computed for the period between the initial (MaP = 0) and the finalmonitoring point (15 MaP) across treatments. The vertical bars indicate the standard error (SE) of the mean, which is multiplied by 10 for improved visualization. Differentletters indicate significant differences between species at p < 0.05 based on an LSD post hoc test.
F. Noulèkoun et al. / Forest Ecology and Management 385 (2017) 254–263 259
species, L. leucocephala had the highest RGRw, followed byM. oleifera.
3.3. Shoot-level traits
Species differed in all shoot-level traits over time (Table 3). M.oleifera, J. curcas, and L. leucocephala had the highest D and H fol-lowed by A. occidentale and P. biglobosa. This species order wasmaintained at 5, 11 and 15 MaP (Table 4). A similar ranking wasobserved for RGRD and RGRH at 5 and 15 MaP, for whichM. oleifera,J. curcas and L. leucocephala had significantly higher growth ratesthan A. occidentale and P. biglobosa (Tables 3 and 4). In contrast,at 11 MaP, after the dry season, faster growth in D and H wasrecorded for P. biglobosa and A. occidentale than for the other threespecies.
Fertilization significantly increased the D and H for all speciesand assessment periods except for H at 11 MaP (Table 3). Thisgrowth-enhancing effect was most obvious at 15 MaP (Table 4).Similarly, RGRD and RGRH significantly increased with fertilization,
but decreased over the assessment period with the lowest ratesobserved at 11 MaP (Tables 3 and 4). The positive impact of irriga-tion was seen in the increased RGRH at 15 MaP only.
Variation in D and RGRD in response to fertilization differedbetween species and over time (at 5 and 11 MaP; Table 3). At 5MaP, the increase in D in response to fertilization was significantlygreater forM. oleifera, J. curcas, L. leucocephala, and P. biglobosa thanfor A. occidentale. At 11 MaP, manuring enhanced stem growth sig-nificantly in P. biglobosa (reflected in D and RGRD) and A. occiden-tale (reflected in RGRD; see also Supporting Information Figs. S1aA and S1b A and C). Fertilization significantly increased saplingheight in all species except M. oleifera at 15 MaP (Supporting Infor-mation Fig. S1c D). The effect of irrigation on shoot traits differedbetween species, predominantly at 15 MaP. Irrigation significantlyincreased D, RGRD and RGRH in J. curcas after supplemental irriga-tion (at 11 MaP) and at the end of the rainy period (15 MaP). Also,P. biglobosawas taller due to irrigation (p < 0.05) as measured at 15MaP. In contrast, at the end of the observation period, irrigatedL. leucocephala saplings were noticeably lower in terms of D and

Table 4Effect of tree species, fertilization, and irrigation on the shoot (D, H, RGRD, RGRH) and root (RD, RE, RGRRD, RGRRE) traits of five tree species for three assessment periods over thefirst 15 months after planting (MaP). Means are expressed per tree, with an initial stand density of 5000 stems ha�1.
Factors Variables Shoot-level traits
Basal diameter (D, cm) Height (H, m) Relative growth rate indiameter (RGRD, cm cm�1
month�1)
Relative growth rate in height(RGRH, m m�1 month�1)
5 MaP 11 MaP 15 MaP 5 MaP 11 MaP 15 MaP 5 MaP 11 MaP 15 MaP 5 MaP 11 MaP 15 MaP
Species M. oleifera 4.55a 3.99b 6.90a 2.29a 2.59a 3.79a 0.56a 0.002c 0.135a 0.428a 0.021b 0.093bJ. curcas 4.39a 4.32a 6.80a 1.08c 1.13c 1.44c 0.37b 0.004c 0.106cb 0.259b 0.010c 0.057cL. leucocephala 2.69b 2.68c 4.41b 1.85b 1.83b 3.05b 0.48c 0.013b 0.118ba 0.441a 0.009c 0.127aA. occidentale 1.82c 2.57c 3.79c 0.75d 1.01d 1.36c 0.20d 0.053a 0.096cb 0.137c 0.046a 0.074cbP. biglobosa 0.84d 1.51d 2.32d 0.33e 0.43e 0.80d 0.14e 0.083a 0.083c 0.045d 0.043a 0.138a
Fertilization No fertilization 2.91b 3.10b 4.86b 1.30b 1.46a 2.10b 0.36b 0.022b 0.093b 0.273b 0.020b 0.084bFertilization 3.15a 3.16a 5.51a 1.38a 1.48a 2.32a 0.38a 0.031a 0.127a 0.289a 0.028a 0.108a
Irrigation No irrigation n/a 3.31a 5.49a n/a 1.58a 2.28a n/a 0.023a 0.108a n/a 0.019a 0.090bIrrigation n/a 2.98a 4.95a n/a 1.38a 2.15a n/a 0.030a 0.111a n/a 0.027a 0.101a
Root-level traits
Rooting depth (RD, m) Maximum extent of lateralroots (RE, m)
Relative growth rate in rootingdepth (RGRRD, m m�1
month�1)
Relative growth rate in lateralroot extension (RGRRE, m m�1
month�1)
5 MaP 11 MaP 15 MaP 5 MaP 11 MaP 15 MaP 5 MaP 11 MaP 15 MaP 5 MaP 11 MaP 15 MaP
Species M. oleifera 0.34d 0.51cb 0.47d 1.15b 1.17b 1.62c 0.271bc 0.058 a 0.008b 0.026d 0.014ab 0.079cJ. curcas 0.46b 0.56b 0.57c 1.27b 1.18b 1.83b 0.323a 0.032b 0.017b 0.748b 0.007b 0.099bL. leucocephala 0.52a 0.65a 0.76a 1.69a 1.81a 2.41a 0.264b 0.038b 0.038a 0.803a 0.018ab 0.068dA. occidentale 0.40c 0.46dc 0.56c 0.70c 0.64c 1.05d 0.191d 0.026b 0.048a 0.518c 0.017ab 0.122bP. biglobosa 0.48ba 0.44d 0.66b 0.67d 0.89cb 1.75cb 0.293c 0.005c 0.092c 0.450c 0.049a 0.156a
Fertilization No fertilization 0.43a 0.51a 0.60a 1.12a 1.25a 1.80a 0.266a 0.030a 0.038a 0.516a 0.023a 0.108aFertilization 0.44a 0.55a 0.60a 1.15a 1.09b 1.70a 0.271a 0.037a 0.035a 0.511a 0.015b 0.093a
Irrigation No irrigation n/a 0.58a 0.58a n/a 1.23a 1.77a n/a 0.045a 0.027b n/a 0.019a 0.092aIrrigation n/a 0.49b 0.62a n/a 1.13a 1.74a n/a 0.024b 0.045a n/a 0.019a 0.108a
n/a = not applicable. For each group of traits (shoot or root), the means with the same superscript within the same column are not significantly different at p < 0.05 betweenthe species.5 MaP covers the first growing season; during the dry season (5–11 MaP) supplemental irrigation was applied; 11–15 MaP covers the second growing season.
260 F. Noulèkoun et al. / Forest Ecology and Management 385 (2017) 254–263
RGRD compared to their non-watered counterparts (SupportingInformation Figs. S2a A and S2b A and C).
The combined effects of fertilization and irrigation on shoottraits varied between species, mainly at 11 MaP (Table 3). As a gen-eral trend, the highest values for these traits were observed in sap-lings that were both fertilized and irrigated (data not shown).
3.4. Root-level traits
The species differed significantly in all their root-level traitsacross the three assessment periods and silvicultural treatmentsexcept for RGRRE at 11 MaP (Table 3). L. leucocephala had the largestRE and RD overall, whereas variation between the other specieswas inconsistent, differing for RE, RD RGRRD and RGRRE (Table 4).
Fertilization and irrigation either enhanced or reduced rootgrowth depending on the species and on the observation period(Tables 3 and 4). For all species, fertilization significantly decreasedplant root elongation as measured by RE and RGRRE, whereaswatering reduced rooting depth (RD and RGRRD) in saplings at 11MaP (Table 4). At 5 MaP, greater root elongation (RE) was observedin manured P. biglobosa saplings but fertilization reduced RE andRGRRE in A. occidentale (p < 0.05). Root elongation decreased signif-icantly in M. oleifera- and P. biglobosa-manured saplings at 11 MaP(Supporting Information Figs. S1a F and H and 1b F). At 15 MaP, REincreased due to supplemental irrigation in M. oleifera, A. occiden-tale and P. biglobosa, but decreased in L. leucocephala (p < 0.05; Sup-porting Information Fig. S2b F). Variations in RD due to fertilizationand irrigation treatments remained the same for all species.
The interaction effects of fertilization and irrigation on rootelongation (RE and RGRRE) differed between species at 11 and 15MaP (Table 3). The smallest RE was observed in fertilized and
watered M. oleifera saplings, while the largest RE and RGRRE wererecorded in unfertilized and irrigated P. biglobosa saplings (datanot shown).
3.5. Intra-specific trait plasticity in response to treatments
Intra-specific trait plasticity differed between the traits, as evi-denced by the coefficient of variation (CV) across treatments(P < 0.001; Fig. 5). However, the difference in intra-specific traitvariation at the shoot level vs. the root level was not significant(P > 0.05). RGR demonstrated the greatest variation in responseto differences in resource availability across the three assessmentperiods, with root-level traits (RGRRD and RGRRE) being the mostplastic. No significant differences between the two classes of treespecies were observed for RGR, but the slow-growing speciesexhibited a greater plastic response in terms of the absolute indi-cators of above- and belowground growth (e.g. D, H and RE) thanthe fast-growers (Fig. 5). The exception was the RD, which wasvery likely restricted by the shallow soil and lateritic concretionat the afforestation site.
4. Discussion
4.1. Effects of nutrient and water supply on trait expression andplasticity
In accordance with earlier findings on tree saplings and seed-lings from temperate and tropical regions (Funk et al., 2007;Barbosa et al., 2014; Coyle and Coleman, 2005) and mature treesfrom temperate areas (Coyle et al., 2016), the supply of nutrientsand water enhanced the development of the shoot traits, as con-

0
0.2
0.4
0.6
0.8
1
1.2
Basa
l dia
met
er
Heig
ht
Rela
tive
grow
th ra
te in
diam
eter
Rela
tuve
gro
wth
rate
inhe
ight
Root
ing
dept
h
Max
imum
ext
ent o
fla
tera
l roo
ts
Rela
tive
grow
th ra
te in
roo�
ng d
epth
Rela
tive
grow
th ra
te in
late
ral r
oot e
xten
sion
Coef
ficie
nt o
f var
iatio
n
Fast-growing Slow-growing
b b ac ac b bc a a
* **
Fig. 5. Coefficient of variation (CV) across treatments and assessment periods as a proxy for the shoot and root level plasticity in response to varying resource availability.Shown are means for five tree species (M. oleifera, J. curcas, L. leucocephala, A. occidentale, and P. biglobosa). Vertical bars indicate the standard error (SE) of the mean. Differentletters indicate significant differences between the traits and (⁄) indicates significant differences between fast- and slow growing species, all at p < 0.05 based on an LSD posthoc test.
F. Noulèkoun et al. / Forest Ecology and Management 385 (2017) 254–263 261
firmed by the increased D and H in our trial. In the roots, a smallerRE in fertilized saplings and deeper rooting systems in non-irrigated saplings were observed in response to the treatments(Table 3), the latter trend a well-established belowground adapta-tion to drought stress (Mainiero and Kazda, 2006; Poorter et al.,2012). These findings are consistent with the hypothesis of func-tional resource allocation (Brouwer, 1963; Poorter et al., 2012),given that the saplings invested in root development to aid inthe uptake of limiting resources, i.e. water and nutrients.
Fertilization- or irrigation-driven plastic changes were evidentin all of the traits monitored, but the size of the variation in thesetraits differed between the shoots and the roots. For instance, RGRwas the most plastic characteristic for all species (Fig. 5) and con-sequently can be considered a suitable indicator of the growthpotential and performance of woody species in the long term.The importance of RGR as an early indicator of potential growthperformance has been shown in numerous laboratory studies(e.g. Shipley, 2000) and a few field trials (e.g. Lamers et al.,2006). Our results indicate that the importance of RGR as a func-tional trait persists for woody species in an environment character-ized by limited water and nutrient resources. Intra-specificvariation in RGR was greatest in those root traits related to waterand nutrient uptake (i.e., RD and RE), which could be due to thestrategy of maintaining functional equilibrium at varying levelsof resource availability (Brouwer, 1963; Poorter et al., 2012).
4.2. Species-related responses to nutrient and water supply
We can further describe plant responses to resource availabilityfor two categories of tree species that were able to be identifiedbased on RGR estimates averaged across the entire observationperiod (Fig. 4): (i) fast-growing L. leucocephala, M. oleifera andJ. curcas, and (ii) slow-growing A. occidentale and P. biglobosa. Thefast-growing species were characterized by more pronouncedshoot development compared to the slow growers during bothrainy seasons. However, in the dry season, slow growers exhibitedgreater development aboveground than did the fast growers due tothe conservative use of resources, resulting in the improved perfor-mance of these slow-growing species even when resources arescare (Reich, 2014). The studied species were grouped into fastand slow growers in accordance with their general characteristics,which are summarized in Table 1, as determined by a literaturereview (Edinger and Kaul, 2003; Maes et al., 2009; Fern, 2014).
During both growing seasons, the saplings of the fast-growingspecies invested more in the development of shoot traits undermore fertile (manured) soil conditions. This reflects the high inher-ent plasticity in the shoot traits of these species during the rainy/-growing seasons and supports the hypothesis of exploitativeresource use and better responsiveness to increased nutrient avail-ability according to the ‘fast-slow’ plant economics theory (Chapin,1980; Reich et al., 2003b).
The response of slow-growing A. occidentale and P. biglobosa toorganic fertilization was reflected in both the shoots and roots. Forinstance, non-manured A. occidentale saplings demonstratedgreater RE and RGRRE in the very early stages of growth (5 MaP)but, by the end of the observation period, these plants had greatershoot growth (indicated by greater RGRH) due to an increasednutrient supply. The other slow-grower, P. biglobosa, had greaterRE in manured plots at 5 MaP and in non-manured plots at 11MaP, which was accompanied by elevated shoot growth (RGRH)at 15 MaP. Unlike the fast-growers, these two species investedmore in their root system, a known adaptation to nutrient stress(Khurana and Singh, 2001; Franko et al., 2006), thus demonstratingtheir ability to interact with spatial heterogeneity in soil fertility(Pérez-Harguindeguy et al., 2013) as a measure to acquire morenutrients. Furthermore, both slow-growers were more responsivein their shoot traits (D and RGRD) to manuring during the dry sea-son, evidence of their enhanced plastic response to treatments inboth the shoot- and root level traits compared to the fast-growers (Fig. 5). This is very likely a direct consequence of theirimproved performance under low-resource conditions, as previ-ously suggested (Siebenkäs et al., 2015; Reich, 2014).
Irrigation during the dry season markedly increased the survivalof slow-growing P. biglobosa, but no clear differentiation could bemade between fast and slow growers with regard to the effect ofirrigation on their functional traits. Species responses to water sup-ply were evident in the post-treatment period (11–15 MaP), sug-gesting a time lag; the lasting impact of irrigation was alsoobserved in a drip irrigation trial with trees in arid Uzbekistan(Khamzina et al., 2008). The effect of irrigation was mirrored inthe increased shoot growth in J. curcas and the development of amore extensive rooting system (reflected in RE) in M. oleifera, A.occidentale and P. biglobosa. The greater RE and stem growth (H)observed in non-watered L. leucocephala saplings at 15 MaP maybe considered proof of their sensitivity to drought pre-conditioning, which resulted in improved above- and belowgroundperformance during the second growing season (Vilagrosa et al.,

262 F. Noulèkoun et al. / Forest Ecology and Management 385 (2017) 254–263
2003; Guarnaschelli et al., 2006). In general, the transplantation ofseedlings from the nursery to the field may have caused additionalstress, which is usually reflected in a shift towards increased rootgrowth (Lyr and Hoffmann, 1967).
When all of the factors are considered, we can conclude that, asa consequence of the combined effects of manure and water appli-cation, both slow- and fast-growing woody species stronglyimprove their aboveground development. In contrast, the greatestimprovement belowground was induced by the supply of manureto fast-growing species (e.g.M. oleifera) and water to slow-growingspecies (e.g. P. biglobosa).
4.3. Species choice and silvicultural management for the afforestationof degraded cropland
The judicious selection of multi-purpose tree species for use inthe afforestation of degraded croplands in West Africa demandsawareness of the species’ ability to respond and adapt to the envi-ronmental stress imposed by water and nutrient deficits. Thus,suitable woody species should possess a set of features that allowthem to tolerate these stressors, such as a high survival rate, quickgrowth, and an effective response to the water and nutrient supply.The vigor of five woody species on degraded cropland in NorthernBenin was demonstrated in this paper by their generally (very) lowoverall incidence and high survival rates. In particular, over15 months, J. curcas demonstrated a 100% survival rate, in line withprevious reports, thus underlining the fact that the drought-resistance of this species enables its ready establishment on mar-ginal lands in arid and semi-arid conditions (Francis et al., 2005;Maes et al., 2009; Reubens et al., 2011; Contran et al., 2013). How-ever, failure has been reported when J. curcas plants are directlyseeded in shallow soils with poor water holding capacity (Sopet al., 2012) or in the absence of silvicultural activities during thepost-seedling growth stage (Baumert et al., 2014). The drought-tolerant L. leucocephala, whose seedlings have been reported tosurvive extended periods of dry soil and weather conditions(Shelton and Brewbaker, 1994), demonstrated strong growth inBenin as well. The observed mortality peak at 0.5 MaP for M. olei-fera, A. occidentale, and P. biglobosamay be due to the stress causedby the transplantation of seedlings from the nursery.
Additional mortality peaks occurred during the dry season(Fig. 3), confirming that water stress is a primary cause of seedlingmortality (Khurana and Singh, 2001). In support of previous find-ings (e.g. Bouda et al., 2013), our results found that P. biglobosawas the most susceptible to drought stress, as evidenced by theincreased mortality in non-irrigated plants compared to their irri-gated counterparts. Hence, extending the habitat range of this spe-cies to marginal croplands may be possible through supplementalirrigation. The advantages of irrigation applied during the first dryseason after transplantation have been reported previously (e.g.Aerts et al., 2007) for Olea europaea spp. cuspidata grown insemi-arid, degraded savanna in Ethiopia. However, the adoptionof irrigation practices even for commercially important tree cropsin sub-Saharan Africa can be constrained by socio-political condi-tions and the lack of capital (Baumert et al., 2014).
Given the known investment risks for small-holder farmers,plantations of fast-growing L. leucocephala, J. curcas and M. oleiferamay offer the greatest pay off. These species offer high early sur-vival rates, growth rates, and plasticity in the aboveground organsin the presence of manuring and irrigation, which lower the abioticstresses characteristic of degraded croplands. When manure isinaccessible or not available, planting A. occidentale and P. biglobosais an option because both species exhibited a high plastic responseto resource availability in above- and belowground organs duringboth the dry and rainy seasons. The mixed cultivation of fast andslow growers (e.g. Khamzina et al., 2006) could help diversify the
risks and increase the benefits of tree plantations on degradedcroplands. In this respect, further studies should reveal a longer-term development of the established tree stands as well as man-agement and harvesting approaches, such as thinning and pruningto reduce pest attack, allow for intercropping with cereals, etc.(Garrity et al., 2010; Baumert et al., 2014), that would thereforeenhance benefits from afforestation.
5. Conclusion
This study on the use of functional traits to characterize thegrowth patterns of promising tree species introduced to degradedcroplands and their responsiveness to silvicultural treatments inNorthern Benin found that all five tree species were able to estab-lish under water- and nutrient-limited conditions. Nevertheless,the species differed in survival rate due to their varying responsesto drought, and exhibited differences in shoot and root morpholog-ical traits in the presence of both fertilization and irrigation. Themost common response to the cultivation treatments was theenhanced growth of shoots in both fast- and slow-growing speciesacross the dry and growing seasons, with the slow-growers per-forming better than the fast-growers during the dry season. Thehighest yield potential on degraded croplands was observed inthe fast-growing L. leucocephala, J. curcas and M. oleifera, asreflected in the responsiveness of their aboveground growth to sil-vicultural management. In contrast, the slow-growing A. occiden-tale and P. biglobosa demonstrated greater adaptive ability in theface of nutrient stress. Therefore, a mix of fast and slow growersmay promote the long-term productivity of plantations ondegraded cropland. In particular, the relative growth rate (RGR)of each plant as a whole (i.e. shoots and roots combined) was asuitable indicator of growth performance, thus suggesting its pos-sible application in the selection of tree species to be used inafforestation efforts. As both morphological and physiological pro-cesses determine plant growth, a consideration of those functionaltraits related to carbon assimilation and biomass allocation in thelater growth stages of tree plantations is needed in the future.
Acknowledgements
This study was supported by the German Federal Ministry ofEducation and Research (BMBF) under the programWASCAL (WestAfrican Science Service Center on Climate Change and AdaptedLand Use), project No. 00100218. We acknowledge the technicalsupport of the staff of WASCAL study catchment in Dassari. Specialthanks go to Dr. Nadine Worou who helped with the installation ofthe trial, field assistant Mr. Prudencio Djakpa, the farmer Mr. Saghiwho willingly offered part of his land for the trial, and variouscasual workers for their contributions in the experimentmaintenance.
Appendix A. Supplementary material
Supplementary data associated with this article can be found, inthe online version, at http://dx.doi.org/10.1016/j.foreco.2016.11.018. These data include Google maps of the most important areasdescribed in this article.
References
Adams, C.R., Eswaran, H., 2000. Global land resources in the context of food andenvironmental security. In: Gawande, S.P. (Ed.), Advances in Land ResourcesManagement for the 20th Century. Soil Conservation Society of India, NewDelhi, pp. 35–50, p 655.
Adegbidi, A., Burger, K., Gandonou, E., Mulder, I., 1999. Farmers’ Perceptions andSustainable Land Use in the Atacora, Benin CREED Working Paper 22.

F. Noulèkoun et al. / Forest Ecology and Management 385 (2017) 254–263 263
International Institute for Environment and Development, London, UnitedKingdom.
Aerts, R., Negussie, A., Maes, W., November, E., Hermy, M., Muys, B., 2007.Restoration of dry Afromontane forest using pioneer shrubs as nurse-plants forOlea europaea ssp cuspidata. Restor. Ecol. 15, 129–138.
Bai, Z.G., Dent, D.L., Olsson, L., Schaepman, M.E., 2008. Proxy global assessment ofland degradation. Soil Use Manage. 24 (3), 223–234.
Barbosa, E.R., van Langevelde, F., Tomlinson, K.W., Carvalheiro, L.G., Kirkman, K., deBie, S., Prins, H.H., 2014. Tree species from different functional groups responddifferently to environmental changes during establishment. Oecologia 174 (4),1345–1357.
Baumert, S., Khamzina, A., 2015. Allometric relations in Jatropha curcas productionsystems of Burkina Faso. J. Arid. Environ. 120, 95–104.
Baumert, S., Khamzina, A., Vlek, P.L.G., 2014. Soil carbon sequestration in Jatrophacurcas systems of Burkina Faso. Land Degrad. Dev. http://dx.doi.org/10.1002/ldr.2310.
Bouda, Z., Bayala, J., Markussen, B., Jensen, J., Ræbild, A., 2013. Provenance variationin survival, growth and dry matter partitioning of Parkia biglobosa (Jacq.) R.Br.ex G.Don seedlings in response to water stress. Agrofor. Syst. 87 (1), 59–71.
Brouwer, R., 1963. Some aspects of the equilibrium between over ground andunderground plant parts. Jaarboek van het Instituut voor Biologisch enScheikundig onderzoek aan Landbouwgewassen 1963, 31–39.
Chamshama, S.A.O., Nduwayezu, J.B., 2002. Rehabilitation of Degraded Sub-HumidLands in Sub-Saharan Africa: A Synthesis. Sokoine University of Agriculture,Morogoro, Tanzania.
Chapin, F.S., 1980. The mineral nutrition of wild plants. Annu. Rev. Ecol. Evol. Syst.11, 233–280.
Chapin, F.S., Autumn, K., Pugnaire, F., 1993. Evolution of suites of traits in responseto environmental stress. Am. Nat. 142, S78–S92.
Contran, N., Chessa, L., Lubino, M., Bellavite, D., Roggero, P.D., Enne, G., 2013. State ofthe art of the Jatropha curcas productive chain: from sowing to biodiesel and by-products. Ind. Crop. Prod. 42, 202–215.
Coyle, D.R., Aubrey, D.P., Coleman, M.D., 2016. Growth responses of narrow or broadsite adapted tree species to a range of resource availability treatments after afull harvest rotation. For. Ecol. Manage. 362, 107–119.
Coyle, D.R., Coleman, M.D., 2005. Forest production responses to irrigation andfertilization are not explained by shifts in allocation. For. Ecol. Manage. 208,137–152.
Edinger, R., Kaul, S., 2003. Sustainable mobility: renewable energies for poweringfuel cell vehicles: renewable energies for powering fuel cell vehicles. ABC-CLIO,108–109.
Eswaran, H., Lal, R., Reich, P.F., 2001. Land degradation: an overview. In: Bridges, E.M., Hannam, I.D., Oldeman, L.R., Pening de Vries, F.W.T., Scherr, S.J.,Sompatpanit, S. (Eds.), Responses to Land Degradation. Proc. 2nd.International Conference on Land Degradation and Desertification. OxfordPress, Khon Kaen, Thailand, New Delhi, India.
Evans, G.C., 1972. The Quantitative Analysis of Plant Growth. University ofCalifornia Press, Berkeley, CA, USA.
Fern, K., 2014. Calopogonium caeruleum, Useful Tropical Plants Database <http://tropical.theferns.info/viewtropical.php?id=Calopogonium%20caeruleum>.
Francis, G., Edinger, R., Becker, K., 2005. A concept for simultaneous wastelandreclamation, fuel production, and socio-economic development in degradedareas in India: need, potential and perspectives of Jatropha plantations. Nat.Resour. Forum 29, 12–24.
Franko, J.A., Martinez-Sanchez, J.J., Fernandez, J.A., Banon, S., 2006. Selection andnursery production of ornamental plants for landscaping and xerogardening insemi-arid environments. J. Hortic. Sci. Biotechnol. 81, 3–17.
Funk, J.L., Jones, C.G., Lerdau, M.T., 2007. Leaf-and shoot-level plasticity in responseto different nutrient and water availabilities. Tree Physiol. 27 (12), 1731–1739.
Garrity, D.P., Akkinifesi, F.K., Ajayi, O.C., Weldesemayat, S.G., Mowo, J.G.,Kalinganire, A., Larwanou, M., Bayala, J., 2010. Evergreen agriculture: a robustapproach to sustainable food security in Africa. Food Secur. 2, 197–214.
Grime, J.P., Hunt, R., 1975. Relative growth-rate-Its range and adaptive significancein a local flora. J. Ecol. 63, 393–422.
Guarnaschelli, A.B., Prystupa, P., Lemcoff, J.H., 2006. Drought conditioning improveswater status, stomatal conductance and survival of Eucalyptus globulus subsp.bicostata seedlings. Ann. For. Sci. 63, 941–950.
Hoffmann, W.A., Porter, H., 2002. Avoiding bias in calculations of relative growthrate. Ann. Bot.-Lond. 80, 37–42.
Kaplan, E.L., Meier, P., 1958. Nonparametric estimation from incompleteobservations. J. Am. Stat. Assoc. 53 (282), 457–481.
Khamzina, A., Lamers, J.P., Martius, C., 2016. Above- and belowground litter stocksand decay at a multi-species afforestation site on arid, saline soil. Nutr. Cycl.Agroecosyst. 104 (2), 187–199.
Khamzina, A., Lamers, J.P.A., Vlek, P.L.G., 2008. Tree establishment under deficitirrigation on degraded agricultural land in the lower Amu Darya River region,Aral Sea Basin. For. Ecol. Manage. 255 (1), 168–178.
Khamzina, A., Lamers, J.P.A., Vlek, P.L.G., 2012. Conversion of degraded cropland totree plantations for ecosystem and livelihood benefits. In: Martius, C., Rudenko,I., Lamers, J.P.A., Vlek, P.L.G. (Eds.), Cotton, Water, Salts and Soums – Economicand Ecological Restructuring in Khorezm, Uzbekistan. Springer Science +Business Media, B.V., pp. 235–248.
Khamzina, A., Lamers, J.P.A., Worbes, M., Botman, E., Vlek, P.L.G., 2006. Assessing thepotential of trees for afforestation of degraded landscapes in the Aral Sea Basinof Uzbekistan. Agrofor. Syst. 66, 129–141.
Khurana, E.K.T.A., Singh, J.S., 2001. Ecology of seed and seedling growth forconservation and restoration of tropical dry forest: a review. Environ. Conserv.28 (01), 39–52.
Lamers, J.P.A., Khamzina, A., Worbes, M., 2006. The analyses of physiological andmorphological attributes of 10 tree species for early determination of theirsuitability to afforest degraded landscapes in the Aral Sea Basin of Uzbekistan.For. Ecol. Manage. 221, 249–259.
Lyr, H., Hoffmann, G., 1967. Growth rates and growth periodicity of tree roots. Int.For. Rev. 2, 181–236.
Maes, W.H., Achten, W.M.J., Reubens, B., Raes, D., Samson, R., Muys, B., 2009. Plant-water relationships and growth strategies of Jatropha curcas L. seedlings underdifferent levels of drought stress. J. Arid. Environ. 73, 877–884.
Mainiero, R., Kazda, M., 2006. Depth-related fine root dynamics of Fagus sylvaticaduring exceptional drought. For. Ecol. Manage. 237, 135–142.
Mulder, I., 2000. Soil Degradation in Benin: Farmers’ Perceptions and ResponsesDissertation. Tinbergen Institute, Vrije Universiteit Amsterdam, Amsterdam,Netherlands.
Noulèkoun, F., Birhane, E., Chude, S., Zenebe, A., 2016. Characterization of Faidherbiaalbida (Del.) A. Chev. population in agroforestry parklands in the highlands ofNorthern Ethiopia: impact of conservation, environmental factors and humandisturbances. Agrofor. Syst., 1–13 http://dx.doi.org/10.1007/s10457-016-9910-6.
Orwa, C., Mutua, A., Kindt, R., Jamnadass, R., Anthony, S., 2009. AgroforestreeDatabase: A Tree Reference and Selection Guide Version 4.0. World AgroforestryCentre, Kenya.
Pérez-Harguindeguy, N., Díaz, S., Garnier, E., et al., 2013. New handbook forstandardised measurement of plant functional traits worldwide. Aust. J. Bot. 61,167–234.
Poorter, H., Niklas, K.J., Reich, P.B., Oleksyn, J., Poot, P., Mommer, L., 2012. Biomassallocation to leaves, stems and roots: meta-analyses of interspecific variationand environmental control. New Phytol. 193, 30–50.
Reich, P.B., 2014. The world-wide ‘fast-slow’ plant economics spectrum: a traitsmanifesto. J. Ecol. 102, 275–301.
Reich, P.B., Buschena, C., Tjoelker, M.G., Wrage, K., Knops, J., Tilman, D., Machado, J.L., 2003a. Variation in growth rate and ecophysiology among 34 grassland andsavanna species under contrasting N supply: a test of functional groupdifferences. New Phytol. 157 (3), 617–631.
Reich, P.B., Wright, I.J., Cavender-Bares, J., Craine, J.M., Oleksyn, J., Westoby, M.,Walters, M.B., 2003b. The evolution of plant functional variation: traits, spectra,and strategies. Int. J. Plant Sci. 164, S143–S164.
Reubens, B., Achten, W.M.J., Maes, W.H., Danjon, F., Aerts, R., Poesen, J., Muys, B.,2011. More than biofuel? Jatropha curcas root system symmetry and potentialfor soil erosion control. J. Arid. Environ. 75, 201–205.
Reubens, B., Poesen, J., Nyssen, J., Leduc, Y., Zenebe, A., Tewoldeberhan, S., Bauer, H.,Gebrehiwot, K., Deckers, J., Muys, B., 2009. Establishment and management ofwoody seedlings in gullies in a semi-arid environment (Tigray, Ethiopia). PlantSoil 324, 131–156.
Sack, L., Grubb, P.J., 2001. Why do species of woody seedlings change rank inrelative growth rate between low and high irradiance? Funct. Ecol. 15, 145–154.
Saıdou, A., Janssen, B.H., Temminghoff, E.J.M., 2003. Effects of soil properties, mulchand NPK fertilizer on maize yields and nutrient budgets on ferralitic soils insouthern Benin. Agric. Ecosyst. Environ. 100 (2), 265–273.
Shelton, H.M., Brewbaker, J.L., 1994. Leucaena leucocephala—the most widely usedforage tree legume. In: Gutteridge, R.C., Shelton, H.M. (Eds.), Forage Trees asLegumes in Tropical Agriculture. CAB International, Wallingford, pp. 15–29.
Shipley, B., 2000. Plasticity in relative growth rate and its components following achange in irradiance. Plant Cell Environ. 23 (11), 1207–1216.
Siebenkäs, A., Schumacher, J., Roscher, C., 2015. Phenotypic plasticity to light andnutrient availability alters functional trait ranking across eight perennialgrassland species. AoB Plants 7, plv029. http://dx.doi.org/10.1093/aobpla/plv029.
Sop, T.K., Kagambèga, F.W., Bellefontaine, R., Schmiedel, U., Thiombiano, A., 2012.Effects of organic amendment on early growth performance of Jatropha curcas L.on a severely degraded site in the Sub-Sahel of Burkina Faso. Agrofor. Syst. 86,387–399.
SPORE, 2015. Agroforestry: Fertiliser Trees Restore Impoverished Land. <http://spore.cta.int/en/environment/fertiliser-trees-restore-impoverished-land.html>(cited 29 April 2016).
StataCorp., 2015. Stata 14 Base Reference Manual. Stata Press, College Station, TX.Valladares, F., Niinemets, Ü., 2008. Shade tolerance, a key plant feature of complex
nature and consequences. Annu. Rev. Ecol. Evol. 39, 237–257.Vilagrosa, A., Cortina, J., Gil-Pelegrin, E., Bellot, J., 2003. Suitability of drought-
preconditioning techniques in Mediterranean climate. Restor. Ecol. 11, 208–216.
Vlek, P., Le, Q., Tamene, L., 2008. Land Decline in Land-Rich Africa: A CreepingDisaster in the Making. CGIAR Science Council Secretariat, Rome, Italy.
WRB, 2006. A Framework for International Classification, Correlation andCommunication. World Soil Resources Reports No. 103. FAO, Rome.

1
Electronic supplementary materials for Noulèkoun et al. (2017a)
Shoot and root responses of woody species to silvicultural management for
afforestation of degraded croplands in the Sudano-Sahelian zone of Benin
Published in the journal “Forest Ecology and Management”
Authors:
Florent Noulèkouna, John P. A. Lamersa, Jesse Naabb, Asia Khamzinac,*
a Center for Development Research (ZEF), Bonn University, Genscherallee 3, 53113 Bonn,
Germany
b WASCAL Competence Center, 06 P.O. Box 9507 Ouagadougou, Burkina Faso
c Div. Environmental Science and Ecological Engineering, Korea University, 145 Anam-Ro,
Seongbuk-Gu, Seoul 02841, Republic of Korea
*Corresponding author
E-mail: [email protected]

2
Table S1 Soil physical and chemical properties at the study site in the Atacora region, northern Benin, at the beginning of the experiment in June 2014
Parameter Unit Soil horizon (cm)
0-5 5-16 16-30 30-50
Texture - Sandy loam Loam Loam Clayey loam Clay % 11.8 15.7 25.5 29.4 Silt % 31.4 35.3 33.3 37.3 Sand % 56.9 49.0 41.2 33.3 BD g cm-3 1.5 1.5 1.6 1.6 pF 2.5 % vol 7.8 10.9 13.4 15.9 pF 4.2 % vol 3.8 5.3 4.5 4.8 Ksat Cm d-1 73.2 18.4 207.7 232.4 OM % 1.2 1.1 1.1 0.9 C % 0.7 0.6 0.6 0.6 N % 0.1 0.1 0.1 0.1 C/N - 12 12 13 13 P mg kg-1 15.7 15.3 14.5 14.8 Kav mg kg-1 90.7 77.6 16.1 20.2 Ca2+ cmol kg-1 2.5 2.7 2.9 2.1 Mg2+ cmol kg-1 0.9 1.9 1.7 2.9 K+ cmol kg-1 0.1 0.1 0.1 0.1 Na+ cmol kg-1 0.1 0.1 0.1 0.1 CEC cmol kg-1 4.7 6.0 5.2 5.3 pH-H2O - 5.3 5.2 5.7 5.8
Legend: BD: bulk density; pF2.5: field capacity; pF4.2: permanent wilting point; Ksat: saturated hydraulic conductivity; OM: organic matter; C: carbon; N: nitrogen; Pav: available phosphorus; Kav: available potassium; CEC: Cation Exchange Capacity

3
(a) 5MaP
(b) 11MaP
12
34
5
D (
cm
)
No manure Manure
(A) Basal diameter
0.5
11
.52
2.5
H (
m)
No manure Manure
(B) Height
0.2
.4.6
.8
RG
R_
RE
(m
/m/m
on
th)
No manure Manure
(H) Relative growth rate in lateral root extension
.15
.2.2
5.3
.35
RG
R_
RD
(m/m
/mo
nth
)
No manure Manure
(G) Relative growth rate in rooting depth
.1.2
.3.4
.5.6
RG
R_
D (
cm
/cm
/mo
nth
)
No manure Manure
(C) Relative growth rate in diameter
0.1
.2.3
.4.5
RG
R_
H (
m/m
/mo
nth
)
No manure Manure
(D) Relative growth rate in height
.3.4
.5.6
RD
(m
)
No manure Manure
(E) Rooting depth
.51
1.5
2
RE
(m
)
No manure Manure
(F) Maximum extent of lateral roots
0
.05
.1.1
5
RG
R_
D (
cm
/cm
/mo
nth
)
No manure Manure
(C) Relative growth rate in diameter
0
.02
.04
.06
.08
RG
R_
H (
m/m
/mo
nth
)
No manure Manure
(D) Relative growth rate in height
.51
1.5
22
.53
H (
m)
No manure Manure
(B) Height
12
34
5
D (
cm
)
No manure Manure
(A) Basal diameter

4
(c) 15MaP
.4.5
.6.7
.8
RD
(m
)
No manure Manure
(E) Rooting depth
.51
1.5
2
RE
(m
)
No manure Manure
(F) Maximum extent of lateral roots
0
.02
.04
.06
.08
RG
R_
RD
(m/m
/mo
nth
)
No manure Manure
(G) Relative growth rate in rooting depth
0
.05
.1.1
5
RG
R_
RE
(m
/m/m
on
th)
No manure Manure
(H) Relative growth rate in lateral root extension2
46
8
D (
cm
)
No manure Manure
(A) Basal diameter
12
34
H (
m)
No manure Manure
(B) Height
.05
.1.1
5
RG
R_D
(cm
/cm
/mo
nth
)
No manure Manuremanure
(C) Relative growth rate in diameter
0
.05
.1.1
5.2
RG
R_H
(m
/m/m
onth
)
No manure Manuremanure
(D) Relative growth rate in height
.4.5
.6.7
.8.9
RD
(m
)
No manure ManureManure
Moringa oleifera Jatropha curcas
Leucaena leucocephala Anacardium occidentale
Parkia biglobosa
(E) Rooting depth
11
.52
2.5
RE
(m
)
No manure ManureManure
Moringa oleifera Jatropha curcas
Leucaena leucocephala Anacardium occidentale
Parkia biglobosa
(F) Maximum extent of lateral roots
0
.02
.04
.06
.08
.1
RG
R_
RD
(m
/m/m
on
th)
No manure ManureManure
Moringa oleifera Jatropha curcas
Leucaena leucocephala Anacardium occidentale
Parkia biglobosa
(G) Relative growth rate in rooting depth
.05
.1.1
5.2
RG
R_
RE
(m
/m/m
on
th)
No manure Manuremanure
Moringa oleifera Jatropha curcas
Leucaena leucocephala Anacardium occidentale
Parkia biglobosa
(H) Relative growth rate in lateral root extension

5
Figure S1 Shoot- and root-level traits of five multi-purpose tree species during the first 15 months after planting (MaP): a=5 MaP, b=11 MaP and c=15 MaP in response to fertilization (no manure and manure application). Shown are species predicted mean values (± 1 standard error of mean (SE) represented by vertical bars) across different levels of irrigation
(a) 11MaP
12
34
5
D (
cm
)
No irrigation Irrigation
(A) Basal diameter
.51
1.5
22
.53
H (
m)
No irrigation Irrigation
(B) Height
0
.05
.1.1
5
RG
R_
D (
cm
/cm
/mo
nth
)
No irrigation Irrigation
(C) Relative growth rate in diameter
0
.02
.04
.06
.08
RG
R_
H (
m/m
/mo
nth
)
No irrigation Irrigation
(D) Relative growth rate in height
.4.5
.6.7
.8.9
RD
(m
)
No irrigation Irrigation
(E) Rooting depth
0.5
11
.52
RE
(m
)
No irrigation Irrigation
(F) Maximum extent of lateral roots
0
.02
.04
.06
.08
RG
R_
RD
(m/m
/mo
nth
)
No irrigation Irrigation
(G) Relative growth rate in rooting depth
-.05
0
.05
.1.1
5
RG
R_
RE
(m
/m/m
on
th)
No irrigation Irrigation
(H) Relative growth rate in lateral root extension

6
(b) 15MaP
Figure S2 Shoot- and root-level traits of five multi-purpose tree species during the first 15 months after planting (MaP): a=5 MaP, b=11 MaP and c=15 MaP in response to no irrigation and irrigation. Shown are species predicted mean values (± 1 standard error of mean (SE) represented by vertical bars) across different levels of fertilization
23
45
67
D (
cm
)
No irrigation Irrigation
(A) Basal diameter
12
34
H (
m)
No irrigation Irrigation
(B) Height
.05
.1.1
5.2
RG
R_D
(cm
/cm
/mo
nth
)
No irrigation IrrigationIrrigation
(C) Relative growth rate in diameter
0
.05
.1.1
5.2
RG
R_H
(m
/m/m
onth
)
No irrigation IrrigationIrrigation
(D) Relative growth rate in height
.4.5
.6.7
.8.9
RD
(m
)
No irrigation IrrigationIrrigation
Moringa oleifera Jatropha curcas
Leucaena leucocephala Anacardium occidentale
Parkia biglobosa
(E) Rooting depth
.51
1.5
22
.5
RE
(m
)
No irrigation IrrigationIrrigation
Moringa oleifera Jatropha curcas
Leucaena leucocephala Anacardium occidentale
Parkia biglobosa
(F) Maximum extent of lateral roots
0
.05
.1.1
5
RG
R_
RD
(m
/m/m
on
th)
No irrigation IrrigationIrrigation
Moringa oleifera Jatropha curcas
Leucaena leucocephala Anacardium occidentale
Parkia biglobosa
(G) Relative growth rate in rooting depth
.05
.1.1
5.2
RG
R_
RE
(m
/m/m
on
th)
No irrigation IrrigationIrrigation
Moringa oleifera Jatropha curcas
Leucaena leucocephala Anacardium occidentale
Parkia biglobosa
(H) Relative growth rate in lateral root extension

ORIGINAL PAPER
Biomass allocation in five semi-arid afforestation species is drivenmainly by ontogeny rather than resource availability
Florent Noulèkoun1,2& Asia Khamzina3 & Jesse B. Naab2
& John P. A. Lamers1
Received: 31 August 2017 /Accepted: 14 November 2017# INRA and Springer-Verlag France SAS, part of Springer Nature 2017
Abstract& Key message The changes in the relative biomass allocation to roots in juvenile stands of fast-growing (Leucaenaleucocephala Lam., Moringa oleifera Lam., and Jatropha curcas L.) and slow-growing (Anacardium occidentale L. andParkia biglobosa Jacq.) afforestation species are driven mainly by ontogeny rather than resource availability. However,silvicultural management aiming at increasing availability of water and particularly nutrients enhances biomass pro-duction in all species.& Context Understanding the patterns of biomass allocation among tree species in response to ontogeny and to variation inresource availability is key to the successful restoration of degraded land using forest plantations.& Aims This study assessed the effects of resource availability and ontogeny on biomass accumulation and partitioning in fivesemi-arid afforestation species.& Methods The aboveground and belowground biomass production of fast-growing Leucaena leucocephala Lam., Moringaoleifera Lam., and Jatropha curcas L. and slow-growing Anacardium occidentale L. and Parkia biglobosa Jacq. was monitoredfollowing the application of manure (1 kg plant−1) and/or supplemental irrigation (0.5 L per sapling daily) during the first tworainy seasons and the intervening dry season on degraded cropland in Northern Benin.& Results Biomass accumulation in the fast-growing species was positively impacted by fertilization and irrigation during both rainyseasons. The slow-growing species responded positively to the silvicultural treatments during the dry and second rainy season. Theapplication of fertilizer alone increased the biomass ofP. biglobosa by up to 335% during the dry season. Fifteenmonths after planting,manure-treated L. leucocephala accumulated the most biomass (2.9 kg tree−1). The root fraction decreased with increasing tree size inall species. The comparison of root versus shoot allocation in trees of equal size indicated that the treatment-induced shifts in biomasspartitioning were controlled by ontogeny, which explained 86–95% of the variation in root-shoot biomass relationships.& Conclusion While ontogeny was the main driver of biomass partitioning, increased resource availability induced a largerproduction of biomass, overall leading to greater aboveground production in all species.
Keywords Intensive silviculture . Manuring . Drip irrigation .
Roots . Optimum partitioning theory
1 Introduction
Conserving and restoring natural forests is essential in copingwith the growing demand for timber and non-timber forestproducts and ensuring environmental sustainability in tropicalregions (Steege et al. 2015). In sub-Saharan Africa (SSA),these efforts are increasingly constrained by the decline inthe per capita availability of agricultural land (de Graaffet al. 2011), required to satisfy the food, feed, and fuel de-mands of the ever-increasing population. The resulting pres-sure on marginal land (Azuka et al. 2015) has dramaticallyreduced the duration of fallows, the traditional practice used torestore soil fertility (Nandwa 2001). The increasing variability
Handling Editor:Michael Tausz
Contribution of the co-authors All authors conceived and designed theexperiment. FN and JBN collected the field data. FN performed statisticalanalyses and composed the manuscript. AK, JBN, and JPAL contributedto the development of the manuscript.
Electronic supplementary material The online version of this article(https://doi.org/10.1007/s13595-017-0676-4) contains supplementarymaterial, which is available to authorized users.
* Asia [email protected]
1 Center for Development Research (ZEF), Bonn University,Walter-Flex-Straße 3, 53113 Bonn, Germany
2 West African Science Service Center on Climate Change andAdapted Land Use (WASCAL), P.O. Box 9507, Ouagadougou06, Burkina Faso
3 Division Environmental Science and Ecological Engineering, KoreaUniversity, 145 Anam-Ro, Seongbuk-Gu, Seoul 02841, South Korea
Annals of Forest Science (2017) 74:78 https://doi.org/10.1007/s13595-017-0676-4

of rainfall in SSA (Sylla et al. 2016) has become an additionalobstacle for efforts to improve cropland productivity and re-generate forest areas. In this regard, the afforestation of de-graded cropland and intercropping with multi-purpose treespecies offer the possibility of increasing on-farm tree cover,reversing land degradation, and contributing to rural liveli-hoods (Chamshama and Nduwayezu 2002; Garrity et al.2010; Khamzina et al. 2012).
Though afforestation is a promising strategy, nutrientand water limitations on degraded land may hamper itssuccess. Intensive silviculture, including fertilization, ir-rigation, pest control, and weed control, has been suc-cessful in overcoming environmental constraints and in-creasing forest production (e.g., Fening and Gershenzon2002; Mead 2013; Coyle et al. 2016). However, this isyet to be adopted in most dryland afforestation systemsdue to insufficient incentives for farmers to invest inecological restoration (e.g., Djalilov et al. 2016) but ispracticed for tree species of commercial importance,such as Jatropha curcas L. in biofuel production(Baumert et al. 2016). For instance, fertilization alonemitigated the negative effects of nutrient stress, resultingin enhanced stem growth (6–30%) in J. curcas andParkia biglobosa Lam. saplings on nutrient-poor soilsunder semi-arid conditions (Noulèkoun et al. 2017)and greater aboveground biomass (AGB) accumulation(125–200%) in two 3-year-old Populus deltoides geno-types in a temperate climate (Coyle and Coleman 2005).Irrigation also improved tree productivity under scarceand erratic rainfall (Khamzina et al. 2008; Trichet et al.2008; Noulèkoun et al. 2017). Early growth responsesof trees to silvicultural treatments are reflected in theadjustment of biomass partitioning between roots andshoots. This relative allocation of biomass can be indic-ative of the physiological potential and long-termgrowth trajectory of tree species (e.g., Niklas 1994;Mcconnaughay and Coleman 1999; Reich 2002;Lamers et al. 2006). Critical physiological processesregulating resource acquisition and plant growth undernutrient and/or water stress occur belowground (Coyleand Coleman 2005). Hence, the root share can accountfor a substantial portion of total biomass (27–68%) in(sub-)tropical dry forests or plantations (Mokany et al.2006).
Variations in belowground biomass (BGB) proportionsduring tree growth are controlled by both resource avail-ability and development (i.e., ontogeny) (Coyle et al. 2008,2016). Increased resource availability (e.g., nutrient andwater) enhances AGB accumulation (which is usually ofinterest to farmers) as a result of allocation shifts from rootto shoot (e.g., Albaugh et al. 1998; Mcconnaughay andColeman 1999; Coleman et al. 2004; Coyle et al. 2016).Changes in the relative biomass allocation to roots in
response to resource availability are predicted to accordwith the optimum partitioning theory (OPT), which sug-gests that plants allocate more biomass to the organ thatacquires the most limiting resource (Brouwer 1963; Bloomet al. 1985). However, studies comparing plasticity inroot/shoot ratios at common plant size or developmentstage (not at common plant age or time) have suggestedthat the shifts in biomass partitioning cited in support of theOPT may largely be induced by accelerated development(e.g., Mcconnaughay and Coleman 1999; Coleman et al.1994, 2004). Therefore, it is important to separate the dy-namics of development-induced (i.e., ontogenetic drift)changes in biomass allocation from those modulated bysilvicultural treatments (i.e., “true” plasticity in allocation)when identifying the controlling factors (Mcconnaughayand Coleman 1999; Reich 2002; Coleman et al. 2004).
Multi-species plant studies, aiming at distinguishing be-tween biomass allocation changes that result from ontogeneticdrift and true adjustment, are scarce in tropical climates, par-ticularly in the context of the afforestation of degraded dry-lands. This is partly because the required sequential samplingof AGB and BGB is challenging in open-field research(Robinson 2004). We assessed biomass allocation patterns infive afforestation species grown on degraded cropland undervarying levels of nutrients and water supply during early standdevelopment in Northern Benin, West Africa. Three of thetested species (Leucaena leucocephala Lam., Moringaoleifera Lam., and J. curcas) were previously classified asfast-growing and two (Anacardium occidentale L. and P.biglobosa) as slow-growing species, based on the responseof root-level and shoot-level morphological traits to nutrientand water amendments (Noulèkoun et al. 2017). Yet, the pre-vious studies did not address the dynamics of plant above-ground and belowground responses to silvicultural treatmentswith emphasis on biomass production and allocation. We hy-pothesized that (i) increased resource availability boosts bio-mass production significantly more in species characterizedby faster ontogenetic development than in slow growers, (ii)biomass partitioning to belowground decreases with ontoge-ny, and (iii) when ontogeny is accounted for as a function ofplant size, increasing resource availability triggers greater bio-mass allocation to aboveground versus belowground.
2 Materials and methods
2.1 Study site description
The study site, plant materials, and experimental design werepreviously described in detail by Noulèkoun et al. (2017). Theresearch was carried out in Pouri village (N 10° 54′ 8.4″ and E1° 4′ 47.4″) located on the periphery of the Dassari catchmentin the department of Atacora, Northern Benin. The area is
78 Page 2 of 12 Annals of Forest Science (2017) 74:78

characterized by a semi-arid climate, marked by one dry sea-son (November to March) with temperatures rising as high as45 °C and one rainy season (April to October) with tempera-tures falling to 14 °C. The average annual precipitation for the15-month study period, spanning the 2014 and 2015 rainy(growing) seasons, was 795 mm. The vegetation is typicalfor a Sudan savanna ecological zone, with parklands, forestpatches, and agricultural and fallow land, all of which areimpacted by human activity (Saïdou et al. 2004; Chabi et al.2016). The soils are compacted, limited in their depth by grav-el and lateritic formations, and have low to moderate inherentfertility (Saïdou et al. 2004; Azuka et al. 2015). The soil at theresearch site was classified as an epipetric plinthosol withsandy-loamy texture in the surface layer and loamy soil dom-inated by clayey loam in deeper layers. Total carbon and NPKmeasured 0.5%, 0.1%, 1.2 mg kg−1, and 44.3 mg kg−1,respectively.
2.2 Woody species
The afforestation trial established at the degraded croppingsite in July 2014 included five (semi-)deciduous tree speciesthat differed in terms of their growth potential and tolerance todrought (Noulèkoun et al. 2017): the fast-growing Moringaoleifera Lam. (drumstick tree, Moringaceae), Jatropha curcasL. (physic nut, Euphorbiaceae), and Leucaena leucocephalaLam. (leucaena, Fabaceae) and the slow-growing Anacardiumoccidentale L. (cashew, Anacardiaceae) and Parkia biglobosaJacq. (African locust bean, Fabaceae). Seeds were germinatedin a local nursery and planted at the experimental site after2.5–4 months.
2.3 Experimental design
Three experimental factors were considered to influence plantgrowth and biomass production and allocation: (i) the fivespecies and two silvicultural treatments consisting of (ii) dripirrigation and (iii) fertilization by manuring. The species andirrigation variables were subject to a fully factorial design withthree repetitions, while manuring was nested within plots. Thedesign thus consisted of a total of 30 pure species plots, each12 × 8 m2 in size. Each plot contained 48 seedlings spaced at2 × 1 m, resulting in an initial density of 5000 plants ha−1.
The irrigation and fertilization treatments resulted in fourresource management options: no resource manipulation(control, C), irrigation (I), fertilization (F), and irrigation plusfertilization (IF). An adapted drip irrigation system (Fig. 1)was used during the dry season to supply 0.5 L of water persapling daily to meet 30% of the evaporative demand (Allenet al. 1998). This amounted to a total of 72.5 mm of irrigation.In addition, saplings received 33 mm of rainfall during the2014–2015 dry season. Manure was supplied in the amountof 1 kg per plant in both growing seasons, i.e., at 2.5 and
11 months after planting (MaP). The manure was compostedcow and pig dung and contained on average 18.7% carbon(C), 1.2% nitrogen (N), and 0.8% phosphorus (P).
2.4 Biomass production
Plants were sampled at 5, 11, and 15 MaP, representing thefirst growing (rainy) season (0–5 MaP), the subsequent dryseason (5–11 MaP), and the second growing season (11–15MaP). At each sampling, two to six saplings were randomlyselected from each experimental plot and harvested entirely.The plants were felled, and the AGB separated into leaves(including the petiole), stems with branches, and (if present)reproductive parts. Roots were manually excavated and sec-tioned into coarse (ø > 2 mm) and fine (ø < 2 mm) fractions.The roots were gently washed on a sieve and freed of soil. Thefresh mass of each fraction was recorded in the field using a 7-kg portable scale (accuracy 0.1 g) and oven-dried at 75 °Cuntil a constant weight. Woody samples were cut into smallpieces before oven drying.
At 11 MaP, biomass was also sampled from a 10-year-oldnatural fallow, located in the vicinity of the experiment tocompare biomass productivity between afforested (active in-tervention) and fallowed (natural succession) sites. An area of0.5 ha was delineated in the fallow land where three sub-plotsof 4 × 4 m each were installed along one of the diagonals forsampling. Grazing was not controlled. The AGB and BGB ofthe predominant vegetation, consisting of shrubs (e.g.,Combretum glutinosum) and trees (e.g., Terminaliamacroptera), were quantified for each species and sub-plotas described above.
2.5 Statistical analyses of treatments
A linear mixed-effect model was used to assess the effectsof the abovementioned experimental factors on biomassproduction at 5, 11, and 15 MaP. The effect of irrigationwas tested at 11 and 15 MaP. The statistical analysesconsisted of several steps. First, the effects of species,treatment (F and I), and treatment interaction on totalbiomass production were tested. Second, differences ob-served between the species in biomass production withrespect to the silvicultural treatments were analyzed.Species, fertilization, and irrigation were considered asfixed terms, while plot identity and fertilization (nestedwithin plots) as random terms. The robust variance esti-mates and unstructured covariance options in STATA 14(StataCorp 2015) were used to control for any deviationfrom the assumption of normality in the data. A leastsignificance difference (LSD) test was used to comparemeans when significant treatment effects were found.
Biomass allocation in five semi-arid afforestation species is driven mainly by ontogeny rather than... Page 3 of 12 78

2.6 Relative biomass allocation analysis
The effect of the treatments and ontogeny on biomass allo-cation was evaluated using clasmometric and allometricanalyses (Poorter and Sack 2012). For the clasmometricanalysis, the root mass fraction (RMF) was computed andplotted against the natural log-transformed estimate of thewhole-plant dry biomass, which was used as a referencefor the ontogenetic stage (e.g., Evans 1972; Poorter andPothmann 1992; Poorter and Sack 2012). The allometricanalysis was performed using an approach that allows forthe differentiation between the effects of ontogeny and re-source availability on biomass allocation (Hunt 1978;Coleman et al. 2004):
lnY ¼ aþ k lnX ð1Þwhere Y is the total root (coarse and fine) dry mass, X is thetotal shoot (leaf and stem) dry mass, a is the y intercept, andthe slope k is the allometric coefficient. The greater the valueof k, the greater the biomass allocation to the roots relativeto the shoots. If k is similar between the treatments, any shiftin biomass allocation can be attributed to development(Hunt 1978). An analysis of covariance (ANCOVA) wasused to reveal differences in k between treatments. TheANCOVA consisted of fitting the model in Eq. 1 to thetreatment class variable. A significant interaction betweenthe covariates (natural log-transformed stand-level estimatesof root and shoot dry mass) and the treatment variable isconsidered indicative of a treatment-induced shift in biomassallocation. An ANCOVAwas also used to compare the RMFversus tree size relationship between the treatments as re-vealed by clasmometry. In the case of significant interactionsbetween the covariate and treatment factor, an LSD post hoctest was used to compare the slopes. In the case of equalityof slopes between the treatments, a test of differences inintercepts was additionally performed. Following Niklasand Enquist (2002) and Poorter et al. (2015), the reproduc-tive biomass fractions (fruits of J. curcas and pods ofM. oleifera), which represented 2–5% of the total biomass,were omitted from the analyses.
To further assess the relative explanatory power of ontog-eny and treatment effects on biomass allocation, stepwisemultiple regression was conducted to characterize the effectof total dry mass, fertilization, and irrigation on root drymass separately for each species. The natural log-transformed mass values and their residuals were judged tobe normally distributed and homoscedastic based on a com-bination of histograms and normality tests performed inSTATA 14. Data from the three harvests at the experimentalsite were pooled to account for changes in biomass alloca-tion over the full size range (Poorter et al. 2012; Poorter andSack 2012).
3 Results
3.1 Biomass production
3.1.1 Effects of resource supply
The shoot, root, and total biomass were affected by fertiliza-tion and irrigation, but the effects differed between species andassessment periods (Table 1). At 5 MaP, total biomass in-creased due to fertilization (F) compared to the control (C)by 18% in M. oleifera, 23% in J. curcas, and 25% inL. leucocephala. No significant difference in biomass accu-mulation was observed between the C and F treatments forA. occidentale and P. biglobosa saplings, which were thesmallest in size (Figs. 2a and 3a, Supplementary material,Appendix S1). The fertilizer-related biomass increase in fast-growing species was mirrored predominantly in AGB accu-mulation (Fig. 2, Supplementary material, Appendix S1). Atthe end of the dry season (11 MaP), only the slow-growingspecies responded to treatments (Table 1, Supplementarymaterial, Appendix S1). Both A. occidentale andP. biglobosa saplings accumulated greater root biomass underIF and F compared to C at this point in time (Fig. 2b). Thecontinued growth during the dry season substantially en-hanced total biomass accumulation in P. biglobosa, whichincreased by 176% under IF and by 335% under F compared
Fig. 1 Drip system using local1.5-L plastic bottles for thesupplemental irrigation ofsaplings during the dry season(December 2014–May 2015) atthe afforestation site in NorthernBenin
78 Page 4 of 12 Annals of Forest Science (2017) 74:78

to C. In contrast, the total biomass of the fast-growing speciesdeclined between 5 and 11 MaP mainly due to a loss of shootbiomass (Fig. 2b). At the end of the second growing season(15 MaP), total biomass followed the order F > IF > I > C forthe fast growers, although the differences between treatmentswere not statistically significant in all cases (Fig. 2c). For theslow growers, the pattern of treatment effects on total biomassfollowed the order of IF = F = I > C. The range of the increasein total biomass under F compared to C was substantiallygreater (8–335%) in the slow growers compared to that inthe fast-growing species (19–68%). A significant effect ofsecond-order interactions (e.g., species × fertilization × irriga-tion) was observed on root and total biomass at 11 MaP only(Table 1) but resulted from differential responses of fast-growing and slow-growing species to treatments (Fig. 2).
Fertilization consistently affected every biomass compo-nent at 5 and 15 MaP. Conversely, the overall effect of irriga-tion was marginal. It was much more evident at 15 MaP andvaried greatly between species (Table 1, Fig. 2).
3.1.2 Species differences
At 5MaP, the species ranking in terms of total biomass accumu-lation followed the order M. oleifera > J. curcas >L. leucocephala > A. occidentale > P. biglobosa (Fig. 3a).Shoot biomass ranking followed the same order, but the rootbiomass was similar for A. occidentale and P. biglobosa. At 11MaP, total biomass did not significantly differ betweenM. oleifera and L. leucocephala and between J. curcas andA. occidentale (Fig. 3b). At 15 MaP, L. leucocephala accumu-lated significantly greater total biomass than the other four spe-cies while A. occidentale and particularly P. biglobosa accumu-lated the lowest total biomass (Fig. 3c). For instance, total bio-mass in L. leucocephala was 53% greater than in M. oleifera,183% greater than in A. occidentale, and 659% greater than inP. biglobosa. Shoot and root biomass followed a similar pattern(Fig. 3c). The total biomass on the 10-year-old fallow land wasestimated at 19.98 Mg ha−1.
3.2 Biomass allocation
3.2.1 Effects of resource supply
For all species and treatments, the RMF fell (slope < 0, Fig. 4)with increasing tree size, reflecting ontogenetic drift, except inA. occidentale, which demonstrated no significant change (P =0.68, Table 2, Fig. 4f). The decrease in RMF was influenced bythe F and I treatments (Supplementary material, Appendix S2),but this exhibited great variation and was species specific (Fig.4). ForM. oleifera, the decline in the RMFwas larger in saplingsunder C, I, and IF than in those under F, whereas a greaterdecrease occurred in L. leucocephala saplings under IF and Icompared to C and F treatments (Table 2, Fig. 4a, c). However,treatment had no effect on the RMF in J. curcas, A. occidentale,or P. biglobosa (P > 0.05; Table 2).
Allometric analysis revealed significant and strong linear re-lationships (R2 > 0.8) between root and shoot biomass (Table 3).For J. curcas, L. leucocephala, andA. occidentale, the variationsin biomass allocation to belowground between treatments wereall explained by ontogeny, as evidenced by a k that did notsignificantly differ between treatments (Table 3). The rate ofincrease in root biomass with increasing shoot biomass (i.e., k)did not differ (P > 0.05) between treatments forP. biglobosa, butthe intercept was significantly higher for saplings grown underC and I compared to F and IF (P = 0.038; data not shown).Conversely,M. oleifera exhibited a significantly higher k underboth F and IF compared to C and I treatments (Table 3), indi-cating that the treatments altered belowground allocation in thisspecies. Due to the differing patterns of treatment-induced ef-fects on the allometric relationship, the relative variation ex-plained by ontogeny and by fertilization and irrigation was fur-ther distinguished. The ontogeny was always important in theallometric relationship between roots and shoots, explaining 86–
Table 1 Significance of species, fertilization, irrigation, and fertilization× irrigation factors for aboveground and belowground biomassproduction after the first growing season (0–5 MaP), the dry season (5–11 MaP), and the second growing season (11–15 MaP) for plantations ofM. oleifera, J. curcas, L. leucocephala, A. occidentale, and P. biglobosaon degraded cropland in Northern Benin. P values lower than α = 0.05are indicated in italics
Factors Shoota Rootb Totalc
5 MaP
Species (S) < 0.001 < 0.001 < 0.001
Fertilization (F) < 0.001 0.002 < 0.001
S × F 0.002 0.021 0.005
11 MaP
Species (S) < 0.001 < 0.001 < 0.001
Fertilization (F) 0.549 0.915 0.677
S × F 0.579 < 0.001 0.035
Irrigation (I) 0.918 0.716 0.838
S × I 0.403 0.109 0.354
F × I 0.873 0.019 0.583
S × F × I 0.082 < 0.001 < 0.001
15 MaP
Species (S) < 0.001 < 0.001 < 0.001
Fertilization (F) < 0.001 < 0.001 < 0.001
S × F < 0.001 < 0.001 < 0.001
Irrigation (I) 0.183 0.827 0.281
S × I < 0.001 < 0.001 < 0.001
F × I 0.253 0.002 0.114
S × F × I 0.832 0.104 0.711
a Shoot = leaves + stem; reproductive parts were not includedb Root = coarse roots + fine rootsc Total = shoot + root
Biomass allocation in five semi-arid afforestation species is driven mainly by ontogeny rather than... Page 5 of 12 78

95% of the variation in all species (P < 0.001, Table 4). Theamount of variation in the root versus shoot allocation explainedby fertilization was 0.3–0.7% and that by irrigation 1.4–43%.Neither factor appeared significant in the models (Table 4).
3.2.2 Species differences
Of the species selected for this study, the RMFwas the highestin P. biglobosa, ranging between 30 and 75% of the totalbiomass over the entire size range (Fig. 4f). The proportionof total biomass allocated to belowground was < 50% inM. oleifera, J. curcas, and L. leucocephala and < 30% inA. occidentale. The latter had the highest k value of the five
species, which was close to unity (a mean of 0.98 with a 95%confidence interval between 0.9 and 1.06, Table 3). The kvalues averaged 0.66 ± 0.09, 078 ± 0.08, 0.78 ± 0.07, and0.75 ± 0.07 for M. oleifera, J. curcas, L. leucocephala, andP. biglobosa, respectively (Table 3).
4 Discussion
4.1 Silvicultural treatment effects
The addition of manure and supplemental irrigation generallyincreased biomass production in the multi-species
400
200
0
200
400
600
C F C F C F C F C F
Bio
mas
s (g
tre
e-1)
(A) 5 MaP
a a a a a a a a
b a b a b a a a a a
B A Ba aA B A A A A A
M. oleifera J. curcas L. leucocephala A. occidentale P. biglobosa
400
200
0
200
400
600
C F I IF C F I IF C F I IF C F I IF C F I IF
Bio
mas
s (g
tre
e-1)
(B) 11 MaP
a a a b a a a a a a b b ab a c a b b
a a a a a a a a a a a a a a a a c a b ab
A Aa a
A A A A A A A A A A A A A A C A B AB
M. oleifera J. curcas L. leucocephala A. occidentale P. biglobosa
1200
600
0
600
1200
1800
2400
3000
C F I IF C F I IF C F I IF C F I IF C F I IF
Bio
mas
s (g
tre
e-1)
(C) 15 MaP
Root Shoot
a a a a c ab b a b a b b b ab a a b a
b a b a c ab b a bc a c b b a a a b a a a
B A B AB C AB B A BC A C B B A A A B Aa aA A
M. oleifera J. curcas L. leucocephala A. occidentale P. biglobosa
Fig. 2 Aboveground (leaves andstem) and belowground (coarseand fine roots) biomass of fivewoody species at a 5 MaP, b 11MaP, and c 15 MaP on degradedcropland in Northern Benin.Treatments included control (C),fertilization (F), irrigation (I), andirrigation + fertilization (IF). The“zero” line on the y-axisdelineates the ground surface.Vertical bars are standard errors ofthe mean. Lowercase lettersabove the bars denote shoots andthose below the bars roots.Capital letters relate to totalbiomass. For each species, meanswith different letters indicate thesignificant impact of the treatmentaccording to a LSD post hoc test(α = 0.05)
78 Page 6 of 12 Annals of Forest Science (2017) 74:78

afforestation system. During the earliest stage of development(0–5 MaP) and in the second growing season (11–15 MaP),increased nutrient availability led to greater aboveground andtotal biomass accumulation but in M. oleifera, J. curcas, andL. leucocephala only. This confirms our hypothesis that in-creased resource availability has a more positive effect on thebiomass production of fast-growing species than it does onslow-growing species. The higher sensitivity of the threefast-growing species to the experimental treatments is likelya result of their exploitative use of resources (Reich et al.2003; Reich 2014; Noulèkoun et al. 2017). In contrast, bothslow-growing species were responsive to silvicultural prac-tices during the dry season (5–11 MaP), which is in line with
the hypothesis that increased resource availability also in-creases biomass production in slow growers. Fertilizationand irrigation led to greater total biomass accumulation inP. biglobosa and to an increase in BGB in A. occidentalesaplings receiving I and IF (Fig. 2b). Slow-growing speciesperform better when resources are scarce because of their con-servative use of resources (Reich et al. 2003; Reich 2014;Noulèkoun et al. 2017), which explains the differences ob-served in the response to the treatments by the fast-growingand slow-growing species during the dry season.
Of the five species, L. leucocephala produced the greatesttotal biomass (2.1 kg tree−1) at 15 MaP on the degraded crop-land, with the total biomass of manured L. leucocephala
400
200
0
200
400
600
M. oleifera J. curcas L. leucocephala A. occidentale P. biglobosa
Bio
mas
s (g
tre
e-1 )
(A) 5 MaPa c d
a c dA
a b
b dB C D E
400
200
0
200
400
600
M. oleifera J. curcas L. leucocephala A. occidentale P. biglobosa
Bio
mas
s (g
tre
e-1 )
(B) 11 MaP
a a a a b
a b a d cA B A B C
1000
500
0
500
1000
1500
2000
M. oleifera J. curcas L. leucocephala A. occidentale P. biglobosa
Bio
mas
s (g
tre
e-1 )
(C) 15 MaP
Shoot Root
b b a c d
a c cBb b
B A C D
Fig. 3 Mean aboveground(leaves and stem) andbelowground (coarse and fineroots) biomass across treatmentsfor five woody species at a 5MaP,b 11 MaP, and c 15 MaP ondegraded cropland in NorthernBenin. Treatments and symbolsare as in Fig. 2
Biomass allocation in five semi-arid afforestation species is driven mainly by ontogeny rather than... Page 7 of 12 78

saplings almost doubling that of M. oleifera and J. curcas(Figs. 2c and 3c). This demonstrates the strong potential ofthis species in afforestation schemes. The leguminousL. leucocephala, known as a “fertilizer tree,” has been
recommended for the restoration of impoverished lands(Garrity et al. 2010). In addition, we found that manuringboosted the biomass production of L. leucocephala, possi-bly due to the increased supply of P, which enhances N2
0.0
0.2
0.4
0.6
0.8
1.0
RMF
(A) M. oleifera
CFIIF
0.0
0.2
0.4
0.6
0.8
1.0
RMF
(C) L. leucocephala
CFIIF
0.0
0.2
0.4
0.6
0.8
1.0
(B) J. curcas
CFIIF
0.0
0.2
0.4
0.6
0.8
1.0(D) A. occidentale
CFIIF
0.0
0.2
0.4
0.6
0.8
1.0
RMF
ln Total drymass (g tree-1)
(E) P. biglobosa
CFIIF
0.0
0.2
0.4
0.6
0.8
1.0
4 5 6 7 8
4 5 6 7 8 9
4 5 6 7 8
3 4 5 6 7 8
1 3 5 7 0 2 4 6 8 10ln Total drymass (g tree-1)
(F) Species means across treatmentsM. oleiferaJ. curcasL. leucocephalaA. occidentaleP. biglobosa
Fig. 4 Fractional allocation toroots (RMF) relative to totalsapling dry mass for M. oleifera(a), J. curcas (b), L. leucocephala(c), A. occidentale (d),P. biglobosa (e), and all speciescombined (f) in response to thecontrol (C), fertilization (F),irrigation (I), and fertilization +irrigation (IF). Total dry massvalues were natural log-transformed. Data from threeharvests (5, 11, and 15 MaP) areconsidered
Table 2 Slope comparison for therelationship between thefractional allocation to roots(RMF) and total dry mass for fivewoody species under the control(C), fertilization (F), irrigation (I),and fertilization + irrigation (IF)treatments
Treatment M. oleifera J. curcas L. leucocephala A. occidentale P. biglobosa
Control (C) − 0.093b − 0.041a − 0.024b − 0.006a − 0.091aFertilization (F) − 0.030a − 0.039a − 0.036b − 0.002a − 0.014aIrrigation (I) − 0.099b − 0.049a − 0.056ab − 0.018a − 0.146aFertilization + irrigation (IF) − 0.065ab − 0.041a − 0.073a − 0.031a − 0.038aMean across treatments − 0.066B − 0.035B − 0.044B − 0.002A − 0.044B
Within columns and for treatments, values followed by the same lowercase letter are not significantly different.Within a row, species means followed by the same uppercase letter are not significantly different. For all the casesof equal slopes between the treatments, the comparison of the intercepts showed no significant difference (data notshown). A significance level of P < 0.05 was used for the LSD post hoc test
78 Page 8 of 12 Annals of Forest Science (2017) 74:78

fixation in trees growing in P-poor agricultural soil(Djumaeva et al. 2013).
The limited response to irrigation during the dry season canbe attributed to (i) a greater importance of nutrient over waterstress under semi-arid conditions (Reubens et al. 2011;Noulèkoun et al. 2017), (ii) the relatively low amount of watersupplied per plant during the dry season, and (iii) the decidu-ousness of the tree species as a drought-escaping mechanisminducing dormancy during dry periods (e.g., Monasterio andSarmiento 1976; Reich and Borchert 1984; Poorter andMarkesteijn 2008). In the fast-growing species, the deciduous-ness also caused a decrease in biomass accumulation between 5and 11 MaP. However, the effect of supplemental irrigationmay extend beyond the dry season period in which it wasapplied, as shown by the enhanced longitudinal and cambialgrowth of shoots and roots in same trial at 15 MaP (Noulèkounet al. 2017), the extended photosynthetically active period incoppicing trees in South Africa (Moyo et al. 2015), and theoverall rise in AGB production in a long-term afforestation trialin arid Uzbekistan (Khamzina et al. 2008). This post-irrigation
effect was particularly evident in the slow growers, which ex-hibited comparable total biomass production under the I, F, andIF treatments at 15 MaP (Fig. 2c).
4.2 Biomass allocation as influenced by ontogenyand resource availability
Previous studies aiming to understand the effects of increasedresource availability on biomass allocation in deciduous spe-cies (Achten et al. 2010) and conifers (Coyle and Coleman2005) have reported conflicting results, presumably becausethe impact of ontogeny was not always considered (McCarthyand Enquist 2007). In our study, except for A. occidentale, theRMF dropped for all species and across all treatments overtime (Fig. 3 and k < 1, Table 3), confirming that thepartitioning of biomass to belowground was predominantlycontrolled by ontogeny (Table 4). Similar ontogenetically in-duced falls in the RMF have been reported for seedlings(Coleman et al. 1998) and 3–4-year-old plantations of loblolly
Table 4 Multiple regressionparameters according to treespecies demonstrating the relativeimportance of ontogeny (total drymass), fertilization, and irrigationfor belowground biomassallocation. The dependentvariable is root dry mass. A and Brepresent the intercept and slopeof the robust linear regression
Species Independent variable A B Prob > F Model R2
M. oleifera Total biomass 0.299 0.775 < 0.001 0.861
Fertilization 5.335 − 0.089 0.458 0.007
Irrigation 5.331 − 0.143 0.336 0.014
J. curcas Total biomass − 0.684 0.874 < 0.001 0.855
Irrigation 4.645 0.488 0.006 0.109
L. leucocephala Total biomass − 0.278 0.849 < 0.001 0.945
Irrigation 5.027 0.242 0.242 0.019
A. occidentale Total biomass − 1.903 0.991 < 0.001 0.944
Fertilization 3.347 0.097 0.656 0.003
Irrigation 2.973 1.251 < 0.001 0.427
P. biglobosa Total biomass − 0.265 0.909 < 0.001 0.951
Backward-stepwise selection was used to identify the most important independent variables. Multiple regressionwas then run to determine the relative variation explained by each. Data presented here are for the most importantvariables only
Table 3 Allometric coefficients(k) and coefficient ofdetermination (R2) for the rootand shoot relationship of fivewoody species under the control(C), fertilization (F), irrigation (I),and fertilization + irrigation (IF)treatments
Treatments M. oleifera J. curcas L. leucocephala A. occidentale P. biglobosa
Control (C) 0.564b 0.721a 0.855a 0.965a 0.593a
Fertilization (F) 0.814a 0.755a 0.803a 0.982a 0.821a
Irrigation (I) 0.561b 0.747a 0.764a 0.866a 0.428a
Fertilization + irrigation (IF) 0.674ab 0.793a 0.667a 0.741a 0.799a
Mean across treatments 0.658C 0.785B 0.777B 0.981A 0.751AB
R2 0.836 0.812 0.918 0.942 0.851
Within columns and for treatments, values followed by the same lowercase letter are not significantly different.Within a row, species means followed by the same uppercase letter are not significantly different. For J. curcas,L. leucocephala, and A. occidentale, the comparison of intercepts between the treatments showed no significantdifference. Intercepts were significantly different between the treatments for P. biglobosa (data not shown). Asignificance level of P < 0.05 was used for the LSD post hoc test
Biomass allocation in five semi-arid afforestation species is driven mainly by ontogeny rather than... Page 9 of 12 78

pine and cottonwood genotypes (Coyle and Coleman 2005;Coyle et al. 2008) in humid sub-tropical climates.
After accounting for ontogeny (by comparing k), our re-sults revealed either that there was no impact by I and F onbiomass partitioning (e.g., in J. curcas and P. biglobosa) orthat there was a shift toward greater root biomass (i.e., greaterk values) in nutrient-rich conditions (e.g., inM. oleifera). Thisindicates that resource availability has no consistent effect onBGB allocation in fast-growing and slow-growing speciesduring early growth stages. The lack of consistent shifts inbiomass allocation to belowground due to nutrient and wateramendments, also evidenced by variations in the decrease inthe RMF between treatments for M. oleifera andL. leucocephala (Table 2), has been reported earlier for grasses(McConnaughay and Coleman 1999; Reich 2002) and 3-year-old woody plants (Coyle and Coleman 2005). The evidencecombined thus suggests that patterns in optimal biomasspartitioning in relation to resource variation after controllingfor size are variable and—to a large extent—unpredictable.According to OPT, a greater proportion of roots, the organsresponsible for resource acquisition, is expected under low-nutrient or low-moisture conditions (McConnaughay andColeman 1999). This pattern was observed in M. oleifera(Fig. 4a), but the opposite occurred in N2-fixingL. leucocephala (Fig. 4c). Therefore, much of the variationin biomass partitioning explained by OPT is driven by differ-ences in plant size and tree species rather than results from trueplasticity in biomass allocation (McConnaughay andColeman 1999; McCarthy and Enquist 2007).
The scaling slope (k) of the allometric relationship betweenAGB and BGB was close to 1.0 for A. occidentale (Table 3).This finding is consistent with the allometric scaling theory(Enquist and Niklas 2002; Niklas and Enquist 2002), given thatthe relationship between root and shoot biomass is isometricover the considered size range (40–1400 g). In contrast, thescaling exponents for the other species were lower, rangingbetween 0.66 and 0.78. This discrepancy between observationand theory could be due to the variation in biomass partitioningbetween aboveground and belowground as a consequence ofspecies-specific adaptations to water-limited and nutrient-limited conditions (Enquist and Niklas 2002). It is also possiblethat there were systematic errors associated with excavating theentire rooting systems, leading to an underestimation of the rootbiomass (Robinson 2004) and thus reducing the numericalvalues of the scaling exponents (Niklas 2004).
4.3 Implications for the afforestation of degradedcroplands
Trade-offs between rapid growth, resource utilization, and siteadaptability arise when selecting suitable species for forestplantations (Aubrey et al. 2012). Fast-growing species are con-sidered competitive but are narrow site adapted and require
adequate resources to optimize productivity. Slow growers aremore stress-tolerant and thus suitable to a broad range of envi-ronments (Aubrey et al. 2012). Of the five tested species, plant-ing fast-growing M. oleifera, J. curcas, and L. leucocephalawith an adequate nutrient supply has the highest productionpotential, as evidenced by their greater biomass productionand strong positive response to fertilization (Fig. 2). This couldincrease return rates for investment in afforestation, but only fora limited expanse of plantation acreage due to the narrow siterequirements of these species. In contrast, the slow-growingA. occidentale and P. biglobosa achieved reasonable biomassproduction and exhibited a more plastic response to treatments,as evidenced by the large range of treatment-induced increase inbiomass. Considering the vast area of degraded croplands inSSA, afforestation using slow growers may produce a largervolume of biomass over the landscape as a whole. Overall then,a mixed cultivation of fast-growing and slow-growing species(Khamzina et al. 2006; Noulèkoun et al. 2017) seems to bemost suitable for sustaining land cover.
The productivity of the 2-year-old afforestation site(5.8 Mg ha−1 year−1) was about three times greater than thatof the 10-year-old fallow (1.9 Mg ha−1 year−1). This compar-ative advantage of plantations over natural succession is dueto both the silvicultural management in plantations and theslow regeneration and unsustainable grazing of fallow land.
5 Conclusion
Belowground biomass represented a substantial share (up to77%) of the total biomass of afforestation species in the earlygrowth stages. However, with increasing tree size, a greater pro-portion of biomass was allocated to aboveground. Ontogenyrather than resource availability was the main driver of the ob-served shift in biomass partitioning. This implies that biomassallocation in young multi-species plantations can be captured bysimple allometric coefficients, thereby improving predictions ofgrowth models for young forest stands. On the other hand, in-creased resource availability through silvicultural treatment ac-celerated sapling biomass production, which overall led to thegreater production of AGB. Fast-growing tree species producedmore biomass, responding more vigorously to silvicultural treat-ments during the rainy seasons than did the slow growers.Significant treatment-induced increases in biomass and the abil-ity to adjust production in resource-limited conditions were thekey characteristics of slow-growing species. For these reasons,we suggest the use of both fast-growing and slow-growing treespecies in the afforestation of degraded croplands.
Acknowledgements We thank the staff of WASCAL study catchment inDassari and casual workers who helped during field work. Our sinceregratitude goes to Dr. Nadine Worou and Dr. Guido Lüchters who helpedwith the installation of the trial and data analysis, respectively. We are
78 Page 10 of 12 Annals of Forest Science (2017) 74:78

grateful to the editors and referees for their insightful and constructivecomments.
Funding information This research was funded by the German FederalMinistry of Education and Research (BMBF) under the programWASCAL (West African Science Service Center on Climate Changeand Adapted Land Use), project no. 00100218.
Compliance with ethical standards
Data availability This manuscript has data included as electronic sup-plementary material. The datasets generated and/or analyzed during thecurrent study are available from the first or corresponding author onreasonable request.
Conflict of interest The authors declare that they have no conflict ofinterest.
References
Achten WMJ, Maes WH, Reubens B, Mathijs E, Singh VP, Verchot L,Muys B (2010) Biomass production and allocation in Jatrophacurcas L. seedlings under different levels of drought stress.Biomass Bioenergy 34:667–676. https://doi.org/10.1016/j.biombioe.2010.01.010
Albaugh TJ, Allen HL, Dougherty PM, Kress LW, King JS (1998) Leafarea and above- and belowground growth responses of loblolly pineto nutrient and water additions. For Sci 44:317–328
Allen RG, Pereira LC, Raes D, Smith M (1998) Crop evapotranspiration(guidelines for computing crop water requirements), FAO Irrigationand Drainage Paper, vol 56. FAO, Rome, p 300
Aubrey DP, Coyle DR, Coleman MD (2012) Functional groups showdistinct differences in nitrogen cycling during early stand develop-ment: implications for forest management. Plant Soil 351:219–236.https://doi.org/10.1007/s11104-011-0946-0
Azuka CV, Igué AM, Diekkrüger B, Igwe CA (2015) Soil survey and soilclassification of the Koupendri catchment in Benin, West Africa.Afric J Agric Res 10:3938–3951. https://doi.org/10.5897/AJAR2015.9904
Baumert S, Khamzina A, Vlek PLG (2016) Soil organic carbon seques-tration in Jatropha curcas systems in Burkina Faso. Land DegradDev 27:1813–1819. https://doi.org/10.1002/ldr.2310
Bloom AJ, Chapin FS, Mooney HA (1985) Resource limitation inplants—an economic analogy. Annu Rev Ecol Evol Syst 16:363–392. https://doi.org/10.1146/annurev.es.16.110185.002051
Brouwer R (1963) Some aspects of the equilibrium between over groundand underground plant parts. Jb Inst Biol Scheikundig OnderLandbouwgewassen 1963:31–39
Chabi A, Lautenbach S, Orekan VOA,Kyei-Baffour N (2016) Allometricmodels and aboveground biomass stocks of a West African SudanSavannah watershed in Benin. Carbon Balance Manag 11:16.https://doi.org/10.1186/s13021-016-0058-5
Chamshama SAO, Nduwayezu JB (2002) Rehabilitation of degradedsub-humid lands in sub-Saharan Africa: a synthesis. SokoineUniversity of Agriculture, Morogoro
Coleman JS, McConnaughay KD, Ackerly DD (1994) Interpreting phe-notypic variation in plants. Trends Ecol Evol 9:187–191. https://doi.org/10.1016/0169-5347(94)90087-6
Coleman MD, Dickson RE, Isebrands JG (1998) Growth and physiologyof aspen supplied with different fertilizer addition rates. PhysiolPlant 103:513–526. https://doi.org/10.1034/j.1399-3054.1998.1030410.x
Coleman MD, Friend AL, Kern CC (2004) Carbon allocation and nitro-gen acquisition in a developing Populus deltoides plantation. TreePhysiol 24:1347–1357. https://doi.org/10.1093/treephys/24.12.1347
Coyle DR, ColemanMD (2005) Forest production responses to irrigationand fertilization are not explained by shifts in allocation. For EcolManag 208:137–152. https://doi.org/10.1016/j.foreco.2004.11.022
Coyle DR, Coleman MD, Aubrey DP (2008) Above and belowgroundbiomass accumulation, production, and distribution of sweetgumand loblolly pine grown with irrigation and fertilization. Can J ForRes 38:1335–1348. https://doi.org/10.1139/X07-231
Coyle DR, Aubrey DP, ColemanMD (2016) Growth responses of narrowor broad site adapted tree species to a range of resource availabilitytreatments after a full harvest rotation. For Ecol Manag 362:107–119. https://doi.org/10.1016/j.foreco.2015.11.047
de Graaff J, Kessler A, Nibbering JW (2011) Agriculture and food secu-rity in selected countries in sub-Saharan Africa: diversity in trendsand opportunities. Food Sec 3:195–213. https://doi.org/10.1007/s12571-011-0125-4
Djalilov B, Khamzina A, Hornidge AK, Lamers JPA (2016) Exploringconstraints and incentives for the adoption of agroforestry practiceson degraded cropland in Uzbekistan. J Environ PlanManag 59:142–162. https://doi.org/10.1080/09640568.2014.996283
Djumaeva D, Lamers JPA, Khamzina A, Vlek PLG (2013) The benefitsof phosphorus fertilization of trees grown on salinized croplands inthe lower reaches of Amu Darya, Uzbekistan. Agrofor Syst 87:555–569. https://doi.org/10.1007/s10457-012-9576-7
Enquist BJ, Niklas KJ (2002) Global allocation rules for patterns of bio-mass partitioning in seed plants. Science 295:1517–1520. https://doi.org/10.1126/science.1066360
Evans GC (1972) The quantitative analysis of plant growth. BlackwellScientific Publications, Oxford
Fening TM, Gershenzon J (2002) Where will the wood come from?Plantation forests and the role of biotechnology. Trends Biotechnol20:291–296. https://doi.org/10.1016/S0167-7799(02)01983-2
Garrity DP, Akkinifesi FK, Ajayi OC, Weldesemayat SG, Mowo JG,Kalinganire A, LarwanouM, Bayala J (2010) Evergreen agriculture:a robust approach to sustainable food security in Africa. Food Sec 2:197–214. https://doi.org/10.1007/s12571-010-0070-7
Hunt R (1978) Plant growth analysis. Edward Arnold Ltd., London 67 ppKhamzina A, Lamers JPA, Worbes M, Botman E, Vlek PLG (2006)
Assessing the potential of trees for afforestation of degraded land-scapes in the Aral Sea Basin of Uzbekistan. Agrofor Syst 66:129–141. https://doi.org/10.1007/s10457-005-4677-1
Khamzina A, Lamers JPA, Vlek PLG (2008) Tree establishment underdeficit irrigation on degraded agricultural land in the lower AmuDarya River region, Aral Sea Basin. For Ecol Manag 255:168–178. https://doi.org/10.1016/j.foreco.2007.09.005
Khamzina A, Lamers JPA, Vlek PLG (2012) Conversion of degradedcropland to tree plantations for ecosystem and livelihood benefits.In: Martius C, Rudenko I, Lamers JPA, Vlek PLG (eds) Cotton,Water, Salts and Soums - Economic and Ecological Restructuringin Khorezm, Uzbekistan. Springer Science + Business Media, B.V.,Dordrecht, pp 235–248
Lamers JPA, Khamzina A, Worbes M (2006) The analyses of physiolog-ical and morphological attributes of 10 tree species for early deter-mination of their suitability to afforest degraded landscapes in theAral Sea Basin of Uzbekistan. For Ecol Manag 221:249–259.https://doi.org/10.1016/j.foreco.2005.10.022
McCarthy MC, Enquist BJ (2007) Consistency between an allometricapproach and optimal partitioning theory in global patterns of plantbiomass allocation. Funct Ecol 21:713–720. https://doi.org/10.1111/j.1365-2435.2007.01276.x
McConnaughay KDM, Coleman JS (1999) Biomass allocation in plants:ontogeny or optimality? A test along three resource gradients.
Biomass allocation in five semi-arid afforestation species is driven mainly by ontogeny rather than... Page 11 of 12 78

Ecology 80:2581–2593. https://doi.org/10.1890/0012-9658(1999)080[2581:BAIPOO]2.0.CO;2
Mead DJ (2013) Sustainable management of Pinus radiata plantations.FAO Forestry paper 170. Food and Agriculture Organization of theUnited Nations, Rome
Mokany K, Raison RJ, Prokushkin AS (2006) Critical analysis of root:shoot ratios in terrestrial biomes. Glob Chang Biol 12:84–96. https://doi.org/10.1111/j.1365-2486.2005.001043.x
Monasterio M, Sarmiento G (1976) Phenological strategies of plant spe-cies in the tropical savanna and the semi-deciduous forest of theVenezuelan Llanos. J Biogeogr 3:325–355. https://doi.org/10.2307/3037976
Moyo H, Scholes MC, Twine W (2015) Effects of water and nutrientadditions on the timing and duration of phenological stages ofresprouting Terminalia sericea. S Afr J Bot 96:85–90. https://doi.org/10.1016/j.sajb.2014.10.009
Nandwa SM (2001) Soil organic carbon (SOC) management for sustain-able productivity of cropping and agro-forestry systems in Easternand Southern Africa. In: Managing organic matter in tropical soils:scope and limitations. Springer Netherlands, pp 143–158
Niklas KJ (1994) Plant allometry. The scaling of form and process. TheUniversity of Chicago Press, Chicago
Niklas KJ (2004) Plant allometry: is there a grand unifying theory? BiolRev 79:871–889. https://doi.org/10.1017/S1464793104006499
Niklas KJ, Enquist BJ (2002) On the vegetative biomass partitioning ofseed plant leaves, stems, and roots. Am Nat 159:482–497. https://doi.org/10.1086/339459
Noulèkoun F, Lamers JPA, Naab J, Khamzina A (2017) Shoot and rootresponses of woody species to silvicultural management for affor-estation of degraded croplands in the Sudano-Sahelian zone ofBenin. For Ecol Manag 385:254–263. https://doi.org/10.1016/j.foreco.2016.11.018
Poorter L, Markesteijn L (2008) Seedling traits determine drought toler-ance of tropical tree species. Biotropica 40:321–331. https://doi.org/10.1111/j.1744-7429.2007.00380.x
Poorter H, Pothmann P (1992) Growth and carbon economy of a fast-growing and a slow-growing species as dependent on ontogeny.New Phytol 120:159–166. https://doi.org/10.1111/j.1469-8137.1992.tb01069.x
Poorter H, Sack L (2012) Pitfalls and possibilities in the analysis ofbiomass allocation patterns in plants. Front Plant Sci 259:1–10.https://doi.org/10.3389/fpls.2012.00259
Poorter H, Niklas KJ, Reich PB, Oleksyn J, Poot P, Mommer L (2012)Biomass allocation to leaves, stems and roots: meta-analyses ofinterspecific variation and environmental control. New Phytol 193:30–50. https://doi.org/10.1111/j.1469-8137.2011.03952.x
Poorter H, Jagodzinski AM, Ruiz-Peinado R, Kuyah S, LuoY, Oleksyn J,Usoltsev VA, Buckley TN, Reich PB, Sack L (2015) How doesbiomass distribution change with size and differ among species?An analysis for 1200 plant species from five continents. NewPhytol 208:736–749. https://doi.org/10.1111/nph.13571
Reich P (2002) Root–shoot relations: optimality in acclimation and ad-aptation or the “Emperor’s new clothes”? In: Waisel Y, Eshel A,Kafkafi U (eds) Plant roots, the hidden half, 3rd edn. MarcelDekker, New York, pp 205–220. https://doi.org/10.1201/9780203909423.ch12
Reich PB (2014) Theworld-wide ‘fast-slow’ plant economics spectrum: atraits manifesto. J Ecol 102:275–301. https://doi.org/10.1111/1365-2745.12211
Reich PB, Borchert R (1984)Water-stress and tree phenology in a tropicaldry forest in the lowlands of Costa Rica. J Ecol 72:61–74. https://doi.org/10.2307/2260006
Reich PB, Wright IJ, Cavender-Bares J, Craine JM, Oleksyn J, WestobyM, Walters MB (2003) The evolution of plant functional variation:traits, spectra, and strategies. Int J Plant Sci 164:S143–S164. https://doi.org/10.1086/374368
Reubens B, AchtenWMJ, MaesWH, Danjon F, Aerts R, Poesen J, MuysB (2011)More than biofuel? Jatropha curcas root system symmetryand potential for soil erosion control. J Arid Environ 75:201–205.https://doi.org/10.1016/j.jaridenv.2010.09.011
RobinsonD (2004) Scaling the depths: below-ground allocation in plants,forests and biomes. Funct Ecol 18:290–295. https://doi.org/10.1111/j.0269-8463.2004.00849.x
Saïdou A, Kuyper TW, Kossou DK, Tossou R, Richards P (2004)Sustainable soil fertility management in Benin: learning fromfarmers. NJAS-Wageningen J Life Sci 52:349–369. https://doi.org/10.1016/S1573-5214(04)80021-6
StataCorp (2015) Stata 14 base reference manual. Stata Press, CollegeStation
SteegeH, Pitman NCA, Killeen TJ, LauranceWF, Peres CA, Guevara JE,SalomãoRP et al (2015) Estimating the global conservation status ofmore than 15,000 Amazonian tree species. Sci Adv 1:e1500936.https://doi.org/10.1126/sciadv.1500936
Sylla MB, Pinghouinde MN, Peter G, Ibourahima K, Nana ABK (2016)“Climate change over West Africa: recent trends and future projec-tions.” In: Adaptation to climate change and variability in rural westafrica. Springer International Publishing, pp 25–40. https://doi.org/10.1007/978-3-319-31499-0_3
Trichet P, Loustau D, Lambrot C, Linder S (2008) Manipulating nutrientand water availability in a maritime pine plantation: effects ongrowth, production, and biomass allocation at canopy closure. AnnFor Sci 814:1–12. https://doi.org/10.1051/forest:2008060
78 Page 12 of 12 Annals of Forest Science (2017) 74:78

1
Electronic supplementary materials for Noulèkoun et al. (2017b)
Biomass allocation in five semi-arid afforestation species is driven mainly by
ontogeny rather than resource availability
Published in the journal “Annals of Forest Science”
Authors:
Florent Noulèkoun1,2, Asia Khamzina3*, Jesse B. Naab2, John P. A. Lamers1
1 Center for Development Research (ZEF), Bonn University, Genscherallee 3, 53113 Bonn,
Germany
2 WASCAL Competence Center, 06 P.O. Box 9507 Ouagadougou, Burkina Faso
3 Div. Environmental Science and Ecological Engineering, Korea University, 145 Anam-Ro,
Seongbuk-Gu, Seoul 02841, South Korea
*Corresponding author
E-mail: [email protected]

2
Appendix S1: Significance levels of the aggregate effects of treatments (control (C), fertilization (F), irrigation (I) and irrigation + fertilization (IF)) on five woody species (M. oleifera, J. curcas, L. leucocephala, A. occidentale and P. biglobosa) on a degraded cropland in northern Benin after the first growing season (0-5 MaP), the dry season (5-11 MaP) and the second growing season (11-15 MaP). P-values lower than α=0.05 are indicated in bold
Time Species Shoota Rootb Totalc
5 MaP M. oleifera 0.004 0.805 0.042
J. curcas 0.032 0.097 0.034
L. leucocephala 0.032 0.079 0.033
A. occidentale 0.393 0.893 0.470
P. biglobosa 0.054 0.141 0.062
Species mean across treatment
<0.001 <0.001 <0.001
11 MaP M. oleifera 0.592 0.071 0.362
J. curcas 0.189 0.809 0.405
L. leucocephala 0.318 0.229 0.278
A. occidentale 0.347 0.042 0.283
P. biglobosa <0.001 <0.001 <0.001
Species mean across treatment
<0.001 <0.001 <0.001
15 MaP M. oleifera 0.006 0.224 0.013
J. curcas <0.001 <0.001 <0.001
L. leucocephala <0.001 0.002 <0.001
A. occidentale 0.001 0.005 0.001
P. biglobosa <0.001 <0.001 <0.001
Species mean across treatment
<0.001 <0.001 <0.001
a Shoot= Leaves + Stem; fruit biomass was not included in the analysis. b Root= Coarse roots + Fine roots c Total= Shoots + Roots

3
Appendix S2: Root mass fraction (RMF) statistics for five woody species at 5, 11 and 15 months after planting (MaP) on a degraded cropland in northern Benin. P-values lower than α = 0.05 are indicated in bold
Factors RMF
5 MaP
Species (S) <0.001 Fertilization (F) <0.001 S x F 0.009
11 MaP
Species (S) <0.001 Fertilization (F) 0.006 S x F 0.001 Irrigation (I) 0.823 S x I 0.036 F x I 0.006 S x F x I 0.124
15 MaP
Species (S) <0.001 Fertilization (F) <0.001 S x F 0.329 Irrigation (I) 0.072 S x I 0.188 F x I 0.572 S x F x I 0.525

Sapling biomass allometry and carbon content in fiveafforestation species on marginal farmland in semi-aridBenin
Florent Noulekoun1,2 • Jesse B. Naab2 • John P. A. Lamers1 •
Sophia Baumert3 • Asia Khamzina4
Received: 14 August 2017 /Accepted: 15 December 2017� Springer Science+Business Media B.V., part of Springer Nature 2017
Abstract Allometric equations are routinely used in the estimation of biomass stocks for
carbon accounting within forest ecosystems. However, generic equations may not reflect
the growth trajectories of afforestation species that are introduced to degraded farmland
characterized by water and nutrient limitations. Using sequential measurements of the
height, basal diameter, and above- and belowground biomass of juvenile trees, we
developed allometric equations for five woody species (Moringa oleifera Lam., Leucaena
leucocephala Lam., Jatropha curcas L., Anacardium occidentale L. and Parkia biglobosa
Jacq.) subjected to a gradient of water and nutrient availability in an afforestation trial on
degraded cropland in the semi-arid zone of Benin, West Africa. For three of the species
studied, the allometric relationships between basal diameter and biomass components (i.e.
leaves, stems and roots) were described best by a simple power-law model (R2[ 0.93).
The incorporation of species-specific height–diameter relationships and total height as
additional predictors in the power-law function also produced reasonable estimates of
biomass. Fifteen months after planting, roots accounted for 10–58% of the total biomass
while the root-to-shoot ratio ranged between 0.16 and 0.73. The total biomass of the
saplings ranged between 1.4 and 10.3 Mg ha-1, yielding 0.6–4.3 Mg C ha-1, far
exceeding the biomass in the traditional fallow system. The rate of stem carbon seques-
tration measured ca. 0.62 Mg C ha-1 year-1. Overall, the allometric equations developed
in this study are generally useful for assessing the standing shoot and root biomass of the
Electronic supplementary material The online version of this article (https://doi.org/10.1007/s11056-017-9624-2) contains supplementary material, which is available to authorized users.
& Asia [email protected]
1 Center for Development Research (ZEF), Bonn University, Genscherallee 3, 53113 Bonn, Germany
2 WASCAL Competence Center, 06 P.O. Box 9507, Ouagadougou, Burkina Faso
3 AFC Agriculture and Finance Consultants GmbH, Dottendorfer Straße 82, 53129 Bonn, Germany
4 Division of Environmental Science and Ecological Engineering, Korea University, 145 Anam-Ro,Seongbuk-Gu, Seoul 02841, Korea
123
New Forestshttps://doi.org/10.1007/s11056-017-9624-2

five afforestation species during the juvenile growth stage and can help in reporting and
verifying carbon stocks in young forests.
Keywords Carbon stock � Height–diameter allometry � Jatropha curcas � Powerfunction � Roots � West Africa
Introduction
Deforestation and forest degradation, particularly in (sub-)tropical developing countries
contribute substantially to carbon dioxide (CO2) emissions into the atmosphere (Pearson
et al. 2017). International programs (e.g. REDD ? and CDM) have been set up to support
national efforts towards carbon sequestration and combat desertification through
afforestation and reforestation (AR) activities (UNFCCC 1997, 2010; Hosonuma et al.
2012). In this regard, afforestation using multi-purpose tree species has been widely
promoted as a way to restore degraded drylands and improve rural livelihoods by providing
bioenergy feedstock (Baumert et al. 2018) and marketable non-timber forest products,
including carbon credits (Djanibekov et al. 2013; Yeboah et al. 2014).
Reporting and verifying the biomass and carbon dynamics of afforested areas for
REDD ? and recent efforts to increase the plantation acreage of commercially important
tree species in West African drylands (e.g. http://www.thp.org/the-miracle-moringa-tree.
Accessed 4/22/2017) need to be accompanied by accurate documentation of the growth
potential of the tree species considered for afforestation. However, information about
carbon concentration, growth allometry, and sapling survival is still lacking, meaning
realistic projections for carbon sequestration using multi-species afforestation in semi-arid
Africa are difficult to achieve (Yeboah et al. 2014; Weber et al. 2017; Baumert et al. 2018).
Developing a database for this information and using it to derive allometric equations that
can be used for tree growth predictions is the starting point for addressing the informational
gap in Africa. The findings can be further incorporated into process-based models to extend
the applicability of the results across a wide range of semi-arid environmental conditions
(Kalliovirta and Tokola 2005; Blujdea et al. 2012).
Very few allometric models are available for use in predicting the standing biomass of
tree species in sub-Saharan Africa (e.g. Henry et al. 2011; Baumert and Khamzina 2015;
Tjeuw et al. 2015), and of those, the majority were derived using data from mature trees
(Nelson et al. 2014), which exhibit relatively little variability in biomass. Moreover, trees
introduced on marginal land, which is characterized by poor soils, often differ in terms of
growth trajectory from those growing in more favourable edaphic conditions or under more
intensive management (Delagrange et al. 2004; Lupi et al. 2017; Noulekoun et al. 2017a).
Hence, the lack of biomass data for juvenile forests and tree plantations under sub-optimal
soil conditions results in inaccurate estimates of biomass and carbon stocks, affecting
carbon accounting and management decisions (Blujdea et al. 2012).
The robustness of allometric predictions depends on the model’s choice and its ade-
quacy to capture prevalent growing conditions (Chave et al. 2004; Sileshi 2014; Picard
et al. 2015). The power-law equation is the most commonly used allometric model for
estimating biomass based on stem diameter or height or their combination (e.g. Brown
1997; Sileshi 2014; Baumert and Khamzina 2015). The inclusion of height in allometric
models has reportedly led to little or no improvement in the performance of these models,
suggesting that stem diameter (i.e. the diameter at breast height, DBH or basal diameter,
D) alone is a robust predictor of aboveground biomass (AGB; Youkhana and Idol 2011;
New Forests
123

Kuyah et al. 2012a, 2013, 2016; Lin et al. 2017; Paul et al. 2016) and belowground biomass
(BGB) (Kuyah et al. 2012b; Baumert and Khamzina 2015) for mature plants of various tree
species and irrespective of the land-use systems observed in both humid and (semi)-arid
tropics. Whether the addition of height as a predictor would yield less biased biomass
estimates for young trees in afforestation systems has yet to be analysed.
Site characteristics (i.e. climate and soil properties), tree morphology and ontogenetic
stages reportedly influence biomass growth and hence the accuracy of biomass prediction
(e.g. Ketterings et al. 2001; Chave et al. 2004; Pilli et al. 2006; Chave et al. 2014; Baumert
and Khamzina 2015). Given the uncertainty in allometric equations induced by the vari-
ation of model parameters between sites, Ketterings et al. (2001) suggested the incorpo-
ration of site-specific height–diameter relations into the power model. Therefore, when
generalizing allometric predictors to enhance their scope and extend their applicability to a
wide range of forest systems, the degree of local specificity and allometric model’s suit-
ability still needs to be taken into account.
Allometric equations for predicting BGB, a considerable biotic carbon pool, are less
commonly reported than those for AGB due to the methodological challenges associated
with root excavation (Mokany et al. 2006; Baumert and Khamzina 2015). Therefore, the
BGB is often estimated using the root: shoot ratio (RSR) assuming that the RSR reflects the
differential investment of resources between above- and belowground organs under the
influence of biotic, abiotic and management factors (Mokany et al. 2006). Broad-scale
derived RSRs, e.g. IPCC default value, have been widely used to quantify BGB for carbon
accounting in the absence of locally valid RSRs (IPCC 2003; Mokany et al. 2006). Since
the information is largely unavailable for many dryland afforestation species, the devel-
opment of allometric equations and RSR is necessary for a reliable estimation of BGB.
This study thus aimed to (1) develop allometric equations to estimate the standing
biomass (i.e. the leaves, stems and roots) of juvenile trees of five drought-deciduous woody
species proposed for the afforestation of degraded lands in the semi-arid zone of Northern
Benin and similar agro-ecological conditions in West Africa, and (2) validate the elabo-
rated equations with independent datasets and against the available allometric equations for
tropical semi-arid tree plantations and forests. Based on empirical data for the biomass and
carbon concentration in plant tissues, the carbon stocks and partitioning between the
above- and belowground biomass of saplings were quantified for a multi-species
afforestation system on degraded cropland.
Materials and methods
Study area
A multi-species afforestation experiment was established on degraded cropland in July
2014 in Pouri village (N10�5408.400 and E1�4047.400), located in the semi-arid Atacora
Department of Northern Benin (Fig. 1, Noulekoun et al. 2017a). The climate in the study
area is characterized by a single rainy season (April–October) followed by a dry season
(November–March). The long-term (1986–2015) annual precipitation averages about
1085 mm while temperatures range between 11 and 45 �C, with an annual mean of
27.5 �C.The experimental afforestation site was savanna forest prior to being clear cut and next
cropped with a successional 3-year intercrop of either sorghum and cowpea or maize
New Forests
123

Fig. 1 Location of the afforestation sites in the semi-arid climate zone of Northern Benin
New Forests
123

followed by yam for about a decade. The site experienced a decline in crop yields and soil
nutrients prior to afforestation. More site details have been reported previously (Noulekoun
et al. 2017a).
Plant material and experimental design
Five (semi-) deciduous tree and shrub species of socio-economic importance in the study
region were included in the experiment (Table 1). All five species provide food and/or
medicine for human consumption and ecosystem services of relevance to land reclamation.
Plantation establishment consisted of mechanical soil preparation (i.e. the clearing of
sparse woody vegetation, ploughing and fencing) and manual transplantation of seedlings
after 2.5–4 months following germination at a local nursery 15–20 km from the experi-
mental site. All seedlings were raised from seeds collected from mature trees growing in
the study area. The number of sampled trees ranged from at least 2 for L. leucocephala and
P. biglobosa to 4 or 5 for the other species (personal communication with the tree nursery
supervisor).
The experiment compared plant growth between untreated control plots (i.e. no silvi-
cultural treatments) and plots subject to manuring, irrigation or combinations of both
(Noulekoun et al. 2017a). The initial stand density was 5000 trees ha-1 (2 9 1 m spacing).
Table 1 General characteristics and stem dimensions (basal diameter [cm] and height [m]) of the sampledsaplings for five afforestation species in the semi-arid region of Northern Benin
Tree species(commonname)
Growthform
Numberof trees
Mean (min, max) Products, services, and usesa
Diameter Height
Moringaoleifera Lam.(Drumsticktree)
Small tree 84 5.1 (2.6, 8.3) 2.8 (1.2, 4.4) Food, fodder, firewood,medicine, soil fertilityimprovement, erosion control,live fences and windbreaks
Jatrophacurcas L.(Physic nut)
Shrub orsmalltree
84 5.1 (2.8, 7.7) 1.2 (0.8, 1.8) Bioenergy, medicine, soilfertility improvement, erosioncontrol, live fences,afforestation of marginal land
LeucaenaleucocephalaLam.(Leucaena)
Small ormedium-sizedtree
84 3.2 (1.6, 7.3) 2.2 (1.1, 3.9) Food, fodder, firewood, nitrogenfixation, soil fertilityimprovement, erosion control,windbreaks and intercropping
AnacardiumoccidentaleL. (Cashew)
Medium-sizedtree
72 2.6 (1.2, 5.2) 0.9 (0.4, 1.9) Food, fodder, firewood,intercropping
ParkiabiglobosaJacq. (Africanlocust bean)
Tree 57 1.4 (0.4, 3.9) 0.5 (0.2, 1.4) Food, fodder, firewood, timber,soil fertility improvement,windbreaks and intercropping
aDerived from Orwa et al. (2009). Only products and services specific to Northern Benin are indicated
New Forests
123

Measurements, biomass sampling and carbon content analysis
Juvenile tree growth was monitored during the first 15 months after planting (MaP) cov-
ering the rainy seasons of 2014 and 2015 and the intervening dry season. Just before
planting the seedlings in the field (i.e. MaP = 0), ten plants of each species were randomly
chosen to determine the mean reference values for different biomass components. Next,
biometric measurements were conducted at 5 MaP (corresponding to the end of the 2014
rainy season), 11 MaP (the end of the 2015 dry season) and 15 MaP (the end of the 2015
rainy season). Height (H, m) and the basal diameter (D, cm) were measured for 2–6
randomly selected juvenile trees per experimental plot (Noulekoun et al. 2017a). Subse-
quently, the measured trees were felled and the aboveground parts separated into leaves
(including the petiole), stems, branches, and (if present) reproductive parts. Next, the entire
rooting system was manually excavated, washed free of soil on a sieve and sectioned into
coarse (ø[ 2 mm) and fine (ø\ 2 mm) fractions. The fresh mass of all harvested frac-
tions was recorded in the field using a 7-kg portable scale (accuracy 0.1 g). Sub-samples of
the harvested fractions were oven-dried at 75 �C until constant weight and their dry mass
determined. Woody fractions were cut into small pieces to facilitate the drying process.
The oven-dried sub-samples collected at 15 MaP were finely ground and analysed for
carbon concentration using a mass spectrometer (ANCA–SL/20-20, SerCon, UK), with 2
replicates per sample.
Allometric analyses
The conventional power-law equation (Y = aXb) was used to describe the empirical
allometric relationship between tree biological traits Y and X. To avoid challenges asso-
ciated with ordinary least squares (OLS) log-linear regression and back-transformation of
the log-transformed equation into its initial form (Packard et al. 2011; Sileshi 2014; Kuyah
et al. 2016), a nonlinear regression was fitted to the power-law equations (Eqs. 1, 2, 3, 4).
The robust standard error estimation option in STATA was used to control for
heteroscedasticity (StataCorp 2015). In this analysis, 95% confidence intervals (CIs) and
the percent relative standard error (PRSE), i.e. the standard error (SE) of the parameter
divided by its absolute value (Sileshi 2014), were used to reflect uncertainty in the model’s
estimates of the scaling coefficient (a) and the exponent (b). A parameter estimate was
considered unreliable if its PRSE was[ 30% (Sileshi 2014). Data from all three harvest
periods and treatments were pooled for the analyses to increase the generalizability of the
equations for the large range of tree diameters (Table 1) found in saplings under various
nutrient and water availability gradients (the effect of age and treatment on the allometric
relationships is presented in Appendix 1, Supplementary Material). Reproductive biomass
(i.e. the fruit of J. curcas and pods of M. oleifera) was omitted from the analyses as
suggested by Niklas and Enquist (2002) because it represented only a minor proportion
(2–5%) of the total biomass. Only coarse roots were considered in the estimation of root
carbon stocks.
Relationship between height (H) and diameter (D)
Since allometric relations are influenced by growth stages (Pilli et al. 2006), the rela-
tionship between tree height and diameter (H–D) was initially analysed by plotting H (m)
versus D (cm) to identify the ontogenetic stages of each species. Next, the H–D growing
New Forests
123

functions were described by fitting either a linear or quadratic curve (Sit 1994; Pilli et al.
2006). The power function was further applied to establish the empirical allometric rela-
tionships between H and D according to:
H ¼ kDc; ð1Þ
where c represents the estimate of the site-specific H–D relationship (Ketterings et al.
2001).
Relationship between biomass (M) and diameter (D)
An allometric power model with D as the sole predictor variable (Eq. 2), an allometric
power model with D in combination with H (Eq. 3), and the model suggested by Ketterings
et al. (2001; Eq. 4), which incorporates the site-specific H–D relationship (c, Eq. 1), were
all tested for their ability to predict biomass:
M ¼ aDb ð2Þ
M ¼ a DxHð Þb ð3Þ
M ¼ aD2þc: ð4Þ
For each species, the allometric relationship between each biomass fraction (i.e. leaves,
stems, and roots) and D was analysed according to Eqs. (2), (3) and (4). The selection of
the best fitting equation was based on the highest coefficient of determination (R2), the
lowest root mean square of error (RMSE), the lowest mean absolute percentage error
(MAPE), and the lowest mean relative error (MRE) between the predicted (Mp) and
corresponding observed (Mo) biomass values:
MAPE ¼ 100
n
Xn
i¼1
Mp�Moj jMo
ð5Þ
MRE ¼ 100
n
Xn
i¼1
Mp�Mo
Mo: ð6Þ
Model validation
The available independent dataset (Baumert and Khamzina 2015) was used to validate the
equations developed for J. curcas. The dataset (n = 101) contained observations of the
woody AGB (WAGB), BGB and D (0.7–20 cm) of J. curcas trees grown in various
cultivation systems including small-scale intercropping, marginal land afforestation,
intensively managed plantations, live fences and contour hedges in the semi-arid zones of
Burkina Faso. An additional validation dataset was derived from an afforestation trial in
Dassari village in Benin, located 8–10 km from the experimental site (Fig. 1). This dataset
included WAGB and BGB observations of 78 saplings (1.5\D\ 7.3 cm). At Dassari
village, the seedlings were planted in July 2014 on agricultural fallow land and subjected to
the same silvicultural treatments as in Pouri.
New Forests
123

The scatter plot of predicted versus observed values and the test of significance of slope
(b = 1) and intercept (a = 0) were used for evaluating the quality of model fit (Pineiro
et al. 2008; Sileshi 2014). The predicted biomass values were simulated by Eq. (2).
Statistical analyses
All statistical analyses were performed using STATA 14 (StataCorp 2015). The normality
and homoscedasticity of the errors were checked using: (1) a skewness and kurtosis test,
(2) normal and kernel density distributions and (3) a plot of residuals against fitted values.
A linear mixed-effect model with the least significant difference (LSD) post hoc test for
mean separation was used to assess differences in MAPE with respect to the equations
(Eqs. 2, 3, 4) and biomass fractions. The random term in the model was plot identity,
while the fixed terms included the equations and biomass fractions.
Results
Relationship between tree H and D
An analysis of the H and D ratio in order to identify potentially different growth stages
revealed a linear pattern for all species except M. oleifera. Although there was a square
misspecification according to the link test (_hatsq\ 0.05) for the latter species, the point
of inflection fell outside the data range. Consequently, for all five species, only one growth
phase (juvenile) was recognised for the subsequent analyses.
Significant and strong allometric relationships (p\ 0.0001; Table 2) were observed
between H and D for all the species with reliable parameter (k and c) estimates
(PRSE\ 11%). No obvious pattern was detectable in the scatter plots of the residuals.
Table 2 Estimates of allometric parameters (k and c), percent relative standard error (PRSE) and coeffi-cient of determination (R2) for the relation between height (H, m) and basal diameter (D, cm) using Eq. (1)(H = kDc) for five afforestation species
Species N k (PRSE) 95% CI for k c (PRSE) 95% CI for c R2
M. oleifera 84 0.71 (9.1) 0.58–0.84 0.85 (6.2) 0.74–0.95 0.98
J. curcas 84 0.48 (7.7) 0.41–0.56 0.57 (8.4) 0.47–0.66 0.99
L. leucocephala 84 0.88 (6.6) 0.76–0.99 0.79 (7.7) 0.67–0.91 0.98
A. occidentale 72 0.49 (5.3) 0.44–0.54 0.76 (7.2) 0.65–0.87 0.98
P. biglobosa 57 0.37 (4.4) 0.34–0.40 0.83 (10.6) 0.66–1.01 0.93
Reported are the number of trees (N) and the confidence interval (CI) of each estimate
k is the scaling coefficient of the allometric relationship between H and D; c represents both the scalingexponent and the estimate of the site-specific H–D relation
New Forests
123

Allometric equations
Aboveground biomass
The empirical allometric coefficients for estimating the biomass of each aboveground
fraction using the different equations are presented in Table 3. All models had significant
(p\ 0.0001) and reliable parameter estimations (i.e. the estimates were within a 95% CI).
Irrespective of the bio-fraction, higher R2 and lower RMSE, MAPE and MRE values were
observed for the model fitted to the power equation (Eq. 2) than for the power models
incorporating H (Eq. 3) and the H–D relationship (Eq. 4) for M. oleifera, J. curcas and A.
occidentale (Table 3). Incorporating the H–D relationship (Eq. 4) yielded a predictive
power similar to that of the power model (Eq. 2) for J. curcas and A. occidentale. Adding
H (Eq. 3) increased the predictive power by 2–23% for P. biglobosa and L. leucocephala,
albeit with unreliable a estimates for the latter species, as evidenced by a PRSE[ 30% for
TAGB and LB. The comparison of model performance based on the MAPE and MRE
between observed and estimated AGB revealed that incorporating the H–D relationship
(Eq. 4) for L. leucocephala substantially reduced the prediction error by 17–20% compared
to Eq. (3), although it resulted in a lower R2 (Table 3).
Fitting the equations to leaf biomass (LB) resulted in lower predictive power compared
to TAGB and WAGB forM. oleifera, L. leucocephala and A. occidentale. In particular, LB
estimations were substantially biased for P. biglobosa. All models using WAGB as the
dependent variable performed better than those using TAGB for M. oleifera, J. curcas, L.
leucocephala and P. biglobosa, as evidenced by the increased R2 (1–7%) and/or reduced
MAPE and MRE (Table 3).
Belowground biomass
Similar to the models for AGB, all parameters considered as proxies for BGB were
estimated with acceptable errors (PRSE\ 30%; Table 4). The power-law equation (Eq. 2)
turned out to be the most precise and unbiased (i.e. highest R2 and lowest RMSE, MAPE
and MRE) in the prediction of the BGB of M. oleifera, J. curcas and A. occidentale. The
model that included H (Eq. 3) performed better than the other models (Eq. 2 and 4) for P.
biglobosa, whereas the power model incorporating the H–D relationship (Eq. 4) best
described the BGB-basal diameter relationship for L. leucocephala (Table 4).
J. curcas equations validation
The scatter plots for the observed versus predicted WAGB and BGB values revealed no
significant prediction errors for the ‘‘juvenile’’ (D\ 5.5) and ‘‘afforestation’’
(1.8\D\ 5.7) datasets of Baumert and Khamzina (2015) or for the Dassari dataset. This
was supported by the statistical test using a = 0 and b = 1, which revealed no significant
departure (p[ 0.05) of the fitted lines from the 1:1 lines (Fig. 2).
Biomass and carbon stocks
At the onset of the experimentation (MaP = 0), the mean (± standard error of the mean,
SEM) stem biomass was 0.003 ± 0.001 Mg ha-1 for M. oleifera, 0.010 ± 0.002 Mg ha-1
for J. curcas, 0.002 ± 0.000 Mg ha-1 for L. leucocephala, 0.009 ± 0.001 Mg ha-1 for A.
New Forests
123

Table
3Model
param
eter
estimates
(aandb),percentrelativestandarderror(PRSE)andgoodnessoffitstatistics
(coefficientofdeterminationR2,rootmeansquareerror
[RMSE],meanabsolutepercentageerror[M
APE]andthemeanrelativeerror[M
RE])oftheallometricrelationshipsbetweentotalabovegroundbiomass(TAGB,kgtree
-1),
woodyabovegroundbiomass(W
AGB,kgtree
-1)andleaf
biomass(LB,kgtree
-1),andbasal
diameter
(D,cm
)forfiveafforestationspecies
Species
Biomassvariables
Equations
Eq.
Na(PRSE)
b(PRSE)
R2
RMSE
MAPE(%
)MRE(%
)
M.oleifera
TAGB
M=
aDb
284
0.010(25.2)
2.36(6.2)
0.97
0.12
22.8c
10.2
M=
a(D
9H)b
384
0.018(17.3)
1.24(4.5)
0.96
0.13
31.5d
11.6
M=
aD2?c
484
0.004(3.9)
2.85
0.96
0.13
19.1ab
-6.1
WAGB
M=
aDb
284
0.008(22.4)
2.38(5.4)
0.97
0.07
18.4a
7.2
M=
a(D
9H)b
384
0.014(14.1)
1.26(3.6)
0.97
0.09
23.2bc
7.1
M=
aD2?c
484
0.003(3.7)
2.85
0.96
0.10
19.1ab
-7.6
LB
M=
aDb
260
0.010(34.8)
1.49(14.2)
0.93
0.04
19.9abc
6.5
M=
a(D
9H)b
360
0.018(21.9)
0.71(12.2)
0.92
0.04
20.9abc
6.5
M=
aD2?c
460
0.001(7.6)
2.85
0.86
0.05
38.5d
-20.0
J.curcas
TAGB
M=
aDb
284
0.004(23.8)
2.93(4.4)
0.96
0.13
32.2e
10.7
M=
a(D
9H)b
384
0.024(23.9)
1.64(7.1)
0.93
0.18
39.9f
18.3
M=
aD2?c
484
0.008(2.8)
2.57
0.96
0.14
37.3f
22.6
WAGB
M=
aDb
284
0.004(21.2)
2.74(4.4)
0.96
0.08
20.3a
3.4
M=
a(D
9H)b
384
0.020(24.2)
1.53(8.2)
0.93
0.11
26.9d
9.8
M=
aD2?c
484
0.005(3.1)
2.57
0.96
0.08
21.7bc
8.3
LB
M=
aDb
260
0.003(24.3)
2.48(5.3)
0.96
0.05
20.8ab
4.4
M=
a(D
9H)b
360
0.015(18.5)
1.40(6.2)
0.95
0.06
25.3
cd
8.2
M=
aD2?c
460
0.003(3.1)
2.57
0.96
0.05
20.5abc
2.4
New Forests
123
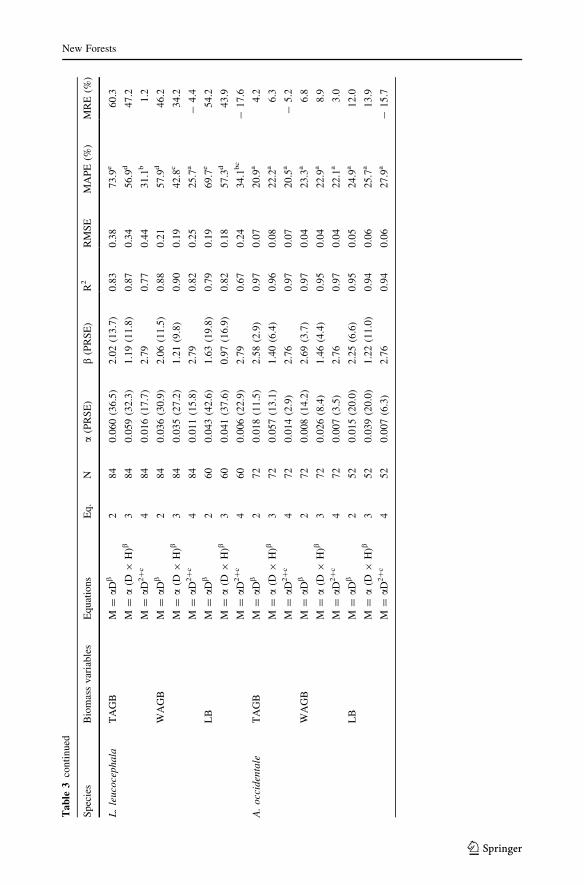
Table
3continued
Species
Biomassvariables
Equations
Eq.
Na(PRSE)
b(PRSE)
R2
RMSE
MAPE(%
)MRE(%
)
L.leucocephala
TAGB
M=
aDb
284
0.060(36.5)
2.02(13.7)
0.83
0.38
73.9e
60.3
M=
a(D
9H)b
384
0.059(32.3)
1.19(11.8)
0.87
0.34
56.9d
47.2
M=
aD2?c
484
0.016(17.7)
2.79
0.77
0.44
31.1b
1.2
WAGB
M=
aDb
284
0.036(30.9)
2.06(11.5)
0.88
0.21
57.9d
46.2
M=
a(D
9H)b
384
0.035(27.2)
1.21(9.8)
0.90
0.19
42.8c
34.2
M=
aD2?c
484
0.011(15.8)
2.79
0.82
0.25
25.7a
-4.4
LB
M=
aDb
260
0.043(42.6)
1.63(19.8)
0.79
0.19
69.7e
54.2
M=
a(D
9H)b
360
0.041(37.6)
0.97(16.9)
0.82
0.18
57.3d
43.9
M=
aD2?c
460
0.006(22.9)
2.79
0.67
0.24
34.1bc
-17.6
A.occidentale
TAGB
M=
aDb
272
0.018(11.5)
2.58(2.9)
0.97
0.07
20.9a
4.2
M=
a(D
9H)b
372
0.057(13.1)
1.40(6.4)
0.96
0.08
22.2a
6.3
M=
aD2?c
472
0.014(2.9)
2.76
0.97
0.07
20.5a
-5.2
WAGB
M=
aDb
272
0.008(14.2)
2.69(3.7)
0.97
0.04
23.3a
6.8
M=
a(D
9H)b
372
0.026(8.4)
1.46(4.4)
0.95
0.04
22.9a
8.9
M=
aD2?c
472
0.007(3.5)
2.76
0.97
0.04
22.1a
3.0
LB
M=
aDb
252
0.015(20.0)
2.25(6.6)
0.95
0.05
24.9a
12.0
M=
a(D
9H)b
352
0.039(20.0)
1.22(11.0)
0.94
0.06
25.7a
13.9
M=
aD2?c
452
0.007(6.3)
2.76
0.94
0.06
27.9a
-15.7
New Forests
123

Table
3continued
Species
Biomassvariables
Equations
Eq.
Na(PRSE)
b(PRSE)
R2
RMSE
MAPE(%
)MRE(%
)
P.biglobosa
TAGB
M=
aDb
257
0.025(24.7)
2.00(15.1)
0.84
0.04
60.8d
39.4
M=
a(D
9H)b
357
0.070(8.3)
1.15(7.2)
0.94
0.03
38.2bc
18.0
M=
aD2?c
457
0.010(20.2)
2.83
0.78
0.05
51.5c
-27.9
WAGB
M=
aDb
257
0.010(28.2)
2.01(18.6)
0.84
0.02
57.0d
46.1
M=
a(D
9H)b
357
0.028(6.2)
1.20(8.3)
0.96
0.01
26.9a
16.4
M=
aD2?c
457
0.004(23.0)
2.83
0.78
0.02
43.6bd
-27.1
LB
M=
aDb
240
0.023(19.7)
1.69(14.5)
0.90
0.02
113.2abcd
100.8
M=
a(D
9H)b
340
0.052(9.2)
0.96(8.2)
0.92
0.02
89.5abcd
76.2
M=
aD2?c
440
0.006(22.0)
2.83
0.79
0.03
54.4bcd
-38.9
Nisthenumber
oftrees(sam
ple
size)usedto
construct
themodels.Fortheleaf
biomass(LB),datacollectedat
theendofthedry
season(i.e.11MaP)wereexcluded
aandbarescalingcoefficientandexponent,respectively
aWithin
each
species,MAPEvalues
followed
bythesamesuperscriptletter
arenotsignificantlydifferentaccordingto
LSDposthoctests.Asignificance
levelofp\
0.05was
usedas
thethreshold
value
New Forests
123

occidentale and 0.002 ± 0.000 Mg ha-1 for P. biglobosa. At 15 MaP, TAGB was
5.2 ± 0.3 Mg ha-1 for M. oleifera, 5.3 ± 0.3 Mg ha-1 for J. curcas, 7.8 ± 0.6 Mg ha-1
for L. leucocephala, 3.2 ± 0.3 Mg ha-1 for A. occidentale and 0.8 ± 0.1 Mg ha-1 for P.
biglobosa, with RSR of 0.32 ± 0.08, 0.30 ± 0.06, 0.34 ± 0.08, 0.16 ± 0.04 and
0.73 ± 0.24, respectively. Total biomass production differed significantly between the
species (p\ 0.001) with the highest total biomass accumulated at 15 MaP by L. leuco-
cephala (10.3 Mg ha-1), and the lowest by P. biglobosa (1.4 Mg ha-1; Supplementary
Material, Appendix 2).
A comparison of the carbon concentration between the biomass fractions and species
found that it varied between 40.3 and 43.8% (Supplementary Material, Appendix 2). Using
the empirical carbon concentration data, the total carbon stock amounted to
0.6 ± 0.002 Mg ha-1 for P. biglobosa, 1.5 ± 0.002 Mg ha-1 for A. occidentale,
Table 4 Model parameter estimates (a and b), percent relative standard error (PRSE) and goodness of fitstatistics (coefficient of determination R2, root mean square error [RMSE], mean absolute percentage error[MAPE] and the mean relative error [MRE]) of the allometric relationships between belowground biomass(BGB, kg tree-1) and basal diameter (D, cm) for five afforestation species
Species Equations Eq. N a (PRSE) b(PRSE)
R2 RMSE MAPE(%)
MRE(%)
M. oleifera M = aDb 2 84 0.032 (28.2) 1.19(9.9)
0.94 0.06 33.9a 17.1
M = a(D 9 H)b
3 84 0.050 (18.3) 0.57(10.9)
0.92 0.07 39.9b 20.3
M = aD2?c 4 84 0.001 (6.8) 2.85 0.80 0.11 40.8ab - 26.3
J. curcas M = aDb 2 84 0.001 (17.3) 2.95(3.4)
0.97 0.03 14.7a 1.3
M = a(D 9 H)b
3 84 0.007 (15.0) 1.68(4.7)
0.95 0.04 17.9b 6.6
M = aD2?c 4 84 0.002 (3.0) 2.57 0.97 0.03 19.3b 12.5
L.leucocephala
M = aDb 2 77 0.024 (24.7) 1.87(10.2)
0.90 0.09 43.0b 30.9
M = a(D 9 H)b
3 77 0.027 (19.6) 1.06(7.9)
0.91 0.09 35.3a 24.7
M = aD2?c 4 84 0.005 (15.8) 2.79 0.81 0.13 33.2ab - 20.9
A. occidentale M = aDb 2 66 0.004 (19.1) 2.37(6.5)
0.94 0.02 29.0a 13.35
M = a(D 9 H)b
3 66 0.010 (10.3) 1.36(4.1)
0.95 0.01 30.0a 10.5
M = aD2?c 4 72 0.002 (5.6) 2.76 0.94 0.02 25.6a - 7.5
P. biglobosa M = aDb 2 54 0.032 (16.8) 1.43(19.9)
0.88 0.03 53.8a 38.3
M = a(D 9 H)b
3 54 0.070 (6.2) 0.75(12.9)
0.89 0.03 54.9a 38.1
M = aD2?c 4 57 0.007 (27.3) 2.83 0.70 0.04 60.4a - 53.5
N is the number of trees (sample size) used to construct the models
a and b are scaling coefficient and exponent, respectivelyaWithin each species, MAPE values followed by the same superscript letter are not significantly differentaccording to LSD post hoc tests. A significance level of p\ 0.05 was used as the threshold value
New Forests
123

2.8 ± 0.003 Mg ha-1 for M. oleifera, 2.8 ± 0.003 Mg ha-1 for J. curcas, and
4.3 ± 0.007 Mg ha-1 for L. leucocephala. The foliar carbon constituents were on average
18–61% of the AGB of these deciduous species. Furthermore, the carbon concentration in
stems ranged between 40.3 and 42.8% in a comparison of the five species (Supplementary
Material, Appendix 2). Assuming constant stem carbon concentration over the study
period, the increase in stem carbon storage ranged from 0.10 Mg C ha-1 year-1 for P.
biglobosa to 1.1 Mg C ha-1 year-1 for M. oleifera.
Considering all species together, the BGB accounted for about a quarter (24.7%) of total
plant biomass (6.21 ± 0.43 Mg ha-1), resulting in a mean and median RSR of
(A) WAGB (B) BGB
Afforesta�ona=-0.000 (-0.019, 0.019)
b=0.97 (0.68, 1.25)RD=41.2%
0.00
0.03
0.06
0.09
0.12
0.15
0.18
0.00 0.03 0.06 0.09 0.12 0.15 0.18
Obs
erve
d
1:1
Juvenilea=-0.002 (-0.005, 0.000)
b=0.76 (0.67, 0.84)RD=74.4%
0.0
0.1
0.2
0.3
0.4
0.0 0.1 0.2 0.3 0.4
Obs
erve
d
1:1
Juvenilea=-0.001 (-0.004, 0.002)
b=1.03 (0.94, 1.12)RD=49.6%
0.00
0.02
0.04
0.06
0.08
0.10
0.12
0.00 0.02 0.04 0.06 0.08 0.10 0.12
Obs
erve
d
1:1
Afforesta�ona=-0.021 (-0.038, -0.003
b=0.90 (0.74, 1.07)RD=50.6%
0.0
0.1
0.2
0.3
0.4
0.0 0.1 0.2 0.3 0.4
Obs
erve
d
1:1
Dassaria=0.003 (-0.003, 0.010)
b= 0.95 (0.89, 1.02)RD=24.9%
0.00
0.07
0.14
0.21
0.28
0.35
0.00 0.07 0.14 0.21 0.28 0.35
Obs
erve
d
Predicted
1:1
Dassaria=-0.012 (-0.026, 0.002)
b=0.96 (0.88, 1.04)RD= 35.2%
0.0
0.1
0.2
0.3
0.4
0.6
0.7
0.0 0.1 0.2 0.3 0.4 0.6 0.7
Obs
erve
d
Predicted
1:1
Fig. 2 Scatterplots of observed and predicted woody aboveground biomass (WAGB, A) and belowgroundbiomass (BGB, B) derived from fitting J. curcas Eq. (2) to the Baumert and Khamzina (2015) data onjuvenile trees (named as ‘‘Juvenile’’) and trees grown in afforestation systems in Burkina Faso(‘‘Afforestation’’), and to the data of juvenile trees grown in the afforestation system in Dassari, NorthernBenin (‘‘Dassari’’). Circles represent observed values, solid lines are fitted lines of the predicted values anddashed lines are the 1:1 lines. Test of significance of the intercept (a) and slope (b) is indicated by the 95%confidence intervals (values in parenthesis). If the 95% confidence interval of ‘‘a’’ covers 0 and that of ‘‘b’’covers 1, then a = 0 and b = 1 cannot be rejected. The mean absolute percentage error (MAPE) and themean relative error (MRE) between predicted and observed values are displayed
New Forests
123

0.35 ± 0.03 and 0.31, respectively. Based on the weighted average of the carbon content in
the total biomass (41.7%) and the mean stem carbon concentration (41.5%) across all
species, the saplings at the afforestation site sequestered about 2.5 ± 0.001 Mg C ha-1 at
15 MaP, at a stem carbon accumulation rate of 0.62 Mg C ha-1 year-1.
Discussion
In agreement with previous studies (e.g. Youkhana and Idol 2011; Kuyah et al.
2012a, b, 2013; Baumert and Khamzina 2015; Kuyah et al. 2016; Lin et al. 2017), the
power function (Eq. 2) using basal diameter as the single predictor of TAGB, WAGB, LB
and BGB provided the most accurate estimations for saplings of three out of the five
afforestation species (M. oleifera, J. curcas and A. occidentale) tested in semi-arid Benin
(R2[ 0.93 and PRSE\ 30%). Large-scale (Ketterings et al. 2001) and global (Chave
et al. 2014) tropical studies suggested incorporating locally derived H–D relationships into
allometric equations to minimize prediction errors due to differing climate and soil con-
ditions. However, the inclusion of the elaborated site-specific H–D relations did not
improve the predictive capability of the corresponding model (Eq. 4) compared to that of
the simple power model (Eq. 2), possibly due to the relatively narrow environmental
gradients (e.g. rainfall, soil characteristics) at the afforestation sites (Noulekoun et al.
2017a). Nevertheless, TAGB and WAGB of J. curcas and A. occidentale were estimated
with similar precision by either approach, suggesting that the use of Eq. (4) obviates the
need for destructive sampling and offers a good trade-off between accuracy, cost and
practicability (Brown et al. 1989; Kuyah et al. 2012a). In line with previous findings on
mature tree allometries (Youkhana and Idol 2011; Kuyah et al. 2012a, 2016), the addition
of H (Eq. 3) in general did not improve model predictions for saplings in our study, with
the exception of the AGB and BGB of the slowest growing species, P. biglobosa.
Statistical diagnostics of model performance using MAPE and MRE showed that high
R2 values alone do not necessarily guarantee precise estimates, as postulated earlier
(Sileshi 2014; Baumert and Khamzina 2015) and as illustrated in our study by the higher
errors associated with Eqs. (2) and (3) compared to Eq. (4) for L. leucocephala. Moreover,
the model specification for various AGB fractions revealed less pronounced allometric
relationships between LB and D than between TAGB or WAGB and D for several species
(M. oleifera, L. leucocephala and A. occidentale). This is very likely due to the decidu-
ousness caused by seasonal and environmental changes overshadowing the allometric
impacts (Rubilar et al. 2010; Kuyah et al. 2013). The exclusion of LB, and hence con-
sidering WAGB only, increased model accuracy. This finding together with that of Bau-
mert and Khamzina (2015) support the argument that deciduousness cannot be easily
captured by allometric relations.
Given the dependence of the scaling exponent (b) between M and D on the relationship
between H and D, the consideration of ontogenetic stages may improve the accuracy of
biomass estimates (Pilli et al. 2006; Baumert and Khamzina 2015). At early ages and hence
with an incomplete diameter series (Pilli et al. 2006), only the juvenile growth phase could
be identified from our analysis of the H–D relation. The resulting negative allometric
relationship (c\ 1) observed between H and D for all the species implied that for the range
of empirical diameters in the current study, the height growth rate was lower than the
diameter growth rate. This follows the conclusion reported by Blujdea et al. (2012) for
young plantations of winter-deciduous, broadleaved species in Romania. Notably, the
New Forests
123

scaling exponent (c, 0.57) obtained for J. curcas in our study is very close to that (c, 0.55)
determined for the same species across various management systems in Burkina Faso by
Baumert and Khamzina (2015). The parameter c could therefore be considered as a proxy
for predicting J. curcas biomass based on D for broader environmental gradients than
recognised thus far. Despite the relatively small scale of the current study, the validation of
the models using other datasets confirmed both the limited influence of environmental
factors on the allometric parameters (a and b) and the applicability of the models to
broader environmental conditions (Baumert and Khamzina 2015). Specifically, the WAGB
and BGB estimates for J. curcas were validated using the independent dataset from
Burkina Faso (Fig. 2). Collectively, these findings suggest that the H–D relationship and
biomass estimates of J. curcas saplings are not significantly influenced by agro-ecological
variability in West Africa, which is dominated by poor soil fertility and low-input culti-
vation. J. curcas has been generally reported as tolerant to drought and marginal soil
conditions (Achten et al. 2010; Noulekoun et al. 2017a).
The reverse exercise, i.e. feeding our data into previously reported allometric equations,
revealed to what degree these equations might be applicable to the present case. For J.
curcas, applying the equation Baumert and Khamzina (2015) developed for juvenile trees
and those by Hellings et al. (2012) for trees with stems ranging from 4 to 16 cm in
diameter to our empirical data produced reasonable estimates of WAGB and the MAPE
and MRE values fell within the 95% confidence limits of the mean MAPE (20%) and MRE
(3.4%; Fig. 3; Supplementary material, Appendix 3). Other equations available for J.
curcas without consideration of ontogenetic stages showed poor fits, emphasizing that
caution must be taken when applying published allometric functions to different datasets,
without differentiating the age groups, even for the same species. Specifically, the function
proposed by Achten et al. (2010) based on a greenhouse experiment with seedlings resulted
in an underestimation of our WAGB data whereas equations by Baumert and Khamzina
0.0
0.4
0.8
1.2
1.6
2.0
3 4 5 6 7 8
WA
GB
(kg
tree
-1)
Basal diameter (D, cm)
Observed valuesEq. (2)Achten et al. 2010Ghezehei et al. 2009Hellings et al. 2012Baumert & Khamzina 2015_juvenileBaumert & Khamzina 2015_adultBaumert & Khamzina 2015_mature
Fig. 3 Predicted woody aboveground biomass (WAGB) for J. curcas using the equations developed byAchten et al. (2010) for seedlings (M = 0.0035D2.33), Ghezehei et al. (2009) (M = 0.001D3.53), Hellingset al. (2012) (M = 0.0019D3.03), Baumert and Khamzina (2015) for the juvenile growth stage(M = 0.003D2.74), Baumert and Khamzina (2015) for the adult growth stage (M = 0.003D3.03) andBaumert and Khamzina (2015) for the mature growth stage (M = 0.016D2.31), compared to Eq. (2)(M = 0.004D2.74). Further details on the equations, MAPE and MRE values are presented in Supplementarymaterial, Appendix 3
New Forests
123

(2015), previously developed for adult and mature trees, led to an overestimation (Fig. 3).
When using the equation developed for the mature growth stage, the overestimation of
sapling WAGB was particularly severe, as evidenced by an MRE = 133% (Fig. 3; Sup-
plementary material, Appendix 3). In this regard, applying allometric equations to data
beyond the initial calibration ranges is strongly not advised (Rothman 2002; Kuyah et al.
2012a; Sileshi 2014). Furthermore, the use of the generalized allometric equation devel-
oped by Brown (1997) for dry forests led to a substantial overestimation of TAGB
(404%\MRE\ 1235%) for all species, emphasizing that site-specificity needs to be
accounted for in allometric models to increase their accuracy (Chave et al. 2014; Kuyah
et al. 2016).
Our results suggest that the afforestation of degraded land with well-adapted and
adequately managed tree species can significantly contribute to ecosystem carbon stocks in
semi-arid regions. For instance, juvenile trees at the afforestation site accumulated stem
carbon at a rate of 0.62 Mg C ha-1 year-1, which is similar to the aboveground carbon
accrual (0.63 Mg C ha-1 year-1) in mature trees of African tropical forests (Lewis et al.
2009) and shows the potential of young forests in semi-arid environments. Moreover, the
total (shoots and roots) productivity (5.8 Mg ha-1 year-1) was about three times greater
than that of the 10-year-old fallow (shrubs and grasses) monitored in the vicinity of the
afforestation site, and greater than that of the degraded cropland that is largely devoid of
vegetation (Noulekoun et al. 2017b). The stem carbon concentration in the afforestation
species (41.5%) was also similar to that (41.5%) of the species studied by Weber et al.
(2017) in the Sahelian and Sudanian ecozones of Niger. Moreover, the total biomass
carbon stock of 2.8 Mg ha-1 measured in J. curcas plots 15 MaP in Benin exceeds that
reported by Diedhiou et al. (2017) for a 2 year-old J. curcas plantation in Senegal (2.2 Mg
C ha-1 with a stand density of 5000 trees ha-1). Even greater accrual of carbon stocks was
demonstrated by the other fast-growing species, L. leucocephala andM. oleifera. The AGB
accounted for the largest proportion of the measured carbon stocks although in these
juvenile trees, the foliage constituted up to 80% of AGB (P. biglobosa). As previously
reported (e.g. Mokany et al. 2006; Kuyah et al. 2013; Noulekoun et al. 2017b), BGB also
represented an important carbon pool in the semi-arid region of Benin, accounting for
10–58% of the total biomass.
The overall RSR mean (0.35 ± 0.03) and median (0.31) values of the saplings in Benin
were higher than the IPCC default value of 0.24 ± 0.02 for tropical hardwood species
(Cairns et al. 1997) and the mean (0.32 ± 0.02) and median (0.28) values determined for
juvenile, adult and mature trees in Kenyan agricultural landscapes (Kuyah et al. 2012b).
Besides vegetation composition and site conditions, the observed differences might also be
attributed to the lower water availability in semi-arid Benin, triggering increased root
biomass allocation. The higher RSR could also be characteristic of the juvenile growth
stage of the trees observed in Benin that favours a greater allocation of biomass to
belowground while a lower RSR is expected to develop with age (Cairns et al. 1997;
Mokany et al. 2006; Noulekoun et al. 2017b). These current results suggest that in any case
a RSR representative of the specific tree population and land-use system under study
should be used when estimating root carbon stocks (Snowdon et al. 2000).
New Forests
123

Conclusion
Allometric equations have been elaborated for predicting the AGB and BGB of saplings of
five woody species of different genera planted on degraded land under variable water and
nutrient supply in semi-arid Benin, West Africa. The conventional power equation pro-
vided the most conservative estimates of the biomass for most of the tested species.
Adjusting the power equations for the height–diameter relations resulted in an accurate
estimation of AGB based on the measured stem dimensions only, thus obviating the need
for destructive sampling. For the slowest growing P. biglobosa, including the tree height
improved the accuracy of the power model predictions.
The equations developed are applicable to saplings, and estimating the biomass of
seedlings and mature plants would require a wider range of stem diameter data. Within the
juvenile growth stage, the allometric relationships defined for J. curcas appeared valid for
the estimation of its biomass over a wide range of agro-ecological conditions in semi-arid
West Africa. In the absence of independent datasets for the other afforestation species, the
sensitivity of their allometric equations to environmental gradients remains to be tested.
Saplings accumulated a substantial amount of biomass and carbon at 15 MaP, by far
exceeding the biomass in the traditional fallow system and demonstrating the potential of
young forest plantations to offset CO2 emissions. RSRs that are representative of the
specific tree population and land-use system under study should be used when estimating
root carbon stocks. These findings provide specific insight into the allometry of semi-arid
afforestation species and can be used for site-adapted biomass predictions and fed into
process-based models to estimate biomass and carbon stocks under a variety of environ-
mental conditions.
Acknowledgements The authors are grateful to the German Federal Ministry of Education and Research(BMBF) who funded this study under the WASCAL (West African Science Service Center on ClimateChange and Adapted Land Use) program, Project No. 00100218. We thank Dr. Nadine Worou, the technicalstaff of the WASCAL study catchment in Dassari, and the numerous workers who facilitated the fieldactivities. We greatly appreciate the statistical guidance by Dr. Guido Luchters.
References
Achten WMJ, Maes WH, Reubens B, Mathijs E, Singh VP, Verchot L et al (2010) Biomass production andallocation in Jatropha curcas L. seedlings under different levels of drought stress. Biomass Bioenerg34:667–676. https://doi.org/10.1016/j.biombioe.2010.01.010
Baumert S, Khamzina A (2015) Allometric relations in Jatropha curcas production systems of BurkinaFaso. J Arid Environ 120:95–104. https://doi.org/10.1016/j.jaridenv.2015.04.015
Baumert S, Khamzina A, Vlek PLG (2018) Greenhouse gas and energy balance of Jatropha biofuel pro-duction systems of Burkina Faso. Energy Sustain Dev 42:14–23. https://doi.org/10.1016/j.esd.2017.09.007
Blujdea VNB, Pilli R, Dutca I, Ciuvat L, Abrudan IV (2012) Allometric biomass equations for youngbroadleaved trees in plantations in Romania. For Ecol Manag 264:172–184. https://doi.org/10.1016/j.foreco.2011.09.042
Brown S (1997) Estimating biomass and biomass change of tropical forests: a primer. UN FAO forestrypaper 134, Food and Agriculture Organization, Rome
Brown S, Gillespie AJ, Lugo AE (1989) Biomass estimation methods for tropical forests with applications toforest inventory data. For Sci 35(4):881–902
Cairns MA, Brown S, Helmer EH, Baumgardner GA (1997) Root biomass allocation in the world’s uplandforests. Oecologia 111(1):1–11
Chave J, Condit R, Aguilar S, Hernandez A, Lao S, Rolando P (2004) Error propagation and scaling fortropical forest biomass estimates. Philos Trans R Soc Lond 359:409–420
New Forests
123

Chave J, Rejou-Mechain M, Burquez A, Chidumayo E, Colgan MS, Delitti WB et al (2014) Improvedallometric models to estimate the aboveground biomass of tropical trees. Glob Change Biol20:3177–3190. https://doi.org/10.1111/gcb.12629
Delagrange S, Messier C, Lechowicz MJ, Dizengremel P (2004) Physiological, morphological and allo-cational plasticity in understory deciduous trees: importance of plant size and light availability. TreePhysiol 24:775–784
Diedhiou I, Diallo D, Mbengue A, Hernandez RR, Bayala R, Dieme R, Diedhiou PM, Sene A (2017)Allometric equations and carbon stocks in tree biomass of Jatropha curcas L. in Senegal’s PeanutBasin. Glob Ecol Conserv 9:61–69
Djanibekov U, Djanibekov N, Khamzina A, Bhaduri A, Lamers JPA, Berg E (2013) Impacts of innovativeforestry land use on rural livelihood in a bimodal agricultural system in irrigated drylands. Land UsePolicy 35:95–106. https://doi.org/10.1016/j.landusepol.2013.05.003
Ghezehei SB, Annandale JG, Everson CS (2009) Shoot allometry of Jatropha curcas. South For 71:279–286Hellings BF, Romijn HA, Franken YJ (2012) Carbon storage in Jatropha curcas tress in Northern Tanzania.
FACT Foundation, EindhovenHenry M, Picard N, Trotta C, Manlay RJ, Valentini R, Bernoux M, Saint-Andre L (2011) Estimating tree
biomass of sub-Saharan African forests: a review of available allometric equations. Silva Fennica45(3B):477–569
Hosonuma N, Herold M, De Sy V, De Fries RS, Brockhaus M, Verchot L, Angelsen A, Romijn E (2012) Anassessment of deforestation and forest degradation drivers in developing countries. Environ Res Lett7(4):1–12. https://doi.org/10.1088/1748-9326/7/4/044009
IPCC (2003) Good practice guidance for land use, land-use change and forestry. Intergovernmental Panel onClimate Change Geneva, Seelisberg
Kalliovirta J, Tokola T (2005) Functions for estimating stem diameter and tree age using tree height, crownwidth and existing stand database information. Silva Fennica 39(2):227–248
Ketterings QM, Coe R, van Noordwijk M, Ambagau Y, Palm CA (2001) Reducing uncertainty in the use ofallometric biomass equations for predicting aboveground tree biomass in mixed secondary forests. ForEcol Manag 146:199–209
Kuyah S, Dietz J, Muthuri C, Jamnadass R, Mwangi P, Coe R, Neufeldt H (2012a) Allometric equations forestimating biomass in agricultural landscapes: I. Aboveground biomass. Agric Ecosyst Environ158:225–234. https://doi.org/10.1016/j.agee.2012.05.011
Kuyah S, Dietz J, Muthuri C, Jamnadass R, Mwangi P, Coe R, Neufeldt H (2012b) Allometric equations forestimating biomass in agricultural landscapes: II. Belowground biomass. Agric Ecosyst Environ158:225–234. https://doi.org/10.1016/j.agee.2012.05.010
Kuyah S, Dietz J, Muthuri C, van Noordwijk M, Neufeldt H (2013) Allometry and partitioning of above-andbelow-ground biomass in farmed eucalyptus species dominant in Western Kenyan agricultural land-scapes. Biomass Bioenerg 55:276–284. https://doi.org/10.1016/j.biombioe.2013.02.011
Kuyah S, Sileshi GW, Rosenstock TS (2016) Allometric models based on Bayesian frameworks give betterestimates of aboveground biomass in the Miombo woodlands. Forests 7(2):13. https://doi.org/10.3390/f7020013
Lewis SL, Lopez-Gonzalez G, Sonke B, Affum-Baffoe K, Baker TR, Ojo LO et al (2009) Increasing carbonstorage in intact African tropical forests. Nature 457(7232):1003–1006. https://doi.org/10.1038/nature07771
Lin K, Lyu M, Jiang M, Chen Y, Li Y, Chen G, Xie J, Yang Y (2017) Improved allometric equations forestimating biomass of the three Castanopsis carlesii H. forest types in subtropical China. New For48(1):115–135. https://doi.org/10.1007/s11056-016-9559-z
Lupi C, Larocque GR, DesRochers A, Labrecque M, Mosseler A, Major J et al (2017) Biomass from younghardwood stands on marginal lands: allometric equations and sampling methods. Biomass Bioenerg98:172–181. https://doi.org/10.1016/j.biombioe.2017.01.023
Mokany K, Raison JR, Prokushkin A (2006) Critical analysis of root: shoot ratios in terrestrial biomes. GlobChange Biol 12:84–96. https://doi.org/10.1111/j.1365-2486.2005.001043.x
Nelson AS, Weiskittel AR, Wagner RG, Saunders MR (2014) Development and evaluation of abovegroundsmall tree biomass models for naturally regenerated and planted species in eastern Maine, USA.Biomass Bioenerg 68:215–227. https://doi.org/10.1016/j.biombioe.2014.06.015
Niklas KJ, Enquist BJ (2002) On the vegetative biomass partitioning of seed plant leaves, stems, and roots.Am Nat 159:482–497. https://doi.org/10.1086/339459
Noulekoun F, Lamers JPA, Naab J, Khamzina A (2017a) Shoot and root responses of woody species tosilvicultural management for afforestation of degraded croplands in the Sudano-Sahelian zone ofBenin. For Ecol Manag 385:254–263. https://doi.org/10.1016/j.foreco.2016.11.018
New Forests
123
Noulekoun F, Khamzina A, Naab J, Lamers JPA (2017b) Biomass allocation in five semi-arid afforestationspecies is driven mainly by ontogeny rather than resource availability. Ann For Sci 74:78. https://doi.org/10.1007/s13595-017-0676-4
Orwa C, Mutua A, Kindt R, Jamnadass R, Simons A (2009) Agroforestry database: a tree reference andselection guide version 4.0. World Agroforestry Centre ICRAF, Nairobi
Packard GC, Birchard GF, Boardman TJ (2011) Fitting statistical models in bivariate allometry. Biol Rev86(3):549–563. https://doi.org/10.1111/j.1469-185X.2010.00160.x
Paul KI, Roxburgh SH, Chave J, England JR, Zerihun A, Specht A et al (2016) Testing the generality ofabove-ground biomass allometry across plant functional types at the continent scale. Glob Change Biol22(6):2106–2124
Pearson TR, Brown S, Murray L, Sidman G (2017) Greenhouse gas emissions from tropical forest degra-dation: an underestimated source. Carbon Balance Manag 12(1):3. https://doi.org/10.1186/s13021-017-0072-2
Picard N, Rutishauser E, Ploton P, Ngomanda A, Henry M (2015) Should tree biomass allometry berestricted to power models? For Ecol Manag 353:156–163. https://doi.org/10.1016/j.foreco.2015.05.035
Pilli R, Anfodillo T, Carrer M (2006) Towards a functional and simplified allometry for estimating forestbiomass. For Ecol Manag 237:583–593. https://doi.org/10.1016/j.foreco.2006.10.004
Pineiro G, Perelman S, Guerschman JP, Paruelo JM (2008) How to evaluate models: observed vs predictedor predicted vs observed. Ecol Model 216:316–322. https://doi.org/10.1016/j.ecolmodel.2008.05.006
Rothman KJ (2002) Epidemiology: an introduction, 2nd edn. Oxford University Press, New YorkRubilar RA, Allen HL, Alvarez JS, Albaugh TJ, Fox TR, Stape JL (2010) Silvicultural manipulation and site
effect on above and belowground biomass equations for young Pinus radiata. Biomass Bioenergy34(12):1825–1837. https://doi.org/10.1016/j.biombioe.2010.07.015
Sileshi GW (2014) A critical review of forest biomass estimation models, common mistakes and correctivemeasures. For Ecol Manag 329:237–254
Sit V (1994) Catalog of curves for curve fitting. Ministry of Forest, Victoria, British Columbia (Canada),Biometrics Information Handbook Series 4
Snowdon P, Eamus D, Gibbons P et al (2000) Synthesis of allometrics, review of root biomass and design offuture woody biomass sampling strategies. NCAS technical report 17. Australian Greenhouse Office,Canberra
StataCorp (2015) Stata 14 base reference manual. Stata Press, College StationTjeuw J, Mulia R, Slingerland M, van Noordwijk M (2015) Tree or shrub: a functional branch analysis of
Jatropha curcas L. Agroforest Syst 89(5):841–856. https://doi.org/10.1007/s10457-015-9819-5UNFCCC (1997) Kyoto protocol to the United Nations framework convention on climate changeUNFCCC (2010) Outcome of the work of the ad hoc working group on long-term cooperative action under
the convention—policy approaches and positive incentives on issues relating to reducing emissionsfrom deforestation and forest degradation in developing countries: and the role of conservation, sus-tainable management of forests and enhancement of forest carbon stocks in developing countriesUNFCCC COP 16 Cancun. http://unfccc.int/2860.php
Weber JC, Sotelo Montes C, Abasse T, Sanquetta CR, Silva DA, Mayer S, Muniz GI, Garcia RA (2017)Variation in growth, wood density and carbon concentration in five tree and shrub species in Niger.New For. https://doi.org/10.1007/s11056-017-9603-7
Yeboah D, Burton AJ, Storer AJ, Opuni-Frimpong E (2014) Variation in wood density and carbon content oftropical plantation tree species from Ghana. New For 45(1):35–52. https://doi.org/10.1007/s11056-013-9390-8
Youkhana AH, Idol TW (2011) Allometric models for predicting above-and belowground biomass ofLeucaena-KX2 in a shaded coffee agroecosystem in Hawaii. Agroforest Syst 83(3):331–345
New Forests
123
1
Electronic supplementary materials for Noulèkoun et al. (2018a)
Sapling biomass allometry and carbon content in five afforestation species on marginal
farmland in semi-arid Benin
Published in the journal “New Forests”
Authors:
Florent Noulèkoun1,2, Jesse B. Naab2, John P. A. Lamers1, Sophia Baumert3, Asia Khamzina4*
1 Center for Development Research (ZEF), Bonn University, Genscherallee 3, 53113 Bonn,
Germany
2 WASCAL Competence Center, 06 P.O. Box 9507 Ouagadougou, Burkina Faso
3 AFC Agriculture and Finance Consultants GmbH, Dottendorfer Straße 82, 53129, Bonn,
Germany
4 Div. Environmental Science and Ecological Engineering, Korea University, 145 Anam-Ro,
Seongbuk-Gu, Seoul 02841, Korea
*Corresponding author
E-mail: [email protected]

2
Appendix 1: Assessment of differences in the biomass-diameter relationship across harvest times and between treatments
We used the total biomass (i.e. aboveground biomass (AGB) + belowground biomass (BGB))
and the basal diameter of each tree to fit a nonlinear regression to the power-law function
(𝑌 = 𝛼𝑋𝛽) under the moderation of harvest times and treatments. The robust (vce) option in
STATA 14 was used to estimate standard errors. The models used for a given species “i” are:
(1) For harvest times (t1 = 5 MaP, t2 = 11 MaP and t3 = 15 MaP):
nl (TDM=cond(t1==1,{α1},cond(t2==2,{α2},{α3}))*D^(
cond(t1==1,{β1},cond(t2==2,{β2},{β3})))) if species== i, vce(cluster plotid)
(2) For treatments (tr1 = Control, tr2 = fertilization, tr3 = irrigation and tr4 = fertilization and
irrigation):
nl (TDN= cond(tr1==1,{α1},cond(tr2==2,{α2},cond(tr3==3,{α3},{α4}))) * D^(
cond(tr1==1,{β1},cond(tr2==2,{β2},cond(tr3==3,{β3},{β4}))))) if species==i, vce(cluster plotid)
where TDM is the total biomass, D is the basal diameter and vce (cluster plotid) is the option
used for the robust estimation of the standard errors while accounting for pseudo-
replication at plot level (plotid= plot identification).
A test of significant differences between intercepts and slopes was performed
following each analysis. The results of these analyses are presented in Table 1 and 2.

3
Table 1 Allometric scaling coefficient (α) and exponent (β) for total biomass (kg tree-1) and basal diameter (cm) relationships of five woody species at 5, 11 and 15 months after planting (MaP). The SEM is the standard error of the mean. The significance of the global test of intercepts and slopes is reported (Prob > F). A significance level of p<0.05 was used as the threshold value
Species 5 MaP 11 MaP 15 MaP Prob > F
M. oleifera
α (SEM) 0.027 (0.011) 0.031 (0.018) 0.041 (0.018) 0.731
β (SEM) 2.085 (0.267) 1.706 (0.437) 1.795 (0.224) 0.632 J. curcas
α (SEM) 0.022 (0.009) 0.151 (0.008) 0.003 (0.002) 0.241
β (SEM) 2.082 (0.274) 1.947 (0.351) 3.135 (0.336) 0.133
L. leucocephala
α (SEM) 0.066 (0.025) 0.045 (0.014) 0.468 (0.189) 0.124
β (SEM) 1.806 (0.361) 2.030 (0.317) 0.999 (0.274) 0.052
A occidentale
α (SEM) 0.045 (0.006) 0.026 (0.011) 0.031 (0.010) 0.205
β (SEM) 1.392 (0.218) 2.316 (0.387) 2.315 (0.188) 0.053 P. biglobosa
α (SEM) 0.043 (0.005) 0.058 (0.012) 0.088 (0.033) 0.420
β (SEM) 1.334 (0.365) 01.217 (0.215) 1.407 (0.328) 0.690

4
Table 2 Allometric scaling coefficient (α) and exponent (β) for total biomass (kg tree-1) and basal diameter (cm) relationships of five woody species under the control (C), fertilization (F), irrigation (I) and fertilization + irrigation (IF). The SEM is the standard error of the mean. The significance of the global test of intercepts and slopes is reported (Prob > F). A significance level of p<0.05 was used as the threshold value
Species C F I IF Prob > F
M. oleifera
α (SEM) 0.027 (0.003) 0.029 (0.007) 0.008 (0.002) 0.012 (0.004) 0.006
β (SEM) 2.034 (0.065) 1.996 (0.142) 2.738 (0.147) 2.366 (0.196) 0.002 J. curcas
α (SEM) 0.015 (0.006) 0.007 (0.001) 0.002 (0.001) 0.003 (0.000) 0.080
β (SEM) 2.230 (0.213) 2.792 (0.088) 3.321 (0.119) 3.195 (0.083) 0.024 L. leucocephala
α (SEM) 0.090 (0.033) 0.071 (0.030) 0.046 (0.020) 0.021 (0.004) 0.161
β (SEM) 1.810 (0.311) 2.056 (0.299) 2.490 (0.312) 3.190 (0.158) 0.001
A occidentale
α (SEM) 0.026 (0.003) 0.021 (0.003) 0.030 (0.007) 0.027 (0.004) 0.348
β (SEM) 2.240 (0.098) 2.539 (0.102) 2.354 (0.138) 2.459 (0.128) 0.054 P. biglobosa
α (SEM) 0.044 (0.006) 0.052 (0.005) 0.089 (0.016) 0.028 (0.009) 0.148
β (SEM) 1.801 (0.226) 1.625 (0.274) 1.205 (0.274) 2.624 (0.257) 0.047
Note: There were no statistically significant differences between the intercepts (α) and slopes
(β) of the three harvest times for all species. In contrast, results show that treatments
influenced the biomass-diameter relationships of M. oleifera, J. curcas and L. leucocephala as
evidenced by statistically significantly different slopes between treatments (Table 2). This
implies treatment-specific equations could improve the predictive power of the allometric
models. However, these equations would only be applicable to a very narrow range of
growing conditions. Therefore, given the objective to develop allometric equations applicable
to a large range of nutrient and water gradients, the data from all the harvest times and
treatments were pooled.

5
Appendix 2: Carbon concentrations and biomass and carbon stocks in five afforestation species at 15 months after planting on degraded cropland in northern Benin. The SEM is the standard error of the mean. Stand density is 5,000 stems ha-1
Species Biomass fraction
Carbon (%)
Biomass (Mg ha-1)
Carbon stock* (Mg C ha-1)
Mean SEM Mean SEM Mean SEM
M. oleifera Foliage 41.4 0.5 0.89 0.07 0.37 0.000
Branch 40.9 0.6 0.94 0.07 0.38 0.000
Stem 41.8 0.9 3.36 0.20 1.41 0.002
Coarse root 41.0 0.7 1.56 0.07 0.63 0.001
Total - - 6.76 0.42 2.79 0.003
J. curcas Foliage 42.1 0.8 1.91 0.12 0.80 0.001
Branch 41.0 0.3 2.03 0.20 0.83 0.001
Stem 40.3 0.5 1.40 0.06 0.56 0.000
Coarse root 40.8 0.9 1.58 0.10 0.58 0.001
Total - - 6.91 0.48 2.78 0.003
L. leucocephala Foliage 42.7 0.7 2.98 0.25 1.27 0.002
Branch 41.7 1.0 2.10 0.27 0.88 0.003
Stem 42.8 0.6 2.75 0.17 1.18 0.001
Coarse root 43.1 1.0 2.49 0.17 0.95 0.001
Total - - 10.32 0.86 4.28 0.007
A. occidentale Foliage 41.7 0.7 1.57 0.17 0.66 0.001
Branch 41.3 0.3 0.74 0.12 0.31 0.000
Stem 41.8 0.5 0.83 0.09 0.35 0.000
Coarse root 42.3 0.6 0.50 0.06 0.19 0.000
Total - - 3.65 0.43 1.50 0.002
P. biglobosa Foliage 41.2 0.8 0.49 0.08 0.20 0.001
Branch 40.9 - 0.02 0.01 0.01 -
Stem 40.3 1.2 0.30 0.05 0.12 0.001
Coarse root 43.8 0.7 0.54 0.08 0.22 0.001
Total - - 1.36 0.23 0.56 0.002
Average for species Foliage 42.0 0.4 1.65 0.11 0.69 0.000
Branch 41.3 0.3 1.27 0.11 0.52 0.000
Stem 41.5 0.3 1.87 0.13 0.77 0.000
Coarse root 42.2 0.4 1.43 0.09 0.55 0.000
Total - - 6.21 0.43 2.54 0.001 * Only coarse roots were considered for the estimation of root carbon stock

6
Appendix 3: Mean absolute percentage error (MAPE) and mean relative error (MRE) between observed and estimated values according to previously published allometric equations for J. curcas. M = woody aboveground biomass (kg tree-
1), D = diameter (cm)
Source Diameter range (cm)
Equation MAPE (%) MRE (%)
Achten et al. (2010) for seedlings
- M = 0.0035 D2.33 47.3 -47.3
Ghezehei et al. (2009) 16-26 M = 0.001 D3.53 26.7 4.2 Hellings et al. (2012) 4-16 M = 0.0019 D3.03 22.0 -12.9 Baumert and Khamzina (2015) for juvenile plants
0-5.5 M = 0.003 D2.74 21.6 -13.1
Baumert and Khamzina (2015) for adult trees
5.5-12.3 M = 0.003 D3.03 42.9 38.6
Baumert and Khamzina (2015) for mature trees
12.3-21 M = 0.016 D2.31 133.9 133.9
Note: For Ghezehei et al. (2009) equation, α was transformed to express biomass in kg tree-1 and stem diameter in cm. Likewise, α was corrected to exclude the share of leaf biomass (43% of total aboveground biomass) for the Achten et al. (2010) equation (Hellings et al., 2012)

sustainability
Article
Climate Change Sensitivity of Multi-SpeciesAfforestation in Semi-Arid Benin
Florent Noulèkoun 1, Asia Khamzina 2,* ID , Jesse B. Naab 3, Ni’matul Khasanah 4,Meine van Noordwijk 4,5 ID and John P. A. Lamers 6
1 Center for Development Research (ZEF), Genscherallee 3, 53113 Bonn, Germany; [email protected] Division of Environmental Science and Ecological Engineering, Korea University, 145 Anam-Ro,
Seongbuk-Gu, Seoul 02841, Korea3 WASCAL Competence Center, 06 P.O. Box 9507 Ouagadougou, Burkina Faso; [email protected] World Agroforestry Centre (ICRAF), Southeast Asia Regional Programme, PO Box 161,
Bogor 16001, Indonesia; [email protected] (N.K.); [email protected] (M.v.N.)5 Plant Production Systems Group, Wageningen University, P.O. Box 430, 6700 AK Wageningen, The
Netherlands6 Center for Development Research (ZEF), Genscherallee 3, 53113 Bonn, Germany; [email protected]* Correspondence: [email protected]; Tel.: +82-232-903-062
Received: 6 May 2018; Accepted: 7 June 2018; Published: 8 June 2018�����������������
Abstract: The early growth stage is critical in the response of trees to climate change and variability.It is not clear, however, what climate metrics are best to define the early-growth sensitivity in assessingadaptation strategies of young forests to climate change. Using a combination of field experiments andmodelling, we assessed the climate sensitivity of two promising afforestation species, Jatropha curcasL. and Moringa oleifera Lam., by analyzing their predicted climate–growth relationships in the initialtwo years after planting on degraded cropland in the semi-arid zone of Benin. The process-basedWaNuLCAS model (version 4.3, World Agroforestry Centre, Bogor, Indonesia) was used to simulateaboveground biomass growth for each year in the climate record (1981–2016), either as the firstor as the second year of tree growth. Linear mixed models related the annual biomass growth toclimate indicators, and climate sensitivity indices quantified climate–growth relationships. In thefirst year, the length of dry spells had the strongest effect on tree growth. In the following year,the annual water deficit and length of dry season became the strongest predictors. Simulated rootingdepths greater than those observed in the experiments enhanced biomass growth under extremedry conditions and reduced sapling sensitivity to drought. Projected increases in aridity impliedsignificant growth reduction, but a multi-species approach to afforestation using species that are ableto develop deep-penetrating roots should increase the resilience of young forests to climate change.The results illustrate that process-based modelling, combined with field experiments, can be effectivein assessing the climate–growth relationships of tree species.
Keywords: climate sensitivity indices; Jatropha curcas; land degradation; Moringa oleifera; saplinggrowth; WaNuLCAS; West Africa
1. Introduction
There is an increasing recognition of the roles of forests and trees in mitigation and adaptationstrategies to global climate change [1,2]. Tree planting can modify local climate through impacts ontemperature, wind speed, and humidity; it can also influence the landscape–scale water balance,cloud cover and albedo, and contribute to global carbon sequestration [3–5]. In (sub-) tropicaldeveloping countries, re– and afforestation have been included in the portfolio of mitigation efforts
Sustainability 2018, 10, 1931; doi:10.3390/su10061931 www.mdpi.com/journal/sustainability

Sustainability 2018, 10, 1931 2 of 23
as a cost-efficient strategy to reverse the degradation of forests and to increase their atmosphericcarbon uptake [1,2,6,7]. Although trees are central to many climate change adaptation and mitigationstrategies, they are vulnerable (particularly in their early growth), to variation in solar radiation,rainfall, and temperature as determinants of potential evapotranspiration (ET0). Changes in theseclimatic variables, particularly temperature increases and precipitation shortages leading to higherfrequencies of extreme weather events (i.e., severe drought and intense rainfall), are expected to affecttree growth and challenge the sustainable management of forests and tree plantations [8–10].
Tree growth sensitivity to drought may be substantial in West African semi-arid zones, wherewater availability is one of the most limiting factors of plant growth, e.g., [11], and where extremedrought events are projected to become more frequent [12–14]. In this region, extreme drought eventsare associated with extended dry spells, low air humidity, high atmospheric evaporative demand, andhigh air temperatures [15], potentially increasing water stress in trees [13]. Droughts and dry spells area major threat to the establishment and early growth of both tropical and temperate tree species [16–18],suggesting the need to assess the effects of climate variability on their growth. However, studiesquantifying the relationships between these climatic factors and tree growth are lacking for treeplantations in the semi-arid tropics. This information is urgently needed to explore species’ responsesto past and current climate and evaluate the effects of climate change on tree growth [19].
If drought occurrences are exacerbated by global warming, it stands to reason that thesustainability of forests and plantations will largely depend on the physiological adaptationsand changes in silvicultural management [18,20]. For example, Abdulai et al. [14] revealeddrought vulnerability in a cocoa-based system in the forest–savanna transition zones of West Africa,despite the availability of subsoil water below a depth of 75 cm. This observation suggests thatdrought vulnerability may be related to trees’ ability to develop sufficiently deep root systems [21].Hartl-Meier et al. [22] found that among three tree species growing under similar temperate climateconditions, those with deep root systems benefited from the access to deep soil water, as reflectedin their higher photosynthetic activity and continued biomass production during severe droughtconditions. Therefore, the consideration of root systems in the analysis of climate–growth relationshipsmay give new insights on species’ responses to extreme climate events. Another plant strategy to avoidmortality under drought conditions is to shed leaves and reduce transpiration losses; such droughtavoidance is likely to reduce the rate of photosynthesis and thus mean growth rates, but also reducevulnerability [23].
Assessing the sensitivity and/or response of (early) tree growth to climate change requiresthe identification of the climate variables that most strongly influence tree growth or have the bestpredictive power in evaluating the early growth risks, e.g., Teets et al. [24]. However, experimentscarried out in any given year to quantify climate–growth relationships of young trees may exhibit asample of bad luck, lucky exceptions or be representative of ‘normal’ conditions at the test location,because experiments capture one (or a few) of the many possible weather (e.g., rainfall and temperature)sequences for this location. Early growth sensitivity of trees to predicted climate change cannot thusbe directly derived from existing weather statistics because it is uncertain how tree transpiration,soil evaporation and temporal rainfall patterns interact, e.g., Raz-Yaseef et al. [25]. In this regard,we argue that well-calibrated tree–soil interaction models, simulating sapling growth responses for atleast 30 years of weather data can help in (a) identifying the best predictors among a wide set of metricsthat can be objectively derived from existing weather records; (b) evaluating where the years withexperimental data are positioned within current climate variability according to the metrics with thehighest predictive power identified in (a); and (c) using the results of (a) and (b) to assess the probabilityof success for given species at a given location under various location-specific climate change scenarios.Our study may be the first to test explicitly this generic approach to assess climate change risks fornewly established dryland afforestation sites. The datasets stem from a site in a semi-arid zone ofWest Africa, where tree-based land restoration is high on the agenda and existing information is notsufficient to assess the robustness of afforestation option for a range of tree species [18,20,26].

Sustainability 2018, 10, 1931 3 of 23
Dendrochronology has been successfully used to analyze temporal and spatial climate–growthrelationships for tree and shrub species in tropical and temperate forests [9,23,27,28]. However,dendrochronological applications may be inappropriate for young trees and compromised byproblematic anatomical features such as missing, vague, discontinuous and false rings commonin tropical species [29,30], thereby also restricting the use of biomass increments derived from tree-ringseries [31,32]. An alternative approach to assessing the climate–growth relationships of saplingsmay be the use of process-based models in combination with field experiments. When supported byreliable soil–plant–climate databases and empirically derived relationships between environmentaland plant eco-physiological parameters [33,34], process-based models can be used to investigate forestresponses to climatic change and silvicultural management [35,36], as well as predict tree growth andproductivity at both the plant and stand level. There have been few models capable of accuratelysimulating processes in tree-based agroecosystems.
The process-based Water, Nutrient and Light Capture in Agroforestry Systems (WaNuLCAS)model [35] has had various applications to improve the understanding of complex ecological processesin tree-based farming systems [35,37,38]. It has also been tested for its performance to simulatecrop (e.g., Pennisetum glaucum L. and Sorghum bicolor L.) and tree (e.g., Parkia biglobosa Jacq. andVitellaria paradoxa C.F. Gaertn) growth in agroforestry parklands in West Africa [39–41]. The aim ofour research was to assess the climate sensitivity of two afforestation species—Jatropha curcas L. andMoringa oleifera Lam.—in the early stages of their development (i.e., the first two years of growth),decisive for the future growth [42] and also when plants are most sensitive to changes in wateravailability [43–45]. The two species have been subjects of silvicultural trials on degraded cropland innorthern Benin [18,20,26]. The specific objectives were to (i) compare different indicators calculatedfrom climate records to identify those with the greatest predictive power for the first two years oftree growth; (ii) quantify the climate–growth relationships of tree growth over the first two years,and (iii) test possible adaptation strategies to reduce the sensitivity of saplings to extreme climateevents. Furthermore, we assessed the relevance of the empirical climate data vis-à-vis the long-termclimatic variability in the study area based on the most influential climate indicators. We hypothesizedthat (i) there will be significant differences between the species’ growth responses to climate indicators,particularly to drought-related indicators; (ii) drought sensitivity of sapling growth decreases overtime, depending on the establishment of roots; and (iii) deepening of the rooting system may aid theadaptation of saplings to extreme drought conditions.
2. Materials and Methods
2.1. Study Area
Data for parametrization, validation, and simulations stemmed from a field experiment conductedduring 2014-2015 at Pouri village (10◦54′8.4” N, 1◦4′47.4” E), Atacora region, northern Benin [18,20].The region has been significantly affected by land degradation driven by deforestation and soilnutrient mining, which threatens the sustainability of forest and farming systems [18,46,47]. To combatland degradation, national and local projects to intensify forest cover, reclaim degraded landsand mitigate the effects of climate change (e.g., the project “10 Million Trees, 10 Million Souls”;http://news.acotonou.com/h/61311.html) through the planation of commercially important food(e.g., M. oleifera) and biofuel (e.g., J. curcas) tree crops have been carried out in the region [26,48].
The climate is semi-arid, characterized by two contrasting seasons, with one rainy season fromApril to October and a dry season for the rest of the year (Figure 1). The annual rainfall totaled757 mm in 2014 and 833 mm in 2015, albeit both below the long-term (1981–2016) average of 1034 mm.The mean annual air temperature was 29 ◦C in 2014 and 28 ◦C in 2015. The area received an averagesolar radiation of 0.2 kW m−1 (≈914 µmol m−2 s−1 of photosynthetically active radiation) in 2014 and2015. Historical patterns of change in precipitation, evapotranspiration, and air temperature showed ahigh inter-annual rainfall variability (676 < annual rainfall < 1509 mm; CV = 20%), along with extreme

Sustainability 2018, 10, 1931 4 of 23
dry (1985) and wet (1998) years, while inter-annual variations in evapotranspiration (CV = 4%) andtemperature (2%) were smaller compared to that of annual precipitation (Appendix A, Figure A1).
The soil at the experiment site is an epileptic Plinthosol [49], compacted and limited at a depth of50 cm by a lateritic hardpan. More details on the study site have been reported previously [18].
Sustainability 2018, 10, x FOR PEER REVIEW 4 of 22
4%) and temperature (2%) were smaller compared to that of annual precipitation (Appendix A, Figure A1).
The soil at the experiment site is an epileptic Plinthosol [49], compacted and limited at a depth of 50 cm by a lateritic hardpan. More details on the study site have been reported previously [18].
Figure 1. Climate diagram (according to Walter and Lieth [50]) based on 1981–2016 data of Natitingou (10°19′ N and 1°23′ E; altitude 460 m a.s.l), Tanguieta (10°37′ N and 1°16′ E; altitude 225 m a.s.l) and Pouri (10°54′ N and 1°6′ E; altitude 175 m.a.s.l) meteorological stations in the Atacora region, northern Benin. Top of the graph shows the long-term mean annual temperature and rainfall. The value at the top-left of the temperature axis is the mean of the average daily maximum temperature of the hottest month; the value at the bottom of the same axis is the mean of the average daily minimum temperature of the coldest month. Area shaded in blue indicates the moist period and area shaded in red shows the arid period. Area filled in blue indicates the period of excess water.
2.2. Experimental Design and Woody Species
The experiment compared the growth performance of saplings subjected to four management options, along an increasing gradient of resource availability: control (C; with neither irrigation nor fertilization), supplemental irrigation (I), fertilization (manure, F), and irrigation plus fertilization (IF). Irrigation was applied during the dry season only (November 2014–May 2015) at a rate of 0.5 L of water per sapling per day to satisfy 30% of the evaporative demand [18]. The saplings each received 72.5 mm of irrigation water and an additional 33 mm of rainfall during the dry season. Manure was applied in both rainy seasons, i.e., at 2.5 and 11 months after planting (MaP), at the amount of 1 kg per sapling (ca. 7.7 kg m−2). The manure consisted of composted cow and pig dung, and contained an average of 18.7% carbon (C), 1.2% nitrogen (N), and 0.8% phosphorus (P). No pesticide or fungicide was applied. Weed growth was controlled by frequent manual weeding.
Seeds of two multipurpose tree species, Jatropha curcas L. (physic nut, Euphorbiaceae) and Moringa oleifera Lam. (drumstick tree, Moringaceae), were germinated in a local nursery. Seedlings were planted in monospecific plots at the experimental site in July 2014 after 2.5–4 months, and were monitored over 15 months [18,20,26]. These local species were selected based on the fast growth rate of their shoots and roots in response to water and nutrient supply, as well as their socio-economic importance and increasing recent efforts to expand their plantation acreage in West Africa [18,26]. Each plot contained 48 seedlings with a 2 m × 1 m spacing, resulting in an initial stand density of 5000 trees ha−1, which was used in the simulations.
Figure 1. Climate diagram (according to Walter and Lieth [50]) based on 1981–2016 data of Natitingou(10◦19′ N and 1◦23′ E; altitude 460 m a.s.l), Tanguieta (10◦37′ N and 1◦16′ E; altitude 225 m a.s.l) andPouri (10◦54′ N and 1◦6′ E; altitude 175 m.a.s.l) meteorological stations in the Atacora region, northernBenin. Top of the graph shows the long-term mean annual temperature and rainfall. The value at thetop-left of the temperature axis is the mean of the average daily maximum temperature of the hottestmonth; the value at the bottom of the same axis is the mean of the average daily minimum temperatureof the coldest month. Area shaded in blue indicates the moist period and area shaded in red shows thearid period. Area filled in blue indicates the period of excess water.
2.2. Experimental Design and Woody Species
The experiment compared the growth performance of saplings subjected to four managementoptions, along an increasing gradient of resource availability: control (C; with neither irrigation norfertilization), supplemental irrigation (I), fertilization (manure, F), and irrigation plus fertilization (IF).Irrigation was applied during the dry season only (November 2014–May 2015) at a rate of 0.5 L ofwater per sapling per day to satisfy 30% of the evaporative demand [18]. The saplings each received72.5 mm of irrigation water and an additional 33 mm of rainfall during the dry season. Manure wasapplied in both rainy seasons, i.e., at 2.5 and 11 months after planting (MaP), at the amount of 1 kg persapling (ca. 7.7 kg m−2). The manure consisted of composted cow and pig dung, and contained anaverage of 18.7% carbon (C), 1.2% nitrogen (N), and 0.8% phosphorus (P). No pesticide or fungicidewas applied. Weed growth was controlled by frequent manual weeding.
Seeds of two multipurpose tree species, Jatropha curcas L. (physic nut, Euphorbiaceae) and Moringaoleifera Lam. (drumstick tree, Moringaceae), were germinated in a local nursery. Seedlings were plantedin monospecific plots at the experimental site in July 2014 after 2.5–4 months, and were monitored over15 months [18,20,26]. These local species were selected based on the fast growth rate of their shootsand roots in response to water and nutrient supply, as well as their socio-economic importance andincreasing recent efforts to expand their plantation acreage in West Africa [18,26]. Each plot contained

Sustainability 2018, 10, 1931 5 of 23
48 seedlings with a 2 m × 1 m spacing, resulting in an initial stand density of 5000 trees ha−1, whichwas used in the simulations.
2.3. Data Collection
Tree morphological properties and biomass were measured at the beginning and end of the2014 and 2015 rainy seasons (i.e., 5, 11, and 15 MaP) on two to six saplings randomly selectedper experimental plot [20,26]. After measuring the height (H, m) and stem diameter (D, cm),the selected trees were felled for total biomass determination, and that of the different tree fractions.The aboveground part was separated into leaves, branch, stem, and reproductive fractions. Rootswere manually excavated, sectioned into coarse (ø > 2 mm) and fine (ø < 2 mm) fractions, and gentlywashed in a sieve to remove the soil. Subsamples of the harvested fractions were oven-dried at 75 ◦Cuntil they reached a constant weight, and their dry mass was determined [20,26].
2.4. Modelling Analysis
2.4.1. Description of WaNuLCAS
The process-based WaNuLCAS model was developed by van Noordwijk and Lusiana [35] toimprove the understanding of tree–soil–crop interactions in agroforestry systems, and runs on theSTELLA (version 7.0) modelling environment software (isee systems Inc., Lebanon, PA, USA) linkedto Microsoft Excel spreadsheets for data input and output, which allows modification by users [35].WaNuLCAS simulates the daily tree growth as a function of resource (i.e., water, nutrient and light)availability at plot-scale. The plot is represented by a four-layer soil profile and four spatial zones,where trees (and/or crops) can be positioned (Figure 2).
Sustainability 2018, 10, x FOR PEER REVIEW 5 of 22
2.3. Data Collection
Tree morphological properties and biomass were measured at the beginning and end of the 2014 and 2015 rainy seasons (i.e., 5, 11, and 15 MaP) on two to six saplings randomly selected per experimental plot [20,26]. After measuring the height (H, m) and stem diameter (D, cm), the selected trees were felled for total biomass determination, and that of the different tree fractions. The aboveground part was separated into leaves, branch, stem, and reproductive fractions. Roots were manually excavated, sectioned into coarse (ø > 2 mm) and fine (ø < 2 mm) fractions, and gently washed in a sieve to remove the soil. Subsamples of the harvested fractions were oven-dried at 75 °C until they reached a constant weight, and their dry mass was determined [20,26].
2.4. Modelling Analysis
2.4.1. Description of WaNuLCAS
The process-based WaNuLCAS model was developed by van Noordwijk and Lusiana [35] to improve the understanding of tree–soil–crop interactions in agroforestry systems, and runs on the STELLA (version 7.0) modelling environment software (isee systems Inc., Lebanon, PA, USA) linked to Microsoft Excel spreadsheets for data input and output, which allows modification by users [35]. WaNuLCAS simulates the daily tree growth as a function of resource (i.e., water, nutrient and light) availability at plot-scale. The plot is represented by a four-layer soil profile and four spatial zones, where trees (and/or crops) can be positioned (Figure 2).
Figure 2. WaNuLCAS schematic presentation of the experimental plot layout, displaying its horizontal and vertical dimensions. Note: --//-- indicate “broken” y-axis.
The model assumes homogenous site conditions within each of the four spatial zones. The emphasis of WaNuLCAS is on above- and belowground resource capture, based on leaf area and fine root length density interacting with resource supply as the basis for predicting interspecific complementarity and competition [51]. Belowground competition is described by calculating the demand and potential uptake of water and N and P nutrients using a zero-sink uptake model on the basis of the root length density. This assumes that the root uptake of water and nutrients is driven by plant demand, as long as the concentration of these resources at the root surface is above the limiting concentration, assumed to be zero under most conditions found in agricultural settings [52]. The demand for N uptake is defined by a “luxury uptake”, which assumes that growth will not be reduced until N content falls below 80% of the demand [51]. At the aboveground level, shading by trees is calculated as a function of the branch area index (BAI), leaf area index (LAI), and plant height in each zone. LAI-dependent light capture triggers photosynthesis, with carbon capture calculated
Figure 2. WaNuLCAS schematic presentation of the experimental plot layout, displaying its horizontaland vertical dimensions. Note: –//– indicate “broken” y-axis.
The model assumes homogenous site conditions within each of the four spatial zones.The emphasis of WaNuLCAS is on above- and belowground resource capture, based on leaf areaand fine root length density interacting with resource supply as the basis for predicting interspecificcomplementarity and competition [51]. Belowground competition is described by calculating thedemand and potential uptake of water and N and P nutrients using a zero-sink uptake model on thebasis of the root length density. This assumes that the root uptake of water and nutrients is drivenby plant demand, as long as the concentration of these resources at the root surface is above thelimiting concentration, assumed to be zero under most conditions found in agricultural settings [52].

Sustainability 2018, 10, 1931 6 of 23
The demand for N uptake is defined by a “luxury uptake”, which assumes that growth will not bereduced until N content falls below 80% of the demand [51]. At the aboveground level, shading bytrees is calculated as a function of the branch area index (BAI), leaf area index (LAI), and plant heightin each zone. LAI-dependent light capture triggers photosynthesis, with carbon capture calculated onthe dry weight basis. The distinction of the light captured by branch (BAI) and by leaves allows themodel to account for tree shading when trees are leafless [51]. The model includes drought–inducedlitterfall and the re-emergence of leaves, controlled by phenological parameters.
The water balance of the system in WaNuLCAS includes rainfall, canopy interception, waterevaporation from surface soil layers, water uptake by crops and trees, and leaching. Water is exchangedbetween the four zones by run-on and run-off. The vertical and horizontal transportation of wateris also included [51]. Calculations of water infiltration into the soil profile follow a “tipping bucket”model [53]. Canopy interception is a function of ground cover (based on the LAI of trees and crops).Soil evaporation depends on both the ground cover and soil water content of the topsoil. Water uptakerate is driven by plant (i.e., trees and crops) transpirational demand, and is calculated based on soiland plant water potentials and the corresponding matrix flux potentials, determined following themethods of De Willigen et al. [52,54].
2.4.2. Input Data for WaNuLCAS
The WaNuLCAS model input data consist of weather data (daily rainfall, soil temperature,and potential evapotranspiration), soil parameters (texture; bulk density; saturated hydraulicconductivity; pH; and organic carbon, nitrogen, and phosphorus contents), tree management options(planting dates, amounts and timing of fertilization/organic material applications, intensity and timingof pruning), and tree library (i.e., growth parameters such as the length of the reproductive cycle,specific leaf area (SLA), growth rate; Supplementary materials, Tables S1 and S2).
Weather data: The 2014 and 2015 daily rainfall and air temperature data were made accessible bythe Pouri weather station (Figure 1) located about 4 km away from the experiment site. Time-domainreflectometry (TDR) sensors (CS655, Soil Water Content Reflectometers, Campbell Scientific Ltd.,Shepshed, Loughborough, LE12 9GX, UK) were installed at the experimental site at the beginningof the second rainy season to collect in-situ soil moisture and temperature data. Daily ET0 data wasgenerated using the FAO ET0 calculator [55].
Soil parameters: Soil physical and chemical properties used to parameterize the WaNuLCASmodel (Table 1) were set according to the four vertical layers of the model that correspond to thefour layers obtained from the soil profile description (Figure 2). The Hodnett and Tomasella [56]pedotransfer function (PTF) in the WaNuLCAS model was used to generate soil hydraulic properties,representative of tropical soil conditions [57]. Default values of initial soil N (ammonium and nitrate)concentrations that were representative of a wide range of tropical cropping systems were used becauseno site–specific data was collected.

Sustainability 2018, 10, 1931 7 of 23
Table 1. Inputs of soil physical and chemical properties to parameterize the pedotransfer (PTF) moduleof WaNuLCAS.
ParameterSoil Layer (cm)
0–5 5–16 16–30 30–50
Clay (%) 11.8 15.7 25.5 29.4Silt (%) 31.4 35.3 33.3 37.3
Sand (%) 56.9 49.0 41.2 33.3BD (g cm−3) 1.5 1.5 1.6 1.6
pH-H2O 5.3 5.2 5.7 5.8TOC (%) 0.7 0.6 0.6 0.6Ntot (%) 0.1 0.1 0.1 0.1
P (mg kg−1) 15.7 15.3 14.5 14.8CEC (cmol kg−1) 4.7 6.0 5.2 5.3
Ksat (cm d−1) 73.2 18.4 207.7 232.4
Legend: BD: bulk density, TOC: total organic carbon, Ntot: total nitrogen, P: available phosphorus, CEC: cationexchange capacity, Ksat: saturated hydraulic conductivity. The data was obtained following a soil profile descriptionconducted at the experimental site at the beginning of the trial in June 2014.
Crop and tree management: Field-collected data as described above was used for parameterizationof this module. As the simulated system consists of trees only, the four horizontal zones of the modelwere set at equal widths of 0.5 m (Figure 2).
Tree growth parameters: Field-collected data was integrated into the “tree parametrization” Excelfile (www.worldagroforestry.org/sea/Products/AFModels/wanulcas/down-loadc.htm) to generatekey growth parameters, including LAI, plant water potential, light extinction coefficient, and others,for use in WaNuLCAS [35,51]. The parameters permitted the simulation of aboveground growthand development, in particular the H, D, and aboveground biomass (AGB; kg m−2) production,subjected to the abovementioned climate, soil, and management factors. The biomass accumulationwas simulated using the empirical allometric relationship between the biomass fractions (total AGB,leaf plus twig biomass, wood biomass, and litterfall) and stem diameter:
Y = aDb (1)
where Y is the biomass of a given fraction (kg tree−1), D is the basal diameter (cm), and a and b areallometric coefficients.
The allometric coefficients (Table 2) were generated previously by Noulèkoun et al. [26] usingthe experimental data. The root growth in all zones and layers was assumed to be constant, which isrepresentative of a tree system with an equilibrium of root growth and root decay [51]. A maximumroot length density was thus given as an input, following van Noordwijk et al. [51].
Table 2. Allometric intercepts (a) and slopes (b) of the biomass components [26] used to simulate thetree growth by WaNuLCAS.
Species Biomass Fractions a b
Jatropha curcas
Total 0.004 2.93Stem 0.004 2.74
Leaf + Twig 0.003 2.48Litterfall * 0.0002 3.29
Moringa oleifera
Total 0.010 2.36Stem 0.008 2.38
Leaf + Twig 0.010 1.49Litterfall * 0.0002 3.29
* The model default values were used for litterfall allometric parameters.

Sustainability 2018, 10, 1931 8 of 23
2.4.3. Model Calibration, Validation, and Evaluation
The WaNuLCAS model was parametrized and calibrated with the two years of data gained fromthe fertilization (F) treatment. The data from the other treatments (C, I, and IF) were used for modelvalidation. The three data collection periods (5, 11, and 15 MaP) served as comparison points betweenthe measured and simulated values. During the calibration process, a sensitivity analysis was usedto improve simulation results, following the method of Khasanah et al. [58]. Consequently, variousparameters, such as the maximum LAI, maximum growth rate, and litterfall caused by drought, weremodified for a more accurate reproduction of the observed values (Supplementary materials, Tables S1and S2).
The model performance was evaluated by comparing the observed and simulated values of H, D,and AGB based on goodness of fit (GOF) (Appendix A, Table A1) statistical indicators proposed byLoague and Green [59], along with the coefficient of determination (R2) of the linear relationshipbetween the observed and simulated values (Figure 3). Based on these criteria, the accuracyof the model simulations was evaluated for its suitability to analyze the climate sensitivity ofgrowth scenarios.
2.4.4. Climate–Growth Relationship Analysis
The model validated with data from the C treatment was used for the simulations, as thisrepresents the common, low-input silvicultural practice in the study area. After calibrating theWaNuLCAS model to adequately capture the growth dynamics of saplings, 35 runs were performed,each covering two consecutive years over the historical climate period of 35 years (1981–2016),to quantify the strength of relationships between annual AGB growth and climate indicators [28].These included indicators related to the rainfall amount (e.g., annual water deficit (AWD)), intensity(e.g., very wet days (R95p)), and temporal distribution (e.g., length of the longest dry spell (LDSP))(Table 3).
Only climate indicators that showed low correlation (r < 0.5) were considered and assumed toinfluence the annual growth of plants. Air temperature was not directly included as an explanatoryvariable because the WaNuLCAS model does not include a representation of the direct effect oftemperature on plant growth. Nevertheless, the effect of temperature was indirectly incorporated intothe length of extreme dry periods (LEDP) and AWD through the ET0 (Table 3).
The growth sensitivity of saplings to the prevailing climatic conditions was quantified by means ofa linear mixed-effects model [28,60]. This approach was employed to account for the variance in growthbetween years. Climate indicators (Table 3) were used as fixed terms, i.e., as explanatory variables ofthe response variables (AGB) in the models, and the random term was the year. The model selectionmethod [61] allowed the selection of the “best-fitting” model from a set of potential models fitted toeach climate indicator separately, based on the difference in the corrected Akaike information criterion(∆AICc) between a null model (including intercept and random effect only) and the one-indicatormodels. The ∆AICc describes the effects of a given climate indicator on a model’s fit. A modelwas considered climate-sensitive when the ∆AIC was greater than two [28]. The preferred modelwas that with the lowest AICc and the highest ∆AICc [62]. The mixed models were fitted using themaximum likelihood estimation, restricted maximum likelihood estimation for slope estimates, and anautocorrelation structure (first-order autoregression (AR1)). The analysis was conducted in R version3.4.3 [63] using the ‘nlme’ package [64].

Sustainability 2018, 10, 1931 9 of 23
Table 3. Climate indicators considered in the climate sensitivity analysis. The overall (1981–2016) value range of the climate indicators, and the value of the climatevariable for the current climate (2014 and 2015) are presented along with their rank.
Parameters Unit Description Definition Range 2014 Rank ** 2015 Rank **
AWD mm Annual water deficit Difference between annual potential evapotranspiration (ET0) andprecipitation 155–1153 931 29/36 978 31/36
LDSP Days Length of the longest dry spell Maximum number of consecutive days of no precipitation within therainy season (April–October; Figure 1) 3–40 24 32/36 19 29/36
LEDP * Days Length of extremely dry period Number of days within a year when daily maximum temperature>99th percentile (40◦ C) and no precipitation (Zhang et al. 2011) 0–42 8 30/36 42 36/36
LDS Months Length of dry season Number of consecutive months within a year with less than 100 mmof rainfall (Wood et al. 2001) 5–10 10 36/36 9 35/36
LWS Day Length of the longest wet spell Maximum number of consecutive rainy days within the rainy season(April–October; see Figure 1) 2–21 10 30/36 21 36/36
ATWP mm Annual total wet-day precipitation Annual total precipitation from wet days (i.e., days with precipitation≥1 mm) (Zhang et al. 2011) 670–1501 749 3/36 825 5/36
R95p * mm Very wet days Annual total precipitation from days with precipitation >95thpercentile (19 mm) (Zhang et al. 2011) 344–1096 395 4/36 424 7/36
R95pot - Total precipitation with respect to the R95p Fraction of precipitation accounted for by the very wet days (R95p)(Zhang et al. 2011) 0.42–0.80 0.52 10/36 0.51 7/36
* The 95th and 99th percentiles of precipitation and temperature were identified from the historical (1981–2016) climate data. ** The ranking was done with regard to the 36(i.e., 1981–2016) observations.
Table 4. Results of the model validation for two tree species based on the datasets from the control (C), irrigation (I), and irrigation + fertilization (IF) treatments basedon the GOF criteria (Loague and Green [59]). Values in brackets represent the optimum value of the criteria. Values close to the optimum value of each criterion areindicated in bold.
Species Growth Parameters EF (1) CD (1) RMSE (0) CRM (0) ME (0) R2 (1)
Jatropha curcasHeight (H, m) 0.72 0.71 6.02 0.00 0.16 0.80
Diameter (D, cm) 0.72 2.48 11.12 −0.03 1.17 0.81Aboveground biomass (AGB, kg m−2) 0.77 2.21 33.78 −0.04 0.19 0.83
Moringa oleiferaHeight (H, m) 0.82 2.59 9.42 −0.03 0.40 0.97
Diameter (D, cm) 0.70 1.76 12.94 −0.08 1.32 0.88Aboveground biomass (AGB, kg m−2) 0.78 2.23 28.55 −0.09 0.13 0.88
EF: model efficiency; CD: coefficient of determination; RMSE: root mean square error; CRM: coefficient of residual mass; ME: maximum error; R2: coefficient of determination of linearregression between observed and simulated values.

Sustainability 2018, 10, 1931 10 of 23
Assuming that the annual growth and weather parameters across sequential years are notcorrelated [65], we compared climate effects in the first and second years of growth. Three indices ofclimate sensitivity were considered during the comparison [28]: (i) the highest ∆AICc; (ii) the absolutevalue of the slope of the best model, which describes the strength and the direction of the relationshipbetween the response and explanatory variables, as slopes were not bound to zero and can be eitherpositive or negative; and (iii) the pseudo R2 of the best model, which is a measure of the varianceexplained by a mixed model. The higher the value of any of these sensitivity indices, the higher theclimate effects. Both the response and explanatory variables were standardized so that the slopes hada common unit and were comparable. The R2 GLMM function of the ‘MuMIn’ library in R 3.4.3 wasused to compute the R2 value of each one-indicator mixed model [66].
2.4.5. Scenario Description
Scenario analyses were performed to evaluate the impact of rooting depth on the biomassproduction of saplings under two contrasting water stress conditions, considering the spatial variationin soil depth and depending on the landscape position and the depth of the lateritic hardpan, andpossible root penetration of the hardpan to capture leached rainfall [18] (personal field observation).Two soil and rooting depth scenarios were thus built by keeping the total root length constant and bychanging the initial rooting depth (50 cm; Figure 2) by +50%. This resulted in (i) a shallower rootingdepth (33.3 cm) with obliquely oriented roots and (ii) a deeper rooting depth (75 cm) with verticallypenetrating roots. Water stress was imposed during the simulations by using the climate data of thetwo consecutive years with the highest (i.e., severe water stress or extreme dry condition) and lowest(i.e., mild water stress or extreme wet condition) cumulative water deficits.
3. Results
3.1. Simulation of Tree Height, Diameter, and Aboveground Biomass
The outputs of the model calibration revealed strong linear relationships (R2 > 0.8) betweenthe simulated and observed values of H, D, and AGB (Figure 3) for both species. The tree growthincrements were also reasonably well reproduced by the model (Appendix A, Figure A2). The overallevaluation of the model indicated a good fit between the model estimates and empirical values forthe key parameters, as evidenced by the satisfactory values of model efficiency (EF), coefficient ofdetermination (CD), coefficient of residual mass (CRM), and maximum error (ME) (Figure 3).
The reproducibility was reduced due to the diameter shrinking (RMSE ca. 7–12%) and the biomassloss as litterfall (root mean square error [RMSE] ca. 23–26%) during the dry season, which resulted inthe overestimation of D and AGB by the model at this point in time (Figure 3; Appendix A, Figure A2).
The model validation (with the independent datasets from the C, I, and IF treatments) showedsimilar results to that of the model calibration, albeit with a reduced GOF compared to that of thecalibration (Table 4). Furthermore, the comparison of the relative increment in growth parametersinduced by the treatments between the model predictions and the field observations revealed that thepredicted values aligned well with the field measurements for both species (Supplementary Materials,Table S3). Hence, the results of the calibration and validation revealed the model’s suitability for theenvisaged scenario analyses.

Sustainability 2018, 10, 1931 11 of 23Sustainability 2018, 10, x FOR PEER REVIEW 11 of 22
Figure 3. Relationships between simulated and observed values of height (m), stem diameter (cm) and aboveground biomass (kg m−2) for J. curcas and M. oleifera during calibration. The data from the fertilization treatment (F) were used. The lines are the 1:1 lines. EF: model efficiency; CD: coefficient of determination; RMSE: root mean square error; CRM: coefficient of residual mass; ME: maximum error; R2: coefficient of determination of linear regression between observed and simulated values.
Figure 3. Relationships between simulated and observed values of height (m), stem diameter (cm) and aboveground biomass (kg m−2) for J. curcas and M. oleiferaduring calibration. The data from the fertilization treatment (F) were used. The lines are the 1:1 lines. EF: model efficiency; CD: coefficient of determination;RMSE: root mean square error; CRM: coefficient of residual mass; ME: maximum error; R2: coefficient of determination of linear regression between observed andsimulated values.

Sustainability 2018, 10, 1931 12 of 23
3.2. Climate–Growth Relationships of the Afforestation Species
The annual AGB growth varied substantially over the simulation period as a result of theinter-annual rainfall and evapotranspiration variability inherent to the reference data (Figure 4 andAppendix A, Figure A1), confirming the common climate–growth relationship.
Sustainability 2018, 10, x FOR PEER REVIEW 12 of 22
The reproducibility was reduced due to the diameter shrinking (RMSE ca. 7–12%) and the biomass loss as litterfall (root mean square error [RMSE] ca. 23–26%) during the dry season, which resulted in the overestimation of D and AGB by the model at this point in time (Figure 3; Appendix A, Figure A2).
The model validation (with the independent datasets from the C, I, and IF treatments) showed similar results to that of the model calibration, albeit with a reduced GOF compared to that of the calibration (Table 4). Furthermore, the comparison of the relative increment in growth parameters induced by the treatments between the model predictions and the field observations revealed that the predicted values aligned well with the field measurements for both species (Supplementary Materials, Table S3). Hence, the results of the calibration and validation revealed the model’s suitability for the envisaged scenario analyses.
3.2. Climate–Growth Relationships of the Afforestation Species
The annual AGB growth varied substantially over the simulation period as a result of the inter-annual rainfall and evapotranspiration variability inherent to the reference data (Figure 4 and Appendix A, Figure A1), confirming the common climate–growth relationship.
Figure 4. Variation in the predicted annual aboveground biomass (AGB, kg m−2) growth for J. curcas and M. oleifera. Apart from the years 1981 and 2016, every year was used twice in the simulation, either as year 1 (filled symbols) or year 2 (open symbols) year.
The observed variance reflected differences in the climate effects of a given year, when used either as year one or year two during the two-year simulation period. Differences in climate–growth patterns between the species are evident in Figure 4. For instance, the annual AGB growth of M. oleifera was higher in year two than in year one in 86% (30/35) of the runs, indicating that the annual growth is likely to be more influenced by climatic conditions in year two. In contrast, the biomass growth of J. curcas was dependent on the climatic conditions in both years (one and two; Figure 4).
The computed climate indicators can be further categorized into two groups: (i) drought-related indicators (AWD, LDSP, LEDP and LDS) and (ii) wetness-related indicators (LWS, ATWP, R95p and R95pot). The values of the drought-related indicators for the two years in which tree growth data were collected (2014 and 2015) were in the upper range of the 1981–2016 data (representing its maximum as shown by the year 2014 ranking for LDS), whereas the wetness-related indicators were in the lower quartile (Table 3). Furthermore, the results of the linear modeling analyses revealed that the AGB growth of both species was influenced by the AWD, LDS, LDSP, and ATWP (Table 5).
Across the years, drought-related indicators (AWD, LDS, and LDSP) best explained the variations in the annual AGB growth, as reflected in their overall high ΔAICc and R² values. The most important and extensive climate factor influencing the annual biomass growth for both species was the AWD, as evidenced by the highest values of the sensitivity indices (Table 5). The AWD was the easiest to calculate, as it only required ET0 and annual rainfall, rather than details of the temporal rainfall distribution. The biomass growth was inversely (slopes < 0) linked to the drought-related
Figure 4. Variation in the predicted annual aboveground biomass (AGB, kg m−2) growth for J. curcasand M. oleifera. Apart from the years 1981 and 2016, every year was used twice in the simulation, eitheras year 1 (filled symbols) or year 2 (open symbols) year.
The observed variance reflected differences in the climate effects of a given year, when used eitheras year one or year two during the two-year simulation period. Differences in climate–growth patternsbetween the species are evident in Figure 4. For instance, the annual AGB growth of M. oleifera washigher in year two than in year one in 86% (30/35) of the runs, indicating that the annual growth islikely to be more influenced by climatic conditions in year two. In contrast, the biomass growth ofJ. curcas was dependent on the climatic conditions in both years (one and two; Figure 4).
The computed climate indicators can be further categorized into two groups: (i) drought-relatedindicators (AWD, LDSP, LEDP and LDS) and (ii) wetness-related indicators (LWS, ATWP, R95p andR95pot). The values of the drought-related indicators for the two years in which tree growth data werecollected (2014 and 2015) were in the upper range of the 1981–2016 data (representing its maximum asshown by the year 2014 ranking for LDS), whereas the wetness-related indicators were in the lowerquartile (Table 3). Furthermore, the results of the linear modeling analyses revealed that the AGBgrowth of both species was influenced by the AWD, LDS, LDSP, and ATWP (Table 5).
Table 5. Mixed effect models comparisons for J. curcas and M. oleifera, showing the most importantclimate indicators along with the corresponding climate sensitivity indices.
Variables Jatropha curcas Moringa oleifera
∆AICc Slope R2 ∆AICc Slope R2
LDSP1 12.22 −0.63 0.39 9.33 −0.58 0.33LDSP2 9.91 −0.59 0.35 8.31 −0.57 0.31LDS1 2.27 −0.43 0.18 2.16 −0.42 0.18LDS2 12.16 −0.63 0.39 9.13 −0.58 0.33AWD1 6.02 −0.53 0.27 5.05 −0.5 0.24AWD2 14.92 −0.67 0.44 11.98 −0.63 0.38ATWP1 3.60 0.46 0.21 2.96 0.45 0.20ATWP2 10.44 0.60 0.36 8.32 0.57 0.31
Note: ∆AICc is the corrected Akaike Information Criterion; R2 is the pseudo coefficient of determination. Descriptionof the climate variables is provided in Table 2. Subscripts accompanying the climate variables stand for year one (1)and year two (2).

Sustainability 2018, 10, 1931 13 of 23
Across the years, drought-related indicators (AWD, LDS, and LDSP) best explained the variationsin the annual AGB growth, as reflected in their overall high ∆AICc and R2 values. The most importantand extensive climate factor influencing the annual biomass growth for both species was the AWD,as evidenced by the highest values of the sensitivity indices (Table 5). The AWD was the easiestto calculate, as it only required ET0 and annual rainfall, rather than details of the temporal rainfalldistribution. The biomass growth was inversely (slopes < 0) linked to the drought-related indicators,but the ATWP had a positive effect on the AGB growth of both species. The AWD had the strongestnegative effect (highest slope values) on the sapling growth (Table 5).
The strength of climate–growth relationships and the identity of climate indicators in the best-fitmodels varied between years one and two (Table 5). The climate sensitivity was greatest in the secondyear of tree growth for all of the important climate indicators, except for the LDSP, which had thestrongest effects on annual growth during the first year. Overall, M. oleifera tended to be less sensitiveto climate than J. curcas, but the observed differences in sensitivity were too subtle to draw generalstatements considering the threshold (∆AICc > 2) used to indicate a significant climate effect.
3.3. Simulated Effect of Rooting Depth on Sapling Biomass under Contrasting Water Stress Conditions
The simulation results revealed that the rooting depth influenced the biomass production ofsaplings (Figure 5), and the magnitude of this effect varied between the water stress scenarios. After thefirst two years of growth and irrespective of the species, AGB was 13–72% higher for deep–rootedplants compared to the shallow-rooted ones. The relative change in AGB induced by the deep rootingdepth was greater under extreme dry conditions (i.e., 1984–1985) compared to that under extreme wetconditions (i.e., 2004–2005) (Figure 5). For instance, the relative change for J. curcas was 72% and 27%for the 1984–1985 and 2004–2005 runs, respectively. The enhanced biomass growth of saplings withdeeper roots was related to an increased water uptake and canopy interception, reduced runoff anddrainage, and thus increased the soil available water and its use by saplings (Figure 6).
Sustainability 2018, 10, x FOR PEER REVIEW 13 of 22
indicators, but the ATWP had a positive effect on the AGB growth of both species. The AWD had the strongest negative effect (highest slope values) on the sapling growth (Table 5).
Table 5. Mixed effect models comparisons for J. curcas and M. oleifera, showing the most important climate indicators along with the corresponding climate sensitivity indices.
Variables Jatropha curcas Moringa oleifera
ΔAICc Slope R² ΔAICc Slope R² LDSP1 12.22 −0.63 0.39 9.33 −0.58 0.33 LDSP2 9.91 −0.59 0.35 8.31 −0.57 0.31 LDS1 2.27 −0.43 0.18 2.16 −0.42 0.18 LDS2 12.16 −0.63 0.39 9.13 −0.58 0.33
AWD1 6.02 −0.53 0.27 5.05 −0.5 0.24 AWD2 14.92 −0.67 0.44 11.98 −0.63 0.38 ATWP1 3.60 0.46 0.21 2.96 0.45 0.20 ATWP2 10.44 0.60 0.36 8.32 0.57 0.31
Note: ΔAICc is the corrected Akaike Information Criterion; R² is the pseudo coefficient of determination. Description of the climate variables is provided in Table 2. Subscripts accompanying the climate variables stand for year one (1) and year two (2).
The strength of climate–growth relationships and the identity of climate indicators in the best-fit models varied between years one and two (Table 5). The climate sensitivity was greatest in the second year of tree growth for all of the important climate indicators, except for the LDSP, which had the strongest effects on annual growth during the first year. Overall, M. oleifera tended to be less sensitive to climate than J. curcas, but the observed differences in sensitivity were too subtle to draw general statements considering the threshold (ΔAICc > 2) used to indicate a significant climate effect.
3.3. Simulated Effect of Rooting Depth on Sapling Biomass under Contrasting Water Stress Conditions
The simulation results revealed that the rooting depth influenced the biomass production of saplings (Figure 5), and the magnitude of this effect varied between the water stress scenarios. After the first two years of growth and irrespective of the species, AGB was 13–72% higher for deep–rooted plants compared to the shallow-rooted ones. The relative change in AGB induced by the deep rooting depth was greater under extreme dry conditions (i.e., 1984–1985) compared to that under extreme wet conditions (i.e., 2004–2005) (Figure 5). For instance, the relative change for J. curcas was 72% and 27% for the 1984–1985 and 2004–2005 runs, respectively. The enhanced biomass growth of saplings with deeper roots was related to an increased water uptake and canopy interception, reduced runoff and drainage, and thus increased the soil available water and its use by saplings (Figure 6).
(A) (B)
Figure 5. Simulated effects of rooting depth (Shallow vs. Deep) on aboveground biomass (AGB, kg m−2) under severe (1984–1985) and mild (2004–2005) water stress for (A) Jatropha curcas and (B) Moringa oleifera.
Figure 5. Simulated effects of rooting depth (Shallow vs. Deep) on aboveground biomass (AGB,kg m−2) under severe (1984–1985) and mild (2004–2005) water stress for (A) Jatropha curcas and(B) Moringa oleifera.

Sustainability 2018, 10, 1931 14 of 23Sustainability 2018, 10, x FOR PEER REVIEW 14 of 22
(A) (B)
Figure 6. Water balance terms (mm) for two rooting depths (Shallow and Deep) under severe (1984–1985) and mild (2004–2005) water stress for (A) Jatropha curcas and (B) Moringa oleifera. Cumulative values over the two-year simulation period are presented.
4. Discussion
Climate change is likely to affect trees in the early growth stage, altering the long-term productivity of forests and plantations [42,44,67]. Although climate–growth relationships have been quantified for mature trees of several tropical and temperate species [9,29,68], much remains unknown regarding the sensitivity of tree growth during the early stages of development in semi-arid areas. In this study, we used a generic approach of climate sensitivity assessment that combines field experiments and modelling as an alternative to the traditional dendrochronology technique. First, we calibrated and validated the process-based model WaNuLCAS based on the empirical tree growth data. Second, we quantified the effects of climate variability on the predicted annual biomass increment, based on the most influential climate indicators. We also assessed the relevance of the empirical climate data to historical simulations based on the frequency distribution of the long-term climate indicator data (Table 3). Our results revealed drought-related indicators as the best predictors, which enabled to quantify their effects on sapling growth. Our approach has an advantage over the dendrochronological analysis because it uses actual biomass increment rather than biomass increment derived from tree-rings as recently suggested [31,32], thereby avoiding challenges associated with problematic anatomical features of tree rings common in tropical trees [29,30].
4.1. Model Performance
In accordance with previous studies [41,57,69,70], the range of the GOF statistics and the high correlation between the simulated and observed growth parameters for both the calibration (Figure 3) and the validation (Table 4) are indicative of the ability of the WaNuLCAS model to reproduce the early growth dynamics of the tested afforestation species with an acceptable accuracy and precision. A R² value of 0.5, CD value of 0.5–2, and EF value above 0.5 represent a good predicted–to–observed relationship [69]. However, the high values of the RMSE for AGB during the model calibration and the reduced GOF during the model validation indicated that not all growth limitations occurring under field conditions were adequately captured through simulations [39]. Most of the discrepancies between the simulations and empirical evidence arose from the limited capacity of the model to reproduce the monitored drought-induced trunk shrinkage and litterfall during the dry season. Shrinking tree diameters are not represented in the current version of the model, although they are known at both the diurnal and seasonal time scales [71]. Drought-induced litterfall is included in the model by a water potential threshold and a waiting period before new leaves emerge [72], but an accurate parametrization requires data beyond what is available for the site. While dry-season leaf shed is characteristic for drought-deciduous tree species, its accounting in our simulations resulted in large reductions of the total height rather than D and AGB (results not shown), implying that tree canopy
Figure 6. Water balance terms (mm) for two rooting depths (Shallow and Deep) under severe(1984–1985) and mild (2004–2005) water stress for (A) Jatropha curcas and (B) Moringa oleifera.Cumulative values over the two-year simulation period are presented.
4. Discussion
Climate change is likely to affect trees in the early growth stage, altering the long-term productivityof forests and plantations [42,44,67]. Although climate–growth relationships have been quantified formature trees of several tropical and temperate species [9,29,68], much remains unknown regardingthe sensitivity of tree growth during the early stages of development in semi-arid areas. In this study,we used a generic approach of climate sensitivity assessment that combines field experiments andmodelling as an alternative to the traditional dendrochronology technique. First, we calibrated andvalidated the process-based model WaNuLCAS based on the empirical tree growth data. Second,we quantified the effects of climate variability on the predicted annual biomass increment, based onthe most influential climate indicators. We also assessed the relevance of the empirical climate datato historical simulations based on the frequency distribution of the long-term climate indicator data(Table 3). Our results revealed drought-related indicators as the best predictors, which enabled toquantify their effects on sapling growth. Our approach has an advantage over the dendrochronologicalanalysis because it uses actual biomass increment rather than biomass increment derived fromtree-rings as recently suggested [31,32], thereby avoiding challenges associated with problematicanatomical features of tree rings common in tropical trees [29,30].
4.1. Model Performance
In accordance with previous studies [41,57,69,70], the range of the GOF statistics and the highcorrelation between the simulated and observed growth parameters for both the calibration (Figure 3)and the validation (Table 4) are indicative of the ability of the WaNuLCAS model to reproduce theearly growth dynamics of the tested afforestation species with an acceptable accuracy and precision. AR2 value of 0.5, CD value of 0.5–2, and EF value above 0.5 represent a good predicted–to–observedrelationship [69]. However, the high values of the RMSE for AGB during the model calibration and thereduced GOF during the model validation indicated that not all growth limitations occurring underfield conditions were adequately captured through simulations [39]. Most of the discrepancies betweenthe simulations and empirical evidence arose from the limited capacity of the model to reproducethe monitored drought-induced trunk shrinkage and litterfall during the dry season. Shrinking treediameters are not represented in the current version of the model, although they are known at boththe diurnal and seasonal time scales [71]. Drought-induced litterfall is included in the model bya water potential threshold and a waiting period before new leaves emerge [72], but an accurate

Sustainability 2018, 10, 1931 15 of 23
parametrization requires data beyond what is available for the site. While dry-season leaf shed ischaracteristic for drought-deciduous tree species, its accounting in our simulations resulted in largereductions of the total height rather than D and AGB (results not shown), implying that tree canopyand height are more influenced by this process than D and AGB in the WaNuLCAS model. The lack ofcalibrated litterfall data may have caused the poor fit of the predicted D and AGB, albeit only duringthe dry season [57]. Despite these deviations between the observed and simulated values during thedry season, the well-reproduced growth patterns and accurate prediction of D, H, and AGB at theend of the growing seasons (Appendix A, Figure A2) are a sufficient basis for further analyses ofplant growth.
4.2. Climate Sensitivity of Afforestation Species
The predicted AGB growth series showed strong variations over the years (Figure 3), indicativeof the influence of climate on the early growth of tree plantations [68]. Although both species havea semi-deciduous phenology and are fast growing and drought tolerant [18], their predicted annualgrowth responses to climate variability differed (Figure 3), confirming our hypothesis that the responsesare species specific. This is likely due to the differences in stress tolerances [73] and/or allometry.Species differences in climate–growth responses have been reported for older trees of winter-deciduousbroad-leaved species (Fagus sylvatica L. and Quercus petraea Matt.) under a temperate climate [68].Together, these findings suggest that caution must be taken when parametrizing growth modelsaccording to plant functional types [5].
Water availability emerged as the primary driver of the climate sensitivity of trees in the earlystages of growth in semi-arid areas. Similar climate–growth relationships were previously found fortemperate tree species [68,74] and for shrub species across the tundra biome [28]. Annual biomassaccumulation declined with annual water deficit, the length of the dry season, and the length of thelongest dry spell, but increased with the annual total wet-day precipitation (Table 5). This supports ourhypothesis that drought-related indicators negatively affect biomass growth in particular. The negativeclimate–growth relationships with drought-related indicators suggested that drought-reduced saplinggrowth occurred not only due to reductions in the total amount of precipitation and subsequent longerdry seasons (e.g., AWD), but also due to variability in the distribution of rainfall (e.g., the LDSP).This outcome is reminiscent of the findings by Elliott et al. [9], which showed that the distribution ofprecipitation is more influential on the radial growth of deciduous tree species than the amount.
Increased aridity (AWD) had the strongest negative influence on the growth of saplings,suggesting that the projected increase in aridity in northern Benin [75] may result in a substantialdecrease in growth. For instance, the predicted AGB of J. curcas after two years of growth was 0.34 and0.49 kg m−2 under extreme (highest AWD) and mild (lowest AWD) drought conditions, respectively,which represents a potential 31% loss in AGB growth. Applying the same calculations for M. oleiferaresulted in a 14% loss in growth if the aridity is increased. These estimates are obviously to someextent simplified, as AWD is not the only climate factor that is likely to change in the future; however,they do highlight the relative importance of water limitation for the early growth of tree plantationsand hence for the planted afforestation efforts in the region.
The influence of drought on tree growth and the identity of climate drivers were not uniformbetween years. In year one, the duration of the LDSP in the rainy season had the best predictive power,while in year two, the annual water balance (here, the difference between precipitation and ET0) wasthe best predictor for both species (Table 5). This supports our hypothesis that the climate sensitivityto ‘immediate’ drought is stronger at the very early stages of tree growth, when root systems are notyet fully established [43–45], compared to later stages where the water balance dominates results.Sensitivity to AWD and LDS was greater in the second year compared to the first. This could beattributed to the increased tree water use and consequent reduction in soil available water related toincreased canopy interception and water drainage as a function of tree growth in the WaNuLCASmodel [51]. For instance, the water use efficiency of J. curcas, defined as the water uptake to total

Sustainability 2018, 10, 1931 16 of 23
rainfall ratio, was 4% in year one and 10% in year two under the most extreme historical droughtscenario (1984–1985). This implies that the same AWD or LDS would result in more water stress inyear two than in year one. Hence, the climatic factors related to the amount of precipitation showedgreater sensitivity in year two, whereas greater sensitivity to LDSP, which describes the distribution ofprecipitation, was more evident in year one.
Just as empirical data gives insights in the credibility of model predictions, the current analysis ofsensitivity of tree growth to a range of rainfall metrics can help to better judge the representativenessof the empirical data regarding climate variability in the study area. The year 2014 had the longestLDS of the available climate data set for the test site, while the AWD and LDSP of both years werein the upper quartiles (Table 3). The values of the wetness-related indicator (ATWP) were in thelowest quartile for both years. Apparently, the years in which experimental data were collected werealready foreboding what climate change predictions point out as a ‘new normal’ for the study area:less predictable rain, with more extremes on both the high and the low end [12,13]. Therefore, thetree performance measured during the two years is probably a conservative estimate of what canbe expected in years closer to the current average values and is more representative of the expectedgrowth under projected climate conditions.
4.3. Effects of Rooting Depth on Biomass Growth under Extreme Dry Conditions
The simulation results showed that deeper rooting depth was an advantage to sapling growthof both species under extreme dry conditions (Figure 5). Moreover, the AGB at the end of year twowas greater for deep–rooted than shallow–rooted saplings in both extreme dry and wet conditions.The improved performance can be attributed to enhanced tree water use under deep rooting depthconditions as a result of increased water uptake and canopy interception, and reduced water drainageand runoff (Figure 6). The relative increase in AGB, induced by the deep rooting depth, was greaterunder severe water stress compared to mild water stress, suggesting that deep-rooted saplings are lesssensitive to extreme drought than shallow-rooted saplings. Similarly, Coulibaly et al. [41] has reportedthat tree species with deep rooting systems are less vulnerable to water deficits. These results can beattributed to the fact that during extreme drought conditions, deep rooted saplings take advantageof their access to deeper soil horizons, which could result in increased photosynthetic activity andcontinued biomass production, as reported by Hartl-Meier et al. [22] for beech (Fagus sylvatica L.) andlarch (Larix decidua Mill.) under a temperate climate.
4.4. Replicability of the Approach
Where trees of a wide range of ages can be found in a local environment of interest,dendrochronological analysis can, in combination with climate records, be used for assessing theeffects of climate change on young forests. In the absence of such, the combination we used ofexperiments, model calibration and identification of the local climate metric with the best predictiveskill can improve the value of experiments and increase their interpretation, at the interface of climatechange mitigation and adaptation strategies.
5. Conclusions
The WaNuLCAS model was successfully calibrated and validated to simulate sapling growthof two afforestation species in semi-arid northern Benin. Although the stem diameter and biomasspredictions during the dry season were poorly simulated due to the limited ability of the modelto reproduce trunk shrinkage and litterfall during this period, the overall outputs of the modelcalibration and validation were satisfactory. The model application to simulate the early growth ofthe afforestation species under past climate conditions permitted the quantification of the climatesensitivity of sapling growth.
The aboveground biomass growth was most sensitive to water availability, as evidenced bythe negative relationships between growth and drought-related indicators, and the positive growth

Sustainability 2018, 10, 1931 17 of 23
response to annual total wet-day precipitation. The distribution, rather than the total amount, ofprecipitation was the main factor limiting sapling growth at the very early stages of growth (yearone), when tree root systems are not yet well established. Given the projected increase in variability ofprecipitation distribution, extended arid conditions, and longer dry spells in West Africa, the currentresults suggest that increased aridity could play an increasingly important role in limiting future treeestablishment and forest growth. Based on the observed species-specific responses to climate variabilityand the importance of root depth in buffering the negative effects of extreme drought on saplinggrowth, a multi-species afforestation system with species that are able to develop deep-penetratingroot systems may increase the resilience of plantations to climate change.
The current results illustrate that process-based modelling combined with field experiments canbe effective in integration of multi-source data to assess the climate–growth relationships of tree species.Further verification of the simulation results under field conditions, through dendrochronological andrhizological studies, would be needed to develop confidence in the application of WaNuLCAS forclimate–growth analyses.
Supplementary Materials: The following are available online at http://www.mdpi.com/2071-1050/10/6/1931/s1,Table S1: Tree parameters used for simulating the growth of Jatropha curcas L. in WaNuLCAS; Table S2: Treeparameters used for simulating the growth of Moringa oleifera Lam. in WaNuLCAS; Table S3: Relative incrementin height (m), diameter (cm), and aboveground biomass (ABG, kg m−2) in response to fertilization, irrigation andfertilization plus irrigation as observed and as simulated by WaNuLCAS.
Author Contributions: F.N., J.P.A.L., J.B.N., and A.K. conceived and designed the experiments. F.N. and J.B.N.conducted the experiments and field data collection. F.N., N.K., and M.v.N. performed modeling and statisticalanalyses. All the authors contributed to the writing of the manuscript.
Acknowledgments: The authors gratefully acknowledge the financial support by the German Federal Ministry ofEducation and Research (BMBF) under the WASCAL (West African Science Service Center on Climate Changeand Adapted Land Use) program, project No. 00100218 and the additional support by O-Jeong Eco-ResilienceInstitute (South Korea). We thank Nadine Worou, the technical staff of the WASCAL study catchment in Dassari,and the numerous workers for assistance during field sampling. We greatly appreciate the statistical guidance byGuido Lüchters and Merveille Koissi Savi.
Conflicts of Interest: The authors declare no conflict of interest.
Appendix
Table A1. Statistical criteria proposed by Loague and Green [59] to evaluate model performance.
Criteria Symbol Formula Acceptable Range Optimum Value
Model efficiency EF (∑ni=1(Oi−Omean)
2− ∑ni=1(Pi−Oi)
2)∑n
i=1(Oi−Omean)≤1 1
Coefficient of determination CD ∑ni=1(Oi−Omean)
∑ni=1(Pi−Omean)
0.5–2 * 1
Maximum error ME Max |Pi −Oi|ni=1 ≥0 0
Root mean square error RMSE(
n∑
i=1
(Pi−Oi)n
)1/2× 100
Omean≥0 0
Coefficient of residual mass CRM (∑ni=1 Oi−∑n
i=1 Pi)∑n
i=1 Oi≤1 0
Pi, predicted value; Oi, observed value; Omean, mean of the observed value. * The range for CD proposed byWalker et al. [57].

Sustainability 2018, 10, 1931 18 of 23
Sustainability 2018, 10, x FOR PEER REVIEW 17 of 22
current results suggest that increased aridity could play an increasingly important role in limiting future tree establishment and forest growth. Based on the observed species-specific responses to climate variability and the importance of root depth in buffering the negative effects of extreme drought on sapling growth, a multi-species afforestation system with species that are able to develop deep-penetrating root systems may increase the resilience of plantations to climate change.
The current results illustrate that process-based modelling combined with field experiments can be effective in integration of multi-source data to assess the climate–growth relationships of tree species. Further verification of the simulation results under field conditions, through dendrochronological and rhizological studies, would be needed to develop confidence in the application of WaNuLCAS for climate–growth analyses.
Supplementary Materials: The following are available online at www.mdpi.com/xxx/s1, Table S1: Tree parameters used for simulating the growth of Jatropha curcas L. in WaNuLCAS; Table S2: Tree parameters used for simulating the growth of Moringa oleifera Lam. in WaNuLCAS; Table S3: Relative increment in height (m), diameter (cm), and aboveground biomass (ABG, kg m−2) in response to fertilization, irrigation and fertilization plus irrigation as observed and as simulated by WaNuLCAS.
Author Contributions: F.N., J.P.A.L., J.B.N., and A.K. conceived and designed the experiments. F.N. and J.B.N. conducted the experiments and field data collection. F.N., N.K., and M.v.N. performed modeling and statistical analyses. All the authors contributed to the writing of the manuscript.
Acknowledgments: The authors gratefully acknowledge the financial support by the German Federal Ministry of Education and Research (BMBF) under the WASCAL (West African Science Service Center on Climate Change and Adapted Land Use) program, project No. 00100218 and the additional support by O-Jeong Eco-Resilience Institute (South Korea). We thank Nadine Worou, the technical staff of the WASCAL study catchment in Dassari, and the numerous workers for assistance during field sampling. We greatly appreciate the statistical guidance by Guido Lüchters and Merveille Koissi Savi.
Conflicts of Interest: The authors declare no conflict of interest.
Appendix A
Table A1. Statistical criteria proposed by Loague and Green [59] to evaluate model performance.
Criteria Symbol Formula Acceptable
Range Optimum
Value
Model efficiency EF ∑ ∑∑ ² <1 1
Coefficient of determination CD ∑ ²∑ ² 0.5–2 * 1
Maximum error ME | | >0 0
Root mean square error RMSE ² / 100 >0 0
Coefficient of residual mass CRM ∑ ∑∑ <1 0
Pi, predicted value; Oi, observed value; Omean, mean of the observed value. * The range for CD proposed by Walker et al. [57].
Sustainability 2018, 10, x FOR PEER REVIEW 18 of 22
Figure A1. Relative changes in the annual rainfall (mm), annual potential evapotranspiration (mm), and air temperature (°C) between 1981 and 2016 compared to the long-term historical means presented in Figure 1.
(A)
(B)
(C)
(D)
(E)
(F)
Figure A1. Relative changes in the annual rainfall (mm), annual potential evapotranspiration (mm),and air temperature (◦C) between 1981 and 2016 compared to the long-term historical means presentedin Figure 1.

Sustainability 2018, 10, 1931 19 of 23
Sustainability 2018, 10, x FOR PEER REVIEW 18 of 22
Figure A1. Relative changes in the annual rainfall (mm), annual potential evapotranspiration (mm), and air temperature (°C) between 1981 and 2016 compared to the long-term historical means presented in Figure 1.
(A)
(B)
(C)
(D)
(E)
(F)
Figure A2. Simulated height (H, m), stem diameter (D, cm), and aboveground biomass (AGB, kg m−2)dynamics for Jatropha curcas (A–C) and Moringa oleifera (D–F) during calibration for which the empiricaldatasets from the fertilization treatment was used. The three comparison points (circles) represent thethree harvest times (i.e., 5, 11, and 15 months after planting). Vertical bars are standard errors of themean. Seedling planting time was defined at 186 Julian days in the Water, Nutrient and Light Capturein Agroforestry Systems (WaNuLCAS) model.
References
1. UNFCCC. Kyoto Protocol to the United Nations Framework Convention on Climate Change; United NationsFramework Convention on Climate Change: Bonn, Germany, 1997.
2. UNFCCC. Outcome of the work of the ad hoc working group on long-term cooperative action underthe convention—Policy approaches and positive incentives on issues relating to reducing emissions fromdeforestation and forest degradation in developing countries, and the role of conservation, sustainablemanagement of forests and enhancement of forest carbon stocks in developing countries. In Proceedingsof the Ad Hoc Working Group on Long-Term Cooperative Actionunder the Convention, Copenhagen,Denmark, 7–15 December 2009.
3. Garrity, D.P.; Akinnifesi, F.K.; Ajayi, O.C.; Weldesemayat, S.G.; Mowo, J.G.; Kalinganire, A.; Larwanou, M.;Bayala, J. Evergreen Agriculture: A robust approach to sustainable food security in Africa. Food Secur. 2010,2, 197–214. [CrossRef]
4. Sanderson, M.; Santini, M.; Valentini, R.; Pope, E. Relationships between Forests and Weather; EC DirectorateGeneral of the Environment: Brussels, Belgium, 2012.

Sustainability 2018, 10, 1931 20 of 23
5. Betts, R.A.; Boucher, O.; Collins, M.; Cox, P.M.; Falloon, P.D.; Gedney, N.; Hemming, D.L.; Huntingford, C.;Jones, C.D.; Sexton, D.M.H.; et al. Projected increase in continental runoff due to plant responses to increasingcarbon dioxide. Nature 2007, 448, 1037–1041. [CrossRef] [PubMed]
6. Hosonuma, N.; Herold, M.; De Sy, V.; De Fries, R.S.; Brockhaus, M.; Verchot, L.; Angelsen, A.; Romijn, E.An assessment of deforestation and forest degradation drivers in developing countries. Environ. Res. Lett.2012, 7, 044009. [CrossRef]
7. Pearson, T.R.H.; Brown, S.; Murray, L.; Sidman, G. Greenhouse gas emissions from tropical forest degradation:An underestimated source. Carbon Balance Manag. 2017, 12. [CrossRef] [PubMed]
8. Pachauri, R.; Allen, M.; Barros, V.; Broome, J.; Cramer, W.; Christ, R.; Church, J.; Clarke, L.; Dahe, Q.;Dasgupta, P.; et al. Climate Change 2014: Synthesis Report. Contribution of Working Groups I, II and III to the FifthAssessment Report of the Intergovernmental Panel on Climate Change; IPCC, Intergovernmental Panel on ClimateChange: Geneva, Switzerland, 2014.
9. Elliott, K.J.; Miniat, C.F.; Pederson, N.; Laseter, S.H. Forest tree growth response to hydroclimate variabilityin the southern Appalachians. Glob. Chang. Biol. 2015, 21, 4627–4641. [CrossRef] [PubMed]
10. Thurm, E.A.; Uhl, E.; Pretzsch, H. Mixture reduces climate sensitivity of Douglas-fir stem growth. For. Ecol.Manag. 2016, 376, 205–220. [CrossRef]
11. Poorter, L. Biodiversity of West African Forests: An Ecological Atlas of Woody Plant Species; CABI: Wallingford,UK, 2004.
12. Sylla, M.B.; Giorgi, F.; Pal, J.S.; Gibba, P.; Kebe, I.; Nikiema, M. Projected Changes in the Annual Cycle ofHigh-Intensity Precipitation Events over West Africa for the Late Twenty-First Century. J. Clim. 2015, 28,6475–6488. [CrossRef]
13. Sylla, M.B.; Nikiema, P.M.; Gibba, P.; Kebe, I.; Klutse, N.A.B. Climate Change over West Africa: RecentTrends and Future Projections. In Adaptation to Climate Change and Variability in Rural West Africa;Yaro, J.A., Hesselberg, J., Eds.; Springer International Publishing: Cham, Switzerland, 2016; pp. 25–40,ISBN 978-3-319-31497-6.
14. Abdulai, I.; Vaast, P.; Hoffmann, M.P.; Asare, R.; Jassogne, L.; Van Asten, P.; Rötter, R.P.; Graefe, S. Cocoaagroforestry is less resilient to sub-optimal and extreme climate than cocoa in full sun. Glob. Chang. Biol.2018, 24, 273–286. [CrossRef] [PubMed]
15. Wang, S.; Huang, J.; He, Y.; Guan, Y. Combined effects of the Pacific Decadal Oscillation and El Niño-SouthernOscillation on Global Land Dry–Wet Changes. Sci. Rep. 2015, 4. [CrossRef] [PubMed]
16. Castro, J.; Zamora, R.; Hódar, J.A.; Gómez, J.M. Alleviation of Summer Drought Boosts EstablishmentSuccess of Pinus sylvestris in a Mediterranean Mountain: An Experimental Approach. Plant Ecol. 2005, 181,191–202. [CrossRef]
17. Comita, L.S.; Engelbrecht, B.M.J. Drought as a driver of tropical tree species regeneration dynamics anddistribution patterns. In Forests and Global Change; Coomes, D.A., Burslem, D.F.R.P., Simonson, W.D., Eds.;Cambridge University Press: Cambridge, UK, 2014; pp. 261–308, ISBN 978-1-107-32350-6.
18. Noulèkoun, F.; Lamers, J.P.A.; Naab, J.; Khamzina, A. Shoot and root responses of woody species tosilvicultural management for afforestation of degraded croplands in the Sudano-Sahelian zone of Benin.For. Ecol. Manag. 2017, 385, 254–263. [CrossRef]
19. Geßler, A.; Keitel, C.; Kreuzwieser, J.; Matyssek, R.; Seiler, W.; Rennenberg, H. Potential risks for Europeanbeech (Fagus sylvatica L.) in a changing climate. Trees 2007, 21, 1–11. [CrossRef]
20. Noulèkoun, F.; Khamzina, A.; Naab, J.B.; Lamers, J.P.A. Biomass allocation in five semi-arid afforestationspecies is driven mainly by ontogeny rather than resource availability. Ann. For. Sci. 2017, 74. [CrossRef]
21. Van Noordwijk, M.; van Lawson, G.; Hairiah, K.; Wilson, J. Root distribution of trees and crops: Competitionand/or complementarity. In Tree-Crop Interactions: Agroforestry in a Changing Climate; Ong, C.K., Black, C.R.,Wilson, J., Eds.; CABI: Wallingford, UK, 2015; pp. 221–257, ISBN 978-1-78064-511-7.
22. Hartl-Meier, C.; Zang, C.; Buntgen, U.; Esper, J.; Rothe, A.; Gottlein, A.; Dirnbock, T.; Treydte, K. Uniformclimate sensitivity in tree-ring stable isotopes across species and sites in a mid-latitude temperate forest.Tree Physiol. 2015, 35, 4–15. [CrossRef] [PubMed]
23. Gebrekirstos, A.; Mitlöhner, R.; Teketay, D.; Worbes, M. Climate-growth relationships of the dominant treespecies from semi-arid savanna woodland in Ethiopia. Trees 2008, 22, 631–641. [CrossRef]
24. Teets, A.; Fraver, S.; Weiskittel, A.R.; Hollinger, D.Y. Quantifying climate-growth relationships at the standlevel in a mature mixed-species conifer forest. Glob. Chang. Biol. 2018. [CrossRef] [PubMed]

Sustainability 2018, 10, 1931 21 of 23
25. Raz-Yaseef, N.; Yakir, D.; Schiller, G.; Cohen, S. Dynamics of evapotranspiration partitioning in a semi-aridforest as affected by temporal rainfall patterns. Agric. For. Meteorol. 2012, 157, 77–85. [CrossRef]
26. Noulèkoun, F.; Naab, J.B.; Lamers, J.P.A.; Baumert, S.; Khamzina, A. Sapling biomass allometry and carboncontent in five afforestation species on marginal farmland in semi-arid Benin. New For. 2018, 49, 363–382.[CrossRef]
27. Schöngart, J.; Orthmann, B.; Hennenberg, K.J.; Porembski, S.; Worbes, M. Climate-growth relationships oftropical tree species in West Africa and their potential for climate reconstruction. Glob. Chang. Biol. 2006, 12,1139–1150. [CrossRef]
28. Myers-Smith, I.H.; Elmendorf, S.C.; Beck, P.S.A.; Wilmking, M.; Hallinger, M.; Blok, D.; Tape, K.D.;Rayback, S.A.; Macias-Fauria, M.; Forbes, B.C.; et al. Climate sensitivity of shrub growth across the tundrabiome. Nat. Clim. Chang. 2015, 5, 887–891. [CrossRef]
29. Brienen, R.J.W.; Zuidema, P.A. Lifetime growth patterns and ages of Bolivian rain forest trees obtained bytree ring analysis. J. Ecol. 2006, 94, 481–493. [CrossRef]
30. Herrera-Ramirez, D.; Andreu-Hayles, L.; del Valle, J.I.; Santos, G.M.; Gonzalez, P.L.M. Nonannual tree ringsin a climate-sensitive Prioria copaifera chronology in the Atrato River, Colombia. Ecol. Evol. 2017, 7, 6334–6345.[CrossRef] [PubMed]
31. Bouriaud, O.; Bréda, N.; Dupouey, J.-L.; Granier, A. Is ring width a reliable proxy for stem-biomass increment?A case study in European beech. Can. J. For. Res. 2005, 35, 2920–2933. [CrossRef]
32. Foster, J.R.; D’Amato, A.W.; Bradford, J.B. Looking for age-related growth decline in natural forests:Unexpected biomass patterns from tree rings and simulated mortality. Oecologia 2014, 175, 363–374.[CrossRef] [PubMed]
33. Kimmins, J.P.; Mailly, D.; Seely, B. Modelling forest ecosystem net primary production: The hybrid simulationapproach used in forecast. Ecol. Model. 1999, 122, 195–224. [CrossRef]
34. Johnsen, K.; Samuelson, L.; Teskey, R.; McNulty, S.; Fox, T. Process Models as Tools in Forestry Research andManagement. For. Sci. 2001, 47, 2–8.
35. Van Noordwijk, M.; Lusiana, B. WaNuLCAS, a model of water, nutrient and light capture in agroforestrysystems. In Agroforestry for Sustainable Land-Use Fundamental Research and Modelling with Emphasis on Temperateand Mediterranean Applications; Auclair, D., Dupraz, C., Eds.; Springer: Dordrecht, The Netherlands, 1999;Volume 60, pp. 217–242, ISBN 978-90-481-5258-2.
36. Kang, H.; Seely, B.; Wang, G.; Cai, Y.; Innes, J.; Zheng, D.; Chen, P.; Wang, T. Simulating the impact ofclimate change on the growth of Chinese fir plantations in Fujian province, China. N. Z. J. For. Sci. 2017, 47.[CrossRef]
37. Bayala, J.; Sanou, J.; Teklehaimanot, Z.; Ouedraogo, S.J.; Kalinganire, A.; Coe, R.; Van Noordwijk, M.Advances in knowledge of processes in soil–tree–crop interactions in parkland systems in the West AfricanSahel: A review. Agric. Ecosyst. Environ. 2015, 205, 25–35. [CrossRef]
38. Luedeling, E.; Smethurst, P.J.; Baudron, F.; Bayala, J.; Huth, N.I.; van Noordwijk, M.; Ong, C.K.; Mulia, R.;Lusiana, B.; Muthuri, C.; et al. Field-scale modeling of tree–crop interactions: Challenges and developmentneeds. Agric. Syst. 2016, 142, 51–69. [CrossRef]
39. Bayala, J.; van Noordwijk, M.; Lusiana, B.; Ni’matul, K.; Teklehaimanot, Z.; Ouedraogo, S.J. Separating theTree–Soil–Crop Interactions in Agroforestry Parkland Systems in Saponé (Burkina Faso) using WaNuLCAS.In Toward Agroforestry Design; Jose, S., Gordon, A.M., Eds.; Springer: Dordrecht, The Netherlands, 2008;Volume 4, pp. 285–297, ISBN 978-1-4020-6571-2.
40. Bayala, J.; Heng, L.K.; van Noordwijk, M.; Ouedraogo, S.J. Hydraulic redistribution study in two native treespecies of agroforestry parklands of West African dry savanna. Acta Oecol. 2008, 34, 370–378. [CrossRef]
41. Coulibaly, Y.N.; Mulia, R.; Sanou, J.; Zombré, G.; Bayala, J.; Kalinganire, A.; van Noordwijk, M. Cropproduction under different rainfall and management conditions in agroforestry parkland systems in BurkinaFaso: Observations and simulation with WaNuLCAS model. Agrofor. Syst. 2014, 88, 13–28. [CrossRef]
42. Van Noordwijk, M.; Cadisch, G. Access and excess problems in plant nutrition. In Progress in Plant Nutrition:Plenary Lectures of the XIV International Plant Nutrition Colloquium; Horst, W.J., Bürkert, A., Claassen, N.,Flessa, H., Frommer, W.B., Goldbach, H., Merbach, W., Olfs, H.-W., Römheld, V., Sattelmacher, B., et al., Eds.;Springer: Dordrecht, The Netherlands, 2002; pp. 25–40, ISBN 978-90-481-6191-1.
43. Cao, K. Water relations and gas exchange of tropical saplings during a prolonged drought in a Borneanheath forest, with reference to root architecture. J. Trop. Ecol. 2000, 16, 101–116. [CrossRef]

Sustainability 2018, 10, 1931 22 of 23
44. Gibbons, J.M.; Newbery, D.M. Drought avoidance and the effect of local topography on trees in theunderstorey of Bornean lowland rain forest. Plant Ecol. 2003, 164, 1–18. [CrossRef]
45. Engelbrecht, B.M.J.; Kursar, T.A.; Tyree, M.T. Drought effects on seedling survival in a tropical moist forest.Trees 2005, 19, 312–321. [CrossRef]
46. Adegbidi, A.; Burger, K.; Gandonou, E.; Mulder, I. Farmers’ Perceptions and Sustainable Land Use in the Atacora,Benin; CREED Working Paper 22; International Institute for Environment and Development: London, UK,1999.
47. Mulder, I. Soil Degradation in Benin: Farmers’ Perceptions and Responses. Ph.D. Thesis, Tinbergen Institute,Vrije Universiteit Amsterdam, Amsterdam, The Netherlands, 2000.
48. Gandji, K.; Chadare, F.J.; Idohou, R.; Salako, V.K.; Assogbadjo, A.E.; Kakaï, R.L.G. Status and utilisation ofMoringa oleifera Lam: A review. Afr. Crop Sci. J. 2018, 26, 137–156. [CrossRef]
49. WRB (Ed.) World Reference Base for Soil Resources 2006: A Framework for International Classification, Correlationand Communication; World Soil Resources Reports; FAO: Rome, Italy, 2006; ISBN 978-92-5-105511-3.
50. Walter, H.; Lieth, H. Climate Diagram World Atlas; VEB Gustav Fischer: Jena, Germany, 1967.51. Van Noordwijk, M.; Lusiana, B.; Khasanah, N.; Mulia, R. WaNuLCAS Version 4.0, Background on a Model of
Water, Nutrient and Light Capture in Agrofoerestry Systems; World Agroforestry Center—ICRAF, SEA RegionalOffice: Bogor, Indonesia, 2011; ISBN 978-979-3198-59-0.
52. De Willigen, P.; van Noordwijk, M. Roots for Plant Production and Nutrient Use Efficiency; AgriculturalUniversity Wageningen: Wageningen, The Netherlands, 1987.
53. Emerman, S.H. The tipping bucket equations as a model for macropore flow. J. Hydrol. 1995, 171, 23–47.[CrossRef]
54. De Willigen, P.; Nielsen, N.E.; Claassen, N.; Castrignanò, A.M. Modelling Water and Nutrient Uptake. In RootMethods; Smit, A.L., Bengough, A.G., Engels, C., van Noordwijk, M., Pellerin, S., van de Geijn, S.C., Eds.;Springer: Berlin/Heidelberg, Germany, 2000; ISBN 978-3-662-04188-8.
55. Allen, R.G.; Pereira, L.S.; Raes, D.; Smith, M. Crop Evapotranspiration—Guidelines for Computing Crop WaterRequirements; FAO Irrigation and Drainage Paper 56; FAO: Rome, Italy, 1998; Volume 300.
56. Hodnett, M.G.; Tomasella, J. Marked differences between van Genuchten soil water-retention parameters fortemperate and tropical soils: A new water-retention pedo-transfer functions developed for tropical soils.Geoderma 2002, 108, 155–180. [CrossRef]
57. Walker, A.P.; Mutuo, P.K.; Albrecht, A.; Cadisch, G. Modelling of planted legume fallows in Western Kenyausing WaNuLCAS. (I) Model calibration and validation. Agrofor. Syst. 2007, 70, 197–209. [CrossRef]
58. Khasanah, N.; Perdana, A.; Rahmanullah, A.; Manurung, G.; Roshetko, J.M.; van Noordwijk, M.Intercropping teak (Tectona grandis) and maize (Zea mays): Bioeconomic trade-off analysis of agroforestrymanagement practices in Gunungkidul, West Java. Agrofor. Syst. 2015, 89, 1019–1033. [CrossRef]
59. Loague, K.; Green, R.E. Statistical and graphical methods for evaluating solute transport models: Overviewand application. J. Contam. Hydrol. 1991, 7, 51–73. [CrossRef]
60. Gazol, A.; Camarero, J.J. Mediterranean dwarf shrubs and coexisting trees present different radial-growthsynchronies and responses to climate. Plant Ecol. 2012, 213, 1687–1698. [CrossRef]
61. Johnson, J.B.; Omland, K.S. Model selection in ecology and evolution. Trends Ecol. Evol. 2004, 19, 101–108.[CrossRef] [PubMed]
62. Burnham, K.P.; Anderson, D.R. Multimodel Inference: Understanding AIC and BIC in Model Selection.Sociol. Methods Res. 2004, 33, 261–304. [CrossRef]
63. R Core Team. R: A Language and Environment for Statistical Computing; R Foundation for Statistical Computing:Vienna, Austria, 2017.
64. Pinheiro, J.; Bates, D.; DebRoy, S.; Sarkar, D. R Core Team nlme: Linear and Nonlinear Mixed Effects Models;R Foundation for Statistical Computing: Vienna, Austria, 2017.
65. Duan, J.; Sikka, A.; Grant, G. A comparison of stochastic models for generating daily precipitation at the HJAndrews Experimental Forest. Northwest Sci. 1995, 69, 318–329.
66. Nakagawa, S.; Schielzeth, H.; O’Hara Robert, B. A general and simple method for obtaining R2 fromgeneralized linear mixed-effects models. Methods Ecol. Evol. 2013, 4, 133–142. [CrossRef]
67. Rodgers, V.L.; Smith, N.G.; Hoeppner, S.S.; Dukes, J.S. Warming increases the sensitivity of seedling growthcapacity to rainfall in six temperate deciduous tree species. AoB PLANTS 2018, 10. [CrossRef] [PubMed]

Sustainability 2018, 10, 1931 23 of 23
68. Friedrichs, D.A.; Trouet, V.; Büntgen, U.; Frank, D.C.; Esper, J.; Neuwirth, B.; Löffler, J. Species-specificclimate sensitivity of tree growth in Central-West Germany. Trees 2009, 23, 729–739. [CrossRef]
69. Rykiel, E.J. Testing ecological models: The meaning of validation. Ecol. Model. 1996, 90, 229–244. [CrossRef]70. Hussain, K.; Wongleecharoen, C.; Hilger, T.; Ahmad, A.; Kongkaew, T.; Cadisch, G. Modelling resource
competition and its mitigation at the crop-soil-hedge interface using WaNuLCAS. Agrofor. Syst. 2016, 90,1025–1044. [CrossRef]
71. Kozlowski, T.T.; Winget, C.H. Diurnal and Seasonal Variation in Radii of Tree Stems. Ecology 1964, 45,149–155. [CrossRef]
72. Muthuri, C.W.; Ong, C.K.; Black, C.R.; Mati, B.M.; Ngumi, V.W.; van Noordwijk, M. Modelling the effectsof leafing phenology on growth and water use by selected agroforestry tree species in semi-arid Kenya.Land Use Water Resour. Res. 2004, 4, 1–11.
73. Ettinger, A.K.; Ford, K.R.; HilleRisLambers, J. Climate determines upper, but not lower, altitudinal rangelimits of Pacific Northwest conifers. Ecology 2011, 92, 1323–1331. [CrossRef] [PubMed]
74. Weber, P.; Bugmann, H.; Rigling, A. Radial growth responses to drought of Pinus sylvestris and Quercuspubescens in an inner-Alpine dry valley. J. Veg. Sci. 2007, 18, 777–792. [CrossRef]
75. Ministère de l’Environnement, de l’Habitat et de l’Urbanisme (MEHU). Deuxième Communication Nationale dela République du Bénin sur les Changements Climatiques; MEHU: Cotonou, Republic of Benin, 2011.
© 2018 by the authors. Licensee MDPI, Basel, Switzerland. This article is an open accessarticle distributed under the terms and conditions of the Creative Commons Attribution(CC BY) license (http://creativecommons.org/licenses/by/4.0/).

1
Electronic supplemental materials for Noulèkoun et al. (2018b)
Climate change sensitivity of multi-species afforestation in semi-arid Benin
Published in the journal “Sustainability”
Authors:
Florent Noulèkoun 1, Asia Khamzina 2,*, Jesse Naab 3, Ni’matul Khasanah 4, Meine van
Noordwijk 4,5, John P. A. Lamers 6
1 Center for Development Research (ZEF), Genscherallee 3, 53113 Bonn, Germany
2 Div. Environmental Science and Ecological Engineering, Korea University, 145 Anam-Ro,
Seongbuk-Gu, Seoul 02841, South Korea
3 WASCAL Competence Center, 06 P.O. Box 9507 Ouagadougou, Burkina Faso
4 World Agroforestry Centre (ICRAF), Southeast Asia Regional Programme, PO Box 161, Bogor
16001, Indonesia
5 Plant Production Systems Group, Wageningen University, the Netherlands
6 Center for Development Research (ZEF), Genscherallee 3, 53113 Bonn, Germany
*Corresponding author
E-mail: [email protected]

2
Table S1 Tree parameters used for simulating the growth of Jatropha curcas L. in WaNuLCAS. C = calibrated values; L = values from literature; M = measured values; D = default values from the “WaNuLCAS tree parametrization” Excel file, except for default values of root parameters, which were derived from the “WaNuLCAS” Excel file
Parameter Description Unit
Jatropha curcas
Default value
Value used in simulation
Determination
Growth Stage Length of vegetative cycle days 365 365 D
Length of generative cycle days 90 90 D
Earliest day to flower in a year Julian day 305 305 D
Latest day to flower in a year Julian day 195 195 D
Initial stage - 0.10 0.10 D
Stage after pruning - 0.15 1.00 L
Growth Max. growth rate kg m-2 0.02 0.007 C
Fraction of growth reserve - 0.025 0.025 D
Leaf weight ratio - 0.70 0.50 M
Specific leaf area m2 kg-1 7.00 25.40 M
Water requirement for dry matter production l kg-1 300 300 D
Tree growth follows rubber tree rules? - 0.00 0.00 D
Fruit Fruit growth follows oil palm rules? - 0.00 0.00 D
Fraction biomass allocated to fruit - 0.25 0.08 L
Canopy Max. canopy height above bare stem m 1.50 1.76 M
Ratio between canopy width and height - 0.50 0.48 C
Max. canopy radius m 1.50 1.62 M
Maximum leaf area index - 5.33 3.00 C
Ratio leaf area index min. and max. - 0.50 0.36 L

3
Table S1 continued
Parameter Description Unit
Jatropha curcas
Default value
Value used in simulation
Determination
Light capture Relative light intensity at which shading starts to affect tree growth
- 0.50 0.50 D
Extinction light coefficient - 0.70 0.50 C
Rain interception Rainfall water stored at leaf surface mm 1.00 1.00 D
Tree Water Coefficient related to tree root conductivity cm day-1 0.00002 0.00002 D
Plant potential for max. transpiration cm -1500 -1500 D
Plant potential for min. transpiration cm -4500 -4500 D
N2 Fixation Type of N2 fixation - 0.00 0.00 D
Proportion of N from atmosphere - 0.00 0.00 D
Fraction of reserve pool for N2 fixation - 0.00 0.00 D
Dry weight cost for N2 fixation - 0.005 0.005 D
Responsiveness of N2 fixation to N stress - 0.00 0.00 D
N Concentration N concentration in carbohydrate reserves g g-1 0.11 0.11 D
N concentration in leaf component g g-1 0.025 0.0099 M
N concentration in twig component g g-1 0.008 0.0158 M
N concentration in wood component g g-1 0.005 0.0175 M
N concentration in fruit component g g-1 0.015 0.015 D
N concentration in root component g g-1 0.01 0.0142 M
P Concentration P concentration in carbohydrate reserves g g-1 0.0055 0.01 C
P concentration in leaf component g g-1 0.001 0.0004 L
P concentration in twig component g g-1 0.00 0.0038 L

4
Table S1 continued
Parameter Description Unit
Jatropha curcas
Default value
Value used in simulation
Determination
P concentration in wood component g g-1 0.00 0.0019 L
P concentration in fruit component g g-1 0.001 0.0047 L
P concentration in root component g g-1 0.001 0.0014 L
Litterfall Litterfall caused by drought day-1 0.10 0.008 C
Threshold value for litterfall due to drought - 0.70 0.70 D
Reducing factor for N of litterfall - 0.85 0.85 D
Reducing factor for P of litterfall - 0.85 0.85 D
Litter quality Lignin fraction of litterfall - 0.20 0.1584 L
Lignin fraction of pruned biomass - 0.20 0.1683 L
Lignin fraction of root - 0.20 0.1395 L
Polyphenol fraction of litterfall - 0.05 0.0371 L
Polyphenol fraction of pruned biomass - 0.05 0.0314 L
Polyphenol fraction of root - 0.05 0.0968 L
Allometric Branching (Aboveground)
Apply allometric equation? - 1.00 1.00 -
Intercept for total biomass equation kg 0.012 0.004 M
Power for total biomass equation cm-1 2.336 2.930 M
Intercept for branch biomass equation kg 0.008 0.004 M
Power for branch biomass equation cm-1 2.315 2.740 M
Intercept for Leaf and twig biomass equation kg 0.004 0.003 M
Power for leaf and twig biomass equation cm-1 2.373 2.480 M
Intercept for litterfall equation kg 0.03 0.000 D

5
Table S1 continued
Parameter Description Unit
Jatropha curcas
Default value
Value used in simulation
Determination
Power for litterfall equation cm-1 3.094 3.290 D
Wood density kg m-3 336.3 336.3 L
Roots Root tip diameter cm 0.10 0.10 D
Max. root length density in layer1-zone1 cm cm-3 2.00 0.035637 L
Max. root length density in layer1-zone2 cm cm-3 1.20 0.907471 L
Max. root length density in layer1-zone3 cm cm-3 0.72 0.787833 L
Max. root length density in layer1-zone4 cm cm-3 0.00 0.001 L
Max. root length density in layer2-zone1 cm cm-3 1.50 0.001 L
Max. root length density in layer2-zone2 cm cm-3 0.90 0.196004 L
Max. root length density in layer2-zone3 cm cm-3 0.54 0.496373 L
Max. root length density in layer2-zone4 cm cm-3 0.00 0.001 L
Max. root length density in layer3-zone1 cm cm-3 0.60 0.001 L
Max. root length density in layer3-zone2 cm cm-3 0.36 0.085274 L
Max. root length density in layer3-zone3 cm cm-3 0.216 0.081456 L
Max. root length density in layer3-zone4 cm cm-3 0.00 0.001 L
Max. root length density in layer4-zone1 cm cm-3 0.20 0.001 L
Max. root length density in layer4-zone2 cm cm-3 0.12 0.001 L
Max. root length density in layer4-zone3 cm cm-3 0.072 0.038183 L
Max. root length density in layer4-zone4 cm cm-3 0.00 0.001 L
Note: Literature values from Tjeuw (2017)

6
Table S2 Tree parameters used for simulating the growth of Moringa oleifera Lam. in WaNuLCAS. C = calibrated values; L = values from literature; M = measured values; D = default values from the “WaNuLCAS tree parametrization” Excel file, except for default values of root parameters, which were derived from the “WaNuLCAS” Excel file
Parameter Description Unit Moringa oleifera
Default value
Value used in simulation
Determination
Growth Stage Length of vegetative cycle days 183 183 D
Length of generative cycle days 90 90 D
Earliest day to flower in a year Julian day 210 210 D
Latest day to flower in a year Julian day 360 360 D
Initial stage - 0.10 0.10 D
Stage after pruning - 0.10 0.10 D
Growth Max. growth rate kg m-2 0.036 0.008 C
Fraction of growth reserve - 0.025 0.025 D
Leaf weight ratio - 0.70 0.50 M
Specific leaf area m2 kg-1 10.5 16 C
Water requirement for dry matter production l kg-1 300 300 D
Tree growth follows rubber tree rules? - 0.00 0.00 D
Fruit Fruit growth follows oil palm rules? - 0.00 0.00 D
Fraction biomass allocated to fruit - 0.080 0.08 D
Canopy Max. canopy height above bare stem m 3.30 3.30 D
Ratio between canopy width and height - 0.50 0.23 C
Max. canopy radius m 2.00 2.00 D
Maximum leaf area index - 3.00 3.00 C
Ratio leaf area index min. and max. - 0.50 0.33 C

7
Table S2 continued
Parameter Description Unit Moringa oleifera
Default value
Value used in simulation
Determination
Light capture Relative light intensity at which shading starts to affect tree growth
- 0.80 0.80 D
Extinction light coefficient - 0.86 0.86 D
Rain interception Rainfall water stored at leaf surface mm 1.00 1.00 D
Tree water Coefficient related to tree root conductivity cm day-1 0.00002 0. 00002 D
Plant potential for max. transpiration cm -1500 -1500 D
Plant potential for min. transpiration cm -4500 -4500 D
N2 Fixation Type of N2 fixation - 0.00 0.00 D
Proportion of N from atmosphere - 0.00 0.00 D
Fraction of reserve pool for N2 fixation - 0.00 0.00 D
Dry weight cost for N2 fixation - 0.00 0.00 D
Responsiveness of N2 fixation to N stress - 0.00 0.00 D
N Concentration N concentration in carbohydrate reserves g g-1 0.22 0.22 D
N concentration in leaf component g g-1 0.025 0.013 M
N concentration in twig component g g-1 0.015 0.020 M
N concentration in wood component g g-1 0.01 0.015 M
N concentration in fruit component g g-1 0.023 0.023 D
N concentration in root component g g-1 0.01 0.011 M
P Concentration P concentration in carbohydrate reserves g g-1 0.022 0.022 D
P concentration in leaf component g g-1 0.003 0.003 D
P concentration in twig component g g-1 0.002 0.002 D

8
Table S2 continued
Parameter Description Unit Moringa oleifera
Default value
Value used in simulation
Determination
P concentration in wood component g g-1 0.001 0.001 D
P concentration in fruit component g g-1 0.002 0.002 D
P concentration in root component g g-1 0.001 0.001 D
Litterfall Litterfall caused by drought day-1 0.100 0.008 C
Treeshold value for litterfall due to drought - 0.90 0.70 C
Reducing factor for N of litterfall - 0.85 0.85 D
Reducing factor for P of litterfall - 0.85 0.85 D
Litter quality Lignin fraction of litterfall - 0.20 0.20 D
Lignin fraction of pruned biomass - 0.20 0.20 D
Lignin fraction of root - 0.20 0.20 D
Polyphenol fraction of litterfall - 0.05 0.05 D
Polyphenol fraction of pruned biomass - 0.05 0.05 D
Polyphenol fraction of root - 0.05 0.05 D
Allometric Branching (Aboveground)
Apply allometric equation? - 1.00 1.00 -
Intercept for total biomass equation kg 0.010 0.010 M
Power for total biomass equation cm-1 2.360 2.360 M
Intercept for branch biomass equation kg 0.008 0.008 M
Power for branch biomass equation cm-1 2.380 2.380 M
Intercept for leaf & twig biomass equation kg 0.010 0.010 M
Power for leaf & twig biomass equation cm-1 1.490 1.490 M
Intercept for litterfall equation kg 0.000 0.000 D

9
Table S2 continued
Parameter Description Unit Moringa oleifera
Default value
Value used in simulation
Determination
Power for litterfall equation cm-1 3.290 3.290 D
Wood density kg m-3 262 262 D
Roots Root tip diameter cm 0.10 2.00 D
Max. root length density in layer1-zone1 cm cm-3 2.00 2.00 D
Max. root length density in layer1-zone2 cm cm-3 1.20 1.20 D
Max. root length density in layer1-zone3 cm cm-3 0.72 0.72 D
Max. root length density in layer1-zone4 cm cm-3 0.00 0.00 D
Max. root length density in layer2-zone1 cm cm-3 1.50 1.50 D
Max. root length density in layer2-zone2 cm cm-3 0.90 0.90 D
Max. root length density in layer2-zone3 cm cm-3 0.54 0.54 D
Max. root length density in layer2-zone4 cm cm-3 0.00 0.00 D
Max. root length density in layer3-zone1 cm cm-3 0.60 0.60 D
Max. root length density in layer3-zone2 cm cm-3 0.36 0.36 D
Max. root length density in layer3-zone3 cm cm-3 0.216 0.216 D
Max. root length density in layer3-zone4 cm cm-3 0.00 0.00 D
Max. root length density in layer4-zone1 cm cm-3 0.20 0.20 D
Max. root length density in layer4-zone2 cm cm-3 0.12 0.12 D
Max. root length density in layer4-zone3 cm cm-3 0.072 0.072 D
Max. root length density in layer4-zone4 cm cm-3 0.00 0.00 D

10
Table S3 Relative increment in height (m), diameter (cm), and aboveground biomass (kg m-2) in response to fertilization, irrigation and fertilization plus irrigation as observed and as simulated by WaNuLCAS. Average values of the three harvest times are presented
Treatment effect
Height (m) Diameter (cm) Aboveground biomass
(kg m-2)
Measured Simulated Measured Simulated Measured Simulated
Jatropha curcas
Fertilization (F) 0.10 0.10 0.48 0.54 0.13 0.12
Irrigation(I) 0.08 0.02 0.30 0.05 0.09 0.01
Irrigation plus fertilization (IF)
0.13 0.15 0.53 0.81 0.18 0.17
Moringa oleifera
Fertilization (F) 0.03 0.15 0.51 0.37 0.07 0.03
Irrigation(I) 0.00 0.06 0.15 0.12 0.01 0.02
Irrigation plus fertilization (IF)
0.08 0.11 0.61 0.29 0.07 0.17
Reference
1. Tjeuw J (2017) Is there life after hype for Jatropha? Exploring growth and yield in Indonesia, Wageningen University

Acknowledgements
ACKNOWLEDGEMENTS
The work presented in this thesis is the outcome of collaborative efforts by a number of institutions and persons. I would like to thank all of them up front, although all may not be mentioned here. First and foremost, I would like to thank the Almighty God for His Grace and Mercy.
I am very grateful for the financial support provided by the German Federal Ministry of Education and Research (BMBF) under the program WASCAL (West African Science Service Center on Climate Change and Adapted Land Use), project No. 00100218, which permitted a good unfolding of the research activities as well as my personal survival throughout the duration of the Ph.D. study. I am highly thankful to the Center for Development Research (ZEF), the University of Bonn, the WASCAL Competence Center (in Ouagadougou) and the World Agroforestry Center (ICRAF; Southeast Asia Regional Programme) for their academic, institutional and logistic support.
This thesis also benefited from advice and guidance from many individuals including my supervisors, colleagues and friends. I would like to start by expressing my heartfelt appreciation and gratitude to my first supervisor Professor Asia Khamzina who trusted me to take on this afforestation study. I am also very grateful for her critical and insightful comments and suggestions that greatly improved the quality of this thesis as well as the logistic support that she provided for data collection. I would also like to express my sincere gratitude to my second supervisor Professor Meine van Noordwijk for introducing me to ecological modeling as well as to Ni’matul Khasanah for training me on the use of the Water, Nutrient and Light Capture in Agroforestry Systems (WaNuLCAS) model. My heartfelt thanks go to my advisor Dr. John Lamers for his unconditional support as a father, elder brother and best friend throughout this journey including his timely and valuable advice, constant encouragement and enthusiastic words and daily availability to listen and provide all kinds of help. I very much appreciated working with you and can never thank you enough! I am also very thankful to my second advisor Dr. Jesse Naab for his guidance and assistance during the field activities and valuable advice and comments on the various chapters/articles of the thesis.
I would like to thank the following people, who made the field activities of my study possible and successful: Dr. Nadine Worou, Mr. Adolph Avocanh, Mr. Prudencio Djakpa, Mr. Ezekiel Djakpa, Mr. Emile Idani, Mr. Alaza Zibrila, Mr. Bagari Kiatti, Mr. Doussi Orou Goura, Mr. Moussa Imoru, Ms. Denise Saghi and many more as well as the numerous casual workers. We had unforgettable moments. I am particularly grateful to my field assistant Mr. Prudencio Djakpa for his enthusiasm and wonderful hard-working spirit. I would also like to thank Mr. Saghi and Mr. Michel Le Cornec who willingly offered part of their lands for the setting the experimental trials. My gratitude goes to Ms. Deborah Ruppreht for the laboratory analyses of the plant samples.
I sincerely appreciate the scientific and moral support given by my ZEF colleagues, in particular Dr. Celestino Amouzou, Dr. Willis Okumu, Ms. Juliet Kamau, Ms. Bibiana Corredor, Mr. Emmanuel Rukundo and Mr. Michael Mensah. I gratefully acknowledge the statistical assistance of Dr. Guido Lüchters and Mr. Merveille Savi. Ms.

Acknowledgements
Karin Hagedorn-Mensah, Ms. Doris Fuß, Ms. Sabine Aengenendt-Baer, Mr. Haik Gregorian, Dr. Manfred Denich, Dr. Günter Manske, Ms. Maike Retat-Amin and the student assistants are all greatly acknowledged for their support in every respect. I am highly grateful to the editors and experts who gave insightful comments and suggestions during the review of the published articles as well as to Dr. Sophia Baumert for proofreading the earlier version of the thesis.
I am highly indebted to my dear parents for their logistic and financial support at the initial and final stages of my study. I would also like to express my deepest gratitude to Mr. Nicéphore Noulèkoun, Ms. Jessika Noulèkoun, Mr. Cédric Koudandé and Ms. Ruth Tamadaho for their unconditional support. More than a degree, I have gained knowledge and skills useful for the sustainable management of natural resources and the protection of the environment as well as earned another family through this Ph.D. I am and will be forever grateful.