Ecology and Biomechanics - Anthony Herrel
351
-
Upload
khangminh22 -
Category
Documents
-
view
1 -
download
0
Transcript of Ecology and Biomechanics - Anthony Herrel


ECOLOGYand
BIOMECHANICSA Mechanical Approach to theEcology of Animals and Plants


A CRC title, part of the Taylor & Francis imprint, a member of theTaylor & Francis Group, the academic division of T&F Informa plc.
ECOLOGYand
BIOMECHANICSA Mechanical Approach to theEcology of Animals and Plants
Anthony HerrelThomas Speck
Nicholas P. Rowe
Edited by
Boca Raton London New York

Published in 2006 byCRC PressTaylor & Francis Group 6000 Broken Sound Parkway NW, Suite 300Boca Raton, FL 33487-2742
© 2006 by Taylor & Francis Group, LLCCRC Press is an imprint of Taylor & Francis Group
No claim to original U.S. Government worksPrinted in the United States of America on acid-free paper10 9 8 7 6 5 4 3 2 1
International Standard Book Number-10: 0-8493-3209-5 (Hardcover) International Standard Book Number-13: 978-0-8493-3209-8 (Hardcover) Library of Congress Card Number 2005024415
This book contains information obtained from authentic and highly regarded sources. Reprinted material isquoted with permission, and sources are indicated. A wide variety of references are listed. Reasonable effortshave been made to publish reliable data and information, but the author and the publisher cannot assumeresponsibility for the validity of all materials or for the consequences of their use.
No part of this book may be reprinted, reproduced, transmitted, or utilized in any form by any electronic,mechanical, or other means, now known or hereafter invented, including photocopying, microfilming, andrecording, or in any information storage or retrieval system, without written permission from the publishers.
For permission to photocopy or use material electronically from this work, please access www.copyright.com(http://www.copyright.com/) or contact the Copyright Clearance Center, Inc. (CCC) 222 Rosewood Drive,Danvers, MA 01923, 978-750-8400. CCC is a not-for-profit organization that provides licenses and registrationfor a variety of users. For organizations that have been granted a photocopy license by the CCC, a separatesystem of payment has been arranged.
Trademark Notice: Product or corporate names may be trademarks or registered trademarks, and are used onlyfor identification and explanation without intent to infringe.
Library of Congress Cataloging-in-Publication Data
Ecology and biomechanics : a mechanical approach to the ecology of animals and plants / editors, Anthony Herrel, Thomas Speck, Nicholas Rowe.
p. cm.Includes bibliographical references.ISBN-13: 978-0-8493-3209-8 (hardcover : alk. paper)ISBN-10: 0-8493-3209-5 (hardcover : alk. paper)1. Ecology. 2. Biomechanics. I. Herrel, Anthony. II. Speck, Thomas. III. Rowe, Nicholas P.
QH541.14.E243 2006577--dc22 2005024415
Visit the Taylor & Francis Web site at http://www.taylorandfrancis.com
and the CRC Press Web site at http://www.crcpress.com
Taylor & Francis Group is the Academic Division of Informa plc.
3209_Discl.fm Page 1 Tuesday, November 22, 2005 1:29 PM

Preface
Ecology and Biomechanics: A Mechanical Approach to the Ecology of Animals andPlants. When we decided upon this title there were two elements we wanted toemphasize: first, that biomechanical approaches have a lot to offer to ecologicalquestions and second, that the approaches included in this book are independent ofthe organism being studied. Indeed, the present collection of state-of-the-art papersbeautifully highlights how biomechanics can provide novel insights into long stand-ing ecological and evolutionary questions (e.g., Chapters 4 and 14). As illustrated,for example, in the chapter by Wendy Griffiths (Chapter 5) on grazing in ruminants,there is tremendous scope for applying engineering principles to the understandingof foraging strategies used by animals. Although most of the examples included inthe book emphasize distinct organism–environment relationships, it is foreseeablethat in the longer term these kinds of approaches will span larger temporal andspatial scales to achieve wider application across ecosystems. The chapter by KarenChristensen-Dalsgaard (Chapter 13) nicely illustrates this, and highlights how micro-bial ecosystems can be understood from the mechanics, morphology, and motileresponses of the individual organisms. The range of topics covered clearly demon-strates that increasing numbers of workers have begun to combine biomechanicsand ecology to generate novel insights into questions of an ecological nature.
We hope that this book will highlight the important cross fertilization that canoccur by combining approaches from two — at first sight — very disparate subdis-ciplines within the general field of biology and will stimulate other researchers tofollow these kinds of approaches. The subjects covered include research based onboth plants (Chapters 1 to 4) and animals (Chapters 10 and 12) as well as theinteraction between plants and animals (Chapters 5 to 9). By highlighting boththeoretical concepts and practical approaches, we hope that this book will be animportant reference for students and researchers alike. Most of the chapters includedin this book were originally presented at a symposium entitled “Ecology and Bio-mechanics” held at the annual meeting of the Society for Experimental Biology inEdinburgh, U.K., in April 2004. Generous support by the Biomechanics Group ofthe Society for Experimental Biology enabled us to invite many outstanding speak-ers, most of whom decided to contribute to the present volume.
Anthony Herrel is a postdoctoral researcher of the Fund for Scientific Research,Flanders, Belgium (FWO-Vl). Thomas Speck is Professor for Functional Morphol-ogy and Director of the Botanic Garden of the Albert-Ludwigs-Universität Freiburg(Germany). Nick Rowe is Chargé de Recherche (CNRS) at the Botanique andBioinformatique Research Institute, Montpellier, France.
3209_C000.fm Page v Tuesday, November 22, 2005 6:40 AM


Editors
Anthony Herrel earned his degree at the University of Antwerp under the supervi-sion of Professor Dr. F. De Vree with a thesis on lizard herbivory. He then becamea postdoctoral researcher at the Fund for Scientific Research — Flanders, Belgium(FWO-Vl) with a home base at the University of Antwerp in Belgium. During hisfirst postdoctoral appointment he was awarded a mobility grant, which enabled himto conduct research at the laboratory of Dr. K. Nishikawa at Northern ArizonaUniversity on motor control during feeding in lizards using nerve transection exper-iments. Later, during his second appointment, he spent a year at Tulane Universityin New Orleans in the laboratory of Dr. D. Irschick working on the evolution ofcranial morphology and diet in Anolis lizards. He is currently on his final appoint-ment as postdoctoral researcher at the FWO-Vl and is based at the FunctionalMorphology Laboratory at the University of Antwerp, working under the tutelageof Dr. P. Aerts.
Thomas Speck graduated in 1986 from the University of Freiburg with a diplomathesis on the biomechanics of early land plants. In 1990 he completed his doctoratethesis on biomechanics and functional anatomy of various plant growth forms andreceived his habilitation in botany and biophysics in 1996. Since 2002 he has beenprofessor of functional morphology and director of the Botanic Garden of theUniversity of Freiburg (Germany). He has written over 130 papers covering manyaspects of plant biomechanics, functional morphology, biomimetics, and phylogenyof plants. He is a member of the board of the Competence Networks Plants asConcept Generators for Biomimetical Materials and Technologies and BIOKON e.V.He is president of the Society of Botanic Gardens, Germany.
Nicholas P. Rowe graduated from the Department of Botany, University of Bristol,where he went on to complete his doctorate thesis in fossil plant biology in 1986.He has since carried out research in plant biology in London, France, and Germany.Over the last 10 years he has been a research scientist for the Centre National de laRecherche Scientifique in Montpellier, France. A relative latecomer to the world ofbiomechanics, his research has combined plant biomechanics with evolutionary andecological studies, and integrating such approaches with both laboratory experimen-tal work and field work, particularly in the tropics. His main interests are functionaland evolutionary studies in plants, particularly the evolution of complex structures,major innovations, and in particular, the evolution and biomechanics of various plantgrowth forms such as trees, shrubs, and climbers.
3209_C000.fm Page vii Tuesday, November 22, 2005 6:40 AM


Acknowledgments
We would like to acknowledge the much appreciated help of Bieke Vanhooydonckand Katleen Huyghe with the final editing and formatting of the chapters presentedin this book. Additionally, we would like to thank the following referees for criticalcomments on the chapters and the many helpful suggestions for improvement:P. Aerts (University of Antwerp, Belgium), B. Borrell (University of California,Berkeley), T. Buckley (Australian National University, Canberra), A. Davy (Univer-sity of East Anglia, Norwich, United Kingdom), R. Dudley (University of California,Berkeley), M. Edmunds (University of Central Lancashire, Preston, United King-dom), S. Eigenbrode (University of Idaho, Moscow), T. Fenchel (University ofCopenhagen, Denmark), F. Gallenmüller (University of Freiburg, Germany), A.Goodman (University of Lincoln, United Kingdom), D. Irschick (Tulane University,New Orleans, Louisiana), G. Jeronimidis (University of Reading, United Kingdom),M. Jervis (Cardiff University, United Kingdom), R. Jetter (University of BritishColumbia, Vancouver, Canada), J. Losos (Washington University, St. Louis, Mis-souri), K. Lunau (University of Duesseldorf, Germany), B. Moon (University ofLouisiana, Lafayette, Louisiana), C. Neinhuis (Technical University of Dresden,Germany), J. Pilarski (Northern Arizona University, Arizona), B. Vanhooydonck(University of Antwerp, Belgium), J. Vincent (University of Bath, United Kingdom).Finally we would like to thank Amy Rodriguez, David Fausel, and John Sulzyckiat Taylor & Francis for all their help with the practical aspects of putting togetherthe book.
3209_C000.fm Page ix Tuesday, November 22, 2005 6:40 AM


List of Contributors
Peter AertsDepartment of BiologyUniversity of AntwerpAntwerpen, Belgium
Brendan J. BorrellDepartment of Integrative BiologyUniversity of CaliforniaBerkeley, California
Tanja BrueningDepartment of Zoology IIBiozentrum, Am HublandWürzburg, Germany
Karen K. Christensen-DalsgaardDepartment of BiologyAarhus UniversityAarhus, DenmarkandSchool of Biological SciencesThe University of ManchesterManchester, United Kingdom
Regine Claßen-BockhoffJohannes Gutenberg UniversitätInstitut für spezielle BotanikMainz, Germany
Catherine CoutandU.M.R. Physiologie Intégrée de l’Arbre
Fruitier et ForestierINRA, Site de CrouëlClermont-Ferrand, France
Roland EnnosSchool of Biological SciencesUniversity of ManchesterManchester, United Kingdom
Walter FederleDepartment of Zoology IIBiozentrum, Am HublandWürzburg, Germany
Thierry FourcaudU.M.R. Laboratoire de Rheologie du
Bois de BordeauxDomaine de l’HermitageCestas, FranceandU.M.R. Botanique et Bionformatique de
l’Architecture des PlantesMontpellier, France
Meriem FournierU.M.R. Ecologie des Forets de Guyane(Mixed Unit:
CIRAD/CNRS/ENGREF/INRA)Campus Agronomique de KourouKourou, France
Friederike GallenmüllerBotanischer GartenUniversität FreiburgFreiburg, Germany
Yvonne GoldingSchool of Biological SciencesUniversity of ManchesterManchester, United Kingdom
Elena GorbEvolutionary Biomaterials GroupMax-Planck-Institut für
MetallforschungStuttgart, Germany
3209_C000.fm Page xi Tuesday, November 22, 2005 6:40 AM

Stanislav GorbEvolutionary Biomaterials GroupMax-Planck-Institut für
MetallforschungStuttgart, Germany
Wendy M. GriffithsAgResearch LimitedInvermay Agricultural CentreMosgiel, New Zealand
Deane L. HarderBotanischer GartenUniversität FreiburgFreiburg, Germany
Andrew P. HendryRedpath Museum and Department of
BiologyMcGill UniversityMontreal, Quebec, Canada
Anthony HerrelDepartment of BiologyUniversity of AntwerpAntwerpen, Belgium
Catriona L. HurdBotany DepartmentUniversity of OtagoDunedin, New Zealand
Duncan J. IrschickDepartment of Ecology and
Evolutionary BiologyTulane UniversityNew Orleans, Louisiana
Sandrine IsnardU.M.R. Botanique et Bioinformatique
de l’Architecture des PlantesMontpellier, France
Rob S. JamesCoventry UniversitySchool of Science and the EnvironmentCoventry, United Kingdom
Harald W. KrennDepartment of Evolutionary BiologyInstitute of ZoologyUniversity of ViennaVienna, Austria
Katherine A. McCullohDepartment of BiologyUniversity of UtahSalt Lake City, Utah
Bruno MouliaU.M.R. Physiologie Intégrée de l’Arbre
Fruitier et ForestierINRA, Site de CrouëlClermont-Ferrand, France
Carlos A. NavasDepartamento de FisiologiaInstituto de BiociênciasUniversidade de São PauloSão Paulo, SP, Brasil
Jeffrey PodosDepartment of BiologyUniversity of MassachusettsAmherst, Massachusetts
Martin ReithBotanischer GartenUniversität FreiburgFreiburg, Germany
Nicholas P. RoweU.M.R. Botanique et Bioinformatique
de l’Architecture des PlantesMontpellier, France
3209_C000.fm Page xii Tuesday, November 22, 2005 6:40 AM

Thomas SpeckBotanischer GartenUniversität FreiburgFreiburg, Germany
John S. SperryDepartment of BiologyUniversity of UtahSalt Lake City, Utah
Craig L. StevensNational Institute for Water and
Atmospheric ResearchKilbirnie, New Zealand
Alexia StokesU.M.R. Laboratoire de Rheologie du
Bois de BordeauxDomaine de l’HermitageCestas, France
Bieke VanhooydonckDepartment of BiologyUniversity of AntwerpAntwerpen, Belgium
Robbie S. WilsonPhysiological Ecology LaboratoryDepartment of ZoologyThe University of QueenslandSt. Lucia, Australia
3209_C000.fm Page xiii Tuesday, November 22, 2005 6:40 AM


Table of Contents
Chapter 1 Tree Biomechanics and Growth Strategies in the Context of Forest Functional Ecology....................................................................................................1
Meriem Fournier, Alexia Stokes, Catherine Coutand, Thierry Fourcaud, and Bruno Moulia
Chapter 2 Diversity of Mechanical Architectures in Climbing Plants: An Ecological Perspective ...............................................................................................................35
Nicholas P. Rowe, Sandrine Isnard, Friederike Gallenmüller, and Thomas Speck
Chapter 3 The Role of Blade Buoyancy and Reconfiguration in the Mechanical Adaptation of the Southern Bullkelp Durvillaea....................................................61
Deane L. Harder, Craig L. Stevens, Thomas Speck, and Catriona L. Hurd
Chapter 4 Murray’s Law and the Vascular Architecture of Plants ..........................................85
Katherine A. McCulloh and John S. Sperry
Chapter 5 Plant–Animal Mechanics and Bite Procurement in Grazing Ruminants .............101
Wendy M. Griffiths
Chapter 6 Biomechanics of Salvia Flowers: The Role of Lever and Flower Tube in Specialization on Pollinators .................................................................................123
Martin Reith, Regine Claßen-Bockhoff, and Thomas Speck
Chapter 7 Do Plant Waxes Make Insect Attachment Structures Dirty? Experimental Evidence for the Contamination Hypothesis ........................................................147
Elena Gorb and Stanislav Gorb
3209_C000.fm Page xv Tuesday, November 22, 2005 6:40 AM
Chapter 8 Ecology and Biomechanics of Slippery Wax Barriers and Wax Running in Macaranga–Ant Mutualisms.................................................................................163
Walter Federle and Tanja Bruening
Chapter 9 Nectar Feeding in Long-Proboscid Insects ...........................................................185
Brendan J. Borrell and Harald W. Krenn
Chapter 10 Biomechanics and Behavioral Mimicry in Insects ...............................................213
Yvonne Golding and Roland Ennos
Chapter 11 Interindividual Variation in the Muscle Physiology of Vertebrate Ectotherms: Consequences for Behavioral and Ecological Performance .................................231
Carlos A. Navas, Rob S. James, and Robbie S. Wilson
Chapter 12 Power Generation during Locomotion in Anolis Lizards: An Ecomorphological Approach ...........................................................................253
Bieke Vanhooydonck, Peter Aerts, Duncan J. Irschick, and Anthony Herrel
Chapter 13 Implications of Microbial Motility on Water Column Ecosystems .....................271
Karen K. Christensen-Dalsgaard
Chapter 14 The Biomechanics of Ecological Speciation ........................................................301
Jeffrey Podos and Andrew P. Hendry
Index......................................................................................................................323
3209_C000.fm Page xvi Tuesday, November 22, 2005 6:40 AM

1
1 Tree Biomechanics and Growth Strategies in the Context of Forest Functional Ecology
Meriem Fournier, Alexia Stokes, Catherine Coutand, Thierry Fourcaud, and Bruno Moulia
CONTENTS
1.1 Introduction ......................................................................................................21.2 Some Biomechanical Characteristics of Trees ................................................3
1.2.1 Wood as a Lightweight, Cellular- and Fiber-Reinforced Material .....31.2.2 Wood Variability...................................................................................51.2.3 Mechanics of Secondary Growth ........................................................6
1.3 Biomechanical and Ecological Significance of Height...................................61.3.1 Biomechanical Environmental Constraints on Tree Height and
Their Ecological Significance..............................................................71.3.1.1 Safety Factor .........................................................................71.3.1.2 Analysis of Successive Shapes Occurring during Growth
Due to the Continuous Increase of Supported Loads..........81.3.2 Biomechanical Functional Traits Defined from Risk Assessment......9
1.3.2.1 Buckling or Breakage of Stems ...........................................91.3.2.2 Root Anchorage ....................................................................9
1.3.3 Biomechanical Functional Traits and Processes Involved in Height Growth Strategy .....................................................................13
1.4 The Growth Processes That Control the Mechanical Stability of Slender Tree Stems......................................................................................................141.4.1 The Mechanical Control of Growth ..................................................141.4.2 The Control of Stem Orientation to Maintain or Restore the
Tree Form, and Allow Vertical Growth .............................................161.4.3 The Control of Root Growth to Secure Anchorage ..........................21
1.5 A Practical Application of Tree Biomechanics in Ecology ..........................211.6 Conclusion......................................................................................................24References................................................................................................................25
3209_C001.fm Page 1 Thursday, November 10, 2005 10:44 AM

2 Ecology and Biomechanics
1.1 INTRODUCTION
Whereas the mechanical performance of plant organs has often been discussed inevolutionary biology [1,2], tree biomechanics has rarely been considered in thecontext of functional ecology. Functional ecology aims at understanding the func-tions of organisms that result in fluxes of biomass or energy within an ecosystem,e.g., a forest. This discipline studies the processes controlling these fluxes, at eitherthe scale of an individual, community, or ecosystem, with their response to naturalor anthropic environmental variations.
Ecological differences among vascular land plant species arise from differentways of acquiring the same major resources of light, water, CO2, and nutrients. Anecological strategy is the manner in which species secure carbon profit, i.e., bothlight and CO2 absorption, during vegetative growth, and this also ensures genetransmission in the future [3]. At the present time, the relationship between biodi-versity and ecosystem functioning is one of the most debated questions in ecology,and it is of great importance to identify variations in ecological strategies betweenspecies [3–6].
In this context, the field of tree biomechanics is concerned with the manner inwhich trees develop support structures to explore space and acquire resources, and,by feedback, to allocate biomass to the support function. The purpose of this chapteris to discuss how an understanding of the solid mechanics of materials and structureshas contributed to functional ecology with examples taken from current studies intree biomechanics.
Mechanics gives physical limits to size, form, and structure because livingorganisms must follow physical laws [7]. This discipline also allows several rela-tionships between function and size, form, or structure to be explored. Solid mechan-ics provides the relationships between supported loads (inputs) to outputs such asdisplacements, strains, stresses (local distribution of loads), and safety factors againstbuckling or failure through given parameters [8]. These parameters may be structuralgeometry (shape) and material properties, e.g., critical stresses or strains leading tofailure, or the relationship between stresses and strains given, e.g., in the simplestcase by the modulus of elasticity (or Young’s modulus) [8]. Biomechanics is muchmore ambitious than solid mechanics. Biomechanics aims at analyzing the behaviorof an organism that performs many not explicitly specified functions using geometryand material properties fabricated by processes shaped by the complexity of bothevolution and physiology. Thus, to use the framework of solid mechanics to solvebiological problems concerning form and function, biomechanics involves differentsteps. Initially, a representation of the plant and of the supported loads using amechanical model is necessary. This step means that initial choices must be madebecause models are nearly always simplifications. For example, can wind be con-sidered as a static or a dynamic force for the problem considered? Are stemsparaboloids or cylinders? Is root anchorage perfectly rigid or not? These initialchoices can have huge consequences on the subsequently discussed outputs, inparticular concerning the functional significance or the adaptive value of mechanicaloutputs, e.g., safety factors [9] or gravitropic movements. The subsequent discussionstend to be biological in nature and therefore out of the scope of engineering science.
3209_C001.fm Page 2 Thursday, November 10, 2005 10:44 AM

Tree Biomechanics and Functional Ecology 3
Before dealing with several ecological questions, we first present some biome-chanical characteristics of trees and develop questions concerning height growthstrategies. We then discuss successively the underlying mechanical problems andassociated models, i.e., the representation of supported loads, plant shape, andmaterial along with the biological problems, data, and hypotheses, especially thosetackling the biological control of size, shape, and material properties. The practicalapplication of biomechanics in eco-engineering [10] is then discussed.
1.2 SOME BIOMECHANICAL CHARACTERISTICS OF TREES
Trees are among the largest living organisms and are the tallest self-supportingplants. Growth in height incurs high costs because of the investment in safe andstable support structures [11]. For the engineer, the understanding of tree biome-chanics represents a challenge to current knowledge because trees can be very talland very slender, and yet display a long life span. As we see later on, secondarygrowth, i.e., growth in thickness or radial growth, occurs in the cambial meristemlocated just underneath the bark [12] and is the main process contributing to thesurvival of such structures during their long life span.
1.2.1 WOOD AS A LIGHTWEIGHT, CELLULAR- AND FIBER-REINFORCED MATERIAL
Secondary growth produces an efficient support tissue: wood. Wood has been usedby human beings for many years — dried wood has been used to construct buildingsor make furniture. Such dried wood has a moisture content that depends on airtemperature and humidity, and is made up of wood cells possessing empty lumina.Living trees, however, possess green wood. In green wood, cell walls are saturated,and additional water also fills up the lumina [13]. Because the mechanical propertiesof wood depend on the moisture content of the cell wall, the drier the wood, thestiffer and stronger it is [13]. Caution should thus be taken when using engineeringliterature in wood sciences because databases are not always suitable for biome-chanical analyses dealing with moist, green wood. However, mechanical propertiesdo not vary significantly beyond a moisture content of approximately 30% (on a dryweight basis) when cell walls are saturated and lumina empty [13,14]. In living trees,water transport affects lumen water content with cell walls in the sapwood beingcompletely or partially saturated. As a consequence, although wood moisture contentvaries in living trees, e.g., according to seasons, species, and ontogeny, the variationsof mechanical properties of green wood, i.e., stiffness and strength, during thegrowing season can be neglected.
Rheological data concerning green wood are scarce (but see, for example[15,16]), and there is a need for more systematic studies in this area. Meanwhile,whenever comparisons are made, there is usually a good correlation between theproperties of green and dry wood used to estimate green wood properties [14].Because of its complex structure at different scales, wood can be considered to be avery “high tech” material. An analysis of specific properties, i.e., ratios of mechanical
3209_C001.fm Page 3 Thursday, November 10, 2005 10:44 AM

4 Ecology and Biomechanics
properties to density, reveals that at the cellular level, wood is a “honeycomb-like”lightweight material of high performance. This cellular structure is also the originof the close relationship between dried wood specific gravity, which represents theamount of supporting material characterized by its porosity, and mechanical prop-erties [17,18]. For instance, using the regressions established by Guitard [17] at aninterspecific level on a wide sample of species with a large range of densities, andtransforming mass, volume, and modulus of elasticity of air-dried wood to greenwood and oven-dried properties, we can approximate the parallel to the grain mod-ulus of elasticity of green wood for angiosperms by:
(1.1)
where E is the modulus of elasticity of green wood (MPa) (pooling together esti-mations by several methods: tension, compression, bending) and D is the basicdensity, i.e., the ratio of the oven-dried biomass to the volume of green wood.
These relationships show an approximately constant ratio between E and basicdensity. Thus, as pointed out by several authors [19–21], wood’s mechanical effi-ciency relative to stiffness and dry biomass available is almost constant, no matterhow porous the wood. However, dried biomass does not represent the true weightsupported by a living tree, and the ratio of E to humid density changes as the moreporous wood can absorb more water (Figure 1.1). Furthermore, an exhaustive dis-
FIGURE 1.1 Evolution of the specific modulus of elasticity for angiosperm green wood (ratioof the modulus of elasticity E to wood density) with basic density D. D is the amount ofdried biomass per unit of green volume, i.e., the cost of support. DS (dotted line) is the densityat full saturation, i.e., cell lumens are entirely filled with water, for wood density obtained infunctioning sapwood, i.e., maximal self-weight of support organs. E/D is almost constantwhile E/DS increases significantly with wood basic density.
ED
= 104000 53
1 03
.
.
0.8
1
1.2
1.4
1.6
0.3 0.5 0.70.1 0.9 Basic density D
Den
sity
0
5000
10000
15000
20000
25000
Spec
ific
Youn
g's m
odul
us (M
Pa)
Ds
E/D
E/Ds
3209_C001.fm Page 4 Thursday, November 10, 2005 10:44 AM

Tree Biomechanics and Functional Ecology 5
cussion about design should also include additional branch and leaf weights. Thus,wood mechanical performance relative to design against, for example buckling, canchange from light to dense woods. Such a distinction between mechanical efficiency,i.e., the cost of support per unit of dried mass, and performance (design safetyrelative to supported, humid mass) has never been considered.
At the level of the cell wall, wood is a multilayered material and can beconsidered as a reinforced composite made up of microfibrils composed of crystal-line cellulose embedded in a matrix of lignins and hemicelluloses [22,23]. Thiscomposite structure is the major reason for the high anisotropy of wood: mechanicalstiffness and strength are much greater along the grain, in the direction more or lessparallel to the stem axis. This longitudinal direction is usually the most loadeddirection and is held in bending in beamlike structures, such as trunks and branches.Because the cellulose microfibrils are very stiff, one important structural feature atthe cell wall level is the angle between cellulose microfibrils and the cell axis in theS2 layer [22]. Significant changes in this microfibril angle (MFA) can be observed,such as in juvenile and compression wood, which have a much greater MFA [22,24].Therefore, these types of wood are much less stiff than can be expected from theirdensity, e.g., by using standard formulas to estimate the modulus of elasticity fromwood dried density [17,18].
1.2.2 WOOD VARIABILITY
Wood structure and properties vary between and within species [25]. The adaptivemechanical performances of wood structure among different species in relation totree phylogeny and other functional traits have rarely been discussed [26]. Amongthe huge diversity of tropical species, wood density (of dried biomass) has oftenbeen used as a measure of maximal growth rate and of relative shade tolerance.Fast-growing, shade-intolerant species have lower wood densities [27,28]. Within aspecies, faster growth is usually associated with lower density, especially in soft-woods, although many exceptions can be found, e.g., in oak, faster growth is asso-ciated with higher density [29]
Another complicating factor when considering wood structure is that wood isnot homogeneous within the radial cross section [25]. Variability due to the presenceof several different types of wood can be observed. These different types of woodinclude: reaction wood (see below), early and late wood (specializing, respectively,in transport and support), juvenile wood (the wood formed from a juvenile cambium[25]), and heartwood (the central wood that does not conduct sap and is impregnatedwith chemicals as a result of secondary metabolism occurring in the sapwood) [30].Although such variability within the cross section is very common, the specificgeometrical pattern of these different types of wood depends on species and geneticbackgrounds, as well as environmental conditions and the stage of ontogeny. Forexample, juvenile wood is often less dense and stiff than normal wood [22], but thecontrary can also be found [31]. The adaptive interest for tree mechanical safety ofsuch radial variations in wood density has been discussed by Schniewind [32],Wiemann and Williamson [33], and Woodcock and Shier [34].
3209_C001.fm Page 5 Thursday, November 10, 2005 10:44 AM

6 Ecology and Biomechanics
1.2.3 MECHANICS OF SECONDARY GROWTH
Secondary growth, or the peripheral deposition of load-bearing tissue over time, isnot a well-known feature in mechanical engineering. This phenomenon thus requiresa careful analysis because inert structures are considered by engineers to exist beforebeing subjected to loading. However, in the case of plants and trees, the structureis already loaded before the new material is laid down, and even during the formationof this new material, mechanical loading continues to occur. For example, whendealing with the local distribution of stresses induced by self-weight in both com-pression and bending, the solid mechanics theory of homogenous materials wouldpredict a linear distribution from the upper to the lower side. This theory can bemodified to take into consideration material heterogeneity within the cross section[35]. In both cases, using formulas from standard mechanical engineering textbooks[8,35] allows us to calculate stresses from the total self-weight and the whole cross-sectional geometry without any data about growth history [7]. However, this analysisimplicitly supposes that the total weight has been fixed after the formation of thecross section, whereas in trees, both the weight and cross section grow simulta-neously. Taking into account the relative kinetics of cross section and weight growth,Fournier and coworkers [36] emphasized the huge discrepancies when classicalengineering theories are used. For example, peripheral wood that is very youngsupports only a small amount of self-weight, i.e., the weight increment in the abovestem and crown since peripheral wood, even when the tree is leaning and self-weightacts as a bending load [37]. This consideration is also of great importance whenanalyzing successive shapes of growing stems that are continuously bent by gravi-tational forces (see Section 1.3.1.2).
1.3 BIOMECHANICAL AND ECOLOGICAL SIGNIFICANCE OF HEIGHT
Height is recognized universally as a major plant trait, giving most benefit to theplant in terms of access to light, and therefore makes up part of a plant’s ecologicalstrategy [3]. Nevertheless, as pointed out by Westoby et al. [3], different elementsshould be separated from an ecological point of view: the rate of height growthassociated to light foraging, the asymptotic height, and the capacity to persist at agiven height. Moreover, investment in height includes several trade-offs and adaptiveelements. The question of the coexistence of species at a wide range of heights hasbeen studied in a mathematical framework using game theory [38]. Whether maximalasymptotic height is constrained by physical limitations, e.g., mechanical supportor hydraulics, or only by the biological competition for light, i.e., height growthstops when it ceases to offer a competitive advantage, is still an open question [39].Hydraulic limitations of tree height have been discussed [39–41]. Although somekind of trade-off may be involved between these different functions, we discuss onlythe biomechanical aspects of the question.
3209_C001.fm Page 6 Thursday, November 10, 2005 10:44 AM

Tree Biomechanics and Functional Ecology 7
1.3.1 BIOMECHANICAL ENVIRONMENTAL CONSTRAINTS ON TREE
HEIGHT AND THEIR ECOLOGICAL SIGNIFICANCE
Although growth in length permits the stem to grow higher, the stem also needs tobe self-supporting. Mechanical instability can occur under the effects of self-weight,wind forces, or the combination of both. When such instability occurs, it can producefailure or not, with obviously distinct ecological consequences. To assess whetherthese risks are or are not ecological constraints and which mechanical load (if any)is limiting for height growth, researchers find that a mechanical representation, i.e.,a model of the geometry, shape, loads, and boundary conditions, is an extremelyuseful tool.
Furthermore, these mechanical models can provide a basis for the understandingof several biomechanical aspects of the dynamics of forest communities. Not onlyis forest dynamics concerned with tree mechanical stability in communities becausestorm damage to trees can induce gaps that are the motor processes of forest growthdynamics, but mechanical stability is also influenced by forest dynamics. Competi-tion for space in communities can induce huge variations in tree form and architec-ture with, in particular, a modification of allometric relations [42] as well as changesin wood quality linked to tree growth rate [25]. Ancelin et al. [43–45] developed anindividual tree-based mechanical model of this feedback between tree biomechanicsand forest dynamics.
1.3.1.1 Safety Factor
Safety factors are the nondimensional ratios between a characteristic of the presentsituation and the critical non–self-supporting one [9,46]. A safety factor of 1 (orlower than 1) means that the critical situation is reached. The higher the safety factor,the lower the risk. An important point to be assessed is whether the mechanical riskcan be linked to material failure due to increasing bending or buckling because eithercould be limiting, but each requires distinct analyses that can lead to differentconclusions. Bending occurs when a force component is acting perpendicular to thetrunk, such as wind drag in a straight tree, or self-weight in a leaning tree. Whenbending stresses exceed the material strength, failure occurs. In a standing tree, thesafety factor is then defined as the ratio of the material strength to the actual bendingstress. Buckling is caused by a loss of stability of an equilibrium. For example, ifa straight column is loaded under compression and at some critical point, thecompressed equilibrium state becomes unstable, then any mechanical perturbationwould induce a high degree of bending (see [7] for a more complete introduction).
In other words, the column is no longer self-supporting. Safety factors can bedefined as the ratio of the critical weight to the actual weight. In plant biomechanics,interest is rather on what can be achieved for a given amount of aerial biomass.Safety factors for buckling are then usually defined as the ratio of the critical heightto the buckling height, assuming relations, usually allometric, between weight andheight. Mechanical models have been developed to calculate critical situations forboth bending failure and buckling (e.g., [7,9,19,47–53]).
3209_C001.fm Page 7 Thursday, November 10, 2005 10:44 AM

8 Ecology and Biomechanics
Such criteria are useful to compare the mechanical constraints between speciesor environmental situations. Many authors have also discussed the optimality ofphenotypes at an individual (optimal stem taper) or population level (optimal stemslenderness), assuming that the optimal shape maximizes the height for a givendiameter [19,48,50,54] or results in a constant breakage risk along the stem[47,53,55]. Slenderness rules, i.e., relationships that are usually allometric, betweenheight and diameter within a population of trees are usually derived from theassumption of constant safety factors among the population (see [51] for a criticalreview and [56,57] for a general discussion about adaptative interpretations ofallometries from mechanical and alternative hypotheses). However, several authorshave discussed the values of safety factors when they are close or not to the criticallimit, and their variability with tree ontogeny [21,49,58–60]. All of them found thatsafety factors against buckling decrease with growth in saplings as the competitionfor light became more intense and material resources that could be used for trunkgrowth become less available. A few authors have also studied safety factors inrelation to species’ shade tolerance and light conditions [58,61]. However, theseapproaches have always considered that trees have to avoid any critical situation andhave never discussed the postcritical behavior of a tree nor the cost of height lossand its possible recovery. Nevertheless, buckling can lead to breakage or permanent,plastic stem lean, which is recoverable through the tree’s gravitropic response (seeSection 1.4.2). Breakage itself does not necessarily result in tree death and recoverycan occur through healing of wounds or resprouting. Determining the conditions forbuckling to occur is thus not sufficient, and the assumption that buckling is acatastrophic biological event remains to be tested in each particular case.
1.3.1.2 Analysis of Successive Shapes Occurring during Growth Due to the Continuous Increase of Supported Loads
Growth is by itself a mechanical constraint. Indeed, from a mechanical point ofview, a small initial bending should be amplified by growth because in any crosssection of the trunk, growth increases bending loads due to self-weight. Thus,bending curvature is increased and stiffened by continuing radial growth in anamount depending on the relative rates of bending moment and cross-sectionalstiffness increases [37,62–64]. This dynamic and continuous growth constraint hasrarely been analyzed carefully and has never been considered in ecological studies.In some cases such constraints may be considerable, such as sudden increase ofloads (e.g. leaf flushes or heavy fruit production) on slender flexible stems, whichis followed by cambial growth that adjusts the curved shape [62]. However, it isclear that without any biological control of verticality, e.g., a selection of the mostvertical trees, or the action of gravitropism to restore verticality (see Section 1.4.2),any given degree of stem lean at a given height should increase significantly withgrowth. Studying two populations of saplings of Goupia glabra Aubl. (shade-intol-erant species of the rainforest in French Guiana) in understory and full light condi-tions, we found that the lean never increases and even decreases in the most com-petitive (understory) environment (Figure 1.2). Therefore, these data provide
3209_C001.fm Page 8 Thursday, November 10, 2005 10:44 AM

Tree Biomechanics and Functional Ecology 9
evidence of the existence of biological reactions to the gravitational mechanicalconstraint at the population level.
1.3.2 BIOMECHANICAL FUNCTIONAL TRAITS DEFINED FROM RISK
ASSESSMENT
Biomechanical functional traits are the combination of morphological, anatomical,and physiological characteristics that define the height growth strategy. When focus-ing on the mechanical constraints on this strategy, the functional traits are combi-nations of the size, shape, and material properties that influence the risk of tilting,bending, or breakage, and are analyzed as inputs of the mechanical model designedto describe the mechanical constraint.
1.3.2.1 Buckling or Breakage of Stems
Tree mechanical design against buckling [48] or breakage [47] has been studied forover a century. Most existing models (see [51] for a synthesis) have considered thetree as a vertical, tapered pole of a homogeneous material, loaded either by static,lateral wind forces, or by its own self-weight, with a perfectly stiff anchorage.Therefore, the functional traits involved and analyzed with regards to their contri-bution to the risk of mechanical instability are typically: the characteristics of polesize (volume, diameter, or height), pole shape (slenderness, taper, cross-sectionalshape), material properties (modulus of elasticity, occasionally torsional modulus,failure criteria usually given by a single critical stress), self-weight (density of the
FIGURE 1.2 Variation in stem lean (%) between 0- and 2-m height in two populations ofGoupia glabra Aubl. saplings from the French Guiana tropical rainforest (Fournier and Jaouen,unpublished data). Lean in seedlings grown in full light (white circles) does not increase withdiameter breast height (DBH) (Spearman R is not significant); in understory seedlings (blacksquares), the lean was found to decrease (Spearman R = 0.40, P = 0.006).
0.1
0
0.2
0.5
0.4
0.3
0.6
DBH (cm)
Lean
bet
wee
n 0
and
2 m
hei
ght
UnderstoryFull light
0 1 2 3 4 5 6 7 8
3209_C001.fm Page 9 Thursday, November 10, 2005 10:44 AM

10 Ecology and Biomechanics
pole material and additional weight of the crown), or structural parameters that definewind forces (drag coefficients and crown area [44]).
1.3.2.2 Root Anchorage
In many cases, failure due to mechanical loading often occurs in the root system.Thus, an understanding of root biomechanics is of crucial interest, not only becausethe anchoring capacity of a plant is an important factor for survival with regards toexternal abiotic stresses, such as wind loading or animal grazing, but also becauseroots are a major component in the reinforcement of soil. Whereas many studies havebeen carried out on the morphological development of roots with regards to theirabsorption capacity [65–67], very few investigations have focused on the mechanicalrole of roots [68,69]. Nevertheless, these pioneer studies have provided a sound basefor a better understanding of root anchorage efficiency in both plants and trees.
Root anchorage has largely been investigated at the single root level [70,71] orat the scale of whole root systems [72–76], whereas soil reinforcement by roots hasgenerally been considered at the population scale [77–79]. To better understand thebiomechanical role of specific root elements and in particular plant adaptation tomechanical stresses, a distinction must be made between small roots, i.e., roots thatresist tension but which have a low bending stiffness, and large roots, i.e., roots thatcan resist both tension and bending. The first category can be compared to “cable”structural elements, whereas the second type can be considered as “beam” elements.This latter category is mainly encountered in adult trees or shrubs and the formerin herbaceous species. Such a distinction between these two categories of roots isnecessary to avoid confusion when considering the consequences of root mechanicalproperties on uprooting efficiency, as discussed in the next paragraph.
Over the last 30 years, an increasing awareness of the role of fine roots (definedas less than 25 mm in diameter) in soil reinforcement has led to several studies beingcarried out on the mechanical properties of roots [80–83]. Soil shear strength isenhanced by the presence of roots due to the increase in additional apparent cohesion[71,84,85]. When roots are held in tension, such as pull-out or soil slippage on aslope, root tensile strength is fully mobilized and roots act as reinforcing fibers inthe surrounding soil matrix [86,87]. In studies where the tensile strength of smallroots has been measured, it is usually shown that the strength, as well as the modulusof elasticity, decreases with increasing diameter d, following an exponential law ofthe type exp(– d) (Figure 1.3) (values of root resistance in tension, bending, andcompression are given for different woody species in [72]). This decrease in tensilestrength is due to a lower quantity of cellulose in small roots ([83]; see Figure 1.3).Although this type of information is invaluable when studying the mechanism orroot reinforcement, especially on slopes subject to instability problems [77,86,88],it is also of extreme interest to researchers trying to understand the specific role ofsmall roots on tree anchorage. It could be suggested that for a fixed amount ofinvested biomass, a network of several small roots is more resistant in tension thana few large structural roots [89,90]. However, a large number of small roots may bealso detrimental to anchorage because a group effect could result in more failureoccurring in the soil [89,91].
3209_C001.fm Page 10 Thursday, November 10, 2005 10:44 AM

Tree Biomechanics and Functional Ecology 11
Fine roots have often been ignored when investigating the root anchorage offorest trees. This neglect is mainly due to the difficulty in extracting them from thesoil, in particular those roots far away from the trunk. Nevertheless, these distalroots determine the boundary conditions of the whole structure and can be veryimportant from the biomechanical point of view. However, this observation cannotbe applied to all plants, e.g., it has been shown in leek (Allium porrum L.) seedlingsthat the distal part of a long, single, fine root is not stressed before failure of itsproximal part [70]. Therefore, the failure mechanism in trees is probably significantlydifferent than that observed in herbaceous species.
The difficulty of investigating root anchorage is not only due to the complexityof the mechanisms occurring in both roots and soil, but also to their multifactorialaspect [88,89]. A good alternative to difficult and time-consuming field experimentscan be found in numerical modeling. Dupuy et al. [89] carried out such numericalanalyses using the finite element method. These authors determined the mechanicalresponse of small ramified roots to pull-out in tension. Parametric studies showedthat the number of lateral ramifications and their diameter were both major compo-nents affecting the resistance to pull-out for a given soil pressure.
Plant anchorage efficiency must be investigated taking into consideration notonly the mechanical behavior of single roots, but more importantly, the whole rootarchitecture. A number of studies were carried out in the 1990s on annual orherbaceous plants [70,76]. Ennos and Fitter [92] proposed an alternative hypothesisconcerning root system shape and function. These authors suggested that creepingand climbing plants develop fibrous root systems because the only mechanical stresstransferred to the roots is tension. However, root systems of single-stemmed, free-standing plants tend to develop a more plate-like or tap-like morphology [93]. Basedon mechanical assumptions, Ennos and Fitter [92] also showed that these different
FIGURE 1.3 Tensile strength increased significantly with decreasing root diameter (y =28.96x(0.57), R2 = –0.45, P <0.05) and cellulose content (y = 0.47x(–14.42), R2 = 0.23, P <0.005)in roots of sweet chestnut (Castanea sativa Mill.) (after [83]).
70
60
50
40
30
20
10
0
Tens
ile st
reng
th (M
Pa)
0.5 0.9 1.1 1.25 1.45 1.9 2.3 3.2 4Diameter (mm)
100
90
70
60
50
40
80
Cel
lulo
se co
nten
t (%
)
3209_C001.fm Page 11 Thursday, November 10, 2005 10:44 AM

12 Ecology and Biomechanics
anchorage strategies can have an impact on the biomass allocation ratio betweenabove- and below-ground parts during plant growth. Other studies on dicots havesince been carried out to quantify the root biomass investment according to theexternal loading on the plant [94].
Investigating the anchorage of adult trees is rather more complicated becauseof the morphological complexity encountered in tree root systems. Several structuralelements of importance for mechanical stability can coexist. Root topology, i.e., theway branches are linked together, is of major interest when trying to understandhow external forces are transmitted throughout the whole system and into the soil[90,91,95,96]. Root system depth and the number of root branches have also beenidentified as highly significant components of tree anchorage [88,96]. Coutts [97,98]identified the main components that play a role in root anchorage of Sitka spruce(Picea sitchensis Bong) by order of importance, i.e., the weight of the root–soilplate, the windward roots in tension, the soil cohesion, and the bending strength ofleeward roots. A further component to consider in shallowly rooted species is thepresence of buttressing around the stem. Although several hypotheses exist concern-ing the development and function of buttresses in tropical trees [99–102], in tem-perate species at least, buttresses tend to develop in trees with shallow, plate-likesystems [103]. The presence of such buttresses will help external loading forces betransmitted more smoothly along the lateral roots and into the soil, thereby improvinganchorage [104]. Particular attention has also been paid to tree species that developtap root systems [88,101,105,106]. Specific experiments carried out by Mickovskiand Ennos [107] on Scots pine (Pinus sylvestris L.) showed that in tap root systems,lateral roots are not a major component of root anchorage. However, in separatestudies, Niklas et al. [108] illustrated the lack of efficiency of a massive tap root ifnot associated with thick lateral roots, and Tamasi et al. [109] showed that in oak(Quercus robur L.) seedlings subjected to artificial wind loading, lateral root growthwas increased at the expense of tap root length.
Contradictory results are often encountered in the literature concerning therelationship between root architecture and anchorage efficiency, and one explanationmay lie in the underestimated role of soil characteristics on uprooting [110]. Numer-ical analyses may help fill this gap in knowledge [95,111]. Fourcaud et al. [95] andDupuy et al. [96] developed methods allowing morphological data from real orsimulated root systems to be subjected to virtual uprooting tests. Soil mechanicalproperties could be changed easily, therefore, allowing a rapid assessment of rootarchitecture efficiency in different soils [112]. In a clay soil, the root and soil systemof a heart root system rotates around an axis that is situated directly beneath thestem, whereas in sandy soil, the same system rotates around an axis that is shiftedleeward. Heart and tap root systems [93] also behave similarly in clay soil but areover twice as resistant to overturning than plate or herringbone [66] systems in thesame soil. However, between the four root types that were studied, anchorage insandy soil was less variable between the four root types; the most efficient anchoragein sand was found in the tap-rooted system and the least, the plate root system [112].
3209_C001.fm Page 12 Thursday, November 10, 2005 10:44 AM

Tree Biomechanics and Functional Ecology 13
In conclusion, although the study of root biomechanics has been neglected untilrecent years, a large number of studies exist that elucidate the mechanisms by whichroots are anchored in the soil. Modifications in root system architecture due toexternal loading will have consequences not only for anchorage efficiency but forthe ability of root systems to absorb nutrients [66,67]. Future studies need to incor-porate both root and soil mechanical properties into numerical models, which arein turn validated by field experiments.
1.3.3 BIOMECHANICAL FUNCTIONAL TRAITS AND PROCESSES
INVOLVED IN HEIGHT GROWTH STRATEGY
The studies mentioned previously have shown that sets of variables derived frommechanical models incorporating tree size, shape, and wood properties (availablevolume of wood, stem vs. crown biomass, shoot vs. root biomass, stem slenderness,taper and lean, and root and shoot architecture) are usually involved in the assessmentof failure risk of trees. As often pointed out for any kind of tree functional trait [3],to describe a strategy, we must analyze those traits we estimated both at the individualand population levels. Thus, we must investigate how individual traits are influencedby both the environment (plasticity) and ontogeny. To define tree functional types,we assign greater importance to the trait variation or trajectory during ontogeny thanto average values. For example, the decrease of the buckling safety factor during theearly growth stages of saplings, and the maximal values reached in the most com-petitive environments, are more pertinent when comparing species’ strategies thanthe mean value of risk per species. Certain size effects are physically obvious, andit is helpful to use modeling to define size-independent traits at the first order, forexample buckling safety factors rather than critical height or structural mean modulusof elasticity rather than cross-sectional flexural stiffness (the product of the meanmodulus of elasticity and the second moment of area of the cross section [113]).Because traits are potentially numerous, the minimal set able to describe a strategyfor a given mechanical constraint in a given situation is a complex question. As faras we know, such a question is rarely considered, and traits are often chosen implicitly.
Lastly, height strategy involves not only selected morphological and anatomicalfeatures that are directly linked to tree failure, but two growth processes also exist,which allow a certain mechanical control over these features. One such process isthigmomorphogenesis [114], the phenomenon by which external mechanical loadingcan change (i) the biomass allocation between roots and shoots and also betweentheir length and thickness, (ii) shoot and root architecture, (iii) organ cross-sectionalshape, and (iv) internal plant structure. The second process is gravitropism [12], i.e.,the phenomenon by which the verticality of a displaced stem or branch can berestored. A “hard” functional trait (see [115] for a discussion of the distinctionbetween “hard” and “soft” traits) defining a species’ strategy should be the species’sensitivity to these processes, i.e., its capacity to adapt functional growth. Such traitscan also be measured experimentally by, for example, measuring the reorientationof artificially tilted stems or studying the growth response to applied mechanicalloading (see Section 1.4).
3209_C001.fm Page 13 Thursday, November 10, 2005 10:44 AM
14 Ecology and Biomechanics
1.4 THE GROWTH PROCESSES THAT CONTROL THE MECHANICAL STABILITY OF SLENDER TREE STEMS
1.4.1 THE MECHANICAL CONTROL OF GROWTH
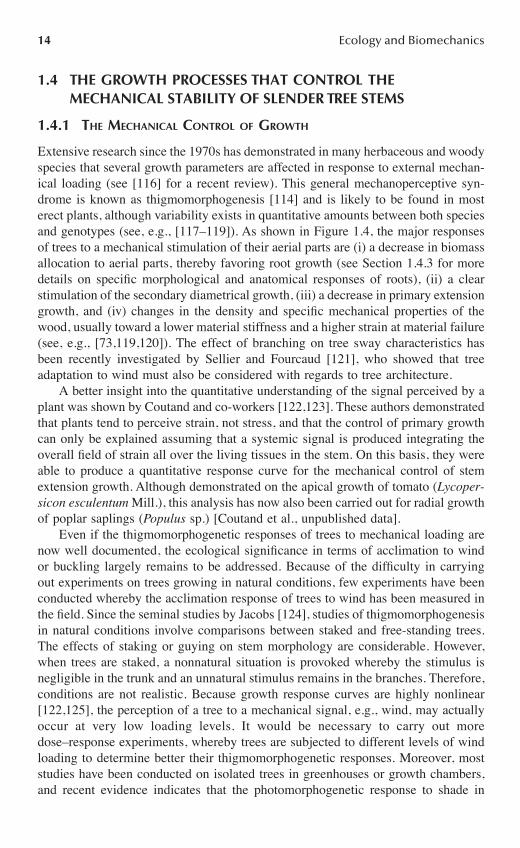
Extensive research since the 1970s has demonstrated in many herbaceous and woodyspecies that several growth parameters are affected in response to external mechan-ical loading (see [116] for a recent review). This general mechanoperceptive syn-drome is known as thigmomorphogenesis [114] and is likely to be found in mosterect plants, although variability exists in quantitative amounts between both speciesand genotypes (see, e.g., [117–119]). As shown in Figure 1.4, the major responsesof trees to a mechanical stimulation of their aerial parts are (i) a decrease in biomassallocation to aerial parts, thereby favoring root growth (see Section 1.4.3 for moredetails on specific morphological and anatomical responses of roots), (ii) a clearstimulation of the secondary diametrical growth, (iii) a decrease in primary extensiongrowth, and (iv) changes in the density and specific mechanical properties of thewood, usually toward a lower material stiffness and a higher strain at material failure(see, e.g., [73,119,120]). The effect of branching on tree sway characteristics hasbeen recently investigated by Sellier and Fourcaud [121], who showed that treeadaptation to wind must also be considered with regards to tree architecture.
A better insight into the quantitative understanding of the signal perceived by aplant was shown by Coutand and co-workers [122,123]. These authors demonstratedthat plants tend to perceive strain, not stress, and that the control of primary growthcan only be explained assuming that a systemic signal is produced integrating theoverall field of strain all over the living tissues in the stem. On this basis, they wereable to produce a quantitative response curve for the mechanical control of stemextension growth. Although demonstrated on the apical growth of tomato (Lycoper-sicon esculentum Mill.), this analysis has now also been carried out for radial growthof poplar saplings (Populus sp.) [Coutand et al., unpublished data].
Even if the thigmomorphogenetic responses of trees to mechanical loading arenow well documented, the ecological significance in terms of acclimation to windor buckling largely remains to be addressed. Because of the difficulty in carryingout experiments on trees growing in natural conditions, few experiments have beenconducted whereby the acclimation response of trees to wind has been measured inthe field. Since the seminal studies by Jacobs [124], studies of thigmomorphogenesisin natural conditions involve comparisons between staked and free-standing trees.The effects of staking or guying on stem morphology are considerable. However,when trees are staked, a nonnatural situation is provoked whereby the stimulus isnegligible in the trunk and an unnatural stimulus remains in the branches. Therefore,conditions are not realistic. Because growth response curves are highly nonlinear[122,125], the perception of a tree to a mechanical signal, e.g., wind, may actuallyoccur at very low loading levels. It would be necessary to carry out moredose–response experiments, whereby trees are subjected to different levels of windloading to determine better their thigmomorphogenetic responses. Moreover, moststudies have been conducted on isolated trees in greenhouses or growth chambers,and recent evidence indicates that the photomorphogenetic response to shade in
3209_C001.fm Page 14 Thursday, November 10, 2005 10:44 AM

Tree Biomechanics and Functional Ecology 15
dense canopy may reduce thigmomorphogenetic responses (e.g., see [42,126], butsee Mitchell [127]) or induce them when trees are grown in full sunlight [128]. Theuse of artificial fans to imitate wind loading on trees may be useful for identifyingthigmomorphogenetic responses [90], but provides little information with regard tothe natural significance of thigmomorphogenesis. Experiments where forest treeswould be subjected to artificial loading by the use of fans, for example to simulateturbulence would require huge facilities (see, e.g., [129,130]). Recently, a newtechnique to demonstrate the occurrence of significant thigmomorphogenetic accli-mation to wind in natural conditions has been proposed by Moulia and Combes[131]. These authors studied the variability in the difference between staked andfree-standing plant canopies over several growing periods in alfalfa (Medicago sativaL.). Moulia and Combes [131] showed that the month-to-month variability in windspeed when winds were moderate was able to explain 65% of the reduction in aerialbiomass and 41% of the reduction in total canopy height, thereby demonstratinghighly significant thigmomophogenetic effects in dense canopies under natural con-ditions. However, similar studies on trees remain to be conducted and would takean extremely long time to carry out. A less cumbersome alternative is to study spatialchanges in morphology associated with obvious natural gradients in wind conditions.
FIGURE 1.4 Thigmomorphogenetic responses in Wild Cherry saplings (Prunus avium L. cv.“monteil”). Three treatments were applied. Control: free standing submitted to natural windsways; S: completely staked (trunk and branches); S+B: completely staked but with artificialbending of the trunk for 1 minute every 3 hours. (A) Typical morphologies of the stem androot system of plants subjected to treatments S and S+B. (B) Changes in dry matter partitioningbetween the shoot and root systems due to bending treatments. (Modified from Coutandet al., 2003.)
A
S S + B
Dry
mat
ter i
n %
of t
heto
tal d
ry b
iom
ass
90%80%70%60%50%40%30%20%10%
100%
0%
Treatments
Shoot
Control S&B S
Root
B
3209_C001.fm Page 15 Thursday, November 10, 2005 10:44 AM

16 Ecology and Biomechanics
When applied to rain forest conditions where the evapotranspirative effects of windcan be neglected, this method has shown that thigmomorphogenetic acclimation isongoing [132]. However, such an approach is only correlative and limited to veryspecial conditions such as ridge crests and shelters in tropical rain forest. Of partic-ular interest would be a study of the correlation between morphology and windspeed within a canopy using the natural spatial variability in wind speeds. A pre-requisite for this would be to record wind-induced sways all over the canopy byusing video recording and image correlation techniques for the kinematic trackingof wind-induced canopy movements [133]. However, long-term studies still remainto be conducted.
Assuming that thigmomorphogenetic acclimation does occur in nature, the sec-ond central question is whether these responses are adaptive or not, i.e., are theperformance vs. mechanical constraints improved and are there consequences onthe fitness of the individual in its environment? Because both the performance vs.the mechanical constraint and the thigmomorphogenetic “syndrome” involve severalvariables, qualitative inferences are uncertain, and only direct measurements of plantperformance or the use of a mechanical model can help to determine the exact effecton plant performance vs. mechanical constraints. Very few analyses of this kind havebeen carried out. Concerning wind loading, it has been postulated that thigmomor-phogenesis might be involved in allowing trees to reach a certain shape. This shapewill permit a spatially homogeneous distribution of wind-induced stresses for windconditions. Achieving such a constant stress is adaptive and even optimal in that allparts of the trees would display the same safety factor against material failure[47,52,134].
Mattheck [135] made a significant contribution to the old hypothesis of constantstress design [47,53] by providing a dynamic biomechanical model of stress equal-ization through growth. Mattheck and Bethge [136] also described a wide range ofshapes that could be explained qualitatively through the constant stress hypothesis.However, no direct quantitative testing of the model’s prediction has ever beenproduced. Moreover, subsequent studies that have attempted to verify the constantstress hypothesis have used fairly detailed modeling of the wind loads involved[137,138] and have even dismissed this hypothesis for wind loads on trees (but see[138,139]). More indirect tests comparing the height-to-diameter ratio have alsobeen reviewed and not found convincing [51]. Although not optimal in terms ofconstant stress, thigmomorphogenesis is likely to improve the overall strength of atree’s structure but to an extent that remains to be quantified, and with strategiesthat still have to be studied.
Thigmomorphogenesis can also increase a tree’s stability against buckling underself-weight. This phenomenon has been tested experimentally by Tateno [46] onmulberry trees (Morus bombycis Koidz).
1.4.2 THE CONTROL OF STEM ORIENTATION TO MAINTAIN OR
RESTORE THE TREE FORM, AND ALLOW VERTICAL GROWTH
It may be logical to assume that trees submitted to gravitational or wind forces wouldlean more and more during their life span; however, stems can maintain or restore
3209_C001.fm Page 16 Thursday, November 10, 2005 10:44 AM

Tree Biomechanics and Functional Ecology 17
verticality more or less continuously using gravitropic reactions. Two “motors” areinvolved, both of which are relative to internally induced, asymmetric strains result-ing in stem curvature. Initially, hydraulic turgor pressure in primary tissues associ-ated with asymmetric growth can lead to reorientation of the apical, unlignified partof stems in just a few hours or days [140]. In other regions of the stem, whereelongation has been achieved but radial growth is still active, the process of woodcell differentiation during maturation is modified, resulting in the formation of aparticular type of wood called “reaction wood” [12,141,142]. This reaction wood islargely responsible for the control of the tree-righting mechanism. This second typeof gravitropic reaction, which occurs during secondary growth, is much slower thanthe first, and the stem may take several months to several years, if at all, to straightenup, depending on its size.
The mechanism by which the stem rights itself occurs during cellular maturationand is associated with the shrinkage of fibers or tracheids [143,144]. In normal wood,as the newly created wood cells are “glued” onto the central core of existing stiffwood, shrinkage of these developing cells is impeded. Therefore, the peripheralwood is “stretched.” Internal tensile forces along the grain are then generated andcan be considered to act similar to a guy-rope system. When stems perceive thedisequilibrium related to vertical growth, the wood structure and/or speed of cambialgrowth are modified on one side of the cross section, resulting in an asymmetry ofthese peripheral forces, and thus stem bending is induced (Figure 1.5). In gymno-sperms, reaction wood formed in leaning stems is called “compression wood” [24]and tends to expand instead of shrink during maturation. Therefore, the peripheralforce is compressive and is formed on the lower side of a leaning stem, on theopposite side to normal “stretched” wood [145]. In angiosperms, tension wood formson the upper side of leaning stems [142]. During maturation, this wood shrinks witha higher resulting tensile force [143–145]. Both the origin of maturation strains andtheir variability in compression and tension wood can be explained by structuralfeatures at the cell wall level [145–148] and in particular, by the high MFA ofcompression wood [149].
At a macroscopic level, a mechanical model [37,150,151] allows a descriptionof the induced curvature during a given stage of growth, which can be expressed ina general way as:
(1.2)
where dCR is the reaction curvature produced by the growth of the cross sectionfrom the area S to S + dS (Figure 1.5), y and z are current coordinates in the cross-sectional plane from its geometric center, assuming that the cross section rotatesaround the z axis, I is the second moment of area of the cross section, and is thematuration strain, which is usually heterogeneous within the cross section (a functionof y and z). Heterogeneities in modulus of elasticity have been assumed as negligiblewith respect to variations. Maturation strains can be estimated by measurements
dC
ydydz
IR
dS=
3209_C001.fm Page 17 Thursday, November 10, 2005 10:44 AM

18 Ecology and Biomechanics
of released peripheral strains [143,152], which have also been used for studyinggrowth stresses [145,153].
Equation 1.2 is useful when analyzing and comparing the effects of growth (dS),stem shape, wood heterogeneity, and values of maturation strains. For a circular,concentric cross section, assuming a sinusoidal variation of maturation strain aroundthe circumference [37,150,151], Equation 1.2 becomes:
(1.3)
where is the difference in maturation strain between the maximal value ofshrinkage and the minimal value on the opposite side (in opposite wood forangiosperms or in compression wood for gymnosperms with a negative valuebecause the wood does not shrink but rather expands), D is the diameter of the crosssection, and dD, the increment of diameter (radial growth). Such an equation indi-cates that the initial size (D) is a constraint to the tree during stem reorientation.Young stems can thus be reoriented much more efficiently for a given amount ofradial growth. In a general sense, Equation 1.2 gives relative scaling ideas aboutgeometrical growth and anatomical effects. For instance, for a given diameter D,
= 0.005 (which corresponds to the formation of very strong tension wood)associated with a relatively slow growth of dD = 1 mm/yr should have the sameeffect as = 0.00025, i.e., a slight asymmetry that does not require the formation
FIGURE 1.5 Gravitropic reactions are induced by an asymmetry of peripheral tensile forcesgenerated at the end of the wood cell differentiation process. Both the asymmetry of the woodstructure in the case of (1a) compression wood formation on the lower side and (1b) tensionwood formation on the upper side of a leaning stem, and (2) the asymmetry of growth, areinvolved (see Equation 1.2).
x
z
y
1a
1b
2
CT
T
d
d
d
C
S
S
S
y
y
y
z
z
z
dCdD
DR = 4
2
3209_C001.fm Page 18 Thursday, November 10, 2005 10:44 AM

Tree Biomechanics and Functional Ecology 19
of typical tension or compression wood, associated with a faster growth of dD = 20mm/yr.
At this stage, the ecological significance of gravitropic curvatures induced bythe asymmetry of tensile peripheral forces may not yet be obvious because reactionwood, usually opposed to “normal wood,” could be supposed to be a quite rare andeven a “pathological” phenomenon. Although the gravitropic function is well known[141,142,154], the formation of reaction wood is often assumed to be a response tomechanical stress (e.g., Turner [28]) associated with a lower technological woodquality [14] and not a motor process that counteracts the physical bending forcesrelative to growth and gravity, essential for the achievement of vertical growth intree communities.
To demonstrate the ecological significance of gravitropic processes and becausemeasurements of reaction and gravitational curvature in stems cannot be carried outseparately over the long term because tree shape integrates both types, we use theapproach of using a model (Equation 1.2 or Equation 1.3) to compare reactioncurvatures to gravitational ones. The latter can be calculated using standard beammechanics [8] through an incremental model [37] (see Section 1.3.1.2):
(1.4)
where
dCg = the curvature physically induced by a weight increase during the growth of the cross section from S to S + dS
I = the second moment of area of the cross sectionE = the modulus of elasticityW = the weightH sin = the lever arm of the bending moment due to W (H is the height of the
center of mass above the cross section and is the lean)
The derivative of the function WH sin with respect to cross-sectional growth S canbe obtained using allometric relations.
A practical application of Equations 1.3 and 1.4 on a community of saplings inthe tropical rainforest of French Guiana provides evidence that reaction curvaturesare usually greater than gravitational ones (Figure 1.6). This study demonstrates thatthe hypothesis previously inferred from Figure 1.2, whereby verticality is biologi-cally controlled and plays a significant role under natural conditions, is sound. Useof the term “biologically controlled” raises the question of the signal perceived byplants that triggers the reorientation processes. This question is still a matter ofdebate, and the sensing system has not yet been clearly identified for either shootsor roots. The site of perception in roots has been shown to be located in thecolumnella cells of the root cap. Studies that aim to identify the perceived variablein shoots and to give quantitative relationships between the variation of the mechan-ical state induced by gravity and the plant’s response are scarce [155,156]. At the
dCEI
d W H
dSdSg =
1 sin
3209_C001.fm Page 19 Thursday, November 10, 2005 10:44 AM

20 Ecology and Biomechanics
organ scale, inclination of the tip (or local inclination) is still usually considered asthe perceived variable, the Cholodny Went theory for elongating organs [157], andis used in the modeling of gravitropism [37,151]. However, the kinematics of thegravitropic response has revealed distinct phases: initially an upward curving occurs,i.e., a gravitropic response, followed by a phase of straightening out or autotropism,which is the automorphogenesis necessary to restore verticality of the whole organ.This straightening out has been observed in a wide range of plant organs and species[158]. Kinematical analyses of the gravitropic response demonstrated that autotro-pism starts well before the organ reaches the vertical [155,156]. This shows that theother variables are perceived to pilot the reorientation processes.
At the cellular scale, signal transduction has been much more studied with anemphasis on cloning genes involved in signal perception along with the role of thecytoskeleton. Through results from studies of gene expression, several gravi-sensingpatterns have been hypothesized, but all are based on sedimentation of organites,such as statoliths and proteic globules. During their sedimentation, these organellesare thought to touch the rough endoplasmic reticulum and disrupt the cytoskeletonactin filament, thus resulting in an activation of mechanosensitive channels or stretch-activated channels. More recently, several authors have suggested that gravi-percep-tion could rely on an activation of mechanosensitive channels of the plasmalemmainduced by sedimentation of the entire cytoplasm. This mechanism suggests that
FIGURE 1.6 Comparison between two main bending processes in a community of saplingsin a 750 m2 plot of the tropical rainforest in French Guiana (DBH between 0.02 and 0.05 m):reaction and gravitational curvatures (see Equations 1.3 and 1.4) have been calculated fortrunk basal cross sections (0.5 m height), using measurements of geometry (diameter, length,lean), weight (trees were cut and weighed), and maturation strains (Wap’s method; see [152])(Fournier, unpublished data).
100
1
10
1000
0.1
=Re
actio
n dC
R/dS
(m−1
/m2 )
0.1 1 10 100 1000Disturbance dCg/dS (m−1/m2)
3209_C001.fm Page 20 Thursday, November 10, 2005 10:44 AM

Tree Biomechanics and Functional Ecology 21
strain could be the perceived variable, but no experimental study or mechanicalmodel of gravi-sensing at the cellular scale has yet been carried out.
Further work should concern more studies in the field as well as in controlledenvironments whereby bending movements, such as stem longitudinal shape, cur-vature, and lean, at the whole trunk level are studied more carefully. The specificdiversity of responses associated with the diversity of reaction wood structure andgrowth geometrical patterns with respect to reorientation efficiency and cost shouldalso be investigated further.
1.4.3 THE CONTROL OF ROOT GROWTH TO SECURE ANCHORAGE
The knowledge from from recent studies on root biomechanics (see Section 1.3.2.2)is of particular interest when trying to understand the biomechanical adaptation ofroots during plant growth. Several experiments have been carried out to quantifythe root biomass investment according to the external loading on the plant [94,109].Ennos and Fitter [92] showed that different root anchorage strategies can have animpact on this biomass allocation ratio between above and below ground parts duringplant growth. Active biomechanical responses to external mechanical stresses havebeen studied and discussed by several authors, including the consequences of mor-phological modifications in root systems of plants regularly submitted to externalforces, such as wind loading or shaking (see the review by Stokes and Guitard [159]).Such modifications include an increase in root branch number, cross-sectional area,and biomass along the axis of bending [73,90,109,159]. Responses may also occurat the cellular level, with consequences for wood mechanical properties [105]. Inadult trees, uneven secondary growth occurs in the most highly stressed parts ofindividual roots, resulting in cross sections with shapes analogous to I or T beams,especially in the highly stressed region at the stem–root base. Such irregular radialgrowth results in an optimized root stiffness in the plane of bending for a givenquantity of dry matter [103,160].
Although of importance for the anchorage of a plant, such responses of roots toexternal mechanical loading also have consequences for nutrient and water uptake.The optimal absorption of nutrients is significantly affected by root architecture andsize [66,67], and a trade-off may exist between anchorage and nutrient uptake,particularly when the latter is limiting [159]. Nevertheless, it should be rememberedthat even though thigmomorphogenetic responses occur in the root system and canbe even more pronounced than those in the stems of the same plants [90,159], suchmorphological changes are small when compared to the direct effects of differencesin water and nutrient conditions on plant growth.
1.5 A PRACTICAL APPLICATION OF TREE BIOMECHANICS IN ECOLOGY
Research on plant biomechanics over the last decade has increased enormously,resulting in a large database of available knowledge. However, although certainfundamental aspects are understood in great detail, biologists, foresters, andmechanical engineers are not yet sure of how this knowledge can be applied in a
3209_C001.fm Page 21 Thursday, November 10, 2005 10:44 AM

22 Ecology and Biomechanics
practical way with regards to ecological sustainability. Nevertheless, several domainsexist that benefit hugely from the recent collation of data typical of that presentedin this chapter. Two examples of subject areas where biomechanics and ecology canbe combined to produce highly effective ecological solutions to long-term sustain-ability issues are ground bio-engineering and eco-engineering [88].
Both eco-engineering and ground bio-engineering fall within the framework of“ecological engineering.” Ecological engineering has been described as “the man-agement of nature” [161] or as the proactive design of sustainable ecosystems thatintegrate human society with its natural environment for the benefit of both[162,163]. Ecological engineering has largely been devoted to the sustainability ofwetlands, wastewater, and aquaculture [162], but can be applied to a larger range ofenvironments. Focusing more on the restoration or protection of sites, the term “eco-engineering” has recently been defined as the long-term strategy to manage a sitewith regards to natural or man-made hazards [88]. Eco-engineering is not to beconfused with ground bio-engineering. Ground or soil bioengineering methods inte-grate civil engineering techniques with natural materials to obtain fast, effective,and economic methods of protecting, restoring, and maintaining the environment[164,165]. The use of, for example, geotextiles or brush mattressing to arrest soilrun off and the planting of fast-growing herbaceous species to fix soil are typicalground bio-engineering techniques. Although ground bio-engineering and eco-engi-neering can be used on all types of land from arid land prone to desertification toriverbanks subjected to flooding, these practices have largely been carried out onhill slopes [165,166]. Hill slopes are highly prone to soil loss once vegetation hasbeen removed through deforestation, cropping, or natural hazards. For natural slopes,such hazards can involve the mass movement of soil, such as landslides, avalanches,and rockfall, or erosion, including sheet and gully erosion or river bank erosion. Bycombining ground bio-engineering techniques with long-term solutions, slopes canbe managed effectively to minimize the risk of failure. The correct choice of plantmaterial is difficult because bio-engineers need to know the ability of the plant togrow on a particular site as well as the efficiency of the root system in fixing andreinforcing soil on an unstable soil. This efficiency depends largely on the mechanicalproperties of individual roots as well as the overall anchorage and architecture ofthe root system [71,167]. Although such information may be available for a particularspecies, its performance in the long run also needs to be known: fo example, grassesoften die back in summer and should be combined with shrubs so as to avoid slippageor erosion problems. Shade intolerant species will also decline as shrubs and treesgrow taller over time. Long-term solutions therefore need to include the use ofappropriate management strategies, the employment of decision support systems[168,169], and the integration of such tools into geographic information systems topredict future risks. Such management techniques are particularly effective in large-scale areas of Europe, e.g., ski resorts, mountain slopes, and forest stands [170].
Not only do a bio- or eco-engineers need to consider the suitability of a speciesto a particular site with regards to its ability to grow and to reinforce the soil throughthe fixing efficiency of the root system, but they also need to take into account thelong-term effect of planting vegetation on the site, especially with regards to treespecies. One example where the careful long-term planning of tree growth is crucial
3209_C001.fm Page 22 Thursday, November 10, 2005 10:44 AM

Tree Biomechanics and Functional Ecology 23
is in mountain forests. Mountain forests are more and more frequently used asprotection forests, i.e., as natural barriers against the effect of snow avalanches,landslides, and rockfall [171–174]. Recent studies have shown that the spatial dis-tribution of trees within a forest stand can have serious consequences on the abilityof a mountain forest to withstand soil mass movement such as rockfall [10,175].The choice of tree species, as well as the aerial and root architecture, is also ofutmost importance because mechanical resistance to overturning and stem rupturewill influence enormously a tree’s ability to withstand abiotic loading [10,88,175].Studies in the French Alps have shown that beech (Fagus sylvatica L.) is extremelyresistant to rockfall, compared with fir (Abies alba Mill.) and Norway spruce (Piceaabies L.), particularly if planted in a certain spatial pattern [10,88,175]. Nevertheless,even if a tree species is useful as a barrier against one particular type of hazard, thesame species may not be suitable in protecting against a different type of hazard,for example, Norway spruce is not especially wind firm [68] nor resistant to rockfall[10,174]. However, in preventing snow movement, because of its aerial architecture,Norway spruce is highly effective in holding the snow mantle in place [174].Therefore, it is always necessary to determine which species is best suited to aparticular function. Similarly, in conifer forests subjected to frequent windstorms,appropriate long-term management of the upwind border of the stand could decreasethe probability of damage during a storm; such borders could be planted with wind-firm broadleaf species such as oak and pruned to create a “ramp,” or shelter belttype structure. This type of structure would cost little to maintain and would allowthe prevailing wind to pass over the plantation, rather than penetrate into the stand[176].
One further example of how effective planting and management can improvethe stability of a slope was shown in a study by Roering et al. [79]. These authorscalculated the additional cohesion in soil by carrying out tensile testing of tree rootsin natural and planted forest stands found within a short distance of landslide scarps.It was shown that a mixture of species, even at a young age, proved more effectivethan a mature monospecific plantation in preventing against soil loss. If a forest isclear felled, roots decay within a period of 3 years, resulting in a decrease in tensilestrength and the ability to fix soil, hence resulting in lost soil cohesion and compro-mised slope stability [77].
Examples of where eco-engineering techniques would be most useful are insituations whereby human safety is not an immediate issue or where protectingstructures are already in place, such as safety nets or avalanche barriers. Whendeciding to carry out eco-engineering techniques on an unstable slope, the engineermust first determine the nature of the slope, type of soil, type of native or desiredvegetation, and the likelihood of any catastrophic event occurring that woulddecrease slope stability during the restoration time. If the risk of danger to humanlife and infrastructures is low, the user must consider the size of the site and coststo be incurred throughout the life of the project. If the site is on a small scale andthe cost of construction (e.g., fascines, gabions, and geotextiles), planting, andupkeep is equal to the economic, aesthetic, and safety gain at the end of the project,ground bio-engineering techniques can be considered. If the site is large scale, suchas a mountain slope, the expenses incurred in carrying out certain bio-engineering
3209_C001.fm Page 23 Thursday, November 10, 2005 10:44 AM

24 Ecology and Biomechanics
techniques may be too high for the gain produced, and eco-engineering techniquesmay be used. However, it must be remembered that any gain as a result of an eco-engineering project will only be incurred in the long-term.
Still a relatively young subject, eco-engineering is beginning to emerge as afuture research area in Europe, an area that engineers and ecologists should considerboth in terms of education and application. Human activity over the last 100 yearshas been concerned with increasing productivity through technological progress atthe cost of environmental degradation [162]. It is now necessary to repair thisdamage, although with limited resources, certain countries are unable to investheavily in environmental restoration of degraded lands. Bio- and eco-engineeringtechniques can therefore provide a low-cost, long-term solution in many cases.
1.6 CONCLUSION
Previous studies in biomechanics should be considered when defining tree traits tobe used to describe the mechanical aspects of height growth strategy. It is assumedthat this strategy presents a competitive challenge with regards to physical con-straints, especially in forest canopies where light is limited in the understory andincreases with canopy height. Two growth processes have been suggested to playa major role in these strategies. The first is thigmomorphogenesis, i.e., the percep-tion of mechanical loads and the plant growth response, which influences biomassallocation between roots and shoots, organ length and thickness, as well as stemand root system shape and their wood properties. The second is concerned withlong-term gravitropic movements of lignified and stiff stems induced by secondarygrowth and maturation strains, which are continuously being generated to maintainverticality.
Studying the biomechanical aspect of a species’ strategy is of general interestfor forest ecologists for different reasons. Firstly, biomechanics can contribute to abetter understanding of the relationships between diversity and functioning. Forexample, with regards to the ability of trees to coexist at different height strata, bothcompetition and physical constraints can be interpreted as the use of differentecological niches with respect to light availability, which in turn could influencegeneral ecosystem functioning and productivity. Biomechanics could therefore beuseful for studying the relationships between tree functional types and natural eco-system resilience or community dynamics. The efficiency of certain pioneer shade-intolerant species, which tend to dominate in gaps of disturbed forests and are ableto survive under a closed canopy before becoming canopy trees in mature forests,should be linked to their ability to use support material at a low cost with a highmechanical efficiency, thus decreasing the risk of failure. Lastly, biomechanics cangive valuable help when assessing species performance in engineering, such asstabilizing the soil on slopes through the use of vegetation or the choice of sylvi-cultural practices in a windy environment.
3209_C001.fm Page 24 Thursday, November 10, 2005 10:44 AM

Tree Biomechanics and Functional Ecology 25
REFERENCES
1. Rowe, N.P. and Speck, T., Hydraulics and mechanics of plants: novelty, innovationand evolution, in The Evolution of Plant Physiology. Poole, I. and Hemsley, A.R.,Eds., Elsevier Academic Press, Kew, 2004, chap. 16.
2. Niklas, K.J., The evolution of plant body plans — a biomechanical perspective, Ann.Bot., 85, 411, 2000.
3. Westoby, M. et al., Plant ecological strategies: some leading dimensions of variationbetween species, Ann. Rev. Ecol. Sys., 33, 125, 2002.
4. Cameron, T., The year of the “diversity-ecosystem function” debate, Trends Ecol.Evol., 17, 495, 2002.
5. Diaz, S. and Cabido, M., Vive la différence: plant functional diversity matters toecosystem processes, Trends Ecol. Evol., 16, 646, 2001.
6. Wright, I.J. et al., The world-wide leaf economics spectrum, Nature, 428, 821, 2004.7. Niklas, K.J., Plant Biomechanics: An Engineering Approach to Plant Form and
Function, University of Chicago Press, Chicago, 1992.8. Timoshenko, S.P., Strength of Materials, van Nostrand, Princeton, 1941.9. Niklas, K.J. and Spatz, H.C., Methods for calculating factors of safety for plant stems,
J. Exp. Biol., 202, 3273, 1999.10. Stokes, A. et al., Mechanical resistance of different tree species to rockfall in the
French Alps, Plant Soil, in press. DOI: 10.1007/s11104-005-3899-3.2005.11. Mosbrugger, V., The tree habit in land plants: A functional comparison of trunk
constructions with a brief introduction into the biomechanics of trees, Lecture notesin earth sciences, Vol. 28, Springer-Verlag, Heidelberg, 1990, p. 161.
12. Wilson, B.F., The Growing Tree, The University of Massachusetts Press, Amherst,1984.
13. Skaar, C., Wood-Water Relations, Springer-Verlag, Heidelberg, 1988.14. Kollman, F.F.P. and Cote, W.A., Principles of Wood Science and Technology, I. Solid
Wood, Springer-Verlag, Heidelberg, 1968.15. Hogan, C.J. and Niklas, K.J., Temperature and water content effects on the viscoelas-
tic behavior of Tilia americana (Tiliaceae) sapwood, Trees-Struct. Funct., 18, 339,2004.
16. Coutand, C. et al., Comparison of mechanical properties of tension and oppositewood in Populus, Wood Sci. Technol., 38, 11, 2004.
17. Guitard, D., Mécanique du Bois et Composites, Cepadues, Toulouse, 1987.18. Gibson, L.J. and Ashby, M.F., Cellular Solids, Pergamon Press, Oxford, 1988.19. McMahon, T.A. and Kronauer, R.E., Tree structures: deducing the principle of
mechanical design, J. Theor. Biol., 59, 443, 1976.20. Niklas, K.J., Influence of tissue density — specific mechanical properties on the
scaling of the plant height, Ann. Bot., 72, 173, 1993.21. Sterck, F. and Bongers, F., Ontogenetic changes in size, allometry, and mechanical
design of tropical rainforest trees, Am. J. Bot., 85, 266, 1998.22. Barnett, J.R. and Bonham, V.A., Cellulose microfibril angle in the cell wall of wood
fibres, Biol. Rev., 79, 2004.23. Fratzl, P., Burgert, I., and Keckes, J., Mechanical model for the deformation of the
wood cell wall, Z. Metallkd, 95, 579, 2004.24. Timell, E., Compression Wood in Conifers, Springer-Verlag, Heidelberg, 1987.
3209_C001.fm Page 25 Thursday, November 10, 2005 10:44 AM

26 Ecology and Biomechanics
25. Zobel, B.J. and Buijtenen, J.P.v., Wood variation: its causes and control, in WoodVariation: Its Causes and Control, Springer-Verlag, Berlin, 1989.
26. Baas, P., Jansen, S., and Wheeler, E., Ecological adpatations in wood microstructureand angiosperm phylogeny, IAWA J., 23, 60, 2002.
27. Favrichon, V., Classification des espèces arborées en groupes fonctionnels en vue dela réalisation d'un modèle de dynamique de peuplement en Guyane française. (Clas-sification of tree species in forests of French Guiana into functional groups based ona dynamic vegetation community matrix.), Rev. Ecol. (Terre et Vie), 49, 379, 1994.
28. Turner, I.M., Ed. The Ecology of Trees in the Tropical Rain Forest, CambridgeTropical Biology Series, Cambridge University Press, London, 2001, p. 298.
29. Zhang, S.Y. et al., Modelling wood density in European oak (Quercus petraea andQuercus robur) and simulating the silvicultural influence, Can. J. Forest Res., 23,2587, 1993.
30. Hillis, W.E., Heartwood and Tree Exudates, Springer-Verlag, Berlin, 1987.31. Grzeskowiak, V., Le bois juvénile de deux angiospermes à pores diffus (Populus
euramericana cv I214, Dicorynia guianensis): variations radiales et avec la hauteurdes caractères anatomiques, de l'infradensité et du retrait radial, doctorate thesis,ENGREF: Nancy Paris Montpellier, 1997.
32. Schniewind, A.P., Horizontal specific gravity variation in tree stems in relation totheir support function, Forest Sci., 8, 111, 1962.
33. Wiemann, M.C. and Williamson, G.B., Wood specific gravity gradients in tropicaland montane rain forest trees, Am. J. Bot., 76, 924, 1989.
34. Woodcock, D.W. and Shier, A.D., Wood specific gravity and its radial variations: themany ways to make a tree, Trees-Struct. Funct., 16, 437, 2002.
35. Laroze, S. and Barrau, J.J., Calcul des structures en matériau composites. Mecaniquedes structures. Masson, Paris, 1987.
36. Fournier, M. et al., Mécanique de l’arbre sur pied: modélisation d’une structure encroissance soumise à des chargements permanents et évolutifs. II. Analyse des con-traintes de support, Ann. Sci. Forest., 48, 513, 1991.
37. Fournier, M., Baillères, H., and Chanson, B., Tree biomechanics: growth, cumulativepre-stresses and reorientations, Biomimetics, 2, 229, 1994.
38. Falster, D.S. and Westoby, M., Plant height and game theory, Trends Ecol. Evol., 18,337, 2003.
39. Becker, P., Meinzer, F.C., and Wullschleger, S.D., Hydraulic limitation of tree height:a critique, Funct. Ecol., 14, 4, 2000.
40. Ryan, M.G. and Yoder, B.J., Hydraulic limits to tree height and tree growth, Bio-Science, 47, 235, 1997.
41. Midgley, J.J., Is bigger better in plants? Hydraulic costs of increasing plant height,Trends Ecol. Evol., 18, 5, 2003.
42. Holbrook, N.M. and Putz, F.E., Influence of neighbors on tree form: effects of lateralshade and prevention of sway on the allometry of Liquidambar styraciflua, Am. J.Bot., 76, 1740, 1989.
43. Ancelin, P., Modélisation du comportement biomécanique de l'arbre dans son envi-ronnement forestier. Application au Pin maritime, in Ecole doctorale de sciencesphysiques et de l’ingénieur, doctorate thesis. Université Bordeaux I. Bordeaux, 2001,p. 182.
44. Ancelin, P., Courbaud, B., and Fourcaud, T., Developing an individual tree basedmechanical model to predict wind damage within forest stands, Forest Ecol. Manag.,203, 101, 2004.
3209_C001.fm Page 26 Thursday, November 10, 2005 10:44 AM

Tree Biomechanics and Functional Ecology 27
45. Ancelin, P., Fourcaud, T., and Lac, P., Modelling the biomechanical behaviour ofgrowing trees at the forest stand scale. Part I: Development of an incremental transfermatrix method and application on simplified tree structures, Ann. Forest Sci., 61, 263,2004.
46. Tateno, M., Increase in lodging safety factor of thigmomorphogenetically dwarfedshoots of mulberry tree, Phys. Plant., 81, 239, 1991.
47. Metzger, K., Der Wind als massgebender Faktor für das Wachsthum der Baüme,Mündener Forstl., 3, 35, 1893.
48. Greenhill, M.A., Determination of the greatest height consistent with stability that avertical pole or mast can be made, and of the greatest height to which a tree of givenproportions can grow, Proc. Cambridge Philos. Soc., IV, PT II, 1881, 5.
49. King, D.A. and Loucks, O.L., The theory of tree bole and branch form, Radiat.Environ. Bioph., 15, 141, 1978.
50. King, D.A., Tree dimensions: maximizing the height growth in dense stands, Oeco-logia, 51, 351, 1981.
51. Moulia, B. and Fournier-Djimbi, M., Optimal mechanical design of plant stems: themodels behind the allometric power laws, in Plant Biomechanics, Centre for Biomi-metics, The University of Reading, Reading, UK, 1997.
52. McMahon, T.A., The mechanical design of trees, Sci. Am., 233, 92, 1975.53. Esser, M.H.M., Tree trunks and branches as optimum mechanical supports of the
crown: I. The trunk, Bull. Math. Biophys., 8, 65, 1946.54. King, D.A., Tree form, height growth, and susceptibility to wind damage in Acer
saccharum, Ecology, 67, 980, 1986.55. Mattheck, C., Trees: The Mechanical Design, Springer-Verlag, Heidelberg, 1991.56. Niklas, K.J. and Spatz, H.C., Growth and hydraulic (not mechanical) constraints
govern the scaling of tree height and mass, Proc. Natl. Acad. Sci., 101, 15661, 2004.57. Niklas, K.J., Plant Allometry: The Scaling of Form and Process, University of Chicago
Press, Chicago, 1994.58. Claussen, J.W. and Maycock, C.R., Stem allometry in a North Queensland tropical
rainforest, Biotropica, 27, 1995.59. Rich, P.M. et al., Height and diameter relationships for dicotyledonous trees and
arborescent palms of Costa Rican tropical wet forest, Bull. Torrey Bot. Club, 113,241, 1986.
60. King, D.A., Allometry and life history of tropical trees, J. Trop. Ecol., 12, 25, 1996.61. Kohyama, T. and Hotta, M., Significance of allometry in tropical saplings, Funct.
Ecol., 4, 515, 1990.62. Almeras, T. and Gril, J., Bending of apricot tree branches under the weight of axillary
growth: test of a mechanical model with experimental data, Trees-Struct. Funct., 16,5, 2002.
63. Schaeffer, B., Biomécanique. Forme d’équilibre d'une branche d’arbre, C. R. Acad.Sci., 1991.
64. Castera, P. and Morlier, V., Growth patterns and bending mechanics of branches,Trees-Struct. Funct., 5, 232, 1991.
65. Cruz, C. et al., Functional aspects of root architecture and mycorrhizal inoculationwith respect to nutrient uptake capacity, Mycorrhiza, 14, 177, 2004.
66. Fitter, A.H. et al., Architectural analysis of plant root systems I. Architectural corre-lates of exploitation efficiency, New Phytol., 118, 375, 1991.
67. Fitter, A.H. and Stickland, T.R., Architectural analysis of plant root systems II.Influence of nutrient supply on architecture in contrasting plant species, New Phytol.,118, 383, 1991.
3209_C001.fm Page 27 Thursday, November 10, 2005 10:44 AM

28 Ecology and Biomechanics
68. Stokes, A., Ed. The supporting roots of trees and woody plants: form, function andphysiology, in Developments in Plant and Soil Sciences, Vol. 87, Kluwer AcademicPublishers, Dordrecht, 2000, p. 426.
69. Ennos, A.R., The mechanics of root anchorage, Adv. Bot. Res. Inc. Adv. Plant Path.,33, 133, 2000.
70. Ennos, A.R., The anchorage of leek seedlings: the effect of root length and soilstrength, Ann. Bot., 65, 409, 1990.
71. Waldron, L.J. and Dakessian, S., Soil reinforcement by roots: calculation of increasedsoil shear resistance from root properties, Science, 132, 427, 1981.
72. Stokes, A., Biomechanics of tree root anchorage, in Plant Roots: The Hidden Part,U. Kafkaki, Ed., Marcel Dekker, New York, 2002, p. 175.
73. Mickovski, S.B. and Ennos, A.R., The effect of unidirectional stem flexing on shootand root morphology and architecture in young Pinus sylvestris trees, Can. J. ForestRes., 33, 2202, 2003.
74. Ennos, A.R., The biomechanics of root anchorage, Biomimetics, 2, 129, 1994.75. Crook, M.J. and Ennos, A.R., The anchorage mechanics of deep-rooted larch Larix
europea × L. japonica, J. Exp. Bot., 47, 1509, 1996.76. Ennos, A.R., The mechanics of anchorage in seedlings of sunflower, Helianthus
annuus L, New Phytol., 113, 185, 1989.77. Watson, A., Phillips, C., and Marden, M., Root strength, growth, and rates of decay:
root reinforcement changes of two tree species and their contribution to slope stability,Plant Soil, 217, 39, 1999.
78. Schmidt, K.M. et al., The variability of root cohesion as an influence on shallowlandslide susceptibility in the Oregon Coast Range, Can. Geotechnol. J., 38, 995,2001.
79. Roering, J.J. et al., Shallow landsliding, root reinforcement, and the spatial distribu-tion of trees in the Oregon Coast Range, Can. Geotechnol. J., 40, 237, 2003.
80. Hathaway, R.L. and Penny, D., Root strength in some Populus and Salix clones, NewZeal. J. Bot., 13, 333, 1975.
81. Jonasson, S. and Callaghan, T.V., Root mechanical-properties related to disturbedand stressed habitats in the Arctic, New Phytol., 22, 179, 992.
82. Makarova, O.V., Cofie, P. and Koolen, A.J., Axial stress-strain relationships of fineroots of beech and larch in loading to failure and in cyclic loading, Soil Till. Res.,45, 175, 1998.
83. Genet, M. et al., The influence of cellulose content on tensile strength in tree roots,Plant Soil, in press, 2006.
84. Wu, W.M. and R.C. Sidle, A distributed slope stability model for steep forested basins,Water Resour. Res., 31, 2097, 1995.
85. Cambell, K.A. and Hawkins, C.D.B., Paper birch and lodgepole pine root reinforce-ment in coarse-, medium-, and fine-textured soils, Can. J. For. Res., 33, 1580, 2003.
86. Wu, T.H., McKinnel, W.P., and Swantson, D.N., Strength of tree roots and landslideson Prince of Wales Island, Can. J. Geotechnol., 16, 19, 1979.
87. Nakamura, H., Nghiem, Q.M., and Iwasa, N., The influence of root reinforcementon slope stability: a case study from the Ozawa slope in Iwate Prefecture, Japan, inEco- and Ground Bio-Engineering: The Use of Vegetation to Improve Slope Stability,Stokes, A., Norris, J.E., Spanos, I., and Cammeraat, L.H., Eds., Kluwer AcademicPublishers, Dordrecht, 2006.
3209_C001.fm Page 28 Thursday, November 10, 2005 10:44 AM

Tree Biomechanics and Functional Ecology 29
88. Stokes, A., Mickovski, S.B., and Thomas, B.R., Eco-engineering for the long-termprotection of unstable slopes in Europe: developing management strategies for usein legislation, in Landslides: Evaluation & Stabilization, Lacerda, W.A., Erlich, M.,Fontoura, S.A.B., and Sayão, A.S.F., Eds., Balkema, 1685.
89. Dupuy, L., Fourcaud, T., and Stokes, A., A numerical investigation into factorsaffecting the anchorage of roots in tension, Eur. J. Soil Sci., 56, 319, 2005.
90. Stokes, A. et al., Responses of young trees to wind and shading: effects on rootarchitecture, J. Exp. Bot., 46, 21, 1995.
91. Stokes, A. et al., An experimental investigation of the resistance of model root systemsto uprooting, Ann. Bot., 78, 415, 1996.
92. Ennos, A.R. and Fitter, A.H., Comparative functional morphology of the anchoragesystems of annual dicots, Funct. Ecol., 6, 71, 1992.
93. Köstler, J.N., Brückner, E., and Bibelriether, H., Die Wurzeln der Waldbäume, PaulParey, Hamburg, 1968.
94. Gartner, B.L., Root biomechanics and whole-plant allocation patterns — responsesof tomato plants to stem flexure, J. Exp. Bot., 45, 1647, 1994.
95. Fourcaud, T., Danjon, V., and Dupuy, V., Numerical analysis of the anchorage ofmaritime pine trees in connection with their root structure, in International Confer-ence “Wind Effects on Trees,” University of Karlsruhe, Germany, September 16–182003, Ruck, B., Kottmeier, C., Mattheck, C., Quine, G., Wilhelm, G., pp. 323–330.
96. Dupuy, L., Fourcaud, T., and Stokes, A., A numerical investigation into the influenceof soil type and root architecture on tree anchorage, Plant Soil, in press, 2006.
97. Coutts, M.P., Root architecture and tree stability, in Tree Root Systems and TheirMycorrhizas, Plant and Soil, 71, 171, 1983.
98. Coutts, M.P., Components of tree stability in Sitka spruce on peaty gley soil, Forestry,59, 173, 1986.
99. Richards, P.W., The Tropical Rainforest, Second Edition, Cambridge University Press,Cambridge, 1996, p. 453.
100. Kaufman, L., The role of developmental crises in the formation of buttresses: a unifiedhypothesis, Evol. Trend. Plant., 2, 39, 1988.
101. Crook, M.J., Ennos, A.R., and Banks, J.R., The function of buttress roots: a compar-ative study of the anchorage systems of buttressed (Aglaia and Nephelium ramboutanspecies) and not-buttressed (Mallotus wrayi) tropical trees, J. Exp. Bot., 48, 1703,1997.
102. Clair, B. et al., Biomechanics of buttressed trees: bending strains and stresses, Am.J. Bot., 90, 1345, 2003.
103. Nicoll, B.C. and Ray, D., Adaptive growth of tree root systems in response to windaction and site conditions, Tree Physiol., 16, 891, 1996.
104. Ennos, A.R., The function and formation of buttresses, Trends Ecol. Evol., 8, 350,1993.
105. Stokes, A., Strain distribution during anchorage failure of Pinus pinaster Ait. atdifferent ages and tree growth response to wind-induced root movement, Plant Soil,217, 17, 1999.
106. Hintikka, V., Wind-induced movements in forest trees, Metsäntutkimuslitoksen Jul-kaisuja, 76, 1, 1972.
107. Mickovski, S.B. and Ennos, A.R., A morphological and mechanical study of the rootsystems of suppressed crown Scots pine Pinus sylvestris, Trees-Struct. Funct., 16,274, 2002.
108. Niklas, K.J. et al., The biomechanics of Pachycereus pringlei root systems, Am. J.Bot., 89, 12, 2002.
3209_C001.fm Page 29 Thursday, November 10, 2005 10:44 AM

30 Ecology and Biomechanics
109. Tamasi, E. et al., Influence of wind stress on root system development and architecturein oak seedlings (Quercus robur L.), Trees-Struct. Funct., 19, 374, 2005.
110. Moore, J.R., Differences in maximum resistive bending moments of Pinus radiatatrees grown on a range of soil types, Forest Ecol. Manag., 135, 63, 2000.
111. Fourcaud, T. et al. Application of plant architectural models to biomechanics, inPMA03 — Plant growth modeling and applications, Hu, B. and Jaeger, M. Eds.,Tsinghua University Press-Springer, Beijing, China, Springer, 2003.
112. Dupuy, L., Fourcand, T., Lac, P., and Stokes, A., Modelling the influence of morpho-logical and mechanical properties on the anchorage of root systems, in Internationalconference “Wind Effect on Trees,” September 16–18, 2003, University of Karlsruhe,Germany, Ruck, B., Koltmeier, C., Mattheck, C., Quine, G., and Wilhelm, G., pp.315–322.
113. Speck, T., Bending stability of plant stems: ontogenetical, ecological and phyloge-netical aspects, Biomimetics, 2, 109, 1994.
114. Jaffe, M.J., Morphogenetic responses of plants to mechanical stimuli or stress, Bio-science, 30, 239, 1980.
115. Weiher, E. et al., Challenging Theophrastus: a common core list of plant traits forfunctional ecology, J. Veg. Sci., 10, 609, 1999.
116. Jaffe, M.J., Leopold, A.C., and Staples, R.C., Thigmoresponses in plants and fungi,Am. J. Bot., 89, 382, 2002.
117. Telewski, F.W. and Jaffe, M.J., Thigmomorphogenesis: anatomical, morphologicaland mechanical analysis of genetically different sibs of Pinus taeda in response tomechanical perturbation, Physiol. Plantarum, 66, 219, 1986.
118. Pruyn, M., Ewers, B.J., and Telewski, F.W., Thigmomorphogenesis: changes in themorphology and mechanical properties of two Populus hybrids in response to mechan-ical perturbation, Tree Physiol., 20, 535, 2000.
119. Coutand, C. et al., Les sollicitations mécaniques, des régulateurs de la répartitionde la biomasse chez les ligneux, Conference “Réseau d’Ecophysiologie de l’Arbre,”France, Cruiziat, P. and Dreyer, E., Eds., INRA, 2003.
120. Telewski, F.W., Structure and function of flexure wood in Abies fraseri, Tree Physiol.,5, 123, 1989.
121. Sellier, D. and Fourcaud, T., Relationship between the oscillations of young pines(Pinus pinaster Aït.) and their aerial architecture, J. Exp. Bot., 56, 1563, 2005.
122. Coutand, C. and Moulia, B., Biomechanical study of the effect of a controlled bendingon tomato stem elongation: local strain sensing and spatial integration of the signal,J. Exp. Bot., 51, 1825, 2000.
123. Coutand, C. et al., Biomechanical study of the effect of a controlled bending ontomato stem elongation: global mechanical analysis, J. Exp. Bot., 51, 1813, 2000.
124. Jacobs M.R., The effect of wind sway on the form and development of Pinus radiataD. Don., Aust. J. Bot., 2, 35, 1954.
125. Telewski, F.W. and Pruyn, M.L., Thigmomorphogenesis: a dose response to flexingin Ulmus americana seedlings, Tree Physiol., 18, 65, 1998.
126. Hal, H. and Thomas, S.C., Interactive effects of lateral shade and wind on stemallometry, biomass allocation, and mechanical stability in Abutilon theophrasti (Mal-vaceae), Am. J. Bot., 89, 1609, 2002.
127. Mitchell, S.J., Effects of mechanical stimulus, shade, and nitrogen fertilization onmorphology and bending resistance in Douglas-fir seedlings, Can. J. Forest Res., 33,1602, 2003.
128. Berthier, S. and Stokes, A., Phototropic response induced by wind loading in maritimepine seedlings (Pinus pinaster Ait.), J. Exp. Bot., 56, 851, 2005.
3209_C001.fm Page 30 Thursday, November 10, 2005 10:44 AM

Tree Biomechanics and Functional Ecology 31
129. Stacey, G.R. et al., Wind flows and forces in a model spruce forest, Bound.-Lay.Meteorol., 69, 311, 1994.
130. Rudnicki, M., Mitchell, S.J., and Novak, M.D., Wind tunnel measurements of crownstreamlining and drag relationships for three conifer species, Can. J. Forest Res., 34,666, 2004.
131. Moulia, B. and Combes, D., Thigmomorphogenetic Acclimation of Plants to ModerateWinds Greatly Affects Height Structure in Field-Gown Alfalfa (Medicago sativa L.),an Indeterminate Herb, Society for Experimental Biology, General Congress, Edin-burgh, 2004.
132. Lawton, R.O., Wind stresses and elfin stature in a montane rain forest tree: an adaptiveexplanation, Am. J. Bot., 69, 1224, 1982.
133. Py, C. et al., A new technique for the measurement of the wind induced motion of aplant canopy, in Flow Induced Vibration, Congress, Paris, 2004.
134. Mattheck, C., Bethge, K., and Schafer, J., Safety factors in trees, J. Theoret. Biol.,165, 185, 1993.
135. Mattheck, C., Why they grow, how they grow: the mechanics of trees, ArboriculturalJ., 14, 1, 1990.
136. Mattheck, C. and Bethge, K., The structural optimization of trees, Naturwissen-schaften, 85, 1, 1998.
137. West, P.W., Jackett, D.R., and Sykes, S.J., Stresses in, and the shape of, tree stemsin forest monoculture, J. Theoret. Biol., 140, 327, 1989.
138. Niklas, K.J. and Spatz, H.C., Wind-induced stresses in cherry trees: evidence againstthe hypothesis of constant stress levels, Trees-Struct. Funct., 14, 230, 2000.
139. Mattheck, C., Comments on “Wind-induced stresses in cherry trees: evidence againstthe hypothesis of constant stress levels” by Niklas, K.J., Spatz, H.-C., Trees-Struct.Funct., 15, 2000.
140. Salisbury, F.B. and Ross, C.W., The power of movement in plants, in Plant Physiology,4th ed., Wadsworth, Belmont, CA, 1992, chap. 19.
141. Wilson, B.F. and Archer, R.R., Tree design: some biological solutions to mechanicalproblems, Bioscience, 29, 293, 1979.
142. Scurfield, G., Reaction wood: its structure and function, Science, 179, 647, 1973.143. Fournier, M. et al., Mécanique de l'arbre sur pied: modélisation d’une structure en
croissance soumise à des chargements permanents et évolutifs. II. Analyse tridimen-sionnelle des contraintes de maturation — cas du feuillu standard, Ann. Sci. Forest.,48, 527, 1991.
144. Archer, R.R. and Byrnes, F.E., On the distribution of tree growth stresses. Part I. Ananisotropic plane strain theory, Wood Sci. Technol., 8, 184, 1973.
145. Archer, R.R., Growth stresses and strains in trees. Springer Series in Wood Sciences,Springer Verlag, Heidelberg, 1987.
146. Bamber, R.K., A general theory for the origin of growth stresses in reaction wood:how trees stay upright, IAWA J., 22, 205, 2001.
147. Yamamoto, H. and Okuyama, T., Analysis of the generation process of growth stressesin cell walls, Mokuzai Gakkaishi, 34, 788, 1988.
148. Yamamoto, H. et al., Origin of the biomechanical properties of wood related to thefine structure of the multilayered cell wall, Trans. ASME, 124, 432, 2002.
149. Boyd, J., Compression wood force generation and functional mechanics, New Zeal.J. Forest Sci., 3, 240, 1973.
150. Fourcaud, T. et al., Numerical modelling of shape regulation and growth stresses intrees. II. Implementation in the AMAPpara software and simulation of growth, Trees-Struct. Funct., 17, 31, 2003.
3209_C001.fm Page 31 Thursday, November 10, 2005 10:44 AM

32 Ecology and Biomechanics
151. Fourcaud, T. and Lac, P., Numerical modelling of shape regulation and growth stressesin trees. I. An incremental static finite element formulation, Trees-Struct. Funct., 17,23, 2003.
152. Fournier, M. et al., Mesures des déformations résiduelles de croissance à la surfacedes arbres en relation avec leur morphologie. Observations sur différentes espèces,Ann. Sci. Forest., 51, 249, 1994.
153. Yamamoto, H., Okuyama, T., and Iguchi, M., Measurement of growth stresses on thesurface of a leaning stem, Mokuzai Gakkaishi, 35, 595, 1989.
154. Sinnott, E.W., Reaction wood and the regulation of tree form, Am. J. Bot., 39, 69,1952.
155. Meskausas, A., Jurkoniene, S., and Moore, D., Spatial organization of the gravitropicresponse in plants: applicability of the revised local curvature distribution model toTriticum aestivum coleoptiles, New Phytol., 143, 401, 1999.
156. Meskausas, A., Moore, D., and Novak Frazer, L., Mathematical modelling of mor-phogenesis in fungi: spatial organization of the gravitropic response in the mushroomstem of Coprinus cinereus, New Phytol., 140, 111, 1998.
157. Salisbury, F.B., Gravitropism: changing ideas, Hortic. Rev., 15, 233, 1993.158. Hart, J.W., Plant Tropisms and Other Growth Movements, Unwin Hyman, London,
1989.159. Stokes, A. and Guitard, D., Tree root response to mechanical stress, in Biology of
Root Formation and Development, Waisel, Y., Ed., Plenum Press: New York, 227,1997.
160. Niklas, K.J., Variations of the mechanical properties of Acer saccharum roots, J. Exp.Bot., 50, 193, 1999.
161. Odum, H.T., Environment, Power and Society, Wiley Interscience, New York, 1971.162. Painter, D.J., Forty-nine shades of green: ecology and sustainability in the academic
formation of engineers, Ecol. Eng., 20, 267, 2003.163. Mitsch, W.J., Ecological engineering: a new paradigm for engineers and ecologists,
in Engineering within Ecological Constraints, S. PC, Ed., National Academy Press:Washington DC, 1996, p. 111.
164. Coppin, N.J. and Richards, I.G., Use of Vegetation in Civil Engineering, Butterworths,London, 1990.
165. Schiechtl, H.M., Bioengineering for Land Reclamation and Conservation, Universityof Alberta Press, Edmonton (Alberta), 1980, p. 404.
166. Barker, D.H., Vegetation and Slopes, Thomas Telford, London, 1995.167. Wu, T.H., Watson, A., and El-Khouly, M.A., Soil-root interaction and slope stability,
in Ground and Water Bioengineering for Erosion Control and Slope Stabilization,Barker, D.H. et al., Eds., Science Publishers, Enfield, NH, 2004, p. 183.
168. Mickovski, S.B., Decision support systems in eco-engineering: The case of the SDSS,in Eco- and Ground Bio-Engineering: The Use of Vegetation to Improve Slope Sta-bility, Cammeraat, L.H., Ed., Kluwer Academic Publishers, Dordrecht, 2005.
169. Mickovski, S.B., Stokes, A., and van Beek, L.P.H., A decision support tool forwindthrow hazard assessment and prevention, Forest Ecol. Manag., 216, 64, 2005.
170. Dorren, L.K.A. and Seijmonsbergen, A.C., Comparison of three GIS-based modelsfor predicting rockfall runout zones at a regional scale, Geomorphology, 56, 49, 2003.
171. Ott, E., Guidelines for the protective role of forests in avalanche formation, Forstwis-senssch. Centralblatt, 115, 223, 1996.
172. Motta, R. and Haudemand, J.C., Protective forests and sylvicultural stability: anexample of planning in the Aosta Valley, Mountain. Res. Dev., 20, 180, 2000.
3209_C001.fm Page 32 Thursday, November 10, 2005 10:44 AM

Tree Biomechanics and Functional Ecology 33
173. Brang, P., Resistance and elasticity: promising concepts for the management ofprotection forests in the European Alps, Forest Ecol. Manag., 145, 107, 2001.
174. Hurand, A. and Berger, F., Forêts et risques naturels. Protection contre l’érosion, lesmouvements de terrain et les avalanches, La Houille Blanche, 3, 64, 2002.
175. Dorren, L.K.A. et al., Mechanisms, effects and management implications of rockfallin forests, Forest Ecol. Manag., 215, 183, 2005.
176. Quine, C.P. et al., Forests and Wind: Management to Minimise Damage, Bulletin 114,Her Majesty’s Stationery Office, London, 1995.
3209_C001.fm Page 33 Thursday, November 10, 2005 10:44 AM

35
2 Diversity of Mechanical Architectures in Climbing Plants: An Ecological Perspective
Nicholas P. Rowe, Sandrine Isnard, Friederike Gallenmüller, and Thomas Speck
CONTENTS
2.1 Introduction ....................................................................................................362.1.1 Importance of Climbers .....................................................................362.1.2 Mechanical Structure and Development of Climbers .......................362.1.3 Attachment Modes of Climbers.........................................................372.1.4 Mechanical Constraints and Types of Attachment............................37
2.2 Methods and Materials...................................................................................402.2.1 Experimental Protocols ......................................................................402.2.2 Calculation of Structural Young’s Modulus ......................................432.2.3 Sampling.............................................................................................44
2.3 Results: Mechanical Properties and Type of Attachment ............................442.3.1 Twining Climbers...............................................................................442.3.2 Tendril Climbers ................................................................................452.3.3 Hook Climbers ...................................................................................452.3.4 Branch-Angle Climbers .....................................................................462.3.5 Leaning Climbers...............................................................................53
2.4 Discussion ......................................................................................................532.4.1 Mechanical Properties and Attachment of Dicotyledonous
Climbers .............................................................................................532.4.2 Climbing Growth Strategies in Monocots and Other Plants
without Secondary Growth ................................................................552.4.3 Ecological Diversity of Climbers among Different Groups .............56
2.5 Conclusions ....................................................................................................57References................................................................................................................57
3209_C002.fm Page 35 Tuesday, November 8, 2005 8:18 AM

36 Ecology and Biomechanics
2.1 INTRODUCTION
Many vines and lianas show extreme variations in mechanical properties duringdevelopment from young to adult growth. These developmental trends differ fromthose observed in most self-supporting plants and have a significant effect on howclimbing plants exploit the environment. Furthermore, different climbers show awide range of attachment methods and may differ considerably in size as well asmechanical properties according to how they attach to host plants. To better under-stand how climbing habits differ, we investigate the mechanical properties of 43species of tropical and temperate climbing plants according to their mode of attach-ment. The study includes stem twiners, tendril climbers, hook climbers, branch-angle climbers, and leaning climbers. Mechanical trends during growth are discussedin terms of mode of attachment, taxonomic affinity, and inherent developmentalconstraints (i.e., existence or lack of secondary growth) as well as approximate sizeand position of the climbing plant in the surrounding vegetation.
2.1.1 IMPORTANCE OF CLIMBERS
Climbing plants can differ considerably from self-supporting plants in terms ofgrowth strategy and stem mechanics. Self-supporting plants can be understood tomake up the overall primary mechanical structure of many terrestrial ecosystems,whereas climbers fill vacant space on and around their self-supporting hosts. Despitea number of commentators noting that the ecology of lianas is more poorly knowncompared with other plant growth forms such as trees, recent studies over the lastdecade, including biomechanical studies, have unequivocally demonstrated thatlianas are extremely important constituents of many tropical ecosystems [1,2]. Fur-thermore, recent reports based on long-term censuses, particularly from the neotro-pics, have demonstrated that liana abundance is apparently increasing relative to treespecies, possibly as a result of anthropogenic disturbance and/or climatic change[3,4]. Because climbing plants represent important elements as well as potentialindicators of regional and possibly global vegetation change, there is much need fordeveloping techniques and approaches to better understand their growth, develop-ment, and ecological significance, especially under natural conditions.
2.1.2 MECHANICAL STRUCTURE AND DEVELOPMENT OF CLIMBERS
Lianas are currently understood to have a range of important ecological functionsin forest dynamics, of which a number are mechanical (Figure 2.1). Mature lianasclimbing to the forest canopy can literally tie neighboring trees together (Figures2.1c and 2.1d); they can weigh down and distort tree growth or even cause mainbranches or entire trees to fall. Young stages of liana growth can be particularly welladapted to spanning long distances even though they are composed of only narrowstems (Figures 2.1a and 2.1b), bridging host supports and exploring and filling openand disturbed areas, often to the detriment of self-supporting species. These special-ized strategies are made possible in many climbing species by highly adaptedmechanical properties of the stem. A number of recent studies have explored thedevelopmental, ecological, and evolutionary significance of the transition from
3209_C002.fm Page 36 Tuesday, November 8, 2005 8:18 AM

Diversity of Mechanical Architectures in Climbing Plants 37
relatively stiff young shoots to older more flexible stems [5–10]. This developmentaltrend differs from most self-supporting plants, which are normally composed ofrelatively compliant tissues when young and relatively stiff tissues when old. Manyvine and liana stems show extreme changes in mechanical properties during devel-opment from young to adult plants (Figure 2.1), and these changes have a significanteffect on how they exploit the environment. Climbers are particularly active in earlysuccessional and secondary forests as well as forest margins and disturbances withinforests, including tree falls and tree fall gaps.
2.1.3 ATTACHMENT MODES OF CLIMBERS
Climbing plants can differ considerably in size, maximal diameter, mechanicalproperties of young and old stems, and exact ecological preference. Furthermore,they show a wide range of attachment organs connecting the climbing plant to itshost plant or plants [11]. These attachment devices vary widely in mechanicalfunction. Climbers, which attach themselves most firmly to host supports, are rep-resented by twining stems, which can literally form knots around host trunks andbranches. The main stem of the climber itself constitutes the connection with thehost and such stems can be extremely firmly attached (Figure 2.1d). Climbers canalso attach via tendrils and sensitive petioles or other touch-sensitive appendicularorgans, which extend out and twine around relatively slender supports (Figure 2.6eand Figure 2.6f). These provide a relatively firm attachment for small-diametersearchers and for initial attachment to the host but are less strong than main twiningaxes that can provide extremely secure attachment after further woody secondarygrowth. Hooks, grapnels, recurved spines, and straight spines provide attachments,which are less secure than either twining leading stems or tendrils. Hooks and spinescan be jolted loose from their attachment. Some hooks, such as the appendicularorgans of the genus Strychnos, maintain woody growth after attachment and caneventually close the hook around the host support, providing a firmer attachmentthan when open (Figure 2.6d and 2.6e). Other climbers attain mechanical dependenceon other host plants by even less secure and possibly less specialized attachmentdevices, including wide-angled, stiff branches, which can interlock with branchesof neighboring plants (Figure 2.6a to 2.6c). Some climbing plants have roughenedsurfaces such as hairs, scales, or a roughened cuticular surface of the leaf that canincrease frictional contact with potential host supports. Other climbers can generatefriction or some degree of anchorage with the host plants via lobed or reflexed leaves.
2.1.4 MECHANICAL CONSTRAINTS AND TYPES OF ATTACHMENT
The attachment of a climber to its support is a crucial aspect of its survival andecology, and it can also mechanically influence its host plant. Climbers that twinevia the main stem on host trees are less likely to fall than plants that deploy recurvedhooks. An interesting question is whether the mechanical properties of the climbingplant stem differ according to the type of attachment device [5]. Climbers that deploy“weak” types of attachment might be expected to produce relatively stiffer stemmaterials than plants that are irreversibly twined onto the host support. If hook
3209_C002.fm Page 37 Tuesday, November 8, 2005 8:18 AM

38 Ecology and Biomechanics
FIGURE 2.1 (a) Juvenile stage of a twining liana. The plant is self-supporting and the stembelow the circumnutating apex is relatively stiff and has a high Estr (French Guiana). Thisstage of development often has mechanical properties that are similar to those of the stiffterminal “searcher” twigs of adult climbing plants [see (b)]. (b) Apical, young stage ofdevelopment of a mature twining liana (Condylocarpon guianense) (French Guiana). Suchaxes are relatively stiff and span long distances to reach host supports. (c) Old stages ofgrowth of a woody twining liana. The stems are firmly attached to the branches of the canopy,and the older basal portions are swinging freely from the canopy (French Guiana). Such stageshave often very low values of Estr. (d) Old stage of growth of a twining liana stem traversingfrom one tree to another and forming a very firm attachment between the two (French Guiana).The stem was observed to be under significant tensile stress when the wind blew and thetrees swayed violently in the wind. (e) Old stage of growth of Bauhinia guianensis (monkeyladder) (French Guiana). The mechanical properties of the old ribbonlike stem are character-ized by low values of Estr because this species attaches to the host tree by numerous tendrilarorgans. The branch to the left is a reiterative branch with “young” development and circularcross section. These reiterative branches are very stiff.
a c
b d e
3209_C002.fm Page 38 Tuesday, November 8, 2005 8:18 AM

Diversity of Mechanical Architectures in Climbing Plants 39
attachment fails, a relatively stiff stem would prevent the stem from buckling andfalling to the ground like a coil of rope; the relatively stiff stem would allow theplant to sway and perhaps secure attachment to another host. In this case, a goodstrategy would be to retain relatively stiff mechanical properties. Because climbingstems employing hooks and spines are more loosely attached to the host plant,swaying or movement of the host would also probably detach the climber from thesupport rather than being deformed and possibly becoming damaged during move-ment, especially if the host supports were massive. Climbers that are firmly attached,such as stem twiners possibly have rather different constraints between attachmenttype and stem mechanics. Although mature to aged twining stems can sometimesbe observed to have loosened and fallen in coils from host trunks, many firmlysecured twining connections that are reinforced by wood production will probablynever disconnect from the stem unless by failure under extreme loading. In suchcases, it is of no advantage to the climbing plant to invest in mechanically stiffeningthe older basal stem. In fact, with such types of connections, the host or climberwill actually fail, possibly under the weight of the growing liana, before the twiningattachment does. Failure of the host tree would probably result in catastrophicmovement and stresses to the climbing plant stem; under such circumstances, arelatively slender stem is less likely to fail if it is flexible rather than relatively stiff.Furthermore, movement or swaying of host trees could exert extreme stresses andstrains on the connected climbing stem, which if firmly twined or knotted to thehost, would require high compliance to avoid failure [12]. Extreme movement ofhost trees might not occur often, but infrequent storm conditions with strong windsand large host movements could excessively load the stems of firmly attachedclimbers. Furthermore, tree falls and the formation of forest gaps are importantelements of forest dynamics, particularly in the tropics. Plants that are firmly attachedto trees and branches that fail are more likely to survive if compliant. Alternatively,more weakly attached climbers might avoid mechanical stresses by becoming unat-tached from the host.
In the following account, we investigate the bending elastic mechanical proper-ties of 43 species of tropical and temperate climbing plants; we explore how mechan-ical properties of the stem vary with the type of attachment, overall height, size, anddiameter of climbers ranging from woody lianas, which can extend to the canopyof the tropical rain forest, to more diminutive climbers or vines barely reaching ameter in height. The study has particular significance for understanding the likelyecological constraints on different climbing habits of different species. We havelisted the species tested along with their type of attachment, taxonomic affinity, andapproximate size and position of the mature climbing plant in the surroundingvegetation. We have differentiated between five types of attachment modes: stemtwiners, tendril climbers, hook climbers, branch-angle climbers, and leaning climb-ers. The categories of climber are somewhat generalized because, for example, bothtendril and hook climbers include plants with varying types of hooks and tendrils.An important omission in this study is root climbers, plants that climb on the hostplant via roots produced along the stem. While these are an important element inmany ecosystems, they are usually attached firmly along much of their entire lengthapart from the apex and as such differ from the majority of vines and lianas. In this
3209_C002.fm Page 39 Tuesday, November 8, 2005 8:18 AM
40 Ecology and Biomechanics
study, we compare plants that attach themselves to the host plant but do not “grow”directly on the host plant as do most root climbers.
2.2 METHODS AND MATERIALS
A wide range of mechanical properties is relevant to the understanding of theextremely specialized stem structures found in some climbing stems. They includethe stiffness in the elastic range of bending, torsion, and tension as well as otherproperties in the nonelastic range up to failure of the plant stem as well as toughness,extensibility, and critical strain — to mention a few [13,14]. Additional propertiesof interest and inextricably linked to stem mechanical properties are hydraulicconductance of the stem and the extent of mechanical deformation that can occurbefore the essential hydraulic supply of the stem is compromised. In the followingaccount, we confine our attention to bending stiffness in the elastic range. We havechosen this single parameter because it can be measured relatively easily under fieldor laboratory conditions and because it gives a measure of the bending mechanicalproperties of the stem before irrereversible deformation and damage outside thenormal properties of living healthy plant tissues. Our objective is to compare a widerange of tested species with different climbing habits and, where possible, fromplants sampled in their natural habitats. The inclusion of a wide range of mechanicalparameters is not feasible with this view in mind. Bending mechanical propertiescan be measured in a number of ways and via a number of types of bending tests.In the following study, we include data from previous and ongoing research projectsin which we use similar bending experimental protocols for a wide range of climbingspecies, in the laboratory, in relatively sophisticated “field laboratories,” and inremote field conditions.
2.2.1 EXPERIMENTAL PROTOCOLS
While bending tests are relatively straightforward in theory, the heterogeneity, geom-etry, combination of tissues contributing to the plant stem, and abrupt changes indevelopment and anatomy provide a variety of practical and theoretical difficulties.A range of bending tests can be set up for the majority of climbing plant species,but the type of test depends on the diameter and resistance to bending of the material.A bending apparatus that we have used in many laboratory and field situations(Figure 2.2a) consists of a steel frame fixed to a solid base and equipped withadjustable holders that can be positioned at variable distances. A stereoscopebinocular microscope equipped with an eyepiece graticule is attached to the baseand can be adjusted vertically and focused in a horizontal plane to a fixed point onthe plant specimen to critically observe deflection [7,15]. The apparatus can beconfigured for two types of bending tests: three-point (Figure 2.2b) and four-point(Figure 2.2c) bending. This kind of apparatus can be modified into more portableversions for making measurements in the field (Figure 2.2d). The principal aim ofthe bending experiment is to measure flexural stiffness, EI, of the stem, and fromthis quantity calculate the structural Young’s modulus, Estr, of the plant stem [7].
3209_C002.fm Page 40 Tuesday, November 8, 2005 8:18 AM

Diversity of Mechanical Architectures in Climbing Plants 41
FIGURE 2.2 (a) Mechanical bending apparatus for use in field camps and field laboratories.The methods are entirely mechanical and do not require electricity. Plant stems are placedon supports suspended from a horizontal beam. Span distances can be adjusted to the sizeand bending resistance of the material. A range of panniers are used for tests in three- andfour-point bending (left) as are a series of weights from 10 to 500 g (center). A series of upto six to eight weight increments is placed on the pannier, and the deflections are observedvia a dissecting microscope equipped with an eyepiece graticule. The central part of eachsegment tested is stored in alcohol or FAA (1 part acetic acid 80%, 25 parts formalin 40%,218 parts ethanol 50%) (right). (b) Configuration for three-point bending. The plant stem isplaced on the two supports at a known distance, and the pannier is suspended from the exactcenter via a plastic ring, which can be turned obliquely to allow observation of the stemthrough the microscope. (c) Configuration for four-point bending. The plant stem is placedon the two supports at a known distance, and the two-armed pannier is placed on the specimenat equal distances from each central support. With this type of four-point bending, the weightsapplied to the pannier produce a deflection of the stem in an upward direction, and theinfluence of shear on the experiment is insignificant. (d) Portable, field, bending apparatus.The plant specimen is placed on the two supports, and the span distance can be adjustedeasily. Both three- and four-point bending tests are possible.
a
b c d
3209_C002.fm Page 41 Tuesday, November 8, 2005 8:18 AM

42 Ecology and Biomechanics
Plant stem segments are pruned from the plant body and placed in the apparatusconfigured for either three- or four-point bending. Stems are first checked for splits,fractures, or other damage that could affect their mechanical properties. Stems thattaper significantly (more than 10%) and stems that include significantly thickenednodes or branch points are excluded from the study. Apical parts of some plant stemssuch as the leading searchers of lianas can show relatively abrupt changes in mechan-ical properties from immature tissue near the very apex to the mature, differentiatedstem lower down. Tests of young axes should avoid this transition, which is notalways obvious from external inspection.
There are a number of advantages and disadvantages to both three- and four-point bending. Three-point bending is relatively easy to apply because the weightis added centrally (Figure 2.2b) and the stem does not tend to move about and spoilthe deflection reading when the weights are added. In four-point bending, however,the stem is loaded via a two-armed pannier (Figure 2.2c), and slightly irregular stemscan twist or flip over after one or more weights are added. This means that it issometimes difficult to study all of the stem segments of a sample. In three-pointbending, because the force is applied and concentrated at one point at the center ofthe stem, the measurement can include deflection of the axis caused by shear of theplant tissues, thus such measurements would underestimate the flexural stiffnessduring the bending test [13,14,16,17]. In four-point bending, the force is distributedequally over the central portion of the tested stem, and the effect of shear is insig-nificant. Tests in three-point bending should be verified to find out the minimumspan-to-depth ratio above which the effect of shear will be insignificant. A longlength of plant stem is selected, and a series of tests at increasing span lengths iscarried out until a span-to-depth ratio is reached at which the flexural stiffnessbecomes a constant value [15,18]. In a plant stem of, say, a liana, ideally such testsshould be carried out prior to measuring stems with widely differing mechanicalproperties such as young and old developmental stages. Stiff combinations of planttissues are less liable to shear than more compliant ones. Many references refer toa span-to-depth ratio of 20 as being suitable for three-point bending based on theproperties of many industrially tested woods and timbers. This value, however, canchange significantly. Some compliant plant materials we have observed require span-to-depth ratios of 40 or more. Four-point bending can also require the addition ofquite substantial weight increments to obtain a reasonable deflection in the regionof 1 to 3 mm for a range of stem diameters of 1 to 30 mm. Adding excessive weightin a four-point bending test can cause problems because the outer tissue of the plantstem resting on the fixed supports can indent and affect the deflection distanceobserved; this is especially the case when the deflection is small. Such problemscan be addressed by carefully trimming soft bark tissue from around the of the stem’spoint of contact with the supports so that the support contacts harder wood beneath.But if the wood itself is compressible, the problem might be difficult to solve. Insummary, three-point bending is somewhat easier and quicker to carry out, but theneed for carrying out span tests can make the approach time-consuming, especiallyunder field conditions. Four-point bending can be trickier to set up and carry outbecause of movement of the stem, and it might not be possible to measure all ofthe stem segments in a sample, resulting in a loss in continuity in the analysis. In
3209_C002.fm Page 42 Tuesday, November 8, 2005 8:18 AM

Diversity of Mechanical Architectures in Climbing Plants 43
general, it is best to stick with one or the other types of test for a given analysis ona given plant. Having said that, it is also informative to first test a specimen in three-point bending and then repeat the test in four-point bending, combining this kindof verification with span tests; however, this takes time.
Successive weights are added during the bending experiment in three- or four-point bending at fixed time intervals of normally 1 min, which are sufficient for theplant stem to achieve its maximum deflection for a given weight. Creep is sometimesobserved when the plant stem continues to deflect and is an indication that sufficientforce is being applied to exceed the elastic range of the stem material. Some stemsreact extremely quickly to the force applied, while others react more slowly. Thetime increment should take this into account, but 1 min is normally enough to reachmaximum deflection.
2.2.2 CALCULATION OF STRUCTURAL YOUNG’S MODULUS
The bending test results are plotted as the deflection (in millimeters) on the y-axisagainst the force applied (in Newtons) on the x-axis. The bending test was successfulif the value of r2 for the force-deflection curve is greater than 0.98 (i.e., if the entiremeasurement is in the linear elastic range), the specimen has not moved or slippedduring the test accidentally, and the experiment has remained within the elastic range.Immediately after the experiment, the diameter of the stem segment is measured inthree to six positions along its length in the direction of the force applied andperpendicular to it. The mean axial second moment of area (I) (in mm4) of the stemis then calculated from these measurements where the stem cross section is approx-imated as an ellipse:
I = ( /4) · (r13 · r2)
where r1 is the radial thickness of the stem in the direction of the applied force andr2 is the radial thickness in the perpendicular direction.
In three-point bending, the flexural stiffness (EI) (Nmm2) of the tested stem iscalculated via:
EI = l3/(48 · b)
where l is the distance (mm) between the two supports (Figure 2b) and b is the slopeof the force-deflection curve (deflection/force) (mm/N).
In four-point bending, the flexural stiffness (EI) (Nmm2) of the tested stem iscalculated via:
EI = l2 · a/(16 · b)
where l is the distance between the two internal supports, a is the distance betweenthe outside pannier and the internal support (Figure 2c), and b is again the slope ofthe force–deflection curve (mm/N).
The structural Young’s modulus of the stem (Estr) (MNm–2) is calculated via:
3209_C002.fm Page 43 Tuesday, November 8, 2005 8:18 AM

44 Ecology and Biomechanics
Estr = EI/I
We use the term “structural Young’s modulus” (Estr) as the parameter to describe astructure consisting of different tissues, i.e., a plant stem [7,15].
2.2.3 SAMPLING
We present values of structural Young’s modulus Estr for a wide taxonomic andmorphological range of climbers; the results are presented as means and standarddeviations for young and old developmental stages of climbing plants (Figure 2.3and Figure 2.4; Table 2.1). Despite problems in assigning specific ages for youngand old plant segments, young axes of the plant are generally positioned toward theapex and, often in climbing plants, represent “searchers” for reaching new hosts(Figures 2.1a and 2.1b). In general, older stages of development represent morebasal and generally, but not always, more flexible parts of the climbing plant (Figures2.1c and 2.1e) [10,19]. The object is to compare how mechanical properties varywith type of attachment among different plant groups. Attachment modes weresummarized as:
1. Twining or winding of the main leading axis and/or principal branches.2. Attachment to the host plant via sensitive tendrils or tendril-like organs.
There are a range of such types of organs derived from stem, leaf, orfertile axis. For simplicity, we have grouped these together. From amechanical perspective and in terms of the growth form of the wholeplant, we suspect that these types of attachment act similarly.
3. Attachment to host plants via hooks.4. Attachment to host plants via wide-angled branches acting as anchors.5. Leaning against the surrounding vegetation.
The analysis includes 43 species from 18 vascular plant families, including 1lycopsid, 3 gymnosperms, 8 monocotyledons, and 31 dicotyledons (Table 2.1).
2.3 RESULTS: MECHANICAL PROPERTIES AND TYPE OF ATTACHMENT
2.3.1 TWINING CLIMBERS
All twining climbers show a marked decrease in Estr from young to older stages ofdevelopment (Table 2.1; Figure 2.3 and Figure 2.4). All but five twiners showrelatively high values of Estr in young stages of development of 2000 to 6000 MNm–2.The highest value for young stages occurs in Doliocarpus sp. at about 6900 MNm–2.Except for the species of Lonicera and two species of Secamone (S. bosserii, S.geayii), values of older stages (Figure 2.4) are below 1200 MNm–2 and about halfof these are less than 600 MNm–2. All stem twiners tested are dicotyledonousangiosperms (Table 2.1) with the exception of the gymnosperm genus Gnetum.Interestingly, the two African species of Gnetum show markedly lower values of Estr
3209_C002.fm Page 44 Tuesday, November 8, 2005 8:18 AM

Diversity of Mechanical Architectures in Climbing Plants 45
in the young searcher shoots compared with all the other angiosperm twiners tested(Table 2.1; Figure 2.3 and Figure 2.4).
2.3.2 TENDRIL CLIMBERS
All dicotyledonous tendril climbers tested show a marked drop in Estr from youngto older stages with final values of Estr in the range of below 1000 MNm–2 (Table2.1; Figure 2.3 and Figure 2.4). The species of Bauhinia (monkey ladder) shows anextreme drop in mechanical properties from young stages of over 8000 MNm–2
(Table 2.1). This varies from one of the highest tested of all categories (8480 MNm–2)to one of the lowest (350 MNm–2). The species shows a marked change in bothmaterial properties of the stem (Figure 2.3 and Figure 2.4) as well as a profoundchange in stem geometry leading to ribbonlike, highly flexible stems (Figure 2.1e).In contrast to the dicotyledonous twiners, the small monocotyledonous climberSmilax aspera, which generally grows on herbs, shrubs, and small trees, shows anincrease in Estr from younger parts of the plant to older basal parts (Table 2.1).
2.3.3 HOOK CLIMBERS
The hook climbers show a more variable range of shifts in mechanical propertiescompared with twiners and tendril climbers (Table 2.1; Figure 2.3 and Figure 2.4).The woody dicotyledonous liana Strychnos (Figure 2.6d and 2.6e) shows the highestvalue of Estr of all plants tested in young stages of development, i.e., over 12,000MNm–2, followed by a large reduction in Estr (Table 2.1). In older stages, its valueof Estr is also rather higher than most twining and tendril-climbing species. The twowoody hook-climbers Bougainvillea and Rosa do not show a noticeable drop in Estr
during development; rather, they retain relatively high values in old stages or increasethem.
Monocotyledonous hook climbers (Figure 2.5) also show variable trends,depending on the taxonomic group they belong to. Species of Calamus (Figure 2.5b)show decreases in Estr to values of 1830 and 2300 MNm–2, equivalent to the highestvalues of old twining species (Lonicera and Secamone) (Table 2.1; Figure 2.3 andFigure 2.4). Old stages of these Calamus species are canelike and have lost the leafsheath that contributed to relatively high values of Estr in young stages of growth.In Daemonorops jenkinsiana, old stages included stems, which are still surroundedby leaf sheaths. For this species, very old and long stems were not available in thestudied area. In Plectocomia himalayana, the older stages measured show no changesin mechanical properties compared with young stages (Table 2.1; Figure 2.3 andFigure 2.4). For this species, values of Estr remain high, around 3000 to 4000 MNm–2
(Table 2.1). The South American climbing palm Desmoncus (Arecoideae) (Figure2.5a and 2.5f) shows a quite different trend. Interestingly, both species show a markedincrease in Estr in older stages of development, for which the leaf sheath has senescedand, in the case of D. orthacanthos, was finally lost. Values in young stages ofaround 4000 to 5000 MNm–2 are in the similar range, with higher values foundamong twiners and tendril climbers, whereas values in older stages of 8000 to 9000
3209_C002.fm Page 45 Tuesday, November 8, 2005 8:18 AM

46 Ecology and Biomechanics
MNm–2 are higher than all other plants tested with the exception of the monocoty-ledon Ischnosiphon and the leaning species Lonicera xylosteum (Table 2.1).
2.3.4 BRANCH-ANGLE CLIMBERS
Plants forming attachments via wide-angled branching also show widely differingpatterns of change in Estr. The species of Croton, representing a woody dicotyledon(Figure 2.6a), shows a similar trend as the majority of twiners and tendril-climbers(Table 2.1; Figure 2.3 and Figure 2.4). The young parts of climbing stems have highvalues of Estr and above the general range of nearly all twiners and most of the hookclimbers and tendril climbers. The older parts show a marked drop in Estr with values
FIGURE 2.3 Mean structural Young’s modulus and one standard deviation of young stagesof development of climbing plants with different modes of attachment. Black bars = dicoty-ledons, grey bars = gymnosperms, white bars = monocotyledons, striped bar = lycopod.
0 2000 4000 6000 8000 10000 12000 14000 16000 18000
Structural Young’s modulus (MNm−2)
Stemtwiners
Tendril climbers
Hook climbers
Branch angleclimbers
Leaning climbers
Secamonopsis madagascariensisSecamone ligustrifolia
Secamone geayiiSecamone cristata
Secamone buxifoliaSecamone bosserii
Pervillaea philipsoniiMaripa scandensMachaerium sp.
Lonicera sempervirensLonicera reticulata
Lonicera periclymenumLonicera alseuosmoides
Gnetum cf. guianensisGnetum bucholzianum
Gnetum africanumFallopia albertiiDoliocarpus sp.
Condylocarpon guianenseAristolochia macrophylla
Aristolochia giganteaAristolochia brasiliensis
Smilax asperaPassiflora glandulifera
Clematis vitalbaClematis flammula var. maritima
Bauhinia guianensis
Strychnos sp. Rosa canina
Plectocomia himalayana Desmoncus polyacanthos Desmoncus orthacanthos
Daemonorops jenkinsiana Calamus tetradactylus
Calamus acanthospathus Bougainvillea glabra
Lycopodiella cernua Ischnosiphon centricifolius
Croton pullei Croton nuntians
Lonicera xylosteum Lonicera myrtillus
Clematis recta
Bending properties of Young stages
3209_C002.fm Page 46 Tuesday, November 8, 2005 8:18 AM

Diversity of Mechanical Architectures in Climbing Plants 47
of less than 1000 MNm–2, approaching that of many tendril climbers and twinersand, interestingly, well below that of all of the other hook climbers.
Stems of Lycopodiella cernua interlock with the surrounding vegetation vialateral branches. The younger parts of the plant show relatively stiff mechanicalproperties of over 8000 MNm–2, in the range of woody rigid species like Bauhiniaand Strychnos (Table 2.1; Figure 2.3 and Figure 2.4). The older stage at the base ofthe plant is more flexible but still retains high values of around 3000 MNm–2.
Finally, the monocotyledonous branch climber, Ischnosiphon centricifolius(Marantaceae) has highly characteristic “pencil-like” stems, which produce rosettesof leaves at nodes along the stem (Figure 2.6b and 2.6c). Both the leaves and theangle formed by the insertion of the next internode can anchor the plant stem ontosurrounding host plants in the forest understory. Younger distal parts of the climbing
FIGURE 2.4 Mean structural Young’s modulus and one standard deviation of old stages ofdevelopment of climbing plants with different modes of attachment. Black bars = dicotyle-dons, stippled bars = gymnosperms, white bars = monocotyledons, striped bar = lycopod.
Leaning climbers
Branch angleclimbers
Hook climbers
Tendril climbers
Stemtwiners
0 2000 4000 6000 8000 10000 12000 14000 16000 18000
Structural Young’s modulus (MNm−2)
Secamonopsis madagascariensisSecamone ligustrifolia
Secamone geayiiSecamone cristata
Secamone buxifoliaSecamone bosserii
Pervillaea philipsoniiMaripa scandensMachaerium sp.
Lonicera sempervirensLonicera reticulata
Lonicera periclymenumLonicera alseuosmoides
Gnetum cf. guianensisGnetum bucholzianum
Gnetum africanumFallopia albertiiDoliocarpus sp.
Condylocarpon guianenseAristolochia macrophylla
Aristolochia giganteaAristolochia brasiliensis
Smilax asperaPassiflora glandulifera
Clematis vitalbaClematis flammula var. maritima
Bauhinia guianensis
Strychnos sp. Rosa canina
Plectocomia himalayana Desmoncus polyacanthos Desmoncus orthacanthos
Daemonorops jenkinsiana Calamus tetradactylus
Calamus acanthospathus Bougainvillea glabra
Lycopodiella cernua Ischnosiphon centricifolius
Croton pullei Croton nuntians
Lonicera xylosteum Lonicera myrtillus
Clematis recta
Bending properties of old stages
3209_C002.fm Page 47 Tuesday, November 8, 2005 8:18 AM

48Eco
logy an
d B
iom
echan
icsTABLE 2.1Structural Young’s Modulus, Attachment Type, Size, Diameter, and Taxonomic Group of 43 Tested Climbing Plants from 18 Different Vascular Plant Families, Arranged according to Attachment Type
Species NotesEstr [MNm-2]Young Stages
Estr [MNm-2]Old Stages
Climbing to:Forest Canopy
Forest UnderstoryHerb to Shrub
LevelHerb Level
DiameterOf Widest
StemTested[Mm]
No. of Samples(Young Stages)
No. of Samples
(Old Stages) Family Group
LeaningClematis recta ** b 4521 ± 980 5132 ± 1200 Herb to shrub 6 20 33 Ranunculaceae Dicot
Lonicera myrtillus ** f 3560 ± 939 2978 ± 560 Forest understory 10 3 7 Caprifoliaceae Dicot
Lonicera xylosteum * f 7022 ± 2497 7790 ± 2222 Forest understory 18 4 5 Caprifoliaceae Dicot
Angled BranchCroton nuntians * d 8318 ± 2401 849 ± 211 Forest canopy 49 14 5 Euphorbiaceae Dicot
Croton pullei * e 6741 ± 2206 490 ± 203 Forest canopy 102 38 8 Euphorbiaceae Dicot
Ischnosiphon centricifolius * 4956 ± 921 10427 ± 921 Forest understory 15 5 8 Marantaceae Monocot
Lycopodiella cernua * e 8719 ± 1571 3031 ± 2054 Herb to shrub 4 10 10 Lycopodiaceae Lycopsid
HookBougainvillea glabra ** a 3640 ± 219 3460 ± 1113 Forest canopy 11 41 20 Nyctaginaceae Dicot
Calamus acanthospathus * i 6110 ± 1560 1830 ± 670 Forest canopy 15 3 2 Arecaceae Monocot
Calamus tetradactylus ** i 7070 ± 1560 2300 ± 500 Forest canopy 13 13 40 Arecaceae Monocot
Daemonorops jenkinsiana ** 6630 ± 1330 - Forest canopy 33 8 – Arecaceae Monocot
Desmoncus orthacanthos * i 4000 ± 1070 8906 ± 2240 Forest canopy 30 17 9 Arecaceae Monocot
Desmoncus polyacanthos * 5074 ± 1782 8091 ± 2546 Forest understory 10 16 11 Arecaceae Monocot
Plectocomia himalayana * 3250 ± 1030 4120 ± 780 Forest canopy 40 3 3 Arecaceae Monocot
Rosa canina * h 1848 ± 787 3155 ± 954 Herb to shrub 13 12 23 Rosaceae Dicot
Strychnos sp. * a 12920 ± 3790 1750 ± 40 Forest canopy 49 14 2 Loganiaceae Dicot
3209_C002.fm
Page 48 T
uesday, Novem
ber 8, 2005 8:18 AM

Diversity o
f Mech
anical A
rchitectu
res in C
limb
ing Plan
ts49
Tendril Bauhinia guianensis * a,g 8480 ± 2820 350 ± 100 Forest canopy 18 3 3 Fabaceae Dicot
Clematis flammula var. maritima
* b 1619 ± 492 470 ± 113 Herb to shrub 10 21 10 Ranunculaceae Dicot
Clematis vitalba * b 3074 ± 1083 772 ± 261 Forest canopy 18 18 17 Ranunculaceae Dicot
Passiflora glandulifera * a 4540 ± 620 630 ± 130 Forest canopy 21 3 3 Passifloraceae Dicot
Smilax aspera * 3178 ± 1057 4937 ± 529 Herb to shrub 6 7 7 Smilacaceae Monocot
Stem TwinerAristolochia brasiliensis ** 1955 ± 411 104 ± 72 Forest canopy 35 6 8 Aristolochiaceae Dicot
Aristolochia gigantea ** 3343 ± 1405 294 ± 89 Forest canopy 23 6 5 Aristolochiaceae Dicot
Aristolochia macrophylla ** b 2465 ± 479 497 ± 385 Forest understory 28 40 45 Aristolochiaceae Dicot
Condylocarpon guianense * c 2720 ± 900 310 ± 50 Forest canopy 38 36 11 Apocynaceae Dicot
Doliocarpus sp. * a 6870 ± 980 290 ± 30 Forest canopy 33 3 3 Dilleniaceae Dicot
Fallopia albertii ** a 2740 ± 290 730 ± 150 Forest canopy 13 10 3 Polygonaceae Dicot
Gnetum africanum * 1036 ± 176 560 ± 64 Forest canopy 24 2 4 Gnetaceae Gymnosperm
Gnetum bucholzianum * 683 ± 180 293 ± 90 Forest canopy 17 11 7 Gnetaceae Gymnosperm
Gnetum cf. guianensis * 3037 ± 126 961 ± 222 Forest canopy 17 2 3 Gnetaceae Gymnosperm
Lonicera alseuosmoides ** f 4561 ± 1330 1170 ± 342 Forest understory 7 10 2 Caprifoliaceae Dicot
Lonicera periclymenum * f 4050 ± 894 1912 ± 444 Forest understory 24 3 6 Caprifoliaceae Dicot
Lonicera reticulata ** f 4028 ± 1589 1876 ± 528 Forest understory 9 8 5 Caprifoliaceae Dicot
Lonicera sempervirens ** f 4666 ± 1516 3262 ± 796 Forest understory 12 8 3 Caprifoliaceae Dicot
Machaerium sp. * a 5750 ± 2110 1200 ± 150 Forest canopy 29 3 3 Fabaceae Dicot
Maripa scandens * a 4111 ± 510 390 ± 30 Forest canopy 32 5 3 Convolvulaceae Dicot
Pervillaea philipsonii * 1851 ± 232 266 ± 79 Forest canopy 15 12 11 Apocynaceae Dicot
Secamone bosserii * 4573 ± 818 1793 ± 305 Herb to shrub 12 12 6 Apocynaceae Dicot
Secamone buxifolia * 3145 ± 693 850 ± 85 Forest canopy 17 12 6 Apocynaceae Dicot
Secamone cristata * 4057 ± 851 1158 ± 357 Forest to shrub 11 9 2 Apocynaceae Dicot
Secamone geayii * 4909 ± 647 1415 ± 396 Herb to shrub 11 8 6 Apocynaceae Dicot
(continued)
3209_C002.fm
Page 49 T
uesday, Novem
ber 8, 2005 8:18 AM

50Eco
logy an
d B
iom
echan
icsTABLE 2.1 (CONTINUED)Structural Young’s Modulus, Attachment Type, Size, Diameter, and Taxonomic Group of 43 Tested Climbing Plants from 18 Different Vascular Plant Families, Arranged according to Attachment Type
Species NotesEstr [MNm-2]Young Stages
Estr [MNm-2]Old Stages
Climbing to:Forest Canopy
Forest UnderstoryHerb to Shrub
LevelHerb Level
DiameterOf Widest
StemTested[Mm]
No. of Samples(Young Stages)
No. of Samples
(Old Stages) Family Group
Stem Twiner (continued)Secamone ligustrifolia * 1976 ± 544 767 ± 105 Forest canopy 29 12 7 Apocynaceae Dicot
Secamonopsismadagascariensis
* 1734 ± 413 570 ± 192 Forest canopy 23 12 4 Apocynaceae Dicot
Note: Values of Estr are based on means and 1 standard deviation.
* Plant measured in natural habitat** Plant measured in botanical gardens or greenhouses.a See ref. [8]b See ref. [27]c See ref. [7]d See ref. [21]e See ref. [15]f See ref. [25]g Old stems of Bauhinia guianensis are ribbon-shaped; the maximum diameter given here corresponds to the diameter of a circular surface equal in area to the ribbon-shaped stem in crosssection.h Measurements of Rosa canina are confined to leaning or climbing stems up to 1 year old.i Data for these climbing palms include measurements based on old stages in which the outer leaf sheath has been lost via natural aging. The other species are all based on older portionsof climbing stems in which the leaf sheath is still attached but usually, at least, partially senescent.
3209_C002.fm
Page 50 T
uesday, Novem
ber 8, 2005 8:18 AM

Diversity of Mechanical Architectures in Climbing Plants 51
FIGURE 2.5 (a) Young phase of growth of the understory climbing palm Desmoncus polya-canthos (French Guiana). When the plant becomes mechanically unstable, it produces leavesequipped with distal hooks and grapnel-bearing cirri (left). (b) Young phase of growth ofCalamus acanthospathus (Yunnan Province, China). When the plant becomes unstable, longmodified inflorescences bearing recurved hooks (flagellae) are produced, and the plant canreach the canopy, producing stems over 70 m in length. (c) The calamoid rattan palm Plecto-comia himalayana (Yunnan Province, China), old stage of development in which the youngpart of the plant is firmly attached in the canopy and the older part of the axis is spanning awide space between supports. The leaves and leaf sheaths of this part of the stem are senescingand lose their attachment with the original supports. (d) Apical parts of P. himalayana emergefrom the forest canopy (Yunnan Province, China) and bear many cirrus-bearing leaves andmany potential attachment points with the surrounding canopy vegetation. (e) The small-bodiedSmilax aspera (southern France) uses both apendicular tendrils and recurved hooks for attach-ing to host plants. Tendrils firmly connect the plant to the host. (f) Apex of the attachmentorgan (cirrus) of Desmoncus polyacanthos (French Guiana) produce laterally deployed grapnel-like modified leaflets (acanthophylls) and abaxially placed recurved spines.
a b e
f
c
d
3209_C002.fm Page 51 Tuesday, November 8, 2005 8:18 AM

52 Ecology and Biomechanics
FIGURE 2.6 (a) The branch-angle climber Croton nuntians (French Guiana) shows a well-attached apex and flexible older stems descending to ground level. (b) The climbing mono-cotyledon Ischnosiphon centricifolius (French Guiana). Its narrow pencil-like stems ascendinto the understory. (c) The angles formed between successive nodes and internodes in stemsof Ischnosiphon centricifolius provide effective points of attachment. (d) Stiff distal branchesand sensitive hooks of Strychnos sp. (French Guiana). (e) Unattached hook of Strychnos sp.When hooks locate a host branch, they can develop a more secure attachment by tendril-likegrowth and woody development (French Guiana). (f) Appendicular woody tendrils producedfrom Bauhinia guianensis. Such structures can form firm attachments to narrow diameter hostbranches (French Guiana).
a b
d
e f
c
3209_C002.fm Page 52 Tuesday, November 8, 2005 8:18 AM

Diversity of Mechanical Architectures in Climbing Plants 53
stem show relatively high values of Estr of around 5000 MNm–2, which is in theupper range of values for twiners and hook climbers. Interestingly older, more basalparts of the plant show very high values of Estr of over 10,000 MNm–2 (Table 2.1;Figure 2.3 and Figure 2.4).
2.3.5 LEANING CLIMBERS
This final category includes plants that simply lean against the surrounding vegeta-tion without any specialized attachment, often showing a limited range of develop-ment and small body size. Species tested do not show significant changes in mechan-ical properties from young to old stages (Table 2.1; Figure 2.3 and Figure 2.4). Thetwo woody dicotyledons, Lonicera xylosteum and L. myrtillus, which resemble“unstable shrubs” show high values of Estr in old stages with values of L. xylosteumamong the four stiffest stems tested of older stages. The small statured Clematisrecta also shows very similar values of Estr in both younger apical parts of the plantand older basal stages of development.
2.4 DISCUSSION
2.4.1 MECHANICAL PROPERTIES AND ATTACHMENT OF
DICOTYLEDONOUS CLIMBERS
All twiners, tendril climbers, and branch-angle climbers of dicotyledons show a dropof Estr from young to old stages of growth. These changes in mechanical propertiesprobably reflect a need for twining and tendril plants to be protected against extremeforces generated by movement of the host trees. Climbers that twine from one treeto another risk experiencing extremely high forces during high winds and after failureof branches and trunks. The twining strategy therefore requires highly compliantolder stems that can withstand severe stresses and strains. Being strongly attachedto a support also means that once the stem is attached, the part of the stem that isbelow the point of attachment has little need of stem stiffness to partially supportthe stem or lean against surrounding vegetation to retain its position. Mature trunksof large-bodied twining species are often so compliant that they hang in tensionfrom the point of attachment above. Such stems can have very low structural Young’smoduli as reflected in some of the values presented among twiners.
Tendrils can also form an extremely firm attachment to the host supports, butthe attachment is usually weaker than for stem twiners because the tendrilar organsare often derived from modified stipules, leaves, or fertile axes, which have narrowdiameters. Like stem twiners, tendril climbers also have little need of stem stiffnessin basal parts of the plant once they are firmly attached at many points.
Hook climbers are generally less firmly attached to the host plant than eitherstem twiners or tendril climbers. Hooks and curved spines can be effective meansof attaching to host supports, but attachment is constrained by the internal angle andlength of the hook. They can also be dislodged by movement of the host branches.Compared with twiners, hook climbers are considerably less firmly attached to thehost plant, particularly in young stages. Movement and swaying of the host plant
3209_C002.fm Page 53 Tuesday, November 8, 2005 8:18 AM
54 Ecology and Biomechanics
could potentially dislodge the climber from the support rather than exert extremestresses on the main stem as in twiners. Furthermore, relatively stiff, older partswould ensure that the plant stem would maintain its position in the vegetation eventhough one or more hooks had become unattached. After detachment, the youngapical part of the plant would remain in the vicinity of potential supports. This isquite different from the effect of removing the attachment from a mature or agingstem twiner because such stems can buckle and collapse in coils because of theirown weight. A hook-climbing strategy with relatively stiff older stems is probablyadopted by many different plant groups and with different developmental constraints[20]. Among the plants tested, two of the three woody plants, Bougainvillea andRosa, retain relatively high Young’s moduli in older stages of development, witheven higher values found in the old stages of Rosa. Interestingly, both climb via lessspecialized curved spines rather than acutely angled hooks. In species of Strychnostested from French Guiana, early growth of apical branches bear open hooks thatare green and sensitive to touch (Figure 2.6e). They can engage small-diametersupports, and the limb of the hook eventually thickens and closes around the sup-porting host branch. Strychnos, like all the dicotyledons that produce active attach-ment organs, shows a large reduction in Estr to just below 2000 MNm–2 from relativelylarge values of over 12,000 MNm–2 found in young stages.
Plants climbing via wide-angled branches show high values of Estr in youngstages, generally higher than those of twiners and consistent with the idea that youngstages of growth require stem stiffness for attachment. Wide-angled branches caninterlock with the branches of neighboring trees and provide very firm anchorage.It is important that young stages of growth be stiff and not deflect when the planthas established its climbing phase. The branch-angle climbers of Croton also showmarked drops in Estr toward the base of the plant. Even though the attachment is notas active as in tendril and twining species, branch anchorage can be very effectiveand can be coupled with very low values of Estr in old stems [21].
For the three plants grouped as leaning climbers, general observations indicatethat branches and leaves do not anchor the plant in the vegetation. We saw previouslythat the adult stems of Croton that were tested can be suspended from the hostcanopy via their wide-angled attachment and finally produce highly compliant wood.Unlike climbing species of Clematis, the petioles of C. recta do not twine extensivelyaround supports. Similarly the two leaning species of Lonicera tested differ fromthe more typical climbing species in that they do not twine around neighboringstems. All three plants produce little change in Estr from young to old stages ofdevelopment and from near the apex to the base. The values do remain relativelyhigh, and this kind of pattern has been termed “semi-self-supporting” [10]. Suchgrowth forms retain relatively stiff mechanical properties through their growth tra-jectory. They form little attachment with host vegetation apart from simply leaning.
Most dicotyledonous species that show a marked decrease in Estr during devel-opment, such as stem twiners and tendril climbers, have active attachment organs.The data also indicate that some species (e.g., Croton) that climb by wide-angledbranches are also capable of producing compliant wood. The production of brancheswith many potential points of anchorage might finally permit a firm connection withthe surrounding vegetation, but twining stems are always more firmly bound.
3209_C002.fm Page 54 Tuesday, November 8, 2005 8:18 AM

Diversity of Mechanical Architectures in Climbing Plants 55
Interestingly, both Strychnos and Croton eventually produce older stages of growthwith relatively low values of Estr. Recent studies have shown that these plants haverelatively extended “stiff” phases of development, and this is possibly linked to theirtype of attachment as well as other potential environmental factors such as lightavailability [9,20]. The type of attachment shown by these plants via many potentialpoints of attachment and the degree of security this affords to the climbing plantdiffers considerably from the mechanical constraints imposed by firmly twining orattaching via tendrils.
2.4.2 CLIMBING GROWTH STRATEGIES IN MONOCOTS AND OTHER
PLANTS WITHOUT SECONDARY GROWTH
In dicotyledonous species, the secondary growth leads to an increase in the secondmoment of area (I) and stem flexural stiffness (EI). The reduction of Estr duringdevelopment can be interpreted as a mechanical strategy that “compensates” for thisincrease in I and confers relative stem compliance. Despite the diversity of attach-ment modes, all the monocots tested, except for species of the rattan Calamus, showhigh values of Estr in old stages and otherwise little change in mechanical propertiesduring development. The latter can be explained by the structural constrains inherentto monocotyledons as a result of the absence of secondary growth. By retainingrelatively small stem diameters (i.e., a small I) in old stems, the monocots escapethis constraint and can, even with a high value of Estr remain compliant in olderstems, i.e., have a relatively small EI in old developmental stages [20,22]. The tendril-climbing species Smilax aspera also lacks secondary growth and shows an oppositetrend to other dicotyledonous tendril climbers, with an increase in structural Young’smodulus. Smilax aspera is a relatively lightly built, small-bodied plant rarely exceed-ing shrub level in its natural habitat (Figure 2.5e), and may therefore not be exposedto high stresses caused by the swaying of the host plants as would be the case forlarge tendril climbers. The branch-angle climber Ischnosiphon with its pencil-likestem has a peculiar growth form that relies largely on stem stiffness to maintainthe plant in position between points at which leaf-bearing nodes catch onto branchesof host plants. High stiffness from top to bottom is used throughout the life historyof the plant to ensure a weakly attached, partially leaning growth form. A similarstrategy is observed in the more diminutive lycopsid Lycopodiella cernua, whichhas very high values of Estr in near apical portions of their small stems that are onlyloosely supported by the wide-angled branches [9,23]. This plant also lacks second-ary tissues, but the primary tissues toward the base of the stem are more compliant.The developmental and ecological significance of the basal compliancy in Lycopodi-ella is not clear [9,20,23]. This herbaceous plant is self-supporting with climbingand horizontal or trailing axes. It is possible that the basal compliancy observed maypermit the plant to occupy a procumbent orientation by bending at the base if itbecomes detached from the surrounding herbs and shrubs. Many formerly uprightor leaning individuals end up as procumbent stems. If true, this is an interestingvariant of how herbaceous plants might use stem compliancy to avoid damage viamechanical stresses after movement and falling from host supports.
3209_C002.fm Page 55 Tuesday, November 8, 2005 8:18 AM
56 Ecology and Biomechanics
The palms tested climb via hook-like organs placed on modified frond tips (cirri)or modified inflorescence stalks (flagellae) that emerge from the leaf sheath. Twospecies of the South American genus Desmoncus show an actual increase in Estr
toward the base of the plant [22]. In the larger species, D. orthacanthos, old stageshave shed the outer leaf sheath and resemble canes. This stage of development doesnevertheless show relatively high values of Estr. With the exception of the two testedCalamus species, the other climbing palms in the Calamoideae, P. himalayana(Plectocominae) [24] also show high values of Estr in old stages. This is consistentwith the idea that hook climbers that are not firmly bound to host supports do notneed to develop high compliancy to survive movement of host branches. Instead,the relatively high stiffness of the stem ensures that the stems can retain theirorientation in the surrounding vegetation when movement of the host branches movesor detaches any hooks and grapnels from their points of attachment. Rattans arewonderful examples of how monocots can escape the structural constraints todevelop a comparable mechanical architecture as dicotyledonous lianas. Species ofCalamus can show a decrease in Estr toward the base, a trend typical of manydicotyledonous lianas. However, the values of old stages of Calamus measured arein the range of the highest values of old stages of dicotyledonous twiners but do notapproach the highly compliant properties of many other twiners.
Finally, future studies should incorporate studies based on hydraulic and mechan-ical properties of the stem. Many climbers show a reduction in structural Young’smodulus during ontogeny, and this might be consistent with a relative increase inlarge-diameter vessels and increased hydraulic conductivity at the expense of rela-tively stiff tissues in the wood. The developmental and ecological trade-offs betweenmechanical functioning (stem stiffness and support) and hydraulic conductivity arecomplex [29]. While increased vessel diameter might influence stem stiffness insome climbers, many dicotyledonous climbers show relative increases in othercompliant tissues during ontogeny such as rays and development of thinner-walledwood fibers. Such tissues are more easily interpreted as structural modifications thatincrease compliancy, resistance to fracture, and stem repair in vines and lianas.
2.4.3 ECOLOGICAL DIVERSITY OF CLIMBERS AMONG DIFFERENT
GROUPS
Climbing growth forms are common among woody families of angiosperms, rela-tively common among monocots, but much rarer in other groups, including gymno-sperms and ferns. The mechanical properties of climbing stems as well as the typeof attachment are undoubtedly coupled to a wide range of evolutionary constraintsamong different plant groups [19,20,26–29]. Most monocot climbers tested so farretain the relatively stiff properties of host location and initial stiff phase of growth.Such plants without secondary growth are unable to make the developmentallycomplex, though ecologically important, transition from high stiffness to high com-pliance of tissues. However, because of their small axial second moment of area,flexural stiffness also remains relatively low in old stems. Such climbing formsnevertheless occupy both small-bodied and large-bodied climbing niches and canshow important diverse modes of climbing attachment. Only species of Calamus,
3209_C002.fm Page 56 Tuesday, November 8, 2005 8:18 AM

Diversity of Mechanical Architectures in Climbing Plants 57
arguably the most diverse and specialized group of climbing monocots, show rela-tively low values of Estr of the inner stem, which produces flexible canes after theloss of the leaf sheath. This particular mechanical architecture in Calamus couldhave been an important innovation in the group and might explain its ecologicalsuccess in Southeast Asia.
2.5 CONCLUSIONS
Twining climbers that attach firmly to the host support eventually require substantialcompliance to escape stresses. Most of the climbing strategies require a stiff initialdevelopment to (a) get off the ground, (b) locate host supports, and (c) span distancesbetween host supports. A twining strategy would therefore require an initial phaseof stiff development followed by a later stage of compliant development. Thisrequires a relatively sophisticated change in stem development and is mostlyobserved among dicotyledonous angiosperms that possess a bifacial vascular cam-bium and produce a specialized type of highly compliant wood during later growth.Many of these wood types have been termed “anomalous wood” (or more recently,variant cambia), and produce a wide range of vascular configurations that oftenincorporate enhanced hydraulic conductance, wound repair, and mechanical com-pliance properties. Is high compliance necessary for all climbing habits? For firmlyattached twining plants that produce large diameter climbing axes, the answer isprobably yes. However, some kinds of hook climbing may require relatively stiffstems so that the plant stem will be more likely to sway onto another neighboringsupport rather than buckle and collapse.
In summary, climbing plants can show many types of attachment from firmlyattached twiners to less well attached hook climbers and to leaning plants. Bendingmechanical properties of the stem and its change during development can differbetween these categories: Twining climbers tend to produce lower values of Estr inolder stages of development than other more loosely attached climbers. This isprobably because firm attachment to host plants requires high compliancy to survivemovement of the host plant. Other niches linked to more loosely attached climbingmodes are open to a wider range of plant groups and do not require high compliancyin older growth stages. This type of climbing strategy has been adopted by a widerange of plant groups, notably monocotyledons.
REFERENCES
1. Schnitzer, S.A. and Bongers, F., The ecology of lianas and their role in forests, TREE,17, 223, 2002.
2. Rowe, N.P. and Speck T. Plant growth forms: an ecological and evolutionary per-spective, New Phytol., 166, 61, 2005.
3. Phillips, O.L. et al., Increasing dominance of large lianas in Amazonian forests,Nature, 418, 770, 2002.
4. Wright, S.J., Calderón, O., Hernandéz, A., and Paton, S., Are lianas increasing inimportance in tropical forests? A 17 year record from Panama, Ecology, 85, 484, 2004.
3209_C002.fm Page 57 Tuesday, November 8, 2005 8:18 AM

58 Ecology and Biomechanics
5. Putz, F.E. and Mooney, H.A. (Eds.), The Biology of Vines, Cambridge UniversityPress, Cambridge, 1991.
6. Speck, T., Bending stability of plant stems: ontogenetical, ecological, and phyloge-netical aspects, Biomimetics 2, 109, 1994.
7. Rowe, N.P. and Speck T., Biomechanical characteristics of the ontogeny and growthhabit of the tropical liana Condylocarpon guianense (Apocynaceae), Int. J. Plant Sci.157, 406, 1996.
8. Speck T. et al., How plants adjust the “material properties” of their stems accordingto differing mechanical constraints during growth: an example of smart design innature, in Bioengineering. Proceedings of the 1996 Engineering Systems Design andAnalysis Conference, Engin, A.E., Ed., PD-Vol. 77, Vol. 5. The American Society ofMechanical Engineers, New York, 1996, p. 233,.
9. Rowe, N.P. and Speck T., Biomechanics of plant growth forms: the trouble with fossilplants, Rev. Palaeobot. Palynol., 102, 43, 1998.
10. Speck, T. and Rowe, N.P., A quantitative approach to analytically defining size, formand habit in living and fossil plants, in The Evolution of Plant Architecture, Hemsley,A.R. and Kurmann, M., Eds., Royal Botanical Gardens, Kew, UK, 1999, p. 447.
11. Hegarty E.E., Vine-host interactions, in The Biology of Vines, Putz, F.E. and Mooney,H.A., Eds., Cambridge University Press, Cambridge, 73, 1991.
12. Fisher, B. and Ewers, F.W., Structural responses to stem injury in vines, in The Biologyof Vines, in Putz, F.E. and Mooney, H.A., Eds., Cambridge University Press, Cam-bridge, 99, 1991.
13. Wainwright, S.A., Biggs, W.D., Currey, J.D., and Gosline, J.M., Mechanical Designin Organisms, John Wiley, New York. 1976.
14. Niklas, K.J., Plant Biomechanics, an Engineering Approach to Plant Form andFunction, The University of Chicago Press, Chicago, 1992.
15. Gallenmüller, F., Müller, U., Rowe, N.P., and Speck, T., The growth form of Crotonpullei (Euphorbiaceae) — Functional morphology and biomechanics of a neotropicalliana, Pl. Biol., 3, 50, 2001.
16. Vincent, J.F.V., Structural Biomaterials, Princeton University Press, London, 1990.17. Vincent, J.F.V., Plants, in Biomechanics — Material: A Practical Approach, Vincent,
J.F.V., ed., IRL Press, Oxford, 1992, p. 165.18. Bodig, J. and Jayne, B.A., Mechanics of Wood and Wood Composites, Krieger Pub-
lishing Company, Malabar, FL, 1993.19. Speck, T. et al., The potential of plant biomechanics in functional biology and
systematics, in Deep Morphology: Toward a Renaissance of Morphology in PlantSystematics, Stuessy, T.F., Mayer, V.,and Hörandl, E, Eds., Koeltz, Königstein, 2003,p. 241,.
20. Rowe, N.P., Isnard, S., and Speck, T., Diversity of mechanical architectures in climb-ing plants: an evolutionary perspective, J. Plant Growth Regul., 23, 108, 2004.
21. Gallenmüller, F., Rowe, N.P. and Speck, T., Development and growth form of theneotropical liana Croton nuntians: the effect of light and mode of attachment on thebiomechanics of the stem, J. Plant Growth Regul., 23, 83, 2004.
22. Isnard, S., Speck, T., and Rowe, N.P., Biomechanics and development of the climbinghabit in two species of the South American palm genus Desmoncus (Arecaceae). Am.J. Bot., 92, 1444, 2005
23. Rowe, N.P. and Speck, T., Biomechanics of Lycopodiella cernua and Huperziasquarrosa: implications for inferring growth habits of fossil small-bodied Lycopsids,Med. Ned. Ins. Toeg. Geo. TNO., 58, 290, 1997.
3209_C002.fm Page 58 Tuesday, November 8, 2005 8:18 AM

Diversity of Mechanical Architectures in Climbing Plants 59
24. Isnard, S., Biomechanics and development of rattans: what is special about P. hima-layana?, Bot. J. Linn. Soc., (in press) 2006.
25. Traiser, C., Reidelstrüz, P., and Speck, T., Biomechanische, anatomische und mor-phologische Untersuchungen verschiedener Wuchsformtypen der Gattung LoniceraL. Mitt. Bad. Landesver. Naturkunde u. Naturschutz N.F., 17, 123, 1998.
26. Civeyrel, L. and Rowe, N.P., Phylogenetic relationships of Secamonoideae based onthe plastid gene matK, morphology and biomechanics, Ann. Missouri Bot. Gard., 88,583, 2001.
27. Isnard, S., Speck, T., and Rowe, N.P. Mechanical architecture and development inClematis: implications for canalised evolution of growth forms, New Phytol., 158,543, 2003.
28. Lahaye, R., Civeyrel, L., Speck, T., and Rowe, N.P., Evolution of shrub-like growthforms in the lianoid sub family Secamonoideae (Apocynaceae s.l.) of Madagascar:phylogeny, biomechanics and development. Am. J. Bot., 92, 1381, 2005.
29. Rowe, N.P. and Speck, T., Hydraulics and mechanics of plants: novelty, innovationand evolution, in The Evolution of Plant Physiology, Poole, I. and Hemsley, A.R.,Eds., Elsevier Academic Press, Kew, 2004, p. 297.
3209_C002.fm Page 59 Tuesday, November 8, 2005 8:18 AM


61
3 The Role of Blade Buoyancy and Reconfiguration in the Mechanical Adaptation of the Southern Bullkelp Durvillaea
Deane L. Harder, Craig L. Stevens, Thomas Speck, and Catriona L. Hurd
CONTENTS
3.1 Introduction ....................................................................................................623.1.1 The Intertidal Zone ............................................................................623.1.2 The Southern Bullkelps Durvillaea antarctica and D. willana ........623.1.3 Drag and Streamlining .......................................................................643.1.4 Objectives ...........................................................................................65
3.2 Material and Methods ....................................................................................653.2.1 Tested Seaweeds.................................................................................653.2.2 Drag Forces ........................................................................................663.2.3 Shortening Experiments.....................................................................673.2.4 Drag Coefficients and Reconfiguration .............................................673.2.5 Buoyancy............................................................................................683.2.6 Field Studies.......................................................................................683.2.7 Morphological Survey........................................................................693.2.8 Statistical Analysis .............................................................................69
3.3 Results ............................................................................................................703.3.1 Drag Forces ........................................................................................703.3.2 Shortening Experiments.....................................................................703.3.3 Drag Coefficients and Reconfiguration .............................................723.3.4 Vogel Number ....................................................................................723.3.5 Buoyancy............................................................................................73
3209_C003.fm Page 61 Thursday, November 10, 2005 10:44 AM

62 Ecology and Biomechanics
3.3.6 Field Studies.......................................................................................733.3.7 Morphological Survey........................................................................74
3.4 Discussion ......................................................................................................743.4.1 Drag Forces ........................................................................................743.4.2 Drag Coefficients, Reconfiguration, and the Vogel Number.............783.4.3 Buoyancy and Field Studies ..............................................................803.4.4 Morphological Survey........................................................................81
3.5 Conclusion......................................................................................................82Acknowledgments....................................................................................................82References................................................................................................................82
3.1 INTRODUCTION
3.1.1 THE INTERTIDAL ZONE
The intertidal habitat is mechanically very demanding [1]. High flow rates (greaterthan 25 m s–1) and accelerations (greater than 500 m s–2) require special mechanicaladaptations by intertidal organisms [2–8]. In general, it is advantageous to minimizethe overall size to avoid excessive wave-induced forces [9]. Intertidal seaweeds,however, deviate from this pattern. Based on common presumptions of how forcesscale with size, this group seems to be oversized [9].
Seaweeds can adapt their mechanical properties in response to ambient waveclimates [2,4,7]. Possibly even more important, seaweeds are very flexible and canchange their overall shape [3,5,6,8]. By streamlining, seaweeds are able to reducethe magnitude of acting forces that can potentially be generated at high velocities[10–12]. The overall goal of this study was to quantify the process of streamliningand reconfiguration and to assess the importance of the positively buoyant laminain the large intertidal seaweed Durvillaea.
3.1.2 THE SOUTHERN BULLKELPS DURVILLAEA ANTARCTICA AND
D. WILLANA
The southern bull kelp Durvillaea is a member of the Fucales [13]. Its morphologyis typical for large brown seaweeds with a holdfast, a stalklike stipe, a transitionarypalm zone at the apical end of the stipe, and a large blade. Unlike other membersof the Fucales, growth in Durvillaea is not restricted to a small apical meristematiczone but is diffuse [14]. The distribution of Durvillaea is confined to the Southernhemisphere where it grows on temperate rocky shores [15].
Durvillaea is the largest intertidal seaweed in the world. Individuals with a lengthof greater than 13 m [16] and a mass of more than 80 kg (C. Hurd, unpublisheddata) have been recorded. This genus can thrive even in the harsh conditions of thewave-swept surf zone. Moreover, it needs at least a moderate wave exposure for thesuccessful establishment at a particular site [14].
Durvillaea antarctica occurs along the coasts of New Zealand, Chile, and somesub-Antarctic islands [15]. Its size and morphology are highly dependent on theambient wave climate [15,17]. Three morphotypes can be identified [15]
3209_C003.fm Page 62 Thursday, November 10, 2005 10:44 AM

The Role of Blade Buoyancy and Reconfiguration in Durvillaea 63
(Figure 3.1). At wave-sheltered sites, the overall morphology of the blade is broadand cape-like, with undulating edges (Figure 3.1A, left). At more wave-exposedsites, the blade becomes flatter and subdivided into many whip-like thongs (Figure3.1B, right). At extremely wave-exposed sites, the stipe becomes longer, the bladeshorter, and the overall morphology is stunted [15]. The morphology of D. antarcticais therefore a qualitative measure of the predominant wave exposure at a particularsite.
The medulla of the blade of D. antarctica consists of gas-filled sacs [14], whichmake the whole blade positively buoyant (Figure 3.2C). At low tide, the photosyn-thetically active area can therefore be maximized as the blade floats at the surfacewhile minimizing self-shading [18]. The thickness of the medulla is not uniform butis dependent on a variety of factors such as wave exposure, age, and overall mor-phology (C. Hurd, unpublished data). The thallus of D. antarctica can consequentlybe very voluminous at a comparatively low weight.
The congeneric species D. willana is endemic to New Zealand. In general, thestipe is larger and stiffer and bears lateral secondary blades of smaller size in additionto the apical main blade [19]. If the main blade is lost as a result of failure, one of
FIGURE 3.1 The morphology of Durvillaea antarctica is highly dependent on wave expo-sure. (A) At comparatively sheltered sites, the blade becomes broad and undulating. (B) Ifwave exposure is more severe, the blade is subdivided into many whip-like thongs. The overalllength of the blade is approximately 5 to 7 m in both photographs.
FIGURE 3.2 (A) The blade of D. antarctica is positively buoyant so the lamina is floatingat the water surface, whereas (B) the blade of D. willana is neutrally buoyant, so that thelamina is upright in the water column. (C) The medulla of D. antarctica contains honeycomb-shaped, gas-filled sacs.
A B
A
B C
5 cm
3209_C003.fm Page 63 Thursday, November 10, 2005 10:44 AM
64 Ecology and Biomechanics
the lateral blades can increase in size considerably. Durvillaea willana commonlyform a belt in the intertidal–subtidal zone just below the belt of D. antarctica.Sometimes stands of the two Durvillaea species will be mixed. The ecological rangeof D. willana, however, seems to be more restricted than for D. antarctica, becausethis species is absent at sites of very severe wave exposure and also at sites ofmoderate wave exposure, where populations of D. antarctica can still exist.
The main morphological–anatomical difference between the two species ofDurvillaea is the makeup of the blade. With D. antarctica, the blade is positivelybuoyant and has the tendency to float at the water’s surface (Figure 3.2A). Unlikemany other seaweeds, e.g., Macrocystis pyrifera or Ascophyllum nodosum, the entiremedulla of the blade of D. antarctica is gas-filled rather than only the pneumatocysts.The blade of D. willana lacks the honeycomb-shaped, gas-filled sacks of the medulla.As a consequence, the blade of D. willana is neutrally buoyant and floats uprightin the water column if no wave action or currents are present (Figure 3.2B) and isgenerally not as bulky as the blade of D. antarctica. A difference in the way thesetwo species react to flow-induced loading can therefore be expected.
3.1.3 DRAG AND STREAMLINING
Commonly, drag is determined by [20]:
(3.1)
where
Fd = drag force (N)= density of the fluid (kg m–3)
Ac = characteristic area of the drag-producing body [m2]Cd = drag coefficientur = fluid’s velocity relative to an object [m s–1] (cf. Figure 3.3)
With flexible organisms, it is commonly observed that the drag coefficient is notconstant but changes with increasing velocity as the body reconfigures itself[10,21,22]. Consequently, comparisons between different individuals or differentspecies often are restricted to a certain velocity [6,11]. Additionally, a constant dragcoefficient typically does not yield the expected increase of drag with the velocitysquared [23]. The process of reconfiguration, which leads to a lower increase ofdrag than would be expected, is described by Vogel [24,25]. The deviation from asecond-power relation between drag and velocity is maintained by the introductionof a “figure of merit” as an addend in the power function. Since the shape is notconstant, a more general shape factor can be introduced, leading to the followingextended equation for drag [6]:
(3.2)
F A C ud c d r= 12
2
F A S ud c d rB= +1
22
3209_C003.fm Page 64 Thursday, November 10, 2005 10:44 AM

The Role of Blade Buoyancy and Reconfiguration in Durvillaea 65
where Sd is the shape coefficient and B is the figure of merit. For clarity andsimplicity, Gaylord et al. [10] have introduced the term “Vogel number” for thisfigure of merit, which is used henceforth in this study.
The more negative the Vogel number, the lower is the increase in drag withincreasing velocity. It is therefore a means of quantifying the effect of reconfiguration.
3.1.4 OBJECTIVES
The aim of this study was to examine how Durvillaea spp. are adapted to the surfzone with its various degrees of wave exposure. This was mainly done by measuringdrag forces on entire thalli in a flume and in the field and by quantifying the processof reconfiguration of the blade. Accompanying tests yielded information on thebuoyancy, acceleration, and the way different forces act together in D. antarcticaand D. willana. These findings were then related to a field survey of several mor-phological parameters.
3.2 MATERIAL AND METHODS
3.2.1 TESTED SEAWEEDS
For flume experiments, a total of eight individual specimens of D. antarctica andtwo individual specimens of D. willana were haphazardly collected from BrightonBeach, New Zealand (46° S, 170° E), during low tide on June 25, 2002 and July26, 2002. They were transported to a nearby laboratory in Dunedin, New Zealand,and tested within 24 hr. Prior to the tests in a flume, the morphometrical parametersof length, mass, volume, and planform area of the blade of the harvested seaweedswere recorded (Table 3.1). The overall length was measured with a tape measure tothe nearest centimeter. The mass was measured to the nearest 0.1 kg by placing theseaweeds in a basket and attaching a spring balance. The volume was determinedby immersing the seaweeds in a barrel of seawater and weighing the displaced
FIGURE 3.3 A simple model of the resulting net force on a seaweed stipe if force due todrag and buoyancy are superimposed.
Fbuoyancy Fnet
Fdrag
Flow
3209_C003.fm Page 65 Thursday, November 10, 2005 10:44 AM

66 Ecology and Biomechanics
amount of water to the closest 0.1 kg. The mass of the displaced water was thendivided by the density of seawater (1024 kg m–3), giving the volume. The planformarea of the seaweeds was determined by photographing the fully extended blade.Because there was no suitable point of elevation for taking an orthographic imagefrom exactly above the spread out individuals, photographs were taken at an angle.The images were then photogrammatically rectified with a vector-based programroutine (MatLab version 12, The Mathworks) to account for and correct the distor-tions introduced by photographing at an angle. Subsequently, the planform area wasanalyzed with an image analysis program (Optimas version 6.5, Media Cybernetics).The recorded morphometrical parameters were then correlated with the drag forceson the seaweeds.
3.2.2 DRAG FORCES
Drag forces were tested in a flume at the Human Performance Centre, Dunedin. Thedimensions of the flume — length, width, and depth — were 10, 2.5, and 1.4 m,respectively. The tests were conducted at flow velocities of 0.5, 1.0, 2.0, and 2.8 ms–1, the latter being the maximum velocity of the flume. The forces and concurrentflow velocities of each test run were logged by an online data recorder for at least2 min at a logging frequency of 10 Hz. To see if high-frequency events occurred,three individuals were logged at a frequency of 1000 Hz. As the flume at the “HumanPerformance Centre” could not be run with highly corrosive sea water, the drag testswere conducted in freshwater. Since Durvillaea is an intertidal seaweed and fre-quently experiences rain water, a temporary exposure to freshwater of 10–15 minuteswas not considered to change the seaweed’s mechanical performance, and no obvioussigns of changes in appearance were observed.
TABLE 3.1Morphometrical Data of the Eight Individuals of Durvillaea antarctica(Specimens I to VIII) and the Two Individuals of D. willana (Specimens IX and X) Tested in the Flume
Individual Morphology Length (m) Area (m2) Mass (kg)Volume
(10–3 m3)
I Exposed 4.97 1.70 23.5 38.0II Exposed 7.15 1.52 17.5 38.0III Exposed 3.10 1.25 8.5 22.5IV Exposed 4.25 1.65 22.0 23.3V Intermediate 7.49 2.52 51.0 92.8VI Intermediate 2.18 1.07 2.5 7.0VII Intermediate 3.80 1.26 9.0 13.5VIII Sheltered 6.40 1.46 15.5 27.0IX Intermediate 6.03 1.55 18.5 17.8X Intermediate 0.35 1.01 0.4 0.4
3209_C003.fm Page 66 Thursday, November 10, 2005 10:44 AM
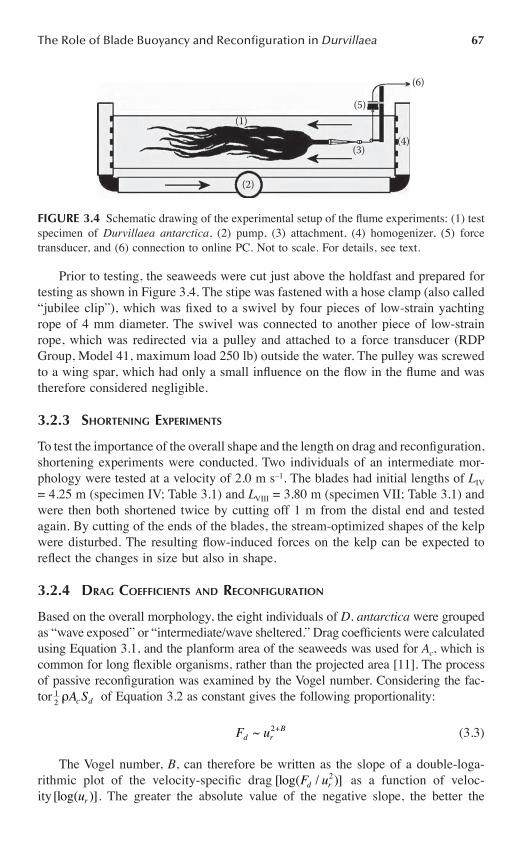
The Role of Blade Buoyancy and Reconfiguration in Durvillaea 67
Prior to testing, the seaweeds were cut just above the holdfast and prepared fortesting as shown in Figure 3.4. The stipe was fastened with a hose clamp (also called“jubilee clip”), which was fixed to a swivel by four pieces of low-strain yachtingrope of 4 mm diameter. The swivel was connected to another piece of low-strainrope, which was redirected via a pulley and attached to a force transducer (RDPGroup, Model 41, maximum load 250 lb) outside the water. The pulley was screwedto a wing spar, which had only a small influence on the flow in the flume and wastherefore considered negligible.
3.2.3 SHORTENING EXPERIMENTS
To test the importance of the overall shape and the length on drag and reconfiguration,shortening experiments were conducted. Two individuals of an intermediate mor-phology were tested at a velocity of 2.0 m s–1. The blades had initial lengths of LIV
= 4.25 m (specimen IV; Table 3.1) and LVIII = 3.80 m (specimen VII; Table 3.1) andwere then both shortened twice by cutting off 1 m from the distal end and testedagain. By cutting of the ends of the blades, the stream-optimized shapes of the kelpwere disturbed. The resulting flow-induced forces on the kelp can be expected toreflect the changes in size but also in shape.
3.2.4 DRAG COEFFICIENTS AND RECONFIGURATION
Based on the overall morphology, the eight individuals of D. antarctica were groupedas “wave exposed” or “intermediate/wave sheltered.” Drag coefficients were calculatedusing Equation 3.1, and the planform area of the seaweeds was used for Ac, which iscommon for long flexible organisms, rather than the projected area [11]. The processof passive reconfiguration was examined by the Vogel number. Considering the fac-tor of Equation 3.2 as constant gives the following proportionality:
(3.3)
The Vogel number, B, can therefore be written as the slope of a double-loga-rithmic plot of the velocity-specific drag as a function of veloc-ity . The greater the absolute value of the negative slope, the better the
FIGURE 3.4 Schematic drawing of the experimental setup of the flume experiments: (1) testspecimen of Durvillaea antarctica, (2) pump, (3) attachment, (4) homogenizer, (5) forcetransducer, and (6) connection to online PC. Not to scale. For details, see text.
(5)
(6)
(4)(3)
(2)
(1)
12
A Sc d
F ud rB~ 2+
[log( / )]F ud r2
[log( )]ur
3209_C003.fm Page 67 Thursday, November 10, 2005 10:44 AM

68 Ecology and Biomechanics
reconfiguration process was considered to be. The Vogel number was subsequentlycorrelated with the previously recorded morphometrical parameters.
3.2.5 BUOYANCY
To measure the buoyancy forces generated by the gas-filled medulla of D. antarctica,10 individuals were haphazardly collected from Brighton Beach on July 23, 2002.All measurements were carried out at the beach so that all replicates were fresh andweight reduction due to desiccation effects could be ruled out. To test the forcesexerted by the buoyancy of the blades, thalli cut at the stipe were submerged byplacing a neutrally buoyant plastic mesh container upside down over the kelp in aseawater-filled barrel. The force necessary to keep the container with the kelp atwater level was measured with a spring scale attached to a metal rod, which wasused to push the container with the kelp down, and taken as the buoyancy of thetested individual. To analyze the correlation of exerted buoyancy forces with mor-phometrical parameters, the overall length, planform area, and fresh weight of thetested kelp were also determined.
3.2.6 FIELD STUDIES
Because of their morphological differences, the mechanical behavior in situ of D.antarctica and D. willana can be expected to differ. The effect of the buoyancy ofthe blade can be gauged by examining the simultaneous response of D. antarcticaand D. willana to waves. Field experiments studying D. antarctica and D. willanaunder natural conditions were conducted at St. Clair, a suburban beach near Dunedin,during the period January 18 to 28, 2000 [26]. The sampling all took place at St.Clair seawall. This site is characterized by a rocky shoaling platform backed by aseawall. The beach boulders were in the range of 0.2 to 0.6 m in diameter. It is notdirectly exposed to open ocean surf, and waves occasionally broke directly in thisregion; more often, the waves broke slightly offshore and then would rush in as abore. A local D. antarctica population was located some 10 m offshore from thesite of the experiments, whereas D. willana did not occur there.
Samples of D. antarctica and D. willana of intermediate morphology were takenfrom Lawyers Head, a rocky outcrop about 3 km away, using a chisel to remove thethalli from the substratum. The harvested individuals were then mounted in smallconcrete blocks, which were then attached to a region of flat substratum using eightself-fastening metal bolts (dynabolts) and four webbing belts with ratchet locks. Equip-ment used included three-dimensional accelerometry (Figure 3.5) and wave gauges(see [26] for methodological details). The tidal range during the experiments was 2 m.
The accelerometers were calibrated before and after each experiment. This wasnecessary because the long cables (greater than 40 m) affected nominal factorycalibration. The wave gauge data can only be considered representative of waveheight, and the arrival time of the waves depended on the relative position to theplants. The wave gauge was guyed to dynabolts to hold it securely in position. Thewave gauge data were logged using a Tattletale® logger (Onset Computer Corpo-ration) running at 32 Hz.
3209_C003.fm Page 68 Thursday, November 10, 2005 10:44 AM

The Role of Blade Buoyancy and Reconfiguration in Durvillaea 69
3.2.7 MORPHOLOGICAL SURVEY
To compare the morphology of individuals of D. antarctica and D. willana withdifferent degrees of wave exposure, we conducted a field survey at St. Kilda Beach,a suburban beach near Dunedin, in February 1999. Quadrats (1 × 1 m) were randomlyplaced within stands of kelp of both D. antarctica and D. willana. The wave exposuretypical of any particular quadrat was qualitatively determined by the predominantblade morphology of the kelp growing within the quadrat. Thus, individuals of bothspecies were categorized as either “wave exposed” or “wave sheltered.” Factored byspecies and wave exposure, four random quadrats were used to sample each of thefour groups, giving a total of 16 quadrats (D. antarctica: sheltered/exposed; D.willana: sheltered/exposed). All individuals of either Durvillaea species growingwithin a quadrat were harvested and four morphological parameters were recorded.Measurements of the blade length, stipe length, and maximum stipe diameter wereused to examine possible correlations between these three morphological parametersand the species or wave exposure as indicated by the forth parameter, blade mor-phology.
3.2.8 STATISTICAL ANALYSIS
Statistical tests were performed with SPSS, version 12.0, and SigmaPlot, SPSS,version 8. Differences between two groups were determined by Welch’s t-test,adapted to unequal variances. Statistical tests were considered significant at a levelof p <0.05. The results are either presented with ±0.1 standard deviation (SD) orthe 95% confidence interval (CI) as indicated. Results of correlation tests are pre-sented with Pearson’s adjusted R2.
FIGURE 3.5 A three-dimensional accelerometer was mounted within a cut section in thepalm of the Durvillaea blade. A second accelerometer was attached at the distal end of thelamina.
y
z
x
Accelero-meter
Stipe
Palm
3209_C003.fm Page 69 Thursday, November 10, 2005 10:44 AM

70 Ecology and Biomechanics
3.3 RESULTS
3.3.1 DRAG FORCES
In general, the drag increased with increasing velocity (Figure 3.6). The variationin data also increased with increasing velocity. No transient drag peaks wereobserved at the higher recording frequency of 1000 Hz, and so the lower recordingfrequency of 10 Hz was sufficient for capturing all relevant velocity-dependentchanges in drag forces. The highest recorded forces during the flume tests werealmost 300 N for the two largest individuals (i.e., individuals II and V in Table 3.1).The increase, however, often deviated from the second power of the velocity aspredicted by the standard equation for drag (Equation 3.1) and was nearly linear.
Correlation tests of drag and the four measured morphometrical parameters forflume specimens yielded only low correlation coefficients (Figure 3.7). The bestcorrelation with drag was found with length (R2
length = 0.63). Planform area and massboth showed a slightly lower correlation with drag (R2
area = 0.58 and R2mass = 0.58),
whereas only a poor correlation was found between drag and volume (R2volume =
0.36). The correlations, however, improved considerably by taking the wave-depen-dent morphology as an additional independent variable into account so that thecombined information on length and wave-dependent morphology of individuals(exposed or intermediate/sheltered) gave the best correlation with the measured dragforces (R2
length + wave exposure = 0.71).
3.3.2 SHORTENING EXPERIMENTS
The shortening experiments for D. antarctica in the flume yielded a nonlinearrelation between drag and each of the four measured morphometrical parameters(Figure 3.8). A linear reduction in length caused a reduction in drag that was less
FIGURE 3.6 The relation between force and velocity for the eight individuals of Durvillaeaantarctica tested in a flume. FDrag is the drag force, and u is the velocity. Error bars indicatestandard deviations of 60 s of data, recorded at 10 Hz (i.e., 600 data points).
300
250
200
150
100
50
0
F Dra
g (N
)
0.0 0.5 1.0 1.5 2.0 2.5u (ms−1)
3209_C003.fm Page 70 Thursday, November 10, 2005 10:44 AM

The Role of Blade Buoyancy and Reconfiguration in Durvillaea 71
FIGURE 3.7 There was a significant correlation between drag and length (R2 = 0.63), whereasonly weak or nonsignificant correlations were found between drag and blade mass, volume,or area. The morphometric parameters and the forces were normalized by the values for thelargest individual, which was also the heaviest and most voluminous one of the test sample.The regression is only for the normalized length data, while the dashed lines represent the95% CI.
FIGURE 3.8 Shortening experiment with two individual D. antarctica (specimens VII andIV; Table 3.1) tested at a velocity of 2.0 m s–1. The nonlinear trend between drag and velocityindicates that a simple cut prevents the thallus body from reconfiguring into a more streamlinedshape. The parameters are normalized to the maximum forces during the individual test runsand the individual lengths for ease of comparison. Error bars indicate standard deviations of60 s of data, recorded at 10 Hz (i.e., 600 data points).
Correlation with length:y = 0.92x + 0.01
R2 = 0.63LengthMassVolumeArea
1.0
0.8
0.6
0.4
0.2
0.0
Nor
mal
ized
forc
e
0.0 0.2 0.4 0.6 0.8 1.0Normalized parameter
1.0
0.9
0.8
0.7
0.6
0.5
Nor
mal
ized
forc
e
0.5 0.6 0.7 0.8 0.9 1.0Normalized length
LVII = 3.80 mLIV = 4.25 m
3209_C003.fm Page 71 Thursday, November 10, 2005 10:44 AM

72 Ecology and Biomechanics
than would be predicted if the relation between a morphological parameter and dragwas linear (see previous paragraph) or squared (Equation 3.1).
3.3.3 DRAG COEFFICIENTS AND RECONFIGURATION
Drag coefficients of the tested seaweeds were highly dependent on velocity (Figure3.9). The mean of the drag coefficients decreased hyperbolically with increasingvelocity, using Equation 3.1 and keeping Ac constant. At all tested velocities, themean drag coefficients of the group with wave-exposed morphology were alwayslower than the ones of the group with intermediate/wave-sheltered morphology. Theminimum mean drag coefficient was found for the wave-exposed group at a velocityof 2.8 m s–1 at Cd = 0.023. The maximum mean drag coefficient was recorded forthe intermediate/wave-sheltered group at a velocity of 0.5 m s–1 at Cd = 0.147. Thevariation in Cd expressed by the standard deviation decreased for both groups withincreasing velocity.
3.3.4 VOGEL NUMBER
The efficiency of passive reconfiguration processes of individual seaweeds wascharacterized by the Vogel number. All tested individuals exhibited an increase indrag with increasing velocity that was less than could be expected from Equation3.1. Vogel numbers ranged from a maximum of B = –0.25 to a minimum of B = –1.21,with an average of B = –0.86 ± 0.31 (mean ± 1 SD). Grouped by morphology, thewave-exposed individuals averaged a lower Vogel number than the intermedi-ate/wave-sheltered individuals (B = –1.08 ± 0.15 and B = –0.65 ± 0.28, respectively),i.e., the wave-exposed individuals performed with a significantly more efficient modeof streamlining (Welch’s t-test, p <0.05).
FIGURE 3.9 The change of the drag coefficient, Cd, with increasing velocity of the fluid (u)for Durvillaea antarctica, grouped by wave-exposed and intermediate/wave-sheltered mor-phology. Error bars indicate one standard deviation.
0.25
0.20
0.15
0.10
0.05
0.000.0 0.5 1.0 1.5 2.0 2.5 3.0
Velocity (ms−1)
Cd
Exposed morphologyIntermediate/sheltered morphology
3209_C003.fm Page 72 Thursday, November 10, 2005 10:44 AM

The Role of Blade Buoyancy and Reconfiguration in Durvillaea 73
The Vogel number could be correlated best with the mass of an individual (R2mass
= 0.84) (Figure 3.10). The other tested morphometrical parameters — volume, length,and planform area — yielded lower correlation coefficients (R2
volume = 0.56, R2length =
0.32, and R2area = 0.77). The correlation could be improved by considering the overall
morphology as an additional independent variable (e.g., R2mass + wave exposure = 0.97).
3.3.5 BUOYANCY
For the sample of 10 individuals of D. antarctica, the highest recorded force due tobuoyancy was about 150 N. Buoyancy could be correlated best with blade mass(R2
mass = 0.94) (Figure 3.11) and correlated well with blade area (R2area = 0.79),
whereas the blade length yielded a low correlation coefficient (R2length = 0.09).
3.3.6 FIELD STUDIES
Accelerometers provided a proxy for frond motion [26]. Time series of water ele-vation data and accelerometer data (Figure 3.12) showed marked differences. Theforcing of the tested individuals by the waves was obviously complex (Figure 3.12a).Despite the wave field being visually well ordered with contiguous crests arrivingat regular intervals, the direct observations revealed a complicated distribution ofpeaks and troughs. There were substantial differences in response of the two speciesto waves as well as differences in how the regions of the frond reacted. In particular,D. antarctica (Figure 3.12, samples 1 and 2) exhibited far sharper “shock-like”responses, lasting only a fraction of a second (sampling at 10 Hz) than those exhibitedby D. willana (Figure 3.12, samples 3 and 4). The D. antarctica response was notparticularly different on the palm compared with the blade. In contrast, the acceler-ometers attached to D. willana on the palm (Figure 3.12, samples 3) and blade
FIGURE 3.10 Correlation of the Vogel number, B, with the mass of the tested seaweeds.The black oblique line indicates the regression, while the dashed black lines are the 95% CIfor the linear regression. The gray horizontal line indicates the mean at B = 0.86 for all testedindividuals, while the dashed gray horizontal lines represent the 95% CI.
x = −0.86
R2 = 0.84
0 10 20 30 40 50 Mass (kg)
0.0
−0.2
−0.4
−0.6
−0.8
−1.0
−1.2
−1.4
−1.6
B
3209_C003.fm Page 73 Thursday, November 10, 2005 10:44 AM

74 Ecology and Biomechanics
(Figure 3.12, samples 4) showed a slower response than D. antarctica and differedfrom one another. The palm response of the D. willana sample could only weaklybe visually correlated with the wave gauge record.
3.3.7 MORPHOLOGICAL SURVEY
For D. antarctica (N = 131) from wave-exposed (N = 76) and wave-sheltered sites(N = 55), the blade length was weakly correlated with stipe diameter (Figure 3.13),and no correlation was found between blade length and stipe length (Figure 3.14).For D. willana (N = 102) from wave-exposed (N = 38) and wave-sheltered sites (N= 64), there were clear correlations between blade length and both stipe diameter(Figure 3.13) and stipe length (Figure 3.14).
3.4 DISCUSSION
3.4.1 DRAG FORCES
The way drag acts on an intertidal seaweed like Durvillaea changes as the algalbody is moved by a wave. A passing wave agitates water particles in a circularorbital motion. As the water depth decreases near shore, the circular motion becomesmore and more elliptical [23]. In shallow water, waves can thus cause a simple backand forth swaying of seaweeds. This swaying can be described for both Durvillaeaspecies by two extreme states and a series of intermediate (“midsway”) positions.
1. The algal body is stretched normal to the oncoming wave and against thedirection of the upstream flow. The characteristic area is then the projected
FIGURE 3.11 Correlation between the mass and buoyancy for 10 individuals of D. antarc-tica. The black oblique line indicates the regression, while the black dashed lines are the 95%CI for the linear regression. The gray horizontal line indicates the mean for all tested indi-viduals, while the dashed horizontal lines represent the 95% CI.
0 10 20 30 40 50
180
160
140
120
100
80
60
40
Buoy
ancy
(N)
Mass (kg)
x = 68
R2 = 0.94
3209_C003.fm Page 74 Thursday, November 10, 2005 10:44 AM

The Role of Blade Buoyancy and Reconfiguration in Durvillaea 75
area. Mainly pressure drag is acting on the seaweed, pushing its bodydownstream. As Durvillaea is reacting to the drag, it starts to reconfigureits blade relative to the flow, exposing more and more area normal to theflow direction.
2. Midway between the extremes, the algal body is comparatively uprightin the water column. The main area of the blade is thus normal to theflow. Subsequently, pressure drag is acting on a large surface. Althoughdrag could be expected to be high, the resulting tensional forces will below as long as the blade can deflect further (“going with the flow”) [27].
FIGURE 3.12 Time series (A) wave gauge data of water surface elevation and (B) along-blade accelerations offset by 1 unit from their mean value. Accelerometers 1 (palm) and 2(blade) are from the D. antarctica sample and accelerometers 3 (palm) and 4 (blade) are fromthe D. willana sample. The water surface elevation is contaminated with foam during extremenearby breaking events (e.g., 772 s). In addition, the wave gauge and samples were not exactlycolocated in space, and the fronds themselves have a finite scale so that the peaks in elevationdo not exactly correspond with the accelerometer responses.
1
2
3
4
750 760 770 780 790 740 800 Time (s)
(B)
(A)
1.8
1.5
1.2
8
6
4
2
0
wg
(m)
acc2
(gm
s-2)
3209_C003.fm Page 75 Thursday, November 10, 2005 10:44 AM

76 Ecology and Biomechanics
3. The algal body is outstretched along the direction of the flow. The areanormal to the flow is comparatively small again (projected area) so thatthe pressure drag is low. The friction drag, however, is comparatively highas water is pushed along the surface of the thongs of the blade so that theplanform area is the relevant factor. The overall drag will often be less inthis position than in the midsway position (2), however, because the bladecannot deflect any further, the reactive tensional forces will increase.
Because the shape of an individual Durvillaea changes and because the drag actingon the body changes, a constant drag coefficient cannot be expected. Although thereal situation in the intertidal zone is more complex, in particular with breakingwaves, these assumptions seem sound as a first-order approximation, and the mor-phological parameters, which can most reliably predict drag, need to be identified.
FIGURE 3.13 Lattice plot of the maximum diameter of the stipe and the length of the bladefor D. antarctica and D. willana, grouped by species and wave exposure. Dashed linesrepresent the 95% CI.
0 2 4 6 8 10 12D. willanaD. antarctica
12
10
8
6
4
2
0
0 2 4 6 8 10 12Maximum stipe diameter (cm)
0
2
4
6
8
10
12
Blad
e le
ngth
(m)
R2 = 0.178 R2 = 0.535
R2 = 0.303 R2 = 0.599
Wave-exposed Wave-exposed
Wave-sheltered Wave-sheltered
3209_C003.fm Page 76 Thursday, November 10, 2005 10:44 AM

The Role of Blade Buoyancy and Reconfiguration in Durvillaea 77
The maximum forces obtained from drag tests in a flume were comparable toforces recorded during field experiments with transplants of Durvillaea at 300 N[26]. Based on Equation 3.1, area is expected to correlate well with drag. Unfortu-nately, the common approach of taking the projected area is of little use if the studyorganisms change their shapes by reconfiguring into streamlined bundles withincreasing flow velocities. Therefore, the planform area is often taken instead as thecharacteristic area, but this does not account for undulations or corrugations typicalof many seaweeds [28,29]. A third approach is to take the wetted area as thecharacteristic area [6]. In the case of Durvillaea, however, the determination of thewetted area is extremely difficult for individuals with wave-exposed morphologiesbecause the blade is reconfigured in such a way that parts of the surface areas ofneighboring thongs will be in close contact on the “inside” of the streamlined body.The contact area will subsequently not act as a friction surface for the surrounding
FIGURE 3.14 Lattice plot of the length of the stipe and the length of the blade for D.antarctica and D. willana, grouped by species and wave exposure. Dashed lines represent the95% CI.
0 20 40 60 80 100 120 140 160
0 20 40 60 80 100 120 140 160
12
10
8
6
4
2
012
10
8
6
4
2
0
D. willanaD. antarctica
Stipe length (cm)
Blad
e le
ngth
(m)
Wave-exposed Wave-exposed
Wave-sheltered Wave-sheltered
R2 = 0.031 R2 = 0.508
R2 = 0.008 R2 = 0.470
3209_C003.fm Page 77 Thursday, November 10, 2005 10:44 AM

78 Ecology and Biomechanics
medium, and drag forces will be lower than could be expected from correlationswith the wetted area.
The highest correlation for D. antarctica between drag and morphologicalparameters was with blade length combined with information about the type ofwave-dependent overall morphology. The highest correlation of the Vogel numberwas with mass. It seems therefore justified to expect that the best predictor of theway a given individual will behave in different flow regimes and at different velocitieswill be a combined factor of length, mass, and overall morphology. The factor wouldbe an expression of the “bulkiness” of an individual.
The importance of an adapted morphology and its bulkiness is clearly demon-strated by the shortening experiments. The original shapes of the tested specimenswere well adapted to high flow velocities. The experimentally shortened bladeprevented a reconfiguration into a streamlined bundle and resulted in drag forcesthat were higher than could be expected from the results of the flume tests on intactindividuals. The importance of the bulkiness factor is further supported by the twooutliers in Figure 3.7. The individual above the 95% CI was previously damaged,probably in a storm. The shortened blade was very “bulky” with many thongs,resulting in disproportionately high drag. The other outlier below the 95% CI alsohad fractured tips. Although missing large parts of its blade, a few thongs hadremained unbroken. The blade was subsequently very long, whereas the bulkinesswas very low. These two outliers demonstrate the shortcomings of simple morpho-metrical measurements for correlations with drag because a similar line of argumentcould be applied to area or mass as morphologically relevant parameters.
Although intuitively easy to understand, the quantification of such a bulkinessfactor is complex. Approaches that involve the determination of the “branchiness”of a lamina, similar to a fractal analysis used in computer models of algae, seemplausible but not very practical for seaweeds of the size of Durvillaea. Other andsimpler methods still need to be developed to describe the intricate shape variationsof these seaweeds to predict drag based on morphology.
3.4.2 DRAG COEFFICIENTS, RECONFIGURATION, AND THE VOGEL
NUMBER
The decrease in the standard deviations of the drag coefficients as the velocityincreased, as found in this study, was probably due to the multifactorial optimizationof the seaweed blade with respect to physiological and mechanical boundary con-ditions [30]. The variability of blade shapes is high at low velocities, which aremechanically harmless. Under these conditions, the shape of a blade can be opti-mized with respect to other, nonmechanical requirements, e.g., light interception ornutrient uptake [31,32]. At higher velocities, the different shapes all reconfigure intostreamlined bundles with similar overall shapes. This seems to be the case forseaweeds with highly variable morphotypes such as Durvillaea and also for a wholerange of flexible seaweeds in general [33].
The Vogel numbers found for Durvillaea are similar to those reported from otherstudies on flexible seaweeds [11]. Because the mean was close to B = –1, an almostlinear increase of drag with velocity can thus be explained. The least negative value
3209_C003.fm Page 78 Thursday, November 10, 2005 10:44 AM

The Role of Blade Buoyancy and Reconfiguration in Durvillaea 79
was found for the same individual that was an outlier below the 95% CI in thecorrelation of drag and length (Figure 3.7). Reduced in bulkiness, the shape of theblade could hardly be further optimized, making it comparable to a rope. The mosteffective reconfiguration process and subsequent reduction in actual drag comparedwith the drag predicted by Equation 3.1 will be achieved for a limited range ofaspect ratios. The most negative Vogel number was found for an individual withwave-exposed morphology and a very massive blade with no apparent damage, thesecond outlier above the 95% CI (Figure 3.7). This type of morphology seems tobe the optimized morphology for reconfiguration under very unsteady, rapidly chang-ing flow conditions.
Assuming a Vogel number of B = –1, the theoretical reduction in drag due toreconfiguration can be calculated. The result of this simple extrapolation can be seenin Figure 3.15. At a velocity of 5 m s–1, the reduction in drag due to reconfigurationis already about 50%. At a velocity of 10 m s–1 — common in stormy conditions atexposed sites — the reduction is even more than 75%. It is noteworthy that similarfindings have been reported for terrestrial plants, e.g., the giant reed Arundo donax[22,34]. Reconfiguration is therefore an effective general process of plants for adapt-ing on a small temporal scale to variable flow conditions, which does not requireany further mechanical changes at the “material” level of the organism.
How can Durvillaea grow to a size an order of magnitude larger than otherintertidal seaweeds at that position on the shore given that its biomechanical prop-erties are rather typical for a large spectrum of seaweeds [35]. The answer may liein the way Durvillaea grows. Unlike other members of the Fucales, Durvillaea lacksan apical meristem but has diffuse growth. This allows two mechanisms to interact.First, broken tips can regrow, regardless of previous damage. Second, a strip of a
FIGURE 3.15 Hypothetical drag forces, assuming a linear increase and a quadratic increasewith velocity, respectively. For the individual represented in the graph, the reduction in dragdue to streamlining and subsequent linear (rather than a quadratic) increase is about 52% ata velocity of 5 m s–1 and 75% at 10 m s–1. The experimental range is shaded in gray. F is thedrag force, and u is the velocity of the fluid.
0 2 4 6 8 10u (ms−1)
>50%
>75%LinearQuadratic5
4
3
2
1
0
F Dra
g (kN
)
3209_C003.fm Page 79 Thursday, November 10, 2005 10:44 AM

80 Ecology and Biomechanics
blade fractured longitudinally at its distal end can change its growth form. The tipof the crack will become blunt to avoid crack propagation [36]. The strip of bladewill then have two termini, which will both be able to grow in length. The tip ofthe crack, however, remains a permanent point of separation of the two newlygenerated termini, forming two only loosely connected mechanical subunits that aredifferentially agitated by wave action. It is thus possible for Durvillaea to changeits morphology as it grows, adapting to the ambient wave exposure. The potentiallyendangered large unit blade is divided into many smaller subunits, possibly reducingthe physiological efficiency of the photosynthetically active area, but more impor-tantly, reducing the risk of total blade loss. The indeterminate morphology of Dur-villaea, therefore, seems to be a key factor for the successful establishment of thisseaweed in the wave-swept intertidal environment.
3.4.3 BUOYANCY AND FIELD STUDIES
In D. antarctica, the whole blade is buoyant, whereas many other large brownseaweeds have only distinct floating organs, e.g., pneumatocysts. The recordedbuoyancy forces of up to 150 N are high, e.g., 15 times higher than the buoyancyforces recorded for an 8 m long individual of Nereocystis luetkeana [37]. It cantherefore be expected that the buoyancy of the blade of D. antarctica has a consid-erable influence on the overall mechanical behavior of this species in the surf zone.
The finding that the acceleration response of D. antarctica was not particularlydifferent on the palm compared with the frond was initially surprising as one mightexpect the blades to respond more strongly because buoyancy holds them up highduring the passage of breaking waves. This suggests that the drag force imparted tothe blades was transferred along the stipe and made itself apparent even near theholdfast. Contemporary load cell data quantifying the actual load transferred to thesubstrate connection supports this [26].
The frond response of the D. willana sample was probably the best track of thewater elevation, clearly marking the passage of the wave crest and the gradual decay(recall that the wave gauge elevation did not exactly reflect the velocity of a passingwave). It is unclear why the D. willana structure did not pass the response inaccelerometer on to the stipe. A possible explanation exists in the load drivingrealignment of the frond that was not constrained by buoyancy.
An alternate viewpoint for the same data is provided by examining the domainof along-blade vs. across-blade accelerations (Figure 3.16). Stevens et al. [26] studiedall three axes combinations (x–y, x–z, and y–z); however, here we consider only x–yfor simplicity. Clearly, the D. willana stipe palm is more constrained than theD. antarctica stipe (Figure 3.16C vs. 3.16A). The scatter in the data points ofD. antarctica indicates that the blade has many degrees of freedom to attain a certainposition in the water column (Figure 3.16B). In contrast, the acceleration data ofD. willana shows less scatter (Figure 3.16D). This might be indicative of a higherconstraint of movement of the blade in the water column. Thus, the positive buoyancyof D. antarctica increases the “movability” of the blade. This could increase ratesof nutrient uptake as well as lower the fatigue strains due to repetitive bending in apreferred direction predefined by the predominant wave direction.
3209_C003.fm Page 80 Thursday, November 10, 2005 10:44 AM

The Role of Blade Buoyancy and Reconfiguration in Durvillaea 81
3.4.4 MORPHOLOGICAL SURVEY
The morphological survey yielded only weak correlations between morphologicalparameters. One reason for this finding seems to be the distribution of data in twooverlapping “clouds” as can be seen in particular with the correlation betweenblade length and stipe length (Figure 3.14, bottom panels). The two overlappingdata sets in Figure 3.13 and Figure 3.14 possibly represent older, well-establishedindividuals and young individuals with overproportioned large blades. It can behypothesized that some of these fast-growing individuals have not yet experiencedsevere winter storms that have the potential to prune the blades to a size that canbe easily correlated to the dimensions of the stipe or, alternatively, will cause thedislodgment of these individuals. As the determination of age is difficult withDurvillaea, long-term studies with tagged populations are necessary to establish aclearer view on correlations between typical wave exposure and subsequentmorphological adaptations.
FIGURE 3.16 Comparison of accelerometer response (in units of g, acceleration due togravity, where 1 g = 9.81 m s–2) for D. antarctica (A) palm and (B) frond and D. willana (C)palm and (D) frond. The results show along-frond acceleration (X) vs. across-frond acceler-ation (Y). Around 170 s of data subsectioned from a 2000s time series are shown.
1
0
−1
1
0
−1
10−1 10−1
Y−
g Y
−g
X − gX − g
(A) (B)
(C) (D)
3209_C003.fm Page 81 Thursday, November 10, 2005 10:44 AM

82 Ecology and Biomechanics
3.5 CONCLUSION
This study demonstrates how organisms can adjust to severe physical conditions bypredominantly passive processes. Further adaptations on the tissue level or thebiochemical composition of cell walls might be important factors for the mechanicalfine-tuning of an individual to its habitat [19,22]. However, the main competitivefactors, reconfiguration and morphological plasticity, are both directly linked to theindeterminate growth of Durvillaea. A main process of rapid adaptation to severeflow conditions is the passive reconfiguration of the flexible blade. In conjunctionwith the positive buoyancy of the blade, D. antarctica seems to possess a very highdegree of adaptability to a great variety of flow conditions, which allows this speciesto occupy a larger range of habitats than D. willana. These adaptations act on a shortto intermediate time scale (few seconds to one growth season), which is advantageousin a highly unsteady and unpredictable habitat like the intertidal. It can therefore beconcluded that seemingly primitive organisms like Durvillaea are actually very well-adapted to their habitat by being less specialized.
ACKNOWLEDGMENTS
The authors thank Dave Pease and George Neill, who were in charge of running theflume during the experiments; Rob Daly and Murray Smith, who helped withharvesting and setting up the thalli for testing; and Louise Kregting and José Derraikfor field assistance. This study was supported by a Marsden Grant to CLS, aUniversity of Otago scholarship, and a DAAD scholarship to DLH, and a Universityof Otago research grant to CLH.
REFERENCES
1. Denny, M.W., Life in the maelstrom — the biomechanics of wave-swept rocky shores,Trends Ecol. Evol., 2, 61, 1987.
2. Armstrong, S.L., Mechanical properties of the tissues of the brown alga Hedophyllumsessile (C. Ag.) Setchell: variability with habitat, J. Exp. Mar. Biol. Ecol., 114, 143,1987.
3. Charters, A.C., Neushul, M., and Barilotti, C., The functional morphology of Eiseniaarborea, Proc. Int. Seaweed Symp., 6, 89, 1969.
4. Delf, E.M., Experiments with the stipes of Fucus and Laminaria, J. Exp. Biol., 9,300, 1932.
5. Denny, M.W., Gaylord, B.P., and Cowen, E.A., Flow and flexibility — II — Theroles of size and shape in determining wave-forces on the bull kelp Nereocystisluetkeana, J. Exp. Biol., 200, 3165, 1997.
6. Gaylord, B. and Denny, M.W., Flow and flexibility — I — Effects of size, shape andstiffness in determining wave-forces on the stipitate kelps Eisenia arborea and Ptery-gophora californica, J. Exp. Biol., 200, 3141, 1997.
7. Koehl, M.A.R. and Wainwright, B., Mechanical adaptations of a giant kelp, Limnol.Oceanogr., 22, 1067, 1977.
8. Koehl, M.A.R., When does morphology matter, Annu. Rev. Ecol. Syst., 27, 501, 1996.
3209_C003.fm Page 82 Thursday, November 10, 2005 10:44 AM

The Role of Blade Buoyancy and Reconfiguration in Durvillaea 83
9. Denny, M.W., Daniel, T.L., and Koehl, M.A.R., Mechanical limits to size in wave-swept organisms, Ecol. Monogr., 55, 69, 1985.
10. Gaylord, B., Blanchette, C.A., and Denny, M.W., Mechanical consequences of sizein wave-swept algae, Ecol. Monogr., 64, 287, 1994.
11. Koehl, M.A.R., Mechanical design and hydrodynamics of blade-like algae, in 3rdPlant Biomechanics Conference, Spatz, H.C. and Speck, T., Eds., Georg ThiemeVerlag, Stuttgart, 299, 2000.
12. Koehl, M.A.R., How do benthic organisms withstand moving water? Am. Zool., 24,57, 1984.
13. Rousseau, F. and De Reviers, B., Phylogenetic relationships within the Fucales(Phaeophyceae) based on combined partial SSU+LSU rDNA sequence data, Eur. J.Phycol., 34, 53, 1999.
14. Naylor, M., The New Zealand species of Durvillea, Trans. Roy. Soc. New Zealand,80, 277, 1953.
15. Hay, C.H., Durvillaea, in Biology of Economic Algae I, Akatsuka, I., Ed., SBSAcademic Publishing, the Hague, 1994, p. 353.
16. Smith, J.M.B. and Bayliss-Smith, T.P., Kelp-plucking — coastal erosion facilitatedby bull-kelp Durvillaea antarctica at sub-Antarctic Macquarie-Island, Antarct. Sci.,10, 431, 1998.
17. Hay, C.H., Growth mortality, longevity and standing crop of Durvillaea antarctica(Phaeophyceae) in New Zealand, Proc. Int. Seaweed Symp., 9, 97, 1979.
18. Wing, S.R., Leichter, J.J., and Denny, M.W., A dynamic model for wave-inducedlight fluctuations in a kelp forest, Limnol. Oceanogr., 38, 396, 1993.
19. Harder, D.L., Hurd, C.L., and Speck, T., Biomechanics of sympatric macroalgae inthe surf zone of New Zealand and Helgoland, Germany, in 3rd Plant BiomechanicsConference, Spatz, H.C. and Speck, T., Eds. Georg Thieme Verlag, Stuttgart, 287,2000.
20. Niklas, K.J., Plant biomechanics: An Engineering Approach to Plant Form andFunction, The University of Chicago Press, Chicago, 1992.
21. Hoerner, S.F., Fluid-Dynamic Drag, Hoerner, S.F., Brick Town, NJ, 1965.22. Harder, D.L. et al., Reconfiguration as a prerequisite for survival in highly unstable
flow-dominated habitats, J. Plant Growth Reg., 23, 98, 2004.23. Denny, M.W., Biology and the Mechanics of the Wave-Swept Environment, Princeton
University Press, Princeton, NJ, 1988.24. Vogel, S., Drag and reconfiguration of broad leaves in high winds, J. Exp. Bot., 40,
941, 1989.25. Vogel, S., Drag and flexibility in sessile organisms, Am. Zool., 24, 37 1984.26. Stevens, C.L., Hurd, C.L., and Smith, M.J., Field measurement of the dynamics of
the bull kelp Durvillaea antarctica (Chamisso) Heriot, J. Exp. Mar. Biol. Ecol., 269,147, 2002.
27. Koehl, M.A.R., Jumars, P.A., and Karp-Boss, L., Algal biophysics, in Out of the Past:Collected Reviews To Celebrate the Jubilee of the British Phycological Society,Norton, T.A., Ed., The British Phycological Society, Belfast, 115, 2003.
28. Hurd, C.L. et al., Visualization of seawater flow around morphologically distinctforms of the giant kelp Macrocystis integrifolia from wave-sheltered and exposedsites, Limnol. Oceanogr., 42, 156, 1997.
29. Koehl, M.A.R. and Alberte, R.S., Flow, flapping, and photosynthesis of Nereocystisluetkeana: a functional comparison of undulate and flat blade morphology, Mar. Biol.,99, 435, 1988.
3209_C003.fm Page 83 Thursday, November 10, 2005 10:44 AM

84 Ecology and Biomechanics
30. Koehl, M.A.R., Seaweeds in moving water: form and mechanical function, in On theEconomy of Plant Form and Function, Givinish, T.J.L., Ed., Cambridge UniversityPress, Cambridge, 1986, p. 603.
31. Hurd, C.L., Water motion, marine macroalgal physiology, and production, J. Phycol.,36, 453, 2000.
32. Niklas, K.J., Petiole mechanics, light interception by lamina, and economy in design,Oecologia, 90, 518, 1992.
33. Carrington, E., Drag and dislodgment of an intertidal macroalga: consequences ofmorphological variation in Mastocarpus papillatus Kützing, J. Exp. Mar. Biol. Ecol.,139, 185, 1990.
34. Speck, O., Field measurements of wind speed and reconfiguration in Arundo donax(Poaceae) with estimates of drag forces, Am. J. Bot., 90, 1253, 2003.
35. Harder, D.L. et al., Comparison of mechanical properties of four large, wave-exposedseaweeds, in preparation.
36. Denny, M.W. et al., Fracture mechanics and the survival of wave-swept macroalgae,J. Exp. Mar. Biol. Ecol., 127, 211, 1989.
37. Denny, M.W. et al., The menace of momentum — dynamic forces on flexible organ-isms, Limnol. Oceanogr., 43, 955, 1998.
3209_C003.fm Page 84 Thursday, November 10, 2005 10:44 AM
85
4 Murray’s Law and the Vascular Architecture of Plants
Katherine A. McCulloh and John S. Sperry
CONTENTS
4.1 Introduction ....................................................................................................854.2 Murray’s Law.................................................................................................864.3 Applying Murray’s Law to Xylem ................................................................884.4 Importance of the Conduit Furcation Number (F)........................................904.5 Does Xylem Follow Murray’s Law? .............................................................914.6 Does Tree Wood Not Follow Murray’s Law? ...............................................924.7 Nature of the Mechanical Constraint on Hydraulic Efficiency ....................944.8 Da Vinci’s Rule ..............................................................................................954.9 Developmental and Physiological Constraints on Transport Efficiency.......954.10 Comparative Efficiency of Conifer vs. Angiosperm Tree Wood ..................964.11 Conclusions ....................................................................................................97Acknowledgments....................................................................................................97References................................................................................................................97
4.1 INTRODUCTION
In the move from the water to land, plants evolved traits that allowed them to copewith their new environment. Arguably, the most dramatic problem they faced wasthe relative dryness of air. Rapid water loss from photosynthetic tissues requiresequally rapid water supply. Poor water transport capabilities limited the earliestnonvascular plants to small size [1]. The evolution of xylem vastly increased hydrau-lic conductance and contributed to the diversification of plant size evident today [2,3].
Xylem structure has changed and diversified considerably over time, presumablyreflecting progressive adaptation [4]. “Measuring” this adaptation is a challengebecause it is not always obvious what traits are being selected for and what con-straints and trade-offs are limiting trait evolution. It seems likely, however, that auniversally favorable trait for a water-conducting network is maximum hydraulicconductance per unit investment. Higher hydraulic conductance means greater vol-ume flow rate of water per pressure drop across the network. The higher the hydraulic
3209_C004.fm Page 85 Tuesday, November 8, 2005 8:20 AM

86 Ecology and Biomechanics
conductance, the more leaf area that can be supplied with water at a given waterstatus and the greater potential for CO2 uptake [5–10]. Minimizing vascular invest-ment means that less of the assimilated carbon is required for the growth of vasculartissue, leaving more for reproduction and other functions. Evaluating the hydraulicconductance per investment criterion provides insight into the adaptive significanceof diverse xylem anatomies throughout the plant kingdom.
In this chapter, we summarize the use of Murray’s law for evaluating the con-ductance vs. investment trade-off across major xylem types. The results haveappeared piecemeal elsewhere [11–14] but benefit from a unified summary. Ofrelevance is the high profile work of West and colleagues [15–17] who concludedthat quarter-power scaling laws in biology (e.g., [18,19]) result from an energy-minimizing vascular structure that constrains metabolism. These models have beencriticized as being mathematically flawed and based on inaccurate vascular anatomy[13,20,21]. Nevertheless, they have drawn attention to the “energy-minimizing”principle, which is equivalent to the maximizing of hydraulic conductance pervascular investment [22]. While West and colleagues assumed this principle holdsempirically, we tested it using Murray’s law.
4.2 MURRAY’S LAW
Murray’s law was derived for animal vascular networks by Cecil Murray [23]. Itpredicts how the blood vessels should change in diameter across branch points tomaximize hydraulic conductance for a given investment in vascular volume and aparticular branching architecture. The derivation for a single bifurcating blood vessel(Figure 4.1) is useful for pointing out the underlying assumptions as highlighted initalics. An initial assumption is that the volume flow rate is conserved from motherto daughter branch ranks — no fluid is lost in transit. The total volume (V) assumingcylindrical geometry of the vessels is:
V = (l0r02 + Fl1r1
2) (4.1)
FIGURE 4.1 A bifurcating blood vessel for which Murray’s law is derived in the text. Shownare the radii (r) and lengths (l) of mother (subscript 0) and daughter (subscript 1) branch ranks.
l0
l1
r0
r1
3209_C004.fm Page 86 Tuesday, November 8, 2005 8:20 AM

Murray’s Law and the Vascular Architecture of Plants 87
where l is length, r is inner radius of vessel lumen, F is the number of daughterbranches per mother (F = 2), and subscripts 0 and 1 designate mother and daughterranks, respectively. We refer to this ratio as the “conduit furcation number.” Thetotal flow resistance (R, pressure drop per volume flow rate), assuming laminar flowthrough cylindrical tubes, is given by the Hagen–Poiseuille equation. Resistancesare used rather than the reciprocal conductance because they are additive in series:
(4.2)
where is the dynamic viscosity of the xylem sap.Comparing Equations 4.1 and 4.2 demonstrates the basic conflict between min-
imizing flow resistance (and thus the energy consumed by the heart) while alsominimizing vascular volume and the energy required to maintain the blood. Lowflow resistance requires large radii (R 1/r4; Equation 4.2), but large radii makefor larger and more expensive volume (V r2l, Equation 4.1). If the individualbranch lengths and total network volume are held constant, the relative change inconduit radii (r0 and r1) across branch ranks that minimizes the flow resistance perfixed volume can be determined.
Setting the volume equation to equal zero (0 = V – C, where C is a constant),Lagrange’s theorem can be used to solve for the values of r0 and r1 that minimizethe resistance:
R/ r0 = V/ r0 (4.3a)
R/ r1 = V/ r1 (4.3b)
where the Lagrange multiplier, , is a nonzero constant. From Equations 4.1 and4.2, the partial derivatives are:
R/ r0 = -32 l0/ r05 (4.4a)
V/ r0 = 2l0 r0 (4.4b)
R/ r1 = -32 l1/F r15 (4.4c)
V/ r1 = 2Fl1 r1 (4.4d)
Substituting Equations 4.4a and 4.4b into Equation 4.3a and solving for yields:
= -16 / 2r06 (4.5)
Rl
r
l
Fr= +
8 0
04
1
14
3209_C004.fm Page 87 Tuesday, November 8, 2005 8:20 AM
88 Ecology and Biomechanics
Inserting Equations 4.4c and 4.4d in Equation 4.3b and solving for yields:
= -16 /F2 2r16 (4.6)
Substituting Equation 4.5 for into Equation 4.6, canceling terms, and rear-ranging, gives Murray’s law:
r03 = Fr1
3 (4.7a)
or more generally,
r03 = r1
3 (4.7b)
which states that the hydraulic conductance of the fixed-volume network is maxi-mized when the radius cubed of the mother vessel equals the sum of the radii cubedof the two daughter vessels. The shape of the conductivity optimum is shown for anetwork of three bifurcating branch ranks in Figure 4.2A.
The law does not require that all vessels of a branch rank be equal in radius asin our simple example; this can be seen by adjusting the equations accordingly andfollowing the same derivation. The law also does not depend on F when conduitsize is expressed as the conservation of r3 across branch ranks (Equation 4.7b).Note that Murray’s law is independent of the lengths of the branches, which cancelout in the derivation even if they are unequal within a branch level (e.g., at Equations4.6 and 4.7). The law is equivalent to solving for the maximum hydraulic conduc-tivity (volume flow rate per pressure gradient, and length-independent) for a fixedcumulative cross-sectional area (volume per unit length) summed across each branchrank. Measurements have largely supported Murray’s law in animals, at least outsideof the network of leaky capillaries and beyond the influence of pulsing pressures atthe exit from the heart [24–26].
As the derivation shows, Murray’s law does not solve for the optimal size orindividual branch lengths — only the optimal tapering of the conduit diameter acrossa given branching topography. The law is less ambitious than the “West et al. model,”which attempts to solve for both the optimum tapering and the relative lengths (l0,l1, etc.) of branches at each level. The limitations of the West et al. approach [20,21]recommend a more limited analysis based on Murray’s law.
4.3 APPLYING MURRAY’S LAW TO XYLEM
Although Murray’s law was derived for animal vascular systems, it recently hasbeen shown to apply to plants given a few additional assumptions as italicized inthe following [11]. The conduits in xylem, though roughly cylindrical, are notcontinuous ramifying tubes like cardiovascular vessels. Instead, tracheids and vesselsin plants are unbranched and range in length from meters to less than a centimeter.They overlap longitudinally to form the branching network, and water has to flowbetween conduits through interconduit pits. The added flow resistance through these
3209_C004.fm Page 88 Tuesday, November 8, 2005 8:20 AM
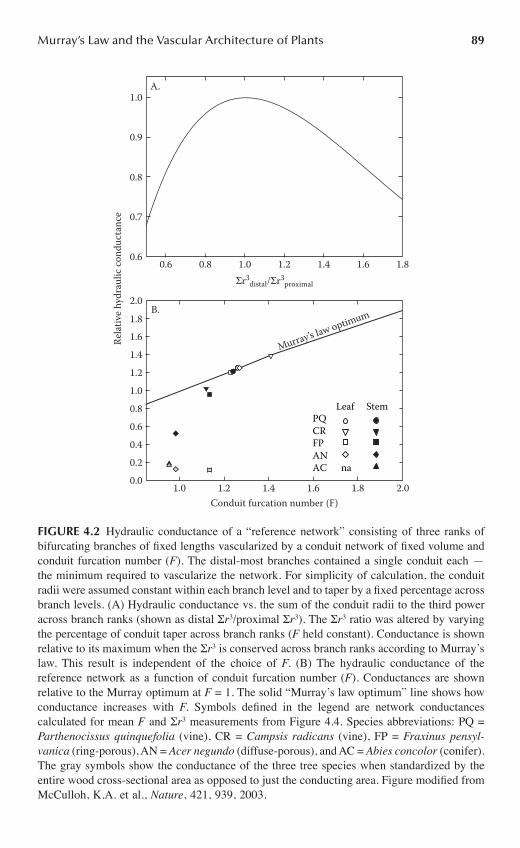
Murray’s Law and the Vascular Architecture of Plants 89
FIGURE 4.2 Hydraulic conductance of a “reference network” consisting of three ranks ofbifurcating branches of fixed lengths vascularized by a conduit network of fixed volume andconduit furcation number (F). The distal-most branches contained a single conduit each —the minimum required to vascularize the network. For simplicity of calculation, the conduitradii were assumed constant within each branch level and to taper by a fixed percentage acrossbranch levels. (A) Hydraulic conductance vs. the sum of the conduit radii to the third poweracross branch ranks (shown as distal r3/proximal r3). The r3 ratio was altered by varyingthe percentage of conduit taper across branch ranks (F held constant). Conductance is shownrelative to its maximum when the r3 is conserved across branch ranks according to Murray’slaw. This result is independent of the choice of F. (B) The hydraulic conductance of thereference network as a function of conduit furcation number (F). Conductances are shownrelative to the Murray optimum at F = 1. The solid “Murray’s law optimum” line shows howconductance increases with F. Symbols defined in the legend are network conductancescalculated for mean F and r3 measurements from Figure 4.4. Species abbreviations: PQ =Parthenocissus quinquefolia (vine), CR = Campsis radicans (vine), FP = Fraxinus pensyl-vanica (ring-porous), AN = Acer negundo (diffuse-porous), and AC = Abies concolor (conifer).The gray symbols show the conductance of the three tree species when standardized by theentire wood cross-sectional area as opposed to just the conducting area. Figure modified fromMcCulloh, K.A. et al., Nature, 421, 939, 2003.
PQCRFPANAC na
Leaf Stem
0.6 0.8 1.0 1.2 1.4 1.6 1.8
1.0
0.9
0.8
0.7
0.6
2.0
1.8
1.6
1.4
1.2
1.0
0.8
0.6
0.4
0.2
0.0
Murray’s law optimum
Rela
tive
hydr
aulic
cond
ucta
nce
Σr3distal/Σr3
proximal
1.0 1.2 1.4 1.6 1.8 2.0Conduit furcation number (F)
B.
A.
3209_C004.fm Page 89 Tuesday, November 8, 2005 8:20 AM

90 Ecology and Biomechanics
end walls means the hydraulic conductivity of xylem conduits is significantly belowthe value predicted by the Hagen–Poiseuille equation for open tubes [27]. TheMurray’s law derivation still holds, however, as long as the actual conductivity isproportional to the Hagen–Poiseuille value within a given network — this simplyadds a proportionality constant to Equation 4.2. Recent work indicates that end wallscontribute approximately half of the total resistance across a wide range of conduitsizes [28]. Flow in xylem under physiological pressures is laminar, so except fordeviations from cylindrical geometry, the Hagen–Poiseuille equation accurately pre-dicts conductivity [29].
In animals, the volume of the circulating blood is a major cost of transport. Inplants, the xylem water is cheap and its volume is presumably irrelevant as a costof the vascular system. Instead, the analogous cost in plants is the construction ofthe relatively thick conduit walls. Xylem sap is under significant negative pressuresof 1 to 10 MPa, depending on the species and habitat [30]. Avoiding implosion ofthe conduits requires thick secondary walls stiffened with lignin [2]. Mechanicspredict that the wall thickness be proportional to the lumen diameter to maintain agiven safety margin against collapse at a given minimum negative pressure. Mea-surements confirm this prediction, showing that the wall thickness per lumen widthscales with the cavitation pressure — the minimum negative pressure the xylem canwithstand without breakage of water columns by vapor nucleation [31]. The Murray’slaw derivation is still valid as long as the wall thickness is proportional to the innerradius of the conduit as expected for a given cavitation pressure. This requiresmodification of Equation 4.1 but not the dependence of wall volume (hence cost)on r2 on which the derivation depends.
Murray’s Law may not necessarily hold if conduit walls perform any additionalfunction other than transporting water. In some plants — conifers being the bestexample — conduit walls perform “double duty” by supporting the plant as well astransporting water. In these cases, wall volume cannot be viewed solely as a cost oftransport and Equations 4.1 and 4.2 do not capture the intended conflict betweenconductivity and cost of investment.
4.4 IMPORTANCE OF THE CONDUIT FURCATION NUMBER (F)
A final distinction between animal and plant vasculature concerns the daughter tomother ratio in conduit number. In animals where the network consists of a singleopen tube that branches, F 2. In plants, the network at every level from trunk totwig consists of numerous conduits running in parallel and F > 0. The increase inthe number of tree branches moving from trunk to twig occurs independently of thechange in the number of conduits in each branch. For any possible F, however, theoptimal (maximum) conductivity occurs when the r3 is conserved (Figure 4.2A,Ref. [11]).
The value of the conduit furcation number has adaptive significance for plants.The “Murray’s law optimum” line in Figure 4.2B shows the conductance of aMurray’s law network ( r3 conserved across three bifurcating branch ranks) that
3209_C004.fm Page 90 Tuesday, November 8, 2005 8:20 AM

Murray’s Law and the Vascular Architecture of Plants 91
corresponds to different values of F when all else (volume and branching pattern)is held constant. The absolute value of the hydraulic conductance increases with F[11].The increase in efficiency with F is greater with an increasing number of branchranks in the network; Figure 4.2 is for a relatively small network of three branchranks. Conductance increases because larger F means the trunk and major brancheshave fewer but wider and more conductive conduits for a given number of conduitsin the twigs (held to the minimum of one per twig for the reference network inFigure 4.2). The plant becomes more like a branching aorta, which is the peak ofefficiency. Thus, for the same investment in conduit volume, plants can increasetheir hydraulic conductance by having more conduits running in parallel in theirtwigs than in their trunk while also conforming to Murray’s law.
The West et al. model assumed F = 1, citing the pipe model of tree form [32,33].However, the “unit pipe” associated with each leaf in the pipe model does not referto an actual fluid conducting pipe but rather to a strip of wood of constant cross-sectional area. The pipe model does not specify the anatomical composition of thisstrand of wood — how much of it is fibers, parenchyma, conduits, and so forth —because it is only concerned with biomass allocation and not hydraulics. There isno a priori value of F in plants except that it must be greater than zero.
4.5 DOES XYLEM FOLLOW MURRAY’S LAW?
Given that Murray’s law is applicable to xylem, we hypothesized that plants shouldfollow the law as long as the conduits were not providing structural support. Wehave tested this hypothesis in compound leaves (Acer negundo, Fraxinus pensylvan-ica, Campsis radicans, and Parthenocissus quinquifolia), vine stems (C. radicansand P. quinquifolia), and shoots (Psilotum nudum) [11,14]. In leaves and Psilotumshoots, structural support of the organ is primarily from nonvascular tissues. Vines,being structural parasites, require little in the way of self-supporting tissue. Whenthe r3 of the conduits in the petiolules and petioles of compound leaves werecompared, they were statistically indistinguishable in four species as predicted byMurray’s law (Figure 4.3). In the vine wood, one species (P. quinquefolia) compliedwith Murray’s law and the other (C. radicans) deviated only slightly (Figure 4.4,compare y axis r3 ratio with Murray value of 1).
Psilotum nudum is a stem photosynthesizer, so water is transpired continuouslyalong the length of the flow path. This means that Q (the estimated xylem flow rate)declines from the single-stemmed base of the shoot to the tips of all the branch ends.Under these conditions, Murray’s law predicts that the r3 should diminish propor-tionally with Q [14]. The relative decline in Q from base to tip of Psilotum wasestimated from shoot transpiration measurements, assuming steady-state conditions.Consistent with Murray’s law, Q declined in direct proportion to the r3 from baseto tip. A log–log plot gave a slope indistinguishable from the Murray’s law valueof 1 (Figure 4.5).
The conduit furcation numbers of the compound leaves, vines, and Ps. nudumwere all between 1.12 and 1.4, meaning an average increase in conduit number ofbetween 12 and 40% from adjacent mother to daughter ranks. To compare the relativetransport efficiency of these vascular networks, we calculated their position on
3209_C004.fm Page 91 Tuesday, November 8, 2005 8:20 AM

92 Ecology and Biomechanics
Figure 4.2B — assuming the same “reference network” (constant volume and threebifurcating branch ranks) used to calculate the increase in the Murray optimum withF. Relative to the F = 1 value assumed by West et al., [15–17] the higher furcationnumbers in leaf and vine networks show a shift toward a more efficient network(Figure 4.2B).
4.6 DOES TREE WOOD NOT FOLLOW MURRAY’S LAW?
As a further test of Murray’s law, we predicted that the wood of freestanding treesshould deviate from the law in proportion to how much of the wood was composedof transporting conduits. Wood holds up trees, and the more this wood is made oftransporting conduits, the more these conduit walls are functioning in mechanicalsupport — violating an assumption of Murray’s law. Conifer wood is made ofconduits, with over 90% of its volume in tracheids [12,34], and it should deviatethe most from Murray’s law by hypothesis. Ring-porous angiosperms, in contrast,have relatively few, large vessels produced in a narrow annual ring composed ofnearly 10% of the wood area, the rest being fibers [12]. These trees should deviatethe least. Diffuse-porous angiosperms are intermediate in wood structure and shouldbe intermediate with respect to Murray’s law. Except for the conifer species, wetested this hypothesis in wood of the same trees used for the compound leaf analysis.
The results supported the hypothesis (Figure 4.4). The conifer species, Abiesconcolor, had the highest fraction of wood devoted to conduit area (91%) anddeviated the most from Murray’s law (Figure 4.4, closed triangle). The deviationcannot be attributed to some inherent limitation of a tracheid-based conducting
FIGURE 4.3 The sum of the conduit radii ( r3) in petioles of compound leaves vs. the r3
of the petiolules they supply. Each symbol corresponds to a single leaf (Acer negundo,triangles; Fraxinus pensylvanica, circles; Campsis radicans, diamonds; and Parthenocissusquinquifolia, squares). The dashed line is a linear regression with a slope of 1.04. This isstatistically indistinguishable from the Murray’s law predicted slope of 1 (solid line). Datafrom McCulloh, K.A. et al., Nature, 421, 939, 2003.
3.5e+6
3.0e+6
2.5e+6
2.0e+6
1.5e+6
1.0e+6
0.5e+5
0.00.0 0.5e+5 1.0e+6 1.5e+6 2.0e+6 2.5e+6 3.0e+6 3.5e+6
Petiolule Σr3 (µm3)
Petio
le Σ
r3 (µm
3 )
3209_C004.fm Page 92 Tuesday, November 8, 2005 8:20 AM

Murray’s Law and the Vascular Architecture of Plants 93
system because Ps. nudum possesses tracheids and followed Murray’s law quiteclosely (Figure 4.5). The ring-porous species F. pensylvanica had the lowest conduitarea fraction (12%) and had the lowest deviation from Murray’s law (Figure 4.4,closed square). When statistics were performed on the ratio of the r3 of the mostdistal to progressively more proximal ranks on a rank-by-rank basis (as opposed tooverall means reported in Figures 4.2B and 4.4), the young wood of F. pensylvanicacomplied with Murray’s law [11]. The diffuse-porous tree (A. negundo) had anintermediate conduit area fraction (24%) and was intermediate between the ring-porous and conifer tree with respect to Murray’s law (Figure 4.4, closed circle).
Interestingly, the furcation numbers for wood of these self-supporting trees weregenerally smaller (0.98 to 1.1) than furcation numbers in vascular tissue that wasnot functioning in mechanical support (1.2 to 1.4) (Figure 4.4). Furthermore, whenall the data are compared, a significant correlation exists between increasing conduitfurcation number and increasing convergence on Murray’s law (Figure 4.4, Ref.[12]). The implications for transport efficiency are evident in Figure 4.2B where therelative hydraulic conductance from the tree wood data is compared to the vine and
FIGURE 4.4 The ratio of the sum of the conduit radii cubed ( r3) versus the conduit furcationnumber (F) for branching ranks within leaves (open symbols — petiolule vs. petiole) andacross the pooled means of three to four branching ranks within stems (closed symbols). The
r3 ratio is the most distal rank r3*, which was the petiolule for the angiosperm species andthe petiole for the conifer species, over the r3 of progressively more proximal ranks. Theconduit furcation number (F) was standardized to account for differences in branching archi-tecture (McCulloh et al., Nature, 421, 939, 2003) and is always the mean for adjacent ranks.The horizontal “ML optimum” line at a r3 ratio of 1 is for Murray law networks where r3
is constant across ranks. The dashed curve is for networks where the r2 is constant acrossranks, i.e., a constant cross-sectional area of conduits. Above this line, conduit area increasesfrom base to tip (inverted cone), while below the line, the conduit area diminishes in the samedirection (upright cone). Symbols are grand means from three to four individuals. PQ =Parthenocissus quinquefolia (vine), CR = Campsis radicans (vine), FP = Fraxinus pensyl-vanica (ring-porous), AN = Acer negundo (diffuse-porous), and AC = Abies concolor (conifer).Data are from McCulloh, K.A. et al., Funct. Ecol., 18: 931–938, 2004.
Conduit furcation number (F)
ML optimum
PQCRFPANAC na
Leaf Stem
1.2
1.0
0.8
0.6
0.4
0.2
0.00.8 1.0 1.2 1.4
Σr3∗
/Σr3
3209_C004.fm Page 93 Tuesday, November 8, 2005 8:20 AM

94 Ecology and Biomechanics
leaf data for the same reference network (Figure 4.2B, compare closed tree vs. vineand leaf data points). Not only is tree wood less efficient than the other xylem typesbecause of its deviation from Murray’s law, but it is also less efficient because ofits lower furcation number. This result implies a conflict between the optimizationof hydraulics vs. mechanics when the two functions are performed by vascular tissue.
4.7 NATURE OF THE MECHANICAL CONSTRAINT ON HYDRAULIC EFFICIENCY
Evidence for a support vs. transport conflict was most obvious in the conifer wood— where the two functions are performed by the tracheids that make up most ofthe wood volume. What prevents conifer wood from matching the efficiency of leafxylem and vine wood? The answer is that if it did, conifer trees would likely fallover. The dashed line in Figure 4.4 represents “area-preserving” transport networks,i.e., vascular systems that have the same total cross-sectional area of functionalxylem from base to tips. A conifer tree above the dashed line in company with thevines and leaves would be top heavy with more cross-sectional area and bulk intheir upper branches than in its trunk.
This result exposes a basic support vs. transport trade-off. Achieving higherconductance for a given network volume requires “area-increasing” conduit networks(Figure 4.4, above dashed line). Achieving the tallest self-supporting structure for agiven volume requires a tapered column with its area-decreasing pattern [35] (Figure4.4, below dashed line). The two functions cannot be simultaneously optimized ifthe supporting cells are also transporting conduits. The conflict is not relevant forvine wood, which is less self-supporting, or for leaf and Psilotum shoot xylem,
FIGURE 4.5 The sum of the conduit radii cubed ( r3) vs. the estimated xylem flow rate (Q)on a log–log plot. Murray’s law predicts that Q r3, indicating a slope of 1 (solid line).The pooled slope was determined using a linear mixed-effects model (slope = 1.01) and isstatistically indistinguishable from this value. Symbols indicate measurements on all shootsegments from five Ps. nudum individuals. Figure modified from McCulloh, K.A. and Sperry,J.S., Am J. Bot., 92: 985–989.
0.1
0.01
0.001
0.0001
Q(m
ol s−1
)
1e+2 1e+3 1e+4 1e+5
Σr3 (µm3)
3209_C004.fm Page 94 Tuesday, November 8, 2005 8:20 AM

Murray’s Law and the Vascular Architecture of Plants 95
which is not involved in mechanical support. We interpret that these mechanicallyunconstrained networks are free to be area-increasing and more efficient. One of thevine species fell near the area-preserving line and also deviated more from Murray’slaw than the other (Figure 4.4, C. radicans). Vine stems can be transitional betweenself-supporting vs. tension structures, depending on species, stem position, anddevelopment [36,37].
The specialized wood of angiosperms can at least partially resolve the supportvs. transport conflict by having separate support vs. transport cells. They can havean area-increasing conduit network while maintaining area-preserving or even area-diminishing branching of the wood as a whole for mechanical stability (Figure 4.4,Fraxinus datum). Ring-porous trees represent the extreme of this angiosperm strategyby localizing transport to a few large vessels embedded in a much greater area offibers.
Sap velocity measurements reinforce our anatomical results. Relative sap veloc-ity in trunk vs. twig is a proxy for relative cross-sectional area of functional conduits— assuming steady state flow conditions and conservation of mass flow. Conifersand diffuse-porous trees show accelerating sap velocity from trunk to twig [38–40],consistent with a reduction in conduit area and less efficient transport networks inthe conductance per volume sense. Ring-porous trees, in contrast, tend to havedecelerating velocity from trunk to twig [39], consistent with more efficient area-increasing conduit networks. Unfortunately, we know of no comparable data forvines or leaf xylem, but we would expect decelerating velocities based on theanatomy (Figure 4.4).
4.8 DA VINCI’S RULE
Our results bear on the venerable “rule” first postulated by Da Vinci that trees showarea-preserving branching, meaning that the collective cross-sectional area of trunk,major branches, and minor branches is the same [27, 41]. Measurements generallyconfirm this rule, at least within the branches of the canopy [32,42]. Da Vinci basedhis rule on the explicit assumption that flow velocities were equal throughout thetree [13,41] and implicitly that branch cross-sectional area was proportional to thearea of the water-conducting conduits. Neither of these assumptions must be truefrom first principles, nor are they true in fact. So why do trees tend to follow thisrule? We suggest that trees follow Da Vinci’s area-preserving branching patternbecause it is the best compromise between opposing demands of hydraulics (area-increasing conduit networks) and mechanics (area-decreasing branching of wood intotal).
4.9 DEVELOPMENTAL AND PHYSIOLOGICAL CONSTRAINTS ON TRANSPORT EFFICIENCY
In addition to the mechanical constraints on hydraulics discussed previously, thereare other considerations that limit efficiency. To achieve Murray-type architecturein combination with higher conduit furcation numbers (i.e., moving up on the Murray
3209_C004.fm Page 95 Tuesday, November 8, 2005 8:20 AM
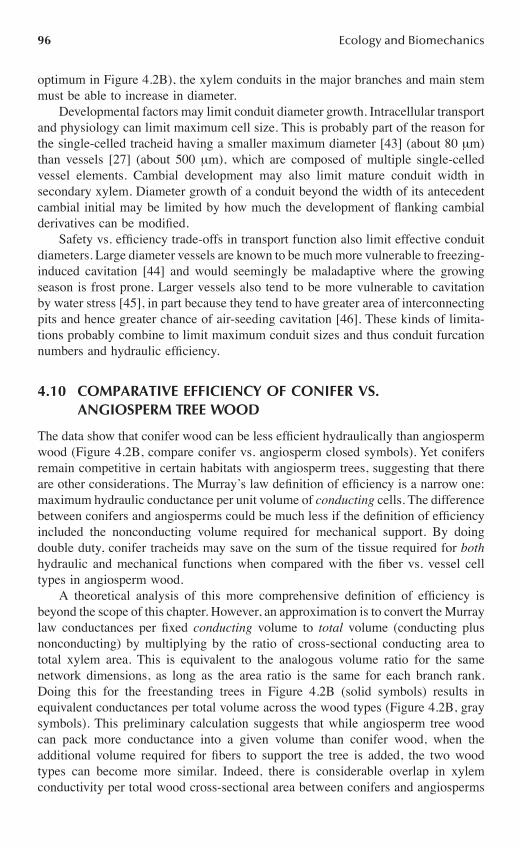
96 Ecology and Biomechanics
optimum in Figure 4.2B), the xylem conduits in the major branches and main stemmust be able to increase in diameter.
Developmental factors may limit conduit diameter growth. Intracellular transportand physiology can limit maximum cell size. This is probably part of the reason forthe single-celled tracheid having a smaller maximum diameter [43] (about 80 m)than vessels [27] (about 500 m), which are composed of multiple single-celledvessel elements. Cambial development may also limit mature conduit width insecondary xylem. Diameter growth of a conduit beyond the width of its antecedentcambial initial may be limited by how much the development of flanking cambialderivatives can be modified.
Safety vs. efficiency trade-offs in transport function also limit effective conduitdiameters. Large diameter vessels are known to be much more vulnerable to freezing-induced cavitation [44] and would seemingly be maladaptive where the growingseason is frost prone. Larger vessels also tend to be more vulnerable to cavitationby water stress [45], in part because they tend to have greater area of interconnectingpits and hence greater chance of air-seeding cavitation [46]. These kinds of limita-tions probably combine to limit maximum conduit sizes and thus conduit furcationnumbers and hydraulic efficiency.
4.10 COMPARATIVE EFFICIENCY OF CONIFER VS. ANGIOSPERM TREE WOOD
The data show that conifer wood can be less efficient hydraulically than angiospermwood (Figure 4.2B, compare conifer vs. angiosperm closed symbols). Yet conifersremain competitive in certain habitats with angiosperm trees, suggesting that thereare other considerations. The Murray’s law definition of efficiency is a narrow one:maximum hydraulic conductance per unit volume of conducting cells. The differencebetween conifers and angiosperms could be much less if the definition of efficiencyincluded the nonconducting volume required for mechanical support. By doingdouble duty, conifer tracheids may save on the sum of the tissue required for bothhydraulic and mechanical functions when compared with the fiber vs. vessel celltypes in angiosperm wood.
A theoretical analysis of this more comprehensive definition of efficiency isbeyond the scope of this chapter. However, an approximation is to convert the Murraylaw conductances per fixed conducting volume to total volume (conducting plusnonconducting) by multiplying by the ratio of cross-sectional conducting area tototal xylem area. This is equivalent to the analogous volume ratio for the samenetwork dimensions, as long as the area ratio is the same for each branch rank.Doing this for the freestanding trees in Figure 4.2B (solid symbols) results inequivalent conductances per total volume across the wood types (Figure 4.2B, graysymbols). This preliminary calculation suggests that while angiosperm tree woodcan pack more conductance into a given volume than conifer wood, when theadditional volume required for fibers to support the tree is added, the two woodtypes can become more similar. Indeed, there is considerable overlap in xylemconductivity per total wood cross-sectional area between conifers and angiosperms
3209_C004.fm Page 96 Tuesday, November 8, 2005 8:20 AM

Murray’s Law and the Vascular Architecture of Plants 97
[47,48], although angiosperms as a group reach a higher maximum. Conifers areoften competitive in stressful habitats [49] where avoidance of cavitation may limitvessel size, keeping conductivity per total wood area in angiosperms from signifi-cantly exceeding the conifer range.
4.11 CONCLUSIONS
In each case where conditions approached the Murray’s law assumptions, the xylemconduit network was at or near the Murray law optimum. Even the tracheid-basedconducting system of Ps. nudum conformed, suggesting the trait may be pervasivein the seedless vascular plants. Although Psilotum is allied to the ferns, its reducedmorphology and central strand of primary tracheids strongly resembles fossils of theearliest of vascular plants [50]. If these ancestral vascular plants also obeyed Murray’slaw, the selective advantage of the trait must have been quite strong. An early originof Murray architecture is consistent with the observation that ancestral vascularsystems did not function significantly in mechanical support of the plant [51].
A major mechanical role of xylem probably evolved with the kind of secondarygrowth seen in extant conifers and angiosperms. Murray’s law does not predict theoptimal conduit structure in the wood of these self-supporting trees because it doesnot consider the mechanical role of the conduit network. Nor did the conifer andangiosperm woods measured match the Murray’s law optimum. As predicted, how-ever, the less the conduits contributed to wood volume and mechanical support (asin the ring-porous angiosperm wood), the less was the deviation from Murray’s law.Although this means that the conduit portion of the wood can be inherently moreefficient in angiosperms vs. conifers, the advantage is less evident when the entirewood volume required for both hydraulic and mechanical functions is considered(Figure 4.2B, gray vs. closed symbols). To better assess the trade-off betweenhydraulic vs. mechanical demands on wood structure, an analysis that moves beyondMurray’s law is necessary.
ACKNOWLEDGMENTS
A Graduate Research Fellowship from the Graduate School at the University of Utahsupported KAM. Some funding was obtained from National Science Foundationgrant IBN-0112213 to JSS.
REFERENCES
1. Raven, J.A., Long-distance transport in non-vascular plants, Plant Cell Environ., 26,73, 2003.
2. Raven, J.A., The evolution of vascular land plants in relation to supracellular transportprocesses, Adv. Bot. Res., 5, 153, 1987.
3. Sperry, J.S., Evolution of water transport and xylem structure, Int. J. Plant Sci., 164,S115, 2003.
3209_C004.fm Page 97 Tuesday, November 8, 2005 8:20 AM

98 Ecology and Biomechanics
4. Niklas, K.J., The evolution of tracheid diameter in early vascular plants and itsimplications on the hydraulic conductance of the primary xylem strand, Evolution,39, 1110, 1985.
5. Hubbard, R.M. et al., Stomatal conductance and photosynthesis vary linearly withplant hydraulic conductance in ponderosa pine, Plant Cell Environ., 24, 113, 2001.
6. Meinzer, F.C. et al., Environmental and physiological regulation of transpiration intropical forest gap species: The influence of boundary layer and hydraulic properties,Oecologia, 101, 514, 1995.
7. Meinzer, F.C. and Grantz, D.A., Stomatal and hydraulic conductance in growingsugarcane: Stomatal adjustment to water transport capacity, Plant Cell Environ., 13,383, 1990.
8. Saliendra, N.Z., Meinzer, F.C., and Grantz, D.A., Water potential in sugarcane mea-sured from leaf segments in a pressure chamber, Agron. J., 82, 359, 1990.
9. Sperry, J.S., Alder, N.N., and Eastlack, S.E., The effect of reduced hydraulic conduc-tance on stomatal conductance and xylem cavitation, J. Exp. Bot., 44, 1075, 1993.
10. Sperry, J.S. and Pockman, W.T., Limitation of transpiration by hydraulic conductanceand xylem cavitation in Betula occidentalis, Plant Cell Environ., 16, 279, 1993.
11. McCulloh, K.A., Sperry, J.S., and Adler, F.R., Water transport in plants obeys Mur-ray’s law, Nature, 421, 939, 2003.
12. McCulloh, K.A., Sperry, J.S., and Adler, F.R., Murray’s law and the hydraulic versusmechanical functioning of wood, Funct. Ecol., 18: 931–938, 2004.
13. McCulloh, K.A. and Sperry, J.S., Patterns in hydraulic architecture and their impli-cations for transport efficiency, Tree Physiol., 25: 257–267.
14. McCulloh, K.A. and Sperry, J.S., The evaluation of Murray’s law in Psilotum nudum(Psilotaceae), an analogue of ancestral plants, Am. J. Bot., in press.
15. Enquist, B.J., West, G.B., and Brown, J.H., Quarter-power allometric scaling invascular plants: Functional basis and ecological consequences, in Scaling in Biology,Brown, J.H. and West, G.B., Eds., Oxford University Press, Oxford, 2000, p. 167.
16. West, G.B., Brown, J.H., and Enquist, B.J., A general model for the origin of allo-metric scaling laws in biology, Science, 276, 122, 1997.
17. West, G.B., Brown, J.H., and Enquist, B.J., A general model for the structure andallometry of plant vascular systems, Nature, 400, 664, 1999.
18. Kleiber, M., Body size and metabolism, Hilgardia, 6, 315, 1932.19. Niklas, K.J. and Enquist, B.J., Invariant scaling relationships for interspecific plant
biomass production rates and body size, Proc. Natl. Acad. Sci. USA, 98, 2922, 2001.20. Dodds, P., Rothman, D., and Weitz, J., Re-examination of the “3/4-law” of meta-
bolism, J. Theor. Biol., 209, 9, 2001.21. Kozlowski, J. and Konarzewski, M., Is West, Brown and Enquist’s model of allometric
scaling mathematically correct and biologically relevant? Funct. Ecol., 18, 283, 2004.22. West, G.B., Brown, J.H., and Enquist, B.J., The origin of universal scaling laws in
biology, in Scaling in Biology, Brown, J.H. and West, G.B., Eds., Oxford UniversityPress, Oxford, 2000, p. 87.
23. Murray, C.D., The physiological principle of minimum work. I. The vascular systemand the cost of blood volume., Proc. Natl. Acad. Sci. USA, 12, 207, 1926.
24. LaBarbera, M., Principles of design of fluid transport systems in zoology, Science,249, 992, 1990.
25. Sherman, T.F., On connecting large vessels to small: The meaning of Murray’s law,J. Gen. Physiol., 78, 431, 1981.
26. Vogel, S., Life in Moving Fluids: The Physical Biology of Flow, 2nd ed., PrincetonUniversity Press, Princeton, NJ, 1994.
3209_C004.fm Page 98 Tuesday, November 8, 2005 8:20 AM

Murray’s Law and the Vascular Architecture of Plants 99
27. Zimmermann, M.H., Xylem Structure and the Ascent of Sap, Springer-Verlag, Berlin,1983.
28. Sperry, J.S., Hacke, U.G., and Wheeler, J.W., Comparative analysis of end wallresistance in xylem conduits, Plant Cell Environ., 28: 456–465, 2005.
29. Zwieniecki, M.A., Melcher, P.J., and Holbrook, N.M., Hydraulic properties of indi-vidual xylem vessels of Fraxinus americana, J. Exp. Bot., 52, 257, 2001.
30. Pockman, W.T. and Sperry, J.S., Vulnerability to xylem cavitation and the distributionof Sonoran Desert vegetation, Am. J. Bot., 87, 1287, 2000.
31. Hacke, U.G. et al., Trends in wood density and structure are linked to prevention ofxylem implosion by negative pressure, Oecologia, 126, 457, 2001.
32. Shinozaki, K., Yoda, K., Hozumi, K., and Kira, T., A quantitative analysis of plantform — the pipe model theory: II. Further evidence of the theory and its implicationsin forest ecology, Jpn. J. Ecol., 14, 133, 1964.
33. Shinozaki, K., Yoda, K., Hozumi, K., and Kira, T., A quantitative analysis of plantform — the Pipe Model Theory: I. Basic analysis, Jpn. J. Ecol., 14, 97, 1964.
34. Gartner, B.L., Patterns of xylem variation within a tree and their hydraulic andmechanical consequences, in Plant Stems: Physiological and Functional Morphology,Gartner, B. L., Ed., Academic Press, New York, 1995, p. 125.
35. Keller, J.B. and Niordson, F.I., The tallest column, J. Math. Mech., 16, 433, 1966.36. Gallenmuller, F. et al., The growth form of Croton pullei (Euphorbiaceae) — Func-
tional morphology and biomechanics of a neotropical liana, Plant Biol., 3, 50, 2001.37. Speck, T. and Rowe, N.P., A quantitative approach for analytically defining size,
growth form, and habit in living and fossil plants, in The Evolution of Plant Archi-tecture, Kurmann, M.H. and Hemsley, A.R., Eds., Royal Botanic Garden, Kew, 1999,p. 447.
38. Andrade, J.L. et al., Regulation of water flux through trunks, branches, and leaves intrees of a lowland tropical forest, Oecologia, 115, 463, 1998.
39. Huber, B. and Schmidt, E., Weitere thermo-elektrische Untersuchungen uber denTranspirationsstrom der Baume., Tharandt Forst Jb, 87, 369, 1936.
40. McDonald, K.C., Zimmermann, R., and Kimball, J.S., Diurnal and spatial variationof xylem dielectric constant in Norway spruce (Picea abies [L.] Karst.) as related tomicroclimate, xylem sap flow, and xylem chemistry, IEEE Trans. Geosci. RemoteSensing, 40, 2063, 2002.
41. Richter, J.P., The Notebooks of Leonardo da Vinci (1452-1519), Compiled and Editedfrom the Original Manuscripts, Dover, New York, 1970.
42. Horn, H.S., Twigs, trees and the dynamics of carbon in the landscape, in Scaling inBiology, Brown, J.H. and West, G.B., Eds., Oxford University Press, Oxford, 2000,p. 199.
43. Lancashire, J.R. and Ennos, A.R., Modelling the hydrodynamic resistance of borderedpits, J. Exp. Bot., 53, 1485, 2002.
44. Davis, S.D., Sperry, J.S., and Hacke, U.G., The relationship between xylem conduitdiameter and cavitation caused by freeze-thaw events, Am. J. Bot., 86, 1367, 1999.
45. Tyree, M., Davis, S., and Cochard, H., Biophysical perspectives of xylem evolution— Is there a tradeoff of hydraulic efficiency for vulnerability to dysfunction?, IAWAJ., 15, 335, 1994.
46. Wheeler, J.W. et al., Inter-vessel pitting and cavitation in woody Rosaceae and othervesseled plants: A basis for a safety vs. efficiency trade-off in xylem transport, PlantCell Environ., 28: 800–812, 2005.
3209_C004.fm Page 99 Tuesday, November 8, 2005 8:20 AM

100 Ecology and Biomechanics
47. Becker, P., Tyree, M.T., and Tsuda, M., Hydraulic conductances of angiosperm versusconifers: Similar transport sufficiency at the whole-plant level, Tree Physiol., 19, 445,1999.
48. Tyree, M.T. and Zimmermann, M.H., Xylem Structure and the Ascent of Sap,Springer, Berlin, 2002.
49. Bond, W.J., The tortoise and the hare: Ecology of angiosperm dominance and gym-nosperm persistence, Biol. J. Linn. Soc., 36, 227, 1989.
50. Kenrick, P. and Crane, P.R., The origin and early evolution of plants on land, Nature,389, 33, 1997.
51. Vincent, J.F.V. and Jeronimidis, G., The mechanical design of fossil plants, in Bio-mechanics and Evolution, Rayner, J.M.V. and Wootten, R.J., Eds., Cambridge Uni-versity Press, Cambridge, 1991, p. 21.
3209_C004.fm Page 100 Tuesday, November 8, 2005 8:20 AM

101
5 Plant–Animal Mechanics and Bite Procurement in Grazing Ruminants
Wendy M. Griffiths
CONTENTS
5.1 Introduction ..................................................................................................1015.2 Ruminant Species.........................................................................................1025.3 Harvesting Apparatus ...................................................................................1025.4 Bite Procurement..........................................................................................1045.5 Plant Form and Fracture Mechanics at the Plant Level..............................1045.6 Instrumentation for Measuring Plant Fracture Mechanics under
Tension .........................................................................................................1075.7 Application of Plant Fracture Mechanics to Foraging Strategies...............1095.8 Instrumentation for Measuring Bite Force at the Animal Level.................111
5.8.1 Prediction of Bite Force from Assessment of Plant Fracture Properties..........................................................................................111
5.8.2 Biomechanical Force Instruments ...................................................1145.9 Biting Effort .................................................................................................1155.10 Conclusion....................................................................................................118Acknowledgments..................................................................................................118References..............................................................................................................118
5.1 INTRODUCTION
Mammalian herbivores are major suppliers of the worlds’ milk, meat, and fiberproducts to humans. Their existence on the various land types on Earth can beattributed to a behavioral mechanism geared toward maximizing fitness (i.e., prolif-eration of their genes via the production of progeny) and is commonly explained bythe body of evolutionary theory known as Optimal Foraging Theory (OFT) [1]. Theacquisition and assimilation of nutrients from food is of paramount importance tothe ruminant because it is the fundamental process that enables survival, growth,and reproduction. Energy is the driving currency, but grazing ruminants face complexdecisions in searching for and harvesting adequate forage to meet their energyrequirements for survival, growth, and reproduction. Vegetation heterogeneity adds
3209_C005.fm Page 101 Thursday, November 10, 2005 10:45 AM

102 Ecology and Biomechanics
complexity to even the simplest of ecosystems and is itself a circular process shapedby the effects of herbivory on the environment. While food intake lies at the heartof the survival of animal species, the discrimination by animals between plant speciesand their morphological organs is central to the survival and regeneration of theplant population.
Despite the advances that have been made in understanding forage intake [2–4],mechanistic explanations for diet choice and observed behavior remain scarce. Theapplication of materials science theory to understanding biological problems inherbivores has led to a revived interest in quantifying plant fracture mechanics, butparallel progress in understanding the mechanistic relationships between animal andplant mechanical properties and grazing strategies in ruminants, particularly ofcontrasting body size, has been much slower. The force that grazing animals exertin procuring a bite has received little attention despite the clear linkages with herbageintake. This probably reflects the difficulties associated with quantification of biteforce. The objectives of this chapter are to: (1) discuss the ruminant species, theirharvesting apparatus, and the process that these herbivores use to harvest food, (2)clarify the terminology used to describe fracture mechanics as they apply to rumi-nants, (3) demonstrate how bite force can be quantified and discuss the problemsand opportunities facing the researcher, and (4) introduce the concept of biting effort.
5.2 RUMINANT SPECIES
Ruminant species constitute a suborder of Artiodactyla, the hoofed mammals, withthe most significant anatomical difference between ruminants and other mammalsbeing the four-chambered (rumen, reticulum, omasum, and abomasum) digestivesystem that allows ruminants to derive 60% of their energy requirements from themicrobial fermentation in the rumen–reticulum of the constituents of plant cell walls.Furthermore, the presence of the rumen–reticulum permits the distinguishable “cudchewing” cycle known as rumination. The literature has been dominated by thescheme of ruminants being grouped into three ecophysiological types [5] accordingto the predominant food type they consume: grazers (e.g., cattle, Bos taurus),browsers (e.g., moose, Alces alces), and intermediate feeders (e.g., red deer, Cervuselaphus). Furthermore, ruminant species also exhibit strong variations in the abilityto digest fiber, a feature that has been attributed to ecophysiological differencesbetween species [6], although more recently it has been proposed [7] that themorphophysiological contrasts in digestive capability merely reflect the contrasts inbody size and not feeding type as historically presented.
5.3 HARVESTING APPARATUS
Physically, the harvesting apparatus is housed within an elongated and bluntlypointed skull and is an important structure within the ruminants’ body. The jaws arethe housing to which the teeth and muscles are attached. The upper jawbone, oftencalled the “maxilla,” is fused to the skull, and the lower jawbone, termed the“mandible,” is hinged at each side to the bones of the temple by ligaments. Common
3209_C005.fm Page 102 Thursday, November 10, 2005 10:45 AM
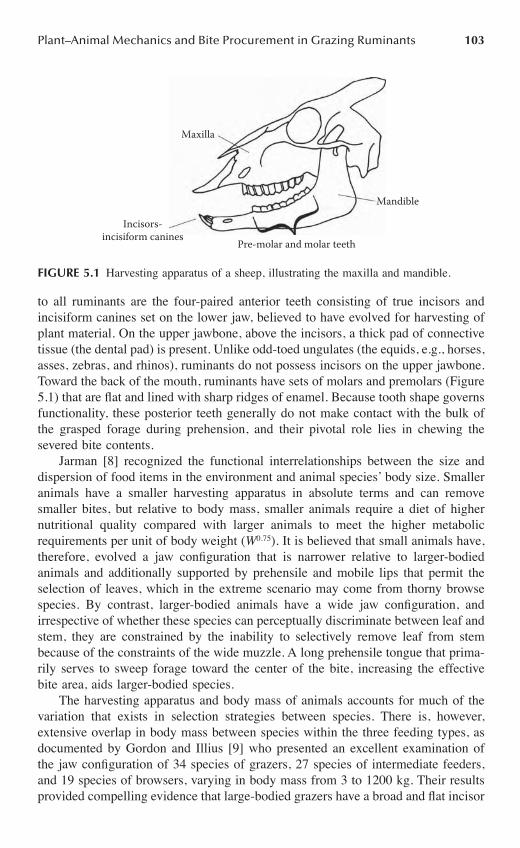
Plant–Animal Mechanics and Bite Procurement in Grazing Ruminants 103
to all ruminants are the four-paired anterior teeth consisting of true incisors andincisiform canines set on the lower jaw, believed to have evolved for harvesting ofplant material. On the upper jawbone, above the incisors, a thick pad of connectivetissue (the dental pad) is present. Unlike odd-toed ungulates (the equids, e.g., horses,asses, zebras, and rhinos), ruminants do not possess incisors on the upper jawbone.Toward the back of the mouth, ruminants have sets of molars and premolars (Figure5.1) that are flat and lined with sharp ridges of enamel. Because tooth shape governsfunctionality, these posterior teeth generally do not make contact with the bulk ofthe grasped forage during prehension, and their pivotal role lies in chewing thesevered bite contents.
Jarman [8] recognized the functional interrelationships between the size anddispersion of food items in the environment and animal species’ body size. Smalleranimals have a smaller harvesting apparatus in absolute terms and can removesmaller bites, but relative to body mass, smaller animals require a diet of highernutritional quality compared with larger animals to meet the higher metabolicrequirements per unit of body weight (W0.75). It is believed that small animals have,therefore, evolved a jaw configuration that is narrower relative to larger-bodiedanimals and additionally supported by prehensile and mobile lips that permit theselection of leaves, which in the extreme scenario may come from thorny browsespecies. By contrast, larger-bodied animals have a wide jaw configuration, andirrespective of whether these species can perceptually discriminate between leaf andstem, they are constrained by the inability to selectively remove leaf from stembecause of the constraints of the wide muzzle. A long prehensile tongue that prima-rily serves to sweep forage toward the center of the bite, increasing the effectivebite area, aids larger-bodied species.
The harvesting apparatus and body mass of animals accounts for much of thevariation that exists in selection strategies between species. There is, however,extensive overlap in body mass between species within the three feeding types, asdocumented by Gordon and Illius [9] who presented an excellent examination ofthe jaw configuration of 34 species of grazers, 27 species of intermediate feeders,and 19 species of browsers, varying in body mass from 3 to 1200 kg. Their resultsprovided compelling evidence that large-bodied grazers have a broad and flat incisor
FIGURE 5.1 Harvesting apparatus of a sheep, illustrating the maxilla and mandible.
Maxilla
Mandible
Pre-molar and molar teeth
Incisors-incisiform canines
3209_C005.fm Page 103 Thursday, November 10, 2005 10:45 AM

104 Ecology and Biomechanics
arcade, where incisor arcade is defined as the distance between the outer edges ofthe incisiform canines on the right and left ramus, compared to large-bodied browsersof a similar body mass who have a more narrow and pointed arcade. Similar patternsare evident between small-bodied grazers and browsers of a similar body mass.
5.4 BITE PROCUREMENT
Interest in the application of engineering principles to the understanding of biologicalsystems such as foraging behavior stems from the knowledge that these principlesare embedded in the everyday behavior of animals. Ruminants forage in diverseenvironments with available forage offering relatively low levels of nutrients peringested bite. They face considerable challenges in procuring a large number of bitesduring a 9- to 10-hr day of grazing activity (approximately 30,000 bites for cattle);consequently, the “bite” is considered the building block of daily herbage intake[10,11].
Alternating periods of grazing, rumination, and rest constitute the diurnal activityof a ruminant. During grazing, the location of potential bites while the animal’sforelegs are stationary is known as a “feeding station” [12] and is defined as thesemicircular area in front of and to each side of the animal. The establishment of afeeding station implies that one or both of the peripheral senses — sight and smell— have been activated, while the senses of taste and touch influence subsequentbehavior following the procurement of initial bites [13]. Procurement of a bite isinitiated when the animal lowers its head in search of food. A bite is then removedwhen a series of manipulative jaw movements (with or without protruding tonguesweeps) gathers herbage, which is gripped by the incisors biting against the dentalpad, with forage material effectively running across the incisal edge, allowing forseverance to result from the animal jerking its head in a characteristic and timelyfashion. On dense foliage or swards of strong phenological contrast, foliage may belost during the jerking of the head since stiff stems increase the probability that thefoliage will spring back, evading the clamping action of the jaws. Furthermore, thebite may necessitate several swinging or jerking motions of the head (i.e., one ormore tugs) to sever the bite. The principle of any foraging strategy is dependentupon how the ruminant animal decides where to select bites from, across the habitatas well as from within the sward canopy, and this entails a series of complexmechanisms that have yet to be unraveled.
5.5 PLANT FORM AND FRACTURE MECHANICS AT THE PLANT LEVEL
Plants are the staple source of the mammalian herbivore diet. The leaves are generallyflat and engineered to capture sunlight for photosynthesis, the primary process thatleads to the production of energy, a source that animal subsistence and productionis dependent upon. Plants themselves are complex but can be divided into three mainmorphological organs — roots, stems, and leaves — which are each exposed toenvironmental forms of mechanical strain. Leaves of monocots are constructed from
3209_C005.fm Page 104 Thursday, November 10, 2005 10:45 AM

Plant–Animal Mechanics and Bite Procurement in Grazing Ruminants 105
vascular tissue that forms in parallel strands (veins) extending along the long axisof the leaf. This vascular tissue is supported by mesophyll tissue (i.e., sclerenchyma,storage parenchyma, and clorenchyma cells) and is covered by waxy epidermaltissue that reduces water loss from evaporation. Sclerenchyma is of great interest inmaterials science because these cells have thick, rigid, nonstretchable secondarywalls that confer strength to the plant. There is wide variation in the interveinaldistance between plant species, but a small interveinal distance does not necessarilyimply that a leaf will be less digestible to livestock [14]. It is the organization ofthe sclerenchyma bundles that determines fracture properties, and this fact formedthe basis of the comment from Wright and Illius [15] that the properties determiningdigestion were essentially those influencing fracture mechanics. Although fibers mayonly constitute a very small proportion (5%) of the leaf cross-sectional area, thatseemingly small proportion accounts for 90 to 95% of longitudinal stiffness [16].
Animal scientists interested in digestive function have long been interested inthe fracture of cellular material as an indicator of its susceptibility to crushing andshearing forces during rumination. As a result, strong working relationships havebeen forged between animal scientists and plant breeders, with much of the workinstigated by plant breeders aimed at selecting for plant traits that increased feedingvalue (FV), and this has been reflected in the strong focus on screening for lowshear strength [17]. Plant fracture properties have also been assessed and related toforage avoidance and/or preference and forage intake [18–21], trampling resistance[22], and plant uprooting (“pulling”) [23]. Additionally, the impact of environmentalconstraints on plant fracture properties have been evaluated [16,24] alongside therelationships with bite force [25,26] and bite dimensions [27,28]. Studies predom-inantly investigate the fracture mechanics of leaves since leaves are innately thepreferred morphological organ. Nevertheless, there have been important contribu-tions from examination of the stem properties of monocotyledons [15] and dicoty-ledons [18,29,30].
There is a broad range of terminology within the subject of fracture mechanicsin plants. In an agricultural context, one of the pioneering studies examining plantfracture properties was the work by Evans [31], but like many other studies, thisresearch has attracted widespread criticism for the inconsistency in adhering to thefundamental engineering principles underlying fracture mechanics. Several pub-lished studies and review articles have addressed the confusion in the use of descrip-tive terms and the units of expression for defining the fracture mechanics in plants.This has generally led to better application of terminology, but incorrect parametersand units still surface in the literature [22,23], largely due to the subjective natureof the experimental objectives.
Briefly, fracture in a test specimen involves both the initiation and propagationof a crack. Cracks can be propagated by three contrasting modes: mode I is bytension (crack opening), mode II is by shear (edge-sliding or in-plane shearingmovement), and mode III is caused by tearing (out-of-plane shearing movement)[32]. Where ruminants are concerned, mode I fracture tests best describe the har-vesting of forage in a predominantly vertical dimension while mode III fracturerepresents the mechanisms of fracture that take place when forage is crushed andground against the molars during chewing.
3209_C005.fm Page 105 Thursday, November 10, 2005 10:45 AM

106 Ecology and Biomechanics
It can also be helpful to be familiar with how materials perform under load.Figure 5.2a and 5.2b illustrate simplified representations of plant lamina when testedunder tension (mode I) and out-of-plane shear (mode III) modes, respectively. Thetriangular-shaped force-displacement curve in Figure 5.2a illustrates the dynamicsof a leaf under tension. The curve represents a steady linear increase in force, theslope being an indicator of the leaf’s stiffness, until the leaf specimen fractures, atwhich point the material ceases to be elastic, resulting in a sudden decrease in forceto zero immediately after fracture. By contrast, the spiky force–displacement curvein Figure 5.2b illustrates the dynamic relationship of the shearing of a leaf specimen,where the force is constantly changing in a controlled manner as a crack is propa-gated across the specimen.
The objective of this chapter is to review and discuss the role of plant–animalmechanics in understanding bite procurement. The focus of the remainder of thischapter, therefore, concerns itself with only mode I fracture where relevant. Threeplant-based terms of interest in understanding the procurement constraints facinggrazing ruminants were summarized by Griffiths and Gordon [33]:
FIGURE 5.2 Simulated force-displacement curves for lamina from (a) tensile (mode I) and(b) out-of-plane shear (mode III) fracture tests.
14
12
10
8
6
4
2
8
6
4
2
0
0
Forc
e (N
)Fo
rce
(N)
(a)
(b)
0 2 4 6 8 10 12 14 16 18Displacement (mm)
3209_C005.fm Page 106 Thursday, November 10, 2005 10:45 AM

Plant–Animal Mechanics and Bite Procurement in Grazing Ruminants 107
• Fracture force is a measure of the force required to fracture a plant organunder tension and can be assessed from the maximum force recorded onthe force–displacement curve that produces fracture.
• Tensile strength is the fracture force under tension per unit of cross-sectional area of the plant specimen.
• Resistance is a plant-based term that has no underlying engineering con-cept, but it carries importance in the application of plant fracture mechan-ics to predicting foraging strategies in ruminants. It can be defined as theaccumulated force required by the animal to sever all the plant organsencompassed within the bite. It can be argued that tensile strength is ameasure of resistance, but in relation to ruminants, we are interested inthe resistance of the bite contents to rupture under load, and hence theaccumulation of plant material.
5.6 INSTRUMENTATION FOR MEASURING PLANT FRACTURE MECHANICS UNDER TENSION
Tensile (mode I fracture) tests have arguably received less attention than out-of-plane shear (mode III) tests in the literature. While this reflects the greater attentionthat has been given to the importance of chewing, it also, in part, reflects the factthat tensile tests are more awkward to perform successfully. Nevertheless, theincreased reporting of tensile tests with reference to ruminants is recognition thatforages place different food procurement constraints on ruminants, which feed bygrasping and tearing herbage with their muscle mass, as opposed to invertebratesthat chew between the fibers of leaves.
Tensile tests are commonly conducted by securing the test piece between twoclamps and breaking the specimen by longitudinal pull. Examination of the literature,however, shows profound deficiencies in the reporting of instrumentation and proceduresfor assessment of tensile strength in grassland studies [15,21,22,26,29,31,34–36]. Theinstrumentation of Sun and Liddle [22] was a modification of that used by Evans [31].The apparatus consisted of a pivoting beam, with a clamp setup on one side and a buckethung on the other side into which sand was poured until fracture of the specimenoccurred. Spring-tensioned instruments used by Diaz et al. [21] and Adler et al. [37],modeled on that described by Hendry and Grime [38], are of similar design to a manuallyoperated fiber-testing machine. Plant material is clamped between screw-type clamps,and tension is applied to the plant material by winding up a spring-operated crank untilfracture results. These two forms of instrumentation provide a subjective measure offracture force and can fulfill the objectives of an experiment designed to compare tensilestrength across a range of plant species or genera under a prescribed set of environmentalconditions. Translation to understanding grazing mechanics is, however, limited. TheInstron testing instruments reported by Henry et al. [39] and Wright and Illius [15] offertighter control over acceleration and greater precision in recording fracture force. Addi-tionally, the machines are compatible with computers and/or plotters that plot theforce–displacement curve for each test specimen, which provides visual reinforcementof the timing selection of fracture.
3209_C005.fm Page 107 Thursday, November 10, 2005 10:45 AM

108 Ecology and Biomechanics
Following the choice of apparatus, a clamp that minimizes slippage while simul-taneously minimizing damage from the compression force applied to the test spec-imen at the site of the clamp has been a serious obstacle in acquiring reliable andrepeatable estimates of tensile strength. Samples that fracture at the vicinity of theclamp should be discarded, with good reason, because their inclusion will lead toerroneous data. Not all studies detail the clamp type used, but square clamps areoften surfaced with rubber and/or emery paper [31]. Griffiths [40] used one clampsurfaced with emery paper, and a second clamp with one side surfaced with rubberthat closed against a solid square cross bar, displaced 10 mm from the top of theclamp, to simulate the incisor grip. Henry et al. [39] devised cylindrical clamps andargued that the clamp method eliminated stress concentration by allowing a gradualincrease in the transmitted force to the specimen around the periphery of the cylinder,avoiding fracture at the clamp. However, cylindrical clamps necessitate long speci-men lengths and restrict the opportunities for assessment of the fracture mechanicsof short vegetative forage material. Vincent [41] recommended that specimens beglued to tabs of aluminum, which could then be held by clamps, and a more recentstudy [34] described a “glue and screw” technique where the test specimen wasglued into the slotted heads of screws.
Notching has been used to control the site of fracture, involving the creation ofa small notch at the edge of the test piece using a needle or razor blade. Manymonocotyledons with their parallel venation do not transmit shear and are considerednotch-insensitive [16], although there are exceptions, and notch insensitivity shouldnot be assumed to apply to all genera. Notch insensitivity implies that a single fibercan be broken without affecting the strength of the test specimen since the stress isdistributed evenly among the remaining fibers. Given the ease with which notchingcan be carried out and the advantages that it offers in minimizing the number ofsamples fracturing in the region of the clamp, it is perhaps rather surprising theprocedure has not been more widely utilized. Wright and Illius [15] assessed thefracture properties of leaf and pseudostem in the same manner, although the pseu-dostem samples could not be notched. By contrast, to assess the tensile strength ofculms, Hongo and Akimoto [25] used the chuck of an electric drill as the clamprather than jaw clamps (specifications not given) that had been used for leaves.Culms were wrapped with emery paper and enclosed within a thin rubber tube withone end inserted into the chuck. A further concern over the use of clamps is theneed to standardize clamp compression force between specimen tests. Screw-typeclamps [21,42] lead to inconsistency in the compression force between tests whereaspneumatic clamps, often found on floor-positioned or bench-top Instron testingmachines [15], eliminate this problem.
Implicit in materials science is the principle that when any load is applied to anobject, strain energy will be stored in that object. Atkins and Mai [43] suggestedthat it was critical that the test specimen be unloaded prior to specimen failure, andthe most appropriate method to ensure that that this has occurred is to conductmechanical tests at a slow and constant speed. Wide ranges of extension rates havebeen reported from as low as 5 mm/min [15] to 10 to 15 mm/min [25,26,39] throughto 50 mm/min [34,44]. However, it must be noted that the removal of elastic strainenergy from the test specimen is only a prerequisite where the stress–strain relation
3209_C005.fm Page 108 Thursday, November 10, 2005 10:45 AM

Plant–Animal Mechanics and Bite Procurement in Grazing Ruminants 109
is to be assessed, and, therefore, the work to fracture is calculated using thework–area method. For estimates of fracture force, the use of faster rates of extensionwould more closely mimic the fast rates of head acceleration used by ruminantsduring bite severance [45].
The majority of studies utilize the youngest fully expanded leaf, which is usuallythe first leaf to make contact with the animal’s mouth. However, some studies haveinvolved measurements on older leaves, which require greater force to fracture[15,39], so caution must be exercised when comparing studies. Although an intact,whole leaf is usually tested, there have been reports of tests performed on an excisedstrip of leaf, running parallel with the midrib [34], reinforcing the point that it iscritical to assess what the tensile strength estimate is related to. Moreover, the siteof fracture can hamper comparisons across studies. Leaves are not homogeneousalong their length, and thus the position of measurement can influence the estimateof tensile strength. This was the reason why Evans [31] assessed tensile strength asbeing equal to the breaking load divided by the dry weight of a 5 cm length, despitehaving correctly defined tensile strength in the introduction to the study. MacAdamand Mayland [35] showed that the position of maximum leaf width does not equatewith the midpoint of the leaf and that there is a region, approximately 50 to 80 mmlong, of constant maximal width in fully expanded tall fescue (Festuca arundincea)leaves. This approach contrasts with that of Zhang et al. [26] who used 20 cm lengthsof the central portion of orchard grass (Dactylis glomerata) leaves and Sun andLiddle [22] who clamped leaves one-third of the distance from each end. It isinteresting to note that Wright and Illius [15] did not assess tensile strength; rather,they quantified the energy required to fracture the specimen standardized for crosssection, avoiding any confounding variation due to contrasting sites of fracturebetween plant species.
The instrumentation described has all involved plant material being cut from thefield or from pots in chamber-grown complexes. A portable instrument consistingof modified pliers with a strain gauge to assess tensile strength of plant specimensgrowing in situ was developed by Westfall et al. [46]. However, it was not clear howclamp compression and acceleration of the longitudinal pull were controlled, factorsthat have been discussed previously, and the apparatus probably offers little advan-tage over the other forms of instrumentation other than the fact that plants arenaturally anchored.
5.7 APPLICATION OF PLANT FRACTURE MECHANICS TO FORAGING STRATEGIES
Why are plant ecologists interested in the application of materials science theory inunderstanding bite mechanics? It is energetically profitable for animals to penetratedeep into the sward canopy [27,47], and yet empirical evidence has shown thatruminants forage using a stratum-orientated depletion style at the patch scale, wherea stratum is defined as a depth of sward canopy confined between two distinct lines.Such a strategy implies that bites from one stratum are removed before penetrationinto a second stratum [48,49], with the depth of the stratum determined by the
3209_C005.fm Page 109 Thursday, November 10, 2005 10:45 AM

110 Ecology and Biomechanics
magnitude of structural complexity [50,51]. Understanding the conceptual basis ofbite depth has been the subject of ongoing research over the past decade with astrong focus on the linkage with bite force. The hypotheses of Summit Force,Balancing Reward against the cost of bite procurement and Marginal Revenue haveall been tested, but evidence to support any of the hypotheses is weak [33]. Theoriginal Summit Force theory implied that once a maximum force was attained, thebite dimensions, primarily bite area, would be moderated to maintain a constant biteforce. Evidence does suggest that animals moderate the bite area when faced withincreased strength of plant components or increased tiller density — and thus biteresistance — but the adjustment is much smaller than the magnitude of the increasein bite resistance [2,47,52,53]. Further, several studies have shown no constancy inthe force per bite relative to the reward attained [27,52,54]. A study by Illius et al.[27] found that goats offered a group of broad-leaved grasses grazed to differentresidual sward heights — and so contrasting bite depths — and exerted variation inbite force to sever the bites, with bite depth being equated to common marginalrevenue. However, in comparison with a group of fine-leaved grasses, the value forcommon Marginal Revenue differed, leaving insufficient evidence for the acceptanceof the Marginal Revenue hypothesis.
In understanding the mechanical interactions and grazing strategies of ruminants,much of the interest lies in defining the force that animals exert in severing a bite.Griffiths and Gordon [33] contended that there are two important animal-based termswhen assessing the magnitude of force animals exert in procuring forage:
• Bite force• Biting effort
Peak bite force represents the maximum force that an animal exerts in three-dimen-sional space to sever a bite of herbage and has been referred to in studies with othervertebrates as the “maximal bite capacity” [55]. Care is required to differentiatebetween bite force and the force generated by the masseter muscle during themechanical action of clamping forage between incisors and dental pad. Likewise,bite force should be differentiated from the force applied during food comminution,where substantial forces are required during occlusal motions of crushing and grind-ing the food bolus against the molars. The peak force exerted in severance of foragematerial is thought of as a response to muscle moving against a fixed anchor of bodymass, and to generate the cyclic patterns depicted on force–time curves from bio-mechanical force plates, animals must move the mass of the head in rhythm. Bitingeffort, as defined by Griffiths and Gordon [33], is primarily determined by bite forcebut is regulated by the components of plant resistance and animal resistance, e.g.,head resistance. It is conceivable that other animal anatomical characteristics willshape biting effort. These authors argued that biting effort represents a holisticapproach to understanding the dynamic nature of the animal’s response to severanceconstraints arising from forage complexity.
How can biting effort be measured in real terms? The area under a force–timecurve, as output from a biomechanical force plate, can be used to represent the workdone. Since the forces that a grazing animal exerts in severing a bite of herbage are
3209_C005.fm Page 110 Thursday, November 10, 2005 10:45 AM

Plant–Animal Mechanics and Bite Procurement in Grazing Ruminants 111
related to time, an accurate assessment of energy is somewhat difficult to derive inthe absence of a measure of displacement. A conservative assumption on displace-ment from force–displacement curves could be used [47], but in the absence of moreevidence, the validity of the approach could be questioned. However, we wouldexpect that bites of a longer duration would utilize more muscular effort than thosebites that result in rapid fracture. The integral of force over time can be used as ameasure of bite effort. This appears valid on the assumption that muscles use energyfor isometric contractions and that energy is approximately proportional to force[56], so the term “bite effort” carries a physical meaning in a mechanical sense,even if it is somewhat subjective.
5.8 INSTRUMENTATION FOR MEASURING BITE FORCE AT THE ANIMAL LEVEL
Two approaches in quantitatively measuring the force that ruminants exert in theremoval of a bite of forage have been reported:
• Indirectly from plant fracture properties of leaf and stem• Directly from biomechanical force instruments
5.8.1 PREDICTION OF BITE FORCE FROM ASSESSMENT OF PLANT
FRACTURE PROPERTIES
The translation of plant fracture properties into the bite force exerted appears attrac-tive, but few researchers have attempted to relate fracture properties to bite force.A classic case of integration across the science and engineering disciplines is givenin the two studies by Wright and Illius [15] and Illius et al. [27] on the applicationof the fracture mechanics in a group of broad- and narrow-leaved grasses andmeasured bite dimensions in goats. These authors determined the predicted bite forceby substituting the residual heights from boxed grazed swards into polynomialregression equations summarizing force–canopy structure relationships based on themeasured fracture properties. With a similar focus to that of Illius and colleagues,Tharmaraj et al. [47] estimated the resistance of material in situ within a fixed bitearea of 100 cm2 (an average value for cattle) progressively down the sward canopyprofile using a tensile apparatus. Their polynomial curves showed marked changesin bite force around 0.6 to 0.7 of sward height, which is in agreement with otherpublished literature on pseudostem height in grazed swards [57]. The residual heightsfrom paddock-scale grazing sessions (greater than 1 h) were used to predict biteforce after adjustment for the measured bite area.
Despite these inspiring studies, there are limitations with the indirect approach.The most obvious is the assumption involved in modeling bite force as the summationof the strength of leaf and stem, and the number of organs severed in the bite [27,47]although Illius et al. [27] had noted that canopy structure has a greater bearing onbite force than individual plant strength. Nevertheless, the scaling of bite force withnumber of leaves harvested as determined by the area of sward encompassed withina bite, using a constant, might be ambiguous. A constant scaling factor would assume
3209_C005.fm Page 111 Thursday, November 10, 2005 10:45 AM
112 Ecology and Biomechanics
that all leaves fracture simultaneously under load. From aural observations we knowthat this characteristic does not hold true; output generated from biomechanical forceinstruments (see the next section) consistently show that the force–time curve canconsist of multiple peaks. Only very recently has there been quantification of thevariation between predictions of bite force from fracture properties and the actualforces exerted by the animal. Data from Zhang et al. [26] and unpublished data byW.M. Griffiths and also by E.A. Laca indicate that there is a large discrepancybetween the indirect and direct estimates of bite force. Figure 5.3, drawn from thedata of Zhang et al. [26], clearly show that the force exerted to sever a bite ofa known number of leaves was not proportional to the sum of the strength ofindividual leaves. However, it is conceivable that the timing of leaf fracture is onlyone contributor to the force per leaf response curve, and we are left wondering aboutmechanisms of fracture at the animal level.
A stiff tensile testing machine capable of recording in one dimension is restrictedto modeling the action of severance by vertical pull, excluding causes of frictionbetween forage material and the incisors. The procurement action in three-dimen-sional space has been clearly illustrated in the work of Griffiths and Gordon [33]and Zhang et al. [26]. A plant tiller can essentially be viewed as a moment arm, andcreation of an angle perpendicular to the tiller from the rooted position allows forgreater friction between the incisors and dental pad, avoiding an action where theincisors would merely scrape against the fibrous veins in the lamina. This leads usto think about the dynamics of vein fracture. According to materials science theory,many grass leaves do not become weaker with the introduction of a notch [41], and,therefore, the biting action of ruminants will not function as a concentrator of stress,making the grass easier to break. Bending flexibility of stems has been assessed asan index for trampling resistance [22], with marked variation between plant speciesin the angle at which stems break. Zhang et al. [26] reported that plant material was
FIGURE 5.3 Relationship between the number of leaves grazed and exerted force per bite(solid circles and fitted linear relationship) by sheep and the predicted bite force using a 1:1relationship (dashed line) based on the strength of a single leaf from tensile tests.
600
500
400
300
200
100
0
Forc
e (N
)
0 10 20 30 40 50Number of leaves per loadcell
3209_C005.fm Page 112 Thursday, November 10, 2005 10:45 AM

Plant–Animal Mechanics and Bite Procurement in Grazing Ruminants 113
generally severed when the angle was around 60˚ perpendicular to the vertical plane.While there has been no quantitative evidence for or against the argument of areduction in strength of plant organs after damage inflicted from being held at anangle over the incisors and exposed to compression stress during the clamping actionagainst the dental pad, it is plausible that the clamping action induces damage tothe outer fibers of the lamina from buckling. This would cause the fibers to weakenin much the same way as compression creasing in wood. The implication of suchan action is that tensile strength may not be the only plant mechanical parameterdetermining the ease of bite procurement [39].
Furthermore, compared with the tensile testing instrumentation, animals are softmachines constructed from muscles containing fibers that are extremely elastic and,therefore, have a large capability to store elastic-strain energy [58]. There does notappear to have been any examination of the storage of strain energy in the musclesof ruminant species, but it is conceivable that ruminants may exert sufficient forceto create cracks in some of the grasped forage, and the energy stored within musclesis then used to propagate a crack [59]. However, such a mechanism is likely to onlybe valid if the forage being harvested is considered notch-sensitive (e.g., Stipagigantea) [60]. Rate-dependent effects have been given as a more likely explanationfor notch-insensitive species [61]. King and Vincent [61] suggested that the stretchingof grasped leaves allows for the storage of elastic-strain energy in the respectiveleaves, and the quick jerking motion of the head then facilitates the generation of ashock wave through the leaves. This subsequently influences the fracture of theremaining fibers, most probably as a result of insufficient time for the stress to beredistributed among the remaining fibers, giving rise to an overload in strain energy[15]. This would go some way to explaining the faster rates of head acceleration insmall-bodied ruminants, with smaller muscle mass than larger species like cattle[45], and suggests very clearly that acceleration of the head plays a major contrib-uting role in the effort that animals exert in severing a bite.
The fibrous nature of forage material ingested and frequent contamination withsoil particles is primarily responsible for tooth wear in ruminants, lending to variationin the incisor–pad configuration [62]. However, there is no consistent evidence ofthe relation between incisor wear and reduced levels of animal performance [63],although a relationship between dental erosion of the molars and animal growth hasbeen documented [64]. Quantification of the role of dentition on procurement capa-bility and mechanism is largely unexplored, but Hongo et al. [65] showed that sheepthat had shed their two central temporary incisors found it difficult to increase thenumber of leaves procured with increasing sward density, a result that was reversedwhen the sheep grazed identical swards after the eruption and growth of the twopermanent central incisors [65]. Although the study was conducted with a smallnumber of animals (n = 3) that had little opportunity to adapt to foraging withoutthe temporary central incisors, the results clearly suggest that incisors do inflictdamage weakening plant tissue and/or forming a point of friction. This result issupported by the finding that in the absence of the two temporary central incisors,the force exerted per grasped leaf was significantly higher than when the animalsgrazed with complete dentition.
3209_C005.fm Page 113 Thursday, November 10, 2005 10:45 AM
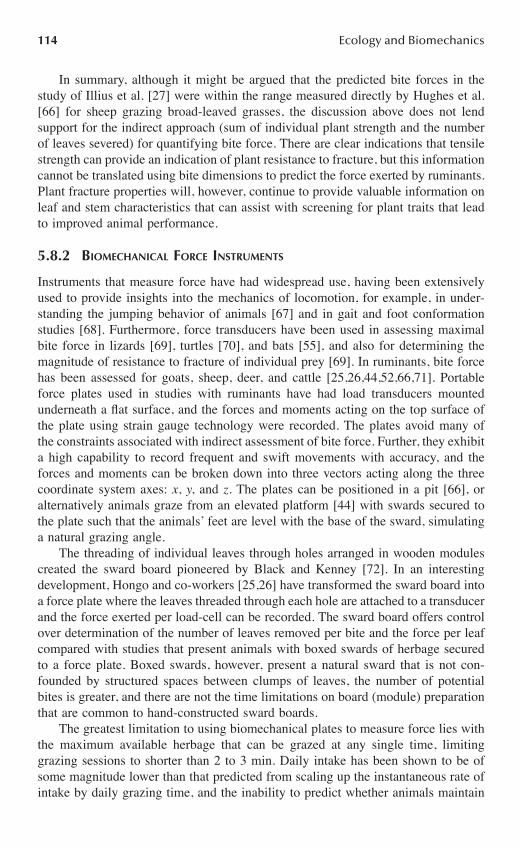
114 Ecology and Biomechanics
In summary, although it might be argued that the predicted bite forces in thestudy of Illius et al. [27] were within the range measured directly by Hughes et al.[66] for sheep grazing broad-leaved grasses, the discussion above does not lendsupport for the indirect approach (sum of individual plant strength and the numberof leaves severed) for quantifying bite force. There are clear indications that tensilestrength can provide an indication of plant resistance to fracture, but this informationcannot be translated using bite dimensions to predict the force exerted by ruminants.Plant fracture properties will, however, continue to provide valuable information onleaf and stem characteristics that can assist with screening for plant traits that leadto improved animal performance.
5.8.2 BIOMECHANICAL FORCE INSTRUMENTS
Instruments that measure force have had widespread use, having been extensivelyused to provide insights into the mechanics of locomotion, for example, in under-standing the jumping behavior of animals [67] and in gait and foot conformationstudies [68]. Furthermore, force transducers have been used in assessing maximalbite force in lizards [69], turtles [70], and bats [55], and also for determining themagnitude of resistance to fracture of individual prey [69]. In ruminants, bite forcehas been assessed for goats, sheep, deer, and cattle [25,26,44,52,66,71]. Portableforce plates used in studies with ruminants have had load transducers mountedunderneath a flat surface, and the forces and moments acting on the top surface ofthe plate using strain gauge technology were recorded. The plates avoid many ofthe constraints associated with indirect assessment of bite force. Further, they exhibita high capability to record frequent and swift movements with accuracy, and theforces and moments can be broken down into three vectors acting along the threecoordinate system axes: x, y, and z. The plates can be positioned in a pit [66], oralternatively animals graze from an elevated platform [44] with swards secured tothe plate such that the animals’ feet are level with the base of the sward, simulatinga natural grazing angle.
The threading of individual leaves through holes arranged in wooden modulescreated the sward board pioneered by Black and Kenney [72]. In an interestingdevelopment, Hongo and co-workers [25,26] have transformed the sward board intoa force plate where the leaves threaded through each hole are attached to a transducerand the force exerted per load-cell can be recorded. The sward board offers controlover determination of the number of leaves removed per bite and the force per leafcompared with studies that present animals with boxed swards of herbage securedto a force plate. Boxed swards, however, present a natural sward that is not con-founded by structured spaces between clumps of leaves, the number of potentialbites is greater, and there are not the time limitations on board (module) preparationthat are common to hand-constructed sward boards.
The greatest limitation to using biomechanical plates to measure force lies withthe maximum available herbage that can be grazed at any single time, limitinggrazing sessions to shorter than 2 to 3 min. Daily intake has been shown to be ofsome magnitude lower than that predicted from scaling up the instantaneous rate ofintake by daily grazing time, and the inability to predict whether animals maintain
3209_C005.fm Page 114 Thursday, November 10, 2005 10:45 AM

Plant–Animal Mechanics and Bite Procurement in Grazing Ruminants 115
instantaneous bite forces across temporal scales or lower the exerted force to main-tain a biting momentum is a limitation with such instrumentation. Nevertheless,force boards and plates avoid the confounding issues associated with one-dimen-sional laboratory-based instrumentation and allow for an objective measure of theforce exerted by the animal. However, with the recent attention given to quantifica-tion of bite force in ruminants, it has become apparent that there are issues sur-rounding output interpretation that need resolving. Output generated from forceplates has illustrated very clearly the incidence of multiple peaks, with at least twoand four peaks recorded for sheep and cattle, respectively [25,26]. The incidence ofmultiple peaks would be expected to correlate with capture rate since a faster capturerate allows for accurate representation of the dynamics of the force being appliedto the forage material, and likewise a slow capture rate will see the force accumulatedinto fewer data points. This raises concerns as to how bite force should be determined.A more representative assessment might be to describe force in terms of the numberof peaks rather than force per bite, but in many instances, this may only be relevantfor bites removed from dense and/or mature swards. Calculating a reward to costratio using the peak bite force recording can lead to erroneous predictions, whichcan only leave us wondering whether peak bite force is the parameter we seek.
On vegetative swards where the upper stratum offers little impediment to theprehension of leaf, the vertical vector is dominant, but with increasing sward struc-tural complexity, the relative magnitude of the longitudinal and lateral vectorsincreases [44]. Unpublished data [44] from deer, sheep, and cattle suggests that therelative change in the magnitude of the force vectors, in response to the spatialarrangement of morphological organs, appears to be less significant for smallerbodied animals. There is no comparable data since the individual vectors appear tobe independent in the data sets generated by Hongo and co-workers [25,26]. Nev-ertheless, clarification of the direction of head movement and dominant force vectoracross animal body size could provide insights into understanding bite procurement.Descriptive observations in the literature suggest that cattle and sheep sever plantmaterial using a backward jerk of the head [73,74], and deer tear herbage with anupward and downward jerking action [75], although these observations may beconfounded by the physical structure of the vegetation that animals were grazing.Hongo and Akimoto [25] suggested that the observation that cattle moved their headsin a backward direction when grazing mixtures of perennial ryegrass and reed canarygrass culms was a strategy to minimize the ingestion of stems because the jerkingaction in a backward plane permitted stiff stems to spring back from the clampedmaterial, and these authors described the foraging action as a “comb-out” strategy.
5.9 BITING EFFORT
The quantification of biting effort is an under-researched area deserving furtherinvestigation, particularly in view of the mounting evidence on the concern over thevalidity of peak bite force from recent studies in ruminants. Biting effort is an indexof efficiency that takes into account the activity budget for gathering as well asseverance of forage.
3209_C005.fm Page 115 Thursday, November 10, 2005 10:45 AM

116 Ecology and Biomechanics
One of the exciting challenges ahead lies in understanding the mechanistic basisfor the foraging strategy contrasts between animals of different body mass. As thebite composition of a large-bodied ruminant generally contains more fiber relativeto that of a small-bodied ruminant, larger-bodied ruminants must rely on theirstrength to harvest forage material to meet their requirements and in accordancewith forage supply. Animal mechanics permit this since it is believed that bite forcescales allometrically with body mass on the premise that force generated by muscleis proportional to the muscular cross-sectional area (W0.67). Consequently, the costsof severance for a given force are lower for animal species of greater body mass.This begs the question of how small-bodied ruminants cope when faced with thesame constraints as large-bodied ruminants. When presented with identical swards,sheep and deer [28] have been observed to exhibit a very similar grazing strategydespite a threefold difference in body mass between the two species. While it appearsthat there is a fixed force exerted on a bite of forage directly from the momentumof the head, as supported by the observation that force does not increase linearlywith increasing number of leaves procured at very low leaf density [26], there hasbeen little quantification of the effort and costs incurred in upholding the tension inthe muscles of the neck to maintain head momentum, although Illius et al. [27]commented that it must be considerable.
Allometric relationships between elements of feeding behavior in ruminants andbody mass have been studied in detail [76–78], and it would be reasonable to thinkthat an allometric relationship between bite force and body mass has evolved. Figure5.4 depicts the allometric relationship between body mass and peak bite force for arange of animal species (goat, sheep, deer, cattle, and horse) from the limited dataavailable in the literature [25,26,44,52,65]. The calculated exponent (0.77 ± 0.18)indicates that peak bite force scales allometrically with body mass. However, thehigh standard error reflects the greater variation among the smaller-bodied animals,and the reasons for such responses should be investigated. Further, there have beeninconsistent reports on the inter- and intraspecific allometric relationships betweenbody mass and bite depth [78,79]. In a horse–cattle comparison, Hongo and Akimoto[25] hypothesized that horses, which have anterior incisors on their upper jaw, wouldbe more efficient grazers on complex swards consisting of perennial ryegrass leavesand reed canary grass culms, but instead they found that horses exhibited littlecompetitive advantage over cattle.
A number of studies have shown that incisor breadth scales with body mass[9,78], and total masseter weight, which reflects masseter tissue size, is correlatedwith body mass [80]. However, unlike in some carnivores [81], there appears to beno compensation between mandibular length and masseter muscle mass in ruminantsdespite the fact that mandibular length scales with body mass. Given that themandible acts as a moment, the absence of any correlation between mandibularlength and masseter muscle mass implies a weaker gripping force at the incisors.Consequently, animals with a high mandibular length to body mass ratio (e.g., goatsand moose) are, theoretically, mechanically disadvantaged when procuring materialthat is tall and/or of high tensile strength. However, little is known about themechanical consequences of changes in mandibular length on the torque around thetemporomandibular joint in ruminants. Given that torque is the force over distance,
3209_C005.fm Page 116 Thursday, November 10, 2005 10:45 AM

Plant–Animal Mechanics and Bite Procurement in Grazing Ruminants 117
it could well be that the balance between incisor breadth and the magnitude ofprotrusion that has evolved in ruminants not only caters for selectivity but alsominimizes the competitive advantage of grazers over browsers of a similar bodymass. Compensation mechanisms for body mass are regularly observed in otherspecies, e.g., in flying insects [82], so it is more than likely that forms of mechanicaldesign, aside from rates of acceleration, contribute to the competitiveness of smaller-bodied ruminants, and the challenge is to think of approaches to investigate thosefeatures.
Quantification of biting effort would be a step forward, but success will bedetermined by the accuracy of defining the endpoints of bites on force–time curves.Since electric equipment generates noise, the potential for the location of endpointsto become clouded can be significant, particularly when the ratio between exertedforces and noise is weak. There have only been a few studies that have examinedbiting effort [44,47,52], limiting any generalization across plant species and animalbody mass. Hughes [52] found that the effort expended by sheep grazing prairiegrass (Bromus willdenowii) and tall fescue (Festuca arundincea) swards was similarbut lower than that on perennial ryegrass (Lolium perenne) swards. Unpublishedpreliminary data of Griffiths [44] showed that the across-bite contrast in biting effortfrom cattle grazing swards of Italian ryegrass (L. multiflorum) exceeded the contrastin peak bite force. Nevertheless, the data showed evidence of similarity in bite effortfor individual bites where there were strong contrasts in peak bite force. Furtherresearch on biting effort would help to clarify the consistency of biting effort acrossanimal species and sward complexity. The challenge is to investigate whether animalmechanics can assist with understanding the mechanisms for diet selection and thebite dimensions. It will only be after we have addressed questions concerning bitingeffort that we will be able to draw conclusions regarding the mechanistic basis for
FIGURE 5.4 Relationship between peak bite force (N) and body mass (kg) for a range ofanimal species. Solid circle: goat; open circle: sheep; solid square: deer; solid triangle: cattle;open triangle: horse. Solid line represents the fitted linear relationship (y = 0.08 + 0.77x ±0.18, p = 0.002, R2 = 0.818).
1.5 2.0 2.5 3.00.0
0.5
1.0
1.5
2.0
2.5
Log body mass (kg)
Log
peak
bite
forc
e (N
)
3209_C005.fm Page 117 Thursday, November 10, 2005 10:45 AM

118 Ecology and Biomechanics
the contrast or similarity in grazing strategies across species of contrasting bodymass and understand functionality of cospecies grazing in ecosystems.
5.10 CONCLUSION
In summary, although there has been renewed interest in quantifying plant fracturemechanics, particularly plant tensile strength, indications are that the procurementof forage material is far more complex than can be defined indirectly from assessmentof plant mechanical parameters. Looking to the future, there is a call for a moreholistic approach that includes the quantification of biting effort from assessmentof mechanical properties directly. There is tremendous scope for applying engineer-ing principles in understanding the foraging strategies used by animals of contrastingbody mass, and while much of this research in the short term will be conducted atthe small scale, it is foreseeable that in the longer term, the work will need to spantemporal scales to achieve wider application across ecosystems.
ACKNOWLEDGMENTS
I would like to thank J. Hodgson and I.J. Gordon for their constructive commentsand J. Perez-Barberia, who kindly drew Figure 5.1.
REFERENCES
1. Charnov, E.L., Optimal foraging: The marginal value theorem, Theor. Popul. Biol.,9, 129, 1976.
2. Laca, E.A. et al., Effects of sward height and bulk-density on bite dimensions ofcattle grazing homogeneous swards, Grass Forage Sci., 47, 91, 1992.
3. Ginnett, T.F. et al., Patch depression in grazers: The roles of biomass distribution andresidual stems, Funct. Ecol., 13, 37, 1999.
4. Baumont, R. et al., A mechanistic model of intake and grazing behaviour in sheepintegrating sward architecture and animal decisions, Anim. Feed Sci. Tech., 112, 5,2004.
5. Hofmann, R.R. and Stewart, D.R.M., Grazers and browsers: A classification basedon the stomach structure and feeding habits of East African ruminants, Mammalia,36, 226, 1972.
6. Iason, G.R. and Van Wieren, S.E., Digestive and ingestive adaptations of mammalianherbivores to low quality forage, in Herbivores: Between Plants and Predators, Olf,H., Brown, V.K. and Brent, R., Eds., Blackwells Scientific Publications, Oxford, 1999,p. 337.
7. Perez-Barberia, F.J. and Gordon, I.J., Relationships between oral morphology andfeeding style in the ungulata: A phylogenetically controlled evaluation, Proc. R. Soc.Lond. B-Biol. Sci., 268, 1023, 2001.
8. Jarman, P.J., The social organisation of antelope in relation to their ecology, Behav-iour, 48, 215, 1974.
9. Gordon, I.J. and Illius, A.W., Incisor arcade structure and diet selection in ruminants,Funct. Ecol., 2, 15, 1988.
3209_C005.fm Page 118 Thursday, November 10, 2005 10:45 AM
Plant–Animal Mechanics and Bite Procurement in Grazing Ruminants 119
10. Ungar, E.D., Ingestive behaviour, in The Ecology and Management of Grazing Sys-tems, Hodgson, J. and Illius, A.W., Eds., CAB International, Wallingford, 1996,p. 185.
11. Demment, M.W. and Laca, E.A., The grazing ruminant: Models and experimentaltechniques to relate sward structure and intake, Proc. 7th World Conf. Anim. Prod.,1993, p. 439.
12. Ruyle, G.B. and Dwyer, D.D., Feeding stations of sheep as an indicator of diminishedforage supply, J. Anim. Sci., 61, 349, 1985.
13. Illius, A.W. and Gordon, I.J., Constraints on diet selection and foraging behaviour inmammalian herbivores, in Behavioural Mechanisms of Food Selection, Hughes, R.N.,Ed. Springer-Verlag, Berlin, 1990,p. 369.
14. Wilman, D., Mtengeti, E.J., and Moseley, G., Physical structure of twelve foragespecies in relation to rate of intake by sheep, J. Agric. Sci. (Cambridge), 126, 277,1996.
15. Wright, W. and Illius, A.W., A comparative study of the fracture properties of 5grasses, Funct. Ecol., 9, 269, 1995.
16. Vincent, J.F.V., The influence of water content on the stiffness and fracture propertiesof grass leaves, Grass Forage Sci., 38, 107, 1983.
17. Inoue, T. et al., Effects of leaf shear breaking load on the feeding value of perennialryegrass (Lolium perenne) for sheep. 1. Effects on leaf anatomy and morphology, J.Agric. Sci., 123, 129, 1994.
18. Hendricksen, R. and Minson, D.J., The feed intake and grazing behaviour of cattlegrazing a crop of Lablab purpureus cv. Rongai, J. Agric. Sci. (Cambridge), 95, 547,1980.
19. Theron, E.P. and Booysen, P.D.V., Palatability in grasses, Proc. Grass. Soc. SouthAfr., 11, 111, 1966.
20. Mayland, H.F. et al., Nonstructural carbohydrates in tall fescue cultivars: Relationshipto animal preference, Agron. J., 92, 1203, 2000.
21. Diaz, S., Noy-Meir, I., and Cabido, M., Can grazing response of herbaceous plantsbe predicted from simple vegetative traits? J. Appl. Ecol., 38, 497, 2001.
22. Sun, D. and Liddle, M.J., Trampling resistance, stem flexibility and leaf strength innine Australian grasses and herbs, Biol. Conser., 65, 35, 1993.
23. Thom, E.R. et al., Relationship of tillering and morphological characteristics of twoperennial ryegrass lines to “pulling” when grazed by dairy cows, N.Z. J. Agric. Res.,46, 15, 2003.
24. Henry, D.A., Simpson, R.J., and Macmillan, R.H., Seasonal changes and the effectof temperature and leaf moisture content on intrinsic shear strength of leaves ofpasture grasses, Aust. J. Agric. Res., 51, 823, 2000.
25. Hongo, A. and Akimoto, M., The role of incisors in selective grazing by cattle andhorses, J. Agric. Sci., 140, 469, 2003.
26. Zhang, J., Akimoto, M., and Hongo, A., Effects of applied nitrogen and leaf densityof orchardgrass (Dactylis glomerata l.) on the grazing behavior of sheep, Grass. Sci.,49, 563, 2004.
27. Illius, A.W. et al., Costs and benefits of foraging on grasses varying in canopy structureand resistance to defoliation, Funct. Ecol., 9, 894, 1995.
28. Mitchell, R.J., Hodgson, J., and Clark, D.A., The effect of varying leafy sward heightand bulk density on the ingestive behaviour of young deer and sheep, Proc. N.Z. Soc.Anim. Prod., 51, 159, 1991.
29. Halyk, R.M. and Hurlbut, L.W., Tensile and shear strength characteristics of alfalfastems, Trans. ASAE, 11, 256, 1968.
3209_C005.fm Page 119 Thursday, November 10, 2005 10:45 AM

120 Ecology and Biomechanics
30. Iwaasa, A.D. et al., A shearing technique measuring resistance properties of plantstems, Anim. Feed Sci. Tech., 57, 225, 1996.
31. Evans, P.S., A study of leaf strength in four ryegrass varieties, N.Z. J. Agric. Res., 7,508, 1964.
32. Vincent, J.F.V., Fracture, in Biomechanics — Material: A Practical Approach, Vin-cent, J.F.V., Ed., Oxford University Press, New York, 1992, p. 192.
33. Griffiths, W.M. and Gordon, I.J., Sward structural resistance and biting effort ingrazing ruminants, Anim. Res., 52, 145, 2003.
34. Aranwela, N., Sanson, G., and Read, J., Methods of assessing leaf-fracture properties,New Phytol., 144, 369, 1999.
35. MacAdam, J.W. and Mayland, H.F., The relationship of leaf strength to cattle pref-erence in tall fescue cultivars, Agron. J., 95, 414, 2003.
36. O’Reagain, P.J., Haller, M., and Zacharias, P.J.K., Relationship between sward struc-ture and dietary quality and intake in cattle grazing humid sour grassveld in SouthAfrica, Proc. XVII Inter. Grass. Cong., 730, 1993.
37. Adler, P.B. et al., Functional traits of graminoids in semi-arid steppes: A test ofgrazing histories, J. Appl. Ecol., 41, 653, 2004.
38. Hendry, G.A.F. and Grime, J.P., Methods in Comparative Plant Ecology: A Labora-tory Manual, 1st ed., Chapman & Hall, London, 1993.
39. Henry, D.A., Macmillan, R.H., and Simpson, R.J., Measurement of the shear andtensile fracture properties of leaves of pasture grasses, Aust. J. Agric. Res., 47, 587,1996.
40. Griffiths, W.M., Sward structural characteristics and selective foraging behaviour indairy cows, Ph.D. thesis, Massey University, New Zealand, 1999.
41. Vincent, J.F.V., The mechanical design of grass, J. Mat. Sci., 17, 856, 1982.42. Perez-Harguindeguy, N. et al., Leaf traits and herbivore selection in the field and in
cafeteria experiments, Austral. Ecol., 28, 642, 2003.43. Atkins, A.H. and Mai, Y.W., Elastic and Plastic Fracture, 1st ed., Ellis Horwood Ltd,
Chicester, U.K., 1985.44. Griffiths, W.M., personal communication.45. Chambers, A.R.M., Hodgson, J., and Milne, J.A., The development and use of equip-
ment for the automatic recording of ingestive behavior in sheep and cattle, GrassForage Sci., 36, 97, 1981.
46. Westfall, R.H. et al., The development of a leaf tensilmeter for in situ measurementof leaf tensile strength, J. Grass. Soc. South. Afr., 9, 50, 1992.
47. Tharmaraj, J. et al., Defoliation pattern, foraging behaviour and diet selection bylactating dairy cows in response to sward height and herbage allowance of a ryegrass-dominated pasture, Grass Forage Sci., 58, 225, 2003.
48. Ungar, E.D. and Noymeir, I., Herbage intake in relation to availability and swardstructure — grazing processes and optimal foraging, J. Appl. Ecol., 25, 1045, 1988.
49. Ungar, E.D. and Ravid, N., Bite horizons and dimensions for cattle grazing herbageto high levels of depletion, Grass Forage Sci., 54, 357, 1999.
50. Bergman, C.M., Fryxell, J.M., and Gates, C.G., The effect of tissue complexity andsward height on the functional response of wood bison, Funct. Ecol., 14, 61, 2000.
51. Griffiths, W.M., Hodgson, J., and Arnold, G.C., The influence of sward canopystructure on foraging decisions by grazing cattle. II. Regulation of bite depth, GrassForage Sci., 58, 125, 2003.
52. Hughes, T.P., Sward structure and intake of ruminants, Ph.D. thesis, Lincoln Univer-sity, New Zealand, 1990.
3209_C005.fm Page 120 Thursday, November 10, 2005 10:45 AM

Plant–Animal Mechanics and Bite Procurement in Grazing Ruminants 121
53. Mitchell, R.J., The effects of sward height, bulk density and tiller structure on theingestive behaviour of Red deer and Romney sheep, Ph.D. thesis, Massey University,New Zealand, 1995.
54. Tharmaraj, J., Chapman, D.F., and Egan, A.R., Bite breaking properties of somepasture species, Anim. Prod. Aust., 22, 360, 1998.
55. Aguirre, L.F. et al., Ecomorphological analysis of trophic niche partitioning in atropical savannah bat community, Proc. R. Soc. Lond. B-Biol. Sci., 269, 1271, 2002.
56. Peters, R.H., The Ecological Implications of Body Size, 1st ed., Cambridge UniversityPress, Cambridge, 1983.
57. Parsons, A.J. et al., Diet preference of sheep — effects of recent diet, physiological-state and species abundance, J. Anim. Ecol., 63, 465, 1994.
58. Alexander, R.M. and Bennet-Clark, H.C., Storage of elastic strain energy in muscleand other tissues, Nature, 265, 114, 1977.
59. Wright, W. and Vincent, J.F.V., Herbivory and the mechanics of fracture in plants,Biol. Rev. Cambridge Phil. Soc., 71, 401, 1996.
60. Vincent, J.F.V., Strength and fracture of grasses, J. Mat. Sci., 26, 1947, 1991.61. King, M.J. and Vincent, J.F.V., Static and dynamic fracture properties of the leaf of
New Zealand flax Phormium tenax (Phormiaceae: Monocotyledones), Proc. R. Soc.Lond. B-Biol. Sci., 263, 521, 1996.
62. Northey, R.D. and Hawley, J.G., The tooth to pad relationship in sheep — somemechanical considerations, N.Z. J. Agric. Res., 18, 133, 1975.
63. Dove, H. and Milne, J.A., An evaluation of the effects of incisor dentition and of ageon the performance of lactating ewes and their lambs, Anim. Prod., 53, 183, 1991.
64. Rogers, G.M. et al., Dental wear and growth performance in steers fed sweet potatocannery waste, J. Am. Vet. Med. Assoc., 214, 681, 1999.
65. Hongo, A. et al., Changes in biting force with incisor dentition of sheep, Grass ForageSci., 59, 293, 2004.
66. Hughes, T.P. et al., The influence of sward structure on peak bite force and bite weightin sheep, Proc. N.Z. Soc. Anim. Prod., 51, 153, 1991.
67. Toro, E. et al., A biomechanical analysis of intra- and interspecific scaling of jumpingand morphology in Caribbean Anolis lizards, J. Expt. Biol., 206, 2641, 2003.
68. Webb, N.G. and Clark, M., Livestock foot-floor interactions measured by force andpressure plate, Farm Build. Prog., 23, 1981.
69. Herrel, A. et al., The implications of bite performance for diet in two species oflacertid lizards, Can. J. Zool., 79, 662, 2001.
70. Herrel, A., O’Reilly, J.C., and Richmond, A.M., Evolution of bite performance inturtles, J. Evol. Biol., 15, 1083, 2002.
71. Laca, E.A. et al., An integrated methodology for studying short-term grazing behaviorof cattle, Grass Forage Sci., 47, 81, 1992.
72. Black, J.L. and Kenney, P.A., Factors affecting diet selection by sheep 2. Height anddensity of pasture, Aust. J. Agric. Res., 35, 565, 1984.
73. Ellis, J.E. and Travis, M., Comparative aspects of foraging behaviour of pronghornantelope and cattle, J. Appl. Ecol., 12, 411, 1975.
74. Arnold, G.W. and Dudzinski, M.L., Ethology of Free-Ranging Domestic Animals, 1sted., Elsevier, New York, 1978.
75. Willms, W., Forage strategy of ruminants, Rangemans J., 5, 72, 1978.76. Shipley, L.A. et al., The scaling of intake rate in mammalian herbivores, Am. Nat.,
143, 1055, 1994.77. Shipley, L.A. et al., The dynamics and scaling of foraging velocity and encounter
rate in mammalian herbivores, Funct. Ecol., 10, 234, 1996.
3209_C005.fm Page 121 Thursday, November 10, 2005 10:45 AM

122 Ecology and Biomechanics
78. Gordon, I.J., Illius, A.W., and Milne, J.D., Sources of variation in the foragingefficiency of grazing ruminants, Funct. Ecol., 10, 219, 1996.
79. Cangiano, C.A. et al., Effect of liveweight and pasture height on cattle bite dimensionsduring progressive defoliation, Aust. J. Agric. Res., 53, 541, 2002.
80. Axmacher, H. and Hofmann, R.R., Morphological characteristics of the massetermuscle of 22 ruminant species, J. Zool. (London), 215, 463, 1988.
81. Jaslow, C.R., Morphology and digestive efficiency of red foxes (Vulpes-vulpes) andgray foxes (Urocyon-cinereoargenteus) in relation to diet, Can. J. Zool., 65, 72, 1987.
82. Lehmann, F.O., The constraints of body size on aerodynamics and energetics in flyingfruit flies: An integrative view, Zoology, 105, 287, 2002.
3209_C005.fm Page 122 Thursday, November 10, 2005 10:45 AM

123
6 Biomechanics of SalviaFlowers: The Role of Lever and Flower Tube in Specialization on Pollinators
Martin Reith, Regine Claßen-Bockhoff, and Thomas Speck
CONTENTS
6.1 Introduction ..................................................................................................1246.1.1 Biomechanics and Bee Pollination ..................................................1246.1.2 A Case Study: The Staminal Lever Mechanism in Salvia .............125
6.2 Materials and Methods.................................................................................1266.2.1 Materials...........................................................................................1266.2.2 Forces of Flower-Visiting Bees .......................................................1276.2.3 Force Measurements on Salvia Flowers and Staminal Levers .......132
6.3 Results ..........................................................................................................1346.3.1 Forces Exerted by B. terrestris and A. mellifera.............................1346.3.2 Forces and Flower Visitors of Salvia ..............................................134
6.4 Discussion ....................................................................................................1366.4.1 Insect Forces.....................................................................................1366.4.2 Observed Flower Visitors.................................................................1376.4.3 Forces Measured in Salvia Flowers.................................................138
6.4.3.1 Critical Discussion of the Applied Methods....................1386.4.3.2 Comparison of Levers and Internal Barriers in
Flowers..............................................................................1396.4.4 Comparing Insect Forces to the Barriers in Flowers ......................1406.4.5 Proboscis Length, Flower-Tube Length, and Forces Exerted by
Visiting Bees ....................................................................................1406.5 Conclusion....................................................................................................141Acknowledgments..................................................................................................143References..............................................................................................................143
3209_C006.fm Page 123 Thursday, November 10, 2005 10:45 AM

124 Ecology and Biomechanics
6.1 INTRODUCTION
6.1.1 BIOMECHANICS AND BEE POLLINATION
Biomechanical interactions between bees and flowers have been known to be involvedin pollen transfer in plant species for more than two centuries [e.g., 1–6]. Bees arevery important pollinators for many plant species. However, because bees feed theiroffspring nearly exclusively with pollen, plants have evolved several mechanisms toavoid overexploitation by pollen-collecting bees and to ensure pollen transfer [7–11].Many of these mechanisms involve specific mechanical features. Four of the mostimportant are buzz pollination and the piston, brush, and lever mechanisms.
Buzz pollination is well-known in many economically important members of thenightshade family (Solanaceae) [12]. Examples include tomato, Solanum lycopersicum;pepper, Capsicum annuum; and eggplant, S. melongena. However, buzz pollination ismuch more widespread and known to occur in at least 65 plant families [13]. Thethecae of many of these plants dehisce only partially, and they only open small poresthrough which pollen can be released (poricidal anthers). To collect pollen from theseplants, bees place their body near the small openings and vibrate the stamen by rapidcontraction of their indirect flight muscles. Buchmann and Hurley [13] model theprocess of pollen release. The bee’s buzzing and the consequential vibration of theanther wall transmit energy to the pollen grains inside the anther. Thus, the energycontent of the anther increases while pollen grains accumulate more and more kineticenergy by repeated interactions with the walls and with each other. Release of pollenon the other hand diminishes the energy content of the anther. If buzzing continues,the number of pollen grains in the anther and the number of pollen grains that escapethe anther diminish, but their average kinetic energy increases. Although this modelis an extreme simplification of flower morphology, it is a cornerstone in the under-standing of buzz pollination. In the case of buzz pollination, overexploitation of thepollen is prevented because only a limited amount of pollen can be “buzzed out” duringa single visit. It would be interesting to test if the size of buzzing pollinators and theenergy they can produce are related to morphological characters of the poricidal anthersand the energy needed to buzz the flowers of a given plant species, thereby limiting“mechanically” the pollinator spectrum.
The piston mechanism [14] often found in the pea family (Fabaceae) acts, froma functional point of view, as a pollen pump. The stamens that are hidden in thecarina have coalesced filaments and form a tube that encloses the style. Flowervisitors have to deform the flower actively to reach the nectar. The forces exertedby visiting insects and the concomitant deformations of the flower cause a relativeforward movement of style and stigma in the staminal tube that squeezes a portionof the pollen mass out of the staminal tube. By this mechanism, pollen is transferredto the ventral part of the pollinator’s body. During a single visit, only a small amountof pollen is extruded by the pollen pump, ensuring pollen dispensing.
The brush mechanism, which also occurs in the pea family, works in a similarmanner [15]. In Lathyrus latifolius, a stylar brush underneath the stigma takes thepollen up during flower development. Later when the ripe flower is deformed byforces exerted by a visiting insect, the carina is lowered and the stigma and the stylar
3209_C006.fm Page 124 Thursday, November 10, 2005 10:45 AM

Biomechanics of Salvia Flowers 125
brush touch the insect consecutively, thus avoiding self-pollination. In flowers ofLathyrus latifolius, 100 millinewtons (mN) are needed to trigger this mechanism[16] (measured with a spring balance). Pollen dispensing is realized by the brush,which deposits only a dosed amount of pollen on each visitor.
Staminal levers in the broadest sense, i.e., stamina that can be tilted with orwithout a hinge, occur not only in the genus Salvia (see Section 6.1.2) but are alsofound in the Lamiaceae–Prostantheroideae [17,18] and in other families such as theZingiberaceae. An example from the latter family is Roscoea purpurea [19]. As theauthor points out, the structure of its stamen differs significantly from the Salvialever. Flowers of R. purpurea have only one fertile stamen; the two thecae areextended; and their basal parts are sterile and block the flower entrance. The upperpart of the thecae is fertile and produces pollen. Salvia, in contrast, has two fertilestamens and a different stamen morphology, as described in more detail below. Inboth taxa, a flower visitor releases the mechanism by pushing against the lever arm,which extends into the flower tube. Thereby, it is loaded with pollen on its head,neck, or back.
6.1.2 A CASE STUDY: THE STAMINAL LEVER MECHANISM IN SALVIA
The previous examples show that there exist many bee-pollinated plant species inwhich sophisticated mechanisms are involved in pollen presentation, pollen dispens-ing, and/or pollen transfer. In the present paper, we focus on the staminal levermechanism found in sages (genus Salvia). Form, function, and ecology of flowersof the genus Salvia have been recently reviewed [20,21]. We therefore only sum-marize briefly the basic morphological and biomechanical parameters of the Salviaflower and its staminal lever mechanism, which are important for our studies. Flowersare sympetalous and mainly bilabiate with an upper and a lower lip (Figure 6.1).Four stamens are usually formed, the upper (adaxial) pair being reduced to small tominute staminodes and the lower (abaxial) pair forming the lever mechanism. Ineach stamen, the lever arms are formed by the extended connective that is fixed tothe filament by a miniature joint-like ligament. The lower lever arm is sterile inmany species, while the upper one is always fertile, producing one theca. The twostamens are often partially fused, thus forming a functional unit. Pollinators in a“typical” Salvia flower push against the base of the sterile lever arm (BC in Figure6.1), causing a swing of the lever around the jointlike ligament (JL) so that thevisitor is touched by the pollen sacs located at the upper, fertile lever arm (UC) andbecomes loaded with pollen on its back or head. In later flower development, stigmasare generally orientated to occupy the same position as the previously functionalpollen sacs. A pollinator carrying pollen delivered from the staminal levers is there-fore likely to transfer the pollen to the stigma of a flower of the same species.
Mechanical barriers that limit the access to floral food sources are one of themost important mechanisms that promote specialization in pollination systems[22,23]. Since Salvia flowers provide nectar as a main food source to their pollinators,a crucial question is if and how Salvia flowers restrict access to the nectar to alimited range of flower visitors. Having the typical structure of a Salvia sympetalousflower with the staminal lever mechanism and nectar presentation at the base of a
3209_C006.fm Page 125 Thursday, November 10, 2005 10:45 AM

126 Ecology and Biomechanics
corolla tube in mind, there are two different mechanical exclusion mechanismspossible: (1) the length and diameter of the flower tube might be an important factorin restricting access to the nectar [24,25, Claßen-Bockhoff and Kuschwitz (in prep-aration)], and (2) flower visitors that are not able to move the staminal lever maybe mechanically excluded from the nectar by this rigid barrier [21,26]. The meth-odological approaches we have developed allow for a quantitative measurement ofthe forces insects are able to exert while gaining access to an artificial nectar source.The methods we have developed allow us to measure (1) the forces that insects areable to exert while gaining access to a custom-made artificial nectar source (Figure6.3), and (2) the forces necessary for insects to trigger the staminal lever and toforce themselves along the corolla tube towards the nectar source (Figure 6.4). Thisenables us to test the different barrier hypotheses and to reconsider the functionalimportance of different flower structures for flower-pollinator specialization.
6.2 MATERIALS AND METHODS
6.2.1 MATERIALS
We studied honeybees (Apis mellifera) and bumblebees (Bombus terrestris) as exem-plary species. Apis mellifera workers have a body length of 12.1 ± 0.3 mm (n = 10,mounted specimens), and a mean proboscis length between 6.05 and 6.40 mm in
FIGURE 6.1 Schematic longitudinal section of a “typical” Salvia flower showing the func-tioning of the staminal lever mechanism. For clarity, the style and second stamen are omitted.Black: staminal lever arm in unreleased position, white: in released position. UL: upper lipof the flower, LL: lower lip of the flower, F: filament, JL: jointlike ligament, UC: upper partof the elongated connective with fertile theca (FT), BC: basal, sterile part of the connective,N: nectar glands. (Modified from Speck, T. et al., in Deep Morphology: Toward a Renaissanceof Morphology in Plant Systematics, T. Stuessey, T., F. Hörandl, F., and Mayer, V., Eds.,Koeltz, Königstein, 2003, p. 241.)
FT
UC
UL
JLF
BCN
LL
3209_C006.fm Page 126 Thursday, November 10, 2005 10:45 AM

Biomechanics of Salvia Flowers 127
the three most often cultured subspecies [27]. The European bumblebee B. terrestriswas used as an example of a large bee species. Bumblebees vary greatly in sizebecause workers can be much smaller than queens. Body length of the tested workerswas 12.0 ± 0.8 mm (n = 10, mounted specimens), but queens can reach a bodylength of 19 mm or more. Compared with other European bumblebee species, B.terrestris has a rather short proboscis of 8 to 9 mm length [28]. The bumblebeecolonies were bought from a commercial supplier (Re-natur GmbH, D-24601 Ruh-winkel, Germany). Forces of bumblebees were measured in the laboratory, and forcesof A. mellifera were measured in a private bee yard near Freiburg, Germany.
Flowers of the following Salvia species were studied: S. amplexicaulis Lam.,S. forskahlii L., S. glutinosa L., S. cf. microphylla Kunth, S. nilotica Juss. ex Jacq.,S. nubicola Wall. ex Sweet, S. phlomoides Asso, S. pratensis L., S. sclarea L.,S. transsylvanica (Schur ex Griseb.) Schur, S. uliginosa Benth., S. verbenaca L., and S.viridis L. We took the flowers from plants that were cultivated in the Freiburg BotanicalGarden (Southwestern Germany). Before flowers were analyzed mechanically, internalstructure and morphology of each species was studied in a number of longitudinalsections and cross sections. The species we were especially interested in are:
Jupiter’s distaff, S. glutinosa L., is a yellow-flowered species that occurs inEuropean and Asian mountain forests. S. glutinosa has a simple levermorphology in the sense of Himmelbaur and Stibal [29]. The connectiveis strongly curved, and the flower entrance is not completely blocked bythe lever (Figure 6.2A and Figure 6.7A). Flower-visiting insects on S.glutinosa were studied during the flowering periods in 2002 to 2004 in theFreiburg Botanical Garden and in 2003 to 2004 on a further site nearEichstetten (southwestern Germany) where this species grows naturally.Flowers are usually visited by bumblebees (see Table 6.1) and not byhoneybees or other midsized bees except for some pollen-thieving or nectar-robbing visits.
Clary sage, S. sclarea L., is a well-known, light blue or pink to white floweringMediterranean species that is widely cultivated for its essential oils and asan ornamental. This species is a representative of the genus with a derivedstaminal lever in the sense of Himmelbaur and Stibal [29]. The lever isspoon shaped and blocks the flower entrance completely (Figure 6.2B andFigure 6.7B). In 2003 and 2004, we observed flower-visiting insects on S.sclarea in the Freiburg Botanical Garden and in private gardens in Boetz-ingen (southwestern Germany) and Schwanau (southwestern Germany)where this plant was cultivated. Clary sage is visited mainly by carpenterbees Xylocopa violacea and, as in S. glutinosa, not by honeybees or othermidsized bees (Table 6.1).
6.2.2 FORCES OF FLOWER-VISITING BEES
Forces that insects are able to exert to gain access to a food source were measuredduring visits to a custom-made “artificial flower” for which the insects can be trained(Figure 6.3). The artificial flower consists of a base plate connected to a highly
3209_C006.fm Page 127 Thursday, November 10, 2005 10:45 AM

128 Ecology and Biomechanics
sensitive force transducer (Burster Präzisionsmeßtechnik GmbH, D-76593Gernsbach, Germany) and a retractable tube behind the posterior wall of the con-struction. The retractable tube contains a sugar solution (apiinvert, Südzucker AG,D-97195 Ochsenfurt, diluted to 50%) as a food source. The posterior wall is coveredby a foam pad with a central hole giving access to the tube with the sugar solution.As the bees are feeding, the thin tube containing the sugar solution is manuallyretracted. By trying further to reach the food source, the insects start pressing theirheads against the foam pad. The induced reactive force is transmitted via the bees’legs and the platform to the force transducer that measures this force with an accuracyof ± 50 N. The force transducer converts the forces into a voltage output, whichis stored online by a laptop computer. The tested bumblebees were continuously fedwith air-dried pollen, and the supply of the colony with sugar solution was interrupted24 hr before the experiments were started.
(A)
(B)
FIGURE 6.2 (A) S. glutinosa flowers with B. hortorum leaving a flower after a visit; originalhabitat near Eichstetten. (B) S. sclarea visited by X. violacea (private garden in Schwanau).
3209_C006.fm Page 128 Thursday, November 10, 2005 10:45 AM

Bio
mech
anics o
f Salvia Flow
ers129
TABLE 6.1Flower Visitors of the Specialized S. sclarea and S. glutinosa, and the Less Specialized S. pratensis
Salvia glutinosa Salvia sclarea Salvia pratensis
literature 21 51 52 33 55 41/56 X 32 34 57 51 33 X 57 21 50 51 53 54 41/56 57
Bees (Apoidea) 0
Andrena carbonaria 0
Andrena dorsata + 0
Andrena hattorfiana +
Andrena labiata 0
Andrena nigripes 0
Anthidium manicatum 0 0 0 +
Anthophora ssp. [+]
Anthophora fulvitarsis 0
Anthopora quadrimaculate 0
Apis mellifua N p p + 0 0 n [0 n]
Bombus ssp. + 0 + 0
Bombus sp. [0] +N
Bombus argillaceus 0
Bombus hortorum + 0 + 0 + + 0 0 + 0
Bombus humilis [0]
Bombus hypnorum +
Bombus lapidarius + 0 0 0
Bombus muscorum 0
Bombus pasquorum + [0] 0 + + 0 0 +
Bombus pratorum + 0 n
Bombus ruderarius + [0]
Bombus sylvarum + 0 N +
Bombus terrestris + 0
Bombus wurfleini [N] [N] [N] [N]
Eucera ssp. +
3209_C006.fm
Page 129 T
hursday, Novem
ber 10, 2005 10:45 AM

130Eco
logy an
d B
iom
echan
icsTABLE 6.1 (CONTINUED)Flower Visitors of the Specialized S. sclarea and S. glutinosa, and the Less Specialized S. pratensis
Salvia glutinosa Salvia sclarea Salvia pratensis
literature 21 51 52 33 55 41/56 X 32 34 57 51 33 X 57 21 50 51 53 54 41/56 57
Eucera nigrescens +
Halictus leucaheneus 0
“Halictus nitidus” n0
Hylaeus sp. pn
Hylaeus communis [n0]
Lasioglossum sp. p 0
Lasioglossum convexiusculum 0
Lasioglossum majus 0
Lasioglossum malachurum 0
Lasioglossum minutissimum 0
Lasioglossum morio [n0]
Lasioglossum nitidiusculum [n0]
Lasioglossum pauxillum 0
Lasioglossum pygmaeum 0
Lasioglossum sexstrigatum [n0]
Lasioglossum xanthopus 0
Megachile sp. 0 0
Megachile circumcincta pN
“Megachile pyrina (fasciata)” +
Megachile parietina 0
Osmia aurulenta 0
Osmia bicolor 0
Osmia bicornis [+] [0]
Osmia caerulescens + 0
Osmia pilicornis 0
Osmia uncinata 0
3209_C006.fm
Page 130 T
hursday, Novem
ber 10, 2005 10:45 AM

Bio
mech
anics o
f Salvia Flow
ers131
Xylocopa itis 0
Xylocopa violacea 0 + + 0 0
Hoverflies 0 0 0
Butterflies n 0
Vanessa cardui 0
Euphydryas aurinia 0
Mellicta parthenoides 0
Lasiommata petropolitana 0
Whites and Yellows (Pieridae) n
Anthocharis cardamines 0
Aporia crataegi 0
Colias hyale 0
Pieris brassicae 0
Pieris rapae 0
Moths 0
Siona lineata 0
Plusia gamma 0n
Hemaris sp. [0]
Macroglossum stellatarum n 0 n 0
Hyles euphorbiae [0]
Source: Data was obtained either from the literature (21,32–34,41,50–57) or from this paper’s authors, represented by X. Activity by the flower visitors was evaluated by the respective authorsor was based on descriptions from the references: + pollinator; 0 visitor (or no details given); N nectar robber; n nectar thief; p pollen thief; [ ] the original author used a synonym.
3209_C006.fm
Page 131 T
hursday, Novem
ber 10, 2005 10:45 AM

132 Ecology and Biomechanics
6.2.3 FORCE MEASUREMENTS ON SALVIA FLOWERS AND STAMINAL
LEVERS
The forces a bee would have to exert during a visit on a Salvia flower were measuredwith a custom-built force-measuring device (Figure 6.4) that mechanically mimicsthe visit of a pollinator [30]. The very sensitive force transducer (Burster Präzision-smeßtechnik) and a displacement transducer (Burster Präzisionsmeßtechnik) are bothmounted on a micromanipulator that is driven by a low vibration DC-micromotorand a gearing system (Märzhäuser GmbH, D-35579 Wetzlar, Germany). The com-puterized instrument is powered by rechargeable batteries. The measuring device ismounted on a portable tripod with a coordinate system setting that allows a straightpositioning of the force transducer and the force sensor to the flower. The movementsof the sensor are controlled by a laptop computer that also stores the force–displace-ment data. This allows for a constant, predefined movement of the sensor into theflower and a measurement of forces even in fragile objects like Salvia flowers withan accuracy of ± 50 m and ± 50 N, respectively.
FIGURE 6.3 Schematic drawing of the artificial flower, a custom-made device for measuringforces exerted by insects to gain access to a food source (for description, see the text). (a)force transducer, (b) base plate, (c) sugar solution, (d) retractable food source, and (e) foampad.
b
a
c
d
e
3209_C006.fm Page 132 Thursday, November 10, 2005 10:45 AM

Biomechanics of Salvia Flowers 133
For the initial tests on different Salvia species, the sensor was a thin metal rodwith a diameter of 0.60 mm. This should mimic a bee’s proboscis (proboscis widthin A. mellifera = 0.61 ± 0.05 mm, n = 10). In a first insertion cycle, we controlledfor correct positioning of sensor and flower. Furthermore, we determined the internal,biologically sensitive flower-tube length, as indicated by a strong increase of themeasured forces when reaching the flower bottom. When further measurements onthe same flower were conducted, the cycling distance was chosen according to theinternal flower-tube length. For these measurements of forces necessary to releasethe staminal lever, the flowers were fixed in their original orientation on their pedicel.
To test whether honeybees might be excluded from the nectar in S. sclarea bythe dimensions of the corolla tube, we measured the forces that bees with a definedproboscis length have to exert to reach the nectar. For this purpose, we used amodified sensor (Figure 6.5). A honeybee’s head was mounted on the thin metalrod. We used a sliding caliper to adjust the distance between the sensor’s tip andthe bee’s head (edge of clypeus) to match the proboscis length that should besimulated. Before each measurement, the bee’s head and the sensor were wettedwith silicone oil to reduce friction and sticking due to the lack of head motility.During the first insertion cycle, a sufficient proboscis length was chosen for thesensor tip so as to avoid contact of the bee’s head with the flower tube; this allowedus to determine the internal flower-tube length. In subsequent measurements on thesame flower, this internal flower-tube length was used as a maximum cycling dis-tance. For this type of measurements, the flowers were fixed on their lower lip, whichreflects the natural situation in which bees typically use the lateral lobes of the lowerlip as grips when collecting pollen and nectar. This type of fixation allows forrepeated measurements as the flowers show only very small spatial movements evenunder the repeated exertion of (comparatively) high forces.
FIGURE 6.4 Schematic drawing of the “pollination simulator,” a custom-made device formeasuring forces necessary to release the staminal levers and to get access to the nectar glandof Salvia flowers (for description, see the text). (a) Micromanipulator with distance transducer,(b) force transducer, (c) sensor, and (d) low vibration motor.
c
d
b
a
3209_C006.fm Page 133 Thursday, November 10, 2005 10:45 AM

134 Ecology and Biomechanics
6.3 RESULTS
6.3.1 FORCES EXERTED BY B. TERRESTRIS AND A. MELLIFERA
For workers and queens of two B. terrestris colonies, our data show that the actualforce an individual bumblebee exerts may greatly differ in sequential attempts. Themean values were 24.6 ± 14.8 mN (n = 103, 44 individuals) with a maximum of 59mN for bumblebee workers (Figure 6.6A) and 46.8 ± 25.5 mN (n = 8) with amaximum of 90 mN for bumblebee queens (Figure 6.6B). In honeybee workers (A.mellifera), measured forces had a mean value of 14.0 ± 7.4 mN (n = 8) and amaximum value of 29 mN. A detailed analysis of the forces exerted by insects togain access to the food source in the artificial flower testing device will be the subjectof a separate paper [31].
6.3.2 FORCES AND FLOWER VISITORS OF SALVIA
In 13 Salvia species, the forces necessary to release the staminal lever have beenmeasured, and for 10 of these species, quantitative data are presented for the firsttime. The data range between 0.5 mN for S. nilotica and 10 mN for S. cf. microphylla(Table 6.2).
A schematic drawing of a S. glutinosa flower is shown in Figure 6.7A. The meanforce necessary to trigger the lever is 1.6 ± 0.8 mN (n = 10). In this species thecorolla tube is narrowed by a broad ring of hairs and the force necessary to pass thehairy ring with the sensor is 2.5 ± 0.7 mN (n = 8) (Figure 6.7C). In S. glutinosa, itwas not possible to measure the release of the staminal lever and the forces necessaryto pass the hairy ring within one continuous measurement because the lever and theflower tube were not arranged linearly in the flowers. As a result, the measurementscannot be depicted in the continuous force–distance diagram. We observed B. hor-torum visiting S. glutinosa flowers at both study sites and B. pasquorum and onespecies of leaf cutter bee Megachile sp. visiting at the Freiburg Botanical Garden.Several pollen and/or nectar thieves were observed that did not trigger the lever,including a small sweat bee and a yellow-faced bee (Lasioglossum sp. and Hylaeussp.).
FIGURE 6.5 Modified sensor used in the “pollination simulator,” showing a bee headmounted on a thin metal rod. The distance of the insect’s head from the tip of the sensor isadjustable to account for different proboscis lengths.
3209_C006.fm Page 134 Thursday, November 10, 2005 10:45 AM

Biomechanics of Salvia Flowers 135
A schematic drawing of a S. sclarea flower is shown in Figure 6.7B. The forcenecessary to release the staminal lever of S. sclarea is 5.2 ± 3.0 mN (n = 43) (Figure6.7D). The triggering of the lever often occurred during a steep increase in force.The peak value of this force increase is relatively variable and shows a mean valueof 14.0 ± 9.9 mN (n = 33). An internal barrier narrows the entrance to the basalregion of the flower tube. The force necessary to pass this additional internal barrieris 5.3 ± 1.7 mN (n = 17). At all three localities, the carpenter bee X. violacea wasobserved visiting S. sclarea flowers. In Boetzingen, we also observed a leaf cutterbee Megachile sp. and in Schwanau a wool carder bee Anthidium manicatum visitingthis sage.
To quantify the forces an insect has to produce to reach the nectar in S. sclarea,which is located at the base of the corolla tubes, measurements with the modifiedsensor were carried out (cf., Figure 6.5). On the metal sensor, the head of a honeybee(A. mellifera) was fixed at various distances from the sensor tip to mimic the influenceof different proboscis lengths. Proboscis lengths of 5, 6, 7, 8, and 11 mm have beensimulated for the measurements (Figure 6.8). To account for different flower sizesfound in S. sclarea, we used a large (internal flower-tube length, 9.7 mm) and asmall flower (internal flower-tube length, 9.4 mm) for our measurements.
(A)
(B)
FIGURE 6.6 Forces exerted by individual bumblebees (B. terrestris) to gain access to thefood source in the artificial flower testing device. (A) Worker, and (B) queen.
50
40
30
20
10
00 5 10 15 20 25 30
(mN
)
(sec)
100908070605040302010
00 5 10 15 20 25 30 35
(mN
)
(sec)
3209_C006.fm Page 135 Thursday, November 10, 2005 10:45 AM

136 Ecology and Biomechanics
A maximum force of 407 mN was recorded with a simulated proboscis lengthof 6 mm and a maximum force of 167 mN for a simulated proboscis length of 8mm in big S. sclarea flowers with 9.7 mm flower-tube length. The maximum forcerecorded for small flowers (flower-tube length 9.4 mm) was 260 mN and 45 mN fora proboscis length of 6 mm and 8 mm, respectively (Figure 6.8). Using even shorterproboscis lengths was not possible because the flowers were destroyed by the headmounted on the sensor if the proboscis length was shorter than 6 mm. The shorterthe length of the simulated proboscis, the earlier the insect’s head has to be squeezedinto the tight corolla tube, resulting in an earlier onset of force increase and in ahigher maximum value of force needed to reach the nectar at the base of the corollatube (Figure 6.8).
6.4 DISCUSSION
6.4.1 INSECT FORCES
The maximum forces measured were 29 mN for honeybees (A. mellifera), 90 mNfor bumblebee queens, and 59 mN for bumblebee workers (Bombus terrestris); thus,our data indicate that the maximum forces exerted by midsized bees and bumblebeesduring a flower visit range between 20 and 100 mN. According to the current state
TABLE 6.2Forces Necessary to Release the Staminal Lever in 13 Salvia Species
Salvia Species
Average Force Necessary to Trigger
the Lever (mN) ±±±±Standard Deviation
Number of Measurements
Number of Flowers
S. amplexicaulis 1.2 ± 0.9 17 10S. forskahlii 2.9 ± 0.9 65 10S. glutinosa 1.6 ± 0.8 10 3S. cf. microphylla 10.0 ± 5.3 22 3S. nilotica 0.5 ± 0.2 25 2S. nubicola 1.0 ± 0.7 26 4S. phlomoides 1.1 ± 0.2 25 2S. pratensis 2.7 ± 0.3 28 5S. sclarea 5.2 ± 3.0 43 7S. transsylvanica 3.0 ± 0.7 20 3S. uliginosa 0.9 ± 0.3 6 1S. verbenaca 2.7 ± 1.1 49 5S. viridis 1.5 ± 0.5 15 3
Note: Measurements were performed with a metal sensor of 0.6-mm diameter, mimicking a bee’sproboscis. In plants where the lever is not triggered by the bees proboscis but by the bee’s head(S. forskahlii, S. glutinosa, S. nilotica, and S. nubicola), a wider sensor (1 to 3 mm) was used totrigger the lever.
3209_C006.fm Page 136 Thursday, November 10, 2005 10:45 AM

Biomechanics of Salvia Flowers 137
of knowledge, the bee flowers that are the hardest to trigger are those of L. latifolius,which require forces of 100 mN to be triggered [16]. Therefore, we hypothesize thateven large bees do not exert forces that significantly exceed 100 mN during flowervisits. The forces bees and bumblebees can exert on flowers are much larger thanthe weight forces that correspond to their body mass [16]. For example, in the testedbumblebee workers that can exert forces up to 59 mN (mean force measured: 24.6± 14.8 mN), a mean body mass of 199 ± 42 mg (n = 56) is found. This meansbumblebees can produce a maximum force that is about 30 times their weight force(a mass of 199 mg induces a weight force of 1.95 mN).
6.4.2 OBSERVED FLOWER VISITORS
During our observation periods, S. glutinosa and S. sclarea were visited only by asmall number of bee species. Most of these (exceptions, e.g., the pollen and nectarthieves, Lasioglossum sp. and Hylaeus sp.) are already known to be flower visitorsof S. glutinosa or S. sclarea (Table 6.1). Though there are numerous publications
FIGURE 6.7 A and B show schematic drawings of a longitudinal section of a flower,showing one stamen (style and ovary not drawn). (A) S. glutinosa, and (B) S. sclarea. C andD show force–distance diagrams of the movement of a metal sensor (sensor diameter 0.6 mm)in a flower: (a) sensor touches lever, (b) lever released, (c) sensor touches internal barrier,and (d) sensor touches bottom of the corolla tube. (C) S. glutinosa flower; left: releasing andpassing the staminal lever, right: passing the internal ring of hairs. (D) S. sclarea flower.
(mN
)
8
6
4
2
00 2
ba
(mm)
(A)
(C)
cd
50 10(mm)
30
2010
050 10
ab
c
dc(m
N)
(mm)
(B)
(D)
3209_C006.fm Page 137 Thursday, November 10, 2005 10:45 AM

138 Ecology and Biomechanics
on the pollination biology of these two Salvia species, there are no reports thathoneybees have ever been seen triggering the staminal lever while foraging for nectarin flowers of these species (see Refs. [32–34] and our unpublished observations).The observation that only a small number of bee species visits these two sagessupports the assumption that S. glutinosa and S. sclarea are specialized (in terms ofspecies number of flower-visiting insects). Honeybees seem to be excluded fromsuccessfully (with regard to nectar feeding) visiting these flowers by either thestaminal lever, the additional internal barriers, or the length of the flower tube.
6.4.3 FORCES MEASURED IN SALVIA FLOWERS
6.4.3.1 Critical Discussion of the Applied Methods
Our methodological approach allows quantitative analysis of the forces involved inflower visits to different sage species and compares for the first time these resultswith the forces that different flower-visiting bee species are able to produce to gainaccess to a food source. In addition, the force measurements in Salvia flowers canbe correlated with the functional morphology of the corolla tube and the structureof the staminal lever.
The first method used was to imitate the proboscis of a bee as it is inserted intoa flower. This test procedure cannot be considered a perfect imitation of the actualprocess taking place during the visit of a bee because the functional mode of ourtesting device forces us to use a stiff metal rod with the same diameter as the bee’sproboscis. A bee’s proboscis is more flexible than a stiff rod, and a bee should beable to avoid adhering and becoming lodged within flower structures (at least partof the time) and piercing floral tissue during a normal flower visit. Because of the
FIGURE 6.8 Force–distance diagrams showing the forces necessary to reach the nectar atthe bottom of the corolla tube depending on different proboscis lengths. Series of measure-ments in the same flower of S. sclarea (internal flower-tube length 9.4 mm) using the modifiedsensor with an insect’s head mounted at various distances from the sensor tip. Mimickedproboscis length (black to white, see insert): 11, 8, 7, 6, and 5 mm (in the latter measurement,the flower tube was destroyed at the end point of the force–distance curve marked with an x).
300
250
200
150
100
50
01 2 3 4 5 6 7 8 9 0 10
11 mm 8 mm 7 mm 6 mm 5 mm
(mN
)
(mm)
x
3209_C006.fm Page 138 Thursday, November 10, 2005 10:45 AM

Biomechanics of Salvia Flowers 139
complex morphology of the flowers of some Salvia species, we were unable to avoidpiercing the floral tissue during some of our measurements. But sticking and piercingevents were easy to recognize after the force measurements when careful dissectionrevealed the resulting damage to the plant tissue. Because the exact position of thesensor in the flower is measured in the force–distance diagrams, we were able totrace the corresponding force peaks exactly in our data set and to exclude them fromfurther biological interpretation. The high peak that followed the triggering of thestaminal lever of S. sclarea is the consequence of such a sticking event. In additionto our morphological investigations, this interpretation is supported by the very highvariability of this peak. In this species, the sterile base of the staminal lever arm isstrongly sculptured (Figure 6.7B), and the sensor often sticks to these structures. InS. glutinosa, the lever arm is much less sculptured, and so the sensor typically passessmoothly.
The force–distance diagrams that resulted from the measurements are rich ininformation about internal flower morphology and the functional importance of thevarious flower parts during the activities of a visiting insect. Even very smallstructures that are found in a direct line from the flower entrance to the flower basewhere the nectar is present often caused a typical, detectable peak in force measure-ments when the sensor touched them. Peaks and structures are easy to correlate ifone compares the position of the peak on the diagram with the structure’s positionin the flower.
6.4.3.2 Comparison of Levers and Internal Barriers in Flowers
Comparing the lever and other internal barriers in terms of forces needed to releaseor to overcome them points to the potential importance of the staminal lever as amechanical barrier. In S. glutinosa, the force needed to trigger the staminal lever islower by about 40% than the force necessary to pass the artificial proboscis throughthe additional internal barrier, built in this species by a hairy ring in the narrow partof the flower tube. This indicates that in terms of forces, the lever does not representthe main device to exclude insects from gaining access to the nectar, and, morelikely, the narrow corolla tube with its hairy ring has this function in S. glutinosa.
The situation in S. sclarea is different. In this species (even after exclusion ofthe peak due to sticking events), the staminal lever is the main barrier in terms ofthe force required to protrude the artificial proboscis to the nectar at the flower base.
Claßen-Bockhoff et al. [21] measured the forces that are necessary to triggerthe levers of eight Salvia species; three of these species were also included in thisanalysis. The previously published values are identical to those found in our presentstudies [in brackets] for two species: S. pratensis 2.98 ± 2.43 mN (n = 1140) [2.7± 0.3 mN (n = 28)] and S. glutinosa 1.47 ± 1.05 mN (n = 780) [1.6 ± 0.8 mN (n =10)]. The only exception is S. sclarea for which a tentative value of 31.8 mN basedon two measurements was given previously by Claßen-Bockhoff et al. [21]. This ismuch higher than the value of 5.2 ± 3.0 mN (n = 43) for the more detailed mea-surements presented in this paper. This difference might be due to the possibilitythat the actual release of the staminal lever is very difficult to distinguish from the
3209_C006.fm Page 139 Thursday, November 10, 2005 10:45 AM

140 Ecology and Biomechanics
sticking event at the sculptured sterile lever base that caused the large force peak inthe present measurements.
6.4.4 COMPARING INSECT FORCES TO THE BARRIERS IN FLOWERS
The force needed to insert a proboscis and trigger the lever in all measured Salviaflowers did not exceed 5.2 ± 3.0 mN (S. sclarea) in bee-pollinated species. This isclearly below the maximum value of 29 mN that even the weakest measured beespecies (honeybee) can exert. This means that honeybees as well as bumblebees arestrong enough to insert their proboscis in the respective flower, and that these beesare not excluded by the force that is needed to trigger the staminal lever of anymeasured sage flowers. This even holds true for the additional internal barriers ofsage flowers under investigation. Neither the protrusion narrowing the corolla tubein Clary sage (S. sclarea) nor the hairy ring in S. glutinosa flowers forms a barrierthat mechanically blocks the access to the nectar for honeybees or bumblebees.
The hypothesis that honeybees and bumblebees are not excluded by force fromvisits of a given Salvia flower is not new. Meadow sage (S. pratensis) is lessspecialized than other sages because it is pollinated by many species of insectsincluding bumblebees and honeybees (Table 6.1). Therefore, the lever of meadowsage evidently does not exclude these insects by force [35]. Our results indicate thateven sages that are pollinated by big bees (Table 6.1) do not exclude smaller beespecies by the magnitude of the force necessary to release the staminal lever. Thisimplies that the forces needed to trigger the staminal lever are of minor significancein the specialization of these Salvia species for specific flower visitors.
6.4.5 PROBOSCIS LENGTH, FLOWER-TUBE LENGTH, AND FORCES
EXERTED BY VISITING BEES
The results on proboscis length and flower-tube length indicate that the amount offorce that a bee has to exert to reach the nectar at the flower base of S. sclarealargely depends on its proboscis length. Bees with a longer proboscis have to exerta much smaller force than bees with a short proboscis, because the latter have topress their heads deeper in the corolla tube to reach the nectar. The forces that a beewith a short proboscis (6 mm) needs to reach the nectar of S. sclarea (260 mN to407 mN, for a short or a big flower, respectively) are much higher than the forceshoneybees can exert (maximum measured force 29 mN), and even if a honeybeecould exert forces comparable to the ones measured in the strongest bumblebeequeen (90 mN), they would not be able to reach the nectar. This means that thelength of the proboscis of a bee has to fit the flower-tube length of a visited Salviaspecies. Honeybees with their short proboscis (6.05 to 6.40 mm) are not able toreach the nectar in S. sclarea flowers and thus are excluded from the nectar by thelength and narrowness of the flower tube. Therefore, flower-tube length seems to bean important factor in specialization of sages on a certain set of flower visitorsbecause the forces required to reach the nectar drastically increase with decreasingproboscis length.
3209_C006.fm Page 140 Thursday, November 10, 2005 10:45 AM

Biomechanics of Salvia Flowers 141
The important role of flower-tube length or spur length in specialization onflower visitors is known for many plants, e.g., ecotypes of Satyrium hallackii, theDisa draconis complex, and many other species [36–39]. Several authors havementioned the possible role of flower-tube length for specialization in Salvia.Dieringer et al. [40] discuss that S. mexicana might be specialized on a singlepollinator, the bee Deltophila elephas because the very long corolla tube of this sagespecies corresponds to the long tongue of this bee species [40]. Westerkamp [34]writes that S. glutinosa is a bumblebee flower, and that honeybees are not able toreach the nectar of this sage because of their short proboscis. Claßen-Bockhoff etal. [20] emphasize that for a definition of pollination niches in Salvia species, avariety of flower characters including length and width of the corolla tube areessential (see also [24,41]). This was recently confirmed by Kuschewitz [25] whodistinguished 11 flower types in 39 European sages that differ in floral proportionsand thus in the spatial patterns of pollen transfer.
Our results, based on the first quantitative measurements of the forces involvedin flower visits by bees, support these hypotheses, which were based on morpho-logical characteristics, and allow a more detailed discussion of the function of variousflower parts in the genus Salvia.
6.5 CONCLUSION
To test the evolutionary significance and the function of the staminal lever in Salviaspecies, we quantitatively analyzed the “force–barrier-hypothesis” [21,26] using abiomechanical approach. This hypothesis states that the interspecific variation in theforces needed to release the lever in Salvia are the main reason for interspecificdifferences in the pollinator spectra. A Salvia population that undergoes an evolu-tionary change in these forces should therefore either specialize on a smaller numberof strong flower visitors or generalize on a wider range of visitors that include weakones. Small changes in joint anatomy could therefore lead to great differences inpollinator spectra and in populations of a Salvia species, which differ largely inspecialization on pollinators. Because they have different pollinators, these popula-tions might even become genetically isolated and be a starting point of speciation.
This interesting idea is not supported by the data presented in this paper. Despitethe expected interspecific variability among Salvia species in the forces necessaryto trigger the lever, these forces are generally low compared with the forces beescan exert. In two Salvia species specialized on bumblebees or carpenter bees andnot visited by the honeybee, honeybees were, in contrast to the predictions of thishypothesis, strong enough to trigger the levers. Instead of the force required to triggerthe lever, it is the flower-tube length that seems to exclude honeybees from the nectarof these two species. Nonetheless, the relative importance of the flower-tube lengthor the lever forces for specialization and speciation in Salvia cannot be finallyevaluated because until now only 2% of all Salvia species have been investigated.In a large number of sages, the lever does not close the flower entrance and cantherefore be circumvented easily (e.g., S. glutinosa). Furthermore, in species with amore derived flower morphology in which the lever closes the flower entrance (e.g.,S. sclarea), the forces that have to be exerted while triggering the lever are low.
3209_C006.fm Page 141 Thursday, November 10, 2005 10:45 AM

142 Ecology and Biomechanics
Therefore, we propose that these forces are of minor importance for pollinator shiftsand specialization in the genus Salvia. We propose that the length of the flower tubein Salvia has the same role as in many other plant groups with tubular flowers ornectar spurs. Flower-tube length restricts access to nectar and is an important factorin recruiting a certain set of flower visitors.
With respect to the evolution of the staminal levers found in Salvia, we favortwo possible functions involved in pollen transfer that are not mutually exclusive.
1. Pollen dispensing. Portioning of pollen by dispensing multiple small por-tions of pollen on successive visitors is found in many other plant speciesas an important mechanism for maximizing male fitness [42–44]. Thehypothesis that staminal levers in Salvia may be involved in pollen dis-pensing is supported by the finding that the staminal levers can be releasedmany times (more than 20 times in all tested sage species), resulting in(nearly) exactly the same force–distance curve with each release [21].
2. Exact pollen placement on the pollinator body. Exact pollen placementmay be important for the reproductive success of plants for three reasons. a. In subsequent visits of flowers of the same Salvia species, pollen
placement at exactly the site where the style touches the insectenhances reproductive success by increasing the probability of pollentransfer [10,21].
b. In subsequent visits of an insect to different Salvia species, exact pollenplacement on the pollinator’s body as achieved by the staminal levercould avoid interspecific pollen transfer and thereby hybridization. Thisdesign would allow sympatric Salvia species to share a large numberof pollinating species [20,45].
c. Exact, nototribic pollen placement as performed by the staminal leverin most Salvia species is thought to reduce pollen losses throughgrooming because bees seem to groom less effectively on their dorsalrather than on their lateral sides [46]. Nototribic pollen placement, inadddition to the fact that the thecae (and hence the pollen) in most bee-pollinated Salvia species are hidden in the upper lip of the flower duringa bee’s approach, should additionally reduce the influence of a flowervisitor on its pollen uptake [47].
The previously mentioned possible functions of the staminal lever, i.e., opti-mizing pollen dispension and exact pollen placement, could allow Salvia speciesto specialize on certain bees as pollinators, which are known as “high-removal low-deposition” pollinators in the sense of Thomson et al. [48]. Therefore, the staminallever of Salvia can be included in a list of floral features that optimize malereproductive success by controlling pollen release and pollen placement in bee-pollinated plants and that include buzz pollination, and the piston and brush mech-anisms [9,10,14,49]. The immense species richness of the genus Salvia and thehigh morphological and functional diversity of its levers can then be interpreted asa by-product of selection on male reproductive success in a variable pollinatorenvironment.
3209_C006.fm Page 142 Thursday, November 10, 2005 10:45 AM

Biomechanics of Salvia Flowers 143
ACKNOWLEDGMENTS
We thank the technical workshop of the University of Freiburg (Biological InstitutesII/III) for constructing the technical devices, the team of the Botanical Garden ofFreiburg for providing plant material, Rainer Oberle, and Hans and Johanna Bumbelfor granting access to plants in private gardens, and Randy Cassada for improvingthe readability of this text. The Deutsche Forschungsgemeinschaft (SPP 1127) isgratefully acknowledged for financial support (Cl 81/9–1, Sp 534/5–1 and 5–2).
REFERENCES
1. Sprengel, C.K., Das entdeckte Geheimnis der Natur im Bau und in der Befruchtungder Pflanzen, Vieweg, Berlin, 1793.
2. Darwin, C., The Various Continuances by Which Orchids Are Fertilised by Insects,John Murray, London, 1862.
3. Hildebrand, F., Ueber die Befruchtung der Salviaarten mit Hilfe von Insekten, Jahrb.Wiss. Bot., 4, 451, 1865.
4. Müller, H., The Mechanism of Flowers, Macmillan, London, 1883.5. Correns, C., Zur Biologie und Anatomie der Salvienblüthe, Jahrb. Wiss. Bot., 22,
190, 1891.6. Troll, W., Über Staubblatt- und Griffelbewegungen und ihre teleologische Deutung,
Flora, 115, 191, 1922.7. Dukas, R. and Dafni, A., Buzz-pollination in three nectariferous boraginaceae and
possible evolution of buzz-pollinated flowers, Plant Syst. Evol., 169, 65, 1990.8. Harder, L.D. and Barclay, R.M.R., The functional significance of poricidal anther
and buzz pollination: controlled pollen removal from Dodecatheon, Funct. Ecol., 8,509, 1994.
9. Harder, L.D. and Thomson, J.D., Evolutionary options for maximizing pollen dis-persal of animal-pollinated plants, Am. Nat., 133, 323, 1989.
10. Yeo, P.F., Secondary Pollen Presentation: Form Function and Evolution, Springer,New York, 1992.
11. Müller, A., Morphological specializations in Central European bees for the uptake ofpollen from flowers with anthers hidden in narrow corolla tubes (Hymenoptera:Apoidea), Entomol. Gener., 20, 43, 1995.
12. Asada, S. and Ono, M., Crop pollination by Japanese bumblebees, Bombus spp.(Hymenoptera: Apidae): tomato foraging behavior and pollination efficiency, Appl.Entomol. Zool., 31, 581 1996.
13. Buchmann, S.L. and Hurley, J.P., A biophysical model for buzz pollination inangiosperms, J. Theor. Biol., 72, 639, 1978.
14. Westerkamp, C., Keel blossoms: bee flowers with adaptions against bees. Flora, 192,125, 1997.
15. Faegri, K. and Van der Pijl, L., The Principles of Pollination Ecology, PergamonPress, Oxford, 1979.
16. Westerkamp, C., The co-operation between the asymmetric flower of Lathyrus lati-folius (Fabaceae-Vicieae) and its visitors, Phyton (Horn), 33, 121, 1993.
17. Huck, R.B., Overview of pollination biology in the Lamiaceae, in Advances inLabiatae Science, Harley R.M. and Reynolds T., Eds., Royal Botanic Gardens, Kew,1992, p. 167.
3209_C006.fm Page 143 Thursday, November 10, 2005 10:45 AM

144 Ecology and Biomechanics
18. Tweraser, E. and Claßen-Bockhoff, R., Hemigenia eutaxioides C.R.P.Andr. — the“invers Salvia flower” from Australia, Abstractband Botanikertagung 2002, Selbstver-lag Botan. Institut, Universität Freiberg, Freiburg i.Br.. 2002, p. 437.
19. Troll, W., Roscoea purpurea SM., eine Zingiberacee mit Hebelmechanismus in denBlüten. Mit Bemerkungen über die Entfaltungsbewegungen der fertilen Staubblättervon Salvia, Planta, 7, 1, 1929.
20. Claßen-Bockhoff, R., Wester, P., and Tweraser, E., The staminal lever mechanism inSalvia L. (Lamiaceae): a review, Plant Biol., 5, 33, 2003.
21. Claßen-Bockhoff, R. et al., The staminal lever mechanism in Salvia L. (Lamiaceae):a key innovation for adaptive radiation? Org. Divers. Evol., 4, 189, 2004.
22. Manning, J. C. and Goldblatt, P., The Moegistorhynchus longirostris (Diptera: Nem-estrinidae) pollination guild: long-tubed flowers and a specialized long-proboscid flypollination system in southern Africa, Plant Syst. Evol., 206, 51, 1997.
23. Lunau, K., Adaptive radiation and coevolution — pollination biology case studies,Org. Divers. Evol., 4, 207, 2004.
24. Dafni, A., Advertisement, flower longevity, reward and nectar protection in Labiatae,Acta Hortic., 288, 340, 1991.
25. Kuschewitz, M., Diversität und mechanische Isolation europäischer Salvia-Arten(Lamiaceae) — eine datenbankgestützte Evaluation, Staatsexamensarbeit UniversitätMainz (unpublished), 2004.
26. Claßen-Bockhoff, R. and Speck, T., Diversity and evolution in Salvia — presentationof a new research project, Vitex, 1, 3, 2000.
27. Ruttner, F., Geographic variability and classification, in Bee Genetics and Breeding,Rinderer, T.E., Ed., Academic Press, Orlando, 1986, p. 23.
28. Knuth, P., Handbuch der Bluetenbiologie, W. Engelmann, Leipzig, 1898.29. Himmelbaur, W. and Stibal, E., Entwicklungsrichtungen in der Blütenregion der
Gattung Salvia L. II., Biologia Generalis, 9, 129, 1934.30. Speck, T. and Claßen-Bockhoff, R., Biomechanik und Funktionsmorphoplogie der
Staubblätter von insektenblütigen und vogelblütigen Salbei-Arten, BIONA-Report,14, 153, 1999.
31. Reith, M., Speck, T. and Claßen-Bockhoff, R., Forces produced by bumble bees(Bombus terrestris) during nectar feeding, (unpublished).
32. Schremmer, F., Blütenbiologische Beobachtungen an Labiaten: nektar und Pollend-iebstahl, Öesterr. Bot. Z., 100, 8, 1953.
33. Kugler, H., Zur Bestäubung von Salvia sclarea L. durch Holzbienen (Xylocopaviolacea L.), Oesterr. Bot. Z., 120, 77, 1972.
34. Westerkamp, C., Honeybees are poor pollinators — why?, Plant Syst. Evol., 177, 71,1991.
35. Thimm, S. et al.., Pollinators of Salvia pratensis are not excluded by physical force— evidence from biomechanical measurements and field investigations, ConferenceProceedings, Abstracts 4th International Plant Biomechanics Conference, W.J. BealBotanical Garden, Michigan State University (East Lansing), Conference Proceed-ings, 2003, p. 21.
36. Johnson, S.D., Pollination ecotypes of Satyrium hallackii (Orchidaceae) in SouthAfrica, Bot. J. Linn. Soc., 123, 225, 1997.
37. Johnson, S.D. and Steiner, K.E., Long-tongued fly pollination and evolution of floralspur length in the Disa draconis complex (Orchidaceae), Evolution, 51, 45, 1997.
38. Hodges, S.A. and Arnold, M.L., Spurring plant diversification: are floral nectar spursa key innovation? Proc. R. Soc. Lond. B., 262, 343, 1995.
3209_C006.fm Page 144 Thursday, November 10, 2005 10:45 AM

Biomechanics of Salvia Flowers 145
39. Dohzono, I. and Suzuki, K., Bumblebee-pollination and temporal change of the calyxtube length in Clematis stans (Ranunculaceae), J. Plant. Res., 115, 355, 2002.
40. Dieringer, G., Ramamoorthy, T.P., and Tenorio Lezama, P., Floral visitors and theirbehavior to sympatric Salvia species (Lamiaceae) in Mexico, Acta Botànica Mexi-cana, 13, 75, 1991.
41. Müller, H., Die Befruchtung der Blumen durch Insekten und die gegenseitigen Anpas-sungen beider, W. Engelmann, Leipzig, 1873.
42. Percival, M.S., The presentation of pollen in certain angiosperms and its collectionby Apis mellifera, New Phytol., 54, 353, 1955.
43. Erbar, C. and Leins, P., Portioned pollen release and the syndromes of secondarypollen presentation in the Campanulales-Asterales-complex. Flora, 190, 323, 1995.
44. Harder, L.D., Pollen removal by bumblebees and its implications for pollen dispersal,Ecology, 71, 1110, 1990.
45. Ramamoorthy, T.P. and Elliot, M., Mexican Labiatae: diversity, distribution, evolutionand endemism, in Biological Diversity of Mexico: Origins and Distribution,Ramamoorthy, T.P. et al., Eds., Oxford University Press, New York, 1993, p. 513.
46. Müller, A., Convergent evolution of morphological specializations in Central Euro-pean bee and honey wasp species as an adaptation to the uptake of pollen fromnototribic flowers (Hymenoptera, Apoidea and Masaridae), Biol. J. Linn. Soc., 57,235, 1996.
47. Westerkamp, C., Pollen in bee-flower relations: some considerations on melittophily,Bot. Acta, 109, 325, 1996.
48. Thomson, J.D. et al., Pollen presentation and pollination syndromes, with specialreference to Penstemon, Plant Species Biol., 15, 11, 2000.
49. Leins, P., Flower pollination by animals: remarks on external and self-pollination andon pollen portioning, Heidelb. Jahrb., 35, 133, 1991.
50. Corbet, S.A. et al., Native or exotic? Double or single? Evaluating plants for polli-nator-friendly gardens, Ann. Bot., 87, 219, 2001.
51. Gams, H. (1927). Labiatae, in Illustrierte Flora von Mittel-Europa, Hegi, G., Ed.,Bd. V. Teil 4, Carl Hauser, München, 1927, p. 2255.
52. Kerner von Maurilaun, A., Pflanzenleben. 2. Band: Geschichte der Pflanzen, Bibliog-raphisches Institut, Leipzig, Wien, 1891.
53. Kratochwil, A., Pflanzengesellschaften und Blütenbesucher-Gemeinschaften: bio-zönologische Untersuchungen in einem nicht mehr bewirtschafteten Halbtrockenra-sen (Mesobrometum) im Kaiserstuhl (Südwestdeutschland), Phytocoenologia, 11,455, 1984.
54. Kwak, M.M., Bumblebees as flower visitors: pollinators and profiteers, Entomol. Ber.(Amsterdam), 62, 73, 2002.
55. Loew, E., Beiträge zur Kenntniss der Bestäubungseinrichtungen einiger Labiaten,Ber. d. dtsch. bot. Ges., 4, 128, 1886.
56. Müller, H., Alpenblumen, ihre Befruchtung durch Insekten und ihre Anpassungen andieselben, W. Engelmann, Leipzig, 1881.
57. Westrich, P., Die Wildbienen Baden-Württembergs, 1st ed., Ulmer, Stuttgart, 1989.58. Speck, T. et al., The potential of plant biomechanics in functional biology and
systematics, in Deep Morphology: Toward a Renaissance of Morphology in PlantSystematics, Stuessey, T., Hörandl, F., and Mayer, V., Eds., Koeltz, Königstein, 2005,p. 241.
3209_C006.fm Page 145 Thursday, November 10, 2005 10:45 AM


147
7 Do Plant Waxes Make Insect Attachment Structures Dirty? Experimental Evidence for the Contamination Hypothesis
Elena Gorb and Stanislav Gorb
CONTENTS
7.1 Introduction ..................................................................................................1477.2 Material and Methods ..................................................................................149
7.2.1 Plant Surfaces and Other Substrates................................................1497.2.2 Model Insect Species and Experiments...........................................149
7.3 Results ..........................................................................................................1507.3.1 Pruinose Plant Surfaces ...................................................................1507.3.2 Adhesive Pads of the Beetle Chrysolina Fastuosa .........................1507.3.3 Pad Contamination ...........................................................................150
7.4 Discussion ....................................................................................................1557.4.1 Contaminating Effect of Crystalline Epicuticular Waxes on
Insect Attachment Devices...............................................................1557.4.2 Dependence of Pad Contamination on Wax Micromorphology .....158
Acknowledgments..................................................................................................160References..............................................................................................................160
7.1 INTRODUCTION
In many higher plants, primary surfaces of aerial organs are covered with crystallineepicuticular waxes. An extremely thick wax layer usually appears as pruinescenceon the stems, leaves, and fruits in various plants [1–3]. Generally, waxes werereported to be important for interactions between plant surfaces and the environment
3209_C007.fm Page 147 Tuesday, November 8, 2005 8:23 AM
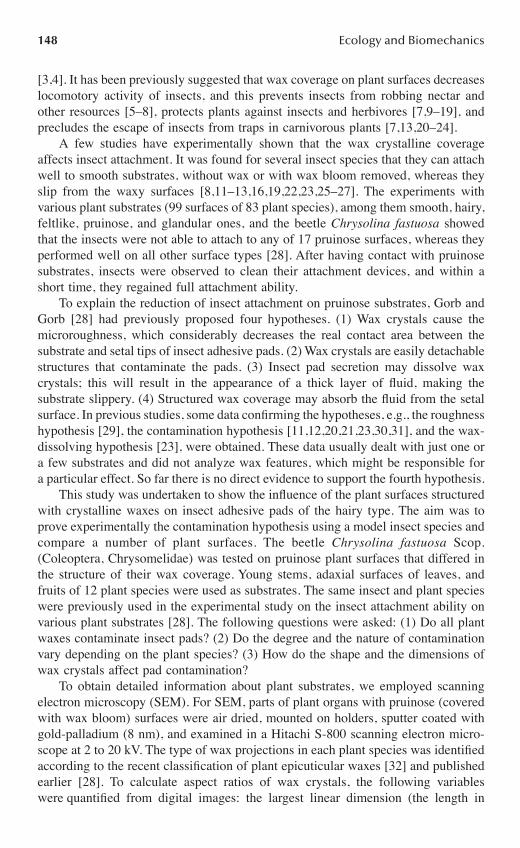
148 Ecology and Biomechanics
[3,4]. It has been previously suggested that wax coverage on plant surfaces decreaseslocomotory activity of insects, and this prevents insects from robbing nectar andother resources [5–8], protects plants against insects and herbivores [7,9–19], andprecludes the escape of insects from traps in carnivorous plants [7,13,20–24].
A few studies have experimentally shown that the wax crystalline coverageaffects insect attachment. It was found for several insect species that they can attachwell to smooth substrates, without wax or with wax bloom removed, whereas theyslip from the waxy surfaces [8,11–13,16,19,22,23,25–27]. The experiments withvarious plant substrates (99 surfaces of 83 plant species), among them smooth, hairy,feltlike, pruinose, and glandular ones, and the beetle Chrysolina fastuosa showedthat the insects were not able to attach to any of 17 pruinose surfaces, whereas theyperformed well on all other surface types [28]. After having contact with pruinosesubstrates, insects were observed to clean their attachment devices, and within ashort time, they regained full attachment ability.
To explain the reduction of insect attachment on pruinose substrates, Gorb andGorb [28] had previously proposed four hypotheses. (1) Wax crystals cause themicroroughness, which considerably decreases the real contact area between thesubstrate and setal tips of insect adhesive pads. (2) Wax crystals are easily detachablestructures that contaminate the pads. (3) Insect pad secretion may dissolve waxcrystals; this will result in the appearance of a thick layer of fluid, making thesubstrate slippery. (4) Structured wax coverage may absorb the fluid from the setalsurface. In previous studies, some data confirming the hypotheses, e.g., the roughnesshypothesis [29], the contamination hypothesis [11,12,20,21,23,30,31], and the wax-dissolving hypothesis [23], were obtained. These data usually dealt with just one ora few substrates and did not analyze wax features, which might be responsible fora particular effect. So far there is no direct evidence to support the fourth hypothesis.
This study was undertaken to show the influence of the plant surfaces structuredwith crystalline waxes on insect adhesive pads of the hairy type. The aim was toprove experimentally the contamination hypothesis using a model insect species andcompare a number of plant surfaces. The beetle Chrysolina fastuosa Scop.(Coleoptera, Chrysomelidae) was tested on pruinose plant surfaces that differed inthe structure of their wax coverage. Young stems, adaxial surfaces of leaves, andfruits of 12 plant species were used as substrates. The same insect and plant specieswere previously used in the experimental study on the insect attachment ability onvarious plant substrates [28]. The following questions were asked: (1) Do all plantwaxes contaminate insect pads? (2) Do the degree and the nature of contaminationvary depending on the plant species? (3) How do the shape and the dimensions ofwax crystals affect pad contamination?
To obtain detailed information about plant substrates, we employed scanningelectron microscopy (SEM). For SEM, parts of plant organs with pruinose (coveredwith wax bloom) surfaces were air dried, mounted on holders, sputter coated withgold-palladium (8 nm), and examined in a Hitachi S-800 scanning electron micro-scope at 2 to 20 kV. The type of wax projections in each plant species was identifiedaccording to the recent classification of plant epicuticular waxes [32] and publishedearlier [28]. To calculate aspect ratios of wax crystals, the following variableswere quantified from digital images: the largest linear dimension (the length in
3209_C007.fm Page 148 Tuesday, November 8, 2005 8:23 AM

Contamination of Insect Feet by Plant Waxes 149
filamentous, ribbonlike, tubelike, and platelike structures) and the smallest lineardimension (the diameter in filamentous, tubelike structures; the thickness in platelikeand ribbonlike structures) (Figure 7.1). For measurements, SigmaScan 5.0 software(SPSS) was employed.
7.2 MATERIAL AND METHODS
7.2.1 PLANT SURFACES AND OTHER SUBSTRATES
Twelve common wild and domestic plants species were used in the experiments:Acer negundo L., Aloe vera (L.) Webb. & Berth., Aquilegia vulgaris L., Berberisvulgaris L., Brassica oleracea L., Chelidonium majus L., Chenopodium album L.,Iris germanica L., Lactuca serriola Torner, Prunus domestica L., Trifolium mon-tanum L., and Vitis vinifera L. These include two trees, one scrub, one liana, andeight herbs. Young stems, leaves, or fruits of these plants were collected in thedeciduous forest, meadows, gardens, or by roadsides near Jagotin (Kiev District,Ukraine). In addition, clean glass surfaces and the glass surfaces covered with dustparticles were used as control substrates for comparison.
7.2.2 MODEL INSECT SPECIES AND EXPERIMENTS
The beetle Chrysolina fastuosa was used as a model insect species because (1) itoccurred in great numbers at the study site and (2) our previous experiments, provinginsect attachment ability on various plant surfaces, have been carried out with thisinsect species [28]. An insect was allowed to walk on the tested surface for 1 min.The beetle was transferred on a clean glass plate, and its legs (foreleg, midleg, andhindleg of one side) were immediately cut off with a sharp razor blade and mountedon SEM holders using conductive carbon double-sided adhesive tabs. On each plantsurface, at least five insects were tested. Insects demonstrating cleaning behavior of
FIGURE 7.1 Diagram of the variables used to calculate aspect ratios of wax crystals havingvarious shapes. (A) Platelets (platelike shape). (B) Tubules (tubelike shape). (C) Terete rodlets(filamentous shape). (D) Polygonal rodlets (ribbonlike shape). Vl, the largest linear variable;Vs, the smallest linear variable.
Vs Vs Vs Vs
VI
DCBA
3209_C007.fm Page 149 Tuesday, November 8, 2005 8:23 AM

150 Ecology and Biomechanics
the tarsi were excluded from the further microscopic procedures. Preparations wereair dried, sputter coated with gold-palladium (10 nm), and examined in a HitachiS-800 scanning electron microscope at 20 kV. Only males were used in the exper-iments because their pads bear mushroomlike hairs having round or oval-shaped flattips, and this facilitated quantification of the contamination.
A portion of the contaminated area of the setal tips was quantified from digitalimages. At least 10 setae having flat, round, or oval-shaped tips were taken formeasurements. For this purpose, the most contaminated part on the ventral surfaceof the third tarsomere (the most distal attachment pad) was selected. Since thetarsomere was not regularly contaminated, portion of setae covered with wax crystalsand dust particles were evaluated from three to five SEM images of the central partof the pad (120 m × 100 m each) taken at low magnification. For measurements,SPSS was used.
7.3 RESULTS
7.3.1 PRUINOSE PLANT SURFACES
Surfaces of plant species studied are either very densely (most species) or rathersparsely (L. serriola, T. montanum, and V. vinifera) covered with wax crystals (Figure7.2). In most species, the wax coverage is relatively uniform. However in L. serriola,crystals are arranged in starlike clusters (rosettes) (Figure 7.2L). In some species(B. oleracea and A. negundo), crystals form compact networks, where single crystalsare hardly discerned (Figures 7.2D and 7.2H). Depending on the plant species,crystals vary in shape, size, and aspect ratio (Table 7.1).
7.3.2 ADHESIVE PADS OF THE BEETLE CHRYSOLINA FASTUOSA
The beetle C. fastuosa possesses hairy adhesive pads [33]. The ventral side of thethree first proximal tarsomeres (1 to 3) is covered by tenent setae [28,34]. There areseveral types of setae. The first type includes setae with curved sharp tips (Figures7.3A to 7.3C). The second one is characterized by the platelike thickening on thetip so that the seta has a mushroomlike shape (Figures 7.3A to 7.3D). The third oneincludes setae with spatula-like tips (Figure 7.3C). There are also setae with transi-tional shapes. Setae of the first type are located on the second and at margins of thefirst and third tarsomeres. Setae of the second type are situated in the middle of thefirst and third tarsomeres. Setae of the third type are located in the distal region ofthe third tarsomeres. Setae with transitional shapes cover areas between setae ofdifferent types.
7.3.3 PAD CONTAMINATION
Intact pads of C. fastuosa beetles were not absolutely clean but bore some contam-inating particles of unknown origin on the surface of their setal tips (Figures 7.3Ato 7.3D). After walking on the glass plate covered with dust, pads were rather stronglycontaminated by large dust particles covering large areas of pads (Figures 7.3E and7.3F). The particles usually got stuck between setae and contaminated setal tips only
3209_C007.fm Page 150 Tuesday, November 8, 2005 8:23 AM
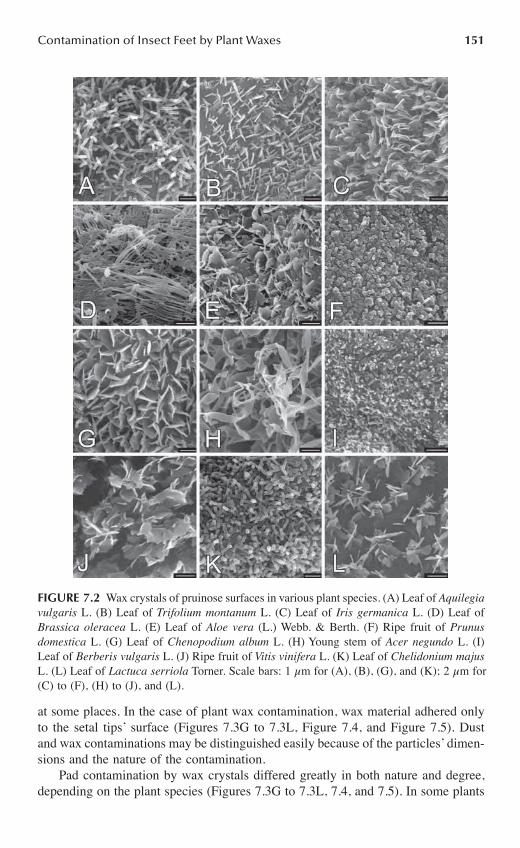
Contamination of Insect Feet by Plant Waxes 151
at some places. In the case of plant wax contamination, wax material adhered onlyto the setal tips’ surface (Figures 7.3G to 7.3L, Figure 7.4, and Figure 7.5). Dustand wax contaminations may be distinguished easily because of the particles’ dimen-sions and the nature of the contamination.
Pad contamination by wax crystals differed greatly in both nature and degree,depending on the plant species (Figures 7.3G to 7.3L, 7.4, and 7.5). In some plants
FIGURE 7.2 Wax crystals of pruinose surfaces in various plant species. (A) Leaf of Aquilegiavulgaris L. (B) Leaf of Trifolium montanum L. (C) Leaf of Iris germanica L. (D) Leaf ofBrassica oleracea L. (E) Leaf of Aloe vera (L.) Webb. & Berth. (F) Ripe fruit of Prunusdomestica L. (G) Leaf of Chenopodium album L. (H) Young stem of Acer negundo L. (I)Leaf of Berberis vulgaris L. (J) Ripe fruit of Vitis vinifera L. (K) Leaf of Chelidonium majusL. (L) Leaf of Lactuca serriola Torner. Scale bars: 1 m for (A), (B), (G), and (K); 2 m for(C) to (F), (H) to (J), and (L).
3209_C007.fm Page 151 Tuesday, November 8, 2005 8:23 AM

152 Ecology and Biomechanics
(A. vulgaris, T. montanum, A. vera, and B. vulgaris), adhered wax had a relativelyhomogeneous texture with almost unstructured or weakly structured surface, andwax crystals were not recognizable anymore (Figures 7.3H, 7.3J, 7.4D, and 7.4L).The waxes of most plants (B. oleracea, C. album, A. negundo, C. majus, andL. serriola) caused clearly structured contaminating coverages or homogeneous cov-erages with well-structured surfaces, where a few crystals or their contours may beidentified (Figures 7.4B, 7.4H, 7.4J, 7.5D, and 7.5F). Waxes of I. germanica and V.vinifera appeared on the setal tips as relatively homogeneous layers with numerouscrystals visible on surfaces (Figures 7.3L and 7.5B).
In the case of A. vulgaris and B. vulgaris, the setae remained almost clean, rarelybearing a few contaminated points or single tiny spots of wax on their tips (Figures7.3G, 7.3H, 7.4K, and 7.4L). Crystals of C. majus displayed only weak contamina-tion appearing as several spots on the setal surface (low degree of contamination)(Figures 7.5C and 7.5D). In B. oleracea, P. domestica, and L. serriola, contaminated
TABLE 7.1Morphometrical Variables and Aspect Ratio of Wax Crystals Constituting Pruinose Surfaces in 12 Plant Species
Wax Projection
TypePlant Species OrganCrystal Shape
Variable, m AspectRatioLargest Smallest
Acer negundo Stem Polygonal rodlets
Ribbon ~20 0.34 ~ 100
Aloe vera Leaf Membraneous platelets
Plate 1.11 0.09 12.33
Aquilegia vulgaris
Leaf Tubules Tube 0.58 0.17 3.41
Berberisvulgaris
Leaf Tubules Tube 0.73 0.16 4.56
Brassica oleracea
Leaf Terete rodlets Filament 2.44 0.06 40.67
Chelidoniummajus
Leaf Tubules Tube 0.83 0.18 4.61
Chenopodiumalbum
Leaf Irregular platelets
Plate 0.89 0.07 12.71
Irisgermanica
Leaf Irregular platelets
Plate 1.74 0.08 21.75
Lactucaserriola
Leaf Irregular platelets
Plate 0.55 0.06 9.17
Prunusdomestica
Fruit Tubules Tube 0.58 0.26 2.23
Trifolium montanum
Leaf Irregular platelets
Plate 0.58 0.06 9.67
Vitis vinifera Fruit Membraneous platelets
Plate 3.17 0.14 22.64
3209_C007.fm Page 152 Tuesday, November 8, 2005 8:23 AM

Contamination of Insect Feet by Plant Waxes 153
spots might cover up to a half of the setal tip area (medium degree of contamination)(Figures 7.4A, 7.4B, 7.4E, 7.4F, 7.5E, and 7.5F). Waxes of T. montanum, I. german-ica, A. vera, and C. album might cover the whole setal tips (strong contamination)(Figures 7.3I to 7.3L, 7.4C, 7.4D, 7. 4G, and 7.4H). In cases of A. negundo and V.vinifera, wax often spread even over the setal tips’ margins (very strong contami-nation) (Figures 7.4I, 7.4J, 7.5A, and 7.5B).
To quantify the influence of wax structure on the degree of contamination, weused the following two parameters: (1) the portion of setal tip surface covered withcontaminating particles and (2) the portion of setae covered with the particles. Plantwaxes studied differed greatly according to both parameters (for the portion of setaltip surface: degrees of freedom (d.f.) = 11, F = 8.963, P < 0.001, one-way ANOVA)
FIGURE 7.3 SEM micrographs of the pad surface in the first (A and B) and the thirdtarsomeres (C to L) of the beetle Chrysolina fastuosa after walking on various surfaces. (A)to (D) Clean glass plate. (E) and (F) Dust particles. (G) and (H) Leaf of Aquilegia vulgaris.(I) and (J) Leaf of Trifolium montanum. (K) and (L) Leaf of Iris germanica. S1, S2, and S3correspond to setae of the first, second, and third type, respectively (see the text). Scale bars:50 m (A); 10 m (B); 100 m (C); 20 m (D), (E), (G), (I), and (K); 5 m (F), (H), (J), and (L).
3209_C007.fm Page 153 Tuesday, November 8, 2005 8:23 AM

154 Ecology and Biomechanics
(Figures 7.6A and 7.6B). A positive correlation (NS) between the portion of thesetal tip surface covered with particles and the portion of setae contaminated wasfound (linear regression: y = 10.332+0.978x, R2 = 0.574; d.f. = 1, F = 13.502, P =0.004, one-way ANOVA) (Figure 7.6C). The positive correlation between the twoparameters was observed not only in the whole set of plant species having varioustypes of wax crystals, but also in plants with the same crystal type, e.g., plateletsand tubes. Therefore, only one of these parameters, the portion of setal tip surfacecontaminated, was used in our further evaluations.
The portion of the setal tip surface contaminated with plant waxes depended onsize of wax crystals. The aspect ratio was found to be statistically significant with
FIGURE 7.4 SEM micrographs of the pad surface in the third tarsomere of the beetleChrysolina fastuosa after walking on various plant surfaces. (A) and (B) Leaf of Brassicaoleracea. (C) and (D) Leaf of Aloe vera. (E) and (F) Ripe fruit of Prunus domestica. (G) and(H) Leaf of Chenopodium album. (I) and (J) Young stem of Acer negundo. (K) and (L) Leafof Berberis vulgaris. Scale bars: 20 m (A), (C), (E), (G), (I), and (K); 5 m (B), (D), (F),(H), (J), and (L).
3209_C007.fm Page 154 Tuesday, November 8, 2005 8:23 AM

Contamination of Insect Feet by Plant Waxes 155
an increase in the largest dimension of crystals (linear regression: y = 6.112+3.955x,R2 = 0.766; d.f. = 1, F = 32.774, P < 0.001, one-way ANOVA) (Figure 7.7A). Theportion of the setal tip surface contaminated correlated positively (NS) with boththe largest dimension (linear regression: y = 44.013+2.509x, R2 = 0.294; d.f. = 1, F= 4.173, P = 0.068, one-way ANOVA) and aspect ratio (linear regression: y =41.434+0.572x, R2 = 0.313; d.f. = 1, F = 4.548, P = 0.059, one-way ANOVA) (Figures7.7B and 7.7C, respectively).
7.4 DISCUSSION
7.4.1 CONTAMINATING EFFECT OF CRYSTALLINE EPICUTICULAR
WAXES ON INSECT ATTACHMENT DEVICES
Similar to other studies on insect attachment to pruinose substrates [8,11–13,16,18,19,22,23,25–27], our previous experiments with C. fastuosa showed that these insects wereunable to attach properly to all tested plant surfaces having wax bloom [28]. Mostpruinose surfaces did not influence the attachment ability of beetles in further experi-ments on the smooth glass plate used as a reference substrate. It was observed that afterhaving contact with pruinose plant surfaces, insects usually cleaned their attachmentorgans from probable wax contamination and, within a short time, recovered theirattachment ability. Only stem of A. negundo had a strong disabling effect on insectattachment, but recovery of the attachment ability was relatively fast. It was assumedthat wax crystals of this plant can probably temporarily impair the function of the tenentsetae in C. fastuosa.
FIGURE 7.5 SEM micrographs of pad surface in the third tarsomere of the beetle Chrysolinafastuosa after walking on various plant surfaces. (A) and (B) Ripe fruit of Vitis vinifera. (C)and (D) Leaf of Chelidonium majus. (E) and (F) Leaf of Lactuca serriola. Scale bars: 20 m(A), (C), and (E); 5 m (B), (D), and (F).
3209_C007.fm Page 155 Tuesday, November 8, 2005 8:23 AM

156 Ecology and Biomechanics
FIGURE 7.6 (A) The portion of the area of the setal tips covered with contaminating particles,(B) the portion of setae contaminated with wax crystals and dust particles, and (C) therelationship between these two parameters.
100
80
60
40
20
0
100
80
60
40
20
0
Gla
ss B
rass
ica
Alo
ePr
unus
Che
nopo
dium Ac
erBe
rber
isAq
uile
gia
Trifo
lium Iris
Vitis
Che
nopo
dium
Lact
uca
Dus
t
Gla
ss B
rass
ica
Alo
ePr
unus
Che
nopo
dium Ac
erBe
rber
isAq
uile
gia
Trifo
lium Iris
Vitis
Che
nopo
dium
Lact
uca
Dus
t
100
80
60
40
20
0
Filaments Plates Tubes Ribbons
0 20 40 60 80 100
Port
ion
of ti
p su
rfac
e co
ntam
inat
ed, %
Portion of tip surface contaminated, %
Port
ion
of se
tae
cont
amin
ated
, %
Port
ion
of se
tae
cont
amin
ated
, %
A
B
C
3209_C007.fm Page 156 Tuesday, November 8, 2005 8:23 AM

Contamination of Insect Feet by Plant Waxes 157
FIGURE 7.7 (A) The relationships between the largest aspect ratio and the largest dimensionof wax crystals, (B) between the portion of setal tip surface contaminated and the largestdimension, and (C) between the portion of setal tip surface contaminated and the aspect ratio.
100
80
60
40
20
0
100
80
60
40
20
0
100
80
60
40
20
0
Asp
ect r
atio
0 5 10 15 20 25 Largest dimension, µm
0 5 10 15 20 25 Largest dimension, µm
0 20 40 60 80 100 Aspect ratio
Port
ion
of ti
p su
rfac
e co
ntam
inat
ed, %
A
B
C
3209_C007.fm Page 157 Tuesday, November 8, 2005 8:23 AM

158 Ecology and Biomechanics
It has been previously reported that insects clean their tarsi and pads after havingcontact with waxy plant surfaces. The grooming behavior was recorded in the beetleParopsis charybdis after having walked on pruinose juvenile leaves of Eucalyptusnitens [13] and in two insect species (the fly Drosophila melanogaster and the antIridomyrmex humilis) after trying to climb up the waxy zone of pitchers in thecarnivorous plant Nepenthes alata [22]. It has been previously shown that crystallinewax of some plant species can contaminate attachment organs of insects. Contam-ination by wax of Brassica spp. was previously observed by SEM in the beetlesPhaedon cochleariae [11,12] and was also reported for three generalist predators[35]. In carnivorous plants, the contaminating effect of wax crystals in Nepenthessp. on pads of the fly Musca domestica has been verified with the transmissionelectron microscopy [5,20]. With the use of SEM, wax platelets of carnivorous N.ventrata, Brocchinia reducta, and Catopsis berteroniana were found attached topads of the fly Calliphora vomitoria [23].
Our data on the contamination of C. fastuosa pads by wax crystals of 12 pruinoseplant surfaces showed for the first time that plants differ essentially in their contam-inating effects on insect’s pads. Differences were found in both quality (nature ofthe contamination, i.e., the structure of the contaminating material and the presenceof recognizable crystals) and degree of contamination (the portion of setal tip surfacecovered with contaminating particles and the portion of setae covered with the wax).These differences are hypothesized to be caused by various micromorphologies ofepicuticular waxes in the plant species studied.
7.4.2 DEPENDENCE OF PAD CONTAMINATION ON WAX
MICROMORPHOLOGY
Analyzing the relationship between the contaminating ability and geometricalparameters of wax crystals, we found that the contamination positively correlatedwith both the largest dimension and the largest aspect ratio of crystals. Thus, larger,relatively longer, and/or relatively thinner wax structures should adhere to insectpads more easily than smaller and shorter ones. We suppose that large crystals withhigh aspect ratio are much more brittle and erodible compared with compact onesand can break readily into tiny pieces during contact formation (Figure 7.8B vs.7.8E). These hydrophobic pieces can attach easily to the setal surface covered withhydrophobic pad secretions (Figure 7.8F).
Our data show the relationship between the degree of contamination and thetype of wax projections (see Table 7.1). Thus, the presence of the tubulelike crystalsled to almost clean or weakly contaminated insect pads, with the only exceptionbeing the very short tubules in P. domestica that nevertheless cause relatively strongcontamination. After having contact with the substrates, covered with wax rodlets,pads were strongly contaminated. In the cases of membraneous and irregular plate-lets, strong or very strong contamination was recorded.
The crystals or at least their contours were clearly observed on the contaminatedinsect surfaces only in the case of platelets (except A. vera); they were not recog-nizable for other wax crystals such as tubules and rodlets. The homogeneous struc-ture of the wax contamination and the absence of the crystals in the contaminating
3209_C007.fm Page 158 Tuesday, November 8, 2005 8:23 AM
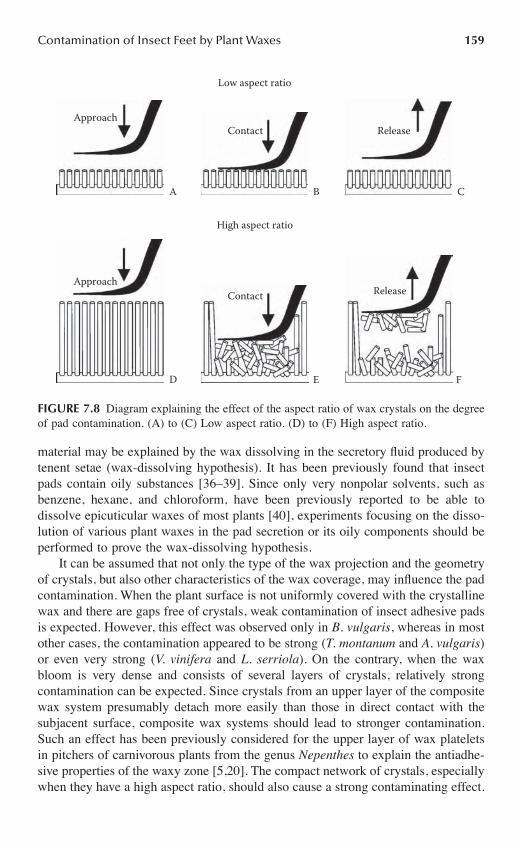
Contamination of Insect Feet by Plant Waxes 159
material may be explained by the wax dissolving in the secretory fluid produced bytenent setae (wax-dissolving hypothesis). It has been previously found that insectpads contain oily substances [36–39]. Since only very nonpolar solvents, such asbenzene, hexane, and chloroform, have been previously reported to be able todissolve epicuticular waxes of most plants [40], experiments focusing on the disso-lution of various plant waxes in the pad secretion or its oily components should beperformed to prove the wax-dissolving hypothesis.
It can be assumed that not only the type of the wax projection and the geometryof crystals, but also other characteristics of the wax coverage, may influence the padcontamination. When the plant surface is not uniformly covered with the crystallinewax and there are gaps free of crystals, weak contamination of insect adhesive padsis expected. However, this effect was observed only in B. vulgaris, whereas in mostother cases, the contamination appeared to be strong (T. montanum and A. vulgaris)or even very strong (V. vinifera and L. serriola). On the contrary, when the waxbloom is very dense and consists of several layers of crystals, relatively strongcontamination can be expected. Since crystals from an upper layer of the compositewax system presumably detach more easily than those in direct contact with thesubjacent surface, composite wax systems should lead to stronger contamination.Such an effect has been previously considered for the upper layer of wax plateletsin pitchers of carnivorous plants from the genus Nepenthes to explain the antiadhe-sive properties of the waxy zone [5,20]. The compact network of crystals, especiallywhen they have a high aspect ratio, should also cause a strong contaminating effect.
FIGURE 7.8 Diagram explaining the effect of the aspect ratio of wax crystals on the degreeof pad contamination. (A) to (C) Low aspect ratio. (D) to (F) High aspect ratio.
Contact Release
Approach Contact Release
Low aspect ratio
High aspect ratio
A B C
D E F
Approach
3209_C007.fm Page 159 Tuesday, November 8, 2005 8:23 AM
160 Ecology and Biomechanics
The delicate mechanical removal (by brushing) of threadlike crystals composingdense networks, and strong contamination of adhesive pads in the fly Calliphoravomitoria by these waxes have been previously described in carnivorous plantsBrocchinia reducta and Catopsis berteroniana [23]. In our study, ribbonlike tereterodlets of A. negundo forming relatively compact networks showed a similar con-taminating effect. Moreover, this wax can disable the attachment ability of beetlesfor some time [28].
Thus, our experiments with C. fastuosa beetles and various pruinose plantsubstrates differing in wax morphology showed that wax crystals in many plantspecies are easily detachable structures that can readily adhere to the surface ofattachment organs in insects and contaminate them. The presence of recognizablecrystals in the contaminating material found for some waxes provides additionalevidence for the contamination hypothesis. The homogeneous contamination maybe explained by wax dissolution in the pad secretion. To prove the wax-dissolvinghypothesis, further experiments should be carried out. In a few plant species, waxesshowed no contaminating effect; however, a decrease in the ability of insects toattach on these substrates has been previously recorded [28]. It may be assumed thatin these cases other mechanisms, such as the reduction of the contact area or theabsorption of the pad secretion by crystalline wax coverage, are involved in theadhesion force reduction.
ACKNOWLEDGMENTS
Constant support by Jürgen Berger (Electron Microscopy Unit at the MPI of Devel-opmental Biology, Tübingen, Germany) is greatly acknowledged. Florian Haas (Uni-versity of Heidelberg, Germany) helped with data quantification. This project wassupported by the Federal Ministry of Education, Science and Technology, Germany,to SNG (Project BioFuture 0311851).
REFERENCES
1. Barthlott, W. and Ehler, N., Raster-Elektronenmikroskopie der Epidermisoberflächenvon Spermatophyten, Trop. Subtrop. Pflanzenwelt, 19, 367, 1977.
2. Barthlott, W. and Wollenweber, E., Zur Feinstruktur, Chemie und taxonomischenSignifikanz epikutikularer Wachse und ähnliche Sekrete, Trop. Subtrop. Pflanzenwelt,32, 7, 1981.
3. Barthlott, W., Scanning electron microscopy of the epidermal surface in plants, inScanning Electron Microscopy in Taxonomy and Functional Morphology, Claugher,D., Ed., Clarendon, Oxford, 1998, p. 69.
4. Jeffree, C.E., The cuticle, epicuticular waxes and trichomes of plants, with referencesto their structure, functions and evolution, in Insects and the Plant Surface, Juniper,B.E. and Southwood, T.R.E., Eds., Edward Arnold, London, 1986, p. 23.
5. Juniper, B.E., Robins, R.J., and Joel, D.M., The Carnivorous Plants, Academic Press,London, 1989.
6. Harley, R., The greasy pole syndrome, in Ant-Plant Interactions, Huxley, C.R. andCutler, D.E., Eds., Oxford University Press, Oxford, 1991, p. 430.
3209_C007.fm Page 160 Tuesday, November 8, 2005 8:23 AM

Contamination of Insect Feet by Plant Waxes 161
7. Juniper, B.E., Waxes on plant surfaces and their interactions with insects, in Waxes:Chemistry, Molecular Biology and Functions, Hamilton, R.J., Ed., Oily, West Ferry,Dundee, 1995, p. 157.
8. Eigenbrode, S.D., Plant surface waxes and insect behaviour, in Plant Cuticles — AnIntegral Functional Approach, Kerstiens, G., Ed., BIOS, Oxford, 1996, p. 201.
9. Anstey, T.H. and Moore, J.F., Inheritance of glossy foliage and cream petals in greensprouting broccoli, J. Heredity, 45, 39, 1954.
10. Way, M.J. and Murdie, G., An example of varietal resistance of Brussel sprouts, Ann.Appl. Biol., 56, 326, 1965.
11. Stork, N.E., Role of wax blooms in preventing attachment to brassicas by the mustardbeetle, Phaedon cochleariae, Entomol. Exp. Applicata, 28, 100, 1980.
12. Stork, N.E., The form of plant waxes: a means preventing insect attachment? inInsects and the Plant Surface, Juniper, B.E. and Southwood, T.R.E., Eds., EdwardArnold, London, 1986, p. 346.
13. Edwards, P.B., Do waxes of juvenile Eucalyptus leaves provide protection fromgrazing insects? Austral. J. Ecol., 7, 347, 1982.
14. Edwards, P.B. and Wanjura, W.J., Physical attributes of eucalypt leaves and the hostrange of chrysomelid beetles, Symp. Biol. Hung., 39, 227, 1990.
15. Stoner, K.A., Glossy leaf wax and host-plant resistance to insects in Brassica oleraceaL. under natural infestation, Environ. Entomol., 19, 730, 1990.
16. Bodnaryk, R.P., Leaf epicuticular wax, an antixenotic factor in Brassicaceae thataffects the rate and pattern of feeding in flea beetles, Phyllotreta cruciferae (Goeze),Can. J. Plant Sci., 72, 1295, 1992.
17. Eigenbrode, S.D. and Espelie, K.E., Effects of plant epicuticular lipids on insectherbivores, Annu. Rev. Entomol., 40, 171, 1995.
18. Federle, W. et al., Slippery ant-plants and skillful climbers: selection and protectionof specific ant partners by epicuticular wax blooms in Macaranga (Euphorbiaceae),Oecologia, 112, 217, 1997.
19. Eigenbrode, S.D. and Kabalo, N.N., Effects of Brassica oleracea waxblooms onpredation and attachment by Hippodomia convergen, Entomol. Exp. Applicata, 91,125, 1999.
20. Juniper, B.E. and Burras, J.K., How pitcher plants trap insects, New Scientist, 269,75, 1962.
21. Martin, J.T. and Juniper, B.E., The Cuticle of Plants, Edward Arnold, London, 1970.22. Gaume, L., Gorb, S., and Rowe, N., Function of epidermal surfaces in the trapping
efficiency of Nepenthes alata pitchers, New Phytol., 156, 476, 2002.23. Gaume, L. et al., How do plant waxes cause flies to slide? Experimental tests of wax-
based trapping mechanisms in the three pitfall carnivorous plants, Artropod Str.Develop., 33, 103, 2004.
24. Riedel, M., Eichner, A., and Jetter, R., Slippery surfaces of carnivorous plants:composition of epicuticular wax crystals in Nepenthes alata Blanco pitchers, Planta,218, 87, 2003.
25. Eigenbrode, S.D., Kabalo, N.N., and Stoner, K.A., Predation, behavior, and attach-ment by Chrysoperla plorabunda larvae on Brassica oleracea with different surfacewaxblooms, Entomol. Exp. Applicata, 90, 225, 1999.
26. Eigenbrode, S.D. et al., Effects of wax bloom variation in Brassica oleracea onforaging by a vespid wasp, Entomol. Exp. Applicata, 97, 161, 2000.
27. Federle, W., Rohrseitz, K., and Hölldobler, B., Attachment forces of ants measuredwith a centrifuge: better “wax-runners” have a poorer attachment to a smooth surface,J. Exp. Biol., 203, 505, 2000.
3209_C007.fm Page 161 Tuesday, November 8, 2005 8:23 AM

162 Ecology and Biomechanics
28. Gorb, E.V. and Gorb, S.N., Attachment ability of the beetle Chrysolina fastuosa onvarious plant surfaces, Entomol. Exp. Applicata, 105, 13, 2002.
29. Gorb, S.N., Attachment Devices of Insect Cuticle, Kluwer Academic Publishers,Dordrecht, 2001.
30. Ramires, V.B., Can dusts be used against Varroa jacobsoni? Apiacta, 24, 2, 1989.31. Dixon, A.F.G., Croghan, P.C., and Gowing, R.P., The mechanism by which aphids
adhere to smooth surfaces, J. Exp. Biol., 152, 243, 1990.32. Barthlott, W. et al., Classification and terminology of plant epicuticular waxes, Bot.
J. Linn. Soc., 126, 237, 1998.33. Beutel, R. and Gorb, S.N., Ultrastructure of attachment specializations of hexapods
(Arthropoda): evolutionary patterns inferred from a revised ordinal phylogeny, J.Zool. Syst. Evol. Res., 39, 177, 2001.
34. Stork, N.E., A scanning electron microscope study of tarsal adhesive setae in theColeoptera, Zool. J. Linn. Soc., 68, 173, 1980.
35. Eigenbrode, S.D. et al., Mobility of three generalist predators is greater on cabbagewith glossy leaf wax than on cabbage with a wax bloom, Entomol. Exp. Applicata,81, 335, 1999.
36. Ishii, S., Adhesion of a leaf feeding ladybird Epilachna vigintioctomaculta(Coleoptera: Coccinellidae) on a vertically smooth surface, Appl. Entomol. Zool., 22,222, 1987.
37. Kosaki, A. and Yamaoka, R., Chemical composition of footprints and cuticula lipidsof three species of lady beetles, Jap. J. Appl. Entomol. Zool., 40, 47, 1996.
38. Eisner, T. and Aneshansley, D.J., Defence by foot adhesion in a beetle (Hemisphaerotacyanea), Proc. Natl. Acad. USA, 97, 6568, 2000.
39. Vötsch, W. et al., Chemical composition of the attachment pad secretion of the locustLocusta migratoria, Insect Biochem. Molec. Biol., 32, 1605, 2002.
40. Hallam, N.D., Fine structure of the leaf surface and the origin of leaf waxes, in ThePlant Cuticle, Cutler, D.E., Alvin, K.L., and Price, C.E., Eds., Academic Press,London, 1982, p. 197.
3209_C007.fm Page 162 Tuesday, November 8, 2005 8:23 AM

163
8 Ecology and Biomechanics of Slippery Wax Barriers and Wax Running in Macaranga–AntMutualisms
Walter Federle and Tanja Bruening
CONTENTS
8.1 Introduction ..................................................................................................1648.2 Ecology and Evolution of Wax Barriers in the Ant-Plant Genus
Macaranga ...................................................................................................1658.2.1 Protection of Specific Ant Partners against Generalist Ants...........1658.2.2 Effect of Wax Barriers on Host Specificity.....................................1658.2.3 Evolution of Macaranga Wax Barriers ...........................................1678.2.4 Adaptive Syndromes of Ant Associations in Waxy and
Nonwaxy Macaranga Ant-Plants ....................................................1688.2.4.1 Ant Traits ..........................................................................1688.2.4.2 Host Plant Traits ...............................................................1688.2.4.3 Evolution of Adaptive Syndromes ...................................169
8.3 Biomechanics of Wax Running in Crematogaster (Decacrema) Ants .......1708.3.1 Tarsal Attachment Devices in Ants..................................................1708.3.2 Mechanisms of Slipperiness ............................................................1718.3.3 Mechanisms of Wax Running..........................................................172
8.3.3.1 Attachment Force vs. Climbing Performance: Is Wax Running Capacity Based on Greater Attachment or Superior Locomotion? ......................................................173
8.3.3.2 Comparative Morphometry of Wax Runners and Non–Wax Runners............................................................174
3209_C008.fm Page 163 Thursday, November 10, 2005 10:46 AM

164 Ecology and Biomechanics
8.3.3.3 Mechanical Benefit of Long Legs for Climbing Ants .....1768.3.3.4 Kinematics of Climbing in Crematogaster
(Decacrema) Wax Runners and Non–Wax Runners........1778.4 Conclusions ..................................................................................................179Acknowledgments..................................................................................................180References..............................................................................................................180
8.1 INTRODUCTION
Most terrestrial ecosystems have been shaped by interactions between plants andinsects. Insects are involved in a variety of interactions with plants, not only aspollinators and herbivores, but also as predators of herbivores, seed dispersers, andas prey of insectivorous plants. The mechanisms giving rise to and maintainingthese interactions are often chemical in nature. Plant secondary compounds mayhave direct effects on herbivores (e.g., feeding inhibitors or toxic compounds) oract as signals (semiochemicals) perceived by insects. The chemical ecology ofinsect–plant interactions has been studied extensively over the past decades (see,e.g., [1–3]). However, insect–plant interactions are not only determined by chemicalfactors, but also by physical factors. For example, mechanical interactions are well-known from specialized flower morphologies tailored for specific pollinators [4,5],and mechanical factors play a significant role in the context of herbivory (see, e.g.,[6–8]). Despite their ecological importance, surprisingly little work has focused onmechanical interactions between insects and plants (but see Chapters 6, 7, and 9of this book).
A mechanical factor that represents a fundamental prerequisite for the existenceof insect–plant interactions is surface attachment. To hold onto and maneuver onsmooth plant cuticles, insects have evolved specialized adhesive pads on their legs[9]. To keep away insects with adhesive organs, many plant species form surfacesthat inhibit insect attachment or hamper insect locomotion. Some insects in turnhave developed adaptations to circumvent these barriers (see, e.g., [10–14]). Theevolution of mechanical barriers and of mechanisms to circumvent them is analogousto the evolution of chemical plant defenses and insect mechanisms to detoxify orsequester them. Such “coevolutionary” processes (in the sense of “escape-and-radiate” or reciprocal adaptation) have probably played a central role in the evolutionof plants and insects [15,16].
One of the clearest examples of the importance of biomechanical factors for theecology and evolution of insect–plant interactions is represented by the protective“wax barriers” in the ant-plant genus Macaranga [17]. The aim of the present chapteris to give a survey of the ecological and evolutionary implications of wax barriersand “wax running” capacity in Macaranga–ant mutualisms. We combine this reviewwith new findings on the biomechanics of wax running in Crematogaster (Deca-crema) ants.
3209_C008.fm Page 164 Thursday, November 10, 2005 10:46 AM

Wax Barriers and Wax Running in Macaranga–Ant Mutualisms 165
8.2 ECOLOGY AND EVOLUTION OF WAX BARRIERS IN THE ANT-PLANT GENUS MACARANGA
8.2.1 PROTECTION OF SPECIFIC ANT PARTNERS AGAINST GENERALIST
ANTS
Macaranga (Euphorbiaceae) is a large paleotropical pioneer tree genus consistingof approximately 280 species [18]. The majority of species are myrmecophilic, i.e.,they offer nectar and food bodies on the plant surface to attract generalist ants, whichprovide protection against herbivory. Only 29 Macaranga species in southeast Asiaare myrmecophytic, i.e., obligately associated with specialized plant-ants. These ants(belonging to the genera Crematogaster and Camponotus) exclusively nest in thehollow (or hollowed-out) stems of their host trees.
In 14 Macaranga ant-plant species, the stems are densely covered by bloomsof epicuticular wax crystals. These waxy surfaces are very slippery for most gener-alist insects. A test of the climbing capacity of 17 generalist ant species on waxyMacaranga stems showed that ants often fell down from the plant or moved forwardvery slowly. This barrier effect of the wax crystal surfaces is only based on reducedphysical adhesion; no evidence of chemical repellence was found [17]. In strikingcontrast to generalist ants, the specialized ant partners of waxy Macaranga hostshad no difficulty running on the slippery stems. Because of their exceptional waxrunning capacity, these ants escape predation and competition by generalist ants. Infact, Crematogaster (Decacrema) wax runners were clearly inferior to most otherants in direct encounters, so that their survival depended on the presence of verticalwaxy stem sections preventing generalist ants from invading their nests [17]. Thebarrier effect of waxy stems is enhanced by the whorled growth form and the extremeepidermis longevity of many Macaranga ant-plants, which increase the length ofslippery, waxy stem sections that have to be traversed to reach the upper parts of atree [17].
8.2.2 EFFECT OF WAX BARRIERS ON HOST SPECIFICITY
Macaranga wax barriers not only act as an exclusion filter favoring specialists overgeneralists, but also as an ecological isolation mechanism between different antpartners of Macaranga. Most of the obligate plant-ants associated with Macarangaare members of the Crematogaster subgenus Decacrema. The Crematogaster (Deca-crema) complex currently represents a group of nine similar morphospecies (msp.),many of which can only be identified by morphometry of queen head dimensions[19]. A formal description of the recognized morphospecies colonizing Macarangaand a taxonomic revision of the Decacrema subgenus are still to come.
Crematogaster (Decacrema) ants colonize both waxy and nonwaxy Macarangahost plants. Running tests in several Crematogaster (Decacrema) morphospeciesshowed that ants associated with nonwaxy Macaranga hosts had great difficultyclimbing on slippery waxy stems [17,20], suggesting that only certain Crematogaster(Decacrema) morphospecies are able to colonize waxy Macaranga hosts. Thehost plant spectrum of Crematogaster (Decacrema) morphospecies surveyed by
3209_C008.fm Page 165 Thursday, November 10, 2005 10:46 AM

166 Ecology and Biomechanics
Fiala et al. [19] clearly confirms that Macaranga wax barriers act as an ecologicalisolation mechanism between different ant associates of Macaranga. Of the eightCrematogaster (Decacrema) morphospecies recognized by Fiala et al. [19], sixmorphospecies are “wax runners” and two are “non–wax runners” (Figure 8.1). Arecently discovered new Crematogaster (Decacrema) morphospecies is also associ-ated with nonwaxy hosts (H. Feldhaar, unpublished results). This specificity patternbecomes even more clear-cut when only adult colonies (and no founding queens)are considered ([19]; B. Fiala, personal communication).
While it is evident that Crematogaster (Decacrema) non–wax runners can hardlybe successful as colonizers of waxy Macaranga hosts, it is less obvious why waxrunners almost never colonize nonwaxy trees. Even though Crematogaster (Deca-crema) wax runners adhere less well to smooth substrates than non–wax runners(suggesting the existence of a trade-off between the ants’ ability to walk on waxyvs. smooth stems [20]), their attachment forces to smooth surfaces are not smallerthan those of other arboreal ants and do not seem to represent any limitation. Theabsence of wax runners on nonwaxy Macaranga hosts is rather based on interspecificcompetition by non–wax runners (see Section 8.2.4).
The only apparent exception from the pattern of specificity conferred by waxbarriers (Figure 8.1) is the association between the waxy M. glandibracteolata andtwo morphospecies of non–wax runners in Sabah (Borneo). The proximate factorsexplaining the existence of this association are still unclear. Even though the waxcrystal surfaces of M. glandibracteolata appear to be less slippery than those ofother waxy Macaranga species, the resident ant colonies show less vitality and
FIGURE 8.1 Association frequency of eight Crematogaster (Decacrema) morphospecieswith waxy vs. nonwaxy Macaranga host plants. The data is from Table 2A in Fiala et al.,Biol. J. Linn. Soc., 66, 305, 1999; of the plants identified as M. indistincta by Fiala et al., 28were M. glandibracteolata trees (B. Fiala, personal communication) and are included amongthe waxy host plants here. Crematogaster msp.8 is not shown here because it is not a memberof the Crematogaster-subgenus Decacrema.
0%
20%
40%
60%
80%
100%
msp.1 msp.2 msp.3 msp.4 msp.5 msp.6 msp.7 msp.9
Crematogaster (Decacrema) morphospecies
Waxy MacarangaNonwaxy Macaranga
Hos
t pla
nt a
ssoc
iatio
n fr
eque
ncy
3209_C008.fm Page 166 Thursday, November 10, 2005 10:46 AM
Wax Barriers and Wax Running in Macaranga–Ant Mutualisms 167
growth rate than the same morphospecies living sympatrically on nonwaxy Macar-anga hosts (H. Feldhaar, unpublished results).
Specialization of Crematogaster (Decacrema) clades (identified from mitochon-drial cytochrome oxidase subunit I [COI] gene sequences) to host plants with vs.without wax barriers has also been confirmed by Quek et al. [21], but their studysuggested that several clades occurred both on waxy and nonwaxy hosts. However,due to interspecific hybridization and mtDNA gene flow, mtDNA patterns of varia-tion can be misleading about species relationships in closely related species groups(see, e.g., [22, 23]). In fact, recent work by H. Feldhaar has revealed evidence forCOI pseudogenes and mtDNA introgression in the Crematogaster (Decacrema)complex ([24], H. Feldhaar, unpublished results), which may explain the conflictingclade boundaries derived from mtDNA gene sequence data and morphology [25].
8.2.3 EVOLUTION OF MACARANGA WAX BARRIERS
Wax crystal surfaces occur frequently among myrmecophytic but only rarely amongmyrmecophilic species of the genus Macaranga [17]. In the few waxy, nonmyrme-cophytic Macaranga species, the waxy stem surface is interspersed with hairs, whichfacilitate access for generalist ants and reduce the effectiveness of the wax barriers.Even though myrmecophytism and the presence of waxy stems in Macaranga exhibitphylogenetic autocorrelation [26,27], the more frequent occurrence of wax barriersamong ant-plants is not solely a consequence of phylogenetic history. Inspection ofthe distribution of gains and losses of slippery wax barriers (i.e., waxy stems withouthairs) across a phylogenetic tree of Macaranga confirmed that they are functionallylinked with myrmecophytism [27], consistent with our earlier conclusions from aphylogenetically uninformed analysis [17].
Although many Macaranga species benefit from the presence of generalist antvisitors, there are several reasons why it is beneficial for Macaranga ant-plants topromote and protect only one or a few specialized plant-ant species:
1. Obligate ant associations can provide advantages over myrmecophilicrelationships. Macaranga trees are protected against overgrowth by thepruning behavior of Crematogaster (Decacrema) ants, which is absent ingeneralist ants [28,29]. Moreover, specific ant partners permanently nest-ing on a tree can defend herbivores more effectively than generalist visitors[30].
2. Once an obligate ant associate is present, myrmecophytes can becomemore dependent on the ant partners’ presence because of an evolutionaryloss of plant defensive compounds ([31]; for Macaranga, see [32,33]). Infact, Macaranga ant-plants are unable to survive in the absence of theirspecific ant partners [30]. For this reason, invasions of generalist ants,which compete for host plant food resources or behave aggressivelyagainst the ant partners, can be costly for the host plant.
Selection may have forced Macaranga ant-plants to evolve traits that minimizepredation and competition for their specific ant partners. There are two alternative
3209_C008.fm Page 167 Thursday, November 10, 2005 10:46 AM

168 Ecology and Biomechanics
ways of how this can be achieved. When plant-ants primarily feed on host plantfood resources — as is the case in Crematogaster (Decacrema) ants — plants canincrease the ants’ defensive capability by supplying them with more food, whichresults in larger colonies with more competitive workers. Alternatively, ant-plantscan evolve exclusion filters that restrict access to the mutualists. Both “strategies”are found in Macaranga–ant associations (see Section 8.2.4.).
8.2.4 ADAPTIVE SYNDROMES OF ANT ASSOCIATIONS IN WAXY AND
NONWAXY MACARANGA ANT-PLANTS
The presence or absence of protective wax barriers has important ecological impli-cations for Macaranga–ant associations. Despite its effectiveness, this exclusionfilter is only present in 14 out of 29 Macaranga ant-plant species. This raises thequestion of why and how non–wax runners are able to compete and survive despitethe absence of the protective wax barriers. Our work has revealed that these asso-ciations compensate for the absence of wax barriers by a variety of other mecha-nisms, which involve both ant and host plant traits.
8.2.4.1 Ant Traits
8.2.4.1.1 Pruning BehaviorCrematogaster (Decacrema) non–wax runners prune neighboring vegetation moreintensely than their congeners inhabiting waxy Macaranga hosts [29]. Strongerpruning not only more effectively prevents host plants from being overgrown byclimbers, but also provides a better protection against invasions by foreign ants[29,34].
8.2.4.1.2 AggressivenessThe greater intensity of pruning behavior might reflect a generally higher level ofaggressiveness by Crematogaster (Decacrema) non–wax runners [29]. Moreover,ants from the nonwaxy M. trachyphylla were reported to be more aggressive thanants from the waxy M. beccariana [35].
8.2.4.1.3 Colony DensityData from young Macaranga trees (1.80 to 3.00 m tall) indicated that colonies ofnon–wax runners have a higher number of workers per twig length [29], whichprobably result in a greater defensive capability. However, a different pattern wasfound in mature Macaranga trees [36], suggesting that other factors (e.g., foodsupply) contribute to interspecific variation of colony density.
8.2.4.2 Host Plant Traits
8.2.4.2.1 Hidden Food PresentationIn many Macaranga host plants devoid of wax crystals, food bodies are presentedin a secluded space under the recurved, succulent stipules, whereas waxy hosts offerthem openly accessible on the plant surface. Similarly, extrafloral nectaries (EFN)are largely absent in nonwaxy Macaranga hosts but not in many waxy members of
3209_C008.fm Page 168 Thursday, November 10, 2005 10:46 AM

Wax Barriers and Wax Running in Macaranga–Ant Mutualisms 169
the genus [27]. The correlation of open food presentation and wax barriers issupported both by traditional and phylogenetically based comparative methods (inde-pendent contrasts [37]). Thus, the hidden food presentation in nonwaxy Macarangahost plants probably represents an adaptation to protect the specific ant partnersagainst competition [27].
8.2.4.2.2 ProstomataThe prostoma, a preformed thin-walled zone of the stem where ants preferably chewtheir entrance holes, represents a further host plant trait that correlates with thepresence and absence of wax barriers. In most Macaranga myrmecophytes devoidof wax crystals, the hollow internodes possess a longitudinal prostoma above theleaf insertion [38]. Many waxy host plants, however, lack prostomata and theirdomatium walls are uniformly thin on all sides of the internode. Absence of pros-tomata and presence of wax barriers were found to be significantly correlated whenMacaranga ant-plant species were treated as independent samples [38]. When thedistribution of prostomata is mapped on a phylogenetic tree of Macaranga, however,it can be seen that most prostoma-containing species in the genus section Pachy-stemon may have originated from a single ancestor. Even though prostomata aretherefore unlikely to have evolved as an adaptation to the absence of wax barriers,they could function as filters promoting only the specialized Crematogaster (Deca-crema) ants capable of finding the prostoma. Crematogaster (Decacrema) workersrecognize the position of the prostoma from inside the domatia by using incidentdaylight as an orientation cue, a capacity that may be absent in many generaliststem-nesting ants that chew entrance holes into hollow twigs [38].
Exclusion filters such as wax barriers, hidden food presentation, or prostomatahave also been reported from other myrmecophytic systems. For example, the roundor flattened prostomata in the ant-plant genus Leonardoxa facilitate hole boring forspecific ants [39]; long and dense trichomes in a variety of ant-plant genera inhibitthe movements of larger ants [40]. The selective effect of all these plant traits is basedon more or less specialized behaviors or morphological properties of the ant partners.
8.2.4.3 Evolution of Adaptive Syndromes
The ant and plant characteristics listed in the previous section correlate with theants’ ability or inability to run on waxy stems and the presence or absence of waxcrystals. The combinations of characters may thus be considered adaptive syndromes.Both ant and host plant traits may maximize the ecological benefits and minimizethe ecological costs of each stem wax type. For the host plants, the evolutionaryoutcome may be governed by trade-offs between costs of producing morphologicalexclusion filters and costs of sustaining highly competitive ant colonies. Similartrade-offs may be associated with the ants’ capacity of wax running.
Reconstructions of ancestral states in Macaranga ant-plants are ambiguous withregard to the question of whether species devoid of wax crystals have evolved fromwaxy ancestors [21,27]. However, it is likely that wax barriers have been lost onceat the base of a large clade in the genus section Pachystemon. Thus, Macarangahost plants have possibly undergone a change of adaptive syndrome, followed byradiation.
3209_C008.fm Page 169 Thursday, November 10, 2005 10:46 AM

170 Ecology and Biomechanics
Even though the existing phylogenetic information on the Macaranga-associatedCrematogaster (Decacrema) species group is still uncertain [21,25], it suggests thatwax running capacity represents the ancestral condition in this clade and thatnon–wax runners have originated through several independent losses [25]. Theevolutionary origin of wax running capacity may thus have occurred before theradiation of this plant-ant clade.
To summarize, the slippery wax barriers and the ants’ capacity to run on themrepresent a mechanical factor that plays a central role in the biology of Macar-anga–ant associations and has multiple implications on traits of both host plants andant partners. An essential prerequisite for clarifying the mechanisms of speciationand the extent of coevolution vs. coadaptation (i.e., the match of characters withindependent origins) in this ant-plant system is a knowledge of the mechanical basisof wax barriers and of wax running behavior. A biomechanical analysis of waxrunning is necessary to identify traits and adaptations involved in the capacity tocolonize waxy hosts. By mapping these traits on the phylogeny of Crematogaster(Decacrema) ants, it will be possible to study the evolution of this biomechanicalcapacity and to compare it with the evolutionary history of host plant adapations.
8.3 BIOMECHANICS OF WAX RUNNING IN CREMATOGASTER (DECACREMA) ANTS
8.3.1 TARSAL ATTACHMENT DEVICES IN ANTS
The pretarsus of arthropods contains two sickle-shaped claws that are used to clingto rough-textured surfaces ([41,42] (Figure 8.2A). Attachment to smooth plant sub-strates is accomplished by adhesive organs, which are structurally diverse in differentinsect orders. In ants and bees (Hymenoptera), the adhesive organ (arolium) is anunfoldable pad located between the claws. The adhesive surface of the arolium isrelatively smooth and is typically wetted by a fluid secretion, as in many other insects[43,44].
FIGURE 8.2 (A) Pretarsus of Crematogaster (Decacrema) msp.2 with claws (cl) and arolium(ar). (B) Wax crystal surface on M. hypoleuca stem. Scale bars: 50 m (A) and 5 m (B).
cl
ar
BA
3209_C008.fm Page 170 Thursday, November 10, 2005 10:46 AM

Wax Barriers and Wax Running in Macaranga–Ant Mutualisms 171
8.3.2 MECHANISMS OF SLIPPERINESS
Epicuticular wax crystals are typically formed by pure lipid compounds when theyare present as the predominant component in the wax mixture. In Macaranga, thethreadlike crystals (Figure 8.2B) are composed of triterpenoids [45]. Plant surfacescovered with wax crystals are mostly slippery for insects (see, e.g., [46–52]). Severalhypothetical mechanisms have been proposed to explain this phenomenon.
1. Wax crystals form substrates with a microscopic surface roughness. Sur-face roughness may effectively prevent attachment of insect tarsi if (a)the roughness height and width are too large for surface minima to befilled completely with adhesive secretion, (b) the roughness width is toosmall to allow the soft adhesive pad cuticle to deform and make sufficientcontact between asperities (which leads to a strongly reduced area of realcontact), and (c) the surface texture is too fine to allow the claws tointerlock with surface protrusions [42]. These criteria are met for inter-mediate surface roughnesses in the micron and submicron range, whichcorrespond to the order of magnitude found in natural waxy plant surfaces.Evidence in favor of microscopic roughness reducing insect attachmentforces is given by Gorb [41].
2. Wax crystals can be easily detached so that insect tarsi become contam-inated when walking on a waxy plant surface [47,48,50,53–55]. Waxcrystal particles not only contaminate insect attachment structures, butthey can form an amorphous substance on the surface of adhesive padswhen partly dissolved by insect adhesive secretions [49,50]. Both formsof contamination impede attachment.
3. The hydrophobic microrough wax crystal substrates may absorb anddeplete insect adhesive secretions necessary for capillarity-based adhe-sion [50].
In the Crematogaster–Macaranga system, both (1) surface roughness and (2)wax crystal detachment and pad contamination contribute to the slipperiness of waxyMacaranga stem surfaces. We measured in-plane detachment forces of Cremato-gaster (Decacrema) msp.2 wax runners on nonexfoliating aluminium oxide sub-strates of different roughness using the centrifuge method [56] (Figure 8.3). Forceswere large on smooth and on coarse rough surfaces, but were minimal on theintermediate microrough substrate (0.05- m particle size, Figure 8.3B). Second, tarsiof ants freshly collected after locomotion on waxy Macaranga stems were clearlycontaminated with wax crystals (Figure 8.4). Similar to the interaction between flytarsi and wax crystal surfaces of the carnivorous plants Nepenthes ventrata(Nepenthaceae) and Brocchinia reducta (Bromeliaceae) [49], the crystal materialappeared to be partly dissolved and amorphous on the surface of the arolia but lessso on the claws and other parts of the tarsus (Figure 8.4).
3209_C008.fm Page 171 Thursday, November 10, 2005 10:46 AM

172 Ecology and Biomechanics
8.3.3 MECHANISMS OF WAX RUNNING
The complex of nine closely related Crematogaster (Decacrema) morphospeciesrepresents an excellent model system to study the function of wax barriers andthe biomechanics of wax running. Even though Crematogaster (Decacrema)ants are very similar in morphology [19,25], wax runners and non–wax runners
FIGURE 8.3 (A) Centrifuge method (Federle et al., J. Exp. Biol., 203, 505, 2000) used tomeasure in-plane attachment forces of ants on artificial substrates and waxy Macaranga stems.(B) Attachment forces of Crematogaster (Decacrema) mspp.2 and 4 ants on substrates ofdifferent surface roughness. For each ant, the mean of three consecutive force measurementswas used (n = 16 to 41 ants per species and substrate). The labels “0.05 m” and “12 m”on the x axis denote rough aluminium oxide substrates with the given particle sizes.
FIGURE 8.4 Tarsus of Crematogaster (Decacrema) msp.4 after climbing on a vertical waxyM. hypoleuca stem for 5–8 min. The ants were anaesthetized by cooling at 4˚C and preparedfor scanning electron microscopy (SEM) by freezing and drying overnight in a lyophilizer.(A) Lateral view of the tarsus. (B) Frontal view of the pretarsus. Note the threadlike waxcrystal material typical of Macaranga (Figure 8.2B) on the claws and on the hairs at theventral side of the tarsus. In contrast, the crystal particles are apparently dissolved by adhesivesecretion on the arolium surface. Scale bars: 50 m.
(a)
Strobe
Photoelectric barrier
Video camera
rpm
(b) Surface
0
100
200
300
400
Forc
e/w
eigh
t
Glass M. hypoleuca 0.05 µm 12 µm
BA
3209_C008.fm Page 172 Thursday, November 10, 2005 10:46 AM

Wax Barriers and Wax Running in Macaranga–Ant Mutualisms 173
differ strikingly in their running performance. Crematogaster (Decacrema) non–waxrunners placed on vertical waxy Macaranga stems are at best capable of walkingvery slowly and often fall down [17]. Our initial study revealed a weak tendencyfor smaller ant species to be better wax runners, which may be explained by scalinglaws (greater surface area to weight ratio in smaller ants). However, this effect wasnot significant, and many ant species even smaller than the specialized ant partnershad problems climbing the waxy stems [17]. In a subsequent study [20], we dis-proved the hypothesis that wax running is simply based on larger adhesive padsrelative to ant body size. Comparison of adhesive forces on a smooth Plexiglasssubstrate between wax runners and non–wax runners indicated even an inverse effectwith wax runners clinging less well to the smooth substrate [20]. Wax running,however, is not necessarily a consequence of special adaptations of the tarsal adhe-sive system. The capacity to climb slippery stems could also involve behavioral andlocomotory adaptations and other morphological traits. In the following section, wepresent a preliminary analysis of wax running in Crematogaster (Decacrema) antsby addressing three questions: (1) Is wax running capacity based on greater attach-ment or superior locomotion? (2) Are there any relevant morphological differencesbetween Crematogaster (Decacrema) wax runners and non–wax runners? (3) Howdo the kinematics of climbing differ between wax runners and non–wax runners?
8.3.3.1 Attachment Force vs. Climbing Performance: Is Wax Running Capacity Based on Greater Attachment or Superior Locomotion?
To investigate whether the wax running capacity of Crematogaster (Decacrema)ants is based on special adaptations of the attachment system to waxy substrates,we compared the ants’ climbing performance with actual attachment forces gener-ated on waxy Macaranga stems. Climbing performance was quantified by placingworkers of Crematogaster (Decacrema) msp.2 (wax runners) and Crematogaster(Decacrema) msp.4 (non–wax runners) on vertical waxy M. hypoleuca stems (n =34 workers from 2 colonies of each morphospecies; 2 stems of 11 mm diameter)and determining the proportion of ants capable of walking to one of two finishinglines 5 cm above and below the release point within 10 min [17]. Attachment wasmeasured in the same ants as the centrifugal shear force required to detach themfrom waxy M. hypoleuca stems (13 stems with diameters between 8 and 13 mm).Surprisingly, we found that attachment forces per body weight were not significantlydifferent between species, with a trend toward greater forces in the non–wax runners(two-tailed U-test, U = 483.5, P = 0.092) (Figure 8.5B). This is in striking contrastto the clearly superior climbing performance of wax runners (Fisher’s exact test, P< 0.001) (Figure 8.5A). To test whether this unexpected result was caused by artifactsdue to ill-defined surfaces of Macaranga trees kept in the greenhouse, we repeatedthe same set of experiments using a standardized, artificial substrate and foundexactly the same effect (unpublished results). Our finding thus indicates that thedifference in wax running capacity between Crematogaster (Decacrema) mor-phospecies is not the result of superior adhesion but rather due to behavioral and/orlocomotory adaptations. These locomotory adaptations could be based both on
3209_C008.fm Page 173 Thursday, November 10, 2005 10:46 AM

174 Ecology and Biomechanics
morphological characters and on kinematic variables, which will be considered inthe following sections. It should be noted that our result does not indicate thatadhesion is irrelevant for wax running. The much poorer wax running performanceof many generalist ants [17] may also be caused by weaker attachment forces to thewax crystal substrates.
8.3.3.2 Comparative Morphometry of Wax Runners and Non–Wax Runners
Workers of the different Crematogaster (Decacrema) morphospecies associated withMacaranga are closely related and morphologically similar. We did not find anyqualitative difference in leg and tarsus structure between wax running and non–waxrunning morphospecies. Quantitative morphometry, however, revealed strong inter-specific variation of the total leg length, with wax runners (Crematogaster [Deca-crema] mspp. 2 and 6) having longer legs than the non–wax runners (Crematogaster[Decacrema] mspp. 3 and 4) (Figure 8.6). To test this effect for significance, weperformed analyses of covariance (ANCOVA) on log-transformed data with bodymass as the covariate. Because the ANCOVA assumption of parallel regression lineswas violated for the middle and hind legs (P < 0.01), we performed analogousanalyses with log (pronotum width) instead of log (body mass) as the covariate(regression slopes not significantly different from each other for the front and middlelegs, F3,181 < 2.6, P > 0.05, but for the hind legs: P = 0.025). All the three leg pairsyielded significant effects (F3,184 115.1; P < 0.001). Interspecific post hoc
FIGURE 8.5 Climbing performance vs. attachment force of Crematogaster (Decacrema) waxrunners (msp.2) and non–wax runners (msp.4) on waxy stems of M. hypoleuca. (A) Climbingcapacity; ants that walked a stretch of 5 cm upward or downward along the stem were classifiedas “successful.” (B) Maximum in-plane attachment force measured on the same substrate,using the centrifuge method (Figure 8.3A).
0
20
40
60
80
100
msp.2 msp.4
Crematogaster (Decacrema)
% S
uces
sful
ant
s
msp.2 msp.4Crematogaster (Decacrema)
0
20
40
60
80
100
120
140
Forc
e/w
eigh
t
(A) (B)
3209_C008.fm Page 174 Thursday, November 10, 2005 10:46 AM

Wax Barriers and Wax Running in Macaranga–Ant Mutualisms 175
comparisons revealed highly significant differences in leg length between Cremato-gaster (Decacrema) mspp.2, 6 and mspp.3, 4 but weaker or no effects within eachgroup (Table 8.1). Thus, the investigated ant morphospecies can be grouped intowax runners and non–wax runners based solely on their leg lengths.
FIGURE 8.6 Double logarithmic plot of middle leg length vs. dry body mass in two waxrunning species (Crematogaster [Decacrema] msp.2 and 6) and two species of non–waxrunners (Crematogaster [Decacrema] msp.3 and 4). Data represent a total of 205 ant workersfrom 29 colonies (n > 32 ants and n > 4 colonies in each morphospecies); lines show modelII (reduced major axis) regressions.
TABLE 8.1Results of ANCOVA Comparing Leg Length between Four Crematogaster(Decacrema) morphospecies with Pronotum Width as the Covariate
Crematogaster(Decacrema)
Front Legs Middle Legs Hind Legs
[ m] [ m] [ m]
msp.2 (wax runner) 1700 a 1997 a 2351 amsp.3 (non–wax runner) 1465 b 1690 b 1975 bmsp.4 (non–wax runner) 1445 b 1628 c (b) 1915 c (b)msp.6 (wax runner) 1700 c 2181 a 2599 d (a)
Note: Numbers indicate the back-transformed adjusted means of leg length, and the letters indicate theScheffé grouping. Different letters denote significantly different leg lengths at the 5% level, and lettersin parentheses denote significantly different leg lengths at the 0.1% level.
Crematogaster(Decacrema)
msp.3msp.4msp.6
msp.2
Log (body mass)
Log
(mid
dle
leg
leng
th)
3.4
3.1
3.2
3.3
1.8 2.0 2.2 2.4 2.6
Non-wax runners
Wax runners
3209_C008.fm Page 175 Thursday, November 10, 2005 10:46 AM

176 Ecology and Biomechanics
8.3.3.3 Mechanical Benefit of Long Legs for Climbing Ants
Longer legs may convey two mechanical benefits to Crematogaster (Decacrema)ants climbing on waxy Macaranga stems, which are illustrated by a simple two-legmodel in Figure 8.7:
1. Longer-legged ants could achieve a greater normal force F by graspingaround the stem (Figure 8.7A).
2. The perpendicular detachment force acting on the front legs is smaller inlonger-legged ants because of the longer lever arm (Figure 8.7B).
Insects climbing up a cylindrical stem can hold on more firmly by drawing eachfoot toward the other, which increases the tarsal ground reaction force F (Figure8.7A). However, leg contraction is limited by the concomitantly growing shear forcesF||, which will cause the legs to slide on larger diameter stems. The proportion oftangential to normal force gained by leg adduction depends on the distance d betweenthe tarsi and the stem diameter D:
(8.1)
To prevent slipping, this proportion should not exceed the static friction coeffi-cient (i.e., the proportion of friction force to normal load) of the tarsus on thewaxy stem surface:
FIGURE 8.7 Two-leg model of ant climbing up a vertical stem. (A) Stem cross section (i.e.,view from above). (B) Side view. D: stem diameter; d: lateral distance between tarsi of a legpair; F : force perpendicular to stem surface; F||: force parallel to stem surface; FG : gravityforce; s: (vertical) distance between front and hind legs; CG: ant’s center of gravity; h: heightof center of gravity above stem.
(A) (B)
sh
FG
CG
F
F
.
D/2
F
d
F
F
D
d=
2
1
3209_C008.fm Page 176 Thursday, November 10, 2005 10:46 AM

Wax Barriers and Wax Running in Macaranga–Ant Mutualisms 177
and thus, (8.2)
Assuming that ants rely wholly on friction in clinging to a stem with typicalfriction coefficient, < 1, Equation 8.2 suggests that in the absence of adhesiveforces, climbing ants can only enhance attachment by grasping around the stem ifd > 0.71 × D, i.e., if the legs subtend at least one quarter of the stem circumference.This situation, however, would be different if the ants were able to dig the tips oftheir claws into the stem surface. When claws interlock with the substrate, theygenerate a new contact surface that is more nearly perpendicular to the adductionforce. This would have the effect that the ants can cling to the stems even if d <0.71 × D [57].
The second possible advantage of longer legs is related to the increased distancebetween front and hind leg footfall positions. The perpendicular force acting on thefront legs tending to topple the ant from the stem during upward climbing dependson the height h of the center of gravity above the stem surface and the distance sbetween front and hind footfall positions (Figure 8.7B):
(8.3)
Assuming a constant height of the center of gravity above the stem, longer legswould reduce the detachment force acting on the upper legs of climbing ants. Unlikethe increase of normal force achieved by grasping around the stem, this effect wouldnot only be beneficial on a cylindrical twig but also on a plane vertical substrate.
8.3.3.4 Kinematics of Climbing in Crematogaster (Decacrema)Wax Runners and Non–Wax Runners
To search for possible locomotory adaptations involved in wax running and toevaluate the predictions of the above climbing model (Figure 8.7), we recorded theants’ climbing behavior on waxy M. hypoleuca (n = 6 stems; mean diameter of 9.2mm) and on 10-mm diameter glass rods by comparing Crematogaster (Decacrema)msp.2 wax runners (n = 21 and 24 on glass and wax, respectively) and Crematogaster(Decacrema) msp.4 non–wax runners (n = 19 and 24 on glass and wax, respectively).Climbing ants were recorded using two synchronized digital high-speed video cam-eras (Redlake PCI 1000 B/W). The cameras were oriented at 90˚ to each other andperpendicular to the stem surface so that dorsal and lateral views could be recorded.We only analyzed continuous runs in which the ants climbed upward in the middleline of the stem in dorsal view (cutoff for lateral excursions: 15% of the stemdiameter). To evaluate gait parameters and body posture, body coordinates andfootfall positions were digitized and further analyzed in MATLAB (The MathWorks,Inc.).
D
d<
2
1 dD
>+2 1
Fh F
sG=
3209_C008.fm Page 177 Thursday, November 10, 2005 10:46 AM

178 Ecology and Biomechanics
Both for wax runners and non–wax runners, the gait strongly differed betweenruns on glass rods and on waxy Macaranga stems. Ants climbed faster and assumeda typical tripod gait when climbing on glass (Crematogaster (Decacrema) msp.2:duty factor = 0.74, mean velocity = 11.5 mm/sec), whereas slower and “safer” gaitswith more legs on the ground at any one time were used on the waxy stems(Crematogaster (Decacrema) msp.2: duty factor = 0.88, mean velocity = 2.2mm/sec). Wax running typically involved a much greater number of steps in thefront legs (Crematogaster (Decacrema) msp.2: stepping frequency = 6.6 sec-1) thanin the middle and hind legs (stepping frequency of middle legs = 1.7 sec-1, of hindlegs = 2.1 sec-1). The ants repeatedly put down their front legs and pulled themtoward the body, apparently to achieve sufficient traction on the waxy substrate.
Crematogaster (Decacrema) msp.2 wax runners not only climbed faster andalmost never fell off the M. hypoleuca stems, but they also assumed a different bodyposture than Crematogaster (Decacrema) msp.4 non–wax runners (Figure 8.8). Wemeasured relative leg distances between footfall positions by dividing the absolutefootfall distances by the total length of the corresponding legs. Relative lateraldistances (tangential to the stem) between front, middle, and hind feet were signif-icantly greater in the Crematogaster (Decacrema) msp.2 wax runners (Figure 8.8;two-tailed U-tests; front legs, U = 145.0, P = 0.003; middle legs, U = 116.0,P < 0.001; hind legs, U = 104.0, P < 0.001). Thus, Crematogaster (Decacrema)msp.2 wax runners not only have longer legs but also spread them out more thanthe non–wax runners. This finding corroborates the functional significance of longlegs for wax running. Despite the conspicuous sprawled posture of the middle andhind legs during wax running (Figure 8.8), the legs subtended in all cases consid-erably less than 0.71 times the stem diameter (median ratio of front, middle, andhind leg distance to stem diameter = 0.18, 0.42, and 0.42, respectively, with maxima= 0.24, 0.53, and 0.53, respectively). According to the prediction derived fromEquation 8.2, the wider spreading of the legs in wax runners should thus not conveyany mechanical advantage if leg contacts were entirely based on friction. It wouldalso be conceivable that the wax runners’ wider stance improves attachment bylowering the height h of the ant’s center of gravity according to Equation 8.3. Becauseof the extension of leg joints, however, d can vary independently of h. Preliminarydata have not shown any evidence that climbing Crematogaster (Decacrema) waxrunners hold their center of gravity closer to the stem than non–wax runners (unpub-lished results). However, leg spreading would have a positive mechanical effect ifsome interlocking of the claw tips with the substrate is involved (see Section 8.3.3.3).
In contrast to the lateral footfall distances, the relative distance between frontand hind tarsi (measured in the vertical direction) did not differ significantly betweenwax runners and non–wax runners (Figure 8.8). As a better estimate of the effectivelever arm, we used the distance between front and hind tarsi divided by pronotumwidth as an arbitrarily chosen body length variable. Here, the distance between frontand hind tarsi in the wax runner Crematogaster (Decacrema) msp.2 significantlyexceeded that of Crematogaster (Decacrema) msp.4 (two-tailed U-test, U = 158.0,P = 0.012). Thus, even though the ants do not appear to extend their legs muchfurther in the fore–aft direction, the greater leg length of the wax runners by itself
3209_C008.fm Page 178 Thursday, November 10, 2005 10:46 AM

Wax Barriers and Wax Running in Macaranga–Ant Mutualisms 179
leads to a longer lever arm that may be mechanically advantageous as shown inFigure 8.7B.
Longer legs appear to be important not only for Macaranga-inhabiting ants, butalso for other insects having to cope with waxy plant surfaces. The aphid Brevicorynebrassicae was found to walk more effectively on waxy Brassica leaves than Lipaphiserysimi [58]; this difference was explained by the greater leg length (relative to bodylength) of B. brassicae [59].
8.4 CONCLUSIONS
The mutualism between Macaranga trees and their specialized Crematogaster (Deca-crema) ant partners illustrates how strongly insect–plant interactions can be determinedand shaped by biomechanical factors. The slippery wax barriers on the stems ofMacaranga myrmecophytes not only keep away generalist ants and thus protect theresident wax running ant partners against predation and competition, but they also actas an ecological isolation mechanism between different Crematogaster (Decacrema)ant associates. Numerous differences between associations of Crematogaster(Decacrema) wax runners and non–wax runners demonstrate that this mechanicalfactor has important ecological implications for Macaranga–ant mutualisms.
FIGURE 8.8 Climbing kinematics of Crematogaster (Decacrema) wax runners (msp.2) andnon–wax runners (msp.4) on waxy M. hypoleuca stems. The relative leg distance correspondsto the distance between footfall positions divided by the actual length of the (two) legs. Lateraldistances between front, middle, and hind legs were measured perpendicular to the stem, withthe distance between front and hind legs parallel to the stem axis. Each raw data pointrepresents the mean distance of one running sequence.
Crematogaster(Decacrema)
msp.2
Hind
Middle
Front
Front to
hind
Front legs Middle legs Hind legs Front to hind legs
0.4
0
0.2
0.6
0.8
1.0
Rela
tive
leg
dist
ance
Crematogaster(Decacrema)
msp.4
3209_C008.fm Page 179 Thursday, November 10, 2005 10:46 AM

180 Ecology and Biomechanics
Our preliminary study into the biomechanics of wax running behavior surpris-ingly suggests that the difference in wax running capacity between Crematogaster(Decacrema) species is not caused by superior adhesion but by mechanical andlocomotory adaptations. We found that Crematogaster (Decacrema) wax runnersnot only have longer legs but also spread them out more during climbing. Thecombination of long legs and a more sprawled posture is mechanically advantageousfor climbing ants and may partly explain the exceptional wax running capacity ofMacaranga ant partners.
ACKNOWLEDGMENTS
We wish to thank Patrick Drechsler for his assistance in the kinematic analysis andthe development of video analysis routines in MATLAB. Sebastian Busch helped inthe ant morphometry and motion analysis. Heike Feldhaar and Brigitte Fiala pro-vided unpublished information on the phylogeny and distribution of Crematogaster(Decacrema) morphospecies. We are grateful to Werner Baumgartner, Bert Höll-dobler, Reinhard Jetter, Ulrich Maschwitz, Frank Rheindt, and Markus Riederer forsupport and fruitful discussions. Our study was financially supported by researchgrants of the Deutsche Forschungsgemeinschaft (SFB 567/A4 (C6) and Emmy-Noether fellowship FE 547/1-3 to WF).
REFERENCES
1. Rosenthal, G.A. and Berenbaum, M.R., Herbivores: Their Interactions with Second-ary Plant Metabolites, Vol. I: The Chemical Participants, Academic Press, San Diego,1991.
2. Bernays, E.A. and Chapman, R.F., Host-Plant Selection by Phytophagous Insects,Chapman & Hall, New York, 1994.
3. Schoonhoven, L.M., Jermy, T., and Van Loon, J.J.A., Insect-Plant Biology: FromPhysiology to Evolution, Academic Press, London, 1998.
4. Kerner von Marilaun, A., Flowers and Their Unbidden Guests, Kegan Paul Co.,London, 1878.
5. Proctor, M., Yeo, P., and Lack, A., The Natural History of Pollination, Harper Collins,London, 1996.
6. Sanson, G., et al., Measurement of leaf biomechanical properties in studies of her-bivory: Opportunities, problems and procedures, Austral. Ecology, 26, 535, 2001.
7. Nichols-Orians, C.M. and Schultz, J.C., Interactions among leaf toughness, chemistry,and harvesting by attine ants, Ecol. Entomol., 15, 311, 1990.
8. Wright, W. and Vincent, J.F.V., Herbivory and the mechanics of fracture in plants,Biol. Rev., 71, 401, 1996.
9. Gorb, S.N. and Beutel, R.G., Evolution of locomotory attachment pads of hexapods,Naturwiss., 88, 530, 2001.
10. Eisner, T. and Shepherd, J., Caterpillar feeding on a sundew plant, Science, 150, 1608,1965.
11. Kennedy, C.E., Attachment may be a basis for specialization in oak aphids, Ecol.Entomol., 11, 291, 1986.
3209_C008.fm Page 180 Thursday, November 10, 2005 10:46 AM

Wax Barriers and Wax Running in Macaranga–Ant Mutualisms 181
12. Ellis, A.G. and Midgley, J.J., A new plant-animal mutualism involving a plant withsticky leaves and a resident hemipteran insect, Oecologia, 106, 478, 1996.
13. Southwood, T.R.E., Plant surfaces and insects — An overview, in Insects and thePlant Surface, Juniper, B.E. and Southwood, T.R.E., Eds., Edward Arnold, London,1986, p. 1.
14. Clarke, C.M. and Kitching, R.L., Swimming ants and pitcher plants: A unique ant-plant interaction from Borneo, J. Trop. Ecol., 11, 589, 1995.
15. Futuyma, D.J., Some current approaches to the evolution of plant–herbivore interac-tions, Plant Species Biol., 15, 1, 2000.
16. Thompson, J.N., The Coevolutionary Process, Chicago University Press, Chicago,1994.
17. Federle, W., et al., Slippery ant-plants and skillful climbers: Selection and protectionof specific ant partners by epicuticular wax blooms in Macaranga (Euphorbiaceae),Oecologia, 112, 217, 1997.
18. Whitmore, T.C., Macaranga Thou., in The Euphorbiaceae of Borneo, Airy-Shaw,H.K., Ed., HMSO (Her Majesty’s Stationery Office), London, 1975, p. 140.
19. Fiala, B., et al., Diversity, evolutionary specialisation and geographic distribution ofa mutualistic ant-plant complex: Macaranga and Crematogaster in South East Asia,Biol. J. Linn. Soc., 66, 305, 1999.
20. Federle, W., Rohrseitz, K., and Hölldobler, B., Attachment forces of ants measuredwith a centrifuge: better “wax-runners” have a poorer attachment to a smooth surface,J. Exp. Biol., 203, 505, 2000.
21. Quek, S.-P., et al., Codiversification in an ant-plant mutualism: stem texture and theevolution of host use in Crematogaster (Formicidae: Myrmicinae) inhabitants ofMacaranga (Euphorbiaceae), Evolution, 58, 554, 2004.
22. Shaw, K.L., Conflict between nuclear and mitochondrial DNA phylogenies of a recentspecies radiation: What mtDNA reveals and conceals about modes of speciation inHawaiian crickets, Proc. Natl. Acad. Sci., 99, 16122, 2002.
23. Sota, T. and Vogler, A.P., Incongruence of mitochondrial and nuclear gene trees inthe carabid beetles Ohomopterus, Syst. Biol., 50, 39, 2001.
24. Feldhaar, H., Fiala, B., and Gadau, J., Is ecological speciation the driving force inthe radiation of the Macaranga-associated Crematogaster (Decacrema) plant-ants?Abstract 16.7, IX Congress of the European Society for Evolutionary Biology (ESEB),Leeds, UK, 2003.
25. Feldhaar, H., et al., Molecular phylogeny of Crematogaster subgenus Decacremaants (Hymenoptera: Formicidae) and the colonization of Macaranga (Euphorbiaceae)trees, Mol. Phyl. Evol., 27, 441, 2003.
26. Davies, S.J., Systematics of Macaranga Sects. Pachystemon and Pruinosae (Euphor-biaceae), Harvard Pap. Bot., 6, 371, 2001.
27. Federle, W. and Rheindt, F., Macaranga ant-plants hide food from intruders: corre-lation of food presentation and presence of wax barriers analysed using phylogenet-ically independent contrasts, Biol. J. Linn. Soc., 84, 177, 2005.
28. Fiala, B. et al., Studies of a South East Asian ant-plant association: protection ofMacaranga trees by Crematogaster borneensis, Oecologia, 79, 463, 1989.
29. Federle, W., Maschwitz, U., and Hölldobler, B., Pruning of host plant neighbors asdefence against enemy ant invasions: Crematogaster ant partners of Macarangaprotected by “wax barriers” prune less than their congeners, Oecologia, 132, 264,2002.
30. Heil, M. et al., On benefits of indirect defence: Short- and long-term studies ofantiherbivore protection via mutualistic ants, Oecologia, 126, 395, 2001.
3209_C008.fm Page 181 Thursday, November 10, 2005 10:46 AM

182 Ecology and Biomechanics
31. Janzen, D.H., Coevolution of mutualism between ants and acacias in Central America,Evolution, 20, 249, 1966.
32. Heil, M., et al., Reduced chemical defence in ant-plants? A critical re-evaluation ofa widely accepted hypothesis, Oikos, 99, 457, 2002.
33. Eck, G. et al., Trade-off between chemical and biotic antiherbivore defense in theSouth East Asian plant genus Macaranga, J. Chem. Ecol., 27, 1979, 2001.
34. Davidson, D.W., Longino, J.T., and Snelling, R.R., Pruning of host plant neighborsby ants: An experimental approach, Ecology, 69, 801, 1988.
35. Itioka, T. et al., Difference in intensity of ant defense among three species of Macar-anga myrmecophytes in a Southeast Asian dipterocarp forest, Biotrop., 32, 318, 2000.
36. Feldhaar, H. et al., Patterns of the Crematogaster–Macaranga association: The antpartner makes the difference, Insectes Soc., 50, 9, 2003.
37. Felsenstein, J., Phylogenies and the comparative method, Am. Nat., 125, 1, 1985.38. Federle, W. et al., Incident daylight as orientation cue for hole-boring ants: Prostomata
in Macaranga ant-plants, Insectes Soc., 48, 165, 2001.39. Brouat, C. et al., Plant lock and ant key: Pairwise coevolution of an exclusion filter
in an ant-plant mutualism, Proc. R. Soc. Lond. B, 268, 2131, 2001.40. Davidson, D.W., Snelling, R.R., and Longino, J.T., Competition among ants for
myrmecophytes and the significance of plant trichomes, Biotropica, 21, 64, 1989.41. Gorb, S., Attachment Devices of Insect Cuticle, Kluwer Academic Publishers, Dor-
drecht, Boston, 2001.42. Dai, Z., Gorb, S.N., and Schwarz, U., Roughness-dependent friction force of the
tarsal claw system in the beetle Pachnoda marginata (Coleoptera, Scarabaeidae), J.Exp. Biol., 205, 2479, 2002.
43. Federle, W. et al., An integrative study of insect adhesion: Mechanics and wetadhesion of pretarsal pads in ants, Integ. Comp. Biol., 42, 1100, 2002.
44. Vötsch, W. et al., Chemical composition of the attachment pad secretion of the locustLocusta migratoria, Insect Biochem. Mol. Biol., 32, 1605, 2002.
45. Markstädter, C. et al., Chemical composition of the slippery epicuticular wax bloomson Macaranga (Euphorbiaceae) ant-plants, Chemoecology, 10, 33, 2000.
46. Kerner von Marilaun, A., Pflanzenleben, Band 2, Bibliographisches Institut, Leipzig,1891.
47. Knoll, F., Über die Ursache des Ausgleitens der Insektenbeine an wachsbedecktenPflanzenteilen, Jahrb. wiss. Bot., 54, 448, 1914.
48. Stork, N.E., Role of wax blooms in preventing attachment to brassicas by the mustardbeetle, Phaedon cochleariae, Entom. Exp. Appl., 28, 100, 1980.
49. Gaume, L. et al., How do plant waxes cause flies to slide? Experimental tests of wax-based trapping mechanisms in three pitfall carnivorous plants, Arthropod Struct. Dev.,33, 103, 2004.
50. Gorb, E.V. and Gorb, S.N., Attachment ability of the beetle Chrysolina fastuosa onvarious plant surfaces, Entom. Exp. Appl., 105, 13, 2002.
51. Eigenbrode, S.D. and Jetter, R., Attachment to plant surface waxes by an insectpredator, Integ. Comp. Biol., 42, 1091, 2002.
52. Eigenbrode, S.D. and Kabalo, N.N., Effects of Brassica oleracea waxblooms onpredation and attachment by Hippodamia convergens, Entomol Exp. Applic., 91(April), 125, 1999.
53. Juniper, B.E. and Burras, J.K., How pitcher plants trap insects, New Scientist, 13, 75,1962.
3209_C008.fm Page 182 Thursday, November 10, 2005 10:46 AM

Wax Barriers and Wax Running in Macaranga–Ant Mutualisms 183
54. Eigenbrode, S.D. et al., Mobility of three generalist predators is greater on cabbagewith glossy leaf wax than on cabbage with a wax bloom, Entom. Exp. Appl., 81, 335,1996.
55. Stork, N.E., The form of plant waxes: A means of preventing insect attachment? inInsects and the Plant Surface, Juniper, B.E. and Southwood, T.R.E., Eds., EdwardArnold, London, 1986, p. 346.
56. Federle, W., Baumgartner, W., and Hölldobler, B., Biomechanics of ant adhesive pads:Frictional forces are rate- and temperature-dependent, J. Exp. Biol., 207, 67, 2004.
57. Cartmill, M., Climbing, in: Functional Vertebrate Morphology, Hildebrand, M. et al.,Eds., The Belknap Press, Cambridge, 1985, p. 73.
58. Åhman, I., Plant-surface characteristics and movements of two Brassica-feedingaphids, Lipaphis erysimi and Brevicoryne brassicae, Symp. Biol. Hung., 39, 119,1990.
59. Eigenbrode, S.D., Plant surface waxes and insect behaviour, in Plant Cuticles — AnIntegrated Functional Approach, Kerstiens, G., Ed., Bios Scientific Publishers,Oxford, 1996, p. 201.
3209_C008.fm Page 183 Thursday, November 10, 2005 10:46 AM

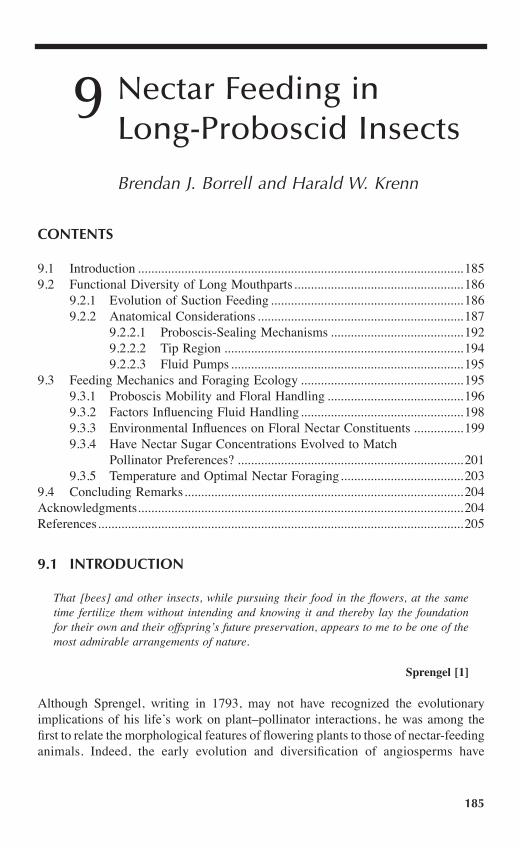
185
9 Nectar Feeding in Long-Proboscid Insects
Brendan J. Borrell and Harald W. Krenn
CONTENTS
9.1 Introduction ..................................................................................................1859.2 Functional Diversity of Long Mouthparts...................................................186
9.2.1 Evolution of Suction Feeding ..........................................................1869.2.2 Anatomical Considerations ..............................................................187
9.2.2.1 Proboscis-Sealing Mechanisms ........................................1929.2.2.2 Tip Region ........................................................................1949.2.2.3 Fluid Pumps ......................................................................195
9.3 Feeding Mechanics and Foraging Ecology .................................................1959.3.1 Proboscis Mobility and Floral Handling .........................................1969.3.2 Factors Influencing Fluid Handling.................................................1989.3.3 Environmental Influences on Floral Nectar Constituents ...............1999.3.4 Have Nectar Sugar Concentrations Evolved to Match
Pollinator Preferences? ....................................................................2019.3.5 Temperature and Optimal Nectar Foraging.....................................203
9.4 Concluding Remarks....................................................................................204Acknowledgments..................................................................................................204References..............................................................................................................205
9.1 INTRODUCTION
That [bees] and other insects, while pursuing their food in the flowers, at the sametime fertilize them without intending and knowing it and thereby lay the foundationfor their own and their offspring’s future preservation, appears to me to be one of themost admirable arrangements of nature.
Sprengel [1]
Although Sprengel, writing in 1793, may not have recognized the evolutionaryimplications of his life’s work on plant–pollinator interactions, he was among thefirst to relate the morphological features of flowering plants to those of nectar-feedinganimals. Indeed, the early evolution and diversification of angiosperms have
3209_C009.fm Page 185 Thursday, November 10, 2005 10:47 AM

186 Ecology and Biomechanics
frequently been attributed to an “arrangement” between plants and their pollinators,but how “admirable” such relationships often are remains questionable [2]. Darwinpostulated that extended corollas of certain flowers represent the outcome of anevolutionary arms race between plants and their pollinators [3], with plants evolvingto match, in depth, mouthpart lengths of pollinating taxa [4–7]. Consequently, therise of flowering plants in the late Cretaceous also corresponded with a period ofrapid diversification in insect feeding strategies, including the evolution of thefamously elongate mouthparts associated with nectar feeding in certain Lepidoptera,Diptera, and Hymenoptera [8,9].
Although many nectar-feeding insects consume floral nectars with short mouth-parts, the benefits nectar feeders derive from their long proboscides are clear: exclu-sive access to deep flowers, providing copious amounts of nectar [10–13]. In fact,long-proboscid insects are able to capitalize on a wider diversity of resources thantheir short-proboscid counterparts as they frequent any flowers from which they canphysically extract nectar whether deep or shallow [11,14–16]. Such advantages leadto the fundamental questions: Do insect nectarivores incur a cost to having suchlong mouthparts? If so, how can we measure these costs? What are the functionalrequirements of elongate mouthparts and how might they influence pollinator behav-ior? Clearly, a long proboscis can be unwieldy [17,18]; the control, extension, andretraction of the proboscis requires specialized machinery [19–23], and imbibementof a viscous fluid through such a slender duct entails a whole other set of biome-chanical problems [24–26]. The goal of the present chapter is to examine thefunctional morphology and biomechanics of nectar feeding with elongate mouthpartsand to explore how physical constraints may have shaped feeding ecology andplant–pollinator relationships over evolutionary time.
9.2 FUNCTIONAL DIVERSITY OF LONG MOUTHPARTS
9.2.1 EVOLUTION OF SUCTION FEEDING
The first fluid-feeding insects employed a lapping or sponging mechanism to imbibetheir liquid meals. This modality, which uses capillary forces for fluid uptake, iswidespread among insects, including those that specifically visit plants to consumefloral nectars [27]. The elongation of mouthparts is derived and enables insects todevelop a pressure gradient along the food canal, allowing them to consume nectarfrom the concealed nectaries found in long, tubular corollas (Figure 9.1). This typeof proboscis, termed a “concealed nectar extraction apparatus” by Jervis [28], oftenmatches or exceeds the body length in holometabolous insects (Endopterygota) andother nectar feeders (Table 9.1 and Figure 9.1). At 280 mm, a tropical sphingid holdsthe record for mouthpart length in absolute terms [29]. Relative to body length,however, record holders are South African nemestrinid flies (Figure 9.1C) whoseproboscides may be over four times the length of their bodies [15]. A number ofdisparate evolutionary pathways have preceded the development of these long,suctorial mouthparts in various taxa (Table 9.2).
3209_C009.fm Page 186 Thursday, November 10, 2005 10:47 AM

Nectar Feeding in Long-Proboscid Insects 187
Many taxa within Hymenoptera have evolved elongate mouthparts in the contextof nectar feeding [28,30]. Many of these feed on nectar using a lapping and suckingmode, but the Euglossini (orchid bees) and long-tongued Masarinae (pollen wasps)have shifted to pure suction feeding [31,32]. In other cases, a suctorial mode offeeding is suggested from the length and general composition of the mouthparts(e.g., some species of Tenthredinidae, Eumenidae, and Sphecidae [27,28,30]).
Suctorial nectar feeding via an elongate proboscis has arisen multiple times inDiptera [33]. Suction feeding in hoverflies (Syrphidae) [34] and beeflies (Bombyli-idae) [19,35] likely evolved from unspecialized flower-visiting ancestors employinga sponging feeding mode on floral and extrafloral nectar and pollen. Specializednectar feeding in the Culicidae and Tabanidae evolved from hematophagous ances-tors [36]. While both sexes of the tropical culicid genus Toxorhychites shifted entirelyto floral nectar, female horseflies in the genus Corizoneura are equipped with botha short proboscis (10 mm) for piercing and sucking blood, and a long proboscis (50mm) for nectar feeding [37]. In addition, nectar-feeding flies belonging to theEmpitidae (dance flies) are derived from predatory insect feeders [36].
Even though generalized feeding on petals, nectar, and pollen is frequent amongadult beetles, only two taxa of blister beetles (Meloidae) have independently shiftedto specialized nectar feeding via an elongate proboscis [36,38].
Ancestors of butterflies and moths fed on nonfloral plant fluids with a simplyformed, coilable proboscis. The proboscides of all nectar-feeding Lepidoptera exhibitthe same set of derived features, suggesting that nectar feeding evolved only oncein a taxon of glossatan Lepidoptera known as the Eulepidoptera [39,40].
9.2.2 ANATOMICAL CONSIDERATIONS
Mouthpart elements that make up the proboscis vary considerably among insecttaxa. In Hymenoptera, where nectar feeding has evolved independently multipletimes, proboscis morphology is similarly diverse. Most frequently, the hymenopteranproboscis is formed by basally linked maxillary and/or labial components, knownas the labiomaxillary complex. In the “long-tongued” bees (Apidae + Megachilidae),the proboscis is composed of the elongated galeae and labial palps that togetherform the food canal surrounding the long and hairy glossa (Figure 9.2) [41]. In some
FIGURE 9.1 (A) Hawkmoth Xanthopan (Sphingidae) approaching the long-spurred blossomof an Angraecum orchid; proboscis length approximately 220 mm (photo with permission ofL.T. Wasserthal). (B) Orchid bee, Eulaema meriana, departing from a Calathea inflorescence(photo with permission of G. Dimijian). (C) Long-proboscid fly Moegistorhynchus longirostris(Nemestrinidae) at a flower of Ixia (photo with permission of S. Johnson).
A B C
3209_C009.fm Page 187 Thursday, November 10, 2005 10:47 AM

188 Ecology and Biomechanics
TABLE 9.1Principal Composition and Maximal Reported Proboscis Length of the Proboscides of Selected Nectar Feeders
Taxon Proboscis ComponentsLength(mm) Ref.
ColeopteraMeloidae (blister beetles)Nemognathinaea
Galeae or maxillary palps 10 132
HymenopteraApidaeBombini (bumblebees)
Bombus hortorum
Galeae, glossa, labial palps 19 2
Euglossini (orchid bees)Eufriesea ornata
Galeae, glossa, labial palps 41 133
Colletidae (“short-tongued” bees)Niltonia virgili
Labial palps 9 43
VespidaeMasarinae (pollen wasps)
Ceramius metanotalis Glossa 6.2 134
LepidopteraSphingidae (hawkmoths)
Amphimoea walkerib
Galeae 280 29
Riodinidae (metalmark butterflies)Eurybia lycisca
Galeae 45 H.W. Krenn, unpublished
DipteraTabanidae (horseflies)
Corizoneura longirostrisLabrum/epipharynx,hypopharynx, mandible stylets, lacinia, labium; distally labium alonec
50 37
Nemestrinidae (tangle-veined flies)Moegistorynchus longirostris
Labrum/epipharynx,hypopharynx, lacinia, labium; distally labium alone
90 15
Bombyliidae (beeflies)Bombylius major
Labrum/epipharynx,hypopharynx, maxillary structures, labium
12.5 19
Syrphidae (hoverflies)Rhingia campestris
Labrum/epipharynx,hypopharynx, maxillary structures, labium
10.5 135
ChiropteraPhyllostomidae (leaf-nosed bats)
Choeronycteris mexicana Tongue 77 94
(continued)
3209_C009.fm Page 188 Thursday, November 10, 2005 10:47 AM
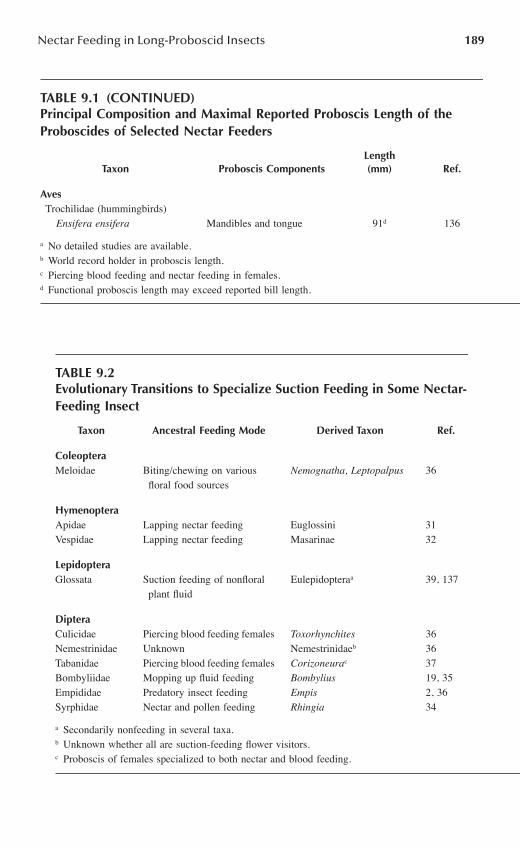
Nectar Feeding in Long-Proboscid Insects 189
TABLE 9.1 (CONTINUED)Principal Composition and Maximal Reported Proboscis Length of the Proboscides of Selected Nectar Feeders
Taxon Proboscis ComponentsLength(mm) Ref.
AvesTrochilidae (hummingbirds)
Ensifera ensifera Mandibles and tongue 91d 136
a No detailed studies are available.b World record holder in proboscis length.c Piercing blood feeding and nectar feeding in females.d Functional proboscis length may exceed reported bill length.
TABLE 9.2Evolutionary Transitions to Specialize Suction Feeding in Some Nectar-Feeding Insect
Taxon Ancestral Feeding Mode Derived Taxon Ref.
ColeopteraMeloidae Biting/chewing on various
floral food sourcesNemognatha, Leptopalpus 36
HymenopteraApidae Lapping nectar feeding Euglossini 31Vespidae Lapping nectar feeding Masarinae 32
LepidopteraGlossata Suction feeding of nonfloral
plant fluidEulepidopteraa 39, 137
DipteraCulicidae Piercing blood feeding females Toxorhynchites 36Nemestrinidae Unknown Nemestrinidaeb 36Tabanidae Piercing blood feeding females Corizoneurac 37Bombyliidae Mopping up fluid feeding Bombylius 19, 35Empididae Predatory insect feeding Empis 2, 36Syrphidae Nectar and pollen feeding Rhingia 34
a Secondarily nonfeeding in several taxa.b Unknown whether all are suction-feeding flower visitors.c Proboscis of females specialized to both nectar and blood feeding.
3209_C009.fm Page 189 Thursday, November 10, 2005 10:47 AM

190 Ecology and Biomechanics
“long-tongued” bees, even basal elements of the mouthparts have a significantinfluence on a bee’s functional tongue length [42]. Remarkably, one group of “short-tongued” bees (Colletidae, Niltonia), which feeds on deep Jacaranda flowers in theNew World tropics, has a proboscis that approaches its body length but is composedof the labial palps alone [43]. Another group of colletid bees has a proboscis formedmostly from the concave maxillary palps [27,44]. In long-tongued pollen wasps(Vespidae: Masarinae), the proboscis and food canal are formed from the glossaalone [36]. There are many other compositions found in various groups ofHymenoptera, including Braconidae, Sphecidae, and even in Tenthredinoidea. Over-views on the occurrence and principal compositions are given in Jervis [28], Jervisand Vilhelmsen [30], and Krenn, Plant, and Szucsich [27].
In contrast to mouthpart diversity exhibited by Hymenoptera, the proboscidesof all “higher” Lepidoptera consist only of the two maxillary galeae enclosing thefood canal (Figure 9.3) [20,39,40].
Most Diptera have sponging and sucking mouthparts that are similar in compo-sition but with highly variable lengths. Their proboscis is complex, consisting of anelongated labrum–epipharynx unit and a hypopharynx, which, sometimes togetherwith rodlike maxillary structures, form the food canal and are enclosed by the gutter-shaped labium. The paired labellae (a homologue to the labial palps of other insects)at the apical end protrude from the proboscis (Figure 9.4) [41]. Adaptations to nectarfeeding include elongation of the whole functional unit, a simplified compositionof the food canal formation, and a slender labellae [27,34].
The long suctorial proboscis of the typical nectar-feeding insect is characterizedby a tightly sealed food canal (Figures 9.5A, 9.5B, and 9.5C), a specialized tip region
FIGURE 9.2 (A) Head and extended proboscis of Melipona sp. (Hymenoptera: Apidae);proboscis consists of galeae (ga), labial palps (lp), and glossa (gl). (B) Close up of theglossal tip.
500 µm
50 µm
B
2A
ga
gl
lp
3209_C009.fm Page 190 Thursday, November 10, 2005 10:47 AM

Nectar Feeding in Long-Proboscid Insects 191
FIGURE 9.3 (A) Spirally coiled proboscis (p) of Vanessa cardui (Lepidoptera: Nymphalidae)in lateral view; tip region (tr). (B) Proboscis tip slits into food canal formed by extendedgaleal-linking structures; sensilla styloconica (s) are characteristic sensory organs of thelepidopteran proboscis.
FIGURE 9.4 (A) Head of Physocephala rufipes (Diptera: Conopidae) with proboscis (p) tipprojecting forward in resting position. (B) Labella (la) of proboscis tip.
50 µm 25 µm
s
B
3A
p
tr
500 µm
50 µm
B
4A
p
la
3209_C009.fm Page 191 Thursday, November 10, 2005 10:47 AM

192 Ecology and Biomechanics
(Figures 9.2B, 9.3B, and 9.4B), and a powerful suction pump (Figure 9.6 and Figure9.7). These features are integral to the functioning of the proboscis and must beconsidered in detail before biomechanical generalizations can be developed.
9.2.2.1 Proboscis-Sealing Mechanisms
One to five individual parts interlock to form a fluid-tight suction tube (Figure 9.5).Various modes of interlocking exist: Individual components can be interlocked bytongue and groove junctions, e.g., bees and flies (Figure 9.5A), or by a series ofoverlapping cuticle plates and hook-shaped structures, e.g., Lepidoptera (Figure9.5B) [23,39,45]. When a single component forms the food canal (e.g., long-tonguedpollen wasps), overlapping cuticle plates shape the food tube (Figure 9.5C) [32]. Inlong-proboscid flies, the distal region of the food tube is formed by the stronglyarched labium, the margins of which interlock to form the tube (Figure 9.5D) [36].In butterflies, epidermal gland cells in the galeal lumen may produce substances thathelp seal the linkage of the galeae (Figure 9.5B) [20].
In long-tongued bees, the food canal is assembled anew each time the proboscisis extended for feeding (Figure 9.5D). During folding and extension, the componentsof the dipteran proboscis remain interlocked, but tongue and groove junctions permitsliding movements of the components against each other [35]. The butterfly probos-cis is assembled once during pupal emergence and remains permanently interlocked.In pupae, the two galeae develop separately and can only interlock by a distinctsequence of galeae movements following eclosion and prior to cuticular sclerotiza-tion. For nymphalid butterflies, interlocking of the galeae is an irreversible andindispensable process that occurs only once during a short time interval followingeclosion [46].
FIGURE 9.5 Cross-sections of the feeding canals (fc) of some nectar feeding insects. (A) InVolucella bombylans (Diptera: Syrphidae), food canal is formed by groove and tongue junctionof labrum–epipharynx unit (lb) and the hypopharynx (h); labium (l) surrounds the otherproboscis components. (B) In Pieris brassicae (Lepidoptera: Pieridae) the galeae (ga) interlockon the dorsal and ventral margins to enclose the central food canal. Dorsal linkage (dl) consistsof overlapping platelets sealed by gland cell (gc) substances; ventral linkage (vl) is formedby cuticular hooks. (C) Overlapping cuticular structures of the glossa (gl) form the food canalin Ceramius hispanicus (Hymenoptera: Vespidae: Masarinae). (D) Food canal is formed fromthe galeae (ga) and labial palps (lp) in Euglossa sp. (Hymenoptera: Apidae: Euglossini), andis disengaged in the resting position.
5A lb
fc
h
l50 µm 10 µm50 µm 50 µm
B
ga
gagc
fc fc
fc
dl
vl lpgl
gl
C D
3209_C009.fm Page 192 Thursday, November 10, 2005 10:47 AM

Nectar Feeding in Long-Proboscid Insects 193
FIGURE 9.6 Sagittal section of the head of Ceramius hispanicus (Hymenoptera: Vespidae:Masarinae); pharyngeal suction pump (psp) enlargeable and contractable by pumping mus-culature; and glossa (gl) in retracted position inside the labium.
FIGURE 9.7 Cross section of the head of Heliconius melpomene (Lepidoptera: Nympha-lidae); large dilator muscles (dm) can expand the cibarial suction pump; and circular mus-culature (cm) can compress the cibarium (ci) for swallowing (images with permission ofS. Eberhard).
psp
6
gl gl
gl
250 µm
dm
7
dm
ci
250 µm
cm
3209_C009.fm Page 193 Thursday, November 10, 2005 10:47 AM

194 Ecology and Biomechanics
9.2.2.2 Tip Region
The presence of a fluid-tight food tube requires a specially adapted tip, which mustinteract with the fluid surface. The tips of lapping and sucking mouthparts of manyHymenoptera are characterized by their hairy glossae (Figure 9.2A). In some long-tongued bees, the glossa is extended just beyond the food canal, and nectar is loadedbetween extendible hairs by capillary forces (see Section 9.3.2). The lapping move-ment of the glossa is mediated by muscles that originate on the basal sclerites ofthe labium and insert at the glossal base. When these muscles relax, the glossaextends because of the elasticity of the glossal rod [42,47,48]. Contraction of thesemuscles draws the proximal end of the glossal rod into an S-shaped position. As aresult, the glossa retracts between the galeae and the labial palps [42]. It is unknownwhether nectar is unloaded either by “squeezing” the glossa [49,50] or via suctionpressure generated in the cibarial chamber [25]. For suction-feeding euglossine bees,the glossa no longer plays an active role in fluid transport [31]. In short-tonguedpollen wasps, the glossa is employed in lapping, whereas in long-tongued taxa, themodified glossa serves as the actual suction tube (Figure 9.5C) [32]. In long-tonguedpollen wasps, arched cuticle structures form an incomplete food canal in the bifur-cated tip region of the glossa. More proximally, these flattened structures overlap toform a tightly closed food tube (Figure 9.5B) [32].
The flexible tip region of the lepidopteran proboscis has been modified to permitfluid uptake into the otherwise tightly closed food tube. Terminal ends of the galeaeare characterized by rows of slits leading into the food canal (Figure 9.3B). There,the galeal-linking structures are arched and elongated, not tightly sealing the foodcanal; instead, they interlock only at their tips with those of the opposite galea.Because of their curved and extended shape, a slit is formed between consecutivestructures. These slits are found on the dorsal side of the proboscis tip in a regionthat makes up 5 to 20% of the total proboscis length [39,51–53]. Because there isno apical opening into the food canal, the intake slits of the tip region must beimmersed into the fluid prior to sucking. The tip region is further characterized byrows of combined contact chemomechanical sensilla [54–56]. Each of these sensillaconsists of a variably shaped stylus and short apical sensory cone (Figure 9.3B).Their shape and arrangement are correlated to some extent with butterfly feedingecology [51,53,57]. When the butterfly feeds from a surface, the fluid adheres tothese structures, forming a droplet that is then ingested [58]. In Lepidoptera withparticularly long proboscides (e.g., Papilio and Sphinx), these sensillae are short andbarely extend over the surface [51], suggesting that they are adapted to work withinthe narrow confines of the tubular flowers these insects visit.
The proboscis tip region of brachyceran Diptera has paired movable and vari-ously shaped labellae [34,59] that contact nectar on their inner surface; that surfaceis equipped with an elaborate system of tiny cuticular channels known as thepseudotracheae (Figure 9.4B). Pseudotracheae distribute saliva over the labellae[60], helping to dissolve nutrients and dilute dried up nectar (see Section 9.3.3).In unspecialized flies, labellae tend to be broad and cushionlike, equipped with acomblike arrangement of pseudotracheae [34,59]. In nectar-feeding hoverflies and
3209_C009.fm Page 194 Thursday, November 10, 2005 10:47 AM

Nectar Feeding in Long-Proboscid Insects 195
beeflies, the labellae are slender and elongate, and the number of pseudotrachealchannels is reduced [19,34]. In other nectar-feeding flies (e.g., Conopidae), they arealso short and slender, not exceeding the diameter of the labium (Figure 9.4) [59].In all, the pseudotracheal system forms an extension of the food canal, and puresuction feeding is likely in all those that feed from tubular flowers where spreadingof the labellae is impaired.
9.2.2.3 Fluid Pumps
Fluid pumps (Figures 9.6 and 9.7) create the pressure gradient required for imbibingnectar through the slender proboscis. In series with the food canal, these pumps arelocated in the head and are formed mainly by the cibarium. In Diptera, however,fluid feeding involves an interplay of successive suction pumps that enlarge subse-quent sections of the food pathway through the mouthparts and the foregut[19,60–62]. Fluid pumps are not restricted to obligatory nectar-feeding insectsbecause all fluid-feeding insects possess similar pump organs to consume liquidnutrients.
The functional anatomy of suction pumps has been studied in detail in butterflies(Figure 9.7) [20,63]. Contractions of dilator muscles enlarge the cibarium, and atthe same time, a ring of muscles in the foregut closes the connection into the pharynx.When the pump lumen is enlarged, nectar is drawn in from the food tube. Subse-quently, the entrance of the pump is sealed by a flaplike valve structure, and circularlyarranged muscles, which form the wall of the cibarial pump, contract, thus forcingfluid into the opened pharynx. Based on video analysis of air bubbles in the foodcanal, the dilation–contraction cycle in a pierid butterfly occurs approximately onceper second [64]. In addition, electrophysiological measurements have shown thatcontraction frequencies range from 4 Hz in the nectar-feeding ant, Camponotus mus[65], to 6 Hz in a hematophagous bug, Rhodnius prolixus [66].
9.3 FEEDING MECHANICS AND FORAGING ECOLOGY
One general conclusion of optimal foraging studies has been that animals seek tomaximize their rate of energy intake [67]. Indeed, floral features that influence therate of energy intake of pollinators have been shown to affect patterns of flowervisitation and specificity of pollinators [17,68–72]. Although the utility of energyintake rate has been called into question by some authors [73–76], apparent violationsof this rule may result from a misunderstanding of an animal’s “temporal scale ofoptimization” [77]. For a nectarivorous animal, the rate of energy intake can bemeasured over the timescale of feeding, over a single flower visit, or over an entireforaging bout. In the following sections, we partition functional aspects of nectarfeeding into several phases of a flower visit: proboscis extension, floral probing,fluid feeding, and proboscis retraction.
3209_C009.fm Page 195 Thursday, November 10, 2005 10:47 AM
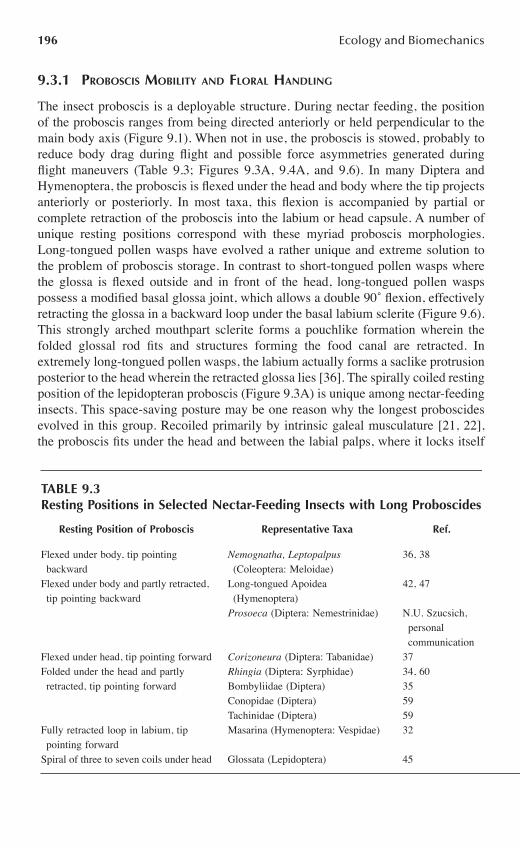
196 Ecology and Biomechanics
9.3.1 PROBOSCIS MOBILITY AND FLORAL HANDLING
The insect proboscis is a deployable structure. During nectar feeding, the positionof the proboscis ranges from being directed anteriorly or held perpendicular to themain body axis (Figure 9.1). When not in use, the proboscis is stowed, probably toreduce body drag during flight and possible force asymmetries generated duringflight maneuvers (Table 9.3; Figures 9.3A, 9.4A, and 9.6). In many Diptera andHymenoptera, the proboscis is flexed under the head and body where the tip projectsanteriorly or posteriorly. In most taxa, this flexion is accompanied by partial orcomplete retraction of the proboscis into the labium or head capsule. A number ofunique resting positions correspond with these myriad proboscis morphologies.Long-tongued pollen wasps have evolved a rather unique and extreme solution tothe problem of proboscis storage. In contrast to short-tongued pollen wasps wherethe glossa is flexed outside and in front of the head, long-tongued pollen waspspossess a modified basal glossa joint, which allows a double 90˚ flexion, effectivelyretracting the glossa in a backward loop under the basal labium sclerite (Figure 9.6).This strongly arched mouthpart sclerite forms a pouchlike formation wherein thefolded glossal rod fits and structures forming the food canal are retracted. Inextremely long-tongued pollen wasps, the labium actually forms a saclike protrusionposterior to the head wherein the retracted glossa lies [36]. The spirally coiled restingposition of the lepidopteran proboscis (Figure 9.3A) is unique among nectar-feedinginsects. This space-saving posture may be one reason why the longest proboscidesevolved in this group. Recoiled primarily by intrinsic galeal musculature [21, 22],the proboscis fits under the head and between the labial palps, where it locks itself
TABLE 9.3Resting Positions in Selected Nectar-Feeding Insects with Long Proboscides
Resting Position of Proboscis Representative Taxa Ref.
Flexed under body, tip pointing backward
Nemognatha, Leptopalpus(Coleoptera: Meloidae)
36, 38
Flexed under body and partly retracted, tip pointing backward
Long-tongued Apoidea (Hymenoptera)
42, 47
Prosoeca (Diptera: Nemestrinidae) N.U. Szucsich, personalcommunication
Flexed under head, tip pointing forward Corizoneura (Diptera: Tabanidae) 37Folded under the head and partly retracted, tip pointing forward
Rhingia (Diptera: Syrphidae) 34, 60Bombyliidae (Diptera) 35Conopidae (Diptera) 59Tachinidae (Diptera) 59
Fully retracted loop in labium, tip pointing forward
Masarina (Hymenoptera: Vespidae) 32
Spiral of three to seven coils under head Glossata (Lepidoptera) 45
3209_C009.fm Page 196 Thursday, November 10, 2005 10:47 AM

Nectar Feeding in Long-Proboscid Insects 197
using the elasticity of the spirally coiled galeae without the need of further muscleaction [45].
The time an insect spends deploying the proboscis and handling floral structuresdecreases foraging profitability, and a number of adaptations allow nectar feedersto minimize floral-handling time. Hummingbirds, nectar-feeding bats, and certaininsects frequently hover when probing flowers, probably reducing floral access times[78] while simultaneously reducing possible predation risks [79]. Many long-pro-boscid insects partially extend their proboscis before landing, but others extend itafter landing, thus making proboscis extension a rather cumbersome process. Inbees, cranial muscles of the labiomaxillary complex unfold the proboscis by movingbasal components anteriorly [80], a design that requires a substantial amount ofspace. In bumblebees, long proboscides may be a hindrance owing to the need torear the head backward prior to proboscis insertion into the corollae [81]. In long-tongued euglossine bees, this process reaches comical proportions as they fumbleto extend their ungainly tongues while barely hanging onto the petals of a Costusflower. By contrast, long-tongued pollen wasps are able to immediately extend theirproboscis into narrow corolla tubes after landing since the glossa is propelled forwardfrom its internally looped resting position [32].
Proboscis movements are well-studied in butterflies. After uncoiling the probos-cis with a hydraulic mechanism [45,82,83], the proboscis assumes a flexed positionduring feeding that permits easy adjustment to various corolla lengths. Probingmovements are controlled by this hydraulic mechanism in addition to high cuticularflexibility, proboscis musculature, and accompanying sensory equipment [45,55].Elevation of the entire proboscis, combined with extension and flexion of the distalparts, leads to rapid and precise probing movements without whole body movements.These probing movements are likely to be advantageous in handling inflorescences[45,64].
The comparison of bombyliid flies with short and long proboscides indicatesthat the same principal mechanisms govern their proboscis movements. One remark-able innovation in long-proboscid bombyliid species is their ability to take up nectarfrom laterally open flowers with the proboscis directed anteriorly but without fullyextending it or spreading the labellae [19,35].
Nectar-feeding insects are typically generalist pollinators, and there is littleevidence to support the partitioning of floral resources on the basis of proboscislength alone [11,14–16]. Not surprisingly, animals with longer mouthparts are ableto access deeper flowers, but the specificity of these relationships often depends onother aspects of plant and pollinator morphology [84–86]. In hummingbirds, foragingefficiency is influenced by the match between corolla and bill morphologies [70–72],and in bumblebees, there is some evidence to suggest that efficiency is maximizedwhen foragers visit flowers matching their tongue length [14,17,18]. Unfortunately,because of a lack of comparative foraging studies, there are few data to address therelationship between handling time, feeding modality, and proboscis length in otherinsects. However, because insects with long proboscides tend to follow foragingtraplines on a few nectar-rich resources [87], fluid-handling times may be moresignificant than probing times.
3209_C009.fm Page 197 Thursday, November 10, 2005 10:47 AM

198 Ecology and Biomechanics
9.3.2 FACTORS INFLUENCING FLUID HANDLING
The rate and efficiency with which an insect can transport nectar from the floralnectar reservoir and through its proboscis depends on the physical properties of thenectar solution, the modality of fluid feeding, the geometry of the feeding apparatus,and the dynamics of muscle contraction [25]. Betts [88] was the first to recognizethe importance of viscosity in limiting nectar ingestion rates in honeybees, and Baker[89] hypothesized that similar biophysical constraints may have influenced theevolution of the dilute nectars found in hummingbird flowers. Early biomechanicalanalyses [26,90] employed the Hagen–Poiseiulle relation to describe how the rateof nectar intake, Q, varies with viscosity, , proboscis length, L, food canal radius,R, and the driving pressure gradient, P:
Q = R4P/(8 L) (9.1)
One prediction derived from Equation 9.1 is that the nectar intake rate declineslinearly as proboscis length increases. Thus, based on this simple analysis, an obviousdisadvantage to a long proboscis may be a slower nectar intake rate. Alternatively,long-proboscid insects may compensate for this handicap by developing proportion-ally larger pump muscles and/or increasing the radius of their food canal. Presently,no published studies have addressed these possibilities, but preliminary data from33 species of euglossine bees suggest that nectar intake rates decline with tonguelength after the confounding effects of body size have been removed [91].
In seeking to maximize their rate of energy intake, insect nectarivores mustselect from a variety of floral resources. One constraint faced by these foragers isthat nectar viscosity increases exponentially with sucrose concentration, and Equa-tion 9.1 tells us that nectar intake rate declines with viscosity. Thus, the rate ofenergy intake will be maximized at some intermediate concentration (Figure 9.8).Because the pressure drop P varies with fluid properties [92], the position of thisoptimal nectar concentration will depend on the precise mechanism of force pro-duction.
Researchers have identified two primary mechanisms of fluid transport duringnectar loading: capillary-based lapping and suction feeding (see Section 9.2). Lap-ping insects such as ants (on extrafloral nectars [48,93]), bees [42,48–50,93], hum-mingbirds (Trochilidae), and nectar-feeding bats (Phyllostomidae: Glossophaginae)dip their hairy tongues (or glossae in insects) into the nectar solution whereuponliquid is drawn up via capillary forces and subsequently unloaded internally via“squeezing” or suction from the cibarial pump [25,26,49,94]. Suction feeding, whichdepends solely on a pressure gradient generated by fluid pumps in the head andalong the intestinal tract, occurs primarily in the Lepidoptera, Diptera, and someHymenoptera (Table 9.2). Many flies use a primitive sponging mode of nectarfeeding where nectar is first taken up by the spread labella and later sucked into thefood canal. The loading phase of sponging likely depends on both capillary forcesand suction pressure generated by the spreading labella.
These two mechanisms of feeding lead to different predictions regarding thevalue of the optimal nectar sugar concentration [25]. Daniel et al. [24] used A.V.
3209_C009.fm Page 198 Thursday, November 10, 2005 10:47 AM

Nectar Feeding in Long-Proboscid Insects 199
Hill’s classic model of muscle contraction dynamics to describe the behavior of thecibarial pump musculature in butterflies. This model predicted an optimal range ofsucrose concentrations between 31 and 39% (sugar weight to total weight) dependingon parameter estimates. Empirical studies with eight lepidopteran species and numer-ous other insects have largely confirmed these predictions (Table 9.4). Remarkably,although proboscis length influences the absolute rate of energy intake for suctionfeeders (see above), the sugar concentration that maximizes energy flux is predictedto be independent of proboscis length [24].
Using a capillary pressure term to examine the mechanics of lapping by bees,Kingsolver and Daniel [25] predicted that optimal nectar sugar concentrations forlappers should be greater than those for suction feeders. Indeed, maximal energyintake rates for lapping bees and ants are at sugar concentrations nearly 15% (w/w)higher than those for suction-feeding insects (Table 9.4). Because the frequency andamplitude of glossal extension in hymenopterans relies on passive mechanical prop-erties [48], Borrell [31] suggested that as tongue length increases, lapping ceases tobe an effective mechanism of fluid transport. One consequence of the evolution ofgreatly elongated proboscides in the Diptera and Hymenoptera may have been adownward shift in the sugar concentration that maximizes the rate of energy intake.
9.3.3 ENVIRONMENTAL INFLUENCES ON FLORAL NECTAR
CONSTITUENTS
Although laboratory feeding experiments have been largely confined to nectar intakerates on pure sucrose solutions (but see [95–97]), floral nectars in nature are oftencomposed of a suite of sugars in various proportions along with small concentrationsof amino acids and other compounds [98]. These chemical constituents influenceboth the physical properties of nectar [26] and its energetic value to a given pollinator[96,98]. Fructose and glucose, for instance, which are found in moderate concen-trations in insect flowers, are both less viscous than sucrose at the same concentration[26]. However, in choice tests, pure sucrose is preferred over either of these sugars
FIGURE 9.8 Relationships between energy intake rate, nectar intake rate, viscosity, andsucrose concentration. Because viscosity increases exponentially with sucrose concentration(A) and volumetric nectar intake rate declines with viscosity (B), energy intake rates will bemaximized at intermediate sugar concentrations (C). Graphs are calculated for a 150-mginsect using the suction feeding model of Daniel et al., Oecologia, 79, 66, 1989.
100
80
60
40
Visc
osity
(mPa
s)
20
015 25 35
Sucrose (%)
8A B C
45 55 65N
ecta
r int
ake
rate
(µl/s
)0
0.6
0.5
0.4
0.3
0.2
0.1
0 20 40Viscosity (mPas)
60 80 100 Ener
gy in
take
rate
(µg
sucr
ose/
s)
0
160
120
80
40
2515 35Sucrose (%)
45 55 65
3209_C009.fm Page 199 Thursday, November 10, 2005 10:47 AM

200 Ecology and Biomechanics
[96,99,100], perhaps because of its ease of assimilation. Nectar viscosity increaseswith the addition of amino acids [26], and although they are ubiquitous at lowconcentrations in floral nectars [98], their significance to nectar-feeding insects hasyet to be convincingly demonstrated [99,101,102].
In general, insect-pollinated flowers tend to be sucrose dominant [98], and nectarintake rates observed in the laboratory provide a window to understanding themechanics of nectar ingestion at real flowers. Sucrose concentrations of nectars ininsect-pollinated flowers vary widely, ranging from just a few percent to a high of88% in the crystallized nectar of one Mediterranean shrub [98]. High concentrationsare typically diluted with saliva prior to ingestion, and under these conditionssalivation rate may even be a limiting factor in foraging efficiency. Diurnally polli-nated flowers normally exhibit a single peak in nectar production in the midmorning,
TABLE 9.4Optimal Nectar Sugar Concentrations (% w/w) Reported for Some Nectar Feeders
Common Name Genus Feeding Mode Optimal % Ref.
Ponerine ant Pachycondyla Lapping 50 93Ponerine ant Rhytidoponera Lapping 50 93Bumblebee Bombus Lapping 55 49Honeybee Apis Lapping 55 101Stingless bee Melipona Lapping 60 101Leaf-nosed bat Glossophaga Lapping 60 118Rufous hummingbird Selasphorus Lapping 50 123, 138Honeyeater bird Variousa Lapping 40 115Leafcutter ant Atta Suction 30 93Carpenter ant Camponotus Suction 40 93Orchid bee Euglossa Suction 35 31Fritillary butterfly Agraulis Suction 40 92Sulphur butterfly Phoebis Suction 35 92Fritillary butterfly Speyeria Suction 35 139Skipper butterfly Thymelicus Suction 40 126Painted lady butterfly Vanessa Suction 40 140Armyworm noctuid moth Pseudaletia Suction 40 126Hummingbird hawkmoth Macroglossum Suction 35 97Tobacco hawkmoth Manduca Suction 30 141Human Homo Suction 40 126Blowfly Phormia Sponging 35 95Mean(±±±± 95% C.I.) for lappers 50.5 ±±±± 5.1Mean(±±±± 95% C.I.) for suction feedersb 36.2 ±±±± 2.7
Note: In general, animals were timed while feeding from large volumes of aqueous sucrose solutionand the volume or mass change of the solution was recorded upon completion of the feeding bout.
a Anthochaera (45%), Phylidonyris (45%), and Acanthorhynchus (35%)b Not including humans.
3209_C009.fm Page 200 Thursday, November 10, 2005 10:47 AM

Nectar Feeding in Long-Proboscid Insects 201
whereas flowers that are pollinated at night exhibit this peak shortly after dusk[11,103,104]. Although available nectar volumes change over the course of the day,nectar sugar concentrations are relatively stable in most flower species [11,12,105–107]. In fact, flowers with long corollas and concealed nectaries are less affectedby evaporation or dilution by rain than flowers with open nectaries [103].
Studies isolating the effects of environmental factors such as temperature, humid-ity, water stress, and atmospheric carbon dioxide on nectar sugar concentrationshave produced mixed results [108–111]. Similarly, the heritability of nectar sugarconcentration appears to vary by species and environment, making generalizationsdifficult at the present time [108,112]. It is important to note, however, that whereasinterindividual variation in nectar volume can be quite large, variation in nectar sugarconcentration tends to be rather low [113]. Patterns of high interspecific and lowintraspecific variation in sugar concentration are at least suggestive of strong stabi-lizing selection.
9.3.4 HAVE NECTAR SUGAR CONCENTRATIONS EVOLVED TO
MATCH POLLINATOR PREFERENCES?
The cost of producing nectar can be substantial, and at least in environments of lowwater stress, this cost can be directly related to sugar content [114]. Thus, if totalsugar mass is held constant, it costs a plant the same amount to offer a pollinator35% sugar as it does 65% sugar [115]. If nectar-feeding insects seek to maximizetheir rate of energy intake during feeding, then they should prefer to visit plants thatprovide nectars matching their optimal sugar concentration. Consequently, flowersspecializing on a particular pollinator may be expected to evolve sugar concentrationsthat match pollinator preferences.
Euglossine bees are derived suction feeders with an optimal nectar sugar concen-tration that falls between 30 and 40% sucrose [31]. We compiled data on the nectarsugar concentrations recorded from flowers in 28 species in 9 families that euglossinebees are known to visit and categorized these flowers as euglossine specialists orgeneralists (Table 9.5). Overall, we found a close match between optimal nectar sugarconcentrations and the concentrations found in specialist flowers. More significantly,however, we observed lower variance in sugar concentrations in specialist as comparedto generalist flowers, but we caution that verifying this trend requires additional dataand phylogenetic controls. In comparison with sympatric bees that lap nectars, eugloss-ine bees also tend to forage from flowers with more dilute rewards (Table 9.6). Otheranalyses of floral nectars have supported partitioning of pollinator guilds on the basisof sugar concentration [89,98,116], but as is evident from Table 9.6, feeding biome-chanics is clearly only one factor influencing these trends. Opposing physiologicalpressures to minimize water loads in flight [117] or obtain dietary water [89,118,119]may also influence choice behavior by nectarivores and the evolution of nectar sugarconcentrations in flowers. Additionally, floral generalization, recent pollinator shifts,and phylogenetic inertia may contribute to the mismatch between sugar concentrationand feeding mechanics in some taxa.
One method for assessing how the biomechanics of nectar ingestion has influ-enced nectar constituents of flowers is to evaluate choice behavior of nectarivorous
3209_C009.fm Page 201 Thursday, November 10, 2005 10:47 AM

202 Ecology and Biomechanics
TABLE 9.5Mean Nectar Sugar Concentrations (% w/w) for Some Flowers Visited by Euglossine Bees
Family Genus (Species N) Specialist Sucrose (%) Ref.
Apocynaceae Stemmadenia (1) N 34 142Apocynaceae Thevetia (1) N 32 142Bignoniaceae Jacaranda (1) N 15 B.J. Borrell,
unpublishedBignoniaceae Tabebuia (3) N 39 142Convolvulaceae Ipomoea (1) N 31 143Gesneriaceae Drymonia (2) N 34 12, 144Gesneriaceae Sinningea (2) N 26 145Mimosaceae Inga (2) N 26 105, 146Passifloriaceae Passiflora (2) N 40 107Costaceae Costus (4) Y 36 12, 106Costaceae Dimerocostus (1) Y 35 B.J. Borrell,
unpublishedGesneriaceae Sinningea (2) Y 34 145Lecythidaceae Coratari (1) Y 39 147Lecythidaceae Eschweilera (2) Y 36 147Marantaceae Calathea (3) Y 38 148–150Mean (±±±± 95% C.I.) for generalist flowers 31 ±±±± 5.7Mean (±±±± 95% C.I.) for euglossine specialists 36 ±±±± 1.7
Note: In general, nectars were extracted from new flowers during times of pollinator visitation, andthe equivalent sucrose concentration was measured using a handheld refractometer. Designation offlowers as euglossine specialists was based on visitation frequency data reported by the authors, nottaking into account pollinator efficiency.
TABLE 9.6Mean Nectar Sugar Concentrations (% w/w) of Flowers Visited by Different Animal Taxa in a Variety of Habitats
Common Name Feeding Mode Sucrose (%) Habitat Type References
Bumblebee Lapping 44 Temperate meadow 151Centridine bee Lapping 48 Tropical forest 102Stingless bee Lapping 44 Tropical forest 102Hummingbird Lapping 22 Tropical wet forest 89Leaf-nosed bat Lapping 14 Tropical wet forest 152Orchid bee Suction 36 Tropical wet forest See Table 9.5Long-proboscid fly Suction 26 Mediterranean shrub 15Hawkmoth Suction 22 Tropical dry forest 11Butterfly Suction 25 Temperate 26
3209_C009.fm Page 202 Thursday, November 10, 2005 10:47 AM

Nectar Feeding in Long-Proboscid Insects 203
insects in laboratory studies. Numerous investigations have measured visitation ratesof nectarivores to effectively infinite volume sucrose solutions and concluded thatthese animals prefer the most concentrated solutions offered them [96,120–122].One problem with this approach is that it confounds nectar sugar concentration withtotal meal energy [75,123]. The more relevant question is how much water shoulda plant add to a fixed quantity of sugar in order to maximize attractiveness topollinators [115]. Furthermore, behavioral studies should use realistic nectar volumesand monitor transport costs to and from nectar sources so that the data may beanalyzed for a variety of timescales [26,77]. Roberts’ exemplary study of humming-bird foraging [123] analyzed concentration preferences at different timescales butemployed an equal volume rather than an equal sugar design. Hainsworth and Hamill[75] conducted the only published sugar choice experiment we know of by offeringthe butterfly Vanessa cardui a choice between feeding from a 70% solution for 30sec or a 35% solution for 20 sec. In spite of the decline in energy intake rate, theseauthors found that butterflies still preferred the more concentrated solution. Onecaveat with interpreting these results is that butterflies were not freely foraging butwere captured and hand fed upon landing at color-coded feeding sites. The euglossinebee Euglossa imperialis does not discriminate between 35% (feeding time [FT] =9 sec) and 55% (FT = 15 sec) solutions offered in an equal sugar design; Euglossaimperialis does, however, show a slight but significant preference for 35% (FT = 9sec) sucrose over 60% (FT = 30 sec; B.J. Borrell, unpublished). Neither B.J. Borrell(unpublished) nor Hainsworth and Hamill [75] monitored transport costs, whichwhen taken into account, predict preferences for more concentrated nectars thanconsideration of feeding costs alone [26].
An alternative route of investigation has been to augment the viscosity of puresucrose solutions using small quantities of polymers such as tylose or methyl cel-lulose [97,124,125]. Hummingbirds do not distinguish between 20% sucrose solutionand a 20% sucrose solution with the viscosity increased to that of a 40% solution[125]. However, the bee Euglossa imperialis shows a strong preference for lowviscosity nectars in choice experiments (B.J. Borrell, unpublished).
9.3.5 TEMPERATURE AND OPTIMAL NECTAR FORAGING
Environmental temperature and nectar sugar concentration interact to influence boththe energetic costs or foraging and the rate of energy intake during feeding. Nectarviscosity increases at colder temperatures, and the dependence of viscosity ontemperature increases with increasing sugar concentration [26]. Consequently, onegeneral prediction is that nectar intake rates should decline at cooler temperatures,a prediction that has been confirmed in experiments with both butterflies [126] andeuglossine bees (B.J. Borrell, unpublished). Thus, foraging insects would do wellto forage in sunny patches [26,111,127] or at inflorescences with endogenous heatsources [128]. The relevant behavioral experiment would involve independentlycontrolling nectar temperature and air temperature to partition thermoregulatorycosts from feeding costs.
Some researchers have argued that nectars are less concentrated at high eleva-tions owing to temperature effects on viscosity [89,103]. However, Heyneman [26]
3209_C009.fm Page 203 Thursday, November 10, 2005 10:47 AM

204 Ecology and Biomechanics
showed that optimal concentrations should shift no more than 1 to 2% for a 10°Cdecrease in air temperature. Indeed, for the butterfly Thymelicus lineola, optimalnectar sugar concentrations lie at approximately 40% sucrose at both 25 and 35°C.At the cooler temperature, however, energy intake rate exhibited a less well-definedpeak, remaining equally rewarding between 25 and 45% sucrose [126].
For endotherms such as hummingbirds, hawkmoths, or large bees, temperaturecan also have a direct influence on the energetic cost of foraging. The energetic costof preflight warm-up and shivering during flower visits is substantially higher atcolder temperatures [69]. As noted above, endothermic flowers have the potentialto offset these costs by providing pollinators a heat reward [128]. Neotropicaleuglossine bees are known to regulate heat production during flight: A 10°C declinein air temperature results in a 30% increase in metabolic power requirements [129].Consequently, an increase in transport costs at lower temperatures may have a greatereffect on optimal nectar sugar concentrations than changes in nectar physical prop-erties [26]. Contrary to this hypothesis, Borrell [91] found that euglossine beesharvest nectars of the same concentration in both dry and wet forests in both thelowlands and highlands of Costa Rica. For hummingbirds, Tamm [130] demonstrateda preference for more concentrated nectars as transport costs increased, and it wouldbe interesting to see if the same relation holds true for temperature-mediated changesin flight costs. One final note is that the metabolic cost of warming nectar on a coldday cannot be ignored in examining thermal effects on foraging choice [131].
9.4 CONCLUDING REMARKS
In this review, we have endeavored to synthesize functional morphology, biome-chanics, and behavioral ecology to develop an integrative view of the interactionsbetween flowering plants and nectar-feeding animals. Proboscides exceeding bodylength have arisen multiple times among nectar-feeding taxa, and although themorphological composition of these proboscides vary widely, all of these insectsshare several key attributes, including the possession of a fluid-tight food canal, aspecialized tip region, and one or more fluid pumps. These insects have overcomefunctional problems of proboscis control, storage, and extension to maximize prof-itability of nectar-foraging activities. The rate of fluid flow in an insect’s proboscisdepends on the modality of fluid feeding, the morphology of the feeding apparatus,and the chemistry of floral nectars. Optimal nectar-foraging strategies may also beinfluenced by environmental temperatures and the distribution of nectar resources.Future studies should aim to test proposed links between morphology and ecologyto further our understanding of the evolution of long proboscides.
ACKNOWLEDGMENTS
We thank G. Byrnes, C. Clark, R. Dudley, R. Hill, S. Horisawa, and two anonymousreviewers for comments and discussions which greatly improved this manuscript.The SEM micrographs were prepared with the help of the electron microscopy labin the Institute of Zoology at the University of Vienna. B.J.B. was supported by agraduate research fellowship from the U.S. National Science Foundation.
3209_C009.fm Page 204 Thursday, November 10, 2005 10:47 AM

Nectar Feeding in Long-Proboscid Insects 205
REFERENCES
1. Sprengel, C.K., Discovery of the secret nature in the structure and fertilization offlowers, in Floral Biology: Studies on Floral Evolution in Animal-Pollinated Plants,Lloyd, D.G. and Barrett, S.C. H., Eds., Chapman and Hall, New York, 1996, p. 65.
2. Proctor, M., Yeo, P., and Lack, A., The Natural History of Pollination, Timber Press,Portland, Oregon, 1996, p. 479.
3. Darwin, C., On the Various Contrivances by which British and Foreign Orchids AreFertilized by Insects, Murray, London, 1862.
4. Nilsson, L.A., The evolution of flowers with deep corolla tubes, Nature, 334, 147,1988.
5. Alexandersson, R. and Johnson, S.D., Pollinator-mediated selection on flower-tubelength in a hawkmoth pollinated Gladiolus (Iridaceae), Proc. R. Soc. Lond. B, 269,631, 2002.
6. Johnson, S.D. and Steiner, K.E., Long-tongued fly pollination and evolution of floralspur length in the Disa draconis complex (Orchidaceae), Evolution, 51, 45, 1997.
7. Schemske, D.W. and Horvitz, C.C., Temporal variation in selection on a floral char-acter, Evolution, 43, 461, 1989.
8. Labandeira, C.C., Insect mouthparts: Ascertaining the paleobiology of insect feedingstrategies, Annu. Rev. Ecol. Syst., 28, 153, 1997.
9. Ren, D., Flower-associated Brachycera flies as fossil evidence for Jurassic angiospermorigins, Science, 280, 85, 1998.
10. Ackerman, J.D., Euglossine bees and their nectar hosts, in The Botany and NaturalHistory of Panama, D’Arcy, W.G. and Correa, M.D., Eds., Missouri Botanical Garden,St. Louis, MO, 1985, p. 225.
11. Haber, W.A. and Frankie, G.W., A tropical hawkmoth community: Costa Rican dryforest Sphingidae, Biotropica, 21, 155, 1989.
12. Grove, K.F., Reproductive Biology of Neotropical Wet Forest Understory Plants,University of Iowa, Iowa City, 1985, p. 187.
13. Heinrich, B., Resource partitioning among some eusocial insects: Bumblebees, Ecol-ogy, 57, 874, 1976.
14. Ranta, E. and Lundberg, H., Resource partitioning in bumblebees: The significanceof differences in proboscis length, Oikos, 35, 298, 1980.
15. Manning, J.C. and Goldblatt, P., The Moegistorhynchus longirostris (Diptera: Nem-estrinidae) pollination guild: long-tubed flowers and a specialized long-proboscid flypollination system in southern Africa, Plant Syst. Evol., 206, 51, 1997.
16. Borrell, B.J., Long tongues and loose niches: Evolution of euglossine bees and theirnectar flowers, Biotropica, 37, 664, 2005.
17. Inouye, D.W., The effect of proboscis and corolla tube lengths on patterns and ratesof flower visitation by bumblebees, Oecologia, 45, 197, 1980.
18. Harder, L.D., Flower handling efficiency of bumble bees: Morphological aspects ofprobing time, Oecologia, 57, 274, 1983.
19. Szucsich, N.U. and Krenn, H.W., Flies and concealed nectar sources: Morphologicalinnovations in the proboscis of Bombyliidae (Diptera), Acta Zool., 83, 183, 2002.
20. Eastham, L.E.S. and Eassa, Y.E.E., The feeding mechanism of the butterfly Pierisbrassicae L., Phil. Trans. R. Soc. Lond. B, 239, 1, 1955.
21. Wannenmacher, G. and Wasserthal, L.T., Contribution of the maxillary muscles toproboscis movement in hawkmoths (Lepidoptera: Sphingidae) — An electrophysio-logical study, J. Insect Physiol., 49, 765, 2003.
3209_C009.fm Page 205 Thursday, November 10, 2005 10:47 AM

206 Ecology and Biomechanics
22. Krenn, H.W., Proboscis musculature in the butterfly Vanessa cardui (Nymphalidae,Lepidoptera): Settling the proboscis recoiling controversy, Acta Zool., 81, 259, 2000.
23. Hepburn, H.R., Proboscis extension and recoil in Lepidoptera, J. Insect Physiol., 17,637, 1971.
24. Daniel, T.L., Kingsolver, J.G., and Meyhofer, E., Mechanical determinants of nectar-feeding energetics in butterflies: Muscle mechanics, feeding geometry, and functionalequivalence, Oecologia, 79, 66, 1989.
25. Kingsolver, J.G. and Daniel, T.L., Mechanics of food handling by fluid-feedinginsects, in Regulatory Mechanisms in Insect Feeding, Chapman, R.F. and, de Boer,G. Eds., Chapman & Hall, New York, 1995, p. 32.
26. Heyneman, A.J., Optimal sugar concentrations of floral nectars: Dependence on sugarintake efficiency and foraging costs, Oecologia, 60, 198, 1983.
27. Krenn, H.W., Plant, J.D. and, Szucsich, N.U., Mouthparts of flower-visiting insects,Arthropod Struct. Dev., 34, 1, 2005.
28. Jervis, M., Functional and evolutionary aspects of mouthpart structure in parasitoidwasps, Biol. J. Linn. Soc., 63, 461, 1998.
29. Amsel, H.G., Amphimoea walkeri Bsd., der Schwärmer mit dem längsten Rüssel!Entomol Rundsch, 55, 165, 1938.
30. Jervis, M. and, Vilhelmsen, L., Mouthpart evolution in adults of the basal, “sym-phytan,” hymenopteran lineages, Biol. J. Linn. Soc., 70, 121, 2000.
31. Borrell, B.J., Suction feeding in orchid bees (Apidae: Euglossini), Proc. R. Soc. Lond.B, 271, S164, 2004.
32. Krenn, H.W., Mauss, V., and, Plant, J., Evolution of the suctorial proboscis in pollenwasps (Masarinae, Vespidae), Arthropod Struct. Dev., 31, 103, 2002.
33. Gilbert, F. and Jervis, M., Functional, evolutionary and ecological aspects of feeding-related mouthpart specializations in parasitoid flies, Biol. J. Linnean Soc., 63, 495,1998.
34. Gilbert, F.S., Foraging ecology of hoverflies: Morphology of the mouthparts in rela-tion to feeding on nectar and pollen, Ecol. Entomol., 1981, 245, 1981.
35. Szucsich, N.U. and Krenn, H.W., Morphology and function of the proboscis inBombyliidae (Diptera, Brachycera) and implications for proboscis evolution inBrachycera, Zoomorphology, 120, 79, 2000.
36. Schremmer, F., Morphologische Anpassungen von Tieren — insbesondere Insekten— an die Gewinnung von Blumennahrung, Verh. Deutschen Zoologischen Ges Saar-brücken, 1961, 375, 1961.
37. Dierl, W., Zur Nahrungsaufnahme von Corizoneura longirostris (Hardwicke)(Diptera: Tabanidae), Khumbu Himal, 3, 76, 1968.
38. Handschin, E., Ein neuer Rüsseltyp bei einem Käfer. Biologische und morphologischeBeobachtungen an Leptopalpus rostratus F., Z. Morphol. Ökologie Tiere, 14, 513,1928.
39. Krenn, H.W. and Kristensen, N.P., Early evolution of the proboscis of Lepidoptera(Insecta): External morphology of the galea in basal glossatan moths lineages, withremarks on the origin of pilifers, Zool. Anz., 239, 179, 2000.
40. Kristensen, N.P., Lepidoptera: Moths and Butterflies 2. Handbook of Zoology IV/36,Walter De Gruyter, New York, 2003.
41. Smith, J.J. B., Feeding mechanisms, in Comprehensive Insect Physiology, Biochem-istry and Pharmacology, Kerkut, G.A. and Gilbert, L.I., Eds., Pergamon Press, NewYork, 1985, p. 64.
42. Harder, L.D., Functional differences of the proboscides of short- and long-tonguedbees (Hymenoptera, Apoidea), Can. J. Zool., 61, 1580, 1982.
3209_C009.fm Page 206 Thursday, November 10, 2005 10:47 AM

Nectar Feeding in Long-Proboscid Insects 207
43. Laroca, S., Michener, C.D., and Hofmeister, R.M., Long mouthparts among short-tongued bees and the fine structure of the labium in Niltonia (Hymenoptera, Col-letidae), J. Kans. Entomol. Soc., 62, 400, 1989.
44. Houston, T.F., An extraordinary new bee and adaptation of palpi for nectar-feedingin some Australian Colletidae and Pergidae (Hymenoptera), J. Aust. Entomol. Soc.,22, 263, 1983.
45. Krenn, H.W., Functional morphology and movements of the proboscis of Lepidoptera(Insecta), Zoomorphology, 110, 105, 1990.
46. Krenn, H.W., Proboscis assembly in butterflies (Lepidoptera): A once in a lifetimesequence of events, Eur. J. Entomol., 94, 495, 1997.
47. Snodgrass, R.E., Anatomy of the Honey Bee, Comstock, Ithaca, 1956.48. Paul, J., Roces, F., and Hölldobler, B., How do ants stick out their tongues? J.
Morphol., 254, 39, 2002.49. Harder, L.D., Effects of nectar concentration and flower depth on flower handling
efficiency of bumble bees, Oecologia, 69, 309, 1986.50. Harder, L.D., Measurement and estimation of functional proboscis length in bumble-
bees (Hymenoptera: Apidae), Can. J. Zool., 60, 1073, 1982.51. Paulus, H.F. and Krenn, H.W., Morphologie des Schmetterlingsrüssels und seiner
Sensillen — Ein Beitrag zur phylogenetischen Systematik der Papilionoidea (Insecta,Lepidoptera), J. Zool. Syst. Evol. Res., 34, 203, 1996.
52. Krenn, H.W. and Penz, C.M., Mouthparts of Heliconius butterflies (Lepidoptera:Nymphalidae): A search for anatomical adaptations to pollen-feeding behavior, Int.J. Insect Morphol. Embryol., 27, 301, 1998.
53. Krenn, H.W., Zulka, K.P., and Gatschnegg, T., Proboscis morphology and foodpreferences in nymphalid butterflies (Lepidoptera: Nymphalidae), J. Zool., 254, 17,2001.
54. Altner, H. and Altner, I., Sensilla with both terminal pore and wall pores on theproboscis of the moth, Rhodogastria Bubo Walker (Lepidoptera, Arctiidae), Zool.Anz., 216, 129, 1986.
55. Krenn, H.W., Proboscis sensilla in Vanessa cardui (Nymphalidae, Lepidoptera): Func-tional morphology and significance in flower-probing, Zoomorphology, 118, 23, 1998.
56. Walters, B.D., Albert, P.J., and Zacharuk, R.Y., Morphology and ultrastructure ofsensilla on the proboscis of the adult spruce budworm, Choristoneura fumiferana(Clem.) (Lepidoptera: Tortricidae), Can. J. Zool., 76, 466, 1998.
57. Büttiker, W., Krenn, H.W., and Putterill, J.F., The proboscis of eye-frequenting andpiercing Lepidoptera (Insecta), Zoomorphology, 116, 77, 1996.
58. Knopp, M.C.N. and Krenn, H.W., Efficiency of fruit juice feeding in Morpho peleides(Nymphalidae, Lepidoptera), J. Insect Behav., 16, 67, 2003.
59. Elzinga, R.J. and Broce, A.B., Labellar modifications of Muscomorpha flies (Diptera),Ann. Entomol. Soc. Am., 79, 150, 1986.
60. Schuhmacher, H. and Hoffmann, H., Zur Funktion der Mundwerkzeuge von Schweb-fliegen bei der Nahrungsaufnahme (Diptera: Syrphidae), Entomol. Gen., 7, 1982.
61. Schiemenz, H., Vergleichende funktionell-anatomische Untersuchungen der Kopf-muskulatur von Theobaldia und Eristalis (Diptera, Culicidae und Syrphidae), Dtsch.Entomol. Z. N.F., 4, 268, 1957.
62. Bonhag, P.F., The skeleto-muscular mechanism of the head and abdomen of the adulthorsefly (Diptera: Tabanidae), Trans. Am. Entomol. Soc., 77, 131, 1951.
63. Eberhard, S.H. and Krenn, H.W., Salivary glands and salivary pumps in adult Nymph-alidae (Lepidoptera), Zoomorphology, 122, 161, 2003.
3209_C009.fm Page 207 Thursday, November 10, 2005 10:47 AM

208 Ecology and Biomechanics
64. Krenn, H.W., Artogeia (Pieris) rapae L. (Pier.) — Russelbewegungen und Nahrung-saufnahme. — Film C 1819 des ÖWF, Österreichisches Bundesinstitut für den wis-senschaftlichen Film, Wien, 1985.
65. Josens, R.B., Nectar feeding and body size in the ant Camponotus mus, Insectes Soc.,49, 326, 2002.
66. Smith, J.J.B., Effect of diet viscosity on the operation of the pharyngeal pump in theblood-feeding bug Rhodnius prolixus, J. Exp. Biol., 82, 93, 1979.
67. Stephens, D.W. and Krebs, J.R., Foraging Theory, Princeton University Press, Prin-ceton, 1987.
68. Whitham, T.G., Coevolution of foraging in Bombus and nectar dispensing in Chilop-sis: A last dreg theory, Science, 197, 593, 1977.
69. Heinrich, B., Energetics of pollination, Annu. Rev. Ecol. Syst., 6, 139, 1975.70. Wolf, L.L., Hainsworth, F.R., and Stiles, F.G., Energetics of foraging: rate and effi-
ciency of nectar extraction by hummingbirds, Science, 176, 1351, 1972.71. Temeles, E.J. and Roberts, M.D., Effect of sexual dimorphism in bill length on
foraging behavior: An experimental analysis of hummingbirds, Oecologia, 94, 87,1993.
72. Temeles, E.J. et al., Evidence for ecological causation of sexual dimorphism in ahummingbird, Science, 289, 441, 2000.
73. Montgomerie, R.D., Eadie, J.M., and Harder, L.D., What do foraging hummingbirdsmaximize? Oecologia, 63, 357, 1984.
74. Hainsworth, F.R. and Wolf, L.L., Nectar characteristics and food selection by hum-mingbirds, Oecologia, 25, 101, 1976.
75. Hainsworth, F.R. and Hamill, T., Foraging rules for nectar: food choices by paintedladies, Am. Nat., 142, 857, 1993.
76. Hainsworth, F.R., “Fast food” vs “haute cuisine”: painted ladies, Vanessa cardui (L.),select food to maximize net meal energy, Funct. Ecol., 3, 701, 1989.
77. Gass, C.L. and Roberts, M.D., The problem of temporal scale in optimization: Threecontrasting views of hummingbird visits to flowers, Am. Nat., 140, 829, 1992.
78. Hainsworth, F.R., Discriminating between foraging rules and why hummingbirdshover, Anim. Behav., 41, 902, 1991.
79. Wasserthal, L.T., Swing-hovering combined with long tongue in hawkmoths, anantipredator adaptation during flower visits, in Animal-Plant Interactions in TropicalEnvironments, Barthlott, W., Ed., Museum Koenig, Bonn, 1993, p. 77.
80. Plant, J.D. and Paulus, H.F., Comparative morphology of the postmentum of bees(Hymenoptera: Apoidea) with special remarks on the evolution of the lorum, Z. Zool.Syst. Evolutionsforsch., 25, 81, 1987.
81. Plowright, C.M.S. and Plowright, R.C., The advantage of short tongues in bumblebees(Bombus): Analysis of species distributions according to flower corolla depth, and ofworking speeds on white clover, Can. Entomol., 129, 51, 1997.
82. Schmitt, J.B., The feeding mechanism of adult Lepidoptera, Smithson. Misc. Coll.,97, 1, 1938.
83. Bänziger, H., Extension and coiling of the lepidopterous proboscis: A new interpre-tation of the blood-pressure theory, Mitt. Schweiz. Entomol. Gest., 43, 225, 1971.
84. Temeles, E.J. et al., The role of flower width in hummingbird bill length-flower lengthrelationships, Biotropica, 34, 68, 2002.
85. Inoue, T. and Kato, M., Inter- and intraspecific morphological variation in bumblebeespecies, and competition in flower utilization, in Effects of Resource Distribution onAnimal-Plant Interactions, Hunter, M.D., Ohgushi, T., and Price, P.W. Eds., AcademicPress, San Diego, 1992, p. 393.
3209_C009.fm Page 208 Thursday, November 10, 2005 10:47 AM

Nectar Feeding in Long-Proboscid Insects 209
86. Harder, L.D., Morphology as a predictor of flower choice by bumble bees, Ecology,66, 198, 1985.
87. Janzen, D.H., Euglossine bees as long-distance pollinators of tropical plants, Science,171, 203, 1971.
88. Betts, A.D., Das Aufnahmevermögen der Bienen beim Zuckerwasserfüttern, Arch.Bienenkunde, 10, 301, 1929.
89. Baker, H.G., Sugar concentrations in nectars from hummingbird flowers, Biotropica,7, 37, 1975.
90. Kingsolver, J.G. and Daniel, T.L., On the mechanics and energetics of nectar feedingin butterflies, J. Theor. Biol., 76, 167, 1979.
91. Borrell, B.J., Optimality and allometry in nectar foraging of orchid bees (Apidae:Euglossini), Integr. Comp. Biol., 43, 869, 2003.
92. May, P.G., Nectar uptake rates and optimal nectar concentrations of two butterflyspecies, Oecologia, 66, 381, 1985.
93. Paul, J. and Roces, F., Fluid intake rates in ants correlate with their feeding habits,J. Insect Physiol., 49, 347, 2003.
94. Winter, Y. and von Helversen, O., Operational tongue length in phyllostomid nectar-feeding bats, J. Mammal., 84, 886, 2003.
95. Dethier, V.G., Evans, D.R., and Rhoades, M.V., Some factors controlling the ingestionof carbohydrates by the blowfly, Biol. Bull., 111, 204, 1956.
96. Dethier, V.G. and Rhoades, M.V., Sugar preference-aversion functions for the blowfly,J. Exp. Biol., 126, 177, 1954.
97. Josens, R.B. and Farina, W.M., Nectar feeding by the hovering hawk moth Macro-glossum stellatarum: Intake rate as a function of viscosity and concentration ofsucrose solutions, J. Comp. Physiol. A, 187, 661, 2001.
98. Baker, H.G. and Baker, I., A brief historical review of the chemistry of floral nectar,in The Biology of Nectaries, Bentley, B. and Elias, T., Eds., Columbia UniversityPress, New York, 1983, p. 126.
99. Erhardt, A., Preferences and nonpreferences for nectar constituents in Ornithopterapriamus Poseidon (Lepidoptera, Papilionidae), Oecologia, 90, 581, 1992.
100. Wykes, G.R., The preferences of honeybees for solutions of various sugars whichoccur in nectar, J. Exp. Biol., 29, 511, 1952.
101. Roubik, D.W. and Buchmann, S.L., Nectar selection by Melipona and Apis mellifera(Hymenoptera: Apidae) and the ecology of nectar intake by bee colonies in a tropicalforest, Oecologia, 61, 1, 1984.
102. Roubik, D.W. et al., On optimal nectar foraging by some tropical bees (Hymenoptera:Apidae), Apidologie, 26, 197, 1995.
103. Cruden, R.W., Hermann, S.M., and Peterson, S., Patterns of nectar production andplant-pollinator coevolution, in The Biology of Nectaries, Bentley, B. and Elias, T.,Eds., Columbia University Press, New York, 1983, p. 80.
104. Frankie, G.W. and Haber, W.A., Why bees move among mass-flowering neotropicaltrees, in Handbook of Experimental Pollination Biology, Jones, C.E. and Little, R.J.,Eds., Scientific and Academic Editions, New York, 1983, p. 360.
105. Koptur, S., Flowering phenology and floral biology of Inga (Fabaceae: Mimosoideae),Syst. Bot., 8, 354, 1983.
106. Schemske, D.W., Floral convergence and pollinator sharing in two bee-pollinatedtropical herbs, Ecology, 62, 946, 1981.
107. Varassin, I.G., Trigo, J.R., and Sazima, M., The role of nectar production, flowerpigments and odour in the pollination of four species of Passiflora (Passifloriaceae)in south-eastern Brazil, Bot. J. Linn. Soc., 136, 139, 2001.
3209_C009.fm Page 209 Thursday, November 10, 2005 10:47 AM

210 Ecology and Biomechanics
108. Carroll, A.B., Pallardy, S.G., and Galen, C., Drought stress, plant water status, andfloral trait expression in fireweed, Epilobium angustifolium (Onagraceae), Am. J. Bot.,88, 438, 2001.
109. Lake, J.C. and Hughes, L., Nectar production and floral characteristics of Tropaeolummajus L. grown in ambient and elevated carbon dioxide, Ann. Bot. (Lond.), 84, 535,1999.
110. Jakobsen, H.B. and Kristjansson, K., Influence of temperature and floret age on nectarsecretion in Trifolium repens L, Ann. Bot. (Lond.), 74, 327, 1994.
111. Corbet, S.A. and Willmer, P.G., The nectar of Justicia and Columnea: compositionand concentration in a humid tropical climate, Oecologia, 51, 412, 1981.
112. Mitchell, R.J., Heritability of nectar traits: Why do we know so little? Ecology, 85,1527, 2004.
113. Real, L.A. and Rathcke, B.J., Patterns of individual variablity in floral resources,Ecology, 69, 728, 1988.
114. Southwick, E.E., Photosynthate allocation to floral nectar: A neglected energy invest-ment, Ecology, 65, 1775, 1984.
115. Mitchell, R.J. and Paton, D.C., Effects of nectar volume and concentration on sugarintake rates of Australian honeyeaters (Meliphagidae), Oecologia, 83, 238, 1990.
116. Perret, M. et al., Nectar sugar composition in relation to pollination syndromes inSinningieae (Gesneriaceae), Ann. Bot. (Lond.), 87, 267, 2001.
117. Bertsch, A., Foraging in male bumblebees (Bombus lucorum L.): Maximizing energyor minimizing water load? Oecologia, 62, 325, 1984.
118. Roces, F., Winter, Y., and Helverson, O.v., Nectar concentration preferences and waterbalance in a flower visiting bat, Glossophaga soricina antillarum, in Animal-plantInteractions in Tropical Environments, Barthlott, W., Ed., Museum Koenig, Bonn,1993, p. 159.
119. Southwick, E.E. and Pimentel, D., Energy efficiency of honey production by bees,Bioscience, 31, 730, 1981.
120. Josens, R.B. and Farina, W.M., Selective choice of sucrose solution concentration bythe hovering hawk moth Macroglossum stellatarum, J. Insect Behav., 10, 651, 1997.
121. Kato, M., Roubik, D.W., and Inoue, T., Foraging behavior and concentration prefer-ence of male euglossine bees (Apidae: Hymenoptera), Tropics, 1, 259, 1992.
122. Waddington, K.D. and Kirchner, W., Acoustical and behavioral correlates of profit-ability of food sources in honeybee round dances, Ethology, 92, 1, 1992.
123. Roberts, W.M., Hummingbirds’ nectar concentration preferences at low volume: Theimportance of time scale, Anim. Behav., 52, 361, 1996.
124. Tezze, A.A. and Farina, W.M., Trophallaxis in the honeybee, Apis mellifera: Theinteraction between viscosity and sucrose concentration of the transferred solution,Anim. Behav., 57, 1319, 1999.
125. Stromberg, M.R. and Johnsen, P.B., Hummingbird sweetness preferences: Taste orviscosity? Condor, 92, 606, 1990.
126. Pivnick, K.A. and McNeil, J.N., Effects of nectar concentration on butterfly feeding:Measured feeding rates for Thymelicus lineola (Lepidoptera: Hesperiidae) and ageneral feeding model for adult Lepidoptera, Oecologia, 66, 226, 1985.
127. Kevan, P.G., Sun-tracking solar furnaces in High Arctic flowers: Significance forpollination and insects, Science, 189, 723, 1975.
128. Seymour, R.S., White, C.R., and Gibernan, M., Heat reward for insect pollinators,Nature, 426, 243, 2003.
3209_C009.fm Page 210 Thursday, November 10, 2005 10:47 AM

Nectar Feeding in Long-Proboscid Insects 211
129. Borrell, B.J. and Medeiros, M.J., Thermal stability and muscle efficiency in hoveringorchid bees (Apidae: Euglossini), J. Exp. Biol., 207, 2925, 2004.
130. Tamm, S., Importance of energy costs in central place foraging by hummingbirds,Ecology, 70, 195, 1989.
131. Lotz, C.N., del Rio, C.M., and Nicolson, S.W., Hummingbirds pay a high cost for awarm drink, J. Comp. Physiol. B, 173, 455, 2003.
132. Lovell, J.H., The origin of anthophily among the Coleoptera, Psyche, 22, 67, 1915.133. Roubik, D.W. and Hanson, P.E., Orchid Bees of Tropical America: Biology and Field
Guide, Editorial InBio, San José, Costa Rica, 2004, 370.134. Gess, S.K., The Pollen Wasps: Ecology and Natural History of the Masarinae, Harvard
University Press, Cambridge, MA, 1996, p. 340.135. Gilbert, F.S. et al., Morphological approaches to community structure in hoverflies
(Diptera, Syrphidae), Proc. R. Soc. London Series B-Biol. Sci., 224, 115, 1985.136. Lindberg, A.B. and Olesen, J.M., The fragility of extreme specialization: Passiflora
mixta and its pollinating hummingbird Ensifera ensifera, J. Tropical Ecol., 17, 323,2001.
137. Kristensen, N.P., Studies on the morphology and systematics of primitive Lepidoptera(Insecta), Steenstrupia, 10, 141, 1984.
138. Tamm, S. and Gass, C.L., Energy intake rates and nectar concentration preferencesby hummingbirds, Oecologia, 70, 20, 1986.
139. Boggs, C.L., Rates of nectar feeding in butterflies: Effects of sex, size, age and nectarconcentration, Funct. Ecol., 2, 289, 1988.
140. Hainsworth, F.R., Precup, E., and Hamill, T., Feeding, energy processing rates andegg-production in painted lady butterflies, J. Exp. Biol., 156, 249, 1991.
141. Stevenson, R.D., Feeding rates of the tobacco hawkmoth Manduca sexta at artificialflowers, Am. Zool., 31, 57A, 1992.
142. Frankie, G.W. et al., Characteristics and organization of the large bee pollinationsystem in the Costa Rican dry forest, in Handbook of Experimental PollinationBiology, Jones, C.E. and Little, R.J., Eds., Scientific and Academic Editions, NewYork, 1983, p. 411.
143. Real, L.A., Nectar availability and bee-foraging on Ipomoea (Convolvulaceae), Bio-tropica, 13, 64, 1981.
144. Steiner, K.E., The role of nectar and oil in the pollination of Drymonia serrulata(Gesneriaceae) by Epicharis bees (Anthophoridae) in Panama, Biotropica, 17, 217,1985.
145. SanMartin-Gajardo, I. and Sazima, M., Non-euglossine bees also function as polli-nators of Sinningia species (Gesneriaceae) in southeastern Brazil, Plant Biol., 6, 506,2004.
146. Koptur, S., Floral and extrafloral nectars of Costa Rican Inga trees: A comparison oftheir constituents and composition, Biotropica, 26, 276, 1994.
147. Knudsen, J.T. and Mori, S.A., Floral scents and pollination in neotropical Lecythi-daceae, Biotropica, 28, 42, 1996.
148. Kennedy, H., Calathea insignis, in Costa Rican Natural History, Janzen, D.H., Ed.,University of Chicago Press, Chicago, 1983, 204.
149. Ackerman, J.D. et al., Food-foraging behavior of male Euglossini (Hymenoptera:Apidae): Vagabonds or trapliners? Biotropica, 14, 241, 1982.
150. Kress, W.J., Moran, N., and Weiss, E., Ecological pressures on pollinator selectionin Calathea lutea, in OTS Tropical Biology: An Ecological Approach, 1978, 425.
3209_C009.fm Page 211 Thursday, November 10, 2005 10:47 AM

212 Ecology and Biomechanics
151. Harder, L.D. and Cruzan, M.B., An evaluation of the physiological and evolutionaryinfluences of inflorescence size and flower depth on nectar production, Funct. Ecol.,4, 559, 1990.
152. Tschapka, M., Energy density patterns of nectar resources permit coexistence withina guild of neotropical flower-visiting bats, J. Zool., 263, 7, 2004.
3209_C009.fm Page 212 Thursday, November 10, 2005 10:47 AM

213
10 Biomechanics and Behavioral Mimicry in Insects
Yvonne Golding and Roland Ennos
CONTENTS
10.1 Introduction ..................................................................................................21310.1.1 Batesian Mimicry.............................................................................21310.1.2 Müllerian Mimicry...........................................................................214
10.2 Morphological Mimicry...............................................................................21410.3 Behavioral Mimicry .....................................................................................215
10.3.1 Behavioral Mimicry in Insects ........................................................21610.3.2 Mimicry in Terrestrial Locomotion .................................................21710.3.3 Flight Mimicry .................................................................................218
10.3.3.1 The Mimetic Flight Behavior of Butterflies ....................21910.3.3.2 The Mimetic Flight Behavior of Hoverflies.....................221
10.4 Conclusion....................................................................................................224References..............................................................................................................225
10.1 INTRODUCTION
10.1.1 BATESIAN MIMICRY
Henry Walter Bates [1,2] was the first person to articulate a theory of mimicry fromhis detailed observations of insects in the Brazilian rainforest. While watching aday-flying moth mimicking a wasp, he wrote “the imitation is intended to protectthe otherwise defenceless insect by deceiving insectivorous animals, which persecutethe moth, but avoid the wasp.” Bates applied this idea to his studies of ithomiinebutterflies that exhibit red, yellow, and black aposematic coloration and pierid but-terflies (Dismorphiinae); pierids are normally white or yellow, but some species,although palatable, exhibit the same warning coloration as the heliconiids. This hasbecome known as Batesian mimicry and is generally defined as the resemblance ofa palatable animal (a mimic) to a distasteful or otherwise protected animal (a model)so that a predator is deceived or confused and protection is gained by the mimic[3]. A mimic may employ visual, auditory, olfactory, or behavioral cues to aid in
3209_C010.fm Page 213 Thursday, November 10, 2005 10:47 AM

214 Ecology and Biomechanics
the deception or confusion that relies on the predator having already sampled themodel and learned from the experience. The mimicry is most effective when (1) themimic is rarer than the model, thereby increasing the chance that the model will besampled more often than the mimic and when (2) the mimicry is accurate. However,there is some evidence that even very common and poor Batesian mimics may gainsome protection by their mimicry [4,5]. Batesian mimicry has been described invertebrates [6], invertebrates [7], and plants [8], but the overwhelming majority aredescribed in tropical insects.
10.1.2 MÜLLERIAN MIMICRY
Müllerian mimicry [9] differs from Batesian mimicry because it involves severalorganisms that are all toxic, distasteful, or protected to some degree, and resembleone another so that a predator avoids all of them. Consequently the mimicry is mosteffective when the component species are numerous. They are usually related speciesbelonging to a broad taxonomic group, e.g., heliconiid butterflies or social wasps,unlike many Batesian mimics whose models can belong to different taxa, e.g.,dipterans or coleopterans mimicking hymenopterans, or in the case of butterflies,belonging to two distinct families. In determining which type of mimicry we aredealing with, it is essential to determine the palatability status of a potential mimic.This can be problematic as suggested by Brower [10] and can lead to incorrectassumptions. Ritland [11] challenged a classical example of Batesian mimicry intemperate zone butterflies; the Florida viceroy butterfly (Limenitis archippusfloridensis) was frequently quoted as being a Batesian mimic of the Florida queen(Danaeus gilippus berenice). However, experiments showed that both species wereunpalatable, suggesting they were Müllerian mimics.
Batesian and Müllerian mimicry are fundamentally different; in Batesian mim-icry deception is involved and the mimic benefits potentially at the expense of thepredator and the model, but in Müllerian mimicry, all three species benefit. Therefore,as Fisher [12] first argued, natural selection would be expected to favor quite differentadaptive strategies. It has been argued by some [13,14] that Müllerian mimicrycannot be regarded as a true type of mimicry because there is no deception involved.
10.2 MORPHOLOGICAL MIMICRY
Many accounts of mimicry in insects have concentrated on the morphological sim-ilarities, particularly the evolution of warning colors by palatable mimetic organismsto resemble their unpalatable or protected models with aposematic coloration. Thereare many well-studied examples, particularly in butterflies, which display theirwarning coloration on their large, conspicuous wings. The well-documented geo-graphical correlations in color pattern between model and mimic species describedby Bates and well illustrated by Moulton [15] have since been explored from agenetic perspective [16–20], and the potential for birds to act as selective agents ofprey coloration and pattern, as suggested by Carpenter [21], has been verifiedexperimentally for captive birds [4,22] and wild birds [23]. Many moths that haveblack and yellow banding on their body appear to be Batesian mimics of wasps [24].
3209_C010.fm Page 214 Thursday, November 10, 2005 10:47 AM

Biomechanics and Behavioral Mimicry in Insects 215
Similarly, some beetles display black and yellow banding on the elytra [3]. Mor-phological mimicry in insects occurs widely throughout the tropics, but there aregood examples occurring in temperate areas as well. Dipterans, including someasilids, conopids, tachinids, bombyliids, and most notably syrphids (hoverflies),mimic solitary and social wasps, honeybees, and bumblebees. The morphologicalsimilarities, particularly in color and markings, have been well-documented [25–28],and the abundance, distribution, and phenology of model and mimic species havealso been intensively studied [29–31].
10.3 BEHAVIORAL MIMICRY
It has been widely acknowledged that behavior plays a major role in mimicry.Members of mimicry complexes dominated by unpalatable neotropical butterflieshave been found to roost at similar heights in the canopy to their comimics [32] andto utilize host plants at similar heights [33]. It is also generally accepted that preythat are unprofitable because they are poisonous or unpalatable often exhibit slowand predictable movement; there is no selection pressure on them to adopt rapidmovement to escape predators. Rather, conversely, there is selection pressure onsuch prey to advertise their defenses [34]. Bates [1] was probably the first personto observe that unpalatable or noxious butterflies flew slowly and deliberately, sothat their warning coloration was easily visible, whereas palatable ones flew fasterand more erratically. Aposematic beetles also adopt slow, sluggish behavior whereaspalatable ones run quickly to avoid predatory birds [35].
On the other hand, prey may be unprofitable because they are simply hard tocatch. Humphries and Driver [36] suggested that certain erratic behaviors shown bysome prey animals when attacked by a predator were not accidental but specificallyevolved as antipredator devices, confusing or disorientating the predator and thusincreasing the prey’s reaction time. Such behaviors, which seem to have no obviousaerodynamic or physiological function, appear highly erratic and include zigzagging,looping, and spinning. Driver and Humphries suggested this occurs in a wide rangeof animals, calling it protean behavior [37]. Examples include noctuid and geometridmoths, which show a bewildering range of seemingly unorientated maneuvers whenexposed to the ultrasonics of hunting bats, a behavior that confers a 40% selectiveadvantage for the moths [38]. Driver and Humphries [37] suggested that the behavioris advertising that the prey is difficult to catch and therefore unprofitable. This seemsto suggest that a predator might not bother to attack, or another explanation is thatsuch behavior could result in confusion, delaying an attack by a predator andallowing the prey to escape. Certainly erratic behavior is commonly observed inmany insects including moths, orthopterans, dipterans, hemipterans, and homopter-ans [37], and Marden and Chai [39] described uncharacteristic upward movementsshown by butterflies escaping predation.
Animals may even evolve morphological signals to reinforce or replace theirbehavioral ones that indicate they are hard to catch, which would help dissuadepredators from attacking them. Of course, possession by one species of these signalscan then lead to the evolution of such signals in other species, to produce whatSrygley [40] has termed escape mimicry. There do not appear to be any clear
3209_C010.fm Page 215 Thursday, November 10, 2005 10:47 AM

216 Ecology and Biomechanics
examples of escape mimicry involving two or more species that are all hard to catch,though several candidates among tropical butterflies have been put forward [40].However, an example in which an easy-to-catch mimic resembles a hard-to-catchmodel was given by Hespenheide [41]. He described an unusual and novel case ofmimicry in which a group of Central American beetles, mostly weevils from thesubfamily Zygopinae, mimic agile flies, notably robust-bodied species, such astachinids, muscids, and tabanids. The weevils share common color patterns with theflies, which are unlike those of other beetles, none of which is considered distasteful.The weevils and flies share a behavioral characteristic that puts them in closeassociation spatially; most perch on the same relatively isolated and exposed treeboles at midelevation in the canopy. Hespenheide [41] estimated that flies accountedfor between 65 to 70% of flying insects in the area, and yet work carried out on thediet of neotropical birds found that flies, particularly robust-bodied species, formeda very small proportion of their diet. Hespenheide hypothesized, therefore, that themimicry was based not on distastefulness but on the speed and maneuverability ofthe flies, which advertise they are difficult to catch. Gibson [42,43], in a series ofexperiments on captive birds, showed that escape mimicry is potentially plausiblesince over a period of several days, two species of birds both learned to avoid modelsof evasive prey and were also confused by escape mimics. However, Brower [10]wrote that erratic flight as an aversion tactic employed by insects and their Batesianmimics is unlikely to result in long-term learning by a predator, and so he wasskeptical that such escape mimicry could evolve.
10.3.1 BEHAVIORAL MIMICRY IN INSECTS
Rettenmeyer [7] predicted that behavioral mimicry would be especially importantamong mimics of Hymenoptera, notably wasps and ants, because the behavior oftheir models is so conspicuous. Many mimetic invertebrates use behavioral cues toenhance their mimicry, and this is particularly remarkable when mimics and modelsare not closely related and have quite different morphologies. Good examples, whichare included here because they mimic insects although they are not themselvesinsects, are ant-mimicking spiders, notably salticids of the genus Myrmarachne(Salticidae). They bring their front legs forward and wave them about to mimic thelong antennae of ants (Hymenoptera: Formicidae) and thus also give the impressionof having just six legs [3,13,44]. However, when alarmed, the spiders run off on alleight legs, so they retain full function of their front legs. The evolution of preciseantlike behaviors in myrmecomorphic species might be predicted given that behavioris often identified as the most conspicuous feature of ants [7]. Some hoverflies(Diptera: Syrphidae), which mostly possess quite short antennae, also mimic thelong antennae of social wasps (Hymenoptera: Vespidae) by bringing their front legsforward [45] while others (Eristalis tenax) mimic honeybees (Hymenoptera: Apidae)by dangling their legs in flight above flowers as if they are transferring pollen intopollen baskets (personal observation). Another example of leg-dangling behavior isshown by a syntomid moth (Macrocneme), mimicking the habit of its fossorial waspmodel [46]. Carpenter [35] cited examples of flies that mimic the antennal behaviorshown by stinging hymenoptera; they do this by waving the anterior pair of legs.
3209_C010.fm Page 216 Thursday, November 10, 2005 10:47 AM

Biomechanics and Behavioral Mimicry in Insects 217
He suggested that the vibrating of antennae is part of an advertisement of aposema-tism by stinging insects. Some hymenopterans have white markings on the antennaethat further highlight this warning behavior, and this is mimicked by syntomid moths.Cott [46] also described many examples of mimics that, when captured, behave asif they are likely to sting by curving the abdomen; these include forest dragonflies(Microstigma maculatum); a moth belonging to the genus Phaegoptera; a staphylinidbeetle (Xanthopugus); and a longicorn beetle (Dirphya). The last example wasdescribed in detail by Carpenter and Poulton [47]; they commented that it was soimpressive, they were reticent to handle the beetle!
10.3.2 MIMICRY IN TERRESTRIAL LOCOMOTION
Locomotory behavior is particularly effective in fooling or confusing predators, andagain there are many anecdotal descriptions of across-taxa similarities. For example,although they look quite dissimilar, the Brazilian long-horned grasshopper Scaphuranigra mimics the fossorial wasp Pepsis sapphires; they both have the habit of runningshort distances with expanded wings [46]. The wasp adopts this behavior whenhunting, but it is uncharacteristic behavior for a grasshopper. The grasshopper alsohas antennae modified to make them look shorter and more like those of the wasp[35]. Hoverflies of the genus Xylota, which resemble wasp species of the familiesIchneumonidae and Pompilidae, also show similar running behavior when they areforaging on leaves; they both move in fits and starts with frequent changes indirection.
Nymphs of the bug Hyalymenus (Hemiptera: Alydidae) enhance their mimicryof ants by constantly agitating their antennae and adopting zigzag locomotion [48].First instar nymphs of the stick insect Extatasoma tiaratum (Phasmidae) also adoptuncharacteristic behavior, running around very rapidly and looking very much likeants (personal observation).The ant-mimicking behavior of salticid spiders men-tioned above, which only use six legs when running about with ants, has been thesubject of some study [13], but the kinematics of the leg movements has not beeninvestigated; it would be interesting to see if the gait of the two organisms is similar.Both clubionid and salticid spiders adopt a zigzag running gait to supplement theirantennal deception [49], and some myrmecomorphic jumping spiders show a reluc-tance to jump unless seriously threatened [50]. Others show more specific mimeticbehavior: Synemosyna spp. tend to walk on the outer edge of leaves like its modelspecies of the genus Pseudomyrmex [51].
Wickler [13] described an example of superb morphological mimicry betweena grasshopper and two beetles that requires the grasshopper to occupy two differentniches at different stages in its life. Tricondyla, a genus of tiger beetles of varyingsize and with a powerful bite, scurry about on the forest floor in Borneo. Thegrasshopper Condylodera trichondyloides occurs in the same locations and looksvery much like Tricondyla even in its mode of running. It seems to have compromisedits jumping ability by evolving shorter hind legs, though once again the kinematicsof its locomotion and the gait it adopts have not been investigated. Beetles pupateand thus do not alter their size in adulthood unlike grasshoppers, which pass througha number of moults, increasing in size each time. Young Condylodera grasshoppers
3209_C010.fm Page 217 Thursday, November 10, 2005 10:47 AM

218 Ecology and Biomechanics
are smaller than their model tiger beetle and do not live on the forest floor. Insteadthey live in the canopy, occurring in tree flowers along with another beetle Collyrissarawakensis that they resemble in size and color. So for many Batesian mimics, itis important that they are in the right place at the right time.
Many lycid beetles (Coleoptera: Lycidae) are considered to be models for Bate-sian mimics (although see the comments by Brower [10], who challenged theevidence for unpalatability). These have aposematic coloration on the elytra, gre-garious habits, and sluggish behavior [52]. Two European wasp-beetles, Strangaliaspp. and Clytus arietis are black and yellow, suggesting that they mimic social wasps.Strangalia is similar in color to a wasp but moves in a characteristically slowbeetlelike way whereas Clytus differs in not having such a close resemblance to awasp and adopts uncharacteristic active, jerky movements that are thought to resem-ble hunting wasps, suggesting that it is a Batesian mimic [3]. It may be that themimic that is less convincing in terms of appearance is enhancing its mimicry byadopting wasplike behavior whereas the more-convincing mimic does not need tobecause it is convincingly unprofitable. The idea that “poor” mimics may enhancetheir mimicry by adapting their behavior has also been suggested for some hoverfliesthat mimic honeybees [53,54].
10.3.3 FLIGHT MIMICRY
Insect flight has been widely studied: Dudley [55] reviewed the biomechanics, Taylor[56] examined the control of insect flight, and Land [57] reviewed the visual control.Flight behavior of insects is commonly cited in early studies as being mimetic thoughthese references are often anecdotal. For example, Opler [58] carried out an extensivestudy of the neotropical neuropteran Climaciella brunnea in Costa Rica. Afterstudying their palatability, distribution, and markings, he concluded that five morphsof this harmless species were Batesian mimics of different species of polistine wasps.This was based on the wasps’ palatability, distributions, and markings. However, healso suggested that their body posture and flight characteristics, which presumablywere similar to those of the hymenopterans, were also evidence of the mimicry.Opler did not elaborate on the flight behavior, and so this is clearly an interestingresearch opportunity.
There are many other examples of anecdotal references to mimetic flight behav-ior. Dressler [59] described a Müllerian mimicry complex in bees of the genusEulaema and in passing mentions two asilid flies that “in flight at least, mimicEulaema quite accurately,” thus suggesting that they are Batesian mimics. Theimplication is that they are not particularly similar in their morphology.
Carpenter [35] observed longicorn beetles that mimic wasps of the family Bra-conidae, describing them as indistinguishable in flight. Other coleopterans showremarkable flight adaptations. The fore wings of beetles are hardened into protectivecases, the elytra. In flight the elytra are normally held out to the sides with the beetlerelying on rapid beating of the hind wings for propulsion. Acmaeodera species,however, fly with the elytra lying in place over the abdomen, so that the warningcoloration is still visible, giving the impression of a hymenopteran in flight. Toachieve this, the elytra have evolved a special modification (“emargination”) that
3209_C010.fm Page 218 Thursday, November 10, 2005 10:47 AM

Biomechanics and Behavioral Mimicry in Insects 219
allows free motion of the hind wings at the base. This uncharacteristic beetle behavioris clearly a mimetic adaptation, and because captive birds readily eat the beetle, itis undoubtedly a Batesian mimic [60].
However, in only two groups of insects has flight mimicry been studied in anydetail and with any attempt at quantification: (1) the Müllerian mimicry of tropicalbutterflies and their Batesian mimics, and (2) the Batesian mimicry by hoverflies ofthe family Syrphidae of various members of the hymenoptera.
10.3.3.1 The Mimetic Flight Behavior of Butterflies
Much of the modern work on flight mimicry in tropical butterflies has been carriedout in Central America starting with Chai’s [22] study of butterfly predation by thespecialist feeder, the rufous-tailed jacamar (Galbula ruficauda). These birds feedexclusively on flying insects; in fact, they do not recognize prey that does not fly.Chai established that captive jacamars fed on a wide range of butterflies and thatthey could distinguish between palatable species (Papilio; Morpho; Charaxinae;Brassolinae; Satyrinae and most Nymphalinae) and the unpalatable species (Battusand Parides [Papilionidae]; Diathreia and Callicore [Nymphalinae]; Heliconiinae;Acraeinae; Ithomiinae; Danainae and some Pieridae), most of which were membersof Müllerian mimicry groups. Most of these were sight rejected. The birds were soadept that they could even distinguish between the very similar color patterns ofsome Batesian mimics and their models, although some mimics such as Papilioanchisiades were never taken by jacamars in feeding trials. Chai suggested that thebirds made these assessments based both on the warning coloration on the wingsand on the flight behavior of the butterflies. He stated that many unpalatable butter-flies flew with “slow and fluttering wingbeats” and in a “regular path” that wouldenable them to display their warning colors. The flight of the Batesian mimics wasdescribed as being similar to that of their models, whereas other palatable butterfliesflew faster and more erratically, making them harder to catch. Importantly, Chaiestablished that jacamars could memorize the palatability of a large variety ofbutterflies, suggesting that insectivorous birds, such as jacamars, were likely to playa major role in the evolution of neotropical butterfly mimicry. Interestingly, Kassarov[61] suggested that the aerial hawking birds recognize butterflies by their flightpattern rather than by details of aposematic or mimetic coloration. Evidence hasbeen presented that insectivorous birds can perceive motion two to four times fasterthan humans [62]; they also have superior color vision and are able to detect UVmarkings that humans cannot see [63].
The qualitative flight observations were later backed up by more quantitativestudies of the flight behavior, body temperature, and body morphology of the but-terflies [64–66]. Unpalatable Müllerian species did indeed fly more slowly and moreregularly than palatable species when filmed flying in an insectary [64]. They werealso able to fly at lower ambient temperatures and had lower thoracic temperatureswhen caught. Srygley and Chai [65] suggested that these differences could also berelated to the contrasting body morphology of the two groups. The palatable, fast-flying butterflies had relatively wider thoraxes that could house the more massiveflight muscles they would need for fast speed flight and rapid acceleration. To achieve
3209_C010.fm Page 219 Thursday, November 10, 2005 10:47 AM

220 Ecology and Biomechanics
this, however, they would have to have higher thoracic temperatures and so wouldbe restricted to flying in warmer ambient temperatures. In contrast the unpalatablebutterflies, with their slower, more economical flight, could fly at lower temperaturesand divert more of their resources into a larger abdomen. This idea is incompatible,however, with a later idea of Srygley [67] about noncheatable signals. Here hesuggested that flight mimicry might actually impose an aerodynamic cost, so thatMüllerian and Batesian mimics would need to develop more power to fly thanpalatable butterflies. To test this idea, Srygley analyzed films of the flight of twospecies of palatable butterfly, four species of Müllerian mimics, and two Batesianmimics, and calculated the power required using the quasisteady analysis methodof Ellington [68]. The Batesian mimics did have higher weight-specific power, butthe power requirements of the other two groups showed extensive overlap. Theoret-ically, it seems unlikely in any case that an unpalatable butterfly would choose tofly in an uneconomical way. The matter is complicated because butterflies, like otherinsects, make extensive use of nonsteady aerodynamics [69], which will affect theirpower requirements. Clearly more research using additional species and examiningthe actual oxygen uptake of the insects rather than modeling the power is neededto settle this matter.
The morphological differences between palatable and unpalatable butterflies andtheir consequences were later examined in more detail [66,70]. These studies showedthat in unpalatable Müllerian mimics, the wing center of mass was further from thebody and the center of mass of the body was further behind the base of the wingsthan in palatable species. Both of these would make the insect less maneuverable,but give it smoother flight because of the increased moment of inertia [68], whereasthe reverse was true for the palatable species. Srygley [10,70] therefore suggestedthat similarities in morphology in these insects lead almost automatically to “loco-motor” mimicry in which “adaptive convergence of physiological and morphologicalfeatures result in similar flight biomechanics and behaviour.” In the Batesian mimicConsul fabius, although the center of mass of the wing was far from the body, asin the unpalatable Müllerian mimics, the center of mass of the body was near thewing base, as in other palatable species. Srygley [70] suggested that this intermediatemorphology would enable this butterfly to fly rapidly and unpredictably if disturbed,like other palatable species, so it could escape if its mimicry proved unsuccessful.
In this context, it is interesting that the majority of Batesian mimetic butterfliesare female [1,71], which typically have larger abdomens for the development ofeggs and, as a consequence, relatively smaller thoraxes than males [64,72]. Thiswould make them less maneuverable and hence more vulnerable to predation [55].Since females are also longer-lived, there would thus be strong selection pressurefor them to evolve the warning coloration of unpalatable butterflies to gain greaterprotection from birds. Females would also be more easily able to adopt the slow,regular flight of these species. Confirming this supposition, Ohsaki [73] found thatin general female butterflies were attacked more frequently than males but thatBatesian mimetic females (protected by their mimicry), males (protected by fasterratic flight if palatable), and the unpalatable models were attacked less thannonmimetic females. Ohsaki suggested that when the predation by avian predatorsis female biased, female-limited mimicry will be favored even if the costs of mimicry
3209_C010.fm Page 220 Thursday, November 10, 2005 10:47 AM

Biomechanics and Behavioral Mimicry in Insects 221
are the same for both sexes. The case is different in Müllerian mimicry in whichunpalatable species resemble each other; all individuals of both sexes will usuallybecome mimetic.
The locomotor mimicry that Srygley described has been most clearly demon-strated in studies of the flight kinematics of four mimetic butterflies of the genusHeliconius [74–76]. These make up two Müllerian mimicry pairs in which eachspecies is more closely related to a member of the other mimicry pair than to theinsect it mimics. Using multivariate statistics, Srygley [76] was able to separate theeffects of evolutionary convergence from those of phylogeny. It was found that themimics were more similar to each other than to the other closely related species intheir wing-beat frequency, the degree of asymmetry in wing motion, and in theirtransport costs. It has been suggested that this is the first clear example of a mimeticbehavioral signal for a flying insect [74–76]. However, since the morphologicalmimetic signal is displayed by the organs of locomotion, the wings, it might in anycase be expected that flight mimicry would occur if the wings showed convergencein form; this would greatly constrain the kinematics and aerodynamics. It shouldalso be emphasized that the research on flight mimicry in butterflies has been basedon the analysis of a very few flights made often by only a single member of particularspecies. The films, moreover, are of captive individuals flying in artificial conditions.More film of free flight in the field might help show other more subtle aspects offlight mimicry and flight behavior.
10.3.3.2 The Mimetic Flight Behavior of Hoverflies
Most examples of mimetic insects occur in the tropics, but temperate Europe andUnited States. are home to many species of hoverflies (Diptera: Syrphidae) that arethought to be Batesian mimics of wasps and bees [28,77]. Some are black and yellowor red, resembling social and solitary wasps; others are large and hairy, resemblingbumblebees (some are polymorphic, mimicking different species); while others,notably droneflies of the genus Eristalis, resemble honeybees. Some hoverfly mimicsappear to closely resemble their models in morphology, while others are onlysuperficially similar. Dipterans and hymenopterans, although both flying insects,have quite different ecologies; hymenopterans are often social insects that forage onflowers for nectar and pollen for the colony, or in the case of solitary species, forprovisioning their nest. Hoverflies are always solitary animals that do not exhibitparental care. However, both spend much of their time foraging on flowers, duringwhich time they are particularly obvious and vulnerable to predation by birds [78].In a study of foraging behavior, Golding and Edmunds [53] found that dronefliesoften spent a similar amount of time as their honeybee models, both feeding onindividual flowers and flying between them, when foraging on the same patch.Because they are seeking different rewards from the flowers and in different quan-tities, the most likely explanation is that this is a case of behavioral mimicry; thehoverflies, which are unprotected insects, are adapting their behavior to appear morelike their model hymenopterans.
There have also been many suggestions that hoverflies show flight mimicry ofhymenopterans. Different species have been referred to anecdotally as having beelike
3209_C010.fm Page 221 Thursday, November 10, 2005 10:47 AM

222 Ecology and Biomechanics
flight [13], bumblebeelike flight [79], and lazy wasplike flight [80]. One of us(Golding) has also observed the hoverfly Xanthogramma pedissequum, a black andyellow wasp mimic, adopting an uncharacteristic flight behavior; it flew about 30cm above low-growing vegetation in a zigzag fashion very similar to the behaviorof a hunting wasp (personal observation). Morgan and Heinrich [81] observed thatthe mimicry of many of the hoverflies they studied appeared most accurate in flight.They also showed that hoverflies (including Eristalis) were able to warm up usingbehavior such as basking or shivering, which they suggested might allow them tobehave more like their endothermic models. There have been few studies, however,that have empirically measured or formatively studied these behaviors, even thoughthe flights of hoverflies and bees have both been well studied.
The aerodynamics of both groups has been elegantly elucidated by Ellington[68]; the flight mechanism, wing design, and kinematics of hoverflies has beeninvestigated by Ennos [82–84]; and other behavioral aspects, such as the mechanismby which hoverflies compute interception courses and manage to return to exactlythe same spot, have been studied by Collett and Land [85,86]. Any flight mimicrybetween the two groups must be quite unlike the locomotor mimicry betweenbutterflies. For a start, the warning coloration of Hymenoptera and their hoverflymimics is displayed on the abdomen and thorax, not the wings. Second, the flightapparatus of hoverflies and Hymenoptera are quite different. Hoverflies have twowings and twist them on the upstroke in the manner described by Ennos [83]. Incontrast, the Hymenoptera have four coupled wings, with positive camber at thebase, which are twisted in the upstroke by the same mechanism as in butterflies [87](personal observation). Therefore there is no possibility of convergence in theirmechanics. Furthermore, convergence in wingbeat frequency cannot be involved inthe mimesis because the wingbeat frequency of both groups is far too high at 150to 250 Hz for predatory birds to detect or even for them to be able to see the wingsin flight. These wingbeat frequencies also overlap extensively with each other andwith those of other insects that use asynchronous muscles [68,84,88].
Hoverflies are generally regarded as having superior flight agility compared withhymenopterans because their center of body mass (CMbody) is closer to their wingbase [68]; they use inclined stroke plane hovering; and they have the apparent abilityto move the aerodynamic force vector independently of the stroke plane [84].Therefore one would expect any flight mimicry to involve the body movements ofthe insects, not the wings, and that hoverflies would have to compromise their flightability when foraging to appear more like a hymenopteran.
In the first quantitative study of flight mimicry in the group, Golding et al. [54]examined the flight of hoverflies of the genus Eristalis, which are known as dronefliesand are considered to be Batesian mimics of honeybees (Apis mellifera). They areof similar overall shape and body mass, although female Eristalis spp. tend to beslightly larger than males. In appearance droneflies differ from honeybees in havingshorter antennae, no discernable “waist,” one pair of wings, and often more orangeor yellow markings on the abdomen. Filming from above a patch of flowers in thefield, Golding measured the horizontal flight velocities and routes taken by insectsfree flying between individual flowers when foraging. She compared E. tenax withA. mellifera along with a control hoverfly (Syrphus ribesii) and a nonmimetic muscid
3209_C010.fm Page 222 Thursday, November 10, 2005 10:47 AM

Biomechanics and Behavioral Mimicry in Insects 223
fly. It was found that droneflies did indeed show more similar flight movements tothe honeybee than to the other two insects [54]. The muscid flew faster than theother three species and took more direct routes between flowers. The control hoverflyflew at similar speeds to the dronefly and honeybee, but took longer to fly betweenthe flowers because it took more convoluted routes and hovered more. The droneflyflew at similar speeds to the honeybee, took similarly convoluted routes, and hoveredfor similar amounts of time.
The dronefly also performed loops along the flight path similar to those per-formed by the honeybee. This behavior was not detectable to the human eye, but itmay well be to a predatory bird because they can detect motion two to four timesfaster than humans [76]. The looped flight of honeybees may be connected withtheir ability to orientate their position in relation to the hive using the sun, asdescribed by von Frisch [89]. It is surprising behavior for droneflies, however, asthey are capable of sudden changes of direction without altering their body position;they can perform turns of over 90 degrees while traveling less than one body length[68,84]. The most likely explanation of the looping flight of foraging droneflies isthat their flight behavior has been modified to be more similar to that of theirhymenopteran model. This cannot be classed as locomotory mimicry as defined bySrygley [70] in his studies of more closely related butterflies because the organismshave such different flight apparatus, but it could accurately be described as mimeticflight behavior. Closer examination of these maneuvers using high speed cinema-tography might help determine whether the aerodynamic mechanisms used by thetwo species are the same. However, the droneflies have still retained the ability forfast accurate flight to escape predation and in males for patrolling territory andchasing females.
Golding et. al. (in preparation) are continuing with this work on other mimicrygroups. The most recent results are from a study of flights between flowers madeby social wasps (Vespula vulgaris) and four of their hoverfly mimics (Sericomyiasilentis; Myathropa florea, Helophilus pendulus, and Syrphus ribesii). Sericomyiasilentis is a large fly similar in size to V. vulgaris, and they occur together duringlate summer; Sericomyia silentis is a conspicuous, bright yellow and black species.The other three yellow and black species are smaller than wasps but are similar insize to each other although M. florea can be slightly larger. H. pendulus and M.florea have more elaborate markings, both on thorax and abdomen than Syrphusribesii. To the human eye, Sericomyia silentis appears to be the best mimic andSyrphus ribesii, the poorest with H. pendulus and M. florae midway between thetwo. It might be expected therefore that Sericomyia silentis would show the mostsimilar behavior to its hymenopteran model. In contrast, preliminary results fromanalysis of 115 flights performed by 53 individuals from the 5 species seem to beshowing the opposite. Syrphus ribesii flies at similar speeds to wasps and hascomparable flight trajectories; it takes similar, more convoluted routes as wasps andflies relatively slowly between flowers. Sericomyia silentis, M. florae, and H. pen-dulus have similar speeds and flight trajectories to each other; they fly straighter andfaster (Figure 10.1).
An interpretation of these results is that Syrphus ribesii has to compensate forits poor morphological mimicry by showing better behavioral mimicry. It adopts
3209_C010.fm Page 223 Thursday, November 10, 2005 10:47 AM

224 Ecology and Biomechanics
slow, convoluted flight to mimic wasp flight even though it is capable of fast flight.The other species are more secure in their morphological mimicry and so do notattempt to behave like a wasp. There is some evidence for this hypothesis; ifSericomyia silentis is threatened, it adopts a characteristic wasplike zigzag flightpattern whereas Syrphus ribesii flies off rapidly (personal observation). These resultssupport the hypothesis that poor visual mimics adapt their behavior to be more liketheir models but retain their ability for rapid escape flight. Better visual mimics mayonly use behavioral mimicry when they perceive danger. There is ongoing work thatlooks at another aspect of flight mimicry in hoverflies: the flight trajectories ofbumblebees, which often have a particularly clumsy flight, and their hoverfly mimics,especially their movements in the vertical plane.
10.4 CONCLUSION
Like Driver and Humphries [37] in their seminal work on protean behavior, we makeno apology for having delved back into nineteenth and early twentieth centurydescriptions of mimicry and animal behavior. The reasons are obvious: Mimicry hasbeen known about for at least 150 years, and there were many early papers reportingmuch work, discussion, speculation, and argument about the subject. In the contextof this article, there are many observations by early entomologists, notably Bates,Carpenter, Poulton, and Shelford, that emphasized that behavior is just as importantas morphology for successful mimetic deception. However, as we have seen, manyaspects of mimicry, particularly those relating to behavior, have only been recordedas anecdotal observations and have remained largely unstudied on a quantitativebasis. Moreover, the interrelations between behavior, locomotion, and mimicry havebarely been addressed.
FIGURE 10.1 Typical flight trajectories between flowers of a wasp Vespula vulgaris and itspotential mimics: Serricomyia silentis, Helophilus pendulus, Syrphus ribesii, and Myathropaflorea. Flowers are approximately 10 cm apart, and the time between points is 0.04 sec.
V. Vulgaris S. Silentis H. Pendulus S. Ribesii M. Florea
3209_C010.fm Page 224 Thursday, November 10, 2005 10:47 AM

Biomechanics and Behavioral Mimicry in Insects 225
Of course quantifying behavior and movement is not particularly easy, but it issurprising that almost no attempt has been made to quantify the running and walkingmovements and gaits of Hymenoptera such as ants and wasps and their Batesianmimics from other insect orders. Because land locomotion is by its nature carriedout largely in two dimensions, filming and quantifying movement should presentlittle problem. Of the quantitative research that has been carried out on the morecomplex subject of flight in butterflies and hoverflies, analysis has largely beenconfined to examining flight in two dimensions. Complex three-dimensional move-ment has not been tackled because of its technical difficulty. Neither has much effortbeen put into examining the aerodynamic basis of flight mimicry. Closer examinationof the movements of the body and wings during maneuvers by mimetic and nonmi-metic insects would help to determine whether mimics show convergence to theirmodels in aerodynamics.
There are some fascinating examples of behavioral mimicry to study, so if anyoneis looking for a new line of research, there is plenty of scope!
REFERENCES
1. Bates, H.W., Contributions to an insect fauna of the Amazon Valley, Lepidoptera:Heliconidae, Trans. Linn. Soc. Lond., 23, 495, 1862.
2. Bates, H.W., Contributions to an insect fauna of the Amazon Valley, Coleoptera:Longicorns, Ann. Mag. Nat. Hist., 9, 446, 1862.
3. Edmunds, M., Defence in Animals, Longman, Harlow, 1974.4. Brower, J.V.Z., Experimental studies of mimicry IV. The reaction of starlings to
different proportions of models and mimics, Am. Nat., 94, 271, 1960.5. Edmunds, M., Why are there good and poor mimics? Biol. J. Linn. Soc., 70, 459, 2000.6. Pough, F.H., Mimicry of vertebrates: are the rules different? Am. Nat., 131, 67, 1988.7. Rettenmeyer, C.W., Insect mimicry, Ann. Rev. Ent., 15, 43, 1970.8. Weins, D., Mimicry in plants, Evol. Biol., 11, 365, 1978.9. Müller, F., A remarkable case of mimicry in butterflies, Proc. R. Ent. Soc. Lond.,
1879, 20, 1879.10. Brower, A.V.Z., Locomotor mimicry in butterflies? A critical review of the evidence,
Phil. Trans. R. Soc. Lond. B., 347, 413, 1995.11. Ritland, D.B., Revising a classic butterfly mimicry scenario: demonstration of Mül-
lerian mimicry between Florida viceroys (Limenitis archippus floridensis) and Floridaqueens (Danaus gilippus berenice), Evolution, 45, 918, 1991.
12. Fisher, R.A., The Genetical Theory of Natural Selection, Clarendon Press, Oxford,1930.
13. Wickler, W., Mimicry in Plants and Animals, World University Library, London,1968.
14. Pasteur, G., A classificatory review of mimicry systems, Ann. Rev. Ecol. Syst., 13,169, 1982.
15. Moulton, J.C., On some of the principal mimetic combinations of tropical Americanbutterflies, Trans. Ent. Soc. Lond., 1909, 585, 1909.
16. Shepherd, P.M., Genetics of mimicry, Proceedings of the XVI International Congressof Zoology, Natural History Press, Garden City, N.Y., 1963.
3209_C010.fm Page 225 Thursday, November 10, 2005 10:47 AM

226 Ecology and Biomechanics
17. Turner, J.R.G., Evolution of complex polymorphism and mimicry in distasteful SouthAmerican butterflies, Proc. Int. Congr. Ent., 12, 267, 1965.
18. Owen, D., Mimetic polymorphism and the palatability spectrum, Oikos, 21, 333,1970.
19. Smith, D.A.S. and Gordon, I.J., The genetics of the butterfly Hypolimnas misippus(L.) — The classification of phenotypes and the inheritance of forms misippus andinaria, Heredity, 59, 467, 1987.
20. Smith, D.A.S. et al., Genetics of the butterfly Danaus chrysippus (L.) in a broadhybrid zone, with special reference to sex ratio, polymorphism and intragenomicconflict, Biol. J. Linn. Soc., 65, 1, 1998.
21. Carpenter, G.D.H., Observations and experiments in Africa by the late C.F.M. Swyn-nerton; non-wild birds eating butterflies and the preference shown, Proc. Linn. Soc.Lond., 10, 1942.
22. Chai, P., Field observations and feeding experiments on the responses of rufous-tailedjacamars (Galbula ruficauda) to free-flying butterflies in a tropical rainforest, Biol.J. Linn. Soc., 29, 161, 1986.
23. Jeffords, M.R., Sternburg, J.G., and Waldbauer, G.B., Batesian mimicry: field dem-onstration of the survival value of pipevine swallowtail and monarch colour patterns,Evolution, 33, 275, 1979.
24. Robinson, G.S. and Carter, D.J., The first vespiforme tineid moth (Lepidoptera:Tineidae), Syst. Ent., 14, 259, 1989.
25. Heal, J.R., Colour patterns in Syrphidae II. Eristalis intricarius, Heredity, 43, 229,1979.
26. Heal, J.R., Colour patterns in Syrphidae III. Sexual dimorphism in Eristalis arbus-torum. Ecol. Ent. 6, 119, 1981.
27. Stubbs, A.E. and Falk, S.J., British Hoverflies, The British Entomological and NaturalHistory Society, London, 1983.
28. Howarth, B., Clee, C., and Edmunds, M., The mimicry between British Syrphidae(Diptera) and aculeate Hymenoptera, Br. J. Ent. Nat. Hist., 13, 1, 2000.
29. Walbauer, G.P., Asynchrony between Batesian mimics and their models, Am. Nat.,131, 103, 1988.
30. Howarth, B., and Edmunds, M., The phenology of Syrphidae (Diptera): are theyBatesian mimics of Hymenoptera? Biol. J. Linn. Soc., 71, 437, 2000.
31. Howarth, B., Edmunds, M. and Gilbert, F., Does the abundance of hoverfly mimics(Syrphidae) depend on the numbers of their hymenopteran models? Evolution, 58,367, 2004.
32. Mallet, J. and Gilbert, L.E., Why are there so many mimicry rings? Correlationsbetween habitat, behaviour and mimicry in Heliconius butterflies, Biol. J. Linn. Soc.,55, 59, 1995.
33. Beccaloni, G.W., Vertical stratification of ithomiine butterfly (Nymphalidae: Ithomi-inae) mimicry complexes: the relationship between adult flight height and larval host-plant height, Biol. J. Linn. Soc., 62, 3134, 1997.
34. Sherratt, T.N., Rashed, A., and Beatty, C.D., The evolution of locomotory behaviourin profitable and unprofitable simulated prey, Oecologia, 138, 143, 2004.
35. Carpenter, G.D.H. and Ford, E.B., Mimicry, Methuen, London, 1933.36. Humphries, D.A. and Driver, P.M., Erratic display as a device against predator,
Science, 156, 1767, 1967.37. Driver, P.M. and Humphries, D.A., Protean Behaviour: The Biology of Anarchization,
Clarendon Press, Oxford, 1988.
3209_C010.fm Page 226 Thursday, November 10, 2005 10:47 AM
Biomechanics and Behavioral Mimicry in Insects 227
38. Roeder, K.D. and Treat, A.E., The acoustic detection of bats by moths, Proc. 11thCong. Ent., 3, 1, 1960.
39. Marden, J.H. and Chai, P., Aerial predation and butterfly design: how palatability,mimicry and the need for evasive flight constrain mass allocation, Am. Nat., 138, 15,1991.
40. Srygley, R.B., Incorporating motion into investigations of mimicry, Evol. Ecol., 13,691, 1999.
41. Hespenheide, H.A., Novel mimicry complex — beetles and flies, J. Entomol. Ser. A,48, 49, 1973.
42. Gibson, D.O., Batesian mimicry without distastefulness, Nature, 250, 77, 1974.43. Gibson, D.O., The role of escape in mimicry and polymorphism 1. The response of
captive birds to artificial prey, Biol. J. Linn. Soc. 14, 201, 1980.44. Oliveira, P.S., Ant-mimicry in some Brazilian salticid and clubionid spiders (Araneae:
Salticidae; Clubionidae), Biol. J. Linn. Soc., 33, 1, 1988.45. Walbauer, G.P., Mimicry of hymenopteran antennae by Syrphidae, Psyche (Camb.
Mass.), 77, 45, 1970.46. Cott, H., Adaptive Colouration in Animals, Methuen, London, 1940.47. Carpenter, G.D.H. and Poulton, E.B., Mimicry, Methuen, London, 1902.48. Oliveira, P.S., On the mimetic association between nymphs of Hyalymenus spp.
(Hemiptera, Alydidae) and ants, Zool. J. Linn. Soc., 83, 371, 1985.49. Reiskind, J., Ant-mimicry in Panamanian clubionid and salticid spiders (Araneae —
Clubionidae, Salticidae), Biotropica, 9, 1, 1977.50. Cushing, P.E., Myrmecomorphy and mymmecophily in spiders: a review, Fla. Ento-
mol., 80, 165, 1997.51. McIver, J.D. and Stonedahl, G. Myrmecomorphy — morphological and behavioural
mimicry of ants, Annu. Rev. Entomol., 38, 351, 1993.52. Linsley, E.G., Eisner, T., and Klots, A.B., Mimetic assemblages of sibling species of
lycid beetles, Evolution, 15, 15, 1961.53. Golding, Y.C. and Edmunds, M., Behavioural mimicry of honeybees (Apis mellifera)
by droneflies (Diptera: Syrphidae: Eristalis spp.), Proc. R. Soc. Lond. B., 267, 903,2000.
54. Golding, Y.C., Ennos, A.R., and Edmunds, M., Similarity in flight behaviour betweenthe honeybee Apis mellifera (Hymenoptera: Apidae) and its presumed mimic, thedronefly Eristalis tenax (Diptera: Syrphidae), J. Exp. Biol., 204, 139, 2001.
55. Dudley, R., The Biomechanics of Insect Flight, Princeton University Press, Princeton,2000.
56. Taylor, G.K., Mechanics and aerodynamics of insect flight control, Biol. Rev., 76,449, 2001.
57. Land, M.F., Motion and vision: why animals move their eyes, J. Comp. Physiol. A.,185, 341, 1999.
58. Opler, P.A., Polymorphic mimicry of polistine wasps by a neotropical neuropteran,Biotropica, 13, 165, 1981.
59. Dressler, R.L., Eulaema bombiformis, E. meriana, and Müllerian mimicry in relatedspecies (Hymenoptera, Apidae), Biotropica, 11, 144, 1979.
60. Silbergleid, R.E. and Eisner, T.E., Mimicry of hymenoptera by beetles with uncon-ventional flight, Science, 163, 486, 1969.
61. Kassarov, L., Are birds the primary selective force leading to evolution of mimicryand aposematism in butterflies? An opposing point of view, Behaviour, 140, 433, 2003.
62. Srygley, R.B. and Ellington, C.P., Discrimination of flying mimetic, passion-vinebutterflies Heliconius, Proc. R. Soc. Lond. B., 266, 2137, 1999.
3209_C010.fm Page 227 Thursday, November 10, 2005 10:47 AM

228 Ecology and Biomechanics
63. Cuthill, I.C. and Bennett, A.T.D., Mimicry in the eye of the beholder, Proc. R. Soc.Lond. B., 253, 203, 1993.
64. Chai, P. and Srygley, R., Predation and the flight, morphology, and temperature ofneotropical rain-forest butterflies, Am. Nat., 135, 748, 1990.
65. Srygley, R.B. and Chai, P., Flight morphology of neotropical butterflies: palatabilityand distribution of mass to the thorax and abdomen, Oecologia, 84, 491, 1990.
66. Srygley, R.B. and Dudley, R.T., Correlations of the position of center of body masswith butterfly escape tactics, J. Exp. Biol., 174, 155, 1993.
67. Srygley, R.B., The aerodynamic costs of warning signals in palatable mimetic but-terflies and their distasteful models, Proc. R. Soc. Lond. B., 271, 589, 2004.
68. Ellington, C.P., The aerodynamics of hovering insect flight, Phil. Trans. R. Soc. Lond.B., 305, 1, 1984.
69. Srygley, R.B. and Thomas A.L.R., Unconventional lift-generating mechanisms infree-flying butterflies, Nature, 420, 660, 2002.
70. Srygley, R.B., Locomotor mimicry in butterflies? The associations of positions ofcentre of mass among groups of mimetic, unprofitable prey, Phil. Trans. R. Soc. Lond.B., 343, 145, 1994.
71. Wallace, A.R., On the phenomena of variation and geographical distribution as illus-trated by the Papilionidae of the Malayan region, Trans. Linn Soc. Lond., 24, 1, 1865.
72. Marden, J.H. and Chai, P., Aerial predation and butterfly design — how palatability,mimicry, and the need for evasive flight constrain mass allocation, Am. Nat. 138, 15,1991.
73. Ohsaki, N., Preferential predation of female butterflies and the evolution of Batesianmimicry, Nature, 378, 173, 1995.
74. Srygley, R.B., Locomotor mimicry in Heliconius butterflies: contrast analyses of flightmorphology and kinemetics, Phil. Trans. R. Soc. Lond. B, 354, 203, 1999.
75. Srygley, R.B. and Ellington, C.P., Estimating the relative fitness of local adaptivepeaks: the aerodynamic costs of flight in mimetic passion-vine butterflies Heliconius,Proc. R. Soc. Lond. B., 266, 2239, 1999.
76. Srygley, R.B. and Ellington, C.P., Discrimination of flying mimetic, passion-vinebutterflies Heliconius, R. Soc. Lond. B., 266, 2137, 1999.
77. Maier, C.T., Evolution of Batesian mimicry in the Syrphidae (Diptera) J. N.Y. Ento-mol. S. 86, 307, 1978.
78. Dlusski, G.M., Are dipteran insects protected by their similarity to stingingHymenoptera? Bull. Mosk. O-Va Ispytatelei Otd Biol., 89, 25, 1984.
79. Howarth, B., An ecological study of Batesian mimicry in the British Syrphidae(Diptera), Ph.D. Thesis, University of Central Lancashire, 1988.
80. Azmeh, S., Mimicry in the hoverflies, Ph.D. Thesis, University of Nottingham, 1999.81. Morgan, K.R. and Heinrich, B., Temperature regulation in bee- and wasp-mimicking
syrphid flies, J. Exp. Biol., 133, 59, 1987.82. Ennos, A.R., A comparative study of the flight mechanism of Diptera, J. Exp. Biol.,
127, 355, 1987.83. Ennos, A.R., The importance of torsion in the design of insect wings, J. Exp. Biol.,
140, 137, 1988.84. Ennos, A.R., The kinematics and aerodynamics of free flight of some Diptera, J. Exp.
Biol., 142, 49, 1989.85. Collett, T.S. and Land, M.F., Visual spatial memory in a hoverfly, J. Comp. Physiol.,
100, 59, 1975.86. Collett, T.S. and Land, M.F., How hoverflies compute interception courses, J. Comp.
Physiol., 125, 191, 1978.
3209_C010.fm Page 228 Thursday, November 10, 2005 10:47 AM

Biomechanics and Behavioral Mimicry in Insects 229
87. Wootton, R.J., Leading edge section and asymmetric twisting in the wings of flyingbutterflies (Insecta, Papilionoidea), J. Exp. Biol., 180, 105, 1993.
88. Unwin, D.M. and Corbet, S.A., Wingbeat frequency, temperature and body size inbees and flies, Physiol. Ent., 9, 115, 1984.
89. Frisch, K. von, The Language and Orientation of Bees, Clarendon Press, Oxford,1967.
3209_C010.fm Page 229 Thursday, November 10, 2005 10:47 AM


231
11 Interindividual Variation in the Muscle Physiology of Vertebrate Ectotherms: Consequences for Behavioral and Ecological Performance
Carlos A. Navas, Rob S. James, and Robbie S. Wilson
CONTENTS
11.1 Introduction ..................................................................................................23111.2 Evolutionary Implications of Individual Variation in Behavioral
Performance and Muscle Physiology ..........................................................23211.3 Scaling Effects on Vertebrate Ectotherm Muscle and Whole Body
Performance .................................................................................................23511.4 Relationships between Muscle Specialization and the Individual
Behavioral Performance of Vertebrate Ectotherms .....................................23811.5 Tradeoffs in Whole-Muscle Function and Its Ecological Importance........24011.6 Conclusions ..................................................................................................242References..............................................................................................................245
11.1 INTRODUCTION
The aim of this review is to promote the study of interindividual variation in theskeletal muscle of vertebrate ectotherms as a promising field of research integratingquestions in evolution, ecology, behavior, and muscle function — levels of organi-zation that are often addressed independently. To fulfill our goal, we offer an evo-lutionary background that illustrates the relevance of studies of individual variabilityin behavioral performance in the context of evolutionary physiology. Then, we focuson some of the best-studied examples of behavioral performance and relate this
3209_C011.fm Page 231 Thursday, November 10, 2005 10:48 AM

232 Ecology and Biomechanics
variability to underlying physiological factors, mainly morphology, muscle size, andmechanics, discussing in parallel the ecological consequences of such variation.
Most of our discussion addresses the measures of performance that are morefrequently treated in the literature because of apparent ecological relevance, includ-ing sprint speed, power production, force production, efficiency, stamina (measuredas either time before exhaustion or distance capacity), and maneuverability. Forinstance, many species of fish [1,2] and lizards [3,4] rely on fast bursts of activityto avoid predators, and faster lizards exhibit greater social dominance [5]. Theefficiency of conversion of metabolic energy into locomotion has been consideredfundamental in the evolution of the muscle traits of vertebrates [6] and may be animportant factor modulating the evolution of locomotor physiology and behavior ofvertebrate ectotherms. Force and power production are crucial to vertebrate ecto-therms during a variety of behaviors, with power production being notably importantfor the jumping performance of anuran amphibians [7,8]. Force production in theforearms of male anurans is important for both holding females and avoiding take-overs by competitor males [9]. Maneuverability has also been considered a keyaspect in antipredator behaviors of fish [1] and larval anurans [10,11], perhaps moreimportant than sprint speed or endurance in at least some specific ecological settings.
Stamina is highly relevant for certain vertebrate ectotherms, such as juvenileBufo during their dispersion phase [12] or male anurans where chorus tenure is afactor in mating success [13]. However, stamina might not be the primary factormodulating the evolution of exercise physiology in some vertebrate ectotherms suchas small heliothermic lizards, in which intermittent locomotion further prolongs theability of individuals to sustain locomotor activity [14]. Although some lizard taxa,such as the genera Varanus or Cnemidophorous, exhibit particularly high runningendurance [15,16], phylogenetic analyses across lizard clades do not indicate unam-biguous evolutionary shifts regarding running endurance [15]. Also, social domi-nance, an ecological factor that is clearly related to differences among individuallizards, does not relate to endurance in Sceloporus occidentalis [5].
11.2 EVOLUTIONARY IMPLICATIONS OF INDIVIDUAL VARIATION IN BEHAVIORAL PERFORMANCE AND MUSCLE PHYSIOLOGY
Whether the behavioral performance* of vertebrate ectotherms relates to underlyingphysiological characteristics and adaptive consequences has been a central questionin evolutionary physiology. From the range of performance measures that may beinvestigated, studies of locomotor performance have offered particular insight intothese questions. The evolution of specific traits underlying locomotor performancemay occur during historical ecological transitions and are thus likely to have adaptiveconsequences. For example, phylogenetic comparative approaches were initiallyused to provide evidence for adaptive differences in locomotor performance among
* Behavioral performance admittedly involves more than active behaviors, but in this chapter we restrictthe term to the quantifiable maximum performance of animals during active behaviors that involve theproduction of mechanical force by skeletal muscle.
3209_C011.fm Page 232 Thursday, November 10, 2005 10:48 AM

Interindividual Variation in Muscle Physiology 233
lizard species [16,17]. These early patterns have been confirmed by more recentstudies focusing simultaneously on sprint performance and muscle physiology. Inthe family Phrynosomatidae, which encompasses the genus Sceloporus, sand lizards(Uta and related lizards), and horned lizards (Phrynosoma and related lizards), sandlizards are the fastest in the clade and have comparatively faster glycolytic fibers[18]. Similarly, in the lizard genus Tropidurus, the sand dune endemic species T.psamonastes exhibits higher sprint speeds on sand and a higher proportion of gly-colytic fibers than the sister species T. itambere, which is endemic to rocky outcrops[19]. Convergent evolution of performance traits suggesting adaptive trends havebeen reported in other taxa of ectothermic vertebrates, including the muscle designof unrelated fish taxa that are ecologically similar [20,21] or the peculiar ability ofunrelated high-elevation tropical anurans to be active at low temperatures [22].
Given the observed and presumably adaptive variation in behavioral performanceand muscle physiology among species, questions arise concerning the relationshipsbetween this higher-level variation and variation among individuals within a popu-lation. This is a central issue in evolutionary physiology because adaptive shifts inthe behavioral performance traits of vertebrates are believed to begin within popu-lations and have three requirements: (1) significant repeatable variation amongindividuals, (2) heritability of the trait, and (3) variation in the trait influencing thesurvival or reproductive success of the individual (i.e., fitness) [23,24]. Testing theset of requirements for the evolution of a physiological performance trait is achallenging enterprise, so most of the data available are fragmented (see next para-graph). Not all reported interindividual variation in performance is both repeatableand has a heritable basis. For example, nonheritable variation may result from healthor reproductive state. Interindividual variation due to ontogenetic development mightalso be difficult to analyze in this context, particularly in amphibians, because itmight involve heritable and environmentally induced variation. Metamorphosisinvolves dramatic morphological transitions, and behavioral performance ranksbefore and after metamorphosis may not be maintained [25,26]. Studies using adultindividual vertebrate ectotherms in similar conditions of health, reproductive state,and season would be ideal to address the question of whether reproducible variabilityexists within populations.
Moving to the second postulate, the heritability of performance traits is assumedgiven interspecific adaptive trends, but direct evidence and attempts at quantificationare scarce. Metabolic rates during intense exercise [24], sprint speed and endurancein lizards [27], as well as various other metabolic traits related to performance andexercise physiology, are at least partially heritable and respond to artificial selectionin the laboratory [28,29]. Finally, and regarding the relationship between behavioralperformance and fitness, faster garter snakes have more chance of survival thanslower counterparts [30], and lizard hatchling survival is positively correlated withbody size, sprint speed, and stride length, but negatively correlated with growth rate[4,31]. In amphibians, phenotypic plasticity in larval forms leads to deeper tails inenvironments with odonate larvae, and these morphs have increased chances ofsurvival [32], partially due to increased swimming speed [33] but perhaps moreimportantly due to the deflection of attacks away from the vulnerable head regionto the tail [32].
3209_C011.fm Page 233 Thursday, November 10, 2005 10:48 AM

234 Ecology and Biomechanics
The occurrence of reproducible individual variation in the behavioral perfor-mance of vertebrates has been well documented in lizards, fish, and amphibians[26,34–39], although this literature encompasses two different approaches to thequestion. On the one hand, some researchers focus on what animals do under naturalconditions, testing the reproducibility of behavioral performances in undisturbedanimals. However, behavioral performance in nature might vary among individualsindependently of their capacity to produce force of work. A cleaner link betweenbehavior and physiology would be expected when attempts are made to elicit themaximal performance in an individual. Maximal performance is more likely to beaffected by body size (see Section 11.3), as clearly illustrated in the jumping per-formance of anuran amphibians [40–43] either via effects on whole body mechanicsor on muscle performance [41,44]. Interindividual differences in maximum perfor-mance may also be related to body shape and morphometric traits such as relativehind limb length and relative tail length, as shown for the locomotor performanceof hatchling lizards [27]. In the iguanid lizard Ctenosaura similes, running enduranceis mass dependent and related to relative differences in organ mass, particularlythigh muscle mass [45], and compatible findings have been reported for salamanders[46]. In the tree-frog Hyla multilineata, a significant amount of variance in maximumjump distance among individuals is related to a combination of factors, includingthe metabolic profile and mass of the plantaris muscle and total hind limb musclemass [47].
Most of the information available regarding interindividual variation in thenatural behaviors of vertebrate ectotherms comes from studies with amphibians.Both discrete and continuous behavioral diversity have been reported within popu-lations of salamanders [48] and frogs [49], showing, for example, consistent variationamong individuals in antipredator behaviors that might depend only partially or notat all on body size. For most anurans, females select males as reproductive partnersbased on call structure and intensity [50,51]. However, individuals of some speciesare silent “satellite males” that do not call but attempt to grasp females on their wayto a calling male [51]. The relationship between this sort of interindividual variationin behavioral strategies and variation in physiological traits, particularly musclephysiology, has been poorly studied, and the data available do not point to a simplepattern. For the North American spring peepers (Pseudacris crucifer), persistentcalling is considered fundamental for the ability of males to obtain copulations [52];however, both satellite and calling males coexist within populations. Analyses of themuscle aerobic capacity of satellite males indicate that they are not physiologicallyinferior to calling males, suggesting these alternative mating strategies are notnecessarily related to physiological potential [53]. Similarly, individual Bufo toadsdiffer in their number of attempts to clasp females, but this does not appear to berelated to the metabolic physiology of individuals [54]. Interindividual differencesin behavior have been reported in various species of male anurans, for exampleregarding the extent to which calling activity decreases through the night or the timeof night at which animals retreat [55], but differences of this sort seem unrelated toan eventual depletion of muscle glycogen reserves [56,57]. These papers, althoughfocused on specific physiological traits, suggest that natural behavioral variationamong individuals might occur in the absence of concomitant physiological
3209_C011.fm Page 234 Thursday, November 10, 2005 10:48 AM

Interindividual Variation in Muscle Physiology 235
differentiation. In contrast, clear consistency between behavior and physiology existin Scinax hiemalis, a tree-frog that when threatened in the field chooses betweenfeigning death, remaining immobile, or jumping away. In the laboratory, behavioralresponses when faced with sudden disturbance are associated with both body sizeand absolute ability of individuals to jump, a trait probably associated with themuscle physiology of individuals [49].
11.3 SCALING EFFECTS ON VERTEBRATE ECTOTHERM MUSCLE AND WHOLE BODY PERFORMANCE
As discussed in Section 11.2, body size has a large effect on the physiology andlocomotor performance of animals; therefore, it is important to elucidate the extentto which body size accounts for interindividual differences in behavioral and under-lying muscle performance. However, in many such scaling relationships, there is alarge amount of scatter, suggesting that mass-independent differences in behavioralperformance are also important in evolutionary physiology.
Generally, as animal size increases, skeletal muscle shortening velocity andcontraction kinetics become slower, a pattern confirmed in both interspecific andinterindividual studies. Interindividual studies within anuran [41,44,46], lizard[58,59], and fish [2,60] species have highlighted that as body size increases, thereare usually decreases in temporal traits of muscle functions, including relative muscleshortening velocity and twitch activation and relaxation rates, i.e., muscle in smallerindividuals of a species will tend to produce force quicker, shorten relatively faster,and relax quicker. In contrast, maximum isometric muscle stress and normalizedpower output are generally unaffected by body size [41,44,46,58,60]. Bodysize–dependent changes in the mechanical properties of skeletal muscle have insome cases been linked to underlying muscle structure and/or fiber type (see Section11.4) and are paralleled by compatible alterations in locomotor performance, withsmaller individuals often being relatively as fast or even faster (i.e., when speed isexpressed relative to body size). Body size is likely to be a confounding factor whencomparing the performance of ectothermic individuals because when analogousmuscles are compared in endotherms, those from larger animals have an increasedproportion of slow myosin and lower maximal shortening velocity (Vmax) within thesame fiber type [61]. Indeed 78% of the interspecific variability in Vmax of musclestaken from a range of endotherms and ectotherms can be explained by variation inbody size [62]. Among species of terrestrial animals (including endotherms andectotherms), there is a significant correlation between maximal shortening velocityand maximal stress (P0) in skeletal muscle [62] with muscles that have relativelyhigh Vmax also having, although to a lesser extent, relatively higher P0.
In general, larger individuals within fish, salamander, and lizard species areconstrained to comparatively lower stride and tail-beat frequencies, thus, achievinghigher absolute locomotory speeds (because of their greater body size) but lowerrelative (length-specific) locomotory speeds [46,58,63,64]. Also, smaller individualshave higher rates of acceleration during jumping [42,65] and swimming [66]. How-ever, it is apparent in aquatic vertebrates that as body size increases, maneuverability
3209_C011.fm Page 235 Thursday, November 10, 2005 10:48 AM

236 Ecology and Biomechanics
decreases [63,66], with larger individuals turning more slowly and through greaterangles. Therefore, larger animal species and individuals can sometimes be at adisadvantage when trying to catch smaller but more maneuverable species andindividuals. Some species of large aquatic vertebrates (e.g., killer whales) havecountered this problem by developing means of prey capture that maximize accel-eration of part of the predator’s body (e.g., tail slaps) rather than relying on wholebody acceleration [66]. Body size also affects maneuverability during running interrestrial vertebrates, which apparently affects predator prey choice and tactics usedduring prey capture [67].
A number of integrative studies have attempted to determine body size effectson both muscle contractile properties and locomotory performance. Muscle twitchduration has been used to predict minimum tail-beat frequency in fish, which in turnwas used to calculate maximum swimming speed [2]. Larger fish had slower musclemechanical properties that led to slower (i.e., constrained) tail-beat frequency, whichin turn limited swimming speed. During sprinting in the lizard Dipsosaurus dorsalis,the decrease in stride frequency with body size was matched by an increase in twitchtimes in fast glycolytic muscle fibers, whereas increases in stride length were relatedto increased hindlimb length [59] (Figure 11.1). The slope of scaling relationshipswas identical in D. dorsalis for both limb cycle frequency during sprinting andoptimal cycle frequency for maximal muscle power output, further supporting thenotion that muscle fiber type is matched to locomotor performance in this species[68]. At lower temperatures in this lizard species, the cycle frequency for maximalmuscle power matches the stride frequency used [69], i.e., the muscle in smallerindividuals tends to cycle at a faster rate (frequency) with faster activation, short-ening, and relaxation rates tending to enable higher stride frequencies by minimizingthe ground contact time [70,71]. The higher stride frequencies in smaller individualsare vital to enable them to achieve the same, or similar, sprint velocity as largerindividuals of the same species [59]. In contrast, larger individuals within a specieshave slower, more economical muscle fibers optimized to work at lower limb cyclefrequency during sprinting, yet still achieve the same sprint speed because of theirlonger limb length (but see Ref. [70] for a full discussion on lower stride frequencyin larger lizards).
Optimal cycle frequency for maximal muscle work loop-power output decreaseswith increasing body size [44,58,72]. Altringham and co-workers [44] have shownthat interindividual variation in the optimal cycle frequency for work loop-poweroutput in Xenopus muscle fiber bundles is more dependent on body size in slowermuscle fibers (from adductor magnus) than in faster muscle fibers (from sartorius),with scaling exponents of Mb
0.23 and Mb0.07, respectively. It has been argued that in
faster muscles and muscle fiber bundles, contractile speed decreases less dramaticallywith body size as animals attempt to maximize speed and power available for escaperesponses [44]. In contrast, in slower muscle and muscle fibers, rapid muscle short-ening velocity or deactivation rate is not as crucial to organismal performance;therefore, large energetic savings can be made by decreasing these variables, hence,the relatively high scaling exponent [71].
Despite the general patterns of body size–related changes in locomotory perfor-mance, the effect of body size can vary between species. Within some species of
3209_C011.fm Page 236 Thursday, November 10, 2005 10:48 AM

Interindividual Variation in Muscle Physiology 237
Anolis lizard, maximum acceleration and distance achieved during jumpingincreased with hindlimb length, yet within other species the relationship betweenperformance and hindlimb length was negative [73].
FIGURE 11.1 (A) Stride length, (B) stride frequency, and (C) running velocity as functionsof body mass during sprint runs with a body temperature of 35°C in the lizard Dipsosaurusdorsalis. Data are plotted on log–log coordinates. Solid lines represent regression lines. (FromMarsh, R.L., J. Exp. Biol., 137, 119, 1988, with permission.)
0.5
0.4
0.3
0.2
A
B
C
0.1
Strid
e le
ngth
(m)
Strid
e fr
eque
ncy
(s–1
)
24
22
18
14
10
8
Velo
city
(ms–1
)
8765
4
3
2
4 6 10Body mass (g)
20 40 60 100
3209_C011.fm Page 237 Thursday, November 10, 2005 10:48 AM

238 Ecology and Biomechanics
11.4 RELATIONSHIPS BETWEEN MUSCLE SPECIALIZATION AND THE INDIVIDUAL BEHAVIORAL PERFORMANCE OF VERTEBRATE ECTOTHERMS
As mentioned in the introduction to the present chapter, within the context ofvertebrate ectotherms, sprint speed has been more frequently studied and seems ofparticular ecological relevance in lizards and fish. Speed during burst running andswimming is dependent on stride length and stride frequency. Stride length in lizardsis dependent on limb length and gait whereas stride frequency is dependent onskeletal muscle having rapid activation, high shortening velocity, and fast relaxation.It has been demonstrated that Lacertid species living in more open environmentstend to have longer limbs and actually modulate their sprint speed by altering theirstride length, and consequently the range of motion of their muscles [74]. In contrast,those species that live in more closed environments (where more vegetation is presentto restrict locomotion) have shorter limbs and alter their speed by changing theirstride frequency (therefore, altering muscle cycle frequency) [74].
The relationship between sprint speed and muscle activation rate, relaxation rate,and shortening velocity suggests a connection between individual differences inperformance and muscle molecular traits. This is because any muscle with rapidactivation and relaxation must rely on rapid release and reuptake of calcium, respec-tively. Rapid relaxation is correlated with greater parvalbumin content in skeletalmuscle [75] but comes at a high energetic cost because it requires rapid calciumpumping and fast cycling cross-bridges, two processes that require ATP consumption[76]. Rapid activation and relaxation can also require an increased proportion of themuscle to be devoted to the sarcoplasmic reticulum (SR) t-tubule system to decreasediffusion distances between this system and the thin filaments [77]. Therefore, anymuscle that cycles at very high frequencies has a disproportionately large volumeof SR. Increased SR volume leads to a proportional decrease in the space availablefor the contractile filaments, causing muscles that cycle at very high frequency, suchas rattlesnake tailshaker and toadfish swimbladder muscles, to produce relativelylow force per unit cross-sectional area [76,77]. Higher levels of SR calcium ATPaseactivity and SR calcium uptake (i.e., two other SR indicators of contractile speed)in sprint-trained horses have been linked with improved sprint performance [78].Therefore, as has previously been suggested for lizards running at suboptimal tem-peratures [69], the rate of muscle activation and relaxation can limit sprint perfor-mance, because muscles used during sprinting need high power output. Given thatboth muscle power production and activation and relaxation rates can in some casesaffect sprint speed, and that morphological tradeoffs might constrain the maximiza-tion of both (see Section 11.5), it is possible that various muscle configurationsmight, for different reasons, lead to similar sprint speeds among individuals.
Maximal shortening velocity (Vmax) of muscle within a species is primarilydependent on the myosin heavy chain isoforms expressed within the muscle, withsignificant differences in Vmax existing between fiber types [79]. Other sources ofvariation in the maximum shortening velocity of muscle may include variation inmyosin light chains, troponin, tropomyosin, and various calcium regulatory proteins
3209_C011.fm Page 238 Thursday, November 10, 2005 10:48 AM

Interindividual Variation in Muscle Physiology 239
[80,81]. In Xenopus laevis, maximal stress, maximal shortening velocity, and max-imal power output vary in the same manner between muscle fiber types decreasingfrom type 1 to type 2 to type 3 to type 4 to tonic [79]. Higher muscle force in bothectotherms and endotherms is thought to be primarily due to relatively highermyofibrillar volume [77].
Muscle architecture can be varied to match the task performed. Evidence fromhuman limb muscles suggests that muscles with a higher pennation angle shouldproduce relatively higher forces (because of a larger physiological cross-sectionalarea) and may produce greater force at any muscle-shortening velocity (because oflower fiber-shortening velocity) when compared with more parallel fibered muscles[82]. However, muscles that are less pennate are better suited to larger length changes,with the result that antigravity extensor muscles are more pennate and flexor musclesare more parallel fibered. It is possible that interindividual variability in musclearchitecture may occur leading to changes in muscle size, muscle pennation, and theposition of the origin and insertion of muscles such as have been found betweenspecies. For example, projectile theory suggests that jumping performance could bealtered by changing: (1) hindlimb length to affect the distance or time period overwhich the propulsive force acts; (2) hindlimb jumping muscle size to alter the poweravailable for propulsion; and (3) moving the position of the origins or insertions ofthe jumping muscles to alter the angular velocity of the limbs [83]. Within a givenclade, jumping specialists usually have longer hindlimbs [40,43,65,84] and moreenlarged hindlimb musculature, across or within species [65], or across species [40].One notable example of muscle specialization is evidenced in the longissimus dorsimuscle of amphisbaenians, which provides the high forces required for digging. Inthe amphisbaenid species Leposternon microcephalum, this muscle is highly pennate(to increase the physiological cross-sectional area and hence force) and overall hasfast moderately oxidative muscle fibers. Subtle biochemical changes along the lon-gitudinal axes suggest higher glycolytic capacity in the distal fibers that seemsspecialized to match the function of this section of the muscle and perhaps enhanceforce toward the end of the digging strokes, when greater forces are required [85].
Skeletal muscle can perform many different tasks during animal behavior,acting to rapidly produce high power output, produce power efficiently over longperiods, produce high force for long periods, produce force isometrically to stabi-lize a limb, transmit force, or absorb power to act as a brake [86]. Essentially themechanical properties of muscle are determined by their composition, which inturn reflects tradeoffs between the differing tasks performed by the muscle [77].In mammalian muscles, the fiber type of a muscle has been correlated to its dailyactivity patterns [87].
In many animals, including fish, frogs, and lizards, different muscles maycontain different proportions of fiber type, and within muscles, fiber types areseparated into distinct regions. The mechanical properties of the different musclesand fiber types and the proportions of different fiber types within muscles matchthe force and power output required by their different functions [79,88,89]. Forexample, in Rana pipiens, the hindlimb muscles primarily used to power jumping(89%) consist of the fastest, most powerful, type-1 muscle fibers, which shouldmaximize burst jumping performance to enable rapid escape from predators [90].
3209_C011.fm Page 239 Thursday, November 10, 2005 10:48 AM

240 Ecology and Biomechanics
In contrast, hindlimb muscles not used to power jumping are composed of far fewer(29%) type-1 muscle fibers.
Skeletal muscle is also involved in sound production, which is a highly special-ized activity. The trunk muscles that support calling in males of many species of frogand some other vertebrate ectotherms are highly aerobic and cycle continuously overmany hours a day during the mating season [13]. This behavior relates to the matingsuccess of males, which in many species is highly dependent on energeticallydemanding vocal displays involved in female attraction and male-to-male interactions[51]. Males able to produce the most energetic calls are often more attractive tofemales [91]. The structure of trunk muscles reflects both the aerobic nature and highcycle frequency requirements of the behavior they support, including 100% fastoxidative glycolytic fibers [92], high citrate synthase activity [93], and high densitiesof mitochondria and capillaries [94]. Differences in calling rate between species havebeen linked to differences in mechanical properties of calling muscles [92].
The amplexus behavior of male anurans requires the forearms of the male to bemaintained in a relatively fixed position for long periods to hold the female duringbreeding. The forearm muscles involved in this behavior can produce high, sustainedisometric force (Navas and James, unpublished results) [9]. These sustained forcescan even be maintained via only short periods of electrical activation because ofvery slow muscle relaxation rates. These mechanical requirements are only neededby the males, and indeed, there is marked sexual dimorphism as evidenced bymuscular hypertrophy [9] and increased proportion of tonic fibers in males [95].Reproductively successful toads in the species Bufo marinus (those found inamplexus) had significantly larger forelimb muscle mass (when corrected for bodysize) than those calling males not found in amplexus [96]. Therefore, these musclesseem well adapted and vital for their role in producing high forces to successfullygrip the female during amplexus but would, for instance, be of limited use duringcyclic locomotion due to the prolonged relaxation times.
11.5 TRADEOFFS IN WHOLE-MUSCLE FUNCTION AND ITS ECOLOGICAL IMPORTANCE
Performance tradeoffs represent constraints on the direction of adaptive physiolog-ical evolution and therefore are fundamental for understanding the widespreadoccurrence of individual variation in physiological traits. Identification of thephysiological mechanisms underlying constraints on vertebrate physical perfor-mance are an important research objective for evolutionary-minded functional biol-ogists. Functional constraints can occur from negative interactions between pairs ofecologically relevant performance traits. For example, one of the most intuitivetradeoffs in muscle performance is between sprint (high power output) and endurance(high fatigue resistance) activities, which arise via differential expression of fast andslow muscle fiber types that maximize these differing activities [97]. As a conse-quence, increases in the performance of one task can lead to decreases in theperformance of another, with the net result a compromised phenotype that is optimalfor neither task. The existence and mechanistic basis of functional tradeoffs can be
3209_C011.fm Page 240 Thursday, November 10, 2005 10:48 AM

Interindividual Variation in Muscle Physiology 241
studied in a variety of ways, including optimality models, quantitative genetic analy-ses, interindividual analyses, and interspecific comparisons. The vertebrate locomo-tor system must often perform a variety of activities that are often antagonistic intheir requirements (see Section 11.4), and as a consequence, it has been used as amodel system for examining performance tradeoffs.
In parallel with the previous discussion on muscle specialization (see Section11.4), the study of functional performance tradeoffs was first addressed within thecontext of interspecific comparisons, which have been very successful at identifyingthe range of possible functional tradeoffs that can limit the evolution of vertebratephysical performance. These studies have also recently been complemented withseveral interspecific comparative analyses within a phylogenetic context [74,98,99]and comparative studies of different breeds of domesticated animals [100]. Forexample, by comparing two dog breeds (greyhound and pit bulls) that have experi-enced intense artificial selection for certain physical attributes, Pasi and Carrier [100]investigated the functional tradeoffs that prevent the simultaneous optimization ofboth running performance and physical fighting. The same authors found that pitbulls possessed greater muscle mass distally in their limbs, larger muscles in theirforelimbs than their hindlimbs, and a lower capacity for elastic energy storage intheir ankle joint tendons than greyhounds [100]. Thus, physical attributes that wereassociated with fighting were antagonistic to running performance and thus couldnot have evolved simultaneously.
Regarding interindividual variation, most analyses of locomotor tradeoffs havebeen conducted using analyses of whole-animal performance. Somewhat surpris-ingly, most of these analyses have not detected the existence of functional tradeoffsin locomotor performance, despite the logical underlying basis of these physiologicaltradeoffs. For example, although a tradeoff between speed and endurance capacityis predicted based on individual differences in the proportions of fast, powerful fibersand slow, more fatigue-resistant fibers, when tested at the whole-animal level, moststudies have found no evidence for this performance tradeoff [27,35,101–105].However, recent studies on human decathletes have argued that such interindividualcomparisons are complicated by the masking effects of variation in general physicalquality [106]. This often prevents the detection of functional tradeoffs in performancedespite their probable importance within each individual and their influence on thedirections of adaptive evolutionary change.
Although previous inter- and intraspecific comparative studies have been suc-cessful at identifying the possible functional constraints operating on the vertebratelocomotor system, they have not allowed detailed analyses of the mechanistic basesof these hypothesized tradeoffs. Studies of performance tradeoffs at the level of thewhole muscle allow direct investigations of the importance of functional tradeoffsat the level at which they are presumed to operate, and they help in understandinghow some of these constraints might be overridden by processes occurring at higherlevels of organization, so as to be obscured in the context of interindividual studies.Few studies have tested the extent of performance tradeoffs in whole-muscle per-formance. Interindividual analyses of muscle physiology can determine both whetherfunctional tradeoffs can be detected in whole muscle and the magnitude of anypossible performance tradeoffs. Based on comparisons of different isolated muscle
3209_C011.fm Page 241 Thursday, November 10, 2005 10:48 AM

242 Ecology and Biomechanics
fiber types, we know that variation in the specific force- and velocity-dependentproperties as well as the mechanical power production capabilities of a muscle arerelated to the specific muscle fiber type and the proportion of certain myosin isoformsexpressed within the fibers (see Section 11.4). A recent comparative analysis of 11different species of Phrynosomatid lizards [18] also showed that the percentage offast oxidative glycolytic muscle fibers was negatively correlated with the percentageof fast glycolytic fibers. Several recent studies have also directly investigated theextent of functional tradeoffs in whole-muscle performance by using the work-looptechnique to analyze the contractile properties of isolated skeletal muscle[105,107,108].
Using interindividual analyses of whole-muscle performance, tradeoffs betweenmaximum power output and fatigue resistance were detected in both isolated mouseand frog muscle [105,107,108]. Despite the lack of a detectable tradeoff betweenspeed and endurance in whole-animal performance of the frog Xenopus laevis, aclear tradeoff between power and fatigue resistance was still found in peroneusmuscle [105]. Interindividual analyses of whole gastrocnemius muscle performanceof the toad Bufo viridus demonstrated tradeoffs between fatigue resistance and bothmaximum power output and stress of the muscle [108] (Figures 11.2A and 11.2B).In addition, this correlative analysis showed a significant positive relationshipbetween power output and maximum stress [108]. Thus, increases in maximumstress of an individual muscle leads to simultaneous increases in maximum poweroutput (Figure 11.2C) and decreases in fatigue resistance [108]. Surprisingly, nosignificant correlations were detected between whole muscle performance of B.viridus and muscle fiber type composition. Future studies should investigate therelationship between interindividual variation in whole-muscle performance and thepredicted underlying relationship with the muscle’s morphological structure.
11.6 CONCLUSIONS
Throughout this chapter, we have argued that interindividual differences are of greatimportance in evolutionary physiology because they are likely to reflect intrinsicvariability upon which natural selection can potentially act [109]. Such variabilitymight have an underlying basis in the physiological traits of individuals, amongwhich those related to skeletal muscle traits, including size, morphology and phys-iology, are particularly relevant for being closely related to behavioral performanceand, likely, to the ecological success of individuals [39,46,108,110]. The assumptionof a logical relationship between muscle performance and ecological success per-meates the literature, but studies directly investigating such relationships are scarce.Similarly, attempts to investigate the strength of phenotypic selection on biomechan-ical quantitative traits are scant (see, e.g., Ref. [4]), an observation that is true ofphysiological traits in general [111]. The study of the nature, reproducibility, andecological consequences of interindividual variation of muscle physiology, therefore,is an integrative and contemporary field of research.
Although the theoretical links relating muscle mechanics, behavioral performance,and evolution seem rather well-established, empirical evidence is missing. Such empir-ical support is not just a formality, but also an essential task to understanding how
3209_C011.fm Page 242 Thursday, November 10, 2005 10:48 AM

Interindividual Variation in Muscle Physiology 243
muscle physiology evolves. For example, studies showing short-term reproducibilityof behavioral performance are becoming abundant, but studies across years [34],temperatures [39], or ecological settings [38] are still uncommon. If behavioralperformance ranks are context dependent, the relationship between behavioral per-formance and fitness would be of a more complex nature than usually stated in theliterature. Understanding how the morphophysiology of skeletal muscle changesalong the lifetime of individuals in response to relevant ecophysiological variablesand how these changes affect the behavioral performance of individuals, would be
FIGURE 11.2 Correlations between several measures of in vitro muscle performance for thegastrocnemius muscle of the toad Bufo viridus. Measures of isolated muscle performancereported are (A) maximum net power output, (B) maximum isometric stress, and (C) fatigueresistance of power output during a fatigue run at 5 Hz. All correlations were statisticallysignificant at the level of P < 0.05. (Modified after Wilson, R.S. et al., J. Comp. Physiol.,174B, 453, 2004.)
Max. power output (W kg–1)
A
B
C
30 35 40 45 50 0.0
0.2
0.4Fa
tigue
resis
tanc
e Fa
tigue
resis
tanc
e M
ax. p
ower
out
put (
Wkg
–1)
0.6
150 200 250 300 0.0
0.2
0.4
0.6
Max. stress (kN m–2)
Max. stress (kN m–2)
150 200 250 300 0
20
40
60
3209_C011.fm Page 243 Thursday, November 10, 2005 10:48 AM
244 Ecology and Biomechanics
an important contribution of muscle physiologists to the evolution of behavioralperformance, a main issue in evolutionary physiology. Interesting contributions fromthis standpoint include how skeletal muscle responds to changes in ecophysiologicalvariables such as ontogeny, level of activity, temperature, availability of resources,and duration of hypometabolic states, for example, estivation or hibernation. Addi-tionally, very few studies have used training as a tool to explore the scope for changesin behavioral performance in vertebrate ectotherms (see, e.g., Ref. [112]).
The study of functional tradeoffs in skeletal muscle also emerges as a field thatdeserves further attention. There is enough evidence to state clearly that certainmuscle traits cannot be simultaneously maximized, and research along these linesstill has much to offer. Phenotypic tradeoffs, however, might relate muscle propertiesto other important traits of natural history. As an example, hatchling survival andsprint speed seem inversely correlated in some lizards [31]. Such findings posequestions regarding how an investment in the production of skeletal muscle mightvary among individuals in ways that might be consequential for fitness. If suchpatterns abound, it would be quite incorrect to assume simplistically that the fastestlizards are the fittest. Studies relating muscle function with life-history traits suchas time for maturity, growth rate, hatchling survival, and other traits are very uncom-mon but are needed. The relationship between fitness and behavioral performanceis further complicated by the observation that differences in muscle performanceamong individuals may not necessarily be coupled with differences in undisturbed(e.g., field) behavioral performance (see Section 11.2). Related questions emerge,however, given that differences among individuals in their activity patterns could,at least in theory, cause differentiation in various aspects of exercise physiologythrough training effects.
Many questions remain to be answered regarding the role of body size as a factorexplaining interindividual variation in muscle performance. It is clear that no onescaling law is universal in its prediction of changes in performance or function withbody size. For example, the scaling of maximal acceleration during jumping withinand across Anolis lizard species demonstrates positive allometry in smaller lizardsbut no relationship in larger lizards [73]. Wilson et al. [42] have also demonstrateda discontinuous scaling relationship with positive allometry between maximum jumpdistance and body mass in frogs of smaller size and then body size independencein larger frogs. The nature of such discontinuities is fundamental to evolutionaryphysiology because scaling patterns might differ at contrasting body masses due todifferent selective pressures associated with ecological performance. Perhaps insome species of frogs, small individuals must jump a minimum absolute distanceto be ecologically functional, whereas larger individuals exhibit mass independenceof jump distance because they have exceeded a critical level of ecologically relevantperformance [42].
Although the scaling relationships of locomotion in running animals havereceived a large amount of attention, they have not been considered in such a clearecological context as in the jumping studies mentioned above. For instance, variouspredictions have been made that limb dimensions should scale according to geomet-ric [113] or elastic similarity [114], and that the energetic cost of locomotion isdependent on the rate at which force is produced and stride frequency [115,116].
3209_C011.fm Page 244 Thursday, November 10, 2005 10:48 AM

Interindividual Variation in Muscle Physiology 245
The generally assumed extension of these hypotheses is that such physical constraintsof body size dictate the stride frequency used at any animal size, which in turndictates the maximal shortening velocity of muscle (for a review, see [117]). How-ever, as discussed in Section 11.3 (see also [62]), the power produced at any stridefrequency is dependent on a range of muscle mechanical properties, not just maxi-mum shortening velocity. Pellegrino and collaborators [61] have also postulated thatthe higher energy cost of locomotion in small animals is due to their higher relativemuscle power output, i.e., they have faster muscles that produce more power, incur-ring a greater energetic cost. Other important constraints may act, however, becauseviable individuals within a species are likely to be those attaining locomotoryperformances that grant appropriate ecological performance. Among lizards, forexample, larger individuals with longer legs and stride lengths could reach a thresh-old speed by using a lower stride frequency. They could, therefore, exhibit slowermaximal muscle shortening velocity and contraction kinetics, and hence relativelylower energetic cost.
Multidisciplinary studies involving muscle physiology and biomechanics, ecol-ogy, and evolution are important to fully understand the relationships betweenorganismal performance and fitness. They are needed also to understand howthe possible mechanistic bases of interindividual behavioral variation may indicatethe role physiology plays in constraining the behavioral tactics used by ectotherms.The relationships between behavioral and physiological performance are evidentonly when experiments involve animals forced to perform near their maximal pos-sibilities, and yet studies with vertebrate ectotherms in the field do not show a clearrelationship between behavior and exercise physiology. Little is known about thenature and significance of interindividual variation in the skeletal muscle of verte-brate ectotherms: Is interindividual diversity in muscle performance similar amongpopulations of related species? If not, why not? To what extent is interindividualvariation merely noise, or does it reflect behavioral strategies coexisting withinpopulations? Why do relationships between individual field behavior and physiologyseem absent is some species? Perhaps many such taxa most frequently perform wellbelow their maximal potential, but if so, what would be the real impact of behavioralperformance on fitness? This relationship is assumed to exist, but it is mainly asensible theoretical premise for which direct empirical support is limited to veryfew studies [118,119]. Further efforts favoring an integrative perspective of themechanistic causes and ecological consequences of interindividual variation are,therefore, very much needed.
REFERENCES
1. Domenici, P. and Blake, R., The kinematics and performance of fish fast-start swim-ming, J. Exp. Biol., 200, 1165, 1997.
2. Wardle, C.S., Limit of fish swimming speed, Nature, 255, 725, 1975.3. Hertz, P.E., Huey, R.B., and Nevo, E., Homage to Santa Anita: thermal sensitivity of
sprint speed in agamid lizards, Evolution, 37, 1075, 1983.
3209_C011.fm Page 245 Thursday, November 10, 2005 10:48 AM

246 Ecology and Biomechanics
4. Miles, D.B., The race goes to the swift: fitness consequences of variation in sprintperformance in juvenile lizards, Evol. Ecol. Res., 6, 63, 2004.
5. Garland, T., Hankins, E., and Huey, R.B., Locomotory capacity and social dominancein male lizards, Funct. Ecol., 4, 243, 1990.
6. Alexander, R.M., Energy-saving mechanisms in walking and running, J. Exp. Biol.,160, 55, 1991.
7. Lutz, G.J. and Rome, L.C., Built for jumping: the design of the frog muscular system,Science, 263, 370, 1994.
8. Roberts, T.J. and Marsh, R.L., Probing the limits to muscle-powered accelerations:lessons from jumping bullfrogs, J. Exp. Biol., 206, 2567, 2003.
9. Peters, S.E. and Aulner, D.A., Sexual dimorphism in forelimb muscles of the bullfrog,Rana catesbeiana: a functional analysis of isometric contractile properties, J. Exp.Biol., 203, 3639, 2000.
10. Brown, R.M. and Taylor, D.H., Compensatory escape mode trade-offs between swim-ming performance and maneuvering behavior through larval ontogeny of the woodfrog, Rana sylvatica, Copeia, 1995, 1, 1995.
11. D’Aout, K. and Aerts, P., Kinematics and efficiency of steady swimming in adultaxolotls (Ambystoma mexicanum), J. Exp. Biol., 200, 1863, 1997.
12. Goater, C.P., Semlitsch, R.D., and Bernasconi, M.V., Effects of body size and parasiteinfection on the locomotory performance of juvenile toads, Bufo bufo, Oikos, 66,129, 1993.
13. Bevier, C.R., Utilization of energy substrates during calling activity in tropical frogs,Beh. Ecol. Sociobiol., 41, 343, 1997.
14. Weinstein, R.B. and Full, R.J., Intermittent locomotion increases endurance in agecko, Physiol. Biochem. Zool., 72, 732, 1999.
15. Garland, T., Phylogenetic analyses of lizard endurance in relation to body size andbody temperature, in Lizard Ecology: Historical and Experimental Perspectives, Vitt,L.J. and Pianka, E.R., Eds., Princeton University Press, Princeton, 1994, p. 237.
16. Garland, T. and Losos, J.B., Ecological morphology of locomotor performance insquamate reptiles, in Ecological Morphology: Integrative Organismal Biology,Wainwright, P.C. and Reilly, S.M., Eds., University of Chicago Press, Chicago, 1994,p. 240.
17. Bauwens, D., Garland, T., Castilla, A.M., and Van Damme, R., Evolution of sprintspeed in lacertid lizards: morphological, physiological, and behavioral covariation,Evolution, 49, 848, 1995.
18. Bonine, K.E., Gleeson, T.T., and Garland, T., Jr., Comparative analysis of fiber-typecomposition in the iliofibularis muscle of phrynosomatid lizards (Squamata), J. Mor-phol., 250, 265, 2001.
19. Kohlsdorf, T., James, R.S., Carvalho, J.E., Wilson, R.S., Dal Pai-Silva, M., and Navas,C.A., Locomotor performance of closely related Tropidurus species: relationshipswith physiological parameters and ecological divergence, J. Exp. Biol., 207, 1183,2004.
20. Donley, J.M., Sepulveda, C.A., Konstantinidis, P., Gemballa, S., and Shadwick, R.E.,Convergent evolution in mechanical design of lamnid sharks and tunas, Nature, 429,61, 2004.
21. Franklin, C.E., Studies of evolutionary temperature adaptation: muscle function andlocomotor performance in Antarctic fish, Clin. Exp. Pharmacol. Physiol., 25, 753,1998.
22. Navas, C.A., Metabolic physiology, locomotor performance, and thermal nichebreadth in neotropical anurans, Physiol. Zool., 69, 1481, 1996.
3209_C011.fm Page 246 Thursday, November 10, 2005 10:48 AM

Interindividual Variation in Muscle Physiology 247
23. Bennett, A.F., Interindividual variability: an underutilized resource, in New Directionsin Ecological Physiology, Feder, M.E., Bennett, A.F., Burggren, W., and Huey, R.B.,Eds., Cambridge University Press, Cambridge, 1987, p. 147.
24. Pough, H.F. and Andrews, R.M., Individual and sibling-group variation in metabolismof lizards: the aerobic capacity model for the origin of endothermy, Comp. Biochem.Physiol., 79A, 415, 1984.
25. Shaffer, H.B., Austin, C.C., and Huey, R.B., The consequences of metamorphosis onsalamander (Ambystoma) locomotor performance, Physiol. Zool., 64, 212, 1991.
26. Watkins, T.B., The effect of metamorphosis on the repeatability of maximal locomotorperformance in the Pacific tree frog Hyla regilla, J. Exp. Biol., 200, 2663, 1997.
27. Tsuji, J.S., Huey, R., Berkum, F.V., Garland, T., and Shaw, R.G., Locomotor perfor-mance of hatching fence lizards (Sceloporus occidentalis): quantitative genetics andmorphometric correlates, Evol. Ecol., 3, 240, 1989.
28. Bennett, A.F. and Lenski, R.E., Experimental evolution and its role in evolutionaryphysiology, Am. Zool., 39, 346, 1999.
29. Dohm, M.R., Richardson, C.S., and Garland, T., Exercise physiology of wild andrandom bred laboratory house mice and their reciprocal hybrids, Am. J. Physiol., 36,1098, 1994.
30. Jayne, B.C., Bennett, A.F., and Lauder, G.V., Muscle recruitment during terrestriallocomotion: how speed and temperature affect fiber type use in a lizard, J. Exp. Biol.,152, 101, 1990.
31. Warner, D.A. and Andrews, R.M., Laboratory and field experiments identify sourcesof variation in phenotypes and survival of hatchling lizards, Biol. J. Linn. Soc., 76,105, 2002.
32. Van Buskirk, J., Phenotypic lability and the evolution of predator-induced plasticityin tadpoles, Evolution, 56, 361, 2002.
33. Van Buskirk, J. and McCollum, S.A., Influence of tail shape on tadpole swimmingperformance, J. Exp. Biol., 203, 2149, 2000.
34. Huey, R. and Dunhan, A., Repeatability of locomotor performance in natural popu-lations of the lizard Sceloporus merriami, Evolution, 41, 1116, 1987.
35. Huey, R.B., Dunham, A.E., Overall, K.L., and Newman, R.A., Variation in locomotorperformance in demographically known populations of the lizard Sceloporus merri-ami, Physiol. Zool., 63, 845, 1990.
36. Kolok, A.S., Plaisance, E.P., and Abdelghani, A., Individual variation in the swimmingperformance of fishes: an overlooked source of variation in toxicity studies, Env.Toxicol. Chem., 17, 282, 1998.
37. Marker, G.M. and Gatten, R.E., Individual variability in sprint performance, lactateproduction, and enzyme activity in frogs (Rana pipiens), J. Herpetol., 27, 294, 1993.
38. Martinez, M., Guderley, H., Nelson, J.A., Webber, D., and Dutil, J.D., Once a fastcod, always a fast cod: maintenance of performance hierarchies despite changingfood availability in cod (Gadus morhua), Physiol. Biochem. Zool., 75, 90, 2002.
39. Navas, C.A., James, R.S., Wakeling, J.M., Kemp, K.M., and Johnston, I.J., An inte-grative study of the temperature dependence of whole animal and muscle performanceduring jumping and swimming in the frog Rana temporaria, J. Comp. Physiol., 169,588, 1999.
40. Choi, I.H., Shim, J.H., and Ricklefs, R.E., Morphometric relationships of take-offspeed in anuran amphibians, J. Exp. Zool., 299A, 99, 2003.
41. Marsh, R.L., Jumping ability of anuran amphibians, Adv. Vet. Sci. Comp. Med., 38B,51, 1994.
3209_C011.fm Page 247 Thursday, November 10, 2005 10:48 AM

248 Ecology and Biomechanics
42. Wilson, R.S., Franklin, C.E., and James, R.S., Allometric scaling relationships ofjumping performance in the striped marsh frog Limnodynastes peronii, J. Exp. Biol.,203, 1937, 2000.
43. Zug, G.R., Anuran locomotion — structure and function, 2: Jumping performance ofsemiaquatic, terrestrial, and arboreal frogs, Smith. Cont. Zool., 276, 1, 1978.
44. Altringham, J.D., Morris, T., James, R.S., and Smith, C.I., Scaling effects on musclefunction in fast and slow muscle of Xenopus laevis, J. Exp. Biol. Online, 1, 1, 1996.
45. Garland, T., Physiological correlates of locomotory performance in a lizard: anallometric approach, Am. J. Physiol., 247, R806, 1984.
46. Bennett, A.F., Garland, T., and Else, P., Individual correlation of morphology, musclemechanics, and locomotion in a salamander, Am. J. Physiol., 256, R1200, 1989.
47. James, R.S., Wilson, R.S., Carvalho, J.E., Kohlsdorf, T., Gomes, F.R., and Navas,C.A., Physiological and morphological basis of individual variation in jumping per-formance of Hyla multilineata, Comp. Biochem. Physiol., 137A, S87, 2004.
48. Dowdey, T.G. and Brodie, E.D., Antipredator strategies of salamanders: individualand geographical variation in responses of Eurycea bislineata to snakes, Anim. Beh.,38, 707, 1989.
49. Gomes, F.R., Bevier, C.C., and Navas, C.A., Environmental and physiological factorsinfluence antipredator behavior in Scinax hiemalis (Anura: Hylidae), Copeia, 2002,994, 2002.
50. Bourne, G.R., Lekking behavior in the neotropical frog Ololygon rubra, Beh. Ecol.Sociobiol., 31, 173, 1992.
51. Wells, K.D., The social behaviour of anuran amphibians, Anim. Behav., 25, 666, 1977.52. Forester, D.C., Lykens, D.V., and Harrison, W.K., The significance of persistent
vocalisation by the spring peeper, Pseudacris crucifer (Anura, Hylidae), Behaviour,108, 197, 1989.
53. Lance, S.L. and Wells, K.D., Are spring peeper satellite males physiologically inferiorto calling males? Copeia, 4, 1162, 1993.
54. Wells, K.D. and Taigen, T.L., Reproductive behavior and aerobic capacities of maleAmerican toads (Bufo americanus): is behavior constrained by physiology? Herpe-tologica, 40, 292, 1984.
55. Runkle, L.S., Wells, K.D., Robb, C.C., and Lance, S.L., Individual, nightly, andseasonal variation in calling behavior of the gray treefrog, Hyla versicolor: implica-tions for energy expenditure, Beh. Ecol. Sociobiol., 5, 318, 1994.
56. Schwartz, J.J., Ressel, S.J., and Bevier, C.R., Carbohydrate and calling: depletion ofmuscle glycogen and the chorusing dynamics of the neotropical treefrog Hyla micro-cephala, Beh. Ecol. Sociobiol., 37, 125, 1995.
57. Wells, K.D., Taigen, T.L., Rusch, S.W., and Robb, C.C., Seasonal and nightly variationin glycogen reserves of calling gray treefrogs (Hyla versicolor), Herpetologica, 5,359, 1995.
58. Johnson, T.P., Swoap, S.J., Bennett, A.F., and Josephson, R.K., Body size, musclepower output and limitations on burst locomotor performance in the lizard Dipso-saurus dorsalis, J. Exp. Biol., 174, 199, 1993.
59. Marsh, R.L., Ontogenesis of contractile properties of skeletal muscle and sprintperformance in the lizard Dipsosaurus dorsalis, J. Exp. Biol., 137, 119, 1988.
60. James, R., Cole, N., Davies, M., and Johnston, I.A., Scaling of intrinsic contractileproperties and myofibrillar protein composition of fast muscle in the fish Myoxoce-phalus scorpius L, J. Exp. Biol., 201, 901, 1998.
3209_C011.fm Page 248 Thursday, November 10, 2005 10:48 AM

Interindividual Variation in Muscle Physiology 249
61. Pellegrino, M.A., Canepari, M., Rossi, R., D’Antona, G., Reggiani, C., and Bottinelli,R., Orthologous myosin isoforms and scaling of shortening velocity with body sizein mouse, rat, rabbit and human muscles, J. Physiol., 546, 677, 2003.
62. Medler, S., Comparative trends in shortening velocity and force production in skeletalmuscles, Am. J. Physiol., 283, R368, 2002.
63. James, R. and Johnston, I.A., Scaling of muscle performance during escape responsesin the fish Myoxocephalus scorpius L., J. Exp. Biol., 201, 913, 1998.
64. Videler, J.J. and Wardle, C.S., Fish swimming stride by stride: speed limits andendurance, Rev. Fish. Biol. Fisher., 1, 23, 1991.
65. Emerson, S.B., Allometry and jumping in frogs: helping the twain to meet, Evolution,32, 551, 1978.
66. Domenici, P., The scaling of locomotor performance in predator-prey encounters:from fish to killer whales, Comp. Biochem. Physiol., 131A, 169, 2001.
67. Iriarte-Diaz, J., Differential scaling of locomotor performance in small and largeterrestrial mammals, J. Exp. Biol., 205, 2897, 2002.
68. Johnson, D.C., Burt, C.T., Perng, W.C., and Hitzig, B.M., Effects of temperature onmuscle pH-i and phosphate metabolites in newts and lungless salamanders, Am. J.Physiol., 265, R1162, 1993.
69. Swoap, S.J., Johnson, T.P., Josephson, R.K., and Bennett, A.B., Temperature, musclepower output and limitations on burst locomotor performance in the lizard Dipso-saurus dorsalis, J. Exp. Biol., 174, 185, 1993.
70. Farley, C.T., Maximum speed and mechanical power output in lizards, J. Exp. Biol.,200, 2189, 1997.
71. Marsh, R.L., Deactivation rate and shortening velocity as determinants of contractilefrequency, Am. J. Physiol., 259, R223, 1990.
72. Altringham, J.D. and Johnston, I.A., Scaling effects on muscle function: power outputof isolated fish muscle fibres performing oscillatory work, J. Exp. Biol., 151, 1990.
73. Toro, E., Herrel, A., Vanhooydonck, B., and Irschick, D.J., A biomechanical analysisof intra- and interspecific scaling of jumping and morphology in Caribbean Anolislizards, J. Exp. Biol., 206, 2641, 2003.
74. Vanhooydonck, B., Van Damme, R., and Aerts, P., Variation in speed, gait character-istics and microhabitat use in lacertid lizards, J. Exp. Biol., 205, 1037, 2002.
75. Heizmann, C.W., Berchtold, M.W., and Rowlerson, A.M., Correlation of parvalbuminconcentration with relaxation speed in mammalian muscles, Proc. Natl. Acad. Sci.USA, 79, 7243, 1982.
76. Rome, L.C., Some advances in integrative muscle physiology, Comp. Biochem. Phys-iol., 120B, 51, 1998.
77. Lindstedt, S.L., McGlothlin, T., Percy, E., and Pifer, J., Task-specific design of skeletalmuscle: balancing muscle structural composition, Comp. Biochem. Physiol., 120B,35, 1998.
78. Wilson, J.A., Kronfeld, D.S., Gay, L.S., Williams, J.H., Wilson, T.M., and Lindinger,M.I., Sarcoplasmic reticulum responses to repeated sprints are affected by condition-ing of horses, J. Anim. Sci., 76, 3065, 1998.
79. Lutz, G.J. and Lieber, R.L., Myosin isoforms in anuran skeletal muscle: their influenceon contractile properties and in vivo muscle function, Microsc. Res. Tech., 50, 443,2000.
80. Bottinelli, R. and Reggiani, C., Human skeletal muscle fibres: molecular and func-tional diversity, Prog. Biophys. Mol. Biol., 73, 195, 2000.
81. Pette, D. and Staron, R.S., Myosin isoforms, muscle fiber types, and transitions,Microsc. Res. Tech., 50, 500, 2000.
3209_C011.fm Page 249 Thursday, November 10, 2005 10:48 AM

250 Ecology and Biomechanics
82. Lieber, R.L. and Friden, J., Functional and clinical significance of skeletal musclearchitecture, Muscle Nerve, 23, 1647, 2000.
83. Emerson, S.B., Jumping and leaping, in Functional Vertebrate Morphology, Hilde-brand, M., Bramble, D., Liem, K., and Wake, D., Eds., Harvard University Press,Cambridge, 1985, p. 58.
84. Toro, E., Herrel, A., and Irschick, D., The evolution of jumping performance inCaribbean Anolis lizards: solutions to biomechanical trade-offs, Am. Nat., 163, 844,2004.
85. Navas, C.A., Antoniazzi, M.M., Carvalho, J.E., Chaui-Berlink, J.G., James, R.S.,Jared, C., Kohlsdorf, T., Pai-Silva, M.D., and Wilson, R.S., Morphological and phys-iological specialization for digging in amphisbaenians, an ancient lineage of fossorialvertebrates, J. Exp. Biol., 207, 2433, 2004.
86. Dickinson, M., Farley, C., Full, R., Koehl, M., Kram, R., and Lehman, S., Howanimals move: an integrative review, Science, 288, 100, 2000.
87. Kernell, D., Hensbergen, E., Lind, A., and Eerbeek, O., Relation between fibrecomposition and daily duration of spontaneous activity in ankle muscles of the cat,Arch. Ital. Biol., 136, 191, 1998.
88. Putnam, R.W., Gleeson, T.T., and Bennett, A.F., Histochemical determination of thefiber composition of locomotory muscles in a lizard, Dipsosaurus dorsalis, J. Exp.Zool., 214, 303, 1980.
89. Rome, L.C., The design of the vertebrate muscular systems: comparative and inte-grative approaches, Clinic. Orthop. Relat. Res., 403S, 58, 2002.
90. Lutz, G.J., Bremner, S., Lajevardi, N., Lieber, R.L., and Rome, L.C., Quantitativeanalysis of muscle fibre type and myosin heavy chain distribution in the frog hindlimb:implications for locomotory design, J. Muscle. Res. Cell. Motil., 19, 717, 1998.
91. Gerhardt, H.C., The evolution of vocalization in frogs and toads, Ann. Rev. Ecol.Syst., 25, 293, 1994.
92. Marsh, R.L., Contractile properties of muscles used in sound production and loco-motion in two species of gray tree frog, J. Exp. Biol., 202, 3215, 1999.
93. Bevier, C., Biochemical correlates of calling activity in neotropical frogs, Physiol.Zool., 68, 1118, 1995.
94. Ressel, S.J., Ultrastructural properties of muscles used for call production in neotro-pical frogs, Physiol. Zool., 69, 952, 1996.
95. Rubinstein, N.A., Erulkar, S.D., and Schneider, G.T., Sexual dimorphism in the fibersof a “clasp” muscle of Xenopus laevis, Exp. Neurol., 82, 424, 1983.
96. Lee, J.C., Evolution of a secondary sexual dimorphism in the toad, Bufo marinus,Copeia, 2001, 928, 2001.
97. Goldspink, G., Selective gene expression during adaptation of muscle in response todifferent physiological demands, Comp. Biochem. Physiol., 120, 5, 1998.
98. Van Damme, R. and Vanhooydonck, B., Origins of interspecific variation in lizardsprint capacity, Funct. Ecol., 15, 186, 2001.
99. Vanhooydonck, B., Van Damme, R., and Aerts, P., Speed and stamina trade-off inlacertid lizards, Int. J. Org. Evol., 55, 1040, 2001.
100. Pasi, B.M. and Carrier, D.R., Functional trade-offs in the limb muscles of dogsselected for running vs. fighting, J. Evol. Biol., 16, 324, 2003.
101. Dohm, M.R., Hayes, J.P., and Garland, T., Quantitative genetics of sprint runningspeed and swimming endurance in laboratory house mice (Mus domesticus), Evolu-tion, 50, 1688, 1996.
102. Garland, T., Jr., Else, P.L., Hulbert, A.J., and Tap, P., Effects of endurance trainingand captivity on activity metabolism of lizards, Am. J. Physiol., 252, R450, 1987.
3209_C011.fm Page 250 Thursday, November 10, 2005 10:48 AM

Interindividual Variation in Muscle Physiology 251
103. Jayne, B.C. and Bennett, A.F., Selection of locomotor performance capacity in anatural population of garter snakes, Evolution, 44, 1204, 1990.
104. Sorci, G., Swallow, J.G., Garland, T., Jr., and Clobert, J., Quantitative genetics oflocomotor speed and endurance in the lizard Lacerta vivipara, Physiol. Zool., 68,698, 1995.
105. Wilson, R.S., James, R.S., and Van Damme, R., Trade-offs between speed and endur-ance in the frog Xenopus laevis: a multi-level approach, J. Exp. Biol., 205, 1145, 2002.
106. Van Damme, R., Wilson, R., Vanhooydonck, B., and Aerts, P., Performance constraintsin decathlon athletes, Nature, 415, 755, 2002.
107. Wilson, R.S. and James, R.S., Constraints on muscular performance: trade-offsbetween power output and fatigue resistance, Proc. R. Soc. Lond. B., 271, 222, 2004.
108. Wilson, R.S., James, R.S., Kohlsdorf, T., and Cox, V.M., Interindividual variation ofisolated muscle performance and fibre-type composition in the toad Bufo viridus, J.Comp. Physiol., 174B, 453, 2004.
109. Spicer, J.I. and Gaston, K.J., Physiological Diversity and Its Ecological Conse-quences, Blackwell Science, London, 1999.
110. Gleeson, T.T. and Harrison, J.M., Muscle composition and its relation to sprintrunning in the lizard Dipsosaurus dorsalis, Am. J. Physiol., 255, R470, 1988.
111. Kingsolver, J.G., Hoekstra, H.E., Hoekstra, J.M., Berrigan, D., Vignieri, S.N., Hill,C.E., Hoang, A., Gibert, P., and Beerli, P., The strength of phenotypic selection innatural populations, Am. Nat., 157, 245, 2001.
112. Miller, K. and Camilliere, J.J., Physical training improves swimming performance ofthe African clawed frog, Xenopus laevis, Herpetologica, 37, 1, 1981.
113. Hill, A.V., The dimensions of animals and their muscular dynamics, Science Progress(London), 38, 209, 1950.
114. McMahon, T.A., Using body size to understand the structural design of animals:quadrupedal locomotion, J. Appl. Physiol., 39, 619, 1975.
115. Rome, L.C., Scaling of muscle fibres and locomotion, J. Exp. Biol., 168, 243, 1992.116. Taylor, C.R., Heglund, N.C., McMahon, T.A., and Looney, T.R., Energetic cost of
generating muscular force during running: a comparison of large and small animals,J. Exp. Biol., 86, 9, 1980.
117. Lindstedt, S.L., Hoppeler, H., Bard, K.M., and Thronson, H.A., Estimate of muscle-shortening rate during locomotion, Am. J. Physiol., 248, R699, 1985.
118. Angilletta, M.J., Niewiarowski, P.E., and Navas, C.A., The evolution of thermalphysiology in ectotherms, J. Therm. Biol., 27, 249, 2002.
119. Johnston, I.A. and Temple, G.K., Thermal plasticity of skeletal muscle phenotype inectothermic vertebrates and its significance for locomotory behaviour, J. Exp. Biol.,205, 2305, 2002.
3209_C011.fm Page 251 Thursday, November 10, 2005 10:48 AM


253
12 Power Generation during Locomotion in AnolisLizards: An EcomorphologicalApproach
Bieke Vanhooydonck, Peter Aerts, Duncan J. Irschick, and Anthony Herrel
CONTENTS
12.1 Introduction ..................................................................................................25312.2 Material and Methods ..................................................................................255
12.2.1 Animals ............................................................................................25512.2.2 Morphology......................................................................................25512.2.3 Running Trials..................................................................................25512.2.4 Jumping Trials..................................................................................25712.2.5 Configuration of Hind Limbs ..........................................................25812.2.6 Ecology.............................................................................................25812.2.7 Statistical Analysis ...........................................................................259
12.3 Results ..........................................................................................................26012.4 Discussion ....................................................................................................264
12.4.1 Ecological Correlates of Power Output...........................................26412.4.2 Interspecific Variation ......................................................................26512.4.3 Power Output during Running and Jumping: A Two-Species
Comparison ......................................................................................266Acknowledgments..................................................................................................267References..............................................................................................................267
12.1 INTRODUCTION
Movement requires the generation of muscular power. How much mechanical powera muscle can produce is determined by its physiological properties, such asforce–velocity relationship, pattern of stimulation, and strain waveform and
3209_C012.fm Page 253 Thursday, November 10, 2005 10:48 AM

254 Ecology and Biomechanics
amplitude [1–5]. High power outputs are typically associated with explosive move-ments such as fast starts, jumping, or take off in flying organisms [6–8]. Amongspecies or higher taxa, mechanical power output and muscle physiology can varydramatically. For instance, Wakeling and Johnston [9] showed that among six teleostfish species, total (hydrodynamic) power output during fast starts varied 10-fold,i.e., from around 16 W kg–1 to over 160 W kg–1, and that this interspecific variationwas associated with differences in body shape and natural temperature regime.Moreover, muscle power output limits the fast-start performance of these animals[9]. Similarly, large differences in muscle power output have been measured in otherstudies comparing species, such as birds [10] and lizards [11], or life-history stageswithin one species, such as eels [12] and frogs [13].
Muscle power output is determined by the interaction between the active musclesand the external environment through which the organism is moving [2]. Thisbecomes clear when comparing muscle power output in individuals moving throughdifferent media, such as water and air [14,15]. Ducks, for instance, produce lesspower when they are swimming than when they are walking, and their work, forces,and muscle strains differ between the two locomotor modes [15]. Additionally,different locomotor modes in the same medium, such as walking vs. running orrunning vs. jumping, might impose different power requirements on the locomotormusculature of an organism. Similarly, in legged animals, the configuration ormovement pattern of a limb during different locomotor behaviors can affect musclepower output. In vivo changes in configuration or posture and power output can bestudied by measuring muscle performance, such as power output, in concert withmorphological and/or kinematical analyses [16,17].
At an even larger scale, different (micro) habitats might impose demands on thelocomotor muscle system with regard to power output. For instance, arboreal habitatsare extremely complex and often require organisms to jump from branch to branch.Because jumping requires high power outputs [8,18], arboreal organisms areexpected to be able to generate high muscular powers. Similarly, lizards such asgeckoes that often move on vertical substrates against gravity while escaping frompredators [19] are expected to have high muscle mass–specific power outputs [20].
Given the potential for differences in limb configuration during different loco-motor modes and its potential effect on power output, we compare mechanical poweroutput in Anolis lizards while accelerating from a standstill and while jumping. Weexamined these two locomotor modes because Anolis lizards typically use burstrunning and jumping to escape from predators or when searching for food [21],suggesting that the selective forces acting on the generation of high mechanicalpower output should be strong. For two of the Anolis species, we furthermorequantify joint angles during running and jumping to investigate whether differencesin limb configuration might explain differences in power output.
Additionally, we investigate whether muscle mass–specific power output hasevolved within Anolis lizards in response to variation in microhabitat use andbehavior. Previous ecomorphological studies have shown that Anolis lizards haveevolved into ecologically and phenotypically distinct forms termed ecomorphs,including trunk-ground, trunk-crown, crown-giant, and twig ecomorphs [22–25].Thus, although most species are classified as “arboreal,” some are more ground
3209_C012.fm Page 254 Thursday, November 10, 2005 10:48 AM

Power Generation during Locomotion in Anolis Lizards 255
dwelling, while others occur almost exclusively in vertical microhabitats. Conse-quently, we expect higher mechanical power outputs to evolve in species frequentlyoccupying arboreal habitats because they often have to move against gravity. Sim-ilarly, we expect high power outputs to evolve in species that escape upward towardthe canopy when threatened by a predator. Therefore, we expect to find correlationsbetween muscle power output during locomotion and the habitat occupied by theseanimals. Specifically, we address the following questions: (1) Have musclemass–specific power output during running and jumping coevolved? (2) Are inter-specific differences in muscle mass–specific power output correlated with differencesin ecology, i.e., microhabitat use? (3) Do differences in limb configuration explaindifferences in power output?
12.2 MATERIAL AND METHODS
12.2.1 ANIMALS
We captured male individuals of 10 species Anolis by hand or noose at differentfield sites between November 2001 and June 2002. A. carolinensis, A. sagrei, A.distichus, and A. garmani were captured at mainland U.S. sites (A. carolinensis atNew Orleans, LA; all the others at Miami, FL); A. grahami, A. lineatopus, and A.valencienni were caught in Jamaica (Discovery Bay), and A. evermanni, A. gundla-chi, and A. pulchellus were caught in Puerto Rico (El Verde). We transported thesespecies back to the laboratory at Tulane University. Upon arrival in the laboratory,we kept the lizards in pairs in 40-L terraria lined with leaf litter. We fed them livecrickets dusted with calcium three times a week and sprayed them with water daily.
12.2.2 MORPHOLOGY
We used digital calipers (Mitutoyo CD-15DC; ± 0.01 mm) to measure snout–ventlength (measured from the tip of the snout to the cloaca) on all individuals used inthe running trials. Between 1 and 3 individuals of the 10 species included in ouranalysis were sacrificed for morphological analysis. Specimens were preserved in10% aqueous formalin and stored in 70% aquous ethanol solution. Before dissection,we weighed the intact specimens to the nearest 0.01 g on an electronic balance (A& D Instruments, FX 3200; ± 0.01 g). We subsequently dissected out all the hindlimb muscles of one hind limb. We then weighed all femur retractor muscles andall knee and ankle extensor muscles separately on a Mettler MT 5 electronic balance(± 0.00001 g). We used the mass of these muscles in further analyses because theseare the only muscles potentially responsible for generating propulsion. Muscle andbody masses were averaged per species.
12.2.3 RUNNING TRIALS
We induced the lizards to run up a 2-m long dowel (diameter of 8 cm) by clappingour hands and/or by tapping the base of their tails. The plastic dowel, covered witha mesh to provide sufficient traction, was placed against the wall at an angle of 45º.Individual lizards were filmed laterally using a high-speed video camera (Redlake
3209_C012.fm Page 255 Thursday, November 10, 2005 10:48 AM

256 Ecology and Biomechanics
Motionscope PCI camera) at 250 Hz. We conducted between 5 to 10 trials perindividual over several nonconsecutive days. Prior to experimentation and in betweentrials, we placed the lizards in an incubator set at 32ºC for at least 1 h to attain bodytemperatures similar to their preferred field body temperatures [26].
The running trials for the Puerto Rican species (i.e., A. pulchellus, A. gundlachi,and A. evermanni) were conducted at the field station in Puerto Rico within 24 hrof capture. The experimental setup differed from the laboratory setup in the followingways: lizards were filmed at 240 Hz using a JVC high-speed video camera. Priorto filming and in between trials, the lizards were placed in individual bags in theshade to attain temperatures equal to or near the environmental temperature (30ºC).
For analysis, we selected sequences in which the lizard (1) started from acomplete standstill, (2) ran over a total distance of at least 25 cm, and (3) ran ontop of the dowel (i.e., in a straight line). For these sequences, we digitized the tipof the lizard’s snout for every frame using MOTUS software by Peak Performance.A sequence began 20 frames before the first movement and lasted until the lizardran out of view or stopped. We subsequently smoothed the data using the QuinticSpline Processor implemented in MOTUS. Only data from individuals that per-formed at least three “good” trials were used in further analyses.
Based on the smoothed displacement data, instantaneous speed and acceleration(i.e., per frame) were calculated in MOTUS. Instantaneous body mass–specificpower output for level locomotion can be calculated as the product of instantaneousvelocity and instantaneous acceleration, and is derived by using the following for-mulas:
Power output = rate of doing work = force × distance/time = force × velocity
and
Force = mass × acceleration
Then,
Power output = mass × acceleration × velocity
and
Body mass–specific power output = acceleration × velocity
Because the animals were running at an angle of 45º, we had to take into accountgravitational forces. Specifically, we used the following formula to calculate bodymass–specific power output:
Power output (W Kg–1 body mass) = [(instantaneous acceleration) + (acceleration due to gravity × cos 45º)] × instantaneous velocity
3209_C012.fm Page 256 Thursday, November 10, 2005 10:48 AM

Power Generation during Locomotion in Anolis Lizards 257
The maximal value of body mass–specific power output was selected from eachsequence.
To estimate peak muscle mass–specific power output, we took into accountwhich step in each running sequence was associated with peak body mass–specificpower output. If peak power output occurred within the first step, then both hindlimbs were considered to be generating the propulsion because lizards typicallystarted running from standstill with both hind limbs pushing off the substrate simul-taneously. Muscle mass–specific power output was then calculated as bodymass–specific power output divided by the ratio of the propulsive muscle mass ofboth hind limbs to total body mass. However, if peak power output occurred in latersteps, then only one hind limb at a time was responsible for generating propulsion,and muscle mass–specific power output was calculated by dividing body mass–spe-cific power output by the ratio of the propulsive muscle mass of only one hind limbto total body mass. The front limbs were not considered as contributing to thepropulsion because they do not contribute to acceleration [27].
As an estimate of an individual’s maximal muscle mass–specific power output,we selected the single highest peak muscle mass–specific power output from all thesequences for that individual, i.e., one value per individual. We subsequently aver-aged these values per species. We refer to this variable as “muscle mass–specificpower output during running.”
12.2.4 JUMPING TRIALS
Jumping trials were performed on the same individuals and under similar laboratorysettings as the running trials. As opposed to running, jumping is a single, discreteevent making it possible to use a force platform to record the forces and ultimatelypower output (see further). We recorded forces of individual lizards jumping froma custom-made force platform to a branch positioned just outside the presumed reachof the individual (see Ref. [26] for detailed description). The lizards were inducedto jump by clapping our hands or by tapping slightly on the tail. Prior to experi-mentation, lizards were placed in an incubator set at 28ºC for A. gundlachi and 32ºCfor all the other species for at least 1 h [26,28]. Each animal was subjected to fiveseparate trials, each on a different and nonconsecutive day. In each trial, we inducedthe lizard to perform as many separate jumps as possible until it was exhausted. Inmost cases, the animals performed three or more good jumps per trial. Bodymass–specific peak (i.e., instantaneous) power output was calculated using an algo-rithm written in Superscope 11 (see Ref. [26,28] for details of the calculations).Because lizards always used both hind limbs to push off the substrate during jumping,we calculated muscle mass–specific power output by taking into account the pro-pulsive force of two hind limbs as described above. As an estimate of an individual’smaximal muscle mass–specific power output, we selected the single highest instan-taneous muscle mass–specific power output from all jumping trials for that individ-ual, i.e., one value per individual. We subsequently averaged these values per species.We refer to this variable as “muscle mass–specific power output during jumping.”
For two of the species (A. valencienni and A. carolinensis), jumping trials werefilmed in lateral view at 250 frames s–1 using the Redlake camera.
3209_C012.fm Page 257 Thursday, November 10, 2005 10:48 AM

258 Ecology and Biomechanics
12.2.5 CONFIGURATION OF HIND LIMBS
We quantified three joint angles for the two species (A. valencienni and A. carolin-ensis) for which movies of both running and jumping were available. In both cases,we only used those sequences in which the individual was producing the highestpower output. For the running trials, joint angles were quantified on the frame offootfall of the step in which peak power was reached; in those sequences in whichpeak power was reached in the first step, joint angles were quantified on the frameprior to the start of any movement. For jumping trials, we used the last frame priorto the start of the jump.
The frames were subsequently imported into CorelDraw (version 10; CorelCorporation 2000), and four lines were drawn connecting (1) the hip to the shoulder,(2) the knee to the hip, (3) the ankle to the knee, and (4) the base of the second toeto the ankle. We then calculated the three angles between the different lines, i.e.,the hip, knee, and ankle angles (Figure 12.1).
12.2.6 ECOLOGY
We quantified the time each species spent off the ground, i.e., its degree of arbore-ality, by observing individual lizards in their natural habitat. Observations were doneon the same populations as those sampled for the locomotor trials. Whenever weobserved an animal, we noted the substrate type (ground, leaf litter, grass, trunk,branch, or boulder or stone wall) and dimensions (height and width) of the perch it
FIGURE 12.1 Lateral view and stick figures of A. valencienni. (A) Footfall prior to peakpower (running). (B) Takeoff (jumping). In the right panel, the stick figure (enlarged) is shownwith the three two-dimensional angles that were measured. Numbers refer to anatomicallandmarks on the body: (1) shoulder, (2) pelvis, (3) knee, (4) ankle, and (5) base of the secondtoe.
12 3
45
12
3
4
5
(B)
(A)
3209_C012.fm Page 258 Thursday, November 10, 2005 10:48 AM

Power Generation during Locomotion in Anolis Lizards 259
was on at first sight. An individual was subsequently scored as being “on the ground”if the substrate type was ground, leaf litter, or grass; perch height was less than 10cm; and perch width was greater than 400 cm. We subsequently approached thelizard and noted in which direction it fled (up, down, or horizontally).
As an estimate of “degree of arboreality,” we used the ratio of number ofobservations the individual lizards were not sitting on the ground against the totalnumber of observations for that species. As an estimate of “proportion of observa-tions fleeing upward,” we used the ratio of number of observations fleeing upwardagainst the total number of observations for that species.
Each individual was only observed once. Except for A. garmani, only observa-tions on males were included in the analyses. Since we were unable to observe anyundisturbed A. garmani male in the field, we used observations on females instead.
12.2.7 STATISTICAL ANALYSIS
Because the values for the variables under study were not normally distributed,muscle mass–specific power output during running and jumping and all morpholog-ical variables were logarithmically (log10) transformed and the ecological variableswere transformed by taking their arcsine [29] before statistical analyses.
To compare muscle mass–specific power output during running to musclemass–specific power output during jumping for all 10 species, we performed a two-way ANOVA with the locomotor mode (i.e., running or jumping) and species as thefactors. Two species, A. carolinensis and A. valencienni, were further analyzed indetail for two reasons: (1) They showed marked differences in muscle mass–specificpower output during running and jumping (see Section 12.3), and (2) movies of bothjumping and running were available, thus allowing the quantification of the two-dimensional joint angles. For just A. carolinensis and A. valencienni, we repeatedthe two-way ANOVA as described above. Since the analysis showed a significantlocomotor mode–species interaction effect and species effect (see Section 12.3 fordetails), we performed one-way ANOVA (with species as factor) on the three jointangles for each locomotor mode separately.
We followed the procedure described below to test whether muscle mass–specificpower output during running and/or jumping were intercorrelated and whether thevariation in muscle mass–specific power output was explained by the variation inecology (i.e., degree of arboreality and proportion of time escaping upward). In thelatter case, we only used the maximal muscle mass–specific power output for eachspecies, regardless of whether it was attained running or jumping. We refer to thisvariable as “maximal muscle mass–specific power output.”
Because species share parts of their evolutionary history, they cannot be regardedas independent data points in statistical analyses [30–32]. Various methods andcomputer programs have been developed over the years, however, in which phylo-genetic relationships among different species are taken into account in statisticalanalyses [30–33]. In this study, we used the independent contrast approach [30,31].
We calculated the standardized independent contrasts using the PDTREE pro-gram [34] on the transformed means per species of muscle mass–specific poweroutput during running and jumping, maximal muscle mass–specific power output
3209_C012.fm Page 259 Thursday, November 10, 2005 10:48 AM

260 Ecology and Biomechanics
snout-vent length (SVL), degree of arboreality, and proportion of time escapingupward. We subsequently performed two multiple regression analyses (backwardmethod). In the first regression, we used the contrasts in muscle mass–specific poweroutput during running as the dependent variable and the contrasts in muscle mass–specific power output during jumping as the independent variable. In the secondregression, we used the contrasts in maximal muscle mass–specific power output asthe dependent variable, and the contrasts in SVL, degree of arboreality, and propor-tion of time escaping upward as the independent variables. All the regressions wereforced through the origin [35].
The independent contrast method requires information on the topology andbranch lengths of the phylogenetic tree. The phylogeny of the 10 Anolis speciesunder study here is based on a phylogenetic analysis of a much larger number ofanole species by Harmon et al. [36], using mitochondrial DNA sequences (Figure12.2). Branch lengths are available upon request from L. Harmon. Moreover, checksof branch lengths, using the diagnostics in the PDTREE program, did not show anysignificant correlation between the absolute values of the standardized contrasts andtheir standard deviations [35]. Recently, the phylogenetic relationships among Anolislizards have been reexamined, resulting in minor changes [37]. Because, however,branch lengths have not been made available for this phylogeny, we preferred to usethe phylogeny data of Harmon et al. [35].
12.3 RESULTS
The 10 species varied 10-fold in body mass, 15-fold in hind limb muscle mass, andabout 2-fold in muscle mass–specific power output both during running and jumping(Table 12.1). As for interspecific variation in field behavior, the degree of arboreality
FIGURE 12.2 Phylogenetic tree of the 10 Anolis species used in this study. Relationshipsare based on mitochondrial DNA data by Harmon L.J. et al., Science, 301, 961, 2003. Branchlengths are not to scale.
A. pulchellus
A. gundlachi
A. evermanni
A. distichus
A. grahami
A. garmani
A. lineatopus
A. valencienni
A. sagrei
A. carolinensis
3209_C012.fm Page 260 Thursday, November 10, 2005 10:48 AM

Power Generation during Locomotion in Anolis Lizards 261
varied between 45 and 100%, while the incidence of escaping upward varied between27 and 100% (Table 12.1).
The 10 species of Anolis lizards differed significantly in muscle mass–specificpower output (two-way ANOVA, species effect, F9,178 = 9.76, p < 0.0001) (Figure12.3). Muscle mass–specific power output, however, did not differ between jumpingand running (two-way ANOVA, locomotor mode effect, F1,178 = 0.06, p = 0.80), andthe difference among species was similar in both locomotor modes (two-wayANOVA, locomotor mode–species effect, F9,178 = 1.56, p = 0.13). Additionally, thecontrasts in muscle mass–specific power output during running were positivelycorrelated with the contrasts in muscle mass–specific power output during jumping(r = 0.86, F1, 8 = 6.94, p = 0.030) (Figure 12.4).
A multiple regression model (backward method) with the independent contrastsof maximal muscle mass–specific power output as the dependent variable and theindependent contrasts of SVL, degree of arboreality, and proportion of time escapingupward as independent variables was performed; only an analysis of the latterindependent variable was found to be significant (r = 0.68, F1,8 = 7.05, p = 0.029).Thus, only the variation in (contrasts in) the relative numbers escaping upwardexplained a significant proportion of the variation in (contrasts in) maximal musclemass–specific power (Figure 12.5). Separate bivariate regressions showed the sameresults, i.e., only the contrasts in proportion of time escaping upward show a sig-nificant correlation with the contrasts in maximal power output.
In the two-species comparison, muscle-mass specific power output differedsignificantly between A. carolinensis and A. valencienni (two-way ANOVA, specieseffect, F1,31 = 4.71, p = 0.038), and the interspecific difference in muscle mass–spe-cific power output varied significantly according to locomotor mode (two-wayANOVA, locomotor mode–species effect, F1,31 = 4.88, p = 0.035). Muscle mass–spe-cific power output during running, however, did not differ significantly from themuscle mass–specific power output during jumping (two-way ANOVA, locomotormode effect, F1,31 = 0.12, p = 0.73). Because there were no significant differencesin power output between locomotor modes, only between species, we further com-pared muscle mass–specific power output for each locomotor mode separatelybetween the two species using one-way ANOVA. During running, muscle mass–spe-cific power output did not differ between A. carolinensis and A. valencienni (one-way ANOVA, F1,26 = 0.94, p = 0.34). Muscle mass–specific power output duringjumping, on the other hand, was significantly greater in A. valencienni than in A.carolinensis (one-way ANOVA, F1,21 = 5.31, p = 0.031).
Because of the significant species–locomotor mode interaction effect and specieseffect (two-way ANOVA, see above), we compared the three joint angles for thetwo species for each locomotor mode seperately using one-way ANOVA. For run-ning, both the hip and knee angle were not significantly different between A. valen-cienni and A. carolinensis (one-way ANOVA for both, F1,16 < 0.27, p > 0.61). Theankle angle in running trials, however, was significantly smaller in A. valencienni(F1,16 = 5.76, p = 0.029). For jumping, all three joint angles were significantlydifferent between the two species (hip: F1,18 = 11.84, p = 0.003; knee: F1,18 = 38.11,p < 0.0001; ankle: F1,18 = 15.55, p = 0.001). Whereas the femur was more protracted
3209_C012.fm Page 261 Thursday, November 10, 2005 10:48 AM

262Eco
logy an
d B
iom
echan
ics
TABLE 12.1Descriptive Statistics for Muscle Mass–Specific Power during Running and Jumping Trials, Propulsive Muscle Mass (of One Hind Limb), Body Mass, Degree of Arboreality, and Proportion of Time Escaping Upward per Species
Species
Muscle Mass–Specific Power (W kg–1) Mass (g) Field Behavior
N Running N Jumping N Muscle Body N Arboreality Escaping up
A. pulchellus 16 574.32 ± 26.96 5 472.26 ± 36.49 2 0.076 ± 0.003 2.37 ± 0.07 23 0.78 0.43A. gundlachi 18 524.84 ± 44.98 6 516.42 ± 65.83 3 0.317 ± 0.030 6.68 ± 0.21 35 0.97 0.69A. evermanni 15 671.71 ± 46.25 3 767.66 ± 17.85 3 0.201 ± 0.006 5.42 ± 0.35 23 0.83 0.48A. distichus 12 735.46 ± 61.73 5 647.43 ± 13.32 3 0.075 ± 0.025 2.97 ± 0.15 25 1 0.72A. grahami 13 438.26 ± 40.47 4 601.50 ± 64.28 3 0.241 ± 0.040 5.54 ± 0.13 23 0.86 0.78A. garmania 8 570.55 ± 57.59 7 598.01 ± 58.51 1 1.054 26.31 6 1 0.83A. lineatopus 14 540.73 ± 37.91 10 543.98 ± 31.94 1 0.247 5.19 14 0.93 0.42A. valencienni 8 725.21 ± 70.36 8 848.71 ± 57.82 2 0.159 ± 0.021 6.93 ± 0.96 5 1 1A. sagrei 19 419.61 ± 24.49 9 373.68 ± 39.69 2 0.226 ± 0.057 4.19 ± 0.45 22 0.45 0.27A. carolinensis 12 714.90 ± 37.32 7 595.91 ± 89.60 3 0.222 ± 0.012 7.33 ± 0.33 30 0.97 0.57
Note: Given are the number of individuals (N) and — where applicable — means and standard errors (mean ± SE) per species.
a Observations of behavior are of females only. We were unable to gather data on males for this species.
3209_C012.fm
Page 262 T
hursday, Novem
ber 10, 2005 10:48 AM

Power Generation during Locomotion in Anolis Lizards 263
FIGURE 12.3 Mean and standard error of muscle mass–specific power output during running(closed symbols) and jumping (open symbols) per species. Species are ordered from low tohigh incidence of escaping upward when confronted with a (human) predator.
FIGURE 12.4 Regression through the origin of the independent contrasts (IC) of musclemass–specific power output during running against the independent contrasts of musclemass–specific power output during jumping (r = 0.86, p = 0.030).
Species
A. sagre
i
A. lineatop
us
A. pulch
ellus
A. everm
anni
A. carol
inensis
A. gundlachi
A. dist
ichus
A. grahami
A. garm
ani
A. valen
cienni
Mus
cle
mas
s-sp
ecifi
c po
wer
(Wkg
–1)
300
400
500
600
700
800
900
1000Running Jumping
IC muscle mass-specific power output: jumping–0.2 –0.1 0.0 0.1 0.2 0.3
IC m
uscl
e m
ass-
spec
ific
pow
erou
tput
: run
ning
–0.20
–0.15
–0.10
–0.05
0.00
0.05
0.10
0.15
0.20
3209_C012.fm Page 263 Thursday, November 10, 2005 10:48 AM

264 Ecology and Biomechanics
in A. valencienni, the knee and ankle angle in this species were significantly smallerthan in A. carolinensis (Figure 12.6).
12.4 DISCUSSION
The aim of this study was to investigate whether muscle mass–specific power outputhas evolved within a closely related group of organisms in response to variation inmicrohabitat use and behavior. To our knowledge, ours is the first study that quan-titatively links the variation in muscle power output to variation in ecology using acomparative approach. Our data show that muscle mass–specific power output variesconsiderably among species (more than twofold) and is indeed linked to the ecologyand behavior of the species investigated.
12.4.1 ECOLOGICAL CORRELATES OF POWER OUTPUT
Our results show a significant correlation between maximal power output and ecol-ogy across 10 species of Anolis lizards. More specifically, the evolution toward ahigher incidence of escaping upward has been parallelled by the evolution towardhigher muscle mass–specific power output. Muscle mass–specific power output,however, does not seem to correlate with an arboreal lifestyle per se. Anolis lizardsare typically “active” lizards that run and jump around their natural habitat to searchfor food and/or partners, to defend their territories, or to escape predators [21].However, it is clear that, on top of the large ecological variation, such as the degreeof arboreality, there is also a large behavioral variation, such as antipredator behavior.Moreover, perching off the ground does not necessarily mean that the animals moveup and down a lot, i.e., in a vertical direction. While some species typically jumpdown to other trees or to the ground, others “squirrel” to the opposite side of the
FIGURE 12.5 Regression through the origin of independent contrasts of maximal musclemass–specific power output against the independent contrasts of the proportion of time lizardsescape upward (r = 0.68, p = 0.029). Evolution toward higher incidence of escaping upwardhas been parallelled by evolution toward higher power outputs among the 10 Anolis species.
IC proportion of time escaping up–0.8 –0.6 –0.4 –0.2 0.0 0.2 0.4 0.6 0.8
IC m
axim
al m
uscl
e m
ass-
spec
ific
pow
er o
utpu
t
–0.2
–0.1
0.0
0.1
0.2
0.3
3209_C012.fm Page 264 Thursday, November 10, 2005 10:48 AM

Power Generation during Locomotion in Anolis Lizards 265
trunk, i.e., stay at the same height, and/or run up [38]. In our sample, for instance,A. lineatopus typically does not escape upward when confronted with a (human)predator while A. valencienni does, although both show similar degrees of arbore-ality. Moreover, maximal power output is greater in A. valencienni (see Table 12.1for raw values). Thus, it seems that higher power outputs are selected for in arborealmicrohabitats, specifically in those species that frequently need to move rapidly byrunning or jumping against gravity.
12.4.2 INTERSPECIFIC VARIATION
When comparing all 10 species, we found no overall difference in muscle mass–spe-cific power output between jumping and running. Moreover, both power outputsseem to have coevolved. This might be explained by the fact that the same musclesare used in running and jumping.
Still, it is striking that even within a very closely related group of lizards suchas Anolis lizards, large variation in muscle mass–specific power output exists. In oursample of 10 species, muscle mass–specific power output varies between 374 and849 W kg–1, i.e., more than a twofold difference (Table 12.1). In general, differencesin maximal power output, when executing the same task, are attributed to differencesin the physiological properties of the muscle. At the moment, we do not have dataon the physiology, for example muscle fiber–type of the different muscles in the
FIGURE 12.6 Plot of two-dimensional angles at footfall in running trials (left) and takeoffin jumping trials (right) for A. valencienni and A. carolinensis. Shown are means and standarderror bars. For running, only the ankle angle differs between the two species (F = 5.76, p =0.029), whereas all three angles differed significantly for jumping (all F > 11.84, all p <0.003). Stick figures representing the mean configuration of the limb segments during runningand jumping, per species are shown in the top panel. ● = hip; � = knee; � = ankle.
0
–20
20
40
60
80
100
120
140
Running Jumping
Ang
le (°
)
A. valen
cienni
A. carol
inensis
A. valen
cienni
A. carol
inensis
3209_C012.fm Page 265 Thursday, November 10, 2005 10:48 AM

266 Ecology and Biomechanics
different species. However, it does seem likely that differences in muscle fiber–typecomposition are present because similar results have been found in other lizardspecies [11,39]. On the contrary, while (theoretically) also being of great importanceto muscular power output, the configuration of the musculoskeletal system, such asthe origin and insertion of the muscles, is generally considered to be more conser-vative, i.e., less variation is found among species. We have some evidence that thismight not be the case among Anolis lizards. When comparing the hind limb mus-culature of two extreme Anolis species — a ground–trunk anole, A. sagrei, and atwig anole, A. valencienni — we found distinct differences in the insertion of thehip retractor and knee extensor muscles between these two species [40]. Thus, ourlimited data set on Anolis lizards at least suggests that muscular morphology mightbe more variable than previously thought.
Surprisingly, the values for muscle mass–specific power output we find for someAnolis species, such as jumping in A. valencienni, are within the range of so-calledextremely high power outputs in jumping frogs [41,42] and flying or running birds[5,10,43]. In the past, it has been generally assumed that power amplifiers arenecessary to produce such high powers at the whole animal level [18,41,42].Recently, however, it has been shown that power outputs of around 1000 W kg–1 arepossible at the muscular level [5,44]. Although likely, it remains to be tested whetherin Anolis lizards high power outputs at the whole animal level reflect power outputat the muscular level. However, our data do show that high power outputs, i.e., inthe range of 500 to 800 W kg–1, might not be as exceptional as previously claimed[5,10,41–43].
12.4.3 POWER OUTPUT DURING RUNNING AND JUMPING:A TWO-SPECIES COMPARISON
The comparison between A. carolinensis and A. valencienni shows that while musclemass–specific power output is similar during running, it differs significantly duringjumping. We suggest that biomechanical differences lie at the basis of this discrep-ancy. While the configuration of the hind limb segments is similar in both speciesin running trials, it differs greatly in jumping events. In the species producing thehighest muscle mass–specific power during jumping, i.e., A. valencienni, the femuris significantly more protracted, i.e., the hip angle is negative (Figure 12.6), whilethe knee and ankle are more flexed, i.e., the knee and ankle angles are smaller (Figure12.6). Could these differences be responsible for the differences in muscle mass–spe-cific power output between the two species? The different configuration of the hindlimbs may indeed result in changes in the instantaneous moment arms of the hipretractors and knee and ankle extensors that power locomotion. For example, inspec-tion of Figure 12.6 shows that in, e.g., A. valencienni, the femur is maximallyprotracted. In this configuration, the dominant femur retractor (m. caudofemoralis)has a negligible moment arm and initially cannot contribute to femur retraction. Thisopens up the possibility for elastic energy storage in the broad tendon of the M.caudofemoralis inserting on the femur. However, for this to be the case, the musclehas to be active prior to femur retraction such that energy can effectively be stored.In A. carolinensis, the femur is significantly less protracted prior to the onset of the
3209_C012.fm Page 266 Thursday, November 10, 2005 10:48 AM

Power Generation during Locomotion in Anolis Lizards 267
jump and may thus have less potential for energy storage. Although these differencesmay explain the observed differences in power output (and also the magnitude ofpower output in these animals), this hypothesis needs to be investigated further byelectromyographic and sonometric recordings of the M. caudofemoralis duringjumping.
ACKNOWLEDGMENTS
We would like to thank Daniel Ballow, Esteban Toro, and Margarita Ramos for theirtremendous help with hours and hours of digitization, Kiisa Nishikawa (NorthernArizona University) for use of the high-speed JVC camera, and the organizers ofthe symposium “Ecology and Biomechanics” at the Annual Meeting of the Societyof Experimental Biology (2004) for the invitation to contribute to their symposiumand book. Luke Harmon provided the information on the topology and branch lengthsof the phylogenetic tree. Esteban Toro and Jay Meyers kindly let us use their high-speed movies of jumping A. valencienni and A. carolinensis. Bieke Vanhooydonckand Anthony Herrel are postdoctoral fellows of the Fund for Scientific ResearchFlanders (FWO-Vl). This work was supported by NSF grants to Duncan Irschick(IBN 9983003 and 0421917).
REFERENCES
1. James, R.S., Atringham, J.D., and Goldspink, D.F., The mechanical properties of fastand slow skeletal muscles of the mouse in relation to their locomotory function,J. Exp. Biol., 198, 491, 1995.
2. Marsh, R.L., How muscles deal with real-world loads: the influence of length trajec-tory on muscle performance, J. Exp. Biol., 202, 3377, 1999.
3. Askew, G.N. and Marsh, R.L., The effects of length trajectory changes on the mechan-ical power output of mouse skeletal muscles, J. Exp. Biol., 200, 3119, 1997.
4. Askew, G.N. and Marsh, R.L., Optimal shortening velocity (V/Vmax) of skeletal muscleduring cyclical contractions: length-force effects and velocity-dependent acitvationand deactivation, J. Exp. Biol., 201, 1527, 1998.
5. Askew, G.N. and Marsh, R.L., The mechanical power output of the pectoralis muscleof blue-breasted quail (Coturnix chinensis): the in vivo length cycle and its implica-tions for muscle performance, J. Exp. Biol., 204, 3587, 2001.
6. Lutz, G.J. and Rome, L.C., Built for jumping: the design of the frog muscular system,Science, 263, 370, 1994.
7. Askew, G.N. and Marsh, R.L., Muscle designed for maximum short-term poweroutput: quail flight muscle, J. Exp. Biol., 205, 2153, 2002.
8. Biewener, A.A., Future directions for the analysis of musculoskeletal design andlocomotor performance, J. Morphol., 252, 38, 2002.
9. Wakeling, J.M. and Johnston, I.A., Muscle power output limits fast-start performancein fish, J. Exp. Biol., 201, 1505, 1998.
10. Askew, G.N., Marsh, R.L., and Ellington, C.P., The mechanical power of the flightmuscles of blue-breasted quail (Coturnix chinensis) during take-off, J. Exp. Biol.,201, 3601, 2001.
3209_C012.fm Page 267 Thursday, November 10, 2005 10:48 AM

268 Ecology and Biomechanics
11. Kohlsdorf, T. et al., Locomotor performance of closely related Tropidurus species:relationships with physiological parameters and ecological divergence, J. Exp. Biol.,207, 1183, 2004.
12. Ellerby, D.J., Spierts, I.L.Y., and Altringham, J.D., Slow muscle power output ofyellow- and silver-phase European eels (Anguilla anguilla L.): changes in muscleperformance prior to migration, J. Exp. Biol., 204, 1369, 2001.
13. Wilson, R.S., Franklin, C.E., and James, R.S., Allometric scaling relationships ofjumping performance in the striped marsh frog Limnodynastes peronii, J. Exp. Biol.,203, 1937, 2000.
14. Gillis, G.B. and Biewener, A.A., Hindlimb extensor muscle function during jumpingand swimming in the toad (Bufo marinus), J. Exp. Biol., 203, 3547, 2000.
15. Biewener, A.A. and Corning, W.R., Dynamics of mallard (Anas platyrhynchos) gas-trocnemius function during swimming versus terrestrial locomotion, J. Exp. Biol.,204, 1745, 2001.
16. Hedrick, T.L., Tobalske, B.W., and Biewener, A.A., How cockatiels (Nymphicushollandicus) modulate pectoralis power output across flight speeds, J. Exp. Biol.,206, 1363, 2003.
17. Hedrick, T.L., Usherwood, J.R., and Biewener, A.A., Wing inertia and whole-bodyacceleration: an analysis of instantaneous aerodynamic force production in cockatiels(Nymphicus hollandicus) flying across a range of speeds, J. Exp. Biol., 207, 1689,2004.
18. Aerts, P., Vertical jumping in Galago senegalensis: the quest for a hidden poweramplifier, Phil. Trans. R. Soc. B., 353, 1607, 1998.
19. Vanhooydonck, B., et al., Effects of substrate structure on speed and accelerationcapacity in climbing geckos, Biol. J. Linn. Soc., 85, 385, 2005.
20. Irschick, D.J. et al., Effects of loading and size on maximum power output and gaitcharacteristics in geckos, J. Exp. Biol., 206, 3923, 2003.
21. Irschick, D.J. and Losos, J.B., A comparative analysis of the ecological significanceof maximal locomotor performance in Caribbean Anolis lizards, Evolution, 52, 219,1998.
22. Rand, A.S., The ecological distribution of the anoline lizards around Kingston,Jamaica, Breviora, 272, 1, 1967.
23. Schoener, T.W., The Anolis lizards of Bimini: resource partitioning in a complexfauna, Ecology, 49, 704, 1968.
24. Williams, E.E., Ecomorphs, faunas, island size, and diverse end points in islandradiations of Anolis, in Lizard Ecology: Studies of a Model Organism, Huey, R.B. etal., Eds., Harvard University Press, Cambridge, 1983, p. 326.
25. Losos, J.B., Ecomorphology, performance capability, and scaling of West IndianAnolis lizards: an evolutionary analysis, Ecol. Mon., 60, 1990.
26. Toro, E. et al., A biomechanical analysis of intra- and interspecific scaling of jumpingbiomechanics and morphology in Caribbean Anolis lizards, J. Exp. Biol., 206, 2641,2003.
27. Aerts, P. et al., Bipedalism in lizards: whole-body modelling reveals a possiblesprandrel, Phil. Trans. R. Soc. B., 358, 1525, 2003.
28. Toro, E., Herrel, A., and Irschick, D.J., The evolution of jumping performance inCaribbean Anolis lizards: solutions to biomechanical trade-offs, Am. Nat., 163, 844,2004.
29. Sokal, R.R. and Rohlf, F.J., Biometry: The Principals and Practice of Statistics inBiological Research, 3rd ed., W.H. Freeman, New York, 1995, p. 859.
30. Felsenstein, J., Phylogenies and the comparative method, Am. Nat., 125, 1, 1985.
3209_C012.fm Page 268 Thursday, November 10, 2005 10:48 AM

Power Generation during Locomotion in Anolis Lizards 269
31. Felsenstein, J., Phylogenies and quantitative characters, Ann. Rev. Ecol. Syst., 19,445, 1988.
32. Harvey, P.H. and Pagel, M.D., The Comparative Method in Evolutionary Biology,Oxford University Press, Oxford, 1991, p. 248.
33. Losos, J.B. and Miles, D.B., Adaptation, constraint, and the comparative method:phylogenetic issues and methods, in Ecological Morphology: Integrative OrganismalBiology, Wainwright, P.C. and Reilly, S.M., Eds., University of Chicago Press, Chi-cago, 1994, p. 60.
34. Garland, T., Jr., Midford, P.E., and Ives, A.R., An introduction to phylogeneticallybased statistical methods, with a new method for confidence intervals on ancestralstates, Am. Zool., 39, 374, 1999.
35. Garland, T., Jr., Harvey, P.H., and Ives, A.R., Procedures for the analysis of compar-ative data using phylogenetically independent contrasts, Syst. Biol., 41, 18, 1992.
36. Harmon, L.J. et al., Tempo and mode of evolutionary radiation in Iguanian lizards,Science, 301, 961, 2003.
37. Nicholson, K.E. et al., Mainland colonization by island lizards, J. Biogeogr., 32, 1,2005.
38. Regalado, R., Approach distance and escape behavior of three species of Cuban Anolis(Squamata, Polychrotidae), Carib. J. Sci., 34, 211, 1998.
39. Bonine, K.E., Gleeson, T.T., and Garland, T. Jr., Comparative analysis of fiber-typecomposition in the iliofibularis muscle of phrynosomatid lizards (Squamata), J. Mor-phol., 250, 265, 2001.
40. Herrel, A., unpublished data, 2005.41. Marsh, R.L. and John-Alder, H.B., Jumping performance of hylid frogs measured
with high-speed cine film, J. Exp. Biol., 188, 131, 1994.42. Peplowski, M.M. and Marsh, R.L., Work and power output in the hindlimb muscles
of Cuban tree frogs Osteopilus septentrionalis during jumping, J. Exp. Biol., 200,2861, 1997.
43. Roberts, T.J. and Scales, J.A., Mechanical power output during running accelerationsin wild turkeys, J. Exp. Biol., 205, 1485, 2002.
44. Curtin, N., Woledge, R., and Aerts, P., Muscle directly meets the vast power demandsin agile lizards, Proc. Roy. Soc. Lond. B., 272, 581, 2005.
3209_C012.fm Page 269 Thursday, November 10, 2005 10:48 AM


271
13 Implications of Microbial Motility on Water Column Ecosystems
Karen K. Christensen-Dalsgaard
CONTENTS
13.1 Introduction ..................................................................................................27113.1.1 Microbial Ecology in a Larger Context ..........................................273
13.2 Generating Motion with Cilia or Flagella ...................................................27513.2.1 Smooth Flagella ...............................................................................27513.2.2 Hispid Flagella .................................................................................27613.2.3 Cilia ..................................................................................................277
13.3 The Energetics of Motion ............................................................................27813.4 Feeding Mechanisms....................................................................................282
13.4.1 The Coexistence of Filter Feeders...................................................28413.4.2 Attaching to Particles while Feeding...............................................288
13.5 Orientation to Stimuli ..................................................................................290Acknowledgments..................................................................................................293References..............................................................................................................293
13.1 INTRODUCTION
All aquatic bodies in the world, from the smallest forest ponds to the open ocean,house complex and diverse microbial ecosystems. When it comes to things such asnumber of species and carbon and nutrient turnover, unicellular organisms com-pletely dominate many aquatic ecosystems, and organisms on the size scale of fishare only minor players, contributing little to the overall balance. In environmentsdominated by open water, such as marine systems and those of large lakes, most ofthe photosynthetic activity is carried out by microscopic phytoplankton cells. Inmany ways, the microbial biota is as fascinating and complex as the apparently moreflashy systems of tropical forests or coastal marine macroscopic ecosystems.
Pelagic microbial biota differ from systems of larger organisms in many respects.At the microbial level, aquatic systems are highly heterogeneous, and microorgan-isms live in and are adapted to a world of alternating feasts and famines [1]. Thisrequires an ability to survive the famines as well as an ability to move in response
3209_C013.fm Page 271 Thursday, November 10, 2005 10:49 AM

272 Ecology and Biomechanics
to chemical gradients, which the microorganisms cannot perceive over the length oftheir bodies, in order to utilize the patchy resources. Microorganisms function atvery low Reynolds numbers and thus in an environment entirely dominated byviscous forces; typically, microorganisms are too small to have sensory organs withwhich they can perceive prey unless they make contact with them. This leaves themonly a few possible means of locomotion and feeding. Nevertheless, a large anddiverse range of morphologies has developed (Figure 13.1), and numerous species
FIGURE 13.1 The diversity of the microbes represented by four genera, not drawn to scale.(A) Diaphanoeca, a flagellate with a smooth flagellum and a “cage” around the cell thatincreases the drag on the organism and thus the filtration efficiency (see Section 13.4.2). (B)Paraphysomonas, a flagellate with one short, smooth flagellum, one hispid flagellum (seeSection 13.2), and a cell body covered by silica spikes. (C) The ciliate Tintinnidium incorpo-rates agglutinated material into its lorica and has most of its cilia confined to its anterior end.(D) Pleuronema has a cell body entirely covered by cilia.
3209_C013.fm Page 272 Thursday, November 10, 2005 10:49 AM

Implications of Microbial Motility on Water Column Ecosystems 273
that occupy apparently similar niches coexist. As in other ecosystems, the peculiarcharacteristics of microbial ecosystems are nothing but a sum of the characteristicsof each of the individual organisms of which it is composed and their response tothe prevailing environment. Unlike systems of larger organisms, however, the micro-bial biota benefits from an absence of complex behavioral responses. Because ofthis, the characteristics of these ecosystems can in principle be understood directlyfrom the mechanics and physiology of the individual organisms and their (to a largeextent) predictable responses to stimuli.
In this chapter, I review some aspects of the existing knowledge on this topicand present some new calculations. I focus on pelagic systems and organisms thatswim by cilia and flagella, which is the case for almost all motile pelagic microbes.I do not consider factors affecting the photosynthetic rate of autotrophic protozoabut deal only with the heterotrophic aspects of the microbial ecosystem. Unlikelarger organisms, the distinction between autotrophic and heterotrophic in the micro-bial world is not clear. Many heterotrophic flagellates also contain chloroplasts [2];even within the same species, there may be individuals with or without chloroplasts.However, because autotrophic flagellates are capable of ingesting particles at ratessimilar to those of apochlorotic flagellates [2,3], in this review they are groupedtogether with the rest of the heterotrophic flagellates.
13.1.1 MICROBIAL ECOLOGY IN A LARGER CONTEXT
It is well known that the classical textbook food chain of phytoplankton being eatenby copepods being eaten by fish and so forth is a huge oversimplification anddescribes at best only a minor part of the aquatic food chain [4]. Depending onconditions, 1 to 60% of the phytoplankton primary production is lost immediatelyas dissolved organic matter (DOM), probably mainly through lysing of phytoplank-ton cells [5–7]. Because of their small size and thus high surface to volume ratio,bacteria are highly efficient in the uptake of DOM [8], and the bacterial productionbased on phytoplankton exudates can be as much as 18 to 45% of the primaryproduction.
Heterotrophic protozoa such as flagellates and ciliates are efficient grazers onbacteria and other small particles. Through their large numbers and high volumespecific grazing rates, they are capable of clearing 3 to 100% of the entire watercolumn for small particles per day. The average values lie between 7 and 90%,depending on the area studied [9–12]. Much of the grazing seems to be carried outby minute eukaryotic organisms not much larger than bacteria [13]; this, however,varies. Flagellates are generally shown to be the most important grazers on bacteria;ciliates, like flagellates, mainly graze on larger particles, but ciliates can also beimportant bacteriovors [12]. The importance of heterotrophic microorganisms in theocean seems to vary with the season; they may mainly be important after the springbloom under summer stratification when the phytoplankton is dominated by smallforms [11]. Bacterial numbers remain fairly constant over time in marine systems,being typically around 0.5 to 3 × 10⁶ ml1; fluctuations in nutrient and DOM avail-ability are apparent instead in fluctuations in the numbers of bacterivorous protozoa.
3209_C013.fm Page 273 Thursday, November 10, 2005 10:49 AM
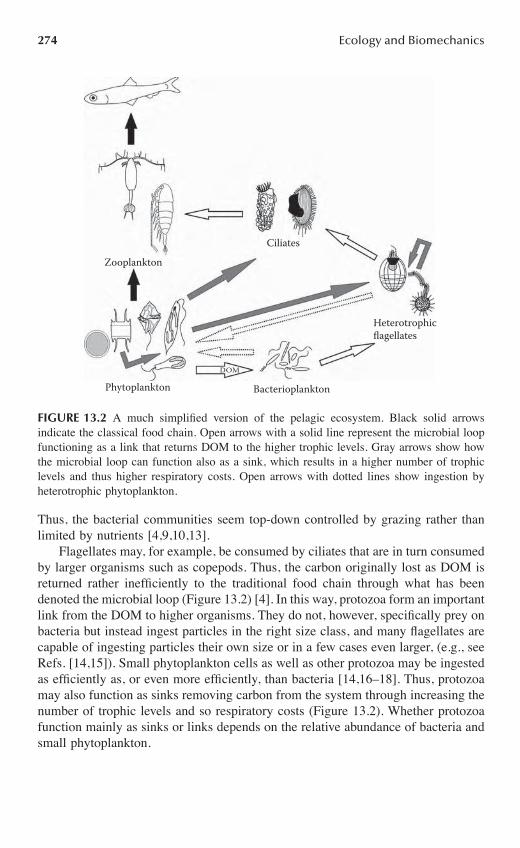
274 Ecology and Biomechanics
Thus, the bacterial communities seem top-down controlled by grazing rather thanlimited by nutrients [4,9,10,13].
Flagellates may, for example, be consumed by ciliates that are in turn consumedby larger organisms such as copepods. Thus, the carbon originally lost as DOM isreturned rather inefficiently to the traditional food chain through what has beendenoted the microbial loop (Figure 13.2) [4]. In this way, protozoa form an importantlink from the DOM to higher organisms. They do not, however, specifically prey onbacteria but instead ingest particles in the right size class, and many flagellates arecapable of ingesting particles their own size or in a few cases even larger, (e.g., seeRefs. [14,15]). Small phytoplankton cells as well as other protozoa may be ingestedas efficiently as, or even more efficiently, than bacteria [14,16–18]. Thus, protozoamay also function as sinks removing carbon from the system through increasing thenumber of trophic levels and so respiratory costs (Figure 13.2). Whether protozoafunction mainly as sinks or links depends on the relative abundance of bacteria andsmall phytoplankton.
FIGURE 13.2 A much simplified version of the pelagic ecosystem. Black solid arrowsindicate the classical food chain. Open arrows with a solid line represent the microbial loopfunctioning as a link that returns DOM to the higher trophic levels. Gray arrows show howthe microbial loop can function also as a sink, which results in a higher number of trophiclevels and thus higher respiratory costs. Open arrows with dotted lines show ingestion byheterotrophic phytoplankton.
Zooplankton
Phytoplankton Bacterioplankton
DOM
Heterotrophic flagellates
Ciliates
3209_C013.fm Page 274 Thursday, November 10, 2005 10:49 AM

Implications of Microbial Motility on Water Column Ecosystems 275
13.2 GENERATING MOTION WITH CILIA OR FLAGELLA
Microorganisms operate at Reynolds numbers (Re) << 1, and so in a world whereall fluid motions are reversible, they are excluded from any form of propulsion thatmakes use of the inertia of the water. Octopuses or jellyfish shrunk to the size ofprotozoa and trying to move would simply be moving back and forth on one spot.In order to move, microorganisms instead make use of the difference in drag of acylinder moving perpendicular compared to parallel to the flow; the resistance tonormal motions of a cylinder is somewhat higher than the resistance to tangentialmotions. This is the principle behind motion by smooth and hispid flagella as wellas cilia. Because of the insignificance of inertial effects at low Re, the motion of anobject is only possible as long as a force acts upon it. If one attempted at low Reto throw a ball, it would never leave the hand (see, e.g., Ref. [19]).
13.2.1 SMOOTH FLAGELLA
Because of the differences in drag, a moving cylinder tilted toward the direction ofmotion will exert a force on the fluid normal to the length of the cylinder (Figure13.3). This is the principle behind flagellar propulsion first noted by Taylor [20,21].Thus, contrary to appearance, the mechanics of flagellar motion is more closelyrelated to that of a snake moving through sand than that of eels or water snakesswimming. Motion is generated by the propagation of planar or three-dimensionalhelical waves along the length of the flagellum. This generates a force normal tothe segments of the flagellum that are tilted to the direction of the wave propagation(Figure 13.3). The propulsive effect depends on this force exceeding the retardingcomponents of tangential forces acting along the body [22–24].
FIGURE 13.3 The generation of motion with smooth (upper) or hispid (lower) flagella. Theblack arrows represent propulsive force or thrust, the gray arrow shows the direction offlagellar wave propagation, and the white arrows indicate the overall direction of the resultingfluid motion with respect to the cell.
3209_C013.fm Page 275 Thursday, November 10, 2005 10:49 AM

276 Ecology and Biomechanics
The fluid dynamics of bacterial and eukaryotic flagella are similar, but they differin all other respects. Eukaryote cilia and flagella are around 0.2 m in diameter andcomposed of the well-known 9 + 2 structure of inflexible microtubules that sliderelative to each other. The bacterial flagellum is about 0.02 m in diameter and isin itself completely immobile. It is composed of molecules of the protein flagellinthat form a hollow tube. Perhaps unique in the biological world, the bacterialflagellum rotates continuously around its own axis [25] because of two rings thatrotate relative to each other [26–28]. In this way, helical waves are propagated alongthe flagellum. Bacteria often have many flagella, which tend to form a bundle orbundles because beating filaments in the vicinity of each other tend to be synchro-nized through viscous coupling [20,29]. The flagella of this bundle are only separatedduring tumbles (see Section 13.5).
Both helical and planer waveforms have energetic disadvantages. In planarwaves, the segments of the flagellum nearly parallel to the wave direction produceonly drag and no thrust [30]. All segments of the helical waves produce thrust butalso generate a torque on the organism that must be counterbalanced by the counter-rotation of the cell body. This reduces the swimming speed proportionally to theeffective rotation rate [31]. It has been proposed that the body movements of micro-organisms rotated around their axis could contribute to the thrust in the manner ofa rotating inclined plane [32,33], but this contribution would in most cases benegligible [34]. One interesting exception is the bacterium Spirillum, which has aspiral-shaped body. It uses the flagella to generate a rotation of the cell body, whichthen moves through the fluid much in the manner of a corkscrew through a cork[35–37].
13.2.2 HISPID FLAGELLA
Hispid flagella have rigid hairs, or mastigonemes, protruding from the flagellum(Figures 13.1B and 13.3). They are curious in that they pull the cell body in thesame direction as that of the wave propagation, opposite to that of smooth flagella.This is because the movement of the individual mastigonemes produces thrust inthe direction of the cell body (Figure 13.3), and given sufficiently large numbers ofmastigonemes, it is predominantly these, and not the flagellum itself, that moves thefluid [38,39]. The number and characteristics of the mastigonemes required maydepend on the relative amplitude and wavelength of the flagellum [38,40,41]. The-oretically, only relatively inflexible mastigomenes should be capable of moving thefluid [39,42]. Dinoflagellates, however, have mastigonemes that appear flexible, andyet they always rotate counterclockwise in the direction of the flagellar beat of thetransverse flagellum [43]. Thus, it seems that our understanding of the functioningof mastigonemes is not yet complete.
Flagellates with hispid flagella are common in all aquatic habitats, and this typeof flagellum is present in a number of unrelated families. Because the presence ofmastigonemes is not a primary character, it must provide important competitiveadvantages in microbial ecosystems. The importance of mastigonemes in evolutionand ecology is, however, as yet poorly understood. They could improve the swim-ming efficiency of the cells, because the previously described energetic
3209_C013.fm Page 276 Thursday, November 10, 2005 10:49 AM

Implications of Microbial Motility on Water Column Ecosystems 277
disadvantages of smooth flagella are not present in hispid flagella. The flagellumitself, however, will work against the motion of the fluid, so the picture is not clear.Another possibility is that the mastigonemes can function as mechanoreceptors orin feeding because the anterior position of the hispid flagellum would make it wellplaced to work also as a sensory or food-intercepting organelle. The mastigonemesalso make it possible for hispid flagella to move fluid across or even perpendicularto the flagellar axis, something that is not possible for smooth flagella [44]. It hasalready been shown that Paraphysomonas uses its flagellum for intercepting preyand increases its effective feeding area by utilizing this possibility [44]. This, how-ever, may be a special case.
13.2.3 CILIA
Cilia make direct use of the differences in drag between cylinders moving normalcompared to tangential to the fluid in generating motion. The movement of the ciliaconsists of a power stroke in which the cilia forms a cylinder with a motion normalto the fluid, and a recovery stroke where most of the cilia moves tangentially withrespect to the fluid (Figure 13.4). Whereas flagellates typically have only one or fewflagella, ciliates must have thousands of cilia to produce motion. They are typicallyarranged in rows in which the cilia beat in metachronical waves, i.e., waves formedby a slight phase lag between adjacent cilia. These waves seem to be fluid dynamicalin origin because they can be explained largely through the viscous coupling ofadjacent cilia [45,46].
Another important aspect of the functioning of the cilia is the proximity of thecell wall. During the power stroke, when the cilium is extended away from the cellwall, it is capable of carrying along with it a large envelope of fluid. During therecovery stroke, the cilium moves close to the surface of the cell, and because ofthe viscous interactions with the wall, the cilium cannot carry as much fluid withit. Hence, there is a net movement of fluid down the surface of the cell, whichcontributes to the motion of the organism [47]. The fact that the ciliates move bymoving fluid over the cell surface results in a much steeper velocity gradient overthe surface than that found in inert bodies being pulled through the fluid by anexternal force, such as sedimenting organisms. Bodies pulled in this way carry morefluid along with them, and so they disturb the fluid much more than swimming cells[47,48]. Because predators may perceive prey through fluid dynamic signals suchas shear [49,50], this reduces the visibility of the ciliates.
FIGURE 13.4 Movement of a cilium. The movement from position 1 to 3 constitutes thepower stroke and from 3 over to 4 and 5 and back to 1 constitutes the recovery stroke.Movement purely related to the recovery stroke is drawn with dashed lines.
5
1
2
43
3209_C013.fm Page 277 Thursday, November 10, 2005 10:49 AM

278 Ecology and Biomechanics
Flagellates, which pull an inert cell body through the fluid with a flagellum, donot have this advantage, but they are also typically smaller and slower. Hence, it isnot clear under which conditions flagellates are hydrodynamically more visible thanciliates. Ciliates that have the cell body only partially, as compared to fully, coveredby cilia could also generate a larger scale flow field around the cell body. Thus, itseems that the exact mechanism by which protozoa generate motion influences theirrelative visibility toward different types of predators and so influences their relativepredation rates. Though this has important ecological implications, there have to myknowledge not been any thorough investigations of this phenomenon on protozoa.Only work on how foraging behaviors influence hydrodynamic visibility in copepods[51] and on how size and velocity of an assumed nonciliated particle affects itsvisibility [49] have been carried out so far.
13.3 THE ENERGETICS OF MOTION
One of the curious aspects of microbial ecosystems compared to those of largermotile organisms is the apparent lack of an optimal swimming speed. It has oftenbeen stated that the energy spent by microorganisms on swimming constitutes onlya minute part of their metabolism (e.g., Refs. [52,53]). In light of this, it shouldalways be advantageous for microorganisms to swim as fast as possible becauseincreasing their swimming speed will increase the contact rate with prey and thusthe feeding rate. In spite of this, there are large differences in swimming speedbetween different species within the same size class and feeding on the same prey.The extent of this cannot be explained by differences in drag of the feeding appa-ratuses, as even within species that do not have retractable feeding structures, largevariations in swimming velocity occur [54]. This variation should provide a firmbasis for natural selection toward higher swimming speeds. So why do many micro-organisms still swim relatively slowly?
One answer could be to reduce the probability of being preyed upon themselves.Contact rates between predator and prey are dependent not only on the swimmingspeed of the predator, but also on the swimming speed of the prey [55]. However,flagellates often seem bottom–up rather than top–down regulated (e.g., for instanceRefs. [10,56]). Furthermore motility, while increasing the contact rate, may decreasethe interception rate, hence in reality potentially providing protection from predation[57]. Thus, this does not seem to be satisfactory as the only answer.
In most previous studies, only the drag on the cell body itself was used in theenergy budget calculations. The drag on the cell body, however, constitutes only aminute part of the overall energy expenditure of motion; most of the energy is usedin overcoming the tangential drag on the flagellum [22,30,31,39,58]. The total powerconsumption by a flagellum propelling a microorganism by helical motions is givenby [31]:
(13.1)P r U= 1 26
3209_C013.fm Page 278 Thursday, November 10, 2005 10:49 AM

Implications of Microbial Motility on Water Column Ecosystems 279
where P (J s–1) is the average power consumption, r (m) is the radius of the organism, (N s m–2) is the viscosity of water, and U (m s–1) is the swimming speed of the
organism. –1 is a nondimensional parameter defining the swimming efficiency ofthe organism. The optimal (smallest possible) value of –1 that is achievable for agiven organism depends on factors such as relative size of the cell body and relativelength and width of the flagellum. The larger the cell body or the thicker the flagellumcompared to its length (L), the less the possible efficiency. Whereas an organismwith L/r = 10 and r = 50 × the radius of the flagellum can, in principle, achieve anoptimal –1 of 125, an organism with the same radius of the flagellum but L/r = 5will not be able to do better than a –1 of 210. The actual value of –1 for a givenorganism can in principle range from this optimum to infinity, depending on flagellarparameters such as amplitude and frequency [31]. The value will only approachinfinity if, for instance, the amplitude of the flagellum is going toward zero, resultingin very inefficient swimming.
I will assume that the flagellates are swimming at constant speed until theyencounter a food particle, then stop their motion for the time it takes to ingest thefood particle, and then immediately reassume constant forward motion, as is seenfor, e.g., Paraphysomonas vestita. The ingestion rate over time can then be calculatedto be:
(13.2)
where I (particles s–1) is the ingestion rate, C (particles m–3) is the concentration offood particles, V (m3 s–1) is the volume of liquid that passes through the area sweptfor particles over time (V = UA, where A is the area swept for particles), and i(s particle–1) is the time it takes for the protozoon to ingest one food particle.
I have assumed the following: The bacteria have a radius of 0.3 m and aresimilar to E. coli with 26% of their volume composed of organic compounds, ofwhich 8% is lipids and 92% is other organic compounds [59]. The energetic valueof lipids is taken to be 37 KJ g1, and the energetic value of other compounds istaken to be 17 KJ g1. The bacteria do not swim. The protozoa have a radius of 3 m,and the flagellum has a length of 30 m and a radius of 0.1 m. At these values,the energetic optimum of the organism lies at approximately –1 = 150. The protozoaare assumed not to spend any energy on motion while in the process of ingesting aparticle, and when swimming, do so close to their energetic optimum. They caningest 60% of their volume per hour in accordance with the data in, e.g., Ref. [52],giving an average ingestion time of 6 sec. Ingested carbon not used in respirationfor the purpose of motion is used in growth, with a growth efficiency of 40%. Inthis case, A is assumed to be equal to the transectional area of the body of theprotozoa, as is seen in P. vestita [54]. From these assumptions, I have calculated thegrowth rate of the protozoa as a function of swimming velocity at different bacterialconcentrations (Figure 13.5A and 13.5B).
How the growth rate varies with swimming speed depends greatly on the con-centration of food particles. At concentrations of 1011 particles m–3, the growth rate
ICV i
=+
11( )
3209_C013.fm Page 279 Thursday, November 10, 2005 10:49 AM

280 Ecology and Biomechanics
is effectively zero until the velocity is 180 m sec–1, with a small optimum of1.85 × 10–4 hr–1 at 91 m sec–1. At velocities above 180 m sec–1, the growth ratebecomes increasingly negative. At 1012 particles m–3, the growth rate increases to amaximum of 1.61 × 10⁻² at a velocity of 850 m sec–1, then decreases again. Athigher particle concentrations than this, the growth rate increases continuously withvelocity for realistic values of potential swimming speed. The value however reachesan asymptotic value toward the maximum growth rate and so, after the asymptoticlevel is reached, a further increase in swimming speed does not significantly increasegrowth rates. The growth rates found are well in accordance with previous valuesobtained experimentally of growth rates for the given particle concentration (e.g.,Refs. [52,60].
FIGURE 13.5 Theoretical growth rate of protozoa as function of their swimming speed atbacterial concentrations of (A) 1011 and 1012 bacteria per cubic meter and (B) 1013 to 1015
bacteria per cubic meter.
0.02
0.01
1012 m–3
1011 m–3
0
0.015
0.005
–0.005
Gro
wth
rate
hou
r–1
–0.015
–0.01
–0.020 100 200 300
Swimming speed, µm s–1
(a)
400 500 600 700 800 900 1000
0.25
0.2
0.15
Gro
wth
rate
hou
r–1
0.05
00 100 200 300
Swimming speed, µm s–1
1015 m–3
1014 m–3
1013 m–3
(b)
400 500 600 700 800 900 1000
0.1
3209_C013.fm Page 280 Thursday, November 10, 2005 10:49 AM

Implications of Microbial Motility on Water Column Ecosystems 281
As mentioned earlier, in aquatic systems, bacterial concentrations are typicallyaround 0.5 to 3 × 10¹² bacteria m–3. Based on this, one would expect protozoa toswim at higher velocities than the 150 to 300 m sec–1 commonly observed forprotozoa not hindered significantly by feeding structures. However, as is discussedin Section 13.5.2, bacteria in the ocean are not uniformly distributed but accumulatein patches that can have concentrations orders of magnitude higher than backgroundconcentrations [61–63]. An individual protozoon in an environment with an averagebacterial concentration of 1012 bacteria m–3 will rarely experience this bacterialconcentration at any given time.
More realistically, we may imagine that the protozoa experience a lower back-ground concentration of say 1011 bacteria m–3 with small patches of highly elevatedconcentrations, say, 1014 bacteria m–3. At the low background concentrations, swim-ming speeds above 180 m sec–1 will give the protozoa increasingly negative growthrates, thus, not allowing it to survive as long and lengthening the recovery time whenit once again encounters higher concentrations of food. It should be noted, however,that the magnitude of the negative growth rate is exaggerated because protozoaundergo physiological changes that enable them to survive when starved [64]. Atthe higher patch concentration, swimming speeds above 300 m sec–1 will onlybenefit it little. Hence, under these conditions, one would expect the optimal swim-ming speed of the organism to be below 300 m sec–1, in accordance with what isactually observed in nature. Because of the heterogeneous nature of the foodresources, however, no single swimming speed is always optimal but will varycontinuously with conditions. Every possible concentration between 1011 and 1014
bacteria m–3 will be encountered by the protozoa at some stage. This explains thehigh variation seen within these organisms when it comes to swimming speed; thereis no unidirectional selective pressure. This is enhanced because swimming servesnot only to directly enhance encounter rates with food particles, but also to moveto and locate areas of higher food concentration (see Section 13.5). Whether thisincreases, decreases, or leaves unaltered the optimal swimming speed for a givenorganism depends on its abilities to orient itself to stimuli and its mechanisms fordoing so.
The proportion of the energy budget used for motion obviously depends onbacterial concentration as well as swimming speed (Figures 13.6A and 13.6B). Thehigher the bacterial concentration, the higher the gain per distance the cell swims.For concentrations of above 1013 bacteria m–3, less than 1% of the ingested carbonis utilized for energy production for swimming almost irrespective of velocity.Because this is a concentration at which experiments are frequently conducted, it isnot surprising that it has often been concluded that protozoa spend only a very smallfraction of their energy budget on swimming. However, at 200 m sec–1 and 1012
bacteria m–3, the figure is 10%, and at 1011, the figure is around 100%, explainingwhy the threshold concentration above which protozoa are capable of balancedgrowth is typically above 1011 bacteria m–3 [52,65]. The rate with which flagellatesare ingested by ciliates, and hence with which the organic carbon is channelled upto higher trophic levels in the food chain, depends among other things on theswimming speed of the flagellates. At the same time, the respiration required forthe energy production results in fixed carbon being lost from the aquatic ecosystems
3209_C013.fm Page 281 Thursday, November 10, 2005 10:49 AM

282 Ecology and Biomechanics
as CO2. It seems that the potential importance of the energetic balance involved inmotion of the individual protozoa so far has been underestimated, and it may be animportant shaping factor in microbial ecosystems.
13.4 FEEDING MECHANISMS
Because of the low Reynolds number at which microorganisms live, they areexcluded from any type of feeding that makes use of the inertia of the prey or their
FIGURE 13.6 Amount of carbon compounds gained through ingestion (solid lines) and lostthrough respiration (dashed lines) as a function of swimming speed. Bacterial concentrations:(A) 1012 bacteria per cubic meter and (B) 1013 bacteria per cubic meter.
8×10⁻¹⁰
7
6
5
4
3
2
1Org
. com
poun
d ga
in/lo
ss, µ
g s–1
00 100 200 300 400
Swimming speed, µm s–1
(a)
500 600 700 800 900 1000
×10–9
0 100 200 300 400Swimming speed, µm s–1
(b)
500 600 700 800 900 1000
3.5
2.5
1.5
0.5
3
2
Org
. com
poun
d ga
in/lo
ss, µ
g s–1
1
0
3209_C013.fm Page 282 Thursday, November 10, 2005 10:49 AM

Implications of Microbial Motility on Water Column Ecosystems 283
own bodies. At the same time, they are too simple to have elaborate organs such ascomplex eyes, which would enable them to perceive potential prey at a distance,and too small to react swiftly to chemical gradients. Thus, they are dependent onpassive contact of their feeding structures with potential food organisms. They canimprove the chances of this happening by swimming or generating feeding currents.The feeding mechanisms employed by heterotrophic microorganisms can broadlybe divided in three categories: diffusion feeding, interception feeding, and filterfeeding.
Diffusion feeding is the simplest form of feeding and involves passively waitingfor motile prey to make contact with the feeding structure. This is not a widespreadfeeding mechanism but is used, e.g., in the heliozoan Ciliophrys, which is immobilewith extended pseudopodia when feeding; Ciliophrys, however, is capable of con-tracting its pseudopodia and swimming when threatened [66].
In interception feeding, organisms swim or generate feeding currents and inter-cept particles that make contact with a feeding structure, such as the flagellum inParaphysomonas [44]. An interesting and unusual example of an interception feederis Noctiluca scintillans, which is not in itself motile but is capable of moving bybeing positively buoyant. In this way, it encounters food particles, often using a longthread of mucus to which the particles attach. It can control its velocity to someextent by altering its buoyancy by swelling; it moves approximately three timesfaster if starved [67]. Hence, the feeding state of the individual cells can alter theprobability of blooms of N. scintillans occurring at the surface.
The term interception feeder is often used to imply that only particles in stream-lines no more than one particle radius away from the feeding structure are intercepted[68,69]. In reality, electrodynamic, electrostatic, solvation, or steric forces may resultin the particle being attracted or repelled, and so may cause it to cross streamlines,which theoretically may greatly affect particle retention rates [70]. Experimentally,it has been shown that the hydrophobicity of the bacteria may indeed affect feedingrates [71]. For small particles, diffusion encounter may also be of importance [72],even for swimming cells.
In filter feeding, the organism makes use of a filtering structure through whichwater is sieved by the motion of the organism or the generation of feeding currents.All particles larger than the distance between filtering elements are removed fromthe flow and transported to the “mouth.” Particles smaller than this may also beremoved if they make contact with and stick to the feeding structures in the sameway as described for interception feeding. Thus, the feeding mechanisms may beoverlapping. Filter feeding is used by a large number of species, including manyciliates as well as numerous flagellates such as choanoflagellates and pedinellids.The filter element can be composed of cilia, as is the case in ciliates, or pseudopodiain the case of flagellates.
Turbulence may in theory increase the contact rate, and thus the feeding rate,of aquatic organisms by increasing the relative velocity of predator and prey [73].It is not clear, however, whether turbulence in reality has a positive effect on feedingrate, even among larger organisms such as copepods. This is, among other things,because turbulence may disturb the feeding currents and alter the behavior of theorganisms (e.g., Refs. [74,75]).
3209_C013.fm Page 283 Thursday, November 10, 2005 10:49 AM

284 Ecology and Biomechanics
For protozoa and bacteria, which are well below the Kolmogorov length scaleand so live in a world of laminar flow, the picture is even more obscure. There havebeen reports of increased feeding rates of some flagellates in the presence of turbu-lence [76,77], but they are not entirely convincing. To some extent, the increasedfeeding rate could be related to the flagellates’ increase in numbers but decrease insize in the presence of turbulence [78]. Thus, although it seems that turbulence doesaffect the microbial ecosystems, I will largely ignore it in this review because thenature of this phenomenon is as yet very poorly understood.
13.4.1 THE COEXISTENCE OF FILTER FEEDERS
A majority of the heterotrophic species of most pelagic microbial ecosystems arefilter feeders. Many overlap in the particles that they are capable of ingesting, andyet they coexist. In systems of larger animals, this would not be possible becauseone species would tend to outcompete the others. The reason why this is possiblecan be found in the nature of filter feeding at low Reynolds numbers, which isillustrated here by a simplified model.
Protozoa seem to be capable of upholding only relatively small hydrostaticpressures in the range of 0.8 to 1.5 N/m2 [79,80]. The unrestricted velocity throughthe area occupied by the filter is directly proportional to the pressure drop over thefilter and to the distance between adjacent filtering elements compared to theirdiameter. Assuming that the filtering elements are parallel cylinders, the unrestrictedvelocity of the fluid can be given by [79]
(13.3)
where U0 is the velocity of the fluid when unrestricted by the filter, p is the pressuredrop over the filter, equals d/b (where d is the diameter of the individual filteringelements and b is the distance between the centers of adjacent filtering elements)(Figure 13.7), and is the viscosity of the fluid.
Assuming that the filtering elements are rigid, filter feeders can retain any particlewith a diameter larger than b. Particles smaller than this can only be retained if theymake contact with and are intercepted by the filtering element. In reality, it seemsthat only very few particles smaller than b are intercepted by filter feeders [81,82].Thus, there is a trade-off: the greater the distance between filtering elements, thelarger the velocity and hence volume of fluid filtered for particles, but the smallerthe proportion of the particles that are retained. The power loss in driving fluidthrough a filter can be found by using Equation 13.3.
(13.4)
Up b
0
2 41 2 6 1448
=+( ln / / )
PU
b=
+
8
1 2 6 14402
2 4( ln / / )
3209_C013.fm Page 284 Thursday, November 10, 2005 10:49 AM

Implications of Microbial Motility on Water Column Ecosystems 285
where P is the power loss and is the area of the surface of the cylinder spannedby the feeding elements.
The growth rate of filter-feeding protozoa with various distances between adja-cent filtering elements as a function of the size of the bacterium is presented inFigure 13.8. The calculations were based on the following assumptions. The pressuredrop over the filtering structure is in all cases assumed constant at 1 N m–2. Thedistances between adjacent filtering elements varies from 0.2 to 1.2 m and areevenly distributed in this interval. The radii of the bacteria vary from 0.1 to 1.4 m.As the size of the bacterium changes, the total bacterial volume is held constant at0.11 × 1013 m3 m–3, equivalent to 1013 bacteria per cubic meter at a radius of thebacteria of 0.3 m. This number was chosen because it has been shown to be wellabove that required for balanced growth in protozoa (e.g., Refs. [52,60]). Becausethe total volume is held constant, the number changes from 2.7 × 10¹⁴ to 1 × 10¹¹
m-3 as the radius of the bacteria changes from 0.1 to 1.4. This was done forcomparative purposes to avoid an excessive increase in the growth rate of all theprotozoa with increasing bacterial volume.
The protozoa are assumed to draw water through a filtering apparatus as shownin Figure 13.7. The average radius is 3 m and the area of the opening of the filterstructure (A) is 4.5 m. The velocity of the fluid through the opening is assumed tobe not yet influenced by the presence of the filtering elements and thus be equivalentto U0, which seems valid from video microscopy analysis [54]. As my model onlyserves to illustrate a principle and does not attempt to be accurate, forces on theparticle other than the viscous ones are ignored. Thus, for smaller particles to beintercepted, they should be on a streamline that passes the filtering element at adistance of no more than that of the radius of the particle [69]. For particles smallerthan the size of the filtering element, 20% of the particles that made contact wereassumed to “stick” to the feeding apparatus and thus be retained. Otherwise, theassumptions are similar to those of the power calculations used in Section 13.3.Particles are ingested with a rate as described by Equation 13.2, but with a maximum
FIGURE 13.7 An idealized filter feeder as used in the model. Water enters the opening ofthe filter at velocity U0 and passes out through the sides at a lower velocity as a result of theenergy loss due to the pressure drop over the filtering elements. Particles in the water areintercepted by the filtering elements. The distance between the centers of adjacent filteringelements is given by b, and the diameter of the cylindrical filtering elements is given by d.
d
b
U0
3209_C013.fm Page 285 Thursday, November 10, 2005 10:49 AM

286 Ecology and Biomechanics
ingestion of 100% of the cell volume of the protozoa per hour since this seems anamount that is more realistic for filter feeders (e.g., Refs. [52,82]).
As can be seen in Figure 13.8, all of the protozoa have a positive growth rateat any of the sizes of bacteria. For the individual protozoon, the growth rateincreases gradually with bacterial size until this exceeds the distance between filterelements. Here, there is a jump in growth rate marking the difference betweenbeing an inefficient interception feeder and being capable of retaining all theparticles by means of the filter. After this there is no further increase in growthrate because the volume of bacteria per cubic meter is constant. Though all of theprotozoa have positive growth rates with every size of bacteria, they each have aunique size range in which they have a maximum growth rate. Analogously, it ispossible to calculate the number of bacteria ingested by each of the protozoa,assuming an equal number of bacteria in each bacterial size class. Though all ofthe protozoa are ingesting bacteria of every size, each is the main predator for asize range of bacteria and for this size range ingests the largest number of bacteria.
This provides some understanding of how filter-feeding protozoa can coexistin nature. In a natural setting, a range of sizes of bacteria will be present at anygiven time. Protozoa with different distances between filtering elements will be themain predators of different size ranges of bacteria. However, because the protozoacan survive on classes of bacteria for which they are not the main predators, theycan be present in low numbers also in systems where they do not have the com-
FIGURE 13.8 Growth rate of protozoan filter feeders as a function of the size of the foodparticles. The growth rate is calculated for different filter feeders with distances b betweenthe centers of adjacent filtering elements ranging from 0.3 to 2.3 m.
Gro
wth
rate
hou
r–1
b = 0.3 µmb = 0.5 µm
b = 0.8 µm
b = 1.1 µm
b = 1.4 µm
b = 1.7 µm
b = 2.0 µm
b = 2.3 µm
Radius of food particle, e.g. bacteria (µm)0 0.2 0.4 0.6 0.8 1 1.2 1.4
0.18
0.16
0.14
0.12
0.08
0.06
0.04
0.02
0
0.1
3209_C013.fm Page 286 Thursday, November 10, 2005 10:49 AM

Implications of Microbial Motility on Water Column Ecosystems 287
petitive advantage. They are then present to take advantage of possible changingconditions.
The system of filter feeders is dynamic because a large number of any giventype of protozoa will tend to result in the “grazing down” of the size range of bacteriaon which it is the dominant predator. This is especially true for protozoa specializingin larger food particles because of the much higher clearance rates. This can beillustrated by looking at the development over time in a system starting off with 1012
bacteria per cubic meter of each of the nine size groups described above, and 108
protozoa per cubic meter with each corresponding distance between filtering ele-ments (Figures 13.9A and 9B). Bacteria are assumed to have a growth rate of 0.05h–1. The modeling has been done computationally with time steps of 120 sec. Largerbacteria are grazed down much more quickly than smaller ones, with only thesmallest having positive growth rates under these conditions. In addition, the relativegrowth rates of the different types of protozoa change over time as the relative sizedistribution of the bacteria changes.
FIGURE 13.9 Development over time in (a) the growth rate of protozoa and (b) bacterialconcentration. The distance between the surface of adjacent filtering elements (function of band d) as well as the size of the bacteria range from 0.2 m (solid line with no markers) to2.3 m (lines with solid circles) with steps of 0.3 m between size groups. The larger bacteriaare grazed down faster, and so the relative growth rate of filter feeders with smaller distancesbetween filtering elements compared to those with larger distances increases.
0.3
0.2
0.1
Gro
wth
rate
(hou
r–1)
Bact
eria
l con
c. (c
ells
m–3
)
0
2×10¹²
1
00 2 4 6 8 10 12 14
1.5
0.5
Time (hours)(a)
Time (hours)(b)
0 2 4 6 8 10 12 14 16 18
16 18
3209_C013.fm Page 287 Thursday, November 10, 2005 10:49 AM

288 Ecology and Biomechanics
13.4.2 ATTACHING TO PARTICLES WHILE FEEDING
Much organic matter in pelagic ecosystems is found in the form of aggregates, orparticulate organic matter (POM). As these sediment out of the pelagic zone, theyconstitute a major pathway for loss of organic carbon from pelagic ecosystems.Many protozoa as well as bacteria attach to the surfaces of POM using mucus threads,flagella, or cilia. Bacteria associated with aggregates are to a large extent responsiblefor the degradation of the aggregates that occur while sinking to the seafloor [83]and are therefore important in recycling organic matter and nutrients to this system.The colonization of aggregates by bacteria is facilitated by the chemotactic behaviorof some bacteria [84,85]. The colonization rate may be either positively [86] ornegatively [87] affected by the presence of other bacteria on the aggregates.Muchof the reason for the attachment of microbes to aggregates can undoubtedly be foundin their wealth of organic matter. Bacteria feed directly on the organic matter of theaggregate, and flagellates feed on attached or suspended bacteria associated withthe aggregates (e.g., Refs. [88,89]). Because the flagellates seem capable of control-ling the bacterial communities, they affect the rate of degradation of the particles.Ciliates may in turn feed on the flagellate community, and aggregates in the pelagicenvironment are typically associated with diverse microbial communities [90–92].Though microorganisms in this way may attach to remain in an environment that isadvantageous for feeding purposes, protozoa not only attach to organic particles orin the presence of food particles, but also attach to glass or other artificial surfaces;they may even attach to inorganic surfaces in sterile water [54,93]. Hence, theremust be additional reasons for attachment.
Attaching during feeding has important fluid dynamical implications, and theymay in some cases be the main reason for attachment. Swimming microorganismsproduce thrust only to overcome the drag of the cell body and so produce only localflow fields [94]. When motile organisms are attached to particles, the force theyproduce against the fluid will result in thrust balancing the drag of the particle towhich it is attached, thus generating a large-scale flow field around the attachedorganism. With the same application of force, the velocity of the fluid past the feedingstructure of the organism may be higher if attached and generating feeding currentsthan if free swimming (Figure 13.10). In this way, it may be advantageous from afluid dynamical point of view for microorganisms to be attached, as measured byan increase in the feeding rate compared to the energy expenditure, even if thebacterial concentration around the aggregate is no higher than ambient concentra-tions [54]. This has also been shown for copepods [51] as well as ciliates [95].
The extent to which the organism can increase its feeding efficiency by attach-ment depends on the relative size of the feeding area as well as on flagellar parametersand characteristics of the stalk, and will thus vary between organisms (Figure 13.10).In this way, the particle composition of an aquatic environment may influenceclearance rates of the protozoa as well as the relative competitive abilities of species.The process may be self-enhancing because the feeding currents of the protozoamay contribute to building up the aggregate [96]. Sessile organisms with a contractilestalk may further increase the filtration rate by altering the length of the stalkperiodically, generating chaotic filtration currents that also sample the nearby liquid
3209_C013.fm Page 288 Thursday, November 10, 2005 10:49 AM

Implications of Microbial Motility on Water Column Ecosystems 289
[97]. Even in species without contractile stalks, chaotic flow patterns might increasefeeding rates [98].
The large-scale flow fields of attached organisms make fluid dynamical interac-tions between feeding currents of adjacent cells possible and so the generation ofcommunal currents. Though intuitively this would seem an advantage, it may notnecessarily be so. For bryozoans, which obviously are not protozoans but alsogenerate flow at low Reynolds numbers, it has been shown theoretically that thehydrodynamic interactions between zooids have negative effects on the ability ofthe individual zooids to generate feeding currents. This is due to a high pressure inthe interior part of the colony caused by the viscous resistance to excurrant flow[99]. It may be possible to reduce this effect by forming communal holes for theoutflow of water [100] in a manner similar to that of chimney-forming bryozoans[101]. Further research is needed to understand the effect of fluid dynamical inter-actions between organisms on aggregates, which presents a very different system tothe dense and planar colonies of bryozoans.
Even less clear is the net effect of attachment on the predation on protozoa.Attaching reduces or eliminates the forward velocity of the cell and, in this way,reduces the probability of encountering a predator. But at the same time, the largescale flow field of the attached protozoa will make them more visible to predatorsthat perceive their prey through hydrodynamical signals. Also, because copepodsfeed on organic aggregates, which they find though the plume of dissolved substancestailing behind the aggregate [102], attached protozoa may be eaten as a by-product.Attached bacteria, which enhance the degradation of the aggregates, increase the“visibility” of these aggregates to copepods and the chance that the aggregates maybe eaten. So the overall effect of attachment on predation is not clear.
FIGURE 13.10 Increase in the filtration efficiency of flagellates when attaching to particles.The average velocity of the fluid past the feeding appendages, and hence the potential feedingefficiency, is shown as a function of how large a fraction of the velocity results from feedingcurrents as opposed to forward velocity of the cell. This ranges from 0 in the case of completelyfree-swimming cells to 1 for cells attached to particles that are too large for them to pull.The curves are calculated from data presented in Christensen-Dalsgaard, K.K. and Fenchel,T., Aquat. Microb. Ecol., 33, 77, 2003.
320
300ParaphysomonasPteridomonas
280
260
240
220
200
180
1600.0
Feeding-current velocity/total velocity of fluid past the cell
Aver
age
flow
vel
ocity
, µm
s–1
0.2 0.4 0.6 0.8 1.0
3209_C013.fm Page 289 Thursday, November 10, 2005 10:49 AM

290 Ecology and Biomechanics
13.5 ORIENTATION TO STIMULI
As with all organisms, an ability to orient with respect to stimuli greatly increasesthe competitive ability of the microbial species. It allows them to increase theirfeeding and photosynthetic rate, and remain in chemically favorable environmentsas well as avoid potentially damaging situations. As previously mentioned, however,microorganisms are too small to be able to perceive chemical gradients over thelength of their bodies and too simple to develop complex eyes. Hence, they havebeen forced to develop other means of orienting to stimuli based on a short term“memory” that allows them to detect changes in stimuli intensity [103]. The degreeto which they have succeeded in doing this is remarkable and is an example of howcomplex and interesting the world of such seemingly simple organisms can be.However, as the topic is generally well described (see Refs. [104,105] as well asthe comprehensive introductions in Refs. [106,107]), I restrict myself to a briefoverview here.
Bacteria are so small and swim at such low velocities that swimming in a straightpath is made impossible by Brownian motions. Instead they swim in what has beennamed the “random walk,” which involves alternating “runs” and “tumbles.” In therun, the bacterium swims in an almost straight path with the flagella rotating in abundle. In tumbles, the flagella change the direction of the rotation, for example,from counterclockwise to clockwise, and the individual flagella separate, whichcauses the bacterium to stop and change direction randomly (e.g., [108]). Thoughruns and tumbles always occur, the presence of attractant or repellents can changethe frequency with which they occur (e.g., Refs. [103,109]). When swimming up aconcentration gradient of a positive attractant or down a gradient of a negativerepellant, the tumbles become less frequent and the runs consequently becomelonger. When swimming in the opposite direction, tumbles become more frequent.This occurs through a direct reaction of the bacterium to the attractants or repellentsvia chemoreceptors in the membrane [110]. This type of locomotion appears to beadvantageous only for bacteria longer than about 0.6 m. Orientation to stimuli inbacteria smaller than this would be too inefficient, which explains why no motilebacteria shorter than 0.8 m have been found [111].
The orientation process of bacteria is random because it swims in a randomdirection after it tumbles. The changes in tumbling frequency, however, results in ahigher probability that the net movement of the bacteria will be toward an attractantrather than away from it, or vice versa for repellents (Figure 13.11). This is surpris-ingly effective, and the bacterial concentrations around nutrient patches may beorders of magnitude higher than ambient bacterial concentrations [61–63,85,112].In this way, bacteria may form dense clusters at optimal conditions with respect toparameters such as oxygen tension or nutrient concentrations. The chemotacticbehavior of bacteria may as much as double the turnover rate of organic carbon inaquatic ecosystems.
For protozoa, this results in an environment of alternating feasts and famines,with patches of high bacterial concentrations dispersed among large areas of lowconcentrations. This makes it important for protozoa to be capable of chemotacticorientation to such patches so as to utilize the available food resources. In addition,
3209_C013.fm Page 290 Thursday, November 10, 2005 10:49 AM

Implications of Microbial Motility on Water Column Ecosystems 291
protozoa may be phototactic, especially those that contain chloroplasts. Thoughsome protozoa make use of the random-walk methods of orienting to stimuli [106],most protozoa are capable of a somewhat more precise orientation.
Most protozoa swim in a helical path (Figure 13.12). As pointed out by Jennings[113], this may be a way of swimming in a straight line, much in the manner of thespinning of a bullet, because the asymmetry of the organisms would otherwise tendto make them swim in circles. The helical swimming path also allows for aningenious way of orienting to light or chemical stimuli. The helical movement ofthe protozoa can be resolved in a translational component and two rotational com-ponents, one parallel to and one perpendicular to the direction of motion (Figure13.12). Theoretically this allows the organism to orient to stimuli if the relativevelocities of these components are functions of the stimulus intensity [63,114–116].
FIGURE 13.11 Orientation by random walk of a bacterium toward an attractant. As thebacterium swims up the concentration gradient, the frequency of tumbles decreases, resultingin longer “runs,” whereas when it swims down the concentration gradient, the frequencyincreases. This results in an overall movement toward the attractant.
FIGURE 13.12 Swimming in a helix, in this case for the flagellate Pteridomonas. Theswimming path of the organism and hence the helix is defined by the velocity vector (V) andthe rotational vector ( ). is a sum of a component ( 1) parallel to the velocity vector and acomponent ( 2) perpendicular to the velocity vector. The axis of the helix will be parallel to .
3209_C013.fm Page 291 Thursday, November 10, 2005 10:49 AM

292 Ecology and Biomechanics
If, for instance, the angle between the translational and the rotational vectorsincreases as the organism moves down the gradient, the path of the organism willbe bent toward the source of the attractant (Figure 13.13).
Numerous experimental studies have confirmed that this does indeed seem tobe the main method by which most protozoa orient to stimuli (e.g., Refs.[106,117,118]). It is not clear however how the protozoa physically change theparameters of the helix. Numerous studies have been done on the reaction of wholeorganisms as well as on isolated and reactivated demembranated flagellar apparatusesin ambient ion concentrations. Hence, it is well known that changes in the intracel-lular Ca2+ level have marked effects on the beating pattern and frequency of cilia(e.g., Refs. [119,120]), flagella of flagellates (e.g., Refs. [121,122]), and spermatozoafrom completely unrelated species (e.g., Refs. [123,124]). There is little doubt thatthis universal mechanism plays an important role in the chemo- and phototaxis ofprotozoa.
What is less clear is the step from the simple reversals and frequency changesobserved with changing Ca2+ levels to the complex flagellar or ciliary reactions thatare responsible for modifying the helical path and how these are achieved. This isonly partially understood and only for a few species. Dinoflagellates make use ofthe transverse flagellum to control their rotational velocity [125]. Paramecium canalter the parameters of the helix by changing the direction and frequency of thethree-dimensional movement of the cilia, the control of which seems to involve alsoH+, Mg2+, and ATP [118]. Pteridomonas seems to be capable of an accurate three-dimensional control of the axis of the planar waveform of the flagellum, resultingin a very precise control of swimming directions, but this is as yet incompletelyunderstood [44]. For most species, the flagellar and ciliary mechanisms by whichprotozoa change the direction of the axis of the helix is not known. It is importantfor our understanding of the microbial ecosystems to gain a deeper understanding
FIGURE 13.13 Orientation of a protozoa swimming in a helix toward an attractant. If theangle between V and is a function of the solute concentration, the axis of the helix willbend toward the source of the concentration gradient as long as the organism is not swimmingdirectly toward or away from the source.
3209_C013.fm Page 292 Thursday, November 10, 2005 10:49 AM
Implications of Microbial Motility on Water Column Ecosystems 293
of how organisms orient physiologically to stimuli and of the factors that may affectthis ability to orient.
Protozoa may react not only to light intensities and chemical gradients but alsoto gravity. In fact, the ecologically important vertical migrations of many organismsin aquatic environments seem driven as much by gravity as by a reaction to lightintensities [126–128]. For most of the last century, gravitaxis was believed to becaused largely by a density gradient in the cell so that the lower, heavier end wouldpassively align with the gravity vector [129–132]. It has been shown however thatthe ciliate Laxodes is capable of switching between positive and negative gravitaxiswithout any apparent structural changes in the cell [133], requiring more complicatedmechanisms for perceiving gravity.
The asymmetrical shape of the organism may play an important role in thegravitational response of ciliates, and even slight changes in shape may have aprofound effect on the orientation of the organism [107]. The prevailing theory today,however, is that at least some protozoa are capable of sensing gravity directly bythe cytoplasmic contents of the cell exerting a pressure on the lower membrane, thusactivating stretch-sensitive calcium-specific ion channels [105]. This hypothesis issupported, among other things, by the fact that changes in density, but not viscosity,of the fluid can reverse the gravitational response of Euglena [134] and that for thisorganism, inhibitors of stretch-sensitive ion channels inhibit gravitaxis [134,135].The precise gravitational response of many organisms may in reality be a combina-tion of this mechanism and shape and density distribution.
The extent to which the ability of an organism to orient to stimuli allows it toexploit patchy resources depends on a number of factors, including how long-livedand far away an average resource path is compared to the swimming speed andnavigation abilities of the organism. Based on these parameters, Grünbaum [136]recently presented a simple numerical index, the Frost number, with which it ispossible to predict roughly the availability of a patchy resource to a consumer usingvarious forms of biased random walks. The Frost number is based on the mobilityof individual organisms, yet provides a powerful tool in understanding ecologicalprocesses and first approximations of quantifications such as carbon turnover rates.As with many other aspects presented in this review, this shows how much ourunderstanding of ecological processes can be improved by bringing our ecologicalinvestigations down to the level of the mechanics of the individual. Failing to do sowill leave our understanding of ecological systems much poorer.
ACKNOWLEDGMENTS
I would like to thank Tom Fenchel for comments on the manuscript, which substan-tially improved the final version.
REFERENCES
1. Koch, A.L., The adaptive responses of Escherichia coli to a feast and famine existence,Adv. Microbial Physiol., 6, 147, 1971.
3209_C013.fm Page 293 Thursday, November 10, 2005 10:49 AM

294 Ecology and Biomechanics
2. Estep, K.W. et al., How important are oceanic algal nanoflagellates in bacterivory,Limnol. Oceanogr., 31, 646, 1986.
3. Bird, D.F. and Kalff, J., Bacterial grazing by planktonic lake algae, Science, 231,493, 1986.
4. Azam, F. et al., The ecological role of water-column microbes in the sea, Mar. Ecol.-Prog. Ser., 10, 257, 1983.
5. Larsson, U. and Hagstrom, A., Phytoplankton exudate release as an energy-sourcefor the growth of pelagic bacteria, Mar. Biol., 52, 199, 1979.
6. Larsson, U. and Hagstrom, A., Fractionated phytoplankton primary production, exu-date release and bacterial production in a Baltic eutrophication gradient, Mar. Biol.,67, 57, 1982.
7. Thomas, J.P., Release of dissolved organic matter from natural populations of marinephytoplankton, Mar. Biol., 11, 311, 1971.
8. Bell, W. and Mitchell, R., Chemotactic and growth responses of marine bacteria toalgal extracellular products, Biol. Bull., 143, 265, 1972.
9. Andersen, P. and Fenchel, T., Bacterivory by microheterotrophic flagellates in sea-water samples, Limnol. Oceanogr., 30, 198, 1985.
10. Fenchel, T., Ecology of heterotrophic microflagellates. 4. Quantitative occurrence andimportance as bacterial consumers, Mar. Ecol.-Prog. Ser., 9, 35, 1982.
11. Nielsen, T.G. and Richardson, K., Food-chain structure of the North-Sea planktoncommunities: seasonal variations of the role of the microbial loop, Mar. Ecol.-Prog.Ser., 56, 75, 1989.
12. Sherr, B.F., Sherr, E.B., and Fallon, R.D., Use of monodispersed, fluorescently labeledbacteria to estimate in-situ protozoan bacterivory, Appl. Environ. Microbiol., 53, 958,1987.
13. Wright, R.T. and Coffin, R.B., Measuring microzooplankton grazing on planktonicmarine-bacteria by its impact on bacterial production, Microb. Ecol., 10, 137, 1984.
14. Goldman, J.C. and Caron, D.A., Experimental studies on an omnivorous microflagel-late — implications for grazing and nutrient regeneration in the marine microbialfood-chain, Deep-Sea Res., A 32, 899, 1985.
15. Drebes, G. and Schnepf, E., Gyrodinium undulans Hulburt, a marine dinoflagellatefeeding on the bloom-forming diatom Odontella aurita, and on copepod and rotifereggs, Helgol. Meeresunters, 52, 1, 1998.
16. Caron, D.A. et al., Nutrient cycling in a microflagellate food-chain. 2. Population-dynamics and carbon cycling, Mar. Ecol.-Prog. Ser., 24, 243, 1985.
17. Goldman, J.C. et al., Nutrient cycling in a microflagellate food-chain. 1. Nitrogendynamics, Mar. Ecol.-Prog. Ser., 24, 231, 1985.
18. Goldman, J.C. and Dennett, M.R., Dynamics of prey selection by an omnivorousflagellate, Mar. Ecol.-Prog. Ser., 59, 183, 1990.
19. Berg, H.C., Dynamic properties of bacterial flagellar motors, Nature, 249, 77, 1974.20. Taylor, G., Analysis of the swimming of microscopic organisms, Proc. R. Soc. Lond.
Ser. A, 209, 447, 1951.21. Taylor, G., The action of waving cylindrical tails in propelling microscopic organisms,
Proc. R. Soc. Lond. Ser. A, 211, 225, 1952.22. Gray, J. and Hancock, G.J., The propulsion of sea-urchin spermatozoa, J. Exp. Biol.,
32, 802, 1955.23. Hancock, G.J., The self-propulsion of microscopic organisms through liquids, Proc.
R. Soc. Lond. Ser. A, 217, 96, 1953.24. Brokaw, C.J., Non-sinusoidal bending waves of sperm flagella, J. Exp. Biol., 43, 155,
1965.
3209_C013.fm Page 294 Thursday, November 10, 2005 10:49 AM
Implications of Microbial Motility on Water Column Ecosystems 295
25. Silverman, M. and Simon, M., Flagellar rotation and mechanism of bacterial motility,Nature, 249, 73, 1974.
26. Depamphilis, M.L. and Adler, J., Fine structure and isolation of hook-basal bodycomplex of flagella from Escherichia-coli and Bacillus-subtilis, J. Bacteriol., 105,384, 1971.
27. Okrend, A.G. and Doetsch, R.N., Plasmolysis and bacterial motility — a method forstudy of membrane function, Archiv Mikrobiol., 69, 69, 1969.
28. Vaituzis, Z. and Doetsch, R.N., Flagella of Escherichia coli spheroplasts, J. Bacteriol.,91, 2103, 1966.
29. Machin, K.E., Control and synchronization of flagellar movement, Proc. R. Soc. Lond.Ser. B-Biol. Sci., 158, 88, 1963.
30. Higdon, J.J.L., Hydrodynamic analysis of flagellar propulsion, J. Fluid Mech., 90,685, 1979.
31. Higdon, J.J.L., Hydrodynamics of flagellar propulsion — helical waves, J. FluidMech., 94, 331, 1979.
32. Lowndes, A.G., The swimming of unicellular flagellate organisms, Proc. Zool. Soc.London A., 114, 325, 1944.
33. Lowndes, A.G., Swimming of Monas-stigmatica, Nature, 155, 579, 1945.34. Holwill, M.E.J., Motion of Euglena viridis — role of flagella, J. Exp. Biol., 44, 579,
1966.35. Chwang, A.T., Wu, T.Y., and Winet, H., Locomotion of Spirilla, Biophys. J., 12, 1549,
1972.36. Lighthill, J., Helical distributions of stokeslets, J. Eng. Math., 30, 35, 1996.37. Ramia, M., Numerical-model for the locomotion of Spirilla, Biophys. J., 60, 1057,
1991.38. Jahn, T.L., Landman, M.D., and Fonseca, J.R., Mechanism of locomotion of flagel-
lates. 2. Function of mastigonemes of Ochromonas, J. Protozool., 11, 291, 1964.39. Brennen, C., Locomotion of flagellates with mastigonemes, J. Mechanochem. Cell.
Motil., 3, 207, 1976.40. Taylor, G., Analysis of the swimming of long and narrow animals, Proc. R. Soc.
Lond. Ser. A, 214, 158, 1952.41. Holwill, M.E.J. and Sleigh, M.A., Propulsion by hispid flagella, J. Exp. Biol., 47,
267, 1967.42. Fauci, L.J., A computational model of the fluid dynamics of undulatory and flagellar
swimming, Am. Zool., 36, 599, 1996.43. Gaines, G. and Taylor, F.J.R., Form and function of the dinoflagellate transverse
flagellum, J. Protozool., 32, 290, 1985.44. Christensen-Dalsgaard, K.K., and Fenchel, T., Complex flagellar motions and swim-
ming patterns of the flagellates Paraphysomonas vestita and Pteridomonas danica,Protist, 155, 79, 2004.
45. Gueron, S. and Liron, N., Ciliary motion modeling, and dynamic multicilia interac-tions, Biophys. J., 63, 1045, 1992.
46. Gueron, S. and Levit-Gurevich, K., Computation of the internal forces in cilia:application to ciliary motion, the effects of viscosity, and cilia interactions, Biophys.J., 74, 1658, 1998.
47. Blake, J., Hydrodynamic calculations on movements of cilia and flagella. 1. Parame-cium, J. Theor. Biol., 45, 183, 1974.
48. Wu, T.Y., Hydrodynamics of swimming at low Reynolds-numbers, Fortschr Zool.,24, 149, 1977.
3209_C013.fm Page 295 Thursday, November 10, 2005 10:49 AM

296 Ecology and Biomechanics
49. Kiorboe, T. and Visser, A.W., Predator and prey perception in copepods due tohydromechanical signals, Mar. Ecol.-Prog. Ser., 179, 81, 1999.
50. Svensen, C. and Kiorboe, T., Remote prey detection in Oithona similis: hydrome-chanical versus chemical cues, J. Plankton Res., 22, 1155, 2000.
51. Tiselius, P. and Jonsson, P.R., Foraging behavior of 6 calanoid copepods — obser-vations and hydrodynamic analysis, Mar. Ecol.-Prog. Ser., 66, 23, 1990.
52. Fenchel, T., Ecology of heterotrophic microflagellates. 2. Bioenergetics and growth,Mar. Ecol.-Prog. Ser., 8, 225, 1982.
53. Fenchel, T. and Finlay, B.J., Respiration rates in heterotrophic, free-living protozoa,Microb. Ecol., 9, 99, 1983.
54. Christensen-Dalsgaard, K.K. and Fenchel, T., Increased filtration efficiency ofattached compared to free swimming flagellates, Aquat. Microb. Ecol., 33, 77, 2003.
55. Gerritsen, J. and Strickler, J.R., Encounter probabilities and community structure inzooplankton — mathematical-model, J. Fisheries Res. Board Canada 34, 73, 1977.
56. Tanaka, T. and Rassoulzadegan, F., Full-depth profile (0–2000 m) of bacteria, het-erotrophic nanoflagellates and ciliates in the NW Mediterranean Sea: vertical parti-tioning of microbial trophic structures, Deep-Sea Res. Part II-Top. Stud. Oceanogr.,49, 2093, 2002.
57. Matz, C. and Jurgens, K., Interaction of nutrient limitation and protozoan grazingdetermines the phenotypic structure of a bacterial community, Microb. Ecol., 45, 384,2003.
58. Higdon, J.J.L., Generation of feeding currents by flagellar motions, J. Fluid Mech.,94, 305, 1979.
59. Mathews, C.K. and Van Holde, K.E., Biochemistry, Benjamin/Cummings, MenloPark, CA, 1996.
60. Eccleston-Parry, J.D. and Leadbeater, B.S.C., A comparison of the growth-kineticsof 6 marine heterotrophic nanoflagellates fed with one bacterial species, Mar. Ecol.-Prog. Ser., 105, 167, 1994.
61. Bowen, J.D., Stolzenbach, K.D., and Chisholm, S.W., Simulating bacterial clusteringaround phytoplankton cells in a turbulent ocean, Limnol. Oceanogr., 38, 36, 1993.
62. Blackburn, N., Fenchel, T., and Mitchell, J., Microscale nutrient patches in planktonichabitats shown by chemotactic bacteria, Science, 282, 2254, 1998.
63. Blackburn, N. and Fenchel, T., Modelling of microscale patch encounter by chemo-tactic protozoa, Protist, 150, 337, 1999.
64. Fenchel, T., Ecology of heterotrophic microflagellates. 3. Adaptations to heteroge-neous environments, Mar. Ecol.-Prog. Ser., 9, 25, 1982.
65. Rivier, A. et al., Growth of microzooplankton: a comparative study of bacterivotouszooflagellates and ciliates, Mar. Microb. Food Webs 1, 51, 1985.
66. Davidson, L.A., Ultrastructure, behavior, and algal flagellate affinities of thehelioflagellate Ciliophyrys-marina, and the classification of the helioflagellates (Pro-tista, Actinopoda, Heliozoea), J. Protozool., 29, 19, 1982.
67. Kiorboe, T. and Titelman, J., Feeding, prey selection and prey encounter mechanismsin the heterotrophic dinoflagellate Noctiluca scintillans, J. Plankton Res., 20, 1615,1998.
68. Fenchel, T., Suspended marine bacteria as a food source, in Flow of Material andEnergy in Marine Ecosystems, Fasham, M.J., Ed., Plenum Press, New York, 1984,p. 301.
69. Shimeta, J. and Jumars, P.A., Physical-mechanisms and rates of particle capture bysuspension-feeders, Oceanogr. Mar. Biol., 29, 191, 1991.
3209_C013.fm Page 296 Thursday, November 10, 2005 10:49 AM

Implications of Microbial Motility on Water Column Ecosystems 297
70. Monger, B.C. and Landry, M.R., Direct-interception feeding by marine zooflagellates— the importance of surface and hydrodynamic-forces, Mar. Ecol.-Prog. Ser., 65,123, 1990.
71. Monger, B.C., Landry, M.R., and Brown, S.L., Feeding selection of heterotrophicmarine nanoflagellates based on the surface hydrophobicity of their picoplanktonprey, Limnol. Oceanogr., 44, 1917, 1999.
72. Shimeta, J., Diffusional encounter of submicrometer particles and small-cells bysuspension feeders, Limnol. Oceanogr., 38, 456, 1993.
73. Rothschild, B.J. and Osborn, T.R., Small-scale turbulence and plankton contact rates,J. Plankton Res., 10, 465, 1988.
74. Kiørboe, T. and Saiz, E., Planktivorous feeding in calm and turbulent environments,with emphasis on copepods, Mar. Ecol.-Prog. Ser., 122, 135, 1995.
75. Marrase, C. et al., Grazing in a turbulent environment — energy-dissipation, encoun-ter rates, and efficacy of feeding currents in Centropages-Hamatus, Proc. Natl. Acad.Sci. U.S.A., 87, 1653, 1990.
76. Peters, F. and Gross, T., Increased grazing rates of microplankton in response tosmall-scale turbulence, Mar. Ecol.-Prog. Ser., 115, 299, 1994.
77. Shimeta, J., Jumars, P.A., and Lessard, E.J., Influences of turbulence on suspension-feeding by planktonic protozoa — experiments in laminar shear fields, Limnol.Oceanogr., 40, 845, 1995.
78. Peters, F., Choi, J.W., and Gross, T., Paraphysomonas imperforata (Protista, Chry-somonadida) under different turbulence levels: feeding, physiology and energetics,Mar. Ecol.-Prog. Ser., 134, 235, 1996.
79. Jorgensen, C.B., Fluid mechanical aspects of suspension feeding, Mar. Ecol.-Prog.Ser., 11, 89, 1983.
80. Fenchel, T., Protozoan filter feeding, Progr. Protistol., 1, 65, 1986.81. Fenchel, T., Relation between particle-size selection and clearance in suspension-
feeding ciliates, Limnol. Oceanogr., 25, 733, 1980.82. Fenchel, T., Suspension feeding in ciliated protozoa — functional-response and
particle-size selection, Microb. Ecol., 6, 1, 1980.83. Smith, D.C. et al., Intense hydrolytic enzyme-activity on marine aggregates and
implications for rapid particle dissolution, Nature, 359, 139, 1992.84. Kiørboe, T. et al., Mechanisms and rates of bacterial colonization of sinking aggre-
gates, Appl. Environ. Microbiol., 68, 3996, 2002.85. Fenchel, T., Eppur si muove: many water column bacteria are motile, Aquat. Microb.
Ecol., 24, 197, 2001.86. Grossart, H.P. et al., Bacterial colonization of particles: growth and interactions,
Appl. Environ. Microbiol., 69, 3500, 2003.87. Martinez, J. et al., Variability in ectohydrolytic enzyme activities of pelagic marine
bacteria and its significance for substrate processing in the sea, Aquat. Microb.Ecol., 10, 223, 1996.
88. Kiørboe, T. et al., Dynamics of microbial communities on marine snow aggregates:colonization, growth, detachment, and grazing mortality of attached bacteria, Appl.Environ. Microbiol., 69, 3036, 2003.
89. Kiørboe, T. et al., Particle-associated flagellates: swimming patterns, colonizationrates, and grazing on attached bacteria, Aquat. Microb. Ecol., 35, 141, 2004.
90. Kiørboe, T., Marine snow microbial communities: scaling of abundances with aggre-gate size, Aquat. Microb. Ecol., 33, 67, 2003.
91. Caron, D.A. et al., Heterotrophic bacteria and bacterivorous protozoa in oceanicmacro-aggregates, Science, 218, 795, 1982.
3209_C013.fm Page 297 Thursday, November 10, 2005 10:49 AM

298 Ecology and Biomechanics
92. Artolozaga, I. et al., Succession of bacterivorous protists on laboratory-made marinesnow, J. Plankton Res., 19, 1429, 1997.
93. Coppellotti, O. and Matarazzo, P., Ciliate colonization of artificial substrates in theLagoon of Venice, J. Mar. Biol. Assoc. U.K., 80, 419, 2000.
94. Lighthill, J., Flagellar hydrodynamics — Neumann, Jv Lecture, 1975, SIAM Rev.,18, 161, 1976.
95. Jonsson, P.R., Johansson, M., and Pierce, R.W., Attachment to suspended particlesmay improve foraging and reduce predation risk for tintinnid ciliates, Limnol. Ocean-ogr., 49, 1907, 2004.
96. Fukuda, H. and Koike, I., Feeding currents of particle-attached nanoflagellates — Anovel mechanism for aggregation of submicron particles, Mar. Ecol.-Prog. Ser., 202,101, 2000.
97. Blake, J.R. and Otto, S.R., Filter feeding, chaotic filtration, and a blinking Stokeslet,Theor. Comput. Fluid Dyn., 10, 23, 1998.
98. Orme, B.A.A., Otto, S.R., and Blake, J.R., Enhanced efficiency of feeding and mixingdue to chaotic flow patterns around choanoflagellates, IMA J. Math. Appl. Med. Biol.,18, 293, 2001.
99. Grunbaum, D., A model of feeding currents in encrusting bryozoans shows interfer-ence between zooids within a colony, J. Theor. Biol., 174, 409, 1995.
100. Fenchel, T. and Glud, R.N., Veil architecture in a sulphide-oxidizing bacteriumenhances countercurrent flux, Nature, 394, 367, 1998.
101. Grunbaum, D., Hydromechanical mechanisms of colony organization and cost ofdefense in an encrusting bryozoan, Membranipora membranacea, Limnol. Oceanogr.,42, 741, 1997.
102. Kiørboe, T. and Thygesen, U.H., Fluid motion and solute distribution around sinkingaggregates. II. Implications for remote detection by colonizing zooplankters, Mar.Ecol.-Prog. Ser., 211, 15, 2001.
103. Brown, D.A. and Berg, H.C., Temporal stimulation of chemotaxis in Escherichiacoli, Proc. Natl. Acad. Sci. U.S.A., 71, 1388, 1974.
104. Fenchel, T., Microbial behavior in a heterogeneous world, Science, 296, 1068, 2002.105. Hader, D.P. et al., Gravitaxis and graviperception in flagellates, in Space Life Sciences:
Gravity-Related Processes in Plants, Pergamon, Oxford, 2003, p. 2181.106. Fenchel, T. and Blackburn, N., Motile chemosensory behaviour of phagotrophic
protists: mechanisms for and efficiency in congregating at food patches, Protist, 150,325, 1999.
107. Roberts, A.M. and Deacon, F.M., Gravitaxis in motile micro-organisms: the role offore-aft body asymmetry, J. Fluid Mech., 452, 405, 2002.
108. Turner, L., Ryu, W.S., and Berg, H.C., Real-time imaging of fluorescent flagellarfilaments, J. Bacteriol., 182, 2793, 2000.
109. Larsen, S.H. et al., Change in direction of flagellar rotation is basis of chemotacticresponse in Escherichia-coli, Nature, 249, 74, 1974.
110. Adler, J., Chemoreceptors in bacteria, Science, 166, 1588, 1969.111. Dusenbery, D.B., Minimum size limit for useful locomotion by free-swimming
microbes, Proc. Natl. Acad. Sci. U.S.A., 94, 10949, 1997.112. Blackburn, N. and Fenchel, T., Influence of bacteria, diffusion and sheer on micro-
scale nutrient patches, and implications for bacterial chemotaxis, Mar. Ecol.-Prog.Ser., 189, 1, 1999.
113. Jennings, H.S., On the significance of the spiral swimming of organisms, Am. Nat.,35, 369, 1901.
3209_C013.fm Page 298 Thursday, November 10, 2005 10:49 AM

Implications of Microbial Motility on Water Column Ecosystems 299
114. Crenshaw, H.C., Orientation by helical motion. 1. Kinematics of the helical motionof organisms with up to 6-degrees of freedom, Bull. Math. Biol., 55, 197, 1993.
115. Crenshaw, H.C., Orientation by helical motion. 3. Microorganisms can orient tostimuli by changing the direction of their rotational velocity, Bull. Math. Biol., 55,231, 1993.
116. Crenshaw, H.C. and Edelsteinkeshet, L., Orientation by helical motion. 2. Changingthe direction of the axis of motion, Bull. Math. Biol., 55, 213, 1993.
117. Crenshaw, H.C., A new look at locomotion in microorganisms: rotating and translat-ing, Am. Zool., 36, 608, 1996.
118. Naitoh, Y. and Sugino, K., Ciliary movement and its control in paramecium, J.Protozool., 31, 31, 1984.
119. Eckert, R., Bioelectric control of ciliary activity, Science, 176, 473, 1972.120. Iwadate, Y. and Suzaki, T., Ciliary reorientation is evoked by a rise in calcium level
over the entire cilium, Cell Motil. Cytoskeleton, 57, 197, 2004.121. Hyams, J.S. and Borisy, G.G., Isolated flagellar apparatus of Chlamydomonas —
characterization of forward swimming and alteration of waveform and reversal ofmotion by calcium-ions in vitro, J. Cell Sci., 33, 235, 1978.
122. Holwill, M.E.J. and McGregor, J.L., Control of flagellar wave movement in Crithidia-oncopelti, Nature, 255, 157, 1975.
123. Cook, S.P. et al., Sperm chemotaxis — egg peptides control cytosolic calcium toregulate flagellar responses, Dev. Biol., 165, 10, 1994.
124. Brokaw, C.J., Calcium and flagellar response during chemotaxis of bracken sperma-tozoids, J. Cell. Physiol., 83, 151, 1974.
125. Fenchel, T., How dinoflagellates swim, Protist, 152, 329, 2001.126. Hader, D.P., Polarotaxis, gravitaxis and vertical phototaxis in the green flagellate,
Euglena-gracilis, Arch. Microbiol., 147, 179, 1987.127. Kessler, J.O., Hill, N.A., and Hader, D.P., Orientation of swimming flagellates by
simultaneously acting external factors, J. Phycol., 28, 816, 1992.128. Hemmersbach, R., Volkmann, D., and Hader, D.P., Graviorientation in protists and
plants, J. Plant Physiol., 154, 1, 1999.129. Brinkman, K., No geotaxis in euglena, Z. Pflanzenphysiol., 59, 12, 1968.130. Dembowski, J., Die Vertikalbewegungen von Paramecium caudatum, Arch. Protis-
tenkd., 74, 153, 1931.131. Fukui, K. and Asai, H., Negative geotactic behavior of Paramecium-caudatum is
completely described by the mechanism of buoyancy-oriented upward swimming,Biophys. J., 47, 479, 1985.
132. Wagner, H., On the effect of gravity upon the movements and aggregation of Euglenaviridis and other micro-organisms., Proc. R. Soc. Lond. Ser. A, 201, 333, 1911.
133. Fenchel, T. and Finlay, B.J., Geotaxis in the ciliated protozoan Loxodes, J. Exp. Biol.,110, 17, 1984.
134. Lebert, M. and Hader, D.P., How Euglena tells up from down, Nature, 379, 590, 1996.135. Lebert, M. and Hader, D.P., Negative gravitactic behavior of Euglena gracilis can
not be described by the mechanism of buoyancy-oriented upward swimming, in LifeSciences: Microgravity Research, 1999, p. 851.
136. Grünbaum, D., Predicting availability to consumers of spatially and temporally vari-able resources, Hydrobiologia, 480, 175, 2002.
3209_C013.fm Page 299 Thursday, November 10, 2005 10:49 AM


301
14 The Biomechanics of Ecological Speciation
Jeffrey Podos and Andrew P. Hendry
CONTENTS
14.1 Introduction ..................................................................................................30114.2 Modes of Speciation ....................................................................................30314.3 Biomechanics and Ecological Speciation....................................................306
14.3.1 Mating Displays and Body Size ......................................................30614.3.2 Mating Displays and Locomotion ...................................................30714.3.3 Mating Displays and Feeding ..........................................................309
14.4 Ecological Dependence and the Evolution of Isolating Barriers................31114.5 Positive Feedback Loops .............................................................................31314.6 Dual Fitness Consequences for Ecological Speciation ...............................31314.7 Performance and Mating Display Production .............................................31414.8 Conclusion....................................................................................................314References..............................................................................................................315
14.1 INTRODUCTION
This book addresses the interplay of biomechanics and ecology. Ecology has longbeen recognized as an important factor in evolutionary diversification and speciation.Architects of the neo-Darwinian synthesis, particularly Mayr [1] and Dobzhansky[2], argued that spatial variation in ecological parameters should facilitate divergenttrajectories of adaptive evolution among populations, at least among populationsthat are able to maintain some degree of reproductive isolation. This insight wasovershadowed for several decades by attention to genetic mechanisms of divergenceand stochastic models of speciation. Empirical and conceptual advances in recentyears, however, have spurred a renewed emphasis on ecological causes of evolution-ary diversification and speciation [3–5].
It thus seems timely to consider how biomechanics, through its interface withecology, might affect the processes of evolutionary diversification and speciation.The possibilities here are admittedly broad. For the purposes of this chapter, wefocus on a “by-product” model of speciation. This model features two stages. In thefirst, adaptive divergence of phenotypic traits drives, as an incidental consequence,divergence in mechanisms that mediate the expression and production of mating
3209_C014.fm Page 301 Thursday, November 10, 2005 10:49 AM

302 Ecology and Biomechanics
displays. Second, resulting divergent evolution of display behavior facilitates repro-ductive isolation, further adaptive divergence, and, ultimately, speciation. In thischapter we evaluate this model’s conceptual foundations, review supporting empir-ical evidence, and outline some of its evolutionary implications. We begin with amore detailed explanation of the by-product model.
Consider an ecological resource that takes two discrete forms, ResourceA andResourceB, with the frequencies of these forms varying nonrandomly in space. Nowconsider an animal species possessing some morphological, behavioral, or physio-logical trait used for exploiting this resource. Assume that different trait values arebest suited for the different resource forms, say TraitA for ResourceA and TraitB forResourceB. As long as these trait values are heritable, and as long as dispersal amongsites with different resources is somewhat limited — thus restricting gene flow —natural selection should favor the evolution of TraitA in sites where ResourceA
predominates, and the evolution of TraitB in sites where ResourceB predominates.Our example thus far follows the well-established logic of adaptive divergence inresponse to natural selection in distinct ecological environments [1–3,6–10].
Now consider the possibility that evolution of the trait in question also influences,as a by-product of selected changes in morphology, physiology, or behavior, thekind of mating displays these animals can express or produce. For example, indi-viduals possessing TraitA might be constrained to produce a particular display vari-ant, DisplayA, whereas those possessing TraitB might necessarily produce another,DisplayB. Possible biomechanical causes of correlated evolution among adaptivetraits and mating displays are detailed later in this chapter. As male displays beginto diverge between sites, females would be expected to evolve, through sexualselection, divergent preferences that mirror the changes in display structure [11,12].(We assume, for present purposes, that only males display and that females usedisplays to guide mate choice.) With sufficient time and sufficient limits on geneflow, ResourceA environments should thus evolve populations wherein males possessTraitA and produce DisplayA, and wherein females respond preferentially to Dis-playA. At the same time, ResourceB environments should support populations thatevolve the other suite of characteristics (TraitB and DisplayB). If individuals fromthese two ecological environments then come into secondary contact, the probabilityof mating should be diminished, and speciation thus initiated.
The above scenario for divergence is conceptualized, for the sake of argument,as occurring in allopatry (separate and isolated locations) or parapatry (separate butnot isolated locations). In the remainder of this chapter, “populations” or “environ-ments” are thus envisioned as geographically distinct, and “migrants” as individualsthat move between populations or environments. It is important to point out, however,that many of the same processes could in principle occur in sympatry (populationsdiverging in the same physical location). Under sympatric divergence, differentgroups of individuals may specialize on different resources within a common geo-graphical location. Here “populations” would refer to sympatric groups using thedistinct resource “environments,” and “migrants” would be individuals that switchresources. It is not our intention to distinguish between these geographical scenariosbecause we are more interested in general mechanisms.
3209_C014.fm Page 302 Thursday, November 10, 2005 10:49 AM

The Biomechanics of Ecological Speciation 303
Our chapter continues with a brief overview of modes of speciation, focusingin particular on a distinction between ecologically dependent and ecologically inde-pendent isolating barriers. Attention to this distinction will be helpful later as weevaluate the possible impacts of adaptive divergence and concomitant evolution inthe biomechanical bases of display behavior.
14.2 MODES OF SPECIATION
A traditional method for categorizing speciation events is on the basis of geography,i.e., as occurring in allopatry, sympatry, or parapatry [4,8,13]. Another way tocategorize speciation events is by identifying “isolating barriers” that initiate andmaintain separation between incipient species [2,4,14]. Isolating barriers are typi-cally categorized as occurring before mating (premating), after mating but beforezygote formation (postmating prezygotic), or after zygote formation (postzygotic).These categories are then further parsed into nested subcategories. Although iden-tifying isolating barriers is a critical part of any research on speciation, we do notdiscuss these subcategories further because they have been reviewed elsewhere[4,14]. Instead, we focus our attention on one of the ultimate and long-standingquestions of speciation: What are the initial causes of reproductive isolation (andthus of speciation) among diverging, incipient species?
Schluter [15] proposed that the initial causes of speciation can be divided intofour general modes: hybridization and polyploidy, genetic drift, uniform naturalselection, and divergent natural selection. Sexual selection is not considered a sep-arate mode but rather as a potential contributor within each. Under uniform naturalselection, in which different populations are exposed to similar ecological environ-ments, divergence occurs as different advantageous mutations arise and spread tofixation in different populations. These mutations may be incompatible when broughttogether by interpopulation mating, thus causing reproductive isolation among dif-ferent populations adapted to similar environments [4,16]. Conversely, under diver-gent natural selection, similar mutations may arise in multiple populations, butdifferent mutations will be favored and therefore retained in different ecologicalenvironments. Adaptive divergence may then lead to initial reproductive isolation ina number of ways. For example, mutations favored in one environment might conferreduced fitness in alternative environments, perhaps also favoring individuals thatmate assortatively. Schluter [3,15] refers to this latter mode of speciation — by-product effects of divergent natural selection — as “ecological speciation.” This isthe arena within which we consider the role of biomechanics.
Isolating barriers that arise through ecological speciation (or other speciationmodes for that matter) may be manifest in two general ways. On the one hand,adaptation to different environments may lead to reproductive isolation that dependsdirectly on features of those environments, such as the availability and distributionof food resources. Such isolating barriers are therefore considered “extrinsic,”“conditional,” “environment dependent,” or “ecologically dependent” [4,17,18]. Toillustrate, male displays are often optimized through natural selection for effectivetransmission in the particular environments that animals inhabit [19–21]. Songbirdsliving in forested environments, for example, tend to evolve mating songs with lower
3209_C014.fm Page 303 Thursday, November 10, 2005 10:49 AM

304 Ecology and Biomechanics
frequencies and lower rates of note repetition, as adaptations that minimize degra-dation by reverberation [21]. Optimization of transmission properties in local habitatsmay thus diminish the effectiveness of particular songs when sung in alternativeenvironments. If the signaling environments inhabited by a species are sufficientlydivergent, and the signals are differentially effective in these environments, thenfemales may mate preferentially with males from local environments. A locality-dependent process of reproductive isolation would thus be initiated [22]. Isolationbarriers in this example would be premating. Ecologically dependent postmatingbarriers are also feasible. Consider, for example, hybrids with phenotypes that areintermediate to parental phenotypes. Hybrids may suffer lower levels of fitness ineither parental environment because of the difficulty in accessing resources on whichparental types are specialized [e.g., 23]. However, as conceptualized in Figure 14.1A,hybrids with intermediate phenotypes might enjoy higher fitness, relative to eitherparental type, in “intermediate” environments, e.g., in which resource parametersfall in between those in parental environments [e.g., 24].
On the other hand, adaptation to divergent environments may lead to reproductiveisolation that is manifest independently of environmental features. Such isolatingbarriers are considered “intrinsic,” “unconditional,” “environment independent,” or“ecologically independent” [4,17,18]. Ecologically independent premating barriersmay arise if traits under divergent selection are also used in mate choice and in waysthat do not depend on the mating environment. In stickleback fishes, for example,divergent selection between benthic and limnetic morphs has fostered the evolutionof differences in body size. Laboratory mating studies suggest that body size playsan important role in mate choice, in that females appear to choose males with bodysizes similar to their own [25,26]. Ecological independence of body size as a matingcue is illustrated by the observation that body size cues are effective not only in thefield but also under laboratory conditions, in which natural variation in environmentaltransmission properties is not present [e.g., 27,28]. As a generalized example ofecologically independent postzygotic barriers, hybrids of diverging lineages can havegenetic incompatibilities that are expressed equivalently (or near equivalently) inany environment. Under such circumstances, hybrids would experience low fitnessin nature even if intermediate environments are present (Figure 14.1B), and perhapseven under benign laboratory conditions — although such barriers may be strongerunder more stressful conditions [4]. Many studies have demonstrated genetic incom-patibilities in hybrids [4], although we are not aware of any conclusively attributingthe resulting isolation to divergent natural selection.
Exploring the distinction between ecologically dependent and ecologically inde-pendent isolating barriers is useful because it speaks to the integrity of species inthe face of environmental perturbation. Ecologically independent barriers may bemore powerful and robust because they should persist even if the environmentchanges, at least during initial stages of divergence. In contrast, ecologically depen-dent barriers may collapse immediately after environments change and couldtherefore represent a more fragile and tenuous route to speciation. For example, ina long-term study of Darwin’s finches on Daphne Major Island, environmentalchanges resulted in increased relative fitness for hybrids, which has led to the
3209_C014.fm Page 304 Thursday, November 10, 2005 10:49 AM

The Biomechanics of Ecological Speciation 305
breakdown of ecologically dependent isolating barriers and to the morphologicalconvergence of formerly distinct species [29]. And yet, ecologically dependentbarriers can evolve very quickly, simply because adaptive divergence can be veryrapid in nature [reviews: 30,31]. As examples, insect herbivores adapting to intro-duced host plants have evolved ecologically dependent barriers after less than a fewhundred generations [32,33; see also 34]. In addition, ecologically dependent barriersshould be particularly widespread, and may therefore cause initial reductions in geneflow that allow subsequent ecologically independent barriers to evolve [35].
FIGURE 14.1 Differences between (A) ecologically dependent and (B) ecologically inde-pendent reproductive isolation. Assumed is a case whereby population X individuals areadapted to environment X, and population Y individuals are adapted to environment Y. Whenisolation is ecologically dependent, hybrids (with intermediate phenotypes) should have ahigher fitness than parental types in intermediate environments. When isolation is ecologicallyindependent, hybrids should have lower fitness than parental types in all environments,although the specific value for hybrid fitness relative to parental fitness could vary considerably(indicated by the arrows). Of course, both types of isolation may act at the same time,generating any number of intermediate scenarios for hybrid fitness.
Fitn
ess
Environment X
Environment Y
Intermediateenvironment
Population Y
Population X
Hybrids
Population Y
Population X
Hybrids
Fitn
ess
A
B
3209_C014.fm Page 305 Thursday, November 10, 2005 10:49 AM
306 Ecology and Biomechanics
14.3 BIOMECHANICS AND ECOLOGICAL SPECIATION
As ecological speciation progresses, the adaptive divergence of phenotypic traits canpresumably strengthen any number of isolating barriers, both pre- and postmating.For the purposes of this chapter, we focus our attention on the role of biomechanicsin premating isolation, and specifically in relation to mating displays. Mating dis-plays include ritualized movements such as visual or vocal signaling, or the presen-tation of static traits such as exaggerated morphological characters [36]. Manydynamic displays, particularly those under intense sexual selection, appear to becostly or to require high levels of biomechanical proficiency in their production.Indeed, a number of studies have shown that dynamic mating displays require largeenergy investments [37–40] or are underpinned by adaptations for rapid neuromus-cular output [41–43]. High costs or high levels of required proficiency help to ensurethat dynamic displays are “honest,” because such displays tend to provide a reliableindication of a male’s genetic or phenotypic quality [44–46].
The crux of the argument we develop here is that adaptive divergence in phe-notypic traits (morphology, physiology, or behavior) may influence, as a secondaryconsequence, the nature or strength of biomechanical constraints on mating displays.Numerous examples are discussed. Insofar as displays are costly or challenging toproduce, even minor divergence in biomechanical systems could influence an ani-mal’s ability to produce these displays. This divergence could potentially influencereproductive isolation. Four lines of evidence would ideally be gathered to demon-strate that adaptive divergence influences mating displays and therefore speciation.First, a trait related to biomechanical performance should be shown to divergeadaptively among populations and species. Second, the corresponding variation inperformance should be shown to influence mating displays. Third, variation in thesedisplays should be shown to influence mate choice. Fourth, the resulting mate choiceshould be shown to influence speciation. No study has yet systematically examinedthese criteria for a single taxon, although the conceptual relationships betweendivergence, signal variation, and speciation have been considered previously atlength [e.g., 11,47,48]. We now review three broad classes of biological adaptations— in body size, locomotion, and feeding — that may affect, as a secondary conse-quence, the biomechanical bases and expression of mating displays.
14.3.1 MATING DISPLAYS AND BODY SIZE
Body size evolves in response to a wide array of environmental factors. Coldtemperatures, for example, tend to favor larger body sizes, as illustrated by Berg-mann’s rule [larger body sizes at higher latitudes; 49–51]. In homeothermic animals,this trend might arise because of a positive relationship between body size and theability to retain metabolic heat [52]. Large animals may also be favored in highlyseasonal or unpredictable environments because they are comparatively resistant tostarvation [53]. Moreover, body size tends to evolve in response to varying selectionon life-history traits such as fecundity, reproductive rate, and dispersal. For example,
3209_C014.fm Page 306 Thursday, November 10, 2005 10:49 AM
The Biomechanics of Ecological Speciation 307
selection for increased fecundity favors comparatively large body sizes, whereasselection for rapid offspring production often favors small body sizes [54,55].
Body size influences myriad aspects of organismal physiology and biomechanics[52,56]. Traits involved in communication are no exception. The maximum size ofornaments used in visual signaling is necessarily limited by body size [36,57].Peacock tails or deer antlers, for example, are constrained to sizes and masses thatcan be effectively carried and displayed. Body size also shapes acoustic signalsbecause of positive scaling between body size and the mass of acoustic source tissues[36,58]. Darwin’s finches of the Galápagos Islands, for example, show a positive,nearly isometric relationship between body mass and syrinx (sound source) volume[59], and larger-bodied finches tend to sing at correspondingly lower vocal frequen-cies [60]. Similar relationships between vocal frequency and body size have beendemonstrated in numerous taxa, especially anurans and birds [e.g., 61–66].
Body size influences how animals are able to execute visual and acoustic displaysbecause of tradeoffs between body size and agility. Size–agility tradeoffs have beendocumented within some birds and butterflies. In these groups, the frequency, dura-tion, and even the effectiveness of male aerial displays tend to be highest in speciesor individuals with the smallest body sizes [67–71]. This pattern is consistent withdemonstrated negative impacts of body size on flight agility [67]. Negative impactsof body size on display production may help to explain selection for small bodysize (“reversed” sexual dimorphism) in species of birds and insects where males useaerial displays [68,69,72]. Body size also influences electric organ discharges(EODs) in electric fishes. Larger-bodied fishes can support larger populations ofelectrocytes, thus augmenting EOD intensity, and also express greater charge sepa-ration distances in their electrogenic organs, thus enhancing EOD range [36].
The first two criteria in support of the by-product speciation model are thusclearly met — body size has been shown to undergo adaptive divergence throughnatural selection, and body size variation can influence the expression of matingdisplays. Many lines of available evidence also support a role for body size in matechoice. In some taxa, females have been shown to express preferences for maleswith body sizes similar to their own [73,74]. In other taxa, females express generalpreferences for larger males, although intrasexual competition can limit femaleaccess to larger males and thus result in patterns of size-assortative mating [75].Because body size is often highly correlated with aspects of behavior and courtship,which in turn provide proximate cues in mate choice, divergent selection on bodysize would seem to be relatively effective in promoting assortative mating [e.g., 76].
14.3.2 MATING DISPLAYS AND LOCOMOTION
Complex and highly specialized adaptations for locomotion are prevalent throughoutthe animal kingdom, and often entail substantial modification of broad suites oftraits [77]. In terrestrial vertebrates, rapid sprint speeds are enabled by adaptationsin limb length, aerobic capacity, and efficiency of pulmonary gas exchange [78]. Infishes that use their caudal fin for routine propulsion, sustained swimming is typicallyassociated with fusiform bodies and high aspect ratio lunate tails, whereas burstswimming is typically associated with deep bodies and large fins, particularly in the
3209_C014.fm Page 307 Thursday, November 10, 2005 10:49 AM

308 Ecology and Biomechanics
caudal area [79]. In aerial vertebrates, powered (flapping) flight requires numerousadaptations including reduced body weight, aerodynamic body shape, broad liftsurfaces, and efficient flight muscles [80]. In humans, selection for endurance run-ning may have favored a broad suite of traits including springlike leg tendons,skeletal stabilization, plantar arches, forearm shortening, and expanded venous cir-culation for thermoregulation [81].
The ecological bases of locomotory adaptation are perhaps best studied throughcomparison of closely related species or populations. Many studies could be citedto this effect [82]; here we provide two representative examples. The first concernsAnolis sagrei, a lizard found throughout the Caribbean. In the late 1970s and early1980s, this species was introduced to islands that contained no lizards. Ten tofourteen years later, the introduced populations were sampled and found to haveundergone substantial divergence in hind- and forelimb length [83]. Moreover, thesechanges correlated positively with the mean diameter of available perches on theexperimental islands, consistent with functional studies of limb length and locomotorefficiency [83,84]. The second example concerns Gambusia affinis, the westernmosquitofish. Langerhans et al. [85] found that mosquitofish populations under highrisk of predation have evolved comparatively large caudal regions, small heads, andelongate bodies, all of which are thought to improve escape ability. Interestingly,these “fast-start” adaptations may impair prolonged swimming ability, which couldexplain the retention of the opposing suite of traits in low-risk populations [see also86].
Adaptive divergence in locomotory traits might, in turn, influence mating dis-plays, given that displays often include, and sometimes even amplify, motor patternsused during normal locomotion. Courting displays in waterfowl, for example, includewing flapping, swimming, and changes in head posture similar to those that occurbefore flight [87,88]. Some other displays, such as courtship flights of hummingbirdsand “strut” displays of grouse, are dominated by locomotion [89,90]. Indeed, a majorpreoccupation in early ethology was to explain ritualization, the process whereincommon locomotory patterns become incorporated into stereotyped displaysequences [91,92]. Beyond providing raw material for display patterns, selection forlocomotory traits may also fine-tune animals’ abilities to perform mating displays.The evolution of complex hummingbird flight displays, for instance, was presumablyfacilitated by selection for agile flight capabilities in other contexts, such as for foodand territory defense. Another possible example concerns crickets and other ortho-pterans that produce acoustic signals through stridulation of the wings. The diver-gence of flight anatomy and biomechanics (e.g., wing size, flight muscle properties)presumably could influence the kinds of acoustic signals these animals produce andevolve.
Operationally it can be very difficult to study biomechanical impacts of loco-motion on dynamic displays, simply because it is difficult to quantify the kineticsand dynamics of display movements in an animal that itself is moving through space[e.g., 89]. It is thus no surprise that most studies of display biomechanics havefocused on animals that signal while stationary. An alternative approach is to studythe biomechanical bases of multimodal signals, i.e., signals that involve multiplesensory channels. In a recent study of brown-headed cowbirds, for instance, Cooper
3209_C014.fm Page 308 Thursday, November 10, 2005 10:49 AM

The Biomechanics of Ecological Speciation 309
and Goller [93] studied mating displays that feature simultaneous vocal output andwing movements. Analysis of dynamic changes in air sac pressure, wing movements,and vocal features provide evidence for a biomechanical interaction between wingmovements and vocal displays. Specifically, wing position appears to constrain thetiming of vocal output via biomechanical influences on the respiratory system [93].Similar interactions between wing movements and breathing could presumablyinfluence the evolution of vocal signals produced during flight [see also 94,95].
As in the previous section, the first two criteria for biomechanically drivenecological speciation are well supported. Morphological and physiological param-eters certainly diverge adaptively through natural selection, and variation in loco-motory performance certainly affects the expression of mating displays. There arefew data, however, that directly support a link in any given system between loco-motory adaptations, resulting divergence in mating displays, and mate choice. Apromising model system on this front is the threespine stickleback, for which dif-ferences among sympatric morphs in body size and behavior are quite pronounced.While some attention has been given to causes and mating consequences of variationin body size in sticklebacks [73], less is known about intermorph differences inswimming performance, or about how such differences might affect mating displaysand patterns. The intricacy and complexity of mating displays in this species, whichhas captivated behavioral biologists since Tinbergen [92], increases the likelihoodthat intermorph differences in display performance would be influenced by divergentselection on swimming performance.
14.3.3 MATING DISPLAYS AND FEEDING
Animals have evolved a wide range of morphological and behavioral adaptationsfor feeding [e.g., 96–99]. Fishes, for example, employ an impressive diversity offeeding modes including suction feeding, ram feeding, and prey capture through jawprotrusion [100–103]. Studies of variation within and among closely related speciesillustrate how ecological conditions may promote adaptive divergence in these traitsand behaviors. Variation within a species in preferred prey (i.e., “resource polymor-phisms”), for example, is sometimes mirrored by genetically based variation infeeding morphology, which in turn may provide the raw material for incipientspeciation [3,104; but see 105]. The link between adaptation to alternative foodresources and speciation is indeed evident in many classic adaptive radiations,including fishes in postglacial temperate regions [3], African cichlids [106,107],Galápagos finches [6,108], and Hawaiian honeycreepers [109].
In a majority of cases, feeding adaptations likely have little proximate impact onthe biomechanics of display production. This is because the two functions often showlittle if any overlap in their mechanical and anatomical bases. This is certainly truefor many familiar displays, such as plumage or color pattern in birds and fishes. Insome taxa, however, feeding and mating adaptations make use of the same morpho-logical structures. When they do, feeding and display functions may interact on bothorganismal and evolutionary scales. In an intriguing example, male giraffes usetheir long necks not only for foraging on high branches but also as weapons duringintrasexual competition for females [110]. Feeding and display functions may
3209_C014.fm Page 309 Thursday, November 10, 2005 10:49 AM

310 Ecology and Biomechanics
sometimes oppose each other in biomechanical function. Male fiddler crabs, forexample, use their claws during feeding and during displays to females; the smalland agile claws are best for feeding and the large and conspicuous claws mostuseful for display. In response to this tradeoff, fiddler crabs have “assigned” eachfunction to a different claw [111]. In other cases, however, feeding and displayfunctions do not involve redundant structures, and morphological or biomechanicaltradeoffs cannot be circumvented. One such case, on which we now focus, concernsoverlap between feeding adaptations and mechanisms of vocal production in song-birds.
A primary feature in the radiation of songbirds is the exploitation of divergentfeeding niches through divergence in the size, form, and function of beaks[108,109,112]. This divergence likely affects the evolution of vocal mating signals,i.e., songs, because of the recently identified contribution of beaks to vocal mechanics[113–115]. One prediction is that divergence in beak and vocal tract volume, andthus in vocal tract resonance properties, should affect the evolution of vocal fre-quencies. This is because larger-volume vocal tracts are best suited for low-frequencysounds, whereas small-volume vocal tracts are best suited for high frequency sounds[113,116]. In support of this prediction, fundamental frequency has been shown tovary negatively with beak length in neotropical woodcreepers [65]. Another predic-tion is that the evolution of increased force application, such as that required tocrack larger and harder seeds, may detract from a bird’s vocal performance capa-bilities [117]. Force–speed tradeoffs are a common feature of mechanical systems,and can be attributed to both biomechanical and muscular properties [118,119]. Inthe evolution of some kinds of “superfast” muscles, such as those used for soundproduction in the toadfish swimbladder, elevated rates of crossbridge detachmentduring contraction necessarily preclude strong force application [119]. The evolutionof bite force in granivorous birds is expected to affect the rapidity with which theycan adjust beak gape, with increases in bite force diminishing maximum rates ofgape adjustment, and vice versa.
Of particular relevance to this latter prediction is the expression of song featuresthat rely on changes in beak gape in their production. Gape changes are tightlycorrelated with changes in fundamental frequency [e.g., 120–124] and with theresonance function of the vocal tract filter [115,116]. Tradeoffs between beak gapespeed and force, either at the level of jaw muscles or force transmission mechanics,could thus impede the evolution of high-performance songs, especially for strongbiters. Recognition of this relationship suggests that two song features in particular,trill rate and frequency bandwidth, should be influenced by beak size evolutionbecause the production of these features requires rapid beak gape cycling [125].Some (but not all) available data support this prediction [126–130]. The nature ofthis relationship is illustrated in an ongoing study of a population of medium groundfinches, Geospiza fortis, at El Garrapatero on Santa Cruz Island, Galápagos. Thispopulation shows a bimodal distribution of small and large beak sizes, with fewintermediates [130] (A.P. Hendry et al., unpublished data). In this population, mor-phological variation is correlated closely with bite force capacities and with thefrequency bandwidth of song, in directions predicted by biomechanical models ofbeak and vocal tract function (Figure 14.2) [130,131].
3209_C014.fm Page 310 Thursday, November 10, 2005 10:49 AM
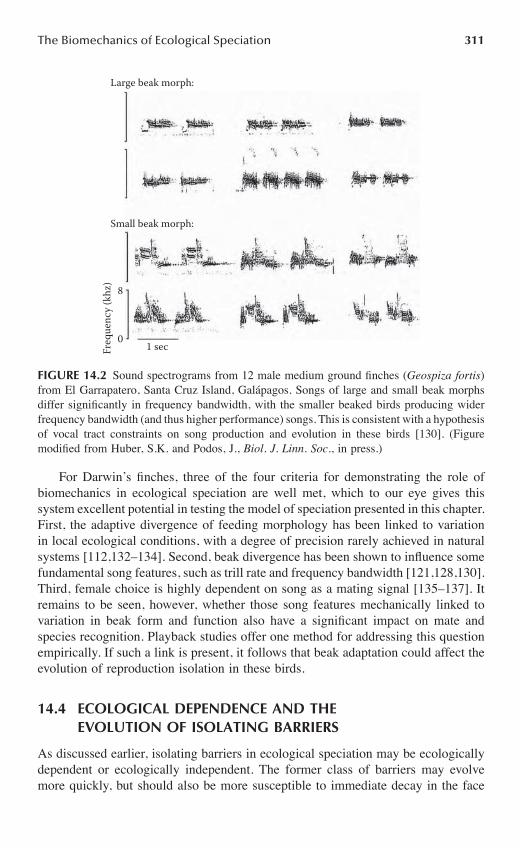
The Biomechanics of Ecological Speciation 311
For Darwin’s finches, three of the four criteria for demonstrating the role ofbiomechanics in ecological speciation are well met, which to our eye gives thissystem excellent potential in testing the model of speciation presented in this chapter.First, the adaptive divergence of feeding morphology has been linked to variationin local ecological conditions, with a degree of precision rarely achieved in naturalsystems [112,132–134]. Second, beak divergence has been shown to influence somefundamental song features, such as trill rate and frequency bandwidth [121,128,130].Third, female choice is highly dependent on song as a mating signal [135–137]. Itremains to be seen, however, whether those song features mechanically linked tovariation in beak form and function also have a significant impact on mate andspecies recognition. Playback studies offer one method for addressing this questionempirically. If such a link is present, it follows that beak adaptation could affect theevolution of reproduction isolation in these birds.
14.4 ECOLOGICAL DEPENDENCE AND THE EVOLUTION OF ISOLATING BARRIERS
As discussed earlier, isolating barriers in ecological speciation may be ecologicallydependent or ecologically independent. The former class of barriers may evolvemore quickly, but should also be more susceptible to immediate decay in the face
FIGURE 14.2 Sound spectrograms from 12 male medium ground finches (Geospiza fortis)from El Garrapatero, Santa Cruz Island, Galápagos. Songs of large and small beak morphsdiffer significantly in frequency bandwidth, with the smaller beaked birds producing widerfrequency bandwidth (and thus higher performance) songs. This is consistent with a hypothesisof vocal tract constraints on song production and evolution in these birds [130]. (Figuremodified from Huber, S.K. and Podos, J., Biol. J. Linn. Soc., in press.)
Large beak morph:
Small beak morph:
8
01 secFr
eque
ncy
(khz
)
3209_C014.fm Page 311 Thursday, November 10, 2005 10:49 AM

312 Ecology and Biomechanics
of environmental change [35]. We suggest that isolating barriers caused by diver-gence in biomechanical systems, at least as conceptualized in this chapter, will becharacterized substantially by ecological independence. This is because the produc-tion and evolution of mating displays usually depends more on intrinsic biomechan-ical properties of the organism, as compared to extrinsic ecological properties of theenvironment (assuming the traits involved are genetically based). In other words,the intrinsic nature of biomechanical systems suggests that the second criteriondiscussed in the examples above — adaptive divergence in phenotypes influencingmating displays — will be expressed partly independently of diversity in environ-ments. Hummingbirds selected for large bodies, for example, will necessarily beconstrained to produce less agile flight displays, regardless of the environments inwhich they display. The same would hold true for many other dynamic matingdisplays, such as the electric signals of fishes, visual displays in waterfowl, andcalling in crickets and anurans, for which the potential for producing different kindsof displays is at least partially independent of the particular environments inhabited.For this reason we expect that isolating barriers based on biomechanical performancewill initially persist in the face of environmental change. The same barriers, however,might ultimately decay if environmental changes persist long enough to causeevolutionary convergence in formerly distinct species.
We do not mean to imply that displays are not influenced by variation in envi-ronmental factors — all phenotypic traits are subject to such impacts. For example,water temperature and conductivity influence the electric organ discharges of somefishes [138], and the physical structure of vegetation in terrestrial systems influencesthe propagation of acoustic signals in birds [21]. Some isolating barriers may bemodified by location-dependent effects, even if they are not strictly ecologicallydependent. Divergence of song in oscine songbirds depends in part on learning andthus on the features of available song models [139]. Different populations of white-crowned sparrows, for example, learn local song types even though they are capableof learning and producing song types from different locales [140]. Learned femalepreferences for local song types might thus facilitate speciation.
Recognition that isolating barriers may include both ecologically dependent andecologically independent components leads us to a general suggestion for futureinvestigations of ecological speciation, as a complement to our broader suggestionof exploring mechanical and functional links between adaptation, mating displays,and reproductive isolation. Instead of showing that any given isolating barrier isecologically independent or dependent, it might be preferable to partition relativeeffects between the two components. For example, one can envision a scenario inwhich between-type matings are found to be half as likely as within-type matingsoutside of the ecological context (e.g., during encounters in the laboratory), and inwhich between-type matings are found to be one-quarter as likely as within-typematings inside the ecological context (e.g., during encounters in nature). We couldthen conclude that the ecologically dependent component of isolation is one-half asstrong as the ecologically independent component (0.25/0.5), and thus causes one-third of the total isolation [0.25/(0.5 + 0.25)].
3209_C014.fm Page 312 Thursday, November 10, 2005 10:49 AM

The Biomechanics of Ecological Speciation 313
14.5 POSITIVE FEEDBACK LOOPS
Ecological speciation may be strengthened by positive feedback loops betweenadaptive divergence and barriers that reduce gene flow [14,35,141]. To elaborate, aninitial reduction in gene flow between two ecological environments, such as that dueto geographical separation, could allow some adaptive divergence to take place. Thispartial adaptive divergence could then further reduce gene flow (i.e., ecologicalspeciation), which could allow further adaptive divergence, which could furtherreduce gene flow, and so on. We expect that phenotypic divergence and correspond-ing tradeoffs and constraints in biomechanical systems will contribute strongly tosuch feedback loops. Consider our example of song production and evolution inDarwin’s finches. As populations begin to adapt to different resources, we haveargued that corresponding changes in beak sizes lead to divergence in the types ofsongs different populations are able to sing. Insofar as this divergence in vocal“potential” leads to differences in realized song structure [139], individuals movingbetween environments could experience reduced mating success, particularly giventhat local females appear to adjust their preferences to match local song types [137,see also 142]. Reduced mating success of migrants between environments couldfurther reduce gene flow between populations, thereby allowing further adaptivedivergence and hence facilitating the positive feedback process.
14.6 DUAL FITNESS CONSEQUENCES FOR ECOLOGICAL SPECIATION
The contribution of ecological trait divergence to speciation depends on the “success”(i.e., fitness) of migrants between environments [14,35], as well as the success ofany resulting hybrids (Figure 14.1). Success in both cases depends on the ability toexploit available resources, and is evident in the survival, growth, and fecundity ofindividuals before reproduction, i.e., natural selection, as well as on their ability toobtain mates, i.e., sexual selection. Both natural and sexual selection can be impor-tant in isolating populations from different ecological environments. With respectto natural selection, ecological and life-history performance (e.g., in resource use,growth, survival, and fecundity) is often low for migrants between environmentsrelative to residents [14,32,33,143], or for hybrids in either parental environmentrelative to pure forms [23,33]. With respect to sexual selection, mating probabilitiesare often low for individuals from different environments relative to individuals fromsimilar environments [26,28,144] or for hybrids relative to pure forms [145].
Isolating barriers manifest through either natural or sexual selection have beendiscussed at length [3,4], but the traits on which they act are usually, if implicitly,considered distinct entities with largely independent implications for speciation. Andyet both types of barriers could be correlated if the trait(s) under natural and sexualselection share a common biomechanical basis. In such cases, adaptive divergenceof a single trait can have dual fitness consequences. Beak size evolution in Darwin’sfinches, to illustrate, should have consequences for both feeding ability (naturalselection) and mate acquisition (sexual selection). The possibility of such correlated
3209_C014.fm Page 313 Thursday, November 10, 2005 10:49 AM

314 Ecology and Biomechanics
isolating barriers is worth considering because they could increase the importanceof a small subset of traits to ecological speciation.
14.7 PERFORMANCE AND MATING DISPLAY PRODUCTION
The relevance of biomechanical constraints to ecological speciation depends on therelationship between performance abilities (i.e., the potential to produce certaindisplays) and actual signaling behavior (i.e., displays as realized in nature). Perfor-mance is increasingly recognized as a critical link between morphology and behavior[77,146,147] but is rarely considered in the studies on production, development, andevolution of animal displays [e.g., 148,149]. We have argued here that as populationsbegin to diverge in adaptive traits, corresponding changes in biomechanical systemsmay influence the potential for animals to perform different kinds of displays. Suchchanges, however, will not necessarily cause immediate changes in the structure ofmating displays. Correlated changes in performance abilities and displays are mostlikely to occur under two conditions [see 139]. First, signals in their initial stateshould be produced at or near some performance limitation. For example, particularlyrapid and intricate aerial displays in a hummingbird may challenge baseline flightperformance capacities. Such displays are likely to be favored by sexual selectionbecause they can help females accurately assess variation in quality among males[37]. Second, adaptive divergence (e.g., in morphological traits) would need to occurin directions that run counter to performance limits, e.g., by imposing phenotypictradeoffs or by barring further evolutionary modifications. In our hummingbirdexample, adaptive evolution toward reduced body sizes and increased flight perfor-mance (e.g., under selection for stronger resource defense) should not detract fromdisplay performance abilities, whereas selection for large body size and thus againstflight agility would immediately detract from display performance. Of course, theformer case could still cause reproductive isolation if the population evolvinghigher performance capacities then performed correspondingly more intricate mat-ing displays.
14.8 CONCLUSION
Many recent studies provide evidence for assortative mating resulting from adaptivedivergence, and thus support a strong role for ecology in speciation. It has alsobecome clear that the evolutionary divergence of signals plays an important role inassortative mating, insofar as signal divergence facilitates reproductive isolation. Wehave argued here that, in some cases, phenotypic divergence can drive, as an inci-dental by-product, the biomechanics of display behavior and the structure of asso-ciated signals, and thus augment the likelihood of ecological speciation.
3209_C014.fm Page 314 Thursday, November 10, 2005 10:49 AM

The Biomechanics of Ecological Speciation 315
REFERENCES
1. Mayr, E., Systematics and the Origin of Species, Columbia University Press, NewYork, 1942.
2. Dobzhansky, T., Genetics and the Origin of Species, Columbia University Press, NewYork, 1951.
3. Schluter, D., The Ecology of Adaptive Radiation, Oxford University Press, Oxford,2000.
4. Coyne, J.A. and Orr, H.A., Speciation, Sinauer Associates, Inc, Sunderland, 2004.5. Orr, M.R. and Smith, T.B., Ecology and speciation, Trends Ecol. Evol., 13, 502, 1998.6. Lack, D., Darwin’s Finches, Cambridge University Press, Cambridge, 1947.7. Darwin, C., On the Origin of Species by Means of Natural Selection, or the Preser-
vation of Favoured Races in the Struggle for Life, John Murray, London, 1859.8. Mayr, E., Animal Species and Evolution, Harvard University Press, Cambridge, 1963.9. Simpson, G.G., The Major Features of Evolution, Columbia University Press, New
York, 1953.10. Endler, J.A., Geographic Variation, Speciation, and Clines, Princeton University
Press, Princeton, NJ, 1977.11. Ptacek, M.B., The role of mating preferences in shaping interspecific divergence in
mating signals in vertebrates, Behav. Proc., 51, 111, 2000.12. Butlin, R.K. and Ritchie, M.G., Behavior and speciation, in Behavior and Evolution,
Slater, P.J.B. and Halliday, T.R., Eds., Cambridge University Press, Cambridge, 1994,p. 43.
13. Bush, G.L., Sympatric speciation in animals: new wine in old bottles, Trends Ecol.Evol., 9, 285, 1994.
14. Nosil, P., Vines, T.H. and Funk, D.J., Reproductive isolation caused by natural selec-tion against immigrants from divergent habitats, Evolution, 59, 705, 2005.
15. Schluter, D., Ecology and the origin of species, Trends Ecol. Evol., 16, 372, 2001.16. Turelli, M., Barton, N.H., and Coyne, J.A., Theory and speciation, Trends Ecol. Evol.,
16, 330, 2001.17. Rundle, H.D. and Whitlock, M.C., A genetic interpretation of ecologically dependent
isolation, Evolution, 55, 198, 2001.18. Rice, W.R. and Hostert, E.E., Laboratory experiments on speciation: what have we
learned in 40 years, Evolution, 47, 1637, 1993.19. Boughman, J.W., Divergent sexual selection enhances reproductive isolation in stick-
lebacks, Nature, 411, 944, 283, 2001.20. Endler, J.A. and Basolo, A.L., Sensory ecology, receiver biases and sexual selection,
Trends Ecol. Evol., 13, 415, 1998.21. Wiley, R.H., Associations of song properties with habitats for territorial oscine birds
of eastern North America, Am. Nat., 138, 973, 1991.22. Slabbekoorn, H. and Smith, T.B., Habitat-dependent song divergence in the little
greenbul: an analysis of environmental selection pressures on acoustic signals, Evo-lution, 56, 1849, 2002.
23. Rundle, H.D., A test of ecologically dependent postmating isolation between sym-patric sticklebacks, Evolution, 56, 322, 2002.
24. Wang, H., McArthur, E.D., Sanderson, S.C., Graham, J.H. and Freeman, D.C., Narrowhybrid zone between two subspecies of big sagebrush (Artemisia tridentata: Aster-aceae). 4. Reciprocal transplant experiments, Evolution, 51, 95, 1997.
3209_C014.fm Page 315 Thursday, November 10, 2005 10:49 AM

316 Ecology and Biomechanics
25. Schluter, D. and Nagel, L.M., Parallel speciation by natural selection, Am. Nat., 146,292, 1995.
26. Rundle, H.D., Nagel, L., Boughman, J.W., and Schluter, D., Natural selection andparallel speciation in sympatric sticklebacks, Science, 287, 306, 2000.
27. Nagel, L. and Schluter, D., Body size, natural selection, and speciation in sticklebacks,Evolution, 52, 209, 1998.
28. McKinnon, J.S., Mori, S., Blackman, B.K., David, L., Kingsley, D.M., Jamieson, L.,Chou, J., and Schluter, D., Evidence for ecology’s role in speciation, Nature, 429,294, 2004.
29. Grant, P.R. and Grant, B.R., Unpredictable evolution in a 30-year study of Darwin’sfinches, Science, 296, 707, 2002.
30. Hendry, A.P. and Kinnison, M.T., The pace of modern life: measuring rates ofcontemporary microevolution, Evolution, 53, 1637, 1999.
31. Stockwell, C.A., Hendry, A.P., and Kinnison, M.T., Contemporary evolution meetsconservation biology, Trends Ecol. Evol., 18, 94, 2003.
32. Sheldon, S.P. and Jones, K.N., Restricted gene flow according to host plant in anherbivore feeding on native and exotic watermilfoils (Myriophyllum: Haloragaceae),Int. J. Plant Sci., 162, 793, 2001.
33. Via, S., Bouck, A.C., and Skillman, S., Reproductive isolation between divergentraces of pea aphids on two hosts. II. Selection against migrants and hybrids in theparental environments, Evolution, 54, 1626, 2000.
34. Hendry, A.P., Wenburg, J.K., Bentzen, P., Volk, E.C., and Quinn, T.P., Rapid evolutionof reproductive isolation in the wild: evidence from introduced salmon, Science, 290,516, 2000.
35. Hendry, A.P., Selection against migrants contributes to the rapid evolution of ecolog-ically-dependent reproductive isolation, Evol. Ecol. Res., 6, 1219, 2004.
36. Bradbury, J.W. and Vehrencamp, S.L., Principles of Animal Communication, SinauerAssociates, Sunderland, MA, 1998.
37. Kodric-Brown, A. and Brown, J.H., Truth in advertising: the kinds of traits favoredby sexual selection, Am. Nat., 124, 309, 1984.
38. Reinhold, K., Greenfield, M.D., Jang, Y.W., and Broce, A., Energetic cost of sexualattractiveness: ultrasonic advertisement in wax moths, Anim. Behav., 55, 905, 1998.
39. Ryan, M.J., Energy, calling, and selection, Am. Zool., 28, 885, 1988.40. Taigen, T.L. and Wells, K.D., Energetics of vocalization by an anuran amphibian
(Hyla versicolor), J. Comp. Physiol. B., 155, 163, 1985.41. Rome, L.C., Syme, D.A., Hollingworth, S., Lindstedt, S.L., and Baylor, S.M., The
whistle and the rattle: the design of sound producing muscles, Proc. Natl. Acad. Sci.U.S.A., 93, 8095, 1996.
42. Bostwick, K.S. and Prum, R.O., High-speed video analysis of wing-snapping in twomanakin clades (Pipridae: Aves), J. Exp. Biol., 206, 3693, 2003.
43. Elemans, C.P.H., Spierts, I.L.Y., Muller, U.K., van Leeuwen, J.L. and Goller, F.,Superfast muscles control dove’s trill, Nature, 431, 146, 2004.
44. Zahavi, A., Mate selection: A selection for a handicap, J. Theor. Biol., 53, 205, 1975.45. Grafen, A., Biological signals as handicaps, J. Theor. Biol., 144, 517, 1990.46. Walther, B.A. and Clayton, D.H., Elaborate ornaments are costly to maintain: evi-
dence for high maintenance handicaps, Behav. Ecol., 16, 89, 2005.47. West-Eberhard, M.J., Sexual selection, social competition, and speciation, Quart. Rev.
Biol., 58, 155, 1983.48. Ryan, M.J. and Rand, A.S., Species recognition and sexual selection as a unitary
problem in animal communication, Evolution, 47, 647, 1993.
3209_C014.fm Page 316 Thursday, November 10, 2005 10:49 AM

The Biomechanics of Ecological Speciation 317
49. Graves, G.R., Bergmann’s rule near the equator: latitudinal clines in body size of anAndean passerine bird, Proc. Natl. Acad. Sci. U.S.A., 88, 2322, 1991.
50. de Queiroz, A. and Ashton, K.G., The phylogeny of a species-level tendency: speciesheritability and possible deep origins of Bergmann’s rule in tetrapods, Evolution, 58,1674, 2004.
51. Ashton, K.G. and Feldman, C.R., Bergmann’s rule in nonavian reptiles: turtles followit, lizards and snakes reverse it, Evolution, 57, 1151, 2003.
52. Schmidt-Nielsen, K.S, Scaling: Why Is Animal Size So Important? Cambridge Uni-versity Press, Cambridge, 1984.
53. Arnett, A.E. and Gotelli, N.J., Bergmann’s rule in larval ant lions: testing the starvationresistance hypothesis, Ecol. Entomol., 28, 645, 2003.
54. Roff, D.A. The Evolution of Life Histories, Chapman & Hall, New York, 1992.55. Blanckenhorn, W.U., The evolution of body size: what keeps organisms small? Quart.
Rev. Biol., 75, 385, 2000.56. Calder, W.A., Size, Function, and Life History, Harvard University Press, Cambridge,
1984.57. Ord, T.J. and Blumstein, D.T., Size constraints and the evolution of display complex-
ity: why do large lizards have simple displays? Biol. J. Linn. Soc., 76, 145, 2002.58. Fletcher, N.H., A simple frequency-scaling rule for animal communication, J. Acoust.
Soc. Am., 115, 2334, 2004.59. Cutler, B., Anatomical Studies of the Syrinx of Darwin’s Finches, San Francisco State
University, San Francisco, 1970.60. Bowman, R.I., The evolution of song in Darwin’s finches, in Patterns of Evolution
in Galápagos Organisms, Bowman, R.I., Berson, M., and Leviton, A.E., Eds., Amer-ican Association for the Advancement of Science, San Francisco, 1983, p. 237.
61. Ryan, M.J. and Brenowitz, E.A., The role of body size, phylogeny, and ambient noisein the evolution of bird song, Am. Nat., 126, 87, 1985.
62. Wallschläger, D., Correlation of song frequency and body weight in passerine birds,Experientia, 36, 69, 1980.
63. Martin, W.F., Evolution of vocalization in the toad genus Bufo, in Evolution in theGenus Bufo, Blair, W.F., Ed., University of Texas Press, Austin, 1972, p. 279.
64. Ryan, M.J., The Tungara Frog, University of Chicago Press, Chicago, 1985.65. Palacios, M.G. and Tubaro, P.L., Does beak size affect acoustic frequencies in wood-
creepers? Condor, 102, 553, 2000.66. Bertelli, S. and Tubaro, P.L., Body mass and habitat correlates of song structure in
a primitive group of birds, Biol. J. Linn. Soc., 77, 423, 2002.67. Andersson, M. and Norberg, R.A., Evolution of reversed sexual size dimorphism and
role partitioning among predatory birds, with a size scaling of flight performance,Biol. J. Linn. Soc., 15, 105, 1981.
68. Blomqvist, D., Johansson, O.C., Unger, U., Larsson, M., and Flodin, L.A., Maleaerial display and reversed sexual size dimorphism in the dunlin, Anim. Behav., 54,1291, 1997.
69. Szekely, T., Freckleton, R.P., and Reynolds, J.D., Sexual selection explains Rensch’srule of size dimorphism in shorebirds, Proc. Natl. Acad. Sci. U.S.A., 101, 12224, 2004.
70. Hernández, M.I.M. and Benson, W.W., Small-male advantage in the territorial tropicalbutterfly Heliconius sara (Nymphalidae): a paradoxical strategy? Anim. Behav., 56,533, 1998.
71. Kemp, D.J. and Wiklund, C., Fighting without weaponry: a review of male-malecontest competition in butterflies, Behav. Ecol. Sociobiol., 49, 429, 2001.
3209_C014.fm Page 317 Thursday, November 10, 2005 10:49 AM

318 Ecology and Biomechanics
72. McLachlan, A.J. and Allen, D.F., Male mating success in Diptera: advantages of smallsize, Oikos 48, 11, 1987.
73. Boughman, J.W., Rundle, H.D., and Schluter, D., Parallel evolution of sexual isolationin sticklebacks, Evolution 59, 361, 2005.
74. Rahman, N., Dunham, D.W., and Govind, C.K., Size-assortative pairing in the big-clawed snapping shrimp, Alpheus heterochelis, Behaviour, 139, 1443, 2002.
75. Harari, A.R., Handler, A.M., and Landolt, P.J., Size-assortative mating, male choiceand female choice in the curculionid beetle Diaprepes abbreviatus, Anim. Behav., 58,1191, 1999.
76. Crespi, B.J., Causes of assortative mating in arthropods, Anim. Behav., 38, 980, 1989.77. Irschick, D.J. and Garland, T. Jr., Integrating function and ecology in studies of
adaptation: investigations of locomotor capacity as a model system, Ann. Rev. Ecol.Syst., 32, 367, 2001.
78. Jones, J.H. and Lindstedt, S.L., Limits to maximal performance, Ann. Rev. Physiol.,55, 547, 1993.
79. Webb, P.W., Body form, locomotion and foraging in aquatic vertebrates, Am. Zool.,24, 107, 1984.
80. Norberg, U.M., Vertebrate Flight: Mechanics, Physiology, Morphology, Ecology andEvolution, Springer-Verlag, Berlin, 1990.
81. Bramble, D.M. and Lieberman, D.E., Endurance running and the evolution of Homo,Nature, 432, 345, 2004.
82. Irschick, D.J., Measuring performance in nature: implications for studies of fitnesswithin populations, Integ. Comp. Biol., 43, 396, 2003.
83. Losos, J.B., Warheit, K.I., and Schoener, T.W., Adaptive differentiation followingexperimental island colonization in Anolis lizards, Nature, 387, 70, 1997.
84. Losos, J.B. and Irschick, D.J., The effect of perch diameter on escape behaviour ofAnolis lizards: Laboratory predictions and field tests, Anim. Behav., 51, 593, 1996.
85. Langerhans, R.B., Layman, C.A., Shokrollahi, A.M., and DeWitt, T.J., Predator-driven phenotypic diversification in Gambusia affinis, Evolution, 58, 2305, 2004.
86. Langerhans, R.B. and DeWitt, T.J., Shared and unique features of evolutionary diver-sification, Am. Nat., 164, 335, 2004.
87. Lorenz, K.Z., The comparative method in studying innate behaviour patterns, Symp.Soc. Exp. Biol., 4, 221, 1950.
88. Heinroth, O. and Heinroth, K., Aus dem Leben der Vogel, Springer-Verlag, Berlin,1955.
89. Dantzker, M.S., Deane, G.B., and Bradbury, J.W., Directional acoustic radiation inthe strut display of male sage grouse Centrocercus urophasianus, J. Exp. Biol., 202,2893, 1999.
90. Gibson, R.M., Female choice in sage grouse: the roles of attraction and activecomparison, Behav. Ecol. Sociobiol., 39, 55, 1996.
91. Daanje, A., On locomotory movements in birds and the intention movements derivedfrom them, Behaviour, 3, 48, 1950.
92. Tinbergen, N., The Study of Instinct, Clarendon Press, Oxford, 1951.93. Cooper, B.G. and Goller, F., Multimodal signals: enhancement and constraint of song
motor patterns by visual display, Science, 303, 544, 2004.94. Boggs, D.F., Seveyka, J.J., Kilgore, D.L.J., and Dial, K.P., Coordination of respiratory
cycles with wingbeat cycles in the black-billed magpie (Pica pica), J. Exp. Biol.,200, 1413, 1997.
95. Huber, S.K., Coordination of vocal production and flight in the cockatiel Nymphaticushollandicus, Integ. Comp. Biol., 42, 1246, 2002.
3209_C014.fm Page 318 Thursday, November 10, 2005 10:49 AM

The Biomechanics of Ecological Speciation 319
96. Liem, K.F., Evolutionary strategies and morphological innovations: cichlid pharyn-geal jaws, Syst. Zool., 22, 425, 1973.
97. Yanega, G.M. and Rubega, M.A., Hummingbird jaw bends to aid insect capture,Nature, 428, 615, 2004.
98. Schwenk, K., Feeding: Form, Function, and Evolution in Tetrapod Vertebrates, Aca-demic Press, San Diego, 2000.
99. Dumont, E.R., Bats and fruit: an ecomorphological approach, in Bat Ecology, Kunz,T.H. and Fenton, M.B., Eds., University of Chicago Press, Chicago, 2003, p. 398.
100. Lauder, G.V. and Liem, K.F., Prey capture by Luciocephalus pulcher: implicationsfor models of jaw protrusion in teleost fishes, Env. Biol. Fishes, 6, 257, 1981.
101. Liem, K.F., Adaptive significance of intra- and interspecific differences in the feedingrepertoires of cichlid fishes, Am. Zool., 20, 295, 1980.
102. Westneat, M.W. and Wainwright, P.C., Feeding mechanism of Epibulus insidiator(Labridae, Teleostei): evolution of a novel functional system, J. Morphol., 202, 129,1989.
103. Norton, S.F. and Brainerd, E.L., Convergence in the feeding mechanics of ecomor-phologically similar species in the Centrarchidae and Cichlidae, J. Exp. Biol., 176,11, 1993.
104. Smith, T.B. and Skúlason, S., Evolutionary significance of resource polymorphismsin fishes, amphibians, and birds, Ann. Rev. Ecol. Syst., 27, 111, 1996.
105. Mittelbach, G.C., Osenberg, C.W., and Wainwright, P.C., Variation in feeding morph-ology between pumpkinseed populations: phenotypic plasticity or evolution? Evol.Ecol. Res., 1, 111, 1999.
106. Liem, K.F., Modulatory multiplicity in the feeding mechanism in cichlid fishes, asexemplified by the invertebrate pickers of Lake Tanganyika, J. Zool., Lond., 189, 93,1979.
107. Streelman, J.T., Alfaro, M., Westneat, M.W., Bellwood, D.R., and Karl, S.A., Evo-lutionary history of the parrotfishes: biogeography, ecomorphology, and comparativediversity, Evolution, 56, 961, 2002.
108. Grant, P.R., Ecology and Evolution of Darwin’s Finches, Princeton University Press,Princeton, NJ, 1999.
109. Amadon, D., The Hawaiian honeycreepers, Bull. Am. Mus. Nat. Hist., 95, 151, 1950.110. Simmons, R. and Scheepers, L., Winning by a neck: sexual selection in the evolution
of giraffe, Am. Nat., 148, 771, 1996.111. Crane, J., Fiddler Crabs of the World. Ocypodidae: Genus Uca. Princeton University
Press, Princeton, NJ, 1975.112. Bowman, R.I., Morphological differentiation and adaptation in the Galápagos finches,
Univ. Calif. Publ. Zool., 58, 1, 1961.113. Nowicki, S., Vocal-tract resonances in oscine bird sound production: evidence from
birdsongs in a helium atmosphere, Nature, 325, 53, 1987.114. Beckers, G.L., Suthers, R.A., and ten Cate, C., Pure-tone birdsong by resonance
filtering of harmonic overtones, Proc. Nat. Acad. Sci. U.S.A., 100, 7372, 2003.115. Nowicki, S. and Marler, P., How do birds sing? Music Perception, 5, 391, 1988.116. Fletcher, N.H. and Tarnopolsky, A., Acoustics of the avian vocal tract, J. Acoust. Soc.
Am., 105, 35, 1999.117. Nowicki, S., Westneat, M.W., and Hoese, W.J., Birdsong: motor function and the
evolution of communication, Sem. Neurosci., 4, 385, 1992.118. Herrel, A., O’Reilly, J.C., and Richmond, A.M., Evolution of bite performance in
turtles, J. Evol. Biol., 15, 1083, 2002.
3209_C014.fm Page 319 Thursday, November 10, 2005 10:49 AM

320 Ecology and Biomechanics
119. Rome, L.C., Cook, C., Syme, D.A., Connaughton, M.A., Ashley-Ross, M., Klimov,A., Tikunov, B., and Goldman, Y.E., Trading force for speed: why superfast cross-bridge kinetics leads to superlow forces, Proc. Natl. Acad. Sci. U.S.A., 96, 5826, 1999.
120. Westneat, M.W., Long, J.H., Hoese, W., and Nowicki, S., Kinematics of birdsong:functional correlation of cranial movements and acoustic features in sparrows, J. Exp.Biol., 182, 147, 1993.
121. Podos, J., Southall, J.A., and Rossi-Santos, M.R., Vocal mechanics in Darwin’sfinches: correlation of beak gape and song frequency, J. Exp. Biol., 207, 607, 2004.
122. Williams, H., Choreography of song, dance and beak movements in the zebra finch(Taeniopygia guttata), J. Exp. Biol., 204, 3497, 2001.
123. Goller, F., Mallinckrodt, M.J., and Torti, S.D., Beak gape dynamics during song inthe zebra finch, J. Neurobiol., 59, 289, 2004.
124. Hoese, W.J., Podos, J., Boetticher, N.C., and Nowicki, S., Vocal tract function inbirdsong production: experimental manipulation of beak movements, J. Exp. Biol.,203, 1845, 2000.
125. Podos, J., A performance constraint on the evolution of trilled vocalizations in asongbird family (Passeriformes: Emberizidae), Evolution, 51, 537, 1997.
126. Grant, B.R. and Grant, P.R., Simulating secondary contact in allopatric speciation:an empirical test of premating isolation, Biol. J. Linn. Soc., 76, 545, 2002.
127. Slabbekoorn, H. and Smith, T.B., Does bill size polymorphism affect courtship songcharacteristics in the African finch Pyrenestes ostrinus? Biol. J. Linn. Soc., 71, 737,2000.
128. Podos, J., Correlated evolution of morphology and vocal signal structure in Darwin’sfinches, Nature, 409, 185, 2001.
129. Seddon, N., Ecological adaptation and species recognition drives vocal evolution inneotropical suboscine birds, Evolution, 59, 200, 2005.
130. Huber, S.K. and Podos, J., Beak morphology and song features covary in a populationof Darwin’s finches, Biol. J. Linn. Soc., in press.
131. Herrel, A., Podos, J., Huber, S.K., and Hendry, A.P., Bite performance and morph-ology in a population of Darwin’s finches: implications for the evolution of beakshape, Funct. Ecol., 19, 43, 2005.
132. Price, T.D., Grant, P.R., Gibbs, H.L., and Boag, P.T., Recurrent patterns of naturalselection in a population of Darwin’s finches, Nature, 309, 787, 1984.
133. Grant, P.R. and Grant, B.R., Predicting microevolutionary responses to directionalselection on heritable variation, Evolution, 49, 241, 1995.
134. Boag, P.T. and Grant, P.R., Intense natural selection in a population of Darwin’sfinches (Geospizinae) in the Galápagos, Science, 214, 82, 1981.
135. Grant, B.R. and Grant, P.R., Hybridization and speciation in Darwin’s finches: therole of sexual imprinting on a culturally transmitted trait, in Endless Forms: Speciesand Speciation, Howard, D.J. and Berlocher, S.H., Eds., Oxford University Press,Oxford, p. 404, 1998.
136. Grant, P.R. and Grant, B.R., Mating patterns of Darwin’s finch hybrids determinedby song and morphology, Biol. J. Linn. Soc., 60, 317, 1997.
137. Grant, P.R. and Grant, B.R., Hybridization, sexual imprinting, and mate choice, Am.Nat., 149, 1, 1997.
138. Silva, A., Quintana, L, Ardanaz, J.L., and Macadar, O., Environmental and hormonaleffects upon EOD waveform in gymnotiform pulse fish, J. Physiol., 96, 473, 2002.
139. Podos, J., Huber, S.K., and Taft, B., Bird song: the interface of evolution and mech-anism, Ann. Rev. Ecol. Evol. Syst., 35, 55, 2004.
3209_C014.fm Page 320 Thursday, November 10, 2005 10:49 AM

The Biomechanics of Ecological Speciation 321
140. Marler, P. and Tamura, M., Culturally transmitted patterns of vocal behavior insparrows, Science, 146, 1483, 1964.
141. Crespi, B.J., Vicious circles: positive feedback in major evolutionary and ecologicaltransitions, Trends Ecol. Evol., 19, 627, 2004.
142. Podos, J., Discrimination of intra-island song dialects by Darwin’s finches, Proc.Royal. Soc. London B, manuscript in review.
143. Nosil, P., Reproductive isolation caused by visual predation on migrants betweendifferent environments, Proc. R. Soc. Lond. B, 271, 1521, 2004.
144. Nosil, P., Crespi, B.J., and Sandoval, C.P., Host-plant adaptation drives the parallelevolution of reproductive isolation, Nature, 417, 441, 2002.
145. Vamosi, S.M. and Schluter, D., Sexual selection against hybrids between sympatricstickleback species: evidence from a field experiment, Evolution, 53, 874, 1999.
146. Arnold, S.J., Morphology, performance and fitness, Am. Zool., 23, 347, 1983.147. Garland, T.J. and Losos, J.B., Ecological morphology of locomotor performance in
squamate reptiles, in Ecological Morphology: Integrative Organismal Biology, Wain-wright, P.C. and Reilly, S.M., Eds., University of Chicago Press, Chicago, 1994,p. 240.
148. Podos, J. and Nowicki, S., Performance limits on birdsong, in Nature’s Music: TheScience of Bird Song, Marler, P. and Slabbekoorn, H., Eds., Elsevier Press, New York,2004, p. 318.
149. Van Hooydonck, B., Herrel, A., Van Damme, R., and Irschick, D.J., Does dewlapsize predict male bite performance in Jamaican Anolis lizards? Funct. Ecol., 19, 38,2005.
3209_C014.fm Page 321 Thursday, November 10, 2005 10:49 AM


323
Index
A
Abiesalba Mill., 23concolor, 89, 92
Acer negundo, 91, 149, 152, 155Acoustic signals, body size and, 307Adaptive divergence, 303Air-dried wood, modulus of elasticity of, 4Alces alces, 102Algal body, friction drag and, 76Allium porrum L., 11Aloe vera, 149, 152, 154Amphibians, phenotypic plasticity in larval forms,
233Amphimoea walkeri, 188Analyses of covariance (ANCOVA), 174, 175ANCOVA, see Analyses of covarianceAngiosperms
diffuse-porous, 92ring-porous, 92specialized wood of, 95
Animal(s)vascular networks, Murray’s law for, 86volume of circulating blood in, 90
Anolis, 244carolinensis, 255, 257, 258, 261distichus, 255evermanni, 255, 256garmani, 255, 259grahami, 255gundlachi, 255, 256lineatopus, 255, 265pulchellus, 255, 256sagrei, 255, 266, 308snout–vent length, 255valencienni, 255, 257, 259, 261, 265, 266
Anolis lizards, power generation during locomotion in, 253–269
discussion, 264–267ecological correlates of power output,
264–265interspecific variation, 265–266power output during running and jumping,
266–267material and methods, 255–260
animals, 255
configuration of hind limbs, 258ecology, 258–259jumping trials, 257morphology, 255running trials, 255–257statistical analysis, 259–260
results, 260–264Anomalous wood, 57Ant(s), see also Macaranga–ant mutualisms,
slippery wax barriers and wax running in
adaptive syndromes, evolution of, 169associations
adaptive syndromes in, 168obligate, 167
attachment forces of, 172climbing, friction coefficient, 176generalist, protection of specific ant partners
against, 165mechanical benefit of long legs for climbing,
176prostoma and, 169tarsal attachment devices in, 170traits
aggressiveness, 168colony density, 168pruning behavior, 168
wax running capacity, 165Anther, energy content of, 124Anthidium manicatum, 135Apis mellifera, 126, 133
forces exerted by, 134maximum forces measured for, 136
Apochlorotic flagellates, 273Aquatic bodies, microbial ecosystems of, 271Aquatic systems, bacterial concentrations in, 281Aquatic vertebrates, maneuverability in, 235–236Aquilegia vulgaris, 149, 152, 159Arboreal species, 254Area-preserving transport networks, 93, 94Aristolochia
brasiliensis, 49gigantea, 49macrophylla, 49
Arthropods, pretarsus of, 170Artificial flower, 127Artiodactyla, 102
3209_Index.fm Page 323 Monday, November 21, 2005 10:32 AM

324 Ecology and Biomechanics
Arundo donax, 79Ascophyllum nodosum, 64Attachment modes, types of, 39Autotrophic flagellates, 273
B
Bacteriaattached, 289grazers on, 273grazing down of size range of, 287orientation process of, 290swimming in random walk, 290, 291
Bacterial flagella, fluid dynamics of, 276Balancing Reward, 110Bauhinia, 45, 47Bauhinia guianensis, 38, 49, 52Beak size evolution, 310Beam mechanics, 19Bee(s)
euglossine, 201, 202long-tongued, 187, 190, 192mechanics of lapping by, 199proboscis
imitation of, 138length, 140
Beetle adhesive pads, 150Behavioral mimicry in insects, 213–229
Batesian mimicry, 213–214behavioral mimicry, 215–224
behavioral mimicry in insects, 216–217flight mimicry, 218–224mimicry in terrestrial locomotion,
217–218morphological mimicry, 214–215Müllerian mimicry, 214
Behavioral performancefitness and, 233reproducible individual variation in, 234short-term reproducibility of, 243
Bending tests, climbing plant, 40Berberis vulgaris, 149, 152Biomechanical force instruments, 114Biomechanics, aim of, 2Bite
capacity, maximal, 110depth, horse–cattle comparison, 116force
force transducers used in assessing, 114lizard, 114measurement of, 111modeling of, 111prediction of, 111, 112
quantification of, 102procurement, 104, 115
Biting effortdetermination of, 110quantification of, 115, 117
Blade buoyancy, see Southern bullkelp Durvillaea, role of blade buoyancy and reconfiguration in mechanical adaptation of
Body masscompensation mechanisms for, 117–specific power output, 256
Body sizeacoustic signals and, 307biomechanics and, 307
Bombushortorum, 188terrestris, 126
forces exerted by, 134, 135maximum forces measured for, 136
Bombylius major, 188Bos taurus, 102Bougainvillea, 45, 54Bougainvillea glabra, 48Branch anchorage, climbing plants, 54Branch-angle climbers, 39, 46, 53Branching topography, conduit diameter across,
88Brassica oleracea, 149, 150, 152Brocchinia reducta, 160, 171Bromus willdenowii, 117Brownian motions, 290Bryozoans, chimney-forming, 289Buckling
height, 7safety factor, decrease of, 13stem, 9tree, 8, 9
Bufo, 232marinus, 240viridus, 242, 243
Buzz pollination, 124
C
Calamus, 45acanthospathus, 48, 51tetradactylus, 48
Calcium-specific ion channels, 293Calliphora vomitoria, 160Camponotus mus, 195Campsis radicans, 89, 91, 92, 93Capsicum annuum, 124Catopsis berteroniana, 160
3209_Index.fm Page 324 Monday, November 21, 2005 10:32 AM
Index 325
Cattle, head movement of, 115Ceramius
hispanicus, 193metanotalis, 188
Cervus elaphus, 102Chelidonium majus, 149, 152, 155Chenopodium album, 149, 152Chloroplasts, 290–291Choeronycteris mexicana, 188Cholodny Went theory, 20Chrysolina fastuosa, 148, 149, 150Cilia, 276, 277Clematis
flammula var. maritima, 49recta, 48, 53vitalba, 49
Climbing plants, diversity of mechanical architectures in, 35–59
attachment modes, 37attachment types, 57bending tests, 40branch anchorage, 54discussion, 53–57
climbing growth strategies in monocots and other plants without secondary growth, 55–56
ecological diversity of climbers among different groups, 56–57
mechanical properties and attachment of dicotyledonous climbers, 53–55
flexural stiffness, 40host tree and, 39importance of climbers, 36mechanical constraints and types of
attachment, 37–40mechanical structure and development of
climbers, 36–37methods and materials, 40–44
calculation of structural Young’s modulus, 43–44
experimental protocols, 40–43sampling, 44
results, 44–53branch-angle climbers, 46–53hook climbers, 45–46leaning climbers, 53tendril climbers, 45twining climbers, 44–45
semi-self-supporting, 54structural Young’s modulus, 48–50, 56
Coevolutionary processes, 164COI, see Cytochrome oxidase subunit ICompression wood, 17Concealed nectar extraction apparatus, 186Conduit furcation number, 87, 90
Condylocarpon guianense, 38, 49Conifer forests, windstorms and, 23Conifer wood, support vs. transport conflict in, 94Constant stress hypothesis, 16Contamination hypothesis, see Insect attachment
structures, plant waxes andCorelDraw, 258Corizoneura longirostris, 188Crack propagation, 105Creep, plant stem and, 43Croton, 46, 54
nuntians, 48, 52pullei, 48
Ctenosaura similes, 234Cytochrome oxidase subunit I (COI), 167
D
Dactylis glomerata, 109Daemonorops jenkinsiana, 45, 48Darwin’s finches, 304, 311, 313Da Vinci’s rule, 95Degree of arboreality, 259Deltophila elephas, 141Desmoncus
orthacanthos, 48polyacanthos, 48, 51
Dicotyledonous species, 45, 55Diffuse-porous angiosperms, 92Diffusion feeding, 283Dinoflagellates, rotational velocity, 292Dipsosaurus dorsalis, 236Dissolved organic matter (DOM), 273, 274Divergence
adaptive, 303phenotypic, 314sympatric, 302
Doliocarpus, 44, 49DOM, see Dissolved organic matterDrag
coefficients, seaweed, 67, 72determination of, 64extended equation for, 64forces
flume experiments and, 66hypothetical, 79
Dried biomass, 4Drosophila melanogaster, 158Durvillaea
antarcticabuoyancy forces, 68, 73, 80field studies, 68, 73flume experiments, 65, 67midsway positions, 74
3209_Index.fm Page 325 Monday, November 21, 2005 10:32 AM
326 Ecology and Biomechanics
morphology, 63, 66, 69, 74occurrence of, 62relation between force and velocity, 70shock-like responses, 73shortening experiments, 70surf zone and, 65wave exposed, 67, 69
willana, 63field studies, 68, 73formation of, 64midsway positions, 74morphological survey, 69, 74surf zone and, 65
E
Eco-engineering, 22, 23, 24Ecologically dependent barriers, 305Ecologically independent barriers, 304Ecological resource, discrete forms, 302Ecological speciation, biomechanics of, 301–321
biomechanics and ecological speciation, 306–311
mating displays and body size, 306–307mating displays and feeding, 309–311mating displays and locomotion, 307–309
dual fitness consequences for ecological speciation, 313–314
ecological dependence and evolution of isolating barriers, 311–312
feedback loops, 313isolating barriers in, 311modes of speciation, 303–305performance and mating display production,
314positive feedback loops, 313
Ecomorphs, 254Ecosystem, see also Water column ecosystems,
implications of microbial motility onfunctioning, biodiversity and, 2pelagic, 274vegetation heterogeneity, 101–102
EFN, see Extrafloral nectariesElectrical activation, 240Electric organ discharges (EODs), 307Endotherms, energetic cost of foraging, 204Energy-minimizing principle, 86Ensifera ensifera, 189Environment dependent barriers, 303EODs, see Electric organ dischargesEpicuticular wax crystals, formation of, 171Escape-and-radiate process, 164Eucalyptus nitens, 158Eufriesea ornata, 188
Euglena, 293Euglossa imperialis, 203Euglossine bees, 201, 202Eukaryote cilia, 276Eulaema meriana, 187Eulepidoptera, 187Eurybia lycisca, 188Evolutionary diversification, 301Extrafloral nectaries (EFN), 168
F
Fagus sylvatica L., 23Fallopia albertii, 49Feeding
adaptations, 309behavior, body mass and, 116diffusion, 283filter, 283mating displays and, 309rate, turbulence and, 283station, 104time (FT), 203value (FV), 105
Festuca arundincea, 109, 117Filter feeder(s), 283
coexistence of, 284dynamic system of, 287idealized, 285
Finches, Darwin’s, 304, 311, 313Fine roots, 11Fish
measures of performance, 232teleost, power output among, 254
Fisher’s exact test, 173Flagella
hispid, 276smooth, 275
Flagellates, 273, 289Flexible organisms, drag coefficient, 64Floral food sources, mechanical barriers limiting
access to, 125Flower(s)
comparing insect forces to barriers in, 140comparing levers and internal barriers in, 139diurnally pollinated, 200insect-pollinated, 200sensor, force–distance diagrams, 139tube, see Salvia flowers, biomechanics of-visiting bees, forces of, 127
Fluid-feeding insects, first, 186Flume experiments
drag forces and, 66Durvillaea antarctica, 65
3209_Index.fm Page 326 Monday, November 21, 2005 10:32 AM
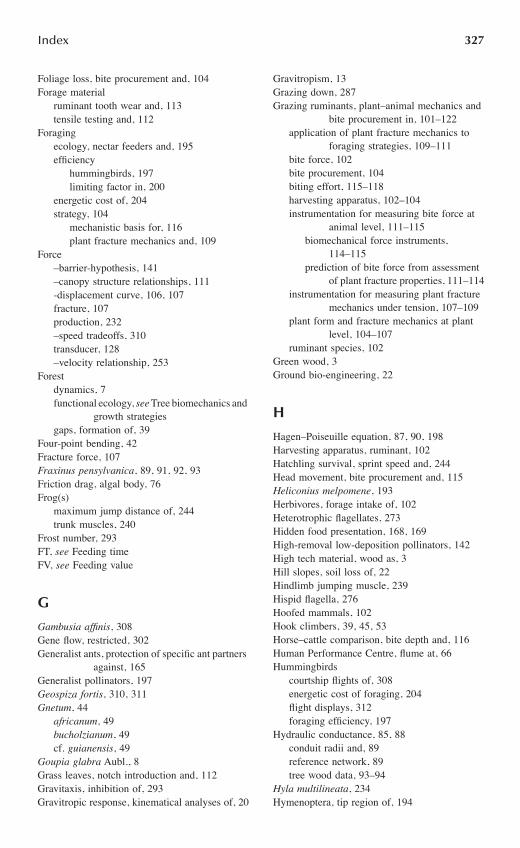
Index 327
Foliage loss, bite procurement and, 104Forage material
ruminant tooth wear and, 113tensile testing and, 112
Foragingecology, nectar feeders and, 195efficiency
hummingbirds, 197limiting factor in, 200
energetic cost of, 204strategy, 104
mechanistic basis for, 116plant fracture mechanics and, 109
Force–barrier-hypothesis, 141–canopy structure relationships, 111-displacement curve, 106, 107fracture, 107production, 232–speed tradeoffs, 310transducer, 128–velocity relationship, 253
Forestdynamics, 7functional ecology, see Tree biomechanics and
growth strategiesgaps, formation of, 39
Four-point bending, 42Fracture force, 107Fraxinus pensylvanica, 89, 91, 92, 93Friction drag, algal body, 76Frog(s)
maximum jump distance of, 244trunk muscles, 240
Frost number, 293FT, see Feeding timeFV, see Feeding value
G
Gambusia affinis, 308Gene flow, restricted, 302Generalist ants, protection of specific ant partners
against, 165Generalist pollinators, 197Geospiza fortis, 310, 311Gnetum, 44
africanum, 49bucholzianum, 49cf. guianensis, 49
Goupia glabra Aubl., 8Grass leaves, notch introduction and, 112Gravitaxis, inhibition of, 293Gravitropic response, kinematical analyses of, 20
Gravitropism, 13Grazing down, 287Grazing ruminants, plant–animal mechanics and
bite procurement in, 101–122application of plant fracture mechanics to
foraging strategies, 109–111bite force, 102bite procurement, 104biting effort, 115–118harvesting apparatus, 102–104instrumentation for measuring bite force at
animal level, 111–115biomechanical force instruments,
114–115prediction of bite force from assessment
of plant fracture properties, 111–114instrumentation for measuring plant fracture
mechanics under tension, 107–109plant form and fracture mechanics at plant
level, 104–107ruminant species, 102
Green wood, 3Ground bio-engineering, 22
H
Hagen–Poiseuille equation, 87, 90, 198Harvesting apparatus, ruminant, 102Hatchling survival, sprint speed and, 244Head movement, bite procurement and, 115Heliconius melpomene, 193Herbivores, forage intake of, 102Heterotrophic flagellates, 273Hidden food presentation, 168, 169High-removal low-deposition pollinators, 142High tech material, wood as, 3Hill slopes, soil loss of, 22Hindlimb jumping muscle, 239Hispid flagella, 276Hoofed mammals, 102Hook climbers, 39, 45, 53Horse–cattle comparison, bite depth and, 116Human Performance Centre, flume at, 66Hummingbirds
courtship flights of, 308energetic cost of foraging, 204flight displays, 312foraging efficiency, 197
Hydraulic conductance, 85, 88conduit radii and, 89reference network, 89tree wood data, 93–94
Hyla multilineata, 234Hymenoptera, tip region of, 194
3209_Index.fm Page 327 Monday, November 21, 2005 10:32 AM
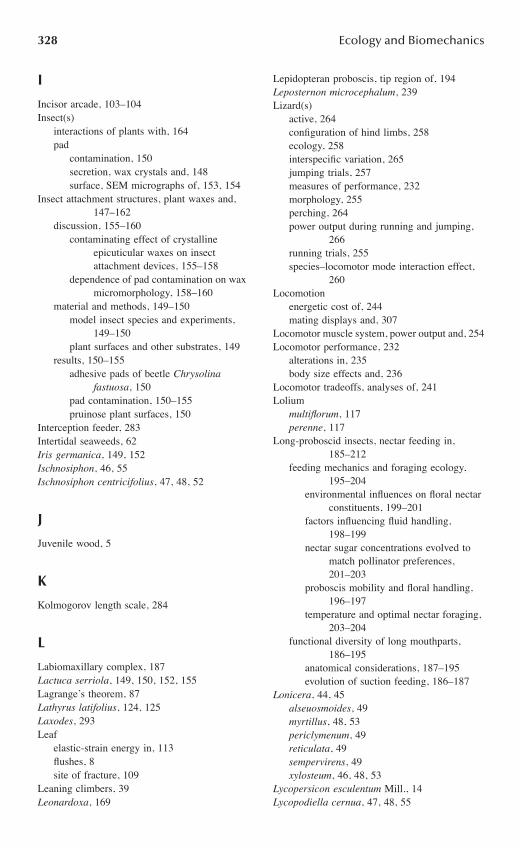
328 Ecology and Biomechanics
I
Incisor arcade, 103–104Insect(s)
interactions of plants with, 164pad
contamination, 150secretion, wax crystals and, 148surface, SEM micrographs of, 153, 154
Insect attachment structures, plant waxes and, 147–162
discussion, 155–160contaminating effect of crystalline
epicuticular waxes on insect attachment devices, 155–158
dependence of pad contamination on wax micromorphology, 158–160
material and methods, 149–150model insect species and experiments,
149–150plant surfaces and other substrates, 149
results, 150–155adhesive pads of beetle Chrysolina
fastuosa, 150pad contamination, 150–155pruinose plant surfaces, 150
Interception feeder, 283Intertidal seaweeds, 62Iris germanica, 149, 152Ischnosiphon, 46, 55Ischnosiphon centricifolius, 47, 48, 52
J
Juvenile wood, 5
K
Kolmogorov length scale, 284
L
Labiomaxillary complex, 187Lactuca serriola, 149, 150, 152, 155Lagrange’s theorem, 87Lathyrus latifolius, 124, 125Laxodes, 293Leaf
elastic-strain energy in, 113flushes, 8site of fracture, 109
Leaning climbers, 39Leonardoxa, 169
Lepidopteran proboscis, tip region of, 194Leposternon microcephalum, 239Lizard(s)
active, 264configuration of hind limbs, 258ecology, 258interspecific variation, 265jumping trials, 257measures of performance, 232morphology, 255perching, 264power output during running and jumping,
266running trials, 255species–locomotor mode interaction effect,
260Locomotion
energetic cost of, 244mating displays and, 307
Locomotor muscle system, power output and, 254Locomotor performance, 232
alterations in, 235body size effects and, 236
Locomotor tradeoffs, analyses of, 241Lolium
multiflorum, 117perenne, 117
Long-proboscid insects, nectar feeding in, 185–212
feeding mechanics and foraging ecology, 195–204
environmental influences on floral nectar constituents, 199–201
factors influencing fluid handling, 198–199
nectar sugar concentrations evolved to match pollinator preferences, 201–203
proboscis mobility and floral handling, 196–197
temperature and optimal nectar foraging, 203–204
functional diversity of long mouthparts, 186–195
anatomical considerations, 187–195evolution of suction feeding, 186–187
Lonicera, 44, 45alseuosmoides, 49myrtillus, 48, 53periclymenum, 49reticulata, 49sempervirens, 49xylosteum, 46, 48, 53
Lycopersicon esculentum Mill., 14Lycopodiella cernua, 47, 48, 55
3209_Index.fm Page 328 Monday, November 21, 2005 10:32 AM

Index 329
M
Macaranga–ant mutualisms, slippery wax barriers and wax running in, 163–183
biomechanics of wax running in Crematogaster (Decacrema) ants, 170–179
mechanisms of slipperiness, 171–172mechanisms of wax running, 172–179tarsal attachment devices in ants, 170
ecology and evolution of wax barriers in ant-plant genus Macaranga, 165–170
adaptive syndromes of ant associations in waxy and nonwaxy Macaranga ant-plants, 168–170
effect of wax barriers on host specificity, 165–167
evolution of Macaranga wax barriers, 167–168
protection of specific ant partners against generalist ants, 165
Machaerium sp., 49Macrocystis pyrifera, 64Mammalian herbivore diet, staple source of, 104Mandibular length to body mass ratio, 116Marginal Revenue, 110Maripa scandens, 49Mating display(s)
body size and, 306feeding and, 309intricacy of, 309locomotion and, 307production, 314
MATLAB, 177Maximal bite capacity, 110Medicago sativa L., 15Megachile sp., 135MFA, see Microfibril angleMicrobes, diversity of, 272Microbial ecosystems, energetics of motion, 278Microfibril angle (MFA), 5Microorganisms
drag of cell body, 288energy budget used for motion, 281feeding mechanisms, 282feeding rate, 288swimming efficiency, 279swimming speed, 278
Moegistorhynchus longirostris, 187, 188Monocotyledons, stem properties of, 105Morus bombycis Koidz, 16MOTUS software, 256Murray’s law and vascular architecture of plants,
85–100
applying Murray’s law to xylem, 88–90comparative efficiency of conifer vs.
angiosperm tree wood, 96–97Da Vinci’s rule, 95developmental and physiological constraints
on transport efficiency, 95–96importance of conduit furcation number,
90–91Murray’s law, 86–88nature of mechanical constraint on hydraulic
efficiency, 94–95optimum line, 90tree wood not following Murray’s law, 92–94xylem following Murray’s law, 91–92
Musca domestica, 158Muscle(s)
activation rate, sprint speed and, 238architecture, varied, 239contraction dynamics, Hill’s model of, 199mass–specific power output, 254, 257, 259,
261maximal shortening velocity of, 238mechanics, 242relaxation, rate of, 238-shortening velocity, 239superfast, 310work loop-power output, 236
N
Natural slopes, hazards of, 22Nectar
constituents, environmental influences on, 199feeders, 186
foraging ecology, 195proboscis length of, 188–189resting positions in, 196selection of floral resources, 198suction feeding in, 189
feeding, 138, 198, 203, see also Long-proboscid insects, nectar feeding in
sugar concentrations, 200, 201, 202viscosity, increased, 198
Neo-Darwinian synthesis, 301Nepenthes, 158Nepenthes ventrata, 171Nereocystis luetkeana, 80Niltonia virgili, 188Noctiluca scintillans, 283Nonvascular plants, water transport capabilities
of, 85Non–wax runners
comparative morphometry of wax runners and, 174
3209_Index.fm Page 329 Monday, November 21, 2005 10:32 AM
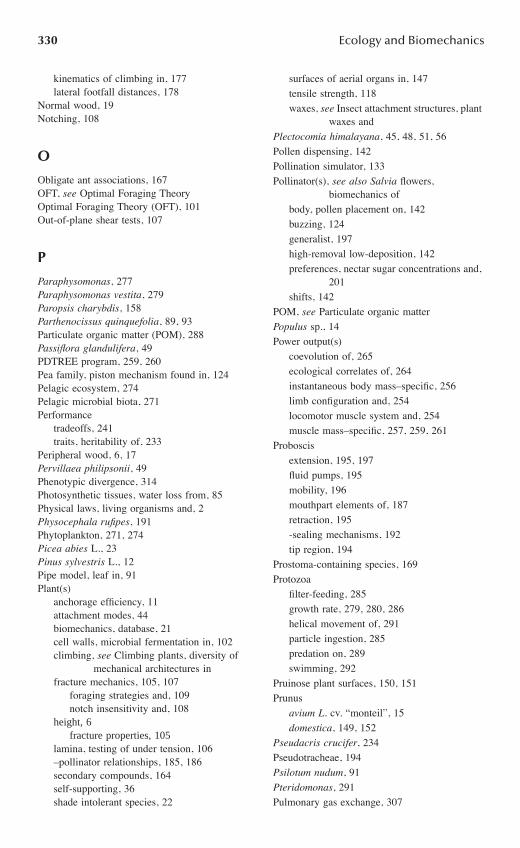
330 Ecology and Biomechanics
kinematics of climbing in, 177lateral footfall distances, 178
Normal wood, 19Notching, 108
O
Obligate ant associations, 167OFT, see Optimal Foraging TheoryOptimal Foraging Theory (OFT), 101Out-of-plane shear tests, 107
P
Paraphysomonas, 277Paraphysomonas vestita, 279Paropsis charybdis, 158Parthenocissus quinquefolia, 89, 93Particulate organic matter (POM), 288Passiflora glandulifera, 49PDTREE program, 259, 260Pea family, piston mechanism found in, 124Pelagic ecosystem, 274Pelagic microbial biota, 271Performance
tradeoffs, 241traits, heritability of, 233
Peripheral wood, 6, 17Pervillaea philipsonii, 49Phenotypic divergence, 314Photosynthetic tissues, water loss from, 85Physical laws, living organisms and, 2Physocephala rufipes, 191Phytoplankton, 271, 274Picea abies L., 23Pinus sylvestris L., 12Pipe model, leaf in, 91Plant(s)
anchorage efficiency, 11attachment modes, 44biomechanics, database, 21cell walls, microbial fermentation in, 102climbing, see Climbing plants, diversity of
mechanical architectures infracture mechanics, 105, 107
foraging strategies and, 109notch insensitivity and, 108
height, 6fracture properties, 105
lamina, testing of under tension, 106–pollinator relationships, 185, 186secondary compounds, 164self-supporting, 36shade intolerant species, 22
surfaces of aerial organs in, 147
tensile strength, 118
waxes, see Insect attachment structures, plant waxes and
Plectocomia himalayana, 45, 48, 51, 56
Pollen dispensing, 142
Pollination simulator, 133
Pollinator(s), see also Salvia flowers, biomechanics of
body, pollen placement on, 142
buzzing, 124
generalist, 197
high-removal low-deposition, 142
preferences, nectar sugar concentrations and, 201
shifts, 142
POM, see Particulate organic matter
Populus sp., 14
Power output(s)
coevolution of, 265
ecological correlates of, 264
instantaneous body mass–specific, 256
limb configuration and, 254
locomotor muscle system and, 254
muscle mass–specific, 257, 259, 261
Proboscis
extension, 195, 197
fluid pumps, 195
mobility, 196
mouthpart elements of, 187
retraction, 195
-sealing mechanisms, 192
tip region, 194
Prostoma-containing species, 169
Protozoa
filter-feeding, 285
growth rate, 279, 280, 286
helical movement of, 291
particle ingestion, 285
predation on, 289
swimming, 292
Pruinose plant surfaces, 150, 151
Prunus
avium L. cv. “monteil”, 15
domestica, 149, 152
Pseudacris crucifer, 234
Pseudotracheae, 194
Psilotum nudum, 91
Pteridomonas, 291
Pulmonary gas exchange, 307
3209_Index.fm Page 330 Monday, November 21, 2005 10:32 AM

Index 331
Q
Quantitative morphometry, wax runners, 174Quercus robur L., 12Quintic Spline Processor, 256
R
Rana pipiens, 239Reaction wood, 17Reconfiguration, flexible organisms and, 64Reference network, hydraulic conductance, 89Reproductive isolation, 303Resistance, definition of, 107Resource polymorphisms, 309Rhingia campestris, 188Rhodnius prolixus, 195Ring-porous angiosperms, 92Root(s)
anchorage, 10difficulty of investigating, 11efficiency, root architecture and, 12nutrient uptake and, 21
fine, 11growth, control of, 21reinforcement, 10system architecture, modifications in, 13tensile strength, 10topology, 12
Rosa, 45, 54Rosa canina, 48Roscoea purpurea, 125Ruminant(s)
body mass of, 116digestion, properties determining, 105harvesting apparatus, 102jaw configuration, 102tooth wear, 113
Rumination, 102
S
Salviaglutinosa, 127, 128, 129–131sclarea, 127, 128, 129–131
Salvia flowers, biomechanics of, 123–145biomechanics and bee pollination, 124–125case study, 125–126discussion, 136–141
comparing insect forces to barriers in flowers, 140
forces measured in Salvia flowers, 138–140
insect forces, 136–137
observed flower visitors, 137–138proboscis length, flower-tube length, and
forces exerted by visiting bees, 140–141
materials and methods, 126–133force measurements on Salvia flowers and
staminal levers, 132–133forces of flower-visiting bees, 127–128materials, 126–127
results, 134–136forces exerted by B. terrestris and
A. mellifera, 134forces and flower visitors of Salvia,
134–136schematic longitudinal section of, 126staminal level mechanism in, 125
Saplings, bending processes in, 20Sap velocity measurements, 95Sarcoplasmic reticulum (SR), 238Satyrium hallackii, 141Scanning electron microscopy (SEM), 148, 150Sceloporus occidentalis, 232Seaweed(s)
along-blade vs. across-blade accelerations, 80blade movability, 80branchiness, 78drag coefficients, 67, 72intertidal, 62Vogel numbers, 78
Secamone, 45bosserii, 44, 49buxifolia, 49cristata, 49geayii, 44, 49ligustrifolia, 50
Secamonopsis madagascariensis, 50Secondary growth, mechanics of, 6Sedimentation, gravi-perception and, 20Self-supporting plants, 36, 91SEM, see Scanning electron microscopySexual selection, 303
hummingbird displays, 314isolating barriers and, 313
Shade intolerant plant species, 22Shrubs, unstable, 53SigmaScan 5.0 software, 149Size–agility tradeoffs, 307Skeletal muscle
contractile properties of isolated, 242functional tradeoffs in, 244interindividual variation in, 245shortening velocity, 235sound production and, 240tasks of, 239
3209_Index.fm Page 331 Monday, November 21, 2005 10:32 AM

332 Ecology and Biomechanics
Slippery wax barriers, see Macaranga–antmutualisms, slippery wax barriers and wax running in
Slope stability, effective planting and, 23Smilax aspera, 45, 49, 51, 55Smooth flagella, 275Snout-vent length (SVL), 260Soil shear strength, 10Solanum
lycopersicum, 124melongena, 124
Solid mechanics, 2Songbirds, divergent feeding niches, 310Southern bullkelp Durvillaea, role of blade
buoyancy and reconfiguration in mechanical adaptation of, 61–84
discussion, 74–81buoyancy and field studies, 80drag coefficients, reconfiguration, and
Vogel number, 78–80drag forces, 74–78morphological survey, 81
drag and streamlining, 64–65Durvillaea antarctica and D. willana, 62–64intertidal zone, 62material and methods, 65–69
buoyancy, 68drag coefficients and reconfiguration,
67–68drag forces, 66–67field studies, 68morphological survey, 69shortening experiments, 67statistical analysis, 69tested seaweeds, 65–66
objectives, 65results, 70–74
buoyancy, 73drag coefficients and reconfiguration, 72drag forces, 70field studies, 73–74morphological survey, 74shortening experiments, 70–72Vogel number, 72–73
Speciationby-product model of, 301modes of, 303
Sprint performance, 233Sprint speed
hatchling survival and, 244muscle activation rate and, 238
SR, see Sarcoplasmic reticulumStamina, Bufo, 232Standing tree, safety factor in, 7Stem(s)
buckling, 9creep and, 43flexural stiffness, 55gravitational curvature in, 19hydraulic conductance of, 40lean, variation in, 9mechanical instability of, 7morphology, staking and, 14orientation, control of, 16photosynthesizer, 91–root base, stressed, 21slenderness, 13twiners, 39Young’s modulus, 43
Stipa gigantea, 113Strain energy, storage of, 108Stratum-orientated depletion style, 109Stretched wood, 17Stride frequency, 236, 237, 238, 244Strychnos, 37, 45, 47, 48, 52Suction feeding, 186, 187, 198Summit Force, 110SVL, see Snout-vent lengthSward board, 114Sympatric divergence, 302
T
Tap root systems, 12Tattletale® logger, 68Tendril climbers, 39, 45Tensile strength, 107, 109Tensile tests, 107, 113Thigmomorphogenesis, 14, 16Three-point bending, 42Toxorhychites, 187Trampling resistance, 105Transport function, safety vs. efficiency trade-offs
in, 96Tree(s)
buckling, 7, 8failure, height strategy and, 13height
hydraulic limitations of, 6safety factors and, 7strata, 24
modulus of elasticity, 9secondary growth, 6self-supporting, 93shade tolerance, 5structure, strength of, 16tropical, development of buttresses in, 12
Tree biomechanics and growth strategies, 1–33biomechanical characteristics of trees, 3–6
mechanics of secondary growth, 6
3209_Index.fm Page 332 Monday, November 21, 2005 10:32 AM

Index 333
wood as lightweight, cellular- and fiber-reinforced material, 3–5
wood variability, 5biomechanical and ecological significance of
height, 6–13biomechanical environmental constraints
on tree height, 7–9height growth strategy, 13risk assessment, 9–13
growth processes that control mechanical stability of slender tree stems, 14–21
control of root growth to secure anchorage, 21
control of stem orientation to maintain or restore tree form, 16–21
mechanical control of growth, 14–16practical application of tree biomechanics,
21–24Trifolium montanum, 149, 150, 152, 159Tropical rainforest, biologically controlled
verticality in, 19Tropical trees, development of buttresses in, 12Tropidurus psamonastes, 233Twining climbers, mechanical properties, 44Twining liana, juvenile stage of, 38Twining species, mature trunks of, 53
VVanessa cardui, 191, 203Vapor nucleation, 90Vascular investment, 86Vascular land plant species, ecological differences
among, 2Vegetation heterogeneity, ecosystem, 101–102Vertebrate ectotherms, interindividual variation in
muscle physiology of, 231–251evolutionary implications in behavioral
performance, 232–235relationships between muscle specialization
and individual behavioral performance, 238–240
scaling effects on vertebrate ectotherm muscle and whole body performance, 235–237
tradeoffs in whole-muscle function, 240–242Vitis vinifera, 149, 150, 152Vogel number, 65, 67, 72, 79Volucella bombylans, 192
W
Water column ecosystems, implications of microbial motility on, 271–299
energetics of motion, 278–282
feeding mechanisms, 282–289attaching to particles while feeding,
288–289coexistence of filter feeders, 284–287
generating motion with cilia or flagella,275–278
cilia, 277–278hispid flagella, 276–277smooth flagella, 275–276
microbial ecology in larger context, 273–274orientation to stimuli, 290–293
Waterfowl, courting displays in, 308Wax
contamination, 155-dissolving hypothesis, 159structure, contamination and, 153
Wax barriers, 164, see also Macaranga–antmutualisms, slippery wax barriers and wax running in
effect of on host specificity, 165evolution of, 167non–wax runners and, 166
Wax crystalsaspect ratio of, 148, 152, 158, 159detachment of, 171pad contamination by, 151
Wax runner(s)climbing kinematics of, 179comparative morphometry of non–wax
runners and, 174kinematics of climbing in, 177lateral footfall distances, 178
Wax runningbiomechanics of, 170capacity, attachment force and, 173mechanisms of, 172
Welch’s t-test, 72West et al. model, 88, 91Whole muscle
function, tradeoffs in, 240performance, 242
Windconditions, natural gradients in, 15evapotranspirative effects of, 16loading
thigmomorphogenesis and, 16trees subjected to, 14
speed, morphology and, 16Windstorms, conifer forests and, 23Wood
air-dried, modulus of elasticity of, 4angiosperms and, 95anisotropy of, 5anomalous, 57cell differentiation process, 18
3209_Index.fm Page 333 Monday, November 21, 2005 10:32 AM

334 Ecology and Biomechanics
composite structure of, 5compression, 17conifer, support vs. transport conflict in, 94conifer vs. angiosperm, 96dried, 3furcation numbers for, 93green, 3juvenile, 5maturation strain, 18mechanical properties of, 3moisture content, 3Murray’s law and, 92normal, 19peripheral, 6, 17reaction, 17shrinkage of cells in, 17stretched, 17variability, 5
X
Xanthopan, 187Xenopus
laevis, 242muscle fiber bundles, 236
Xylemapplication of Murray’s law to, 88flow rate, 91major mechanical role of, 97sap, negative pressures of, 90structure, changed, 85
Xylocopa violacea, 127, 128
Y
Young’s modulus, 2, 40
3209_Index.fm Page 334 Monday, November 21, 2005 10:32 AM