Effects of suppression and release on sapling growth for 11 tree species of northern, interior...
10
Effects of suppression and release on sapling growth for 11 tree species of northern, interior British Columbia Elaine F. Wright, Charles D. Canham, and K.D. Coates Abstract: Saplings of canopy tree species frequently undergo alternating periods of suppression and release before reaching canopy size. In this study, we document the effects of periods of suppression and release on current responses to variation in light by saplings of the 11 major tree species of northwestern, interior British Columbia. We were spe- cifically interested in the degree to which increasing length of suppression had long-term effects on subsequent re- sponse to release in gaps or following partial cutting, and the degree to which the effects of suppression were ameliorated with time following release. At least some saplings of all 11 species had undergone alternating periods of suppression and release. The most shade-tolerant species generally did not show either a decline in growth over time during suppression or a gradual increase in growth at a given light level over time during release. The least shade- tolerant species exhibited significant declines in growth rate during suppression; however, in all of the species except trembling aspen (Populus tremuloides Michx.), the effects of suppression disappeared over time during release. Failure to account for the effects of past suppression and release leads to significant overestimates of the initial responses of shade-intolerant species to release. Our results suggest that competitive balances between species shift substantially over time as a result of growth history and that these shifts have significant effects on successional patterns. Résumé : Les gaules des essences qui forment le couvert subissent fréquemment une alternance de périodes de sup- pression et de dégagement avant d’atteindre leur dimension finale. Dans cette étude, nous avons observé les effets de périodes de suppression et de dégagement sur la réaction courante à une variation de la lumière chez les gaules des 11 principales espèces d’arbres du nord-ouest de la zone intérieure de la Colombie-Britannique. Nous étions plus particulièrement intéressés à déterminer dans quelle mesure l’augmentation de la durée de la période de suppression a des effets à long terme sur la réaction subséquente à un dégagement dans les trouées ou suite à une coupe partielle et dans quelle mesure les effets d’une période de suppression sont compensés avec le temps suite à un dégagement. Au moins quelques gaules de toutes les espèces avaient subi une alternance de périodes de suppression et de dégagement. Les espèces les plus tolérantes n’ont généralement subi ni de diminution de croissance en fonction du temps en période de suppression, ni une augmentation graduelle de croissance en fonction du temps à un niveau donné de lumière en prériode de dégagement. Les espèces les moins tolérantes ont connu une diminution significative de leur taux de croissance en période de suppression; cependant, chez toutes les espèces à l’exception du peuplier faux-tremble (Populus tremuloides Michx.), les effets de la suppression ont disparu avec le temps suite au dégagement. Le fait de ne pas tenir compte des effets de périodes passées de suppression et de dégagement entraîne une surestimation importante de la réaction initiale à un dégagement chez les espèces intolérantes. Nos résultats suggèrent que l’équilibre compétitif entre les espèces change de façon importante avec le temps selon l’historique de croissance et que ces changements ont des effets majeurs sur les patrons successionnels. [Traduit par la Rédaction] Wright et al. 1580 Introduction An understanding of patterns of sapling growth and mor- tality is fundamental to predicting forest successional dy- namics (Pacala et al. 1994; Kobe 1996; Kobe and Coates 1997; Wright et al. 1998) and for prediction of forest regen- eration in managed stands after partial or complete release of advance regeneration (e.g., Crossley 1976; Herring 1977; Herring and McMinn 1980; McCaughey and Ferguson 1986). There has been a great deal of study of the role of ad- vance regeneration in gap-phase dynamics of temperate and tropical forests (e.g., Runkle 1981; Hibbs 1982; Canham 1988; Lertzman 1992; Kneeshaw and Bergeron 1998). There has also been a long-term debate in forestry over the man- agement of advance regeneration following cutting (Pogue 1946; Gordon 1973; Crossley 1976; Herring 1977; Ferguson and Adams 1980; Herring and McMinn 1980; Graham 1982; Oliver 1985; Seidel 1985; Laackie and Fiddler 1986; McCaughey and Ferguson 1986; Carlson and Schmidt 1989; Bassman et al. 1992; Tesch and Korpela 1993). Saplings of different tree species clearly have different abilities to sur- Can. J. For. Res. 30: 1571–1580 (2000) © 2000 NRC Canada 1571 Received November 9, 1999. Accepted July 17, 2000. E.F. Wright 1 and K.D. Coates. Forest Sciences Section, Prince Rupert Forest Region, Bag 5000, Smithers, BC V0J 2N0, Canada. C.D. Canham. Institute of Ecosystem Studies, P.O. Box AB, Millbrook, NY 12545, U.S.A. 1 Corresponding author. Present address: Department of Conservation, Southern Regional Office, P.O. Box 13-049, 3/137 Kilmore Street, Christchurch, New Zealand. e-mail: [email protected]
-
Upload
caryinstitute -
Category
Documents
-
view
0 -
download
0
Transcript of Effects of suppression and release on sapling growth for 11 tree species of northern, interior...

Effects of suppression and release on saplinggrowth for 11 tree species of northern, interiorBritish Columbia
Elaine F. Wright, Charles D. Canham, and K.D. Coates
Abstract: Saplings of canopy tree species frequently undergo alternating periods of suppression and release beforereaching canopy size. In this study, we document the effects of periods of suppression and release on current responsesto variation in light by saplings of the 11 major tree species of northwestern, interior British Columbia. We were spe-cifically interested in the degree to which increasing length of suppression had long-term effects on subsequent re-sponse to release in gaps or following partial cutting, and the degree to which the effects of suppression wereameliorated with time following release. At least some saplings of all 11 species had undergone alternating periods ofsuppression and release. The most shade-tolerant species generally did not show either a decline in growth over timeduring suppression or a gradual increase in growth at a given light level over time during release. The least shade-tolerant species exhibited significant declines in growth rate during suppression; however, in all of the species excepttrembling aspen (Populus tremuloidesMichx.), the effects of suppression disappeared over time during release. Failureto account for the effects of past suppression and release leads to significant overestimates of the initial responses ofshade-intolerant species to release. Our results suggest that competitive balances between species shift substantiallyover time as a result of growth history and that these shifts have significant effects on successional patterns.
Résumé: Les gaules des essences qui forment le couvert subissent fréquemment une alternance de périodes de sup-pression et de dégagement avant d’atteindre leur dimension finale. Dans cette étude, nous avons observé les effets depériodes de suppression et de dégagement sur la réaction courante à une variation de la lumière chez les gaules des11 principales espèces d’arbres du nord-ouest de la zone intérieure de la Colombie-Britannique. Nous étions plusparticulièrement intéressés à déterminer dans quelle mesure l’augmentation de la durée de la période de suppression ades effets à long terme sur la réaction subséquente à un dégagement dans les trouées ou suite à une coupe partielle etdans quelle mesure les effets d’une période de suppression sont compensés avec le temps suite à un dégagement. Aumoins quelques gaules de toutes les espèces avaient subi une alternance de périodes de suppression et de dégagement.Les espèces les plus tolérantes n’ont généralement subi ni de diminution de croissance en fonction du temps en périodede suppression, ni une augmentation graduelle de croissance en fonction du temps à un niveau donné de lumière enprériode de dégagement. Les espèces les moins tolérantes ont connu une diminution significative de leur taux decroissance en période de suppression; cependant, chez toutes les espèces à l’exception du peuplier faux-tremble(Populus tremuloidesMichx.), les effets de la suppression ont disparu avec le temps suite au dégagement. Le fait de nepas tenir compte des effets de périodes passées de suppression et de dégagement entraîne une surestimation importantede la réaction initiale à un dégagement chez les espèces intolérantes. Nos résultats suggèrent que l’équilibre compétitifentre les espèces change de façon importante avec le temps selon l’historique de croissance et que ces changements ontdes effets majeurs sur les patrons successionnels.
[Traduit par la Rédaction] Wright et al. 1580
Introduction
An understanding of patterns of sapling growth and mor-tality is fundamental to predicting forest successional dy-namics (Pacala et al. 1994; Kobe 1996; Kobe and Coates
1997; Wright et al. 1998) and for prediction of forest regen-eration in managed stands after partial or complete releaseof advance regeneration (e.g., Crossley 1976; Herring 1977;Herring and McMinn 1980; McCaughey and Ferguson1986). There has been a great deal of study of the role of ad-vance regeneration in gap-phase dynamics of temperate andtropical forests (e.g., Runkle 1981; Hibbs 1982; Canham1988; Lertzman 1992; Kneeshaw and Bergeron 1998). Therehas also been a long-term debate in forestry over the man-agement of advance regeneration following cutting (Pogue1946; Gordon 1973; Crossley 1976; Herring 1977; Fergusonand Adams 1980; Herring and McMinn 1980; Graham 1982;Oliver 1985; Seidel 1985; Laackie and Fiddler 1986;McCaughey and Ferguson 1986; Carlson and Schmidt 1989;Bassman et al. 1992; Tesch and Korpela 1993). Saplings ofdifferent tree species clearly have different abilities to sur-
Can. J. For. Res.30: 1571–1580 (2000) © 2000 NRC Canada
1571
Received November 9, 1999. Accepted July 17, 2000.
E.F. Wright 1 and K.D. Coates.Forest Sciences Section,Prince Rupert Forest Region, Bag 5000, Smithers, BC V0J2N0, Canada.C.D. Canham. Institute of Ecosystem Studies, P.O. Box AB,Millbrook, NY 12545, U.S.A.
1Corresponding author. Present address: Department ofConservation, Southern Regional Office, P.O. Box 13-049,3/137 Kilmore Street, Christchurch, New Zealand.e-mail: [email protected]
I:\cjfr\cjfr30\cjfr-10\X00-089.vpFriday, October 13, 2000 7:45:41 AM
Color profile: DisabledComposite Default screen

vive periods of suppression (Kobe 1996; Kobe and Coates1997) and different magnitudes of response to release(McCaughey and Ferguson 1986). In forests where gap-phase dynamics represent the dominant mode of canopy re-cruitment, individuals of shade-tolerant species typically un-dergo multiple episodes of suppression and release beforereaching canopy size (Canham 1985, 1990; Merrens andPeart 1992; Rebertus and Veblen 1993; Orwig and Abrams1994; Cho and Boerner 1995). Attributes such as saplingage, size, crown area and geometry, presence of injuries, andpathogens have been used to help predict sapling growth af-ter release (e.g., Herring 1977; Ferguson and Adams 1980;Seidel 1980, Graham 1982; McCaughey and Schmidt 1982;Oliver 1985; Laackie and Fiddler 1986; McCaughey andFerguson 1986; Canham 1988, Tesch and Korpela 1993).However, there have been no systematic studies of whether,and to what extent, previous periods of suppression or re-lease have long-term effects on the growth of advance re-generation.
In this study, we examined the effects of the lengths ofprevious periods of suppression and release on the growthresponses of eight conifers and three broadleaved tree spe-cies of northwestern, interior British Columbia. The 11 spe-cies ranged from very shade tolerant to shade intolerant andrepresent the dominant species of early to late-successionalstands throughout the region. We were specifically interestedin the degree to which increasing length of suppression hadlong-term effects on subsequent response to release in gapsor following partial cutting, and the degree to which the ef-fects of previous periods of suppression were amelioratedwith time following release.
Materials and methods
Study area and tree speciesData were collected for 11 tree species in study sites
throughout the Prince Rupert Forest Region, located in cen-tral to northwestern British Columbia, Canada (Table 1). The11 species include all the dominant and codominant speciesfound in early to late-successional stands in this region(Banner et al. 1993). The species span a range of shade tol-erance (Krajina et al. 1982; Burns and Honkala 1990; Carter
and Klinka 1992; Klinka et al. 1992; Wang et al. 1994;Kayahara et al. 1996; Kobe and Coates 1997). Amabilis fir(Abies amabilisDougl. ex Forbes), western redcedar (Thujaplicata (Dougl. ex D Don), western hemlock (Tsuga hetero-phylla (Raf.) Sarg.), mountain hemlock (Tsuga mertensiana(Bong.) Carr.), and subalpine fir (Abies lasiocarpa(Hook.)Nutt.) are considered shade tolerant. Black spruce (Piceamariana(Mill.) BSP), white spruce (Picea glauca(Moench)Voss), Engelmann spruce (Picea engelmanniiParry exEngelm.), and Sitka spruce (Picea sitchensis(Bong.) Carr.)are intermediate in shade tolerance. Lodgepole pine (Pinuscontorta var. latifolia Engelm.), trembling aspen (Populustremuloides Michx.), paper birch (Betula papyriferaMarsh.), and black cottonwood (Populus balsamiferassp.trichocarpa Torr. & Gray) are considered shade intolerant.
The forests of British Columbia have been classified intoa system of biogeoclimatic zones, subzones, and variants(Pojar et al. 1987, Meidinger and Pojar 1991, Banner et al.1993). We sampled within the five major forest zones of in-terior, northern British Columbia, and from one to threesubzones within each zone, with from two to eight speciessampled within a subzone (Table 1). Within each subzone,we sampled on sites with average soil moisture and nutrientsin mature stands, canopy gaps, regenerating burns and asso-ciated mature remnants, road and trail cuts greater than 30years old, and in partially cut and clear-cut areas. Areas withdisturbance within the last 5 years (e.g., blowdown, insectrelated dieback, and new road cuts) were carefully avoided.A detailed analysis of geographic variation in sapling growth(without consideration of the effects of suppression and re-lease) is presented elsewhere (Wright et al. 1998). For thispaper, we present results from all subzones pooled (to in-crease sample size and statistical power, accepting that re-sponse as a function of light will be more variable forpooled data versus that of the representative subzone) andfrom one representative subzone, the moist, cool variant ofthe interior cedar–hemlock forests (ICHmc2), for which wehave the largest number of species represented (nine). Forour pooled data set we break the spruces into two groups:(i) black spruce from our boreal sampling and (ii ) hybridspruce, which includes any of the various mixtures of white,Sitka, and Engelmann spruce from within our sampling ar-
© 2000 NRC Canada
1572 Can. J. For. Res. Vol. 30, 2000
Tree species nToleranceranking* Latitude (N) Elevation (m) DBH (cm) Height (m)
Light level(% full sun)
Western redcedar 57 High 54°40′–55°30′ 320–480 4.2 (0.4–10.3) 3.45 (1.00–7.50) 32.8Western hemlock 278 High 54°40′–57°08′ 290–1255 3.9 (0.2–10.6) 3.49 (1.00–7.80) 38.3Mountain hemlock 103 High 54°40′–55°25′ 520–1255 4.2 (0.3–11.6) 3.07 (0.80–7.90) 45.0Amabilis fir 128 High 54°40′–55°30′ 100–1200 4.2 (0.4–11.8) 2.8 (0.03–8.40) 44.5Subalpine fir 679 High 54°01′–59°03′ 320–1380 3.9 (0.3–16.5) 2.87 (0.60–10.50) 42.3Black spruce 58 Medium 59°39′–59°37′ 700–925 3.6 (0.6–6.9) 3.62 (1.10–7.60) 47.5Hybrid spruce 674 Medium 54°01′–59°57′ 130–1370 3.9 (0.1–13.3) 3.07 (0.50–9.20) 42.2Lodgepole pine 434 Low 54°01′–59°57′ 130–1450 4.2 (0.5–14.6) 3.33 (0.40–9.70) 50.8Trembling aspen 68 Low 54°40′–55°30′ 260–700 4.7 (0.0–10.3) 6.4 (2.30–10.70) 42.0Cottonwood 52 Low 54°40′–55°30′ 600–850 5.0 (0.5–12.1) 5.78 (1.10–12.00) 48.8Paper birch 73 Low 54°40′–55°30′ 260–700 4.3 (0.8–11.7) 5.66 (2.10–9.00) 44.3
*Estimates are from Krajina et al. (1982), Burns and Honkala (1990), and Kobe and Coates (1997).
Table 1. Characteristics of the data set: sample size (n), shade-tolerance ranking (low, medium, high), the range of latitude and eleva-tion, the mean and range (in parentheses) of DBH, sapling height, and average light level from which saplings were collected for eachof the 11 study species.
I:\cjfr\cjfr30\cjfr-10\X00-089.vpFriday, October 13, 2000 7:45:42 AM
Color profile: DisabledComposite Default screen
eas. The complex nature of spruce hybridization in north-western British Columbia is described in Coates et al.(1994). In our representative ICHmc2 subzone, white andSitka spruce hybridize commonly.
Sampling design and measurementsNaturally regenerated saplings were obtained from a range
of height classes (0.5–12.0 m) across the full range of lightlevels found within forests in this region (<5 to >90%). Sam-ple sizes for a given species ranged from 52 to 679 saplings,depending on the number of forest types within which sap-lings were collected (Table 1). Sapling sizes were uniformlydistributed across light levels for each species and climaticregion. Where saplings occurred in clusters, the dominant in-dividuals were selected to provide us with an estimate of op-timum growth for that light level. Sampling took place at theend of the summer in 1995 and throughout the field seasonin 1996. For each sapling, total height and diameter at 1.3 m(diameter at breast height, DBH) were recorded, and a sec-tion of the stem was removed at 10 cm above the root collarfor measurement of radial growth. Except for trembling as-pen, a species that regenerates primarily by root suckers inour study area (Haeussler et al. 1990), all sample trees wereof seed origin.
Annual ring widths were measured along a representativeradius (the radius bisecting the angle formed by the longestand shortest radii of the cross section). Ring widths weremeasured with a digital ring analyzer to 0.025 mm resolu-tion using a high-resolution colour video camera connectedto a 40× stereoscope. The most recent growth ring was dis-carded for saplings obtained in 1996 because of incompleteradial growth.
LightHemispherical canopy photos were taken at 1–1.5 m
above the stump of each cut sapling to quantify light avail-able for growth over the growing season. Saplings were se-
lected so that overstory canopy trees, rather than adjacentsaplings, provided shading. In addition, sample trees wereonly obtained from areas where coniferous species domi-nated the canopy trees. GLI, an index of growing seasonlight availability, was computed from each photograph (us-ing GLI version 2.0 software) following Canham (1988).This index combines the seasonal distribution of sky bright-ness with the distribution of canopy openness to calculate asingle index of available light in units in percentage of fullsun for a specified growing season (mid-April through mid-September) (Canham et al. 1990).
Characterization of patterns of suppression and releaseWe considered suppression to be periods with at least four
or more consecutive years of growth below a species-specific threshold, without three or more consecutive yearsexceeding the threshold (Canham 1985, 1990). The thresh-olds for each species were determined on the basis of func-tional relationships between growth and mortality, using theresults of a recent study of 9 of the 11 tree species sampledin the same geographic location (Kobe and Coates 1997).Specifically, the growth rate associated with a sapling mor-tality rate of 10% over a 3-year period (Table 2) was chosenas the threshold, because it coincided with a steep inflectionin the probability of mortality as a function of recent growth(Kobe and Coates 1997). Growth rates below the thresholdresulted in sharply increasing mortality rates. Black spruce isconsidered intermediate in tolerance between subalpine firand hybrid spruce (Krajina et al. 1982), and a threshold forblack spruce using the difference between these two specieswas used in lieu of direct mortality data. The threshold foramabilis fir was set at the threshold for subalpine fir. Be-cause of differences in the shade tolerance of the 11 species,the estimated light levels associated with the threshold be-tween suppression and release ranged from 5 to 37% of fullsun. In effect, the shade-intolerant species become sup-pressed at much higher light levels than the shade-tolerantspecies (Table 2).
On the basis of this definition, we calculated the totalnumber of years of suppression and release, the number ofdistinct periods of suppression and release, and the length ofthe most recent (or current) period of suppression and re-lease for each sapling. The individual patterns of suppres-sion and release varied enormously among saplings andspecies. In a preliminary analysis, all independent variableswere evaluated for use as predictive variables. The best fitswere obtained using length of the most recent (or current)period of suppression and release. While it is possible thatthe entire sequence of past suppression and release eventsmay affect current growth, we have concentrated our analy-sis on the effects of the most recent periods of suppressionand release because of the very large number of permuta-tions required to incorporate the entire growth history in themodels outlined below.
Data analysisThe basic analysis of variation in growth as a function of
light is presented elsewhere (Wright et al. 1998). That analy-sis examined a number of different functional relationshipsbetween light and growth (including Michaelis–Menten,Chapman–Richards, and Weibull functions, with and without
© 2000 NRC Canada
Wright et al. 1573
Tree speciesRadial growththreshold (mm/year)
Light level(% of full sun)
Western redcedar 0.25 6Western hemlock 0.3 5Mountain hemlock 0.3 5Amabilis fir 0.3 8Subalpine fir 0.3 8Black spruce 0.45 15Hybrid spruce 0.6 12Lodgepole pine 0.9 28Trembling aspen 1.25 20Cottonwood 1.6 27Paper birch 1.8 37
Note: Periods of suppression were defined as periods with at least fouror more consecutive years of growth below the threshold, without three ormore consecutive years of growth exceeding the threshold. The growthrate associated with a sapling mortality of 10% over a 3-year period(Kobe and Coates 1997) was used as the threshold for each species. Alsoreported are the approximate light levels associated with that growth rate,from relationships in Wright et al. (1998).
Table 2. Radial growth thresholds (mm radial growth/year) andcorresponding light levels used to define periods of suppressionversus release.
I:\cjfr\cjfr30\cjfr-10\X00-089.vpFriday, October 13, 2000 7:45:42 AM
Color profile: DisabledComposite Default screen

non-zero intercepts). Based on the results of that analysis,we have used Michaelis–Menton functions (with a zero in-tercept) for the basic functional relationship between growthand light:
[1] YaL
a s L=
+
+
( )yε
whereY = log10(radial growth + 1),a is the asymptote ofthe function at high light,s is the slope of the function atzero light, L is GLI (in units of percent full light receivedover the growing season), andε is the error term of theequation. Since we avoided sampling in areas that had evi-dence of canopy disturbance in the past 5 years, radialgrowth was measured as the mean of the past 5 years to re-duce measurement error. We analyzed absolute rather thanrelative growth (i.e., growth relative to size), because ourdata indicate that saplings of most of our species did notshow a strong size dependency within the range of sizessampled for this study (Wright et al. 1998). Radial growthwas log transformed to stabilize the variance.
We used eight variants of eq. 1 to examine how the basicrelationship between growth and light was altered by thelengths of the most recent periods of suppression and releasefor each sapling:
(1) The basic growth model (eq. 1, above)
(2–4) The basic model, plus a term (d) for length ofthe last (or current) period of suppression (YLS), ashape factor (f), and a term for the role of light (h)(allowing for the effects of past suppression to vary asa function of current light levels):
[2] YaL
a s Ld=
+
−
( )ye YLS
[3] YaL
a s Ld f=
+
−
( )( )
ye YLS
[4] YaL
a s Ld hL=
+
− +
( )( )
ye YLS
(5–7) The basic model, plus a term (g) for the lengthof the last (or current) period of release (YLR), a shapefactor (f), and a term for the role of light (h) (asabove):
[5] YaL
a s Lg=
+
( )y
e YLR
[6] YaL
a s Lg f=
+
( )
( )
ye YLR
[7] YaL
a s Lg hL=
+
+
( )ye YLR
(8) The basic model, plus terms (d and g) for thelength of the last suppression (YLS) and release periods(YLR):
[8] YaL
a s Lg d=
+
−
( )ye YLR YLS
Parameters for all models were estimated for each speciesusing the NONLIN procedure in SYSTAT 6.0 (Systat, Inc.1996) and the simplex estimation method to minimize theloss function.
We fit models to saplings of each species for all subzonescombined (Table 1), as well as separate models for saplingscollected within the moist–cool subzone of the interiorcedar–hemlock forests. The significance of the improvementin fit of the model due to the inclusion of additional parame-ters (d, g, f, h) in the basic model (eq. 1) was assessed usingthe extra sums of squares principle: ESS = [(SSRE1 –SSRE2)/(df1 – df2)/(SSRE2)/(n – p)], where SSRE1 and df1are the residual sums of squares and degrees of freedom forthe full model and SSRE2 and df2 are the residual sums ofsquares and degrees of freedom for the reduced model,n isthe number of observations, andp is the number of parame-ters in the larger model. ESS is distributed as anF statisticwith df1 – df2, n – p degrees of freedom (Bergerud 1991).
© 2000 NRC Canada
1574 Can. J. For. Res. Vol. 30, 2000
Tree species Age (years)
No. ofperiods ofsuppression
No. of yearsof suppression
No. ofperiods ofrelease
No. of yearsof release
Length of lastsuppression(years)
Length of lastrelease (years)
Western redcedar 31.08 (7–57) 0.34 (0–2) 3.81 (0–23) 1.10 (1–2) 27.27 (7–45) 3.56 (0–22) 26.46 (5–45)Western hemlock 36.38 (5–155) 0.68 (0–5) 10.95 (0–88) 1.28 (1–5) 25.43 (3–89) 7.29 (0–70) 22.20 (3–82)Mountain hemlock 53.39 (9–179) 1.07 (0–4) 20.20 (0–120) 1.44 (1–4) 33.18 (3–104) 10.14 (0–69) 26.83 (3–104)Amabilis fir 49.72 (6–151) 0.99 (0–3) 32.27 (0–123) 1.19 (0–4) 17.45 (0–74) 26.98 (0–103) 14.81 (0–69)Subalpine fir 47.00 (6–225) 0.89 (0–6) 19.24 (0–160) 1.36 (0–6) 27.75 (0–99) 12.84 (0–146) 23.79 (0–95)Black spruce 41.84 (15–93) 0.95 (0–2) 25.29 (0–78) 1.02 (0–2) 16.55 (0–36) 23.12 (0–78) 15.83 (0–36)Hybrid spruce 34.86 (8–161) 0.85 (0–5) 21.65 (0–141) 0.94 (0–5) 13.20 (0–58) 18.83 (0–141) 12.09 (0–58)Lodgepole pine 22.78 (6–77) 0.72 (0–2) 15.00 (0–77) 0.68 (0–2) 7.78 (0–27) 14.48 (0–77) 7.63 (0–27)Trembling aspen 12.07 (5–24) 0.37 (0–2) 2.88 (0–15) 0.96 (0–2) 9.19 (0–17) 2.81 (0–15) 9.04 (0–17)Cottonwood 12.29 (5–26) 0.42 (0–1) 4.21 (0–24) 0.79 (0–2) 8.08 (0–23) 4.21 (0–24) 8.02 (0–23)Paper birch 15.25 (6–32) 0.64 (0–2) 9.86 (0–32) 0.56 (0–2) 5.38 (0–16) 9.59 (0–32) 5.32 (0–16)
Note: Included in the table are the numbers of periods of suppression and release, the total years of suppression and release, and the lengths of the lastperiods of suppression and release prior to sampling.
Table 3. Radial growth patterns of suppression and release (mean and range), by species, across all sites.
I:\cjfr\cjfr30\cjfr-10\X00-089.vpFriday, October 13, 2000 7:45:43 AM
Color profile: DisabledComposite Default screen

Results and discussion
Interspecific variation in patterns of suppression andrelease
Average stem diameters of the samples were relativelyuniform across species (ranging from 3.6 cm for blackspruce to 5.0 cm in cottonwood), as were the average lightlevels in which we sampled (ranging from a mean of 32.8%of full sun for western redcedar to a mean of 50.8% forlodgepole pine) (Table 1). The mean ages showed muchgreater variation among species, ranging from 12.1 years foraspen saplings to 53.4 years in mountain hemlock. Meanage, by species, was closely correlated with the mean num-ber of periods of suppression for a species (n = 11, r =0.848,p = 0.015), which ranged from 0.34 periods in west-ern redcedar to a mean of 1.1 periods of suppression per in-dividual in mountain hemlock (Table 3). For all speciesexcept aspen and cottonwood, sapling age within specieswas also positively correlated with the percentage of the sap-ling’s life-span spent in periods of suppression (n = 52–679,p < 0.05). Despite this, sapling age has not been reported tobe an important factor in determining growth response fol-
lowing release for subalpine fir (Crossley 1976; Herring1977), white or black spruce (Crossley 1976; Johnstone1978), true fir, and mountain hemlock (Seidel 1985). Acrossall species, individual saplings had undergone as many assix distinct cycles of suppression and release, with the mostrecent periods of suppression lasting as long as 146 years(Table 3).
Interspecific variation in the effects of suppression andrelease on growth for all sites
None of the models incorporating either a shape parame-ter (f) or a parameter for the effect of current light level onthe effect of growth history (h) (eqs. 3, 4, 6, and 7) showed asignificant improvement in fit over models that incorporatedsimple terms for the length of the most recent periods ofsuppression or release (d and g), (eqs. 2, 5, and 8). Two ofthe 11 species (western redcedar and subalpine fir) showedno effects of previous periods of suppression and release oncurrent response to light (Table 4). Both species are consid-ered shade tolerant, and redcedar is generally consideredamong the most shade tolerant of the 11 species included inour study (Krajina et al. 1982; Burns and Honkala 1990;
© 2000 NRC Canada
Wright et al. 1575
Tree species n a s d g R2, basic R2, full
Western redcedar 55 0.799 0.019 0.48Western hemlock 278 0.61 0.038 0.006 0.45 0.47Mountain hemlock 103 0.532 0.015 0.006 0.51 0.54Subalpine fir 679 0.824 0.012 0.42Amabilis fir 119 1.019 0.010 0.013 0.54 0.57Black spruce 58 0.349 0.013 0.018 0.38 0.62Hybrid spruce 674 0.548 0.022 0.008 0.012 0.36 0.53Lodgepole pine 434 0.789 0.016 0.015 0.017 0.55 0.72Trembling aspen 68 0.907 0.034 0.024 0.68 0.71Cottonwood 52 0.753 0.035 0.011 0.012 0.39 0.48Paper birch 73 0.688 0.044 0.016 0.015 0.59 0.72
Note: Parametersa and s control the basic shape of the response to light (eq. 1), whiled and g control the magnitude ofthe effects of suppression and release, respectively (eqs. 2, 5, and 8). Also reported are theR2 values for both the basicmodel (eq. 1) and the full model (eqs. 2, 5, or 8, incorporating either or both of the growth history parameters). Where novalues are reported ford or g, inclusion of those parameters did not produce a significant improvement in the fit of theregression model.
Table 4. Parameter estimates of the regression models for growth as a function of current light level and thelengths of the most recent periods of suppression and release for saplings from all sites combined.
Tree species n a s d g R2, basic R2, full
Western hemlock 77 0.858 0.027 0.73Western redcedar 55 0.799 0.019 0.48Amabilis fir 79 0.911 0.010 0.016 0.47 0.51Subalpine fir 78 1.044 0.015 0.71Hybrid spruce 74 0.623 0.017 0.026 0.61 0.72Trembling aspen 68 0.907 0.034 0.024 0.68 0.71Cottonwood 52 0.753 0.035 0.011 0.012 0.39 0.48Paper birch 73 0.688 0.044 0.016 0.015 0.59 0.72Lodgepole pine 68 3.496 0.009 0.005 0.020 0.81 0.85
Note: Parametersa and s control the basic shape of the response to light (eq. 1), whiled and g control the magnitude ofthe effects of suppression and release, respectively (eqs. 2, 5, and 8). Also reported are theR2 values for both the basicmodel (eq. 1) and the full model (eqs. 2, 5, or 8, incorporating either or both of the growth history parameters). Where novalues are reported ford or g, inclusion of those parameters did not produce a significant improvement in the fit of theregression model.
Table 5. Parameter estimates of the regression models for growth as a function of current light level and thelengths of the most recent periods of suppression and release for saplings from ICH forests only.
I:\cjfr\cjfr30\cjfr-10\X00-089.vpFriday, October 13, 2000 7:45:44 AM
Color profile: DisabledComposite Default screen
Carter and Klinka 1992; Klinka et al. 1992; Kobe andCoates 1997). This contrasts the work by Johnstone (1978)who found the number of years since release to be useful forpredicting growth response to release in subalpine fir.
Four species (hybrid spruce, lodgepole pine, cottonwood,and birch) showed significant responses to the lengths of themost recent periods of both suppression and release (Ta-ble 4). The latter three species are generally consideredamong the least shade-tolerant species in the region (Kobeand Coates 1997). For these species the cumulative effectsof the most recent periods of suppression are ameliorated bycurrent periods of release (i.e., significantg coefficients inTable 4). The remaining five species had significant re-sponses to either suppression or release (but not both) andranged from shade tolerant (western and mountain hemlock)to intolerant (aspen) (Table 4). This agrees with the work ofJohnstone (1978) who also reported the number of yearssince release to be an important predictive variable for deter-mining growth response of both white and black spruce fol-lowing release, whereas length of suppression was not.
Of the six species for which there was a significant nega-tive effect of the length of suppression, the magnitude of theeffect (d) was positively correlated with the shade intoler-ance of the species, ranging from 0.006 in western hemlockto 0.024 in trembling aspen. The magnitude of the positive
effect of release (g) was also roughly correlated with shadeintolerance, ranging from 0.006 in mountain hemlock to0.018 in black spruce (Table 4).
Effects of suppression and release on sapling growth ininterior cedar–hemlock forests
Analysis of the subset of species and samples collectedfrom the moist-cool subzone of the interior cedar–hemlockforests (ICHmc2 subzone) revealed similar relationships be-tween shade tolerance and response to suppression and re-lease (Table 5). The five most shade-tolerant species (westernhemlock, western redcedar, amabilis fir, subalpine fir, andhybrid spruce) showed no response to the length of previousperiods of suppression, and three of the five species showedno response to the length of release (Table 5). The threeleast shade-tolerant species (lodgepole pine, cottonwood,and birch; Wright et al. 1998) responded to the length of pe-riods of both suppression and release (Table 5). Tremblingaspen had the greatest reduction in growth as a function ofthe length of suppression and did not recover during release(i.e., nog coefficient in Table 5), while lodgepole pine hadthe smallest reduction in growth (Table 5).
Comparisons between the basic model (eq. 1, with no ef-fects of growth history) and full models (eqs. 2, 5, or 8, withvarying effects of suppression and (or) release) demonstrate
© 2000 NRC Canada
1576 Can. J. For. Res. Vol. 30, 2000
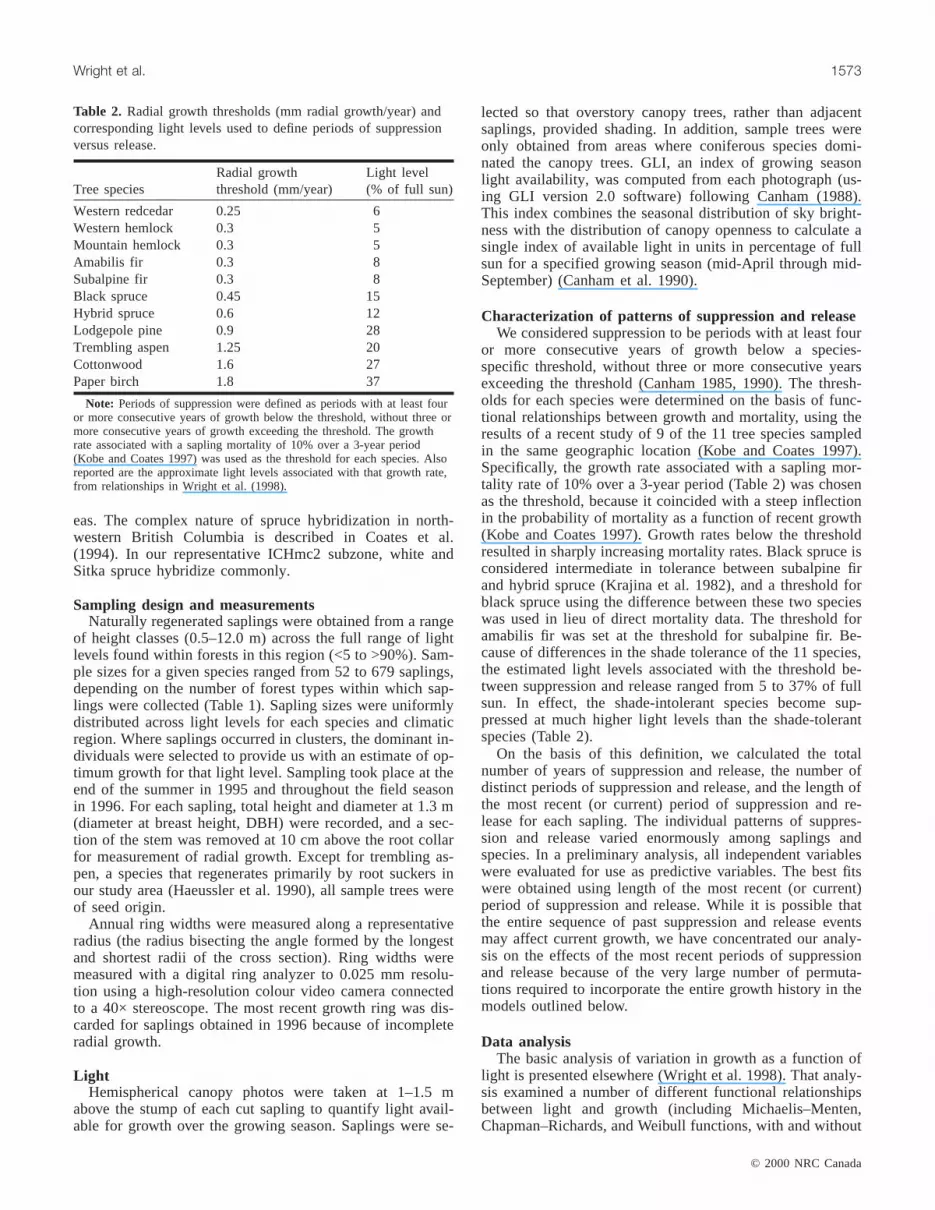
Fig. 1. Predicted radial increment growth (mm/year) for saplings of four species in interior cedar–hemlock (ICH) forests as a functionof light (GLI, in units of percentage of full sun) from the basic model (Wright et al. 1998), which does not incorporate historical ef-fects of the most recent periods of suppression and release, versus the full model (Table 5 of this study), incorporating the effects ofsuppression and release. For the full models, the length of the most recent periods of both suppression and release were set to 0 to al-low comparison of the predictions of the two models of the growth of saplings in the first year of release for saplings with no previ-ous period of suppression.
I:\cjfr\cjfr30\cjfr-10\X00-089.vpFriday, October 13, 2000 7:45:47 AM
Color profile: DisabledComposite Default screen
that ignoring the effects of suppression and release producesoverestimates of initial growth response to release, particu-larly at high light levels (Fig. 1). In particular, the extremelyrapid growth rate predicted by the basic model for lodgepolepine under high light appears to only develop over a periodof time following release. (Table 5, Fig. 1). In effect, thedata for saplings in high light represent individuals that hadspent varying lengths of time in release. By ignoring growthhistory, we overestimated the potential initial response to re-lease for the less shade-tolerant species (Wright et al. 1998).
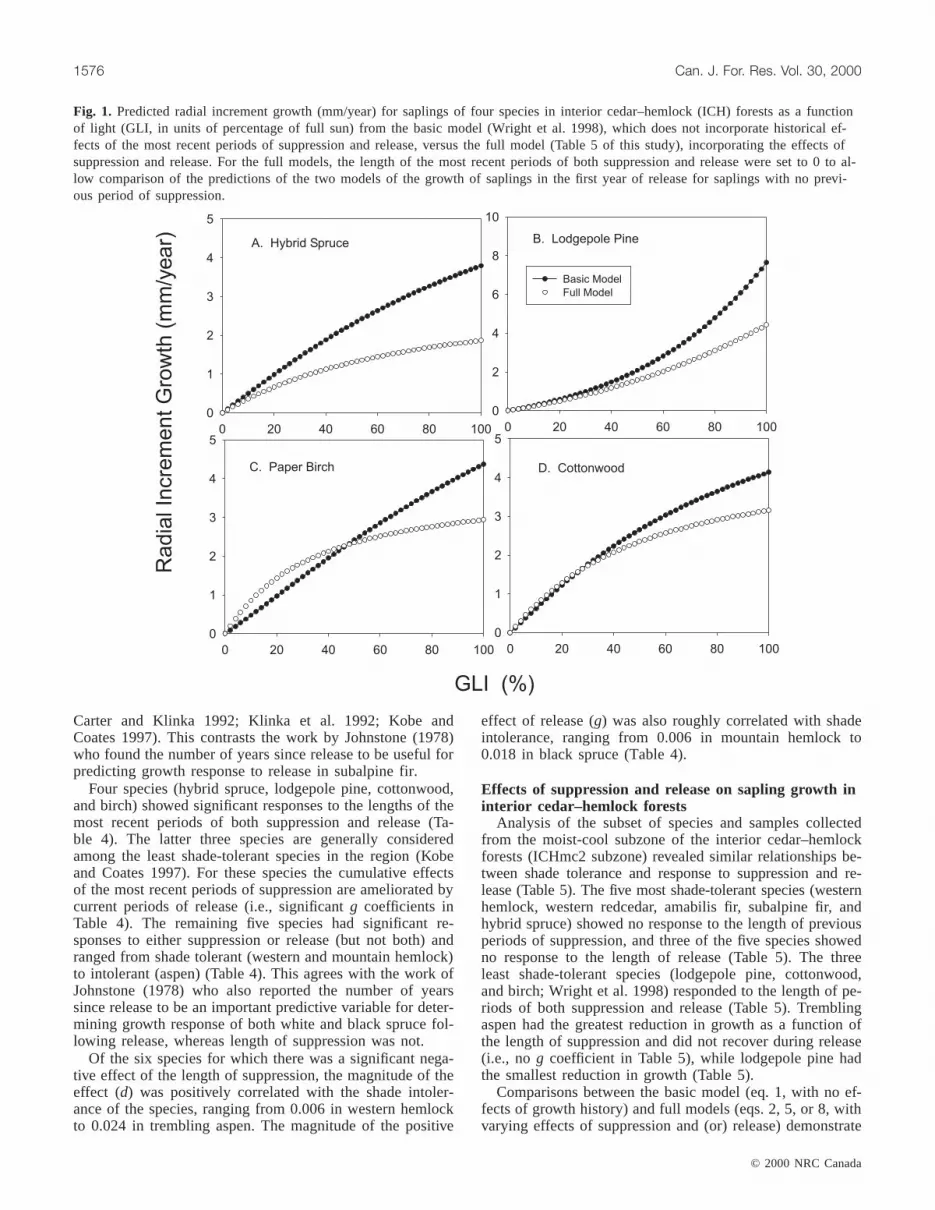
Figures 2A–2D show the expected current growth rate atall light levels as a function of past growth history. Note thatat light levels below the thresholds given in Table 2, currentgrowth rates would represent suppression, while light levelsabove the species-specific thresholds represent saplings thatare currently released. When the full model is used (but withhistory factored out by setting suppression and release tozero), aspen is dominant at all light levels <95% of full sun,whereas spruce and amabilis fir have the lowest growth(Fig. 2A). The high diameter growth rates of aspen, birch,and cottonwood at <60% full sun confirm our previous con-
clusion that interspecific variation in low-light growth ratesis not predicted by shade tolerance (Wright et al. 1998) (Fig2A). In fact, during the first year of growth for saplings withno history of suppression, the three broadleaved specieshave the highest growth rates of all species across the rangefrom 0 to 50% of full sun (Fig. 2A). However, growth ratesof all three of those species decline rapidly over time whensuppressed (i.e., at light levels less than 20–40% of full sun;Table 2). Moreover, mortality rates of all three species risesharply with declining light levels in this range (Kobe andCoates 1997). After 20 years of suppression, western hem-lock is predicted to have the fastest growth rate at essentiallyall light levels when released (Fig. 2B). In contrast, growthof aspen saplings drops off dramatically after 20 years ofsuppression, and all three of the broadleaved species initiallyhave relatively low growth rates when released, even at highlight levels (Fig. 2B). In contrast to previous work (e.g.,Canham 1985, 1990; Orwig and Abrams 1994) suppressionhere is defined on the basis of survival; much greater de-creases in light are required to see a reduction in growth andan increase in mortality. As a result, suppression occurs at
© 2000 NRC Canada
Wright et al. 1577
Fig. 2. Predicted radial increment growth (mm/year) for saplings of the nine major tree species of interior cedar–hemlock forests as afunction of light (GLI, in units of percentage of full sun), under four different histories of suppression and release: (A) no suppressionor release, (B) 20 years of suppression, (C) 20 years of suppression followed by 20 years of release, and (D) 20 years of release withno preceding period of suppression.
I:\cjfr\cjfr30\cjfr-10\X00-089.vpFriday, October 13, 2000 7:45:55 AM
Color profile: DisabledComposite Default screen
different light levels for different species (Table 2). By ourdefinition, approximately 50% of saplings would survive 20years at light levels where these species become functionallysuppressed. Twenty years of suppression at the threshold forsuppression in aspen (i.e., 20% of full sun) would reducegrowth rates of aspen saplings well below the growth rate ofwestern hemlock saplings that spent 20 years in much darkerlight levels required to induce suppression in that shade-tolerant species (i.e., 6% of full sun; Table 2).
After 20 years of suppression followed by 20 years of re-lease, lodgepole pine growth rates exceed all other species atlight levels greater than 60% of full sun, while hybrid sprucedominates at intermediate light levels (Fig. 2C). Because ofthe lack of response to release in aspen, saplings that hadbeen suppressed for 20 years still have extremely lowgrowth rates even after 20 years of release (Fig. 2C).
Delays in response to release have been reported previ-ously for a number of tree species, including black spruce(Crossley 1976), subalpine fir (Herring 1977), Engelmannspruce, (McCaughey and Schmidt 1982; Carlson andSchmidt 1989), and true fir and mountain hemlock (Seidel1985). The delay may reflect physiological and morpho-logical adjustments of saplings following overstory removal(Tucker and Emmingham 1977; Ferguson and Adams 1980;Tucker et al. 1987). Seidel (1985) found that growth re-sponse in true fir and mountain hemlock reflected the degreeof shading provided by the overstory and hence the degreeof suppression, as did Sundkvist (1994) for Scots pine(Pinus sylvestrisL.) seedlings. This is supported by thework of Bassman et al. (1992) who found that growth of re-generation following release was poor when the density ofother vegetation was high, indicating that partial canopy re-moval may not result in an increase in light for smaller sap-lings because of shading by competing vegetation.
Performance of regeneration after 20 years of release forsaplings that had undergone no previous periods of suppres-sion (i.e., light levels over the past 20 years were above thespecies specific thresholds for suppression given in Table 2)are illustrated in Fig. 2D. There is a clear separation be-tween shade-tolerant and -intolerant species, with amabilisfir having the poorest growth over all light levels and paperbirch the highest growth at light levels <60% of full sun.Lodgepole pine growth is greater than the three broadleavedspecies at light levels exceeding 60%.
Summary and conclusions
Our results indicate that saplings of all of the major treespecies of northern, interior British Columbia frequently ex-perience multiple episodes of both suppression and releaseprior to reaching even subcanopy size. As silvicultural prac-tices in the region shift from clear-cutting to various formsof partial harvesting, alternating periods of suppression andrelease are likely to become even more characteristic of theprocess of canopy recruitment in these forests. Our resultsshow a clear relationship between shade tolerance and themagnitude of the effects of past periods of suppression andrelease on sapling growth. In general, there was no effect ofprevious suppression on the current response of shade-tolerant species to light. Similarly, the most shade-tolerantspecies did not show a gradual increase in growth rate at a
given light level during the course of release. The lessshade-tolerant species showed varying degrees of responseto both suppression and release, with the strongest responsesin the least shade-tolerant species. Our results clearly indi-cate that periods of suppression do not cause shade-tolerantspecies to lose their ability to respond to release followingpartial cutting. The less shade-tolerant species show a lag inresponse to release, particularly if they have been sup-pressed, but the effects of prior suppression in all of the spe-cies except trembling aspen disappear during the course ofrelease.
Failure to incorporate these effects of growth history canresult in misleading conclusions about patterns of inter-specific variation in response to light environments. This isparticularly true in the least shade-tolerant species, wherefailure to incorporate the effects of history are likely to sig-nificantly overestimate initial response to release (Fig. 1).More generally, competitive balances among species at agiven light level shift strikingly as a function of history (seeFig. 2). SORTIE, a spatially explicit model of forest dynam-ics (Pacala et al. 1993) has been recently parameterized forthe interior cedar–hemlock forests of British Columbia. Ini-tial tests of the model show that runs that do not incorporatesuppression–release dynamics do a poor job at predictingsuccession in these forests (unpublished data).
Acknowledgements
We thank Bruce Catton, Saleem Dar, Ronnie Drever,Duncan Moss, Jenyfer Neumann, and Tara Wylie for assis-tance in the field; S. Dar and J. Neumann for assistance withimage analysis; and Russell Klassen for assistance with ra-dial growth measurements and data entry. We also thank twoanonymous reviewers for their helpful comments on themanuscript. Partial funding for this research was provided byForest Renewal British Columbia (SB96028-RE andSB96026-RE). This study is a contribution to the program ofthe Institute of Ecosystem Studies, Millbrook, N.Y.
References
Banner, A., MacKenzie, W., Haeussler, S., Thomson, S., Pojar, J.,and Trowbridge, R. 1993. A field guide to site identification andinterpretation for the Prince Rupert Forest Region. B.C. Minis-try of Forests, Victoria. Land Manage. Handb. 26.
Bassman, J.H., Zwier, J.C., Olson, J.R., and Newberry, J.D. 1992.Growth of advance regeneration in response to residual overstorytreatment in northern Idaho. West. J. Appl. For.7(3): 78–81.
Bergerud, W. 1991. Picture of linear models. Forest SciencesBranch, B.C. Ministry of Forests, Victoria. Biometr. Inf. Handb.Ser. Handb. 1.
Burns, R.M., and Honkala, B.H. (Technical coordinators). 1990.Silvics of North Amercia. Vol. 1 and 2. U.S. Dep. Agric. Agric.Handb. 654.
Canham, C.D. 1985. Suppression and release during canopy recruit-ment in Acer saccharum. Bull Torrey Bot. Club,112: 134–145.
Canham, C.D. 1988. An index of understory light levels in andaround canopy gaps. Ecology,69: 1634–1638.
Canham, C.D. 1990. Suppression and release during canopy recruit-ment in Fagus grandifolia. Bull. Torrey Bot. Club,117: 1–7.
Canham, C.D., Denslow, J.S., Platt, W.J., Runkle, J.R., Spies, T.A.,and White, P.S. 1990. Light regimes beneath closed canopies
© 2000 NRC Canada
1578 Can. J. For. Res. Vol. 30, 2000
I:\cjfr\cjfr30\cjfr-10\X00-089.vpFriday, October 13, 2000 7:45:55 AM
Color profile: DisabledComposite Default screen

and tree-fall gaps in temperate and tropical forests. Can. J. For.Res.20: 620–631.
Carlson, C.E., and Schmidt, W.C. 1989. Influence of overstory re-moval and western spruce budworm defoliation on growth of ad-vance conifer regeneration in Montana. USDA For. Serv. Res.Pap. INT-409.
Carter, R.E., and Klinka, K. 1992. Variation in shade tolerance ofDouglas fir, western hemlock and western redcedar in coastalBritish Columbia. For. Ecol. Manage.55: 87–105.
Cho, D.S., and Boerner, R.E.J. 1995. Dendrochronological analysisof the canopy history of two Ohio old-growth forests. Vegetatio,120: 173–183.
Coates, K.D., Haeussler, S., Lindeburgh, S., Pojar, R., and Stock,A.J. 1994. Ecology and silviculture of interior spruce in BritishColumbia. Canada – British Columbia Economic and RegionalDevelopment, Victoria. For. Resour. Dev. Agree. Rep. 220.
Crossley, D.I. 1976. Growth response of spruce and fir to releasefrom suppression. For. Chron.52: 189–193.
Ferguson, D.E., and Adams, D.L. 1980. Response of advancegrand fir regeneration to overstory removal in northern Idaho.For. Sci.26: 537–545.
Gordon, D.T. 1973. Released advance reproduction of white (Abiesconcolor) and red fir (Abies magnifica) growth, damage, mortal-ity. USDA Forest Serv. Res. Pap. PSW-95.
Graham, R.T. 1982. Influence of tree and site factors on westernredcedar’s response to release: a modelling analysis. USDA For.Serv. Res. Pap. INT-296.
Haeussler, S., Coates, D., and Mather, J. 1990. Autecology of com-mon plants in British Columbia: a literature review. Canada –British Columbia Forest Resources Development Agreement.B.C. Ministry of Forests, Victoria. For. Resour. Dev. Agree.Rep. 158.
Herring, L.J. 1977. Studies of advance subalpine fir in theKamloops forest district. B.C. Forest Service, Victoria. Res.Note 80.
Herring, L.J., and McMinn, R.G. 1980. Natural and advance regen-eration of Engelmann spruce and subalpine fir compared 21years after site treatment. For. Chron.57: 55–57.
Hibbs, D.E. 1982. Gap dynamics in a hemlock–hardwood forest.Can. J. For. Res.12: 522–527.
Kayahara, G.J., Chen, H.Y.H., Klinka, K., and Coates, K.D. 1996.Relations of terminal growth and specific leaf area to availablelight in naturally regenerated seedlings of lodgepole pine and in-terior spruce in central British Columbia. B.C. Ministry of For-ests, Victoria. Res. Rep. 09.
Klinka, K., Wang, Q., Kayahara, G.J., Carter, R.E., Blackwell,B.A. 1992. Light-growth response relationships in Pacific silverfir (Abies amabilis) and subalpine fir (Abies lasiocarpa). Can. J.Bot. 70: 1919–1930.
Kneeshaw, D.D., and Bergeron, Y. 1998. Canopy gap characteris-tics and tree replacement in the southeastern boreal forest. Ecol-ogy, 79: 783–794.
Kobe, R.K. 1996. Intraspecific variation in sapling mortality andgrowth predicts geographic variation in forest composition.Ecol. Monogr.66: 181–201.
Kobe, R.K., and Coates, K.D. 1997. Models of sapling mortality asa function of growth to characterize interspecific variation inshade tolerance of eight tree species of northwestern British Co-lumbia. Can. J. For. Res.27: 227–236.
Krajina, V.J., Klinka, K., and Worrall, J. 1982. Distribution andecological characteristics of trees and shrubs of British Colum-bia. Faculty of Forestry, University of British Columbia, Van-couver.
Laackie, R.J., and Fiddler, G.O. 1986. Overstory removal: standfactors related to success and failure. USDA For. Serv. Res. Pa-per PSW-183.
Lertzman, K. 1992. Patterns of gap-phase replacement in a sub-alpine, old-growth forest. Ecology,73: 657–669.
McCaughey, W.W., and Ferguson, D.E. 1986. Response of advanceregeneration to release in the inland mountain west: a summary.In Proceedings—Future Forests of the Mountain West: a StandCulture Symposium, 29 Sept. – 3 Oct. 1986, Missoula, Mont.USDA Forest Service, Intermountain Research Station,Missoula, Mont. pp. 255–266.
McCaughey, W.W., and Schmidt, W.C. 1982. Understory tree re-lease following harvest cutting in spruce–fir forests of theIntermountain West. USDA For. Serv. Res. Pap. INT-285.
Meidinger, D., and Pojar, J.(Compilers and Editors). 1991. Ecosys-tems of British Columbia. B.C. Ministry of Forests, Victoria.Spec. Rep. Ser. 6.
Merrens, E.J., and Peart, D.R. 1992. Effects of hurricane damageon individual growth and stand structure in a hardwood forest inNew Hampshire, USA. J. Ecol.80: 787–795.
Oliver, W.W. 1985. Growth of California red fir advance regenera-tion after overstory removal and thinning. USDA For. Serv. Res.Pap. PSW-180.
Orwig, D.A., and Abrams, M.D. 1994. Contrasting radial growthand canopy recruitment patterns inLiriodendron tulipiferaandNyssa sylvatica: gap-obligate versus gap-facultative species.Can. J. For. Res.24: 2141–2149.
Pacala, S.W., Canham, C.D., and Silander, J.A., Jr. 1993. Forestmodels defined by field measurements: 1. The design of a north-eastern forest simulator. Can. J. For. Res.23: 1980–1988.
Pacala, S.W., Canham, C.D., Silander, J.A., Jr., and Kobe, R.K.1994. Sapling growth as a function of resources in a north tem-perate forest. Can. J. For. Res.24: 2172–2183.
Pogue, H.M. 1946. Regeneration and growth of white spruce afterlogging. Department of Lands and Forests, Victoria, B.C. pp. 1–26.
Pojar, J., Klinka, K., and Meidinger, D.V. 1987. Biogeoclimaticclassification in British Columbia. For. Ecol. Manage.22: 119–54.
Rebertus, A.J., and Veblen, T.T. 1993. Structure and tree-fall gapdynamics of old-growthNothofagusforests in Tierra del Fuego,Argentina. J. Veg. Sci.4: 641–654.
Runkle, J.R. 1981. Gap regeneration in some old-growth forests ofthe eastern United States. Ecology,62: 1041–1051.
Seidel, K.W. 1980. Diameter and height growth of suppressedgrand fir saplings after overstory removal. USDA For. Serv. Res.Pap. PNW-275.
Seidel, K.W. 1985. Growth response of suppressed true fir andmountain hemlock after release. USDA For. Serv. Res. Pap.PNW-344.
Sundkvist, H. 1994. Initial growth ofPinus sylvestrisadvance re-production following varying degrees of release. Scand. J. For.Res.9: 360–366.
SYSTAT, Inc. 1996. SYSTAT for Windows: statistics, version 6edition. SYSTAT, Inc., Evanston, Ill.
Tesch, S.D., and Korpela, E.J. 1993. Douglas-fir and white fir ad-vance regeneration for renewal of mixed-conifer forests. Can. J.For. Res.23: 1427–1437.
Tucker, G.F., and Emmingham, W.H. 1977. Morphological changesin leaves of residual western hemlock after clear and shelter-wood cutting. For. Sci.23: 195–203.
Tucker, G.F., Hinckley, T.M., Leverenz, J., and Jiang, S. 1987. Ad-justments of foliar morphology in the acclimation of understory
© 2000 NRC Canada
Wright et al. 1579
I:\cjfr\cjfr30\cjfr-10\X00-089.vpFriday, October 13, 2000 7:45:56 AM
Color profile: DisabledComposite Default screen

© 2000 NRC Canada
1580 Can. J. For. Res. Vol. 30, 2000
Pacific silver fir following clearcutting. For. Ecol. Manage.21:249–268.
Wang, G.G., Quian, H., and Klinka, K. 1994. Growth ofThujaplicata seedlings along a light gradient. Can. J. Bot.72: 1749–1757.
Wright, E.F., Coates, K.D., Canham, C.D., and Bartemucci, P.1998. Species variability in growth response to light across cli-matic regions in northwestern British Columbia. Can. J. For.Res.28: 871–886.
I:\cjfr\cjfr30\cjfr-10\X00-089.vpFriday, October 13, 2000 7:45:56 AM
Color profile: DisabledComposite Default screen