SAP HANA: An Introduction - Purple-IT
431
-
Upload
khangminh22 -
Category
Documents
-
view
6 -
download
0
Transcript of SAP HANA: An Introduction - Purple-IT


SAP PRESS is a joint initiative of SAP and Galileo Press. The know-how offered by SAP specialists combined with the expertise of the Galileo Press publishing house offers the reader expert books in the field. SAP PRESS features first-hand informa-tion and expert advice, and provides useful skills for professional decision-making.
SAP PRESS offers a variety of books on technical and business related topics for the SAP user. For further information, please visit our website: http://www.sap-press.com.
Ginger Gatling et al. Enterprise Information Management with SAP 2012, 504 pp., hardcover ISBN 978-1-59229-414-5
Loren Heilig et al. SAP NetWeaver BW and SAP Business Objects: The Comprehensive Guide 2012, 795 pp., hardcover ISBN 978-1-59229-384-1
Michael Doane The SAP Blue Book: A Concise Business Guide to the World of SAP 2012, 190 pp., paperback ISBN 978-1-59229-412-1
Sanjeet Mall, Tzanko Stefanov, and Stanley Stadelman Mobilizing Your Enterprise with SAP 2012, 409 pp., hardcover ISBN 978-1-59229-419-0

Dr. Berg and Penny Silvia
SAP® HANA™
An Introduction
Bonn � Boston

Dear Reader,
Ever since SAP HANA was first announced in 2010, I looked forward to the book that SAP PRESS would publish on it. However, finding authors suitable for such a new, cutting edge, and sometimes-controversial topic is not an easy task. You need people with true experience, objectivity, a sense of what information people really want to know, and the voice to effectively share it. This is hard to find, especially for a topic like SAP HANA.
Enter Dr. Berg and Penny Silvia. I had the pleasure of working with these fine authors for an intensive period of writing, rewriting, updating—and then a little more rewriting. The goal: To provide the most up-to-date and down-to-earth SAP HANA book out there. It took them late nights and, I’d venture to guess, many a cup of coffee—but I think you’ll agree that the goal has been accomplished.
Of course, we at SAP PRESS are always interested in your opinion. What do you think about SAP HANA: An Introduction? How could it be improved? As your comments and suggestions are the most useful tools to help us make our books the best they can be, we encourage you to visit our website at www.sap-press.com and share your feedback.
Thank you for purchasing a book from SAP PRESS!
Kelly Grace Harris Editor, SAP PRESS
Galileo Press Boston, MA
http://www.sap-press.com

Notes on Usage
This e-book is protected by copyright. By purchasing this e-book, you have agreed to accept and adhere to the copyrights. You are entitled to use this e-book for personal purposes. You may print and copy it, too, but also only for personal use. Sharing an electronic or printed copy with others, however, is not permitted, neither as a whole nor in parts. Of course, making them available on the Internet or in a company network is illegal as well.
For detailed and legally binding usage conditions, please refer to the section Legal Notes.
This e-book copy contains a digital watermark, a signature that indicates which person may use this copy:
Copy No. 5wh7-4ftp-x3eq-mcrgfor personal use ofRGA Rik Vriens, user id c3b3ffa0-d601-c76a-06ae-b5f2c05f5c4a

Imprint
This e-book is a publication many contributed to, specifically:
Editor Kelly Grace HarrisCopyeditor Julie McNameeCover Design Graham GearyPhoto Credit iStockphoto.com/mevansProduction E-Book Kelly O’CallaghanTypesetting E-Book Publishers’ Design and Production Services, Inc.
We hope that you liked this e-book. Please share your feedback with us and read the Service Pages to find out how to contact us.
The Library of Congress has cataloged the printed edition as follows:Berg, Bjarne.
SAP HANA : an introduction / Bjarne Berg and Penny Silvia. — 1st edition.
pages cm
ISBN-13: 978-1-59229-434-3
ISBN-10: 1-59229-434-0
1. Database management. 2. Business enterprises—Data processing. 3. SAP
HANA (Electronic resource) I. Silvia, Penny. II. Title.
QA76.9.D3B473 2012
005.74—dc23
2012031125
ISBN 978-1-59229-434-3 (print) ISBN 978-1-59229-619-4 (e-book) ISBN 978-1-59229-620-0 (print and e-book)
© 2012 by Galileo Press Inc., Boston (MA) 1st edition 2012

7
Contents
Foreword ................................................................................................... 15Preface ....................................................................................................... 17Acknowledgments ..................................................................................... 19
PART I What, Why, and When
1 In-Memory Computing, Big Data, and SAP HANA .................. 23
1.1 Introduction to In-Memory Computing and Big Data .................. 231.1.1 In-Memory Computing and Analytics ............................. 231.1.2 Big Data ........................................................................ 26
1.2 Introduction to SAP HANA ......................................................... 301.2.1 SAP HANA as in In-Memory Computing Solution ........... 311.2.2 SAP HANA as an Enabler of Big Data Solutions .............. 351.2.3 SAP HANA Capabilities .................................................. 381.2.4 SAP HANA Adoption Drivers .......................................... 41
1.3 Getting Started with SAP HANA ................................................. 421.4 Summary .................................................................................... 46
2 SAP HANA Versions .................................................................. 47
2.1 SAP HANA Standalone Version ................................................... 472.1.1 Technical Requirements .................................................. 482.1.2 Skills Requirements ........................................................ 512.1.3 Project Plan Steps .......................................................... 55
2.2 SAP HANA for SAP NetWeaver BW ............................................ 572.2.1 Technical Requirements .................................................. 582.2.2 Skills Requirements ........................................................ 602.2.3 Project Plan Steps .......................................................... 64
2.3 Summary .................................................................................... 66
3 SAP HANA Use Cases ............................................................... 67
3.1 Do Something New .................................................................... 683.2 Do Something Faster .................................................................. 713.3 Which SAP HANA Version Is Right for You? ................................ 74

8
Contents
3.3.1 Choosing SAP HANA as a Standalone System ................. 763.3.2 Choosing SAP HANA for BW .......................................... 773.3.3 Final Thoughts ............................................................... 78
3.4 Summary .................................................................................... 78
4 SAP HANA and Your Business Strategy .................................... 79
4.1 Identifying Transformational Opportunities ................................. 814.2 Understanding Your Needs ......................................................... 84
4.2.1 Enterprise Needs ............................................................ 844.2.2 Data Needs .................................................................... 86
4.3 Working with Existing Solutions: SAP HANA versus SAP NetWeaver BWA ........................................................................ 904.3.1 Does SAP HANA Replace BWA? ..................................... 904.3.2 Pros and Cons of BWA ................................................... 924.3.3 Pros and Cons of SAP HANA .......................................... 944.3.4 Conclusion ..................................................................... 97
4.4 Writing a Business Case, Budgeting, and Staffing for SAP HANA .................................................................................. 984.4.1 Writing a Business Case .................................................. 994.4.2 Budgeting for an SAP HANA Implementation ................. 1034.4.3 Staffing an SAP HANA Implementation .......................... 1064.4.4 Building a Roadmap ....................................................... 108
4.5 Frequently Asked Questions about SAP HANA ............................ 1114.5.1 Is SAP HANA a Database, Hardware, or a Solution? ........ 1114.5.2 What Type of Customer is Looking at SAP HANA
Solutions? ...................................................................... 1124.5.3 What Are the Problem Statements that Identify a
Need for SAP HANA? ..................................................... 1124.5.4 What Is the Differentiator for SAP with SAP HANA? ....... 1124.5.5 What Is SAP Envisioning for the Future of SAP HANA? ... 1134.5.6 Is SAP HANA Plug and Play? .......................................... 1134.5.7 Can Non-SAP Business Intelligence Tools Work on Top of
SAP HANA? ................................................................... 1134.5.8 What Does a Customer Need to Buy to Use
SAP HANA? ................................................................... 1144.5.9 How Much Does SAP HANA Cost? ................................. 1144.5.10 Does SAP HANA Replace BWA for Customers? .............. 115

9
Contents
4.5.11 Is SAP HANA Just Another SAP Fad That Will Not Have a Long Lifespan—Like mySAP? ........................ 115
4.6 Summary .................................................................................... 115
PART II How
5 Planning an SAP HANA Installation ......................................... 119
5.1 In-Memory Computing Engine (IMCE) ........................................ 1195.2 Sizing Your System ...................................................................... 120
5.2.1 SAP Quick Sizer for SAP HANA ...................................... 1215.2.2 Some Quick Sizing Rules to Follow ................................. 1265.2.3 SAP’s T-Shirt Sizing Model for SAP HANA ...................... 127
5.3 Software and Technical Requirements ......................................... 1295.4 Row versus Column Indexes and the Persistency Layer ................ 1335.5 Hardware Options ...................................................................... 1385.6 Special Considerations for Planning an SAP HANA for BW
Installation .................................................................................. 1405.6.1 SAP HANA-Optimized InfoCubes ................................... 1415.6.2 SAP HANA-Optimized Data Store Objects (DSOs) .......... 1445.6.3 The Future of InfoCubes ................................................. 145
5.7 Summary .................................................................................... 146
6 SAP HANA and the SAP BusinessObjects BI Platform ................ 147
6.1 Overview of the SAP Business Objects Tools ................................ 1476.1.1 SAP Business Objects Dashboards (Xcelsius) .................... 1486.1.2 SAP Business Objects Web Intelligence ........................... 1496.1.3 SAP Business Objects Explorer ......................................... 1506.1.4 SAP Business Objects Analysis ......................................... 1516.1.5 SAP Business Objects Design Studio ................................ 1536.1.6 SAP Crystal Reports ........................................................ 153
6.2 Connecting SAP Business Objects BI Tools to SAP HANA ............. 1556.2.1 Universes with Open and Java Database Connections
(ODBC/JDBC) ................................................................ 1556.2.2 IDT Access to Attributes, Calculations, and Analytical
Views ............................................................................. 1636.2.3 Connecting to Excel with Open Database Objects
(ODO) and MDX ............................................................ 164

10
Contents
6.2.4 Building a Microsoft Query on SAP HANA ...................... 1686.2.5 BICS Connections ........................................................... 1696.2.6 Connectivity Summary .................................................... 169
6.3 Going Mobile with SAP HANA and SAP Business Objects ............ 1706.4 Summary .................................................................................... 171
7 Data Modeling with Information Composer ........................... 173
7.1 Getting Started with Information Composer ................................ 1757.1.1 Functionality .................................................................. 1767.1.2 Example Scenario ........................................................... 178
7.2 Uploading Data to SAP HANA .................................................... 1807.2.1 Specifying the Data Source and Loading Data ................. 1807.2.2 Cleansing the Data ......................................................... 1847.2.3 Classifying Data Columns ............................................... 1887.2.4 Saving the Data .............................................................. 190
7.3 Composing Information Views .................................................... 1917.3.1 Specifying Data Sources ................................................. 1927.3.2 Combining Data ............................................................. 196
7.4 Viewing Uploaded Data and Composed Information Views ......... 2037.4.1 My Data Screen Area ...................................................... 2037.4.2 My Information Views Screen Area ................................. 204
7.5 Summary .................................................................................... 205
8 Data Modeling with SAP HANA Studio ................................... 207
8.1 SAP HANA Studio Overview and Terminology ............................. 2078.2 Getting Started with SAP HANA Information Modeler ................ 212
8.2.1 Adding a System ............................................................ 2148.2.2 Opening Perspectives ..................................................... 2178.2.3 Using Quick Launch ....................................................... 2188.2.4 Creating a Package ......................................................... 2198.2.5 Example Scenario ........................................................... 220
8.3 Building Attribute Views ............................................................. 2218.3.1 Creating an Attribute View ............................................. 2218.3.2 Defining Table Joins ....................................................... 2258.3.3 Defining Output ............................................................. 2318.3.4 Checking, Saving, and Activating Views .......................... 2338.3.5 Creating the Time Attribute View ................................... 235

11
Contents
8.4 Building Analytic Views ............................................................... 2378.4.1 Creating an Analytic View .............................................. 2388.4.2 Copying an Analytic View ............................................... 248
8.5 Building Calculation Views Using the Graphical Method ............. 2498.6 SQL and SQLScript ...................................................................... 260
8.6.1 Using SQL ...................................................................... 2608.6.2 Using SQLScript ............................................................. 267
8.7 Summary .................................................................................... 272
9 Advanced Concepts in SAP HANA Studio ................................ 275
9.1 Derived Attribute Views ............................................................. 2759.2 Calculated Attributes .................................................................. 2819.3 Restricted and Calculated Measures ............................................ 2849.4 Filter and Variable Operations ..................................................... 290
9.4.1 Filters ............................................................................. 2909.4.2 Variables and Input Parameters ...................................... 299
9.5 Currency Conversion ................................................................... 3049.5.1 Using an Input Parameter to Specify Target Currency ...... 3079.5.2 Linking Measures with Currencies without Using
Conversion ..................................................................... 3089.6 Hierarchies .................................................................................. 309
9.6.1 Creating a Leveled Hierarchy .......................................... 3109.6.2 Creating a Parent-Child Hierarchy ................................... 314
9.7 Personalizing Studio .................................................................... 3179.7.1 Model Validation ........................................................... 3179.7.2 Versioning ...................................................................... 3189.7.3 Checking Model References ........................................... 3199.7.4 Customizing Perspectives ............................................... 320
9.8 Summary .................................................................................... 323
10 Data Provisioning ..................................................................... 325
10.1 Choosing a Data Provisioning Method ........................................ 32610.1.1 Strategic Considerations ................................................. 32810.1.2 Technical Considerations ................................................ 335
10.2 Trigger-Based Replication: SAP Landscape Transformation ........... 33810.2.1 Installation ..................................................................... 338

12
Contents
10.2.2 How SLT Works .............................................................. 34010.2.3 SLT Configuration ........................................................... 34210.2.4 SLT Administration (Start, Replicate, Stop, Suspend,
Resume) ......................................................................... 34310.2.5 Extended Features .......................................................... 345
10.3 ETL-Based Replication: SAP Data Services ................................... 34910.3.1 Configuration Requirements ........................................... 35010.3.2 Preparing SAP HANA to Receive Data from SAP Data
Services .......................................................................... 35010.3.3 Loading Data .................................................................. 353
10.4 Log-Based Replication: Sybase Replication Server and Load Controller ................................................................................... 35810.4.1 Installation ..................................................................... 36010.4.2 Running Sybase Replication ............................................ 361
10.5 Direct Extractor Connection ........................................................ 36110.5.1 DXC Technology ............................................................. 36210.5.2 Important Considerations for the Use of DXC ................. 36510.5.3 Preparing SAP HANA for Use with DXC .......................... 36810.5.4 Preparing the Source System for Use with DXC .............. 37010.5.5 Loading Data to SAP HANA with DXC ............................ 370
10.6 Summary .................................................................................... 371
11 SAP HANA Administration ....................................................... 373
11.1 Main Administration Tasks .......................................................... 37411.1.1 Adding Systems .............................................................. 37511.1.2 Exporting and Importing Systems ................................... 37711.1.3 Viewing System Installation Details ................................ 37711.1.4 Administrator Editor and Diagnosis Mode ...................... 37911.1.5 Changing File Locations .................................................. 38011.1.6 Changing Configurations ................................................ 38011.1.7 Modifying the Administration Console ........................... 381
11.2 SAP HANA System Monitoring ................................................... 38111.2.1 Monitoring Disk Usage ................................................... 38311.2.2 Performance Monitoring ................................................ 38411.2.3 Monitoring with Alerts ................................................... 38511.2.4 Configuring Alerts .......................................................... 38511.2.5 Monitoring Services and Distributed Systems ................. 386

13
Contents
11.2.6 Exporting and Importing Table Data and Definitions ....... 38811.2.7 Monitoring Memory Usage ............................................ 38911.2.8 Moving Files for Load Balancing .................................... 39011.2.9 Fixing a Full Disk Event .................................................. 39111.2.10 Support for Unresponsive Systems ................................. 391
11.3 Updates ...................................................................................... 39211.3.1 Updating the SAP HANA Appliance ................................ 39211.3.2 Updating SAP HANA Studio ........................................... 392
11.4 Security and License Keys ........................................................... 39311.4.1 System Privileges ............................................................ 39311.4.2 Authentication Security .................................................. 39411.4.3 Authorization Security .................................................... 39511.4.4 License Keys ................................................................... 400
11.5 Failover and High Availability ...................................................... 40311.6 Summary .................................................................................... 404
Appendices ..................................................................................... 405
A SAP HANA Rapid Deployment Solutions .............................................. 407A.1 SAP CO-PA Accelerator ............................................................... 407A.2 Operational Reporting RDS ......................................................... 408A.3 Summary .................................................................................... 409
B Pre-Configured Data Modeling Content for SAP HANA ........................ 411B.1 SAP Business Objects Rapid Marts ............................................... 411B.2 Accelerators ................................................................................ 411B.3 Rapid Deployment Solutions ....................................................... 415
C The Authors ......................................................................................... 419
Index ......................................................................................................... 421
Service Pages ............................................................................................. ILegal Notes ............................................................................................... III


15
Foreword
The world is changing fast, and we want to live on a smarter planet. We are faced with available orders of magnitude of data like never before. If we could analyze that data in a very fast way—in fact, in real time—we could change how businesses work in a globalized economy. This applies to large enterprises as well as medium or small companies, because the desire for growth is the same for all participants. To derive new insights, in real time, into those humungous amounts of data, we need new ways of processing that data. Fortunately, it is now possible to do that—because the technology of in-memory computing and the underlying hardware infrastructure capabilities are finally available and affordable.
SAP HANA changes the game for enterprises. Innovative use cases like accelerat-ing business analytics by orders of magnitudes (e.g., several hundred times faster response times on reports) or running completely new applications on top of SAP HANA appear all around the world. However, before companies choose in-memory computing solutions such as SAP HANA, it’s necessary to identify the relevant busi-ness scenarios that lead to companies achieving one of two objectives (or both):
EE Will the company make more revenue and thus more profit?
EE Can the company achieve higher customer satisfaction?
Use cases for SAP HANA can vary quite significantly, of course; for example, a financial institution will have very different desires than an automotive supplier or a retail company. However, these are the two basic questions any company implementing SAP HANA should ask.
The decision for SAP HANA is usually made on the business side. On the IT side, the situation is often challenging: SAP HANA is delivered as an integrated solution with hardware and software bundled together and called an “appliance.” However, it’s still the device in the data center that will need all of the attention, along the IT service management (ITIL) processes, similar to the infrastructure, where classic SAP applications have been running. Tasks such as installing new systems, monitoring ongoing health, upgrading and patching, backing up and restoring, maintaining
Personal Copy for RGA Rik Vriens, user id c3b3ffa0-d601-c76a-06ae-b5f2c05f5c4a

16
Foreword
high availability, ensuring scalability, monitoring security issues, and promising business continuity don’t change.
All of these requirements need to be mature and data-center-ready before corpora-tions can use SAP HANA for business-critical data. Fortunately, if you’re considering an SAP HANA solution, you’ve made the right first step: This book gives you insight into the selection of SAP HANA scenarios, its use cases, and the recommendations around the IT management of the infrastructure for SAP HANA in the data center. In addition, the book contains practical instruction about working in SAP HANA. In short, this book is all you need to get started.
Irene Hopf Consulting Architect Global Lead for Analytics and SAP HANA at IBM
© 2013 by Galileo Press Inc., Boston (MA)

17
Preface
You know SAP HANA is fast. But what else do you need to know? Don’t worry—within these pages, you’ll find out. Whether you’re a manager, developer, or administrator, we’ll give you everything you need to get started with SAP HANA.
Part I is for the business person (or anyone, really!) looking to understand the basics of SAP HANA. In Chapter 1, we offer an introduction to the topic with general explanations of big data, in-memory computing, and SAP HANA. In Chapter 2, we get a little more specific about the solution, outlining the two main SAP HANA scenarios, specifically focusing on their technical differences and prerequisites. In Chapter 3, we boil down the differences into two main use cases, and offer some advice for how to decide which version of SAP HANA might be right for your com-pany. Finally, in Chapter 4, we offer some advice on outlining a business strategy that includes SAP HANA.
Part II is for the technical at heart. In Chapter 5, we introduce you to the first steps in planning an SAP HANA installation: hardware, sizing, and more. In Chapter 6, we offer an introduction to SAP HANA and the SAP Business Objects BI platform, which is the recommended BI tool for SAP HANA. Then, in Chapters 7-9, we really dive into the details of SAP HANA itself: with step-by-step instructions and hun-dreds of screenshots for working in Information Composer and SAP HANA Studio. The detailed discussion continues in Chapter 10, with step-by-step instructions on data provisioning with SAP Data Services, SAP Landscape Transformation, and the Sybase Replication Server. Finally, in Chapter 11, we round out the book with a discussion of SAP HANA administration.
After reading this book, you’ll know the what, when, why, and how of SAP HANA—and, perhaps even more importantly—where to go from here. Read on, and enjoy!
Dr. Berg Associate Professor, SAP University Alliance, Lenoir Rhyne University Vice President of Information Technology, ComeritLabs
Penny Silvia SAP Analytics Go To Market Leader, IBM Global Business Services
Personal Copy for RGA Rik Vriens, user id c3b3ffa0-d601-c76a-06ae-b5f2c05f5c4a

© 2013 by Galileo Press Inc., Boston (MA)

19
Acknowledgments
We would like to thank Filip Lemmens at ComeritLabs for significant contributions to Chapters 7 and 8, and Tag Robertson at IBM Labs in Research Triangle Park, North Carolina for the loan of the powerful SAP HANA hardware system that we used when writing this book. We also extend a thank you to Irene Hopf for arrang-ing IBM support in writing this book, and to Brandon Harwood, Kong Yang, Osi Nriagu, and Nick Le at ComeritLabs in North Carolina for their timely support and testing of SAP solutions.
Personal Copy for RGA Rik Vriens, user id c3b3ffa0-d601-c76a-06ae-b5f2c05f5c4a

© 2013 by Galileo Press Inc., Boston (MA)

PART IWhat, Why, and When
Personal Copy for RGA Rik Vriens, user id c3b3ffa0-d601-c76a-06ae-b5f2c05f5c4a

© 2013 by Galileo Press Inc., Boston (MA)

23
Three of SAP’s biggest buzzwords right now are “in-memory computing,” “big data,” and—of course—“SAP HANA.” In this chapter, learn how they come together and what it all means.
1 In-Memory Computing, Big Data, and SAP HANA
At least once a day, we are asked: “What is SAP HANA—really?” Well, the answer isn’t easy, and it involves more than just a description of a software solution. In this chapter, we’ll start to answer this question by offering a conceptual explanation of in-memory computing and big data, two major concepts that play a part in SAP HANA. We’ll then introduce you to the software solution itself, and offer a brief word on getting started with planning your solution. Throughout it all, we’ll put the information into a context that non-technical folks can understand, and in a way that will hopefully remove some of the uncertainty associated with in-memory computing and big data in general, as well as SAP HANA specifically.
1.1 Introduction to In-Memory Computing and Big Data
“In-memory computing” and “big data” are terms that seem to be thrown around all the time these days, especially with regard to SAP HANA. Since it’s important to understand both concepts before getting into the specifics of SAP HANA as a software solution, this section will introduce you to them.
1.1.1 In-Memory Computing and Analytics
Business leaders are increasingly being asked to make real-time decisions in today’s highly dynamic and challenging environments. This is putting more and more pres-sure on IT departments and business leadership to find and provide new and faster ways to get information and insight into the hands of decision makers. Waiting for
Personal Copy for RGA Rik Vriens, user id c3b3ffa0-d601-c76a-06ae-b5f2c05f5c4a

24
In-Memory Computing, Big Data, and SAP HANA1
data to work its way through a complex data model and data warehouse, and then finally to your reports, is no longer good enough. The business user community is demanding full visibility to what is happening now and to react in near real time.
Consider this scenario: A retailer monitors a customer’s real-time behavior in a store or on a website and draws on historical data from its loyalty system about that customer’s behavior, combines that with that customer’s “likes” on Facebook or other social media sites, and then sends the customer coupons or promotions directly to their cell phone—for items they are standing in front of (or viewing on their screen). This vision has long been dreamed of, but it can be made a reality today, in part due to in-memory computing technology. This type of scenario and solution requires not only real-time analytics but also sorting through massive amounts of data in that same real time. By moving data off disk and into main memory, the retrieval time for the data is next to nothing—significantly boosting performance and allowing for this possible scenario.
The idea of running databases in memory is nothing new; it was one of the founda-tions of the business intelligence product QlikView, back in 1997. As this overall technology (in-memory) has matured, and memory prices have plummeted, it has become a viable and realistic option for organizations. This has opened the door for other software companies—for example, SAP—who have been working on ways to take advantage of this convergence of technology and affordability to build new and faster solutions for their customers.
At its core, in-memory computing is a technology that allows the processing of massive quantities of data in main memory to provide immediate results from analysis and transaction. SAP refers to this as massive parallel processing (MPP). The data to be processed is ideally real-time data or as close to real time as is technically possible. To achieve that level of performance, in-memory computing follows a simple tenet: speed up data access and minimize data movements. The main memory (RAM) is the fastest storage type that can hold a significant amount of data (while CPU registers and CPU caches are faster to access, their usage is lim-ited to the actual processing of data). Data in main memory (RAM) can be accessed 100,000 times faster than data on a hard disk. Clearly, compared with keeping data on hard disk, leveraging this in-memory capability can improve performance just by the dramatically decreased access time to retrieve the data and make it available to your reporting and analytic solutions or other applications.
© 2013 by Galileo Press Inc., Boston (MA)

25
Introduction to In-Memory Computing and Big Data 1.1
There is lots we could say about in-memory computing (whole books have been written on the subject!), but our goal here is to keep it simple. Before we end our explanation, though, we do want to address one of the main questions that seem to surround in-memory computing: What happens to my data if I lose power?
Let’s compare this situation to a Microsoft Word document that you haven’t clicked the Save button for yet. If your computer crashes before you click Save and write that document to your hard drive, have you lost all of your work? After all, your document is in the memory of the computer until you click Save—not the hard drive. If you haven’t clicked Save and your computer crashes, you might get a version in recovery mode, but it’s also possible that you’ll find yourself rewriting your docu-ment. The good news is that you won’t run into this same problem with in-memory databases and solutions. So, how do in-memory solutions address this issue?
In database technology, atomicity, consistency, isolation, and durability (ACID) is the set of requirements that are assessed for reliability:
EE A transaction has to be atomic. Meaning if part of a transaction fails, the entire transaction has to fail and therefore leave the database state unchanged.
EE The consistency of a database must be preserved.
EE Isolation ensures that no one transaction interferes with another transaction.
EE Durability means that after a transaction has been committed to the database, it will remain there.
Although the first three requirements are not affected by in-memory technologies, durability is a requirement that cannot be met by storing data in main memory alone. Main memory is volatile storage, which means it loses its content if it loses power. To make data persistent, it has to reside on non-volatile storage, such as hard drives. (Stay with us now—this is going to be a bit technical for a couple of minutes.)
The medium used by a database to store data (in this case, main memory) is divided into pages. When a transaction changes data, the corresponding pages are marked and written to non-volatile storage (a hard drive not at risk of power failures) in regular intervals. In addition, a database log captures all changes made by transac-tions. Each committed transaction generates a log entry that is written to non-volatile storage. This ensures that all transactions are permanent.
Personal Copy for RGA Rik Vriens, user id c3b3ffa0-d601-c76a-06ae-b5f2c05f5c4a

26
In-Memory Computing, Big Data, and SAP HANA1
In-memory databases can save changed pages in savepoints (Figure 1.1), which are asynchronously written to persistent storage in regular intervals (for SAP HANA, every five minutes by default). This log is written synchronously. In other words, a transaction does not return before the corresponding log entry has been written to persistent storage—in order to meet the durability requirement that was described earlier—thus ensuring that in-memory databases meet (and pass) the ACID test.
Time
Data savepointto persistent
storage
Log written topersistent storage
(committedtransactions)
Power failure
Figure 1.1 Savepoints and Logs
After a power failure, the database can be restarted, and the database pages are restored from the savepoints. The database logs are applied to restore the changes that were not captured in the savepoints. This ensures that the database can be restored in memory to exactly the same state as before the power failure.
In other words: If you forget to pay your electric bill and the power gets shut off to your in-memory database hardware, you don’t have to panic.
1.1.2 Big Data
One of the reasons that in-memory computing is becoming such a big deal is because of changing information consumption trends. The need for and requirements of data and visualization for organizations are rapidly changing, and are becoming more and more vital for the future. The importance of historical or trend reporting is decreasing, while data visualization and the ability to drive change continue to increase in importance (Figure 1.2).
Clearly, times are changing, and, as a result, organizations are looking at alterna-tives for their business intelligence needs. What is the user audience demanding that is not being met with the current tools and technologies that are available and deployed for their use? You would get different answers to those questions if you
© 2013 by Galileo Press Inc., Boston (MA)

27
Introduction to In-Memory Computing and Big Data 1.1
asked the IT department, of course, but if you ask the users of the systems—from the business perspective—you’ll probably hear something like: “We heard about massive volumes of data sitting ready for use in the ERP systems—but it isn’t accessed or can’t be accessed.” If asked why this is the case, your users will likely respond with one or more of the following:
EE “It’s too hard to retrieve.”
EE “It takes too long to load it into a data warehouse.”
EE “I’ve always been told a data warehouse is for aggregated data.”
EE “We don’t have enough space in the data warehouse to hold everything.”
EE “The reports can’t handle that much data.”
EE “I don’t really know what to ask for, and they won’t give me ‘everything.’”
Two Years Ago Today
Legend:
Historic trend analysis and forecasting
Analytics applied within business processes
Simulations and scenario development
Clustering and segmentation
Regression analysis, discrete choicemodeling, and mathematical optimization
Data visualization
Standardized reporting
Historic trend analysis and forecasting
Analytics applied within business processes
Simulations and scenario development
Clustering and segmentation
Increased or sustained value Decreased in value
Regression analysis, discrete choicemodeling, and mathematical optimization
Data visualization
Standardized reporting
Figure 1.2 Evolution of Information Needs
Any of this sound familiar? One of the things that you’ll find is that as your users and organization mature in their perspective on technology and information, their demands for information and how that information is available to them will increase (see Figure 1.3).
Personal Copy for RGA Rik Vriens, user id c3b3ffa0-d601-c76a-06ae-b5f2c05f5c4a

28
In-Memory Computing, Big Data, and SAP HANA1
As you progress through these levels of capabilities and needs, you’ll start requir-ing massive amounts of data to address these solutions—this is what is known as big data. The “big data” phrase is thrown around in the analytics industry to mean many things. In essence, it refers to the massive—nearly inconceivable—amount of data that is available to us today. People create 2,500,000,000,000,000 bytes of data per day. More than 90% of the world’s data has been created in the past two years alone, and this pace isn’t slowing.
Mosey (33%)
� Turn to analytics for ways to cut costs
� Focused on analytics at point of need
Fast Walk (46%)
� Seeking to grow revenue with focus on cost efficiencies
� Seeking to expand ability to share information and insights
Financial management and spreadsheet analysis
Monitoring day-of operations and production
Historical trend reporting
Evolving strategy and business development
Focusing on customer service
Prioritizing product research and development
Managing risk
Planning and allocating workforce to meet demand
Predicting and driving market behavior
Placing importance on positive customer experience
Run (21%)
� Most experienced and successful using analytics
� Seeking targeted revenue growth
� Feeling the most pressure to do more with analytics
CapabilityProgression
Figure 1.3 Increasing Needs for Analytic Solutions
The types of problems that organizations are looking to solve today need to bring in more than just sales orders and financial postings—organizations are trying to gain insight into how and why consumers do what they do and get ahead of the curve. Organizations are trying to drive behavior of consumers. Organizations are look-ing to bring in insight from how customers really feel about their products—what are they saying on social media sites? Which stores do they look in versus shop in?
© 2013 by Galileo Press Inc., Boston (MA)

29
Introduction to In-Memory Computing and Big Data 1.1
Information and the analytics of that information are at the core of the new demand for insight. However, organizations are either not getting what they need, or they are not trusting what they get. Consider the following statistics:1
EE One in three business leaders frequently make decisions based on information they don’t trust or don’t have.
EE One in two business leaders say they don’t have access to the information they need to do their jobs.
EE 83% of CIOs cited “business intelligence and analytics” as part of their visionary plans to enhance competitiveness.
EE 60% of CEOs say they need to do a better job capturing and understanding information rapidly to make swift business decisions.
What does all this mean to you—the business user or the IT person who has to deal with all of this? If you are a business user, it means that you’ll want to incor-porate all of this data into your repositories so you can bring it into your analyses. If you are an IT person, it means that you have to quickly look at strategies to deal with not only bringing in and storing massive amounts of data, but also making it available to your user community on an as-needed basis. Your paradigm has to shift, because the old way of capturing, staging, and storing data will no longer be sufficient. Both structured and unstructured data will continue to grow at astro-nomical rates, and you must address both of these types of data. This presents a huge opportunity to create and deliver reporting and analytic solutions that can bring together these massive amounts of data in a trusted and secure environment and make it accessible to the organization.
These analytic solutions that you’ll use to house all of your big data will also need to do the following:
EE Find new ways of looking at data based on a broad set of mixed information (structured, unstructured, transaction, etc.) that could not be analyzed before.
EE Incorporate streaming data inputs into analysis.
EE Process and provide ad hoc analysis against massive data volumes.
EE Manage high volumes of structured, relational data.
1 Arvind, Krishna. “Why Big Data? Why Now?” IBM: 2011. http://almaden.ibm.com/colloquium/resources/Why%20Big%20Data%20Krishna.PDF
Personal Copy for RGA Rik Vriens, user id c3b3ffa0-d601-c76a-06ae-b5f2c05f5c4a

30
In-Memory Computing, Big Data, and SAP HANA1
EE Enable ad hoc exploration and reporting.
EE Ensure consistency for repeatable queries.
Big data presents five main challenges:
EE Volume How do you deal with massive volumes of data coming from multiple source systems in a heterogeneous environment?
EE Scope How do you determine the breadth, depth, and span of data to be included in cleansing, conversion, and migration efforts?
EE 360 degree view How do you build consensus in an organization to build 360 degree views of master data domains?
EE Data integrity How do you establish the desired data integrity levels across multiple functional teams and business processes?
EE Governance process How do you establish procedures across people, processes, and technology to maintain a desired state of governance?
Each of these is difficult because you are trying to bring together massive amounts of data with tremendous variety in real time, and then manage, maintain, and make this data available to your organization for whatever its various definitions of insight might be.
There’s a lot more we could say about both in-memory computing and big data—but we’re trying to keep it simple. With this information as your base, let’s now jump to the specifics of SAP HANA, and how it comes into play for both of these general concepts.
1.2 Introduction to SAP HANA
In this section, we introduce you to SAP HANA, both as an in-memory solution and as an enabler of big data solutions. We’ll also outline its main capabilities for you, and explain why organizations are adopting it.
© 2013 by Galileo Press Inc., Boston (MA)

31
Introduction to SAP HANA 1.2
1.2.1 SAP HANA as in In-Memory Computing Solution
SAP first began assessing and incorporating the capabilities of in-memory comput-ing and its power years ago, with its Search and Classification Engine commonly referred to as TREX. TREX, as a search engine, is a key part of various SAP software offerings, such as SAP NetWeaver Enterprise Search. TREX as an SAP NetWeaver standalone engine is a significant part of most search features in SAP applications.
TREX stores its data not in the way traditional or classic databases would, but as flat files in a file system. Although not the full use of in-memory computing, this was the first foray into this technology and solution.
SAP then moved into the world of liveCache. SAP liveCache technology can be described as a hybrid main-memory database. It is based on MaxDB, a relational database owned by SAP that introduced a combination of in-memory data stor-age with special object-oriented database technologies supporting the application functions. This liveCache database system can process enormous volumes of information—quickly. It significantly increases the speed of the complex, data-intensive, and time-sensitive functions of various SAP applications, especially within SAP Supply Chain Management (SCM) and SAP Advanced Planner and Optimizer (SAP APO).
With this validation of in-memory technologies and how they can help improve the usability and responsiveness of SAP solutions and applications, SAP took their next step with an appliance-based solution that was specifically targeted to improving the reporting and analytic capabilities for its SAP NetWeaver Business Warehouse (BW) install base: the BW Accelerator (BWA), which SAP introduced in 2006. The BWA solution is based on TREX technology, which enhanced this existing (and proven) technology to support querying the large—sometimes very, very large—amounts of BW data for analytic requirements. BWA is a combination of hardware and software that moved identified data onto the BWA, organized and indexed it differently than in the core SAP NetWeaver BW database, and then integrated it with the SAP NetWeaver BW reporting tools to read the data via the query engine.
The SAP NetWeaver BW Accelerator is specifically—and only—for speeding up the responsiveness of queries and reports written against SAP NetWeaver BW. In a nutshell, after you attach the BWA appliance (which requires specialized hardware and a physical installation and connection to your SAP NetWeaver BW system),
Personal Copy for RGA Rik Vriens, user id c3b3ffa0-d601-c76a-06ae-b5f2c05f5c4a

32
In-Memory Computing, Big Data, and SAP HANA1
you identify the InfoProviders that will be “accelerated” via that BWA. Then, when queries are executed that require data from those InfoProviders, the query engine will first look for the data on BWA. If it cannot find the data on BWA, the query engine will revert to the traditional (and slower) database to retrieve the data. So, if the data is available on BWA, it gets fed into the query engine almost instantly. If the data has to be retrieved from the traditional database, you can go get a cup of coffee.
Note
For more on BWA, see Section 4.3 in Chapter 4.
The next—and current—step in this evolutionary process is the SAP HANA database, which is fully in-memory. This solution is possible due to advances in hardware technology, a reduction in cost of memory, and an expansion of capacity. SAP has optimized SAP HANA to take advantage of these technology advances, and you can now evaluate this technology as an option for your information and data needs.
SAP HANA is a flexible, data source agnostic toolset (meaning it does not care where the data comes from) that allows you to hold and analyze large (massive) volumes of data in real time, without the need to aggregate or create highly complex physi-cal data models. The SAP HANA in-memory database solution is a combination of hardware and software that optimizes row-based, column-based, and object-based database technologies to exploit parallel processing capabilities. We want to say the key part again: SAP HANA is a database. The overall solution requires special hardware and includes software and applications, but at its heart, SAP HANA is a database.
Even though today’s hardware and memory capacities allow you to keep enormous amounts of data in-memory, you still need to consider how to compress your overall database size (even in-memory). This compression is one of the keys of success—along with keeping the price manageable—with SAP HANA. This is particularly important to note because SAP HANA is licensed (as of this writing) based on the size of the database you will be creating.
In addition to data compression, another key differentiator of SAP HANA is how it stores and processes your data. This is done via column-based organization, as opposed to row-based organization. Relational databases organize data in tables that contain the data records. The difference between row-based and column-based stor-age is the way in which the table is stored (Figure 1.4). As the descriptions suggest:
© 2013 by Galileo Press Inc., Boston (MA)

33
Introduction to SAP HANA 1.2
EE Row-based storage stores a table in a sequence of rows.
EE Column-based storage stores a table in a sequence of columns.
Row ID
Row-based
Column-based
1
2
3
4
5
6
7
Date/Time
845
851
872
878
888
895
901
Material
2
5
4
1
2
3
4
Quantity
1
2
1
2
3
1
1
Customer Name
3
2
4
5
3
4
1
Row ID
1
2
3
4
5
6
7
Date/Time
845
851
872
878
888
895
901
Material
2
5
4
1
2
3
4
Quantity
1
2
1
2
3
1
1
Customer Name
3
2
4
5
3
4
1
Figure 1.4 Row-Based versus Column-Based Storage
Both storage models have advantages and disadvantages, as discussed in Table 1.1.
Row-Based Storage Column-Based Storage
Advantages Data is stored together and is easy to insert or update.
Only relevant columns are read during the selection process, and any column can serve as an index or key for data retrieval.
Disadvantages During selection, all data must be read (see following boxed note).
Updates of data are not as efficient in column-based storage as row-based storage.
Table 1.1 Advantages and Disadvantages of Row-Based versus Column-Based Storage
Personal Copy for RGA Rik Vriens, user id c3b3ffa0-d601-c76a-06ae-b5f2c05f5c4a

34
In-Memory Computing, Big Data, and SAP HANA1
All Data Must Be Read
One of the disadvantages of row-based storage is that, regardless of which columns are actually involved, all columns must be read—meaning that even if your query is not asking for a customer name, for example, that column still gets read by the system when executing the query request. When applied to a SAP NetWeaver BW database, the row data that you think is a single row is spread across multiple tables; master data is separate (generally) from the fact table, so the data has to be constructed in response to a query, making the entire process slower.
Before you get too worried about the drawback for column-based storage, let us explain how it works and how SAP has addressed the issue. To update a field in a row (e.g., when a customer changes his order from a blue car to a silver car), the system finds the row (in a row-based format) and updates the information. In a column-based format, the system has to find the right column and then the right row for the update, so the write process is not as efficient.
For SAP HANA, SAP has dealt with this by not updating during updates. Instead, SAP HANA basically inserts the new line of information. In other words, even though the write process for updating information is a bit slower for column-based databases, SAP has addressed this issue with a different way of updating informa-tion; that is, by inserting instead of updating. In addition, generally speaking, not all of the columns of a row are needed for processing, especially in analytic queries. You generally don’t ask for every possible piece of information for every report requirement (although some people may want all of the possible information and will filter it down from there). The use of this column structure of the data and the database itself will reduce or eliminate scanning unnecessary data when execut-ing a query, thus making it that much faster and more efficient than traditional row-based access.
With this in mind, clearly, SAP HANA is a database that enables improved perfor-mance and new capabilities.
Note
For more technical details on row- and column-based storage, please see Section 5.4 in Chapter 5.
© 2013 by Galileo Press Inc., Boston (MA)

35
Introduction to SAP HANA 1.2
1.2.2 SAP HANA as an Enabler of Big Data Solutions
Big data isn’t going anywhere—and, if anything, it’s getting bigger. The good news is that SAP HANA can certainly handle the data. Now that you understand the kind of problems that big data brings about, let’s talk about what you can put in place with an SAP HANA-enabled solution to effectively address the issue and meet end user requirements:
EE Volume The entire premise of SAP HANA is based around the ability to conduct massive parallel processing (MPP). SAP HANA systems (up to 100TB) are in place in lab environments, showcasing that the SAP HANA capabilities can process those massive amounts of data. Remember—SAP HANA is putting all of this data in memory, not on drives, so the sheer scope of this is massive.
EE Scope SAP HANA can hold massive amounts of data, so it can address whatever scope of information you need. However, this means that you must determine what information from the nearly limitless array of options will come into SAP HANA, and how it will be used. SAP HANA can hold massive amounts of data—but it doesn’t necessarily mean that you should put massive amounts of information into the system if it’s not relevant or applicable to a business need.
EE 360 degree view What is a customer? What is a material? Does your entire organization agree on these definitions? One of the key things organizations are asking for is the 360 degree view of the customer—the fullest, most complete picture of customers, so that you can understand their buying habits, what will be effective promo-tions versus what will be a wasted effort, and what drives them to buy. Previ-ously, analyzing these kinds of massive data sets was near impossible—but with SAP HANA, you have new possibilities.
EE Data integrity This goes directly to the issue of trusting the data. If you are presenting these solutions to the leaders of your organizations as ways to gain insight and visibil-ity into vast amounts of data—and you are telling them that they have the abil-ity to make decisions that drive business activities on a real-time basis—then they better trust that data. Whether the results are good or bad, data integrity implies that you can depend on the data to know that the results are repeatable and the data is trackable. With the ability to now load these massive volumes
Personal Copy for RGA Rik Vriens, user id c3b3ffa0-d601-c76a-06ae-b5f2c05f5c4a

36
In-Memory Computing, Big Data, and SAP HANA1
of data into a single environment—SAP HANA—you can have more trust in the data as you will be able to (potentially) eliminate a series of data migrations, transformations, and extracts across multiple environments.
EE Governance process Making sure that the data and the system stay trusted goes hand in hand with having trusted data. This process applies to the data and the system overall, and makes sure that there is overall governance of the key system points and the measures and metrics that the business leaders will be depending on. Does SAP HANA address governance directly? No. Governance is a process and a business procedure issue. However, thanks to its ability to give you (near) instant visibil-ity of your data and information, SAP HANA will be able to quickly highlight problems for you.
The big data problems—or, perhaps better put, the analytics that require big data—are excellent use cases for SAP HANA. Figure 1.5 shows some examples of how SAP HANA can deliver analytics that require massive amounts of data. Early adopters of SAP HANA were looking at point of sale information, prescriptions, banking transactions, credit card activity, GPS tags, and metrics from tens of thousands of trucks or rail cars.
R&D
ClinicalPerformanceManagement
Clinical TrialManagement
System
ElectronicData Capture
Contracts
ClinicalDashboards
Sample
MarketingEffectiveness
FieldEffectiveness
ContractAnalytics
Manufacturing
Sales Reportingand Analytics
CRM
ExpenseManagement
Powered by SAP HANA
Finance
Commercial
Dashboards
Scorecards
Reporting andAnalysis
Planning andForecasting
Contracts Rebates ERPCapital HR ProjectsStrategicFinance
Figure 1.5 Examples of How SAP HANA Can Deliver for Big Data
© 2013 by Galileo Press Inc., Boston (MA)

37
Introduction to SAP HANA 1.2
These are all data inputs that come from SAP and non-SAP systems that get merged. The following are some practical use cases that require big data from numerous sources:
EE Assessing sales impact A consumer products company wants to assess the impact of in-store demon-strations and coupon handouts to point of sale activity in a real-time basis to make sure it can restock as quickly as needed. This requirement needs to bring in point of sale data from the grocery store; historical sales information (to com-pare period over period sales to see that the sales during demonstrations and couponing are outside of the norm); orders and delivery information to under-stand the grocer’s buying patterns, how much is on order, and when it’s due to be delivered; and logistics information to understand how quickly the consumer packaged goods (CPG) company could restock if required. You could get really fancy and add in weather information to see if the weather was driving addi-tional sales (let’s say it’s really hot out in the area you’re couponing, and you’re giving away samples and coupons on ice cream) and how outside factors are affecting your efforts.
EE Assessing performance A transportation firm lives and dies by miles covered and deliveries on time. To assess its performance on a daily basis, the firm gathers 40 measures from each of its 15,000 containers every five minutes to compile a real-time dashboard that shows how the firm is doing to plan and target, as well as which routes need to be adjusted. This capability requires contract information to understand what should be met for delivery routes and delivery dates as well as penalties for missed or late deliveries. In addition, the firm needs traffic information, weather reports, best gas prices, and the 600,000 measures that come in every five minutes. This all needs to be compiled and presented on a dashboard that updates every five minutes so that management can determine what adjustments need to be made. You could even build in information about service and repair facilities along each route to be able to respond immediately in case of a tire blowout or engine problems.
These are two very different examples of analytic requirements that need big data and that would benefit from using SAP HANA. SAP HANA could build these analytic applications by using MPP power and in-memory capabilities to push enormous amounts of data from multiple systems into user-defined business intelligence (BI)
Personal Copy for RGA Rik Vriens, user id c3b3ffa0-d601-c76a-06ae-b5f2c05f5c4a

38
In-Memory Computing, Big Data, and SAP HANA1
applications that can be used to make (near) real-time business decisions that can be acted upon in a timely manner.
1.2.3 SAP HANA Capabilities
There are things that SAP HANA can do, and there are some that it can’t—and it’s equally important to understand both. In this section, we outline the basics for you.
What It Can Do
For the spectrum of analytic needs that you can address with your SAP HANA-enabled solution, take a look at Figure 1.6.
BusinessManager
LineManager
CasualBusiness User
BusinessAnalyst
FinancialAnalyst
Executive
Scorecarding Reporting Query Analysis PlanningDashboarding
Monitor yourbusiness’s
progress withguided or self-service access.
Predict where the businessis going with statisticalcontent, “what-if,” and
predictive analysis.
Plan your next steps withenterprise planning
throughout the business.
Use real-time orhistorical data todiscover what’s
happening.
Figure 1.6 SAP HANA Analytic Capabilities
Your SAP HANA-based solution can be used to address a variety of analytic needs, as you can see. Remember that SAP HANA has the power to bring together and analyze billions of rows of information in a subsecond. The options and capabili-ties this enables will vary by industry and by user. There are broad analytic needs and focused analytic needs, as shown in Figure 1.7.
With all of this in mind—and the ability to actually answer the full spectrum of questions now possible with an SAP HANA-enabled solution—the scope of the types of analytics that you need addressed is really only limited by what your organization can define.
© 2013 by Galileo Press Inc., Boston (MA)

39
Introduction to SAP HANA 1.2
Analytical Reporting
� Drill, sort, or change your view to track market shifts and monitor product ranking.
� Market shifts.
� Product ranking.
Trending
� Analyze sales trends and the market by organizing data and exploring in a way that makes sense.
Scenario Modeling
� Model or compare scenarios to better understand your business’s financials or profitability.
Advanced Analytics
� Monitoring patterns in data and text can help prevent fraud, or predict possible positive or negative outcomes.
Focused Usage(Specialist)
Broad Usage(Consumers)
Casual Users Executive BusinessManager
Financial andBusiness Analyst
StatisticalAnalyst
Figure 1.7 Scope of SAP HANA Analytical Capabilities
SAP HANA’s potential for practical application spans industries and use cases such as the following:
EE Trading
EE Customer retention
EE Telecommunications
EE Manufacturing
EE Traffic control
EE Fraud prevention
These are just a few of the seemingly endless opportunities being developed and discussed currently, and they all require massive amounts of data available at any time. The most common uses for SAP HANA (at this point) include the following:
EE Call detail record analysis
EE Point of sale analysis
Personal Copy for RGA Rik Vriens, user id c3b3ffa0-d601-c76a-06ae-b5f2c05f5c4a

40
In-Memory Computing, Big Data, and SAP HANA1
EE Quality and production analysis
EE Smart grid/smarter utilities
EE RFID tracking and analytics
EE Fraud/risk management and modeling
EE A complete and full understanding of customers’ needs and habits
What It Can’t Do
Now that you have a basic idea of what SAP HANA is and what it can do, it’s important to understand what SAP HANA isn’t:
EE SAP HANA is not a reporting solution. In and of itself, it does not have a report-ing capability. You have to install and attach a business intelligence (BI) tool—such as the SAP Business Objects Business Intelligence (BI) platform—to generate reports. (For more on SAP Business Objects BI and SAP HANA, see Chapter 6.)
EE SAP HANA is not an extract, transform, and load (ETL) tool. SAP HANA needs either a standalone ETL tool or SAP Data Services to bring data into it. (For more on ETL for SAP HANA, see Chapter 10.)
EE SAP HANA is not a data modeling tool. It cannot handle unstructured data, at least at the time of this writing; data needs to be in some structured form, such as a table, a flat file, a staging table, etc. To create this structure, you can use SAP HANA Studio, or if you are using SAP HANA for BW, you can continue to use the SAP NetWeaver BW data modeling tools. (For more on SAP HANA Studio, see Chapters 8 and 9.)
EE SAP HANA is not a module of SAP ERP. This is a completely different tool from SAP ERP, and while SAP HANA is expected to be able to be a replacement or an option for an SAP ERP database in the future, it will remain that—a database. It is not, nor will it be, a module of SAP ERP.
EE SAP HANA is not SAP NetWeaver BW. SAP NetWeaver BW is a tool for a per-sistent, highly structured data model based on an extended star-schema concept. SAP HANA is not.
EE SAP HANA is not a data quality management tool—but you should have one!
© 2013 by Galileo Press Inc., Boston (MA)

41
Introduction to SAP HANA 1.2
SAP HANA and Unstructured Data
There are efforts underway to assess bringing unstructured data into SAP HANA by integrating it with Web Services, but those efforts are not complete, and no official or definitive position is ready to be published that details either the results of those efforts or how to accomplish this. Documentation from SAP does show that it intends or desires to have SAP HANA accept unstructured data, but there is no specific information on when that functionality will be readily and generally available.
So where does that leave you? With a database—a really, really fast database that needs a place to live and friends such as hardware, ETL, modeling, and a BI solu-tion. In the end, SAP HANA is what you make of it. Many customers incorrectly equate SAP HANA to a final solution, like an SAP tool or specific functionality. They say, “We’re going to implement SAP HANA reporting,” or “Can you show me SAP HANA?” You can’t implement SAP HANA reporting because it isn’t a reporting tool. And although we can show you an SAP HANA box and the database tables on SAP HANA, it’s like trying to show an Oracle database, which is not really something you can demonstrate. SAP HANA is power. SAP HANA is speed. SAP HANA is an enabler. It’s what you do with your data and information after it’s on SAP HANA that counts. That’s what SAP HANA is all about.
1.2.4 SAP HANA Adoption Drivers
With all of the discussion about what SAP HANA is and how it can be used, the question of what is driving the adoption of SAP HANA might appear to be a simple one. In many ways, it is. Organizations are looking for ways to address needs that they cannot meet today or to speed up what they are doing already. But that is not the whole story.
Essentially, organizations are seeking to make information consumable and acces-sible to everyone, optimized for their specific purpose, at the point of impact, to deliver better decisions and actions. They are looking for solutions that bring together the spectrum of data and information that allow them to get the neces-sary information (acquire), ensure that it is dependable data (govern), run reports and analytics—both defined and ad hoc—against that data, and then act on the insights gleaned from those analyses (Figure 1.8). Organizations are tying this to their overall needs for complete visibility of information, increasing the velocity or speed of that insight, and integrating the concept of information as a strategic asset into their organizational culture.
Personal Copy for RGA Rik Vriens, user id c3b3ffa0-d601-c76a-06ae-b5f2c05f5c4a

42
In-Memory Computing, Big Data, and SAP HANA1
Acquire Act
Alert InvestigateMobility
Social Collaboration
User Centric Design
Govern
Data Quality
Metrics & Measures
Process Integration
Detect
Infer
Report
Cloud
Figure 1.8 Acquire, Govern, Report, Act
Organizations are adopting SAP HANA to enable delivery of these levels of analyt-ics solutions, to speed up the performance of their existing SAP NetWeaver BW systems, and to build standalone or enterprise solutions to address reporting and analytic needs that cannot be addressed by their existing solutions (or require so much data and raw computing power that it is not feasible to get results in a rea-sonable time frame).
Additionally, organizations are adopting SAP HANA as a foundation for their future. Remember, SAP’s vision—and full intent—is that SAP HANA will become the underlying database platform for the SAP ERP environments and other transaction systems. So as organizations look at having to renew their existing database licenses, they are evaluating their long-term plans and making decisions about what platform they want to be investing in. Even though SAP HANA is not yet available for SAP ERP applications, organizations are seeing the long-term roadmap and adopting SAP HANA now to lay the first pieces of that foundation.
1.3 Getting Started with SAP HANA
So—you now understand what in-memory computing is, what big data is, and how SAP HANA can help with both. The next thing you need to understand is your choices when it comes to SAP HANA implementation. To put it as clearly as possible, you have two main options:
© 2013 by Galileo Press Inc., Boston (MA)

43
Getting Started with SAP HANA 1.3
EE Version 1: Standalone SAP HANA This scenario is also known as SAP HANA 1.0 or the enterprise version of SAP HANA. In this version, the organization implements a standalone (new) instance of SAP HANA to address a new reporting or analytic need. An example of this is a reporting solution that today requires thousands of work-hours to construct or requires billions of rows of data—something you never thought your busi-ness intelligence environment could handle.
These standalone installations might address a point or single solution and therefore could add tremendous value to the organization, “simply” by solving this one issue that was either never deemed solvable or would simply not be cost effective to run with all of the manual activity required.
In this case, you need to get the data into SAP HANA via extract, transform, and load (ETL) processes, create the data model (nowhere near as sophisticated or complex as required by SAP NetWeaver BW, but there still is some effort involved), install a BI tool, and create the reports. But we’ll cover more on all that later.
EE Version 2: SAP HANA for BW This scenario is also know as SAP HANA 2.0 or SAP NetWeaver BW powered by SAP HANA. In this version, you are looking to optimize the performance of your existing SAP NetWeaver BW system by replacing your existing database (Oracle, DB2, etc.) with an SAP HANA database.
In this case, you will be leveraging all of your existing investment of time and effort in your SAP NetWeaver BW system and all of the reporting on top of that SAP NetWeaver BW system. There will be some adjustments and decisions you will need to make but, again, we’ll talk more about that later.
SAP HANA RDS
At the risk of complicating the matter, there is a third option: SAP HANA RDS (Rapid Deployment Solutions). So that we could focus on the fundamentals of SAP HANA in this book, we don’t spend a significant amount of time discussing SAP HANA RDS solutions—but we do provide some additional information on the subject in Appendices A and B.
With all of these considerations and aspects to consider, most organizations start with some kind of pilot project. Whether it’s called proof of concept, pilot, or prototype, it’s essentially a smaller effort that puts your envisioned SAP HANA-based solution through its paces. The goal of these efforts is to assess the SAP
Personal Copy for RGA Rik Vriens, user id c3b3ffa0-d601-c76a-06ae-b5f2c05f5c4a

44
In-Memory Computing, Big Data, and SAP HANA1
HANA-enabled solution’s capability to meet the specific goals and objectives that your organization needs addressed. You are typically assessing some or all of the following types of capabilities and functions:
EE Speed of data loading.
EE Ease of data transformation.
EE Level of data transformation possibilities (if not using SAP NetWeaver BW).
EE Ease of loading non-SAP data.
EE Ease of defining SAP ERP data directly into SAP HANA (if not using SAP NetWeaver BW).
EE Data modeling requirements and capabilities.
EE Improvement of data loading over traditional SAP NetWeaver BW data loading (if applicable).
EE SAP NetWeaver BW data model (cubes, DSOs, etc.) changes required to get optimal performance with SAP HANA.
EE Ability to “flatten” the SAP NetWeaver BW data model (drop all those redundant or logically partitioned cubes you had to create for performance reasons).
EE Ability to drop SAP NetWeaver BW aggregates.
EE Ability to leverage existing reports already built on SAP NetWeaver BW.
EE Effort to install and integrate new BI tools (if required for standalone SAP HANA).
EE Ability to leverage the full suite of BI capabilities for an integrated tool.
EE User administration and security.
EE Ad hoc performance capabilities and response times.
EE Formatted reporting capabilities and response times.
EE SAP HANA administration requirements—measured against the skills of your resources.
EE SAP HANA disaster recovery.
EE SAP HANA back-up.
EE SAP HANA uptime availability.
EE SAP HANA scale out options.
EE SAP HANA scale up options.
© 2013 by Galileo Press Inc., Boston (MA)

45
Getting Started with SAP HANA 1.3
Although this isn’t an exhaustive list of the things your organization will want to assess and consider, look at it as something to stir the thought process. Remember that SAP HANA is not a solution; it is, at its heart, a fast database that can hold a lot of information. What you are setting up on your roadmap is really what you will be doing when you harness the power of SAP HANA, so these first smaller projects are to assess the tool’s readiness to support your overall goals and objectives.
After your successful early efforts, you then proceed with rolling out your SAP HANA-based solution. How you do this will depend entirely on which option you are choosing with SAP HANA. If you want to make SAP HANA your new SAP NetWeaver BW database—you can’t convert just part of it—you are all in. So your roadmap will be to either do a full rip-and-replace database effort for your SAP NetWeaver BW system, or install a fresh SAP NetWeaver BW with an SAP HANA database and then build that out solution by solution. The early solutions will be those that most need the performance that SAP HANA can offer.
If you are looking at a standalone installation of SAP HANA, then you need to determine which ETL capabilities or tools you will be using—which will determine if you can use the real-time capabilities—and where the data will be coming from. You will need to identify the data tables, as well as determine the modeling that needs to occur, any transformations, which BI tool you will be using, and so on. This allows you to dip your toe in the SAP HANA-waters and start with something small—a single use case or point solution—and then build on it from there.
Whatever your decision, you will likely need some advice. In addition to the rest of the information contained in this book, you can pursue many avenues when looking for SAP HANA support, including full-service SAP Implementation Partners, the SAP Professional Services Organization, and independent contractors. Be realistic, however, when you put your support requirements out there. If you say that you’ll only accept consultants who have three years of SAP HANA experience with 10 or more go-lives, you are not going to find anyone to fit the bill. SAP HANA has just not been around that long and doesn’t have the thousands of live implementations (yet) to justify those high numbers.
Personal Copy for RGA Rik Vriens, user id c3b3ffa0-d601-c76a-06ae-b5f2c05f5c4a

46
In-Memory Computing, Big Data, and SAP HANA1
1.4 Summary
You should now be armed with questions that you didn’t know to ask before, along with a stronger baseline understanding of what SAP HANA is—and isn’t—and how it might fit into your organization’s needs.
As we continue, we’ll look at all of these topics in more detail so that by the end of this book, you will know the information that will allow you to fully assess SAP HANA and its implications for your organization.
© 2013 by Galileo Press Inc., Boston (MA)

47
Now that you know what SAP HANA is and how it might fit into your business, it’s time to understand more about the options available to you.
2 SAP HANA Versions
In this chapter, we’ll give you more details about the two main flavors of SAP HANA: the standalone version, and the version that runs on top of SAP NetWeaver Business Warehouse (BW). Specifically, we’ll offer a discussion of the technical differences between the two versions, and also talk about their different requirements and high-level project plan steps.
2.1 SAP HANA Standalone Version
The standalone version of SAP HANA (also known as the enterprise version and as SAP HANA 1.0) does not involve SAP NetWeaver BW. In the first chapter, we described SAP HANA as fundamentally a database and an enabler of solutions. In this version of the product, though, SAP HANA becomes more of an “appliance” solution, because you have to look at the entire set of components all at once. You need to look at hardware, the SAP HANA database, the specific software compo-nents that you’ll be required to implement, the modeling studio, the BI tools, and administration of SAP HANA.
Although the standalone SAP HANA version is called an “appliance” solution, keep in mind that this is not one fully contained plug and play solution. SAP HANA is not plug and play in any scenario and certainly not in the standalone version. When you purchase standalone SAP HANA, you get the following:
EE SAP In-Memory Computing Studio
EE SAP Host Agent 7.2
EE SAPCAR 7.10
EE Sybase Replication Server 15
Personal Copy for RGA Rik Vriens, user id c3b3ffa0-d601-c76a-06ae-b5f2c05f5c4a

48
SAP HANA Versions2
EE SAP HANA Load Controller 1.00
EE SAP Landscape Transformation 1—SHC for ABA
You can’t implement this set of technology as is because you still need hardware, a BI tool or the intention to access data via Microsoft Excel, and a data integration tool. There is no requirement that the source systems (the systems where the data comes from) for your SAP HANA databases be SAP environments, but the implica-tions of your choice of source systems will determine which data loading tool you can work with and your options for those tools.
Next, we’ll discuss both the technical and skills requirements for a company imple-menting the standalone version of SAP HANA. We’ll conclude the section with a high-level overview of what a project plan would involve.
2.1.1 Technical Requirements
In many ways, the standalone version of SAP HANA requires the same components that SAP HANA for BW would require, but with this version, you have to build everything from scratch. The necessary architecture is displayed visually in Figure 2.1.
ABAP
SAP Business Suite Non-SAP
SAP HANA
SAP CrystalReports
SAP CrystalReports
WebIntelligence
WebIntelligence
Dashboards
Dashboards
MOBI
MOBI
Explorer
BusinessObjects CommonSemantic Layer
SAP NetWeaverBW
BWA
Replication/ETL
BusinessObjects Common Semantic Layer
Figure 2.1 Standalone Version of SAP HANA: Architecture
© 2013 by Galileo Press Inc., Boston (MA)
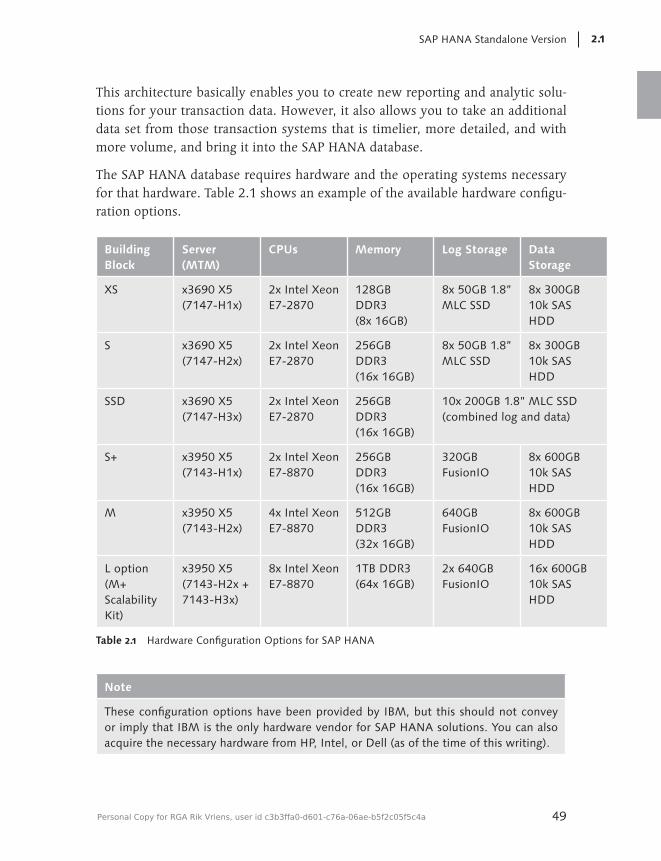
49
SAP HANA Standalone Version 2.1
This architecture basically enables you to create new reporting and analytic solu-tions for your transaction data. However, it also allows you to take an additional data set from those transaction systems that is timelier, more detailed, and with more volume, and bring it into the SAP HANA database.
The SAP HANA database requires hardware and the operating systems necessary for that hardware. Table 2.1 shows an example of the available hardware configu-ration options.
Building Block
Server (MTM)
CPUs Memory Log Storage Data Storage
XS x3690 X5 (7147-H1x)
2x Intel Xeon E7-2870
128GB DDR3 (8x 16GB)
8x 50GB 1.8” MLC SSD
8x 300GB 10k SAS HDD
S x3690 X5 (7147-H2x)
2x Intel Xeon E7-2870
256GB DDR3 (16x 16GB)
8x 50GB 1.8” MLC SSD
8x 300GB 10k SAS HDD
SSD x3690 X5 (7147-H3x)
2x Intel Xeon E7-2870
256GB DDR3 (16x 16GB)
10x 200GB 1.8” MLC SSD (combined log and data)
S+ x3950 X5 (7143-H1x)
2x Intel Xeon E7-8870
256GB DDR3 (16x 16GB)
320GB FusionIO
8x 600GB 10k SAS HDD
M x3950 X5 (7143-H2x)
4x Intel Xeon E7-8870
512GB DDR3 (32x 16GB)
640GB FusionIO
8x 600GB 10k SAS HDD
L option (M+ Scalability Kit)
x3950 X5 (7143-H2x + 7143-H3x)
8x Intel Xeon E7-8870
1TB DDR3 (64x 16GB)
2x 640GB FusionIO
16x 600GB 10k SAS HDD
Table 2.1 Hardware Configuration Options for SAP HANA
Note
These configuration options have been provided by IBM, but this should not convey or imply that IBM is the only hardware vendor for SAP HANA solutions. You can also acquire the necessary hardware from HP, Intel, or Dell (as of the time of this writing).
Personal Copy for RGA Rik Vriens, user id c3b3ffa0-d601-c76a-06ae-b5f2c05f5c4a

50
SAP HANA Versions2
With the hardware, you also have to acquire or develop the necessary operational support to cover things such as disaster recovery, high availability preparation, SAP HANA system administration support, rack and stack of the SAP HANA box itself, and so on.
You’ll also, of course, have to get the necessary information into SAP HANA in the first place. We’ll go into the technical details of this in Chapter 10, but to give you a brief overview: You’ll primarily use the SAP Landscape Transformation (SLT) tool for loading SAP ERP data, although as of the SP04 version of the tool, you can also use it for non-SAP data. (You won’t get the same real-time data loading that you can get from SAP ERP data, but you can get near real time if you configure it appropriately.) Your other choice for loading non-SAP or non-BW data is to use SAP Data Services. This is the ETL tool that came into the fold when SAP acquired Business Objects. Data Services will allow you to get at data sets from non-SAP and non-BW environments and bring them into your SAP HANA environment. You will again not get the real-time data movement that you can get from the SAP ERP system, but you can get to near real time by configuring it appropriately.
You’ll also need to purchase, install, and implement a BI tool. Remember—don’t confuse SAP HANA with a BI tool. SAP HANA is a database for BI tools. The easiest tool to integrate into your SAP HANA-based solution is the SAP Business Objects suite of tools—because it’s part of SAP. These tools will allow the connection through the native SAP integration BI Consumer Services (BICS) tools. Also remember that there is an access point for data to be brought into Microsoft Excel.
If you are wondering about non-SAP and non-Microsoft Excel BI tools from other vendors (such as Cognos, QlikView, or WebFocus): As of this writing, no other BI tools are certified interfaces to an SAP HANA-enabled solution. SAP has publicly committed, however, that they will begin certifying non-SAP BI tools against SAP HANA-enabled environments. They made these commitments in public addresses during SAPPHIRE Orlando 2012. Which tools will be certified when remains to be seen.
Many businesses have asked whether it’s possible to use non-certified BI tools. Opinions vary on this subject. Objectively, there are access points into SAP HANA for Excel and MDX/SQL, which implies that there are ways to get data out of SAP HANA and into other tools. However, what you need to test is whether or not you’ll get the benefits and capabilities of SAP HANA—the power and the speed—if you are accessing the data via these other connectors and not via the native SAP interface points.
© 2013 by Galileo Press Inc., Boston (MA)

51
SAP HANA Standalone Version 2.1
Now, there are creative and curious customers (and consultants) who are testing non-SAP BI tools against SAP HANA. Anecdotal evidence will show various degrees of success with these tools, and the Internet is likely full of blogs and comments about these ventures. What can be said with certainty is that, as of this writing, the only certified BI tools against an SAP HANA-enabled environment are the SAP Business Objects tools. Other certified tools are coming, but which ones, when they will be available, and how seamlessly they will work is unknown at this time.
2.1.2 Skills Requirements
Whether your existing hardware administrators and Basis team can assume SAP HANA activities or whether you need an entire full-time employee (FTE) depends on several factors, but you do have options. There are a host of skills you need depending on the size and scope of your implementation (Figure 2.2).
Note
Please see Chapter 4 for additional information on the individual job roles in an SAP HANA implementation.
� Data design
� Data modeling
� Data governance
� Enterprise architecture
� SQL
� Mobility
� SAP Data Services
� Core SAP application knowledge
� SLT
� Sizing
� Installation
� Operations
� Application maintenance
� Disaster recovery
� Strategy and transformation/ domain knowledge
� Use case analysis and definition
� Analytics application development (SAP BusinessObjects, etc.)
Infrastructureand Operations
EnterpriseInformation
ManagementDevelopment
BusinessAnalysts
Figure 2.2 SAP HANA Standalone Version: Skills Requirements
Personal Copy for RGA Rik Vriens, user id c3b3ffa0-d601-c76a-06ae-b5f2c05f5c4a

52
SAP HANA Versions2
Let’s look at each category listed for the types of skills that you’ll need and how they come into play for a standalone implementation.
Infrastructure and Operations
First, you’ll need what you traditionally think of as administration skills, which cover your infrastructure and operations needs and the “rack and stack” of the SAP HANA box itself. You need someone to install the SAP HANA software and the operating and file systems on the SAP HANA box. You can likely negotiate to include these services with the hardware vendor from whom you purchase the SAP HANA box.
You’ll also need to arrange and manage the remote function call (RFC) connections to the source system(s) and the BI tool(s). You need someone to look at disaster recovery, set up for high availability, and provide overall application maintenance. In this category, you should include someone to set up and manage user access and account as well as security and authorizations.
If you’re looking at enabling these solutions for mobile applications, you’ll also need people who understand mobile applications and architecture. Advanced use cases for SAP HANA look at leveraging its power and data accessibility and bring-ing it into mobile-enabled solutions.
Business Analysts
Your business analysts will be determining the base use case and business need that drive the SAP HANA implementation. They will identify the reporting or analytic need(s) that are not currently addressed or that take up so much time and effort that they are unmanageable in their current state.
Your use cases will likely initially be driven by your business analysts, or, if IT is trying to drive this solution, then the use cases will have to be verified and fully mapped out with the business analysts and users. The business analysts will iden-tify the following:
EE Source systems
EE Data needs
EE Data transformation
EE Data relationships
EE Calculations
© 2013 by Galileo Press Inc., Boston (MA)

53
SAP HANA Standalone Version 2.1
EE Key performance indicators (KPIs)
EE Reports
EE Presentation layer
EE Security and user access
Your business analysts will also drive the transformational opportunities that will be identified now that you have this in-memory solution in place. Transformational opportunities are completely new insights and perspectives into your business; that is, they are answers to the kinds of questions that previously you couldn’t even think of asking your IT department or data warehousing team—because the technology was just not ready to answer them.
The business analysts will also drive the final visualization of the solution; that is, what the user experience needs to be. Is this a dashboard? What are the measures and metrics to be shown? What is the level of drill-down and supporting detail required?
If they are super users—i.e., they traditionally do their own data manipulation—you may also be required to get this community trained on the modeling tools of SAP HANA. If they chafed at other data modeling tools because they couldn’t define their own left outer joins, for example, then they might need to be trained on SAP HANA. Of course, if they don’t know what a left outer join is versus a data union, then you may not want to train them on the modeling capabilities and just focus on the reporting aspects.
You’ll also likely want to train this user audience on the BI tools you’ll be attaching to the SAP HANA environment. You’ll likely develop an initial set of reports as part of the core implementation, but the true power of this solution will be in enabling the on-demand analytics that this audience will need.
Enterprise Information Management
You’ll also need enterprise information management (EIM) skills for getting data into SAP HANA—traditionally referred to as ETL (extract, transform, and load) skills. You have a few options for how to do this.
The first is using the SAP Landscape Transformation (SLT) Replication Server. The SLT is the engine that will move your data from the transaction systems into the SAP HANA database. If you are planning to extract SAP ERP transactional data
Personal Copy for RGA Rik Vriens, user id c3b3ffa0-d601-c76a-06ae-b5f2c05f5c4a

54
SAP HANA Versions2
into SAP HANA, SLT capabilities will give you that real-time or near real-time data visibility. But (as of this writing) the SLT will only work for SAP ERP transaction system data—unless you are on SP04, in which case you can use it for non-SAP data as well.
If you are using SLT, you’ll need people to identify the data tables and fields within the SAP transaction system—which may require the skills of your core SAP ERP developers and configuration experts. They will then configure the source system for the RFC connection to SAP HANA and make sure the data has a place to go within the SAP HANA system when it arrives over there. If you are not using the SLT capabilities because you are bringing in non-SAP data, you’ll likely be using a traditional ETL approach and a tool such as SAP Data Services. (For more techni-cal information about these different data provisioning options, see Chapter 10.)
In either case, you’ll need the services and skills of a data architect to make sure that you have a full understanding of all of the data, data sources, data fields, and overall enterprise data structure that you want to bring into SAP HANA. Your data architect will be working closely with an overall SAP HANA architect. This SAP HANA architect will be looking at the big picture of the entire solution that will be SAP HANA-enabled and developed. Don’t forget that SAP HANA is a database, so while you’re putting the data in memory, you still need a level of structure that requires modeling. Although not to the same degree as a persistent data model (such as in SAP NetWeaver BW), you do need to do some work here. Your SAP HANA architect will be able to take in all of the aspects of the use case, including what future uses might be, and help build out the right solution for you. Your SAP HANA architect should also be involved in any aspects of ETL design and overall data design.
Development
You’ll then need a BI developer who is highly skilled in whichever BI tool you have attached to your SAP HANA system. This person will be building the user experi-ence and interfaces for your general user community. This person will be working closely with the mobile architects to make sure there are appropriate versions and levels of information for your mobile user community. Just because you can query a billion rows in a subsecond doesn’t mean you want to be deploying reports with a billion—or even a million—rows to someone’s iPad! You do need to look at the user experience and integrate that into the overall solution. You must align what
© 2013 by Galileo Press Inc., Boston (MA)

55
SAP HANA Standalone Version 2.1
you can do with what you should do and then finally decide what you will do when it comes to SAP HANA-enabled solutions.
All of this may sound intimidating, but it shouldn’t be. You would bring all of these skills into the design and development of a traditional data warehouse and BI solu-tion; that is, a non-SAP solution. If you have a (non-SAP) traditional enterprise data warehouse in your organization, you likely have many of these core skills within your organization already. However, realize that your traditional enterprise data warehouse (EDW) people will understand the concepts that need to be designed and deployed but will not understand the technology that SAP HANA employs, and likely will not have practical experience in designing and building an in-memory solution. So, although you’ll have some of what you need from within your SAP and EDW teams, you’ll need to get those folks trained in how to transition those skills into this technology. A paradigm shift will also have to take place concerning what a BI solution should deliver and how to design the data model when the data is not in a persistent model but in memory only.
2.1.3 Project Plan Steps
At a very high level, the steps in building a standalone version of SAP HANA are as follows:
1. Work with your hardware vendor to determine the amount of hardware you need, and, of course, work with SAP to secure the appropriate licenses for SAP HANA.
2. Determine which BI tool you will implement, and then secure licenses for that solution.
3. Your infrastructure and operations team conducts the installation of the software and build, and then tests that the necessary RFC connections are in place. The infrastructure and operations team begins working on setting up the appropriate operational support processes for disaster recovery, high availability, and so on.
4. Identify the necessary data feeds and their corresponding source systems. Work with the business analysts to identify the necessary data and supporting trans-formations necessary. Use the SLT connection for each source system—if you are on a compatible version of SAP HANA—or use SAP Landscape Transforma-tion (SLT) for the SAP ERP data and SAP Data Services for the non-SAP data. (For more technical information about data provisioning for SAP HANA, see Chapter 10.)
Personal Copy for RGA Rik Vriens, user id c3b3ffa0-d601-c76a-06ae-b5f2c05f5c4a

56
SAP HANA Versions2
5. Work with your data modelers to build the appropriate data model using the SAP HANA tools, and work with your extract, transform, and load (ETL) devel-opers to match the ETL requirements to the necessary data model and transfor-mation requirements. (For more technical information about data modeling, see Chapters 7 and 8.)
6. Work with the business analysts and the overall user community to determine what the user experience and interface should look like. Start working with your report developers to build the required BI interface—making sure that your reports cascade (allow for drill-down) as required.
7. Your support team builds the appropriate user accounts and profiles and assigns security and authorizations.
8. After everything is tested and good to go, release the solution to users.
Obviously, this is a simplified version, and reality is not that simple. But these are the high-level, basic steps that are involved in deploying an SAP HANA standalone solution. To put the development cycle into terms and a flow that SAP folks are used to, Table 2.2 shows the phases of a typical project and some key activities from lessons learned with early adopters of SAP HANA solutions.
Strategize Design Build Run
EE How will SAP HANA deliver the proposed value? Identify corresponding uses cases, KPIs, and calculations.
EE Make sure that the use case and analytics strategy are compatible.
EE What role will an SAP HANA adoption play? What are the potential impacts?
EE Select and understand the SAP ERP table you need.
EE Do you need to address any master data issues?
EE Create analysis authorizations to restrict different levels of users.
EE Recreate table relationships in SAP HANA.
EE Model the master data and join conditions.
EE Load SAP ERP tables into SAP HANA.
EE Use a suitable tool such as Microsoft Excel or a web tool to decide how to build above the SAP HANA layer.
EE Design new back-up procedures for in-memory applications and data.
EE Understand how much reload time is required for restoring mission-critical data after failure.
EE Develop business alterative procedures to be run during downtime.
EE Develop high availability and disaster recovery capabilities.
Table 2.2 Project Phases for SAP HANA Standalone Version
© 2013 by Galileo Press Inc., Boston (MA)

57
SAP HANA for SAP NetWeaver BW 2.2
As SAP HANA matures and becomes more commonplace with implementations, there will certainly be a formal ASAP methodology released for SAP HANA. (The ASAP methodology is the traditional implementation methodology for SAP tools that brings together five phases—from pre-project work and requirements gather-ing to building, testing, and releasing the final solution.)
2.2 SAP HANA for SAP NetWeaver BW
SAP HANA for SAP NetWeaver BW is SAP HANA 2.0, and is the first significant step in SAP’s goal of being a major player in the database space and of having its transaction systems running on an SAP HANA database in short order. Running SAP HANA for SAP NetWeaver BW allows you to leverage what SAP has dubbed the massive parallel processing (MPP) capabilities of SAP HANA to query and report against those massive BW cubes and get results in subseconds. Because SAP HANA is much faster than regular relational databases such as Oracle or Microsoft SQL Server, the data warehouse performs much faster, and therefore your reports will run much faster.
This version of SAP HANA is really the beginning of where SAP is moving in its long-term direction: using SAP HANA as the underlying database for existing solutions. By putting SAP HANA in your SAP NetWeaver BW environment, you are actually removing the Oracle or DB2 database that you’ve been using all these years. In this scenario, you don’t have to design everything from scratch, as you do with the standalone version of SAP HANA. Instead, you simply replace your existing database with SAP HANA.
In addition to migrating your SAP NetWeaver BW system to SAP HANA, there are two additional options for running SAP HANA for BW:
EE Set up a new SAP NetWeaver BW system (with an SAP HANA database) along-side your existing BW system and use that new SAP NetWeaver BW environment for particularly challenging or new requirements. This is known as a side-by-side or sidecar installation. This allows you to keep your standard reporting that is running fine as is and not have to change everything over. You can design new solutions in the new SAP NetWeaver BW system and move other things over as you have the time, budget, or need.
Personal Copy for RGA Rik Vriens, user id c3b3ffa0-d601-c76a-06ae-b5f2c05f5c4a

58
SAP HANA Versions2
EE Implement an SAP NetWeaver BW system for the first time, and then run SAP HANA for it. This offers all the advantages of SAP NetWeaver BW without the less-than-elegant data modeling that has been required in the past to address performance with larger SAP NetWeaver BW solutions.
As we did with the standalone version of SAP HANA, let’s now take a look at the technical and skills requirement for an installation of SAP HANA for BW. As before, we’ll conclude with a high-level overview of what a project plan would look like.
SAP NetWeaver BW Accelerator (BWA)
Wondering what an implementation of SAP HANA on top of SAP NetWeaver BW means for BWA? We’ll get to that in Chapter 4, when we talk about how SAP HANA impacts your business strategy.
2.2.1 Technical Requirements
The implementation architecture of SAP HANA for BW is shown in Figure 2.3.
ABAP
SAP Business Suite Non-SAP
SAP HANA
SAP CrystalReports
WebI
BusinessObjects CommonSemantic Layer
SAP NetWeaverBW
WebIntelligence
Dashboards
MOBI
Figure 2.3 SAP HANA for SAP NetWeaver BW: Architecture
How does this differ from the standalone version of SAP HANA? In this scenario, you see that SAP HANA is now directly attached to SAP NetWeaver BW. What this actually means is that SAP HANA is your database, not a separate instance. You
© 2013 by Galileo Press Inc., Boston (MA)

59
SAP HANA for SAP NetWeaver BW 2.2
aren’t required to build new ETL layers or design a data model from scratch. You can use your existing BW models and structures.
Those are all good things, but there’s one big catch: there are version requirements for this level of SAP HANA. Because you are using SAP HANA as a database for your SAP NetWeaver BW system, that BW system must be at a certain version and level. Your SAP Business Objects BI system must also be at a certain version and level. As of this writing, you must be on SAP NetWeaver BW 7.3 (Unicode) with SAP Business Objects 4.0 (if you are using the SAP Business Objects toolset). The first thing you need to determine when assessing how quickly, easily, and at what cost you can implement SAP HANA for BW is whether you need a system upgrade first.
The next thing you need to look at is your hardware for your existing SAP NetWeaver BW system. It must be compatible with your new SAP HANA database. As with the standalone version of SAP HANA, you’ll need hardware that can handle the needs and power of the SAP HANA database. The following components are in play:
EE Server SAP HANA runs on SUSE Linux Enterprise Server (SLES) 11 SP1 (as of this writ-ing). These are big rack-mount systems that take up to 8 CPUs and 80 cores. You can also basically “stack” these on top of each other for your scale-out options. You can purchase this software on the Internet from the big vendors, but you may also be able to negotiate a deal with your regular hardware partner. There are showcase systems that are 100TBs.
EE RAM Lots of RAM is required and should be matched to the CPUs. Twenty cores allow 256GB RAM, leading to a maximum of 1TB of RAM with current CPUs.
EE Log storage The trick to a quick recovery of an SAP HANA system that goes down—due to power loss, for example—is the ability to quickly restore via the logs.
EE Data storage The requirement for data storage is 4x RAM. On all of the certified single-node configurations, this is cheap SAS direct storage. You need this so you can power down the appliance and do things like backups. For multi-node configurations, some form of shared storage is required, either a SAN or local storage replicated using IBM’s GPFS (General Parallel File System) type of solution.
Personal Copy for RGA Rik Vriens, user id c3b3ffa0-d601-c76a-06ae-b5f2c05f5c4a

60
SAP HANA Versions2
So when you’re looking at the hardware side of implementation costs and planning, you need to determine if your existing hardware will meet the preceding require-ments. You’ll also have to make sure your hardware is compatible with the server versions that SAP HANA requires, which means you might have to look at a new series of hardware. If that is the case, the good news is that you’ll need much less hardware than your current solution requires because of the compression ratios. Your hardware vendor can help you decide how much of your existing hardware can be leveraged for this new solution. You’ll also need to plan for racking and stacking the box, just like with the standalone version of SAP HANA. On average, this will take a couple days when you factor in knowledge transfer to your exist-ing support team.
After you have SAP HANA as your database, you’ll likely want to change a few things about your SAP NetWeaver BW system. You should first get rid of all of the aggregates on your cubes. Why would you do this when aggregates have been a necessary evil all along? Aggregates on a traditional, non-SAP HANA BW system were about pre-calculating certain results so you would not have to spend the time during query and report processing to compile and calculate those results. Aggre-gates dealt with bad performance—or at least slow performance—particularly when your BW cubes and data sets started to get very large. After you convert your SAP NetWeaver BW to an SAP HANA database, you’ll no longer need those aggregates to pre-calculate and make accommodations for system performance. As far as SAP HANA is concerned, aggregates are completely unnecessary overhead and add no value whatsoever. Getting rid of aggregates will also improve your data loading because you don’t have to roll up everything to aggregates anymore!
Finally, you may wonder what you need to do with your BW cubes after you implement SAP HANA. You don’t have to do much, but you do need to convert your BW cubes to SAP HANA cubes. This simple process allows the cubes to be stretched across the SAP HANA database in the new columnar format, which also reduces some of the overall size of the cubes themselves. (For more information about SAP HANA-optimized cubes, see Chapter 5.)
2.2.2 Skills Requirements
For the additional skills and components that come into play when looking at SAP HANA for BW, see Figure 2.4. The skills required for SAP HANA for SAP NetWeaver BW similar; however, there are a couple of new and different things worth discussing.
© 2013 by Galileo Press Inc., Boston (MA)

61
SAP HANA for SAP NetWeaver BW 2.2
Note
Please see Chapter 4 for more specific information on the individual job roles in an SAP HANA implementation.
� Data design
� Data modeling
� Data governance
� Enterprise architecture
� SQL
� Mobility
� SAP Data Services
� Core SAP application knowledge
� SAP NetWeaver BW configuration
� SAP NetWeaver BW process chains
� Sizing
� Installation
� Operations
� Application maintenance
� Disaster recovery
� Database migration
� Strategy and transformation/ domain knowledge
� Use case analysis and definition
� Analytics application development (SAP BusinessObjects, etc.)
Infrastructureand Operations
EnterpriseInformation
ManagementDevelopment
BusinessAnalysts
Figure 2.4 SAP HANA for BW: Skills Requirements
Infrastructure and Operations
The first major new or different skill is that your team—or your implementation partner—needs to be skilled in performing database migrations. Your existing SAP NetWeaver BW database must be migrated from its existing Oracle or DB2 over to the new SAP HANA database. You’ll want to bring experienced resources to the team for this activity, although this may not be something that you need to specifi-cally get your own people trained in. After all, how many times are you going to perform this conversion that you need the skills in house?
Personal Copy for RGA Rik Vriens, user id c3b3ffa0-d601-c76a-06ae-b5f2c05f5c4a

62
SAP HANA Versions2
You’ll also need all of the key operations supported for your new SAP NetWeaver BW system as you do for your existing SAP NetWeaver BW system. This time, however, your system administrators need to know how to manage the SAP HANA database. Your Basis team needs to know how to manage a BW disaster recovery with an SAP HANA environment involved, including how to restore the system. The team needs to know their options for scaling the environment up and out as the system grows. The team will need to know how to troubleshoot the different data-loading capabilities and keep those RFC connections up and running.
The good news for this team is that they can leverage all of their existing skills for general Basis management of the activities of the system. User management is still all contained within the SAP NetWeaver BW framework. User security and autho-rizations are still the same and are done in the SAP NetWeaver BW system itself.
Business Analysts
Your business analysts are likely already involved in the design and usage of your existing SAP NetWeaver BW solution. If they aren’t, they should be. As with the standalone environment, the business analysts define and drive the requirements, assess the solution fit to the business needs, and drive innovation and change. They are looking at the transformational opportunities that this newly powered up solution can offer to them and to the organization as a whole.
If you are looking at SAP NetWeaver BW for the first time and will be using the SAP HANA for BW version, then it’s crucially important that you involve your business analysts and super user or power user communities to identify and gather all of the appropriate requirements. If you try to implement SAP HANA for BW simply as an IT toolset, you won’t be doing your organization any service—remember, the power of SAP HANA for BW is in satisfying business requirements. Your business analysts will know exactly what is really going on within the business when it comes to the necessary steps to gather, transform, and compile the massive amounts of data necessary for their complex reporting and analytic solutions.
Enterprise Information Management
The enterprise information model and data components make up a huge com-ponent in an SAP HANA for BW environment, as with any SAP NetWeaver BW system. You are (potentially) bringing data into your SAP NetWeaver BW system from any number of sources, and the secret to success (although it shouldn’t be a
© 2013 by Galileo Press Inc., Boston (MA)

63
SAP HANA for SAP NetWeaver BW 2.2
secret!) is making sure it all marries up and makes sense after it gets in there. Your EIM team needs to know the questions to ask and the answers to agree on when it comes to data:
EE What data is coming in?
EE How clean is that data?
EE Is your data harmonized?
EE Are the key data structures aligned?
EE Will you bump into data inconsistencies with things like order numbers, cus-tomer numbers, and so on?
EE What is the governance plan to keep data clean?
EE Who is allowed to create new measures, metrics, calculations, and KPIs?
All of this thought process needs to go into your solution, just as it does when designing a traditional SAP NetWeaver BW system. This becomes all the more important when you are building this for SAP HANA for BW, because you are now going to be bringing in billions of rows of data instead of “merely” millions of rows of data. More data means more opportunity for insight, but it also means more opportunity for error, confusion, and contradictions.
Development
For SAP HANA for BW, you’ll conceptually need the same skills that you always need with SAP NetWeaver BW. You need people who understand the data sources, how to get the data into SAP NetWeaver BW, manage it after it’s in SAP NetWeaver BW, model the data, and organize it effectively. You need people to create and build the queries and calculations and ultimately the reports and user experience on the interface.
One thing that will be a bit different for SAP HANA for BW—or one opportunity for things to be different with SAP HANA for BW—is that you can change your data model. You can flatten it out. Make sure that you have developers who can handle this process.
Basically, if you are looking at SAP NetWeaver BW for the first time and plan to be using SAP HANA, or if you will be building that second instance of SAP NetWeaver BW for specific solutions, then your developers need to be able to look at the data modeling requirements and skills quite differently from the “traditional” SAP
Personal Copy for RGA Rik Vriens, user id c3b3ffa0-d601-c76a-06ae-b5f2c05f5c4a

64
SAP HANA Versions2
NetWeaver BW modeling skills. Because they are using SAP HANA as the database, they will be able to design a thinner and leaner data model.
2.2.3 Project Plan Steps
At a very high level, the steps in building a standalone version of SAP HANA are as follows (you’ll see that in some ways they are the same high-level steps as if you were installing a standalone SAP HANA system):
1. Work with your hardware vendor to determine if your existing hardware will be usable for an SAP HANA database, and, of course, work with SAP to secure the appropriate licenses for SAP HANA:
EE Work with your hardware partners and SAP to estimate your compressed database size to determine the amount of hardware necessary.
EE Secure new hardware if necessary.
EE If appropriate, look at your BWA hardware for reworking, or find alternate uses. (For more on BWA, see Chapter 4.)
2. Check your SAP NetWeaver BW and SAP Business Objects versions to make sure they are at the appropriate levels required for SAP HANA. Upgrade if necessary.
3. Migrate the SAP NetWeaver BW database to SAP HANA.
4. Check your data sources and connections. Look to see what you might be able to migrate to SLT connections (remembering that the Business Content data sources have not all been converted yet).
5. If you are planning to extend your solution with any additional data—from SAP or non-SAP sources—you’ll want to look at the mechanism to bring it in: SLT, SAP Data Services, and so on.
6. Work with your data modelers to make the basic necessary adjustments to your BW data model; at a minimum, remove aggregates. Work with your ETL devel-opers to match the ETL requirements to the necessary data model and trans-formation requirements (e.g., for process chains).
7. Start looking at opportunities to flatten out your existing BW model. This is not necessary at this time unless you have factored in a certain amount of reduced data redundancy into your compression or want to truly ramp up your solution to the max.
© 2013 by Galileo Press Inc., Boston (MA)
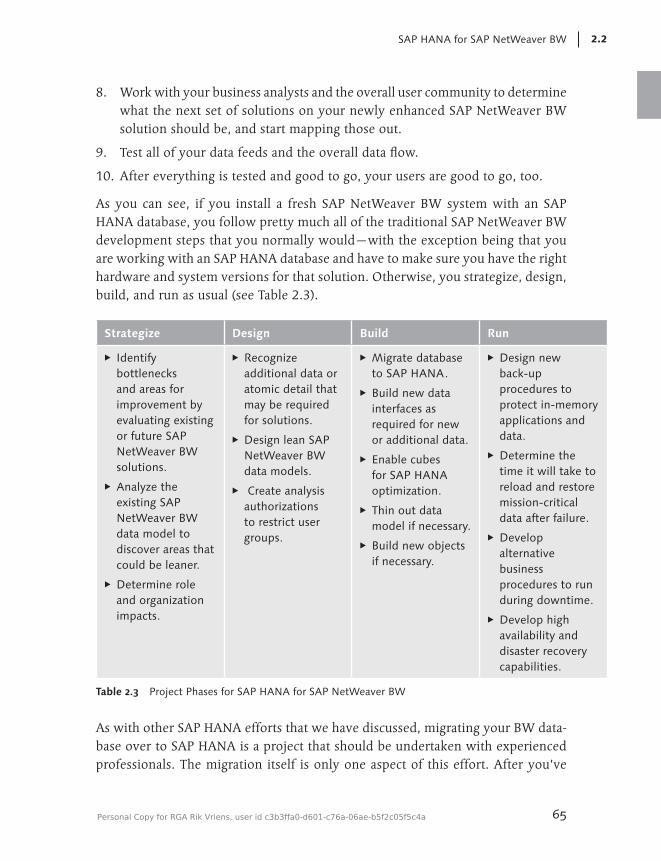
65
SAP HANA for SAP NetWeaver BW 2.2
8. Work with your business analysts and the overall user community to determine what the next set of solutions on your newly enhanced SAP NetWeaver BW solution should be, and start mapping those out.
9. Test all of your data feeds and the overall data flow.
10. After everything is tested and good to go, your users are good to go, too.
As you can see, if you install a fresh SAP NetWeaver BW system with an SAP HANA database, you follow pretty much all of the traditional SAP NetWeaver BW development steps that you normally would—with the exception being that you are working with an SAP HANA database and have to make sure you have the right hardware and system versions for that solution. Otherwise, you strategize, design, build, and run as usual (see Table 2.3).
Strategize Design Build Run
EE Identify bottlenecks and areas for improvement by evaluating existing or future SAP NetWeaver BW solutions.
EE Analyze the existing SAP NetWeaver BW data model to discover areas that could be leaner.
EE Determine role and organization impacts.
EE Recognize additional data or atomic detail that may be required for solutions.
EE Design lean SAP NetWeaver BW data models.
EE Create analysis authorizations to restrict user groups.
EE Migrate database to SAP HANA.
EE Build new data interfaces as required for new or additional data.
EE Enable cubes for SAP HANA optimization.
EE Thin out data model if necessary.
EE Build new objects if necessary.
EE Design new back-up procedures to protect in-memory applications and data.
EE Determine the time it will take to reload and restore mission-critical data after failure.
EE Develop alternative business procedures to run during downtime.
EE Develop high availability and disaster recovery capabilities.
Table 2.3 Project Phases for SAP HANA for SAP NetWeaver BW
As with other SAP HANA efforts that we have discussed, migrating your BW data-base over to SAP HANA is a project that should be undertaken with experienced professionals. The migration itself is only one aspect of this effort. After you’ve
Personal Copy for RGA Rik Vriens, user id c3b3ffa0-d601-c76a-06ae-b5f2c05f5c4a

66
SAP HANA Versions2
migrated the database, you must make sure that you set up everything in SAP NetWeaver BW that is necessary to take advantage (as much as you are ready to, anyway) of the power that is now at your fingertips.
Remember that you don’t have to make any changes to your BW data model or system (other than the migration and setting of the cubes for the SAP HANA capa-bilities) until or unless you are ready. Things like deleting your aggregates can be done when you decide that it’s the right time.
Once you have SAP HANA running on SAP NetWeaver BW, you can start to look at the big data problems that you never before thought you could bring into an SAP NetWeaver BW solution.
2.3 Summary
After reading this chapter, you should now understand your two main options when it comes to selecting a version of SAP HANA, as well as the requirements and basic project plan for each. Before you can really proceed with an SAP HANA strategy, though, you have to know which of these versions to pick. And to do that, you have to understand the different SAP HANA use cases. Don’t worry—we get to that in the next chapter.
© 2013 by Galileo Press Inc., Boston (MA)

67
You now know about the technical differences and requirements of your two main SAP HANA options, but how do you decide which to choose?
3 SAP HANA Use Cases
After you’ve understood your options for SAP HANA, the next step is to decide which you should implement: SAP HANA standalone version or SAP HANA for BW. Although this is a difficult choice with a potentially complex answer, we can break it down into two basic use cases: “do something new” and “do something faster” (Table 3.1).
Standalone Version of SAP HANA: Do Something New
SAP HANA for BW: Do Something Faster
How it works Deploy specific use cases (e.g., profitability analysis, cash management).
Migrate existing relational databases to SAP HANA as the backend to SAP NetWeaver BW.
What it does EE Leverages real-time analytics and streaming data to drive critical business decisions.
EE Provides possible high ROI based on specific use cases.
Provides possible performance improvement for existing SAP NetWeaver BW implementations.
Requirements EE Develop use cases to model process/industry pain points.
EE Development and configuration in SAP Business Objects, SAP HANA, and data design/modeling.
EE Master data governance if multiple source data systems are used.
EE Same requirements as a traditional database migration effort.
EE SAP NetWeaver BW upgrade.
EE Some type of datastore/database will still be required.
Table 3.1 SAP HANA Use Cases
Personal Copy for RGA Rik Vriens, user id c3b3ffa0-d601-c76a-06ae-b5f2c05f5c4a

68
SAP HANA Use Cases3
Standalone Version of SAP HANA: Do Something New
SAP HANA for BW: Do Something Faster
Challenges EE Limited amount of pre-defined content available from SAP (but rapidly evolving).
EE Requires new efforts for operations and disaster/recovery needs.
Limited to performance-related (e.g., speed) improvements. Will still require development of new analytical applications to take advantage of in-memory capabilities.
Logical architecture
Use cases executing on operational data from SAP ERP.
Existing SAP NetWeaver BW cubes and applications.
Table 3.1 SAP HANA Use Cases (Cont.)
In this chapter, we’ll discuss both of these options and offer some insight about what might be right for you.
3.1 Do Something New
If you want to do something new in your organization, then the standalone version of SAP HANA is what you’re looking for. The good news for the standalone ver-sion is that you get to build it from scratch. In other words, you can do something new. The bad news, however…is that you have to build it from scratch. (Unless you are using Rapid Deployment Solutions (RDS), which are pre-built point solutions from SAP. SAP HANA RDS are not a focus of this book, but we offer a bit more information on the subject in Appendices A and B.)
The standalone version of SAP HANA offers you the freedom and flexibility of designing from scratch, which comes with both great opportunity and additional work. You have to design and build how the data gets loaded. You have to design and build the (albeit) limited data model. You have to design and build the users, security, and authorizations. You have to design and build the interface to the busi-ness intelligence (BI) solution (that you must install and implement). You have to design and build the reporting and analytic layer.
Although this might sound daunting, in the end you’ll reap the following:
© 2013 by Galileo Press Inc., Boston (MA)

69
Do Something New 3.1
EE Reporting solutions that you could never before address with your SAP tools.
EE Real-time (or very near real-time) visibility to massive amounts of highly detailed data.
EE Billions of rows of information at your fingertips.
EE Billions of rows of operational level, highly detailed SAP transaction data acces-sible in seconds.
EE Billions and billions of rows of non-SAP data accessible at your fingertips.
EE Reporting or analytic solutions that (today) take a massive amount of computing power or manual data aggregation.
Now we’re talking about something worth all that effort!
Remember that the intent of the standalone version of SAP HANA is to build new large-volume (very large volumes) in-memory databases and then create a corre-sponding data model and set of reporting and analytic capabilities; in other words, build it from scratch. This is the version of SAP HANA that is not dependent on the SAP NetWeaver BW constructs that you may or may not already have in place.
Table 3.2 lists some things to consider when estimating the effort for the standalone version of SAP HANA.
Driver Key Consideration
Use case selection SAP business process?
Non-SAP data need?
Data acquisition ETL tool/process selection and configuration (SLT, Sybase, SAP Data Services?)
Enterprise data warehouse (EDW) impacts
Reengineering of any existing EDW solutions or manual processes?
Access/user interaction
SAP Business Objects (or other BI tool) integration or impacts (universes, dashboards, SAP Business Objects Explorer data, reports)
Data modeling SAP HANA modeling objects (attribute, analytical, and calculation views)
Security SAP HANA security model design
Landscape SAP HANA sizing and landscape install
Operations Disaster recovery, backup, availability
Table 3.2 Key Considerations for the SAP HANA Standalone Version
Personal Copy for RGA Rik Vriens, user id c3b3ffa0-d601-c76a-06ae-b5f2c05f5c4a

70
SAP HANA Use Cases3
As you ask these questions or address these issues, you’ll start to drive out the scope and effort for your SAP HANA implementation and will be able to build a staffing model and timeline for the implementation. Standalone SAP HANA imple-mentations can take from a few weeks to a few months. The setup and installation of the system itself—the empty database—requires only a week or less, including knowledge transfer time to your infrastructure and operations resources. The rest of the effort is in defining and building the solution and supporting components.
An organization can build and test a simple SAP HANA solution in a matter of a few weeks if all of the right pieces are in place at the outset, which means that the data is readily available. In other words, the data is harmonized where required, and the reports and/or analytics are well defined and understood.
A “Simple” SAP HANA Solution
A “simple” SAP HANA solution validates and tests the system performance and overall concepts. This is more a pilot program than a proof of concept. The difference is that a pilot is an actual productionalized solution—albeit a small one or one with a single, highly targeted use case or goal. These solutions can be used to “validate” the SAP HANA capabilities to the organization and the user community and can then be leveraged as a foundation to be built upon.
Of course, if you need a larger, more complex initial SAP HANA project, you can certainly tackle that as well, by planning for a longer project and everything that comes with it. A complex pilot project looking at credit card transactions at a large financial institution, for example, might take three months.
Regardless of whether your project is a small pilot or a large, complex program, you should engage or bring experienced SAP HANA experts to assist or work with your internal team. Although building an SAP HANA solution in many ways mir-rors building a traditional BI solution, this is a new technology with new tools and capabilities for you to work with. Your BI and SAP NetWeaver BW developers will be able to understand the concepts of what needs to happen in general terms, but they will not be familiar with the particular tools that SAP HANA employs or the nuances of the SAP HANA solution.
© 2013 by Galileo Press Inc., Boston (MA)

71
Do Something Faster 3.2
3.2 Do Something Faster
Now that we’ve considered how SAP HANA can be applied to new requirements, let’s discuss how SAP HANA can be applied to existing solutions. Do you already have SAP NetWeaver BW? If so, you want to do something faster. So what is the good news and the bad news about this version of SAP HANA? The good news is that you get to leverage all of the work you’ve already built into your SAP NetWeaver BW solution. You don’t need to do any complex data modeling, which will save the following:
EE Time The process and scope of the data modeling and construction of the data model are dramatically less involved and complex.
EE Space You reduce or eliminate a tremendous amount of redundancy that we all inten-tionally build into our SAP NetWeaver BW system to address performance.
EE Data loading You won’t have to wait for each of the many steps of the process to execute before you have access to and visibility of your data.
The bad news is that you inherit all of the designs you built into your SAP NetWeaver BW solution, which may not always be ideal.
How does the second generation of SAP HANA—SAP HANA for BW—come into play when looking at your mature, advanced, or data-intensive SAP NetWeaver BW reporting requirements? Think back to Figure 1.2 of Chapter 1. What does it show you about what has been traditionally developed within SAP NetWeaver BW solutions and where those solutions are today in the scheme of priorities? Provid-ing those trend and historical reports and analytics was the key capability of SAP NetWeaver BW—bringing together what has happened—but clearly that capability is moving far down the list of desired features. SAP HANA can take what you’ve already built into SAP NetWeaver BW—along with all of that data already in your BW systems—and bring it to bear on new requirements and business needs. SAP HANA can do something faster with your SAP NetWeaver BW systems.
The overall benefits include the following:
EE Report performance Because you are now running on an in-memory database, your database reads
Personal Copy for RGA Rik Vriens, user id c3b3ffa0-d601-c76a-06ae-b5f2c05f5c4a

72
SAP HANA Use Cases3
for queries will be much faster than on your existing Oracle or DB2 systems. Anecdotal results from early adopters show results 10 1,000 times faster for reports.
EE Faster data loads An unexpected benefit of SAP HANA is that your data loads and activation pro-cess will be much faster. Some customers show massive improvements (loads that once took three hours are now running in three minutes).
EE Smaller database Databases converted to SAP HANA compress data on average 4 times; however, some customers have seen results up to 10 times. You’ll gain benefits from not just the compression algorithms, but also by being able to reduce the overall database by removing unnecessary objects from your data model.
EE Reduced cost of development Developers can work much faster in SAP HANA (because there is less to design and build), so they are much more productive, which reduces the cost of devel-opment.
EE Highly detailed data Because SAP HANA can store data at the lowest levels of granularity without the need for aggregation, you can bring over, store, and report on any level of detail or drill into as much detail as you want.
EE Transformational opportunities With the capabilities of SAP HANA and the ability to bring in and report against massive amounts of data, you can take a new view of your SAP NetWeaver BW system as a tool to address large and complex reporting solutions that bring together both SAP and non-SAP data.
EE Agility With the ability to create leaner, crisper data models and get rid of the complex physical modeling required to address performance, you can push out new solu-tions faster.
EE Adoption Many times the barrier to SAP NetWeaver BW adoption centers on the (per-ceived) usability and responsiveness of BW systems. A faster system that has more data will go a long way to bridging those adoption issues, because you’ll be able to be more responsive to the user requirements, providing users with a faster, more effective system.
© 2013 by Galileo Press Inc., Boston (MA)

73
Do Something Faster 3.2
SAP HANA for BW will also give you the opportunity to assess your existing BW data model and identify the (many) opportunities to flatten it out. Think about a traditional SAP NetWeaver BW system and database scenario where you need to bring in five years of highly detailed sales data for a complex analysis of pricing and customer buying trends. With SAP NetWeaver BW, you would have started with (a series of) data store (DSO) objects—those flat tables used to store highly detailed data. You would then aggregate into at least one layer of InfoCubes, but would probably have decided that for performance reasons, you were going to break up that one big cube into five smaller cubes—one for each of the five years of data you are looking at. And then for the current year cube and to accommodate future data, you likely would have partitioned the fact table for additional perfor-mance gains. And, of course, you would have had to put a multi-provider on top of all of those cubes and then build aggregates. You might have even had to build a series of layers of cubes as you aggregated more and more for each level to get to a point where the fact table sizes were reasonable for performance. We’re tired just thinking about it.
With SAP HANA as your database for SAP NetWeaver BW, you don’t have to do all that. You simply bring in all of that detailed data and set up the simple data model that is required. In addition, you have the opportunity to look at your entire BW model and decide what you don’t need any more. What did you build only to address the performance needs of your user communities? For years, we’ve advo-cated that SAP NetWeaver BW could address your reporting needs, that it wasn’t limited by any size constraints, and that it was all in how you modeled the system and what you used for tools (aggregates, pre-calculations, etc.). Now you have the opportunity to challenge that thought process and create a leaner model.
The implication of this, however, is that you have to deconstruct and re-build a great deal of your SAP NetWeaver BW system, so you have to determine if you have the time, budget, and appetite for that. You don’t have to decide to do this all at once or even now. You can make these changes as changes to your require-ments demand, or as you feel like it. But you won’t gain all of the potential speed and performance advantages until you optimize your model.
In its simplest form, SAP HANA for BW is about migrating your existing SAP NetWeaver BW database over to an SAP HANA platform. There are many BW installations out there that have been in place for 10 years or more. These systems are mature in terms of the solutions they offer to their user base, but also in the level of complexity—or creativity—that has been deployed in the designs of these
Personal Copy for RGA Rik Vriens, user id c3b3ffa0-d601-c76a-06ae-b5f2c05f5c4a

74
SAP HANA Use Cases3
systems. Customers who were the really early adopters of SAP NetWeaver BW technology had to get very creative with designing their data models to allow for the amount, volume, and granularity required for their solutions. As these systems have grown and the database has grown along with them, the cubes have, in many cases, reached hundreds of millions of rows each. The standard SAP NetWeaver BW technology struggled with processing a query against hundreds of millions of rows of data in a timely manner. Clients were required to break up the cubes into a series of small(er) cubes that were tied together via MultiProviders. They had to build complex aggregates that added time to data loading and updating. They looked at hardware-based solutions and added SAP NetWeaver BW Accelerators (BWA) to their landscape. All of these approaches helped make large SAP NetWeaver BW systems more accessible and more responsive. But the overhead—for resources, skills, and hardware—can also be onerous.
Existing SAP NetWeaver BW customers can use SAP HANA to take advantage of all of the benefits and leverage the significant investments they have already made in their SAP NetWeaver BW solutions. These customers are looking to take advantage of SAP HANA to run SAP NetWeaver BW faster—run their thousands of BW reports and queries faster—and then start building new and more advanced applications knowing that this new capability will allow them to build faster, leaner solutions. These customers are not looking to build entirely new solutions from scratch. These customers have solutions built that they want to make run smarter and faster.
3.3 Which SAP HANA Version Is Right for You?
So after reading all of this information about which version of SAP HANA can do what, we hope you are you more comfortable than confused. Let’s say it again: The SAP HANA options come down to two choices: you can do something new or you can do something faster. This may seem quite simple in its approach, but this is really all the decision boils down to. Is your goal to enable a faster SAP NetWeaver BW solution, or is it to enable a standalone solution?
Figure 3.1 is an example of how to map out your thought process on this deci-sion and where you might end up. Remember, there is no right or wrong answer here—only the one that makes the most sense for your organization.
Be aware that as you assess these options, there are skills and capabilities that you will need to have either directly within your organization or with consulting skills
© 2013 by Galileo Press Inc., Boston (MA)

75
Which SAP HANA Version Is Right for You? 3.3
that augment your team (Table 3.3). You have to build the plan for either building or securing these skills into your roadmap and plan, because costs are associated with some of these components—either direct costs for services or hardware or costs associated with training and developing skills and people.
Presentation LayerData Replication
and Sourcing Dimension SAP HANA
Standalonesystem
BI Reporting
SAP SLT
SAP DataServices
SAP HANAfor BW
SAP HANA for BW
BI Reporting
SAP HANAStandalone
Solution
SAP DataServices
SAP SLT
SAP systems
Non-SAPsystems
SAP Systems
Non-SAPsystems
Figure 3.1 SAP HANA Solution Decision Map
Hardware Imple-menta-tion
SAP HANA / SLT Architect
SAP Data Services Developer
SAP Net-Weaver BW/SAP HANA Architect
SAP HANA Architect
BI Developer
Transfor-mation
SAP HANA for BW
Required Required N/A Required N/A Required Optional
SAP HANA Stand-alone Version
Required Required Optional N/A Required Required Required
Table 3.3 Requirements for Different SAP HANA Scenarios
Personal Copy for RGA Rik Vriens, user id c3b3ffa0-d601-c76a-06ae-b5f2c05f5c4a

76
SAP HANA Use Cases3
3.3.1 Choosing SAP HANA as a Standalone System
If you are trying to address an issue that has nothing to do with SAP NetWeaver BW, then you are looking at the standalone version of SAP HANA, which you install fresh and build up as you would any traditional data warehouse or BI solution. You design your ETL requirements, your data movements, your data model, your transformations, and your reporting layer. You’ll need to determine the BI tool you are going to use and, of course, set up the user administration and authorizations layers. Remember that this version of SAP HANA can accept any structured data (not just SAP ERP data), but the real-time capabilities are going to be less real time for non-SAP ERP data. Again, you can use the standalone version of SAP HANA even for bringing in SAP ERP data—SAP HANA for BW is not required here.
If you choose the standalone version, the disadvantage is that you lose some of the capabilities associated with SAP NetWeaver BW—such as, for example, Business Content. If you are unfamiliar with the concept of Business Content, this is the name given to the library of pre-delivered SAP NetWeaver BW solutions (data sources, ETL logic, cubes, reports, queries, and more) that is part of the SAP NetWeaver BW licensing scheme. The Business Content repository, available at http://help.sap.com/bicontent/, consists of literally hundreds of pre-defined solutions from SAP that customers can leverage in part or in whole. In other words, you can decide that you want to use just the BW extractors to get data out of your SAP ERP system—and not have to fight through all of those transparent tables to decode the logic—and build your own cubes, queries, and reports. Or you can decide to use the BW extractors and cubes, modify the cubes to suit your own data requirements, and build your own queries and reports. And, as another option, you can also decide to use the Business Content solution—including the reports—for standard, non-differentiating business processes (like your accounts receivable analysis, for example) completely as they are delivered. As time progresses, SAP will be making the Business Content data sources that are currently only in SAP NetWeaver BW available to standalone versions of SAP HANA. As of this writing, though, they are not yet available. You must build those data extracts yourself from SAP ERP.
If you’re bringing in non-SAP data, you’ll want to weigh the value and benefit of all of it with the cost of the SAP HANA licenses. Make sure that you get the value from what you are spending for licenses and the corresponding hardware. There is no point in spending all of that money if you aren’t going to get the insights you need because the data is so completely unorganized and disparate that you can’t bring it together for analysis and reporting.
© 2013 by Galileo Press Inc., Boston (MA)

77
Which SAP HANA Version Is Right for You? 3.3
As you can see, there are decisions to be made with this version of the SAP HANA database. If you are looking at SAP HANA purely—or primarily—to speed up your SAP NetWeaver BW solution, then this isn’t necessarily the right version of SAP HANA for you. If you are looking to address reporting or analytic problems outside of your SAP NetWeaver BW system—involving tons of data or for reporting in real time against your operational SAP transaction data—then it may be just what you need.
3.3.2 Choosing SAP HANA for BW
If you want to empower your existing SAP NetWeaver BW system with new, faster, in-memory capabilities and try to maximize what SAP NetWeaver BW can do for you while leveraging the investments your organization has already made, then you are looking at a migration of your SAP NetWeaver BW database to SAP HANA. First, however, remember that you need to be on certain versions of SAP NetWeaver BW to do this—so you may need to decide if you are going to upgrade and then migrate, or if you are going to install a side-by-side version of SAP HANA for BW with the newest versions and migrate solutions over as you are ready. You can use the side-by-side version of SAP HANA to solve particular use cases or cer-tain high-value analytics that you bring over first and then migrate the rest as you are ready to. In this scenario, you don’t have to deal with an upgrade right away.
SAP HANA for BW presents you with opportunities. You can simply migrate your database and immediately gain some good efficiencies and reduce your overall database size. You can speed up your data loading and your reporting. You can bring new solutions, data sets, and use cases into your SAP NetWeaver BW realm. But remember, there is work to be done to gain all of the efficiencies and benefits that SAP HANA brings to your SAP NetWeaver BW system. Migrating a database to SAP HANA will not deliver all of the benefits. You’ll get benefits, but to maxi-mize those benefits, you’ll need to go through the exercise of assessing your SAP NetWeaver BW data model and flattening it out. You can also stand up a fresh installation of SAP NetWeaver BW alongside your existing BW system and design only the key solutions that need the extra horsepower of SAP HANA at this time. Later you can move over additional solutions as time, money, or appetite permits. Many organizations are making this approach work for them.
There are definitely benefits to SAP HANA for BW. The smaller database means less hardware and therefore lower costs. Increased data loads mean you can realistically look at a single global instance with a follow-the-sun loading cycle and actually be able to have a single global instance with acceptable data loading windows and
Personal Copy for RGA Rik Vriens, user id c3b3ffa0-d601-c76a-06ae-b5f2c05f5c4a

78
SAP HANA Use Cases3
data accessibility for all users. This technology is real, and real customers—not lab environments—are seeing dramatic improvements in their SAP NetWeaver BW solutions as they employ SAP HANA. The improvements are not gained without some effort (remember, this is not a plug and play solution), but the improvements can be very real and are worth evaluating.
Note
We hope this should be clear at this point, but just to make sure there is no confusion: You are not being forced to migrate your database to SAP HANA. SAP has publicly stated that it will not force customers to migrate to SAP HANA at any point.
3.3.3 Final Thoughts
The choice of which version of SAP HANA you use is entirely based on what you are trying to accomplish. You could say you have more flexibility with the standalone version because you can build it more specifically to suit your needs; you could also say that you can leverage more of your existing investments and intellectual property with SAP HANA for BW, because you can maximize what you’ve already built with your SAP NetWeaver BW systems.
The choice is ultimately yours: do something new or do something faster.
3.4 Summary
As you can see, there are many things you need to consider when looking at SAP HANA: how to implement, what to implement, what is going to make the most sense going forward, how to leverage the most of what you already have in place, and more. As with many tools and solutions in this business intelligence and technology space, there are no purely right or wrong answers—only the ones that make the most sense to your organization.
While you are looking at these options from a technical perspective, don’t forget that you also have to look forward to what the future of these technologies envi-sions and how all of this plays into your overall BI strategy. These are big, expensive decisions you are making, and you’ll want to make sure that the investments you make today are aligned with the future goals and plans of the organization.
So with that in mind, let’s take a look at SAP HANA’s impact on your BI strategy.
© 2013 by Galileo Press Inc., Boston (MA)

79
So far you have read a lot about what SAP HANA is and isn’t, and its different types of implementations. Now let’s discuss how SAP HANA can fit into your business strategy.
4 SAP HANA and Your Business Strategy
As you’ve heard by now, SAP HANA is an enabler more than a solution in and of itself, because it allows you to change what and how you think of your enterprise data warehouse and business intelligence (BI) solutions. This is particularly true if you are a “traditional” SAP shop and an SAP NetWeaver Business Warehouse (BW) customer. When you understand what SAP HANA is and the types of solutions you might be able to deliver via an SAP HANA-enabled platform, you’ll likely start looking at your BI strategy and roadmap a bit differently. You can now look more aggressively at what you can do with a BI solution and aim for things that were once deemed impossible from your BI solutions.
If you do decide to move forward with an SAP HANA implementation, you should know that there are challenges with being an “early” (okay, “earlier,” as the truly brave have already forged the path for you) adopter of SAP HANA, regardless of which type you choose. The adoption of SAP HANA in-memory computing creates several challenges. Table 4.1 describes these challenges and lessons learned based on early adopters’ experiences with an SAP HANA adoption program.
Challenges Solutions
Lack of understanding—or buy-in—to the (potential) immediate value that can be gained by the organization from in-memory and real-time analytics capabilities versus their current capabilities
Align BI vision against current business information solutions and capabilities, analyzed from the perspectives of the new technology capabilities.
Looking at SAP HANA with a short-term lens instead of as a long-term investment and solution
Align long-term strategies with the technology and incorporate SAP HANA and SAP HANA-enabled solutions into your roadmap.
Table 4.1 Challenges of Early SAP HANA Adoption
Personal Copy for RGA Rik Vriens, user id c3b3ffa0-d601-c76a-06ae-b5f2c05f5c4a

80
SAP HANA and Your Business Strategy4
Challenges Solutions
Lack of understanding of high availability, disaster recovery, and operational impacts of in-memory solutions inhibiting enterprise-wide adoption
Define a complete view of end-to-end operational requirements, including hardware capabilities and current support organization capabilities.
Program delays due to a poor integration between hardware vendors and implementation partners
Select highly integrated hardware and service providers that can cover an end-to-end solution, covering all aspects of the implementation.
Table 4.1 Challenges of Early SAP HANA Adoption (Cont.)
The key lessons to be seen here are that the decision to use an in-memory solution such as SAP HANA requires careful consideration, planning, and attention to detail. This decision can absolutely be a great one, but make sure your organization is doing this for the right reasons. Bringing SAP HANA into your organization is not a total cost of ownership (TCO) play—SAP HANA requires an investment in licenses, hardware, and services—but SAP HANA can add and enable tremendous capabili-ties for your organization that were never before possible. If those capabilities are something your organization needs, or if you want to prepare your organization today for the eventual shift to an in-memory database for your SAP ERP and trans-action systems, then the decision to adopt SAP HANA as part of your technology footprint can be a good one.
So: Say you decide to take the plunge. With new technologies, new ways of look-ing at your organization, and new and different value driven transformational opportunities in mind, let’s discuss how SAP HANA and in-memory analytics will impact your existing BI strategy as well as your BI and IT organizations. When you consider your BI strategies and organizations, remember that you want to set up solutions and strategies that have a large impact on a company’s overall business performance by enabling managers to make better decisions at every level of the organization. A well-thought-out BI strategy includes consideration of people, processes, technologies, and goals and accountabilities. A clear strategy guides the deployment roadmap and phases and helps with the utilization of the technology solutions appropriately. A strategy will also help the company become more flex-ible, agile, responsive, and competitive while enabling departmental spending to go further and contribute to the overall effectiveness of the organization by creating consistency across the organization.
© 2013 by Galileo Press Inc., Boston (MA)

81
Identifying Transformational Opportunities 4.1
BI strategies have both tangible and intangible goals, which you must think about as we discuss how SAP HANA and in-memory analytics affect your organizations. Whether bringing an in-memory solution and enablement tool such as SAP HANA into the organization will affect these aspects may vary from organization to orga-nization, but you’ll see common threads of maximizing value, reducing cycle times, enabling value-adding activities, and improving agility and visibility.
Without further ado, let’s talk about how to establish a BI strategy that involves SAP HANA, breaking the process into four main phases:
EE Identifying transformational opportunities
EE Understanding your needs
EE Working with existing solutions
EE Planning, budgeting, and staffing
We talk about each of these phases in the sections of this chapter. In the last sec-tion, we conclude this first part of the book by offering some answers to the most frequently asked SAP HANA questions.
4.1 Identifying Transformational Opportunities
Now that you understand the new capabilities possible with SAP HANA, you must understand how to use this new technology as a catalyst (or enabler) of transfor-mational change for your organization. SAP HANA makes some solutions and capabilities possible that you previously thought were impossible. These value-driven transformations can change an organization’s focus on key outcomes that drive business performance. This is a change from the traditional activities and perspective, as shown in Table 4.2.
Traditional Outcomes Transformational Outcomes
Justify SAP Realize the value from an SAP investment
Install and integrate SAP Drive organizational adoption to new processes and procedures
Use existing KPIs Accountability for newly defined KPIs and metrics that drive and showcase business value
Access reports KPIs for real-time decisions and BI
Table 4.2 Traditional Outcomes versus Transformational Outcomes
Personal Copy for RGA Rik Vriens, user id c3b3ffa0-d601-c76a-06ae-b5f2c05f5c4a

82
SAP HANA and Your Business Strategy4
Before you can realize these transformational outcomes, however, you must mitigate the challenges that prevent it by doing the following:
EE Define the right key performance indicators (KPIs) to drive operational perfor-mance and process adoption rather than looking at the same measures and metrics that you always have.
EE Manage the governance process and accountability for results rather than deal-ing with messy and inconsistent data.
EE Measure performance and analyze information for strategic decision making rather than looking at the past.
EE Focus on designing and extracting value, instead of focusing on the budget and implementing the core technology (many businesses simply lack the bandwidth and skill set).
EE Understand the value opportunities and the amount of effort required, instead of just knowing the program was justified/approved.
These value-driven transformations are being considered by organizations that are moving up and along the maturity scale of their BI spectrum; they are moving past looking at what did happen to what could happen and then trying to dictate what will happen (Figure 4.1).
As organizations move up this spectrum, having a solid vision of where you want to go and what you want to deliver for business analytics and capabilities is necessary, but unless you have the ability to actually deliver these capabilities or solutions, then your organization will always be striving for something that is just out of reach.
The first step in a path of progress (rather than simply motion) toward transformation is to redefine the paradigm so that you are no longer allowing your technological capabilities to restrict your thought processes concerning what will drive and deliver value to the organization. Saying that is far easier than making it happen, but with that open-mindedness of thought, you can begin the process of identifying those value-driven transformations for your organization.
With an in-memory solution such as SAP HANA now available, you can change how you think about what your SAP solutions can deliver. You can continue to look at what has happened, of course, but can now look at what is happening right now. This presents you with a transformational opportunity to change your business processes and to empower your organization with new insight. Instead of trying
© 2013 by Galileo Press Inc., Boston (MA)

83
Identifying Transformational Opportunities 4.1
to streamline your existing processes based on habitual knowledge of how things have always been done, you can reinvent the process altogether.
Value Sustainability
Value identification
Business case
Value initiation
Value ownership
Value governance
Value scorecardand reporting
Value trackingand analytics
KPI collaboration
Mobile KPI visibility
� Brainstorm strategy for realizing value
� Create execution plan
� Propose potential value in detail
� Set benchmarks and have them reviewed
� Identify KPIs
� Top-down and bottom-up value impact
� Create KPI goals and targets
� Get others involved: buy-in, ownership, incentives
� Create and standardize KPI operational playbooks and process adoption
� Create plan of action and governance
� Provide enterprise executive dashboards
� Use KPI consolidation reporting (SAP and non-SAP)
� KPI analytics
� Enterprise-managed value project management office
� Collaboration between enterprise and partners
� Encourage communities of practice
� KPI visibility driven by events
� Enable mobile collaboration and making real-time decisions
Val
ue E
nabl
emen
t
Extend valueacross theenterprise
Deliver thevalue and decidewho is accountable
Brainstorming andinitial phases: Whatpotential value canwe get and when?
Figure 4.1 Value Enhancement and Value Sustainability
Look at your world from a different perspective. Sophisticated analysis of events and inputs in real time will allow you to change how you respond to and interact with your customers, employees, and processes. Imagine a customer service rep-resentative offering customer-tailored solutions or offerings based on analysis of voice responses, emotional indicators, and profile data. Imagine notifying the closest qualified technician instantly when a malfunctioning valve on an oil rig sounds an alarm, and then telling that technician what the alarm means, what repairs will be necessary, and where the closest parts and materials are. Imagine retail associates being prompted with high-value add-on sales opportunities in real-time based on sales and inquiry activity in the store and online.
Personal Copy for RGA Rik Vriens, user id c3b3ffa0-d601-c76a-06ae-b5f2c05f5c4a

84
SAP HANA and Your Business Strategy4
All of these scenarios start to fall into the realm of possibility in an SAP HANA-enabled scenario. SAP HANA isn’t ready today for pulling emotional triggers and indicators from speech patterns, but it’s a real possibility in the near future. Pre-dictive analytics that bring in unstructured data are being fine-tuned even now. The point is that you should not be restricted in your identification of what might be a value-driven transformation to your organization. But as you look at your organization in this new way, with this new level of visibility and understanding, realize that your organization can change its business structure and operations by harnessing these capabilities. As you do this, remember to shift accountability and authority along with risk profiles for your users. Empower your organization to act on the information now available, or you’ll lose the opportunity to gain value from that insight.
4.2 Understanding Your Needs
Once you’ve identified your possible opportunities, the next step in developing an SAP HANA strategy—or any business strategy, really—is to understand your company’s needs. These needs can be grouped into two categories: enterprise needs and data needs.
4.2.1 Enterprise Needs
Organizations are seeing the need to adopt new ways of working to improve speed to insight and impact on performance via business analytics. This is prevalent across the industry spectrum. Consider the following statistics:1
EE Four in five business leaders see information as a source of competitive advan-tage.
EE One in two business leaders don’t have access to the information across their organization needed to do their jobs.
EE One in three business leaders frequently make critical decisions without the information they need.
As organizations seek to identify and address these enterprise data and analytic needs, it quickly becomes apparent that the “need” means different things to
1 IDC Digital Universe, 2010; IBM Institute for Business Value, 2009; IBM CIO Study 2010; TDWI: Next Generation Data Warehouse Platforms Q4 2009.
© 2013 by Galileo Press Inc., Boston (MA)

85
Understanding Your Needs 4.2
different people within the organization. Different roles within the organization—even different people who hold the same role—will define their enterprise analytic needs differently. This is based on many factors but is very much representative of the level of “maturity” of the organization, the users, and the technology for data and analytics. The overall goal is to have enterprise-wide analytics that are (or can be) transformative, sustainable, and cost effective.
Developing a comprehensive enterprise analytics vision and strategy enables leader-ship and the organization to define their top analytics priorities, develop a vision for what the future state capabilities should be, define the value they will deliver, and ultimately devise the proper plans and actions to achieve the analytics vision. You can best understand your enterprise needs by asking yourself the following questions:
EE What are the industry best practices and trends?
EE How does our current status and abilities compare to the industry standard?
EE What are our business objectives?
EE What do we want our future analytics capabilities to be, and how big is the gap between the present and the future?
EE How would our ideal company roadmap look?
EE What is our justification for a need for better analytic capabilities?
The question then becomes how to identify the organization’s true business analytic needs at the enterprise level, socialize those needs, and reach a level of agreement—if not outright consensus—on what those needs are (Figure 4.2).
Workstream 2:Business Capabilities
Workstream 3:Data and Technology
B. Developarchitecturalvision
Workstream 1:Vision and Value
A. Definevision andvalue drivers
E. Assess currentenvironment
C. Assess theorganization’sreadiness
H. Align valuesand stakeholders
D. Assess maturityand identify gaps
F. DevelopBI visionand blue-print
G. Develop roadmapand project plans
Map capabilitiesand key players toachieve initiatives
Create projectplans/summaries
Assess Blueprint RoadmapVision
Figure 4.2 Defining Your Analytic Needs and Tying Them to Your Roadmap
Personal Copy for RGA Rik Vriens, user id c3b3ffa0-d601-c76a-06ae-b5f2c05f5c4a
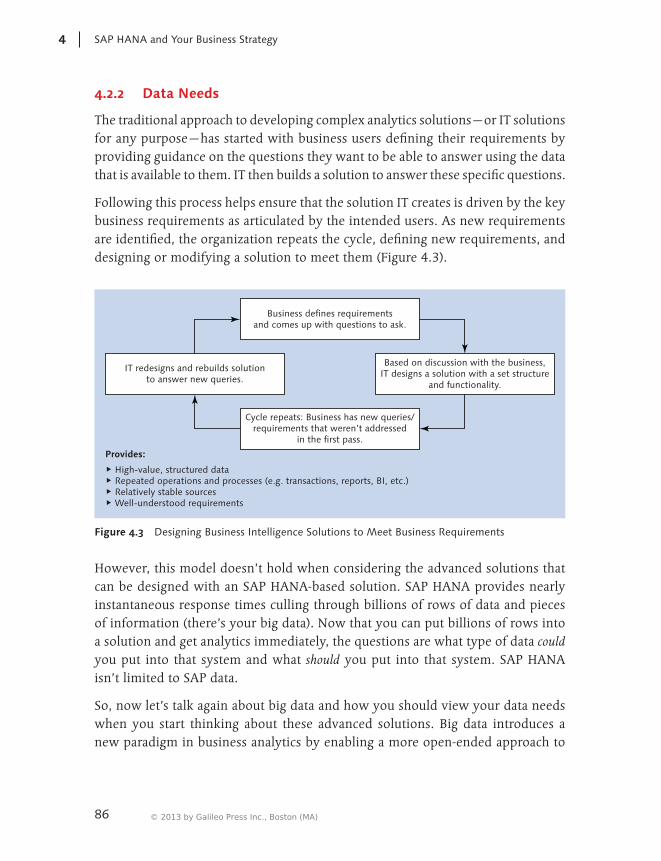
86
SAP HANA and Your Business Strategy4
4.2.2 Data Needs
The traditional approach to developing complex analytics solutions—or IT solutions for any purpose—has started with business users defining their requirements by providing guidance on the questions they want to be able to answer using the data that is available to them. IT then builds a solution to answer these specific questions.
Following this process helps ensure that the solution IT creates is driven by the key business requirements as articulated by the intended users. As new requirements are identified, the organization repeats the cycle, defining new requirements, and designing or modifying a solution to meet them (Figure 4.3).
Provides:
� High-value, structured data� Repeated operations and processes (e.g. transactions, reports, BI, etc.)� Relatively stable sources� Well-understood requirements
Business defines requirementsand comes up with questions to ask.
IT redesigns and rebuilds solutionto answer new queries.
Cycle repeats: Business has new queries/requirements that weren’t addressed
in the first pass.
Based on discussion with the business,IT designs a solution with a set structure
and functionality.
Figure 4.3 Designing Business Intelligence Solutions to Meet Business Requirements
However, this model doesn’t hold when considering the advanced solutions that can be designed with an SAP HANA-based solution. SAP HANA provides nearly instantaneous response times culling through billions of rows of data and pieces of information (there’s your big data). Now that you can put billions of rows into a solution and get analytics immediately, the questions are what type of data could you put into that system and what should you put into that system. SAP HANA isn’t limited to SAP data.
So, now let’s talk again about big data and how you should view your data needs when you start thinking about these advanced solutions. Big data introduces a new paradigm in business analytics by enabling a more open-ended approach to
© 2013 by Galileo Press Inc., Boston (MA)

87
Understanding Your Needs 4.2
discovering the insights in your organization. Business and IT users can identify and incorporate new data sources into their processes as they become available. IT delivers a flexible platform that enables creative exploration of all available data.
Business users are then able to explore the data, test different hypotheses, and itera-tively examine their approach to solving a problem. With a clear understanding of what types of insights are contained in their data, they can use these insights to make business decisions and drive integration with traditional technologies (Figure 4.4).
Provides:
� Quick-changing data and content� Iterative, exploratory analysis (e.g. scientific research, behavioral modeling, etc.)� Quick-changing sources� Changing requirements
Business and IT identify availableinformation sources.
The business decides to integratetraditional technology, based on
new insights.
Business explores the data and relation-ships delivered by IT, which prompts
additional questions.
With the IT-delivered platform, businessusers creatively explore all available
data to better solve problems.
Figure 4.4 Using Business Intelligence Solutions to Understand What Questions to Ask
When you drive to this new paradigm, you open up an entirely new world of options and possibilities. The goal of these advanced analytic solutions is to be able to respond immediately to business challenges or opportunities—and eventually to be able to drive the behaviors of your organization and customers.
As clients become more mature or sophisticated with their analytic requirements—or gain a greater understanding of the level of insight they can gain now that they can harness this new power—the data needs to move from traditional transaction records to include unstructured data, video, audio, and more. The complexity of the data will increase as the maturity increases, and the sheer volume of data will become something that was previously considered impossible to manage (Figure 4.5).
Personal Copy for RGA Rik Vriens, user id c3b3ffa0-d601-c76a-06ae-b5f2c05f5c4a

88
SAP HANA and Your Business Strategy4
Dat
a Vo
lum
e, V
eloc
ity,
Var
iety
Uncertainty (1/veracity)Precise, authoritative,
well formed
AccountManagement
CRM
Traditional Data and Processing Data Uncertainty at Scale
Telco Profiles
Call DetailRecords
Fraud
Credit CardTransactions
Retail
Services
SocialNetwork Data
HomelandSecurity
ContactCenters
Text, Audio,Video
Predictive Modelingof Outcomes
MedicalTranscription
DiseaseProgression
Patient Records
SmarterTraffic
SmarterWater
Smart Grid WeatherModeling
SmarterCities
Sensor Data
MarketTrends
PortfolioRisk
Market Feeds
CustomerRecords
Electronic DataInterchange
SWIFT
Inconsistent, imprecise,uncertain, unverified,
spontaneous, ambiguous,deceptive
Figure 4.5 Uncertainty Increases with Data Volume, Velocity, and Variety
This level, type, and sheer amount of data are many and varied. As you look at the data elements in the figure, the potential challenge point that all of the data sets have in common is the same as it might be when bringing data together for any solution—data harmonization. Just because you can bring in billions and billions of rows and points of data from any number of places doesn’t mean that all of that data will make sense when you connect it all.
A big part of your success with any complex and advanced analytics solution set such as this will depend on your ability to align your data across the systems and disciplines of your organization so you actually can bring it all together and analyze it. It does you no good to have a system that can analyze a billion rows in a subsecond if none of that data can be brought together in a meaningful way.
© 2013 by Galileo Press Inc., Boston (MA)

89
Understanding Your Needs 4.2
This means that somewhere, somehow, there needs to be a data alignment or data conversion effort.
A key task of the data alignment strategy is to determine and gain agreement on the levels for data quality. The definition of data quality is subjective and therefore often best formalized using levels (tiers) for data quality based on the category of data. Many SAP implementations have interpreted quality data as simply data that loads into the target without error. However, experience shows that a higher defi-nition of data quality is often needed based on the category of data. For example, master data objects and configuration data objects may have differing levels of acceptance for data quality. Organizations must recognize trade-offs in the time required to achieve data quality if standards are set too high. Large gaps between current data quality and desired data quality may require internal subject matter experts to develop data that does not exist today. The steps involved in this process are shown in Figure 4.6.
Data Cleansing1 to 1 movement
� What: Reconciled divisional requirements� Output: Aligned data (by source)
Data Harmonizationmany to 1 movement
� What: Aggregated enterprise requirements� Output: Harmonized data (access sources)
Solution Implementationsystem movement
� What: Business process requirements� Output: Targeted business solution
Data Profile1 to 1 movement
� What: Initial analysis of source data, quality� Output: Understanding of status of source data
Data Assessment1 to 1 assessment
� What: Source data analysis and validation to target� Output: Validated business requirements and specifications
Figure 4.6 Developing New Data
Data harmonization will be a key to the successful deployment of any SAP HANA-based solution if the solution involves data from more than one system. This will apply whether you are using the SAP HANA solution as the foundation for a standalone solution or using SAP HANA for BW. As soon as you try to bring data together from multiple systems—SAP or non-SAP—you need to make sure that Client A = Client A regardless of the source of the data, even if Client A is called A Client in the other system(s). You must be able to create the data linkages that will allow you to bring together all of this disparate information—from structured data sources and unstructured data sources—to gain the true insight and benefit you are seeking.
Personal Copy for RGA Rik Vriens, user id c3b3ffa0-d601-c76a-06ae-b5f2c05f5c4a

90
SAP HANA and Your Business Strategy4
4.3 Working with Existing Solutions: SAP HANA versus SAP NetWeaver BWA
If you already have an SAP in-memory solution in place—namely, SAP NetWeaver BW Accelerator (BWA)—you may be wondering how to reconcile SAP HANA and your existing business strategy. In this section, we’ll put SAP HANA and BWA into context.
4.3.1 Does SAP HANA Replace BWA?
If you have implemented BWA, you may be wondering whether SAP HANA replaces it. Actually, how you choose to go forward with SAP HANA will dictate whether or not you need to continue with a BWA solution.
BWA is a hardware appliance with in-memory data caching capabilities that attaches to your existing SAP NetWeaver BW system and allows you to identify certain InfoProviders for indexing. In other words, you pick and choose which of your cubes (and potentially data store objects [DSOs]) you want to be visible on BWA. The cubes and objects you select are then indexed on the BWA system instead of on the regular SAP NetWeaver BW database servers. BWA takes only those identi-fied cubes and brings them into its in-memory cache. The other data sets—those not identified or those that you can’t bring over (such as master data)—are not indexed in the cache.
For those cubes that are in the BWA caches, you’ll see dramatically improved query and report results because the engines are pulling the data from those indexes on BWA instead of the traditional SAP NetWeaver BW servers. You can drop the aggregates that you’ve built for those cubes and consider flattening out those cube designs.
But BWA systems only speed up the queries for those identified data sets, which is the limitation of BWA. BWA doesn’t fundamentally speed up the entire system or change the nature of how all of the data is organized. No customers (at least to our knowledge) have taken their entire SAP NetWeaver BW system and put it in a BWA or even multiple BWAs.
© 2013 by Galileo Press Inc., Boston (MA)

91
Working with Existing Solutions: SAP HANA versus SAP NetWeaver BWA 4.3
When SAP HANA Replaces BWA
SAP HANA replaces BWA when you’ve migrated your BW database to SAP HANA. There will be absolutely no need for a BWA on your SAP NetWeaver BW system after that system’s database has been fully migrated to an SAP HANA database. And because you can’t partially migrate a database, once you’re on SAP HANA, your BWA can go away.
You may be able to repurpose that BWA hardware for use with SAP HANA, but you’ll need to talk to your hardware partner about that. Only your hardware part-ner can assess your hardware configuration versus needs and determine what can be potentially repurposed or reconfigured. You might also be able to have some credits applied toward purchases of SAP HANA hardware. Fundamentally, though, BWA configurations and SAP HANA configurations are different, so you MUST work with your hardware vendor on this question.
Whether you can repurpose your license fees depends on your fee structure and your negotiating position with SAP. There is no publicly available information that sets a basic premise or starting point for any credits of license fees from BWA to SAP HANA.
When SAP HANA Does Not Replace BWA
You’ll still need your BWA if you aren’t doing a database migration to SAP HANA. If you are implementing the standalone version of SAP HANA for specific use cases or for non-SAP use cases and are leaving your existing SAP NetWeaver BW alone, you’ll want to take advantage of the performance improvements that BWA offers for your SAP NetWeaver BW system. If you are implementing a side-by-side version of SAP NetWeaver BW with SAP HANA, you won’t need a BWA for that instance of BW, but you will want to leave in place any BWA that you have on your “older” instance of BW.
Final Thoughts
In summary, the short answer to the question of SAP HANA versus BWA is the following:
EE If you implement SAP HANA for BW—the database migration—then you do not need a BWA.
EE If you implement a standalone SAP HANA but also have SAP NetWeaver BW, you’ll want to use a BWA solution to address your BW query performance needs.
Personal Copy for RGA Rik Vriens, user id c3b3ffa0-d601-c76a-06ae-b5f2c05f5c4a

92
SAP HANA and Your Business Strategy4
EE If you are implementing a fresh installation of BW with SAP HANA and leaving your older version of BW in place (without an SAP HANA database), then the older BW—the one without the SAP HANA database—can still definitely ben-efit from the BWA.
BWA is an in-memory appliance that addresses query performance of identified BW data providers. SAP HANA is a full in-memory database. They are similar in concept but definitely not the same. They fill different needs and different uses. But once you have your SAP NetWeaver BW database migrated to SAP HANA, the need for your BWA on that same instance of BW goes away.
So, the harder question is: Should you consider a BWA or SAP HANA solution to help address your BI needs? It depends. The same rationale that we used when discussing whether or not SAP HANA replaces BWA can be applied to the decision points on whether or not you should consider an SAP HANA-enablement for your BI solution(s) or whether you should consider a BWA enablement.
4.3.2 Pros and Cons of BWA
First, let’s look at what BWA is and what it delivers from a “pros” and “cons” per-spective against common use cases and decision points (Table 4.3).
Need/Use Case Pros Cons
You need to speed up reporting against your SAP NetWeaver BW 7.x cubes and DSOs.
The newest and latest BWA can quickly and cost effectively attach a BWA to your existing BW system, and you can index the desired cubes and DSOs onto BWA for faster reporting.
BWA will only speed up reporting against those identified cubes.
You want to speed up reporting against all of your SAP NetWeaver BW data—cubes, DSOs, and master data.
You can quickly and cost effectively attach a BWA to your existing SAP NetWeaver BW system and index the cubes and DSOs for faster reporting.
BWA won’t really help with your master data reporting.
Table 4.3 Pros and Cons of BWA
© 2013 by Galileo Press Inc., Boston (MA)

93
Working with Existing Solutions: SAP HANA versus SAP NetWeaver BWA 4.3
Need/Use Case Pros Cons
You want to flatten out your data model on SAP NetWeaver BW and get rid of multiple layers of data design and redundancy.
Bringing cubes and objects over to BWA will allow you to flatten some of your model by reducing the levels of aggregation required and potentially reducing the number of cubes you split data across for logical partitioning.
You’ll still need to have levels of DSOs and cubes to manage truly atomic detail at high volumes.
You want to speed up your data loading.
BWA will allow you to flatten out some of your data model and reduce the aggregates, thus reducing the overall processing of data loads.
BWA won’t address the transformational needs of data (it only invokes at query time) as it processes through the system or fundamentally how data is stored in the overall database for SAP NetWeaver BW.
You want to attach a BWA solution to a non-BW environment.
This is not possible. This is not possible.
You want to maximize your long-term investments with hardware and database decisions.
You may be able to get credit or repurpose some of your BWA hardware for use toward SAP HANA.
BWA as a technology is outdated and is a first generation in-memory solution. The future is based around more comprehensive solutions such as SAP HANA.
You want a quick and proven solution to speed up your BW report performance.
BWA has been around for years and can be installed and positively affecting your report performance in days.
BWA may be a short-term fix to your BW performance problems.
You want to look at real-time reporting and analytics.
BWA will make the data retrieval of what is already loaded into BW faster.
BWA does not address data loading; it is only concerned with retrieving data that is already loaded into the system.
Table 4.3 Pros and Cons of BWA (Cont.)
Personal Copy for RGA Rik Vriens, user id c3b3ffa0-d601-c76a-06ae-b5f2c05f5c4a

94
SAP HANA and Your Business Strategy4
BWA is a good solution for BW problems that are mostly related to reporting and querying because BWA gets invoked only when a query is executed. BWA sits on top of your BW system and indexes only what you tell it to. BWA doesn’t funda-mentally change the nature of your BW environment or technical solution. BWA doesn’t address data loading—other than to help ease some design aspects by giving you the ability to reduce your data redundancies designed into logically partitioned models (breaking one great big cube into a bunch of smaller cubes with pretty much the same construct but split out by year, for instance). BWA won’t help address the need for real-time data loads or updates.
Don’t read this and think that you have wasted your money and implementation efforts on putting BWA onto your SAP NetWeaver BW systems—that’s not true. Implementing BWA has helped thousands of SAP NetWeaver BW customers achieve better performance and increase user adoption and satisfaction with their systems. Putting BWA onto SAP NetWeaver BW systems has also helped lay a foundation for understanding in-memory solutions and technology, because BWA is a (small and focused) in-memory solution.
4.3.3 Pros and Cons of SAP HANA
A common question at this point is whether you should implement (or continue to implement) BWA, or implement an SAP HANA solution instead. Let’s take some of those same use cases that we applied to BWA and now apply them to SAP HANA. We can’t compare BWA to standalone SAP HANA because you can’t attach a BWA solution to a non-BW environment, so this comparison is specific to SAP HANA for BW (Table 4.4).
Need/Use Case Pros Cons
You need to speed up reporting against your SAP NetWeaver BW 7.X cubes and DSOs.
Converting your SAP NetWeaver BW database to SAP HANA will allow for dramatically faster reporting against all of your BW data.
You must be on SAP NetWeaver BW 7.3 and Unicode to make this work. This might require an upgrade project.
You want to speed up reporting against all of your SAP NetWeaver BW data—cubes, DSOs and master data.
Converting your SAP NetWeaver BW database to SAP HANA will allow for dramatically faster reporting against all of your BW data.
You must be on SAP NetWeaver BW 7.3 and Unicode to make this work. This might require an upgrade project.
Table 4.4 Pros and Cons of SAP HANA
© 2013 by Galileo Press Inc., Boston (MA)

95
Working with Existing Solutions: SAP HANA versus SAP NetWeaver BWA 4.3
Need/Use Case Pros Cons
You want to flatten out your data model on SAP NetWeaver BW and get rid of multiple layers of data design and redundancy.
With an SAP HANA database, you will no longer need the multiple layers and levels of partitioning and aggregation that you created to manage data loading and performance. You can reduce this overhead and therefore database size considerably.
This is an effort you’ll have to go through manually, and it may result in a good amount of work to analyze and then flatten out your data model and keep all of your query logic in place (meaning that you might have to re-point your queries to different objects if you now have only 1 great big cube for sales, for instance, instead of 10 or 12 small ones as your queries point to specific cubes).
You want to speed up your data loading.
The layout on the SAP HANA database itself will allow the data to load faster even with no other changes because there are fewer indices to build, less spreading out of data, and so on. This positive effect will be compounded when you flatten out your data model and remove now-unnecessary layers of the model and aggregates.
Real-time data loading will be possible with certain SAP ERP data extracts and will become more and more prevalent with SAP data as the solution and technology progresses.
To truly optimize the loading, you will need to go through the exercise of flattening out the data model.
You want to attach an SAP HANA solution to a non-BW environment.
You just need the standalone version of SAP HANA.
This will require a fresh installation with a “build from scratch” approach unless you are implementing one of the SAP RDS solutions.
Table 4.4 Pros and Cons of SAP HANA (Cont.)
Personal Copy for RGA Rik Vriens, user id c3b3ffa0-d601-c76a-06ae-b5f2c05f5c4a

96
SAP HANA and Your Business Strategy4
Need/Use Case Pros Cons
You want to maximize your long-term investments with hardware and database decisions.
SAP HANA is the foundation of SAP’s long term strategy and technology solution. This investment now will position you well for years to come with SAP.
You may not be able to repurpose any of your BWA hardware, and you might have to look at different hardware overall for your SAP HANA-based BW environment if your current solution is not compatible with the necessary SAP HANA configuration specs. You need to talk this through with your hardware partner.
You want a quick and proven solution to speed up your SAP NetWeaver BW report performance.
SAP HANA for BW is a generally available solution that has undergone rigorous testing and validation from SAP and early adopters.
SAP HANA-enabled solutions are still new—particularly SAP HANA for BW—so there are not thousands of success stories and “been there, done that” references to draw upon.
You want to look at real-time reporting and analytics.
SAP HANA for BW will allow you to begin to bring in SAP ERP data in real time and push it into your reporting solutions at dramatic speeds.
You must convert your SAP NetWeaver BW database to SAP HANA, and not all Business Content data extractors are SAP HANA-enabled for real time at this point.
Your custom data extractors for SAP NetWeaver BW may need to be rewritten with SAP HANA tools if you want to enable real-time data access and visibility.
If you do not flatten out your data model, you’ll still be forcing your data—which now comes into the systems in real time—through a complex set of steps before it is available to your reports.
Table 4.4 Pros and Cons of SAP HANA (Cont.)
© 2013 by Galileo Press Inc., Boston (MA)

97
Working with Existing Solutions: SAP HANA versus SAP NetWeaver BWA 4.3
4.3.4 Conclusion
From a strategy perspective, how do these two in-memory technologies play into our current and future BI strategies? Should you be making any immediate changes to in-flight projects or imminent plans?
This discussion truly comes down to a simple understanding of what each tool is and what it’s meant for—and then using the tool for its best application. The primary purpose of BWA is for existing SAP NetWeaver BW systems as a means to improve query performance by reading previously identified indexed data on its in-memory platform, which is optimized for speed of reading data. Its secondary purpose is to allow for reduction in aggregates and logical data model partitioning, which leads to data redundancy. It can also increase data accessibility times by reducing the steps through which the data needs to process before it’s available to reports and queries. BWA’s limitations are that it’s for SAP NetWeaver BW systems only, and it will not fundamentally change the nature of the entire SAP NetWeaver BW system infrastructure, data loading, and database. In other words, BWA can only improve query performance, not other performance issues and challenges that your SAP NetWeaver BW system may be facing.
Meanwhile, the primary purpose of SAP HANA on top of SAP NetWeaver BW is to migrate the entire SAP NetWeaver BW database to an in-memory platform that is designed for speed of both data writing and reading. Its secondary purpose is to allow for the reduction or elimination of aggregates and logical data model partition-ing that leads to data redundancy. It can also make (selected) data available in real time and near real time for increased accessibility to the business user community. The limitations are, of course, that it requires the migration of an existing SAP NetWeaver BW database to SAP HANA (new installations will obviously not require a migration), which may require a change or extension of your existing hardware. To maximize benefits, you also need to go through exercises to flatten your data model, and you may need to perform an upgrade on your existing BW system.
To help you decide whether to go with BWA or SAP HANA for BW and whether you should stop any in-flight or imminent projects, consider the following two lists.
You’ll want to consider SAP HANA for BW if the following are true:
EE You’re looking for a long-term and more comprehensive solution that will allow you to leverage most of your BW investments and development, and you intend to keep using your BW system (and build upon it) for years to come. This will
Personal Copy for RGA Rik Vriens, user id c3b3ffa0-d601-c76a-06ae-b5f2c05f5c4a

98
SAP HANA and Your Business Strategy4
also allow you to bring SAP HANA into your environment and begin to get familiar with working on an in-memory platform as SAP continues to develop SAP HANA capabilities so that transitions of other SAP solutions to an SAP HANA platform will be less daunting in the future.
EE You want or need to make platform or database changes today in a less compli-cated environment (than it will be when you’re ready to move your SAP ERP solution over).
EE You want to increase the power and capabilities of your overall BW system and are ready to make an investment for the future of your BW environment, rec-ognizing that you will now be able to use it for more than “just” SAP historical reporting.
You’ll want to consider BWA if the following are true:
EE You’re looking for a quick and cost effective way to speed up key BW queries and reports.
EE You already have a project in flight and have secured the hardware and any associated licenses and services and don’t want to spend any more money at this time.
EE You’re looking for a short-term, short-money fix for reporting problems while you figure out your overall BI strategy and solution approach.
As you can see, there are few black and white answers to these questions. Cost, efforts, results, and long-term plans and visions have to be considered to determine the right path (or at least the right path for right now) for your organization.
4.4 Writing a Business Case, Budgeting, and Staffing for SAP HANA
Starting the planning process and budgeting for an SAP HANA implementation can be challenging. First, the technology is new to an organization, there is often a lack of knowledge on how to support the system, and little pricing information is available on the project’s actually cost, the resources required, and the changes it will make to your support organization. In this section, we address some of these issues and provide an overview of the decisions required to successfully implement and maintain an SAP HANA solution.
© 2013 by Galileo Press Inc., Boston (MA)

99
Writing a Business Case, Budgeting, and Staffing for SAP HANA 4.4
4.4.1 Writing a Business Case
The first step in planning for SAP HANA is to write a business case. This can be approached from several angles. There are clearly benefits in terms of system per-formance, but to quantify the value of this in terms of money spent and return on investment (ROI) is often a futile exercise. A better approach is to write the business case from one of four value propositions:
EE Total cost of ownership (TCO)
EE IT strategy
EE Reducing time and effort of delivery
EE Improved information access for end users
While it’s tempting to argue all of these items in a business case, it’s important to stay focused and provide a clear and cohesive vision of why the investment in the SAP HANA implementation is needed. There should also be clearly defined reasons and tangible results. So be careful of taking a “shotgun” approach to the business case in hope something hits with the senior management.
Instead, pick one or two of these areas, and give four to six justifications that are well reasoned and supported in your argument. Inexperienced IT managers often do a poor job of writing a good business case. Therefore, most of these writers should review their business case with a financial analyst, business planner, or senior manager before calling a meeting and requesting a budget.
Total Cost of Ownership (TCO)
It’s important to acknowledge that a significant initial investment is required for SAP HANA when compared to a traditional database and server strategy. However, when compared with the costs of maintaining, upgrading, patching, and paying license fees for databases, application servers, database servers, connectivity and security support in many platforms, as well as daily monitoring of multiple systems, the investment in SAP HANA becomes more reasonable.
For example, the average database administrator (DBA) in the United States is paid $78,239, according to the U.S. Bureau of Labor Statistics, whereas the average DBA in Europe is paid around $64,000. In SAP HANA, DBAs aren’t needed, resulting in significant operational savings. Also, the average SAP NetWeaver BW developer in a company is paid approximately $65,000 to $85,000 per year, while some consul-tants charge as much as $225 per hour. These developers are building InfoCubes,
Personal Copy for RGA Rik Vriens, user id c3b3ffa0-d601-c76a-06ae-b5f2c05f5c4a

100
SAP HANA and Your Business Strategy4
aggregates, SAP NetWeaver Business Warehouse Accelerator (BWA) indexes, and process chains, along with doing performance tuning efforts. Depending on your situation, this type of work may not be needed with an SAP HANA system.
Furthermore, a Basis person managing an SAP landscape is often well compensated and has specialized skills. With SAP HANA, much of the Basis tasks are “outsourced” to the support contracts that each customer is often required to purchase from the hardware vendors. This creates a benefit of scale at the vendor sites and allows companies to leverage specialized skills instead of trying to build these internally. This is a better service level manager approach that can save companies significant amounts of money in the long run.
The system also requires less development. For SAP NetWeaver BW, many of the InfoCubes aren’t needed in an SAP HANA system, while other objects such as developing aggregates (summary tables for reporting) aren’t needed in either SAP ERP or SAP NetWeaver BW. External indexing engines such as BWA are also not required. All of this points to simplified system landscapes, reduced numbers of integration points, and overall reduced TCO of both the SAP ERP system and the SAP NetWeaver BW systems in an organization.
IT Strategy
The fundamental value proposition of SAP HANA lies in the technology landscape and the need for increased performance. If you consider the evolution of hardware components relative to prices since 1990, you see that CPU prices have dropped and performance has increased so much that you can get more than 6,000 times more processing power for the same amount of money (Table 4.5).
1990 2012 Improvement
CPU 0.05 MIPS/$ 304.17 MIPS/$ 6083x
Memory 0.02 MB/$ 52.27 MB/$ 2614x
Addressable Memory
216 264 248x
Network Speed 100 MBPS 100 GBPS 1000x
Disk Data Transfer 5 MBPS 620 MBPS 124x
Table 4.5 Technology Improvements Since 1990
© 2013 by Galileo Press Inc., Boston (MA)

101
Writing a Business Case, Budgeting, and Staffing for SAP HANA 4.4
Memory costs have dropped by a factor of 1 to 2,614, and addressable memory has increased by 248, while available network speed has increased by up to 1,000 times faster. However, magnetic spinning disks have increased by only 124 times. Actually, disks are 105 times slower compared to main memory access, which is the reason in-memory platforms are inevitable. Transferring electrons to magnetic disks and moving physical hardware reader “arms” are simply too slow and have not kept up with the improvements of the other hardware components.
This has many implications. First, if you remove the magnetic drives as the primary method for data access, you don’t need a relational database. After all, relational databases were made to optimize and manage access to organized file systems on hard drives. Second, if the role of hard drives is relegated to persistent storage only (SAP HANA has a persistent file and log storage), you may not need a dedicated or shared SAN and can instead have internal drives on each system.
The business case for SAP HANA can therefore be made on the landscape transfor-mation required to enable the next generation of IT platforms. This transition isn’t unlike the move away from punch cards and tapes to hard drives in the 1970s and 1980s, or the move away from floppies in the 1990s. It’s simply a question of what hardware an organization is willing to support and how fast it wants to realize the benefits of the next generation of systems.
Few argue that the transition away from punch cards was not beneficial, but some companies kept using them for many years after better technology was available, resulting in slow performance, high support costs and limited choice in what was possible to accomplish. The same is true for SAP HANA.
Organizations can be early adopters and get early benefits, or they can be late adopt-ers and try to live within the limitations of their older systems. The issue is that hard drives are at the end of their useful lives as providing “instant” accessible data for large-scale systems. Trying to make it work through redesign and performance tuning can be very costly. A better business case can be made for SAP HANA based on technology trends and the long-term IT strategy.
Reducing Time and Effort of Delivery
After an SAP HANA system is implemented, it significantly reduces development lead times. For example, 20- 40% of an SAP ERP implementation may be used for developing reports, interfaces, conversions, extensions, and forms (RICEF). For reports, SAP HANA simplifies the delivery by reducing the need to create reports
Personal Copy for RGA Rik Vriens, user id c3b3ffa0-d601-c76a-06ae-b5f2c05f5c4a

102
SAP HANA and Your Business Strategy4
that have to be performance tuned or optimized by ABAP code reviews. SAP HANA is already performance enhanced. SAP ERP interface development is also faster because you can connect directly to the system and retrieve data “live” through database links instead of having to create asynchronous loads and file creations during nightly batch windows to reduce SAP ERP system load/stress.
For SAP NetWeaver BW, there are even more development benefits. For example, write-optimized DSOs can serve as the staging layer, and reportable DSOs can sig-nificantly reduce the need for InfoCubes. The BEx flag ensures that the DSO can link to master data such as hierarchies, customers, vendors, and materials. Data transformation can occur during data loads into the BW system or during data loads from one DSO to another.
You can also create a single DSO for smaller data loads and report from it directly, thereby significantly reducing both the development time as well as the data load times. In addition, the need for performance tuning efforts is reduced, and data volumes are reduced through less data duplication in DSOs and InfoCubes.
Many will find these business reasons so compelling that their business case is writ-ten solely around these benefits as the core reason for their SAP HANA implementa-tion. Trying to quantify the benefits, SAP NetWeaver BW systems customers may see as high as 15 -30% less development time required, and SAP ERP customers may see 10- 15% reductions in development times depending on the complexity of their implementations. However, for some customers, the benefits may even be higher.
Improved Information Access for End Users
One of the core reasons for implementing SAP HANA is the improved access to data and information. Tools such as SAP Business Objects Dashboards have allowed companies to build operational dashboards in SAP ERP and BI dashboards in SAP NetWeaver BW. However, the rollout of these to large user communities is rare because the relational databases are unable to handle extreme high-data volumes that are required to be summarized and consumed by thousands of users in a graphical format. SAP HANA addresses this by freeing companies up to develop SAP ERP and SAP NetWeaver BW dashboards that improve data visibility beyond list reports and Excel interfaces.
SAP HANA also provides companies with a platform that allows an increased use of ad hoc query tools from power users and authors. For example, in SAP Business Objects Web Intelligence, users can create their own reports. Currently,
© 2013 by Galileo Press Inc., Boston (MA)

103
Writing a Business Case, Budgeting, and Staffing for SAP HANA 4.4
some companies are reluctant to provide this capability to thousands of users without scheduling and pre-running the reports for performance reasons. Instead, it’s common to see controlled availability of this powerful tool, thereby reducing the benefits of self-service BI on a large scale.
SAP HANA addresses this by making the database inherently faster and capable of handling high system stress with sub-second response times. This benefit is a good example of the option theory, which states that the earlier a person is made aware of a change, the longer he has to react to the change. Because the time to react has increased, users can explore more alternatives and options and make better decisions. Therefore, SAP HANA has an intrinsic value by simply providing more information to more people earlier, giving them more time to react.
It has been said that the work of an analyst is 80% data collection and 20% data analysis. SAP HANA promises to change this by allowing faster access to data and thereby allowing analysts to spend 20% of their time collecting data (running reports) and 80% actually doing what they are supposed to do: analyzing the data.
Few analysts are willing to click a drill-down button and explore data if it takes 20 –60 seconds each time. However, with SAP HANA, the financial analyst community can start exploring large data sets, business planners can run planning scenarios faster, and executives can see operational results at sub-second speed.
Many will write their business case for SAP HANA simply based on data availability and performance alone and make a strong case for why it should be implemented in their organizations.
4.4.2 Budgeting for an SAP HANA Implementation
You must budget for four core areas in an SAP HANA implementation:
EE Hardware
EE Project costs
EE Support costs
EE Training and transition costs
Hardware is the easiest because you just need to size your environments and obtain a quote from your hardware vendor. Remember to budget for hardware support costs and a support package that meets your system response time (i.e., 24×7, and
Personal Copy for RGA Rik Vriens, user id c3b3ffa0-d601-c76a-06ae-b5f2c05f5c4a

104
SAP HANA and Your Business Strategy4
30-minute response). The software licensing from SAP should also be included in this costs estimate.
Project costs are harder to determine because they depend largely on the size of the system, the complexity of the system, the need for regression testing, the need for disaster recovery, the user community, the modules already implemented, the available skill sets, and the Basis team’s existing knowledge.
Working with a strong implementation partner can help estimate the project efforts; most companies will benefit from a 60-40% mix of internal and external resources. You can also start with a sandbox environment for testing before detailed budgeting is done for a large-scale SAP ERP conversion project.
For SAP NetWeaver BW, the costs are somewhat easier to estimate, and most com-panies with a sandbox, development, testing, and production landscape should plan for an 8 -16 week implementation time frame depending on the size and complexity of their current SAP NetWeaver BW implementation. Some implementations may be somewhat longer.
Support costs include staffing your support organization appropriately. A benchmark estimate is that each environment may need 0.15 to 0.2 support staff for applying SAP Notes, upgrades, system monitoring, backups, and overall Basis tasks. Depend-ing on the company’s model and internal support structure, this may require 0.6 to 0.8 full-time employees (FTEs) dedicated in a four-tiered system environment. Reasonable operational support levels (not including new development or other environments such as portal, LDAP, etc.) may be estimated as shown in Table 4.6.
Environments Benchmarks Full-Time Employees (FTE)
Standard Basis Support Staffing
Low Basis Support Staffing
High Basis Support Staffing
Stan
dard
Sandbox 0.20 0.15 0.40
Development 0.20 0.15 0.40
Testing 0.20 0.15 0.40
Production 0.30 0.20 0.50
Table 4.6 SAP HANA Basis Operational Support Staff Levels
© 2013 by Galileo Press Inc., Boston (MA)

105
Writing a Business Case, Budgeting, and Staffing for SAP HANA 4.4
Environments Benchmarks Full-Time Employees (FTE)
Standard Basis Support Staffing
Low Basis Support Staffing
High Basis Support Staffing
Opt
iona
l
Training Development
0.20 0.15 0.40
Training Production
0.20 0.15 0.40
Technical Sandbox
0.20 0.15 0.40
System Testing 0.20 0.15 0.40
Table 4.6 SAP HANA Basis Operational Support Staff Levels (Cont.)
The last item to be budgeted is training and transition costs. The best method to achieve this is to complete an internal resource skills assessment.
Figure 4.7 SAP HANA Training Classes Available
Personal Copy for RGA Rik Vriens, user id c3b3ffa0-d601-c76a-06ae-b5f2c05f5c4a

106
SAP HANA and Your Business Strategy4
After this is completed, a training plan should be implemented. As of July 2012, SAP had three e-learning courses and two instructor-led SAP HANA courses avail-able. Participants who complete these courses may take the 80-question certification exam for SAP HANA and become a certified application associate. The available SAP HANA courses are summarized in Figure 4.7.
4.4.3 Staffing an SAP HANA Implementation
You may recall from Chapter 2 that we briefly outlined the skills requirements of SAP HANA implementations. In this section, we go into more detail about indi-vidual job titles and what is needed and expected of them. (Because a person may be able to complete multiple roles, be sure not to confuse this set of roles with positions or FTEs.)
Project Manager
The project manager should be a dedicated resource and not be involved in other major projects. This role is the key to the project’s success. The manager is respon-sible for the following:
EE Creating and maintaining all project plans and organizing the work environment
EE Making timely decisions and delegating tasks
EE Effectively communicating with all members of the team
EE Facilitating project meetings
EE Understanding key concepts of SAP HANA and their implications
EE Managing crises and issues effectively
EE Ensuring that deadlines are met and quality is delivered
EE Managing time and expense
SAP HANA Architect
The SAP HANA architect should be an individual who is familiar with all technology aspects. The architect should have participated on more than one successful project in a key technical role, as well as a thorough understanding of SAP HANA tools, design, and technical infrastructure. The architect is responsible for the following:
© 2013 by Galileo Press Inc., Boston (MA)

107
Writing a Business Case, Budgeting, and Staffing for SAP HANA 4.4
EE Integrating all applied technologies and designing the technology architecture for all integrated systems
EE Supervising the technical aspect of the transition
EE Leading any additional tool or vendor evaluations and providing recommenda-tions to the project leader
EE Providing input and recommendations on technical issues to the project leader
EE Reviewing the technical work of other team members for quality assurance
EE Reviewing and participating in testing of data design, tool design, data loads, and presentation system design or standards
EE Maintaining transformations, gateways, and networks, and performing hardware selection and sizing
Business Analysts/Testers
The business analysts/testers are responsible for the overall testing of the project’s functionality. These individuals are responsible for gathering detailed testing require-ments from the business users within the organization. The ideal candidate for this position should have detailed knowledge of the company and a solid understanding of the needs of the organization. The individual should also have strong commu-nication skills and the ability to plan, conduct, and document test scenarios, test cases, and test problem reports with managers and users. The analysts will also be managing the user acceptance testing and feedback process from representatives of the user community, as well as ensuring that those requirements are being met by the system being converted. For large projects, there may also be a test lead, test coordinator, and test administration support person.
Hardware Vendor Staff
The hardware vendor will work with the SAP HANA architect on the actual install of the hardware system at the data centers. Most hardware vendors will send one or two people to accomplish this over one to three weeks. Some vendors will require a system, or data center, layout before arriving on-site.
Developers
This role depends on how much new functionality the organization wants to roll out during the first conversion project. Some companies will simply convert their
Personal Copy for RGA Rik Vriens, user id c3b3ffa0-d601-c76a-06ae-b5f2c05f5c4a

108
SAP HANA and Your Business Strategy4
SAP ERP and SAP NetWeaver BW systems to the SAP HANA platform, while others will include development work to take advantage of the new system as well (i.e., SAP Business Objects implementations, ABAP report conversions, or new function-ality). Each of these initiatives should be sized individually, and it’s advisable to keep these as separate projects after the SAP HANA conversion project completion.
SAP Support
Having access to SAP support staff for the project is also a key to success. Every project should have a contact list of key SAP support resources who can be contacted directly for support and assistance. This may be through on-site full-time resources from the Regional Implementation Groups (RIGs) or from the SAP consulting organization, or it might be in the form of access to key individuals dedicated to supporting the project from a technical standpoint.
4.4.4 Building a Roadmap
Your SAP HANA strategy drives your BI and IT departments’ activities, programs and projects, and skillset requirements. By having a strategy in place, you are set-ting up the roadmap for everyone to follow and collectively work toward. This will also keep your user community happier because you are communicating a clear path and vision of the end goal and the steps along the way.
One large impact created by using SAP HANA and in-memory analytics is with that roadmap. When you first created your BI strategy and roadmap, SAP HANA was likely not even a gleam in SAP founder Hasso Plattner’s eyes, so it was never considered as part of your roadmap. As you look at your BI strategy and build in the transformational opportunities as part of your newly enhanced vision, you now need to incorporate SAP HANA into your BI roadmap plan.
You approach this effort one step at a time, as shown in Figure 4.8. The key steps are also listed here:
1. Define the overall vision and guiding principles. Identify targeted BI capabilities.
2. Assess your progress against targeted capabilities (best practice and Harvey Ball assessments are common).
3. Develop a roadmap showing the interrelated dependencies/timing for the key initiatives.
© 2013 by Galileo Press Inc., Boston (MA)

109
Writing a Business Case, Budgeting, and Staffing for SAP HANA 4.4
4. On an ongoing basis, monitor the progress of initiatives on the roadmap and associated progress toward achieving targeted BI capabilities.
Define overall vision and guiding principles. Identify targeted BI capabilities.
Evaluate advancement against targeted goals.
Create a roadmap that shows dependencies and timing for the key initiatives.
Monitor progress achieving initiatives on the roadmap and achieving targeted BI goals.
BI Framework
Vision and guidingprinciples
BI roadmap
AssessmentCurrent and planned
initiatives
Monitor and update
Figure 4.8 Roadmap Development
SAP HANA will change the look of this roadmap and the tools, solutions, and capabilities that are delivered along the way to your end-state vision of BI and analytics. For example, you may decide to shift from a multi-vendor approach for BI and analytics to a single-vendor approach. You may be considering or have already implemented different solutions for your various BI needs, assuming that there were no tools available at the time to create those real-time insights that you needed for massive amounts of data. You may now be able to transition to a single platform and gain the efficiencies and benefits of such a move.
You may change the vision of what your end-state BI solution looks like as well. Successful BI has four simple parameters: get the right information to the right people at the right time and in the right form. With in-memory solutions such as those enabled by SAP HANA, your definition of right information and right time can change considerably.
You may decide that you no longer need to have an SAP reporting strategy and a BI strategy because they can be the same. Remember that there are many new possibilities to consider.
You may decide that you can create new business processes and perspectives by enabling mobile solutions that bring together massive amounts of data in real time or near real time for your customer-facing workforce.
Personal Copy for RGA Rik Vriens, user id c3b3ffa0-d601-c76a-06ae-b5f2c05f5c4a

110
SAP HANA and Your Business Strategy4
You may decide to delay—or speed up—hardware or database changes or invest-ments. Remember that in-memory analytics enabled by SAP HANA are merely the first step on SAP’s HANA journey. SAP is committed to having its entire transaction suite running on SAP HANA platforms in the very near future. Does that change your decisions to renew or negotiate your positions with current vendors?
You’ll have to factor a different set of skillsets and capabilities into your training and hiring plans. With SAP HANA for standalone applications, you’ll need a combina-tion of traditional BI and business analyst skills along with specialized technical skills for those who will be responsible for designing and developing these new SAP HANA solutions.
Additionally, you’ll need to look at the skills of your current SAP NetWeaver BW team. There are many skills that are transferable when you move your current (or future) BW environments to an SAP HANA-enabled solution, including data extrac-tion and movements, transformation skills, cube development, query development, report and dashboard development, user administration, security and authoriza-tions, and so on. However, these skills will need to be augmented with the technical know-how of Best Practices when working with an SAP HANA-enabled solution because how you build a BW system, how you manage your BW system, and how you handle disaster recovery will all be different.
With all of these possibilities and many more that weren’t mentioned, it’s certain that SAP HANA will impact your BI strategy, but the depth and variety of the impact will vary from organization to organization.
Some organizations are hesitant to embrace new technologies and solutions, so the impact (at this point) may purely be to draw a line in the sand to “wait and see” how others are doing with SAP HANA in a year or two. Then these organizations will assess how SAP HANA might be integrated slowly into the organization for point solutions or use cases but without significant change to existing plans or visions.
Organizations at the other end of the spectrum are ready to blow the roof off their existing systems and embrace this new solution. These organizations realize that in-memory isn’t new even though SAP HANA itself has only been around for a short time. These organizations are more likely to embrace this new solution as a way to address business users’ needs for more information on a timelier basis. These are organizations that are marching up the maturity scale and have recognized the value of information and insight to the organization and its leaders.
© 2013 by Galileo Press Inc., Boston (MA)

111
Frequently Asked Questions about SAP HANA 4.5
And somewhere in the middle sit many organizations that are willing to evaluate and consider SAP HANA but aren’t quite ready to change their roadmaps just yet. These organizations will insert (generally small) pilot projects for very specific use cases—a particular problem or business need that they have not yet been able to address in a reasonable manner for all parties—and progress slowly with their in-memory journey. They will likely slow other existing projects while they investigate the in-memory solutions and then slowly add them into the roadmap.
As with many things in the BI and analytics area and in SAP overall, there are no absolute right or wrong answers to how to integrate HANA and in-memory solutions into your BI roadmap. With that said, next we’ll take a look at some frequently asked questions about SAP HANA, and what the best possible answers to these questions are.
4.5 Frequently Asked Questions about SAP HANA
Now that you’ve been introduced to the ideas behind in-memory computing, how SAP HANA fits into this picture, and how to start building an SAP HANA strategy, let’s conclude the chapter by discussing some of the most frequently asked ques-tions about SAP HANA.
4.5.1 Is SAP HANA a Database, Hardware, or a Solution?
SAP HANA is all of these and yet none of these in pure terms. SAP HANA is an in-memory database “appliance” but is not an application. And, although not a solution per se, it is a technology that enables solutions. SAP HANA is a database that adds a performance boost by placing data to be processed in RAM instead of reading it off disks. This is combined with special hardware and (in the case of standalone SAP HANA) includes tools and capabilities.
Today SAP HANA offers a technology foundation that a customer can implement to address reporting challenges. A customer can install SAP HANA and replicate data from its SAP ERP or non-SAP ERP systems to the SAP HANA database to address specific challenges. Alternatively, a customer can implement SAP HANA as a database replacement on an existing SAP NetWeaver BW system to dramatically improve the performance of that BW system.
Personal Copy for RGA Rik Vriens, user id c3b3ffa0-d601-c76a-06ae-b5f2c05f5c4a

112
SAP HANA and Your Business Strategy4
SAP HANA is not a replacement for SAP NetWeaver BW or SAP Business Objects solutions. SAP HANA augments or enhances those solutions.
4.5.2 What Type of Customer is Looking at SAP HANA Solutions?
Customers for all industries, segments, and geographies are looking at SAP HANA. The typical customer has or deals with significant amounts of data and is experi-encing challenges with executing (operational) reports that require huge amounts of computing power either for brute force calculations or to compile and calculate against billions of pieces of information.
The types of customers who may not be looking at SAP HANA are small- and medium-sized enterprise (SME) customers for whom SAP HANA is too expensive a solution for their reporting and analytic problems. This is not to say that the SME market can’t benefit from SAP HANA, but it just may be at a price point that isn’t acceptable for them.
4.5.3 What Are the Problem Statements that Identify a Need for SAP HANA?
Key pain points are those that deal with frustration around the amount of time and/or effort to address reporting challenges:
EE Reports or analyses that require billions of data inputs
EE Solutions that they are currently applying brute force to address—lots of man-hours or computing power
EE Information needs that SAP ERP and SAP NetWeaver BW haven’t been able to effectively address due to the data volumes or processing power
These pain points usually apply to point-of-sale data, GPS data from transportation firms, banking transactions, and retail transactions, for example.
4.5.4 What Is the Differentiator for SAP with SAP HANA?
SAP is in the process of developing, and eventually marketing and selling, dozens to hundreds of additional out of the box SAP HANA-based applications for the SAP customer, focusing on industry and line of business solutions.
© 2013 by Galileo Press Inc., Boston (MA)

113
Frequently Asked Questions about SAP HANA 4.5
At present SAP has developed and released a couple of applications for SAP HANA, most notably an SAP HANA-enabled CO-PA solution. SAP customers who deploy SAP HANA will also be able to leverage its real-time and in-memory capability for additional SAP solutions and products such as SAP Business Planning and Consolidation (SAP BPC), thereby allowing them real-time operational planning, simulation, and forecasting.
In addition to the applications (apps) that SAP is building, SAP is encouraging its partners—both large and small—to build SAP HANA apps and will be creating an App Store for direct customer access to view and purchase these apps.
4.5.5 What Is SAP Envisioning for the Future of SAP HANA?
SAP HANA is currently available to customers as either a standalone solution or for the foundation of their SAP NetWeaver BW solution. The future, according to SAP, is for SAP HANA to be the underlying database for the SAP ERP environment. SAP has publicly committed that it will be showing an SAP ERP environment running on an SAP HANA platform by the end of 2012, but how large and complex this environment will be—and when the market will readily adopt this platform—is yet to be seen.
4.5.6 Is SAP HANA Plug and Play?
Absolutely not. Installation of the SAP HANA box requires time services work associated with racking and stacking the box and making it ready to use. The cli-ent must perform administration functions on the SAP HANA database to model the data and must perform the configuration and steps necessary to move data into SAP HANA. This may involve SAP Data Services or SAP data replicator tools.
Customers must then integrate or purchase a BI tool to access the SAP HANA data and be the user interface. The BI tool must be configured, and the services for this will vary according to the level required for the solution. Security and authoriza-tions must be set up as well.
4.5.7 Can Non-SAP Business Intelligence Tools Work on Top of SAP HANA?
Although this hasn’t been fully tested in a live customer environment yet, there is likely no technical reason to prevent non-SAP BI tools from being connected to
Personal Copy for RGA Rik Vriens, user id c3b3ffa0-d601-c76a-06ae-b5f2c05f5c4a

114
SAP HANA and Your Business Strategy4
SAP HANA. SAP HANA offers three interface methods: MDX, SQL, and the BICS (BI Consumer Services) tools for the SAP Business Objects set. The only SAP-certified interfaces at this point are the Business Objects tools and Microsoft Excel. SAP is in the process of testing and certifying non-SAP BI tools.
4.5.8 What Does a Customer Need to Buy to Use SAP HANA?
An SAP HANA solution requires a combination of hardware and software. The client must purchase the SAP HANA box from any of the approved hardware vendors. The customer must then purchase the SAP HANA licenses from SAP. In addition, the customer must leverage or license a BI tool to put on top of SAP HANA as the user interface.
4.5.9 How Much Does SAP HANA Cost?
This depends entirely on how you want to use SAP HANA, how much data will be involved, and to some degree, how well you can negotiate with SAP. SAP controls the licensing cost of SAP HANA as well. The average SAP HANA license sale is $400,000, with deal sizes that can reach $10M in just licensing. As of this writing, SAP is not discounting the SAP HANA licenses, but you may be able to negotiate attractive deals if bundled with other SAP tools and solutions.
The hardware for SAP HANA begins at approximately $40,000 for the smallest box and goes up from there. Your hardware vendor will configure the box(es) that are best for you, but the sizing is generally referred to in T-shirt sizes, with the XS box being approximately $40,000 after discounts.
The client must perform (or incur the cost of the services for) administration func-tions on the SAP HANA database to model the data and must perform the configu-ration and steps necessary to move data into SAP HANA, which may involve SAP Data Services or SAP data replicator tools.
Customers must then integrate or purchase a BI tool to access the SAP HANA data and be the user interface. The BI tool must be configured, and the services for this will vary according to the level required for the solution. Security and authoriza-tions must be set up as well.
© 2013 by Galileo Press Inc., Boston (MA)
115
Summary 4.6
4.5.10 Does SAP HANA Replace BWA for Customers?
Not at this time. For today, SAP HANA is a complementary solution. BWA reads structured SAP NetWeaver BW data and only structured SAP NetWeaver BW data. It accelerates the BW data-read process and feeds the results into BW queries and ultimately the reports that sit on top of those queries.
SAP HANA sits outside of SAP NetWeaver BW and can directly access SAP ERP and non-SAP ERP data (including BW if you choose to replicate BW data into SAP HANA). There is no SAP NetWeaver BW query interface to SAP HANA, and only the BI tools implemented on top of SAP HANA will have access and visibility to those data sets.
BWA is about accelerating SAP NetWeaver BW reporting now. SAP HANA is about accelerating different reporting problems and will be about accelerating SAP NetWeaver BW reporting in the future. There is no reason to stop a BWA installa-tion at this time due to SAP HANA.
In the future, when SAP NetWeaver BW is generally using SAP HANA as its under-lying database, the need for BWA will go away.
4.5.11 Is SAP HANA Just Another SAP Fad That Will Not Have a Long Lifespan—Like mySAP?
SAP HANA is a new technology that SAP has bet its future on—not a repackaging of existing solutions. This technology will not go away. SAP is moving toward a time when their customers have their SAP systems (SAP ERP, BW, etc.) sitting on an SAP HANA database instead of an Oracle database. SAP has made a strong state-ment that it wants to be the #2 database vendor by 2015.
4.6 Summary
As we close Part I of this book, we hope that you now have a fuller picture of what SAP HANA is and what types of SAP HANA are generally available as of this writ-ing. By understanding what each version of SAP HANA is and is not meant for, you can assess how SAP HANA might fit as an enablement tool for your reporting and analytics solutions within your organization. You also have the tools you need to establish an SAP HANA strategy, and then translate the vision into reality. A
Personal Copy for RGA Rik Vriens, user id c3b3ffa0-d601-c76a-06ae-b5f2c05f5c4a

116
SAP HANA and Your Business Strategy4
successful BI strategy gets the right information to the right people at the right time and in the right form. Sounds simple enough, right?
With SAP HANA in the mix, you can drive down to the needs that require billions of rows of data with real-time visibility. There is no limit to what you can do. You just have to define what you need to do, what you want to do, and what you should do. What’s right is what works to get the right information to the right users in the right form at the right time—for your organization.
In Part II of this book, we transition to the more technical aspects of SAP HANA. We will show you how to configure and work with the various components that have been discussed in these first chapters.
© 2013 by Galileo Press Inc., Boston (MA)

PART IIHow
Personal Copy for RGA Rik Vriens, user id c3b3ffa0-d601-c76a-06ae-b5f2c05f5c4a

© 2013 by Galileo Press Inc., Boston (MA)

119
Before you embark on an SAP HANA implementation, you need to know some key pieces of information.
5 Planning an SAP HANA Installation
This chapter focuses on the first decisions you have to make when installing SAP HANA. We take a look at the different components of the appliance and provide insights into sizing, hardware, and the technical requirements for getting SAP HANA implemented in an organization. We conclude with a section devoted to some special considerations related specifically to the SAP HANA for BW scenario.
Note
Because the steps vary dramatically based on your chosen SAP HANA version, edition, and your existing IT landscape, it is out of the scope of this book to provide step-by-step installation instructions for SAP HANA. However, the content provided in this chapter should give you a good understanding of what decisions you need to make before decid-ing on an appropriate installation route.
5.1 In-Memory Computing Engine (IMCE)
To many, the components of SAP HANA may be a bit confusing. After all, SAP HANA is supposed to be an “appliance” with all components hidden from the users. However, inside the In-Memory Computing Engine (IMCE) of SAP HANA, many different components manage the access and storage of the data (Figure 5.1).
First, the disk storage is typically a file system that allows for data security and log-ging of activities, which is managed in the persistence layer. There is also a relation engine where the row or column store is managed. Whether your implementation will use a row or column store depends on the content you’re implementing as well as the system you’re placing on top of SAP HANA (i.e., SAP NetWeaver BW or SAP ERP). All systems will use a combination of row and column stores. However, when you’re building your own data set from tools such as SAP Data Services (ETL-based replication), you’ll have an option to implement either method.
Personal Copy for RGA Rik Vriens, user id c3b3ffa0-d601-c76a-06ae-b5f2c05f5c4a
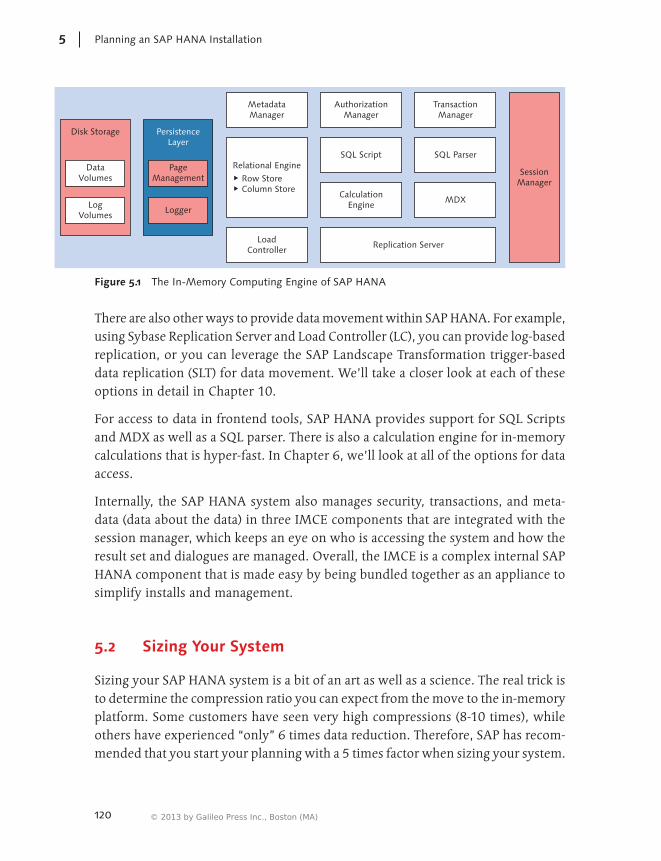
120
Planning an SAP HANA Installation5
MetadataManager
PageManagement
Logger
AuthorizationManager
SQL Script
CalculationEngine
TransactionManager
SQL Parser
SessionManager
MDX
Replication Server
Relational Engine� Row Store� Column Store
LoadController
Disk Storage
DataVolumes
LogVolumes
PersistenceLayer
Figure 5.1 The In-Memory Computing Engine of SAP HANA
There are also other ways to provide data movement within SAP HANA. For example, using Sybase Replication Server and Load Controller (LC), you can provide log-based replication, or you can leverage the SAP Landscape Transformation trigger-based data replication (SLT) for data movement. We’ll take a closer look at each of these options in detail in Chapter 10.
For access to data in frontend tools, SAP HANA provides support for SQL Scripts and MDX as well as a SQL parser. There is also a calculation engine for in-memory calculations that is hyper-fast. In Chapter 6, we’ll look at all of the options for data access.
Internally, the SAP HANA system also manages security, transactions, and meta-data (data about the data) in three IMCE components that are integrated with the session manager, which keeps an eye on who is accessing the system and how the result set and dialogues are managed. Overall, the IMCE is a complex internal SAP HANA component that is made easy by being bundled together as an appliance to simplify installs and management.
5.2 Sizing Your System
Sizing your SAP HANA system is a bit of an art as well as a science. The real trick is to determine the compression ratio you can expect from the move to the in-memory platform. Some customers have seen very high compressions (8-10 times), while others have experienced “only” 6 times data reduction. Therefore, SAP has recom-mended that you start your planning with a 5 times factor when sizing your system.
© 2013 by Galileo Press Inc., Boston (MA)

121
Sizing Your System 5.2
The differences in these compression numbers come from the fact that some SAP customers are already using relational databases with extensive compression methods (e.g., DB2 v9.7), while others are using databases with less compression capabilities. Naturally, we expect to see higher compression numbers in databases that have little compression already.
In addition, there are differences in how data types are compressed (i.e., strings are actually arrays in most databases), while numbers are already compressed up to 50% in most versions of Oracle databases. Finally, there are differences in the size of indexes that are row based versus those that are column based. To get a rough estimate, going by SAP’s 5-times rule of thumb is a reasonable first step.
SAP Notes for Further Reference
For more information, see SAP Note: 1514966 (SAP HANA: Sizing SAP HANA Database) and SAP Note 1637145 (SAP BW on HANA: Sizing SAP HANA Database). Work with your preferred vendor before ordering your hardware or finalizing your budgets.
Next, we discuss the SAP tools available for the task of sizing your SAP HANA system.
5.2.1 SAP Quick Sizer for SAP HANA
SAP has provided a Quick Sizer for SAP HANA, which is available at http://service.sap.com/quicksizer. There are three versions of the tool for each of the different ver-sions of SAP HANA, as shown in Figure 5.2.
The Quick Sizer for the Rapid Deployment Solutions (RDS) allows you to size for specific SAP ERP components. The second Quick Sizer version is for SAP HANA on SAP NetWeaver BW, and the last is for those who want to use SAP HANA as a stand-alone platform for in-memory data (i.e., using SAP Data Services to load data to).
In our example, we look at the second option, the Quick Sizer for SAP HANA on SAP NetWeaver BW, where SAP HANA memory requirements for caches and addi-tional components are somewhat fixed at approximately 30GB. (The rest is driven by the size of the column and row stores.)
The first step in using the Quick Sizer is to enter the project information such as the operating system, hardware, and database. After that, you enter the Quick Sizer menus (Figure 5.3).
Personal Copy for RGA Rik Vriens, user id c3b3ffa0-d601-c76a-06ae-b5f2c05f5c4a

122
Planning an SAP HANA Installation5
Figure 5.2 The Versions of SAP HANA Quick Sizer
Figure 5.3 SAP Quick Sizer for BW with SAP HANA
© 2013 by Galileo Press Inc., Boston (MA)

123
Sizing Your System 5.2
In the Table 1 area at the top of the screen, you enter the planning information (if you’re using planning in SAP NetWeaver BW). The fields marked with a red star are mandatory fields. For H-PLAN-1, you enter the maximum concurrent users in the Users field. The S.t. and E.t. fields are the start and end times for the processing. By entering this type of information, you’ll also get estimates of loads on the SAP HANA system by time periods at the end of the sizing exercise.
In Table 2, you enter the estimated number of information consumers (H-BW-INFO), business users (H-BW-BUSI.), and experts (H-BW-EXPER). SAP suggests a ratio of 71%, 26%, and 3%, respectively, for each user group, but you can enter your own mix if you have better estimates.
It’s important to note that the number of SAP NetWeaver BW users refers to con-current users (not named users). But you can get great estimates of this from your EarlyWatch report in SAP Solution Manager. Your Basis team should be able to provide this information.
In the Report., OLAP, and Explor. columns, you should enter the estimated per-centage distribution of the users. In this example, we’re estimating that of the 438 information consumers, 33% will consume static pre-formatted reports; 56% will use OLAP tools such as SAP BEx Web Analyzer or SAP Business Objects Analysis; the last 11% will be exploring data and have a high amount of navigation activity. These estimates help SAP Quick Sizer estimate the size of the memory required.
In Table 3, you estimate how many records will be loaded to SAP NetWeaver BW periodically. In this example, we’re estimating that 279,994,355 records will be loaded each day between noon and 1pm.
In Table 4, you estimate a 2.9TB footprint in the column data store and a 500GB footprint in the row data store in SAP HANA. This sizing number is database spe-cific, and SAP provides a couple of programs to assist you in getting good estimates. In SAP Note 1637145, SAP BW on HANA: Sizing SAP In-Memory Database, there are programs you can run on SAP NetWeaver BW to get good sizing numbers. The shell script for each database type is located in the file get_size.ZIP, which should be extracted and executed along with the file called load_RowStore_List.SQL for size input to Table 4. The exception to this approach is the IBM DB2 database on the z/OS. For this combination, there is an ABAP program instead (all this information is found in the SAP Note referenced earlier in this paragraph).
While actual compression rates and examples are frequently provided by SAP from real clients, we estimate a compression rate of 1:5. This compression rate will
Personal Copy for RGA Rik Vriens, user id c3b3ffa0-d601-c76a-06ae-b5f2c05f5c4a

124
Planning an SAP HANA Installation5
probably be higher for your actual system, but a five-times compression estimate will ensure that you don’t significantly undersize your hardware.
You’re now ready to add the information of the actual BW system. Most of the information required in Table 5 and Table 6 (Figure 5.4) is available in the Admin-istrator Workbench (RSA1) in SAP NetWeaver BW, reports such as SAP_ANALYZE_ALL_INFOCUBES, ANALYZE_RSZ_TABLES, and SAP_INFOCUBE_DESIGNS, which also provides information for each InfoProvider.
Figure 5.4 SAP Quick Sizer for BW with SAP HANA—BW Data
In Table 5, you enter the InfoCube information. The max number of dimensions (Dim. field) you can enter is 13. The three fixed dimensions of an InfoCube are already included, so just enter the free dimensions. The field KeyF. refers to the number of key figures in the fact table of your InfoCube, while the field Com. is the estimated compression. If you don’t have better estimates, a rate of 5 may serve for the initial sizing before your refine the estimates with your hardware vendor.
In the Initial load field, you enter the number of records in the existing InfoCube, and in the Period. Upld field, you enter the number of records you estimate will be loaded periodically. This record number information is available in many ways in SAP NetWeaver BW. For example, you can find this information by going to each InfoCube in RSA1, and then right-clicking and selecting Manage in the content tab.
© 2013 by Galileo Press Inc., Boston (MA)

125
Sizing Your System 5.2
From here you select Number of Entries to see the number of records of the fact table. The program ANALYZE_RSZ_TABLES will include all entries in the dimen-sion tables as well. These numbers can be used for the initial load estimate. For the upload estimate, the data packages will tell you how many records are loaded daily. Because this drives a significant portion of SAP HANA’s size, it’s important to spend some time getting these numbers as accurate as possible.
The last item in Table 5 is to estimate how many data loads will be kept in SAP NetWeaver BW. In this example we’re estimating daily loads for most InfoCubes and intend to keep 2 years of data. This would be 2 × 365 = 730, but we have included scheduled downtime for upgrades, patches, and services that we’re planning next year, so the actual will be somewhat lower (notice that the last InfoCube in our estimate is periodically loaded, so we only plan for 208 periods).
In Table 6, the estimates for the data store objects (DSO) are added. The logic is very similar to those in Table 5, but the fields NumF., TxtFlds, and CharL. refer to the number of numeric fields in the DSO, the number of text fields, and the average length of character fields, respectively. This is hard to estimate, so good design information from your SAP NetWeaver BW team is required.
The field flag WO isn’t required, but it allows you to identify whether the DSO is write optimized and therefore won’t have as many log-file entries as a regular DSO. The remaining fields are the same as for the InfoCubes in Table 5.
After you’ve completed the entries, the Quick Sizer will give you a good initial size estimate of the components required. Figure 5.5 shows the results of this example.
Figure 5.5 The SAP HANA Quick Sizer Results
Personal Copy for RGA Rik Vriens, user id c3b3ffa0-d601-c76a-06ae-b5f2c05f5c4a

126
Planning an SAP HANA Installation5
As you may have noted, this SAP HANA sizing example calls for 1.6TB of memory. Because we’re unlikely to get this in a single server node, we’ll have a multi-node system. In this case, SAP HANA for BW will deploy the master data, ABAP system tables, and row store data on the master node. The other connected server node(s) will contain the Persistent Staging Area (PSA), InfoCubes, and DSOs.
When adding many nodes, there will be more processing on the master node (such as master data lookups), so it’s important to work with your hardware vendor to add more memory to the master node beyond what the Quick Sizer estimated. Armed with this information, you can approach the hardware partner for quotes and cost estimates.
5.2.2 Some Quick Sizing Rules to Follow
There are some other quick ways to get a basic idea of how large your system is going to be. These rules of thumb are great for preliminary estimates and high-level budgeting, but to get exact numbers, you should complete a real sizing effort as outlined previously.
Memory is what most people think of when considering SAP HANA. It can be estimated by taking the current system size, estimating a 5 times compression, and multiplying this by two.
Memory = (Source Data Footprint ÷ 5) × 2
For example, you could start with an SAP NetWeaver BW data warehouse system, clean the log files, remove aggregates (not needed with SAP HANA), compress your InfoCubes, clean the PSA, and get rid of unused DSOs and InfoCubes. With this cleaned SAP NetWeaver BW system, you have a starting point for your SAP HANA sizing. For SAP ERP systems, parts of log files may be deleted, and older tables may be archived (Transaction SARA), thereby reducing the size of the overall system.
In our rule-of-thumb example, if you had a 1TB BW system, you would divide it by 5, which gives you a 200GB size. Then you multiply it by 2, to allow for memory for internal processes, indexing, data movement, and end users. This gives a rough estimate of 400GB of memory needed.
The next item you need is disk space, which can be estimated by the following:
Disk for persistence layer = 4 × Memory
© 2013 by Galileo Press Inc., Boston (MA)

127
Sizing Your System 5.2
Disk for the log = 1 × Memory
In this example, you need 4 × 400GB disk for the persistence layer and about 400GB for the logs. This equals around 2TB (don’t worry, disk space of this size is now almost “cheap”). The persistence layer is the disk that keeps the system secure and provides for redundancy if there are any memory failures, so it’s important not to underestimate this.
You can always add more as the system grows, but it’s better not to have so little disk that the first thing to do after go-live is adding more. So “over sizing” is encour-aged. Also, this disk should not be placed on a shared, high-usage, Storage Area Network (SAN). Keep the SAP HANA disk as dedicated as possible.
The CPUs are based on the number of cores that you include. For example, 8 and 10 core CPUs now exist (depending on when you bought your system). If you have an 8 × 8 core system, you will have 64 cores and can handle 320 active users. For SAP vendor sizing, it’s common to add processors based on the SAP HANA memory size, so your actual number will be somewhat different. CPU needs are figured with the following:
CPU = 0.2 CPU cores per active user
Depending on whom you give access to, the concept of active users may be hard to pin down. In the past, we’ve seen 20% to 40% of named users being active in SAP NetWeaver BW, while a higher number is normal in SAP ERP systems. You can get the actual usage numbers from the EarlyWatch report in SAP Solution Manager. This will show you how many of your named users are currently using your system with a breakdown of their activities as low, medium, and high. This can be a great input in determining how many CPU cores you may need.
The CPU speed may vary a bit depending on when you bought your SAP HANA system, but as of the summer of 2012, IBMs Intel Xeon E7 series had a clock speed of 2.40GHz, and even faster processors are likely in the years to come.
5.2.3 SAP’s T-Shirt Sizing Model for SAP HANA
SAP has also published a T-shirt sizing model to act as a guide for customers inter-ested in a quick estimate for their system. The model is based on similar rules as outlined previously but categorizes the sizes into convenient Extra Small to Large SAP HANA environment sizes (Table 5.1).
Personal Copy for RGA Rik Vriens, user id c3b3ffa0-d601-c76a-06ae-b5f2c05f5c4a

128
Planning an SAP HANA Installation5
Data Compression (from)
Working Memory
PCLe Flash/SSD
Processors SAS/SSD (for data)
Replication Speed (per hour)
Large (L) 2500– 5000GB 1024GB 1200GB 8 × 8 Core Intel Nehalem (EX)
4096GB 5–20GB
Medium-Plus (M+)
1250–5000GB 512GB 640GB 4 × 8 Core Intel Nehalem (EX)
2048GB 5–20GB
Medium (M)
1250–2500GB 512GB 640GB 4 × 8 Core Intel Nehalem (EX)
2048GB 5–20 GB
Small-Plus (S+)
500–2500GB 256GB 320GB 2 × 8 Core Intel Nehalem (EX)
1024GB 5GB
Small (S) 500–1250GB 256GB 320GB 2 × 8 Core Intel Nehalem (EX)
1024GB 5GB
Extra Small (XS)
256–500GB 128GB 160GB 2 × 8 Core Intel Nehalem (EX)
1024GB 5GB
Table 5.1 SAP HANA T-Shirt Sizing
As more cores are available (currently 10), this guide may be updated, and customers who want to exceed 1,024GB memory should work with their hardware partner to connect multiple node systems together for increased scalability.
Another major factor for many will be the speed with which you can replicate data. The smaller systems are confined to around 5GB per hour, while the larger systems can get up to 20GB and more. Because these numbers change frequently with new hardware versions and new SAP HANA versions, these numbers should serve as a guide only. This is a quickly improving field, so by nature, most hardware
© 2013 by Galileo Press Inc., Boston (MA)

129
Software and Technical Requirements 5.3
examples may have limited usefulness. For example, you can now buy physical systems with 10 cores per processor.
5.3 Software and Technical Requirements
Many buyers are surprised to find that SAP has actually created three different editions of SAP HANA (not to be confused with the two different versions that we discussed in Chapters 1–4). The first is called HANA appliance software platform edi-tion, the second is called HANA appliance software enterprise edition, and the most complete solution is called HANA appliance software enterprise extended edition.
The editions are simply what components are included in the software licensing and how you want to extract, move, and replicate the data. For either version of SAP HANA—the standalone version or the SAP NetWeaver BW version—you then have the additional choice of three editions. If you want to use SAP HANA for clas-sical extract, transform, and load (ETL) development using SAP Data Services, you should choose the platform edition. This is great for non-SAP shops or customers who want to accelerate any sources, such as custom-made data warehouses, data marts, or data from non-SAP ERP systems.
The enterprise edition is for companies who want to use their SAP HANA system with trigger-based replication. The enterprise edition also includes SAP Data Services, so you can actually do both ETL and triggers. We’ll cover trigger-based replication in detail in Chapter 10.
Finally, the enterprise extended edition is for those who want it all. This adds the log-based replication of data to the other editions, and most large-scale organizations that already have SAP ERP or business intelligence (BI) software in their landscapes should seriously consider this edition.
Each of the editions also allows power users and authors to upload their own data and access the in-memory data via their own views using the Information Composer. This is a web tool that is installed separately from the components in the different SAP HANA editions. We’ll cover the Information Composer in much more detail in Chapter 7.
The components included in the three different SAP HANA editions are summa-rized in Table 5.2.
Personal Copy for RGA Rik Vriens, user id c3b3ffa0-d601-c76a-06ae-b5f2c05f5c4a

130
Planning an SAP HANA Installation5
Software Component Enterprise Extended Edition
Enterprise Edition
Platform Edition
SAP HANA Studio X X X
SAP HANA Information Composer X X X
SAP HANA Client X X X
SAP HANA Client for Excel X X X
SAP HANA User Interface for Information Access (INA)
X X X
SAP HANA Database X X X
SAP HANA Host Agent X X X
Diagnostics Agent X X X
SAP Data Services X X
SAP HANA Direct Extractor Connection (DXC)
X X
SAP Landscape Transformation Tool (SLT)
X X
Landscape Transformation Replication Server
X X
SAP HANA Load Controller (LC) X
Sybase Replication Server and Agent
X
Sybase Adaptive Service Enterprise (ASE)
X
Table 5.2 The Different Editions of SAP HANA
The operating system installed on your system will be SUSE Linux Enterprise Server (SLES) currently on version 11 Service Pack 1 (as of June 2012). From a technical standpoint, there are also subcomponents that you can find notes for on the SAP Marketplace website. These are best identified by their technical references as outlined in Table 5.3.
© 2013 by Galileo Press Inc., Boston (MA)

131
Software and Technical Requirements 5.3
Area Component ID Component Name
Lifecycle Management
BC-INS-NGP SAP HANA unified installer
BC-HAN-INS SAP HANA unified installer
BC-HAN-UPD Software Update Manager
BC-DB-HDB-INS SAP HANA database installation
BC-DB-HDB-UPG SAP HANA database upgrade
Platform Edition
BC-DB-HDB SAP HANA database
BC-DB-HDB-ENG SAP HANA database engine
BC-DB-HDB-PER SAP HANA database persistence
BC-DB-HDB-SYS SAP HANA database interface
BC-DB-HDB-DBA SAP HANA database/DBA cockpit
BC-HAN-MOD SAP HANA Studio
BC-HAN-3DM Information Composer
BC-HAN-SRC Search
BC-HAN SAP HANA appliance software
BC-CCM-HAG Host agent
BC-DB-HDB-MDX MDX engine: Microsoft Excel client
Enterprise Editions
BC-DB-HDB-DEC SAP HANA Direct Extractor Connection
EIM-DS SAP Data Services: ETL-based
BC-HAN-LOA SAP HANA Load Controller: log-based
BC-HAN-LTR SAP Landscape Transformation (SLT): trigger-based
BC-HAN-REP Sybase Replication Server: log-based
Table 5.3 SAP HANA—Internal Software Components and References
SAP has created a set of notes that are being appended and modified with the dif-ferent releases and service packs. For example, the release of SAP HANA Service Pack 4 (SP) in 2012 resulted in a new note (1703675). So partners and hardware vendors should read these key notes carefully and periodically for updates. These
Personal Copy for RGA Rik Vriens, user id c3b3ffa0-d601-c76a-06ae-b5f2c05f5c4a

132
Planning an SAP HANA Installation5
notes are available at the SAP Marketplace website for SAP customers as outlined in Table 5.4.
Note Number Note Name
1514967 SAP HANA: Central Note
1523337 SAP HANA Database: Central Note
1577128 Supported Clients for SAP HANA
1597355 Swap-Space Recommendation for Linux
1661202 Support for Multiple Applications on SAP HANA
1681092 Support for Multiple SAP HANA Databases on a Single SAP HANA Appliance
Table 5.4 Key Notes for the SAP HANA Install
Other components that are required to be installed on the SAP HANA box include the following:
EE Java Runtime Environment (JRE) This is used by Java components inside Studio. The system needs at least version JRE 1.6.
EE XULRunner This is a runtime environment for a common backend for XUL-based applica-tions. The system needs at least version 1.9.2.
EE Libicu This is a set of international components for Unicode.
EE Network Time Protocol (NTP) While technically not required, this supports trace files between SAP HANA nodes and should be installed.
EE Syslogd This is a logging tool for system messages.
EE GTK2 This is a software component for graphical user interfaces (GUIs).
The network connections between source systems and the SAP HANA server should be 10GBt/s to ensure that the data replication is efficient. Because a substantial
© 2013 by Galileo Press Inc., Boston (MA)

133
Row versus Column Indexes and the Persistency Layer 5.4
amount of data is going to be moving between these servers, it’s also important that the connection isn’t shared with other components such as through shared routers or switches. SAP recommends that these connections are dedicated to the servers only and that there isn’t a substantial distance between these environments (i.e., servers in Europe and Americas and an SAP HANA system in Asia). While this isn’t preventing such architecture, it could slow down the replication of the data due to slow network connections.
SAP HANA is also integrated into the standard solution monitoring and diagnostics of SAP Solution Manager just like other SAP software servers such as SAP NetWeaver BW and SAP ERP.
After you’ve decided what versions to install, your hardware partner can start the install. To simplify the install, SAP provides a software tool to the partners called the HANA Unified Installer.
With the install, you also get the Software Logistics Toolset (SL), which includes the Software Update Manager (SUM). This tool is used to provide software updates to the components of SAP HANA to help make sure they stay compatible over time. More details on the automated software update process are given in Chapter 11.
It’s important to note that only hardware vendors and installation partners should install the SAP HANA SL software and the components of SAP HANA. This isn’t something that Basis staff in organizations should attempt themselves because it’s simply too complex and too many details have to interact with hardware to do it correctly. Given that SAP HANA is also an emerging technology, it’s very unlikely that Basis staff in organizations have the required skills to make this work. So, while SAP does provide an online detailed guide for HANA Unified Installer, customers should leave the software install to the hardware vendors and certified partners.
5.4 Row versus Column Indexes and the Persistency Layer
Note
You may recall our brief discussion of row-based and column-based storage in Chapter 1. In this section, we get more detailed.
While there have been many algorithms to build indexes over the past 30 years, few are as advanced as the new options leveraged in SAP HANA. For example,
Personal Copy for RGA Rik Vriens, user id c3b3ffa0-d601-c76a-06ae-b5f2c05f5c4a

134
Planning an SAP HANA Installation5
B-tree indexes were originally based on physical tables with up to seven nodes, something that made them very large and often caused them to become unbal-anced. An unbalanced B-tree index basically means that there are more members in one node than in the others.
Think of this as a phone book. Initially, there may be similar numbers of people in each section. For example 500 with a last name starting with “J” and 500 with a last name starting with “K”. In a single node index, you open the first page of the phone book and simply see that the “Js” started on page 89. After you filled to that page, you scan each and look for “Jensen.” If you had a static phone book, it would be equally as easy to find “Jensen” as it would be to find people with the last name of “Koswalski.” But what happens if another 1,500 Koswalskis moved into your town? Now you have 500 entries in “J” and 2,000 entries in “K,” so search-ing for Jensen is faster than searching for Kowalski. In other words, the index has become unbalanced.
Naturally, you can solve this by adding a second node to the index so that the Koswalskis with a first name starting with “A” are on certain pages and those with “B” are on others. This way, you can keep adding index pages to the phone book, and this is basically how the first generation of indexes worked (actually they are somewhat more mathematically based, but for our purposes this is good enough to understand the concepts).
In the 1990s, Relational Database Management Systems (RDBMs) became more advanced, and new indexing methods were added. The first new method created pointers instead of physical tables for indexes. These were easier to modify and balance. Some vendors such as Oracle actually made indexes that balanced them-selves automatically.
About 20 years ago, academics invented newer bitmap indexes. These were truly different from those based on the B-tree idea. First, they created a map of each possible value in the data set (i.e., column) and assigned a set of bits to each value. A bit is either a “0” or a “1”, as opposed to a byte, which is a whole character. For example, if you were to assign bits to all 50 state codes in the United States, you would only need 6 bits. You could make “000001” be “Alaska” and “110010” would be Wyoming. That is a tiny portion of the bytes it takes to store the word “Wyoming.” That would be 8-16-32 times each letter, depending on your operating system. So bitmaps are smaller and therefore also much faster.
© 2013 by Galileo Press Inc., Boston (MA)

135
Row versus Column Indexes and the Persistency Layer 5.4
During the past decade, there has been a proliferation of index methods, including star-joins, hash, ngram, inverted, opt-eval, and many more. There are also differences in how new records are inserted, how the indexes can be merged, compression options, fault tolerance (when errors occur), and the overall speed of data retrieval. This research and development has in large part been fueled by the growing size of the Internet and the millions of users seeking electronic information.
The basic idea of column-based indexes is that there are repeated patterns, or occurrences, in the data that you can reduce in the index creating and compres-sion process. To illustrate this point, let’s look at a simplified example (Figure 5.6).
Figure 5.6 Data Set by Rows
In Figure 5.6, there is only one record with Jane Hansen, who is a Gold customer, lives in North Carolina, was born in 1959, and has an income of $71,927. Although you can use data compression, there is little you can do to reduce the data set further if you index this by rows. However, if you look at the data from a column perspective, you see quite a bit of data redundancy (Figure 5.7).
In addition to the standard compression, you can now remove data redundancy in the columns. For example, there are only three values of customer class in the data (Silver, Gold, and Platinum), and only seven states are represented by these 20 records. That lends itself to much better data reduction in the indexes as well
Personal Copy for RGA Rik Vriens, user id c3b3ffa0-d601-c76a-06ae-b5f2c05f5c4a

136
Planning an SAP HANA Installation5
as significant performance benefits when accessing data. In short, column-based stores have the benefit of high compression rates, scan operations (easier to search), and in cache-client processing of aggregation (easier to group and aggregate). By also including the Row ID in the column-based index, SAP HANA maintains the “ownership” of the values in the index that can still be “mapped” back to the other fields on the record.
Figure 5.7 Data Set by Columns
Although these examples somewhat oversimplify SAP HANA’s internal algorithms for indexes and compression, they are actually quite complex. For example, for dictionary compression, SAP HANA uses bit coded log2(NDICT) bits, and for value ID sequencing, SAP HANA uses prefix coding, run length coding, cluster coding, sparse coding, and indirect coding. However, that isn’t important unless you are a computer scientist.
But you get the basic idea—column-based indexes are often preferred due to the smaller and faster indexes they tend to produce, and SAP HANA always uses dic-tionary compression. It’s important to note that in some cases, the SAP HANA scan operations are so fast that indexes aren’t needed at all, and column data is simply accessed in memory scans directly. SAP HANA also has a text engine that supports indexing of text and has fuzzy and phrase search features.
© 2013 by Galileo Press Inc., Boston (MA)

137
Row versus Column Indexes and the Persistency Layer 5.4
Note
For those interested in the inner workings of SAP HANA’s compression and algorithms, Hannes Rauhe at SAP in Europe has published many in-depth presentations on the subject.
The fundamental differences between row-based stores and column-based stores are summarized in Table 5.5.
Row Store Column Store
EE It is a relational engine to store data in row format.
EE It is a pure in-memory store.
EE Has an in-memory object store (in future) for live cache functionality.
EE Transactional version memory is the heart of the row store.
EE Write operations mainly go into transactional version memory.
EE INSERT also writes to the persisted segment.
EE The visible version is moved from memory to the persisted segment.
EE Outdated record versions are cleared from transactional version memory.
EE Row store tables have a primary index.
EE The Row ID maps to the primary key.
EE Secondary indexes can be created.
EE The Row ID contains the segment and the page for the record.
EE Indexes in the row store only exist in memory.
EE The index definition is stored with table metadata.
EE Read functionality is improved significantly, and write functionality is also improved.
EE Highly compressed data resides in memory.
EE No real files are used, just virtual files.
EE Optimizer and executer handle queries and execution plan.
EE Supports delta data for fast write.
EE Has asynchronous delta merge.
EE Enables a consistent view manager.
EE Main store is compressed and read optimized; data is read from the main store.
EE Has delta store that is write optimized—for write operations.
EE Asynchronous merge moves the data from the delta store to main store.
EE Compression is created by the dictionary compression method and other compression methods applied.
EE Even during the merge operation, the columnar table will still be available for read and write operations. For this purpose, a second delta and main store are used internally.
EE The merge operation can also be triggered manually with a SQL command.
Table 5.5 Row Store versus Column Store
Personal Copy for RGA Rik Vriens, user id c3b3ffa0-d601-c76a-06ae-b5f2c05f5c4a

138
Planning an SAP HANA Installation5
5.5 Hardware Options
SAP HANA is sold as an in-memory appliance, which means that both software and hardware are included from the vendors. As of August 2012, while others may join in the solution offerings, you could only buy SAP HANA hardware solutions from Cisco, Dell, Fujitsu, IBM, and Hewlett-Packard.
The SAP HANA hardware is unique in many respects and is optimized by the ven-dors to support the SAP solution. The vendors have also built expertise in installing and supporting the SAP HANA landscape, so you should not expect non-certified hardware vendors to be able to install, run, and support the appliance.
Although this will likely change rapidly in the future, there are currently 10 different hardware options that can run SAP HANA. Cisco’s UC 460 system has scalability up to 512GB per system, while Dell’s cost-effective R910 platform features up to 256GB. Fujitsu and HP have two servers each that provide support for systems from 128GB to 1TB, and IBM offers three different configurations for their x-series 3690, 3850, and 3950 boxes (Table 5.6 and Figure 5.8). Multiples of these hardware nodes can be connected together for increased scalability into the multi-terabytes of memory.
Hardware RAM
128GB 256GB 512GB 1024GB
Cisco UC S C460 M2 X
Dell R910 X
Fujitsu RX 600 S5 X X X
Fujitsu RX 900 S1 X X
HP DL 580 G7 X X X
HP DL 980 G7 X X
IBM x3690 X5 X X X
IBM x3850 X5 X X
IBM x3950 X5 X X X
Table 5.6 SAP HANA Hardware Node Options (subject to change)
© 2013 by Galileo Press Inc., Boston (MA)

139
Hardware Options 5.5
IBM System x3950 X5
HP DL 580 G7 Dell R910
Fujitsu
Cisco UCSC460 M2
Figure 5.8 Some of the Hardware Solutions from the Different Vendors
As part of writing this book, we worked with IBM Labs in installing and testing its high-end x3950 x5 server. Because we only needed a medium-sized system, we decided on 256GB memory and a mid-sized file system.
Our x3950 box was a massive 4U rack-mounting server (4U = 7 inches high) that weighs 70.5 lbs. Inside, the 256GB main memory was split into two memory banks installed; however, this was expandable to 512GB with all four memory banks filled (the SAP HANA DB resides here). We could also implement larger memory banks and increase the memory to 1TB. The disk was stored on a GPFS file system that was a 3.3 TB HDD. Actually, it was several HDDs acting as one virtual disk and one hot swap.
There were two processors inside the box: 10 core Intel Xeon E7 series 2.40 GHz processors and a 320GB internal fusion card, used on a separate GPFS file system for the SAP HANA logs. Looking from the back (open box), we had the components shown in Figure 5.9.
A number of connectors were also used. For example, one dedicated Ethernet con-nection was used for IMM (IBM’s Integrated Management Module that manages the server) and two QPI ports were used to connect to a second x3950. Using this connection type, the two physical servers could be scaled up to act as one big server (important for those who want multi-terabyte SAP HANA systems). Our system also had two 10GB connections on an Emulex card, four 1GB Ethernet connections on a PCI card, and two 1GB Ethernet connections on the motherboard.
Personal Copy for RGA Rik Vriens, user id c3b3ffa0-d601-c76a-06ae-b5f2c05f5c4a

140
Planning an SAP HANA Installation5
Back ofmachine
Front ofmachine
PCI Cards: The internal PCI SSDcard holds the SAP HANA logs
under a separate GPFS (file system).
Hard Disks: 1 hot swap; the restact as one virtual disk. These
contain the SAP HANA failover.
Processors (10 cores, Intel Xeon E7 series)
Main Memory:256GB installed,
expandable to 512GB.This is the SAP HANA DB.
Dual powersupplies
Figure 5.9 An Inside View of SAP HANA on IBM’s x3950 x5
The software in our SAP HANA system was a bit simpler. The operating system was Linux SUSE (SLES 11 SP 1), and we had installed the two IBM GPFS file systems as well as the SAP HANA software (the server components such as Studio, XML and SQL parsers, logs, and many more subcomponents)—but remember, it’s all included inside the appliance.
Although this hardware example is specific to IBM’s high-end x3950 x5 box, the components of other vendors are similar.
5.6 Special Considerations for Planning an SAP HANA for BW Installation
Putting an existing SAP NetWeaver BW system on SAP HANA makes a lot of sense. First, the data activations are done in memory (over 10 times faster), the data dialogs between application and database servers are removed, and the application logic currently being done by the BW Analytical Engine is executed in memory as well. This includes OLAP and query processes such as executing calculated key figures (CKF), restrictive key figures (RKF), sorts, filters, time-dependent master data look-ups, exception aggregation, currency conversion, and much more. In short, SAP NetWeaver BW acts much faster in almost all aspects, not just query performance.
© 2013 by Galileo Press Inc., Boston (MA)

141
Special Considerations for Planning an SAP HANA for BW Installation 5.6
In addition to allowing customers to move SAP NetWeaver BW to SAP HANA, SAP also took a serious look at placement of the application logic in BW to take advantage of the massively parallel processing (MPP) architecture. This supports parallel processing across CPU cores, data sets, and nodes of BW query reads and query logic. This also meant that SAP had to rewrite the logic in the ABAP tier and move it to SAP HANA.
Behind the scenes, SAP HANA is executing queries on InfoCubes, master data, analytical indexes, and composite providers through the SAP HANA Calculation Engine. Queries on DSOs and InfoSets are primarily executed against the SAP HANA SQL Engine (queries in DSOs with a SID flag activated can also use the calculation engine). However, to take advantage of shared components, regardless of how the queries are executed, they all leverage SAP HANA’s internal Aggrega-tion Engine for summarizations and subtotaling. Therefore, executing queries on BW isn’t just a merely a question of faster data read times; the query logic is also executed much faster.
If you are considering an SAP HANA for BW system, it’s important to understand SAP’s two new optional InfoProvider types. These are called SAP HANA-optimized DSOs and SAP HANA-optimized InfoCubes.
5.6.1 SAP HANA-Optimized InfoCubes
You can continue using existing standard InfoCubes that don’t have the SAP HANA-optimized property, or you can convert them. The core of the new SAP HANA-optimized InfoCube is that when you assign characteristics and/or key figures to dimensions, the system doesn’t create any dimension tables except for the package dimension. Instead, the master data identifiers (SIDs) are simply written in the fact table, and the dimensional keys (DIM IDs) are no longer used, resulting in faster data read execution and data loads. In short, dimensions become logical units instead of physical data tables. The logical concept of “dimensions” is used only to simplify the query development in BEx Query Designer. Figure 5.10 shows an example of an SAP NetWeaver BW InfoCube model before SAP HANA optimization.
Because the physical star-schema tables changes during the SAP HANA optimiza-tion, any custom-developed program that accesses InfoCubes directly instead of going through standard interfaces will have to be rewritten. However, because very few companies have ventured into this area, the optional conversion will have little impact on most organizations except for providing faster InfoCube
Personal Copy for RGA Rik Vriens, user id c3b3ffa0-d601-c76a-06ae-b5f2c05f5c4a

142
Planning an SAP HANA Installation5
performance. Figure 5.11 shows an example of a BW InfoCube model after SAP HANA optimization.
Fact Table
DimensionTable
DimensionTable
Characteristics
Characteristics
Attributes &Hierarchies
Attributes &Hierarchies
Attributes &Hierarchies
Attributes &Hierarchies
Characteristics
Characteristics
Characteristics
Characteristics
Characteristics
Characteristics
Attributes &Hierarchies
Attributes &Hierarchies
Attributes &Hierarchies
Attributes &Hierarchies
Attributes &Hierarchies
Attributes &Hierarchies
Attributes &Hierarchies
Attributes &Hierarchies
DimensionTable
DimensionTable
Attributes &Hierarchies
Attributes &Hierarchies
Attributes &Hierarchies
Attributes &Hierarchies
Figure 5.10 SAP NetWeaver BW InfoCube Model before SAP HANA Optimization
Fact Table
Characteristics
Characteristics
Attributes &Hierarchies
Attributes &Hierarchies
Attributes &Hierarchies
Attributes &Hierarchies
Characteristics
Characteristics
Characteristics
Characteristics
Characteristics
Characteristics
Attributes &Hierarchies
Attributes &Hierarchies
Attributes &Hierarchies
Attributes &Hierarchies
Attributes &Hierarchies
Attributes &Hierarchies
Attributes &Hierarchies
Attributes &Hierarchies
Attributes &Hierarchies
Attributes &Hierarchies
Attributes &Hierarchies
Attributes &Hierarchies
Figure 5.11 SAP NetWeaver BW InfoCube Model after SAP HANA Optimization
© 2013 by Galileo Press Inc., Boston (MA)

143
Special Considerations for Planning an SAP HANA for BW Installation 5.6
To convert existing InfoCubes, simply go to the program RSDRI_CONVERT_CUBE_TO_INMEMORY and select the InfoCubes you want to convert. The job is executed in the background as a store procedure and is extremely fast. Typically, you can expect 10- 20 minutes even for very large InfoCubes with hundreds of millions of rows. During the conversion, users can even query the InfoCubes. However, data loads must be suspended. Currently, traditional InfoCubes with a maximum of 233 key figures and 248 characteristics can be converted to SAP HANA optimized InfoCubes.
After the conversion to SAP HANA, optimized InfoCubes are maintained in the SAP HANA database’s column-based store and are assigned a logical index (Cal-culationScenario). However, if the InfoCubes were stored only in BWA before the conversion, the InfoCubes are set to inactive during the conversion, and you’ll need to reactivate them and reload the data if you want to use it.
While SAP HANA-optimized InfoCubes can’t be remodeled, you can still delete and add InfoObjects using the InfoCube maintenance option, even if you’ve already loaded data into the InfoCube.
Other routine maintenance tasks in SAP NetWeaver BW have changed as well, including standard compression of fact tables and how you handle non-cumulative key figures in SAP HANA, which we’ll discuss in the following subsections.
Changes to Fact Tables in InfoCubes
Because SAP HANA-optimized InfoCubes have only one fact table, instead of the two fact tables of traditional InfoCubes (E-tables with read-optimized partitioning and an F-table with write/delete-optimized partitioning), the star schema is significantly simpler and also more in line with classical logical data warehouse designs based on Ralph Kimball’s dimensional modeling principles. This fact table simplification, combined with the removal of physical dimension tables, also results in two to three times faster data loads.
Non-Cumulative Key Figures in InfoCubes
Some consideration has to be given to non-cumulative key figures. Because SAP HANA loads separately the initial non-cumulative, delta, and historical transactions, two data transfer processes (DTPs) are required for InfoCubes with non-cumulative key figures (i.e., inventory cubes). In this case, one DTP is required to initialize the non-cumulative data, and one is required to load data and historical transactions
Personal Copy for RGA Rik Vriens, user id c3b3ffa0-d601-c76a-06ae-b5f2c05f5c4a

144
Planning an SAP HANA Installation5
(for more details see SAP Note 1558791). Also, traditional InfoCubes with non-cumulative key figures can only be converted to SAP HANA-optimized InfoCubes if they aren’t included in a 3.x dataflow.
Because manual intervention and DTP changes are needed, inventory cubes and cubes with non-cumulative key figures should always be tested in a sandbox, or development box, before being converted in production systems. Alternatively, these InfoCubes can be left in a non-converted status.
Partitioning of InfoCube Fact Tables and Compression
After the optimization of SAP HANA InfoCubes, you can no longer partition the fact tables semantically, and you don’t need to. However, there are still four partitions behind the scenes. The first partition is used for non-compressed requests, while the second contains the compressed requests. Another partition contains the reference points of the inventory data and yet another is used for the historical inventory data movements. The last two partitions are empty if their non-cumulative key figures aren’t used. However, the first two partitions still require periodic compression to reduce the physical space used and increase the load times during merge process-ing (very much like traditional BW maintenance). This has only a minor impact on small InfoCubes (less than 100 million records) and InfoCubes without significant data reloads or many requests. Because the compression is also executed as a stored procedure inside SAP HANA, the compression is very fast and should take no more than a few minutes even for very large InfoCubes.
5.6.2 SAP HANA-Optimized Data Store Objects (DSOs)
When converting exiting DSOs, you can either convert them automatically using Transaction RSMIGRHANADB, or you can do this manually in the Data Warehous-ing Workbench. This migration doesn’t require any changes to process chains, MultiProviders, queries, or data transformations.
The new SAP HANA-optimized DSOs execute all data activations at the database layer, instead of the application layer. This saves significant time in data loads and process chains, making data available to users much faster.
Behind the scenes, SAP HANA maintains a future image of the recently uploaded data stored in a columnar table called the activation queue. The current image of the current data is stored in a temporal table that contains the history, main index, and delta index. Finally, to avoid data replication, the change log is now kept in
© 2013 by Galileo Press Inc., Boston (MA)

145
Special Considerations for Planning an SAP HANA for BW Installation 5.6
the calculation view instead of a physical table. Because log data doesn’t have to be written to disk at this stage (in traditional SAP NetWeaver BW, this data is written to a log table in a relational database), this new SAP HANA approach is much faster and also consumes less storage space. So, while logically the activation process is very similar to the current relational tables in BW, the technical approach is quite different.
The data loads are also positively impacted. By not being constrained by I/O writes and reads to/from disks (data is loaded in-memory instead) and by using the new optimized approach to internally generated keys (SIDs) to take advantage of the storage methods in SAP HANA, the migrated SAP NetWeaver BW system on SAP HANA typically sees two to three times faster data loads overall. For many compa-nies, this will be reason enough to make the transition to SAP HANA.
Note
For more information on new DSO activations on SAP HANA, see SAP Note 1646723, BW on SAP HANA DB: SAP HANA-opt. DSO Activation Parameters.
5.6.3 The Future of InfoCubes
Currently, there is significant debate on Internet blogs and forums concerning whether InfoCubes are needed with an SAP HANA system. However, for the interim period, there are several reasons why InfoCubes are needed.
First, transactional InfoCubes are needed for integrated planning and write-back options. InfoCubes are also needed to store and manage non-cumulative key fig-ures, and the direct write interface (RSDRI) only works for InfoCubes. In addition, the transition from SAP NetWeaver BW to SAP HANA is simplified by allowing customers to move to the new platform without having to rewrite application logic, queries, MultiProviders, and data transformations from DSOs to InfoCubes.
However, the continued use of InfoCubes has to be questioned. The introduction of the star schema, snowflakes, and other Dimensional Data Modeling (DDM) techniques in the 1990s was to reduce costly table joins in relational databases, while avoiding the data redundancy of data stored in first normal form (1NF) in operational data stores (ODSs).
The removal of the relational database from SAP HANA’s in-memory processing makes most of the benefits of DDM moot, and continued use of these structures
Personal Copy for RGA Rik Vriens, user id c3b3ffa0-d601-c76a-06ae-b5f2c05f5c4a

146
Planning an SAP HANA Installation5
is questionable. In the future, we may see multilayered DSOs with different data retention and granularity instead. But, for now, InfoCubes will serve a transitional data storage role for most companies.
5.7 Summary
Planning an SAP HANA installation is an effort that requires strong technical skills and also a solid understanding of the long-term architecture and system deploy-ment strategy of an organization. It’s very unlike upgrading servers, databases, and operating systems. Instead, organizations get an appliance that enables brand-new functionality that fundamentally changes the way servers and databases work in the organization.
Companies should not underestimate the effort involved. The long-term ben-efits of simplifying application servers and database servers, while removing the performance limitations of relational databases are so numerous that companies should ignore them. However, it’s also important to involve skilled partners dur-ing the transition phase while committing serious resources for the training of existing support staff. Picking the right platform vendor and experienced partner is therefore crucial.
© 2013 by Galileo Press Inc., Boston (MA)

147
You can leverage the speed of SAP HANA to enhance reporting with the SAP Business Objects suite and SAP reporting tools.
6 SAP HANA and the SAP Business Objects BI Platform
SAP HANA requires a business intelligence tool of some kind. By leveraging SAP’s own offering, the SAP Business Objects BI 4.0 platform, it’s possible to enhance how users interact with the SAP reporting suite. Currently, many enterprise data warehouses have grown so large, and reports are running so slow, that only the absolutely needed reports are used. However, with in-memory processing, you get increased speed of data visualizations and reports, so you no longer need pre-run batch reporting. Reports on line executions are quick, and BI usage can now increase to its full potential.
In this chapter, we’ll start with a brief introduction to each of the SAP Business-Objects frontend tools and then dive into the details with a discussion of how to connect the SAP Business Objects BI tools to SAP HANA. We’ll conclude the chapter with a brief discussion about SAP HANA and SAP Business Objects Mobile.
Note
The topic of SAP HANA and SAP Business Objects is large enough for its own book. As such, this chapter doesn’t attempt to offer a comprehensive discussion but rather aims to introduce you to the major concepts.
6.1 Overview of the SAP Business Objects Tools
In this section, we’ll offer a brief introduction to the SAP Business Objects BI plat-form tools. If you’re already familiar with the toolset, skip on to Section 6.2, where we dive into how to connect these tools to SAP HANA.
Personal Copy for RGA Rik Vriens, user id c3b3ffa0-d601-c76a-06ae-b5f2c05f5c4a

148
SAP HANA and the SAP Business Objects BI Platform 6
6.1.1 SAP Business Objects Dashboards (Xcelsius)
SAP Business Objects Dashboards (originally known as Xcelsius) is a visualization tool that allows interactive analysis with graphs, charts, maps, and other custom objects. Due to the strategic direction of SAP and the new capabilities of dashboards, SAP Business Objects Dashboards is the preferred alternative to other legacy tools such as the SAP Visual Composer and BEx Web Application Designer. Figure 6.1 shows an example of a report from SAP Business Objects Dashboards.
For non-SAP HANA systems, SAP Business Objects Dashboards allows traditional data connectivity to SAP NetWeaver Business Warehouse (BW) through Business Intelligence Consumer Services (BICS), relational database connections through universes, and other external data sources such as Web Services.
Figure 6.1 SAP Business Objects Dashboards
SAP Business Objects Dashboards allow developers to work in the Rapid Applica-tion Design mode to quickly deliver stunning visualizations with minimal coding on standard objects. SAP Business Objects Dashboards also allows the developer to preview the final result before publishing it to the working environment so that edits can be quickly applied before publishing the final work product.
© 2013 by Galileo Press Inc., Boston (MA)

149
Overview of the SAP Business Objects Tools 6.1
You can enhance the SAP Business Objects Dashboards experience by using SAP HANA. SAP HANA enables SAP Business Objects Dashboards to display more data faster than ever before. By running an SAP NetWeaver BW system on top of SAP HANA, SAP Business Objects Dashboards become more dynamic and interactive, providing more useful information to the end users without long wait times.
SAP Business Objects Dashboards is generally intended to be used by decision makers who need a quick view of their current business or area of responsibility. Decision makers also have the capabilities to do what-if analysis to manage the next line of decisions. Prior to SAP HANA, SAP Business Objects Dashboards was built on top of summarized data so the performance was faster. As performance is becoming less of a concern, SAP HANA may change this design view and allow for more operational dashboards. In general, acceptable performance in the past has been to not exceed more than 20 seconds to launch any dashboard. However, SAP HANA is likely to change these expectation levels significantly.
6.1.2 SAP Business Objects Web Intelligence
SAP Business Objects Web Intelligence is a query tool that allows a deeper analysis to uncover hidden meaningful data. SAP Business Objects Web Intelligence allows users to easily add tables, charts, filters, and calculations to support a BI self-service model where users develop their own reports in an ad hoc manner. Figure 6.2 shows an example of a report from SAP Business Objects Web Intelligence.
You can access SAP Business Objects Web Intelligence in three different interfaces: the rich client, which is installed onto a PC; a Java-based client, which is launched from the BI Launch Pad in SAP Business Objects BI 4.0; or the HTML web client, which can be executed by launching a report on the BI Launch Pad.
SAP Business Objects Web Intelligence reports are intended to be used by business analysts or users who want to explore business questions. SAP Business Objects Web Intelligence can also deliver static reports that can’t be edited by applying the “view only” security role to a user so that the queries can’t be edited. Other business users may, however, easily modify the existing reports or add new components with minimal IT development. These reports can also be shared on the BI Launch Pad or exported into various static formats and sent by email to a wider audience.
Personal Copy for RGA Rik Vriens, user id c3b3ffa0-d601-c76a-06ae-b5f2c05f5c4a

150
SAP HANA and the SAP Business Objects BI Platform 6
Figure 6.2 SAP Business Objects Web Intelligence
Using SAP HANA with SAP Business Objects Web Intelligence allows for much faster query performance, decreasing the time required for data to be returned to the SAP Business Objects Web Intelligence report. This increases the amount of interactiv-ity and drilldown capabilities of SAP Business Objects Web Intelligence and also removes much of the need to pre-run slow reports that users need periodically.
6.1.3 SAP Business Objects Explorer
SAP Business Objects Explorer is a tool that is intended for users who conduct unstructured analysis of data (Figure 6.3). The tool relies on information spaces that are exposed through a standard interface. There is no need to define queries, and graphics are built by the system intuitively without initial user input. The tool also allows for navigation inside each information space, creating personalized views and downloading data into Microsoft Excel, files, images, and add new calculated key figures.
© 2013 by Galileo Press Inc., Boston (MA)
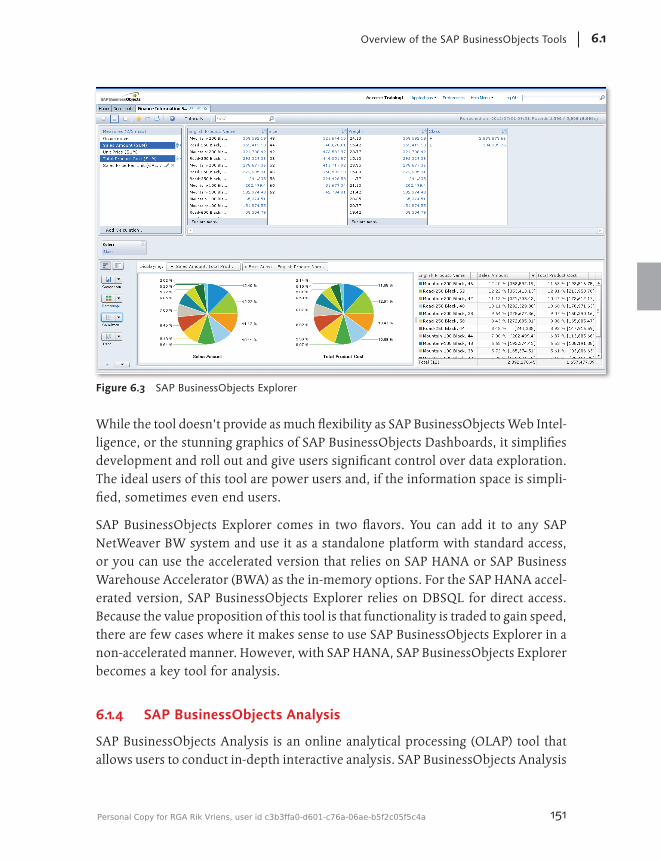
151
Overview of the SAP Business Objects Tools 6.1
Figure 6.3 SAP Business Objects Explorer
While the tool doesn’t provide as much flexibility as SAP Business Objects Web Intel-ligence, or the stunning graphics of SAP Business Objects Dashboards, it simplifies development and roll out and give users significant control over data exploration. The ideal users of this tool are power users and, if the information space is simpli-fied, sometimes even end users.
SAP Business Objects Explorer comes in two flavors. You can add it to any SAP NetWeaver BW system and use it as a standalone platform with standard access, or you can use the accelerated version that relies on SAP HANA or SAP Business Warehouse Accelerator (BWA) as the in-memory options. For the SAP HANA accel-erated version, SAP Business Objects Explorer relies on DBSQL for direct access. Because the value proposition of this tool is that functionality is traded to gain speed, there are few cases where it makes sense to use SAP Business Objects Explorer in a non-accelerated manner. However, with SAP HANA, SAP Business Objects Explorer becomes a key tool for analysis.
6.1.4 SAP Business Objects Analysis
SAP Business Objects Analysis is an online analytical processing (OLAP) tool that allows users to conduct in-depth interactive analysis. SAP Business Objects Analysis
Personal Copy for RGA Rik Vriens, user id c3b3ffa0-d601-c76a-06ae-b5f2c05f5c4a

152
SAP HANA and the SAP Business Objects BI Platform 6
is available in two interfaces: the edition for OLAP web interface as shown in the BI Launch Pad (Figure 6.4) and the Microsoft edition (Figure 6.5), which is based on Excel and PowerPoint. While the web-based interface requires no prerequisite installs on a standard client PC, the Microsoft edition requires some prerequisites along with the initial install on each user’s computer.
Figure 6.4 SAP Business Objects Analysis, Edition for OLAP
Both editions of SAP Business Objects Analysis are intended to be used by the power user who needs to perform analysis on data. The tool also allows for each user to have a saved view that may be refreshed with periodically updated data.
To leverage the OLAP interfaces, the power user must have a good understand-ing of the available data, navigation, filtering, and options. SAP Business Objects Analysis allows power users to share the work that they have created via the BI Launch Pad or exported static view of the report. There are also options for using SAP Business Objects Analysis as a data source, including for SAP Business Objects Web Intelligence, SAP Business Objects Explorer, or via SAP Business Objects Live Office as a sharing tool. SAP Business Objects Web Intelligence reports can be built on top of SAP Business Objects Analysis views that are saved after navigational steps have been performed. SAP Business Objects Analysis provides one of the most flexible forms of analysis and is frequently used by business and financial analysts.
© 2013 by Galileo Press Inc., Boston (MA)

153
Overview of the SAP Business Objects Tools 6.1
Figure 6.5 SAP Business Objects Analysis, Edition for Microsoft Office (Excel shown)
With the combination of SAP Business Objects Analysis and SAP HANA, you get sub-second in-memory data retrieval as well as in-memory OLAP functions and calculations. This powerful combination of in-memory processing provides users with the ability to slice-and-dice data, drill down to details, add new calculations, and interact with the data much faster than ever before.
6.1.5 SAP Business Objects Design Studio
SAP is also coming out with a new product called SAP Business Objects Design Stu-dio that will replace SAP BEx Web Application Designer. This product is internally dubbed as the “Zen” project with the vision that this will be the recommended devel-opment and visualization tool for SAP NetWeaver BW shops that don’t have SAP Business Objects. The initial release is targeted to support both the SAP NetWeaver BW and the SAP HANA data sources, with others being added later. The tool is expected to be in ramp-up mode in 2013.
6.1.6 SAP Crystal Reports
SAP Crystal Reports is a tool with pixel-formatted reporting capabilities that allows developers the full control of formatted reports. There are two versions of SAP Crystal
Personal Copy for RGA Rik Vriens, user id c3b3ffa0-d601-c76a-06ae-b5f2c05f5c4a

154
SAP HANA and the SAP Business Objects BI Platform 6
Reports that come with the SAP Business Objects BI 4.0 suite: SAP Crystal Reports 2011 and SAP Crystal Reports Enterprise Edition. SAP Crystal Reports Enterprise Edition allows connections with SAP HANA. Figure 6.6 shows an example of a report from SAP Crystal Reports Enterprise Edition.
SAP Crystal Reports Enterprise Edition also allows users to choose from among 36 available charts, and add filters, cross-tabs, flash objects, and images onto the reporting canvas. The BI Launch Pad also allows users to enable alerts from SAP Crystal Reports to be sent to their inbox so that if a condition has been triggered, the user can receive the notification quickly.
Figure 6.6 SAP Crystal Reports
SAP Crystal Reports can have a large audience; for instance, SAP Crystal Reports might be used for a manager who needs a summarized total for the end of a detailed report, employees on the shop floor who need a detailed report to cross-check their production runs for the day, or a customer who needs a printout of a utility bill. In general, there are many uses for SAP Crystal Reports when it comes to fixed format
© 2013 by Galileo Press Inc., Boston (MA)
155
Connecting SAP Business Objects BI Tools to SAP HANA 6.2
reports or high frequency batch reports. The benefits of SAP Crystal Reports is that a developer can create virtually any kind of fixed format report easily because the tool allows developers to control each object at the pixel level.
SAP HANA supports SAP Crystal Reports with direct SQL connections through JDBC and ODBC, as well as through universes built on top of SAP HANA data. This allows you to generate high-volume batch reports in a shorter time frame, and permits users to leverage SAP Crystal Reports in a more ad hoc fashion than previously possible.
6.2 Connecting SAP Business Objects BI Tools to SAP HANA
In this section, we explore how the different SAP Business Objects BI tools may con-nect to SAP HANA. We cover Open Database Connectivity (ODBC), Java Database Connectivity (JDBC), and Universe Designer with the Information Design Tool (IDT) in SAP Business Objects BI 4.0, as well as direct Excel Access through MDX, open database objects (ODBOs), Microsoft queries, and BICS connections. We also show how these tasks can be completed in a step-by-step cookbook fashion.
6.2.1 Universes with Open and Java Database Connections (ODBC/JDBC)
JDBC and ODBC connections are two possible methods to access data inside SAP HANA. These connection types can be used by third-party tools, SAP Crystal Reports without a universe, custom development tools, and by both SAP Universe Designer and the Information Design Tool (IDT).
Universes can provide the semantic layer to access SAP HANA data by tools such as SAP Business Objects Web Intelligence, SAP Business Objects Dashboards, SAP Business Objects Explorer, and even SAP Crystal Reports for Enterprise, which can access both via universes as well as through a direct ODBC/JDBC connection.
The first step in making JDBC and ODBC connections is to install the SAP HANA middleware from SAP Marketplace using the wizard. After this is installed, you can then go to your control panel and access data sources (Figure 6.7 and Figure 6.8). Follow these steps:
Personal Copy for RGA Rik Vriens, user id c3b3ffa0-d601-c76a-06ae-b5f2c05f5c4a

156
SAP HANA and the SAP Business Objects BI Platform 6
Figure 6.7 Accessing the Control Panel
1. Select Administrative tools.
Figure 6.8 Accessing the ODBC Data Sources in the Administration Tools
2. Under the System DSN (domain name server) tab, click Add (Figure 6.9).
Figure 6.9 Adding a System Domain Name Server
© 2013 by Galileo Press Inc., Boston (MA)

157
Connecting SAP Business Objects BI Tools to SAP HANA 6.2
3. Select the SAP HANA driver from the middleware you installed, and click Finish (Figure 6.10).
Figure 6.10 Selecting the Database Driver
4. Give the source a name, for example, “HANA”, and a description. Enter the service port. This includes the server name and port. You’ll also need a user name and password from your SAP HANA administrator to complete this task (Figure 6.11).
Figure 6.11 The Data Source and Server Port
5. Enter your user name and password for access and authentication (Figure 6.12).
6. After you’ve connected, you’ll get a prompt stating whether the connection was successful.
Personal Copy for RGA Rik Vriens, user id c3b3ffa0-d601-c76a-06ae-b5f2c05f5c4a

158
SAP HANA and the SAP Business Objects BI Platform 6
Figure 6.12 Logging On with the New Connection
You can now go to the IDT and start creating the universe semantic layer for tool access. To do so, follow these steps:
1. Open the IDT.
2. Right-click on a resource in the Repository Resource section of your SAP Business Objects environment.
3. Select Open Session.
4. Log on to the session with your user name and password (Figure 6.13).
Figure 6.13 Open a Repository Resource Session in IDT
5. From the File menu, create a new project by choosing New and then Project (Figure 6.14).
© 2013 by Galileo Press Inc., Boston (MA)

159
Connecting SAP Business Objects BI Tools to SAP HANA 6.2
Figure 6.14 Create a New Project in IDT
6. Give the project a name and save it (we call our example project “HANA”).
7. Now add a new relational connection to the project by going to the Repository Resources in IDT and clicking Insert Relational Connection.
8. Give the resource a name, and click Next (Figure 6.15).
Figure 6.15 Inserting a Relational Connection in IDT
9. Navigate to the SAP drivers that are installed. Here you should find the SAP middleware. If you can’t see it in this list, you’ll have to install it from the SAP Marketplace. Select the middleware ODBC Drivers option (Figure 6.16). (You
Personal Copy for RGA Rik Vriens, user id c3b3ffa0-d601-c76a-06ae-b5f2c05f5c4a

160
SAP HANA and the SAP Business Objects BI Platform 6
can also choose the JDBC Drivers if you want a Java-based connection, but in this example, we’re creating an ODBC connection.)
Figure 6.16 Selecting the ODBC Driver for SAP HANA in IDT
10. Select the connection (called “HANA” from earlier steps), enter your user name and password, and click Next (Figure 6.17).
Figure 6.17 Connecting to the SAP HANA Data Source in IDT
11. You can now set timeout parameters for logons, pool, and array parameters. Some companies will have log-in timeout rules, which you can implement here (Figure 6.18).
© 2013 by Galileo Press Inc., Boston (MA)

161
Connecting SAP Business Objects BI Tools to SAP HANA 6.2
Figure 6.18 Controlling the Connection Parameters
12. You’ll have the options to change custom parameters on the next screen, or you can simply accept the standard ConnectInit and click Finish.
13. The new connection will now be displayed under the Repository Resources, and you can create the required shortcut for your universe. Click on the con-nection, and select Create Relational Connection Shortcut (Figure 6.19).
14. Select the HANA project, and click OK. A message appears stating that the connection shortcut was created successfully.
Figure 6.19 Creating a Relational Shortcut in IDT
15. After the shortcut is created, it will show up under the project. From here, you can create a standard data foundation layer in IDT and use the standard universe functions that are leveraged by the SAP Business Objects BI tools (Figure 6.20).
Personal Copy for RGA Rik Vriens, user id c3b3ffa0-d601-c76a-06ae-b5f2c05f5c4a

162
SAP HANA and the SAP Business Objects BI Platform 6
Figure 6.20 Using the Shortcut to Create the Universe Data Foundation
After these tasks are completed, standard functionality is leveraged, and you can attach tools such as SAP Business Objects Web Intelligence, SAP Business-Objects Dashboards, SAP Business Objects Analysis, SAP Crystal Reports, and SAP Business Objects Explorer to the universe.
16. Give the resource a name, and click Next.
17. Select Single Source, and click Next (Figure 6.21).
Figure 6.21 Creating a New Data Foundation in IDT
© 2013 by Galileo Press Inc., Boston (MA)

163
Connecting SAP Business Objects BI Tools to SAP HANA 6.2
18. Select the HANA.cns connection you created earlier, and click Finish.
19. The DFX file now shows up under the project, and you can start creating the business layer of the universe on all tables and views to which the user has access (Figure 6.22).
Figure 6.22 The Data Foundation in IDT
These steps complete the connections to SAP HANA using ODBC. From this point, you can design the universe, add tables, add your own SQL logic, and make the universe available to the frontend tools like normal.
6.2.2 IDT Access to Attributes, Calculations, and Analytical Views
In the Information Views option in SAP HANA, users can combine objects inside SAP HANA, create their own calculations, and access their results in SAP Business-Objects tools. There are three types of information views:
EE Attribute view This view provides attribute level details.
Personal Copy for RGA Rik Vriens, user id c3b3ffa0-d601-c76a-06ae-b5f2c05f5c4a

164
SAP HANA and the SAP Business Objects BI Platform 6
EE Analytic view This view forms the basis of an analysis (similar to an InfoCube in SAP NetWeaver BW).
EE Calculation view This view is basically a query that can be built on attribute views, database tables, and/or analytic views.
We cover each of these views in details in Chapter 8 and show you how to build them. You can access all of these views by the IDT in SAP Business Objects BI 4.0, and you can build universes on top of these for reporting and analytics. To access the views in IDT, you can connect to SAP HANA using an ODBC driver, and you’ll see the views under the user called _SYS_BIC (Figure 6.23).
Figure 6.23 Accessing SAP HANA Views in IDT
6.2.3 Connecting to Excel with Open Database Objects (ODO) and MDX
Open database objects connections (ODO) are a quick way to access data objects using a platform that supports this interface. In the standalone version of SAP HANA (1.0), SAP supports the Excel 2010 standard MDX. This isn’t a complete set of MDX; instead, it’s a Microsoft version that allows for connections to Excel specifically.
To get started with the connections, you first need to go to the SAP Marketplace and download the SAP In-Memory Database 1.0 Clients software. Installation
© 2013 by Galileo Press Inc., Boston (MA)

165
Connecting SAP Business Objects BI Tools to SAP HANA 6.2
instructions are available in the SAP HANA Master Guide by SAP, which you can find on the SAP Marketplace. After this is installed, you need to create a connection in Excel by following these steps:
1. Go to the Data tab in Excel.
2. Click From Other Sources, and select From Data Connection Wizard (Figure 6.24).
Figure 6.24 The Data Connection Wizard in Excel
3. Select the Other/Advanced option (Figure 6.25).
Figure 6.25 The Data Connection Wizard in Excel
Personal Copy for RGA Rik Vriens, user id c3b3ffa0-d601-c76a-06ae-b5f2c05f5c4a

166
SAP HANA and the SAP Business Objects BI Platform 6
4. Select the Object Link Enabled Database (OLE DB) for SAP HANA—SAP NewDB MDX Provider—(it’s MDX based), and click Next (Figure 6.26).
Figure 6.26 The OLE DB MDX Provider for SAP HANA
5. In the Data Link Properties, go to the Connections tab.
6. Enter information for the Data Source, Instance number, User, and Password fields for your account on SAP HANA (Figure 6.27).
Figure 6.27 The Data Link Connection in Excel
© 2013 by Galileo Press Inc., Boston (MA)

167
Connecting SAP Business Objects BI Tools to SAP HANA 6.2
7. Click the Connect to a specific cube checkbox.
8. Select from the list of cubes you have access to (Figure 6.28).
Figure 6.28 Selecting a Specific Cube in Excel
9. You can also save your password so that you don’t have to enter it each time you use this connection (Figure 6.29).
Figure 6.29 Saving Data Connection in Excel
Personal Copy for RGA Rik Vriens, user id c3b3ffa0-d601-c76a-06ae-b5f2c05f5c4a

168
SAP HANA and the SAP Business Objects BI Platform 6
10. You can now import the data into your workbook as a pivot table report, a pivot chart and table, or only create the connection for future use. You can also assign the data to a new or existing worksheet (Figure 6.30).
Figure 6.30 Importing Data into Excel
6.2.4 Building a Microsoft Query on SAP HANA
You can also consume raw data tables instead of cubes in Excel. To do so, your administrator will need to install an OBDC driver on SAP HANA and create a con-nection that you can consume (see the SAP HANA Master Guide for details). After this is completed, you can access the data from Excel (Figure 6.31).
Figure 6.31 Excel Access with Microsoft Query and ODBC
© 2013 by Galileo Press Inc., Boston (MA)

169
Connecting SAP Business Objects BI Tools to SAP HANA 6.2
The wizard now allows you to select the database and database connection, as well as see the tables you have access to. Also, the Excel interface will take you step by step through the process of building a Microsoft query through the query wizard.
After selecting the data and filters, you’ll be prompted to select where you want to insert the Microsoft query data in the Excel spreadsheet (Figure 6.32).
Figure 6.32 Importing Data into Excel from Microsoft Query and ODBC
Make sure you select the Machine Data Source in the prompt. You’ll also be asked to log on to the system to validate your security credentials before the data you requested is inserted into your spreadsheet.
6.2.5 BICS Connections
BICS connections are supported for SAP Business Objects Analysis, edition for Micro-soft Office. This allows the tool to access SAP Business Explorer (BEx) queries and consume them directly. Because this interface doesn’t rely on the MDX interface, it’s typically faster. This connection type also allows you to use all of the features of the BEx Query Designer and take full advantage of the BI Analytical Engine in SAP NetWeaver BW.
6.2.6 Connectivity Summary
SAP is moving fast with SAP HANA and may include new connectivity options with future releases, so the options will change over time. SAP has also provided some backwards capability; with SAP Business Objects (XI) 3.1 SP4, you also get support for SAP HANA as a universe source and direct connections with SAP Crystal Reports.
Personal Copy for RGA Rik Vriens, user id c3b3ffa0-d601-c76a-06ae-b5f2c05f5c4a

170
SAP HANA and the SAP Business Objects BI Platform 6
Currently, the options are summarized as shown in Figure 6.33.
Real time
HANA Appliance
SemanticLayer
Analysis Office
Explorer
Others
Sybase Unwired Platform
Custom Web Development
Third-Party BI Clients
MS Excel (certified)
Third-Party Applications
SybaseReplication
Server
In-MemoryComputing
Engine
Database
SAP ERP
SAP Data Services
SAP NetWeaverBW
Third Party
Dashboards
SQL (JDBC/ODBC)
SQL (JDBC/ODBC)
SQL (JDBC/ODBC)
MDX (ODBO)
BICS
DBSQL
Crystal
Crystal
Web Intelligence
Figure 6.33 SAP HANA BI Tool Connectivity Summary
6.3 Going Mobile with SAP HANA and SAP Business Objects
There are many ways you can use SAP HANA for mobile applications. First, you can use any of the SAP Business Objects BI tools for standard web access. They are all web enabled, except for the Microsoft Office edition of SAP Business Objects Analysis, which requires client components.
Using SAP Business Objects Web Intelligence and SAP Crystal Reports, you can publish reports directly to BEx Mobile Intelligence in the BI platform. You can access these reports by iPads and iPhones through applications downloaded from the Apple store.
You can also use standard web features for Android or Microsoft-based tablets and smartphones. Because they support Flash software, SAP Business Objects Dashboards can be rendered directly to these devices also. SAP also has announced that SAP Business Objects Dashboards will support HTML5 in 2013, so that SAP Business-Objects Dashboards may be rendered on Apple-based devices as well, without the need for third-party software.
© 2013 by Galileo Press Inc., Boston (MA)

171
Summary 6.4
In addition, SAP has the Sybase Unwired Platform for companies that want to develop their own mobile applications across the enterprise and manage them consistently from performance, security, and application development standpoints. This platform also connects to SAP HANA and takes full advantage of the speed and simplicity of the in-memory platform.
The main consideration with mobile solutions on SAP HANA is the tool selection. By staying with SAP tools, companies can be assured that the frontend capabilities link to future SAP backend enhancements. However, for companies that use other tools for their mobile development, SAP also provides open and flexible access to SAP HANA data via standard access methods such as ODBC and JDBC, even at the data table level. Therefore, SAP HANA may be considered the ideal backend platform for high-speed mobile applications of any kind.
6.4 Summary
In this chapter, we offered a high-level summary of the SAP Business Objects Business Intelligence toolset and how SAP HANA speeds up these tools. We also reviewed the different ways to connect these tools to SAP HANA. Finally, we briefly discussed the topic of SAP HANA and mobility. Although not an exhaustive treatment of the SAP Business Objects topic, the information in this chapter should give you enough background information to understand your options and make choices about how to move forward.
Personal Copy for RGA Rik Vriens, user id c3b3ffa0-d601-c76a-06ae-b5f2c05f5c4a

© 2013 by Galileo Press Inc., Boston (MA)

173
Information Composer offers an easy to use web-based tool for power users and authors to create new views on existing data and even combine it with new data, for example, from local spreadsheets.
7 Data Modeling with Information Composer
In this and the next chapter we’ll go over data modeling techniques in SAP HANA, using the two client tools provided by SAP: Information Composer and SAP HANA Studio. We’ll use examples based on sales data. Starting from base tables where the data is stored in SAP HANA that correspond to tables in SAP ERP, we’ll be building different types of views to connect the data from the separate tables together and make it available to SAP Business Objects client tools.
SAP HANA Information Composer, or Information Composer for short, is intended for power users and authors. For our purposes, power users are defined as those business users who have the capability to create new reporting elements for themselves, and authors are those users who can additionally share those new reports with other users. This application allows users to access the data in the SAP HANA in-memory database and model their own reporting objects based on existing information views in SAP HANA. (An information view is the overall term for a reusable view created in SAP HANA.) In addition, it’s possible for users to upload their own data—for example, from spreadsheets—load that data into SAP HANA, and combine it with existing information views to create new information views directly in Information Composer. Views created in Information Composer are saved to the SAP HANA database, where they can be stored for private use or shared with others.
The objects and views that can be modeled in Information Composer can equally well be created in SAP HANA Studio, the developer tool of the SAP HANA client suite of applications. In contrast to Studio however, Information Composer offers the basic modeling capabilities of Studio in a web-based tool that is much easier to use. This tool can thus be used by people outside of the IT organization to build
Personal Copy for RGA Rik Vriens, user id c3b3ffa0-d601-c76a-06ae-b5f2c05f5c4a

174
Data Modeling with Information Composer 7
data models that can serve as data sources for new reports in SAP Business Objects or elsewhere. (We discuss SAP HANA Studio in more detail in Chapters 8 and 9.)
Studio versus Information Composer
The decision to use Studio versus Information Composer is based on your organizational context. In organizations that give many users the possibility to create their own reports in SAP ERP (e.g., using InfoSets) and place the central IT organization in charge of the subset of reports that are globally used and standardized, Information Composer may take on a bigger role. Studio would then be used to ensure standardization and consistency of the global reports. In contrast, in companies with a highly standardized set of reports on both the global and local levels, Studio will likely take on a comparatively bigger role.
In general, keep the following in mind when deciding when to use each of these client tools to model data:
EE Studio offers more capabilities but conversely requires more experience and more knowledge of the IT processes. As a broad rule of thumb, if complex transformations are required that go significantly beyond simple aggregation, Studio is the most likely choice.
EE The information views created in Studio are available to users of Information Composer. Thus, by creating a number of views in Studio, you can make life easier on power users. For example, creating a view in Studio for generic, non-sensitive customer master data avoids effort for every power user to have to do it on his own.
EE The more you model reusable, centrally supported and “guaranteed correct” objects and views in Studio, the more standardized your reports will likely be. The less you offer, the more freedom power users will have and use to create their own local views of the data but also the more divergent the final reports will be across your company.
EE Consider what your support model is today and in the future for reports that are cre-ated by power users for themselves or by authors for local user groups. The logistics for providing up-to-date documentation and support for the SAP HANA views that exist must be in place for power users and authors to work with the views efficiently and accurately.
EE Consider how much training you’re able and willing to provide to power users and local authors. If you leave it up to power users and authors to model much of their information views from scratch, you need to ensure they have enough technical and functional knowledge of both data modeling and the data itself to come to accurate reports later.
Information Composer requires that its users are familiar with the underlying SAP HANA views for the area in which they want to work (e.g., if you want to build a local sales revenue report for your department, you’ll need to know which exist-ing information views can be used for this). Users will also need to receive some
© 2013 by Galileo Press Inc., Boston (MA)

175
Getting Started with Information Composer 7.1
basic training in the use of the tool and finally need to be comfortable with basic data modeling concepts and techniques. For people with the required knowledge, Information Composer can be a very powerful tool.
In this chapter, we go over the capabilities and elements of Information Composer, and we explain and demonstrate the use of the tool using an example scenario.
7.1 Getting Started with Information Composer
Information Composer is an SAP HANA tool whose purpose is to help you load data into SAP HANA and to create new data models and data combinations in the database. The following are the two main functions:
EE Uploading data for use in SAP HANA.
EE Composing an SAP HANA information view. There are three general types of information views in SAP HANA:
EE Attribute view
EE Analytic view
EE Calculation view
The views that are built using Information Composer are generated as calculation views on the SAP HANA system. A calculation view‘s main purpose is to combine other existing views. Typical combinations include actual with planned data, or sales revenue with invoiced amounts (queries such as “how much has not yet been invoiced?”).
Prior to starting in Information Composer, it’s best to take a moment to think about the data you want to find and combine:
EE How is it structured?
EE How much detail do you want?
EE How much detail do you need?
EE Which views in SAP HANA best match the amount of information and level of detail you want to have in reporting?
EE Are the views you want to use suitable to the end result, and can they provide accurate results for your intended purpose?
EE Does the data need to be combined with a join or with a union operation?
Personal Copy for RGA Rik Vriens, user id c3b3ffa0-d601-c76a-06ae-b5f2c05f5c4a

176
Data Modeling with Information Composer 7
Identify the views from SAP HANA that you think are best. If you plan to upload data from a spreadsheet, cleanse and prepare it as far as reasonable. Make a note of any peculiarities in the data or in the views that you’re aware of and that may affect your end result.
In this section, we’ll introduce you to Information Composer by briefly discussing its high-level functionality, and then describing the example scenario that we’ll use to demonstrate Information Composer’s capabilities.
7.1.1 Functionality
When you have an idea of which data you’re after and how it should combine, launch Information Composer and get started. Information Composer is a web-based tool, meaning it opens in a web browser. After it’s installed on your PC, you can launch it in your web browser by entering the web address provided to you by your IT department. It will likely look something like http://<server name>:8080/IC or https://<server name>:8443/IC. In addition, the tool requires Microsoft Silverlight to be installed and activated as an add-on to the web browser. Log on with the user name, password, and the SAP HANA system identifier provided to you.
The main tasks to perform in Information Composer and the order in which you go about them are listed here:
1. Uploading data, if applicable:
EE Upload the data from a file on your computer.
EE Review the data, and cleanse it if necessary.
EE Save the final data to a database table in SAP HANA.
2. Composing—that is, building—a new information view:
EE Choose any two views from SAP HANA; for example, your uploaded data and another existing view, or two existing but as yet separate views in SAP HANA. Alternatively, choose an existing information view you created earlier (or one that was shared with you), and copy it to a new view.
EE Specify how to combine the two views.
EE Refine the data; for example, by hiding columns, creating a calculated column, cleansing data, and so on.
3. Save the view to SAP HANA.
4. Publish the new view, and, optionally, share it with others.
© 2013 by Galileo Press Inc., Boston (MA)

177
Getting Started with Information Composer 7.1
As we mentioned, Information Composer has two main functions: the Upload function and the Compose function (Figure 7.1). The Upload function allows you to load data from your PC to Information Composer and, after cleansing and clas-sifying the data, to the SAP HANA database itself. The Compose function allows you to use two sources of data from SAP HANA—whether it’s data previously uploaded through Information Composer or any of the existing information views in SAP HANA—combine them into one, and save the result as a new view definition to the SAP HANA database. If you need to upload new data from your PC first, choose the Upload function first, and then move on to the Compose function. If no upload is required and you want to use two existing SAP HANA views, choose the Compose function immediately from the main screen.
The interface is simple and presents a step-by-step guide for each of the necessary activities in the two main functions. By walking through the steps in the predefined order, the functions can be performed quite quickly. Any uploads or views from Information Composer can be saved for private use only or shared with other users.
Figure 7.1 The Information Composer Main Screen
Personal Copy for RGA Rik Vriens, user id c3b3ffa0-d601-c76a-06ae-b5f2c05f5c4a

178
Data Modeling with Information Composer 7
7.1.2 Example Scenario
In this chapter, we’ll go through the capabilities of Information Composer with a scenario that requires both the upload and compose functions. Our goal is to combine sales forecast data uploaded from a workbook with actual sales data from a view in SAP HANA.
To do this, we’ll use both the Upload and the Compose functionalities of Infor-mation Composer. The sales forecast data comes from an Excel workbook, which demonstrates the Upload function. In the meantime, there is an existing view in SAP HANA for actual sales data (an analytic view that we’ve determined contains the necessary information and is close to the level of detail of the forecast data). In our example, we’ll combine the forecast data with the actual data, illustrating how to perform mappings between the views in the Compose function.
To achieve the desired result, the first task is to upload the sales forecast from the spreadsheet file on your PC to SAP HANA. Next you need to combine it with the existing actuals view so that the actuals and forecast data can be put side by side in the final report output. The final result will be saved to SAP HANA as a fully reusable, database-supported information view.
Before we begin with development, it’s best to examine and inventory the data available, and plan your activities in Information Composer accordingly. The sales forecast data is shown in Figure 7.2.
Figure 7.2 Spreadsheet to Be Used to Upload Data to SAP HANA
© 2013 by Galileo Press Inc., Boston (MA)

179
Getting Started with Information Composer 7.1
The sales actuals data is much more detailed because it’s based on SAP ERP trans-actional data tables (Figure 7.3).
Figure 7.3 Actuals Data from the SAP HANA Database
Tip
The screenshot of the actual sales data is from within Studio. Power users and authors usually won’t have access to Studio, however. To preview data and do some preliminary analysis before combining it with another data set, power users and authors have three main options:
EE Use the data preview that comes standard with Information Composer and is auto-matically available during the process of composing a view. Wherever possible, use this standard option.
EE If the built-in data preview isn’t enough—for example, if the data set is large and you need to examine the entire set before knowing how to combine it with a second source—create a Draft or Private information view in Information Composer with only the single view from SAP HANA you want to analyze combined with a simple attribute view. Then, view the result in its entirety in your frontend tool.
EE If you have access to SAP Business Objects in your frontend tool suite, use SAP Business-Objects Explorer to connect easily to the SAP HANA view. SAP Business Objects Explorer is a very powerful data profiling and discovery tool.
In general, go over the SAP HANA view(s) you want to use carefully with an eye to which filters are required to make the proposed information view work, and
Personal Copy for RGA Rik Vriens, user id c3b3ffa0-d601-c76a-06ae-b5f2c05f5c4a

180
Data Modeling with Information Composer 7
check that the necessary variables are available for this. Ensure the correct data can be selected from the view(s) for your specific purpose.
Note
At any time during the data upload definition or the composing of new views, you can save your work to come back to it later. This will place the object in the Draft Models or Draft User Data sections of the screen where you can easily retrieve it later.
Now that you’re acquainted with the example scenario and understand what you have to accomplish, let’s walk through the necessary steps.
7.2 Uploading Data to SAP HANA
You can upload data to SAP HANA using Information Composer from the follow-ing sources:
EE Microsoft Excel files (.xls or .xlsx)
EE Comma-delimited files (.csv)
EE The clipboard
To upload data, perform these steps:
1. Specify the source of the data and load the data into Information Composer.
2. (Optionally) cleanse the data.
3. Classify data columns into attributes and measures.
4. Finish by saving the data to SAP HANA.
We discuss each of these steps in more detail next.
7.2.1 Specifying the Data Source and Loading Data
To start the upload, log on to Information Composer, and click on the Upload function on the initial screen (Figure 7.4). Next, click Start.
© 2013 by Galileo Press Inc., Boston (MA)

181
Uploading Data to SAP HANA 7.2
Figure 7.4 Switching to the Upload Function on the Main Screen
This releases the central dialog screen. The activities that you need to perform are listed on the left side of this dialog from top to bottom (Figure 7.5):
EE Source comprises identifying the data source and uploading the data itself.
EE Classify comprises identifying which columns are measures (quantities and amounts).
EE Finish comprises saving the data to SAP HANA and, optionally, publishing it for public use.
Figure 7.5 Uploading Data: Step 1—Specify the Data Source
Personal Copy for RGA Rik Vriens, user id c3b3ffa0-d601-c76a-06ae-b5f2c05f5c4a

182
Data Modeling with Information Composer 7
Choose the source of your data (Figure 7.6):
EE Data from File System will enable you to browse your computer for a work-book file.
EE Data from Clipboard will give you an area where you can use the Paste func-tion to place the data.
Figure 7.6 Choosing the Workbook and Tab to Upload
There are some specific points to note here:
EE When uploading from a workbook, only one tab can be uploaded. Essentially, it’s one set of data in table format that is required as input here. The reason for this is to afterwards enable Information Composer to save the data to SAP HANA in a table on the database. Information Composer will automatically define and create the table for you.
EE The data still needs to be in an accepted format if you use the clipboard as a source; for example, it can be a selected set of values from a spreadsheet that you’ve copied to the clipboard. Basically, the data on the clipboard needs to be structured, meaning it should come from a spreadsheet or .csv source, so that Information Composer can recognize columns and rows in it.
© 2013 by Galileo Press Inc., Boston (MA)

183
Uploading Data to SAP HANA 7.2
The option Upload with column headers allows you to also import the column headings into Information Composer.
Click Upload. A confirmation will appear on the screen when your data has been successfully uploaded to Information Composer (Figure 7.7). On this screen, you’ll also get a sample of the data as a preview so you can check that it was imported correctly, and the next activity becomes accessible (the Classify activity on the left side is now clickable).
Figure 7.7 The Initial Upload of Data Presented with Column Headers and Data Values
Note that, at this point, your data is in the local session of Information Composer but hasn’t been copied into a database table on the SAP HANA system yet. Also notice the small “AB” letters next to each of the column headers in the data preview portion. These indicate that for now, all of the fields are considered as literals, and Information Composer doesn’t yet know which are codes for entities (attributes) and which are amounts or quantities (measures).
An interesting extra feature is the ability to look at your uploaded data at a more summarized level now. The Data Summary View button at the bottom of the data preview screen brings up a view of the top five values for each column according to the number of times they occur in the table (Figure 7.8).
Personal Copy for RGA Rik Vriens, user id c3b3ffa0-d601-c76a-06ae-b5f2c05f5c4a

184
Data Modeling with Information Composer 7
Figure 7.8 The Data Summary View Offering a High-Level Profile of the Uploaded Data
7.2.2 Cleansing the Data
After successfully uploading data, you can also do some data cleansing. This step is optional, so if no cleansing is required, you can skip this activity and proceed with the Classify activity instead.
If you do want to makes some changes to the data now, click the Cleanse Data button in the top-right corner (shown in Figure 7.8). The screen will change to a Cleanse Data dialog (Figure 7.9).
Exactly what is on offer on this screen depends on your data, but you always have the option to merge values or change values. We’ll discuss both of these processes next.
Merging Values
In our case, Information Composer starts with the sales organization (Sales_Org). As it happens, this is the column with a very lopsided distribution of values: two sales organizations occur only once while the third occurs hundreds of times in the data. Because of this, you might want to merge the small organizations with the larger one. To merge values, use the graphic on the right half of this screen. Each small stack of papers represents one specific value. Click and drag a stack of papers on to the large bottom stack of papers at the bottom of the screen (Figure 7.10).
© 2013 by Galileo Press Inc., Boston (MA)

185
Uploading Data to SAP HANA 7.2
Figure 7.9 The Option to Cleanse Data
Figure 7.10 Merging Values by Dragging Them on the Screen
Personal Copy for RGA Rik Vriens, user id c3b3ffa0-d601-c76a-06ae-b5f2c05f5c4a

186
Data Modeling with Information Composer 7
Immediately, the result of the merge is reflected on the left side as well, where the values and occurrence counts are changed accordingly (Figure 7.11).
Figure 7.11 Result of the Merging of Values Reflected Immediately
In the example scenario, however, you actually don’t want to merge values. So, to undo the merge, simply click Undo in the top-right corner of the screen.
Changing Values
Another type of data cleansing possible in Information Composer is to change specific values. This may be useful if the uploaded data contains values entered in somewhat different formats. For example if you use Country and sometimes the value is “US” and other times it’s “USA”, you can change one of these to match throughout the uploaded data and with the second source of data you intend to combine it with. We’ll illustrate with the second field presented for possible cleans-ing by Information Composer.
Switch from sales organization to the second field by using the tabs (Figure 7.12).
© 2013 by Galileo Press Inc., Boston (MA)

187
Uploading Data to SAP HANA 7.2
Figure 7.12 Moving to Another Field for Data Cleansing Activities
The field now presented is Customer. To change a particular value, hover the mouse pointer over the value, and a small icon will appear next to it (Figure 7.13).
Figure 7.13 Changing Values during Data Cleansing
Click on the icon to bring up a dialog box. Here you can type in what you want the value to be (Figure 7.14).
Figure 7.14 Editing Values during Data Cleansing
When you’re done cleansing data, click the OK button to return to the main activi-ties screen.
Personal Copy for RGA Rik Vriens, user id c3b3ffa0-d601-c76a-06ae-b5f2c05f5c4a

188
Data Modeling with Information Composer 7
Note
The data cleansing capabilities just reviewed in Information Composer can all be done prior to the data upload as well, in the workbook itself using, for example, Microsoft Excel.
The Data Summary view offers an extra feature by having a real-time profile of the column values available during cleansing, so for small data sets and data sets where minimal cleansing is required, it may be just as easy or easier to do it in Information Composer. But for large data sets, it’s still best to do most of the cleansing in the workbook, prior to the upload to Information Composer. More complicated cleansing tasks involving, for example, many thousands of rows of data, would be cumbersome to perform in Information Composer.
7.2.3 Classifying Data Columns
Click on Classify on the left side of the screen to move on to this task. This displays the columns that Information Composer estimates may be used for calculations, that is, that may be measures (Figure 7.15).
Figure 7.15 Classifying Fields as Attributes and Measures
© 2013 by Galileo Press Inc., Boston (MA)

189
Uploading Data to SAP HANA 7.2
Note
Notice here that in addition to the sales Forecasted Amount, Information Composer also presents Sales Office as a potential measure. This is also why Sales Office was not presented for data cleansing earlier: during the initial data upload, Information Com-poser has analyzed the data columns and made a best guess as to what kinds of values they contain. Take a quick look back at the screenshot of the actual Excel workbook earlier in the chapter (Figure 7.2). Because Sales Office has only numeric values, it was deemed most likely to be a measure. The column Sales Org also has only numbers in it, but some of them start with zero (e.g., “0405”), making it more likely that this is an attribute code and not a measure. Of course for users, the heading Sales Office makes it clear that the column is an attribute, but the tool has no way of interpreting language this way and makes its initial classification of fields based on the values in the columns.
Before starting on more complicated data sets, it’s best to try out a few small files for practice. By formatting columns differently in the workbook or using alternative codes or descriptions in columns, you’ll find out quickly how to make things go as smoothly as possible. For example, in the scenario just described, any data cleansing needed on the Sales Office column has been done in Excel already, and it’s no longer important how Information Composer classifies the field. In the end, any field not classified as a measure in the Classify activity will wind up as an attribute in the final SAP HANA table.
Mark the columns that are measures by clicking on the checkmark below the column. The column will become green, and the checkmark will be in place (Figure 7.16).
Figure 7.16 Classifying the Correct Fields as Measures with All Others Attributes by Default
Personal Copy for RGA Rik Vriens, user id c3b3ffa0-d601-c76a-06ae-b5f2c05f5c4a

190
Data Modeling with Information Composer 7
7.2.4 Saving the Data
The last activity is to publish the uploaded, cleansed, and classified data to SAP HANA. Click the Finish icon on the left side of the screen (Figure 7.17).
Figure 7.17 Finishing the Data Upload and Publishing the Data
Provide a technical name for the view and the table the data will be stored in. The name you provide here will become the technical name of the data source from now on. It will be used, for example, as the technical name of the view when you compose other views with it later. The name can only contain letters, numbers, and the underscore character for this reason.
Choose the other two available options as needed:
EE Share this data with other users will make the view available to all users who have the IC_PUBLIC role in SAP HANA and will make this a public information view. If you don’t select this option, only you can see it, and it will be a private information view.
EE Start a new Information View based on this data will perform the finish function and immediately skip ahead to a new Compose screen where you can combine the data with another view.
© 2013 by Galileo Press Inc., Boston (MA)

191
Composing Information Views 7.3
Click the Publish and Finish button to place the data into a table on the SAP HANA database and make the view available for yourself and/or others.
A confirmation message will appear on the screen (Figure 7.18).
Figure 7.18 Success Message after the Data Uploads
7.3 Composing Information Views
Information views composed in Information Composer consist of two sources of data that are combined together (with a join, a union, or fully custom mappings).
To compose a new information view, here are the high level steps:
1. Specify two sources of data, called “Source A” and “Source B.”
2. Combine the data.
3. Refine the data; for example, hide columns, create a calculated column, cleanse data, and so on.
4. Save the view to SAP HANA.
5. Publish the new view, and, optionally, share it with others.
Next, we’ll describe these steps in more detail.
Personal Copy for RGA Rik Vriens, user id c3b3ffa0-d601-c76a-06ae-b5f2c05f5c4a

192
Data Modeling with Information Composer 7
7.3.1 Specifying Data Sources
To begin, click on Compose on the initial screen, and then click on Start (Figure 7.19).
Figure 7.19 The Main Screen with the Compose Function Selected
This releases the central dialog screen. As in the previous section, the activities you need to perform appear on the left side of this dialog from top to bottom:
EE Source A allows you to specify the first source of data you want to use.
EE Source B allows you to specify the second source of data you want to use.
EE Combine allows you to join or union the data together.
EE Refine allows you to hide columns and calculate new columns.
EE Finish allows you to save the definition of the view to SAP HANA and share it as a public view, if desired.
© 2013 by Galileo Press Inc., Boston (MA)

193
Composing Information Views 7.3
For each of the activities Source A and Source B, select the data source from the list presented (Figure 7.20).
Figure 7.20 Choosing the First Source of Data
You can look for views in two different ways:
EE Type the beginning letters of the name of the view into the Filter… input field at the top of the screen. Be aware that the search happens based on the begin-ning letters only; for example using the filter “SALES” will bring back everything that is called “SALES_1”, “SALESHDR”, and so on, but it won’t find a view called “PAST_SALES”.
EE Use the icons at the bottom of the screen to look only within a specific type of information view if you know the type of view you’re looking for (Figure 7.21).
Personal Copy for RGA Rik Vriens, user id c3b3ffa0-d601-c76a-06ae-b5f2c05f5c4a

194
Data Modeling with Information Composer 7
Figure 7.21 Different Options for Browsing through Available Views
Select the analytic view with actual sales information as source A (Figure 7.22).
Figure 7.22 Selecting the First Source of Data by Searching in the List of Available Views
Click on the view name to select it. The view will be selected as the first source, and a preview of its data will appear. Source A is now selected.
Click on the Source B activity on the left side of the screen, and select the data you’ve uploaded for the sales forecast earlier in the chapter as the second source of data (refer to Section 7.2). Notice that even when going through the list of views to select, the system automatically offers a small preview of the columns and data in a view to help you make the right selection (Figure 7.23).
In any view selected as Source A or B, you can further verify that it contains the data you want by using the magnifier icon. This enables you to look for specific values in larger data sets (Figure 7.24).
© 2013 by Galileo Press Inc., Boston (MA)

195
Composing Information Views 7.3
Figure 7.23 Selecting the Second Source of Data, Which Has Just Been Uploaded to SAP HANA Using Information Composer
Figure 7.24 Previewing and Searching Data of a View Prior to Finalizing Its Selection as a Source of Data
Personal Copy for RGA Rik Vriens, user id c3b3ffa0-d601-c76a-06ae-b5f2c05f5c4a

196
Data Modeling with Information Composer 7
7.3.2 Combining Data
The next activity is to combine the data. When you click on the Combine icon, Information Composer first tries to combine the data for you. If column headings match, and values appear compatible, mappings between the two sources are automatically proposed.
In general, the system attempts to come up with combination settings, but if it can’t, or you don’t want to keep the proposed settings, you can combine data yourself in three ways: using the join option, using the union option, or creating your own mappings.
Because the system can’t find automatic combinations for columns in both sources in the example, the resulting screen looks like Figure 7.25.
Figure 7.25 Message Stating the System Can’t Combine Two Sources of Data
Click on Create your own combination settings.
To use the join or union options, choose whether the combination type will be a join or a union. You must be careful to choose correctly here; picking the wrong option will most likely lead to incorrect data in the final view.
© 2013 by Galileo Press Inc., Boston (MA)

197
Composing Information Views 7.3
EE Join A join will match up rows from both sources with each other based on the join condition you specify. Joins are generally useful to combine one source with measures with a second source that contains extra attributes to qualify the data further.
EE Union A union won’t match up rows; rather, it simply adds the rows from the second source to those of the first source while matching up the columns. Unions are generally useful to combine two sets of measures that share a number of com-mon attributes.
The concept of a join is illustrated in Figure 7.26; in this case, it’s the default inner join type. Information Composer defaults to the inner join type when you choose the Join option, but with use of the Show Advanced Operations link, you can also create a left outer or right outer join.
SalesOffice
SalesEmployee
SalesRegion
Berlin Jürgen Schengen
London Jeremy UK
Paris Jacques Schengen
SalesOffice
OrderType
Sales
Berlin Standard 8,000
London Rush 11,000
Paris Standard 14,000
SalesOffice
Order Type SalesEmployee
SalesRegion
Sales
Berlin Standard Jürgen Schengen 8,000
London Rush Jeremy UK 11,000
Paris Standard Jacques Schengen 14,000
Source A
Source B
Join Operation basedon Sales Office
Information View Result
Figure 7.26 Result of a Join between Two Data Sources
The concept of a union is illustrated in Figure 7.27.
Personal Copy for RGA Rik Vriens, user id c3b3ffa0-d601-c76a-06ae-b5f2c05f5c4a
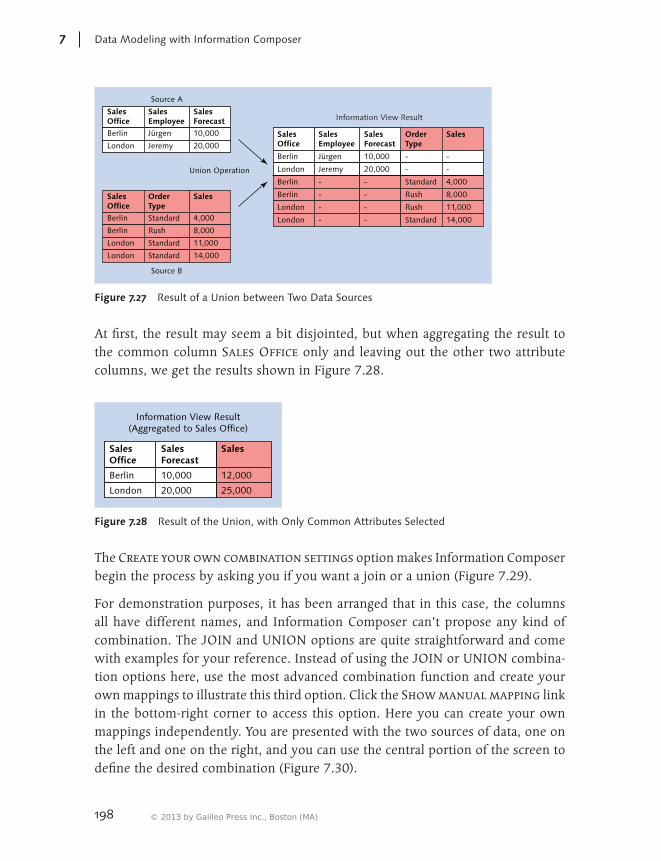
198
Data Modeling with Information Composer 7
Source A
Source B
Union Operation
Information View Result
SalesOffice
SalesEmployee
SalesForecast
OrderType
Sales
Berlin Jürgen 10,000 - -
London Jeremy 20,000 - -
Berlin - - Standard 4,000
Berlin - - Rush 8,000
London - - Rush 11,000
London - - Standard 14,000
SalesOffice
SalesEmployee
SalesForecast
Berlin Jürgen 10,000
London Jeremy 20,000
SalesOffice
OrderType
Sales
Berlin Standard 4,000
Berlin Rush 8,000
London Standard 11,000
London Standard 14,000
Figure 7.27 Result of a Union between Two Data Sources
At first, the result may seem a bit disjointed, but when aggregating the result to the common column Sales Office only and leaving out the other two attribute columns, we get the results shown in Figure 7.28.
SalesOffice
SalesForecast
Sales
Berlin 10,000 12,000
London 20,000 25,000
Information View Result(Aggregated to Sales Office)
Figure 7.28 Result of the Union, with Only Common Attributes Selected
The Create your own combination settings option makes Information Composer begin the process by asking you if you want a join or a union (Figure 7.29).
For demonstration purposes, it has been arranged that in this case, the columns all have different names, and Information Composer can’t propose any kind of combination. The JOIN and UNION options are quite straightforward and come with examples for your reference. Instead of using the JOIN or UNION combina-tion options here, use the most advanced combination function and create your own mappings to illustrate this third option. Click the Show manual mapping link in the bottom-right corner to access this option. Here you can create your own mappings independently. You are presented with the two sources of data, one on the left and one on the right, and you can use the central portion of the screen to define the desired combination (Figure 7.30).
© 2013 by Galileo Press Inc., Boston (MA)

199
Composing Information Views 7.3
Figure 7.29 Choosing between Join and Union to Combine Data Sources, or Choosing to Create Manual Mappings
Figure 7.30 The Initial Screen for Defining Data Mappings Manually
Personal Copy for RGA Rik Vriens, user id c3b3ffa0-d601-c76a-06ae-b5f2c05f5c4a

200
Data Modeling with Information Composer 7
Mappings are made simply by dragging fields from both the left and right side of the screen to the middle portion. In Figure 7.31, the fields are identified from the two sources for the sales organization. In a join, this would specify a join condition; in a union this identifies columns that correspond.
Figure 7.31 Dragging and Dropping Fields to Create Mappings
The final result of the combination settings is shown in Figure 7.32, with all three matching fields identified as pairs from both sources of data.
When the necessary field mappings have been provided, click OK to accept the combination definition and to go back to the main screen.
With both sources of data now combined, you can move on to the next step in the view definition. Click the Refine activity on the left side of the screen (Figure 7.33).
© 2013 by Galileo Press Inc., Boston (MA)

201
Composing Information Views 7.3
Figure 7.32 The Completed Mappings
Figure 7.33 Refining Data, If Necessary
Personal Copy for RGA Rik Vriens, user id c3b3ffa0-d601-c76a-06ae-b5f2c05f5c4a

202
Data Modeling with Information Composer 7
In this example, there is no further refinement to be done. In general, you shouldn’t have much to do in this step because the two sources of data are predefined and as such have already been refined in most cases. Refining data by identifying which columns are measures should therefore no longer be necessary in the Manage Fields function, but you can always check the field classifications there if you want to. But refining data by creating calculated fields may be useful, and you can do so in this step if desired.
To create a new calculated field, click the Add calculated field link. You can calcu-late either an attribute or a measure. In either case, you’ll need to simply provide a name, a data type, and the calculation expression. The expressions are constructed similar to the way they are in Studio, using any of the functions provided in a list to you and, of course, the existing fields of the view.
Our example doesn’t require any refinement, so you can simply click on the Finish activity on the left to go to the screen where you can save your new view definition to SAP HANA (Figure 7.34).
Figure 7.34 Finishing the New View Created in Information Composer
© 2013 by Galileo Press Inc., Boston (MA)

203
Viewing Uploaded Data and Composed Information Views 7.4
7.4 Viewing Uploaded Data and Composed Information Views
At some point during your work in SAP HANA, you’ll probably want to see your uploaded data or composed information views, even if you haven’t published them yet. Information Composer offers two tools for precisely these functions: the My Data screen, and the My Information Views screen.
7.4.1 My Data Screen Area
When you select the Upload function, the left side of the screen will display an area called MY DATA. Here you’ll find data that has already been uploaded and published to the SAP HANA database, as well as your own upload definitions that are still in progress (Figure 7.35).
Figure 7.35 The MY DATA Screen
With the Filter icon, you can choose to see different sets of uploaded data. This tool allows you to find the data you’re looking for more easily.
EE Draft user data will display only those upload views that you’ve saved but not yet finished.
EE Private user data will display those upload views that you’ve created and fin-ished.
EE Public user data will display all uploaded views that you or any other user have finished with the option Share this data with other users.
Personal Copy for RGA Rik Vriens, user id c3b3ffa0-d601-c76a-06ae-b5f2c05f5c4a

204
Data Modeling with Information Composer 7
With regards to which options are available for your data, keep in mind the following:
EE Data upload definitions that you’ve created but that haven’t yet been published can be edited from here. The Tools icon allows you to rename, delete, or share the data, and data can be exported (this will happen in the .csv file format, a comma-delimited text file).
EE Views that have already been published can only be renamed or shared.
EE Views that have already been published and shared aren’t editable anymore; they can only be exported.
You can recognize views that have already been published from the icon next to them, which displays a green checkmark.
Views that have been both published and shared are identified by the same green checkmark combined with a people icon element.
An important feature of the MY DATA screen area is to refresh existing data. Pro-vided the new data has the same format as the existing data, you can refresh data by following these steps:
1. From the MY DATA screen area, select the data to be refreshed.
2. On the following screen, click Refresh Data.
3. Specify the source of the data as you would for a normal upload.
4. Click Update to load the new data into SAP HANA.
7.4.2 My Information Views Screen Area
When you select the Compose function, the left side of the screen will display an area called My Information Views. This works exactly like the MY DATA screen area but lists views instead.
By default, all information views used will be listed, but you can use the Filter function to manage your own views from here in an easy overview. You can filter for the following:
EE Draft Models, which you’ve saved but not yet finished
EE Private Models, which you’ve finished
© 2013 by Galileo Press Inc., Boston (MA)

205
Summary 7.5
EE Public Models, which have been finished and published with the option Share this data with other users by yourself or any other user
The Tools icon allows you to edit some properties of the views and generally access their definitions. You can rename, delete, copy, and share an information view this way, or export its data to a .csv file (comma-delimited text file).
As is the case throughout Information Composer, views that have already been published (but not shared) can only be renamed or shared. Views that have already been published and shared aren’t editable anymore; they can only be exported. You can recognize views that have already been published from the icon next to them, which displays a green checkmark. Views that have been both published and shared are identified by the same green checkmark combined with a people icon element.
7.5 Summary
This chapter introduced you to the Information Composer tool, which allows you to upload data to SAP HANA and to create new information views in SAP HANA. The tool offers a web interface and is well suited for use by authors and power users. The functionality goes beyond typical frontend tools but stops short of the full array of capabilities (and the required training and organizational context) of SAP HANA Studio. You can upload data from spreadsheets or similar sources and combine any existing two views from SAP HANA into a new view. The uploaded data and the views created in Information Composer are saved to the SAP HANA database and can be shared with other Information Composer users.
Be aware that knowledge of the views in the SAP HANA system is required to make accurate new views that also perform well. If you want to make extensive use of Information Composer, it’s also best that the reusability of views created in Studio is considered during the design. This will ensure that views created by business users with authoring rights both present consistent data across the enterprise and follow a basic set of guidelines that allow them to be supported in an effective way.
Personal Copy for RGA Rik Vriens, user id c3b3ffa0-d601-c76a-06ae-b5f2c05f5c4a

© 2013 by Galileo Press Inc., Boston (MA)

207
SAP HANA Studio is the developer tool that you’ll use to build and deploy data models.
8 Data Modeling with SAP HANA Studio
SAP HANA Studio is the central tool for developers in your SAP HANA landscape for defining the tables that will hold your data, setting up data provisioning on SAP HANA, and modeling data into views. In this chapter, we’ll focus on the modeling capabilities of SAP HANA Studio (or Studio, for short), taking a practical, hands-on approach to modeling using real-life examples. The basic modeling capabilities in Studio comprise attribute views, analytic views, and calculated views, which are all covered in this chapter. Advanced options such as filtering, variables, custom calculations, and currency conversion are covered in the next chapter.
Studio differs from Information Composer in that it offers more advanced modeling options, as well as being the tool in which you perform the administration of the models. (For a more detailed discussion of the differences between Information Composer and Studio, refer to the beginning of Chapter 7.) Studio also serves as the tool in which you start and stop the data feeds from external systems using the SAP Landscape Transformation tool (SLT), but we’ll save that discussion for Chapter 10.
We’ll follow a logical progression through the topics pertaining to data modeling in Studio. In the first two sections, we introduce some new terms and take a look at the layout and different elements of the Modeler. The next three sections cover basic modeling, where we take a sample data model in the sales area and model it in SAP HANA in a step-by-step fashion.
8.1 SAP HANA Studio Overview and Terminology
Studio is organized into perspectives. A perspective organizes the screen into different elements, giving you all the tools, information, and functions you need to accom-plish a specific task. Perspectives can be customized by each individual user to his
Personal Copy for RGA Rik Vriens, user id c3b3ffa0-d601-c76a-06ae-b5f2c05f5c4a

208
Data Modeling with SAP HANA Studio8
liking. Often, developers have their own preferred way of working with screens, such as positioning certain information on the screen in a way that works for them.
The following standard perspectives are offered by SAP:
EE Administration Console (the default perspective when launching Studio)
EE Modeler
EE Debug
EE RCP Perspective
EE Resource
EE SVN Repository Exploring
EE Team Synchronizing
We’ll work with the standard SAP perspectives and their standard layouts in this chapter. In particular, we’ll be covering the Modeler perspective in detail.
Before starting the example scenario and logging on to SAP HANA, you need to become familiar with the terminology of the different modeled objects. At its most basic level, data in SAP HANA is organized and stored in tables. Each field in a table is classified either as an attribute or a measure:
EE An attribute is an entity that qualifies data in some way. Examples are Material and Customer.
EE A measure is an entity that quantifies something. Examples are Order Quantity and Sales Amount.
To bring data from different tables together, you model information views. Specifi-cally, there are three types of information views:
EE Attribute views Attribute views are views on one or more tables that are reusable for different purposes. They are the basic building blocks in the Modeler. Attribute views are often comparable to dimensions in the language of SAP NetWeaver Business Warehouse (BW), although one important difference is that attribute views are fully reusable throughout the system and not tied to any particular model or even subject area.
Example: An attribute view named “Organization” can bring together different organizational entities such as company code, controlling area, and credit control
© 2013 by Galileo Press Inc., Boston (MA)

209
SAP HANA Studio Overview and Terminology 8.1
area into one object. You can then use that object in all analytic and calculation views for the subject area where the entities are relevant. This way you can standardize which attributes are available in all of the reports in, say, Credit Reporting.
Most of the attribute views you create will be on master data. However, there is no technical restriction for this, and it’s equally possible to create attribute views on transaction tables. To make attribute views of this type reusable, you need to be careful with their definition, so this type of attribute view shouldn’t be used too often. For example, an attribute view on Sales Document Header and Sales Document Item is reusable.
EE Analytic views Analytic views join together one central fact table, which contains the measures you want to report on, with any number of other tables and/or attribute views that contain additional attributes to report by. Additionally, you can create cal-culated measures and variables in an analytic view.
An analytic view that contains all of these elements is often used directly as a source of data for reporting tools. From a reporting perspective, analytic views like this are roughly comparable to InfoCubes in SAP NetWeaver BW or InfoSets in SAP ERP.
Example: Sales by product, customer, and organizational entity.
EE Calculation views Calculation views bring together database tables, attribute views, analytic views, and even other calculation views to satisfy a complex business requirement. They offer a way to combine different analytic views (i.e., more than one fact table) into one source of data for reporting tools.
Example: Comparison of actual sales with forecast sales.
For most BI architects familiar with SAP products, such as SAP NetWeaver Busi-ness Warehouse (BW), it’s tempting to compare these types of views with the ones used throughout BW: attribute views are like dimensions, analytic views are like cubes, and calculation views are more or less like MultiProviders. To some extent this is true, but don’t be fooled by the superficial resemblance. Information views in SAP HANA offer much more than this, and need to be modeled carefully for both reusability and performance. From an architectural point of view, then, it would be a mistake to consider the information views to be simple counterparts of dimensions, cubes, and MultiProviders in SAP NetWeaver BW.
Personal Copy for RGA Rik Vriens, user id c3b3ffa0-d601-c76a-06ae-b5f2c05f5c4a

210
Data Modeling with SAP HANA Studio8
Consider the two implementations shown in Figure 8.1 and Figure 8.2.
Analytic View 1
Data Foundation 1
Fact Table, e.g.,VBRP: SalesInvoice Item
Data Foundation 2
Fact Table, e.g.,BSEG: General
Ledger DocumentItems
AttributeView
KNA1: GeneralData in Customer
Master
ADRC: AddressData
KNVV: SalesArea Data for
Customers
Analytic View 2
Figure 8.1 Attribute View Used as One-Stop Shop for all Analytic Views
Analytic View 2
Fact Table, e.g.,BSEG:General
Ledger DocumentItems
Data Foundation 2
KNA1: GeneralData in Customer
Master
Attribute View
ADRC: AddressData
Attribute View
KNVV: SalesArea Data for
Customers
Attribute View
Data Foundation 1
Fact Table, e.g.,VBRP: SalesInvoice Item
Analytic View 1
Figure 8.2 Separate Attribute Views Used on As-Needed Basis Only in Analytic Views
In the first implementation, the attribute views are modeled in a similar way to SAP NetWeaver BW objects. The customer attribute view here contains all essential
© 2013 by Galileo Press Inc., Boston (MA)

211
SAP HANA Studio Overview and Terminology 8.1
customer data. This leads to maximum reusability of the view—it’s essentially a one-stop shop for any and all customer attributes.
In the second implementation, the attribute views are comparatively smaller. This leads to more objects in the system but also to better performance, while still maintaining very good reusability of the views. The performance is better here because of multiple factors:
EE Each view contains fewer fields than the combined attribute view for customer data in the first implementation.
EE Each attribute view is at the best possible level of detail. For example, the sales area level of detail in the customer data isn’t required in the second analytic view, but in the first implementation, it is still be retrieved. In the second imple-mentation, only the maximum required level of detail is retrieved.
EE There are fewer joins to execute (three joins for the first analytic view but only one for the second view in the second implementation).
The first implementation can be referred to as the conceptual approach, which is what SAP NetWeaver BW uses. This approach relies on building a conceptual model first, then deriving the structures and views needed for it from there, and stopping when the goal of the model is achieved. Architects sometimes refer to this as the top-down approach to modeling. The second implementation can be called the physical approach. Starting from the physical base tables, objects are built until the necessary result can be achieved. This is sometimes also called the bottom-up approach to modeling.
Overall, it seems that, on the surface, the second implementation offers a better way to model data in general. Unfortunately, this isn’t a general rule for all imple-mentations. How exactly you architect your views deserves serious consideration before you begin an implementation of SAP HANA, and you need to consider a number of other factors as well.
For instance, if you want to standardize reporting to a larger extent, you may choose to create the customer attribute views of both the conceptual and physical approaches just described. The all-in-one customer view can be used throughout the sales module reporting, offering an easy one-stop view for all reports that need all three master data tables anyway. The other views are better suited to use outside logistics than, for example, in the finance area. This way you can achieve great
Personal Copy for RGA Rik Vriens, user id c3b3ffa0-d601-c76a-06ae-b5f2c05f5c4a

212
Data Modeling with SAP HANA Studio8
reusability, good performance and a high degree of standardization at the same time. In this approach, your system will contain many different attribute views.
If on the contrary your reporting is less standardized (e.g., your company has many divisions that operate in a fundamentally different way), the physical modeling approach may be more suited to your case. You’ll have comparatively more attribute views in the system than in the conceptual approach, which gravitates toward a relatively larger amount of analytic views instead.
An additional important point is to make use of the flexibility that SAP HANA offers. Remember that analytic views can combine tables and/or views; in other words, an analytic view can also consist only of tables and not use any attribute views in its definition at all! Applying this to the second implementation example, the “receivables” analytic view could be built with the tables only, forgoing the need to create attribute views on the customer tables entirely. This would reduce the number of attribute views you need but, on the other hand, lead to less standard-ization in reporting in the finance area as a whole. The set of customer master data fields reported in the finance area may be different in the different analytic views in this area—all fields from the base tables would automatically be available in each analytic view in finance, and a different subset may be used in each analytic view by the developer. If this is too much modeling flexibility for you, attribute views can be used to present a predefined set of fields, hiding others from view, so to speak.
Before you begin setting standards for creating views, therefore, consider both your reporting requirements and reporting strategy carefully. Take into account the hardware you have available as well—a more powerful system (i.e., more CPU power) can handle the larger number of joins in the conceptual approach better than a more modest hardware configuration. As always, architect your solution before you begin, and in the case of SAP HANA, don’t fall into the trap of automatically porting your design philosophy from the SAP NetWeaver BW concept into your SAP HANA implementation.
8.2 Getting Started with SAP HANA Information Modeler
Now let’s log on to an SAP HANA system and build a data model. The initial screen after logging on will look something like Figure 8.3.
© 2013 by Galileo Press Inc., Boston (MA)

213
Getting Started with SAP HANA Information Modeler 8.2
Figure 8.3 SAP HANA Studio Screen upon First Logon
On the left is the Navigator pane. The content of this pane changes in each of the perspectives, but, in general, this is where you’ll find the overview of all the objects at your disposal for achieving certain tasks, and from here you can choose to view their definition and their data. You find objects in this pane largely like you find files on your computer. When you select and double-click on an object in the navigation pane, it opens in the central pane. Because you haven’t started performing any tasks yet, this pane is blank initially.
At the bottom is the Properties pane. For any object selected in the central pane, its specific properties will be displayed here and can be edited if needed. On the right is a general pane that gives access to cheat sheets, system help documenta-tion and the like.
Personal Copy for RGA Rik Vriens, user id c3b3ffa0-d601-c76a-06ae-b5f2c05f5c4a

214
Data Modeling with SAP HANA Studio8
In the Administration Console perspective, the navigation pane contains the SAP HANA systems that are connected to your Studio client as top-level nodes. Remember that Studio is a client tool that is installed on your PC and that allows you to perform tasks in the SAP HANA database, which sits elsewhere, probably in your company’s data center. Your company may have several SAP HANA systems, in which case you can work in all of them using your single Studio client. The first task after starting Studio for the very first time, therefore, is to set up the relevant SAP HANA systems in Studio. After this one time setup, Studio will remember which systems it’s connected to.
In this section, we discuss some of the basic functionalities of Studio and explain how to perform them. We then conclude with a description of the example scenario that we’ll use to demonstrate the concepts in this chapter.
8.2.1 Adding a System
To add a system to your local Studio client, simply right-click anywhere in the blank space of the navigation pane, and choose Add System (Figure 8.4).
Figure 8.4 Adding a System
A popup window will appear asking you which system you want to connect to (Figure 8.5).
© 2013 by Galileo Press Inc., Boston (MA)

215
Getting Started with SAP HANA Information Modeler 8.2
Figure 8.5 Specifying the System
After you’ve specified the system, click Next, fill in your credentials, and then click Finish (Figure 8.6).
Figure 8.6 Adding Your Credentials
The system you’ve added should now appear as a top-level node in the navigation pane (Figure 8.7).
Personal Copy for RGA Rik Vriens, user id c3b3ffa0-d601-c76a-06ae-b5f2c05f5c4a

216
Data Modeling with SAP HANA Studio8
Figure 8.7 System Added to Studio
In the Administration perspective, the catalog objects are the only ones displayed for each system. The catalog contains the list of the available database schemas in the system and their objects, as well as a folder to view and edit authorizations (provided you have security access to do this, of course) and a folder for Public Synonyms (Figure 8.8).
A schema is a group of physical tables on the database. Schemas are listed under the Catalog node in the Navigator pane of the screen in Studio.
Figure 8.8 System Catalog Objects
© 2013 by Galileo Press Inc., Boston (MA)

217
Getting Started with SAP HANA Information Modeler 8.2
Note that you can’t see any information views in this perspective, such as attribute views, and so on. To see and edit those objects, you have to switch to the Modeler perspective. As the name implies, the Modeler perspective is used for creating and maintaining data models, which we’ll focus on in this chapter.
8.2.2 Opening Perspectives
To open a different perspective, in our case, the Modeler, go through the menu option Window • Open Perspective • Other, and choose the Modeler option in the popup window. Alternatively, the Open Perspective button near the top-right corner of the screen provides a slightly quicker way to access the same popup window (Figure 8.9).
Open Perspective
Figure 8.9 Opening the Modeler Perspective
After the Modeler perspective opens, you can see a second node just below the system in the navigation pane with the modeling content of this system. The Con-tent node contains all modeled objects, such as the different types of information views, analytic privileges, and a few others (Figure 8.10).
Apart from the navigator, properties, and help panes, there is by default also a Where Used pane and a Jobs pane. As always, you can minimize, maximize, or close panes to your liking to organize your screen.
In the central pane, you’ll now see Quick Launch.
Personal Copy for RGA Rik Vriens, user id c3b3ffa0-d601-c76a-06ae-b5f2c05f5c4a

218
Data Modeling with SAP HANA Studio8
Figure 8.10 Making the Content Visible
8.2.3 Using Quick Launch
Quick Launch provides easy access to many common tasks in an SAP HANA system. This includes creating attribute or other views and also the setup and administra-tion of the data provisioning for the system, immediate access to the SQL editor, and various other tasks (Figure 8.11).
Figure 8.11 Quick Launch
© 2013 by Galileo Press Inc., Boston (MA)

219
Getting Started with SAP HANA Information Modeler 8.2
Quick Launch can always be started easily from the menu option Help • Quick Launch.
8.2.4 Creating a Package
The different types of information views are organized in SAP HANA inside packages, which are groupings of information objects. This is a logical grouping of related objects and is different from a schema, which is a group of physical database tables. There are two kinds of packages: non-structural and structural. A non-structural package can contain information objects such as views (attribute, analytic, calcula-tion), procedures, and so on. A structural package can only contain other packages and is used only to organize all packages in the system into a logical tree.
All information objects in Studio are grouped into packages. Packages are logical groupings intended to help you organize your objects. They don’t limit your ability to use and reuse objects throughout the system, so provided you have the neces-sary privileges, you can use objects from multiple packages in information objects to create new attribute views and so on.
To create a package, follow these steps:
1. Ensure you’re in the Modeler perspective.
2. Either from the Quick Launch page or by right-clicking on the Content node inside the Navigator pane, access the option Create Package. A dialog box appears.
3. Fill in the technical name of the package, its description, and the person respon-sible. The field Delivery Unit is related to the way objects in SAP HANA are promoted to other systems. This can be specified later as and when objects are planned to move, so leave it blank for now.
4. Click OK (Figure 8.12).
Each package will be empty upon creation. As you create objects in your package, the system will automatically group them in several subfolders for the different types of information objects.
Personal Copy for RGA Rik Vriens, user id c3b3ffa0-d601-c76a-06ae-b5f2c05f5c4a

220
Data Modeling with SAP HANA Studio8
Figure 8.12 Creating a New Package
8.2.5 Example Scenario
Before starting with implementation in the system using Information Composer, you should identify the data you’ll need, learn where and how it’s stored in SAP HANA, and determine how the data and tables relate to each other. This will enable you to create a data model.
Our sample requirement is as follows (Figure 8.13): “Provide a set of reports in SAP Business Objects that can be used throughout the company and that contains sales order quantities and amounts. It must be possible to analyze data by orga-nizational entities (sales area, plant, sales office, etc.), customer (sold-to, ship-to, etc., and the customer’s country), material (including material type and MRP type), and by order date.”
You begin by identifying the tables you need as sources and placing them into a model. The way the model is laid out in Figure 8.13 isn’t necessarily the way you’ll build it in SAP HANA, but it provides you with an overview of which tables are needed and where the joins are to be made. You’ll make the model more specific to SAP HANA as you go.
As you can see, there aren’t many fields included from the sales tables, and there’s no plan to provide the descriptions for all of the fields that are included. The list of tables needed for even a fairly simple requirement grows quickly, so beware the scope of your analytic views. Note that the model doesn’t contain a table for time
© 2013 by Galileo Press Inc., Boston (MA)

221
Building Attribute Views 8.3
rollups (date to month, to year, etc.); this is only represented by a box called Time. The way to incorporate the time rollup information will be explained separately.
Data Foundation
VBRP + VBRK+ VBPA: Sales
Invoice Item andHeader, Sales
Document Partner
TVKOT: SalesOrganization Texts
TSPAT: DivisionTexts
T001W:Plants/Branches
DD07T: DomainFixed Values
TIME
Sold-To
T438T: MRPType Texts
MARA: GeneralMaterial Data
T005T: CountryTexts
MARC:PlantMaterial Data
MAKT: MaterialTexts
T134T: MaterialType Texts
KNA1: General Datain Customer Master
Figure 8.13 The Sample Data Model
The tables already exist in the SAP HANA database and have data. Using different types of information views, you’ll build this data model in SAP HANA using the standard interface and tools.
8.3 Building Attribute Views
In this section, you’ll create the first view in SAP HANA. As we go through this process, we’ll introduce a number of definitions and concepts, explain join types, and get you familiar with the basic mechanics of working with views in Studio.
8.3.1 Creating an Attribute View
In the example model, you need information on materials, customers, and a few organizational entities. The organizational entities are specific to sales; for example, Sales Organization. The customer and material data, however, are used very widely throughout different applications and reporting subject areas. For this reason, you’ll create reusable attribute views for these two entities (Figure 8.14). Start with the material attribute view.
Personal Copy for RGA Rik Vriens, user id c3b3ffa0-d601-c76a-06ae-b5f2c05f5c4a

222
Data Modeling with SAP HANA Studio8
ATTRIBUTE VIEWATV_CUSTOMER
Data Foundation
VBRP + VBRK+ VBPA: Sales
Invoice Item andHeader, Sales
Document Partner
TVKOT: SalesOrganization Texts
TSPAT: DivisionTexts
T001W:Plants/Branches
DD07T: DomainFixed Values
TIME
ATTRIBUTE VIEWATV_MATERIAL
Sold-To
T438T: MRPType Texts
MARA: GeneralMaterial Data
T005T: CountryTexts
MARC:PlantMaterial Data
MAKT: MaterialTexts
T134T: MaterialType Texts
KNA1: General Datain Customer Master
Figure 8.14 Identifying Good Candidates for New Attribute Views
To create a new attribute view, right-click on a package, choose New and then Attribute View. Alternatively, from Quick Launch, choose Attribute View, and click the Create button. A popup will appear asking you for a technical name and description. If you called up the View Creation dialog using Quick Launch, be sure to choose the correct package from the dropdown; if you’ve used the right-click option in the Navigator pane, it’s defaulted for you (Figure 8.15).
Figure 8.15 Creating New Objects Inside a Package
© 2013 by Galileo Press Inc., Boston (MA)

223
Building Attribute Views 8.3
In the following dialog box, choose the type of attribute view you want to create:
EE Standard will give you a blank canvas from which to start.
EE Copy from will make a new copy of an existing attribute view from which to work. The newly created view and the one you copied from are not linked; it’s simply a quicker way to get started if you know of an existing view that has many of the elements you need already.
EE Time will create both a view and data for you regarding time attributes (date, month, year, etc.).
EE Derived will create a new attribute view, to which you can give a different name from the original, but the same definition. The views will be linked, and you can’t change the definition of the derived view.
The option Time is covered in Section 8.3.5, and the option Derived will be covered in Chapter 9, Section 9.1.
In this example, you’ll create the standard attribute view “ATV_MATERIAL” as a standard view to contain all of the material master data that you want in your data model (Figure 8.16). This means it will have material data both at the general level and at the plant level, as well as the necessary descriptions for the entities you want to report on.
Figure 8.16 Creating a New Attribute View
Personal Copy for RGA Rik Vriens, user id c3b3ffa0-d601-c76a-06ae-b5f2c05f5c4a

224
Data Modeling with SAP HANA Studio8
Clicking the Next button takes you to a selection of tables. Notice that you can pick any tables in the system, from any number of schemas. It’s important here to have the data model made beforehand and to know which schema(s) contain the necessary tables.
Five tables are required for this attribute view. Select them from the schema by placing the cursor on the table and clicking the Add button to bring them over into your definition (Figure 8.17).
Figure 8.17 Select Tables for the Attribute View
Clicking Finish takes you back to the regular Studio screen. In the central pane, there is a new tab where the tables will now display, and you can start the task of defining the attribute view. Two major activities are needed now:
EE Define the table joins Table joins tie the data in the tables together in a particular way. The end result of this step is that there is one view that combines all data from all tables together.
© 2013 by Galileo Press Inc., Boston (MA)

225
Building Attribute Views 8.3
EE Define the output of the attribute view Not all fields of the resulting view need to be exposed to the rest of the system. Only those output fields that you specify explicitly will be visible to other views.
For ease of use, you can close the Navigator and Help panes that you don’t need.
In Figure 8.18, the tables are arranged like they were in the data model design graph.
Figure 8.18 Initial Screen When Creating a New Attribute View
8.3.2 Defining Table Joins
You need two different types of joins in this view.
EE The join between the tables with attributes (MARA and MARC) is a standard join.
EE The joins with the text tables are of a special type: text joins.
You create a join simply by clicking a field in one table, holding down the mouse button, and dragging the pointer onto a field in another table. The appropriate Properties pane automatically displays the properties of any selected object in the design pane. You can always display the properties of a join by clicking on the join link in the graphical view (Figure 8.19).
Personal Copy for RGA Rik Vriens, user id c3b3ffa0-d601-c76a-06ae-b5f2c05f5c4a

226
Data Modeling with SAP HANA Studio8
Figure 8.19 Creating a Join between Tables in the Graphical Interface
The properties for the join are set by SAP HANA as shown in Figure 8.20.
Figure 8.20 Overview of All Join Properties with SAP Defaults
In this case the system defaults are the correct values for the join. In general, pay close attention to the following join properties:
© 2013 by Galileo Press Inc., Boston (MA)

227
Building Attribute Views 8.3
EE Join Type
EE Cardinality
Apart from the general inner, left outer, and right outer join types, other options exist called referential join and text join. Table 8.1 summarizes the different types of joins in SAP HANA.
Join Type Result Use Comments
Inner Rows where there is at least one match in both tables—if left unspecified, a join is executed as an inner join.
Attribute views and analytic views.
In the specific case where there is a filter on a field in the right table, but no field from the right table is requested, the filter isn’t taken into account. The reason is that if no field of the right table is requested, the join engine skips this table for performance reasons.
Referential
(default join type in the graphical interface for view definitions)
An inner join where referential integrity is assumed (see the Comments column).
Same as for inner join. For example, for joins between item and header data for documents (header record always exists for any item record), or for joins between different levels of the same master data, such as plant/material and material general data.
Can be faster than an inner join because the right table isn’t checked when no field from the right table is requested. In that specific case, note that the join engine doesn’t check the right table, and even if an entry in the right table is missing, the row from the left table is still returned. In this case, it behaves more like a left outer join. If the join must always be executed as inner, use the type Inner Join instead. (See the “Referential Join Types” box following this table.)
Table 8.1 Join Types
Personal Copy for RGA Rik Vriens, user id c3b3ffa0-d601-c76a-06ae-b5f2c05f5c4a

228
Data Modeling with SAP HANA Studio8
Join Type Result Use Comments
Left outer All rows from the left table, even if there is no match in the right table.
Analytic views, to join fact table as left table to attribute views as right table. Cardinality in that case should be set to N:1.
This is the join type used between the fact table and dimensions in a basic star schema (e.g., “even if no entry exists for product x in the product dimension, show all the facts in the output”).
Right outer All rows from the right table, even if there is no match in the left table.
Rarely used. Potential use is in analytic views to display all master data values even if there are no facts in the fact table for them. Possible to use in attribute views as well.
For example, when joining customer master data (right table) with sales documents (left table), this would display all customers, even the ones who did not buy anything. Typically used in the type of scenario “Give me all customers/products/… with no sales last period,” and so on.
Full All rows from both tables, regardless of whether they match.
Rarely used. Only allowed in attribute views. Potential use is to check master data relationships.
For example, when joining customers with customer account managers, this gives all the customers (even if no account manager is assigned) and all account managers (even if they have no customers assigned). May be useful to verify accuracy of master data relationships.
Text Retrieves descriptions for codes; for example, material descriptions, and so on.
To join text tables, especially if they are language dependent. Can retrieve descriptions based on the language the user is logged in with.
Text joins can only be used in attribute views; they are not supported in analytic or calculation views.
Table 8.1 Join Types (Cont.)
© 2013 by Galileo Press Inc., Boston (MA)

229
Building Attribute Views 8.3
Referential Join Types
An exception to this exception is when the referential join is executed outside of an analytic view—in which case the OLAP engine is bypassed, and only the join engine is used. It will always execute as an inner join in this case.
As a general rule, developers should be very familiar with the join types and with the few exceptions that exist for specific types in SAP HANA. A lot of detailed information is available both in SAP Help and on the SAP Community Network (SCN) website (http://scn.sap.com/welcome).
The joins for the text tables are created in the same way as any other joins. You do need to go to the properties of each join and change the join type to a Text Join for these.
To modify join type and cardinality, simply click in the Value field for the property, and select another value from the dropdown (Figure 8.21).
Figure 8.21 Cardinality Options
In text joins, you don’t need to set the cardinality because it’s set to 1:1 by the system. This is, strictly speaking, not correct because the text table has multiple rows for each row in the code values table (each value has descriptions in multiple languages). However, by definition of a text join, only one description will be retrieved for each code value, based on the user’s logon language. In effect, then, this becomes a 1:1 relationship.
Specifically for text joins, if the text table is language-dependent, you should always specify the Language column property as well (Figure 8.22). This will allow you later to pass the user’s logon language to the attribute view so that the texts are retrieved from the database for the correct language.
Personal Copy for RGA Rik Vriens, user id c3b3ffa0-d601-c76a-06ae-b5f2c05f5c4a

230
Data Modeling with SAP HANA Studio8
Figure 8.22 Specifying the Language Field in a Text Join
The join type is also set in the same Properties pane, as you can see from Figure 8.23.
Figure 8.23 Join Type Options
The final definition of the table joins should look like Figure 8.24.
Figure 8.24 Table Joins in the Finished Attribute View
© 2013 by Galileo Press Inc., Boston (MA)

231
Building Attribute Views 8.3
There is one referential join between the MARA and MARC tables. This join can be referential because one table contains data at a more granular level than the other, but it’s impossible in SAP ERP to make entries in table MARC without first defining the material generally in table MARA. The other three joins are text joins.
8.3.3 Defining Output
With the table joins in place, you can now define the output of the attribute view by dragging fields from the tables into the Output section to the right of the design pane (Figure 8.25).
Output Pane
Figure 8.25 Moving Fields from Tables into View Output
The output of the view is based on the joined tables, and there is no way for the system to know what the proper keys should be, or what you want them to be. But to reuse this attribute view later and join it with other views, there must be a key to the end result. Therefore, in the output, you must specify visible key attributes. These will be used as the definition of a primary key for the attribute view and thus for model validity checks in further views that contain this attribute view.
Set the visible key attributes as follows:
1. Right-click the field in the Output section.
2. Choose the option Convert to Key Attribute (Figure 8.26).
Personal Copy for RGA Rik Vriens, user id c3b3ffa0-d601-c76a-06ae-b5f2c05f5c4a

232
Data Modeling with SAP HANA Studio8
Figure 8.26 Defining Key Attributes for a View
In this case, table MARC determines the granularity of the view, so you must con-vert the fields Material and Plant to key attributes. You can always see quickly which attributes are keys by the icon next to the fields.
There are now two ways to get the description of a field into the attribute view:
1. Drag the text field into the Output from the design pane. The text field will appear as any other attribute in the list.
2. Specify the Description Mapping property in the Output field of the view. The text field will appear in the output as <field name of the code field>.description; for example, LAND1.DESC (Figure 8.27).
Figure 8.27 Using the Description Mapping Property in the Customer Attribute View
© 2013 by Galileo Press Inc., Boston (MA)

233
Building Attribute Views 8.3
The end result of both is that the desired description field is in the output. Note that in the Output section, you can change the order of the fields either by dragging them up or down, or by using the icon buttons provided at the top of the section. For views with a very large number of fields, there is even a search function.
8.3.4 Checking, Saving, and Activating Views
The view is now fully defined. Check that everything is ready with the Validate button (Figure 8.28).
Validate
Figure 8.28 Validate a View to Check for Warnings and Errors
The bottom-right pane automatically switches to the Job Log tab where you can see the result of the validation check (Figure 8.29).
Figure 8.29 Checking Results of Model Validation
Checking Errors during Model Validation or Activation
The job log also produces an error log in case the validation fails. This error log contains an extensive list of checks and tells you what exactly has failed during validation. For example, if you forget to specify key attributes, the job log returns an error message. If that happens, you can right-click on the job log entry and choose Open Job Details to see the exact error message (Figure 8.30).
Personal Copy for RGA Rik Vriens, user id c3b3ffa0-d601-c76a-06ae-b5f2c05f5c4a

234
Data Modeling with SAP HANA Studio8
Figure 8.30 Model Validation: Checking the Job Details
In this case, the validation check was successful, and you can now activate the view. Activation creates the view in SAP HANA, meaning the view definition becomes available in the system for further use. Specifically, it will be available in a folder called Attribute Views in your selected package in the Modeler perspective. To activate a view, use the Save and activate icon (Figure 8.31).
Figure 8.31 Saving and Activating a View
© 2013 by Galileo Press Inc., Boston (MA)

235
Building Attribute Views 8.3
Similarly, you create the attribute view ATV_CUSTOMER with the description “Customer Attribute View” as shown in Figure 8.32.
Figure 8.32 The Customer Attribute View
8.3.5 Creating the Time Attribute View
The need to report by date is universal, as is the need for the dates to be available in a number of formats, such as month, year, and so on. SAP HANA offers an easy way to make this possible for all your data models using a special type of attribute view called the time attribute view. SAP HANA can generate the values for all of the fields automatically, if you want, and this need only be done once. Once created, this can be reused throughout the system.
To create this view, start by creating a new attribute view, but this time, choose the view type Time in the first popup window. You can choose the granularity of the view and whether it’s a regular calendar or a fiscal one. In Figure 8.33, a Gregorian calendar view is selected, with date as the lowest level. SAP HANA will generate the table contents automatically.
Personal Copy for RGA Rik Vriens, user id c3b3ffa0-d601-c76a-06ae-b5f2c05f5c4a

236
Data Modeling with SAP HANA Studio8
Figure 8.33 Creating the Attribute View for Time Attributes
The system now presents a ready-made attribute view design, so all you need to do is to Save and Activate it. You can check the data that this view contains in the same way as for any other view or table. Right-click on the view in the Navigator pane, and choose Data Preview. Figure 8.34 shows the results.
Figure 8.34 The Time Attribute View Data
© 2013 by Galileo Press Inc., Boston (MA)

237
Building Analytic Views 8.4
Note that this table isn’t one that was defined in our schema. The time table resides in the SAP HANA System Schema _SYS_BI and is called M_TIME_DIMENSION. By default, it contains all dates for the years 1990 to 2020.
8.4 Building Analytic Views
Analytic views are the most common views for reporting purposes. This is the basic view type that is used as a source of data in the SAP Business Objects Business Intel-ligence (BI) tools (or other frontend tools). This view type can contain the following:
EE One fact table with measures
EE Any number of attribute views
EE Any number of other tables
The definition of the view can be as simple or as complex as you like. In fact, an analytic view doesn’t even have to make use of attribute views; for example, it can simply join a fact table with master data tables directly. The attribute views for Customer and Material that we created in the previous section serve the purpose of making the modeling in analytic and calculation views easier, and of course of being reusable across many different analytic views that all need customer and/or material data. For which entities and at which level you want to create attribute views and where you want to do all of the work in analytic views instead is a topic for data architects to discuss before your implementation. This important decision affects both performance and development (and maintenance) effort.
To create an analytic view, follow these steps:
1. Ensure you’re in the Modeler perspective.
2. Find the appropriate package.
3. Right-click on the package, choose New, and then choose Analytic View.
4. Provide a technical name, description, and a default schema.
5. Define the view: design (joins and properties) and output.
6. Validate the view definition.
7. Save and Activate the view.
Personal Copy for RGA Rik Vriens, user id c3b3ffa0-d601-c76a-06ae-b5f2c05f5c4a

238
Data Modeling with SAP HANA Studio8
Alternatively, you can use Quick Launch to bring up the popup window where you start by providing a technical name and description. As always when you go through Quick Launch, don’t forget to specify the correct package; it won’t be defaulted in.
The data model you’re trying to build now looks like Figure 8.35, with the use of attribute views.
Data Foundation
VBRP + VBRK+ VBPA: Sales
Invoice Item andHeader, Sales
Document Partner ATV_CUSTOMER:KNA1: General Data in Customer
Master + T005TCountry Texts
ATV_MATERIAL:MARA: General Material Data +
MARC Plant Material Data +T134T Material Type Texts +
MAKT Material Texts +T438T MRP Type Texts
TVKOT: SalesOrganization Texts
TSPAT: DivisionTexts
T001W:Plants/Branches
TIME
ATV_DOM_VBTYP:DOM_VBTYP Domain VBTYP +DOM_VBTYPT Domain VBTYP
Descriptions
Sold-To
Figure 8.35 The Sample Data Model with Attribute Views
The fact table contains data from invoices in SAP ERP. As such, it will have both the regular invoices and all of the corrections made afterward in the form of invoice cancellations, debit memos, and credit memos. We’ll create two analytic views, one for invoices and one for invoice corrections.
Notice that Table DD07T that was in the original model has also been replaced by an attribute view. The reasons for this, and how to create the attribute view, are explained in Chapter 9.
8.4.1 Creating an Analytic View
Using Quick Launch, choose Analytic View, and click Create. Alternatively, you can right-click in the Navigator pane on the desired package and click New and then Analytic View (Figure 8.36).
© 2013 by Galileo Press Inc., Boston (MA)

239
Building Analytic Views 8.4
Figure 8.36 Using the Navigator Pane to Create an Analytic View
In the dialog box that comes up, fill in the necessary information, giving the view its technical name and description as well as the correct package you want to place it in (Figure 8.37). In the Schema for conversion field, you need to specify the database schema that has the tables necessary for currency conversion, should you want to perform any. For now, just choose the schema that contains the tables you want in this view. This can always be changed later in the view properties.
Figure 8.37 Creating a New Analytic View
Personal Copy for RGA Rik Vriens, user id c3b3ffa0-d601-c76a-06ae-b5f2c05f5c4a

240
Data Modeling with SAP HANA Studio8
Click Next to tell the system which tables you want in the view (Figure 8.38). Remember to only pick the tables you want to use directly in the view. It isn’t nec-essary to select the tables for materials or customers. For that, you’ll use attribute views instead of tables.
Figure 8.38 Choosing Tables to Add to the Analytic View
Until this point, the screens have been the same as for creating a new attribute view. Now, however, when you click Next again, an additional screen appears where you can specify which attribute views you want to include in the analytic view (Figure 8.39).
Finally, click Finish to go back to the Modeler perspective (Figure 8.40).
© 2013 by Galileo Press Inc., Boston (MA)

241
Building Analytic Views 8.4
Figure 8.39 Choosing Attribute Views to Add to the Analytic View
Figure 8.40 Initial Screen during Creation of an Analytic View
Personal Copy for RGA Rik Vriens, user id c3b3ffa0-d601-c76a-06ae-b5f2c05f5c4a

242
Data Modeling with SAP HANA Studio8
The next task is to define the relationships between the information objects that make up the analytic view. You need to accomplish the following:
EE Have sales amounts and quantities from the sales items available for reporting later.
EE Have descriptions for Sales Organization, Division, Plant, and Document Category.
EE Have most or all of the attributes of material and customer, as defined in their respective attribute views, available in the analytic view.
Follow these steps:
1. Define the joins in the data foundation.
2. Define the output of the data foundation using measures from the fact table and attributes from the different tables in the data foundation.
3. Add attribute views to the data foundation using joins.
Working with the Fact Table as a Data Foundation
On the screen of the analytic view so far, the attribute views haven’t shown up. You only see the tables that you’ve selected explicitly because the attribute views aren’t physical objects. Notice that there are actually two tabs at the bottom of the design pane that, combined, display the entire view definition (Figure 8.41):
EE Data Foundation
EE Logical View
In the Data Foundation tab, only the physical objects that are part of the view are presented. The Logical View tab presents the data foundation as a single logical object along with all of the attribute views that you initially selected during creation. Essentially, only the logical objects that are part of the view are represented here.
At this point, you can’t yet work in the logical view. There are, as yet, no fields avail-able in the data foundation with which to join the attribute views. This is because so far your definition of the data foundation doesn’t have any fields defined as output.
The first task is now to build a data foundation. Locate the table you want to use as the fact table. There can be only one fact table in an analytic view; that is, one table from which you’ll get the measures for the output.
© 2013 by Galileo Press Inc., Boston (MA)

243
Building Analytic Views 8.4
Figure 8.41 The Initial Screen of the Analytic View Definition, Showing the Data Foundation Objects
Adding Descriptions for Fields in the Fact Table
Text joins aren’t supported in the analytic view. To add text tables in an analytic view, regular joins must be used. A few are simple joins, such as the tables TVKOT and TSPAT, which are only there to provide descriptions for Sales Organization and Division. Join these tables to the fact table as inner joins, and add a constraint filter (also called a design-time filter) for the language, setting it to “E” for English. Constraint filters are explained in detail in Chapter 9, Section 9.4. They impose a strict value filter on the view that can’t be changed at runtime; it’s part of the view definition itself.
Adding Tables with Attributes
Table T001W is a table from SAP ERP that contains at the same time the description of the plants and a number of assignments and configuration settings. It’s joined to the fact table as an inner join with cardinality (fact table) N:1 (attribute table).
Personal Copy for RGA Rik Vriens, user id c3b3ffa0-d601-c76a-06ae-b5f2c05f5c4a

244
Data Modeling with SAP HANA Studio8
Adding a Filter to the View
Finally, add a constraint filter on the field VBTYP (Document Category) in the fact table directly. The first analytic view you create will be for invoices only, and you can set the filter accordingly using this field.
To apply a constraint filter in a view, right-click the field in the design pane of the view, and choose the option Apply Filter (Figure 8.42).
Figure 8.42 Applying a Constraint Filter Inside a View
A small window will pop up where you can choose an operator and the neces-sary value(s). In this case, there is only one value to filter on, so choose the Equal operand (Figure 8.43).
Figure 8.43 Specify the Operand for the Constraint Filter
© 2013 by Galileo Press Inc., Boston (MA)

245
Building Analytic Views 8.4
To look for values to filter on, provide any criterion in the top input field and click Find. To display a list of all possible values in the Value Help Dialog, leave the top input field blank, and then click the Find button (Figure 8.44).
Figure 8.44 Selecting Values for the Constraint Filter
Click the OK button to come back to the design pane, where there is now a small funnel icon next to the field in the table, indicating there is a filter on it. The filter value is also reflected in the attribute properties (Figure 8.45).
Figure 8.45 Checking the Constraint Filter in the Attribute Properties
In general, don’t forget to add constraint filters for any field that is a true constant in the reporting requirements for which the view is being built.
The join definitions are now in place for the data foundation. The next step is to define output fields.
Defining the Output of the Data Foundation
Using measures from the fact table and attributes from the different tables in the data foundation, you specify which fields will be retrieved from the database and
Personal Copy for RGA Rik Vriens, user id c3b3ffa0-d601-c76a-06ae-b5f2c05f5c4a

246
Data Modeling with SAP HANA Studio8
provided as view fields wherever the view is later used. In the data foundation view, you define the output by dragging the desired fields into the Output section of the screen. The attributes go under the folder Private Attributes, and the basic measures go under the folder Measures (Figure 8.46).
Figure 8.46 The Fully Defined Data Foundation: Joins, Filters, and Output
At this point, the data foundation is fully defined.
Adding Attribute Views to the Data Foundation Using Joins
Switch to the Logical View tab of the definition. In here, the data foundation will appear as a list of the fields selected as output in the Data Foundation tab. Using these fields, you can join the data foundation with the attribute views.
It’s important to know the definition of the attribute views in this activity. For example, the Material attribute view is, in our example, at the plant/material level. Knowing this, you can make the correct join with the data foundation using both the Plant and Material fields. The joins with the attribute views for Customer and Time are accomplished with one field for each view only.
© 2013 by Galileo Press Inc., Boston (MA)

247
Building Analytic Views 8.4
Note the following on the screen in Figure 8.47:
EE All of the fields from the attribute views are by default selected in the Output section of the analytic view. Notice that at the level of the analytic view, all fields from the attribute views are part of the output, and they can’t be removed. You’ll see in Chapter 9 how to remedy this in case you don’t want all fields from, say, the Time attribute view in your analytic view.
EE In the Data Foundation list of fields in the logical view, all attributes are marked as key attributes. The icon next to each field will have a small green asterisk to indicate this.
EE All joins to attribute views are proposed by the system as (attribute view) 1:N (data foundation), which is almost always correct.
In fact, to developers familiar with SAP NetWeaver BW, the logical view will cer-tainly resemble the definition of an InfoCube.
Figure 8.47 Attribute Views Joined to the Data Foundation
To finish up with the attribute view, validate the definition. Upon receiving a mes-sage that the validation is successful, you can Save and Activate the analytic view.
Previewing the Data in the Analytic View
After activating the analytic view, you can immediately preview the output data by going to the view in the Navigator pane. Right-click on the view, and choose
Personal Copy for RGA Rik Vriens, user id c3b3ffa0-d601-c76a-06ae-b5f2c05f5c4a

248
Data Modeling with SAP HANA Studio8
Data Preview. Alternatively, if the view definition is open in the central pane, click the Data Preview icon near the top-right corner of the central pane (Figure 8.48).
Figure 8.48 Getting the Data Preview of the Activated View
The output looks like Figure 8.49.
Figure 8.49 Data Preview: The First Few Thousand Records of the View
8.4.2 Copying an Analytic View
The view you just created is for invoice data only. Its overall definition is generally usable, however, and can easily be reused as a basis for the second view on invoice corrections. In fact, the constraint filter on the document category (field VBTYP) is the only thing that needs to be changed. To create an analytic view when you know one already exists one that is fairly close to what you want, you can make use of the copy functionality in Studio.
Create the analytic view for invoice corrections as follows:
1. From the Navigator pane or from Quick Launch, choose to create a new ana-lytic view. The popup New Analytic View appears.
© 2013 by Galileo Press Inc., Boston (MA)

249
Building Calculation Views Using the Graphical Method 8.5
2. In the popup, choose the option Copy from, and click Browse.
3. A selection popup will appear. Navigate to the correct package, and choose the analytic view you want to copy from. In our case, this is ANV_SALESITEM. Click OK.
4. Your choice is now reflected in the New Analytic View popup. Click Finish.
You now have a new view that is independent from the original object you copied from. The copy process provides a quick way of starting new views, but it doesn’t link any views together. From now on, changes made to either view are entirely independent from each other. Proceed as with any other analytic view by chang-ing filters, mappings, adding or removing tables and attribute views as needed.
For the example, you can change the constraint filter on the field VBTYP to different values to capture the invoice corrections and leave the rest of the view definition as it was copied over.
8.5 Building Calculation Views Using the Graphical Method
In general, calculation views are intended for complex business requirements. They serve two main purposes:
EE Combine two or more analytic views into one; for example, plan and actual data.
EE Allow for complex transformations, whether one or two analytic views are used.
Calculation views can correspondingly be created using two separate methods:
EE Graphical method This allows you to define operations and mappings in a graphical interface.
EE SQL method This allows (and, in fact, requires) you to use SQL statements or SQLScript to retrieve and manipulate the data in the view.
We’ll illustrate the graphical method in some detail in this chapter. The full use of SQL and especially SQLScript doesn’t fit within these pages, unfortunately, but a brief introduction is given later in this chapter in Section 8.6.
Be careful when creating calculation views because they are always processed through the calculation engine of the system, making them potentially significantly
Personal Copy for RGA Rik Vriens, user id c3b3ffa0-d601-c76a-06ae-b5f2c05f5c4a

250
Data Modeling with SAP HANA Studio8
slower than analytic views. The basic rule of thumb is don’t use a calculation view when an analytic view can suffice.
Following are general guidelines for deciding whether to use calculation views or analytic views:
EE Use analytic views where mostly aggregation of data is required. These views perform very well on database selection of data, but the opportunities for trans-formations are limited.
EE Use calculation views where more than one fact table needs to be combined and where complex calculations or other transformations are needed.
EE For a simple union of analytic views, the graphical method is good.
EE For complicated transformations, use the SQL method. Where possible, use the proprietary variant of the language called for, which, in this case, is SQLScript.
In this section, we’ll cover the graphical method of creating calculation views. We’ll introduce SQL and SQLScript in Section 8.6.
From the package in the Navigator, right-click and choose New • Calculation View, or from Quick Launch, click on Calculation View, and click the Create button.
In the following popup, specify the technical name and description for the view. Choose the graphical method for creation, and don’t forget to specify the correct package. Click Next (Figure 8.50).
In the subsequent popups, you can choose tables, analytic views, and attribute views to use in the new calculation view. When done, click Finish to go to the main screen.
In this example scenario, there are two analytic views that, for a reporting require-ment that needs corrected invoice amounts, need to be combined in the calcula-tion view. You don’t need any extra tables, so you don’t select any tables on the first dialog box screen. Click next. The screen shown in Figure 8.51 allows you to choose which views should be part of the calculation view.
© 2013 by Galileo Press Inc., Boston (MA)

251
Building Calculation Views Using the Graphical Method 8.5
Figure 8.50 Creating a New Calculation View
Figure 8.51 Choosing the Views to Include in the Calculation View
Personal Copy for RGA Rik Vriens, user id c3b3ffa0-d601-c76a-06ae-b5f2c05f5c4a

252
Data Modeling with SAP HANA Studio8
Click Finish to go to the main screen and start designing the calculation view. This screen looks a little different from the one for attribute views and analytic views (Figure 8.52).
Figure 8.52 Initial Screen during Creation of a Calculation View
The left portion of the design pane is now a graphical presentation of the view. It contains the objects you’ve selected during the initial creation of the view: two analytic views and an additional object called Output. The definition of any object in the graphical grid is displayed in the middle portion of the design pane simply by clicking on the object (Figure 8.53).
On the grid, the two analytic views have two small circles at the bottom and top of their rectangle, indicating that they can both receive input and produce output. The Output object has only one such connection node because it’s the final output of the calculation view and can’t be used to link further to other information objects. By hovering the mouse pointer over any object, you’ll also see a small arrow appear with the text Create connection (Figure 8.54).
© 2013 by Galileo Press Inc., Boston (MA)

253
Building Calculation Views Using the Graphical Method 8.5
Figure 8.53 Click an Object on the Grid to See Its Definition
Figure 8.54 Creating Connections between the Objects in the Grid
Lastly, the Tools Palette is an important part of the graphical layout. You can use the Tools Palette to introduce the following additional elements into the grid (Figure 8.55):
Personal Copy for RGA Rik Vriens, user id c3b3ffa0-d601-c76a-06ae-b5f2c05f5c4a

254
Data Modeling with SAP HANA Studio8
EE Union
EE Join
EE Projection
EE Aggregation
Figure 8.55 Using the Tools Palette to Insert Specific Operations in the View
Note
The common case for calculation views is to use the Union tool. Be careful with the Join tool in calculated views. A join between two large result sets can be very expensive to execute. When combining data from two analytic views, a union is almost always required. In this respect, the calculation view somewhat conceptually resembles a MultiProvider in SAP NetWeaver BW.
Click the dropdown box Tools Palette, and click Union to start linking the two analytic views together. This places an object called Union_1 on the grid. You can rename this if you want by clicking inside the object. For this example, however, leave it as it is because you have only one union to perform.
Connect the top connection node of the first analytic view with the bottom con-nection node of the union operation by dragging the mouse pointer between the shapes (Figure 8.56). Do the same for the second analytic view.
Remember that the analytic views contain not only the fields from the fact table and the attribute views for customer and material but also all of the time attributes,
© 2013 by Galileo Press Inc., Boston (MA)

255
Building Calculation Views Using the Graphical Method 8.5
including fields such as Hour, Second, and so on, which you don’t need for report-ing. You can suppress those fields now by using a projection.
Figure 8.56 Connecting the Views and Operations in the Calculation View
Click the dropdown box Tools Palette, and click on Projection to place an object called Projection_1 on the grid (Figure 8.57). Notice that the system automatically aligns the shapes using drawing guides as you move the shapes around.
Figure 8.57 Aligning Objects on the Grid
Personal Copy for RGA Rik Vriens, user id c3b3ffa0-d601-c76a-06ae-b5f2c05f5c4a

256
Data Modeling with SAP HANA Studio8
Link the outgoing (top) connection node of the Union object to the ingoing (bot-tom) node of the Projection object. Then link the top node of the Projection shape with the Output shape. Your objects are now all placed, and the sequence of operations in the view is defined.
The next step is to define the connections in more detail for each individual step in the graphical flow. Start with the union operation. Click on it to see its details in the central portion of the design pane. You’ll see a source and a target on the screen, as yet undefined (Figure 8.58).
Figure 8.58 Detail View of the Union Operation
By using the Map by Field Name button in the Source portion of this screen, you can establish a mapping between the source (the analytic views) and the target (the output of the union operation) (Figure 8.59).
Figure 8.59 Generating a System Proposal for the Union Operation
© 2013 by Galileo Press Inc., Boston (MA)

257
Building Calculation Views Using the Graphical Method 8.5
Remember that the mapping needs to be there for both analytic views, so that the fields on the union output are sourced from both source analytic views. Scroll through both the Source and Target screen elements to review all of the map-pings (Figure 8.60).
Figure 8.60 Checking and Correcting the Mappings
This mapping is also reflected in the right-hand portion of the design pane, where you can quickly check the mappings attached to each output field (Figure 8.61).
Figure 8.61 Reviewing Field Mappings in the Output Pane
Personal Copy for RGA Rik Vriens, user id c3b3ffa0-d601-c76a-06ae-b5f2c05f5c4a

258
Data Modeling with SAP HANA Studio8
Next, define the next object in the flow, the projection. Click on the Projection shape to see the details of this operation. In the middle portion of the pane, the definition of the union appears, which serves as input for the projection. The right-hand portion contains the output definition of the projection, as yet without fields.
Choose which fields to add to the projection output definition by right-clicking on the field and choosing Add To Output (Figure 8.62).
Figure 8.62 Choosing Fields from Calculation View Operations as Output
At the end of this task, a number of the Time attributes have been left out, but all other fields from the union are part of the projection output (Figure 8.63).
Figure 8.63 Selecting Specific Fields for Output of the Projection
© 2013 by Galileo Press Inc., Boston (MA)

259
Building Calculation Views Using the Graphical Method 8.5
The final step in the design of the view is to define the output of the view itself. Click on the Output shape. The output of the projection now shows up as the source. Simply transfer fields to the final output by right-clicking them and choosing Add as Attribute or Add As Measure as needed (Figure 8.64).
Figure 8.64 Adding Fields to the Final View Output
This task completes the definition of the view. Validate, save, and activate the calculation view. You can preview a sample of the data using the Data Preview function to check the results.
Note
The sequence of operations in the calculation view will differ for different cases. In the preceding scenario, the flow was from the analytic views to a union, then to a projec-tion, and then to the output. This was done because you had two analytic views with the same definition. They were only different in that they had different constraint filters, in other words, two different sets of data but with the same definition.
In other scenarios, one of the analytic views (e.g., for actuals) may contain many more fields than the other (e.g., for planned values). In such a case, you would probably per-form two separate projections first, one for each analytic view, and only then perform the union. In general, go over the basic objects in the view and decide based on the desired output of the calculation view which path you should follow, before you start creating in Studio.
Personal Copy for RGA Rik Vriens, user id c3b3ffa0-d601-c76a-06ae-b5f2c05f5c4a

260
Data Modeling with SAP HANA Studio8
8.6 SQL and SQLScript
To define complex functions and views, you can use either standard SQL (Structured Query Language) or SQLScript, which is a proprietary variant of SQL. Standard SQL conforms to the global SQL standard, and developers with knowledge of SQL will find themselves at home there. There is, however, an advantage to using SQLScript instead: This SAP-proprietary variant has been designed to help push a number of operations down to the database level. Therefore SQLScript is usually recommended over standard SQL wherever possible.
It’s beyond the scope of this book to cover the SQL functionality in detail, but we’ll go through the steps to get started with both SQL and SQLScript in the creation of a calculated view to give you some idea of what both the screens and language elements look like.
8.6.1 Using SQL
SQL can be used in SAP HANA in many different ways. For example, you can use SQL to create tables when no metadata import is possible. You can also use SQL to create calculation views, to manipulate data in SAP HANA, and to manage transactions.
Before we begin with a calculation view, let’s go over a few basics concerning the language elements in SQL. As a standard language, SQL contains the regular classes of language: DDL (Data Definition Language, with statements such as CREATE, ALTER, etc.), DML (Data Manipulation Language, with SELECT, INSERT, etc.), and DCL (Data Control Language, with GRANT, REVOKE, etc.).
In writing and reading the SQL code, be aware of the following:
EE On any line, a double hyphen (--) starts a comment.
EE Block comments are enclosed between /* and */.
EE Single quotes indicate a string literal.
EE Double quotes indicate a delimited identifier, which can be used to specify any identifier regardless of its name (used wherever undelimited identifiers can’t be used because they are restricted to only letters, numbers, and the underscore character, with the name required to begin with a letter).
© 2013 by Galileo Press Inc., Boston (MA)

261
SQL and SQLScript 8.6
EE The percentage sign (%) is a wildcard for any number of characters.
EE The underscore sign (_) is a wildcard for exactly one character.
For example, in Listing 8.1, everything before the word create are comments and not part of executable code. The create statement will create a database table called 001_MyTable with the specified fields. The table name (identifier) is delimited so that you can start it with, say, a source system identifier—or anything else, for that matter. Note that delimited identifiers are taken literally from between the delimiters, so the identifiers “001_MyTable” and “001_MYTABLE” would create two separate tables on the database. The words Material General data at the end of the create statement are also comments and will be ignored by the system when executing the code. The insert statement puts the literal values ‘1’ and so on in the table. Finally, the select statement will retrieve the first row of the table.
/* material master dataCreate the material master data table and put some values in it!*/create column table “MYSCHEMA”.”001_MyTable”(“MATNR” NVARCHAR (18) not null,“SPART” NVARCHAR (2),“MTART” NVARCHAR (4),primary key (“MATNR”)) ; -- Material General datainsert into MYSCHEMA.”001_MyTable” values (‘1’,’AB’,’FERT’);insert into MYSCHEMA.”001_MyTable” values (‘2’,’AB’,’DIEN’);select * from “MYSCHEMA”.”001_MyTable” where “MTART” like ‘F%’;
Listing 8.1 Sample SQL Code
A great degree of flexibility exists in SQL for you to create tables from scratch, based on other tables, and so on. Just remember that for optimized performance during reading of data from the tables for reporting purposes, you’ll want to create tables as column tables wherever you can, as shown here:
create history column table “MYSCHEMA”.”001_MyHIST” as ( select “MATNR” “MTART” from “MYSCHEMA”.”001_MyTable” )with no data primary key (“MATNR”)) ;
Creating a Calculation View Using SQL
Now let’s explore the process of creating a calculation view using standard SQL. Apart from the programming elements, this is the same as when using SQLScript, so the instructions in this section apply to both.
Personal Copy for RGA Rik Vriens, user id c3b3ffa0-d601-c76a-06ae-b5f2c05f5c4a

262
Data Modeling with SAP HANA Studio8
Start by going to the Navigator pane in the Modeler perspective, and then right-click on the desired package to create a new calculation view. On the dialog screen that comes up, provide a technical name and description. For the View Type, choose the option SQL Script. Click Finish (Figure 8.65).
Figure 8.65 Creating a Calculation View Using the SQL Script Method
The initial screen that comes up has three sections. On the left is a graphical representation of the elements that make up the view. In the middle, the object selected in the left section is displayed. On the right, you find the usual output section (Figure 8.66).
© 2013 by Galileo Press Inc., Boston (MA)

263
SQL and SQLScript 8.6
Figure 8.66 The Initial Screen When Creating a Calculation View Using SQL
To select data from the sales document items in the database—rather than type in the beginning statement from scratch—you can take a quicker way by having SAP HANA generate the select statement for you. To do this, go back to the Naviga-tor pane, and find the table in the catalog. Right-click the table name, and select Generate • Select Statement (Figure 8.67).
Figure 8.67 SAP HANA Generates a Select Statement for You
Personal Copy for RGA Rik Vriens, user id c3b3ffa0-d601-c76a-06ae-b5f2c05f5c4a

264
Data Modeling with SAP HANA Studio8
The system displays a select statement for all of the fields of that table but lists them out explicitly (Figure 8.68). You can copy and paste the statement and simply remove any fields from the field list that you don’t want.
Figure 8.68 Select Statement for a Table, Generated by SAP HANA
Keep the select statement on your clipboard and return to the calculation view definition. You can now start defining the view itself.
To begin, click on the Script object in the graphical section of the screen. Specify the output of the view in the output section of the screen. You’ll notice that the output parameter is already named var_out. Edit the parameter by right-clicking it and choosing Edit (Figure 8.69).
Specify field names and their appropriate data types in the dialog screen that comes up (Figure 8.70). When finished, click OK to return to the main screen. Pay atten-tion to the sequence of the fields because you’ll be expected to provide them in the correct sequence inside the script code to the var_out parameter.
© 2013 by Galileo Press Inc., Boston (MA)

265
SQL and SQLScript 8.6
Figure 8.69 Defining the Output Parameter of the Script
Figure 8.70 Specifying the Output Structure of the SQL Script
On the main screen, you can now edit the SQL code itself in the Script object, using the select statement you have on the clipboard. After adding a clause to aggregate data and a filter, the initial data selection is defined (Figure 8.71).
Personal Copy for RGA Rik Vriens, user id c3b3ffa0-d601-c76a-06ae-b5f2c05f5c4a

266
Data Modeling with SAP HANA Studio8
Figure 8.71 The Code in the Script Object in a Basic Working Condition
In the script, you can now add any further SQL code that is desired; for example, to calculate fields, to join or union data from other tables, to incorporate conditional filtering based on input parameters, and so on. For the purpose of our illustration, just leave it here.
With the script defined, the next step is to define the output of the view itself. Click on the Output object in the left section of the screen. The central screen section will now display the Script object’s var_out definition as a logical object. Add the fields from the script output to the view output by right-clicking on the field names and selecting Add as Attribute or Add As Measure (Figure 8.72).
When the fields have been added, the view has its first working definition. Save and activate the view, and check the data preview to check that it returns data (Figure 8.73).
At this point, you have a working view with the general framework defined. From here on, the expansion of the view definition to include more fields, more tables, calculations, and other functions is primarily a work of SQL coding, and you can explore and incorporate as many enhancements as desired.
© 2013 by Galileo Press Inc., Boston (MA)

267
SQL and SQLScript 8.6
Figure 8.72 Defining the View Output by Selecting Fields from the Script Output
Figure 8.73 Checking Data Preview for Returned Data
8.6.2 Using SQLScript
The details of standard SQL programming will be familiar to many developers. The functions of SQLScript are probably much less familiar, however.
SQLScript is proprietary to SAP and is an enhancement to SQL-92 consisting of several components:
Personal Copy for RGA Rik Vriens, user id c3b3ffa0-d601-c76a-06ae-b5f2c05f5c4a

268
Data Modeling with SAP HANA Studio8
EE Data extensions, enabling the definition of reusable table types, separate from tables
EE Procedural extensions, enabling functionality in database processes in the con-text of imperative orchestration logic
EE Functional extensions, enabling functions that can be used in view definitions and procedures used in views
Through these extensions, a number of operations can be pushed closer to the data-base level. The objective of this is performance improvement during the execution of tasks. Specifically, the functional extensions allow you to get better performance in calculation views when retrieving large amounts of data for reporting. This is achieved by the calculation engine, which will parse the SQLScript components into the calculation model (roughly similar to an execution plan, at least in concept, but on the scale of the whole view) at the time of query execution. So the calcula-tion engine has more chances to interpret the SQL commands and push them as far to the database level as possible in the different operations that make up the calculation model.
The data extension to enable table type definitions is useful primarily to define stan-dardized structures that can be reused in multiple view definitions and procedures.
The functional extensions also encourage the reusability of code, making it a bit easier to modularize code without sacrificing performance (the query optimizer will avoid recomputations from multiple function calls where possible). In other words, you can place common portions of code in procedures in SAP HANA and then use those inside calculation view definitions (or inside other procedures) to gain more control over the maintenance aspect of the custom code on a system-wide scale and ensure a higher level of consistency and quality in the custom code.
Procedures can be created directly in the SQL Editor or with the help of a wizard, and they can both read from and write to parameters (e.g., “internal tables” to be passed along to the next procedure or to the view definition). Note that the wizard helps you construct the syntax clauses of the create procedure statement, but you’ll still have to write the content of the procedure in the SQL Editor.
The functional extensions in SQLScript are often referred to as CE functions because their names begin with the characters CE_. A few of the most common CE functions are provided in Table 8.2 for illustration purposes. Refer to the SQLScript Reference Guide on SCN for the fully documented syntax of the CE functions.
© 2013 by Galileo Press Inc., Boston (MA)

269
SQL and SQLScript 8.6
SQLScript Command Use
CE_COLUMN_TABLE Selects data from a columnar table.
Example:
tab1 = CE_COLUMN_TABLE (“MYTABLE”,[“FIELD1”,”FIELD2”]);
CE_JOIN_VIEW Selects data from an attribute view.
Example:
tab2 = CE_JOIN_VIEW (“ATV_MATERIAL”,[“MATNR”,”SPART”]);
CE_OLAP_VIEW Selects data from an analytic view.
Example:
tab3 = CE_OLAP_VIEW (“ANV_SALESITEM”,[“KUNNR”,”NETWR”]);
Note that this will provide the SUM of NETWR GROUPed by KUNNR.
CE_CALC_VIEW Selects data from a calculation view.
Example:
tab4 = CE_CALC_VIEW (“CAV_SALESITEM”,[“KUNNR”,”NETWR”]);
CE_AGGREGATION Aggregates data, particularly useful for counting.
Example:
tab5 = CE_AGGREGATION (:tab3, [COUNT(“ID”) as “NBR_OF_ORDERS”, “KUNNR”]);
CE_UNION_ALL Unions two tables.
Example:
tab6 = CE_UNION_ALL (:tab4, :tab5);
CE_JOIN Performs joins between tables.
Example:
tab7 = CE_JOIN (:tab1, :tab2, [“JOINFIELD”],[“OUTPUTFIELD1”, “OUTPUTFIELD2”]);
CE_PROJECTION Apart from restricting the list of columns returned, renames or applies formulas to columns and applies filters.
Example:
tab8 = CE_PROJECTION (:tab7, [“KUNNR” as “CUSTOMER”, “NETWR” > 100000]);
Table 8.2 Common SQLScript Commands
Personal Copy for RGA Rik Vriens, user id c3b3ffa0-d601-c76a-06ae-b5f2c05f5c4a

270
Data Modeling with SAP HANA Studio8
Creating a Calculation View Using SQLScript
The steps for this task are the same as for a calculation view using SQL; the differ-ence lies in the code that you enter into the Script object of the view.
Let’s build a basic frame of code that will start from the same foundation as the calculation view that you created using the graphical method earlier in the chapter: two analytic views form the basis of the view. They are first unioned together, and then a projection is made of the result. The projection in turn feeds the view output.
In Listing 8.2, essentially the same steps are preformed—taking the two analytic views, performing a union operation on them, and creating a projection. Then, however, the specific logic is introduced: “get the top n customers by sales amount this time.”
So the overall definition of the view looks very similar to the one created using SQL, as you can see in Figure 8.74.
Figure 8.74 Calculation View Definition Using SQLScript
The code inside the script, however, makes use of SQLScript.
inv = CE_OLAP_VIEW (“_SYS_BIC”.”p576516-2/ ANV_SALESITEM”, [“VKORG”,”VKBUR”,”ATV_SOLDTO_KUNNR”,”NETWR”]); -- sales amountsinvcorr = CE_OLAP_VIEW (“_SYS_BIC”.”p576516-2/ANV_SALESITEM_CORR”,
© 2013 by Galileo Press Inc., Boston (MA)

271
SQL and SQLScript 8.6
[“VKORG”,”VKBUR”,”ATV_SOLDTO_KUNNR”,”NETWR”]); -- corrections
invall = CE_UNION_ALL (:inv, :invcorr);
/* the analytic view amounts are all in USD.If this changes, insert currency conversion here.*/
-- in invproj, only keep select fields and only-- orders > $10000invproj = CE_PROJECTION (:invall, [“VKORG”,”VKBUR”,”ATV_SOLDTO_KUNNR” as “SOLD_TO”,”NETWR”], ‘”NETWR” > 10000’);
/* Basic selection is done and two analytic views are combined.Now invoke any procedures or code with special calculations or manipulations*/
-- get top 500 customers by corrected sales amountinvseq = select VKORG, VKBUR, SOLD_TO, NETWR from :invproj order by NETWR desc;
invrank = CE_PROJECTION (:invseq, [“VKORG”,”VKBUR”,”SOLD_TO”, “NETWR”, CE_CALC(‘rownum()’, integer) as “RANK”]);
/* Assign the final result to the script output*/var_out = select top 500 * from :invrank;
Listing 8.2 Example of SQLScript Code to Create a Calculation View
Listing 8.2 is simple and, at the same time, accomplishes a selection from two views, puts the data together, aggregates, sorts, and ranks customers. Of course, there are still a number of enhancements we would need or like to make before this is ready for productive use—such as incorporating variables or input parameters, for example, or adding security information to dynamically provide users with only data they personally have access to.
All in all, it’s worth getting quite familiar with SQLScript; it often offers a way to create views that can do calculations or manipulations that aren’t possible in
Personal Copy for RGA Rik Vriens, user id c3b3ffa0-d601-c76a-06ae-b5f2c05f5c4a

272
Data Modeling with SAP HANA Studio8
graphically defined views, and it performs better than the equivalent definitions in standard SQL.
It’s good to emphasize here, again, the importance of thinking ahead about which views you want to create in SAP HANA. In particular, the definition and scope of analytic views is very important. They should be consistent enough that they can be combined and used easily in code, yet specific enough to perform well. You should always remember these extra considerations when determining your system-wide modeling strategy:
EE Naming of fields and aliases
EE Using subsets of fields as standard parts for all views in a subject area (e.g., hav-ing at a minimum a small set of time fields in every single analytic view, such as day, month, and year)
EE Considering the granularity of views (so that there isn’t one very detailed view that must be used in code, even if the code only needs a much more aggregated result)
Doing this strategy exercise diligently will save you in development, maintenance, and enhancement efforts, and it will make it easier for power users that use Infor-mation Composer to find their way to creating very high-performing views that closely match reporting requirements.
8.7 Summary
We’ve covered a lot of ground in this chapter, starting from the very basics and the definition of terms all the way to the creation of more complex views in SAP HANA. You should now be able to create attribute, analytic, and calculation views using the Modeler in Studio and start exploring their capabilities.
Here are some key points to remember as you move on from here into designing and developing your SAP HANA system:
EE The Modeler perspective offers a very flexible way to retrieve and model data. It supports both a top-down modeling approach, starting from the final desired model and developing views until the result is achieved, and a bottom-up approach, in which SQL code can be used to programmatically build virtually any result set starting from existing views or from any number of base tables in
© 2013 by Galileo Press Inc., Boston (MA)

273
Summary 8.7
the SAP HANA database directly, effectively bypassing the attribute and analytic views. Both approaches have their advantages and disadvantages. The top-down approach can be used to strictly organize and standardize objects, keeping the number of objects, their design parameters, and the amount of custom code in the system lower. This may come at a cost in terms of flexibility and performance, though. The bottom-up approach offers full flexibility and maximum performance tuning of the steps in the data flow from base tables to view output, but runs the risk of custom code proliferation and inconsistency in what is available for reporting where. This can in turn lead to extra work and confusion on the fron-tend tools; for example, in creating SAP Business Objects universes and so on. Determine a way to achieve the standardization that you want while keeping the possibility open to fulfill highly custom requirements where it’s called for.
EE Develop the skills needed to use the latest and greatest functionality offered by SAP HANA. The peculiarities of the join engine, SQLScript coding, and the dif-ferent ways to accomplish a certain result set for output to frontend tools are all capabilities that you’ll need to optimize your SAP HANA solution. These are a few items that we’ve covered in this chapter, but there are many more in total. Just think of security requirements that need to be incorporated, the need for historical reporting (instead of real-time data, sometimes you’ll require data “as of date x” to report out), and so on. All of these require technical skills to put in place.
EE Architect your system and model your data. Skipping this step will inevitably lead to problems down the road. Put the appropriate guidelines and organiza-tional tools in place to allow for a thoughtful and efficient development of a large number of objects. You may start small—for example, with one subject area—but over time, your SAP HANA system will likely grow in scope and data volume. From the sample data model used in this chapter, you can see that the way we’ve developed a number of views is by no means the only way we could have gone about it, and you may already be thinking of different ways that the same final outputs can be achieved that are better suited to your organization’s mode of working with and consuming data. Find an overall architecture that works for your resources and way of developing and supporting BI solutions.
In the next chapter, we’ll cover some more advanced Modeler functions, allowing you to add filters, variables, calculations, and the like to your views.
Personal Copy for RGA Rik Vriens, user id c3b3ffa0-d601-c76a-06ae-b5f2c05f5c4a

© 2013 by Galileo Press Inc., Boston (MA)

275
In the previous chapter, we introduced you to data modeling with SAP HANA Studio. In this chapter, we go a little deeper into some advanced concepts.
9 Advanced Concepts in SAP HANA Studio
In this chapter, we tackle the more advanced modeling capabilities of SAP HANA Studio, continuing the real-life examples of modeling from the previous chapter and building on the views and data you’ve already created. The advanced modeling techniques that Studio offers and common topics covered in this chapter include the following:
EE Derived attribute views
EE Calculated attributes
EE Restricted and calculated measures
EE Filter and variable operations
EE Currency conversion
EE Hierarchies
The first section talks about derived attribute views, which enable you to use the same definition multiple times in one view. The next two sections cover calculations and derivations of field values. After that, we go into filters and variables. We then cover the special topics concerning currency conversion and hierarchies. Finally, we conclude with a section about how to personalize your Studio experience.
9.1 Derived Attribute Views
Attribute views are generally shared objects in the system, meaning that one attribute view can be used in any number of analytic and calculation views across any number of packages. But a single attribute view can only be used once in one specific analytic or calculation view.
Personal Copy for RGA Rik Vriens, user id c3b3ffa0-d601-c76a-06ae-b5f2c05f5c4a

276
Advanced Concepts in SAP HANA Studio9
Sometimes, however, the same attribute view needs to be used more than once in the same analytic or calculation view. A good example is customer master data. In the basic modeling example used so far, you’ve created a customer attribute view and used it to join together sales data with customer master data for the sold-to partner on the sales transactions. But the fact table actually contains four distinct customer numbers: sold-to, ship-to, bill-to, and payer customer partner functions. How do you get those customer numbers—and their associated master data—into the analytic view for sales transactions? Creating four separate customer attribute views by copying the existing view isn’t the answer—because if you’ll recall from the previous chapter, copying a view doesn’t establish any kind of link between the original and the copy. So after the initial copy function is executed, the views are distinct and separate. The answer to how you can maintain only one definition for a standard customer attribute view and use it multiple times in an analytic view is the derived attribute view.
A derived attribute view has its own technical name and description but not its own definition. It acts as a reference to a basic attribute view. This allows you to have one definition, in the basic attribute view, and multiple references to it under dif-ferent join conditions from the same data foundation.
A more logical way to construct this portion of the data model is shown in Figure 9.1.
Data Foundation
VBRP + VBRK+ VBPA: Sales
Invoice Item andHeader, Sales
Document Partner
ATV_SOLDTO:Derivedattribute view
referencing ATV_CUSTOMER
ATV_SHIPTO:Derivedattribute view
referencing ATV_CUSTOMER
ATV_BILLTO:Derivedattribute view
referencing ATV_CUSTOMER
ATV_PAYER:Derivedattribute view
referencing ATV_CUSTOMER
Analytic View
ATV_CUSTOMER:KNA1: General Data in Customer
Master + T005TCountry Texts
Figure 9.1 Derived View Using the Same Attribute View Multiple Times in One Analytic View Definition
© 2013 by Galileo Press Inc., Boston (MA)

277
Derived Attribute Views 9.1
In this data model, the original attribute view isn’t used directly anymore—it only serves as a definition in the modeler. Only the derived attribute views are part of the analytic view.
To create a derived attribute view (Figure 9.2), follow these steps:
1. Ensure you’re in the Modeler perspective.
2. Navigate to the package under which you want to place the view.
3. Right-click on the package, and choose New • Attribute View.
4. In the New Attribute View popup, provide a technical name and a description for the derived view.
5. For Attribute view Type, choose Derived.
6. Click Browse to choose the basic attribute view from which to derive.
7. After you’ve chosen the basic attribute view and returned to the New Attribute View popup, click Finish.
8. Save and Activate the derived attribute view.
From this point forward, you can use the derived view in other views in the system.
Figure 9.2 Creating a New Attribute View
The original customer attribute view was called ATV_CUSTOMER. Choose this as the basic attribute view (Figure 9.3).
To use the derived attribute views, modify the analytic view to incorporate them. Place the derived attribute views into the analytic view simply by dragging them from the Navigator pane into the Logical View tab of the analytic view.
Personal Copy for RGA Rik Vriens, user id c3b3ffa0-d601-c76a-06ae-b5f2c05f5c4a

278
Advanced Concepts in SAP HANA Studio9
Figure 9.3 Specifying the Base Attribute View for a Derived Attribute View
After also removing the original customer attribute view, the joins between the data foundation and the customer master attribute views in the analytic view for sales look like Figure 9.4.
As it is now, the analytic view can’t be activated yet. With the use of derived attri-bute views, you’ve now introduced multiple fields with the same name into the analytic view. In fact, all of the fields from the customer attribute view now exist in the analytic view four times. The view can’t resolve these confusing references on its own, so you have to provide it with a way to distinguish between them. This is always the case with the use of multiple derived views based on the same basic view, but it can happen in other cases as well. Field names are reused throughout SAP ERP, for example, and depending on how you model your views, this may lead to the same problem of having two tables joined together, each of which has a field called MATNR, for instance.
© 2013 by Galileo Press Inc., Boston (MA)

279
Derived Attribute Views 9.1
Figure 9.4 Using Derived Attribute Views to Utilize One Set of Master Data Multiple Times with Different Join Conditions
You must use aliases to resolve this problem. An alias is maintained as a field property of an output field of the view. To maintain aliases, follow these steps (Figure 9.5):
1. Access the view in the Modeler perspective.
2. Click on the first instance of the repeated field name in the Output section of the screen.
3. Click on the Value cell of the field property AliasName.
4. Maintain the alias name as desired by typing directly into the field.
5. Repeat this for all other instances of the repeated field name in the view Output section.
In many cases, with derived attribute views, the system provides a significant short-cut for this activity by proposing alias names for you using the derived attribute view name as part of the alias.
Personal Copy for RGA Rik Vriens, user id c3b3ffa0-d601-c76a-06ae-b5f2c05f5c4a

280
Advanced Concepts in SAP HANA Studio9
Figure 9.5 Setting an Alias for an Output Field of a View
To have the system propose the alias names it can figure out, simply click the Save icon to save your view. A popup appears with proposed alias names. Clicking OK fills in these alias names in all of the field properties (Figure 9.6).
Figure 9.6 Generating a System Proposal for Alias Names
© 2013 by Galileo Press Inc., Boston (MA)

281
Calculated Attributes 9.2
You’ll see the alias names reflected in the Output section of the screen; they are shown in parentheses after the technical field name (Figure 9.7).
Figure 9.7 Reviewing the Alias Names Easily in the Output Pane
9.2 Calculated Attributes
You can derive an attribute from another attribute inside the definition of a view. In disk-based systems, this type of operation usually requires data movement of some sort, but in SAP HANA, it can be done on a logical level. Of course, you can still choose to create a physical field in the table in SAP HANA instead and populate it during data provisioning, but in each case you’ll have to decide how to enhance your data with calculated attributes. In general, if the logic is fairly simple, creating the calculated attribute in the view definition is often the simplest way.
Let’s take the example of the material types in the data model developed earlier in the chapter. One of the attributes in the model is Material Type. Suppose you want a new grouping of several material types into higher-level codes to easily distinguish Finished Goods from all other material types in reporting.
The basic material types are shown in Figure 9.8.
Personal Copy for RGA Rik Vriens, user id c3b3ffa0-d601-c76a-06ae-b5f2c05f5c4a

282
Advanced Concepts in SAP HANA Studio9
Figure 9.8 Base Data to Be Used in a Calculated Attribute
Figure 9.9 Defining a Calculated Attribute
You already have an attribute view for material master data, called ATV_MATE-RIAL. To enhance a view with a calculated attribute, follow these steps (Figure 9.9):
© 2013 by Galileo Press Inc., Boston (MA)

283
Calculated Attributes 9.2
1. Ensure you’re in the Modeler perspective.
2. In the Navigator pane, go to the view under the Content node.
3. Open the view for editing.
4. In the Output section of the screen, right-click Calculated Attributes, and choose New.
5. A dialog box opens where you can provide a technical name, description, data type, and length.
6. Construct the formula to be used for calculating the new attribute.
7. Check the formula by clicking Validate (Figure 9.10).
8. When done, click Add to create the calculated attribute and add it to the view.
Figure 9.10 Validating the Definition of the Calculated Field
Personal Copy for RGA Rik Vriens, user id c3b3ffa0-d601-c76a-06ae-b5f2c05f5c4a

284
Advanced Concepts in SAP HANA Studio9
You can check immediately in Data Preview that the formula is working. By using the Distinct Values tab for both the original and the calculated attribute, you can check record counts and verify that the calculation is working as you intended (Figure 9.11).
Figure 9.11 Checking the Results of the Calculation of the Attribute
9.3 Restricted and Calculated Measures
Restricted and calculated measures are among the most common enhancements made to analytic views, just like restricted and calculated key figures are the most common enhancements to InfoCubes in SAP NetWeaver BW. SAP HANA offers the same functionality, but the advantage in SAP HANA is that by defining these measures in the view itself, the calculations and restrictions are pushed to the database. In other words, the calculations and restrictions are—as much as pos-sible—executed before data is sent from the database, which improves performance. Note that there is also the option of evaluating the expression on the most granular level of data because, in some cases, this is the only option (the equivalent of the SAP NetWeaver BW option Calculate before Aggregation).
To create a new restricted measure, follow these steps:
© 2013 by Galileo Press Inc., Boston (MA)

285
Restricted and Calculated Measures 9.3
1. Ensure you’re in the Modeler perspective.
2. In the Navigator pane, go to the view under the Content node.
3. Open the view for editing.
4. Choose to create a New Restricted Measure in the Output section of the screen.
5. Define the restricted measure with the following:
EE Technical name
EE Description
EE Basic measure
EE Data type and length
EE Any number of restrictions to be applied to the basic measure
EE The aggregation type of the restricted measure (Sum, Min, or Max)
6. Save the changes, and Activate the view.
To illustrate this, you can create a restricted measure on the sales analytic view that contains the net value but only for materials that are finished goods.
Open the view for editing, and the starting point should look like Figure 9.12. In the Output section, right-click on Restricted Measures, and choose New.
Figure 9.12 Creating a New Calculated or Restricted Field from the Output Pane of a View
Personal Copy for RGA Rik Vriens, user id c3b3ffa0-d601-c76a-06ae-b5f2c05f5c4a

286
Advanced Concepts in SAP HANA Studio9
In the Restricted Measures popup window, provide a technical name and descrip-tion for the new restricted measure, and specify the basic measure on which this will be based (Figure 9.13).
Figure 9.13 Choosing the Basic Restricted Measures
Most measures use the aggregation type Sum, but the options Min and Max are also available. Click on the Add Restriction button to create a new entry in the Restrictions list. Next, click on the new row in the Restrictions list in the Param-eter field to bring up the available parameters in the view. Choose the desired parameter (Figure 9.14).
Do the same for Operator and Value until the restriction is fully defined. You can add as many restrictions to the list as needed. Click OK to add the new restricted measure to your view definition.
Restricted measures are automatically placed in the view output. If you want to use this measure in further calculations but don’t want it to be visible to users of this view, you can go into the properties of the restricted measure and set the Hidden property to True (Figure 9.15). By default, the system will always set this property to True when a field is added to the view output.
© 2013 by Galileo Press Inc., Boston (MA)

287
Restricted and Calculated Measures 9.3
Figure 9.14 Defining Restriction Parameters for a Restricted Measure
Figure 9.15 Hiding or Showing Measures in the Output
To create a new calculated measure, follow these steps:
1. Ensure you’re in the Modeler perspective.
2. In the Navigator pane, go to the view under the Content node.
3. Open the view for editing.
4. Choose to create a New Calculated Measure in the Output section of the screen.
Personal Copy for RGA Rik Vriens, user id c3b3ffa0-d601-c76a-06ae-b5f2c05f5c4a

288
Advanced Concepts in SAP HANA Studio9
5. Define the calculated measure with the following:
EE Technical name
EE Description
EE Data type and length
EE The calculation expression
EE The aggregation type for the calculated measure (Sum, Min, or Max)
6. Validate the definition of the calculation expression.
7. Save the changes and Activate the view.
As an example, you can build a calculated measure in the sales analytic view con-structed earlier in the chapter. The new calculated measure is to have profit available in the view, which is defined as the net value minus the cost of sales. The starting point looks like Figure 9.16.
Figure 9.16 Opening the View for Editing to Create Calculated Measures
In the Output section, right-click on Calculated Measures, and choose New (Figure 9.17).
In the Calculated Measures popup window, provide a technical name and descrip-tion for the new calculated measure. For the calculation expression, fill in the formula by using the elements, operators, and functions presented at the bottom of the popup (Figure 9.18).
© 2013 by Galileo Press Inc., Boston (MA)

289
Restricted and Calculated Measures 9.3
Figure 9.17 Creating a Calculated Measure from the Output Pane
Figure 9.18 Defining a Calculated Measure
Personal Copy for RGA Rik Vriens, user id c3b3ffa0-d601-c76a-06ae-b5f2c05f5c4a

290
Advanced Concepts in SAP HANA Studio9
Validate the expression, and click OK to add the calculated measure to the ana-lytic view definition. If you only want the calculated measure but not the basic measure to be visible to users of this view, you can go into the properties of the basic measure and set the Hidden property to True.
Finally, preview the data in the view to check your results.
9.4 Filter and Variable Operations
Filters and variables restrict both the amount of data that the user sees and often the amount of data that is retrieved at database level as well. We speak of variables when the value is determined dynamically at runtime; we speak of filters when the value is fixed.
9.4.1 Filters
Filter operations can significantly help reduce the amount of data retrieved from the database, both inside SAP HANA (when combining views) and between SAP HANA and the end user reporting tool.
They are most commonly used to do the following:
EE Apply constraint filters to the design of a view.
EE Specify the correct client to use when accessing client-dependent tables from SAP ERP.
EE Model texts in attribute views for domain fixed values.
We discuss each of these functionalities in more detail next.
Constraint Filters
We’ve talked briefly before about filters that are configured as part of the definition of a view. These are properly called constraint filters, although the term design-time filters is used as well. Both terms are synonymous.
A constraint filter or design-time filter is hardwired into the view definition. It can’t be changed except by changing the definition of the view itself in Studio. A filter
© 2013 by Galileo Press Inc., Boston (MA)

291
Filter and Variable Operations 9.4
of this type is applied on the database during retrieval of data whenever the view is called; that is, the filter takes effect before selection of data from the SAP HANA database begins. Even if the filter is on a field in a table other than the fact table, it will be applied first before the join is executed. This improves the performance of the view during runtime. This type of filter is useful when you know that it must always be there and doesn’t need to be changeable by the user at runtime.
For example, if the purpose of the view is to present data only to a specific division or region in your company, you can apply design-time filters for organizational entity fields to the relevant tables in the view (Figure 9.19).
Figure 9.19 Example of a Constraint Filter
These filters are applied before table joins in the view are executed. As a result, they reduce the data volume at the very source—the initial selection of data from tables in SAP HANA—and are very performance friendly.
Constraint filters are usually faster than the equivalent WHERE clause in a standard SQL statement. Although both perform essentially the same function, a WHERE clause is only applied on the result set of the SELECT query; that is, after the data is already selected from tables at the database level.
Personal Copy for RGA Rik Vriens, user id c3b3ffa0-d601-c76a-06ae-b5f2c05f5c4a

292
Advanced Concepts in SAP HANA Studio9
Client-Dependent Tables
Users and developers of SAP ERP, SAP NetWeaver BW, and other SAP systems will be familiar with the client concept in SAP systems. End users don’t see a great deal of this; the only time they need concern themselves with it is when logging onto an SAP ERP system. A production SAP ERP system can only have one client, so end users need not concern themselves with this concept beyond that. Developers who deal with development and quality assurance systems will be intimately acquainted with the concept though, as those systems usually have more than one client.
SAP HANA systems do not follow the client concept; in other words, SAP HANA systems have no clients. As a result, the client field MANDT that is a primary key field in almost all SAP ERP tables is treated in SAP HANA as just another primary key attribute. If your SAP HANA system contains data from multiple clients, there needs to be a way to specify the client for which you want to retrieve data in your views. (During data provisioning, the data can already be restricted to only one client where desired; see Chapter 10 for more on this.)
SAP HANA provides special functionality to deal with this, which we explain next.
Setting the Default Session Client in the User Master Record
It’s certainly inadvisable to hardcode the client as a constraint filter on the MANDT field in all of the separate views. Instead, the recommended way of specifying the client is to set the Default Session Client property on the user master record in SAP HANA.
To do this, follow these steps:
1. Ensure you’re in the Administration perspective.
2. In the Navigator pane, open the Catalog node.
3. Open the Authorizations node.
4. Find the SAP HANA user ID you want to maintain (Figure 9.20).
5. Double-click on the user ID to configure.
6. Edit the user ID master record, filling in the Session Client field (Figure 9.21).
© 2013 by Galileo Press Inc., Boston (MA)

293
Filter and Variable Operations 9.4
Figure 9.20 Finding User IDs to Maintain the Default Session Client
Figure 9.21 Maintaining the Default Session Client
7. Make the change effective by clicking the Deploy icon in the top-right corner (Figure 9.22).
Personal Copy for RGA Rik Vriens, user id c3b3ffa0-d601-c76a-06ae-b5f2c05f5c4a

294
Advanced Concepts in SAP HANA Studio9
Figure 9.22 Deploying the New Value for This User ID
Setting this property on the user master records is recommended for SAP HANA administrators regardless of whether one or more SAP ERP clients are loaded to SAP HANA, because it’s a necessary setting for currency conversion to work.
For attribute views, analytic views, and calculated views created using the graphi-cal interface, there is a property on the view itself that can be modified if needed. During normal operation, you shouldn’t have to change this property, but because developers in particular will occasionally need to do this, it’s explained next.
Setting the View-Specific Default Client
In the view definitions, the view property Default Client is defaulted by the system to the value “dynamic” (to be precise, it’s defaulted to the Default Model Parameter for Client, which is also set by the system to “dynamic” by default). This setting will cause the client specified in the user master record to be passed dynamically to the view definition upon execution and will act as a constraint filter there.
If it’s ever necessary to have a view retrieve data from a different client (e.g., for testing purposes) than the default session client, you can change the view property, for the specific view only, by overwriting the value with a different client number.
To do this, perform these steps:
1. Ensure you’re in the Modeler perspective.
2. Navigate to the view you want to modify, and open it for editing.
3. Click anywhere in the white space between objects in the design pane.
4. The Properties pane now displays the overall view properties (Figure 9.23).
© 2013 by Galileo Press Inc., Boston (MA)

295
Filter and Variable Operations 9.4
Click in white space
Figure 9.23 Displaying the View Properties
5. Change the Default Client property to the value you want (Figure 9.24).
Figure 9.24 Specifying a Default Client inside a View
6. Validate, Save, and Activate the view.
From this point forward, the view will operate with the client you’ve specified as a view property.
Personal Copy for RGA Rik Vriens, user id c3b3ffa0-d601-c76a-06ae-b5f2c05f5c4a

296
Advanced Concepts in SAP HANA Studio9
Caution!
Be careful when changing the default client in individual view definitions. If you specify client “xyz” in a view in an SAP HANA development system and then promote this view to, for example, your SAP HANA QA system, chances are the view won’t work there because the SAP HANA QA system is connected to the SAP ERP QA system, which usually has different clients than the SAP ERP development system. It’s precisely for this reason that the default session client property on the user master record defaults to “dynamic.”
Setting the Default Model Parameter for the Client
If you need to create a number of views, all of which need to operate on a specific client that isn’t the default session client, you can change the default value that is used by the Modeler perspective during creation of views in general.
To change the default at this level, follow these steps:
1. Go to the top-level menu option Window • Preferences (Figure 9.25).
Figure 9.25 Setting Preferences
2. On the left side of the dialog box that appears, expand the Modeler node, and then click Default Model Parameters.
3. The value for the Default Client parameter is set upon normal installation of an SAP HANA system to “dynamic” to work with the default client session
© 2013 by Galileo Press Inc., Boston (MA)

297
Filter and Variable Operations 9.4
concept; however, it is changeable. Simply type in any other client you want to have as the default for view creations (Figure 9.26).
Figure 9.26 Specifying a Default Client for All Your Models
4. Click Apply and OK to close the dialog box and have the new setting take effect.
Be aware that this only affects views that are created after the parameter is changed. Upon view creation, the default value is copied into the view definition and from then on is part of the design of the individual view. Changing this setting has no effect on views already created in the system.
As before, be careful when changing the default value for client in views!
Using the Variable $$client$$
Lastly, there is a standard variable in the system called $$client$$ that can be used to provide a dynamic way to specify the client for views, meaning it can be speci-fied at runtime from a user prompt. To do this, follow the earlier steps to modify the properties of the individual view, but replace the value of the Default Client view property with the string “$$client$$”.
The use cases for this are very rare, and in normal operation, this is virtually never necessary.
Personal Copy for RGA Rik Vriens, user id c3b3ffa0-d601-c76a-06ae-b5f2c05f5c4a

298
Advanced Concepts in SAP HANA Studio9
Note
These view and modeler properties are only applicable to attribute views, analytic views, and calculated views created using the graphical interface. They are not applicable to calculation views created using the SQL or SQLScript method. If there are multiple SAP ERP clients loading data to the same SAP HANA system, the SQL-based calculation views will have to handle client dependency inside the code. Refer to the built-in SQLScript function SESSION_CONTEXT for more details.
Domain Fixed Values
In SAP ERP, a fair number of fields have what are called domain fixed values. This means that there is no specific table in SAP ERP that contains the codes and descrip-tions that these fields can have. Rather, all codes and descriptions for all of these fields combined are stored in the SAP ERP tables DD07L and DD07T.
To get these descriptions into views in SAP HANA, those tables can be used directly with the necessary join conditions specified in the individual views directly. How-ever, there is a better way.
The standard way to get the descriptions for the fields (and to use the codes in constraint filters in joins) is to use specially generated tables in SAP HANA that are created and populated automatically by the system during data provisioning from SAP ERP. During the initialization of the data replication, SAP HANA generates two tables for each domain, one with the codes and one with the descriptions:
EE DOM_<domain name> for the codes
EE DOM_<domain name>T for the descriptions
Instead of using the DD07* tables directly in analytic or calculation views, you can use these pairs of tables to create attribute views that can then be reused throughout the system. In the attribute views, text joins can be defined between the tables.
The example analytic view that we created in Chapter 8, Section 8.4, made use of the field VBTYP – SD Document Category, for instance. This is a field from SAP ERP that has domain fixed values.
The pair of generated tables in SAP HANA for this field would be the following:
EE DOM_VBTYP
EE DOM_VBTYPT
© 2013 by Galileo Press Inc., Boston (MA)

299
Filter and Variable Operations 9.4
The attribute view that uses these tables would look like Figure 9.27.
Figure 9.27 Attribute View to Get Codes and Texts for a Field with Domain Fixed Values in SAP ERP
The attribute view has the following settings:
EE DOM_VBTYP and DOM_VBTYPT are joined using a text join.
EE The text join is executed on the field DOMVALUE_L.
EE The text join has the language field DDLANGUAGE specified as a property.
EE The field DDTEXT has the descriptions of the domain.
The attribute view can now be used in other views to get the SD Document Cat-egory descriptions.
9.4.2 Variables and Input Parameters
Variables are used to restrict the data retrieved or displayed by allowing the user to enter a value dynamically at runtime. In SAP HANA, you can create variables in analytic and calculation views. You can create variables there on any field in the output definition of the view (including attributes from attribute views).
Input parameters perform the same function, and the end users won’t notice any difference between these and variables. The difference is technical only: variables are tied to attributes and are passed to the database query in the where clause when
Personal Copy for RGA Rik Vriens, user id c3b3ffa0-d601-c76a-06ae-b5f2c05f5c4a

300
Advanced Concepts in SAP HANA Studio9
accessing the database. Input parameters can be standalone (for use in calculated measures, for instance, or for currency conversion) and are passed to the SQL state-ment in the placeholder clause.
Variables and input parameters come in different flavors depending on their pur-pose. Specifically, the following types exist:
EE Variable for attribute value (including for time fields)
EE Input parameter using static lists
EE Input parameter for currency
EE Input parameter for use in formulas (standalone parameter)
Creating variables and input parameters is done inside the definition of the view itself. An overall consideration of some importance is that they are tied to the individual view in which they are created; they aren’t system-wide. They are, however, like all other objects in a view, available for use wherever the view is used. For example, if you define a variable in an analytic view and then use the view in a calculation view, the variable will be inherited there, but you can’t edit it in the calculation view—editing must be done in the analytic view in which the variable was created.
We’ll go over the ways to create variables and input parameters first and then cover a few specific important remarks concerning their use and reuse.
To create an attribute value variable, follow these steps:
1. Navigate to and then open the view (analytic or calculation) in which you want to define a variable.
2. In the Output section, right-click on the desired attribute and choose Create Variable or Create Variable – Apply Filter (to have the variable applied imme-diately to the view definition).
3. When the Variables dialog box opens, type in a technical name for the variable.
4. Provide a description and the basic Data Type and Length.
5. Choose the Selection Type as either:
EE Single (only single distinct values can be selected)
EE Interval (from–to intervals can be selected)
EE Range (any combination of values can be selected)
© 2013 by Galileo Press Inc., Boston (MA)

301
Filter and Variable Operations 9.4
6. Choose whether Multiple Entries of the specified selection type are allowed (multiple single values or multiple intervals). This isn’t very useful with selec-tion type range.
7. Choose whether the variable Is Mandatory or not.
8. Specify a Default Value if so desired.
9. Click OK to create the variable.
10. Validate, Save, and Activate the view.
Verify that the variable works as you intended by getting the Data Preview of the view. A prompt should now come up to ask you for variable values prior to displaying the data.
Note
For optional variables, the selection prompt can be bypassed and all values displayed by clicking the Cancel button on the variable prompt.
As an example, you can create a variable for Year in the analytic view for sales items used before (Figure 9.28).
Figure 9.28 Creating a New Variable
Fill in the details for the variable as shown in Figure 9.29.
Personal Copy for RGA Rik Vriens, user id c3b3ffa0-d601-c76a-06ae-b5f2c05f5c4a

302
Advanced Concepts in SAP HANA Studio9
Figure 9.29 Defining the Variable
When getting the data preview, the prompt shown in Figure 9.30 appears.
Figure 9.30 Variable Prompt inside Studio When Asking for Data Preview
To create an input parameter using a static list, follow these steps:
1. Navigate to and then open the view (analytic or calculation) in which you want to define a variable.
2. In the Output section, right-click on Input Parameters, and choose New.
3. When the Input Parameters dialog box opens, provide a technical name and description for the parameter.
4. Choose the Data Type and Length.
© 2013 by Galileo Press Inc., Boston (MA)

303
Filter and Variable Operations 9.4
5. Choose the Type to be Static List to release the List of Values input section for editing in the dialog box.
6. Compose the list by using the Add button.
7. Choose whether the parameter Is Mandatory or not.
8. Specify a Default Value if desired.
9. Click OK to create the parameter and add it to the view.
10. Validate, Save, and Activate the view.
An example for this analytic view is shown in Figure 9.31.
Figure 9.31 Creating a New Input Parameter
The technical keys for the different values of the static list are generated by the system; you only have to provide the descriptions you want the users to see (Fig-ure 9.32).
This input parameter can now be used in calculated attributes, for example. In general, static list input parameters are often useful in calculation views built using the SQL method, where they can be used to guide conditional logic in the SQL code (if-then-else type of logic). For input parameters for currency, see Section 9.5 coming up next, where the topic is explained in some detail.
Overall it’s important to remember the following concerning variables and input parameters: all input parameters that are technically necessary to execute the query—that is, those that are used in currency conversion, in calculated measures,
Personal Copy for RGA Rik Vriens, user id c3b3ffa0-d601-c76a-06ae-b5f2c05f5c4a

304
Advanced Concepts in SAP HANA Studio9
or in attributes—are always mandatory because the query simply can’t be com-pleted without them.
Figure 9.32 Defining an Input Parameter with Static List
9.5 Currency Conversion
Most of the amounts in any given fact table are expressed in one specific currency. For example in SAP ERP tables, there is a mandatory and explicit link between any monetary amount field and its currency. Converting currencies is a necessary function for many reporting scenarios, and SAP HANA offers the possibility to do this as part of the modeling of the analytic and calculation views.
In general, to convert an amount to a different currency, you must specify the following:
EE Source currency
EE Target currency, either fixed or with the use of a variable
EE Date you want to use as the exchange rate between the two currencies
© 2013 by Galileo Press Inc., Boston (MA)

305
Currency Conversion 9.5
Additionally, you must of course have the necessary tables in the system to store the exchange rates. For an SAP ERP system, this requires the following tables to be replicated to SAP HANA:
EE TCURR: Exchange Rates
EE TCURV: Exchange Rate Types
EE TCURF: Conversion Factors
EE TCURN: Quotations
EE TCURX: Currency Decimal Settings
The tables must be in the schema you specified as Schema for Conversion during the creation of the view. If you need to change the schema for conversion later, you can do so by changing the view property Default Schema. The best place to do currency conversion in SAP HANA is in the analytic views, where it can be done using the graphical interface.
Measures in SAP HANA have their own type. By default, all measures are defined by the system as Simple and can be used as standalone fields, without a currency or unit attached to them, which is different from the SAP ERP concept of measure definition. Yet it’s possible to establish the same link between the amount field and its associated currency field as exists in SAP ERP. This is done by changing the measure type to Amount with Currency, which is a necessary step in enabling currency conversion for the measure.
To perform currency conversion for a measure, follow these steps:
1. Ensure you’re in the Modeler perspective.
2. Open the analytic view that contains the measure.
3. Click on the measure in the Output section of the screen.
4. Change the Measure Type field property by clicking in the Value cell of this entry and then clicking on the small button at the right (shows an ellipsis).
5. When the Currency/Unit of Measure dialog box appears, change the measure type to Amount with Currency. This places a new editable field on the popup called Currency, along with two checkboxes Enable for conversion and Enable for decimal shifts.
6. Check the Enable for conversion checkbox. This makes the fields needed to specify the conversion parameters editable.
Personal Copy for RGA Rik Vriens, user id c3b3ffa0-d601-c76a-06ae-b5f2c05f5c4a

306
Advanced Concepts in SAP HANA Studio9
7. Specify the Target Currency using the top Currency field in the dialog box. This can be done in three ways:
EE As a fixed target currency, for example, “USD.”
EE As an attribute of the view, for example, “T001.WAERS” for company code currency.
EE As an input parameter, so the user gets a prompt where the target currency can be chosen dynamically (see later in this section for how to create such a parameter).
8. Specify the Source Currency. This can be done in two ways:
EE As a fixed source currency; for example, “EUR.”
EE As an attribute of the view; for example, “VBAP.WAERK” for a sales docu-ment currency.
9. Specify the Exchange Type. In general, there can be many types of exchange rates; for example, “mean daily rate”, “bank buying rate”, and so on. If you don’t specify anything here, the system will use the exchange rate type “M”—mean daily value.
10. Specify the Date. This can be done in three ways:
EE As a fixed date; for example, “12/31/2012”.
EE As an attribute of the view; for example, “VBAK.ERDAT” for the sales doc-ument creation date.
EE As a variable, so the user gets a prompt where the date can be chosen dynamically, or the value is specified at runtime using a procedure that runs in the background.
11. The system automatically checks the option Enable for decimal shifts. This serves to shift the decimal point to the correct position for specific exchange rate configurations from SAP ERP. This may be necessary, for example, for specific combinations of from–to currencies among Japanese yen, New Taiwan dollar, Hungarian forint, and Ukrainian hryvnia, to name a few. It’s best always to consult someone in your organization who is an expert in the configuration of the TCUR* tables in SAP ERP if you use some of the less common currencies.
12. Set the Upon Conversion Failure option to tell the system how to respond to requests where no exchange rate can be found. There are three choices:
© 2013 by Galileo Press Inc., Boston (MA)

307
Currency Conversion 9.5
EE Fail
EE Set to NULL
EE Ignore
13. Finally, click OK. The currency conversion for the measure has now been defined.
As an example, Section 9.5.1 will provide the Sales Amount measure with a simple conversion from its document currency to USD, so that aggregation works easily across all reporting levels, and all reports have an apples-to-apples view of sales amounts.
9.5.1 Using an Input Parameter to Specify Target Currency
To create a currency variable for the target currency in currency translation, follow these steps:
1. Navigate to and open the view (analytic or calculation) in which you want to define a variable.
2. In the Output section, right-click on the folder Input Parameters, and choose New.
3. When the Input Parameters dialog box opens, choose the Data Type to be VARCHAR with Length 5 (Figure 9.33). This is the way currency fields are defined in the TCUR* tables.
Figure 9.33 Creating a New Input Parameter for Target Currency
Personal Copy for RGA Rik Vriens, user id c3b3ffa0-d601-c76a-06ae-b5f2c05f5c4a

308
Advanced Concepts in SAP HANA Studio9
4. Choose the Type to be Currency.
5. Choose the Is Mandatory option.
6. Specify a Default Value.
7. Click OK to create the variable.
The variable is now available in the dialog boxes for currency conversion to use as needed.
Note
When you use a currency variable in currency conversion, the variable is automatically mandatory because the system can’t calculate the result of the output measure without it.
To use the variable for target currency in a measure, put the variable name in the Currency field when you define the measure type in the measure properties. Figure 9.34 shows the variable as it can be used in a currency conversion.
Figure 9.34 Using a Target Currency Variable in a Measure Definition
Note
Before you begin, the Default Session Client must be set for the user master record. This is necessary because the TCUR* tables are client-dependent in SAP ERP. See the “Client-Dependent Tables” section earlier in this chapter for details on how to set this parameter.
9.5.2 Linking Measures with Currencies without Using Conversion
The measure type Amount with Currency can be used even if you don’t want to perform any currency conversion. In such a case, the amount displays with its currency.
© 2013 by Galileo Press Inc., Boston (MA)

309
Hierarchies 9.6
Note that in this case, you set the Currency in the dialog box to the currency the amount is expressed in, but you don’t check the Enable for Conversion option. For example, to always display the sales amount in document currency, set the Currency to the attribute value VBAP.WAERK, which will automatically set the target currency to VBAP.WAERK as well.
Note that this is different from the situation in which you want to perform conver-sion. If you do want conversion, say from document currency to company code currency, you specify the document currency VBAP.WAERK to be the source cur-rency, and the company code currency T001.WAERS as the target currency using the Currency field.
In other words, whichever currency is specified in the dialog box field, Currency is always the currency in which the measure will be output from the view. If you want to output the amount in its original currency, specify the source currency in the Currency field, and leave the checkbox Enable for Conversion blank. The source currency will also become the target currency for output. If you want to output the amount in any other currency, specify the target currency in the Cur-rency field, check the box Enable for Conversion, and specify the original cur-rency as the source currency.
9.6 Hierarchies
Hierarchies serve many purposes and can sometimes be very useful in reporting. From organizational structures to employee hierarchies, they can be used to struc-ture the output of data in a way that is easier to interpret and navigate for the user.
Hierarchies can be created in different forms in SAP HANA:
EE Leveled hierarchy
EE Parent-child hierarchy (also known as a recursive hierarchy)
In a leveled hierarchy, each node has its specific assigned place, and child nodes can only be accessed in a rigid, predetermined sequence. An organizational structure is often a good candidate for a leveled hierarchy, provided it doesn’t contain employee data. Each organizational unit (company code, plant, etc.) belongs in exactly one place in the hierarchy, and its level is explicitly assigned. Another example is group-ing countries into regions.
Personal Copy for RGA Rik Vriens, user id c3b3ffa0-d601-c76a-06ae-b5f2c05f5c4a

310
Advanced Concepts in SAP HANA Studio9
A recursive or parent-child hierarchy has entities that can be at the same time parent and child of other nodes. In this type, the parent-child relationships are represented in the data values themselves. Examples are the employee hierarchy or the bill of material (BoM).
For both the leveled and parent-child hierarchies, the initial, and often relatively largest, effort is in populating the tables that underlie the build of the hierarchy. We’ll use a very simple set of sample data to illustrate the build and use of hierar-chies in the Modeler here.
9.6.1 Creating a Leveled Hierarchy
To create a leveled hierarchy, perform the following steps:
1. Define and load the underlying table that has the hierarchy data.
2. Create an attribute view to hold the hierarchy with the table in it.
3. Place all of the fields needed in the hierarchy in the Output of the view.
4. Define the hierarchy in the Hierarchies screen.
5. Validate, Save, and Activate the view.
To illustrate, let’s group a few countries into regions. The desired hierarchy is shown in Figure 9.35.
GLOBAL
AMERICAS ASIA
US MX CN MY
Figure 9.35 Example of a Leveled Hierarchy
Underlying the leveled hierarchy is a table in SAP HANA with the information shown in Figure 9.36.
© 2013 by Galileo Press Inc., Boston (MA)

311
Hierarchies 9.6
Figure 9.36 Table Data for a Leveled Hierarchy
You can see here why this is called a leveled hierarchy: each country is assigned all of its levels explicitly, and the structure is essentially flattened out (leveled) to specify all nodes for a value at once. The country is the lowest leaf and determines the granularity of the table data.
To create a hierarchy based on this information, you create a standard attribute view to hold the hierarchy (Figure 9.37). Select the table with the hierarchy data as the object on which to base the view (Figure 9.38).
Figure 9.37 Creating a Standard Attribute View with the Base Table
In the view, select the fields of the hierarchy as Output. The most granular field is the key field; set both the Key Attribute and Principal Key properties of the output field accordingly (Figure 9.39).
Personal Copy for RGA Rik Vriens, user id c3b3ffa0-d601-c76a-06ae-b5f2c05f5c4a

312
Advanced Concepts in SAP HANA Studio9
Figure 9.38 Selecting Only the Table with the Hierarchy Data for Your View
In the field properties of the field that is thelowest level of the hierarchy, set Key Attribute
and Prinicpal Key properties to “True”.
Figure 9.39 Setting the Correct Properties on the Lowest Level Field for a Hierarchy
© 2013 by Galileo Press Inc., Boston (MA)

313
Hierarchies 9.6
Now you’re ready to define the hierarchy. In the Output pane, right-click the Hierarchies folder. Click New Level Hierarchy to start creating a new hierarchy (Figure 9.40).
Figure 9.40 Creating a New Leveled Hierarchy in a View
In the following dialog box, give it a technical and descriptive name, and use the add row function (green plus sign) to add attributes to the hierarchy. Make sure you place the attributes from highest level in the hierarchy to lowest level in the correct sequence. Click OK when you’re done (Figure 9.41).
Figure 9.41 Specifying the Details of a Leveled Hierarchy
Personal Copy for RGA Rik Vriens, user id c3b3ffa0-d601-c76a-06ae-b5f2c05f5c4a

314
Advanced Concepts in SAP HANA Studio9
You can check the properties of the new hierarchy in the Properties pane (Figure 9.42).
Figure 9.42 The Hierarchy’s Properties
Validate, Save, and Activate the attribute view.
You can’t get the tree structure displayed in preview mode, but you can verify your leveled hierarchy’s accuracy with the usual Data Preview function, which will display the hierarchy in table format (Figure 9.43).
Figure 9.43 Data Preview of the Hierarchy
9.6.2 Creating a Parent-Child Hierarchy
To create a parent-child hierarchy, the basic steps are the same as for the leveled hierarchy, but a few settings in the definition differ. The basic steps are the following:
1. Define and load the underlying table that has the hierarchy data.
2. Create an attribute view to hold the hierarchy with the table in it.
3. Place all of the fields needed in the hierarchy in the Output of the view.
© 2013 by Galileo Press Inc., Boston (MA)

315
Hierarchies 9.6
4. Define the hierarchy in the Hierarchies screen.
5. Validate, Save, and Activate the view.
Let’s illustrate this with a hierarchy of employees. The desired hierarchy is shown in Figure 9.44.
Sarah
Jacob Veronica
Christopher Isabella Ethan Sophia Robin
Jennifer
Figure 9.44 A Parent-Child Hierarchy
The underlying table for this hierarchy looks like Figure 9.45.
Figure 9.45 Underlying Data Table for a Parent-Child Hierarchy
A parent-child hierarchy is also called a recursive hierarchy because the table holds no explicit information on where each value belongs in the tree. Rather, it’s the values themselves from which the structure is derived.
Again, create an attribute view to hold the hierarchy, drag the fields into the Output of the view, and define the child field (also called “successor”) as both Key Attribute
Personal Copy for RGA Rik Vriens, user id c3b3ffa0-d601-c76a-06ae-b5f2c05f5c4a

316
Advanced Concepts in SAP HANA Studio9
and Principal Key. In the Output pane, right-click on the Hierarchies folder, and click New Parent Child Hierarchy to create a new hierarchy (Figure 9.46).
Figure 9.46 Creating a New Parent-Child Hierarchy
In the dialog box, fill in a technical name and description for the hierarchy, and specify which attribute is the child and which is the parent. Remember that the hierarchy is derived from the values themselves, so the underlying structure is very simple, and this is all the information the system needs to construct the hierarchy. Click OK to go back to the main screen (Figure 9.47).
Figure 9.47 Specifying the Details for a Parent-Child Hierarchy
© 2013 by Galileo Press Inc., Boston (MA)

317
Personalizing Studio 9.7
You can check the hierarchy’s properties for accuracy if you want. Finally, Validate, Save, and Activate the attribute view.
9.7 Personalizing Studio
A number of aspects of Studio can be personalized by the developer. In addition, there is some limited possibility of versioning of objects (not strictly a personaliza-tion option, but it helps keep track of objects). In this section, we’ll introduce you to the different personalization options in Studio.
9.7.1 Model Validation
During the creation of all views, we have used the Validate function to check the definition of the view, prior to activating it, which deploys the definition on the database. A good number of validation rules are checked during the Validate process, and which rules exactly are checked can be customized.
To specify which rules to check, go to Window • Preferences (Figure 9.48).
Figure 9.48 Setting Preferences
Under the Modeler option in the following popup, choose Validation Rules. The Validation Rules window opens, and you’ll notice more than 35 rules that you can switch on or off (Figure 9.49). By default, all of the rules are checked and you should leave them this way when you first start out with Studio. As you become familiar with the tool, you may want to switch off some of the check rules.
Personal Copy for RGA Rik Vriens, user id c3b3ffa0-d601-c76a-06ae-b5f2c05f5c4a

318
Advanced Concepts in SAP HANA Studio9
Figure 9.49 Validation Rule Options
9.7.2 Versioning
The versioning concept in SAP HANA is similar to that in SAP NetWeaver BW: there is no database of all historical versions of an object (as in SAP ERP), but there is an active and inactive version that you can see and compare. You can have at most one active and one inactive version of an object at the same time.
When you navigate to an object in Modeler, it will by default open the active version (if one exists). As soon as you make a change and save the object again, the screen will switch to the modified, inactive version. This is fully transparent to the user. As you make a number of modifications to the view, you may want to bring up the active version again to verify that you’ve made all of the modifications desired. To switch between the versions, use the switch version icon in the top-right corner of the screen (Figure 9.50).
© 2013 by Galileo Press Inc., Boston (MA)

319
Personalizing Studio 9.7
Figure 9.50 Switching between Active and Inactive Object Versions
9.7.3 Checking Model References
Model references refer to the where-used list of views and objects. Attribute views and analytic views are often used in other views because that is their purpose to a considerable extent.
To find out where exactly they are used so you can analyze the impact of any proposed object change, you can always go to the object in the Navigator pane, right-click, and choose the Where-Used option (Figure 9.51).
Figure 9.51 Calling Up the Where-Used List for an Object
Personal Copy for RGA Rik Vriens, user id c3b3ffa0-d601-c76a-06ae-b5f2c05f5c4a

320
Advanced Concepts in SAP HANA Studio9
This will open up a screen pane called Where-Used List. In addition, by default, when you open a view in the standard Modeler perspective, the system will place the Where-Used List pane on your screen (Figure 9.52).
Figure 9.52 The Where-Used List Screen Pane
9.7.4 Customizing Perspectives
You can rearrange screen panes simply by dragging them around. Illustrations here are for the Modeler perspective, but this is true for any perspective in the system. Click on the tab with the pane name, and drag it over the screen. The system will show you where you can drop it again.
© 2013 by Galileo Press Inc., Boston (MA)

321
Personalizing Studio 9.7
To illustrate this, drag the Properties pane to the central screen section, and the system shows that you can “pin” it to the left of the design pane (Figure 9.53). Release the cursor to reposition the pane.
Figure 9.53 Rearranging Panes by Dragging and Dropping Them on the Screen
You can now save this new screen layout by using the Window • Save Perspec-tive As menu option. Under the Window menu, you’ll also see other options for managing perspectives, such as the Customize Perspective option (Figure 9.54). This will launch a popup window where you can set many options for screen display (Figure 9.55).
Personal Copy for RGA Rik Vriens, user id c3b3ffa0-d601-c76a-06ae-b5f2c05f5c4a

322
Advanced Concepts in SAP HANA Studio9
Figure 9.54 Setting Display Options for Perspectives
Figure 9.55 Further Options for Customizing How Perspectives Display on Screen
© 2013 by Galileo Press Inc., Boston (MA)

323
Summary 9.8
9.8 Summary
This chapter provided a hands-on introduction to a few of the more advanced func-tionalities available in the SAP HANA Studio Modeler perspective. We’ve covered the most commonly used functions in some detail because they are so prevalent. All in all, the different information views in SAP HANA offer a great deal of mod-eling functionality in the graphical interface. You can perform calculations, derive new fields, do currency conversion and unit conversion, create hierarchies, and, of course, add filters, variables, and other input parameters to the views.
The purpose of this extended functionality is to allow you to do most of your modeling using the views, without having to resort too quickly to custom coding (i.e., calculation views using the SQL method). The intent is to make it easier to develop and especially support the solution. It’s important that you’re aware of the advanced capabilities of the Information Modeler and the views so that you can find the optimal balance between creating views—use these wherever possible—and creating solutions that rely more on custom SQL code—use these only where other information views fall short.
Personal Copy for RGA Rik Vriens, user id c3b3ffa0-d601-c76a-06ae-b5f2c05f5c4a

© 2013 by Galileo Press Inc., Boston (MA)

325
Getting data into your SAP HANA system requires some forethought. In this chapter, learn what your options are, and how to work with them.
10 Data Provisioning
There are many ways to propagate data in SAP HANA. In this chapter, we’ll go over the main data provisioning tools, including the different options, how they compare, and their installation effort and features. There are three fundamental options:
EE SAP Landscape Transformation (SLT), also called trigger-based replication
EE SAP Data Services, also called ETL-based replication
EE Sybase Replication Server, also called log-based replication
Any of these can be used independently, or all three can be used together. Depend-ing on the technical characteristics of the source system and on the desired data provisioning strategy, you can implement the appropriate mechanism for each of your sources of data.
In addition to these three methods, you can also leverage existing extractors; that is, Business Content data sources originally developed for use with SAP NetWeaver Business Warehouse (BW). This is called Direct Extractor Connection (DXC) and only covers extraction from data sources, so it’s more of a complement to the oth-ers, rather than a replacement for any of them. DXC generally applies more to SAP HANA for BW than to SAP HANA as a standalone version. This additional replica-tion method is also discussed in this chapter.
In this chapter, we’ll discuss all four of these data provisioning mechanisms. In the first section, we’ll give you some information that will help you choose which of the three data provisioning models is most appropriate for your business scenario. In the subsequent sections, we’ll explain how to perform each of the different methods. In the last section, we spend some time explaining the DXC and how it can complement the three main data provisioning methods.
Personal Copy for RGA Rik Vriens, user id c3b3ffa0-d601-c76a-06ae-b5f2c05f5c4a

326
Data Provisioning10
10.1 Choosing a Data Provisioning Method
Each of the three data provisioning mechanisms (Figure 10.1) is fundamentally different from the others. Before we go into the details of each, let’s contrast and compare the three options.
SAP HANA Database
SourceSystem
Application Layer
Database Layer
SLTSAP DataServices
SybaseReplication
Figure 10.1 Main SAP HANA Data Replication Mechanisms
SLT/trigger-based replication is the primary data provisioning mechanism for SAP source systems, for example, SAP ERP. When considering SLT replication, here are some key facts to keep in mind:
EE SLT requires the installation of an SLT Replication Server.
EE Both data and metadata from tables can be replicated to SAP HANA with this technology.
EE This Replication Server records any changes to a set of designated tables inside the source system and makes them available for a pull into the SAP HANA database.
EE The SLT Replication Server intercepts the changes to the tables in the application layer when transactions are executed in SAP ERP by detecting the triggers that are sent to the database to update tables, making this solution database-inde-pendent on the SAP ERP side.
EE The replication of data to SAP HANA can be set up according to a schedule or as a continuous, near real-time feed.
EE Opportunities for filtering data within a table exist; for example, when replicat-ing the accounting tables, you can specify which company codes you want the data for and which fields should come across to SAP HANA.
© 2013 by Galileo Press Inc., Boston (MA)

327
Choosing a Data Provisioning Method 10.1
EE You can also perform limited transformations during the data export from the source system using the SLT Replication Server. More complex transformations are technically possible, but pay special attention to performance with this func-tionality to avoid impact on the replication performance, especially for con-tinuous data feeds that you want to use for operational reporting.
EE The SLT Replication Server is an ABAP-based technology that leverages several proven existing system landscape optimization technologies from SAP, which are now updated to work for SAP HANA.
EE The SLT Replication Server can also be used for non-SAP sources that meet some basic database criteria that enable the Replication Server to capture the changes in the source system.
SAP Data Services/ETL-based replication uses the SAP Data Services technology that is already in place in many implementations. When considering SAP Data Services replication, here are some key facts to keep in mind:
EE This requires the installation of the SAP Data Services software component.
EE The replication can leverage existing extractors, function modules, and programs in the source system.
EE Both data and metadata can be replicated to SAP HANA with this technology.
EE Replication of data typically runs on a more traditional batch job schedule, for example, every few hours or once per day.
EE SAP Data Services is often used to integrate non-SAP source systems into the reporting landscape.
EE Highly complex transformations and data cleansing capabilities are possible.
EE SAP Data Services is a proven, highly stable technology for which many com-panies already have the necessary tools and skillsets in house.
Sybase Replication Server/log-based replication is a database-specific technology that is available only for specific database systems, namely the Sybase and IBM DB2 for LUW (Linux, UNIX, and Windows) systems. When considering Sybase Replication Server replication, here are some key facts to keep in mind:
EE Sybase Replication Server starts from the database level, using database log tables to identify any changes to tables in the source system.
EE This is a high-performing real-time replication technology that bypasses the application layer.
Personal Copy for RGA Rik Vriens, user id c3b3ffa0-d601-c76a-06ae-b5f2c05f5c4a

328
Data Provisioning10
EE Because the application layer is bypassed, no opportunities for filtering or trans-formation of data exist; the mapping is one-to-one and at the table level.
EE The data is copied to SAP HANA exactly as it’s entered into database tables in the source system. The database commits are essentially replayed on the SAP HANA database.
Note
The name DB2 for LUW is the one given by IBM to its product. In SAP speak, this is more often than not referred to as DB6. The two are synonymous. SAP uses the name DB6 to distinguish this version of the DB2 database from other versions; for example, the version that runs on mainframes.
From these highlights of the three replication mechanisms, it’s apparent that all three differ fundamentally in both technical and functional terms. How then do you decide which of these you should implement? In general, there is no precise decision tree for this, so it’s best that you spend some time evaluating your data provisioning strategy based on your specific needs. In this section, we briefly discuss the strategic and technical considerations that will influence what data provisioning model is right for you.
10.1.1 Strategic Considerations
Strategically, you should always keep in mind both your operational and corporate requirements. By operational requirements, we typically mean granular, real-time or near real-time data that is provided in (usually) small data sets at a time. By corpo-rate requirements, we mean what is typically served by a data warehouse solution. These requirements are typically for higher level, often cross-process views of the data and accept (or even demand) some degree of data latency.
You must also consider that you have many different potential sources of data:
EE SAP systems
EE Non-SAP systems that run on SAP-supported databases compatible with SLT
EE Other database-based legacy systems
EE External data feeds, often coming in as files (e.g., comma-delimited files)
EE Unstructured data
© 2013 by Galileo Press Inc., Boston (MA)

329
Choosing a Data Provisioning Method 10.1
The overall goal is to find the best path from each of the sources to the final delivery of information to end users. For example, for operational reporting requirements, you’ll need to identify the sources that are required and then choose the data rep-lication method and system that can satisfy the requirements.
As an exercise and instead of the usual very high-level diagrams that only map the main flows, we’ll construct an example diagram that contains a large number of dataflows that cover many of the functional and technical requirements listed previously. The system-level diagram will incorporate many different sources of data and different requirements:
EE An SAP ERP source system
EE A non-SAP system with an SLT-compatible database
EE External data feeds
EE Unstructured data for use in reporting
EE A legacy system on an older database version
EE A requirement to build custom hierarchies for reporting based on multiple sources of data
EE A requirement to perform complex transformations and data cleansing on some sources
The objectives are to maximize the availability of real-time or near real-time data for end users, to provide a consistent presentation of the data in the reporting tools, to maintain internal consistency and coherence of all data used in reporting tools regardless of source, and finally to leverage available technology and connections as much as possible.
In this specific example, you make use of SLT and SAP Data Services to get data into the appropriate target systems, but you aren’t incorporating Sybase Replication. You can begin with the dataflow for operational data from the applicable sources, which is the area where you primarily deploy SAP HANA as a solution. Figure 10.2 shows the necessary flows, labeled O1 O6 C1 C6 S1 S5 U1 U2 U5 through O1 O6 C1 C6 S1 S5 U1 U2 U5 .
The dataflow has the following characteristics at this point:
EE The use of SLT to provide up-to-the-minute operational data from all source systems compatible with SLT, maximizing the availability of this data for users.
Personal Copy for RGA Rik Vriens, user id c3b3ffa0-d601-c76a-06ae-b5f2c05f5c4a

330
Data Provisioning10
O1
Non-SAP systemon SAP-
supported DB
SAP system;e.g., ECC
(disk-based)
Other system(disk-based) +
external data feeds
SLT Server(1:1 or minor
transformations)
SAP HANA(transformations inviews or SQLScript)
SAP BusinessObjectsdashboards,reports, etc.
SAP Data Services (trans-formations for cleansing,metadata, data matching,PAL, custom hierarchies)
O6O5
O3
O2
O4
Figure 10.2 Data Provisioning Flow for Operational (Real-Time) Data
EE The use of SAP Data Services for all other sources of data. This would likely run on a scheduled load basis, although there are some limited capabilities in SAP Data Services to provide near real-time data as well, if absolutely needed.
EE The collection of all operational data in one SAP HANA system. This will most likely be in different schemas in SAP HANA.
EE This in turn enables a consistent approach to data transformations: transforma-tions specific to the source systems can take place in SLT or SAP Data Services, while SAP HANA will combine the sources and perform any extra transforma-tions.
EE SAP HANA becomes the one central source of operational data for SAP Business-Objects reporting tools. In SAP Business Objects, transformations are no longer needed.
© 2013 by Galileo Press Inc., Boston (MA)

331
Choosing a Data Provisioning Method 10.1
Next, consider the dataflow for corporate reporting and other requirements that are served from the data warehouse. In this example, you have an SAP HANA for BW system as the data warehouse. For a disk-based or SAP NetWeaver Business Warehouse Accelerator (BWA)-enabled BW system, the changes to the diagram are small, however (the data connections from SLT to SAP NetWeaver BW fall away and can be left out or be replaced by connections through SAP Data Services). These requirements don’t need real-time data; however, they are typified by much more complex transformations and a higher degree of integration of data across separate source systems.
Figure 10.3 adds the necessary flows to get corporate data to the target systems in the connections labeled O1 O6 C1 C6 S1 S5 U1 U2 U5 to O1 O6 C1 C6 S1 S5 U1 U2 U5.
Non-SAP systemon SAP-
supported DB
SAP system;e.g., ECC
(disk-based)
Other system(disk-based)
SLT Server(1:1 or minor
transformations)
SAP HANA for BW(typical BW
transformations)
SAP HANA(transformations inviews or SQLScript)
SAP Data Services (trans-formations for cleansing,metadata, data matching,PAL, custom hierarchies)
C1
C4
C3
C2
C6C5
SAP BusinessObjectsdashboards,reports, etc.
Figure 10.3 Adding the Data Provisioning Flow for Corporate Data (Higher Level, Not Necessarily Real-Time Data)
Personal Copy for RGA Rik Vriens, user id c3b3ffa0-d601-c76a-06ae-b5f2c05f5c4a

332
Data Provisioning10
Notice the following in Figure 10.3:
EE The SLT server is leveraged for the non-SAP system.
EE However, for the SAP ERP source, the existing implementation of SAP NetWeaver BW extractors is leveraged. For a standalone version of SAP HANA, this is sim-ply the existing data sources; for an SAP HANA for BW system, you have to use the DXC technology (discussed in Section 10.5). Alternatively, you can use the SLT server for this as well.
EE The necessary data cleansing and complex transformations for the legacy source system can be accomplished in SAP Data Services. This also leverages the con-nection from the legacy system to SAP Data Services that was already there in the operational dataflow.
EE Several connections and configurations already used for the operational dataflow are leveraged here for corporate data.
Finally, the flows are added for supplemental data such as hierarchies and other, highly transformed, data sets that are needed in reporting, as well as the flows for external data feeds. A few possible paths for unstructured data are also included.
Figure 10.4 adds the additional flows in the connections labeled O1 O6 C1 C6 S1 S5 U1 U2 U5 through O1 O6 C1 C6 S1 S5 U1 U2 U5 and O1 O6 C1 C6 S1 S5 U1 U2 U5 through O1 O6 C1 C6 S1 S5 U1 U2 U5.
Remember that the tables underlying hierarchies in SAP HANA must be built explic-itly with a certain structure. To accomplish this, you can route the data through SAP Data Services, for example. In general, data of this type can be fed to SAP Data Services from any source and distributed from there to all SAP HANA and data warehousing systems that require it, or even to SAP Business Objects tools directly.
For this small-volume but important data set, the following occur in the flow:
EE All target systems and reporting tools use the same data because it has a single source in SAP Data Services.
EE The only exception to this is non-system information, such as Microsoft Word documents and other written documents provided in the BI Launch Pad as addi-tional information. These have no application in SAP HANA or SAP NetWeaver BW and can consequently be incorporated directly in the SAP Business Objects
© 2013 by Galileo Press Inc., Boston (MA)

333
Choosing a Data Provisioning Method 10.1
layer. The same applies to unstructured data that is only needed supplementally in reporting but doesn’t need to be incorporated into system data. There is no need to place this in SAP HANA.
EE Again, several existing connections are leveraged.
Non-SAP systemon SAP-
supported DB
SAP system;e.g., ECC
(disk-based)
Other system(disk-based) +external data
SLT Server(1:1 or minor
transformations)
SAP HANA for BW(typical BW
transformations)
SAP HANA(transformations inviews or SQLScript)
SAP Data Services (trans-formations for cleansing,metadata, data matching,PAL, custom hierarchies)
S1
S2
S3
S4 S5
U1
U2
SAP BusinessObjectsdashboards,reports, etc.
Figure 10.4 Additional Data Provisioning Flows for Any Supplemental Data and External and Unstructured Data
The total diagram with all connections for all data source systems now looks like Figure 10.5.
Personal Copy for RGA Rik Vriens, user id c3b3ffa0-d601-c76a-06ae-b5f2c05f5c4a

334
Data Provisioning10
O1
Non-SAP systemon SAP-
supported DB
SAP system;e.g., ECC
(disk-based)
Other system(disk-based)
SLT Server(1:1 or minor
transformations)
SAP HANA for BW(typical BW
transformations)
SAP HANA(transformations inviews or SQLScript)
SAP Data Services (trans-formations for cleansing,metadata, data matching,PAL, custom hierarchies)
C1
O6O5
O3
O2C4
C3
C2
C6
S1
S2
S3
S4 S5
U1
U2
O4
C5
SAP BusinessObjectsdashboards,reports, etc.
Figure 10.5 All Data Provisioning Flows Combined
This example has taken a fairly wide scope in terms of both the sources of data and the required actions on them. We’ve considered both operational reporting using SAP HANA and the existence of a data warehouse. We haven’t made use of all of the possible data provisioning methods all at once because this is also not likely to occur in your own strategy. It’s likely that in its first incarnation, the flows you establish for an SAP HANA system will be much simpler than the example you’ve just seen because they will contain fewer elements, but the task remains the same. As you construct your own flows, remember to leverage both existing and new technologies, consider where you want to deploy SAP HANA and when, and decide the initial scope and the longer term direction of your landscape. Deciding which source systems are in scope now and which will become part of scope in the
© 2013 by Galileo Press Inc., Boston (MA)

335
Choosing a Data Provisioning Method 10.1
future is important in drawing up a roadmap for which replication technologies you should adopt. Additionally, consider the point at which you anticipate moving your SAP NetWeaver BW and SAP ERP systems to run on the in-memory database as a primary database and how to ease the transition. Depending on these scope decisions, you may wind up with a very different decision on which replication technologies you’ll implement.
10.1.2 Technical Considerations
Aside from the more strategic considerations, you need to keep in mind a few tech-nical constraints when you devise a data provisioning setup. The most important of these are summarized in Table 10.1 to Table 10.4, along with the overall technical characteristics of each replication method. SAP HANA capabilities are still increas-ing with every major and minor release, so make sure to check in detail with SAP before you embark on an implementation. Consult the Product Availability Matrix (PAM) and the latest info pages and installation guides.
SLT SAP Data Services Sybase Replication Server
Installation Requirements
SLT server must be installed either on a separate machine or on an SAP ERP application server. SLT server is based on SAP NetWeaver 7.02, kernel release 7.20 EXT.
SAP Data Services 4.0 SP2 must be installed. This is a regular SAP Data Services implementation; no special components need be installed on SAP Data Services to work with SAP HANA.
Sybase Replication Server must be installed on the SAP HANA server.
Sybase Replication Agent must be installed on the source system server.
Number of Source Systems
Multiple source systems to any number of SAP HANA systems.
Multiple source systems to any number of SAP HANA systems.
One source system per SAP HANA instance.
Table 10.1 Comparing the High-Level Architectures
Personal Copy for RGA Rik Vriens, user id c3b3ffa0-d601-c76a-06ae-b5f2c05f5c4a

336
Data Provisioning10
SLT SAP Data Services Sybase Replication Server
Data Movement
Real-time and scheduled replication.
Scheduled replication. Real-time replication.
Data Replication Approach
Replication set up on table level.
Replication according to SAP Data Services configuration.
Replication by Logical Unit of Work (LUW).
Presence of Load Balancing
Load balancing (parallelization).
Load balancing (parallelization).
No load balancing.
Data Transformation
Limited data transformations and filtering are possible.
Complete ETL toolset for data transformations.
No transformation of data.
Supported Tables
Transparent, pool, and cluster tables can be replicated.
Transparent, pool, and cluster tables can be replicated.
Transparent tables can be replicated. No support for pool and cluster tables, but consult OSS notes.
Support of Compressed Tables
Compressed tables are supported.
Compressed tables are supported.
Tables with compressed values are supported for DB2 9.1, 9.5, and 9.7. Row-compressed tables only supported for DB2 9.7.
Table 10.2 Comparing Data Replication Capabilities
SLT SAP Data Services Sybase Replication Server
SAP Systems SAP ERP systems from 4.6C, other ABAP-based systems from Basis release 4.6C.
For SAP systems this is an RFC connection from SLT to the source system.
SAP ERP systems from 4.6C, other ABAP-based systems from Basis release 4.6C.
SAP ERP 6.0.
Table 10.3 Comparing Source System Compatibility Aspects
© 2013 by Galileo Press Inc., Boston (MA)

337
Choosing a Data Provisioning Method 10.1
SLT SAP Data Services Sybase Replication Server
Non-SAP Systems
Any system on SAP-supported database (note: DB2 for iSeries and Sybase ASE as of SAP HANA 1.0 SPS04 only).
For non-SAP systems this is over a DB connection.
Any. As feasible in Sybase Replication Server, currently not in scope for SAP HANA though.
Unicode Unicode or non-Unicode source systems.
Unicode or non-Unicode source systems.
Unicode source systems only.
Database Source Support
Source system can be on any SAP-supported database.
Source system can be on any SAP-supported database.
IBM DB2 for LUW only.
Table 10.3 Comparing Source System Compatibility Aspects (Cont.)
SLT SAP Data Services Sybase Replication Server
Administration Administration in SAP HANA Studio.
Administration via regular SAP Data Services Management Console, or through SAP Solution Manager.
Administration in SAP HANA Studio using the Load Controller component.
Configuration Some configuration in SLT server, especially with first setup of new replication scenarios.
Configuration in SAP Data Services.
Configuration in Sybase Replication Server.
Transformations Transformations are configured and processed on SLT server.
Transformations are configured and processed in SAP Data Services.
No transformations possible.
Table 10.4 Comparing Administration and Configuration Aspects
Personal Copy for RGA Rik Vriens, user id c3b3ffa0-d601-c76a-06ae-b5f2c05f5c4a

338
Data Provisioning10
10.2 Trigger-Based Replication: SAP Landscape Transformation
For SAP source systems such as SAP ERP, SLT is the premier replication method. SLT offers filtering and some transformation capabilities while still achieving near real-time replication, and it can be administered from within the existing Studio application. Because of this combination of flexibility, functional capabilities, and ease of administration, SLT can be considered to be the default choice in many cases. In this section, we’ll walk you through what you need to know about trigger-based replication.
10.2.1 Installation
SLT software can be installed in different ways. You need to consider the use cases for SLT to determine the best installation method: whether you intend to use SLT only for SAP source systems, or if non-SAP source systems are also in scope. The installation may be done differently in both cases.
Installation for SAP Source Systems
For use with an SAP source system, there are two options for where you place SLT in your system landscape:
EE Installation as a separate SAP system
EE Installation on the SAP source system itself
For production source systems, it’s generally best to install SLT as its own, separate system. This has some very important benefits:
EE Software updates, support packages, and so on can be applied to the source system and to SLT separately, reducing risk and regression testing effort, and avoiding any impact from software changes on the SLT system to the source system.
EE The impact of data replication on system resources of the source system is avoided. Apart from recording the changes and sending them over to the SLT server, there is no activity on the source system for replication purposes.
© 2013 by Galileo Press Inc., Boston (MA)

339
Trigger-Based Replication: SAP Landscape Transformation 10.2
Filtering, transformations, and control processing of the replication all occur on the SLT system.
EE A standalone SLT server can remain operational for non-SAP sources when SAP ERP gets moved to an SAP HANA database without further impacts.
In general, if the SLT system is administered on its own, there is the cost of main-taining another server and instance, but there are significant benefits in terms of reliability and maintenance cost elsewhere as well.
If you do want to install SLT on the source system, you must have the proper com-ponents and kernel level. In particular, for SLT with the standalone version of SAP HANA (1.0 SPS03), the source system must have the following:
EE Kernel 7.20 EXT (patch level 110 or above)
EE The Add-on DMIS in release 2010_1_700 with SP05
EE ABAP stack 7.02 (i.e., SAP NetWeaver 7.0 with EHP 2), which SLT is based on
When you do this, remember to provide enough processing power on the application server on which SLT is installed. Replication is done using background processes so enough processes and memory must be available. The connection between the SAP source system and the SLT system is made via remote function call (RFC).
Installation for Non-SAP Source Systems
To use SLT for non-SAP source systems, the SLT Replication Server must be installed as a standalone system. The source systems for which you can use SLT are those satisfying these criteria:
EE Source system must be on an SAP-supported database.
EE The database must be on a version compatible with SAP NetWeaver 7.02 as defined in the PAM.
EE The database operating system must be on a version compatible with SAP NetWeaver 7.02 as defined in the PAM.
The SLT server in this case is installed somewhat differently. The communication between the source and SLT systems takes place over a permanent database con-nection (instead of via RFC).
Personal Copy for RGA Rik Vriens, user id c3b3ffa0-d601-c76a-06ae-b5f2c05f5c4a

340
Data Provisioning10
10.2.2 How SLT Works
Always keep the following three general rules in mind for connecting a source system to SAP HANA:
EE Each source system can connect to only one SLT system.
EE Each SLT system can connect to multiple SAP HANA systems.
EE Each SAP HANA system can get data, through SLT, from multiple source systems.
The steps in the data replication are always the same, regardless of which installa-tion scenario you choose:
1. Database triggers are detected by the SLT software on the source system.
2. The data is written to special log tables for SLT, which are created in the source system during SLT installation.
3. Read modules poll the log tables for new data and pass the data along when requested by the Controller modules.
4. Controller modules then pass the data to Write modules.
5. Write modules perform any operations required and pass the data to the SAP HANA database.
6. Data is written to the application tables in SAP HANA.
Note that while the steps in the data transfer process are always the same, the pre-cise location of some components differs depending on your installation scenario. Of course, if SLT is installed on the SAP source system directly, all components reside there (Figure 10.6).
There is, however, also a difference between SAP and non-SAP sources, even if you install SLT as a separate SAP system. For an SAP source system, the Read modules are placed on the source system, and the connection to SLT goes over RFC (Figure 10.7).
But if the source system is non-SAP, the Read modules are installed on the SLT system, and the connection to SLT is a database connection (Figure 10.8).
© 2013 by Galileo Press Inc., Boston (MA)

341
Trigger-Based Replication: SAP Landscape Transformation 10.2
SAP System; e.g., ECC (Disk-Based), Including SLT ServerComponent
SAP HANA(transformations inviews or SQLScript)
dbApplication
Tables
ReadModule
DB Trigger
LoggingTables
Control Module,Mapping,
Transformations
Write ModuleApplication
Tables
Figure 10.6 Installation of the SLT Server Component on the SAP Source System Application Server
SAP System;e.g., ECC (Disk-Based)
SAP HANA(transformations inviews or SQLScript)
ApplicationTables
DB Trigger
LoggingTables
SLT Server(1:1 or minor
transformations)
ReadModule
Control Module,Mapping,
Transformations
Write ModuleApplication
Tables
RFC
db
Figure 10.7 Installation of a Separate SLT Server for an SAP Source System
Personal Copy for RGA Rik Vriens, user id c3b3ffa0-d601-c76a-06ae-b5f2c05f5c4a

342
Data Provisioning10
SAP System;e.g., ECC (Disk-Based)
SAP HANA(transformations inviews or SQLScript)
ApplicationTables
DB Trigger
LoggingTables
SLT Server(1:1 or minor
transformations)
ReadModule
Control Module,Mapping,
Transformations
Write ModuleApplication
Tables
db
db
Figure 10.8 Installation of SLT for a Non-SAP Source System
10.2.3 SLT Configuration
To establish the data transfer to SAP HANA using SLT, some configuration is required. The central configuration dashboard is called up in SLT using Transaction LTR. In here, you can define the data transfers individually as pairs of a source system and a target schema. Each pair is saved as a replication configuration and is assigned a unique mass transfer ID.
For each such combination of source system and target schema, you must do the following:
1. Define the incoming connection from the source system (SAP or other).
2. Define the outgoing connection to SAP HANA. You’ll need the hostname and instance number of the SAP HANA system, as well as the user ID and password that should be used for the connection. Have your SAP HANA administrator set up a dedicated user ID for this purpose in SAP HANA.
3. Specify a target schema.
4. Specify the number of background jobs to be used for data replication.
5. Specify the replication frequency:
© 2013 by Galileo Press Inc., Boston (MA)

343
Trigger-Based Replication: SAP Landscape Transformation 10.2
EE Real Time will establish a continuous stream.
EE Schedule by Interval enables a load at specific intervals (e.g., every 15 min-utes or every 8 hours).
EE Schedule by Time enables a load at a specific time of day.
6. Assign tablespaces for the logging tables on the source system. It’s recommended to place the logging tables in separate tablespaces for easier monitoring of the table sizes.
7. Specify if you want to allow this source system to map to multiple target schemas.
8. Specify if you want this configuration to only read data from a single client for an SAP source system.
If there is no need to filter or transform data, this is all you need to enable data replication to SAP HANA. From this point, you can go to the Studio and start load-ing data with a 1:1 mapping.
Note that activating a data transfer configuration does more than just save configu-ration settings. It also does the following:
EE Creates the database schema on the SAP HANA system (if it doesn’t exist already).
EE Creates the necessary logging tables on the source system to capture changes.
EE Copies over the table metadata from the source system.
EE Creates authorization roles and grant/revoke procedures on the SAP HANA sys-tem for the target schema.
EE Registers the replication parameters in SAP HANA.
EE Creates the control and job log tables in SAP HANA that will keep track of the replication jobs and allow you to see the status within Studio.
Each source-target configuration is assigned a mass transfer ID, which is used else-where in SLT—for example, when creating transformation rules—to identify the configuration to which the extra settings should be applied.
10.2.4 SLT Administration (Start, Replicate, Stop, Suspend, Resume)
The administration of the data replication itself isn’t done on the SLT server but inside Studio. In the Modeler perspective, you can choose Data Provisioning, from which you’re able to start and stop loading data to SAP HANA.
Personal Copy for RGA Rik Vriens, user id c3b3ffa0-d601-c76a-06ae-b5f2c05f5c4a

344
Data Provisioning10
There are five functions to choose from for the data loading:
EE Load drops the target table and starts a new one-time load of the current data.
EE Replicate performs a load (if none has taken place yet) and starts the replication based on the parameters defined in SLT (i.e., real-time, schedule by interval, or schedule by time).
EE Stop halts any future data loads and deletes the logging tables from the source system; data integrity is no longer ensured when you do this, and to load again, you’ll have to choose Load or Replicate again.
EE Suspend pauses data loads temporarily, meaning the logging tables in the source system remain intact, and changes are still being tracked on the source system; at any point, the replication can be resumed again without loss of data and without compromising data integrity. It’s best not to suspend loads for a long period as the logging tables may grow large, and the system may automatically move to a stop operation.
EE Resume is used after a suspend operation to begin loading data where the loads left off on the suspend function.
You can monitor all data loading, table by table, in the Data Load Management screen in Studio where the current job status is displayed along with the exact timestamp of the last replication.
This isn’t to say that the SLT system itself doesn’t offer monitoring and trouble-shooting capabilities. In SLT, you can start and stop what is called the master job for each configuration (this effectively toggles the configuration from an active to a not active state and back). More important for day-to-day operation are the statistics that SLT offers: you can find—by individual table—the last, minimum, median, and maximum data latency times of the replication and how many records were inserted, updated, and deleted.
The capabilities of the technology in terms of monitoring and troubleshooting are still expanding, and new ways to monitor the replication are just now making it to market, such as integration with SAP Solution Manager (including alerts) and a mobile version of the SLT Replication Manager.
© 2013 by Galileo Press Inc., Boston (MA)

345
Trigger-Based Replication: SAP Landscape Transformation 10.2
10.2.5 Extended Features
During the data replication, you can make use of a number of features to specify the data replication more fully:
EE Select specific tables to replicate.
EE Apply filters for certain field values to replicate only certain records of a table.
EE Apply transformations to the data:
EE Transform individual fields.
EE Extend the replicated table structure with extra fields, or reduce the replicated table structure by leaving out certain columns.
Be aware that every filter or transformation defined in SLT relates to one specific mass transfer ID.
Selecting Specific Tables
Specific tables are selected in Studio when you start the loading. Both the Load and Replicate functions will allow you to choose the specific tables in a dialog screen before you begin the data transfer itself.
Note
Developers and administrators of an SAP system will be familiar with the special table type of cluster tables and the specific challenges it sometimes poses. SLT can replicate cluster tables to SAP HANA. The process has been described in OSS notes for your refer-ence. Please review the latest notes if you want to replicate cluster tables using SLT. The notes on this topic should be listed under the application area BC-HAN-LTR.
Applying Filters
There are a few different ways that you can apply filters for certain field values to replicate only certain records of a table. Filtering records with the use of event-based or parameter-based rules takes place within SLT; in other words, all changed records are still tracked in the logging tables on the source system and then transferred to the SLT server. Once there, the filter is applied, and only the remaining chosen records are sent on to SAP HANA. This type of filter is applied during both the load and the replicate operations. For an event-based filter, you specify exactly at which point in the processing logic the filter is to be applied in the rule configuration.
Personal Copy for RGA Rik Vriens, user id c3b3ffa0-d601-c76a-06ae-b5f2c05f5c4a

346
Data Provisioning10
Event-based rules consequently offer the most flexibility in implementing filters and transformations, but you’ll have to familiarize yourself with the different events available in this type of rule. Parameter-based filters don’t require you to specify this event because they occur at a predefined point in the processing where the incoming record is available.
Within SLT, the way records are processed resembles the mechanism used in SAP ERP data sources or in SAP NetWeaver BW update rules/transformations. Every replication cycle breaks up the data it receives into portions (by default, this is 5000 records per portion in a replication cycle) and loops through the portions. Within each such loop, any rules are applied (filters or transformations), and the data is then transferred by the Write module to the SAP HANA target.
Figure 10.9 displays the flow of the processing logic in SLT with regards to trans-formations. This is the default flow logic that applies to parameter-based rules and event-based rules where the event Begin Of Record (BOR) is chosen. Other events are available that also allow you to execute a rule elsewhere, for example, at the start and end of each portion (similar to start and end routines in SAP NetWeaver BW).
ReadModule
Control Module, Mapping, Transformations:* Start replication cycle * Outer loop, each time getting next portion from source * Inner loop through records of each portion * Apply rules (filters/transformations) * Transfer record to sender structure * End inner loop * End outer loop* Conclusion of replication cycle
WriteModule
Figure 10.9 Internal Data Processing Login in SLT for Parameter-Based Rules and BOR Event-Based Rules
Note
Parameter-based rules always execute at the record-processing level. That might be less optimal for performance, but it doesn’t require worrying about the different events and what information is available to work within each of them. Certain operations are faster when performed at other times, however, and it’s worth developing both the skills and some guidelines for the use of event-based rules to optimize the SLT replication performance.
© 2013 by Galileo Press Inc., Boston (MA)

347
Trigger-Based Replication: SAP Landscape Transformation 10.2
The following are the essential activities to create rules of this type:
EE Create an entry in a configuration table in SLT with the appropriate values. This is done using a standard SAP program in SLT.
EE Maintain an ABAP program of the INCLUDE type with the desired filter.
The coding of the filters themselves is usually very easy because a simple IF/ENDIF statement will suffice for the condition, and SAP has provided a small macro called SKIP_RECORD. Essentially then, the filters are specified from a negative condition (the condition specifies which records to skip, not which to retain).
A sample filter is shown here in which we’re selecting only specific company codes to transfer to SAP HANA, by skipping the ones we don’t want loaded:
IF e_bukrs = ‘1000’ OR e_bukrs = ‘1100’.SKIP_RECORD.ENDIF.
Another way to filter records is to modify the trigger on the source system itself. Because this applies the filter on the source even before any data is transferred to the SLT server, this will perform better. This filter works on the source system on the database level, however, so the syntax of the rule itself is database-specific.
This type of filter is applied by making entries in a configuration table, where you can specify the mass transfer ID to which the rule should be applied, the type of the source system database, the specific table to which it relates, and, of course, the rule itself. The filter conditions are specified with positive conditions in this case, meaning that records that satisfy the condition will be transferred to SLT for further processing.
An important note here is that trigger-based filter conditions are only applied dur-ing the replication cycles and not during the initial load, because they are applied during the tracking of changes in the SLT logging tables by use of the database triggers. If you use this method to filter data and also want to have a filter dur-ing the initial load into SAP HANA, you need to specify a second, event-based or parameter-based filter in SLT.
Personal Copy for RGA Rik Vriens, user id c3b3ffa0-d601-c76a-06ae-b5f2c05f5c4a

348
Data Provisioning10
Applying Transformations by Transforming Individual Fields
Transformation of values happens on the SLT server after receiving the data from the source system and before sending it to SAP HANA. The SLT system is an ABAP system, so code for transformations is written in ABAP.
To implement value transformations, two things are needed:
EE An entry is made in a configuration table on SLT to tell the system to call the transformation code.
EE The code itself is inside an ABAP program of the INCLUDE type.
As with filters, value transformations can be event-based or parameter-based.
The code you place in the transformations has an impact on the throughput perfor-mance of the replication, so be careful how much code you place here. Especially if you want to get real-time data into SAP HANA (latencies of just a few seconds), it’s best to avoid transformations. There are, however, cases where it makes sense to transform the data at this stage before it’s forwarded to the SAP HANA system. Examples include unit or currency conversions to fixed target units/currencies or filling in initial fields—such as a source system or client identifier if the target table in SAP HANA is fed from more than one source table, system, or client.
Applying Transformations by Altering the Replicated Table Structure
When you extend a structure with extra fields, you have to add transformation routines, as described earlier, to populate these fields. The additional complexity of this type of enhancement lies in the fact that you now have to change metadata as well, or, to be more precise, you have to provide new metadata for use in the output of data.
To implement this type of transformation, the following needs to happen:
EE An entry is made in a configuration table on SLT to tell the system to use a dif-ferent structure as the sender structure; that is, different from the table definition in the source system.
EE A table with the desired target structure must be created in the system. This is a regular, transparent table created in the ABAP Dictionary. The table can be created either in the source system or in the SLT system; you specify where in the entry made in the configuration table.
© 2013 by Galileo Press Inc., Boston (MA)

349
ETL-Based Replication: SAP Data Services 10.3
EE An entry is made in a configuration table on SLT to tell the system to call the transformation code that will populate the new field (event-based or parameter-based rule).
EE The code itself is inside an ABAP program of the INCLUDE type.
The reduction of the number of fields in the sender structure requires the first two of these steps but not the last two because there is no need to determine the value of any field in this case.
Special Filter Rule for Client in SAP Source Systems
Chapter 9 on Studio has addressed the capabilities of SAP HANA to specify which clients you want to load data from. Because SAP HANA has no client concept in its tables, by default, data from all clients in client-dependent tables is read from a source SAP system into SAP HANA. This is rarely what you want. Even when you want to load data from more than one client, it’s still recommended to maintain control over which clients get loaded where and when into SAP HANA, instead of leaving it as a wide open selection.
Loading data from multiple clients can be useful in development, testing, or training systems, depending on your SAP client landscape. There will be many cases, however, where only data from one client should ever be replicated to SAP HANA; for example, for all production systems but often also for other systems.
It’s always possible to add a filter rule on the MANDT field for this purpose, but because of the special role the field plays in so many source system tables, SAP has also provided a way to do it in configuration. While configuring the data replication itself, you can specify if you want this configuration to only read data from a single client. The value for the client is in that case taken from the configuration of the RFC connection. The main advantage of this approach is performance: the configuration setting will incorporate this as a trigger-based filter at the very beginning of the data logging and replication process.
10.3 ETL-Based Replication: SAP Data Services
If you require a high degree of transformation of data prior to putting the data in SAP HANA, and a scheduled data feed is enough, consider SAP Data Services. Especially if the need to include non-SAP sources that drive you toward the use of SAP Data Services exists, consider combining a real-time mechanism with SAP Data Services. Even some data provisioning from SAP ERP may be better suited to SAP Data Services while the bulk of SAP feeds flow through SLT or Sybase.
Personal Copy for RGA Rik Vriens, user id c3b3ffa0-d601-c76a-06ae-b5f2c05f5c4a

350
Data Provisioning10
In this section, we’ll go over the capabilities, the sequence of activities needed, and the positioning of SAP Data Services in terms of data provisioning to SAP HANA systems. The internal processes within SAP Data Services aren’t discussed; they are firmly established, and there is no change in how SAP Data Services itself works.
SAP Data Services is designed to work primarily as a batch processing application; that is, the loads through SAP Data Services generally take place at regular times of day instead of in real time. There is some limited capability for real-time process-ing but the tool isn’t capable of performing the real-time feeds of large volumes of data that an operational reporting scope for an SAP HANA implementation typically requires.
This isn’t to say that the software offers less capabilities than, for example, SLT. In fact, SAP Data Services has its entire array of extract, transform, and load (ETL) func-tionality available for loading data to SAP HANA as well as the following benefits:
EE For SAP source systems, extraction can be done from tables (as in SLT or Sybase) but also from data sources, enabling you to leverage existing extraction codes for a quicker implementation and reducing the required modeling effort in SAP HANA.
EE Metadata can also be transferred to SAP HANA using SAP Data Services.
EE The delta capabilities of SAP Data Services are available as usual.
10.3.1 Configuration Requirements
SAP Data Services 4.0 or higher is required. The components of the software that must be installed to be able to transfer metadata to SAP HANA are the Metadata Service and the Viewdata Service.
In terms of configuration, it’s necessary to turn off the session security for the web service IMPORT_REPO_OBJECT in SAP Data Services. This too is to enable the metadata transfer to SAP HANA. There are no specific configuration requirements for the SAP HANA system itself.
10.3.2 Preparing SAP HANA to Receive Data from SAP Data Services
Before data can be loaded to SAP HANA, the necessary tables must exist in a schema in SAP HANA to receive the data. The creation of the target tables in the SAP HANA system can technically be done by SAP Data Services during the data load itself;
© 2013 by Galileo Press Inc., Boston (MA)

351
ETL-Based Replication: SAP Data Services 10.3
however, this doesn’t allow you to review the table definition and especially the field typing before data is populated into the table. After data is populated, the definitions can no longer be changed; for example, to switch a field from being non-Unicode (type VARCHAR) to Unicode (NVARCHAR). It’s often best, therefore, that you create the tables beforehand.
Of course, the internal functionality of SAP HANA can be used to create tables through the Modeler perspective or with the use of the SQL Editor. For SAP source systems, there is also an easier way: get the metadata definitions from SAP Data Services and have SAP HANA create the tables automatically.
In summary, there are four ways to create the target tables in SAP HANA:
EE Using Studio, through the graphical interface
EE Using Studio, through the SQL Editor
EE Automatically with a mass metadata import, for SAP source systems only
EE Automatically during the SAP Data Services load job execution, table by table
To create tables for SAP source systems automatically in a mass operation, do the following:
1. If the connection doesn’t exist yet (e.g., the connection between SAP Data Ser-vices and the SAP source system is brand new), create a data store of the type SAP Applications in SAP Data Services. This will be the source of the metadata for SAP HANA.
2. Establish the connection between the SAP Data Services data store and the SAP HANA system.
EE In SAP HANA, start Quick Launch.
EE In the Setup section, click the entry Configure Import Server.
EE In the dialog box that appears, provide the host name of the SAP Data Services system as the Server Address, and provide the name of the SAP Data Services repository where the data store was created. Don’t specify a value for the ODBC Data Source field.
EE Click OK to finish the configuration. The source of the metadata import is now known to SAP HANA.
3. Import the metadata into SAP HANA.
Personal Copy for RGA Rik Vriens, user id c3b3ffa0-d601-c76a-06ae-b5f2c05f5c4a

352
Data Provisioning10
EE In SAP HANA, in the Content section of the Quick Launch screen, click the entry Import.
EE A dialog screen appears asking you to select an import source. Under the heading Information Modeler, click the entry Source Objects.
EE Now you’ll need to specify a target system. Remember that one Studio instal-lation can be connected to any number of SAP HANA systems simultaneously. Click on the desired target SAP HANA system.
EE It’s now time to select the specific SAP Data Services source system as the connection to be used. Select the SAP source system name that was created with the data store earlier.
EE Still on the same dialog screen, select whether you want to import metadata for tables or for extractors. If you want both, choose one now, and simply repeat the whole process for the other later.
EE You now have a chance to select for which individual tables or extractors you want to import the metadata definitions. Add the objects you want. Don’t forget to specify the desired schema in SAP HANA that target tables for the objects should be created in.
EE Review the metadata definitions. You can make corrections or desired changes here for data type, length, nullability of the fields, and so on.
EE At the completion of this step, the metadata import is fully specified. Click Next to get a short summary of the proposed import.
EE Finally, click Finish. This will perform the import itself and create a target table in SAP HANA for each of the objects selected for import.
This method allows you to create tables in SAP HANA based on the source table definitions in a quick way, handling many tables or extractors at once. Unfortunately, this method is currently not supported for non-SAP source systems.
The second way to create tables in SAP HANA automatically, based on the meta-data provided by SAP Data Services, is to do it in the batch job definition. You’ll need a data store for the source system tables, and a second data store for the SAP HANA table definitions, both to be created in SAP Data Services. You can then create a batch job that makes use of the Template Table functionality to export the metadata to SAP HANA.
© 2013 by Galileo Press Inc., Boston (MA)

353
ETL-Based Replication: SAP Data Services 10.3
The batch job definition will look like Figure 10.10.
Batch Job Definition
Dataflow
ABAP Dataflow
SourceTable
Query 1Template
Table
SAPTransport
File Format
Query 2
Figure 10.10 Batch Job Definition for a Metadata Import
Without going into great detail, in the definition, the following occurs:
EE The source table is the individual table from the source system data store that you want to load to SAP HANA.
EE The template table contains the definition of the target table in the SAP HANA data store: table name and target schema in the SAP HANA system (the schema name is placed in the Owner Name field of the template definition).
EE The fields that will be part of the target table to be created in SAP HANA are specified in Query 2.
EE In Query 1, you map the fields you want to load to SAP HANA (this should nor-mally be the same list as in Query 2).
When you execute this batch job in SAP Data Services, the target table will be cre-ated in the SAP HANA system.
10.3.3 Loading Data
In a discussion of the different ways to load data to SAP HANA through SAP Data Services, it’s necessary to take into account the different possible sources and the different delta mechanisms, called Change Data Capture (CDC) mechanisms in SAP Data Services.
Personal Copy for RGA Rik Vriens, user id c3b3ffa0-d601-c76a-06ae-b5f2c05f5c4a

354
Data Provisioning10
The main characteristics of the different data update modes are as follows:
EE Full Refresh performs a complete drop and reload of the data.
EE Timestamp-based CDC is based on timestamps that must be available in the table on the source system. Depending on the timestamps available, slightly different implementation scenarios exist.
EE Target-based CDC loads all data from the source system but sends only new and changed records on to SAP HANA.
EE Source-based CDC extracts only new and changed records from the source; this can be thought of as the functional equivalent of a timestamp-based extraction but for Business Content data sources instead of for tables. This only works for extractors that support delta recognition.
Table 10.5 summarizes the different options for updating data by the type of source you want to use.
Full Refresh
Timestamp-Based CDC
Target-Based CDC
Source-Based CDC
Table Inserts only √ √ √
Updates possible √ √ √
Data Source
With ODP and delta recognition
√ √ √
Without ODP or without delta recognition
√ √
Table 10.5 Update Types by Type of Source Data
You’ll notice in Table 10.5 that the extraction scenarios for data sources are consid-ered separately for ODP or non-ODP compatible data sources. For the purpose of data replication, the Operational Data Provider (ODP) interface mainly enables the use of data sources with delta queues for those extractors that support a delta. Not all data sources delivered by SAP are ODP compatible, so you’ll need to check the individual data sources to see if the ones you want to use with SAP Data Services are in the list. For those that are ODP compatible and have delta recognition, an efficient delta extraction is available to SAP Data Services. An additional benefit for
© 2013 by Galileo Press Inc., Boston (MA)

355
ETL-Based Replication: SAP Data Services 10.3
ODP-compatible data sources is that they don’t require the use of an ABAP dataflow in SAP Data Services (regardless of whether they support delta capabilities or not).
A full refresh of all the data in a table is obviously the simplest way to load data. For a full refresh, the setup of the batch job in SAP Data Services looks the same as it does for any other target system (Figure 10.11).
Batch Job Definition
Dataflow
ABAP Dataflow
SourceTable
Query 1TargetTable
SAPTransport
File Format
Query 2
Delete datafrom table
before loading
Figure 10.11 Batch Job Definition for Full Refresh of Data (from a Table)
The batch job definition just shown is for tables. For data source extractors, the definition is basically the same, except that for ODP-compatible data sources, no ABAP dataflow is required. This is illustrated in Figure 10.12. We won’t present the ODP-compatible data source batch job definitions for the other scenarios in this section. To modify a scenario for these data sources, the principle is always exactly the same.
Batch Job Definition
Dataflow
Data Source Query 1 TargetTable
Delete datafrom table
before loading
Init = Yes
Figure 10.12 Batch Job Definition for Full Refresh of Data (ODP-Compatible Data Source)
Personal Copy for RGA Rik Vriens, user id c3b3ffa0-d601-c76a-06ae-b5f2c05f5c4a

356
Data Provisioning10
In the target-based CDC mechanism, all data is loaded from the source, and a full table comparison is done in SAP Data Services to generate the delta records. This type of batch job will look almost the same as a full refresh; the only difference is the addition of a table comparison (Figure 10.13).
Batch Job Definition
Dataflow
ABAP Dataflow
SourceTable
Query 1TargetTable
SAPTransport
File Format
Query 2Table
Comparison
Figure 10.13 Batch Job Definition for a Target-Based CDC Feed
The other CDC mechanisms deserve some special consideration when you want to use them to feed an SAP HANA system. Remember that you’re populating simple tables in SAP HANA—there is no data activation mechanism, for example, like there is for data store objects (DSOs) in SAP NetWeaver BW. And, depending on the available change dates and so on for the records—and, for extractors, the delta mechanism of the extractor itself—it may be necessary to adjust the batch job definitions specifically for use with SAP HANA. The logic for generating the correct delta and mapping the correct insert, update, and delete operations needs to be implemented in SAP Data Services.
Using a timestamp-based CDC method for generating the delta to send to SAP HANA, for example, might look Figure 10.14.
Depending on exactly which timestamps are available in the source data, the design might change somewhat. The preceding example is for a source that has separate timestamps for new and changed records and is for tables with both inserts and updates in the source system. If the source table only gets new records (inserts only), the second dataflow (Dataflow 2) would simply be omitted.
© 2013 by Galileo Press Inc., Boston (MA)

357
ETL-Based Replication: SAP Data Services 10.3
SAP Data Services
Batch Job Definition
WorkflowScript: read
last TS
Status Table (LastTimestamp)
Dataflow 1 (Insert Records)
ABAP Dataflow
SourceTable (i)
Query 1(ii)
SAPTransport
File Format
SourceTable (i)
Query 3(ii)
SAPTransport
File Format
Query 2(iii)
Map CDCOperation (iv)
TargetTable
Script:update TS
Dataflow 2 (Update Records)
ABAP Dataflow
Read
update
(i) For this example: Source table must have, or be enhanced with, a TS for new records and a separate TS forchanged records.
(ii) Add the TS to both the Where and Order By tabs of the query definition.
(iii) Add columns for GeneratedSequenceNbr and Operation (=”I” for inserts, “U” for updates), plus repeatsettings of (ii).
(iv) Specify the columns created in (iii) as CDC columns.
Query 4(iii)
Map CDCOperation (iv)
TargetTable
Figure 10.14 Batch Job Definition for a Common Timestamp-Based CDC Data Feed
A source-based CDC method is the fastest way to load data using data source extrac-tors because, in this case, only the new and changed records are loaded from the source system to SAP Data Services. All that is required to prepare the delta for SAP HANA is to map the correct CDC operations (insert, update, delete). For an ODP-compatible extractor with delta recognition capability, the batch job definition would look like Figure 10.15.
Batch Job Definition
Dataflow
DatasourceInit = No
TargetTable
Query 1Map CDCOperation
Figure 10.15 Batch Job Definition for an Extractor with Delta Recognition (Source-Based CDC Mechanism)
Personal Copy for RGA Rik Vriens, user id c3b3ffa0-d601-c76a-06ae-b5f2c05f5c4a

358
Data Provisioning10
These are the basic batch job definitions that you work with for the different update scenarios to SAP HANA. Of course, you can enhance these with transformations as needed.
10.4 Log-Based Replication: Sybase Replication Server and Load Controller
If your source system is on IDM DB2 for LUW (Linux, UNIX, or Windows) as a database, log-based replication is an option. Remember that when you use this replication method, the mapping is a purely one-to-one affair. You must have con-fidence in your source system’s data quality, and the data must be usable as-is in the target SAP HANA system.
If these criteria are met, this replication method offers you high-performance, real-time replication. Given the combination of a pure 1:1 mapping and real-time replication, this method is most often used to satisfy detailed operation reporting requirements.
Figure 10.16 illustrates the software components required to use Sybase replica-tion to SAP HANA.
SAP System;e.g., ECC (Disk-Based)
SAP HANA
Application/Transaction
Commit
Databaselog files
Databasetables
Replication Agent (RA)
data
metadatadata +
metadata
Replication Server (RS)
ECDA
generate SQL
Databasetables
execute SQL
delta
R3load
initialization
Load Controller(LC)
R3load
Figure 10.16 Log-Based Replication Software Components and Flows
The following are the components on the source system:
© 2013 by Galileo Press Inc., Boston (MA)

359
Log-Based Replication: Sybase Replication Server and Load Controller 10.4
EE Sybase Replication Agent (RA)
EE RA gets data from the database logs in raw format and combines it with meta-data from the database tables themselves to construct meaningful records to send to the target system.
EE RA runs on the accompanying Embedded Replication Agent System Database (ERASD), which is installed implicitly with RA.
EE Reading from the database logs satisfies the delta data feed requirements; any changes are captured and forwarded.
EE R3load R3load is an SAP component that is used for the initial loads to SAP HANA.
The following are the components on SAP HANA:
EE Sybase Replication Server (RS)
EE This is the target component where records sent by RA are received. Once received, RS generates the appropriate SQL statements needed to insert the data into the target tables on SAP HANA.
EE RS runs on the accompanying Embedded Replication Server System Database (ERSSD), again implicitly installed with RS.
EE Enterprise Connect Data Access (ECDA) This is the second Sybase software component that needs to be installed on SAP HANA. ECDA gets the generated SQL statements from RS and executes them on SAP HANA, inserting and updating records in the data tables as needed.
EE ECDA connects to the SAP HANA database to update data by using an Open Database Connectivity (ODBC) connection.
EE Sybase RS and ECDA together handle the delta records sent by RA.
EE R3load on the SAP HANA side This is the recipient of the initial loads from the corresponding R3load compo-nent on the source system, and it propagates the data to the SAP HANA database tables.
EE Load Controller (LC) This component pulls all of the functionality together. When a load is started from within Studio using this replication method, it invokes both R3load (for the initial data transfer) and RA (to start capturing changes). After the initial load has finished, it switches to a continuous data stream from RA instead, first
Personal Copy for RGA Rik Vriens, user id c3b3ffa0-d601-c76a-06ae-b5f2c05f5c4a

360
Data Provisioning10
catching up on changes made since the start of the initial load and then running on a continuous, real-time basis.
EE SAP host agent This is a prerequisite for the mechanism to work. It’s required for communica-tion between the systems.
10.4.1 Installation
Installation of the components is straightforward. Installation scripts are provided with the software to make it easy to do. The following are the high-level steps:
1. SAP HANA: Verify that SAP host agent is installed and running. This should be the case because the SAP host agent is automatically installed with the initial SAP HANA database install.
2. Source system: Verify that the host agent is installed. This should again already be the case, but depending on your release, you may need to upgrade the host agent component to version 7.20, which is the minimum required to work with this replication method.
3. SAP HANA: Install RS and ECDA. The software will arrive in an archive file format. After unpacking it, you need to configure a few small items and run the installation script.
4. Source system: Install RA. This software will also arrive in an archive file format. After unpacking it, you need to configure a few small items and run the instal-lation script.
5. SAP HANA: Install LC by unpacking the software and running the installation script.
6. Source system: Create a new directory to be used for the data export and patch R3load to the latest level if required.
After the installation, several configuration scripts need to be run to set up the connections between the systems. The scripts are provided by SAP.
1. Configure RS by entering the pertinent system information (SAP HANA host name, instance number, etc.) into a configuration file and then running the RS configuration script.
2. Create a user in the source system that can be used by RA to log on to DB2 so that it can monitor the logs and capture changes.
© 2013 by Galileo Press Inc., Boston (MA)

361
Direct Extractor Connection 10.5
3. Configure RA by entering the required system information into a text file and running the RA configuration script.
4. In SAP HANA, set up a password for communication of LC with the host agent.
5. In SAP HANA, create a target schema to hold the tables that will be replicated by Sybase.
6. Configure LC by entering parameters in a configuration file and running the LC configuration script. Because it’s LC that ties together all of the parts, there are quite a few parameters to enter here, covering information from hosts and ports, RS and RA, both the SAP HANA and source database systems themselves, and the target schema in SAP HANA, to name the most important ones.
7. Finally, start running LC on the SAP HANA server with the provided script.
10.4.2 Running Sybase Replication
There isn’t much to running Sybase replication. Remember that this is a pure one-to-one replication that, by definition, is a continuous stream. Ensure that you have the required metadata (table definitions) in SAP HANA to receive data.
The only thing to do to get it running is to log on to Studio, go to the Administra-tor perspective, and choose Data Provisioning. Using the Load function, select the schema and tables you want to start loading, and kick off the initial load. From here on out, LC takes over the process and both starts and completes the initial data transfer and starts the subsequent real-time replication stream.
10.5 Direct Extractor Connection
So far, all of the replication methods we’ve discussed require a separate software component between the source system and the target SAP HANA system. There is, however, also a way to load from SAP source systems directly into SAP HANA using the delivered SAP Business Content data sources originally developed for use with SAP NetWeaver BW. The SAP HANA Direct Extractor Connection (DXC) is a way to load data from an SAP source system to SAP HANA using existing data sources.
DXC is generally used most when you deploy SAP HANA for BW. Any current SAP NetWeaver BW system you have will certainly be making extensive use of these delivered data sources, and its storage objects (DSOs, InfoCubes, etc.) will have been modeled based on the information provided in the data sources, in the way
Personal Copy for RGA Rik Vriens, user id c3b3ffa0-d601-c76a-06ae-b5f2c05f5c4a

362
Data Provisioning10
it has been provided. Data sources often combine data from several tables and apply some application logic to the data to turn it into a logical entity (semantically enriched data) that is more easily consumed by SAP NetWeaver BW. Consequently, moving to SAP HANA for BW could involve a lot of work in remodeling the storage objects if you want to move, at the same time, to a table-by-table type of replica-tion. DXC allows you to keep all of the existing data models in place instead and feed the new SAP HANA database in the same way, using the same data sources in the source system, as you did before.
The solution is technically perfectly suited for use with any other SAP HANA sys-tem as well, but you should consider some important ramifications. The embed-ded SAP NetWeaver BW instance in your SAP source system will become less (or potentially entirely) unusable for reporting. On an architectural note, the lack of the most granular and complete data foundation (the original tables) may cause you significant rework in the future as you move more and more operational reporting to SAP HANA. The use case for DXC with an SAP HANA system based directly on a source SAP system also presents several benefits, however. It leverages existing development of extractor logic, provides semantically enriched data to SAP HANA, and leverages the delta capabilities of the extractors in data provisioning.
10.5.1 DXC Technology
DXC isn’t only a data provisioning technology, it also creates the necessary in-memory DSOs (IMDSOs) in the target SAP HANA system to store the data it sends. So DXC will deliver what is shown in Figure 10.17.
SAP Source System;e.g., ECC (Disk-Based)
SAP HANA
ApplicationTables
Data Source
Embedded BW
httpData Source
(BW)
IMDSO
Active Table
OtherTables
DXC encompasses thedata transfer, creation
of a target IMDSO,and its population
with data
Figure 10.17 Direct Extractor Connection (DXC)
© 2013 by Galileo Press Inc., Boston (MA)

363
Direct Extractor Connection 10.5
Let’s now look at the components of the DXC itself.
There are three ways to deploy DXC:
EE With an SAP source system on SAP NetWeaver version 7.0 or higher, using the embedded SAP NetWeaver BW system.
EE With an SAP source system on a version below SAP NetWeaver 7.0, using a side-by-side SAP NetWeaver BW system.
EE With an SAP HANA for BW system.
SAP Source System on SAP NetWeaver 7.0 or Higher
DXC uses the SAP NetWeaver BW functionality of the embedded SAP NetWeaver BW system that comes with SAP NetWeaver 7.0 and up; this is called the default configuration of DXC (Figure 10.18).
SAP System;e.g., ECC (Disk-Based)
SAP HANA
ApplicationTables
Data Source
StatusTables
Embedded BW
PSA
httpData Source
(BW)
DSO,InfoCube,
etc.
IMDSO
Active Table
OtherTables
X
User Exit
Figure 10.18 DXC Default Configuration
Of the embedded SAP NetWeaver BW system, only the source system and data source functionalities are used, together with the data load functions such as InfoPackages and process chains. No data storage at all takes place in this system, and it’s no longer possible to have the data in the Persistent Staging Area (PSA), in any DSO, or any InfoCube from the data sources that work with DXC. DXC will
Personal Copy for RGA Rik Vriens, user id c3b3ffa0-d601-c76a-06ae-b5f2c05f5c4a

364
Data Provisioning10
instead reroute the data to go directly from the data source in the SAP NetWeaver BW system, outside to the SAP HANA system.
SAP Source System on a Version Below SAP NetWeaver 7.0
If you’re on a release prior to SAP NetWeaver 7.0, it’s still possible to make use of DXC, but it requires a separate SAP NetWeaver BW system. This can’t be a “nor-mal” BW system that is used for reporting data; it can only serve the purpose of transferring data to SAP HANA. No DSOs, InfoCubes, and so on can be built in it. This is also called a “side-by-side” or “sidecar” implementation of SAP NetWeaver BW (Figure 10.19).
SAP System;e.g., ECC
(Disk-Based)
SAP HANA
ApplicationTables
Data Source
StatusTables
Separate BW System
PSA
httpData Source
(BW)
DSO,InfoCube,
etc.
IMDSO
Active Table
OtherTables
X
User Exit
Figure 10.19 DXC with Side-by-Side SAP NetWeaver BW Configuration
SAP HANA for BW System
The scenario where you use DXC with an SAP HANA for BW system can be thought of as a variant on the side-by-side scenario: from the data source in the source system, the data is transferred via HTTP to the remote SAP NetWeaver BW system. Once there, the BW functionality of loading it to PSA and up is bypassed, and instead the data is fed to an IMDSO in a regular SAP HANA schema (a non-BW schema), as shown in Figure 10.20.
© 2013 by Galileo Press Inc., Boston (MA)

365
Direct Extractor Connection 10.5
SAP System;e.g., ECC
(Disk-Based)
SAP HANA for BW
ApplicationTables
Data Source
StatusTables
PSA
httpData Source
(BW)
DSO,InfoCube,
etc.
IMDSO
Active Table
OtherTables
XUser Exit
BW Schema non-BW Schema
Figure 10.20 DXC Used with an SAP HANA for BW System
10.5.2 Important Considerations for the Use of DXC
The use of this technology to populate SAP HANA with data offers significant benefits in terms of leveraging existing development, both from SAP and in-house enhancements already in place to enrich the data source data with additional information. There are, however, a number of important things to keep in mind concerning this data provisioning method.
Transformations
One consequence of the DXC technology is that the only chance for transforma-tion of data is in the data source user exits of the source system. In the transferring SAP NetWeaver BW system, the data isn’t stored, so no layers of storage exist that make it possible to perform any transformation on the BW side; for example, in transfer rules or transformations.
The following is the flow of the data:
1. Data is extracted with the existing SAP Business Content data source.
2. The existing data source user exits are called as usual.
3. Data transfers to the embedded or side-by-side SAP NetWeaver BW system, or the SAP HANA for BW system.
Personal Copy for RGA Rik Vriens, user id c3b3ffa0-d601-c76a-06ae-b5f2c05f5c4a

366
Data Provisioning10
4. The data is received in that SAP NetWeaver BW system by the local data source replica.
5. It’s then immediately transferred via HTTP to the target schema in the SAP HANA system.
6. The data is received into an IMDSO in SAP HANA, so it first goes into the acti-vation queue.
7. Data activation takes place in the IMDSO in SAP HANA.
8. After data activation, the data is available in the active table of the IMDSO, which is then used in data models (attribute, analytic, and calculation views).
Data Source Exclusivity
Another very important consideration in the use of DXC is the mutual exclusive-ness of the data source use with the embedded SAP NetWeaver BW system or with DXC. The basic principle in all scenarios is that with the use of DXC for any given data source, the SAP NetWeaver BW dataflows in the transferring BW system are cut off. The transfer via DXC happens instead of the transfer to a BW PSA table in that system. There is no issue using the data sources with another SAP NetWeaver BW system; for example, a separate data warehousing BW that isn’t used in a DXC.
In the default configuration and the side-by-side scenarios:
EE Each data source can always be used with a target SAP NetWeaver BW system that is a separate database and instance and isn’t fed by a DXC, regardless of the use of the data source with DXC or not.
EE Each data source that is used with DXC can no longer be used to populate data in the transferring SAP NetWeaver BW system. For example, in the default con-figuration, when a data source is flagged in configuration for use with DXC, it can no longer be used by the embedded system.
In the SAP HANA for BW scenario:
EE Each data source used with DXC can no longer be used to feed BW dataflows in the SAP HANA for BW system.
EE DXC reroutes the data to non-BW schemas instead.
For example, the setup shown in Figure 10.21 is all right. As you can see, the use of DXC in its default configuration has no impact on the possible use of the same data sources for an external data warehousing SAP NetWeaver BW system.
© 2013 by Galileo Press Inc., Boston (MA)

367
Direct Extractor Connection 10.5
DSO,InfoCube,
etc.
SAP System;e.g., ECC (Disk-Based)
SAP HANA
ApplicationTables
Datasource
StatusTables
embedded BW
PSA
httpDatasource
(BW)
IMDSO
Active Table
OtherTables
X
User Exit
BW System(Disk-Based or on SAP HANA)
PSA
Data Source(BW)
DSO,InfoCube,
etc.
Figure 10.21 DXC and SAP NetWeaver BW Data Warehouse Both Using Data Sources
It’s important to understand the consequences of this concept and the options you have for configuring the data sources with DXC.
You have three configuration options:
EE GLOBAL: Global use of DXC.
EE All data sources are intended for use with DXC.
EE The embedded or side-by-side SAP NetWeaver BW system is disabled, so it will now only be able to transfer data to SAP HANA.
EE SYSTEM: You indicate which clients of the system are intended for use with DXC.
Personal Copy for RGA Rik Vriens, user id c3b3ffa0-d601-c76a-06ae-b5f2c05f5c4a

368
Data Provisioning10
EE All data sources can extract data from those clients for use with DXC only. For those clients, the embedded or side-by-side SAP NetWeaver BW system is disabled.
EE In the other clients, you can still use the embedded or side-by-side SAP NetWeaver BW functions to load data with the data sources.
EE DATASOURCE: You indicate specifically which individual data sources are to be used with DXC.
EE The data sources indicated for use with DXC can no longer be used in the embedded or side-by-side SAP NetWeaver BW system.
EE All other data sources, however, can still be used to transfer data to the embed-ded or side-by-side SAP NetWeaver BW system.
Primary Key Constraints
By definition, a data source that loads SAP HANA using the DXC loads its data to an IMDSO. The IMDSO is just like any other DSO or table in that it must have a primary key. This has some consequences for the use of the data sources. Before you implement this load mechanism, you must make sure that either the data source delivers a primary key definition, or that you can determine one yourself.
Effectively, the data source must be compatible with the overwrite-DSO concept from SAP NetWeaver BW, with the use of some combination of fields as the pri-mary key constraint.
Full Data Loads and Deleted Records
When using a data source that has delta capabilities, this isn’t a concern, but for data sources that only deliver full loads, you must consider the following: As of the current version of the product, by default, a full data refresh from a data source using DXC performs an update operation on the target table, but it doesn’t perform a drop first. In other words, records that were deleted in the source system will in that case not be deleted from the corresponding IMDSO in SAP HANA.
10.5.3 Preparing SAP HANA for Use with DXC
To use DXC to feed your SAP HANA system, a few preparatory steps are needed in SAP HANA:
© 2013 by Galileo Press Inc., Boston (MA)

369
Direct Extractor Connection 10.5
1. Enable the XS Engine and the ICM in SAP HANA.
EE The XS Engine is a slim HTTP server that uses XS technology to parse HTTP requests. The XS parser is a stateless parser that is used in a number of web server software designs, and it’s generally considered lightweight, fast, secure, and good in handling multipacket HTTP requests. SAP HANA includes an XS Engine that will handle the incoming data from the data source, which is sent using HTTP. Without this engine, the arriving HTTP requests can’t be parsed.
EE Both XS Engine and Internet Communication Manager (ICM) are enabled through Studio using the Administration perspective. In the configuration tab, look for the daemon.ini section, and ensure the sapwebdisp and xsengine services are running.
2. Import the delivery unit for DXC into SAP HANA.
EE A delivery unit is a group of items or objects that can be copied between SAP HANA systems. The delivery unit concept essentially replaces the transport request concept from other SAP systems such as SAP ERP or SAP NetWeaver BW.
EE The delivery unit for DXC must be provided to you by SAP; for example, through the SAP Service Marketplace.
3. Configure SAP HANA to work with DXC.
EE The XS Engine must know how to work with the DXC software. This is accom-plished by adding a new entry with the appropriate values as a parameter to xsengine.ini in Studio’s Administration perspective.
EE When this is done, the software is ready on the SAP HANA side. SAP provides a Python script that enables you to quickly test that all is working fine.
4. Create a DXC user in SAP HANA that will be used later by the source system to log on to SAP HANA for the transfer of the data. This user must have the roles PUBLIC and MONITORING.
5. Create a schema in SAP HANA where you want the data sent by data sources using DXC to be stored. It’s recommended to have one schema for each source system that uses DXC.
On the SAP HANA system, all is now ready. The software is in place, the necessary processes are running, and a user and target schema are ready for the data to be received.
Personal Copy for RGA Rik Vriens, user id c3b3ffa0-d601-c76a-06ae-b5f2c05f5c4a

370
Data Provisioning10
10.5.4 Preparing the Source System for Use with DXC
On the SAP source system side, there are also a number of steps to perform before data can be sent with DXC:
1. Create an HTTP connection to the SAP HANA server.
EE This is done in the same way as HTTP connections to any other server.
EE The connection should use the DXC user that was created on the SAP HANA system previously.
2. Configure the HTTP destination for the DXC.
EE This is done by making the appropriate entry in table RSADMIN on the source system.
3. Enter the setting for the use of data sources with DXC.
EE This is also done by making the appropriate entry in table RSADMIN.
EE The choices are GLOBAL, SYSTEM, and DATASOURCE, as explained when we discussed the data source exclusivity concept.
EE If you choose DATASOURCE, you have two extra steps to perform: maintain-ing a table in the source system with a list of which data sources are intended for exclusive use with DXC, and entering the name of that table in the RSAD-MIN table so that the software can find your list.
4. Tell the DXC which target schema it should load data to, and create IMDSOs in the target SAP HANA system.
EE This too is done by making the appropriate entry in table RSADMIN.
10.5.5 Loading Data to SAP HANA with DXC
With both the SAP HANA and the source system ready to work with DXC, you can now start loading data to SAP HANA:
1. Transfer the desired data sources from the Business Content version if this hasn’t already happened.
2. Replicate the data sources to the embedded SAP NetWeaver BW system as usual. This will create the data sources on the embedded system. You can now activate the data sources there.
© 2013 by Galileo Press Inc., Boston (MA)

371
Summary 10.6
3. It’s during the activation of the data sources in the embedded SAP NetWeaver BW system that the target IMDSOs are created in SAP HANA.
4. At this point, you can log on to SAP HANA and verify the IMDSO definition, particularly with regard to the primary key definition.
5. The embedded (or side-by-side) SAP NetWeaver BW system is used to schedule loads. The loads happen with InfoPackages and process chains as they would in any other SAP NetWeaver BW system, but the data will automatically be routed through the HTTP connection to the corresponding IMDSO in SAP HANA.
The monitoring of the loads happens for the most part in the embedded SAP NetWeaver BW system using the normal BW tools: the monitor in the Administrator Workbench of BW, and the process chain log views. The only part the embedded SAP NetWeaver BW system can’t monitor is the IMDSO data activation step in SAP HANA, which can be monitored using Studio instead.
10.6 Summary
You can provision your SAP HANA system with data in several ways. Each has its own technological components and its own strengths and limitations. With a wide field to choose from, you should learn about all of the options and consider both your short-term and long-term scope for data provisioning. Devise a strategy that allows you to leverage existing development and at the same time steers you toward the desired long-term layout of your system landscape.
We’ve given a short comparison of the different data provisioning options avail-able to you. SAP Landscape Transformation is a real-time data provisioning method that can be implemented quickly and is often the default choice for SAP source systems; on the other hand, it offers only limited transformation capabilities. SAP Data Services works with SAP HANA, but it doesn’t offer real-time feeds in gen-eral. However, for data that doesn’t require this or for data that requires extensive cleansing or other transformations, it’s the solution that offers the most. Sybase Replication Server is a highly specific solution that works with IBM DB2 for LUW sources to deliver simple one-to-one data replication in real time. Finally, DXC is available to leverage SAP Business Content data sources; the data feeds aren’t real time, but you can get highly enriched data into SAP HANA quickly using this method.
Personal Copy for RGA Rik Vriens, user id c3b3ffa0-d601-c76a-06ae-b5f2c05f5c4a

© 2013 by Galileo Press Inc., Boston (MA)

373
SAP HANA is basically a technical component. The general support concepts are similar to—and just as essential as—the management of other SAP environments. In this chapter, we look at the major administration tasks involved in maintaining, monitoring, and updating SAP HANA.
11 SAP HANA Administration
SAP HANA administration involves most of the regular administration tasks with which you’re probably already familiar. You’ll have to apply periodic software updates, add new users, maintain security roles for authorizations and authentications, and keep the environments in sync as other software and hardware updates are applied.
You’ll of course remember SAP HANA Studio from our in-depth coverage in Chapters 8 and 9. In this chapter, we give you a different view of Studio by focusing on the way it helps you perform specific administrative tasks. Before we dive into the details, you should first know that you can get an overview of your system by going to the Navigator pane in Studio and opening the System Information tab (Figure 11.1).
Figure 11.1 The SAP HANA System Information Tables
Personal Copy for RGA Rik Vriens, user id c3b3ffa0-d601-c76a-06ae-b5f2c05f5c4a

374
SAP HANA Administration11
Some of this information is only available in the System Information tab, but substantial amounts of information in these tables are also found in the editors and options that we cover in this chapter. You’ll learn about the major SAP HANA maintenance tasks and get an introduction to system monitoring, software updates, administration security, and ongoing support tasks for the environments.
11.1 Main Administration Tasks
Many administration activities for SAP HANA are performed via the Administra-tion Console. There are three ways to gain access to the Administration Console:
EE Go to Window, select Open Perspective, and then select the administrative console.
EE Select the perspective from the top-right corner of the screen.
EE Select the open Administration Console option on the Overview screen (Fig-ure 11.2).
Figure 11.2 Accessing the SAP HANA Administration Console in Studio
Each option will take you to the administration functions of Studio. In this section, we explain the most important administration activities that you’ll perform using the Administration Console and admin functions of SAP HANA.
© 2013 by Galileo Press Inc., Boston (MA)

375
Main Administration Tasks 11.1
11.1.1 Adding Systems
Systems can be added from the Administration Console (Figure 11.3).
Figure 11.3 Adding New Systems in SAP HANA
Go to the context menu on the left Navigator pane and click Add System. First, you’ll need to type in the hostname of the system you want to add and the instance number (i.e., “chana”, “00”). If the system is a distributed system, you’ll need to add the index server hostname (Figure 11.4).
Give it a logical description, so that you’ll recognize it in the future. You can also organize your systems in folders in the Navigator. If you do so, you’ll need to save them in the folder where you want them organized. You also enter your locale and select Next.
Personal Copy for RGA Rik Vriens, user id c3b3ffa0-d601-c76a-06ae-b5f2c05f5c4a

376
SAP HANA Administration11
Figure 11.4 Specifying System Parameters
Figure 11.5 Security Settings When Adding a New System
From a security standpoint, you now get a set of options. You can select the authen-tication type and add your user name and password (Figure 11.5), or you can select Connect using SSL (Secure Sockets Layer) for secured connections (data will be
© 2013 by Galileo Press Inc., Boston (MA)

377
Main Administration Tasks 11.1
encrypted when transmitted from the system). You can also select advanced proper-ties and define whether the system should automatically connect when SAP HANA detects a broken connection or is rebooted. You can also add database connection parameters in the URL if applicable.
Once completed, you can see if the connection is secure by validating the SSL cer-tificate. Select Validate SSL Certificate. You can override the system hostname if needed (i.e., with a valid certificate). Finally, you can use the user key store as the trust store if you’re using certificates from trusted issuers such as VeriSign and others. After these steps are completed, you’ll see the new system in the Navigator pane.
11.1.2 Exporting and Importing Systems
The admin functions also allow you to export a list of systems and connection set-tings from one SAP HANA system to another. This reduces the chance for manual errors and also makes the systems much easier to manage.
To export the systems, or folders, go to the main menu and select File and then Export. Look in the SAP HANA folder structure for Landscape, and click Next. From here, you can select the systems you want to export connections from and the target file location where you want to save the file with the system definitions to. Pay attention to where on the network you save it because you’ll need it again when you import the system definitions.
To import the systems, simply go to the main menu and select File and then Import. Look in the SAP HANA folder structure for Landscape, and click Next. Now you have to find the folder where you stored the export file in the preceding steps and simply select the file. This will import all system definitions that you exported and make sure that any connections that are working in one system also work across multiple SAP HANA platforms.
11.1.3 Viewing System Installation Details
To view the system installation details, you can click on the Help tab in the Admin-istration Console in Studio and go to About SAP HANA Studio in the submenu (Figure 11.6).
Personal Copy for RGA Rik Vriens, user id c3b3ffa0-d601-c76a-06ae-b5f2c05f5c4a

378
SAP HANA Administration11
Figure 11.6 Accessing SAP HANA Configuration Information
From the About SAP HANA Studio screen, select Installation Details (Figure 11.7).
Figure 11.7 Getting Installation Details
In the resulting set of tabs, go to the Configuration tab (Figure 11.8).
This provides you with all of the technical details of your SAP HANA system in a textual format. You can copy this information to the clipboard and paste it into Microsoft Word, Excel, or PowerPoint, or in support requests to your hardware vendor or SAP.
© 2013 by Galileo Press Inc., Boston (MA)

379
Main Administration Tasks 11.1
Figure 11.8 The Configuration Tab in SAP HANA Install
11.1.4 Administrator Editor and Diagnosis Mode
If a system isn’t running, you can open the Administration Editor, which opens by default in a diagnosis mode. This editor allows you to see the SQL statements that attempted to execute while the system was being started or stopped (informa-tion collected by the sapstartsrv connection).
You can read these files in the Administrator Editor even when the general sys-tem isn’t available. The Administrator Editor can be accessed at any time by an administrator by selecting the Admin button on the main menu and then selecting Open Diagnosis Mode from the dropdown list.
Personal Copy for RGA Rik Vriens, user id c3b3ffa0-d601-c76a-06ae-b5f2c05f5c4a

380
SAP HANA Administration11
11.1.5 Changing File Locations
Although not required, you can change the default locations of files such as log files and configuration files. This is maintained in the System Landscape Directory (SLD).
This is available under the Configuration tab in the Administrator Editor. Select the nameserver.ini configuration file, and then select Add Section to add a new section called sld. You may now add new parameters and change parameters in the name server configuration file that keeps track of your system directories. (For more information about this topic, see SAP Note 1018839.)
11.1.6 Changing Configurations
The configuration of your SAP HANA system is contained in configuration files. You can change some of the parameters in this file in the Administrator Editor. To see the file, you should select the Configuration tab and then select the file you want to edit (Figure 11.9).
Figure 11.9 SAP HANA Configuration Tab
For each row, you may select the Change option in the context menu and make modifications. If you modify a value, you’ll see a green mark next to the value that was changed. You can’t modify the values in columns that are marked with a minus sign. These values are set by the system and can’t be changed.
To change the global allocation of memory, open the global.ini file, and look in the Memorymanager area. Using the context menu, you can change the Global_Allo-cation_Limit for both hosts and the overall system.
You can always reset the configuration values you changed back to default values by selecting the file and selecting Delete in the context menu for the parameter. This will restore the default parameter value.
© 2013 by Galileo Press Inc., Boston (MA)

381
SAP HANA System Monitoring 11.2
11.1.7 Modifying the Administration Console
You can also change the Administration Console to fit your own needs by going to Studio and selecting Windows and then Preferences. Under Administration Console, you can now make your changes.
Changes may include restricting database display only to the user logged on and controlling how many catalog objects are retrieved initially. You can also control settings such as how frequently background saves are executed (i.e., to reduce loss of work in case of a failure), how to display null values, and how many tables are initially opened in the View Table Distribution options.
You also get access to global settings to control default dialog settings for opening diagnosis files for error analysis. This includes whether confirmation is required and whether the information dialog is displayed after deleting files or viewing trace files.
In the Results area, you can control how many bytes are returned to the results editor or a column, how many bytes are available in a zoom for LOB, and country-specific formatting of values. You can even control if the system appends values to a file when exporting the data, instead of overwriting it.
In the SQL area, you get detailed controls over how SQL statements are executed. These controls shouldn’t be changed by anyone except experts in SQL execution. Controls include cancellations of batch SQL statements if errors occur, log handling, and parameters for how and what data is displayed in the SQL Editor in Studio (i.e., start times, durations of SQL statements, and command separator character).
You can also set system preferences for displaying data in the table viewer and for templates based on the editor you currently have open. For example, in the SQL Editor, you can get autofill for template(s) and access these through [Ctrl]+[Space]. This allows you to rapidly select from a set of templates you frequently use in the SQL Editor.
11.2 SAP HANA System Monitoring
In Studio, you also find the System Monitoring tool. To access this tool, select the System Monitoring button on the main toolbar. You can find great overview information here that will help diagnose the state of the SAP HANA environment (Figure 11.10).
Personal Copy for RGA Rik Vriens, user id c3b3ffa0-d601-c76a-06ae-b5f2c05f5c4a

382
SAP HANA Administration11
Figure 11.10 The SAP HANA System Overview
First, in the General System Information section, let’s look at the Operational State of the system(s). This is indicated in green, yellow, or red. Green means that all services were started correctly, whereas yellow indicates that the sapstartsrv service did not start, or one of the other services is still in the process of starting. If you see a red operational state of a system, it means that either a Java Based Database Connection (JDBC) can’t be executed or one of the services is stopped.
In the Data section, the disk space used and available on the disk holding the data files is also displayed. Data disk utilization is measured in gigabytes. You can see how much space is used in the gray area of the bar displayed and the free space in the white area. You can also create thresholds and color-code the area based on your own parameters such as “if less than 500GB, make it yellow.” This will help you quickly see available space on systems.
This type of space monitoring is also available for discs holding log files and trace files, as well as for physical memory and virtual memory, all measured in gigabytes. More than 150–200% utilization of memory may indicate serious performance issues. SAP has stated that:
© 2013 by Galileo Press Inc., Boston (MA)

383
SAP HANA System Monitoring 11.2
“Physical memory is the actual physical RAM on the host machine. Virtual memory includes swap-space on disk. SAP HANA should always execute out of physical memory; a virtual memory size that is much larger than physical memory size is an indication of system performance degradation, possibly requiring the addition of memory” (SAP Admin Guide SPS04, p. 25).
In the CPU section, you’ll also see the CPU utilization of the system as a percent of max available. From the monitor, administrators can investigate when services were started, ended, first executed, and last executed, as well as see the hostname and operating system version of the SAP HANA system, and the software release version currently being used by the system.
11.2.1 Monitoring Disk Usage
SAP HANA copies the data in memory to disks on a periodic basis to assure that there is limited loss of data in case of a system failure. The data is stored in one volume per index server. If you run out of disk space, this feature can no longer be performed, so you need to make sure you always have enough disk space available. To help you, SAP HANA provides a disk space monitoring feature.
To access this feature, go to the Administrator Editor and the Volumes tab (Figure 11.11).
Figure 11.11 The Disk Volumes of SAP HANA
Personal Copy for RGA Rik Vriens, user id c3b3ffa0-d601-c76a-06ae-b5f2c05f5c4a

384
SAP HANA Administration11
Here you’ll find information about disk usage, free space, and logs stores on the disks. All measures are in megabytes. To diagnose the disk volume usage and per-formance in detail, file and volume level details are found under the Details for Volume of Service area (Figure 11.12).
Figure 11.12 Details of Disk Storage Areas
This displays I/O, buffer performance, sizes, and disk performance statistics.
11.2.2 Performance Monitoring
There is also a Performance tab in the Administrator Editor where you can find information on thread performance, runtimes, blocked threads, and which SQL statements are causing the most stress on the system (Figure 11.13).
Figure 11.13 The Performance Tab of SAP HANA
© 2013 by Galileo Press Inc., Boston (MA)

385
SAP HANA System Monitoring 11.2
In addition, you find query performance statistics for all compiled queries in the SQL plan cache, which you can use to decide which queries are candidates for elimination or which should be revisited for better design (i.e., nested SQL selects that can be costly). You also get information on resources consumed by tasks such as compression, merges of deltas (new records), logs, and more.
For Service Level Agreements (SLAs), you may consider using the system load history for key performance indicator (KPI) metrics. Here you find historical performance, loads, up-times, and memory usage. You can also compare the performance of one system against another.
11.2.3 Monitoring with Alerts
Alerts are a great way to keep track of your current and historical system perfor-mance. You can create your own alerts and have them emailed to you when triggered. You can set up alerts for when servers stop, disks are reaching critical capacity, or the system is experiencing high stress such as CPU bottlenecks.
Behind the scenes, the statistics server is collecting information about the system status and events and storing it inside SAP HANA. You can access key alert infor-mation in the Administrator Editor under the Overview tab, while the details are found under the Alerts tab.
You can display all of the alerts grouped under different time periods, or you can select only Current Alerts. If you do this, you’ll only see recent alerts that haven’t been resolved. To get the latest data, you’ll have to click Refresh periodically if you’re keeping this screen open.
11.2.4 Configuring Alerts
You can create your own alerts to help in monitoring the system performance in the Administrator Editor under the Alerts tab. To add a new alert, click Con-figure Check Settings, and enter the email information where you want the alert sent. It may be a good idea to create an email account called HANA_Administrator@your_company.com and send all emails to this address to enable future administrators to monitor the system separately from an individual email account. The SMTP port is normally 25, and the mail server must be added as well as the email address.
You can also click Modify Recipients and add email addresses for those who should receive alert notifications instead of targeting different alerts to specific email
Personal Copy for RGA Rik Vriens, user id c3b3ffa0-d601-c76a-06ae-b5f2c05f5c4a

386
SAP HANA Administration11
addresses. This is an optional step. If, instead, you want to target specific types of alerts to different emails, you can click Recipients Configuration for Specific Checks and add emails to each of the specific checks available in the list displayed.
Each alert has three specific thresholds for when the alert can be executed: high, medium, and low. You can define the value for each of these thresholds. For example, 80% for the alert “check disk space” can be coded as “high,” and automatic emails can be sent to the administrator if the disk utilization exceeds 80%. To define or change the thresholds, click on Configure Check Settings under the Alerts tab, and select the sub-tab called Configure Check Thresholds. You may now make any changes, and the color-coded alerts on the main Alerts tab will reflect your changes as well as trigger emails.
The last step is to schedule times when the alerts are checked to see if they are triggered. This is set by default to every six hours and once a day. To schedule start times, you click on Configure Check Settings under the Alerts tab and select the sub-tab called Configure Start Time on Check Intervals. You can now select the start time for the six hour checks and the daily checks for each section of the alerts.
11.2.5 Monitoring Services and Distributed Systems
The Landscape tab includes the Services sub-tab and the Configuration sub-tab (Figure 11.14).
Figure 11.14 System Landscape Services
© 2013 by Galileo Press Inc., Boston (MA)

387
SAP HANA System Monitoring 11.2
These tabs provide in-depth details about services, memory utilization, and system configurations. In the Services sub-tab, you’ll find the information listed in Table 11.1.
Detail Description
Host The hostname(s) where the services are running.
Detail Master and normal hosts for distributed systems.
Port Communication port between services.
Service For the host(s), shows the daemon, indexserver, nameserver, statistics server, preprocessor, and sapstartsrv.
Process ID The operating system ID for the process.
Start Time Start time of each service.
Active Red: the service isn’t running.
Yellow: the service is stopping or starting.
Green: the service is started.
Memory The memory usage of individual services and total for the server. Performance problems may occur if more than 150% of the physical memory is used (will start to use slower virtual memory). The maximum physical memory is shown as a mark in the middle of the graph.
Allocated Memory
Reserved memory for a service from the operating system.
Used Memory Used memory for a service (actual).
CPU Shows the CPU usage for a service and the overall CPU usage in bar form and details.
SQL Port The SQL connection port for a service.
Memory The total memory used, the virtual/physical memory available, and the total physical memory.
Table 11.1 Components of the Services Sub-Tab
You also get information about your distributed system configuration (if you’re using one) in the Configuration sub-tab. This tab provides the information shown in Table 11.2.
Personal Copy for RGA Rik Vriens, user id c3b3ffa0-d601-c76a-06ae-b5f2c05f5c4a

388
SAP HANA Administration11
Detail Description
Host Hostname.
Active Shows if the host is running.
Host status Shows if the host is running correctly.
Failover status Displays if host is standby or active.
Name server role (configured)
The role of the nameserver as it has been configured; i.e., master1, master2, or slave.
Name server role (actual)
The role the server is currently running as.
Index server role (configured)
The role of the index server as it has been configured, i.e., worker, indexserver, or standby.
Index server role (actual)
The role the server is currently running as.
Failover group In a failover, the server will attempt to hand over to a host in the group.
Storage Partition
Shows the number of the subdirectory mnt000 used under the DATA and LOG directory.
Table 11.2 Components of the Configuration Sub-Tab
11.2.6 Exporting and Importing Table Data and Definitions
You can export and import table data between systems and hosts. For row-based data tables, you can export the data in comma-delimited format (CSV). For column-based data tables, you can also choose a binary format. Binary formats tend to be smaller in size and also faster, but this option should only be used if you’re moving data tables between SAP HANA systems (i.e., from production to a development box).
To export tables, you first go to the Navigator pane in Studio, navigate to the table(s) you want data from, and select Export. This will take you to an Export Wizard that will guide you in the process of selecting tables and formats available. You can also choose to export only the table definitions (catalog) or include the data as well (catalog and data).
© 2013 by Galileo Press Inc., Boston (MA)

389
SAP HANA System Monitoring 11.2
Select where you want to store the file and how many threads you want to use for the export. The more threads you select, the faster the export will execute. How-ever, selecting too many threads may impact system performance for others, so keep it small (one to five) unless you do this on a large system, during off-times, or on systems with little usage. This will save the file where you specified in the format selected.
To import table(s) into SAP HANA from the file, simply go to the catalog in the Navigator pane in Studio and select Import. After entering the file path where the file is located, you can select the tables you want. You may have to type in the names of the tables if you’re using a remote host. The last import steps are to tell the system the format of the file (CSV or binary), and enter the threads to be used. The table is now automatically imported into your system and can be seen in the Navigator.
11.2.7 Monitoring Memory Usage
Memory in SAP HANA is used for a variety of purposes. First, the operating systems and support files are using memory. Second, SAP HANA has its own code and stack of program files that also consume memory. Third, memory is consumed by the column and row stores where data is stored. Finally, SAP HANA needs memory for its working space where computations occurs, temporary results are stored, and shared user memory consumption occurs.
In short, the physical memory is the maximum available, and some of this is used by the operating systems and files. The allocated limit is what is “given” to SAP HANA, and the remaining is free space. This is important because you’re using pre-allocations of memory pools, and you can’t rely on Linux operating system information for memory management. But there are many other ways to get this information.
In addition to the memory consumption and memory tracking information in the preceding sections, you can also obtain memory information using SQL statements. In the view M_Service_Memory, you can execute a set of predefined SQL state-ments provided by SAP, including that shown in Listing 11.1 through Listing 11.3.
Select round(sum(USED_FIXED_PART_SIZE +USED_VARIABLE_PART_SIZE)/1024/1024) AS “Row Tables MB” FROM M_RS_TABLES;
Listing 11.1 Total Memory Used by All Row Tables
Personal Copy for RGA Rik Vriens, user id c3b3ffa0-d601-c76a-06ae-b5f2c05f5c4a

390
SAP HANA Administration11
Select round(sum(MEMORY_SIZE_IN_TOTAL)/1024/1024) AS “Column Tables MB” FROM M_CS_TABLES;
Listing 11.2 Total Memory Used by All Column Tables
Select SCHEMA_NAME AS “Schema”, round(sum(MEMORY_SIZE_IN_TOTAL) /1024/1024) AS “MB” FROM M_CS_TABLES GROUP BY SCHEMA_NAME ORDER BY “MB” DESC;
Listing 11.3 Total Memory Used by All Column Tables in a Schema
For column tables, SAP HANA sometimes unloads columns that are infrequently used out of memory to free up space. This occurs when the allocated memory threshold is near the used capacity. So, when memory consumption is estimated, it’s important to look at all column tables, not just those currently loaded in memory. You can see all column table sizes in a schema by using the SAP provided SQL statement in Listing 11.4.
Select TABLE_NAME AS “Table”, round(MEMORY_SIZE_IN_TOTAL/1024/1024, 2) as “MB” FROM M_CS_TABLES WHERE SCHEMA_NAME = ‘SYSTEM’ ORDER BY “MB”DESC;
Listing 11.4 Total Memory by Column Tables in a Schema
By default, SAP HANA can pre-allocate up to 90% of the host’s physical memory. You can also set the allocation limit of memory. However, this is normally done by the installation vendor. Changing the value can be useful if you’ve bought a license for less than your current hardware capacity.
11.2.8 Moving Files for Load Balancing
You can periodically move files and file partitions for column tables to achieve better load balancing across hosts. To do this, you must first go to the Navigator pane in Studio and select the Table Distribution Editor. From here, you can see the catalog, schemas, and tables.
Select the object you want to display, and choose Show Table Distribution. You can also filter to a single host as needed. This will display the first 1,000 tables in the area you selected. If more are available, you’ll see a message box.
In the overview lists, you can now select any table you want to analyze, and the details are displayed in the Table Partition Details area. You can move the table
© 2013 by Galileo Press Inc., Boston (MA)

391
SAP HANA System Monitoring 11.2
to another host by right-clicking it and selecting Move table. If you want to move a partition instead of a table, you can select the partition instead and do the same. This may be very useful if you want to load-balance large tables across multiple hosts or consolidate the partitions to single hosts. For detailed recommendations on load balancing, see SAP Note 1650394 for large table management.
11.2.9 Fixing a Full Disk Event
If you run out of disk space, an event called “disk full” is triggered. This will show up on alerts and also suspend the use of the database. You’ll have to resolve this event before the system becomes available again.
To fix this, go to the Administrator Editor and the Volumes tab. Here you’ll find information about the disk usage under the option Show Storage. If the disk is full due to other files being stored (i.e., temporary staging files for data movement), you can delete these and mark the event as handled in the Overview tab, in the Disk Full Events link. This will stop the suspension of the database.
If all files that aren’t needed are removed, and the disk is still full, you’ll have to add additional disks before flagging the events as handled.
11.2.10 Support for Unresponsive Systems
If your system is unresponsive, and SQL statements can’t be executed, you can gather system information for support using a Python script provided by SAP. You’ll need to have system admin privileges to run this script.
To execute the script, navigate to the Python support directory …/exe/ python_support> python fullSystemInfoDump.py. This will create a ZIP file with system information that will be stored in the directory DIR_TEMP/system_dump. If you also want usage information, simply add the handle -h at the end of the command.
If you’re unsure of what your temporary directory is, you can find this informa-tion in the sapprofile.ini file, as well as obtaining it by typing hdbsrvutil -z | grep DIR_TEMP=.
The ZIP file contains value system information and can help SAP support in resolving issues related to your system. The content of the ZIP file will depend on whether the system can be reached by SQL or not. If SQL can’t be executed, the file will
Personal Copy for RGA Rik Vriens, user id c3b3ffa0-d601-c76a-06ae-b5f2c05f5c4a

392
SAP HANA Administration11
have mostly system configuration data, topology, and trace files. However, if SQL can be executed, the file will also have information about the system tables and views as well as system statistics that can be useful for SAP Support and Diagnostics.
11.3 Updates
In this section, we briefly discuss the two types of updates for SAP HANA: updates for the appliance itself, and updates for Studio.
11.3.1 Updating the SAP HANA Appliance
Systems that were installed with the SAP HANA unified installer can use the auto-mated update procedure. This requires that a backup is completed, data replication is suspended, and the business is made aware of the planned outage. You may want to do this on a quarterly basis set when other systems are scheduled for maintenance at the same time (i.e., holidays).
The Software Update Manager (SUM) for SAP HANA Support Package Stack (SPS) 3 and higher executes automatic updates of the Lifecycle Management perspective as part of self-update. So unless your hardware partner installed SUM as part of the install, you have to first install it from the SAP Marketplace before you can use it. It isn’t part of the base SAP HANA install.
During the install, it’s important to note that all archives, including SUMFORHANA, must be located in the same directory as the stack.xml file. Additional details on the release of SUM can be found in SAP Note 1545815. After the SUM is installed, you can choose to apply either SPSs that contains larger upgrades, or individual support packages based on your needs or upgrade schedule.
11.3.2 Updating SAP HANA Studio
You’ll periodically need to update the Studio software. You can choose to update the software automatically based on periodic updates with SUM, or you can execute the software update manually.
However, in both cases, you first need to point your SAP HANA system to the site from which updates are downloaded. You can do this by going to the main
© 2013 by Galileo Press Inc., Boston (MA)

393
Security and License Keys 11.4
menu and selecting Window. From here, select Preferences, Install/Update, and then Available Software Sites. Click Add. The site you add should be in the following format: http://<host_name>:<port_number>/tools/hdb.studio.update or file:////update_server/hdbstudio/repository/
To check for manual updates to Studio, you can go to the main menu and select Help and then Check for Updates (Figure 11.15).
Figure 11.15 Checking for Updates Manually
You’ll be notified immediately if another update is available. The system will then take you through the upgrade based on available components. After the site has been added, you can also set up automatic updates. To set up automatic upgrades, just go to the main menu and select Window. From here, select Preferences • Install/Update • Automatic Updates. You can now decide how frequently you want to apply automated updates.
11.4 Security and License Keys
In this section, we discuss the basics of what you need to know about managing security and license keys in SAP HANA.
11.4.1 System Privileges
The right to execute services and to access data and software components in SAP HANA is decided by the privileges and roles of database users (Figure 11.16).
Personal Copy for RGA Rik Vriens, user id c3b3ffa0-d601-c76a-06ae-b5f2c05f5c4a

394
SAP HANA Administration11
Figure 11.16 Granted Privileges in SAP HANA
The highest set of privileges is maintained in the system user called SYSTEM (Figure 11.17). This is a database user that should only be granted to a very few individuals. These users basically have access to do whatever they want. There are also internal system users such as _SYS-STATISTICS and SYS that are used by the system itself. You can’t log on using these database users.
An operating system administrator user was also created during install. You can log on with this user to stop or start a database, to execute recovery processes, to add new system privileges to a role, and to grant that role to a user. For more on setting up roles and granting access, see Chapter 7.
11.4.2 Authentication Security
There are two forms for authentication security: user authentication and external authentication. User authentication is referred to as an internal authentication that consists of validating a password with a user name.
© 2013 by Galileo Press Inc., Boston (MA)

395
Security and License Keys 11.4
Figure 11.17 System Privileges for Administrators
You can also use external authentication with Kerberos or through the Security Assertion Markup Language (SAML). When using Kerberos, the users in the key distribution center in Kerberos should be mapped to database users in SAP HANA. This is done by making the user principal name the external ID when creating or modifying the database user.
To use SAML, you need to have created a SAML identity provider first. For more information, see the Kerberos protocols on UPN mapping and the key distribution center, or the SAP HANA Database Security Guide.
11.4.3 Authorization Security
After the user identity has been established (authentication), the user has to be granted privileges to do something through authorizations. Users can be assigned
Personal Copy for RGA Rik Vriens, user id c3b3ffa0-d601-c76a-06ae-b5f2c05f5c4a

396
SAP HANA Administration11
privileges through a direct assignment, or they can inherit them through privileges assigned to roles.
Adding or Deactivating Users
To add users, go to the Navigator pane in Studio, and select the system you want to grant access to. Select the Catalog folder, and then the Authorization folder (Figure 11.18).
Figure 11.18 Adding a New User
Right-click on the User folder, and select New User. Give the user a distinct name following your corporate standards. If you have no standards, it’s advisable that you create them before adding users in the system. It can get really messy if you allow user names to be made up without any controls.
© 2013 by Galileo Press Inc., Boston (MA)

397
Security and License Keys 11.4
Select your authentication method (internal, Kerberos, or SAML), and assign roles, system, SQL, and/or analytical privileges. If you want the user to be able to also grant his privileges to other users, you can select the option Grantable to other users and roles. This option should only be used in rare cases where such author-ity to grant privileges are distributed (i.e., to different administrators in business units). For most organizations, this will be managed centrally instead. If you allow this, the user can grant his role to others (Figure 11.19).
Figure 11.19 Granting Roles to Users
Select Deploy to save the user definitions. You must have the privilege Role Admin to create new users or modify existing users.
To deactivate users, go to the Navigator pane in Studio, and select the system impacted. Select the Catalog folder, and then select the Authorization folder. Choose the Users folder, and select the user to be deactivated. In the User editor, you can now click on Deactivate User on the toolbar, and the user no longer has access to the system.
More options on SAP HANA security at the services and data level are maintained in the SAP Security Guide on SAP Marketplace and in SAP Notes 1598623 and 1514967.
Personal Copy for RGA Rik Vriens, user id c3b3ffa0-d601-c76a-06ae-b5f2c05f5c4a

398
SAP HANA Administration11
Adding and Modifying Roles
To add roles, go to the Navigator pane in SAP HANA studio, and select the system you want to grant access to. Select the Catalog folder and then the Authorization folder (Figure 11.20).
Figure 11.20 Adding New Roles from the Roles Folder
Right-click on the Roles folder, and select new Role. Give the role a distinct name following your corporate standards. If you have no standards, it’s advisable that you create them before adding roles in the system. It can get really messy if you allow role names to be made up without any controls.
After you’ve given the role a name, you can assign the SQL, analytical, package, or system privileges, and select Deploy to save the role definitions (Figure 11.21).
Figure 11.21 Grantable Privileges
© 2013 by Galileo Press Inc., Boston (MA)

399
Security and License Keys 11.4
You must have the privilege Role Admin to create new roles or modify existing roles.
Assigning Administration Roles and Privileges
For administrators, a set of privileges must be assigned so that they can do their jobs. This includes those privileges listed in Table 11.3.
Administration Privileges or Roles Administration Task Enabled
MONITORING This grants read-only access to the Administration Editor.
SERVICE ADMIN Under the Performance tab and sub-tab Threads, this grants the ability to cancel operations. In the Landscape tab, the ability to starts and stop database services is enabled.
MONITOR ADMIN With this, you can mark as handled any “disk full” events.
TRACE ADMIN This grants the ability to start and stop performance traces and delete trace files.
ROLE ADMIN This grants the ability to add new roles or modify existing roles.
USER ADMIN This grants the ability to add new users or modify existing users.
INIFILE ADMIN This controls the ability to configure database and SQL traces, change any configuration settings on the Configuration tab, or modify check settings in the Alerts tab.
SQL privilege SELECT for the SQL schema _SYS_STATISTICS
In the Overview and Alerts tabs, this grants the ability to view alert information.
System privilege DATA ADMIN; or CATALOG READ and SQL privilege ALTER for the respective table(s)
This allows you to move tables or partitions to other hosts in a distributed system.
System privileges EXPORT and IMPORT as well as SQL privilege INSERT and SELECT
These privileges allow you to import and export data tables.
Table 11.3 Administrator Privileges
Personal Copy for RGA Rik Vriens, user id c3b3ffa0-d601-c76a-06ae-b5f2c05f5c4a

400
SAP HANA Administration11
To have access to manage the resources in SAP HANA, you may need the Resource Admin privileges added to your role. This is found under the System Privileges tab in the role maintenance (Figure 11.22).
Figure 11.22 Granting Resource Admin to a Role
Database administrators also may need to see all schemas in the system. This is turned off by default through schema filtering. To gain access to all schemas, you need to go to the Navigator pane and select the respective system. Right-click the Catalog folder and select Filters. The Filter dialog box appears where you can select the option Display All Schemas and click OK. This imparts the users with the privileges Data Admin, Catalog Read, and System.
11.4.4 License Keys
There are two types of license keys. You can have temporary keys (typically 90 days) or permanent keys. To check your type of license keys and expiration dates,
© 2013 by Galileo Press Inc., Boston (MA)

401
Security and License Keys 11.4
right-click on a system in the Navigator pane in Studio, select Properties, and choose Licenses (Figure 11.23).
Figure 11.23 Checking License Keys
Permanent keys identify how much memory you’re licensed to use on the SAP HANA system. In addition, keys can be enforced or non-enforced. This means that if you have enforced keys, the SAP HANA system will shut down if you try to use the system for more memory than you’re licensed for (SAP grants a little extra memory consumption in reality before shutting down). If the system is shut down due to a license key violation, you can’t access the system via queries nor can the system be backed up. To see if your keys are enforced or not, take a look inside the license file. If you see “SWPRODUCTNAME=SAP-HANA,” your keys are not enforced. If you see “SWPRODUCTNAME=SAP-HANA-ENF,” your license keys are enforced (Figure 11.24).
Temporary License Keys
Most SAP HANA systems come with temporary license keys installed from the ven-dor, so you have to make sure you install permanent keys before the expiration of the temporary license keys. To do so, you’ll need to go the SAP marketplace (https://service.sap.com/support), log on with your credentials from SAP, and select Keys &
Personal Copy for RGA Rik Vriens, user id c3b3ffa0-d601-c76a-06ae-b5f2c05f5c4a

402
SAP HANA Administration11
Requests. If a permanent key expires, you’ll automatically be granted a 28-day extension to get new keys to avoid operational disruption to your organization.
Figure 11.24 Temporary License Key
Changes to license keys can only be made by administrators with the system privilege License Admin in their security role. More information on monitoring of license keys is found in SAP Note 1704499.
Permanent License Keys
If you first bought SAP HANA and it came with temporary license keys, simply go to the Studio Navigator pane and right-click on the system you want to man-age. Choose Properties, and then select Licenses. Administrators can also delete license keys in this area.
If you have a temporary license, you’ll see the system ID and hardware key under the Request License Key area. You’ll need this information when requesting the
© 2013 by Galileo Press Inc., Boston (MA)

403
Failover and High Availability 11.5
permanent keys on the SAP Marketplace website. SAP will send you the permanent license key file by email, and after you’ve downloaded it, you can go back to the Request License Key area and select Install License Key. After this, you select the file you downloaded from the email, and the key will automatically be installed.
11.5 Failover and High Availability
When you buy SAP HANA, you can buy additional hardware to be in a standby mode for failover in case the system experienced issues. You can keep the server running and be ready to take over at any time. However, in this cold standby mode, no SQL is executed on the system, and it may take a few minutes to restore if the primary system goes down.
Currently, you can assign up to three master servers as the nameservers and select one of these as the active server. The active server is assigned a master index server and a statistics server, while those in standby mode have none. If the active master nameserver fails, the system restores itself to any available standby masters and uses this system instead.
The index server keeps tracks of the directories in a volume where the files are located. If the index server fails, the nameserver will automatically try to restart it. This can take up to two to three minutes. If that fails, it looks for any standby index servers. The restore occurs by having the nameserver assign the volume to the standby index server, and after the process is complete, the system becomes available again.
Because the statistics server is stored on the nameserver, any failure of the statistics server triggers a nameserver failover. This will create a new statistics server on the new active nameserver, and the old statistics server is removed automatically.
Groups of failover systems can also be defined for each of the hosts to assure that preferred standby servers on the same hardware are used first. This helps restore the servers faster because less data and configurations may need to physically be moved on the network.
The setup of high availability and failover systems should be done by SAP Partners and hardware vendors to ensure the correct system sizing connectivity, provision-ing, and future support.
Personal Copy for RGA Rik Vriens, user id c3b3ffa0-d601-c76a-06ae-b5f2c05f5c4a

404
SAP HANA Administration11
11.6 Summary
While the SAP HANA administration tasks are numerous and executed by system administrators, security administrators, developers, and hardware vendors, it is important to have a basic understanding of the major functions you will need to know to successfully manage an SAP HANA system. In this chapter, we provided an introduction to some of these. Additional version specific administration tasks are outlined in SAP Notes that are updated when new releases and service packs are made available. You should periodically review these before embarking on system changes to your SAP HANA installation.
© 2013 by Galileo Press Inc., Boston (MA)

405
Appendices
A SAP HANA Rapid Deployment Solutions ................................ 407
B Pre-Configured Data Modeling Content for SAP HANA ......... 411
C The Authors ............................................................................. 419
Personal Copy for RGA Rik Vriens, user id c3b3ffa0-d601-c76a-06ae-b5f2c05f5c4a

© 2013 by Galileo Press Inc., Boston (MA)

407
A SAP HANA Rapid Deployment Solutions
SAP and its implementation partners have developed pre-configured Rapid Deploy-ment Solutions (RDS), which can be dropped into a standalone version of SAP HANA and jumpstart your SAP HANA development and solutions. For those of you who are traditional SAP NetWeaver BW people, think of SAP HANA RDS as a type of Business Content—though they are not exactly the same.
One of the differences between SAP HANA RDS and the SAP NetWeaver BW Busi-ness Content repository is that the SAP HANA RDS aren’t included with the SAP HANA license, and must be licensed individually and separately. Another differ-ence is that you likely won’t use only part of an RDS—like you can with Business Content. Because you have to pay for the RDS, you’ll want to get the full benefit of the solution, and, if it doesn’t fit your scenario, you’ll probably build from scratch.
There are two main RDS (as of this writing) that are of interest to the SAP customer base: the SAP HANA CO-PA RDS and the SAP HANA Operational Reporting RDS. Let’s take a look at each of these in a bit more detail.
A.1 SAP CO-PA Accelerator
This solution is geared at allowing for full visibility and analysis of cost and prof-itability aspects of huge volumes of data—faster and more efficiently than either the traditional SAP NetWeaver BW or SAP ERP-based CO-PA handles them today. Intended benefits of this solution include the following:
EE Perform real-time (or near real-time) profitability reporting and analysis on large data volumes.
EE Conduct ad hoc analysis of profitability data at any level of granularity, aggrega-tion, and perspective.
EE Run cost allocations at significantly faster processing times over standard pro-cesses available today.
EE Empower business users with easy self-service access to Profitability Analysis via the SAP Business Objects toolset.
Personal Copy for RGA Rik Vriens, user id c3b3ffa0-d601-c76a-06ae-b5f2c05f5c4a

408
SAP HANA Rapid Deployment SolutionsA
For those who are interested in learning more about how SAP positions this solution, full information can be found at http://www.sap.com/solutions/technology/in-memory-computing-platform/hana/overview/solutions/co-pa-accelerator/index.epx.
A.2 Operational Reporting RDS
The other popular and heavily evaluated RDS is Operational Reporting. This RDS can address areas for sales reporting, financial reporting, shipping reporting, pur-chasing reporting, and master data reporting.
As with the CO-PA RDS, the Operational Reporting RDS are built and offered by SAP. They offer a jumpstart to SAP HANA implementation by providing a quick solution to address common usability problems facing customers who are consid-ering SAP HANA.
SAP even offers a public implementation guide that can be reviewed and used to understand the steps that come in when implementing an RDS. This implementa-tion guide can be found at http://help.sap.com/saap/RDS_Cockpit/step-by-step-guide-iframe_preview.html#CRM_CRM701_EN_XX_Generic_Preview. The current price for this RDS from SAP can be found here: http://www.sap.com/solutions/rapid-deployment/hana-erp-operational-reporting/affordable-costs.epx. This published price is an estimate to implement the RDS with five reports—in as little as six weeks. Per SAP, this price does not include maintenance or other negotiated services or fees. SAP has also opened up the design, development, and marketing of accelerated solutions or RDS to its implementation partners. Implementation partners can become certified to work with SAP’s RDS and either become a certified implementer of the core RDS or create and develop their own SAP-verified offering in this area.
An RDS—and there are many more in development—offers a fixed scope at a fixed price with a fixed timeline. “You will get X in Y time for Z money.” The good news is that if your business need fits into these solutions neatly and completely, this might be a very good option for you. The challenge comes when your business need does not fit neatly and completely into these solutions, because then you are looking at custom development, and the concept of fixed scope, fixed budget, and fixed price no longer applies. The trick, therefore, is to fully evaluate the RDS that you are considering—realizing it’s a pay-to-play model unlike the Business Content model you might be used to—and make sure it has a good fit to your business requirement.
© 2013 by Galileo Press Inc., Boston (MA)

409
Summary A.3
With a good business fit, RDS might be a very good way to get a value-adding solu-tion quickly and at a cost-effective price point.
A.3 Summary
This appendix was merely a business-focused introduction to SAP HANA RDS. For a bit more technical information about RDS, as well as information on SAP HANA Rapid Marts and accelerators, please see Appendix B.
Personal Copy for RGA Rik Vriens, user id c3b3ffa0-d601-c76a-06ae-b5f2c05f5c4a

© 2013 by Galileo Press Inc., Boston (MA)

411
B Pre-Configured Data Modeling Content for SAP HANA
It isn’t always necessary to develop new data models with new views, procedures, SQL, or SQLScript code starting from scratch with just the base tables in SAP HANA. SAP offers pre-configured content for your SAP HANA system in a number of subject areas as Rapid Marts, accelerators, or Rapid Deployment Solutions (RDS).
B.1 SAP Business Objects Rapid Marts
If you have products from the SAP Business Objects portfolio, or have considered them, you’ve probably heard of Rapid Marts. A Rapid Mart is a prepackaged solution that includes the data models and dataflows (including transformations) required in SAP Data Services to extract data from SAP systems and prepare it for consump-tion in the SAP Business Objects frontend tools—along with the semantic layers, reports, and dashboards required to deploy it to the organization.
In the past, SAP Business Objects has developed a significant number of these packages for use with RDBMS, and now there are a number of Rapid Marts under development designed specifically to run on the SAP HANA database.
Rapid Marts contain the following:
EE ETL mappings for SAP Data Services
EE Data models to be deployed in SAP HANA
EE Reporting content, such as dashboards, SAP Business Objects Web Intelligence reports, and so on.
SAP Business Objects BI 4.0 has introduced support for access to the SAP HANA database as a source of data in Service Pack 4.
B.2 Accelerators
An accelerator is a standard solution that is delivered on SAP HANA to address specific needs in a small, well-defined subject area. Accelerators are intended to help you go live quickly, sometimes even in a matter of weeks, with useful content.
Personal Copy for RGA Rik Vriens, user id c3b3ffa0-d601-c76a-06ae-b5f2c05f5c4a

412
Pre-Configured Data Modeling Content for SAP HANAB
The accelerators often go beyond mere reporting of data as you’re used to it today and include components other than data models in SAP HANA. In fact, many accelerators offer both technical and functional innovations. The Material Led-ger accelerator, for instance, includes the possibility to enable the standard SAP NetWeaver Business Warehouse (BW) extractor for the material ledger to read from both SAP ERP and SAP HANA to speed up extraction of data from SAP ERP to an SAP NetWeaver BW (non-SAP HANA) system.
The SAP roadmap for accelerators and RDS classifies them in three broad categories:
EE Line of Business (LOB) solutions
EE Industry-specific solutions
EE Business analytics solutions
LOB solutions have a main focus on a specific business activity and contain both SAP ERP components (reporting and transactions) and SAP Business Objects BI components. The future for SAP HANA is moving to a system landscape where SAP HANA fully replaces the current disk-based databases, and the business applica-tions themselves will run directly on the in-memory database. For the time being, however, the SAP ERP system itself isn’t yet being migrated to run on top of SAP HANA as its sole persistent database. Instead, SAP HANA implementations are generally side by side with the SAP ERP system. A number of accelerators con-sequently address the most urgent and valuable areas in this type of side-by-side implementation, such as operational reporting and faster period-end closing in the financial area. They leverage SAP HANA primarily as a secondary database to complement the primary SAP ERP database.
Industry-specific accelerators aim to deliver high-performing solutions for very specific topics in an industry, such as the Financial Reporting accelerator for the Banking industry.
Finally, Business Analytics accelerators are focused mainly on BI in the way we usually understand it today. These will contain mostly data models for SAP HANA and reports and dashboards for SAP Business Objects.
Although it’s out of the scope of this book to go into detail on all the accelera-tors available, we will go over the Financial Accounting (FI) and Controlling (CO) accelerator as an example here to illustrate what you can expect from accelerators for SAP HANA.
© 2013 by Galileo Press Inc., Boston (MA)

413
Accelerators B.2
Example: Finance and Controlling Accelerator
The FI-CO accelerator is a good illustration of the different improvements that an accelerator can offer; it covers a number of solutions. In fact, technically four dif-ferent accelerators are presented as scenarios within this accelerator:
EE Financial Accounting accelerator
EE Controlling accelerator
EE Material Ledger accelerator
EE Production Cost accelerator
The Financial Accounting accelerator includes not only the General Ledger data (FI-GL) but also Asset Accounting (FI-AA), Special Ledger accounting (FI-SL), and Profit Center Accounting (EC-PCA).
For the FI portion, a number of existing reports in the SAP ERP system are made much faster with the use of SAP HANA, such as the financial statements. This type of improvement concerns existing SAP ERP reports. It doesn’t require the users to log on to a new tool (such as SAP Business Objects); rather, they can execute the same transactions as today in SAP ERP, but the reports will retrieve the data from SAP HANA instead of from the SAP ERP application tables. There is also a new GL Account Line Item Browser report, also accessed from SAP ERP, that provides access to detailed GL documents from SAP HANA using any number of selection criteria. In general, in many reports, the selection capabilities are also drastically improved (as opposed to many standard SAP ERP reports where only a limited number of predefined drilldown paths are supported).
Last but not least, a number of existing data sources can be enabled to pull data from SAP HANA. These are data sources typically used today to load data from SAP ERP to SAP NetWeaver BW for reporting, such as 0FI_GL_10 for the totals records of the leading ledger. This doesn’t mean that the SAP NetWeaver BW system con-nects directly to SAP HANA; rather, the BW system will still call the data source in the SAP ERP system, which in turn gets data from SAP HANA because this is much faster than getting it from the SAP ERP application tables.
The CO accelerator works along similar lines. A number of existing transactions in SAP ERP are sped up through the use of SAP HANA as a source for the data, and a number of new transactions are introduced, mostly to enable fast and detailed inquiries for CO line item data using a large number of possible selection criteria.
Personal Copy for RGA Rik Vriens, user id c3b3ffa0-d601-c76a-06ae-b5f2c05f5c4a

414
Pre-Configured Data Modeling Content for SAP HANAB
This accelerator goes further than just the transactions for reporting data, however. A number of transactions for accrual and overhead calculations in SAP ERP are also made faster by allowing them to get their data inputs from the SAP HANA database instead of the SAP ERP tables.
The Material Ledger accelerator then incorporates yet another type of improve-ment. In addition to faster SAP ERP reports and faster costing runs in its Costing Cockpit, this accelerator also provides two new virtual InfoProviders that can be used by SAP NetWeaver BW. Whereas the data sources in the FI area allow for faster extraction of data to SAP NetWeaver BW, the virtual InfoProviders can be used directly in BW and further in SAP Business Objects tools to write reports on. Depending on the volume of your data and the complexity of the reporting require-ments, this may enable you to eliminate extraction of this data to SAP NetWeaver BW entirely. Instead, you may be able to satisfy those reporting requirements with the virtual provider alone.
In the Production Cost accelerator, the improvements are again in the area of existing reports; a large number of these can now get their data from SAP HANA instead, drastically increasing their performance.
Note that it isn’t just standard SAP reports that can make use of the connection to SAP HANA to increase performance. Customer-defined reports that were created within the standard SAP framework are also accelerated by this solution; drilldown reports in Transaction FGI1, for example. Of course, custom ABAP reports have no way to make use of the SAP HANA system.
In summary, the FI-CO accelerator offers improvements in efficiency in several ways (Figure B.1):
EE Analytical content in SAP HANA
EE Faster reports in SAP ERP
EE More dynamic selection capabilities for SAP ERP reports
EE New SAP ERP reports
EE Faster processing in SAP ERP during period end closing
EE SAP ERP data sources readable from SAP HANA
EE Virtual providers for Material Ledger data for use in BW
© 2013 by Galileo Press Inc., Boston (MA)

415
Rapid Deployment Solutions B.3
ECC HANA
SLTReplication
Server
BW
Tables Tables
AnalyticalContent
New Reports
Existing Reports/Transactions
Datasources read
read
read
Datasources
Virtual Provider
BOBJ
Explorer, Webi,Dashboards, etc.
Figure B.1 FI-CO Accelerator Summary
This is all a lot more than data models in the Modeler portion of SAP HANA, and you’ll notice that we’ve avoided the comparison with the term “Business Content” in the discussion because this is inaccurate and doesn’t do the accelerators justice. The next steps for the SAP HANA database platform involve rewriting the applications themselves to run natively on SAP HANA as the primary persistent database. The SAP HANA technology in this respect offers much more than just a speed increase in data retrieval; it can be used to change the way applications run and activities are performed. Accelerators are the first step in that direction.
B.3 Rapid Deployment Solutions
From our discussion of accelerators, it’s clear that implementing them requires you to cover multiple bases:
EE Installation of an SLT Replication Server
EE Configuration in SAP ERP (e.g., to enable reports to run on SAP HANA data)
EE Implementing the software components themselves both on SAP ERP and on SAP HANA
Personal Copy for RGA Rik Vriens, user id c3b3ffa0-d601-c76a-06ae-b5f2c05f5c4a

416
Pre-Configured Data Modeling Content for SAP HANAB
Rapid Deployment Solutions (RDS) are packaged solutions that include all of the ele-ments required to go live quickly with one or more accelerators. RDS are offered by SAP for most of the accelerators, and typically include the following:
EE The necessary software for the accelerators
EE Project Management methodology and tools for a rapid deployment scenario
EE Documentation, training materials, training and knowledge transfer
EE Performance testing
EE Go-live and go-live support
Example: Operational Reporting RDS
The accelerator on which the Operational Reporting RDS is based is more specifi-cally focused on BI content; it contains data models for SAP HANA as well as SAP Business Objects reports. In the RDS, you can choose 5 reports among a list of 26 available reports to deploy quickly. The list covers multiple subject areas, as shown in Table B.1.
Dashboards Explorer Views
WebI Crystal Reports
Total
Finance 1 1 6 8
Sales 1 4 1 3 8
Purchasing 1 5 6
Shipping 1 1
Master Data
3 3
Total 26
Table B.1 High-level Overview of BI Content in the Operational Reporting RDS
Apart from RDS for the type of accelerators that we’ve already discussed, there are also RDS planned that focus specifically on SAP Business Objects reporting tools. These RDS and accelerators will deliver reports as well as dashboards. Examples are the accelerator and RDS for Retail Sales Analysis, those for HR Executive Reporting, and one for Predictive Analytics. These are generally referred to as RDS for Business Analytics, and a large number are on their way.
© 2013 by Galileo Press Inc., Boston (MA)

417
Rapid Deployment Solutions B.3
This type of content is still being developed by SAP, and new accelerators are being added frequently, so be sure to check what is available and what is planned for any subject area when you roadmap your SAP HANA implementation. Evaluate which accelerators and RDS will be of use to you and when they will become available, if they aren’t already. This is particularly important in the area of SAP HANA data modeling. It can help you avoid superfluous development (developing a custom solution that is later replaced by an accelerated solution) and rework in the future.
Personal Copy for RGA Rik Vriens, user id c3b3ffa0-d601-c76a-06ae-b5f2c05f5c4a

© 2013 by Galileo Press Inc., Boston (MA)

419
C The Authors
Dr. Berg has extensive experience in implementing in-memory solutions for SAP analytics in Europe and in the USA. In addition to his SAP HANA work at ComeritLabs and at clients, he has collaborated with IBM Labs in the testing and development of SAP HANA for BW solutions. He has also implemented many in-memory systems for Fortune 500 companies, and has managed over 50 SAP performance tuning engagements in the last 15 years. He is a frequent speaker at SAP conferences and is a professor with the SAP University Alliance at Lenoir-Rhyne University.
As part of the IBM Global Leadership Team for SAP Data and Analytics, Penny Silvia has extensive experience in implementing advanced and in-memory analytic solutions for SAP customers. She works closely with clients to help them understand and develop SAP HANA roadmaps, strate-gies, and implementation plans, as well as to identify data and analytic needs that can benefit from an in-memory solution. She is a frequent speaker at SAP conferences and is on the Advisory Board for multiple SAP publications.
Personal Copy for RGA Rik Vriens, user id c3b3ffa0-d601-c76a-06ae-b5f2c05f5c4a

© 2013 by Galileo Press Inc., Boston (MA)

421
A
Activation queue, 144Add as Attribute, 259Add as Measure, 259Ad hoc analysis, 29, 407Administration Console, 374Administration Editor, 379Administrator, 51Aggregate, 60Aggregation Engine, 141Alerts, 385Alias, 279
system proposal, 280Amount with Currency, 305Analytical Engine, 140Analytic views
adding a filter, 244adding descriptions, 243copying, 248creating, 237definition, 209
Android, 170Appliance, 47Attribute, 208Attributes
calculated, 281Attribute views
creating, 221definition, 208derived, 275time, 235types of, 223
Authentication security, 394Authorizations, 395
B
BI Consumer Services (BICS), 50, 114connection, 169
Big data, 29, 30, 36, 86
Bitmap indexes, 134Budgeting, 103Business analyst, 52Business analytics, 84Business Content, 76Business intelligence
strategy and roadmap, 79BWA, 74, 92, 143
hardware, 91
C
Cache, 90Calculation Engine, 141Calculation scenario, 143Calculation views
creating (graphical method), 249creating (SQL method), 261definition, 209
Catalog, 216CE function, 268Changing file locations, 380Cisco, 138Classify, 184Client-dependency, 292
variable $$client$$, 297Cognos, 50Column-based index, 135Combination settings
creating, 196Combine, 196Compose, 192Compressed request, 144Configuration, 380Configuration sub-tab, 387Content, 217Controller module, 340Conversion checkbox
enable, 305CO-PA, 113CPU utilization, 383
Index
Personal Copy for RGA Rik Vriens, user id c3b3ffa0-d601-c76a-06ae-b5f2c05f5c4a

422
Index
Currency conversion, 304failure options, 306table, 305
D
Database migration, 61Database users, 394Data cleansing, 184Data disk utilization, 382Data foundation output, 245Data Foundation tab, 242Data governance, 30Data integrity, 30Data loading, 44
faster, 72Data modeling, 56, 64Data provisioning, 325
technical considerations, 335strategic considerations, 328
Data scope, 30Data storage, 59Data Summary view, 183Data transfer process (DTP), 143Data transformation, 44Data volume, 30Decimal shifts checkbox
enable, 306Default client
default model parameter, 296view-specific, 294
Default session client, 292, 308Dell, 138Development, 54Diagnosis mode, 379Dictionary compression, 136Dimensional Data Modeling, 145Direct Extractor Connection, 361
data source exclusivity, 366data transformation, 365default configuration, 363preparing SAP HANA, 368preparing source system, 370primary key constraints, 368SAP HANA for BW configuration, 364side-by-side configuration, 364
Disaster recovery, 62Disk Full Events, 391Disk space monitoring, 383Domain fixed value, 298Do something faster, 67, 71, 74Do something new, 67, 68, 74DSO object, 73Duplicate field references, 278
E
EarlyWatch report, 123Enterprise Connect Data Access (ECDA), 359Enterprise information management (EIM), 53Ethernet connection, 139ETL, 43, 56, 76ETL-based replication, 327, 349
configuration, 350Export and import table data, 388Export file, 377Export Wizard, 388Extract, transform, and load (see ETL)
F
Failover, 403Field description, 232Filter, 290
constraint filter, 290Formula
validate, 283Fujitsu, 138
G
Generate select statement, 263GTK2, 132
H
HANA Unified Installer, 133Help tab, 377Hewlett-Packard, 138
© 2013 by Galileo Press Inc., Boston (MA)

423
Index
Hierarchy, 309leveled, 310parent-child, 314
High availability, 403Highly detailed data, 72
I
IBM, 138Information Composer, 173
changing values, 186merging values, 184previewing data, 179saving data, 190uploading data to SAP HANA, 180
Information Design Tool (IDT), 164Information view, 173Infrastructure and operations, 52In-memory computing, 23, 24In-Memory Computing Engine, 119Input parameter, 299
currency, 307static list, 302
Installation, 377Integrated Management Module, 139Internal software component, 131Inventory cube, 144
J
Java Runtime Environment, 132Join properties, 226
K
Kerberos, 395Key attribute, 231Key figures
calculated, 140non-cumulative, 143restrictive, 140
L
License keys, 400temporary, 400, 401
Linux SUSE, 140Load balancing across hosts, 390Load Controller, 358Log-based replication, 327, 358Logical View tab, 242Log storage, 59
M
Manage Fields, 202Manual mapping, 198Map by Field Name, 256Massive parallel processing (MPP), 57, 141MaxDB, 31MDX, 50, 114, 120Measures, 208
calculated, 287linking with currencies, 308restricted, 284type, 305
Memory consumption, 389Microsoft query, 168Microsoft Silverlight, 176Model references
checking, 319Model validation, 317Model validation or activation
checking errors, 233M_Service_Memory, 389My Data screen, 203My Information Views screen, 204
N
Navigator, 213Network Time Protocol (NTP), 132Non-SAP BI tool, 50
Personal Copy for RGA Rik Vriens, user id c3b3ffa0-d601-c76a-06ae-b5f2c05f5c4a

424
Index
O
Open and Java Database Connections (ODBC/JDBC), 155
Open database object (ODBO) and MDX, 164Operational data store (ODS), 145Optimized DSO, 141Output
defining, 231Output parameter
SQL view, 264
P
Performance tab, 384Permanent keys, 401Perspective, 207
customizing, 320opening, 217
Physical memory, 383, 389Plug and play, 47Power user, 62Pre-configured content, 411Preferences (Window), 317Publish, 191
Q
QlikView, 24QPI port, 139Query performance statistics, 385Quick Launch, 218Quick Sizer for SAP HANA, 121Quick sizing rules, 126
R
R3load, 359RAM, 59Rapid Deployment Solutions (RDS), 68, 407,
416Rapid Mart, 411RDS
CO-PA, 408
Read module, 340Real time, 69Real-time replication, 343Real-time reporting, 407Reduced cost of development, 72Replication, 326
ETL-based, 349log-based, 358trigger-based, 338
Report performance, 71RICEF, 101Roles, 398
administration, 399
S
SAP accelerator, 411Finance and Controlling, 413
SAP BusinessObjects Analysis, 151SAP BusinessObjects BI, 59, 64, 411SAP BusinessObjects Dashboards (Xcelsius),
148SAP BusinessObjects Explorer, 150SAP BusinessObjects Web Intelligence, 149SAP Crystal Reports, 153SAP Data Services, 55
data update mode, 354metadata replication, 351overview, 327
SAP HANA, 23, 31, 67, 79, 84, 89project phases, 56, 65updating, 392
SAP HANA 2.0 (see SAP HANA for BW), 57
SAP HANA course, 106SAP HANA for BW, 40, 48, 57, 59, 60, 62, 63,
67, 71, 73, 75, 77, 89, 91, 94, 97, 325, 361, 362, 363, 364, 365, 366
SAP HANA-optimized DSO, 141SAP HANA-optimized InfoCube, 141SAP HANA standalone version, 43, 44, 45, 47,
48, 51, 55, 56, 64, 67, 69, 74, 75, 76, 89, 113, 129, 164, 325, 332, 339
SAP HANA Studio, 40, 207updating, 392versus Information Composer, 174
© 2013 by Galileo Press Inc., Boston (MA)

425
Index
SAP Landscape Transformation, 326, 338administration, 343configuration, 342data transformation, 348filtering data, 345installation, 338overview, 326replication frequency, 342selective table replication, 345special filter rule for client, 349
SAP liveCache, 31SAP LT Replication Server (see SLT)SAP NetWeaver Business Warehouse
Accelerator (see BWA)SAP NetWeaver BW, 43, 44, 47, 57, 71, 77,
89, 1127.3 Unicode, 59aggregates, 44cubes, 57, 76data model, 44
SAP Solution Manager, 123Schedule by Interval, 343Schedule by Time, 343Schema, 216Schema for Conversion, 239Secured Sockets Layer, 376Security
users and authorizations, 62Security Assertion Markup Language, 395Server, 59Service Level Agreements, 385Services sub-tab, 387Share data with other users, 190Sizing, 120SLT, 53, 55, 64
load, 344log table, 340replicate, 344resume, 344stop, 344suspend, 344
Smaller database, 72Snowflakes, 145Software Logistics toolset (SL), 133Software Update Manager (SUM), 133SP04, 50SQL, 50, 114, 260
SQL Engine, 141SQLScript, 260
common commands, 269Staffing, 104Star schema, 145Studio
adding a system, 214SUMFORHANA, 392SUSE Linux Enterprise Server, 59Sybase Replication Agent, 359Sybase Replication Server, 120, 358
installation, 360overview, 327
Sybase Unwired Platform, 171Syslogd, 132System definitions
importing, 377System Monitoring, 381System Privileges, 393
T
Table joinsdefining, 225
Tools palette, 253Total cost of ownership (TCO), 80, 99Training plan, 106Transformational opportunity, 72TREX, 31T-shirt sizing, 127
U
Unicode, 132Unified installer, 392Unresponsive systems, 391Unstructured data, 41Upload, 180
with column headers, 183
V
Validate, 233Value-driven transformations, 82
Personal Copy for RGA Rik Vriens, user id c3b3ffa0-d601-c76a-06ae-b5f2c05f5c4a

426
Index
Variables, 299attribute value variable, 300
Versioning, 318Views, 246
adding attribute views in analytic views, 246
W
WebFocus, 50Where-used list, 319Write module, 340
X
x3950, 139XS Engine, 369XULRunner, 132
© 2013 by Galileo Press Inc., Boston (MA)


Service Pages
The following sections contain notes on how you can contact us.
Praise and Criticism
We hope that you enjoyed reading this book. If it met your expectations, please do recommend it, for example, by writing a review on http://www.sap-press.com. If you think there is room for improvement, please get in touch with the editor of the book: [email protected]. We welcome every suggestion for improve-ment but, of course, also any praise!
You can also navigate to our web catalog page for this book to submit feedback or share your reading experience via Facebook, Google+, Twitter, email, or by writing a book review. Simply follow this link: http://www.sap-press.com/H3256.
Supplements
Supplements (sample code, exercise materials, lists, and so on) are provided in your online library and on the web catalog page for this book. You can directly navigate to this page using the following link: http://www.sap-press.com/H3256. Should we learn about typos that alter the meaning or content errors, we will provide a list with corrections there, too.
Technical Issues
If you experience technical issues with your e-book or e-book account at SAP PRESS, please feel free to contact our reader service: [email protected].
i

ii
About Us and Our Program
The website http://www.sap-press.com provides detailed and first-hand information on our current publishing program. Here, you can also easily order all of our books and e-books. For information on Galileo Press Inc. and for additional contact options please refer to our company website: http://www.galileo-press.com.

iii
Legal Notes
This section contains the detailed and legally binding usage conditions for this e-book.
Copyright Note
This publication is protected by copyright in its entirety. All usage and exploitation rights are reserved by the author and Galileo Press; in particular the right of repro-duction and the right of distribution, be it in printed or electronic form.
© 2012 by Galileo Press Inc., Boston (MA)
Your Rights as a User
You are entitled to use this e-book for personal purposes only. In particular, you may print the e-book for personal use or copy it as long as you store this copy on a device that is solely and personally used by yourself. You are not entitled to any other usage or exploitation.
In particular, it is not permitted to forward electronic or printed copies to third parties. Furthermore, it is not permitted to distribute the e-book on the Internet, in intranets, or in any other way or make it available to third parties. Any public exhibition, other publication, or any reproduction of the e-book beyond personal use are expressly prohibited. The aforementioned does not only apply to the e-book in its entirety but also to parts thereof (e.g., charts, pictures, tables, sections of text).
Copyright notes, brands, and other legal reservations as well as the digital watermark may not be removed from the e-book.
Digital Watermark
This e-book copy contains a digital watermark, a signature that indicates which person may use this copy. If you, dear reader, are not this person, you are violating the copyright. So please refrain from using this e-book and inform us about this violation. A brief email to [email protected] is sufficient. Thank you!

iv
Trademarks
The common names, trade names, descriptions of goods, and so on used in this publication may be trademarks without special identification and subject to legal regulations as such.
All of the screenshots and graphics reproduced in this book are subject to copyright © SAP AG, Dietmar-Hopp-Allee 16, 69190 Walldorf, Germany. SAP, the SAP logo, mySAP, mySAP.com, SAP Business Suite, SAP NetWeaver, SAP R/3, SAP R/2, SAP B2B, SAPtronic, SAPscript, SAP BW, SAP CRM, SAP EarlyWatch, SAP ArchiveLink, SAP HANA, SAP GUI, SAP Business Workflow, SAP Business Engineer, SAP Business Navigator, SAP Business Framework, SAP Business Information Warehouse, SAP interenterprise solutions, SAP APO, AcceleratedSAP, InterSAP, SAPoffice, SAPfind, SAPfile, SAPtime, SAPmail, SAP-access, SAP-EDI, R/3 Retail, Accelerated HR, Acceler-ated HiTech, Accelerated Consumer Products, ABAP, ABAP/4, ALE/WEB, Alloy, BAPI, Business Framework, BW Explorer, Duet, Enjoy-SAP, mySAP.com e-business platform, mySAP Enterprise Portals, RIVA, SAPPHIRE, TeamSAP, Webflow, and SAP PRESS are registered or unregistered trademarks of SAP AG, Walldorf, Germany.
Limitation of Liability
Regardless of the care that has been taken in creating texts, figures, and programs, neither the publisher nor the author, editor, or translator assume any legal respon-sibility or any liability for possible errors and their consequences.