
Sahu_umd_0117E_17007.pdf - UMD DRUM
293
ABSTRACT Title of dissertation: DATA DRIVEN APPROACHES TO IDENTIFY DETERMINANTS OF HEART DISEASES AND CANCER RESISTANCE Avinash Das Sahu, Doctor of Philosophy, 2016 Dissertation directed by: Professor Sridhar Hannenhalli Department of Computer Science Cancer and cardio-vascular diseases are the leading causes of death world-wide. Caused by systemic genetic and molecular disruptions in cells, these disorders are the manifestation of profound disturbance of normal cellular homeostasis. People suffering or at high risk for these disorders need early diagnosis and personalized therapeutic intervention. Successful implementation of such clinical measures can significantly improve global health. However, development of effective therapies is hindered by the challenges in identifying genetic and molecular determinants of the onset of diseases; and in cases where therapies already exist, the main challenge is to identify molecular determinants that drive resistance to the therapies. Due to the progress in sequencing technologies, the access to a large genome-wide biolog- ical data is now extended far beyond few experimental labs to the global research community. The unprecedented availability of the data has revolutionized the ca- pabilities of computational researchers, enabling them to collaboratively address the long standing problems from many different perspectives. Likewise, this thesis
-
Upload
khangminh22 -
Category
Documents
-
view
0 -
download
0
Transcript of Sahu_umd_0117E_17007.pdf - UMD DRUM

ABSTRACT
Title of dissertation: DATA DRIVEN APPROACHES TOIDENTIFY DETERMINANTS OFHEART DISEASES AND CANCER RESISTANCE
Avinash Das Sahu, Doctor of Philosophy, 2016
Dissertation directed by: Professor Sridhar HannenhalliDepartment of Computer Science
Cancer and cardio-vascular diseases are the leading causes of death world-wide.
Caused by systemic genetic and molecular disruptions in cells, these disorders are
the manifestation of profound disturbance of normal cellular homeostasis. People
suffering or at high risk for these disorders need early diagnosis and personalized
therapeutic intervention. Successful implementation of such clinical measures can
significantly improve global health. However, development of effective therapies is
hindered by the challenges in identifying genetic and molecular determinants of the
onset of diseases; and in cases where therapies already exist, the main challenge is
to identify molecular determinants that drive resistance to the therapies. Due to
the progress in sequencing technologies, the access to a large genome-wide biolog-
ical data is now extended far beyond few experimental labs to the global research
community. The unprecedented availability of the data has revolutionized the ca-
pabilities of computational researchers, enabling them to collaboratively address
the long standing problems from many different perspectives. Likewise, this thesis
tackles the two main public health related challenges using data driven approaches.
Numerous association studies have been proposed to identify genomic variants
that determine disease. However, their clinical utility remains limited due to their
inability to distinguish causal variants from associated variants. In the presented
thesis, we first propose a simple scheme that improves association studies in su-
pervised fashion and has shown its applicability in identifying genomic regulatory
variants associated with hypertension. Next, we propose a coupled Bayesian re-
gression approach – eQTeL, which leverages epigenetic data to estimate regulatory
and gene interaction potential, and identifies combinations of regulatory genomic
variants that explain the gene expression variance. On human heart data, eQTeL
not only explains a significantly greater proportion of expression variance in sam-
ples, but also predicts gene expression more accurately than other methods. We
demonstrate that eQTeL accurately detects causal regulatory SNPs by simulation,
particularly those with small effect sizes. Using various functional data, we show
that SNPs detected by eQTeL are enriched for allele-specific protein binding and hi-
stone modifications, which potentially disrupt binding of core cardiac transcription
factors and are spatially proximal to their target. eQTeL SNPs capture a substantial
proportion of genetic determinants of expression variance and we estimate that 58%
of these SNPs are putatively causal.
The challenge of identifying molecular determinants of cancer resistance so
far could only be dealt with labor intensive and costly experimental studies, and in
case of experimental drugs such studies are infeasible. Here we take a fundamentally
different data driven approach to understand the evolving landscape of emerging re-

sistance. We introduce a novel class of genetic interactions termed synthetic rescues
(SR) in cancer, which denotes a functional interaction between two genes where a
change in the activity of one vulnerable gene (which may be a target of a cancer
drug) is lethal, but subsequently altered activity of its partner rescuer gene restores
cell viability. Next we describe a comprehensive computational framework –termed
INCISOR– for identifying SR underlying cancer resistance. Applying INCISOR to
mine The Cancer Genome Atlas (TCGA), a large collection of cancer patient data,
we identified the first pan-cancer SR networks, composed of interactions common
to many cancer types. We experimentally test and validate a subset of these in-
teractions involving the master regulator gene mTOR. We find that rescuer genes
become increasingly activated as breast cancer progresses, testifying to pervasive
ongoing rescue processes. We show that SRs can be utilized to successfully predict
patients’ survival and response to the majority of current cancer drugs, and impor-
tantly, for predicting the emergence of drug resistance from the initial tumor biopsy.
Our analysis suggests a potential new strategy for enhancing the effectiveness of ex-
isting cancer therapies by targeting their rescuer genes to counteract resistance.
The thesis provides statistical frameworks that can harness ever increasing
high throughput genomic data to address challenges in determining the molecular
underpinnings of hypertension, cardiovascular disease and cancer resistance. We
discover novel molecular mechanistic insights that will advance the progress in early
disease prevention and personalized therapeutics. Our analyses sheds light on the
fundamental biological understanding of gene regulation and interaction, and opens
up exciting avenues of translational applications in risk prediction and therapeutics.

DATA DRIVEN APPROACHES TO IDENTIFY DETERMINANTSOF HEART DISEASES & CANCER RESISTANCE
by
Avinash Das Sahu
Dissertation submitted to the Faculty of the Graduate School of theUniversity of Maryland, College Park in partial fulfillment
of the requirements for the degree ofDoctor of Philosophy
2016
Advisory Committee:Professor Sridhar Hannenhalli, Chair/AdvisorProfessor Eytan Ruppin, Co-AdvisorProfessor Laura ElnitskiProfessor Hector Corrada BravoProfessor Michael Cummings

c© Copyright byAvinash Das Sahu
2016

ii

Contents
iii
1 Introduction 11.1 How does a cell function? . . . . . . . . . . . . . . . . . . . . . . . . 11.2 How does a cell produce proteins? . . . . . . . . . . . . . . . . . . . . 21.3 How can same DNA give rise to drastically different cells? . . . . . . 41.4 How do eukaryotes regulate genes in a cell-type specific manner? . . 61.5 Biological processes performed by genes . . . . . . . . . . . . . . . . . 81.6 Disruption of biological processes causes diseases . . . . . . . . . . . 9
1.6.1 Mutation . . . . . . . . . . . . . . . . . . . . . . . . . . . . . 91.6.2 Coding mutation . . . . . . . . . . . . . . . . . . . . . . . . . 101.6.3 Non-coding mutation . . . . . . . . . . . . . . . . . . . . . . . 10
1.7 Heritable mutation disorder . . . . . . . . . . . . . . . . . . . . . . . 121.7.1 Expression quantitative trail loci (eQTL) . . . . . . . . . . . . 131.7.2 Genome wide association studies (GWAS) . . . . . . . . . . . 141.7.3 Limitation of association studies . . . . . . . . . . . . . . . . . 141.7.4 How to improve association studies? . . . . . . . . . . . . . . 16
1.8 Somatic mutation disorder . . . . . . . . . . . . . . . . . . . . . . . . 171.8.1 Hallmarks of cancer . . . . . . . . . . . . . . . . . . . . . . . . 171.8.2 Cancer therapies . . . . . . . . . . . . . . . . . . . . . . . . . 201.8.3 Cancer resistance and molecular reprogramming . . . . . . . . 211.8.4 Genetic interactions in cancer . . . . . . . . . . . . . . . . . . 22
1.9 Computation challenges . . . . . . . . . . . . . . . . . . . . . . . . . 231.10 Significance . . . . . . . . . . . . . . . . . . . . . . . . . . . . . . . . 26
1.10.1 Cardio-vascular disease and hypertension . . . . . . . . . . . . 271.10.2 Cancer . . . . . . . . . . . . . . . . . . . . . . . . . . . . . . . 28
1.11 Organization of Thesis . . . . . . . . . . . . . . . . . . . . . . . . . . 291.12 Contribution . . . . . . . . . . . . . . . . . . . . . . . . . . . . . . . . 30
I Cardio-vascular disease and hyper-tension 33
2 EPIGENOMIC MODEL OF CARDIAC ENHANCERS WITH AP-PLICATION TO GENOME WIDE ASSOCIATION STUDIES 352.1 Overview . . . . . . . . . . . . . . . . . . . . . . . . . . . . . . . . . . 35
iii

2.2 Background . . . . . . . . . . . . . . . . . . . . . . . . . . . . . . . . 382.2.1 Expression quantitive trait loci . . . . . . . . . . . . . . . . . 382.2.2 Genome wide association studies . . . . . . . . . . . . . . . . 402.2.3 Epigenetics and regulation . . . . . . . . . . . . . . . . . . . . 412.2.4 Epigenetic Modifications . . . . . . . . . . . . . . . . . . . . . 422.2.5 Epigenetic Inheritance . . . . . . . . . . . . . . . . . . . . . . 432.2.6 Support vector machines (SVM) . . . . . . . . . . . . . . . . . 43
2.3 Methods . . . . . . . . . . . . . . . . . . . . . . . . . . . . . . . . . . 442.3.1 Correlating DNase Hypersensitivity and Gene Expression . . . 46
2.4 Results . . . . . . . . . . . . . . . . . . . . . . . . . . . . . . . . . . . 472.4.1 SVM model for cardiac enhancers . . . . . . . . . . . . . . . . 472.4.2 Identification of cardiac enhancers near SNPs associated with
cardiac phenotypes . . . . . . . . . . . . . . . . . . . . . . . . 512.4.3 Cardiac enhancers near cardiac GWAS SNPs are enriched for
cardiac regulator motifs . . . . . . . . . . . . . . . . . . . . . 532.4.4 Cardiac enhancers near cardiac GWAS SNPs are likely to reg-
ulate the nearby genes . . . . . . . . . . . . . . . . . . . . . . 542.4.5 Genes near cardiac enhancers are enriched for cardiac function 56
2.5 Conclusion . . . . . . . . . . . . . . . . . . . . . . . . . . . . . . . . . 57
3 Bayesian integration of genetics and epigenetics detects causalregulatory SNPs underlying expression variability 593.1 Introduction . . . . . . . . . . . . . . . . . . . . . . . . . . . . . . . . 593.2 Results . . . . . . . . . . . . . . . . . . . . . . . . . . . . . . . . . . . 613.3 Quantitative Trait enhancer Loci (eQTeL) model . . . . . . . . . . . 613.4 eQTeL detects expression regulatory SNP in MAGNet . . . . . . . . . 653.5 eQTeL detects causal SNPs in semi-synthetic data . . . . . . . . . . . 683.6 eQTeL detects SNPs with small effect sizes . . . . . . . . . . . . . . . 713.7 eeSNPs lie within protein-bound genomic regions . . . . . . . . . . . 743.8 eeSNPs exhibit binding and regulatory allele specificity . . . . . . . . 753.9 eeSNPs are spatially proximal to their target gene . . . . . . . . . . . 783.10 eeSNPs disrupt motifs of cardiac transcription factors . . . . . . . . . 783.11 Proportion of eeSNPs that are causal . . . . . . . . . . . . . . . . . . 803.12 Methods . . . . . . . . . . . . . . . . . . . . . . . . . . . . . . . . . . 82
3.12.1 Modeling regulatory-interaction potential: . . . . . . . . . . . 823.12.2 Modeling Gene Expression: . . . . . . . . . . . . . . . . . . . 823.12.3 Cardiac expression data (MAGNet): . . . . . . . . . . . . . . 853.12.4 Selection of genes: . . . . . . . . . . . . . . . . . . . . . . . . . 863.12.5 Pre-procession of gene-expression: . . . . . . . . . . . . . . . . 863.12.6 Genotypes and imputation for cardiac samples: . . . . . . . . 873.12.7 Epigenetic data and Interaction features: . . . . . . . . . . . . 883.12.8 Estimating fraction of putatively causal eeSNP: . . . . . . . . 893.12.9 Simulation study: . . . . . . . . . . . . . . . . . . . . . . . . . 903.12.10 Motif binding score differential: . . . . . . . . . . . . . . . . . 913.12.11 DNAse footprint enrichment: . . . . . . . . . . . . . . . . . . 92
iv

3.12.12 Allelic imbalance and ChIA-PET analysis: . . . . . . . . . . . 92
3.13 Software availability . . . . . . . . . . . . . . . . . . . . . . . . . . . 93
II Cancer 95
4 Synthetic rescue determinants of resistance and response to cancertherapy 97
4.1 Introduction . . . . . . . . . . . . . . . . . . . . . . . . . . . . . . . . 97
4.2 Background . . . . . . . . . . . . . . . . . . . . . . . . . . . . . . . . 98
4.2.1 Synthetic lethality . . . . . . . . . . . . . . . . . . . . . . . . 99
4.2.2 Computation identification of SL network in cancer (DAISY) . 101
4.2.3 Synthetic dosage lethality . . . . . . . . . . . . . . . . . . . . 102
4.2.4 Synthetic rescue . . . . . . . . . . . . . . . . . . . . . . . . . . 102
4.2.5 Down-Down (DD) synthetic rescue . . . . . . . . . . . . . . . 103
4.2.6 Down-Up (DU) synthetic rescue . . . . . . . . . . . . . . . . . 104
4.3 INCISOR . . . . . . . . . . . . . . . . . . . . . . . . . . . . . . . . . 105
4.4 Validations of INCISOR . . . . . . . . . . . . . . . . . . . . . . . . . 110
4.5 Application of SR . . . . . . . . . . . . . . . . . . . . . . . . . . . . . 120
4.6 Additional Methods . . . . . . . . . . . . . . . . . . . . . . . . . . . . 125
4.6.1 Evaluating the predictive survival signal of the inferred SRnetworks . . . . . . . . . . . . . . . . . . . . . . . . . . . . . 125
4.6.2 Tracing the number of functionally active SR pairs in tumorsduring cancer progression . . . . . . . . . . . . . . . . . . . . 126
4.6.3 Identifying the clinical significance of reprogrammed SR andbuffered SR . . . . . . . . . . . . . . . . . . . . . . . . . . . . 127
4.6.4 The Cancer-Drug SR Network (drug-DU-SR) and predictingpan-cancer drug response . . . . . . . . . . . . . . . . . . . . 127
4.6.5 Charting molecular mechanism underlying drug resistance us-ing SR networks . . . . . . . . . . . . . . . . . . . . . . . . . 129
4.6.6 Experimental analyses . . . . . . . . . . . . . . . . . . . . . . 130
4.6.7 Predicting adjuvant therapy candidates for counteracting theemergence of resistance via DU-SR interactions . . . . . . . . 133
4.6.8 Estimating the likelihood of developing resistance to anti-cancer drug treatments via DU-SR interactions . . . . . . . . 133
5 Discussion and perspective 135
5.1 Discussion . . . . . . . . . . . . . . . . . . . . . . . . . . . . . . . . . 136
5.1.1 Association studies . . . . . . . . . . . . . . . . . . . . . . . . 136
5.1.2 Synthetic rescue in cancer . . . . . . . . . . . . . . . . . . . . 137
5.2 Perspective . . . . . . . . . . . . . . . . . . . . . . . . . . . . . . . . 143
5.2.1 Alternatives . . . . . . . . . . . . . . . . . . . . . . . . . . . . 146
5.2.2 Unresolved question . . . . . . . . . . . . . . . . . . . . . . . 147
5.2.3 Potential follow up and new project . . . . . . . . . . . . . . . 148
v
III Appendix 153
A Bayesian integration of genetics and epigenetics detects causal reg-ulatory SNPs underlying expression variability 155Inference . . . . . . . . . . . . . . . . . . . . . . . . . . . . . . . . . . . . . 171
Sampling γ parameters accounting for Linkage Disequilibrium . . . . 171Sampling α and θ parameters . . . . . . . . . . . . . . . . . . . . . . 172Inference of β, σ2 and c . . . . . . . . . . . . . . . . . . . . . . . . . 173
Convergence of sampler . . . . . . . . . . . . . . . . . . . . . . . . . . 175Initialization . . . . . . . . . . . . . . . . . . . . . . . . . . . . . . . . 175
Further investigation into the reasons for eQTeL’s performance gain . . . . 175Other methods for comparison . . . . . . . . . . . . . . . . . . . . . . . . . 178
Eqtnminer . . . . . . . . . . . . . . . . . . . . . . . . . . . . . . . . . 178LASSO . . . . . . . . . . . . . . . . . . . . . . . . . . . . . . . . . . . 178Matrix-eQTL /univariate-eQTL (Lappalainen et. al.) . . . . . . . . 179Epigenetic-only model . . . . . . . . . . . . . . . . . . . . . . . . . . 179Known-epigenetic-prior-eQTeL . . . . . . . . . . . . . . . . . . . . . . 179Variable selection method . . . . . . . . . . . . . . . . . . . . . . . . 180Lirnet . . . . . . . . . . . . . . . . . . . . . . . . . . . . . . . . . . . 180
Eqtnminer subset selection . . . . . . . . . . . . . . . . . . . . . . . . . . . 181Multiple hypothesis correction/sparsity constrains . . . . . . . . . . . . . . 181Explained variance and expression predictability . . . . . . . . . . . . . . . 182Scalability and computation . . . . . . . . . . . . . . . . . . . . . . . . . . 183
B Synthetic rescue determinants of resistance and response to cancertherapy 185Extended data figures . . . . . . . . . . . . . . . . . . . . . . . . . . . . . 185The INCISOR pipeline . . . . . . . . . . . . . . . . . . . . . . . . . . . . . 207
Molecular survival of the fittest (SoF) (Step 1): . . . . . . . . . . . . 207Vulnerable gene screen (Step 2) . . . . . . . . . . . . . . . . . . . . . 209
Robust rescue effect (Step 3): . . . . . . . . . . . . . . . . . . . . . . 209Oncogene rescuer screen (Step 4): . . . . . . . . . . . . . . . . . . . . 210Pan-cancer KM analyses: combining survival analysis of different can-
cer types. . . . . . . . . . . . . . . . . . . . . . . . . . . . . . 210Pan-cancer SR network . . . . . . . . . . . . . . . . . . . . . . . . . . . . . 211
DU network . . . . . . . . . . . . . . . . . . . . . . . . . . . . . . . . 211Pancancer DD, UD and UU networks . . . . . . . . . . . . . . . . . . 226Pancancer SL network and combined clinical impact of SL and SR . . 227
Breast cancer SR network . . . . . . . . . . . . . . . . . . . . . . . . . . . 228SR networks . . . . . . . . . . . . . . . . . . . . . . . . . . . . . . . 228Patient survival prediction using SR networks . . . . . . . . . . . . . 230SR levels increase as cancer progresses . . . . . . . . . . . . . . . . . 231Reprogrammed and buffered SRs . . . . . . . . . . . . . . . . . . . . 231SR networks predict drug response of cancer cell lines and breast
cancer patients (TCGA) . . . . . . . . . . . . . . . . . . . . . 233
vi

SR buffers the lethal impact of essential genes . . . . . . . . . . . . . 234SR partners of cancer associated genes . . . . . . . . . . . . . . . . . 236
SR partners of cancer associated genes . . . . . . . . . . . . . . . . . 236Breast cancer subtypes SR network . . . . . . . . . . . . . . . . . . . . . . 236Identifying treatment-specific SR interactions . . . . . . . . . . . . . . . . 237Functional enrichment . . . . . . . . . . . . . . . . . . . . . . . . . . . . . 238In-vitro validation in HNSC . . . . . . . . . . . . . . . . . . . . . . . . . . 239
Bibliography 246
vii

viii

List of Figures
1.1 Central dogma of molecular biology. . . . . . . . . . . . . . . . . . . . 4
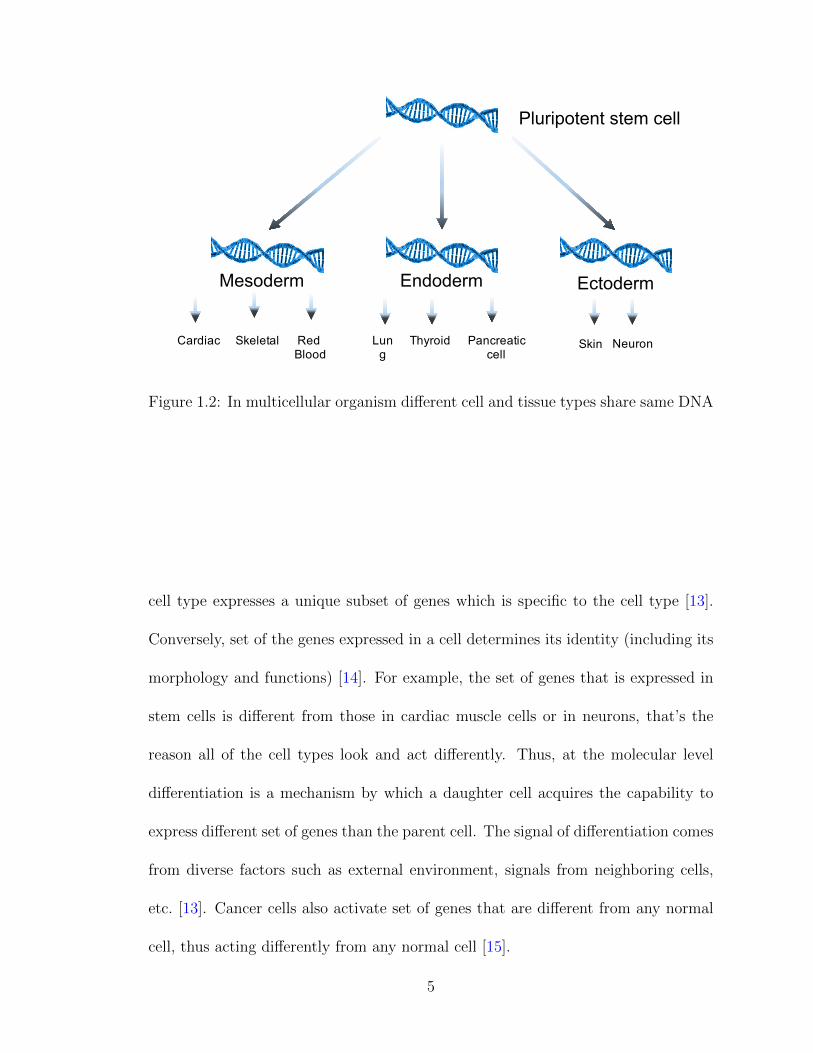
1.2 In multicellular organism different cell and tissue types share sameDNA . . . . . . . . . . . . . . . . . . . . . . . . . . . . . . . . . . . . 5
1.3 Regulatory elements in a cell: Promoter and enhancer in DNA. Thefew hundreds to a thousand base pairs region immediately upstreamof a gene that mediates the assembly of the pre-initiation complexand initiate gene transcription is referred to as the promoter. An en-hancer, on the other hand, is a distal regulatory element that interactswith a promoter by forming a loop. . . . . . . . . . . . . . . . . . . . 7
2.1 Support Vector Machine (SVM): SVM illustration for a linear sepa-rate case. Red (green) dot are positive (negative) examples. Supportvectors are circled. . . . . . . . . . . . . . . . . . . . . . . . . . . . . 45
2.2 Effect of variation of proportion of promoter region on accuracy ofmodel. Two fold cross validation is used for positive set. Negative setaccuracy is calculated by running the trained model on large numberof random 1 kb genomic regions not including those used for training. 49
2.3 ROC curve of SVM model . . . . . . . . . . . . . . . . . . . . . . . . 50
2.4 Number of enhancers (out of 23) predicted by SVM, P300 peaks andNarlikar et. al. . . . . . . . . . . . . . . . . . . . . . . . . . . . . . . 52
2.5 Significantly enriched motifs in SVM SNPs. The size of each TFlabel is proportionsal to its significance. For instance, the p-value forGATA1 in (a) is 0.001 and in (b) is 0.004. The largest p-value is 0.05. 55
3.1 Overview of eQTeL model . . . . . . . . . . . . . . . . . . . . . . . . 62
3.2 Comparative performance of different methods applied to humanheart data (MAGNet). . . . . . . . . . . . . . . . . . . . . . . . . . 66
3.3 eQTeL identify causal SNP accurately in semi-simulated data. . . . . 70
3.4 eQTeL increase statistical power to detect small-effect regulatory SNPs 73
3.5 eeSNPs overlaps with DNAse footprint . . . . . . . . . . . . . . . . . 76
3.6 DNAse hypersensitivity at eeSNPs shows greater allele specificity inHCM . . . . . . . . . . . . . . . . . . . . . . . . . . . . . . . . . . . . 77
3.7 eeSNP-gene pairs are spatially proximal . . . . . . . . . . . . . . . . . 79
3.8 Regulatory motifs disrupted by eeSNP include several cardiac TFs. . 81
4.1 Synthetic lethal . . . . . . . . . . . . . . . . . . . . . . . . . . . . . . 100
ix

4.2 Down-Down (DD) Synthetic resuce . . . . . . . . . . . . . . . . . . . 1044.3 Down-UP (DU) Synthetic resuce . . . . . . . . . . . . . . . . . . . . 1054.4 Pan-cancer DU-type SR network . . . . . . . . . . . . . . . . . . . . 1134.5 The four types of SR networks successfully predict cancer patients
survival . . . . . . . . . . . . . . . . . . . . . . . . . . . . . . . . . . 1154.6 Experimental shRNA screening validates the predicted DD-SR rescue
interactions involving mTOR in a head and neck cancer cell-line . . . 1194.7 The DU-SR network identifies key molecular alterations associated
with tumor relapse after Taxane treatment . . . . . . . . . . . . . . . 122
A.1 Mixing rate of eQTeL with and without block sampler . . . . . . . . 156A.2 Feature-analysis . . . . . . . . . . . . . . . . . . . . . . . . . . . . . . 157A.3 Validation of eeSNP in GTEx [1] . . . . . . . . . . . . . . . . . . . . 158A.4 Comparative performance of eQTeL in terms of explained variance in
the simulated data . . . . . . . . . . . . . . . . . . . . . . . . . . . . 159A.5 Comparative performance of eQTeL in terms of expression predictabil-
ity in simulated data . . . . . . . . . . . . . . . . . . . . . . . . . . . 160A.6 eQTeL small effect regulatory SNPs in simulated data . . . . . . . . . 161A.7 Comparative performance of eQTeL as number of SNP per genes are
increased in imputed data . . . . . . . . . . . . . . . . . . . . . . . . 162A.8 Lirnet enrichment of DGF footprint . . . . . . . . . . . . . . . . . . . 163A.9 Eqtnminer subset selection . . . . . . . . . . . . . . . . . . . . . . . . 164A.10 Allele specificity comparison of eQTeL and LASSO . . . . . . . . . . 165A.11 Relative allele specificity of DHS reads by SNPs identified by different
methods . . . . . . . . . . . . . . . . . . . . . . . . . . . . . . . . . . 166A.12 Relative allele specificity of H3K4me3 by SNPs identified by different
methods . . . . . . . . . . . . . . . . . . . . . . . . . . . . . . . . . . 167A.13 Comparative performance of Lirnet [2] . . . . . . . . . . . . . . . . . 168A.14 Proportion of causal SNPs detected by eQTeL . . . . . . . . . . . . . 169A.15 eeSNPs are evolutionary conserved. . . . . . . . . . . . . . . . . . . . 170
B.1 Extendeded data figure 1 . . . . . . . . . . . . . . . . . . . . . . . . . 187B.2 Extendeded data figure 2 . . . . . . . . . . . . . . . . . . . . . . . . . 189B.3 Extendeded data figure 3 . . . . . . . . . . . . . . . . . . . . . . . . . 191B.4 Extendeded data figure 4 . . . . . . . . . . . . . . . . . . . . . . . . . 193B.4 Extendeded data figure 4 (cont) . . . . . . . . . . . . . . . . . . . . . 194B.5 Extendeded data figure 5 . . . . . . . . . . . . . . . . . . . . . . . . . 196B.6 Extendeded data figure 6 . . . . . . . . . . . . . . . . . . . . . . . . . 198B.7 Extendeded data figure 7 . . . . . . . . . . . . . . . . . . . . . . . . . 200B.8 Extendeded data figure 8 . . . . . . . . . . . . . . . . . . . . . . . . . 202B.9 Extendeded data figure 9 . . . . . . . . . . . . . . . . . . . . . . . . . 204B.10 Extendeded data figure 10 . . . . . . . . . . . . . . . . . . . . . . . . 206
x
List of Abbreviations
DNA Deoxyribonucleic acidSNP Single Nucleotide PolymorphismRNA Ribonucleic acidmRNA Messenger RNAGWAS Genome wide association studieseQTL expression quantitive trait lociSCNA Somatic copy number varianceH3K4me3 H3 at lysine 4ChIP-seq chromatin immunoprecipitation sequencingChIP-seq chromatin immunoprecipitation sequencingRNA-seq RNA sequencingDHS DNase I hypersensitive sitesFPKM Fragments Per Kilobase of transcript per MillionRPKM Reads Per Kilobase of transcript per MillionSVM Support vector machinebp base pairkbps/kb kilo base pairseSNP eQTL-SNPLD Linkage DisequilibriumOMIM Online Mendelian Inheritance in Man
xi

Chapter 1: Introduction
1.1 How does a cell function?
All living organisms, from bacteria to human, are made of cells. Cells are
basic structural, functional and biological building block of living organisms [3].
Bacteria, perhaps the simplest organism that exists today, is a self contained single
cell. Humans, on the other hand, are multicellular and comprise of around 10 trillion
cells.
All cells in a unicellular or a multicellular organism contain an outer cellular
membrane that encapsulates liquid cytoplasm. Around 70% of cytoplasm is water,
rest comprises proteins and number of other small molecules (amino acids, glucose
etc.). DNA is a molecule that carries genetic hereditary information [3]. It holds
all the instructions for life of an organism in genes, which are stretches of DNA
and most of them encode protein molecules. In simple organisms, referred to as
prokaryotes, DNA resides in the cytoplasm. Whereas in more complex organisms,
called eukaryotes, a special nuclear membrane protects the DNA and separates it
from the cytoplasm [4].
Proteins carry out all essential processes necessary to maintain life, including
1

development, maintenance functions and reproduction [5]. There are many different
kinds of proteins including enzymes, antibodies (related to immune system), regu-
latory proteins, contractile proteins (related to muscle function), structural proteins
and transport proteins [6]. The enzymes catalyze more than 5,000 bio-chemical re-
actions and convert substrates to products inside the cells. Almost all metabolic
reactions need enzymes, which thus are essential for life [7]. What metabolic pro-
cesses occurs in a cell depends on the set of enzymes present in the cell [7]. The
case of lactose intolerance illustrates the importance of enzymes. People with lac-
tose intolerance cannot produce lactase enzymes. Lactase breaks down lactose into
monomers glucose and galactose, completing the first step in lactose digestion, there-
fore people who suffer from the lactose intolerance cannot digest milk that contains
lactose. This condition can be mitigated by taking lactase pill prior to drinking
milk [3, 8].
1.2 How does a cell produce proteins?
The answer to the question lies in a central dogma of molecular biology [9],
which explains how genetic information flows in an organism. DNA, mRNA and
proteins are major players in the central dogma [10]. The end product of this
process involves manufacturing of proteins by genes, which constitutes of following
two steps:
• Transcription: is a process by which information in DNA is transferred to
a messenger RNAs (mRNA). Specific proteins, RNA polymerase and tran-
2

scription factors, form a core of the transcription machinery and facilitate the
transcription [3]. Using a DNA-encoded gene as a template, DNA-polymerase
copies the gene to its corresponding mRNA.
In eukaryotic cells transcription process generates first primary transcript
mRNA (pre-mRNA) [5,11], which is then processed to mature mRNA (Fig 1.1).The
processing involves attaching a poly-A tail and a 5 ′ cap to pre-mRNA. This
is followed by splicing, which gives the final product - the mature mRNA
molecule [12].
• Translation: is a process transfers information from mRNAs to corresponding
proteins [3]. During translation, a protein complex called ribosome reads the
mRNA according to genetic code [10], where each mRNA triplet codon encodes
for an amino acid (Fig 1.1) [10]. Thus, mRNA is used as a template to assemble
a chain of amino acids that form the final protein product. In eukaryotic
cells, transcription occurs in the nucleus while translation occurs in cytoplasm,
therefore mRNA are transported out of nucleus (to the cytoplasm)(Fig 1.1).
In many organisms, the translated protein can be further modified by various
enzymes. This process, referred as post-translation modification, is not covered in
the central dogma.
3

DNA
Pre-‐mRNA
mRNA mRNA Protein
Transcription
Splicing
Transport Translation
Neucles
Cytoplasm
Figure 1.1: Central dogma of molecular biology.
1.3 How can same DNA give rise to drastically
different cells?
All cells in a human body are created by cell-divisions and DNA replications
from a single fertilized cell; thus all cells in an individual share identical DNA (with
exceptions of B cells) [13]. If DNA contains all genetic information, how do the
differences in tissues and cell types arise in a multicellular organism? How does the
same genetic information translate into morphologically and phenotypically distinct
cells (Fig 1.2).
The underlying mechanism involved in generation of different morphologies
and functions of cell types is called differentiation [13]. It is mechanism by which
a less specialized stem cell produces more specialized differentiated cells. Each
4
Pluripotent stem cell
Mesoderm Endoderm Ectoderm
Cardiac Skeletal Red Blood
Lung
Thyroid Pancreaticcell
Skin Neuron
Figure 1.2: In multicellular organism different cell and tissue types share same DNA
cell type expresses a unique subset of genes which is specific to the cell type [13].
Conversely, set of the genes expressed in a cell determines its identity (including its
morphology and functions) [14]. For example, the set of genes that is expressed in
stem cells is different from those in cardiac muscle cells or in neurons, that’s the
reason all of the cell types look and act differently. Thus, at the molecular level
differentiation is a mechanism by which a daughter cell acquires the capability to
express different set of genes than the parent cell. The signal of differentiation comes
from diverse factors such as external environment, signals from neighboring cells,
etc. [13]. Cancer cells also activate set of genes that are different from any normal
cell, thus acting differently from any normal cell [15].
5

1.4 How do eukaryotes regulate genes in a cell-
type specific manner?
In eukaryotes, a promoter Fig 1.3 is a genomic region that is necessary to
initiate transcription of a specific downstream gene. They are generally located
a few base pairs upstream of the transcription initiation site (TSS) of its target
gene [16]. Each transcription factor (TF), protein that helps in transcription of
genes, contains a specific DNA binding domain that recognizes a 6-10 base-pair
motif of DNA. A promoter contains a specific set of motifs, also called transcription
factor binding sites (TFBS), which allow specific set of TFs to bind and modulate
expression of its target gene [16].
For a gene to be transcribed, its promoter region must be accessible (or open)
to TFs [17], so that a pre-initiation complex can be formed. Once TFs are bound
to the promoter, RNA polymerase binds to the promoter forming a transcription
initiation complex. This initiates the transcription of the gene.
In eukaryotic cells, the transcriptional regulation depends upon chromatin,
which is a complex of DNA and proteins called histones [18]. The DNA in the
default state is tightly wrapped around histones in the nucleus, a state referred as
closed chromatin. TFs and RNA polymerase cannot bind to promoters in a such
state because they are inaccessible. Genes in such a state are inactive [18].
A set of chemical modifications to the histones can change the local accessibil-
ity of DNA for TF binding and therefore can modulate gene expression [17,18]. For
6

TF
RNAP
Promoter
Enhancer
Figure 1.3: Regulatory elements in a cell: Promoter and enhancer in DNA. Thefew hundreds to a thousand base pairs region immediately upstream of a gene thatmediates the assembly of the pre-initiation complex and initiate gene transcriptionis referred to as the promoter. An enhancer, on the other hand, is a distal regulatoryelement that interacts with a promoter by forming a loop.
example, a histone modification H3K4me3 at promoter of a gene can make promoter
accessible to TFs and RNA polymerase, thus activating the gene. There are other
types of histone modifications (for eg. H3K27me3) that repress the gene. DNA
methylation is another modification to DNA that silences gene expression. Histone
modifications and DNA methylation are also known to be inherited during the cell
division and therefore are collectively called epigenetics [3]. Epigenetics, in sum-
mary, decides how transcription machinery reads the genetic instruction from DNA
in a cell. It is also widely known that undesirable epigenetic changes cause many
human disease [19, 20].
For transcription, a promoter needs to be unwound from histones so that TFs
can bind [17]. Many TFs are activators, while others are repressor of genes. The
7

TFs not only bind to promoter but it can also bind a distal regulator of gene called
enhancer (Fig 1.3). Like a promoter, an enhancer is a genomic region that can be
bound by TFs to activate transcription of its distal target gene by interacting with
the gene promoter [17]. To activate its target gene an enhancer physically interacts
with the gene-promoter by forming a chromatin loop as shown in Fig 1.3. Enhancers
are located up to 1Mbp away from TSS. Enhancers are also activated or inactivated
by epigenetic factors like histone modifications and DNA methylation [21]. Some
histone modifications are known to be specific to enhancers.
1.5 Biological processes performed by genes
Genes are involved in variety of biological processes in a cell. One of the way
biological processes can be broadly categorized into [3]:
• Cellular metabolism: These are the set of biochemical reactions needed to
maintain life and allow to the cells function properly. In a case of environ-
mental changes, metabolism helps in cellular response to maintain the cell
growth. Metabolism is perhaps the most studied cellular process, since it is
often altered in diseases [7].
• Genetic information processing: It involves processes associated with the cen-
tral dogma of molecuar biology (see section 1.2, i.e DNA replication, transla-
tion, transcription and DNA repair [22]).
• Cellular process: It involves process related to cell cycle, e.g. cell growth and
8

cell death. It also includes cell membrane function [22].
• Organismal systems: This involves organ specific functions such as associated
with immune system, endocrine system, cardio-vascualar system, nervous sys-
tem etc [3].
Many genes are multi-functional and may be active in multiple functional
processes. The aforementioned categories are also not strictly disjoint. Because
each cell type expresses specific set of genes, set of the active biological processes in
a given cell type is unique to it.
1.6 Disruption of biological processes causes dis-
eases
Each of biological process activated in a cell type is necessary for its normal
functioning , and their disruption interferes with normal functioning of the cells.
A severe malfunction manifests into a disease. Disruptions in biological processes
are often mediated by gene expression changes. Various genetic and environmental
factors can affect gene expression patterns in a cell [23].
1.6.1 Mutation
Any alteration to DNA sequence or genetic element is called mutation. Mu-
tations may occur due to errors in DNA replication during cell divisions. It may
also be a result of segmental insertion or duplication caused by mobile genetic el-
9

ements [24, 25]. Mutations at single nucleotide level that accumulate over time in
a population, and are present at appreciable degree within the population (for eg.
> 5%), is referred to as single nucleotide polymorphism (SNP).
1.6.2 Coding mutation
Mutations that occur in genes are called coding mutations. Coding mutations
can be of different kinds. A mutation in a gene may have no effect, alter the gene
product, or hamper partially or completely the normal gene function. Most coding
mutations that change amino acid of the resultant protein (called non-synonymous
mutations) are harmful to the organism. For example 70% of non-synonymous mu-
tations are estimated to be harmful in Drosophila [26]. The rest of the mutations are
neutral. Only a few coding mutations are known to be beneficial to the organisms.
1.6.3 Non-coding mutation
Mutations can also occur in non-coding regions (called non-coding mutations)
of the genome. Most mutations in human DNA are known to be neutral i.e they
do not have any discernible effect on phenotype of the organism. However, many
non-coding mutation in regulatory elements, such as enhancers and promoters, can
also be deleterious. These mutations although do not change any protein product
of genes, can severely affect regulatory network within cells. A mutation in a gene
promoter can destroy the TFBS of an essential regulatory TF necessary for its tran-
scription. It will prevent the TF from binding to the promoter, ultimately causing
10

down-regulation of the gene. Therefore, a non-coding mutation in a promoter can
disrupt gene regulation and can have severe phenotypic consequences. For instance,
SDHD is a metabolic gene and mutations in its promoter are known to cause down-
regulation. The mutation in SDHD promoter mutations are associated with gastric
cancer and paraganglioma [27,28].
A mutation in a gene promoter can also affect the gene. A somatic mutation
– mutation that is not inherited, i.e, it does not appear in germ-line cells but in
somatic cell – in promoter of TERT gene over-activates the gene. The occurrence
of somatic mutations are associated with oncogenesis, particularly in melonomas,
bladder and hepatocellular cancer [29].
A mutation in an distal regulatory element can also affect expression of its
target gene, and therefore can contribute to a disease. The disruption of enhancers
by mutations has been linked to both Mendelian and complex disease traits. In
human, sonic hedgehog (SHH) gene is controlled by an enhancer that is almost a
megabase away from it. Further, mutations in the enhancer is shown to result in
pre-axial polydactyly in families [30].
It must be noted that, the impact of non-coding mutations on phenotype
may vary from that of coding mutations, even if the both mutations disrupt same
gene. Mutations in enhancers or promoters only affect expression levels of their
target genes, whereas those in coding regions may alter protein product, stability or
folding [31]. Generally, coding mutations are more detrimental than those of non-
coding mutations. Most enhancers are tissue specific, they are active and regulate
genes in few tissues. Consequentially, a mutation in a tissue specific enhancer will
11

manifest into a phenotypic disorder only in specific tissues. In contrast, mutations
in promoters will affect expression more globally. For example TBX5 is a gene
involved in heart and forelimb development. Smemo et al. demonstrated that a
mutation in heart specific enhancer of TBX5 affects heart development and not
forelimb development [32]. Localization of phenotypic effect is another distinction
between the coding and non-coding mutations.
1.7 Heritable mutation disorder
Heritable mutations, mutation which are either inherited from parents, or
occur in germ-line, cause two class of genetic disorders:
1. Monogenic disorders (Mendelian disorder): They are disorders that manifest
due to disruption of a single gene. For example sickle cell anemia is caused by
mutation in haemoglobin gene [33].
2. Polygenic disorders (Complex disorder): They are disorders that are caused
by mutation in multiple genes. For example cardiovascular diseases, diabetes
and hypertension are caused by mutation in multiple genes.
Online Mendelian Inheritance in Man (OMIM) have cataloged around 4,000
diseases which are believed to be caused by alterations in a single gene. Mendelian
disorder are not common and are generally very rare disorder. Since monogenic
disorders manifest due mutation in single gene, it relatively not hard to predict the
disease onset. They are inherited in families, so tracking the genes that cause the
12

disease through families is relatively easy. Complex disorders also occur in families,
but the inheritance rules are much more complex. We have poor understanding these
rules of why some family members develop them while others remain healthy [34].
In past decade, association studies are extensively used to identify genetic and
molecular determinants associated with a disease (or phenotype). These studies
were aimed at identifying genomic variants that are associated with phenotypic
traits in the population, specifically at detecting association either between SNPs
and common diseases such as cardiovascular diseases, cancer risk, hypertension,
diabetes etc, or between SNP and gene expression [35]. There are two types of
association studies :
1.7.1 Expression quantitative trail loci (eQTL)
The primary goal of Expression quantitative trait loci (eQTLs) is to iden-
tify genetic variations that determine the expression variation among individuals
in a population and ultimately uncover underlying regulatory network by which an
individual variation leads to expression changes [36].
eQTL studies are conducted using gene-expression and genotype of multiple
individuals. A SNP is deemed associated with a gene if the gene expression is
significantly different in people with one particular allele compared to other.
13

1.7.2 Genome wide association studies (GWAS)
The ultimate aim of Genome wide association studies (GWAS) is to determine
genetic risk of an individual to develop a disease and to reveal biological mechanism
that underlies the genetic disease, so that it can be harnessed for prevention and
therapeutics [37].
GWAS are conducted similarly to eQTL, however it requires genotype and
disease information (phenotype) of each individual in a population. If people with a
particular SNP allele have much higher occurrence of disease compared to others, the
SNP is called to be associated. GWAS represents a powerful tool for understanding
molecular underpinnings and genetic makeup of complex polygenic diseases [38–40].
These studies have revealed thousand of risk loci associated with such disorders and
have provided valuable molecular insights into their regulatory architecture [41,42].
1.7.3 Limitation of association studies
In the past decade, numerous association studies were conducted, and yet at
the same time, they have been heavily criticized. The criticisms include association
studies cannot explain enough genetic and phenotypic variation in the population.
However, the major disappointment with the association studies is due to perception
that results they produce are neither biologically relevant nor have any therapeutic
utility [35]. The major limitations [43] and challenges of the association studies are:
• Associated variants in non-coding region: Less than 5% of associated
SNPs fall in coding region of genome (both synonymous and non-synonymous).
14

Rest of the associated SNPs fall in non-coding region [44]. Therefore they are
not immediately informative. Further they are hard to validate experimentally.
• Linkage disequilibrium: It is defined as non-random association of alle-
les between different loci. When two alleles occur together significantly more
often than expected by random chance, they are called to be in linkage dise-
quilibrium. Linkage disequilibrium are caused due to variety of factors such as
selection, recombination rate, mutation rate, genetic drift, population struc-
ture, mating system and genetic linkage [45].
In the human genome, each SNP loci are in linkage disequilibrium with hun-
dreds of other SNPs. All SNPs which are in a strong linkage disequilibrium
with a causal variant of a phenotype will also show strong association. There-
fore association does not necessarily imply causality of the factor. Further,
most of the association studies use genotyping and the original causal SNP
may not be in the genotyped chip [44].
• Missing heritability. Only a portion of phenotypic variance is determined
by genetics (called heritability). Further, as any association studies consider
a subset of all possible genetic factors in the analyses, there is upper bound
on how much of heritability, called as narrow sense heritability [38], can be
explained by association studies. This can be estimated by twin studies. How-
ever, phenotypic variance explained by most of GWAS are much smaller than
the estimated narrow sense heritability [38] (difference referred to as missing
heritability).
15

• Rare variants (and not common variants) may be causal : Missing
heritability in GWAS points to the fact that rare rather than common variants
may be causal, which are generally missed by SNP array technologies [44].
Further, in order to achieve enough statistical power much larger sample size
will be required to detect associations [38].
• Reproducibility. Many GWAS are conducted on single population and are
not generalizable across studies or populations, suggesting that many of the
associations are false positive and have no biological relevance. [46].
1.7.4 How to improve association studies?
In recent years, multiple association studies have shown strong and consistent
association of thousand of genomic variants with various diseases. However, their
interpretation of the molecular mechanisms remain challenging. Characterization
of missense and nonsense coding mutations offers a solution for coding variants.
Given the abundance of non-coding functions and current state of incomplete anno-
tation of transcriptional regulators and their poor understanding, the challenge of
interpretation is far more formidable for non-coding variants [47–50].
Several recent efforts were geared to provide a comprehensive map of regula-
tory annotations. For example, the Encyclopedia of DNA Elements (ENCODE) [51]
project has released comprehensive map of epigenetic data for many primary cell
lines. Epigenome road-map project [52] has taken initiative to deliver these annota-
tion in primary cells and cultured cells. The explosion of epigenetic data has made it
16

possible to detect cell-type-specific regulatory regions [43,47–50], which can be used
to distinguish regulatory SNPs from non-regulatory SNPs in LD blocks. Further it
will help us to interpret non-coding associated variants, which constitute majority
of reported GWAS variants. Finally, the data will help to solve the problem of
limited statistical power to detect associations of rare variants (refer to chapter 3
for details).
1.8 Somatic mutation disorder
Although certain germ-line mutations are known to be associated with risk of
cancer onset, only around 5-10% [53] of cancer incidences are known to be hereditary.
Cancer is mainly caused by genetic alterations that occur in cells within the life span
of an individual, i.e somatic mutations.
1.8.1 Hallmarks of cancer
Genetic diseases, such as Cardio-vascular diseases or hypertension, are result
of a systematic break down of the normal functioning of cells, where regulatory
networks and cellular processes are severely compromised. In contrast, cancer is
a unique genetic disorder where transcription machinery and cellular processes are
hijacked to allow cancer to proliferate continuously.
In cancer, existing cellular processes and regulatory networks are reprogrammed
in systematic manner to tailor the need of malignant cancer cells. In the remodeling
of normal cells to cancerous cells, a tumor undergoes a series of genetic and tran-
17

scriptome alterations, each conferring specific proliferative advantage, which leads
to gradual conversion of normal cells to cancer cells. Proliferation and homeosta-
sis of normal cell are governed and limited by check points embedded in a robust
regulatory circuit. Systematic reprogramming in cancer cells allow them to bypass
these checkpoints. Hanahan et. al. suggested six essential alterations in cells that
dictate the oncogensis [54,55]:
• Self sufficiency of growth signal: Normal cells require specific growth sig-
nal (GS) from extracellular signaling molecules to proliferate. Tumor cells, in
contrast, show a greatly reduced dependence on the external growth stimula-
tion. Many oncogenes mimic growth signals in tumors and evade the external
GS dependence. For instance glioblastomas and sarcomas produce growth
factors PDGF and TGFα. Alternatively, cancer can alter the downstream
pathways of GF signaling by permanently activating the pathways that re-
spond to the GFs.
• Insensitivity to growth-inhibitory (antigrowth) signals: Multiple anti-
growth signals operate in cells, blocking the uncontrolled proliferation of nor-
mal tissue, predominately acting through trans-membrane signaling receptors
and intracellular signaling pathways. They either force a cell out of the pro-
liferation in a quiescent state (G0) or permanently switch off the proliferation
potential of a cell.
Cancer evades these antigrowth factor signals to keep proliferating uncontrol-
lably. Much of the insensitivity is achieved by disruption of pRB pathway
18
responsible for blocking cell transit through G1 into S phase. Tumor suppres-
sor genes that primarily control the antigrowth signal, are highly disrupted in
cancer so that cell divisions are not prevented in cancer [56].
• Evasion of programmed cell death (apoptosis): Rate of tumor expansion
depends upon proliferation rate and rate of cell death. Programmed cell death,
known as apoptosis, is a major mechanism by which uncontrolled growth is
tackled in the normal cells. The acquired resistance to the apoptosis is a
hallmark of all cancer types [54]
Cancer acquires the apoptosis resistance through a variety of strategies. Most
commonly through mutation in p53, a tumor suppressor gene that regulates
apoptosis. The P53 functional inactivation is observed in more than half of
the tumors [57]. In addition antiapoptic signals are over-expressed in tumors
such as over-expression of AKT/PKB pathway mitigates apoptosis and are
over-expressed in many melonomas. Cancer cells may also alter the capability
to detect DNA damage or abnormalities, thus avoiding the apoptosis.
• Limitless replicative potential: Three acquired capabilities – independence
of the growth signals, insensitivity to antigrowth signals, and resistance to
apoptosis – do not suffice in supporting uncontrolled tumor growth and tu-
morogenesis due to an intrinsic limit on a number of cell divisions allowed.
Once cells have achieved a certain number of doubling they stop dividing, a
concept termed as senescence. This program is independent of cell signaling.
In order for cells to grow in malignant tumor, they must evade this program
19

too.
Telomeres located at the ends of chromosomes are the counting devise, which
shorten with every cell divisions. The progressive shortening causes cells to
eventually lose their capability to divide further. Telomere maintenance is
evident in all types of tumors. In most tumors, their maintenance is mediated
by telomerase up-regulation, the enzyme responsible for maintaining telemore
length in stem cells [58].
• Sustained angiogenesis: Nutrients and oxygen are supplied by blood to
each cell and are necessary for maintenance and survival. The formation of
new blood vessels is referred to as angiogenesis. The expanding tumor needs
additional routes for blood supply. Cancer hijacks the angiogenesis to ensure
adequate oxygenation. This is achieved by disruption of the production of
factors that regulate blood vessel formation.
• Tissue invasion and metastasis: Advanced stages of tumors eventually
acquire capability to invade adjacent tissue and metastasize to distant sites.
Most of cancer types do not lead to patient’s death unless they metastasize.
In fact 90% of cancer deaths are due to metastasis [59].
1.8.2 Cancer therapies
The main aim of an anti-cancer therapy is to selectively kill cancer cells, with-
out affecting the normal cells. Current cancer therapies in one way or another target
one of the hallmarks of cancer. For example kinase inhibitor like Gleevec ( iman-
20

tinib msylate) selectively kills chronic myeloid leukemia (CML) and gastrointestinal
stromal tumors (GIST) cells. CML is driven by over-activation of growth factor
ABL kinase through a mutation of kinase fusion protein BCR-ABL. Whereas GIST
is caused by over-activation of PDGFR (platelet derived growth factor receptor).
Gleevec effectively inhibits the activity of all of these growth factor kinases. The
therapy shows remarkable initial response in the patient’s where the kinases are
over-active by selectively eliminating tumor cells and in many cases tumors disap-
pear within few regimens of the therapy. Similarly, in lung cancer, epidermal growth
factor receptor (EGFR) inhibitors have great response in tumors with activating mu-
tation in EGFR gene. In lung cancer, clinical responses to epidermal growth factor
receptor (EGFR) inhibitors are associated with point mutations in the EGFR kinase
domain. Nearly 25% of breast cancer patients have over-expressed ERBB2 (HER2)
gene, which drives tumor cell growth. Targeting the oncogene has been shown to be
effective treatment in HER2 positive breast cancer patients [60].
1.8.3 Cancer resistance and molecular reprogramming
Advances in biomarker discovery approaches have led to significant improve-
ments in targeted cancer therapies in the past decade. However, the success of most
of the therapies are short-lived due to emergence of resistance to drugs and eventual
relapse of cancer. The mechanisms of drug resistance share many features such as
activation of drug efflux, alterations in the drug target, and downstream adaptive
responses [61]. A key driving force underlining in the emergence of cancer resis-
21

tance to specific drug treatments involves changes in the activity of a gene that can
buffer the inactivation of the specific drug targets. For instance Lapatinib show im-
pressive initial response in HER2 positive breast cancer patient by inhibiting HER2
(ERBB2) gene. However, resistance to the therapy eventually emerges in patients.
Lapatinib resistance is known to be caused either by over-expression of ERBB3
gene that replaces the downstream function of ERBB2, or by over-expression of
other kinases that compensates for the ERBB2 inhibition by over-activating down-
stream target of ERBB2 gene directly [60]. Interaction between genes are likely to
be major determinant of cellular reprogramming that leads to resistance.
1.8.4 Genetic interactions in cancer
In order to better understand the mechanism of drug resistance and long term
effectiveness of cancer therapies, we need to understand landscape of genetic inter-
action in cancer. There are a few well-known and extensively studied types of gene
interactions (GIs). First and foremost are Synthetic lethal interactions (SL), which
describe the relationship between two genes whose individual inactivation results in
a viable phenotype while their combined inactivation is lethal to the cell [62–70].
SLs have long been considered a potential basis for developing selective anticancer
drugs [71–73]. Such drugs are aimed at inhibiting the SL partner of a gene that is
inactivated by genomic alterations in the particular cancer, thus potentially leading
to more selective cancer treatments that primary kill the cancer cells with few cyto-
toxic effects on healthy cells. Another important class of GIs are synthetic dosage
22

lethal (SDL) interactions, where the under-activity of one gene together with the
over-activity of another gene is lethal but not each event individually [74]. In a man-
ner similar to SLs, SDL interactions also provide a powerful alternative for targeting
cancer cells, and are potentially promising for targeting tumors with activated onco-
genes, many of which are known to be difficult to target directly. Instead, targeting
the oncogenes SDL partner may selectively kill cancer cells [75].
Fueled by Next Generation Sequencing technologies, TCGA (The cancer genome
atlas) have provided genetic, molecular and clinical annotations of thousands of tu-
mor samples for 27 different tumor types [76]. Capitalizing on TCGA, Jerby et. al.
proposed a direct data-driven approach, termed DAISY [71], for identifying candi-
date SL and SDL-interactions via the analysis of the omics data directly from a large
collection of patient tumor samples. Mapping the first genome-wide pan-cancer SL-
network, they showed SL can successfully predict both gene essentiality and drug
response as well as patient survival [71].
1.9 Computation challenges
With advances in high throughput sequencing, the emphasis have shifted to-
wards analyzing the data using big data approaches. Beside posing a computational
challenge due to size of data, the rapid accumulation of large data poses challenge
to integrate informations from diverse dataset to extract inferences about the adap-
tion, diversity and complexity of biological system. The main computational issues
in the problem covered in this thesis i.e, identifying molecular underpinning of dis-
23

eases onset and drug resistance are :
1. Substantial amount of noise in the biological data
2. Integrating the information flow to account for the biological mechanism
3. Over-fitting in modeling
4. Confounding factors
Bayesian approaches are ideally suited for the problems, which need to extract
information from complex data, especially where there exists uncertainty in the
data due to noise. The source of noise may include experimental error or noise,
as well as noise due to intrinsic random variations. In Bayesian approaches it is
imperative to specify a ”prior” distribution before the data is observed. Assigning
priors implies all sources of variance and uncertainty are now treated in the unified
and consistent manner. This forces us not only to integrate our assumptions and
constraints in the model but also integrate our prior knowledge (for eg. mechanism)
about the biological system, which is a philosophically appealing feature of the
Bayesian paradigm [77, 78]. This also provides relatively richer information about
the model parameters. Further, this makes inference robust to outliers and lack of
data [77].
The information flow within a cell are essentially hierarchal. Information in
DNA are transcribed to mRNAs [3]. Transcriptional regulators modulate also the
mRNA, which in turn are modulated by different epigenetic factors. Epigenetic
factors themselves are dependent on DNA and environment. Many of the biological
24

problems therefore can be improved in a fundamental manner by modeling the infor-
mation hierarchies. Emphasis, therefore, has now shifted to data driven bottom-up
approaches, integrating the different hierarchies of the information flow to parame-
terize bottom-up mechanistic models of biological processes. Bayesian methods offer
a systematic approach to propagate uncertainty across different levels of modeling
to make inferences. Not surprisingly, Bayesian methods are now a day extensively
used in genetics, bioinformatics and system biology.
When a model fits the training data, but does not generalize to unseen data
is called Over-fitting. It occurs in a statistical model when it tries to describe the
random variation with in the data instead of the underlying relationship. The main
consequence of the over-fitting is that it exaggerates performance of the model and
also will have poor performance in unseen (test) data. The over-fitting is usually
caused by over-parameterization and lack of the regularization. Cross-validation is
the most popular technique to estimate level of the over-fitting and reduce it from
the modeling [79].
The most attractive feature of the Bayesian paradigm is ”integrating out” all
irrelevant variables, which inherently leads to implementation of Ockhams Razor
[78, 80, 81]. Bayesian frameworks in that case automatically prefer a simple model
provided that it is sufficient to explain the observed data. This concept enables to
set regularization parameters and select models without the need for any additional
validation [77].
Confounding factors are the variables that are correlated with both dependent
and independent variables. Due to confounding factors inferences from the model
25

are often biased and in many instances completely wrong. For example when de-
termining what gene causes a disease, co-expression between genes is a confounding
factor. It is one of the most challenging issue in computational modeling, which can-
not be automatically corrected but needs explicit correction by including them in
modeling. The presented thesis proposes multiple ways to account for confounding
factors both in Bayesian and frequentist paradigms.
1.10 Significance
Recent advances in high throughput sequencing have made it possible to assay
new arrays of genome-wide biological data. Methods that can capitalize on these to
identify the molecular and genetic underpinnings of disease can significantly advance
not only our understanding of biology but also clinical applications. In consonance,
the thesis presents our computational efforts to bridge the diverse array of genome-
wide biological data into statistical frameworks to make inferences about mechanis-
tic understandings, molecular and genetic underpinning of cardiovascular diseases,
hyper-tension and cancer. In the first part of the presented work, we demonstrate
ways to improve association studies by integrating epigenetic and genetic interaction
information to the association studies. In second part, we discover a new class of
genetic interactions that underlies ongoing molecular reprogramming in cancer in
order to overcome drug treatment and become resilient to external onslaughts like
various drug treatments.
26

1.10.1 Cardio-vascular disease and hypertension
Genetic diseases such as Cardio-vascular diseases (CVD), hyper-tension, and
cancer affect millions of people all over the world. Cardio-vascular diseases are the
leading cause of the deaths in US. As per World health organization (WHO) overall
31% of all the deaths worldwide are due to Cardio-vascular diseases which includes
coronary heart diseases and strokes [82]. More people die due to CVDs than any
other cause. It accounts for nearly 17% of total the National health expenditures.
Most of Cardio-vascular diseases can be prevented if people at high risk for CVD are
diagnosed early and therapeutic interventions are personalized. Despite extensive
research, genetic and molecular factors that lead to CVDs in humans remain elusive,
undermining the efforts of the early detection and prevention. Further, it severely
limits our ability to devise new CVD targeted therapies and interventions.
With advances in the next generation sequencing technologies in the past
decade, genomic, epigenomic and molecular data obtained both from patients and
healthy population are rapidly accumulating. Approaches that can systematically
exploit the rapidly expanding data to identify determinants of CVD can signifi-
cantly advance our efforts to detect risk of CVD, prevent and devise novel targeted
therapeutic interventions. The presented thesis first describes our efforts to identify
determinants of CVD followed by developing computational approaches that inte-
grate a diverse array of high-throughput data pertaining to regulation and disease
etiology.
27

1.10.2 Cancer
Cancer is also among the leading cause of death worldwide and in US. Around
15 million new cases of cancer and 8.2 million deaths were reported in 2012 [82].
Among all diseases National institute of health devotes highest amount of its bud-
getary allocation to the cancer research. It is expected that the number of cancer
cases will increase by 70% in the next two decades. In the past decade multiple
anti-cancer therapies have been introduced showing a promising initial response.
However, the frequent emergence of resistance to therapies and eventual relapse re-
mains most daunting challenge in fighting cancer. Molecular determinants of the
resistance emergence that limit effectiveness of the current therapies remain elusive
and a pressing challenge in cancer research.
Our computational efforts in cancer research were geared towards identifica-
tion of molecular determinants and mechanisms that determine resistance and ef-
fectiveness of anti-cancer therapies. Indeed, recent studies published in many high-
impact journals have aimed to address this challenge by measuring the molecular
profiles (typically DNA or RNA sequencing) of tumors before and after a given drug
treatment to characterize drug and tumor specific molecular signatures of emerg-
ing resistance (e.g., [83–86]]). Such studies – which are another example of causal
inference – are quite labor intensive and costly, requiring the designated collection
and assessment of pre- and post-treatment data for every specific treatment and
cancer type in dedicated painstaking clinical studies. Moreover, importantly, such
clinical studies are infeasible for estimating the potential of emerging resistance to
28

investigational drugs during their development. In the present work, we take a fun-
damentally different and novel approach to address resistance to therapy in cancer.
We define a new class of genetic interactions termed synthetic rescues (SRs) (defined
in Background) that provide fundamental insights into the molecular underpinnings
by which cancers reprogram their molecular activity in response to specific drug
treatments, to rescue themselves from the onslaught. The reprogramming can be
mediated by cellular response (such as changes in regulatory network) to external
onslaughts. Alternatively, such reprogramming can be explained by selection of tu-
mor cells (within a heterogeneous tumor or rapid genetic and molecular alterations
in a tumor) that confer selective advantage to the tumor to cope with the onslaughts.
1.11 Organization of Thesis
Part 1 consists of following two chapters:
In Chap. 2, we present a model to predict human heart enhancer using epige-
nomic data. We then show utility of the model by applying to hypertension data
and showing improvement in identifying regulatory SNPs over traditional associa-
tion studies. [47]
In Chap. 3, we introduce a coupled Bayesian regression approach – eQTeL [87],
which leverages epigenetic data to estimate regulatory and gene interaction poten-
tial, and identifies combination of regulatory SNPs that explain the gene expression
variance. We apply eQTeL to the human heart data and demonstrate its superior
performance in identifying putative causal regulatory SNP over existing eQTL meth-
29

ods. The model unravels specific regulatory mediators that participate in interaction
between regulatory SNPs and target genes.
In Part 2 or the thesis we introduce a novel class of gene interactions termed
Synthetic Rescue (SR) that underlies extensive genetic reprogramming emerging
with cancer progression. We also propose a data driven computation framework,
termed INCISIOR, to identify SR in a genome-wide fashion [88]. Applying INCISOR
to mine The Cancer Genome Atlas (TCGA) [76], a large collection of cancer patient
data, we present the first genome-wide pan-cancer compendium of synthetic rescue
(SR) interactions. In the rest of the chapter we (i) comprehensively characterize
emergence and evolution of SR and (ii) demonstrate their role in the emergence of
resistance to current cancer therapies and (iii) determine personalized effectiveness
of the therapies. Finally, we provide therapeutic application emerging from the SR.
Chap. 5 concludes the thesis providing a discussion and a future perspective.
1.12 Contribution
The presented work was only possible due to immense support and guidance
from numerous collaborators. The work shown in this thesis has been done by
the author by collaborating with many others. The collaborator contributions for
each chapter are shown below. Keywords used for collaborator names: S.H - Srid-
har Hannenhalli, E.R - Eytan Ruppin, J.L - Joo Sang Lee, S.G - Silvio Gutkind,
R.B - Ramiro Iglesias-Bartolome, R.A - Radhouane Aniba, Y.P.C - Yen-Pei Christy
Chang, MM - Michael Morley, CSM - Christine S. Moravec, WT - W. H. Wil-
30

son Tang,H.H- Hakon Hakonarson, M.C- MAGNet Consortium, K.M- Kenneth B.
Margulies, T.C - Thomas P. Cappola, S.J - Shane Jensen A.D - Avinash Das Sahu.
• Chapter 2 : S.H conceived the project. A.D developed the model under su-
pervision of S.H. S.H, A.D and R.A analyzed the data and performed the
analyses. All authors wrote the manuscript.
• Chapter 3 : S.H and A.D conceived the project. A.D developed the Bayesian
method under supervision of S.H. A.D devised the inference algorithm with
help from S.J. A.D and S.H analyzed the data and performed the analyses.
M.M, C.M, W.T, H.H, K.M, T.C and other members of MAGNet Consortium
generated the MAGNet data. S.H and A.D wrote the manuscript, with help
from others.
• Chapter 4 : A.D, J.L and E.R conceived the project. E.R supervised the
project. A.D and J.L developed INCISIOR method under guidance of E.R
and with help from S.H. E.R, A.D, J.L and S.H designed the analyses and
experiments. A.D and J.L analyzed the data and performed the analyses. S.G
and R.B conducted the shRNA experiments. E.R, J.L and A.D wrote the
manuscript, with help from others.
31

32

Determinants of Cardio-vascular disease
and hypertension
33


Chapter 2: EPIGENOMIC MODEL OF CARDIAC ENHANCERS
WITH APPLICATION TO GENOME WIDE ASSOCI-
ATION STUDIES
2.1 Overview
Eukaryotic transcription is intricately regulated at multiple levels including
chromatin reorganization through epigenomic modifications and sequence specific
binding of transcription factors (TF) to either proximal promoter or to distal en-
hancer/repressor regions of the gene [89, 90]. Enhancers can regulate their target
genes from long distances, up to a megabase away and are especially important in
regulating developmental and tissue-specific genes [91, 92]. Numerous genome wide
association studies (GWAS) have revealed genomic loci associated with various hu-
man traits [93]. Going from association to causality is however a major challenge,
because a vast majority of GWAS signals lie in non-coding regions, often far from
any gene, and our understanding of functional consequences of non-coding mutations
is incomplete. It is possible that many of these associations are mediated via reg-
ulatory regions [94]. By investigating putative polymorphic enhancers near GWAS
signals, we might be able to identify the causal links between genetic variability
35

and disease, at least in some cases. Thus, both for our fundamental understand-
ing of transcriptional regulation as well as for interpretation of genotype-phenotype
relationships, a comprehensive knowledge of context-specific enhancers is critical.
Large scale identification of enhancers is challenging because they do not have
sufficiently discriminating sequence properties (except for their tendency to harbor
homotypic binding motifs [95]) and their location is not restricted relative to the lo-
cation of the target gene. Moreover, enhancers are often tissue and cell-type specific
and are detectable only under the appropriate conditions. Recent revolution in se-
quencing technologies have triggered several large scale profiling of epigenomic marks
and analysis of these marks have revealed strong associations between enhancers and
specific epigenomic marks (either positive or negative [96–98]). Using genome-wide
profiling of several epigenomic marks, Ernst et al. segmented the genome into 51
segment classes, where each segment class is defined by a specific combination of
epigenomic marks [96, 99]. They designated two of these segment classes as strong
and weak enhancers. Apart from epigenomic marks, histone acetylase P300 is known
to bind to tissue-specific enhancers, with high rate of experimental validation us-
ing mouse transgenic [98, 100]. However, it is argued that while P300 may mark
tissue-specific enhancers, those enhancers are not necessarily active in a specific
context [101]. This assertion is consistent with less than perfect validation rate of
P300 bound regions as enhancers. Despite this, previous approaches to predict en-
hancers have used P300 bound regions as the gold standard to assess the methods
prediction accuracy [102,103].
Here we report an SVM trained specifically on 83 validated cardiac enhancers
36

using four epigenomic profiles marks (H3K4me1, H3K27me3, P300 and DNase hy-
persensitivity) in human heart tissue. Our model achieves a cross-validation classi-
fication accuracy of 84% and 92% on positive and negative sets respectively. It was
encouraging that our model can distinguish validated enhancers from those that were
bound by P300 but failed to exhibit enhancer activity in transgenic mouse. Next,
starting with a comprehensive set of 229 SNPs associated with cardiac phenotypes
in 36 GWAS studies, we identified putative enhancers harboring SNPs in linkage
disequilibrium (LD) with the GWAS SNP. We found that our predicted enhancers
are enriched for binding sites for all known core cardiac transcriptional regulators
GATA, MEF2, STAT, NF-AT, Nkx, and FOX. Using a novel approach we show that
the predicted enhancers are likely to regulate the nearby gene. Our predicted en-
hancers uniquely point to a few genes highly relevant to the heart disease. Moreover,
these tendencies of having enriched cardiac transcriptional motifs and likelihood of
regulating nearby genes are more favorable for the predicted enhancers compared
with an approach that uses P300 binding as a marker of enhancer activity. Overall,
we show that a SVM model trained exclusively on validated enhancers performs
better than those that use P300 binding as gold standard and that GWAS studies
can be better interpreted in light of predicted polymorphic enhancers.
37

2.2 Background
2.2.1 Expression quantitive trait loci
Expression quantitative trait loci (eQTLs) identifies genetic variations that
determine the expression variation among individual in a population. And aim to
ultimately uncover underlying regulatory network that drives gene expression. [36].
Jansen et. al. first proposed the concept of eQTL mapping in 2001 [104]
and the first eQTL study was conducted on two yeast strains [105]. Since then,
eQTL have attained tremendous amount of attention in understanding of regulatory
variation and its consequence in humans and other species.
eQTL studies identifies genomic regions that effect the expression of on or more
genes. These are inferred based on population studies. Individual in population
vary at multiple loci from each other. In human, any two individual vary at rate
of 1 in 1300, i.e on average any two individual have different sequence at around
4.6 million loci in genome called Single polymorphic nucleotide (SNP). Most of the
variations in an individual are non-functional, i.e. they does not have any phenotypic
consequences. In order to capture large variation in regulation a population with
genetically different individual is required for conducting eQTL.
To conduct an eQTL study two types of data are required. First, DNA se-
quence information of the individuals in the population. This is usually accom-
plished by genotyping (such as SNP micro-array), if the sequence variant in the
population is known. Alternatively, with advances in high throughput technology
38

it is now possible to sequence whole genome of individual such that all variants are
collected. The whole genome sequencing approach is becoming more popular due to
decrease in cost of the sequencing. Further, it ensures that rare variants or individ-
ual specific variants are accounted. Second type of data needed for eQTL studies
are expression quantification of each gene in each of the individual. Micorarray and
RNA sequencing are two popular technologies to quantify gene expression. To es-
tablish association between a genomic variant and a gene expression by frequentist
appraoch, individuals are divided into groups according to the alleles for the variant.
The variant is associated with the gene if the gene has significantly higher expression
in one of the group compared to another. The test is conducted for for each variant
and gene combinations.
Cis and trans effects
Expression of a target gene can be directly modulated by an eQTL in its
regulators (such as in its enhancer and promoter). Alternatively, expression of a
target gene can also be modulated indirectly by an eQTL of another gene B (such
as transcription factor genes). The former type of eQTL lies in proximity of the
target gene and hence referred as cis-eQTL. The later type can lie any where within
genome and referred as trans-eQTL.
The successful eQTL will enable to understand of mechanism of gene regulation
and how a mis-regulation manifest into a disease and ultimately to devise personalize
treatment for patients. Amid advancement in next generation sequencing, recent
eQTL have been conducted on larger and larger sample size to detect the rare SNP
39

association with gene regulation. However, two fundamental problems remains : (i)
if the associations are causal (ii) if causal, then what is the mechanism by which a
SNP regulate its target. In the third chapter of the thesis, we propose an alternative
to eQTL to address both of the questions using a computation method by integrating
information pertaining to regulations to eQTL.
2.2.2 Genome wide association studies
The ultimate aim of Genome wide association studies (GWAS) is to determine
genetic risk of an individual to develop a disease and to underpin biological mech-
anism that underlies the genetic disease, so that it can be harnessed for prevention
and therapeutics [37].
Analogous to eQTL, it involves DNA sequencing of large population of in-
dividual with and without disease, followed by finding association between Single
nueclotide polymorphisms (SNPs) and the disease. The most popular frequentist
approach to infer association is to calculate p-value of correlation for the null hypoth-
esis (H0) of no association, although many sophisticated approaches are proposed
to overcome the shortcomings of the frequentist approach [?,106,107]. Factors such
as population structure are known to be confounder in association studies. Such
confounder factors are tackled by controlling for confounders in the sampled popu-
lation. Alternatively, many recent studies take into account the confounding factors
by explicitly modeling them in the association studies.
In one of the successful GWAS identified genetics disruption of CFH gene of
40

associated with age-related muscular destrophy (AMD). Not only they identified
the association but also they determine precisely how the disruption manifest into
AMD in an individual [108,109].
Besides studying several genetic diseases, multiple GWAS studies are con-
ducted to study various phenotypes. Many recent studies have identified genetic
determinants that leads to variation in the drug response [110,111]. For eg. Harper
et. al. identified genetic variants associated with variation of warafin dosage re-
sponse among humans [111]. The GWAS have been also studied to identify genetics
variation associated with non-deleterious phenotype such as height etc [112].
2.2.3 Epigenetics and regulation
Sequencing of human genome laid the foundation to understand information
stored in the genome. How this information is processed depends upon an additional
layer of heritable biological information referred as epigenetics that have only just
begun to be appreciated in past decade. The term epigenetics, which literally means
above or outside conventional genetics, is now used to describe information stored
in cell via chemical changes to cytosine and to the histones (proteins that regulates
how the genome is packaged inside a cell) [18]. In a cell, how the genome will be
finally read by the transcription machinery in the cells are maintained by these
chemical modifications. They modulate the chromatin structure making available
only part of the genome accessible to the machinery. Thus these modifications decide
cellular fate and how same genome manifests into diverse array of biological state,
41

in particular different developmental stages and disease states [21,113,114].
Beside developmental processes, epigenetic modifications are known to be asso-
ciated with two other processes (i) random changes and (ii) environmental changes.
Our understanding how an external factors regulate the epigenetic modifications and
in turn regulate the genome remains limited. However, it is clear now the epigenetic
processes are key mediators that regulates the modification to DNA itself or protein
associated with DNA [115]. The modifications are read and processed by specific
protein and mediates appropriate biological effects.
2.2.4 Epigenetic Modifications
Epigenetics modification occurs in four broad categories: (i) DNA methyla-
tion, (ii) histone modification, (iii) DNA accessibility and (iv) Transcription factor
binding. The CPG methylation occurs mostly at CpG dinucleotide and occur at
lower frequency in at embryonic stages [116] and decreases significantly in somatic
tissues [117]. Riggs et. al. first proposed DNA methylation could stabilize a par-
ticular gene expression pattern through mitotic cell division [118, 119]. Now DNA
methylation is recognized to regulator of the stability of gene expression states,
particularly in chromatin state silencing [120,121].
Histone are protein that is essential of DNA packaging in the cells, DNA wrap
around the histones to make primary cellular packaging. Histones undergoe around
100 different kind of post-translation modifications. The functionality of a histone
modification depends upon two factors type of modification (acetylation, methy-
42

lation, phosphorylation, and ubiquitination) and position of modification in the
histone tail. Most of the modifications are currently poorly understood. Modifica-
tions involving acetalyation are associated with DNA accessibility and transcription.
Modifications involving methylation comes in different flavors – H3K4 and H4K36
are associated with transcribed chromatin, on the other hand H3K9, (H3K27), and
H4K20 are associated with repression of gene transcription [18].
2.2.5 Epigenetic Inheritance
The epigenetic factors DNA methylation and histone modification are known
to heritable which is not encoded in the DNA. DNA methylation patterns known
to be propagated through cell division [21, 113]. In addition of DNA methylation,
compelling evidence supports the heritability of specific histone modifications in
multicellular organisms [122]. However, precise mechanism of histone modification
inheritance remains still elusive. It must be noted that heritability of the epigenetic
factor is much lower then DNA sequence, in other words during mitosis, accuracy
with which DNA is replicated (from parent to daughter cell) is several order higher
than epigenetic replication accuracy.
2.2.6 Support vector machines (SVM)
Support vector machines (SVMs) are supervised learning algorithms that among
most popular machine learning metod to perform classification. Here we briefly re-
visit basic of SVM.
43

Given the labeled training data xi, yi, i = 1, ..., n, where yi ∈ 1,−1 is label
and xi ∈ Rd are d dimensional features of training data i, the goal of support
vector machine is to identify best hyperplane that separates positive and negative
examples [123].
SVM assumes best hyperplane called ”separating hyperplane”, is a linear
model of form w · x + b = 0 (however, the separating plane is linear in trans-
formed (dual) space and not in feature space [123]). Where, w is normal to the
hyperplane. If d+ (d) be the shortest distance from a hyperplane to the closest pos-
itive (negative) example, the separating plane have the properties that it maximizes
the margin d+ + d− Fig 2.1. Therefore, SVM simply searches for the hyperplane
that maximizes the margin [123]. The maximization translates into quadratic pro-
gramming formulation. As seen in the Fig 2.1, in training examples that lies closest
to the separating plane, called as support vectors. They are defined as point in the
training examples whose removal will change the solution of SVM.
2.3 Methods
More on SVM and grid search criteria
In SVM, vector in original feature space is projected onto a higher dimensional
feature space using kernel function (usually non-linear). Because of this the data
which in original space is not linearly separable, may become separable in trans-
formed space, where the SVM tries to find a maximum margin hyperplane that
separates the positive and negative set in the kernel space. SVM, employs a struc-
44

d+ + d -
d+
d-
margin
Separating planewTx + b = 0
Figure 2.1: Support Vector Machine (SVM): SVM illustration for a linear separatecase. Red (green) dot are positive (negative) examples. Support vectors are circled.
tural risk minimization (SRM) method [124, 125] to obtain the hyperplane, which
tries to balance complexity of the model while minimizing the empirical risk. There-
fore, relative to traditional methods based on empirical risk minimization, SVM is
better suited to handle the problem of overfitting. SVM chooses a maximum mar-
gin hyperplane by identifying subset of training data (called support vectors), which
would be closer to the optimal separating plane. Support vectors are cases which
are most difficult to classify as positive or negative. Therefore to ensure good perfor-
mance of SVM classifier, it is necessary to have a set of extreme examples (in both
positive and negative example in the training set) that would qualify as support
vectors.
Our positive training set included 330 (80% of 415) regions while the negative
45

training set included 1000 regions. We weighted the positive and negative examples
to accommodate for the difference in sizes. An exhaustive search over the weight
space was conducted to obtain best possible cross-validation result on a tuning
set. The weight used for negative and positive set respectively was 1 and 1.2.
Furthermore, we defined our criteria for grid search based on the observation that
randomly sampled negative set may contain enhancer regions and therefore, it is
not desirable to minimize false positive rate to extreme. In addition, we required
that difference between two rates is below a fixed threshold. This is equivalent
to maximizing the F-score, while keeping difference of true positive (TP) and true
negative (TN) rate below a fixed threshold.
2.3.1 Correlating DNase Hypersensitivity and Gene Expres-
sion
To assess correlation of chromatin accessibility at a putative enhancer to ex-
pression level of a putative target gene, we extracted genome wide DHS as well as
RNA-seq data from 15 cell types from a single study (GSE29692, GSE23316) rep-
resenting a breadth of cell types HepG2, GM12878, A549, HeLa-S3, AG04450, BJ,
NHLF, NHEK, HUVEC, h1-Hesc, HMEC, HSMM, K562, MCF-7, SK-N-SH RA.
For the enhancer region we extracted the DHS tag density in each of the 15 cell
types using bigWigSummary tool. Correspondingly, for the putative target genes
we obtained the gene expression (RPKM) in the same set of cell types. We then
estimated the pearson correlation between DHS and gene expression as an indicator
46

of interaction between the enhancer and the gene.
2.4 Results
2.4.1 SVM model for cardiac enhancers
Data
Heart tissue was chosen for our analysis because of the availability of both
relevant epigenetic data (H3K4me1, H3K27me3, P300 and DNase hypersensitivity)
and validated human enhancers. We collected 83 experimentally heart enhancers
validated in mouse transgenic from VISTA browse and split them into 1kb regions
(step size 500 bps) to be used as positive training set. Negative set was constructed
by mixing random samples of 1 Kb long regions from the genome and randomly
selected promoters. H3K4me1, H3K4me3, H3K27me3, P300 and DNase-I epigenetic
markers, which have previously been shown to be associated with tissue-specific
enhancers, were collected for the heart tissue from the GEO database. For each
epigenetic mark we calculated its average signal strength across every 1 Kb genomic
region as feature vector of the region. In order to normalize the feature vectors of
the positive and negative set to zero mean and unit variance, we randomly sampled
40,000 1 Kb regions across the genome to estimate mean and variance of feature
vector.
47

Training
Epigenetic marks relevant to enhancers are relatively sparse in the genome. If
the negative example in the training set only included random regions then SVM
would choose subset of these inactive regions as its support vectors and would create
a classifier hyperplane separating inactive regions from any epigenetically active re-
gion, resulting in high false positive rate. Therefore, in our negative set, in addition
to random genomic regions, we added gene promoters as examples of epigenetically
active non-enhancer regions. Figure 2.2 shows the effect of varying the proportion
of promoters region in negative training set. In general, we found that a greater
proportion of promoters in negative set improves positive set accuracy with rela-
tively smaller decline in negative set accuracy, at least initially. This suggests that
including a small fraction of promoters in the negative training set results in a better
classification. Therefore, we constructed the negative training set by mixing 1000
random genomic regions and 250 randomly selected gene promoters.
Testing
We used 5-fold cross validation for positive set accuracy estimate. For negative
test set we randomly sampled 1000 1kb genomic regions. On performing grid search
(see Methods) to train the SVM model the average testing classification accuracy
on positive set was 84.1% and on negative set was 92%. The roc curve for the model
prediction is shown in Figure 2.3. The AUC of the model was 0.9231.
Despite some evidence to the contrary, a number of previous works have as-
48

Figure 2.2: Effect of variation of proportion of promoter region on accuracy of model.Two fold cross validation is used for positive set. Negative set accuracy is calculatedby running the trained model on large number of random 1 kb genomic regions notincluding those used for training.
sumed P300-bound regions to be active enhancers and used them as gold standards
to train and evaluate enhancer prediction tools. Next, we tested whether our model
trained on validated enhancer and oblivious of P300 binding can nevertheless distin-
guish active and inactive P300-bound regions. We tested our model with 12 P300
peaks in human heart which were found not to have enhancer activity [126]. Interest-
ingly, the model classified 10(83%) of these cases as non-enhancers. Although based
on a small set of examples, this suggests that our model can distinguish inactive
P300-bound regions from active enhancers.
Narlikar et al. [127] proposed a model based on specific motifs as features for
cardiac enhancer identification. To compare performance of our model with their’s,
49

Figure 2.3: ROC curve of SVM model
83 validated enhancers were separated into 60 training and 23 testing instances.
SVM was trained on the 60 instances. We extracted the 1Mb regions flanking each
of the 23 test enhancers and predicted enhancer in those genomic regions using the
trained SVM. We first checked how well P300 can retrieve the validated enhancers.
We found that there are only 69 P300 peaks in adult human heart in the 23 genomic
regions, out of which only one overlapped with a validated enhancer. In other words,
P300 peaks are poor predictor of enhancer activity in this context.
Using our trained SVM model we scored each 1 Kb region in the test set. Car-
diac enhancer predicted in Narlikar et al. [127] are typically much shorter. For fair
comparison with Narlikar et al. [127] (1) we extended each of their enhancer to 1
Kb region flanking the reported location, and (2) used a threshold on the enhancer
50

score such that the predictions made by our SVM and the Motif based model cover
almost the same number of enhancers (same basepair coverage as well due to exten-
sion) in the genomic test set. Among the 8522 enhancer regions predicted by the
SVM, 21 of the 23 validated enhancers were included, while among 8551 enhancer
regions predicted by Narlikar et al. [127] only 13 were covered. we repeated the
above comparison between our method, P300 peaks and Narlikar et. al. 10 times
with different sets of 60 training and 23 testing instances out of total 83 enhancers.
Figure 2.4 shows the number of enhancer predicted by each method across different
iterations.
Taken together, these results suggest that the SVM model trained on epige-
nomic data is more suitable for identifying cardiac enhancers than are P300 binding
or motif based models.
2.4.2 Identification of cardiac enhancers near SNPs associ-
ated with cardiac phenotypes
Next, we hypothesized that the causal variants underlying GWAS signals
might lie within an enhancer element and affect gene regulation. We tested this
hypothesis on SNPs associated with a variety of cardiomyopathies. Starting with
NHGRI’s GWAS catalog [93], which includes 1332 studies revealing 6852 SNPs,
we manually selected studies for cardiovascular disease traits. This yielded 229
SNPs from 36 studies. We then extended this seed SNPs set to include all other
SNPs in Linkage Disequilibrium (LD) with a seed SNP using Broad Institutes SNAP
51

different runs
Cor
rect
ly p
redi
cted
enh
ance
rs o
ut o
f 23
2 4 6 8 10
0
5
10
15
20
SVMP300Narlikar
Figure 2.4: Number of enhancers (out of 23) predicted by SVM, P300 peaks andNarlikar et. al.
server [128]. We included all SNPs within 500kb from a seed SNP with r2 ≥ 0.3. The
extended SNP were merged from the 1000 Genome Project and multiple HapMap
releases (Consortium 2003; Consortium 2010). For each of the resulting 14233 SNPs,
we scored 1kb flanking region using our SVM model to prioritize them as potential
cardiac enhancers. Of all SNPs, the SVM scored 1054 as having enhancer probabil-
ity ≥ 0.8. We found that distance of these enhancers from the corresponding GWAS
SNP was significantly shorter than expected (Wilcoxon p-value = 3.9E-05).
52

2.4.3 Cardiac enhancers near cardiac GWAS SNPs are en-
riched for cardiac regulator motifs
Cardiac transcription is primarily regulated by members of GATA, MEF2,
STAT, NF-AT, Nkx, and FOX families of TFs [129–132]. Next, we tested whether
predicted enhancers near GWAS SNPs are enriched for known cardiac TF binding
motifs. We first constructed three SNP sets: (1) eSNPs: comprised of the top
500 SNPs in LD with a GWAS SNP ranked by the SVM score, (2) pSNPs: the
top 500 SNPs in the LD with a GWAS SNP ranked by mean P300 tag density
(using bigwig summary tool from UCSC) in human heart, (3) gSNPs: The GWAS
SNPs themselves. For each SNP we extracted the 1kb genomic flanking region
resulting in three sets of sequences. For each sequence we determined the binding
sites corresponding to 981 vertebrate motifs in TRANSFAC [133] whose motif match
score (using our own tool [134]) was in the top 95th percentile of scores achievable
by that motif. We then determined the enriched motifs in one set of sequences
relative to the other using Fisher Exact Test. Because enhancers have distinctive
compositions which can bias motif enrichment, we normalized the two sequence sets
for their GC composition via random sampling prior to motif enrichment analysis.
When comparing SVM SNPs to the GWAS SNPs, 50 motifs were enriched with p-
value ≤ 0.05, 11 of which corresponded to multiple representatives of GATA, STAT,
NF-AT, Nkx families. When we compared the P300 SNPs with GWAS SNPs, among
the 34 enriched motifs with GATA, Nkx and STAT families were represented by 4
motifs. Importantly, when we compare SVM SNPs directly to the P300 SNPs,
53

GATA, FOX, MEF2 families of TF motifs were found to be enriched among the 32
enriched motifs. Figure 2.5 shows the top 50 motifs significantly enriched in SVM
SNPs compared to GWAS SNPs or P300 SNPs. When we restrict the motif search
to 20 bps flanking the SNP using same parameters, we still observe enrichment of
NF-AT and STAT motifs in SVM SNPs relative to GWAS SNPs. However similar
enrichment is also observed in P300 SNPs. It is possible that the SNP affect the
formation of cis regulatory modules indirectly. Further investigation is required. In
summary, all core cardiac TF families are enriched near eSNP loci, relative either
to GWAS SNPs or to P300-bound regions. The overall conclusion was comparable
when we used top 200 SVM scores and top 200 P300 score to be construct eSNP
and pSNP sets. We note that because of small numbers, the p-values were modest
and did not qualify a strict FDR threshold.
2.4.4 Cardiac enhancers near cardiac GWAS SNPs are likely
to regulate the nearby genes
Next we tested whether the predicted enhancers are likely to regulate genes.
While enhancers can in principle regulate non-neighboring genes, a majority of them
do regulate nearby genes [135], therefore, we focused only on the gene promoter clos-
est to the SNP. For a SNP locus and a gene promoter, we estimated the likelihood
of SNP locus to regulate the gene as the correlation between the DNase-I hypersen-
sitivity (DHS) at the locus and the expression of the genes across 15 cell types in
which DHS and RNA-seq was performed in parallel (see Methods); this approach to
54

(a) SVM VS GWAS (b) SVM VS P300
Figure 2.5: Significantly enriched motifs in SVM SNPs. The size of each TF labelis proportionsal to its significance. For instance, the p-value for GATA1 in (a) is0.001 and in (b) is 0.004. The largest p-value is 0.05.
link a putative enhancer to a target genes is similar to Ref. [99]. We constructed
three comparison SNP sets. gSNP comprised of 229 GWAS SNPs. To construct
eSNP set, we selected the SNP with highest SVM score in LD with each GWAS
SNP as long as the SVM score was ≥ 0.8, resulting in 115 eSNP, all of which were
intronic or intergenic. Similarly, to construct pSNP set, we selected the SNP with
highest P300 mean tag density in LD with each GWAS SNP as long as the P300
tag density was ≥ 1, resulting in 58 pSNP. For each SNP we obtained the closest
gene promoter. We then performed three pair-wise comparisons. For instance, when
comparing eSNPs with gSNPs, we focused on genes that were closest to both an
eSNP and a gSNP. Then we computed two DHS-expression correlations - between
55

eSNP locus and the gene and between gSNP and the same gene. Given all such
pairs of correlations we tested whether eSNP-gene correlation was greater than the
gSNP gene correlation using paired one-side Wilcoxon test. We found that eSNP
loci were more likely than gSNP loci to regulate the closest gene (based on 124 genes,
p-value = 0.03), eSNP loci were more likely than pSNP loci to regulate the closest
gene (based on 50 genes, p-value = 0.01), and pSNP loci were not more likely than
eSNP loci to regulate the closest gene (based on 23 genes, p-value = 0.87). We also
checked whether the distance of eSNPs from the closest gene promoter was shorter
than that for gSNP or pSNP and we did not observe a statistical difference. The
results suggest that SVM predicted enhancers are more likely to regulate the nearby
genes relative to both the original GWAS SNPs and P300 predicted enhancers.
2.4.5 Genes near cardiac enhancers are enriched for cardiac
function
Next we tested whether the genes uniquely closest to the eSNPs provide greater
insight into the cardiovascular disease phenotype, relative to genes uniquely closest
either to gSNPs or the pSNPs. We used the same criteria as above to obtain the
closest gene lists, but unlike the expression analysis above we retained only the
unique genes in each list. Unfortunately, the uniqueness requirement greatly reduced
the number of genes with 94 for gSNP, 17 for eSNPs and only 2 for pSNPs. We then
used ToppGene [136] to compare enrichment of disease categories in the three gene
lists. ToppGene uses three sources for disease ontology terms - GWAS, Comparative
56

Toxicogenomics Database, and OMIM. We excluded GWAS to avoid circularity. As
expected, the pSNP gene list did not show any enrichment. At FDR≤ 0.05 the genes
near gSNP also did not show enrichment for any disease term. The 17 genes in the
eSNP list include NOS3 and MYH7. NOS3 alone showed enrichment for 2 terms
- “Hypertension, Pregnancy-Induced” and “Coronary Vasospasm”. MYH7 alone
was enriched for 5 distinct terms from OMIM database, all immediately related to
myopathy or cardiomayopathy. The results are based on very limited dataset and
one cannot draw general conclusion but they suggest that SVM can uniquely lead
to genes directly relevant to the phenotype.
2.5 Conclusion
Here we present a SVM model for human cardiac enhancers based on four
epigenomic marks H3K4me1, H3K27me3, DHS and P300, each of which have pre-
viously shown to be associated with enhancers in various cell types. While P300
is known to bind to tissue specific enhancers [100], and have been used as the
gold standard for estimating accuracy of previous enhancer prediction approaches
[102,103,127], many P300 bound regions fail to exhibit enhancer activity [100,101].
Our SVM trained specifically on experimentally human cardiac enhancers validated
in trangenic mouse, can not only predict other validated enhancers with high accu-
racy, it can also distinguish validated enhancers from the regions that were bound
by P300 but failed to exhibit enhancer activity in transgenic mouse.
There are three prior approaches to predict enhancers. Narlikar et al. use
57

clusters of known cardiac TF motifs as predictor of cardiac enhancers [127]. Lee
at al. train a SVM model based on genomic features based on cardiac P300 bound
regions [102]. Another SVM model for CD4+ T-cell enhancers based on epigenomic
features, again, using P300-bound regions as the gold standard was proposed in
[103]. We have demonstrated the ability of our SVM model to distinguish between
active and inactive P300 bound sites. Additionally, direct comparison of prediction
accuracy on novel validated cardiac enhancers of our SVM model with that of P300
[102] and Narlikar et al. [127], explicitly shows that active enhancers have specific
epigenomic properties not captured just by P300 binding or by clusters of putative
binding sites. Genomic regions bound by P300 may not be active. Therefore, use
of additional features add the tissue specific context to the model. Furthermore,
kernel transformation of feature space used by SVM builds a non-linear classifiers.
Thus it captures a greater variety of enhancers by recognizing a wider combination
of epigenetic factors.
It has been previously suggested that a better knowledge of context-specific
enhancers can help interpret GWAS signals [96]. However, this reasonable assertion
has not been tested explicitly on a specific disease area. Here we use our enhancer
prediction tool to interpret GWAS studies related to cardiovascular phenotypes. We
found an enrichment of high scoring cardiac enhancers near cardiac GWAS SNPs.
Analysis of these putative enhancers suggest that (1) they are enriched for known
core cardiac transcription factor binding sites, (2) they are likely to regulate nearby
genes, and (3) they can uniquely point to certain genes involved with cardiac function
and heart disease.
58

Chapter 3: Bayesian integration of genetics and epigenetics detects
causal regulatory SNPs underlying expression variability
3.1 Introduction
Numerous expression Quantitative Trait Loci (eQTL) studies have been per-
formed to determine the cell-type-specific regulatory architecture of the human
genome [1]. However, since single nucleotide polymorphisms (SNP) within a linkage
disequilibrium (LD) region are statistically indistinguishable from each other, these
studies essentially reveal LD blocks that are associated with a genes expression but
do not reveal the potential causative regulatory SNPs, which limits the utility of
these studies [43,46,47,137,138]. The recent explosion of epigenetic data has made
it possible to detect cell-type-specific regulatory regions [43, 47–50], which can be
used to distinguish regulatory SNPs from non-regulatory SNPs in LD blocks.
Recently, a few approaches have incorporated regulation specific epigenetic
data into association studies [43, 47–51]. However, these methods have utilized the
regulatory information either retrospectively or as an empirical prior to prioritize
eQTL SNPs. Such approaches are prone to missing regulatory SNPs with small
effects due to the severe multiple testing correction (or sparsity constraints) [1].
59

Furthermore, these approaches ignore interaction between the region harboring the
SNP and the target gene, which is useful in identifying regulators specific to a
gene. Multiple SNPs are known to regulate single genes [139], yet many current
methods [49, 50, 139] limit the number of causal SNPs per gene to a single SNP. In
this paper, we introduce a new method, expression Quantitative Trait enhancer Loci
(eQTeL), which addresses these limitations. It identifies combination of regulatory
SNPs – including SNPs with small effect sizes – that jointly determine expression
variance.
eQTeL is a fully Bayesian approach (Fig. 3.1), which infers cis regulatory
polymorphisms underlying gene expression variability by integrating: (i) genotype
and gene-expression variance across individuals (ii) epigenetic data in appropriate
cell types [51, 52] (iii) DNAse I hypersensitivity (DHS) variance of SNPs and pro-
moters across cell types [17] (iv) expression variance of genes across multiple cell
types (v) linkage disequilibrium blocks [140], and (vi) imputed haplotypes inferred
from the 1000 Genomes Project [141]. Our approach addresses a number of key
methodological challenges. First, it systematically integrates three characteristics
of a causal regulatory eQTL, i.e, correlation with the target genes expression across
individuals, the regulatory properties of the harboring region, and interaction with
the target gene. Second, it can account for heterogeneity of regulatory regions in
terms of different combinations of epigenetic marks. Third, to learn the regulatory
model, eQTeL leverages regulatory polymorphisms that are not associated with gene
expression in addition to expression-regulators. Fourth, it interrogates the LD struc-
ture to find the optimal combination of explanatory SNPs. Fifth, it implements a
60

hierarchical scheme to select a sparse set of SNPs, while simultaneously explaining
a maximal fraction of gene expression variance. Finally, eQTeL is scalable to large
datasets.
We statistically validated our method using human heart data as well as real-
istic simulated data and demonstrated that it can predict an individual’s expression
from the genotype more accurately compared to other methods. SNPs identified
by our method include regulatory SNPs with small effect sizes. Further assessment
of functional relevance of identified SNPs suggest that they tend to (i) overlap a
high resolution DNAse footprint, (ii) have an allele-specific DNAse footprint, (iii)
preferentially disrupt putative binding of core cardiac regulators, and (iv) be spa-
tially proximal to their putative target gene. We also estimate that 58% of SNPs
identified by eQTeL (which we call eeSNPs, Supplementary Data 1) are likely to be
causal. Collectively, these results strongly suggest that eeSNPs have functional role.
3.2 Results
3.3 Quantitative Trait enhancer Loci (eQTeL) model
We first provide a broad overview of the eQTeL model and further details can
be found in Methods. As illustrated in Fig. 3.1, eQTeL is composed of two Bayesian
regression models, an expression model and a regulatory model, which are coupled
through message passing. The expression model is a Bayesian variable selection
model [142, 143] which explains the gene expression variance among samples as a
61

Input
SNP Expression LD block Epigene8cs & Interac8on
(ii) Effect size
(i) Regulatory variants (eeSNP)
(iii) Regulatory and interac8on poten8al
(iv) Epigene8cs and interac8on importance
Output
Expression model
eQTeL
Regulatory model
a
LD
LD LD
LD
SNP
Regulatory model
Epigene8cs +
Interac8on
Interac8ng regulators
Feature importance
For each gene
Expression model
Regulatory & interac8on Poten8als
Expression regulators
b
Figure 3.1: Overview of eQTeL model: (a) Input and output of eQTeL. eQTeL takesgenotype and gene-expression across samples, epigenetic and interaction features for eachSNP and LD block as input. It outputs regulatory SNPs and their target genes, their effectsizes and regulatory-interaction potentials, as well as estimated feature importance ofeach epigenetic and interaction feature. (b) eQTeL is composed of two coupled regressionmodels (i) a Bayesian variable selection with informative priors models expression as alinear combination of SNPs. Given the regulatory and interaction priors, this hierarchicalmodel first identifies LD blocks and then combinations of SNPs that explains expressionvariance and that also have high regulatory and interaction potentials. (ii) a Bayesianlogistic regression specifies the regulatory and interaction potential as linear model ofepigenetic and interaction features in semi-supervised manner. The logistic regressionpasses the regulatory and interaction potentials to the variable selection model, while thevariable selection model passes expression-regulators to the logistic regression model.
62

linear function of SNP alleles. A distinct feature of the expression model is that it
uses informative prior for each SNP, which depends on the SNPs regulatory [47] and
interaction potential. The regulatory model, which is common for all genes, uses a
Bayesian logistic regression [144] to estimate that informative prior as a probabilistic
function of epigenetic and interaction features. Known expression regulators can
be used to train the regulatory model, while an accurate model of regulatory and
interaction potential can help to identify expression regulators. The expression
model then passes current estimates of expression regulators to the regulatory model,
which in passes current estimates of regulatory and interaction priors for each SNP
back to the expression model. eQTeL starts with estimating expression regulators
assuming equal priors for each SNP and then, using current estimates of expression-
regulators, trains the regulatory-model. In turn, current estimates of regulatory
and interaction potential are used as informative priors to re-estimate expression
regulators. This iterative process continues until convergence. Thus, our eQTeL
model gradually improves estimation accuracy by joint learning.
In our approach (see equations below and Methods for details), expression Y
relates to candidate SNPs X via a standard normal linear model [142,145,146] with
noise σ2. However, for each SNP β, its effect size is non-zero only if its regulatory-
interaction indicator γ is 1, which depends on a function φ ′(θ) of regulatory-
interaction potential θ (Methods). The potential θ of a SNP is modeled as a combi-
nation of (i) features for regulatory potential and (ii) features for SNP-gene inter-
action P, via a logistic function. Vector α represents feature weights that are shared
across all genes, thus we learn a single genome wide model of regulators. This choice
63
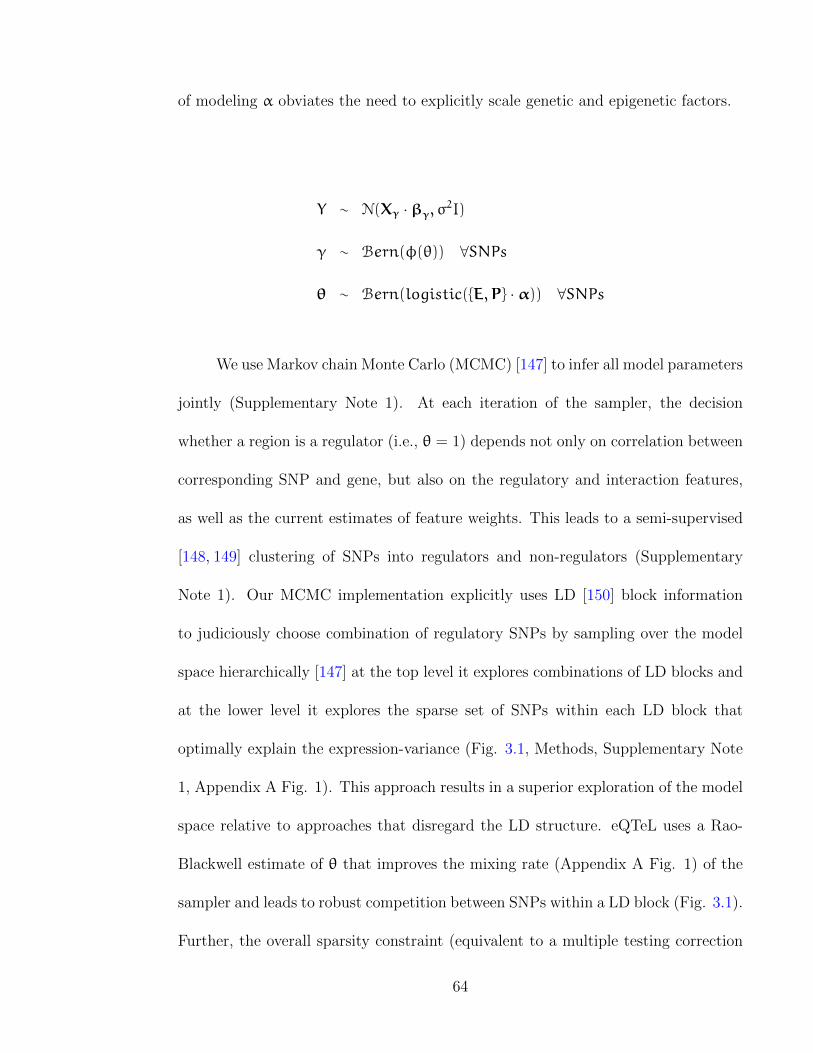
of modeling α obviates the need to explicitly scale genetic and epigenetic factors.
Y ∼ N(Xγ · βγ, σ2I)
γ ∼ Bern(φ(θ)) ∀SNPs
θ ∼ Bern(logistic(E,P · α)) ∀SNPs
We use Markov chain Monte Carlo (MCMC) [147] to infer all model parameters
jointly (Supplementary Note 1). At each iteration of the sampler, the decision
whether a region is a regulator (i.e., θ = 1) depends not only on correlation between
corresponding SNP and gene, but also on the regulatory and interaction features,
as well as the current estimates of feature weights. This leads to a semi-supervised
[148, 149] clustering of SNPs into regulators and non-regulators (Supplementary
Note 1). Our MCMC implementation explicitly uses LD [150] block information
to judiciously choose combination of regulatory SNPs by sampling over the model
space hierarchically [147] at the top level it explores combinations of LD blocks and
at the lower level it explores the sparse set of SNPs within each LD block that
optimally explain the expression-variance (Fig. 3.1, Methods, Supplementary Note
1, Appendix A Fig. 1). This approach results in a superior exploration of the model
space relative to approaches that disregard the LD structure. eQTeL uses a Rao-
Blackwell estimate of θ that improves the mixing rate (Appendix A Fig. 1) of the
sampler and leads to robust competition between SNPs within a LD block (Fig. 3.1).
Further, the overall sparsity constraint (equivalent to a multiple testing correction
64

in non-Bayesian approaches) of eQTeL is controlled by two factors: (i) the fraction
of SNPs that are interacting-regulators and (ii) the fraction of interacting-regulators
that are expression-regulators. This allows for a less conservative sparsity constraint
and makes it possible to identify SNPs with small effect sizes which are typically
missed by alternative approaches due to severe multiple testing correction. eQTeL
assumes Normal priors on α. Finally, eQTeL implementation allows an option to
select a subset of epigenetic factors important for estimating regulatory potential
through Bayesian variable selection model.
3.4 eQTeL detects expression regulatory SNP in
MAGNet
We applied eQTeL to genotype and gene expression data for 313 human hearts
(procured by MAGNet consortium (www.med.upenn.edu/magnet/)) and compared
to the performance of other eQTL methods (Supplementary Note 2 & 3). To deter-
mine regulatory and interaction potentials, we used 95 epigenetic and interaction
features (Appendix A Fig. 2) for primary tissues and cell lines of heart from EN-
CODE and Roadmap Epigenome project [51, 52]. For expediency we selected 1880
genes with expression deemed to have a significant genetic component according to
the univariate eQTL [139,151].
Consistent with its ability to explain a greater expression variance, eQTeL also
predicts expression of genes much more accurately compared to other methods (Fig.
65

Figure 3.2: Comparative performance of different methods applied to human heart data(MAGNet). The analysis is based on 2428 SNPs identified by eQTeL for which posteriorprobability of selection > 0.5. To ensure the same total number of SNPs selected by eQTeL,eqtnminer and LASSO: for eqtnminer we sort SNPs based on posterior probability andfor LASSO based on absolute estimated effect size and then selected top 2428 SNPs. (a)Explained expression variance based on three representative methods on human heartdata. (b) Accuracy of predicted expression of three methods. (c) Explained expressionvariance for human heart data by potentially functional (approximated by overlap witha footprint) genotyped SNPs and imputed SNPs. (d) Cross-dataset generalization ofMAGNet eeSNPs: Expression predictability in GTEx by eeSNPs identified in MAGNet.
66

3.2b). The mean (cross-validated) Pearson correlation coefficient between predicted
and actual expression is 0.176 -+ 0.065 (in contrast with 0.025 for eqtnminer [49]
and 0.088 for LASSO [152]). The bimodality of distribution of correlation coefficient
implies that for a subset of genes, the expressions are highly predictable by eQTeL.
Because of its ability to discriminate among multiple SNPs based on regulatory
and interaction potentials, eQTeL is expected to be much more advantageous on
imputed data, which has a substantially greater number of linked SNPs. To confirm
this, we imputed [153] around 6.5 million SNPs using the 1000 Genome Project
data [141]. Note that each imputed SNP is derived from the reference SNPs using
the linkage information, and cannot be any more associated (in a statistical sense)
with the gene expression than the reference SNPs, and therefore are not expected to
increase the explained variance (as evident from Fig. 3.2c). However, eQTeL with
imputation is expected to improve detection of causal functional SNPs compared
with the genotyped SNPs [51, 139]. Therefore, restricting our search to potentially
functional SNPs, imputed SNPs should explain the expression better. Restricting
our analysis only to SNPs mapped to a DNAse footprint (as a proxy for putative
functional SNPs), the relative advantage of imputation with eQTeL becomes evident
(Fig. 3.2c). Indeed, with imputed data, there is no significant improvement in
detection of likely causal SNPs if standard eQTL approaches are used. Therefore it
becomes imperative to use an integrative approach, such as eQTeL, in the presence
of a large number of linked SNPs (Fig. 3.2c).
To validate eeSNPs in an independent cohort, we analyzed expression and
genotype of 85 Left ventricle samples from GTEx [1] (Supplementary Note 2). We
67

note that compared to an exhaustive eQTL, eQTeL cannot identify novel associated
loci, but instead is designed to identify putatively causal SNPs within an associated
locus. We found that 18.9% of eGenes detected in MAGNet replicates in GTEx
(Supplementary Data 2). To assess the relative generalizablity of eQTeL in inde-
pendent cohort, using the eeSNPs identified by eQTeL in MAGNet, we estimated
the explained variance in GTEx. We repeated this for other methods while control-
ling for the number of eeSNPs as well as other regularization procedures. While, as
expected due to the differences in the datasets, the cross-cohort explained variance
is lower than that within MAGNet (Fig. 3.2b versus 3.2d), relative to other meth-
ods, eQTeL exhibits substantially and significantly greater (in both cases Wilcoxon
test p-value between eQTeL and other methods is < 1.0e− 16) cross-dataset gener-
alizability (Fig. 3.2d, Appendix A Fig. 3).
3.5 eQTeL detects causal SNPs in semi-synthetic
data
To demonstrate that eQTeL can accurately identify putatively causal SNPs,
we use a synthetic data evaluation (Fig. 3.3a) (for additional details refer to Meth-
ods). We used 174800 SNP probes along with their genotypes from 313 MAGNet
samples that were within 1MB from transcription start of 200 genes (Methods).
Since regulatory region may have no effect on genes included in our analyses and
yet can contribute to learning the regulatory-model, eQTeL makes a distinction
68
between a regulator and a gene-specific expression-regulator. This distinction was
made explicitly in our simulation by designating 1% of all SNPs as regulators (as an
approximation of previous estimation in humans [154]). We then used a frequency
distribution of expression regulators per gene inferred from MAGNet data to ran-
domly choose gene specific expression-regulators for 200 genes. Using allele status
of 313 samples for expression-regulators, we generated gene expression and added
random noise such that expected explained variance from simulated data matched
MAGNets explained variance (Fig. 3.2a). We generated the epigenetic features
for each SNP using ENCODE epigenetic data and validated heart-enhancers from
VISTA [47]. Thus our simulated data closely parallels the experimental data.
Next we applied eQTeL to the simulated data. The precision-recall plot (Fig.
3.3b) shows that eQTeL significantly outperforms other methods. In fact, the per-
formance of full-eQTeL is close to the theoretically best eQTeL model that uses
the original feature weights (see Methods). The previous integrative method eqt-
nminer [49, 50], the only other current method that uses epigenetic data in eQTL,
shows only a modest increase in precision compared to methods that do not use
epigenetic data.
The immediate effect of increase in precision of detecting expression regula-
tors, especially for SNPs with high regulatory potential, is that eQTeL explains a
significantly greater proportion of expression variability (Appendix A Fig. 4). There
is also significant improvement in correlation between predicted expression and ac-
tual gene expression; mean correlation for eQTeL was 0.298 -+ 0.02 (compared to
0.18 for eqtnminer and 0.23 for LASSO regression, Appendix A Fig. 5). Note that
69

Figure 3.3: eQTeL identify causal SNP accurately in semi-simulated data. (a)Design of simulaton study: Simulation study uses (i) 174800 SNPs from MAGNet Geno-type (874 SNPs per gene) data for 313 samples (ii) distribution of number of expression-regulators per gene from MAGNet data (iii) distribution of explained expression varianceestimated from MAGNet data (iv) ENCODE epigenetic data for heart cell lines, and (v)distribution of epigenetic data for regulators VISTA heart enhancers. Expression regula-tors per gene were chosen amongst regulators (1% of MAGNet SNPs). Using allele statusof expression regulators in 313 samples expression of 200 genes was generated such thatexplained variance distribution matches MAGNets explained variance. Epigenetic datafor regulators were generated using the epigenetic distribution estimated from VISTAheart enhancers. (b) Comparative performance assessment on simulated data. Methodsinclude (i) Matrix-eQTL (univariate-eQTL): univariate regression (Lappalainen et. al.),(ii) LASSO: L1 regularizer multivariate regression, (iii) variable selection: Bayesian vari-able selection, (iv) eqtnminer: Bayesian variable selection with empirical-priors (Gaffneyet. al.), (v) epigenetic-only: epigenetic feature weights derived from verified enhancersand used to prioritize SNPs, (vi) eQTeL: proposed method, (vii) known-epigenetic-priors-eQTeL: eQTeL with fixed epigenetic priors as in epigenetic-only. Number of SNPs eachmethods were controlled.
70

for this analysis we controlled for the number of SNPs that were selected for each
method, using the most explanatory respective SNPs for each method. Overall,
eQTeL can accurately identify around 75% of putative causal SNPs (at 40% recall)
reinforcing the fact that our method can identify substantial fraction of likely causal
genetic determinants of transcriptomic variance.
3.6 eQTeL detects SNPs with small effect sizes
The statistical power to detect SNPs associated with expression variance (i.e.,
the probability of correctly rejecting the null hypothesis that the SNP is not asso-
ciated with gene expression) depends on various factors such as sample size, noise
to signal ratio, number of hypothesis tested (number of SNPs) and effect size of
SNP. The effect size, in turn, depends on the allele frequency of SNP, thus low al-
lele frequency limits statistical power to detect regulatory SNPs [1, 155]. Another
advantage of eQTeL model is that it can detect SNPs with small effect sizes by
distributing sparsity between: (a) sparsity in the number of regulators and, (b)
sparsity in expression regulators among all regulators. eQTeL employs relatively
relaxed sparsity constraints for SNPs that have high regulatory potential and there-
fore the model has higher statistical power to retrieve a greater fraction of SNPs
with low minor allele frequency (small effect sizes) compared to eqtnminer (Fig.
3.4). Furthermore, eQTeLs statistical power to identify low minor allele frequency
SNPs is greater among SNPs with high regulatory-interacting potential (labeled as
eQTeL-high in Fig. 3.4). This trend of differential statistical power is also observed
71

in simulated data, where we know the exact effect size of regulatory SNPs (Appendix
A Fig. 6).
eQTeL leverages LD information to judiciously choose combinations of SNPs
(per gene) which explains a much greater proportion of expression variance (details
in Supplementary Note 2). The power to detect SNPs with low allele frequency is
the primary reason that eQTeL captures substantial proportion of causal genetic
determinants underlying transcriptomic variance. However, it should be noted that
SNPs with small effect sizes are only detected by eQTeL if they have a high regula-
tory potential.
eQTeLs performance gain is potentially due to two factors: (i) integration
of epigenetic data, (ii) allowing multiple causal variants per gene [156]. We as-
sessed relative contribution of the two factors. eQTeLs expression predictability by
functional SNPs increases substantially when multiple SNPs per gene were allowed
(Appendix A Fig. 3.7, Supplementary Note 2), supporting a contribution due to
multiple explanatory SNPs. However, in the absence of epigenomic data, i.e., when
using standard LASSO, we do not see a performance gain, and in general, the per-
formance is substantially worse than the performance of eQTeL. This suggests that
allowing multiple SNPs per gene is useful specifically when functional information
is used.
72
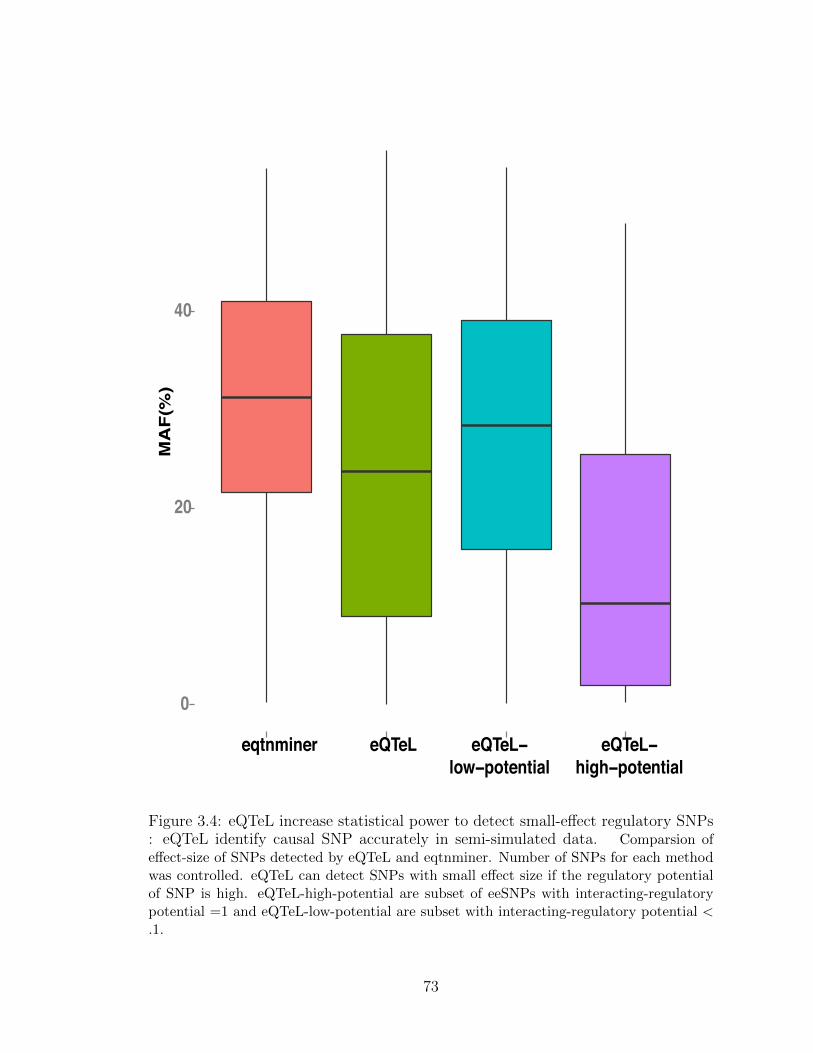
0
20
40
eqtnminer eQTeL eQTeL−low−potential
eQTeL−high−potential
MA
F(%
)
Figure 3.4: eQTeL increase statistical power to detect small-effect regulatory SNPs: eQTeL identify causal SNP accurately in semi-simulated data. Comparsion ofeffect-size of SNPs detected by eQTeL and eqtnminer. Number of SNPs for each methodwas controlled. eQTeL can detect SNPs with small effect size if the regulatory potentialof SNP is high. eQTeL-high-potential are subset of eeSNPs with interacting-regulatorypotential =1 and eQTeL-low-potential are subset with interacting-regulatory potential <.1.
73

3.7 eeSNPs lie within protein-bound genomic re-
gions
Putative causal regulatory SNPs are expected to be bound by regulatory pro-
teins. Earlier studies have shown enrichment of regulatory elements near causal
SNPs [48–50,139]. Since eQTeL and eqtnminer use epigenetic data, which is known
to be correlated [51] with protein binding, we expect to find enrichment of DNAse
footprints near the identified regulatory SNPs. Using genome-wide high-resolution
DNAse footprint data for 41 cell types [157], we obtained the fraction of eeSNPs
(and control SNPs) overlapping with a footprint; Note that DNAse footprints were
not used in eQTeL so they could be used for validation. 76.3 % of eeSNP have a
footprint overlapping the eeSNP (Fig. 3.5), in contrast to 6.3% of in SNPs detected
by eqtnminer that uses same epigenetic data as eQTeL. The performance of eqtn-
miner did not improve even if the best SNP per gene were chosen for this analysis.
For SNPs chosen by LASSO, which does not use epigenetic data, only 5.95 % of
SNPs have overlapping DNAse footprints. Only 2% of SNPs identified by Lirnet
(for 200 genes) overlap with the DNAse footprints (Appendix A Fig. 3.8). Using
top 8 epigenetic features estimated from eQTeL allowed to improve performance of
eqtnminer, but could not bring it up to eeSNPs enrichment level (Appendix A Fig.
9 & Supplementary Note 4). Notably, the DNAse footprint enrichment is high in the
four heart-related cell types. This result suggests that majority of SNPs identified
by eQTeL coincide with regions of in vivo protein binding and are at least 12 fold
74

more likely to be functional than the next closest method.
3.8 eeSNPs exhibit binding and regulatory allele
specificity
To ascertain the functional role of eeSNPs, we checked whether the change of a
SNPs allele would affect their regulatory properties (such as protein binding, histone
modifications etc.). For each cell line, we selected heterozygous SNPs by inspecting
genotyped data or pooled reads from different histone modifications, DNAse-seq
and CTCF. We first assessed allelic differences in footprint reads for human cardiac
myocyte (HCM) (see Methods). As shown in Fig. 3.6, the eeSNPs that overlap
a footprint show significantly greater (with odd-ratio of M = 3.005 and p-value <
3.83E-17) allele-specificity relative to SNPs identified by eqtnminer, consistent with
eeSNP having a regulatory impact (allele-specifity comparison with LASSO is shown
in Appendix A Fig. 10). For eeSNPs, we obtained 6.57-fold more reads mapping
to the allele with more DNA-seq reads compared to the other allele (for eqtnminer,
the average read difference was 1.8). We also found higher allele specificity for
eeSNPs in other heart cell lines (Appendix A Fig. 11, HCF, SKMC) for DNASe-Seq
reads. The trend of higher allelic specificity is also true in heart cell lines for histone
modification H3K4me3, which is associated with active enhancers (Appendix A Fig.
12). Allele-specificity of eeSNPs suggests that they may underlie population variance
in gene expression.
75
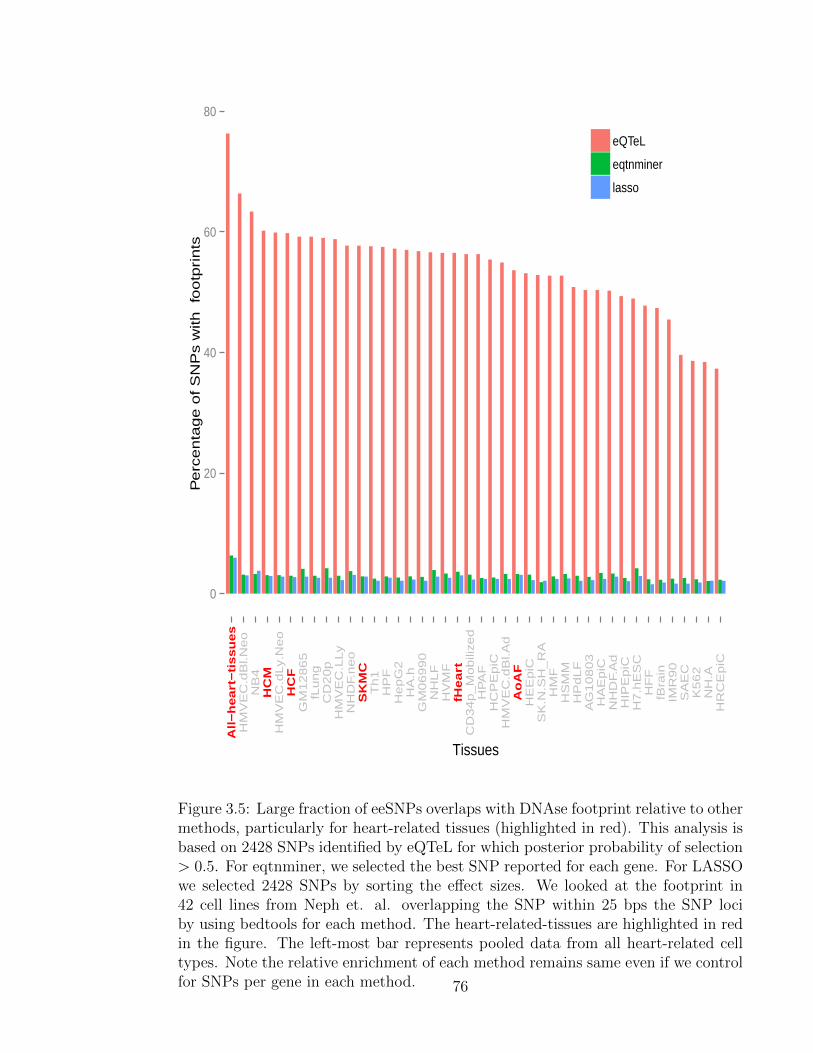
0
20
40
60
80
All−
he
art
−tissu
es
HM
VE
C.d
Bl.N
eo
NB
4H
CM
HM
VE
C.d
Ly.N
eo
HC
FG
M1
28
65
fLu
ng
CD
20
pH
MV
EC
.LLy
NH
DF.
ne
oS
KM
CT
h1
HP
FH
ep
G2
HA
.hG
M0
69
90
NH
LF
HV
MF
fHe
art
CD
34
p_
Mo
bili
ze
dH
PA
FH
CP
Ep
iCH
MV
EC
.dB
l.A
dA
oA
FH
EE
piC
SK
.N.S
H_
RA
HM
FH
SM
MH
Pd
LF
AG
10
80
3H
AE
piC
NH
DF.
Ad
HIP
Ep
iCH
7.h
ES
CH
FF
fBra
inIM
R9
0S
AE
CK
56
2N
H.A
HR
CE
piC
Tissues
Pe
rce
nta
ge
of S
NP
s w
ith
fo
otp
rin
ts
eQTeL
eqtnminer
lasso
Figure 3.5: Large fraction of eeSNPs overlaps with DNAse footprint relative to othermethods, particularly for heart-related tissues (highlighted in red). This analysis isbased on 2428 SNPs identified by eQTeL for which posterior probability of selection> 0.5. For eqtnminer, we selected the best SNP reported for each gene. For LASSOwe selected 2428 SNPs by sorting the effect sizes. We looked at the footprint in42 cell lines from Neph et. al. overlapping the SNP within 25 bps the SNP lociby using bedtools for each method. The heart-related-tissues are highlighted in redin the figure. The left-most bar represents pooled data from all heart-related celltypes. Note the relative enrichment of each method remains same even if we controlfor SNPs per gene in each method. 76

0
1
2
3
4
5
0.00 0.25 0.50 0.75 1.00A = rank of total reads for both SNP alleles
M =
a
llelic
im
ba
lan
ce
(ab
so
lute
lo
g−
ratio
of
rea
ds m
ap
pin
g to
SN
P a
llele
s )
eqtnminer
3sd 2sd 1sdeQTeL
Figure 3.6: DNAse hypersensitivity at eeSNPs shows greater allele specificity inHCM: X axis: rank of DHS read counts, Y axis: absolute log-ratio of read countsmapping to the two alleles at a SNP. SNPs from different methods are selectedsimilarly to Fig 5. The analysis was performed on a subset of SNPs that wereheterozygous in the sample. The median white lines represent LOESS (local regres-sion) for each method. Confidence intervals for each median line is estimated usingbootstrapping and are represented either by thin lines representing the LOESS ofeach bootstrap or by colored shades representing confidence intervals in terms ofstandard deviation of bootstraps. Note the allele-specificity at SNPs detected byeQTeL and eqtnminer remains the same even if we control for number of SNPs pergene.
77

3.9 eeSNPs are spatially proximal to their target
gene
The spatial proximity of eeSNP with its target promoter is a pre-requisite for
cis-regulation. Spatial proximity has been experimentally determined using chro-
matin interaction analysis with paired-end tags (ChIA-PET) assays [158]. Identified
SNPs that were closer than 100 bps from their target promoters were excluded. We
quantified spatial proximity of each eeSNP and its target by the number of pair-end
reads supporting the proximity, whereby one of the reads overlaps with the target
promoter and other read overlaps with the eeSNP. Analysis of pooled ChIA-PET
data from various cell types suggests that, relative to controls, eeSNPs are signifi-
cantly more proximal to their target genes (Fig. 3.7). This implies that eeSNPs are
more likely to be cis-regulators of their target genes.
3.10 eeSNPs disrupt motifs of cardiac transcrip-
tion factors
A likely mechanism by which a regulatory SNP may affect gene expression
is by disrupting binding of specific transcription factors [159]. For each of the 981
vertebrate TF motifs annotated in the TRANSFAC database [160], we quantified
(see Methods) the TF binding score difference between two alleles of eeSNP. We
only considered the SNPs for which the score was significant for at least one of the
78

25
50
75
100
125
2 3 4 5Distance between SNP and target promoter (in log)
Ch
IA−
PE
T r
ea
ds m
ap
pin
g t
o S
NP
pro
mo
ter
pa
irs eqtnminer
Random SNP promoter pairs
3sd 2sd 1sdeQTeL
Figure 3.7: eeSNP-gene pairs are spatially proximal. X axis: the rank of eeSNP-genedistance (log 10), Y axis: ChIA-pet support. SNPs from eQTeL and eqtnminer areselected as in Fig 8. The random SNP-gene pairs were selected so as to have thesame distance distribution as for eeSNPs. SNP-gene pair closer to 100bps were ex-cluded. The median white lines represent LOESS (local regression) for each method.Confidence was estimated for each method just as in Fig. 3.6.
79

alleles. As shown in Fig. 3.8, the core cardiac TF motifs (such as FOX, NKX,
GATA) are among the TF binding motifs that are most likely to be disrupted by
eeSNPs. This observation indicates that functional consequence of regulatory SNP
might be heart specific. The disruption of STAT, MEF2, FOX, NKX and GATA
transcription factor families are known to play important role in cardio-vascular
diseases [47, 161–163]. This suggests that identified eeSNPs may have a specific
transcriptional role in the heart.
3.11 Proportion of eeSNPs that are causal
In the absence of extensive experimental data, it is difficult to estimate the
proportion of eeSNPs that are causal. However, similar to a previous approach [139],
we used the proportion of eeSNPs that disrupt potential TF binding relative to the
same for high-confidence putatively causal SNPs, as an independent estimate of
proportion of eeSNPs likely to be causal (see Methods). Based on each TF motif,
that was found to be preferentially disrupted by eeSNPs above, the proportion of
eeSNPs estimated to be causal varied from 17% to 93%, with a mean estimate of
58% (Methods, Appendix A Fig. 12). Lastly, based on mammalian conservation
data, we found that eeSNPs are more conserved than control SNPs (Appendix A
Fig. 13).
80

0.0
0.5
1.0
1.5
2.0
HF
H4
_(F
OX
J1
)P
OU
6F
1E
vi−
1.1
Nkx3
−1
HO
XA
13
HN
F3
A (
FO
XA
1)
AP
−3
PX
R_
(PX
R:R
XR
)E
vi−
1.2
HF
H3
_(F
OX
I1)
ER
PN
RE
vi−
1.3
GATA
−3
XF
D−
1R
BP
−Jka
pp
aN
kx2
−2
Brn
−2
GATA
−1
FO
X_
facto
rsH
OX
B3
ISG
F−
3A
RE
B6
Dlx
−2
IPF
1M
AZ
RG
ATA
−4
RX
R:L
XR
−b
eta
Blim
p−
1C
TF
1F
rea
c−
3IC
SB
PM
RF
−2
RF
XM
EF
−2
.1FA
C1
ME
F−
2.2
TF
Diffe
ren
tia
l b
ind
ing
ra
tio
Known core cardiac TF
Putative cardiac TF (from literature)
Figure 3.8: Regulatory motifs disrupted by eeSNP include several cardiac TFs. Onlythe motifs with average allele-specific binding score ratio ¿ 1.5 and Wilcoxon testp-value < 0.05 are shown, ordered by the ratio. Motifs corresponding to knowncardiac TF families are shown in red and additional motifs with literature evidenceof involvement in cardiac development or function are shown in blue.
81
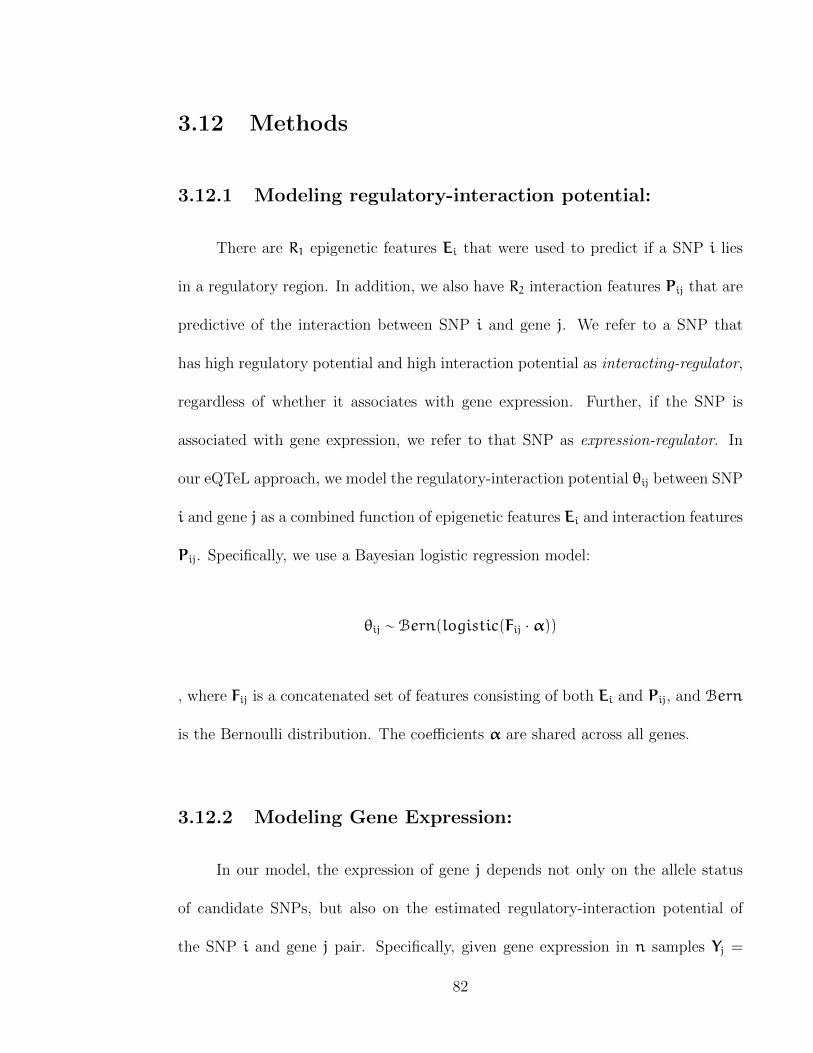
3.12 Methods
3.12.1 Modeling regulatory-interaction potential:
There are R1 epigenetic features Ei that were used to predict if a SNP i lies
in a regulatory region. In addition, we also have R2 interaction features Pij that are
predictive of the interaction between SNP i and gene j. We refer to a SNP that
has high regulatory potential and high interaction potential as interacting-regulator,
regardless of whether it associates with gene expression. Further, if the SNP is
associated with gene expression, we refer to that SNP as expression-regulator. In
our eQTeL approach, we model the regulatory-interaction potential θij between SNP
i and gene j as a combined function of epigenetic features Ei and interaction features
Pij. Specifically, we use a Bayesian logistic regression model:
θij ∼ Bern(logistic(Fij · α))
, where Fij is a concatenated set of features consisting of both Ei and Pij, and Bern
is the Bernoulli distribution. The coefficients α are shared across all genes.
3.12.2 Modeling Gene Expression:
In our model, the expression of gene j depends not only on the allele status
of candidate SNPs, but also on the estimated regulatory-interaction potential of
the SNP i and gene j pair. Specifically, given gene expression in n samples Yj =
82

(Yj1, . . . , Yjn), we model the vector of expression Yj for gene j as a linear function of
the allele status for all candidate SNPs, X = X1, · · · , Xp where Xi is allele status
of SNP i over the n samples:
Yj|βj,X,γj ∼ N(Xγ,j · βγ,j, σ2j I), (3.1)
where the effect βij of SNP i on the expression of gene j is nonzero only when
indicator variable γij = 1. In other words, γij = 1 signifies whether SNP i is
associated with the expression of gene j. Xγ,j ( and βγ,j ) refers to a subset of SNPs
for which γij = 1.
If a SNP lies within a genomic region that is deemed to be (i) a regulator, and
(ii) interacting with the target gene, then the SNP is likely to affect the gene’s ex-
pression. Thus, the regulatory-interaction potential for each pair of SNP i and gene
j enters our gene expression model through the prior distribution on the indicator
variables γij,
γij|φ(θij) ∼ Bern(φ(θij)) ∀ SNPs i (3.2)
where the function φ(θ) is defined so that φ(θ) = πθπ1−θ0 = π/ρ1−θ with π being
our prior probability for each SNP to be expression-regulator and let π0 = π/ρ
be the prior probability when the SNP does not reside in such a region, where ρ
is an amplification factor. An uniform prior for π ∈ (m/e,M/e) is defined where
m and M are respectively the minimum and the maximum number of expected
83
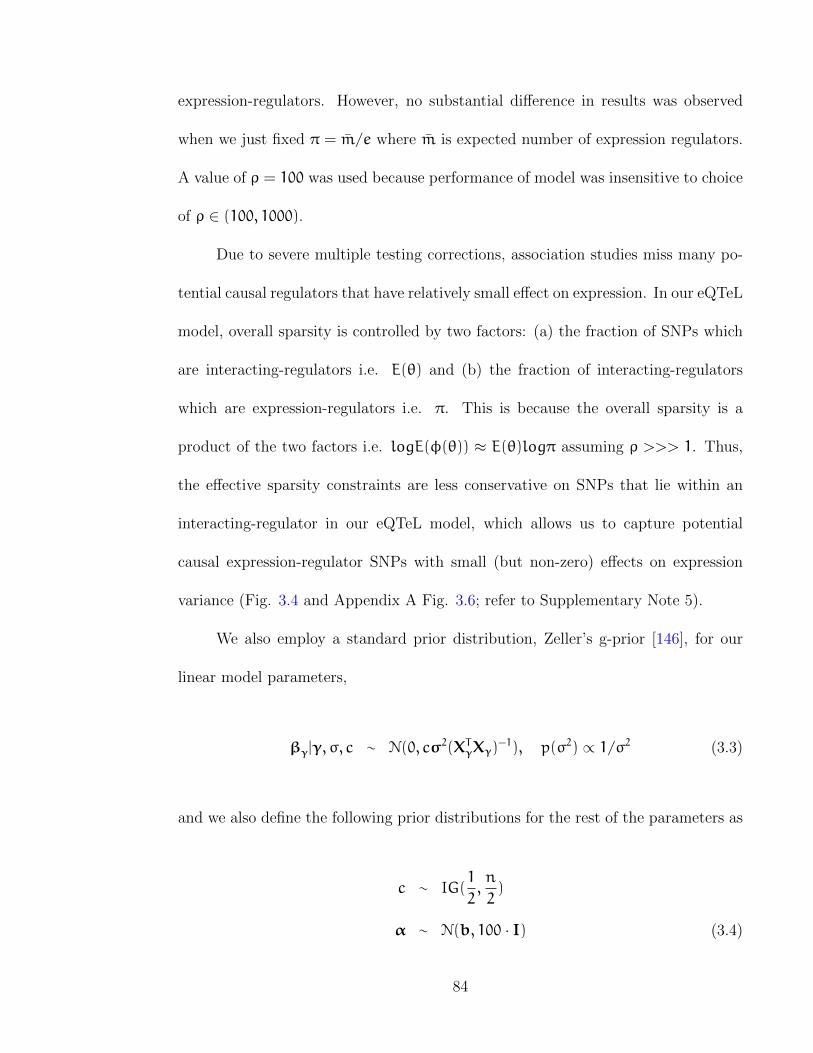
expression-regulators. However, no substantial difference in results was observed
when we just fixed π = m/e where m is expected number of expression regulators.
A value of ρ = 100 was used because performance of model was insensitive to choice
of ρ ∈ (100, 1000).
Due to severe multiple testing corrections, association studies miss many po-
tential causal regulators that have relatively small effect on expression. In our eQTeL
model, overall sparsity is controlled by two factors: (a) the fraction of SNPs which
are interacting-regulators i.e. E(θ) and (b) the fraction of interacting-regulators
which are expression-regulators i.e. π. This is because the overall sparsity is a
product of the two factors i.e. logE(φ(θ)) ≈ E(θ)logπ assuming ρ >>> 1. Thus,
the effective sparsity constraints are less conservative on SNPs that lie within an
interacting-regulator in our eQTeL model, which allows us to capture potential
causal expression-regulator SNPs with small (but non-zero) effects on expression
variance (Fig. 3.4 and Appendix A Fig. 3.6; refer to Supplementary Note 5).
We also employ a standard prior distribution, Zeller’s g-prior [146], for our
linear model parameters,
βγ|γ, σ, c ∼ N(0, cσ2(XTγXγ)−1), p(σ2) ∝ 1/σ2 (3.3)
and we also define the following prior distributions for the rest of the parameters as
c ∼ IG(1
2,n
2)
α ∼ N(b, 100 · I) (3.4)
84

The first element of α, α0 is the bias term, and b is the prior for α, and is set
to 0, except for b0 (the prior for α0), which can be used to control the sparsity on
the number of interacting-regulators. We expect 1% of all SNPs to be regulators. To
achieve this level of sparsity in number of regulators, b0 was set to log(e/(p− e)),
where e is expected number of interacting-regulators, and was set to p/100. That
is, b0 = log(1/99).
Refer to Supplementary Note 1 for the eQTeL’s inference algorithm, initial-
ization and convergence criteria.
3.12.3 Cardiac expression data (MAGNet):
Samples of cardiac tissue (n = 313) were acquired from patients from the My-
ocardial Applied Genomics Network (MAGNet; www.med.upenn.edu/magnet). Left
ventricular free-wall tissue was harvested at the time of cardiac surgery from sub-
jects with heart failure undergoing transplantation and from unused donor hearts.
Genomic DNA was extracted using the Gentra Puregene Tissue Kit (Qiagen, CA) ac-
cording to manufacturer’s instructions. Total RNA was extracted using the miRNeasy
Kit (Qiagen) including DNAse treatment. RNA concentration and quality was de-
termined using the NanoVue PlusTM spectrophotometer (GE Healthcare) and the
Agilent 2100 RNA Nano Chip (Agilent). To assess gene expression, RNA was hy-
bridized with Affymetrix Genechip ST1.1 arrays using manufacturer instructions.
CEL files were normalized with the robust multiarray analysis (RMA) using the
oligo package in Bioconductor [164]. To remove potential batch effects, expression
85

values were further adjusted using ComBat, an empirical Bayes method that es-
timates parameters for location and scale adjustment of each batch for each gene
independently [165]. Probe sets were removed if they displayed RMA expression
values < 4.8 on all arrays. This filtering yielded sets of genes present well above
background levels in the human heart. Probeset showing no annotated cross hy-
bridization potential were kept, leaving 15,395 probes for final analysis.
3.12.4 Selection of genes:
The genes were selected such that they had at least one significantly associated
SNPs based on univariate-eQTL (Matrix eQTL). 1880 genes were thus selected using
FDR threshold of 1E-6 using Matrix-eQTL (Lappalanien et. al.). We have no reason
to believe that this selection is favorable to eQTeL.
3.12.5 Pre-procession of gene-expression:
It has been found that removing technical biases and confounding factors can
greatly improve the association studies. Normalization of gene-expression data to
remove confounding factors have been studied extensively ( [166,167]). In association
studies the comparison is across individual and not across genes, and therefore
main aim of the normalization is to make the gene-expression distribution across
samples comparable. Similar to Lappalainen et. al., we use PEER [166] to remove
the confounding factors from expression data as pre-processing. Given expression
data for multiple individuals, PEER identifies hidden factors that explain a large
86

proportion of global expression variability. Factors represent covariates that affect
multiple gene and are therefore most likely to be confounding factors or technical
biases. The factors are then regressed out from the expression and residual are used
for performing association studies. In certain cases, such in trans-eQTL, a genetic-
factor can affect multiple SNPs and PEER might remove biologically relevant signal.
However, since the aim of the paper is to identify cis-eQTL, i.e. local effects, we can
safely use PEER.
To determine number of factors (K) to be removed using PEER, we used
approach similar to Lappalaninen et. al. We ran PEER for 16,271 Affymetrix gene
probes from MagNet using parameter K=0, 3, 5, 10, 15 and 20; then we compared
number of genes (eGenes) that have at least one SNPs significantly associated with
expression (p-value < 1 E -6). We chose K=10 because number of eGenes plateaued
at K=10. Factors from PEER were regressed out from the expression and residual
expression was used for further analyses.
Linear regression assumes normality of the expression data. Residual data
from PEER was standardized to normal distribution before performing the associ-
ation analysis.
3.12.6 Genotypes and imputation for cardiac samples:
DNA samples were genotyped using Affymetrix Genome Wide SNP Array 6.0
and analyzed per manufactures instructions. We applied quality control (QC) fil-
ters to exclude unreliable samples, samples with cryptic relatedness and samples
87
that were not genetically inferred Caucasian. After QC filtering, 313 individuals
remained. All analyses were conducted using software package PLINK [140]. For
the analysis reported here, we eliminated SNPs with genotype call rate < 95%, with
minor allele frequency (MAF) < 15%, or if there was significant departure from
Hardy-Weinberg equilibrium (p < 10−6). A total of 360,046 SNPs passed QC and
were available for analysis. To improve cross study comparisons, genotype imputa-
tion was performed using the Minimac (v 2012.11.16) [153] program. Imputation
results were filtered at an imputation quality threshold of 0.5 and a MAF threshold
of 0.15.
PLINK [140] was used to infer LD block for the genotypes. Default setting of
SNPs within 200Kb was used to estimate it.
3.12.7 Epigenetic data and Interaction features:
Epigenetic data were obtained from ENCODE, Roadmap epigenome project
and GEO database for following heart tissues: AoAF, HCM, HCF, Fetal-hearts,
Adult-hearts, Left Ventricle, Right Ventricle, Arota, and Right Atrium. Because
DNAse I footprints were used to validate eeSNPs, they were excluded from the
feature importance (α) estimation of eQTeL. Appendix A Fig. 2 lists the epigenetic
and interaction features, that were critical for identification of interacting-regulators.
We assessed the importance of epigenetic factors directly overlapping each SNP
within 50 bps flanking region (suffix .50 in Appendix A Fig. 2). We also assessed
the importance of epigenetic factors in broader context of each SNP within 500 bps
88

flanking region (suffix .500 in Appendix A Fig. 2). Interaction features between a
gene-promoter and a region containing SNP were calculated using RNASeq and DHS
data from 15 cell types (A549, Bj, H1hesc, Hepg2, Hsmm, K562, Nhek, Ag04450,
Gm12878, Helas3, Hmec, Huvec, Mcf7, Nhlf, and Sknshra). These features include:
a)correlation and absolute correlation between DHS of the region and DHS of the
promoter b) correlation and absolute correlation between DHS of the region and
RNASeq FPKM of the gene.
Both epigenetic and interaction features were normalized to mean of 0 and
standard deviation of 1. This implies that distribution of each of these features for
a set of random SNPs were expected to have zero mean and one standard deviation.
Therefore, y-axis in Appendix A Fig. 2 shows absolute enrichment over random-
SNPs with units in standard deviation.
3.12.8 Estimating fraction of putatively causal eeSNP:
Using an approach similar to Lappalanien et. al. [139], we estimated propor-
tion of eeSNP that are putatively causal. Clearly, an independent estimation of
proportion of causal SNPs cannot rely on features used to identify eeSNPs, or any
other potentially correlated feature, such as footprints. Thus, for an independent
estimate of the proportion of causal SNPs, we used potential TF binding disruption
by a SNP allele. Following Lappalanien et. al., using Matrixeqtl [151], we first
identified causal SNPs as follows. For each gene we identified best and second best
associated SNPs, and the best SNP was deemed causal if (i) the best SNP associa-
89

tion was significant (FDR < 10−6) and (ii) the difference in association score (-log10
pvalue) between the best and the second best SNPs was greater than a threshold
(conservatively, 2.5, a la Lappalanien et al.).
For each TF motif, we obtained the disruption at each SNP (decrease in motif
match scores due minor allele relative to major allele) thus obtaining two distribu-
tions, one for causal SNPs and another for the presumed non-functional background.
Using distribution of motif disruption score for causal SNP, we identified TF mo-
tifs that are preferentially disrupted by causal SNPs. For each of such motif y, we
calculated an enrichment score ccausal,y which is the ratio of means of TF motif
disruption score between the causal and a set of presumed non-causal SNPs. For
motif y, we similarly calculated the enrichment score for eeSNPs ceeSNP,y. Following
Lappalainen et. al., we then estimated the fraction of eeSNPs likely to be causal as
ceeSNP,y−1
ccausal,y−1. Appendix A Fig. 14 shows these proportion of eeSNP that is likely to be
causal for all selected motifs, suggesting that overall 58% of eeSNPs are putatively
causal.
Functional explained variance and expression predictability was defined as
explained variance by subset of expression-regulators that mapped to a DNAse I
footprint.
3.12.9 Simulation study:
Simulation was done on 200 genes. We used 174800 SNPs (874 SNPs per each
gene) for 313 samples from MAGNet genotype data. 1% of total SNPs were declared
90
as enhancers. We estimated, number of causal regulatory SNPs and distribution of
explained expression variance by genotype by running eQTeL in MAGNet data.
Using estimated number of causal regulators from MAGNet, expression-regulators
were selected among enhancer per gene. Effect-size of each expression regulator was
generated from ∼ N(0, 1), that is finally being used to generate expression for each
gene using a linear model. Finally a random noise was added such that explained
variance by expression-regulators will be same as estimated from MAGNet data.
For each regulator SNP, 7 epigenetic features (DNAse, H3K4me1, H3K4me3, P300,
H3K27me3, H3K36me3 and H3K9me3) for heart were generated from distribution
derived from validated heart enhancers [47]. For all other SNPs epigenetic features
were generated from random SNP background.
3.12.10 Motif binding score differential:
For each of the 981 vertebrate TF motif from TRANSFAC database [168], we
scanned the 50 bps flanking eeSNPs (and for 10,000 control SNPs randomly sampled
from 300,000 SNPs) for the presence of motif using pwmscan tool [169], separately
for the major and the minor allele. Only the cases where at one of the two alleles
had a motif hits (p− value < 0.0002) were further considered. For each such case,
the difference in the binding score for the two alleles was computed, as the difference
in log(p-value). For each motif, the binding differential score for eeSNPs and the
control SNPs were compared using Wilcoxon test and the motifs which had at least
1.5 fold greater differential among eSNPs and a p− value < 0.05 were identified.
91

3.12.11 DNAse footprint enrichment:
From [157] we obtained a list of genomic locations, for 41 different cell-types,
where significant evidence of in-vitro protein binding event were detected using
DNAse-footprint. For each tissue, we calculated fraction of number of SNP that
have a footprint in the 50 bps flanking it.
3.12.12 Allelic imbalance and ChIA-PET analysis:
DNAse hypersensitivity (DHS-seq) reads for heart cells (HCM sample) were
obtained and mapped to eeSNPs (and control SNPs). Heterozygousity at each SNP
locus was ascertained by the presence of multiple alleles among the reads mapping
to the SNP location. For each such locus, the allelic imbalance was calculated as
the difference in the number of reads mapped to each allele. The allelic imbalance
was plotted against the overall signal intensity rank.
ChIA-pet assay identified spatially proximal genomic regions where at least
one of the region is bound by PolII. Because ChiA-pet data is unavailable for heart-
related cell types, we pooled multiple ChiA-pet data from K562, Hela, Nb4 and
MCF7. For each 50 bps flanking an eeSNP (or control SNP) and the target promoter
pair, number of ChIA-pet reads supporting the spatial proximity of the two loci
were recorded. The ChiA-pet support for each SNP-gene pair was then compared
for different methods after controlling for the genomic distance between the SNP
and its target gene.
In Fig. 3.6 and 7, median “white” lines represent LOESS (local regression) for
92

each method. Confidence interval for each median line is estimated using bootstrap-
ping and they are shown in the s using either of following two ways: by thin lines
representing LOESS of each bootstrap, or by colored regions representing confidence
intervals in terms of standard deviation of bootstraps.
3.13 Software availability
The implementation of eQTeL with its source code is freely available at
(www.cbcb.umd.edu/software/goal) as a R-package under MIT license.
For details of other eQTL methods (Supplementary Note 3); expression ex-
plained variance and predictability (Supplementary Note 6); and scalability of eQ-
TeL (Supplementary Note 7) refer to Supplementary Notes.
93

94

Synthetic rescue determinants in cancer
95


Chapter 4: Synthetic rescue determinants of resistance and response
to cancer therapy
4.1 Introduction
Resistance to therapy in cancer may arise due to diverse mechanisms including
drug efflux, mutations in drug targets and adaptive responses in downstream molec-
ular pathways [61]. The latter cellular reprogramming alterations mainly involve
network-wide changes in the DNA sequence, copy number, expression, epigenetics
and phosphorylation of proteins that buffer the disrupted function of the drug tar-
gets. Indeed, numerous recent transcriptomic and sequencing studies have identified
different molecular signatures underlying the variable response and emergence of re-
sistance to specific drugs in cancer patients, and potential interventions to improve
the effectiveness of therapies [83,84,170–179].
During cancer progression, fitness-reducing alterations in a particular gene may
be compensated by subsequent alterations in the activity of another gene, restoring
cancer progression and proliferation. In this type of genetic interaction, we term
the former gene a vulnerable gene, the latter gene a rescuer gene, and the functional
relation between them a synthetic rescue (SR). There are potentially four basic types
97

of SRs: (1) down-regulation of both the vulnerable and the rescuer gene (DD); (2)
down-regulation of the vulnerable gene and up-regulation (i.e., over-activation) of
the rescuer (DU); (3) up-regulation of the vulnerable gene and down-regulation of
the rescuer (UD); and (4) up-regulation of both vulnerable and rescuer genes (UU)
(see Extended Data Figure 1a-d).
Recent years have seen a surge of interest in studying an inherently different
class of genetic interactions termed synthetic lethality (SL) [180, 181] in which the
inactivation of both SL partner genes is lethal but the inactivation of either gene
alone is viable (see Extended Data Figure 1e). A tumor may become insensitive to
a drug treatment because activity of the SL partner of its drug target is maintained
at wild-type levels to escape conditional lethality [72]. However, cancer cells may
also further over-activate a rescuer gene of the drug target far beyond its wild-type
activity levels to escape lethality [60,83, 84,170–173] (DU-type SR). While the role
of SL interactions in cancer has received tremendous attention [71, 181–183]18,21-
24, only a few instances of SR interactions have been reported in cance [60, 83,
84, 170–173] (and very few reported in micro-organisms [184–186]). Specifically, a
genome-wide approach to identify SR interactions has not been reported.
4.2 Background
Before proceeding further, we briefly revisit some background of genetic inter-
actions in cancer.
98
4.2.1 Synthetic lethality
Synthetic lethal (SL) interaction between a pair of genes defines an interac-
tion between two genes when concomitant inactivation of two gene is lethal to cell,
while inactivation of each of gene is not [71]. As shown in a figure an example of
SL interactions between genes BRCA and PARP [187]. In a cell, individual knock-
down of either BRCA or PARP genes are not lethal to cell. However, simultaneous
knockdown of BRCA and PARP genes are lethal to cell. Fig 4.1b. illustrates the
concept of SL in terms on a functional truth table of gene activities. We will use
the functional truth table representation throughout the document to represent any
genetic interaction between two genes. In the functional table samples are divided
based on each of the genes activity. We assume tri-state of gene activity i.e, in-active
(under-expressed), wild-type, over-active (over-expressed).
Synthetic lethality was first noticed first by Cavin bridge in 1922, when he
observed a combination of mutation confer lethality in melanogaster [188]. The term
synthetic lethality was later coined in 1945 [188]. Synthetic lethality offers a unique
opportunity to develop anticancer drugs that will target genes whose Synthetic
Lethal (SL)-partners are inactivated in the specific cancer being treated. SL-based
drugs are therefore expected to kill cancer cells selectively, sparing normal healthy
cells [72, 73, 189]. Towards the realization of this potential, screening technologies
have been developed to detect SL-interactions in numerous model organisms [180]
and in human cell lines [62–70]. However, as every pair of genes can potentially
interact in synthetically lethal manner, the combinatorial search space consists of
99

A B+ = Cell survival
A B+ = Cell survial
A B+ = Cell death/Synthetic lethality
A B+ = Cell survialLethal
Low activation
Wild type Overactivation
BRCA
PARP
LethalLow
activation
Wild type
Over
activation
BRCA PARPa b
Figure 4.1: A example of synthetic lethal between genes BRCA and PARP. (a) Twogenes form an SL pair if the combined inhibition of both gene products is lethalto the cells, while the inhibition of either gene product alone is not lethal. (b).Synthetic lethal functional truth tables: The truth table denotes the cell viabilitystates - viable (green), lethal (red) - as a function of the activity state of each of theSL pair genes (down regulated, wild-type and up-regulated).
more than 500 million pairs that ideally should be examined in more than just one
experimental system. Current experimental technologies at our disposal are hence
yet far from being able to address the challenge of identifying the SL interactions
across different cancers on a genome-scale. New bioinformatics approaches are hence
been called for to guide and complement the experimental search for SL-interactions
in cancer.
Previous computational approaches developed to systematically study syn-
thetic lethality in cancer have aimed to infer SL pairs by mapping SL-interactions
in yeast to their human orthologs [190, 191]or by utilizing metabolic models and
evolutionary characteristics of metabolic genes [192–194]. In a recent study Jerby
100
et. al. harnessed large cancer genomic data that have been rapidly accumulating
to identify candidate SL-interactions via a direct data-driven approach, termed the
DAta-mIning SYnthetic-lethality-identification pipeline (DAISY) [71].
4.2.2 Computation identification of SL network in cancer
(DAISY)
DAISY identifies candidate SL interactions employing three independent sta-
tistical tests
1. Molecular survival of the fittest: DAISY mines gene expression and SCNA of
tumor samples from TCGA and cell lines data to identify SL gene pairs A and
B having the property that tumor samples with co-inactivation the genes are
significantly less frequent than than what would be expected by observing the
genes individual inactivation rates in the data.
2. The second inference strategy, ”shRNA-based functional examination”, is closely
related to the first. It is based on the notion that the essentiality of a synthet-
ically lethal gene manifests itself when a gene is knocked down in cancer cells
where its SL-partner(s) are inactive (that is, with a markedly low copy-number
and expression). Accordingly, the SL-pairs of a given gene can be identified
by searching for partner genes whose under-expression and low copy-number
induce its essentiality.
3. The third procedure, ”pairwise gene co-expression”, is based on the notion
that SL-pairs tend to participate in closely related biological processes and
101

hence are likely to be co-expressed [180].
They show that a genome-wide cancer-SL-network can be robustly identified
from these datasets, and then utilized to successfully predict both gene essentiality
and drug response in cancer cell lines, as well as patient survival [71].
4.2.3 Synthetic dosage lethality
Synthetic dosage lethal interaction between a pair of genes defines an (asym-
metric) interaction such that the over-activity of one of them renders the other
gene essential, i.e independent knockdown of gene A is not lethal to cell, however
knockdown of A in cells where B is over-expresssed is lethal [74]. The concept of
synthetic dosage lethality, although not explored as extensively as SL, may hold
therapeutic potential, especially in case of cancer. One of the hallmark of caner
is over-expression of oncogenes. The over-expression of oncogenes such as MYC
help cells to overcome apoptosis and proliferate rapidly. However, over-expression
of oncogenes creates additional vulnerabilities in cells, specifically in such cells if
SDL partner of the oncogenes are knockdown it will selectively kill the cancer cells.
Therefore, the over-activation associated with oncogenes, unlike loss-of-function as-
sociated with tumor suppressor, can be therapeutically exploited by SDL.
4.2.4 Synthetic rescue
We define synthetic rescue (SR) interactions between a vulnerable gene V and
rescuer gene R as (asymmetric) interactions in which change in activity of V is lethal,
102

but subsequent perturbation in gene R makes the cell viable again. Depending on
direction of perturbation there can be following four kinds of SR.
4.2.5 Down-Down (DD) synthetic rescue
In this kind of interaction, inactivation of vulnerable gene is lethal to cell, how-
ever subsequent inactivation of rescuer gene make cell viable. Fig ?? illustrates the
DD interaction. SR interaction have three possible state: (i) ”viable” (green): ac-
tive vulnerable gene active , (ii) ”lethal” (red): inactive vulnerable gene and rescuer
gene active and (iii) ”rescue” (blue): inactive vulnerable gene and inactive rescuer
gene. At first glance it might seem that viable and rescue state should be phenotyp-
ically similar, however as we shall see in case of cancer they are phenotypically very
different. In cancer while viable state represent normal poliferation of cancer cell,
on the other hand rescue state represents resistant state (i.e cells still proliferate
with drug treatment).
Such kind of interaction in are also referred as extragenic suppressor mutations
[195]. However, suppressor mutation definition are limited to mutations, where
mutation in one gene reverses the phenotypic effect due to mutation in other gene.
For eg. mutation in gene UNC-54 can be rescued by mutation in UNC-22 in C.
elegans [196].
103

Lethal
Low activation
Wild type Overactivation
Gene A Activation
Low
ac
tivat
ion
Wild
type
Ove
rac
tivat
ion
Gen
e B
Act
ivat
ion
Rescue
Vulnerable genes
Rescuergenes
A B+ = Cell survival
A B+ = Cell death
A B+ = Cell survival/Synthetic rescue
a b
Figure 4.2: Definition of DD type SR: (a) A vulnerable gene and a rescuer gene forman DD SR pair if the inhibition of the vulnerable gene is lethal unless it is rescued byinhibition of the rescuer gene. (b) The truth table denotes the cell viability states -viable (green), non-rescued (i.e., lethal – red), and rescued (blue) - as a function ofthe activity state of each of the DD SR pair genes (down regulated, wild-type andup-regulated).
4.2.6 Down-Up (DU) synthetic rescue
In this kind of interaction, inactivation of vulnerable gene is lethal to cell,
however subsequent over-expression of rescuer gene make cell viable. Fig 4.3
illustrates the DU interaction. Analogous to DD interaction DU have three possible
state.
Other SR interactions are Up-Down(UD) SR and Up-Up SR, where over-
expression of vulnerable gene is lethal and rescued by rescuer in-activation in case
of UD and over-activation in case of UU.
104

Lethal
Low activation
Wild type Overactivation
Gene A Activation
Low
ac
tivat
ion
Wild
type
Ove
rac
tivat
ion
Gen
e B
Act
ivat
ion
Rescue
Vulnerable genes
Rescuergenes
A B+ = Cell survival
A B+ = Cell death
A B+ = Cell survival/Synthetic rescue
a b
Figure 4.3: Definition of DU type SR: (a) A vulnerable gene and a rescuer geneform an DU SR pair if the inhibition of the vulnerable gene is lethal unless it isrescued by over-activation of the rescuer gene. (b) The truth table denotes the cellviability states - viable (green), non-rescued (i.e., lethal – red), and rescued (blue) -as a function of the activity state of each of the DU SR pair genes (down regulated,wild-type and up-regulated).
Although all four types of SR interactions are important, in the presented
work we concentrate on DU SR interactions because (i) they are most intituive of
SR interaction, (ii) most clinically relevant in cancer and (iii) can be used to devise
anti-resistant cancer therapies.
4.3 INCISOR
Here we set out to study the potential role that SR interactions play in de-
termining drug resistance in cancer, mediated by altered activity of SR rescuer
105

partners of drug targets. We developed a new statistical pipeline, termed IdeNtifi-
cation of ClinIcal Synthetic Rescues in cancer (INCISOR) to identify genome-wide
SR networks in cancer. Mining tumor molecular and survival data of cancer pa-
tients, INCISOR predicts SR pairs through a series of four inference steps that
together capture the salient features of an SR pair. We provide a brief overview of
INCISOR for the DU-SR type (see Methods for a comprehensive description and
refer to Appendix B for other types): (1) The first step, termed Molecular survival
of the fittest (SoF) uses molecular data (somatic copy number alterations (SCNA)
and transcriptomics data) and examines the fraction of tumor samples that display
a given candidate SR pair of genes in its DU rescued state that is, where the vul-
nerable gene is down-regulated and the rescuer gene is up-regulated. Scanning all
possible gene pairs it selects pairs that appear in the rescued state (respectively
non-rescued state) significantly more (respectively less) frequently than expected,
testifying to their rescue effect on the tumor fitness. The next three steps examine
patient survival data to further narrow down the SR candidate pairs (identified in
the first step based on molecular data) by eliminating potential false positives: (2)
Vulnerable gene screening aims to identify the vulnerable genes by searching for
genes whose down-regulation improves patient survival (i.e., reduces tumor fitness)
in the subset of tumors where the rescuer partner (as predicted from the first step)
is not up-regulated. (3) Robust rescue effect studies the subset of tumors where the
vulnerable gene is down-regulated. It aims to select the SR pairs where the rescue
of the vulnerable gene is robustly associated with worse patient survival than its
non-rescued state. Finally (4) Oncogene rescuer screening removes false positive
106

candidate SR pairs whose rescuers show worse survival when up-regulated regard-
less of the inactivation of the vulnerable gene partners (thus likely to have oncogenic
effects on their own).
More specifically, INCISOR identifies candidate SR interactions employing
four independent statistical tests, each tailored to test a distinct property of SR
pairs. We describe here the identification process for the DU-type SR interactions.
The methods to detect other patterns are analogous and described in the Appendix
B. We identified pan-cancer SRs analyzing gene expression, SCNA, and patient
survival data of TCGA from 7,995 patients in 28 different cancer types. As reviewed
in the main text, INCISOR is composed of four sequential steps (see Extended Data
Figure 1a):
1. Molecular survival of the fittest: We mine gene expression and SCNA of mul-
tiple tumor samples to identify vulnerable gene (V) and rescuer gene (R) pairs
having the property that tumor samples in non-rescued state (that is samples
with underactive gene V and non-overactive gene R shown in red in Extended
Data Figure 1a) are significantly less frequent than expected (due to lethal-
ity), whereas samples in rescues state (that is samples with under-active gene
V but over-active gene R shown in blue in Extended Data Figure 1a) appear
significantly more than expected (testifying to an explicit rescue from lethal-
ity). Specifically, we performed multiple one-sided Wilcoxon rank-sum tests
to identify the pairs that have the above properties (see Appendix B).
The next three steps utilize patient survival data to narrow down which of
107

the SR candidate pairs from step 1 are the most promising candidates (Note
that in doing that we take into account both FDR adjusted log-rank p-value
and effect size, ∆AUC, which quantifies the difference in the Area Under the
Curves in the KM survival plot of the two compared groups):
2. Vulnerable gene screening: This step aims to selects vulnerable genes V by
searching genes whose down regulation conditionally improves patient survival,
that is it examines the samples where the gene R is not unregulated and tests
whether the candidate vulnerable gene V is detrimental to cancer progression
(when not rescued by candidate rescuer gene R). Specifically, we perform two
KM analyses testing if the inactivation of vulnerable gene V (without rescue)
improves patient survival (test I) and if the over-activation of candidate res-
cuer gene R when V is inactivated decreases patient survival (test II). Among
candidate pairs that are significant in test I (after FDR correction), we calcu-
late ∆AUC in tests I and II, and then we calculate the difference in these two
∆AUC values. Gene pairs with top 25 percentile of these differences will be
selected for further testing in steps 3 and 4.
3. Robust rescue effect: This step examines the samples where the gene V is not
down-regulated and aims to identify candidate SR pairs where the rescue (blue
in Extended Data Figure 1a) of the vulnerable gene is robustly associated with
worse patient survival than its non-rescued state (red in Extended Data Figure
1a). We compare the survival of patients whose tumors show rescued versus
non-rescued activation patterns for a given SR pair. Based on KM analysis,
108
candidate SR pairs where the rescued state is associated more strongly with
worse survival than the non-rescued state are considered likely SR candidates
and are passed to the final, 4th step. In order to augment the robustness
of the rescue effect we employed bootstrapping within TCGA samples, which
improves cross-dataset generalizability of rescue effect of SR pairs. Specifically,
we aggregated the results over 50 bootstraps of the samples set to identify
robust rescue effects [152].
4. Oncogene rescuer screening: Some pairs found significant in step 3 might show
an effect on patient survival simply because the rescuer gene is an oncogene,
irrespective of any synergy between the rescuer and the vulnerable gene. This
step aims to correct for such false positives by eliminating the SR pairs with
the lowest 90% of rescue effect (measured by ∆AUC in KM patient survival
curves) among all pairs that include a given rescuer gene.
Finally, INCISOR tailors a log-rank statistical test (two-sided) for the three
survival analyses (steps 2-4) to account for differences in survival time between
cancer types. Specifically, to compare survival of any two groups, we estimate the
expected number of deaths in each group for each cancer type separately assuming a
hypergeometric distribution. We then sum the cancer-specific estimates of expected
and observed number of deaths to infer pan-cancer expected and observed number
of deaths. Finally a 2-test (two-sided) comparing the pan-cancer expected and
observed death gives the final pan-cancer survival difference between any two groups
tested.
109

4.4 Validations of INCISOR
We applied INCISOR to mine the TCGA data, which spans 7,995 samples
across 28 different cancer types [197]. We focus our description on DU-SR analysis
as it has the greatest survival predictive power and most importantly, DU rescuer
genes can be targeted to reduce emerging resistance to cancer drug therapies. The
resulting pancaner DU-SR network has 2,033 interactions involving 686 rescuer genes
and 1,513 vulnerable genes (Figure 4.4 , Extended Data Figure 1g). The Gene On-
tology (GO) distance (Appendix B) between pairs of vulnerable and rescuer genes
is less than that of random pairs (Wilcoxon rank-sum P < 4.4E-05) and shuffled
DU-SR pairs (Wilcoxon rank-sum P <0.03), suggesting that SR partners are func-
tionally related. An interesting example involves RPL23, which suppresses tumor
progression by stabilizing P53 protein. It is a moonlighting gene, having two ad-
ditional secondary functions as a ribosomal protein and an inhibitor of cell cycle
arrest. A GO analysis of its 12 predicted rescuer partners shows that they indeed
span such secondary functions, compensating the loss of RPL23 (Appendix B Ta-
ble 2). Only a small fraction (2.5%) of the DU protein pairs physically interact
with each other, indicating that more complex and indirect regulatory and signal-
ing mechanisms mediate most SR functional interactions. The relative significance
of each of the four screening steps in determining the final DU-SR network was
benchmarked in an independent gastric cancer dataset, showing that each step of
INCISOR significantly contributes to the final prediction accuracy (Extended Data
110

Figure 4j,k) [175]. Descriptions of the other pan-cancer DD (Extended Data Fig-
ure 6a), UD (Extended Data Figure 6d) and UU (Extended Data Figure 6g) SR
networks are provided in Appendix B.
We tested the clinical significance of the DU-SR network in an independent
METABRIC breast cancer (BC) dataset [198] by comparing the survival of patients
that have many vs. few (top vs. bottom 10%) SR pairs in their DU rescued state
in tumor (Methods, Extended Data Figure 1a). We find that tumors with many
rescued SRs have markedly worse patient survival than tumors bearing a low load
of rescued SRs (true for all four SR types; see Figure 4.5a-d), and that this is not
merely due to differential activation of vulnerable genes (Figure 4.5e, Extended Data
Figure 8e, Extended Data Figure 8f) or other confounding factors (Cox regression
in Appendix B Table 1). The pancancer DU-SR network predicts patient survival
also in other cancer types, as determined by cross validation evaluation over dif-
ferent TCGA cancer types (Extended Data Figure 2a) and in another independent
(ovarian) cancer dataset with a sufficiently large number of samples33 (Extended
Data Figure 2b). Combining INCISOR-inferred SL interactions (Extended Data
Figure 5e, Appendix B) with SR interactions further improves survival predictive
power (Figure 2f). Finally, we find that the copy number of DU rescuer genes is
significantly higher when their vulnerable genes are mutated vs wild type (data
not used in the INCISOR inference, Wilcoxon rank-sum P <1.2E-100), and so is
the rescuers gene expression (Wilcoxon rank-sum P < 1.1E-17, Extended Data Fig-
ure 2c,d). Breast cancer specific SR networks inferred using TCGA breast cancer
samples only are also predictive of patient survival in the METABRIC dataset (Ex-
111

tended Data Figure 8a-d, Appendix B). Patient outcomes were also predictable by
SR networks built specifically for each of four major BC subtypes (HER2, Luminal
A, Luminal B and TNBC, Extended Data Figure 10).
b
c
a
b
c
mitotic sisterchromatidsegregation **
Bacterial invasion ofepithelial cells **
formation of primarygerm layer substrate-dependent
cell migrationneural crest celldevelopment
'de novo'posttranslationalprotein folding
regulation of mitoticcell cycle phasetransition **
RNA transport **
protein K63-linkeddeubiquitination
cellular proteinmetabollic process
homophilic cell adhesion via plasmamembrane
cellular proteinmodification process**
112

Figure 4.4: Pan-cancer DU-type SR network. (a) Pan-cancer DU-type synthetic rescuesnetwork with 686 rescuer genes (green) and 1,513 vulnerable genes (red) encompassing2,033 interactions. The size of nodes indicates their degree in the network. (b,c): GeneOntology enrichment of vulnerable and rescuer genes. (b) The vulnerable genes are en-riched with cell adhesion, protein modification, metabolism and deubiquitination. (c) Therescuer genes are enriched with mitotic cell cycle phase transition, chromatid segregation,cell migration and RNA transport. Only significant pathways (one-sided hypergeometricFDR adjusted P<0.05) are shown in the figure.
We next investigated the dynamics of SR pairwise activity as cancer progresses.
We stratified the BC patients in the METABRIC dataset into six different cancer
progression bins based on their survival data and quantified the number of rescued
DU-SR pairs in samples in each bin. We find that tumors associated with shorter
survival times (i.e., likely to be more advanced) have a higher fraction of rescued
DU-SR pairs (Extended Data Figure 8g,h). Based on the patient stratification,
we further distinguished between two kinds of DU-SR interactions: reprogrammed
SRs (rSR), where the rescuer gene up regulation (over-activation) is inferred to
follow after the down-regulation (inactivation) of the paired vulnerable gene (and
hence likely to occur in response to it), and buffered SR (bSR), where the rescuer
gene up-regulation is inferred to precede the down-regulation of the vulnerable gene
(Appendix B). Indeed, we find that while SRs carry a significant predictive survival
signal irrespective of their order of occurrence (as shown throughout and also in
Extended Data Figures 8a-d,10), the emerging resistant-associated responsive rSRs
have a significantly stronger predictive survival signal than bSRs ( Appendix B).
Interestingly, a DU-SR analysis may also provide insights to carcinogenesis,
since the cellular response to the inhibition of a vulnerable gene may result in the
113

Not−rescued Viable Rescued
DU DD UD
UU SR + SL
e
∆
0.00
0.25
0.50
0.75
1.00
P=9.81E-07 AUC=0.18
0 2000 4000 6000 8000
Sur
viva
l
P =4.48E-05 AUC=0.13∆
P =3.04E-03∆ AUC=0.072
P =3.43E-03∆ AUC=0.08
P =6.59E-06∆ AUC=-0.5
d
0.00
0.25
0.50
0.75
1.00
0 2000 4000 6000 8000
0.00
0.25
0.50
0.75
1.00
0.00
0.25
0.50
0.75
1.00
0 2000 4000 6000 8000
Days
0.00
0.25
0.50
0.75
1.00
0 2000 4000 6000 8000
Days
0.00
0.25
0.50
0.75
1.00
0 2000 4000 6000 8000
Days
Sur
viva
l
a b c
f
SR- /SL+SR+/SL-
0 2000 4000 6000 8000
114

Figure 4.5: The four types of SR networks successfully predict cancer patients survival.(a-d) A Kaplan-Meier (KM) analysis comparing the survival of patients whose tumors havemany rescued SRs (top 10 percentile (N=800), rescued) to those with the few (bottom 10percentile (N=800), non-rescued). The difference in the areas under the curve betweenrescued (blue) and non-rescued (red) samples (δAUC) and their logrank p-values aredenoted. (e) Patients with tumors having a large fraction of vulnerable genes that are notdown-regulated (termed viable, green curve) have only intermediate levels of survival, lessthan those patients whose tumors are highly rescued. (f) Survival prediction by integratingboth SL and SR networks. The subset of non-rescued patients in Figure 4.5a that also havemany functionally active SLs (top 10 percentile (N=87); Appendix B) show remarkablybetter survival than the subset of rescued patients that also have few functionally activeSLs (bottom 10 percentile (N=158)).
up-regulation of oncogenic rescuers. Indeed, by mining the data of carcinogenic
agents and their targets [199, 200], we found that drugs that inhibit vulnerable
partners of known oncogenes [189] are known to be carcinogenic (hypergeometric
P<0.03, Appendix B). For instance, Lindane, which inhibits GLRB, is shown in the
literature to be carcinogenic through the activation of RAS/MAPK/ERK pathway
[201, 202] which in turn activates MDM2 [203, 204]. Nitric oxide, which targets
guanylyl cyclase (GUCY1A2), is known to be closely associated with KRAS-driven
tumorigenesis [203, 205]. These observations are consistent with our predictions of
DU-SR interactions between GLRB and KRAS/MDM2 and between GUCY1A2 and
KRAS, suggesting that screening for agents targeting vulnerable genes rescued by
oncogenes may offer a new way for identifying carcinogens on a pan cancer, genome
scale.
We next set out to experimentally test our SR predictions in vitro focusing on
a subset of the predicted SRs involving mTOR, a major kinase regulating cancer
growth and survival. We studied rSR and bSR predictions of the DD-SR type as
they can be readily validated by in vitro knockdown (KD) experiments. Our investi-
115

gation was performed in a head and neck squamous cell carcinoma (HNSC) cell-line,
where mTOR is known to be essential for cancer progression and its inhibition by
Rapamycin interferes with cancer progression [206,207] (also confirmed in our anal-
ysis, Wilcoxon rank-sum P < 4.5E-15, Appendix B). In difference from its overall
effect, we hypothesized that when mTORs predicted vulnerable DD-SR partners are
knocked down, Rapamycin treatment will not inhibit but induce cancer progression
as per the DD definition (Extended Data Figure 1b). To test this predicted reversal
of effect, we tested 10 (pan-cancer) DD-rSR pairs where mTOR is the predicted
rescuer gene via shRNA knockdowns of the vulnerable partner gene followed by
Rapamycin treatment (Methods). The KD of mTORs vulnerable partners hampers
tumor proliferation both in an in vitro tissue culture (Paired Wilcoxon rank-sum P
<1.3E-5) and in an in vivo mouse model (Paired Wilcoxon rank-sum P < 6.5E-6, see
Appendix B). We observed a significant reversal effect of Rapamycin treatment on
proliferation in 6 out of 10 vulnerable gene KDs (Figure 4.6a, aggregate Wilcoxon
rank-sum P< 2.1E-8). The experiments testing the shRNA KD of five different sets
of control (non-vulnerable) genes followed by mTOR treatment reassuringly failed
to produce a significant rescue signal (see Figure 4.6a,b). A similar but less marked
rescue effect is observed when mTOR is the vulnerable gene in DD-bSR interac-
tions (Figure 4.6b, P<4.3E-4 across 9 predicted SR interactions), consistent with
the observation of superior predictive power of rSR above. An experimental testing
of the predicted HNSC-specific DD-type rescuers of mTOR yielded an additional
validation of the predicted mTOR DD partners in an analogous manner (Extended
Data Figure 5g, Methods).
116

As an additional validation test we investigated the extent to which SR in-
teractions can provide a unified network-level account of transcriptome resistance
signatures that have been published recently (Methods, Figure 4.6c). One promi-
nent case involves resistance emerging to treatments targeting BET and AR; the
predicted SR rescuers of the BET inhibitor (hypergeometric FDR P< 1.9E-5) and
the AR inhibitor (FDR P< 5E-7) are enriched with Wnt signaling pathways, in line
with recent reports [83, 84]. Further, we identified MYC as a common rescuer of
BET and AR, which confirms its known association with the resistance to both AR
and BET inhibition [84,171]. In another recently published case involving resistance
to an EGFR inhibitor, the predicted SR rescuers are enriched with signaling path-
ways associated with the hepatocyte growth factor receptor (hypergeometric FDR
P< 1E-3), including PI3KCA that has been associated with the resistance to EGFR
inhibition [171]. A detailed description of this analysis is provided in Methods.
To test the utility of SRs in predicting emergence of resistance we analyzed
longitudinal expression and sequencing data from tumors of 81 ovarian cancer pa-
tients (OC81 dataset), some of whom initially responded to drug treatment but
later relapsed. The patients had been treated with two drugs: Taxane, which has
18 rescuer genes linked to 3 drug targets in the treatment specific DU-SR network,
and Cisplatin (Figure 4.7a)16. We find a significantly higher expression of the 18
rescuer genes in initial non-responder versus responder patients (Wilcoxon rank-
sum P<1.5E-4; expression and copy number alterations were significantly higher
than those observed in randomly selected genes, empirical P<0.045; Extended Data
Figure 5a). The SR network successfully predicts patient-specific gene activation al-
117
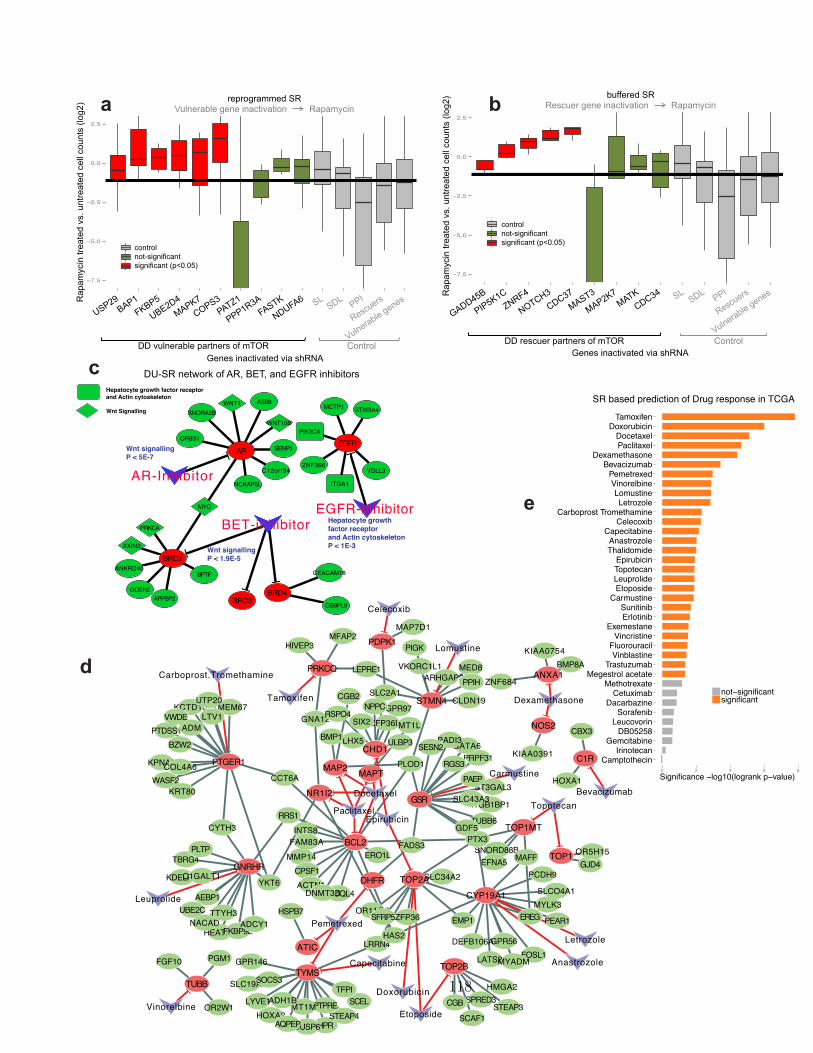
7.5
5.0
2.5
0.0
2.5
GADD
45B
PIP5K
1C
ZNRF
4
NOTC
H3
CDC3
7
MAST
3
MAP2
K7
MATK
CDC3
4
sl.co
ntrol
sdl.c
ontro
l
ppi.c
ontro
l
rescu
er.co
ntrol
vulne
rable.
contr
ol
Genes shRNA
Rapm
ycin
treate
d vs u
ntrea
ted ce
ll cou
nts(lo
g2)
col
controlnot significantsignificant(P<.05)
bSR
Genes inactivated via shRNA Control DD rescuer partners of mTOR
Rap
amyc
in tr
eate
d vs
. unt
reat
ed c
ell c
ount
s (lo
g2)
bSR
control not-significant significant (p<0.05)
buffered SR Rescuer gene inactivation Rapamycin
PIK3CA
WNT1 MCTP1
EGFR
ST8SIA4
AR SENP1OR8S1
WNT10BSNORA2B
ASB8
CEACAM18BPTFANKRD40
BRD2AXIN2
GOSR2 BRD4OSBPL9
APPBP2 BRD3
AR-Inhibitor VGLL3ZNF366
PRKCA
NCKAP5L ITGA1
C12orf54
MYC
BET-inhibitorEGFR-inhibitor
Wnt Signalling
Hepatocyte growth factor receptor and Actin cytoskeleton
Wnt signallingP < 5E-7
Wnt signallingP < 1.9E-5
Hepatocyte growth factor receptor and Actin cytoskeletonP < 1E-3
DU-SR network of AR, BET, and EGFR inhibitors
PIK3CA
WNT1 MCTP1
EGFR
ST8SIA4
AR SENP1OR8S1
WNT10BSNORA2B
ASB8
CEACAM18BPTFANKRD40
BRD2AXIN2
GOSR2 BRD4OSBPL9
APPBP2 BRD3
AR-Inhibitor VGLL3ZNF366
PRKCA
NCKAP5L ITGA1
C12orf54
MYC
BET-inhibitorEGFR-inhibitor
Wnt Signalling
Hepatocyte growth factor receptor and Actin cytoskeleton
Wnt signallingP < 5E-7
Wnt signallingP < 1.9E-5
Hepatocyte growth factor receptor and Actin cytoskeletonP < 1E-3
7.5
5.0
2.5
0.0
2.5US
P29
BAP1
FKBP
5
UBE2
D4
MAPK
7
COPS
3
PATZ
1
PPP1
R3A
FAST
K
NDUF
A6
sl.co
ntrol
sdl.c
ontro
l
ppi.c
ontro
l
rescu
er.co
ntrol
vulne
rable.
contr
ol
Genes shRNA
Rapm
ycin
treate
d vs u
ntrea
ted ce
ll cou
nts(lo
g2)
col
controlnot significantsignificant(P<.05)
rSR
Genes inactivated via shRNA Control DD vulnerable partners of mTOR
Rap
amyc
in tr
eate
d vs
. unt
reat
ed c
ell c
ount
s (lo
g2) reprogrammed SR
Vulnerable gene inactivation Rapamycin
control not-significant significant (p<0.05)
a b
d
c
e
KPNA2
CYTH3
WASF2KRT80
TBRG4
PTGER1
GNRHR
COL4A6
PLTPMMP14
INTS8
MAP2CCT6A
NR1I2
CPSF1
RRS1
FAM83A BCL2
Paclitaxel
PTDSS1
TMEM67KCTD10
ADMLTV1VWDE
UTP20
BZW2
Carboprost.Tromethamine
GNA12
PRKCQ
RSPO4
LHX5BMP1
MFAP2
Tamoxifen CGB2
HIVEP3
HPRSTEAP4
PTPREHOXA2
DUSP6
MT1M
AQPEP
GPR146FGF10
LYVE1
PGM1
TUBB SLC19A3
OR2W1Vinorelbine
YKT6 SLC34A2TOP2ARECQL4
KDELR2ACTN1 DHFR
DNMT3B
C1GALT1
ATIC
ZFP36
LRRN4
OR11G2Pemetrexed
SFRP5
HAS2
HSPB7
SCELADH1BTFPI
SOCS3TYMS
Capecitabine
AEBP1
HEATR2FKBP9L
TTYH3ADCY1NACAD
UBE2CLeuprolide
STEAP3SPRED3CGB
SCAF1
HMGA2
Etoposide
Doxorubicin
MYLK3
FOSL1
EREG PEAR1
PCDH9
SLCO4A1
Letrozole
Anastrozole
GPR56
TOP2B
CYP19A1
LATS2MYADM
EMP1
DEFB106A
KIAA0391 C1R
BMP8AANXA1
KIAA0754
CBX3NOS2
Dexamethasone
VKORC1L1
CLDN19
MED8ARHGAP29 ZNF684
PIGK
STMN4
PPIH
Lomustine
MAP7D1
ZFP36L2
SLC2A1
PDPK1
SIX2
LEPRE1
MT1L
GPR97NPPC
Celecoxib
SNORD88B
ITGB1BP1
ST3GAL3
TOP1MT
EFNA5 MAFF
Carmustine
GJD4
HOXA1
OR5H15
Topotecan
TOP1
Bevacizumab
PTX3
SLC43A3
PAEP
PRPF31
TUBB6GDF5
GATA6
Docetaxel
FADS3
GSR
ERO1L
Epirubicin
PLOD1
PADI3
RGS3
SESN2CHD1
MAPT
ULBP3
CamptothecinIrinotecan
GemcitabineDB05258
LeucovorinSorafenib
DacarbazineCetuximab
MethotrexateMegestrol acetate
TrastuzumabVinblastine
FluorouracilVincristine
ExemestaneErlotinibSunitinib
CarmustineEtoposideLeuprolideTopotecanEpirubicin
ThalidomideAnastrozole
CapecitabineCelecoxib
Carboprost TromethamineLetrozole
LomustineVinorelbine
PemetrexedBevacizumab
DexamethasonePaclitaxelDocetaxel
DoxorubicinTamoxifen
0 2 4 6 8r value)
significant
SR based prediction of Drug response in TCGA
118

Figure 4.6: Experimental shRNA screening validates the predicted DD-SR rescue interactionsinvolving mTOR in a head and neck cancer cell-line: Predicted DD-SR pairs involving mTORboth as (a) a rescuer gene and as (b) a vulnerable gene were tested (Methods). The vertical axisshows the cell count fold change in Rapamycin treated vs. untreated (i.e., in the rescued versusthe non-rescued state), and the significance was quantified using one-sided Wilcoxon rank-sum testfor three technical replicates with at least 2 independent shRNAs per each gene in each condition.Several sets of control genes (5 genes in each set that is total of 25 genes) that are not predictedas SR partners of mTOR were additionally knocked down and screened for comparison. Thesecontrol sets include proteins known to physically interact with mTOR, computationally predictedSL and SDL partners of mTOR, predicted DD-SR vulnerable partners of non-mTOR genes, andDD-SR predicted rescuer partners of non-mTOR genes. The horizontal black line indicates themedian effect of Rapamycin treatment in these controls as a reference point. Experiments werecarried with at least 2 independent shRNAs for each gene of interest and controls. (c-e) The SRnetwork successfully predicts the response to cancer drug treatments. (c) The SR network of afew cancer drugs whose resistance mechanisms were recently published (see text). The networkincludes the drug targets (red) and their rescuers (green). The rescuers are involved in Wntsignaling (diamond), and hepatocyte growth factor receptor and actin cytoskeleton (box). (d) Thedrug-DU-SR network includes 170 interactions between 36 cancer drug targets genes (red) and a103 rescuer genes interacting with them (green). The drugs (purple) are linked to their targets. (e)Logrank p-values per drug denote how well treatment response (measured by survival) is predicted(KM plots for each drug are provided in Extended Data Figure 3).
terations after treatment, where patients that initially responded but then relapsed
had increased rescuers activation in the relapsed tumors relative to the primary tu-
mors (testified by gene expression and SCNA alterations, overall Wilcoxon rank-sum
P< 5.8E-5, empirical P<4.0E-4; Figure 4.7b). Many but not every single rescuers
show significant difference above, which may be at least partially due to the hetero-
geneity between and within tumors.
Remarkably, the rescuers gene expression at the pretreatment stage already
provides a clear predictive signal for future emergence of resistance (AUC=0.77 for
SVM predictor, P<2.2E-16, Extended Data Figure 5b, markedly superior to the
predictive performance obtained using the predicted SL partners of these drug tar-
gets for this task (AUC=0.52, Extended Data Figure 5c)). The expression of the
multidrug resistance (MDR) genes inversely correlates with the expression levels
of the predicted rescuers in resistant samples (Spearman = -0.63 (P<0.03), Figure
119

4.7c), suggesting a complementary relationship between these two resistance mecha-
nisms. A similar resistance prediction analysis of 155 primary breast cancer patients
treated with Tamoxifen45 shows that the expression of 13 rescuers of Tamoxifens
targets can significantly predict patient relapse also in this dataset (AUC=0.74, P
<2.2 E-16, Extended Data Figure 5d).
4.5 Application of SR
Next we assessed whether SR interactions can help predict drug efficacy in a
specific tumor based on the active SR partners of the drugs target. The original SR
networks are based on highly stringent significance criteria and hence do not include
many of the target genes of current cancer drugs. We hence applied INCISOR to
build a drug-DU-SR network that includes a large number of drug targets and
their rescuer genes by using lower significance cut-offs to select the interactions
(though still highly significant after multiple hypotheses correction, see Methods
and Figure 4.6d). We next used the drug-DU-SR network alongside with gene
expression data from cancer patients to predict the response of 3873 patients (from
the TCGA dataset) to 37 common anticancer drugs (≥ 30 treated patients per drug).
Specifically, patients with tumors having many up-regulated DU rescuers of a given
drug target(s) were predicted as non-responder to that drug, and patients with
just few such up-regulated rescuers were predicted as responders. By comparing
our predictions to the actual patient survival data we confirmed that we correctly
classified the patients to responders and non-responders in a significant manner for
120

primary relapse
refractory(N=12)
resistant(N=37)
sensitive(N=11)
resistant(N=11)
sensitive(N=21)
acquired resistance
non-responder
responder
acquired resistant samplesnon-resistant samples
pre-treatment post-treatment
Structure of Ovarian Cancer (OC81) dataset a
c d
0
20
40
60
Pacl
itaxe
lLe
trozo
leTr
astu
zum
abTo
pote
can
Doc
etax
elD
acar
bazi
neC
apec
itabi
neC
arm
ustin
eD
oxor
ubic
inEx
emes
tane
Beva
cizu
mab
Cet
uxim
abFl
uoro
urac
ilSu
nitin
ibD
B052
58Vi
nore
lbin
eTa
mox
ifen
Leuc
ovor
inAn
astro
zole
Pem
etre
xed
Dex
amet
haso
neAnti−cancer drugs
Patie
nt w
ith re
scue
r act
ivatio
n (%
)
CYTH3(Carboprost Tromethamine)
GJD4(Topotecan)
CBX3(Bevacizumab)
DNMT3B(Paclitaxel)
PGM1(Vinorelbine)
GPR56(Anastrozole)
MED8(Lomustine)
DNMT3B(Docetaxel)
PTX3(Doxorubicin)
PTPRE(Fluorouracil)
SIX2(Epirubicin)
ANXA5(Vincristine)
UBE2C(Leuprolide)
LEPRE1(Tamoxifen)
CTBP2(Thalidomide)
MAP7D1(Celecoxib)
PLOD1(Megestrol acetate)
FADS3(Pemetrexed)
HAS2(Letrozole)
0.0 0.2 0.4 0.6 Increase in survival with rescuer knockout (∆AUC)
Res
cuer
( D
rug)
pai
rs
e
!
!
!
0.00
0.25
0.50
0.75
1.00
NPBWR1 IL7GDAP2
XKR9
FBXO30
ZNF706TDG
ABRALYPD2
MYCNGF
GOPCDNM1L
CCNE2
TXNRD1
CLLU1OS
PRKAG1
UBE2V2
factor(rescuer)G
ene
activ
atio
n (ra
nk o
f GE/
SCNA
)
rescuers
BCL2 MAP4 MAP2 drug targets
!" !" !" !" !"
Post-treatment over-activation of rescuers!b
!
!
!
!
!
!
!!
!
!
!
0.0
0.5
1.0
1.5
2.0
0.0 0.3 0.6 0.9Increase of MDR genes (!log(P))
Incr
ease
of r
escu
er g
enes
in (!
log(
P))
0.51.01.52.0
rescuers
Significance of MDR over-activation (-log(P))!
Sign
ifican
ce o
f res
cuer
ove
r-act
ivatio
n !
(-log
(P))!
Spearman != -0.63!(p<0.03) !
Anti-correlation of rescuer and MDR over-activation!
121

Figure 4.7: The DU-SR network identifies key molecular alterations associated with tumor re-lapse after Taxane treatment. (a) The OC81 dataset includes gene expression, copy number, andmutational information for primary (N=81) and relapsed (N=11) tumors. The tumors were classi-fied as refractory (N=12), resistant (N=37), and sensitive (N=32). (b) Post-treatment activationin the relapsed tumors (blue) of rescuer genes compared to their activation level in pre-treatmentprimary tumors (red) of the 11 patients. Significant genes are marked by stars (one-sided Wilcoxonrank-sum P¡0.05). (c) SR- (blue) and MDR- (red) mediated responses co-vary in the patients de-veloping resistance to Taxane treatment in the 11 patients: The horizontal axis denotes the extent(-log10(one-sided Wilcoxon rank-sum P)) of post-treatment increase in MDR genes activation andthe vertical axis represents the extent of post-treatment increase in the predicted rescuers activa-tion (-log10(one-sided Wilcoxon rank-sum P)) (d) The likelihood of developing drug SR-mediatedresistance following treatments. (e) The predicted clinical impact of rescuer gene down-regulation:Key rescuer genes and their corresponding drugs are listed on the vertical axis, and the survivalincrease associated with suppression of rescuer over-activation is presented on the horizontal axis.(d,e) are generated via an SR mediated data-driven analysis of the TCGA collection (see maintext).
28 of the 37 drugs (Figure 4.63), a result that was reconfirmed in several additional
datasets (see Appendix B).
To test the utility of SRs in predicting emergence of resistance we analyzed
longitudinal expression and sequencing data from tumors of 81 ovarian cancer pa-
tients (OC81 dataset), some of whom initially responded to drug treatment but
later relapsed. The patients had been treated with two drugs: Taxane, which has
18 rescuer genes linked to 3 drug targets in the treatment specific DU-SR network,
and Cisplatin (Figure 4.7a) [179]. We find a significantly higher expression of the
18 rescuer genes in initial non-responder versus responder patients (Wilcoxon rank-
sum P<1.5E-4; expression and copy number alterations were significantly higher
than those observed in randomly selected genes, empirical P<0.045; Extended Data
Figure 5a). The SR network successfully predicts patient-specific gene activation al-
terations after treatment, where patients that initially responded but then relapsed
had increased rescuers activation in the relapsed tumors relative to the primary tu-
mors (testified by gene expression and SCNA alterations, overall Wilcoxon rank-sum
122

P< 5.8E-5, empirical P<4.0E-4; Figure 4.7b). Many but not every single rescuers
show significant difference above, which may be at least partially due to the hetero-
geneity between and within tumors.
Remarkably, the rescuers gene expression at the pretreatment stage already
provides a clear predictive signal for future emergence of resistance (AUC=0.77 for
SVM predictor, P<2.2E-16, Extended Data Figure 5b, markedly superior to the
predictive performance obtained using the predicted SL partners of these drug tar-
gets for this task (AUC=0.52, Extended Data Figure 5c)). The expression of the
multidrug resistance (MDR) genes inversely correlates with the expression levels
of the predicted rescuers in resistant samples (Spearman = -0.63 (P<0.03), Figure
4.6c), suggesting a complementary relationship between these two resistance mecha-
nisms. A similar resistance prediction analysis of 155 primary breast cancer patients
treated with Tamoxifen45 shows that the expression of 13 rescuers of Tamoxifens
targets can significantly predict patient relapse also in this dataset (AUC=0.74, P
<2.2 E-16, Extended Data Figure 5d).
Uncovering cancer SR networks raises new treatment strategies options in
which rescuer hubs can be targeted in a specific manner alongside traditional chemother-
apy to enhance treatment response and counteract resistance. As a first step, by
quantifying the number of samples in the TCGA dataset with rescued interactions
among the patients that receive a specific drug, we provide estimates of the emer-
gence of DU SR-mediated resistance following each current cancer treatment (Fig-
ure 4.7d, Methods). Interestingly, microtubule-destabilizing therapy (Vinorelbine)
has a much lower likelihood of resistance emerging with rescuer activation than
123

microtubule-stabilizing therapies (Paclitaxel, Docetaxel). Next, we analyzed the
TCGA collection and provide a list of cancer type-specific rescuer hubs (Appendix
B Table 3), many of which have been already associated with resistance (see Ap-
pendix B). Interestingly, none of these predicted rescuer hubs are targeted by current
anti-cancer therapies. We estimated the effect of targeting each of these key rescuer
genes following specific contemporary cancer treatments on patient survival by com-
paring the survival time of the treated-patients with and without up-regulation of
the DU rescuers (Figure 4.6e, Methods). Notably, a considerable fraction of the DU
rescuers are housekeeping genes [208] (27.3%, hypergeometric P<0.03) and hence
their complete inhibition is likely to have adverse side-effects. However, as they are
up-regulated their rescue effect may be abolished by inhibiting their activation to
moderate levels, potentially thus having lesser effects on healthy cells.
In summary, this work presents a new concept of synthetic rescue interactions
in cancer, and a data-driven framework INCISOR for inferring genome-wide SR
networks. We find that SR reprogramming is widespread across cancer types and
is predictive of patient survival and drug response. Previous studies of cancer resis-
tance to therapy have been typically conducted in a supervised manner by identifying
gene signatures that differentiate between responders and non-responders, requiring
exhaustive clinical studies. In difference, INCISOR is the first approach capable of
predicting drug response and resistance utilizing the growing body of publicly avail-
able tumor data to this end in a universal and unsupervised manner. As we have
shown, given the extent of SR interactions, resistance may potentially emerge due
to alterations in any of the multiple alternative rescuers. The actual rescuers that
124

lead to resistance may vary across patients (or even within a heterogeneous tumor),
calling for the integration of personalized tumor omics data with the SR networks
to devise an optimal treatment [209]. Indeed, we show that the down regulation
of specific individual rescuers of some specific drugs may have considerable clinical
value. Ideally, on the longer run, one would strive to devise new drugs whose targets
have as few rescuers as possible. Therefore, identifying SR interactions in cancer
networks, which is likely to further improve with the incoming flux of cancer data
sets, bears considerable future translational importance, mainly: (a) for assessing
the likelihood that resistance will emerge; this is relevant both to optimizing the
treatment of individual patients and for prioritizing new drug targets in specific
cancer types, and (b) for targeting key rescuer genes in a new class of adjuvant
cancer therapies aimed at counteracting resistance.
4.6 Additional Methods
4.6.1 Evaluating the predictive survival signal of the in-
ferred SR networks
To evaluate the aggregate survival predictive signal of the pan-cancer SRs we
applied INCISOR to pan-cancer TCGA samples (training set) to identify the SR
pairs and tested their clinical significance in a completely independent METABRIC
dataset (test set) to avoid potential risk of over-fitting, which includes the gene
expression, SCNA, and survival of 1981 breast cancer patients. Based on the number
125

of functionally active SRs in each tumor sample, the top 10 percentile of samples
were considered as rescued and the bottom 10 percentile as non-rescued. We then
estimated the significance of improvement of survival in the rescued vs non-rescued
samples using a logrank test.
4.6.2 Tracing the number of functionally active SR pairs in
tumors during cancer progression
To study the functional activation of SRs as cancer progresses we divided the
breast cancer patients in METABRIC dataset into 6 classes of cancer progression
(removing censored data), by dividing them equally into 6 bins according to their
survival times (N=627). First, in each bin, we counted the mean fraction of func-
tionally active SRs. Such pairs are defined by the under-activation of the vulnerable
gene and the over-activation of the rescuer gene, where the latter are determined
based on their SCNA and gene expression values (Extended Data Figure 8g). Sec-
ond, we defined a vulnerable gene as rescued if more than N number of rescuers are
over-activated with the threshold N running from 0 to 4, and counted the mean frac-
tion of rescued vulnerable genes in the six progression bins (Extended Data Figure
8h).
126
4.6.3 Identifying the clinical significance of reprogrammed
SR and buffered SR
Using the cancer progression classes described above, we classified the DU
SRs identified by INCISOR based on the relations of three frequency values: res-
cuer over-activation (fr), vulnerable gene inactivation (fv), and functional activation
of SR (fSR). An SR pair is defined as reprogrammed SR (rSR) if the inactivity
of the vulnerable gene A occurs first (in an earlier stage) and is followed by the
over-activation of rescuer gene B (i.e., occurring in a later stage). Accordingly, we
classified an SR pair as an rSR if fr and fSR are highly correlated while fv and fSR
are not, and fSR increases as cancer progresses. Similarly, an SR was classified as
buffered (bSR) when the over-activation of rescuer gene B precedes the inactivation
of vulnerable gene A. We classified as an SR pair as a bSR if fv and fSR are highly
correlated while fr and fSR are not, and fSR increases as cancer progresses.
4.6.4 The Cancer-Drug SR Network (drug-DU-SR) and pre-
dicting pan-cancer drug response
To show the utility of SR network in predicting drug resistance and response we
constructed a cancer-drug DU SR network (drug-DU-SR) using pan-cancer TCGA
data. Gene targets of 37 drugs that are included drug-DU-SR were identified using
Drugbank database [210]. In identifying the original genome-wide DU-SR network,
we have applied a very conservative criteria (FDR < .01 wherever applicable) at each
127

steps of INCISOR. As a result, the network contained only 2033 interactions (3.5E-
4 % of all possible gene pairs), leaving out many potential rescuers of many drug
targets. To capture DU-type rescuers of anti-cancer drug targets in a more com-
prehensive manner we modified INCISOR as follows: (i) Vulnerable gene screening
was eliminated (because inhibition of the cancer drug targets that we studied are by
definition known to hamper cancer progression) (ii) An FDR correction was applied
only at the last step, and (iii) The SR significance P-value threshold were relaxed to
accommodate weaker SR interactions. The resultant network drug-DU-SR includes
the targets of most of the 37 cancer drugs that were administered to TCGA patients,
encompassing 170 interactions between 36 vulnerable genes (drug targets) and 103
rescuer genes (Figure 4.6d). A pathway enrichment analysis shows that the rescuers
are highly enriched with lipid storage/transport, thioester/fatty acid metabolism,
and drug efflux transporters (Extended Data Figure 4.5g). Using the drug-DU-SR,
we analyzed 3,873 TCGA patient samples that have been treated [197], including
drugs that were used to treat at least 30 patients. For each drug tested, we divided
the treated samples into rescued (predicted non-responders) and non-rescued (pre-
dicted responders) groups based on the number of over-active rescuers of the drug
target genes in the drug-DU-SR network. We then analyzed patient survival data of
treated patients to evaluate the predictive power of drug-DU-SR by comparing the
decrease in survival in the rescued group compared to the non-rescued group using
a logrank test (Figure 4.6e, Extended Data Figure 3).
128

4.6.5 Charting molecular mechanism underlying drug resis-
tance using SR networks
We analyzed multiple drug response and resistance datasets where gene ex-
pression (and SCNA for limited cases) was measured from the patients treated with
targeted therapy [175–178]. For each dataset we identified drug targets from Drug-
bank [210] and the rescuer genes were specifically inferred by applying the relaxed
condition described above in the section The Cancer-Drug SR Network (drug-DU-
SR) and predicting pan-cancer drug response to the specific treatment of interest.
To check the over-activation of rescuers in post-treatment samples (relative to pre-
treatment), we performed a paired one-sided Wilcoxon rank-sum test. To associate
the over-activation of rescuers in non-responders (compared to responders) we first
divided samples into rescued and not-rescued groups based on the number of over-
active rescuers, and performed a one-sided Wilcoxon rank-sum test between the two
groups. When information on patient survival is available (instead of drug response)
we performed a logrank test between the two groups using progression free survival
and/or overall survival. To predict emergence of resistance based on pre-treatment
gene-expression (and/or SCNA) in an unsupervised manner, we divided the samples
into predicted resistant and sensitive groups based on the number of over-activated
rescuers in pre-treatment samples, and then performed a one-sided Wilcoxon rank-
sum test. The supervised predictor was built using SVM with rescuer expression
profile as input feature, and the accuracy of the supervised predictor was determined
using cross validation. To compare the resistance arising from multidrug resistance
129

and synthetic rescues, we considered the post-treatment increase of gene activation
level of the rescuer partners of the given drug targets with the gene expression levels
of 12 MDR-associated genes [211] in relapsed tumors. To validate our SR network
with the recent findings on pathways associated with the resistance of 4 different
drug treatments (BET [83, 84], AR [170], EGFR [171] and BRAF [172] inhibitors),
we first applied INCISOR to identify treatment-specific DU-SR rescuers. We then
performed a pathway enrichment analysis of them, and observed that there are sig-
nificant overlaps in the cellular processes to which these rescuers belong and the
resistance gene sets reported in these studies. The details and additional analysis
for each such dataset are provided in Appendix B.
4.6.6 Experimental analyses
We used Rapamycin because it is a highly specific mTOR inhibitor and hence
enables targeting of a predicted rescuer gene by a highly specific drug, combined
with the ability to knock down predicted vulnerable genes in a clinically-relevant
lab setting. We used HNSC cell-line HN12, which, like most HNSC cells, is highly
sensitive to Rapamycin [207]. For this we applied INCISOR to identify top 10
vulnerable partners and 9 rescuer partners of mTOR in a pan-cancer scale. We also
identified HNSC-specific DD-type vulnerable partners of mTOR (see Appendix B
for complete description).
We performed the shRNA knockout and mTOR inhibition in the following
steps (Extended Data Figure 5f). Each of these mTORs vulnerable/rescuer part-
130

ners together with the controls were knocked down in HN12 cell lines, after which
mTOR was inactivated via Rapamycin treatment. HN12 cells were infected with a
library of retroviral barcoded shRNAs at a representation of 1,000 and a multiplic-
ity of infection (MOI) of 1, including at least 2 independent shRNAs for each gene
of interest and controls. 25 genes were included as controls (71 shRNA in total).
At day 3 post infection cells were selected with puromycin for 3 days (1g/ml) to
remove the minority of uninfected cells. After that, cells where expanded in culture
for 3 days and then an initial population-doubling 0 (PD0) sample was taken. For
in vitro testing, the cells were divided into 6 populations, 3 were kept as a control
and 3 where treated with Rapamycin (100nM). Cells where propagated in the pres-
ence or not of drug for an additional 12 doublings before the final, PD13 sample
was taken. For in vivo testing, cells were transplanted into the flanks of athymic
nude mice (female, four to six weeks old, obtained from NCI/Frederick, MD), and
when the tumor volume reached approximately 1cm3 (approximately 18 days after
injection) tumors where isolated for genomic DNA extraction. Mice studies were
carried out according to National Institutes of Health (NIH) approved protocols
(ASP # 10569 and 13695) in compliance with the NIH Guide for the Care and
Use of Laboratory Mice. shRNA barcode was PCR-recovered from genomic sam-
ples and samples sequenced to calculate abundance of the different shRNA probes.
From these shRNA experiments, we obtained cell counts for each gene knock-down
at the following three time points: (a) post shRNA infection (PD0, referred as initial
count), (b) shRNA treatment followed by either Rapamycin treatment (PD13, re-
ferred as treated count, 3 replicates) or control (PD13, referred as untreated count,
131

3 replicates) (c) shRNA infected cell injected to mice (tumor, referred as in-vivo
count, 2 replicates). To obtain normalized counts at each time point, cell counts of
each shRNA at each time point were divided by corresponding total number of cell
count. To estimate cell growth rate at treated, untreated and in vivo time points for
each gene X, normalized counts were divided by initial normalized count as follow:
growth rate(X) =normalized count(X)
initial normalized count(X)(4.1)
Effect of Rapamycin treatment on cell growth on knockdown of gene X was
calculated as:
rapamycin effect(X) =treated growth rate(X)
mean treated growth rate(X)(4.2)
To quantify the lethality of vulnerable knockdown, we performed a one-sided
Wilcoxon rank-sum test between initial normalized count with in vivo normalized
count for in vivo lethality (and with untreated normalized count for in vitro lethal-
ity). To compare rescue effect of Rapamycin treatment between shRNA knockdown
of mTORs vulnerable gene partner and control gene knockdown, we performed a
one-sided Wilcoxon rank-sum test between Rapamycin effects of mTOR partner
vulnerable genes and control genes.
132

4.6.7 Predicting adjuvant therapy candidates for counter-
acting the emergence of resistance via DU-SR inter-
actions
Down-regulating DU-SR rescuers provides a unique opportunity to mitigate
drug-resistance. For each drug in TCGA collection, we first identified all DU-SR
rescuer partners of its drug targets. We then investigated the impact of the down-
regulation of these rescuers by comparing the survival of patients whose rescuer
activation is low vs. high (using a logrank test) per each drug treatment. We
selected the top rescuers of each drug that show the highest improvement in patient
survival when inactivated, and reported 19 drug-rescuer pairs that have significant
clinical impacts.
4.6.8 Estimating the likelihood of developing resistance to
anti-cancer drug treatments via DU-SR interactions
The proportion of patients who have over-activated rescuers provides an esti-
mate of likelihood of developing SR-mediated resistance. For 25 anti-cancer drugs,
whose response is predictable by SR network, we estimated the drugs likelihood
to develop resistance by the fraction of patients whose tumors harbor significantly
over-activated DU-SR rescuers of the drug targets.
133

134

Chapter 5: Discussion and perspective
The presented thesis addresses emerging challenges in the improving detection
and therapy of diseases, focusing on cardio-vascular diseases and cancer. To this end
we developed novel computational methods for the integration of high-throughput
data, and utilized them to study the genetic and molecular determinants of disease
onset and drug resistance. The prediction of disease onset was accomplished, as de-
scribed in Chapter 3., via a Bayesian integration of epigenetic and genetic data that
enable the prediction of regulatory elements in genome and in turn the regulatory
variants that drive transcriptome variations. The prediction of drug resistance in
cancer was accomplished by proposing and identifying a novel type of gene interac-
tion, synthetic rescue.
The first part of the thesis begins with the presentation of a simple scheme to
improve association studies. The scheme was further extended and leveraged in a
Bayesian framework in Chapter 3 that significantly improved the association studies.
The second part of the thesis, in order to understand cancer-drug-resistance, defined
synthetic rescue gene interactions and proposed a data driven approach, INCISOR,
to identify the interactions. It concludes with presenting an array of translation
applications of synthetic rescue.
135

Below we provide in details discussion and future perspective of these parts of
the thesis.
5.1 Discussion
5.1.1 Association studies
In Chapter 3, we introduce a novel Bayesian approach, eQTeL, that integrates
genetic and epigenetic data in a statistically consistent manner to identify putatively
causal genetic variants underlying the expression variance. We have shown that (i)
eQTeL identifies combinations of SNPs (eeSNPs) that, compared to other methods,
explain substantially greater portion of expression variability, (ii) eQTeL is especially
effective in identifying SNPs with small effect sizes, (iii) 58% of the identified eeSNPs
are likely to be causal, (iv) eeSNPs can predict sample specific expression much
more accurately, (v) eeSNPs are much more likely to be bound by a regulatory
factor in an allele-specific manner, (vi) eeSNPs preferentially disrupt core cardiac
transcription factor binding, and (vii) eeSNPs tend to be spatially proximal to their
target genes. Taken together, our results strongly suggest that eQTeL captures a
substantial proportion of putative causal regulatory genetic determinants underlying
transcriptomic variance.
It is important to note limitations of eQTeL. First, eQTeL can only detect
cis-eQTL and not trans-eQTL. Second, like other model-based association methods,
eQTeL’s computational speed is a bottleneck; however, using parallel cores and cer-
136

tain reasonable compromises in parameter estimation procedure, the computational
burden can be substantially reduced. Third, eQTeL assumes normality of expres-
sion data, therefore the expression data needs to be pre-processed accordingly, which
can be particularly problematic for certain kinds of high throughput data. Fourth,
eQTeL can only detect SNPs with small effect sizes if they have high regulatory po-
tential. Finally, eQTeL statistically infers the potentially causal SNPs and further
experimental validations are required to establish causality.
eQTeL can effectively resolve LD and discriminate putative regulatory SNPs
from myriad associated SNPs. This lays a foundation for future experimental stud-
ies to characterize genetic variants underlying disease risk. Finally, eQTeL can
be extended by integrating additional layer of molecular data – easily achieved in
Bayesian framework – to directly infer SNPs that cause disease.
5.1.2 Synthetic rescue in cancer
In Chapter 4 we introduce and rigorously define a new concept of synthetic
rescue reprogramming occurring in cancer. We developed INCISOR, a data-driven
framework to infer genome-wide SR networks. We extensively studied evolutionary
properties of SR pertaining to cancer. Our study reveals that cellular reprogram-
ming is widespread across cancer types, shows significant clinical importance and is
associated with patient survival, drug sensitivity and emergence of resistance.
SR provides multiple therapeutic opportunities. The functional activity of
SL and SR networks determines tumor aggressiveness and patient survival. We
137

demonstrated that the clinical impact of the combined SR and SL networks is more
significant than their individual impacts (Figure 4.5f). The SL network provides
information on the selectivity and efficacy of a given drug [71]. On the other hand,
the SR network provides complementary information on the likelihood to incur
resistance. Combining SL and SR networks, we can predict a drug that has the
highest efficacy/selectivity and lowest chance of developing resistance.
SR reprogramming can be used to develop two novel classes of sequential
treatment regimens of anticancer therapies. First, almost all cancer patients who
initially respond to a drug, have the potential to develop resistance to the treat-
ment and experience tumor relapse. Currently, we do not have the ability to access
and prepare for the second line of treatment for the relapsed tumors, till it hap-
pens to the patients, which is often too late. SR provides a way to infer, together
with pretreatment expression screening, whether resistance will emerge quickly and,
more importantly, the possible mechanisms of the emergence of resistance and how
they can be mitigated by subsequent treatments (as demonstrated in Figure 4.7d).
Therefore, SR can guide decisions on the second line of action without biopsies from
the relapsed tumors.
Second, some of the gene-targeting drugs are known to be more efficient and
effective in treating cancer (eg. kinase inhibitors) than other drugs, provided tumors
are homogeneously addicted to the target gene. In such a scenario, using concept
of SR reprogramming, it is possible to first induce homogeneous addiction to such
targetable genes by first targeting vulnerable partner of the targetable gene. In order
to survive the cell will over-activate the targetable genes which will lead to oncogenic
138

( or non-oncogenic) addiction. In the second line of treatment, the targetable gene
can be targeted to eradicate the homogeneously addicted tumor population, thus
efficiently treating cancer.
INCISOR has limitations arising from the scarcity of available data, the spe-
cific design of the pipeline, and the diverse mechanisms of the emergence of drug
resistance. It is well-known that many genes are correlated based on their expres-
sion and the proximal genes have correlated SCNA values, which make it difficult
to identify the true rescuers from spurious ones. INCISOR mitigates some of these
problems by selecting pairs only when they are supported by both gene expression
and SCNA, however, it may not completely resolve this issue. INCISOR is also
based on patient survival data, which is known to be noisy. INCISOR does not
incorporate other genetic, epigenetic and post-transcriptional mechanism of gene
inactivation partly due to the unavailability of these data for cancer patients.
INCISOR is designed to identify the rescuer genes for targeted therapies, so it
cannot be used to predict drug response/resistance analysis for non-targeted ther-
apies such as generic chemotherapy (e.g. Cisplatin). By definition, SR reprogram-
ming events are context-specific to a cancer type or a sub-type. Our pancancer
SR network focuses on the generic SR interactions that are prevalent across multi-
ple cancer types, and the same pipeline can be applied to specific cancer types or
sub-types as presented in the main text and Supplementary Information for specific
cancer types and subtypes.
It must be noted that resistance does not always emerge due to SR reprogram-
ming. This is because there are multiple mechanisms for development of resistance
139
including drug efflux via multi-drug resistance mechanism or the modification of
drug target that makes drug ineffective. We nonetheless note that SR interactions
are so widespread in multiple cancers that they are highly likely to be a contributing
factor. Our analysis shows that only a small subset of SR interactions are mediated
by physical contacts, and further studies are needed to identify the mechanism of
SR reprogramming in giving rise to drug resistance.
We expect the fast growth of the publically available omics/survival patient
data, both within the TCGA collection and beyond would help us designing a better
pipeline and improving our identification of the SR interactions, and lead to a deeper
understanding of their mechanism in a context-specific manner.
It is necessary to be aware of the difference between SL and SR. First, as
revealed in Extended Figure 1a-e, their molecular states are different. In SR, the
inactivation of the vulnerable gene is lethal, only over-activation of rescuers retains
the cell viability under the condition (i.e. normal expression level is not enough to
rescue the cell). However, in SL, the inactivation of one of the SL partners is not
lethal unless the other partner is inactivated (i.e. normal expression level does not
lead to a lethal state). In other words, the inactivation of a vulnerable gene is in
general lethal in SR, unless it is rescued, but the inactivation of a single gene is not
lethal in SL pairs. In our analysis we made a clear distinction between SL and SR.
In ovarian and breast cancer analysis, the activation profile of SL partners of the
drug target genes have poor predictive potential for tumor relapse (Extended Data
Figure 5c), while over-activation profile of rescuers show great predictive potential
(Extended Data Figure 5b,d). Also, the predictive power for drug response is sig-
140

nificantly reduced if a vulnerable gene is defined rescued when its rescuer partner is
not over-activated but only normally activated (Extended Data Figure 2f).
Second, in SL, if any two partner genes are both inactive, it will be lethal
irrespective of activity of any other genes. But in SR, the inactivation of a rescuer
partner of a vulnerable gene does not guarantee lethality because an alternative
rescuer may have been over-activated to rescue the cell. Third, while SL has two
cellular states of viable and lethal; SR have additional third state rescued, where
cancer is often more aggressive than in both viable and lethal states (see Figure
4.5e). Fourth, both SL and SR may play roles in determining effectiveness of cancer
therapy. In SL, targeted treatments, which inactivate one of the SL partners, lead
to the activation of the other partner from inactive state to escape conditional
lethality. On the other hand in SR, in response to the inactivation of the vulnerable
gene due to targeted therapies, a cancer cell rewires the pathways associated with
the targeted cellular function by changing wild-type activity of its rescuer gene (to
over-active or inactive state) to escape lethality. In sum, SL is an inherent property
of the system, but SR is an adaptive cellular response, where cells reprogram their
molecular activity state to evade lethality.
These differences have therapeutic implications. Unlike SL, therapy based on
SR is likely to be used only in combination with other primary therapies. While
SL-based therapy can selectively kill cancer cells, SR based therapy, on other hand,
may not be selective. However, if the primary therapy is selective and SR interaction
is highly synergistic (implying selectivity), then the combined therapy will be also
selective.
141
The inference from SL and SR can be combined to identify drugs that target
cancer cells ( and not normal cells) and that are not likely to develop resistance (as
shown in Fig. 4.5). In particular, SL gene pairs with no rescuers would be best drug
targets.
Our analysis reveals a frightening aspect of SR reprogramming, namely that
critical vulnerable genes for cancer progression have not one but multiple rescuers,
implying the presence of multiple ways of developing resistance. Thus, targeting a
single rescuer may not be enough. This has been already known in the case of La-
patinib resistance, where ERBB3 over-expression leads to resistance but inhibiting
ERBB3 can be overcome by over-expression of other kinases. Many patients that
go through sequential treatments, where each treatment targets a new gene, show
initial response; however cancer relapse after every treatment might be due to the
fact that many of target genes have multiple rescuers. In this light, it is necessary to
chart a complete SR network to avoid emergence of resistance by focusing on drug
targets that have little chance of being rescued (a limited number of rescuers).
Synthetic rescue reprogramming has a considerable translational importance.
Targeting the rescuer hubs can offer a new class of treatments for adjuvant cancer
therapies aimed at counteracting resistance and may also be efficient in treating het-
erogeneous tumor cells. This is because targeting rescuer hubs makes cancer cells
vulnerable to the inactivation of different vulnerable genes. Alternatively, vulnera-
ble genes with few or no rescuer can be important drug targets because targeting
such genes would be least likely to evolve resistance due to SR reprogramming.
Further, the probability of a new drug to develop resistance can be efficiently eval-
142

uated using SR, which will significantly reduce the time and cost of clinical trials or
enable to assess long-term effect of a drug, which is often impossible. Finally, SR
reprogramming can predict mechanism of emerging resistance using pre-treatment
gene expression. By periodically monitoring patients gene expression, we can pre-
dict when resistance will emerge, and accordingly develop a sequential regimen for
patients.
SR reprogramming can contribute to precision and personalized cancer medicine
in the following manner: (i) ranking drugs by its likelihood to develop resistance, (ii)
recommending a drug for patients based on their gene expression before treatment,
(iii) predicting (aggressiveness of ) emerging resistance in patients, time of relapse
and second line of action (iv) drug-repurposing to target rescuer hubs or vulnerable
genes that have no rescuer. (v) identifying new drugs that target rescuer hubs and
can lead to development of a new class of anti-resistance drugs. (vi) SR network
can be combined with SL prediction to identify drugs that only target cancer cells
and at the same time are unlikely to develop resistance.
5.2 Perspective
We conclude the thesis by placing it in a wider academic perspective, and
exploring some unresolved questions. Finally, we point out potential follow up and
new exciting projects that emerged from the thesis but are beyond the scope of this
work.
In Chapter 4, at the regulatory mechanism level, eQTeL uncovers genetic
143

regulatory network that controls gene expression in cells. Specifically, it provides
genomic regions that regulate the genes such that a variation within one of the
regions changes the expression of its target. The analysis also reveals many of the
regulatory elements are far away from its target, pointing out that most of the
variation that causes transcriptomic changes are distal regulators.
Because some of the identified SNPs are common in the population, the anal-
ysis suggests that these genomic variations are not deleterious (since they can ac-
cumulate in the population). The expression variance associated with this set of
genomic variation also does not manifest into deleterious phenotypes.
Our analysis in Chapter 4 provides a basis to find contributions of each epige-
netic factor in regulatory element. In particular, whether presence of an epigenetic
factor activates regulators (in turn having activating effect on expression of target
genes), or in-activates them. Thus the framework can be used to identify marker of
different regulatory elements and also their functional characterizations.
The human heart data (MAGNet) is composed of data for individuals with
and without heart failure, therefore a major portion of expression variance in the
samples will be due to heart failure. Consequently, the identified genomic variants by
eQTeL that explain the major portion of expression variance will explain a portion
of phenotypic variance due to heart failure. Thus, these variants will be associated
with cardiovascular disease risk to a large extent. Importantly, identified variants
are likely to be causal in expression regulation, and thus they are likely to be causal
with regards to cardio-vascular disease risk as well.
eQTeL is important from a translational point of view, because it not only
144

provides regulatory variants, but also identifies specific genes that are highly dis-
rupted by the regulatory variants. This gives us an opportunity to devise therapies
in a personalized manner. For example, if a eeSNP over-expresses its target gene in
a cardio-vascular patient, targeting the gene by an inhibitory drug may mitigate the
risk of the heart failure. eQTeL also provides epigenetic and regulatory mediators
thus providing additional means to mitigate the risk by targeting those mediators.
In Chapter 5 we introduce a concept of synthetic rescues that dictates extensive
cellular reprogramming in tumors. Our analysis also reveals that multiple types
of SR participate in the reprogramming. As cancer advances, synthetic rescuing
becomes increasingly rampant. This indicates that cancer cells become increasingly
refractory, confirming Darwinian kind of evolution of cancer cells in tumors. Tumors
undergo gradual but extensive cellular reprogramming, each conferring additional
advantage to cancer in terms of proliferation and viability in the event of external
onslaughts.
Synthetic rescues will change the current paradigm of how anti-cancer inter-
ventions are devised. It illustrates at molecular level how resistance to a therapy
emerges in a cell. Synthetic rescuing plays the role of a double-edged sword for
cancer cells because it not only develops additional refractoriness, but also devel-
ops many additional vulnerabilities that can be capitalized on for cancer therapies
against resistance.
For instance, if a kinase is a (DU) rescuer of a vulnerable gene, inhibiting
vulnerable gene in cells will not only over-express the kinase, but also will make the
cells addicted to the kinase. Targeting such kinases with our repertoire of available
145

kinase inhibitors will efficiently eliminate the cancer cells. Thus SR raises very
promising therapeutic possibilities.
From a computational point of view, the thesis demonstrates that Bayesian
approaches can be used to integrate diverse set of data in a statistically consistent
manner. eQTeL harnessed two advantages of Bayesian approaches : (i) seamless
integration of different type of data through belief propagation, and (ii) develop-
ing bottom-up computational framework that can leverage known mechanisms and
hierarchies of information flow.
Therefore the approaches are ideally suited to tackle myriad of biological
datasets that are being generated with ever increasing pace and building computa-
tional framework to obtain superior inferences.
The thesis also proposes simple means to control various confounding factors
in statistical tests. These include controlling cancer type confounders in Kaplan-
Meier survival analyses. Such simple techniques can also be utilized and extended
to remove confounding factors in many of published genomic studies.
5.2.1 Alternatives
There is a number of ways the proposed methods can be improved. for in-
stance, a Bayesian approach in INCISOR will significantly improve the SR prediction
algorithm. Another elegant alternative to Kaplan-Meier analysis used in INCISOR
is Cox regression, which resolves the issue of individual gene effect to uncover ge-
netic interactions. In SR analysis, the emphasis was on introducing the concept of
146

synthetic rescues and consequently we choose to sacrifice elegance over simplicity of
the method used in INCISOR.
Bayesian approach used in eQTeL needs a complicated and computationally
intense algorithm. In case of eQTeL, an alternative approach that can be used for
data integration is a simple empirical approach. In fact, it was employed in the
initial phase, showing superior performance over than existing association methods.
However, the performance of empirical approach was inferior with respect to eQTeL
(refer to Appendix A).
5.2.2 Unresolved question
The analyses in the presented thesis opened up some interesting, yet unan-
swered questions that require further follow up analyses:
• In enrichment analysis of eeSNP in section 3.10, regions around eeSNPs were
enriched with two types of transcription factor motifs: (i) core-cardiac motifs
and (ii) enhancer specific motifs. However, only core-cardiac TFs were pref-
erentially disrupted by eeSNP and not enhancer specific TFs. This indicates
the possibility that enhancer specific motifs are avoided by regulatory SNPs.
The landscape of transcription is enriched with regulatory variants and it is
currently unexplored which ones among them are disrupted by regulatory vari-
ants. The variation of the landscape across different tissues and other disease
might be an interesting direction to pursue.
• In SR analyses, we identified many genes that have multiple rescuers. A
147

natural question that arises in such cases is if activation of any single rescuer
suffices for the rescue, or the rescue occurs with collective over-expression of
all rescuers. The rescue behavior may be variable across genes; for certain
genes the rescue may occur by over-expression of any rescuer and for others
over-expression of multiple rescuers may be required. For instance, genes with
multiple functions require all their functions to be rescued to promote cell
viability (see chap 4).
• Another intriguing question that was raised with our analyses is based on can-
cer heterogeneity. Our analyses suggest that resistance landscape is quite het-
erogeneous and resistance to a drug can arise through multiple routes. There
is large variation among patients in terms of molecular causes of resistance.
Does the variance of resistance mechanism also tranlate into tumors due to
heterogeneity? Does a different set of cell activates a different set of rescuers
to avoid lethality due to the inactivation of the same gene?
5.2.3 Potential follow up and new project
The thesis opens up and provides a basis for several new research directions.
We are currently pursuing some of them.
• Extending eQTeL to GWAS eQTeL model can be easily extended to
GWAS. Based on the causal SNPs identified by eQTeL a hierarchical model
can be developed for genotype-phenotype relationship that includes additional
layers corresponding to gene expression and biological pathways mediating the
148

genotype-phenotype relationships.
• Drug response prediction by eQTeL Tissue specific predicted transcrip-
tome by eQTeL can be harnessed to predict drug efficacy in a personalized
manner. Using eQTeL tissue specific expression before and after drug treat-
ment can be predicted for each individual. Relating the pre and post-treatment
transcriptome to phenotype [212], drug efficacy can be evaluated in a person-
alized manner.
• Predicting anti-biotic/anti-microbial resistance by synthetic rescue
Emerging microbial resistance to antibiotics is as a serious challenge in the
effective prevention and treatment of infections caused by microbes including
bacteria, viruses and fungi. It is already proving to be a serious menace
and expected to keep growing rapidly in the next decade, poseing a serious
challenge to all nations. In 2014, alarming increase in resistance cases to HIV
drugs were also reported [82].
Applying INCISOR to a large dataset of bacterial transcriptome data, we will
be able to predict synthetic rescue landscape specific to the infectious bacteria.
Similarly to cancer, this will enable us to predict molecular mechanisms of
emergence of antibiotics resistance.
• Devising new targeted cancer therapies by estimating clinical essen-
tiality of a gene One of the popular approaches of precision oncology [213]
is mouse transgenics. Tumor samples from a patient are first inserted into im-
muniodeficient transgenic mice and then treated with an array of anti-cancer
149
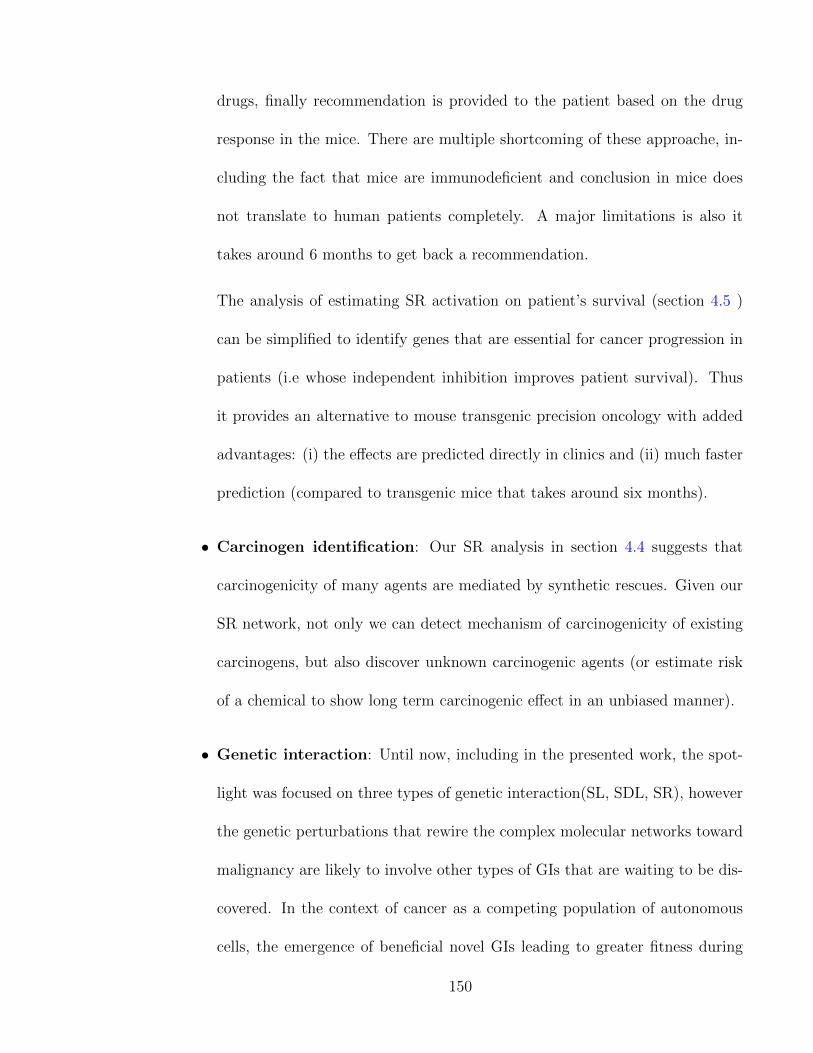
drugs, finally recommendation is provided to the patient based on the drug
response in the mice. There are multiple shortcoming of these approache, in-
cluding the fact that mice are immunodeficient and conclusion in mice does
not translate to human patients completely. A major limitations is also it
takes around 6 months to get back a recommendation.
The analysis of estimating SR activation on patient’s survival (section 4.5 )
can be simplified to identify genes that are essential for cancer progression in
patients (i.e whose independent inhibition improves patient survival). Thus
it provides an alternative to mouse transgenic precision oncology with added
advantages: (i) the effects are predicted directly in clinics and (ii) much faster
prediction (compared to transgenic mice that takes around six months).
• Carcinogen identification: Our SR analysis in section 4.4 suggests that
carcinogenicity of many agents are mediated by synthetic rescues. Given our
SR network, not only we can detect mechanism of carcinogenicity of existing
carcinogens, but also discover unknown carcinogenic agents (or estimate risk
of a chemical to show long term carcinogenic effect in an unbiased manner).
• Genetic interaction: Until now, including in the presented work, the spot-
light was focused on three types of genetic interaction(SL, SDL, SR), however
the genetic perturbations that rewire the complex molecular networks toward
malignancy are likely to involve other types of GIs that are waiting to be dis-
covered. In the context of cancer as a competing population of autonomous
cells, the emergence of beneficial novel GIs leading to greater fitness during
150
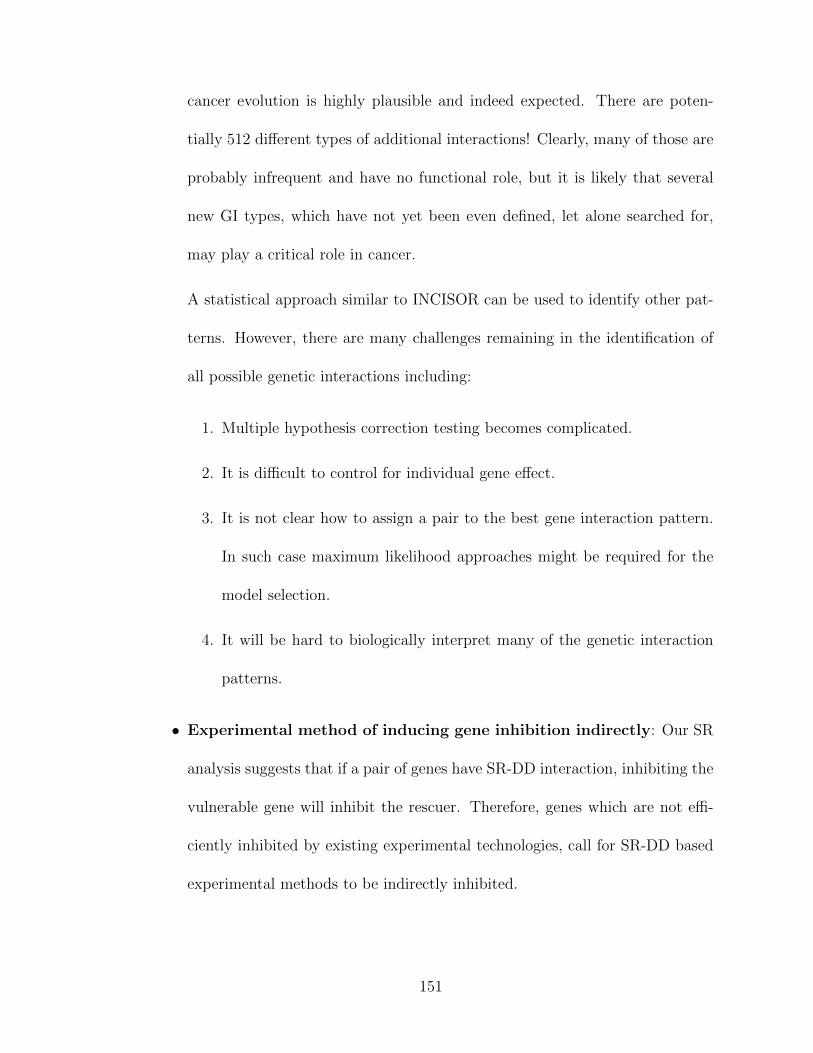
cancer evolution is highly plausible and indeed expected. There are poten-
tially 512 different types of additional interactions! Clearly, many of those are
probably infrequent and have no functional role, but it is likely that several
new GI types, which have not yet been even defined, let alone searched for,
may play a critical role in cancer.
A statistical approach similar to INCISOR can be used to identify other pat-
terns. However, there are many challenges remaining in the identification of
all possible genetic interactions including:
1. Multiple hypothesis correction testing becomes complicated.
2. It is difficult to control for individual gene effect.
3. It is not clear how to assign a pair to the best gene interaction pattern.
In such case maximum likelihood approaches might be required for the
model selection.
4. It will be hard to biologically interpret many of the genetic interaction
patterns.
• Experimental method of inducing gene inhibition indirectly: Our SR
analysis suggests that if a pair of genes have SR-DD interaction, inhibiting the
vulnerable gene will inhibit the rescuer. Therefore, genes which are not effi-
ciently inhibited by existing experimental technologies, call for SR-DD based
experimental methods to be indirectly inhibited.
151

152

Appendix
153


Appendix A: Bayesian integration of genetics and epigenetics detects
causal regulatory SNPs underlying expression variabil-
ity
155
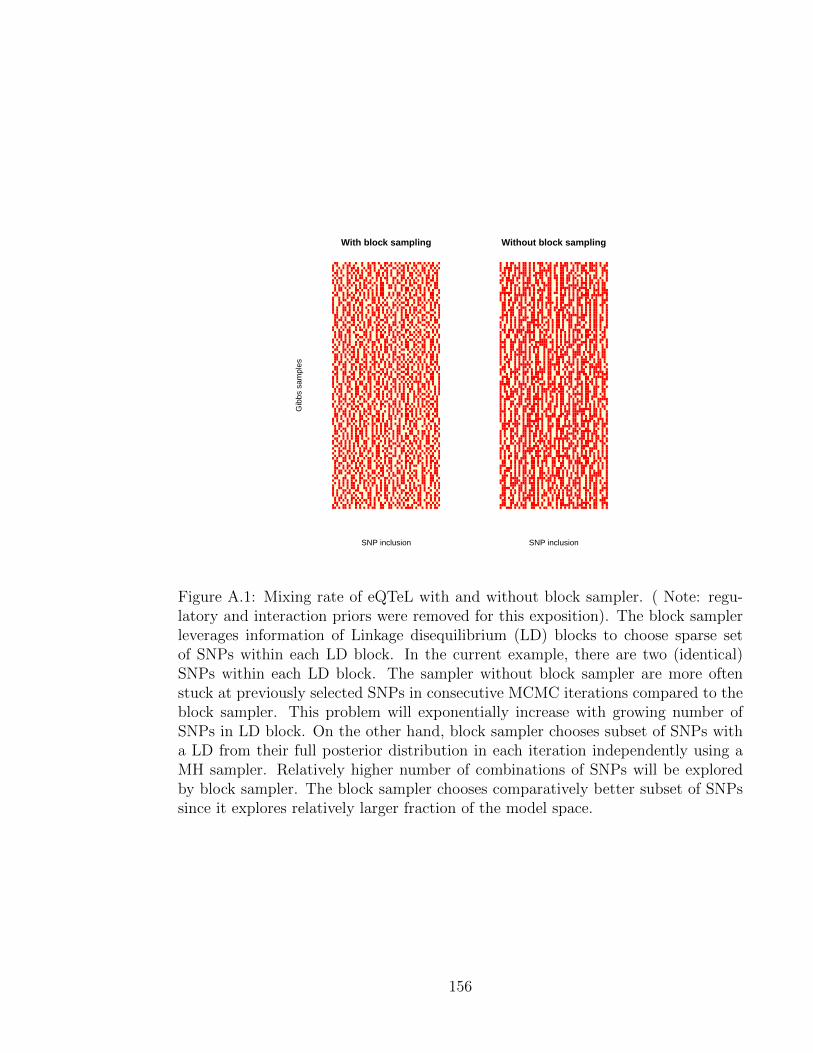
With block sampling
SNP inclusion
Gib
bs s
ampl
es
Without block sampling
SNP inclusion
Figure A.1: Mixing rate of eQTeL with and without block sampler. ( Note: regu-latory and interaction priors were removed for this exposition). The block samplerleverages information of Linkage disequilibrium (LD) blocks to choose sparse setof SNPs within each LD block. In the current example, there are two (identical)SNPs within each LD block. The sampler without block sampler are more oftenstuck at previously selected SNPs in consecutive MCMC iterations compared to theblock sampler. This problem will exponentially increase with growing number ofSNPs in LD block. On the other hand, block sampler chooses subset of SNPs witha LD from their full posterior distribution in each iteration independently using aMH sampler. Relatively higher number of combinations of SNPs will be exploredby block sampler. The block sampler chooses comparatively better subset of SNPssince it explores relatively larger fraction of the model space.
156

0
1
2
3
4
Dna
seH
paf.5
00H
CF.
500d
gfH
CM
.500
dgf
Dna
seH
cm.5
00F
etal
.Hea
rt.d
gf.H
.500
Dna
seH
cf.5
00D
nase
Aoa
f.500
Rig
ht.V
entr
icle
.H3K
4me3
.500
fHea
rt.5
00dg
fR
ight
.Ven
tric
le.H
3K4m
e3.5
0R
ight
.Ven
tric
le.H
3K27
ac.5
00H
isto
neH
cfH
3k4m
e3S
td.5
00H
isto
neA
oafH
3k4m
e3S
td.5
00R
ight
.Ven
tric
le.H
3K27
ac.5
0D
nase
Hcm
.50
Rig
ht.A
triu
m.H
3K4m
e3.5
00Le
ft.V
entr
icle
.H3K
4me3
.500
His
tone
Aoa
fH3k
4me3
Std
.50
Rig
ht.A
triu
m.H
3K4m
e3.5
0Le
ft.V
entr
icle
.H3K
27ac
.500
Left.
Ven
tric
le.H
3K4m
e3.5
0H
isto
neH
cfH
3k4m
e3S
td.5
0Le
ft.V
entr
icle
.H3K
27ac
.50
Dna
seH
paf.5
0R
ight
.Atr
ium
.H3K
27ac
.500
Rig
ht.A
triu
m.H
3K27
ac.5
0A
oAF.
500d
gfD
nase
Hcf
.50
Fet
al.H
eart
.dgf
.H.D
GF.
500
Fet
al.H
eart
.dgf
.H.5
0A
orta
.H3K
4me3
.500
Dna
seA
oaf.5
0H
CM
.50d
gfA
orta
.H3K
4me3
.50
HC
F.50
dgf
Fet
al.H
eart
.H3K
9ac.
H.5
00F
etal
.Hea
rt.H
3K9a
c.H
.50
Aor
ta.H
3K27
ac.5
00A
orta
.H3K
27ac
.50
fHea
rt.5
0dgf
Fet
al.H
eart
.dgf
.H.D
GF.
50A
oAF.
50dg
fH
CM
.ove
rlapd
gfH
CF.
over
lapd
gfR
ight
.Atr
ium
.H3K
36m
e3.5
00fH
eart
.ove
rlapd
gfA
oAF.
over
lapd
gfF
etal
.Hea
rt.H
3K4m
e3.H
2391
4.50
0R
ight
.Atr
ium
.H3K
36m
e3.5
0T
fbsA
oafC
tcfS
td.5
0T
fbsA
oafC
tcfS
td.5
00F
etal
.Hea
rt.H
3K4m
e3.H
2391
4.50
P30
0F.5
00P
300F
.50
Rig
ht.A
triu
m.H
3K9m
e3.5
00R
ight
.Atr
ium
.H3K
9me3
.50
Rig
ht.A
triu
m.H
3K4m
e1.5
00R
ight
.Atr
ium
.H3K
4me1
.50
Fet
al.H
eart
.H3K
4me1
.H.5
00Le
ft.V
entr
icle
.H3K
4me1
.500
Fet
al.H
eart
.H3K
4me1
.H.5
0A
orta
.H3K
27m
e3.5
00A
orta
.H3K
27m
e3.5
0Le
ft.V
entr
icle
.H3K
4me1
.50
Rig
ht.V
entr
icle
.H3K
4me1
.500
Aor
ta.H
3K4m
e1.5
00R
ight
.Ven
tric
le.H
3K4m
e1.5
0A
orta
.H3K
4me1
.50
Fet
al.H
eart
.RR
BS
.H.5
0A
orta
.H3K
9me3
.50
Fet
al.H
eart
.RR
BS
.H.5
00A
orta
.H3K
9me3
.500
Left.
Ven
tric
le.H
3K36
me3
.500
Aor
ta.H
3K36
me3
.50
Aor
ta.H
3K36
me3
.500
Left.
Ven
tric
le.H
3K9m
e3.5
0Le
ft.V
entr
icle
.H3K
9me3
.500
Fet
al.H
eart
.H3K
36m
e3.H
.50
Fet
al.H
eart
.H3K
36m
e3.H
.500
Tfb
sHcf
Inpu
tStd
.50
Fet
al.H
eart
.H3K
27m
e3.H
.50
Fet
al.H
eart
.H3K
27m
e3.H
.500
Rig
ht.V
entr
icle
.H3K
9me3
.50
Tfb
sHcf
Inpu
tStd
.500
Rig
ht.V
entr
icle
.H3K
9me3
.500
Rig
ht.A
triu
m.H
3K27
me3
.50
Rig
ht.A
triu
m.H
3K27
me3
.500
dhs.
rna.
abso
lute
.cor
rela
tion.
500
dhs.
rna.
abso
lute
.cor
rela
tion.
50dh
s.dh
s.ab
solu
te.c
orre
latio
n.50
dhs.
dhs.
abso
lute
.cor
rela
tion.
500
dhs.
rna.
corr
elat
ion.
50dh
s.rn
a.co
rrel
atio
n.50
0dh
s.dh
s.co
rrel
atio
n.50
0
Fea
ture
enr
ichm
ent f
or e
eSN
Ps
(fea
ture
s no
rmal
ized
to z
ero
mea
n, u
nit S
D)
Epigenetic−feature
Interaction−feature
Figure A.2: Feature-analysis: Significant features (p − value < 10−6) are sortedby their enrichment in eeSNPs relative to random SNPs (Note: features are notindependent). Lists the epigenetic and
157
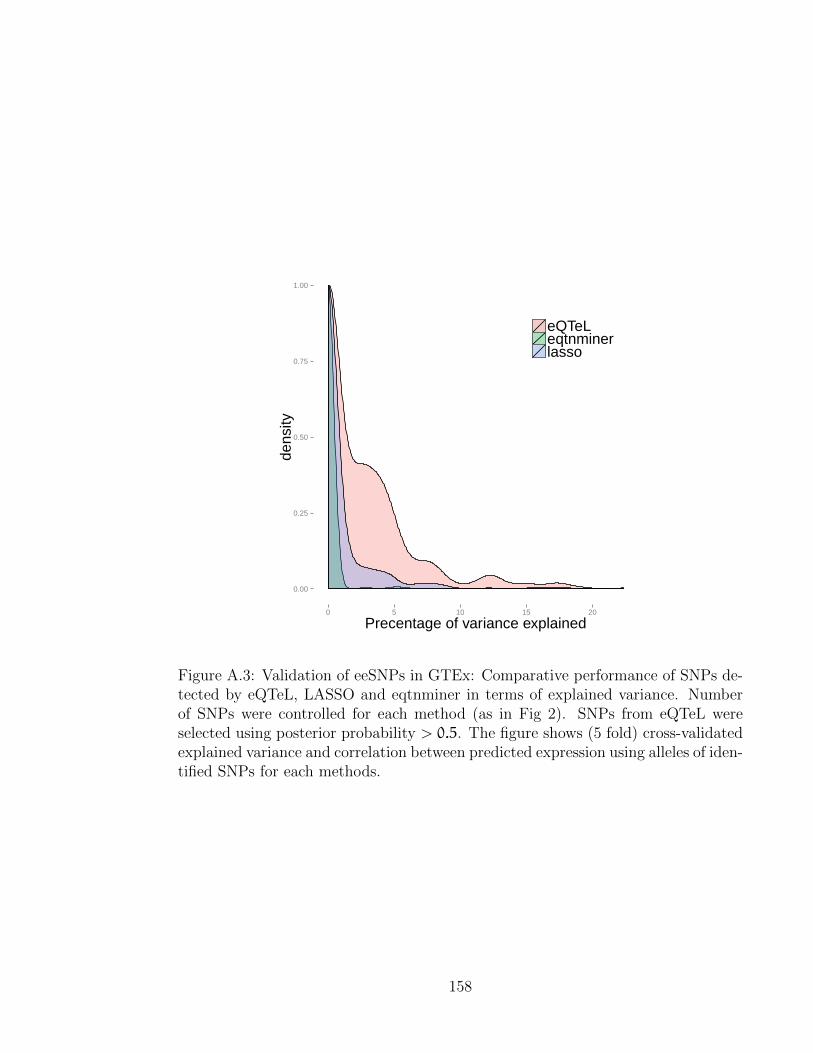
0.00
0.25
0.50
0.75
1.00
0 5 10 15 20
Precentage of variance explained
dens
ity
eQTeLeqtnminerlasso
Figure A.3: Validation of eeSNPs in GTEx: Comparative performance of SNPs de-tected by eQTeL, LASSO and eqtnminer in terms of explained variance. Numberof SNPs were controlled for each method (as in Fig 2). SNPs from eQTeL wereselected using posterior probability > 0.5. The figure shows (5 fold) cross-validatedexplained variance and correlation between predicted expression using alleles of iden-tified SNPs for each methods.
158

0.00
0.25
0.50
0.75
1.00
0 20 40 60Precentage of variance explained
dens
ity
eQTeL
eqtnminer
lasso
Figure A.4: Comparative performance of eQTeL in terms of explained variancein simulated data: Number of SNPs were controlled for each method (as in Fig2). SNPs from eQTeL were selected using posterior probability > 0.5. SNPs fromeQTeL were identified with posterior probability > 0.5. The figure shows (10 fold)cross-validated explained variance for each method.
159

0.00
0.25
0.50
0.75
1.00
0.0 0.2 0.4 0.6 0.8Predicted−real expression correlation
dens
ity
eQTeL
eqtnminer
lasso
Figure A.5: Comparative performance of eQTeL in terms of expression predictabilityin simulated data: Number of SNPs were controlled for each method (as in Fig 2).SNPs from eQTeL were selected using posterior probability > 0.5. The figure shows(10 fold) cross-validated correlation between predicted expression using alleles ofidentified SNPs for each method.
160

0.0
0.4
0.8
0.00 0.25 0.50 0.75 1.00qunatile
ratio
eQTeL
eQTeL−high
eQTeL−low
eqtnminer
lasso
Figure A.6: Comparison of recall-rate of different methods (controlled for overalleffective sparsity). eQTeL-high is eeSNPs with high regulatory potential (above 75quantile). eQTeL-low is eeSNPs with low regulatory potential in lower 25% quantile.
161

0.0
0.2
0.4
0.6
0.8
Spe
arm
an c
orre
latio
n of
pre
dict
ion
with
act
ual e
xpre
ssio
n
label
eQtel
eqtnminer
lasso
eQtel−functional
eqtnminer−functional
lasso−functional
(a) top 1 per gene
0.0
0.2
0.4
0.6
0.8
Spe
arm
an c
orre
latio
n of
pre
dict
ion
with
act
ual e
xpre
ssio
n
label
eQtel
eqtnminer
lasso
eQtel−functional
eqtnminer−functional
lasso−functional
(b) top 2 SNPs per gene//
0.0
0.2
0.4
0.6
0.8
Spe
arm
an c
orre
latio
n of
pre
dict
ion
with
act
ual e
xpre
ssio
n
label
eQtel
eqtnminer
lasso
eQtel−functional
eqtnminer−functional
lasso−functional
(c) top 3 SNPs per gene
0.0
0.2
0.4
0.6
0.8
Spe
arm
an c
orre
latio
n of
pre
dict
ion
with
act
ual e
xpre
ssio
n
label
eQtel
eqtnminer
lasso
eQtel−functional
eqtnminer−functional
lasso−functional
(d) top 5 SNPs per gene
Figure A.7: Comparative performance of eQTeL as number of SNP per genes areincreased in imputed data.
162

0
20
40
60
80
All−
hear
t−tis
sues
fLun
gT
h1H
CF
HC
MC
D20
pG
M06
990
H7.
hES
CH
MV
EC
.dB
l.Neo
NB
4H
A.h
HM
VE
C.L
LyG
M12
865
HPA
FS
K.N
.SH
_RA
fHea
rtH
PF
NH
DF.
neo
AG
1080
3C
D34
p_M
obili
zed
HS
MM
HV
MF
HM
VE
C.d
Ly.N
eoS
KM
CA
oAF
HC
PE
piC
Hep
G2
HM
FN
HLF
HE
Epi
CH
MV
EC
.dB
l.Ad
HP
dLF
HA
Epi
CH
FF
HIP
Epi
CN
HD
F.A
dfB
rain
IMR
90S
AE
CH
RC
Epi
CK
562
NH
.A
Tissues
Per
cent
age
of S
NP
s w
ith f
ootp
rints
eQTeL
lirnet
Figure A.8: Lirnet enrichment of DGF footprint: This analysis is based on 162SNPs identified by eQTeL and Lirnet. We analyzed footprint in 42 cell lines fromNeph et. al. overlapping the SNP within 25 bps the SNP loci by using bedtools foreach of the method. The heart-related-tissues are highlighted in red in the figure.The left-most bar represents pooled data from all heart-related cell types.
163

0
20
40
60
All−
hear
t−tis
sues
NB
4G
M12
865
HM
VE
C.d
Bl.N
eoC
D20
pH
epG
2T
h1G
M06
990
HC
FH
MV
EC
.LLy
CD
34p_
Mob
ilize
dfL
ung
HM
VE
C.d
Ly.N
eoH
CM
SK
.N.S
H_R
AfH
eart
HA
.hH
PF
NH
DF.
neo
SK
MC
HM
VE
C.d
Bl.A
dH
VM
FH
EE
piC
NH
LFH
PAF
HC
PE
piC
HM
FH
7.hE
SC
AoA
FfB
rain
HS
MM
HIP
Epi
CN
HD
F.A
dA
G10
803
HA
Epi
CH
PdL
FIM
R90
HF
FK
562
SA
EC
NH
.AH
RC
Epi
C
Tissues
Per
cent
age
of S
NP
s w
ith f
ootp
rints
eQTeL
eqtnminer
Figure A.9: Eqtnminer subset selection. The eqtnminer with 8 dimensional features(from 95 dimensional features), selected based on feature importance estimatedby eQTeL. Non-redundant features were chosen. The performance of eqtnminerimproves substantially compared to 95 dimensional eqtnminer.
164
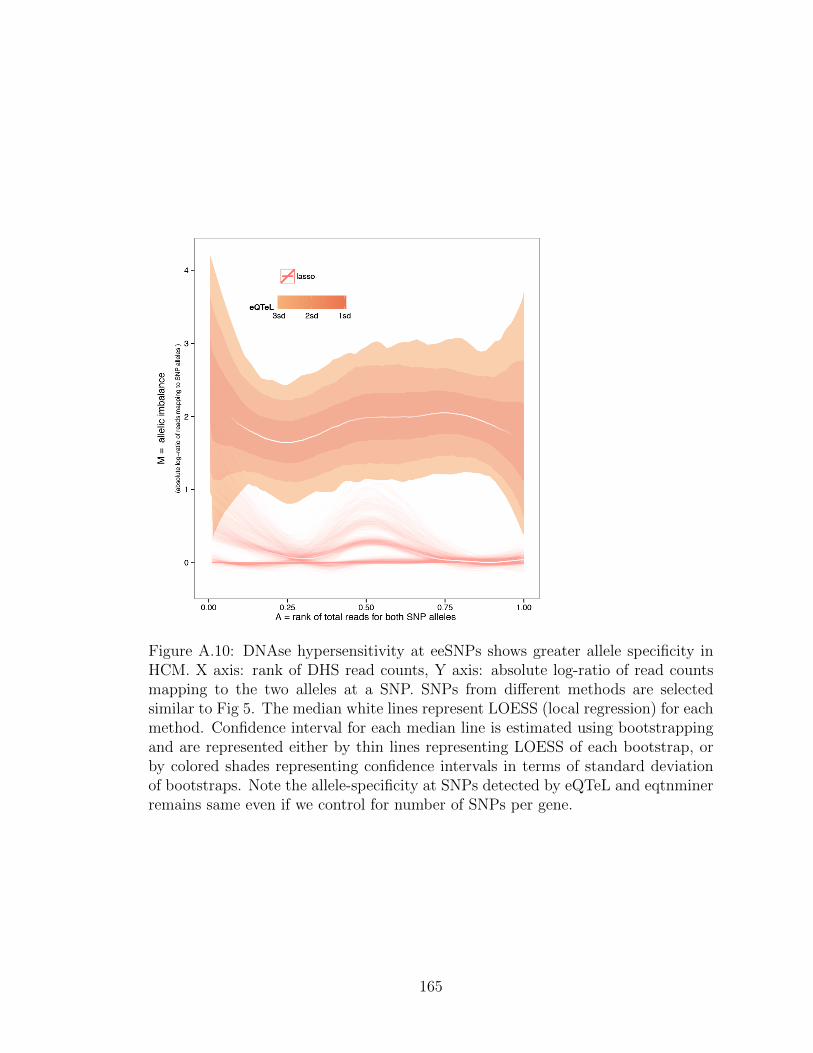
Figure A.10: DNAse hypersensitivity at eeSNPs shows greater allele specificity inHCM. X axis: rank of DHS read counts, Y axis: absolute log-ratio of read countsmapping to the two alleles at a SNP. SNPs from different methods are selectedsimilar to Fig 5. The median white lines represent LOESS (local regression) for eachmethod. Confidence interval for each median line is estimated using bootstrappingand are represented either by thin lines representing LOESS of each bootstrap, orby colored shades representing confidence intervals in terms of standard deviationof bootstraps. Note the allele-specificity at SNPs detected by eQTeL and eqtnminerremains same even if we control for number of SNPs per gene.
165

(a) SKMC (b) HCF
Figure A.11: Relative allele specificity (in terms of DHS reads) by SNPs identifiedby different methods: X axis: rank of DHS read counts, Y axis: absolute log-ratio of read counts mapping to the two alleles at a SNP. SNPs from differentmethods are selected similar to fig 5. The median white lines represent LOESS (localregression) for each method. Confidence interval for each median line is estimatedusing bootstrapping and they are shown in the figures using either of following twoways: by thin lines representing LOESS of each bootstrap, or by colored shadesrepresenting confidence intervals in terms of standard deviation of bootstraps. Notethe allele-specificity at SNPs detected by eQTeL and eqtnminer remains same evenif we control for number of SNPs per gene.
166

Figure A.12: Relative allele specificity by SNPs ( in terms of H3K4me3) identifiedby different methods: X axis: rank of DHS read counts, Y axis: absolute log-ratio of read counts mapping to the two alleles at a SNP. SNPs from differentmethods are selected similar to fig 5. The median white lines represent LOESS (localregression) for each method. Confidence interval for each median line is estimatedusing bootstrapping and they are shown in the figures using either of following twoways: by thin lines representing LOESS of each bootstrap, or by colored shadesrepresenting confidence intervals in terms of standard deviation of bootstraps. Notethe allele-specificity at SNPs detected by eQTeL and eqtnminer remains same evenif we control for number of SNPs per gene.
167

0.00
0.25
0.50
0.75
1.00
0 10 20 30 40 50
Precentage of variance explained
dens
ity
eQTeLlirnet
(a) Explained variance
0.00
0.25
0.50
0.75
1.00
0.0 0.2 0.4 0.6 0.8
Pearson correlation coefficient
dens
ity
eQTeLlirnet
(b) Expression predictiblity
Figure A.13: Comparative performance of Lirnet: Comparative performance of Lir-net in terms of explained variance and expression predictability for 200 genes. Num-ber of SNPs were controlled for each method (as in Fig 2). SNPs from eQTeL wereselected using posterior probability > 0.5. The figure shows (10 fold) cross-validatedcorrelation between predicted expression using alleles of identified SNPs for eachmethod.
168

HOXA5_(Hox−1.3)
GATA−3
c−Myc:Max
USF
MEF−2
CHOP:C/EBPalpha
Oct−1
GATA−2
HNF4alpha1
MEIS1
MEIS1A:HOXA9
STAT4
ATF3
HEB
MyoD
Stra13
LMAF
HOXB3
six4
IRXB3
Irx2
P53
LTF
TERALPHA
MZF1
TFEB
0 25 50 75 100
Proportion of causal SNP detected by eQTeL
TF
Figure A.14: Proportion of causal SNPs detected by eQTeL: Highly putatively causalwere identified SNPs using difference in association between best-associated SNPand second-associated SNP for each gene. Y axis shows mammalian TF motifs thatare preferetially disrupted by causal SNPs. For each of these motifs, proportion ofcausal SNPs among eeSNPs was estimated using ratio of relative enrichment (overbackground) of motif disruption score ( differential binding score between majorallele and minor allele of SNP) between eeSNPs and causal SNPs.
169

0.00
0.25
0.50
0.75
1.00
0.00 0.25 0.50 0.75 1.00Phastcon primate score
Den
sity
eQTeL
Random−SNPs
Figure A.15: Conseravation of eeSNPs. Distribution of mammalian PhasCons scoresfor eeSNPs and the control SNPs. The ratio of the two means is 1.49 and Wilcoxontest p-value < 5 ∗ 10−5.
170

Inference
We used a combination of Gibbs and Metropolis-Hasting sampling [214] to
jointly estimate the full posterior distribution of our model parameters.
Sampling γ parameters accounting for Linkage Disequilib-
rium
We estimated linkage disequilibrium block using PLINK [140], by using default
setting of SNPs within 200kb. The effects of SNPs in Linkage Disequilibrium are
dependent on each other because the SNP alleles are highly correlated. Gibbs or
Metropolis-Hastings samplers that ignore the LD structure of SNPs can get stuck in
local minima while failing to explore high probability combinations of γ (Fig. S15).
To overcome these poor mixing properties, we devise a block MCMC sampler that
explicitly uses LD-block information to sample from the posterior probability of a
LD-block i.e.
p(γLD|.) =P(Y |γLD,γ−LD)
∏i p(γi|θi)∑
γ ′LDP(Y |γ ′
LD,γ−LD)∏
i p(γ′i |θi)
where, γLD and γ−LD are γ of set of SNPs respectively within and outside the
LD-block. The resulting sampler mixed much faster (Fig. S15) by exploring high
probability models in a hierarchical fashion: we use a Gibbs sampler to sample
highly-probable combinations of LD blocks and within these sampled LD block, and
then a Metropolis-Hasting sampler is used to sample a sparse combination of SNPs
that explain expression variance.
171

Sampling α and θ parameters
We follow the latent variable Gibbs sampling strategy of [144] to sample the
logistic regression parameters α. Specifically, we can sample latent variables from a
Polya-gamma distribution,
wi|α ∼ PG(1, Eiα)
(A.1)
and then sample α from a normal distribution,
α ∼ N(mw, Vw)
where, Vw = (FTΩF + B−1)−1, mw = Vw(FTκ(θ) + B−1b) with κ(θ) = (θ − .5)
and Ω being a diagonal matrix of the wi’s. Then, for each SNP i and gene j, the
regulatory-interaction potential θij is sampled from its posterior distribution as
P(θij = 1) =φ(γij)logistic(Eiα)
φ(γij)logistic(Eiα) + (1− φ(γij))(1− logistic(Eiα))(A.2)
where φ(γ) = πγπ1−γ0 . If θ were estimated based only on whether the correspond-
ing SNP was an expression-regulator (i.e based on value of γ ), then the result-
ing estimation of regulatory-interaction potential would be equivalent to supervised
learning. On the other hand, if θ were sampled on posterior that depended only on
current estimate of α and not on γ, the resulting estimation be equivalent to clus-
172

tering. eQTeL, however, uses both in its posterior sample and therefore induces a
semi-supervised clustering of genomic regions into interacting regulator and neutral
regions. This approach to model θ induces a semi-supervised clustering of genomic-
region into interacting-regulators and noninteracting-regulators, since each MCMC
iteration produces a sample of θij for each SNP that depends on its γij in addition
to its current estimate of regulatory and interaction potentials.
Inference of β, σ2 and c
For simplifying the notations, in the section we only consider subset of SNPs
which were selected by the model so that X represents Xγ (this is n × q matrix,
where n is number of samples and q is total number of SNP selected in the model).
The generative model for β, σ2 and c are:
Y|β, X, γ ∼ N(XTβ, σ2I)
β|c, σ ∼ N(0, cσ2(XTX)−1)
σ2 ∼ IG(ν/2, νλ/2)
c ∼ IG(1
2,n
2) (A.3)
173

For Zellner’s g-prior ν is usually assumed to be zero. β, σ2 and c are sampled from
the full posterior distribution as:
P(β, σ2, c|Y, X) ∝ c3/2exp(−n/2c)
σ−2(ν/2+1)σ−n(cσ2)−q/2
exp−1
2σ2νλ
−1
2σ2(Y − Xβ)T(Y − Xβ)
−1
2σ2(β− β)TXTX(β− β)
−1
2cσ2βTXTXβ (A.4)
Where, β = (XTX)−1XTY
P(σ2/.) ∝ σ−2(ν+n+q2
+1)
exp−1
2σ2
((Y − Xβ)T(Y − Xβ) +
βTXTXβ
c+ νλ
)
σ2|. ∼ IG
(ν+ n+ q
2,1
2(Y − Xβ)T(Y − Xβ) +
βTXTXβ
2c+νλ
2
)(A.5)
P(c/.) ∝ c−(q+1)/2−1
exp−1
2c
(n+
βTXTXβ
σ2
)
c|. ∼ IG
(q+ 1
2,βTXTXβ
2σ2+ n/2
)(A.6)
174
P(β, |.) ∝ exp−1
2σ2(β− β)TXTX(β− β) −
1
2cσ2βTXTXβ
β|. ∼ N
(c
c+ 1β,
cσ2
c+ 1(XTX)−1
)(A.7)
Convergence of sampler
Convergence of the MCMC sampler was assessed by running 10 independent
chains and diagnostics of MCMC chain was performed using R-package “coda”. In
general, we found that the Markov chains converge within 5000 iterations of the
sampler.
Initialization
We use univariate-eQTL to initialize different parameter of the eQTeL model.
Further investigation into the reasons for eQTeL’s
performance gain
In this paper, we have chosen to compare performance of eQTeL against eqt-
nminer since it is the only method that mostly explicitly incorporated epigenomic
data in eQTL as opposed to traditional eQTL approaches. First eqtnminer esti-
mates Bayesian factor (likelihood of association) of each SNP, assuming at most
one SNP per gene to be causal; this assumption can be limiting, because it cannot
175

identify combination of SNPs that jointly explain the expression variance. It then
estimates posterior probability of each SNP to be causal regulator by modeling prior
probability as a function of epigenetic data. However, eqtnminer parameter estima-
tion relies on maximizing a likelihood function, which is prone to get stuck in local
maxima due to correlation among different types of epigenetic data (demonstrated
in supplementary note 6 and Fig S9). Further, they do not explicitly model relative
weights of genetic and epigenetic factors in determining causality of SNPs. Another
approach by Lee et al. [2], does not have the limiting assumption of single causal SNP
per gene but it does not incorporate epigenomic data, making comparison infeasible.
Recently, Lappalainen et al. [139] uses Matrix-eQTL (essentially a univariate eQTL
method) to find associated SNPs, and estimates the proportion of causal SNPs by
comparing their epigenomic profiles with that of the most associated SNP per gene
as a gold standard (which is a strong assumption). Since they do not explicitly iden-
tify causal SNPs amongst associated SNP (the only estimate proportion of causal
SNPs), this method is not directly comparable with our method.
To assess performance of eQTeL, we also chose LASSO as a representative
of multivariate regression eQTL approaches, because of its good performance and
scalability to larger datasets. Other approaches to date [215–217] that identify
causal variants in GWAS, but not in eQTL studies and therefore are not directly
comparable.
eQTeLs performance gain is potentially due to two main factors (i) inte-
gration of epigenetic data, (ii) allowing multiple causal variants per gene (cite
http://www.ncbi.nlm.nih.gov/pubmed/25104515). In quantifying the relative con-
176

tribution of each of these factors, we note that the mean correlation between actual
and predicted eQTeL-predicted gene expression, when a single causal SNP per gene
is allowed, is 0.154. This correlation improved substantially to 0.289 when 5 causal
SNPs per gene are allowed in eQTeL (Fig S8). However, in the absence of epige-
nomic data, i.e., when using standard LASSO, we do not see any such performance
gain, and in general, the performance is substantially worse than that for eQTeL.
This strongly suggests that allowing multiple SNP per gene is useful in identifying
regulatory SNP specifically when functional information is used.
Another advantage of eQTeL is that it models heterogeneity in epigenetic sig-
natures of expression regulators. eQTeL is a hierarchical Bayesian model as opposed
to empirical Bayes model. Unlike empirical Bayes, hyper-parameters of model are
drawn from unparameterized distributions. For this reason in eQTeL all parame-
ters are estimated using MCMC sampling and EM approximation was not required.
Empirical prior models [2, 49, 218, 219] assumes a single signature for all regulators
and therefore cannot account heterogeneity in the type of regulators of different
genes. The eQTeL accommodates such heterogeneity because it allows variation in
parameter combinations.
177

Other methods for comparison
Eqtnminer
The software tool related to Gaffney et. al. was downloaded from http://
eqtnminer.sourceforge.net. For each of the comparative analysis, the initial set
of SNPs per gene was kept same for both eqtnminer and eQTeL for fair comparison.
We obtained Bayesian factor for each SNPs using eqtnminer. The parameters to
calculate epigenetic prior were estimated using maximizing equation (9) of Veyrieras
et. al. The parameters were initialized as recommended by Veyrieras et. al.
To generate Fig 2, we controlled for total number of SNPs selected by eQTeL
and eqtnminer. To do so, we sorted SNPs based on eqtnminer prior probability and
selected top 2428 SNPs. As Gaffney et. al. recommend the eqtnminer for single
SNP per gene, we compared the performance of eqtnminer in main manuscript (Fig
5, 6 and 8) using single SNP per gene for footprint enrichment, allele-specificity
and ChiA-PET enrichment analyses. We repeated that analysis by controlling for
number of SNPs per gene between eQTeL and eqtnminer; the eQTeL still outperform
eqtnminer in that case. To generate Fig S8, for each gene we selected N (= 1,2, 3
and 5) top SNP(s) based on eqtnminer posterior probability.
LASSO
R-package GLMNET was used for L1 regulaizer multivariate regression (LASSO).
LASSO estimates effect size (regression coefficient), for the SNP included in the
178

model. We used 10-fold cross validation to estimate the hyper-parameter (lambda,
regularization parameter). For each of the comparative analysis, the initial set of
SNPs per gene was kept the same for both LASSO and eQTeL for fair comparison.
To generate Fig 2, we controlled for total number of SNPs selected by eQTeL
and LASSO. To do so, we sorted SNPs based on absolute value of effect size esti-
mated by LASSO-selected top 2428 SNPs. To generate Fig S8, for each gene we
selected N (=1,2,3 and 5) top SNP(s) based on absolute value of estimated effect
size estimated by LASSO.
Matrix-eQTL /univariate-eQTL (Lappalainen et. al.)
We used R package matrix-eQTL (http://www.bios.unc.edu/research/genomic_
software/Matrix_eQTL/), to perform univariate-eQTL as recommended by Lap-
palainen et. al.
Epigenetic-only model
In simulation study, α parameters were learned, in supervised manner, by
using enhancers as training example. Bayesian logistic regression [144] was used to
learn α. Based on learned α, SNPs were sorted based on their regulatory potential.
Known-epigenetic-prior-eQTeL
Known-epigenetic-prior-eQTeL, is a version of eQTeL (for simulation study
only) where instead of estimating α, the α used to generate regulatory potential for
179
simulation study was used. Thus it is a theoretically best model for eQTeL.
Variable selection method
Variable selection model was implemented by modifying eQTeL model as fol-
lows: (a) informative prior was changed to uninformative priors. (b) hierarchical
sampling SNP (based on LD block) was switched off; each SNP were processed
sequentially, similar to Liang et. al. [146].
Lirnet
Lirnet was downloaded from (http://homes.cs.washington.edu/~suinlee/
lirnet/). Because of computational limitation of lirnet (it takes 13 days of CPU
processing in a 64 core machine to process 200 genes), this analysis was limited
to 200 random genes. Hyper-parameter of the model was set by cross-validation
as recommended in Lee et. al. [2]. For comparing the performance of Lirnet with
eQTeL we ran eQTeL with same set of 200 genes.
Figure A.13 demonstrates that eQTeL outperforms Lirnet in terms of explained
variance and prediction accuracy ( we controlled for number of SNPs selected by each
methods). Figure A.8 also demonstrates that higher fraction of of SNPs detected by
eQTeL overlaps with footprints, suggesting eeSNPs are more likely to be functional
compared to SNPs detected by Lirnet.
180

Eqtnminer subset selection
We used 95 dimensional epigenetic and interaction features, (Fig A.2) to learn
interacting-regulatory potential by eQTeL. Many of the features have very high
correlation between them. When the 95 dimensional features were used for learning
prior in eqtnminer, the alpha parameters (feature importance) were not learned
accurately. This is most probably due extreme correlation between different input
features that might cause the maximization function to stuck in a local maximum.
To analyze this further, we used 8 features of the 95 dimensional features, which were
given high feature importance by eQTeL and does not have extreme correlation. The
performance improved substantially, although eQTeL performed better compared to
eqtnminer(Supplementary Fig. A.9).
Multiple hypothesis correction/sparsity constrains
Here we demonstrate that eQTeL model can detect causal expression-regulatory
SNP even if they have small effect size by analyzing sparsity constraints by asso-
ciation methods on the simulated dataset. Normally, due to multiple-hypothesis
test correction (equivalent to sparsity constraint in Bayesian models), expression-
regulators with small effect on expression are missed. Fig. A.6. shows effect-size
distribution of identified causal SNPs by univariate-eQTL and eQTeL when the
same number of SNPs is selected by each methods. Univariate-eQTL cannot identify
causal SNPs with low effect-size because of severe multiple-hypothesis correction.
181
eQTeL, however, detects causal SNPs with small effect-size. Although the recall-rate
decreases with the effect size for eQTeL it can more effectively retrieve causal SNP
with small effect size, particularly those with relatively high interacting-regulator
potential. Since there are fewer SNPs which are within an interacting-regulator,
selection of expression regulators among those SNPs can be made under a relatively
less severe sparsity constraint (or equivalently, multiple hypothesis correction). This
is evident from from Fig. A.6. Moreover, recall rate of eQTeL is relatively higher
for top 50% causal SNPs with stronger interacting-regulatory potential (eQTeL-
high) than for the bottom 50%. This suggests that eQTeL applies a relatively lower
sparsity constraint on interacting-regulators.
Explained variance and expression predictability
Different methods are known have biases in estimating effect size β. For in-
stance, LASSO is know to over-shrink the parameters, therefore it is recommended
that first LASSO be used for feature selection and then β be estimated indepen-
dently for selected features [79]. To remove such biases and compare performance
of different methods in an unbiased manner, each methods were used for regulatory
SNPs identification only and β was independently estimated using cross-validation
training set as follows.
For each method, explained variance and expression predictability was esti-
mated using k fold cross-validation. Samples were randomly partitioned into k
subsamples. k − 1 of subsamples were used for estimating β for selected SNPs as
182

βtrain = (XTX)−1XTY, while retaining one subsample for validation. In the validation
subsample expression was predicted as Ytest = XT βtrain. Expression predictability
was defined as Pearson correlation between Ytest and Ytest. Explained variance was
calculated as 1− var(Ytest−Ytest)var(Ytest)
. This process is repeated k times, using each k sub-
samples for validation exactly once. The mean and standard deviation of explained
variance of expression predictability and explained variance was calculated for k test
subsamples.
Scalability and computation
eQTeL uses shared memory multiprocessing to process genes in parallel. This
makes it feasible to run Gibbs sampler to process thousands of genes with mil-
lion of putative SNPs. In order to calculate Bayesian factor of SNP, we use fast
Choleksy-update algorithm described in Dongarra et al. (Ch 10. [220]). Further,
while calculating feature importance α at each Gibbs iteration we randomly sample
subset of interacting-regulator and non-regulators to: a) speed up the eQTeL model
and b) avoid over-fitting while estimating α.
The software GOAL that implements the eQTeL model uses the multiple cores
to speed up the process. In addition, we use several efficient algorithms from LA-
PACK to efficiently update the Choleskythe most computation intensive part of
eQTeL. GOAL can efficiently handle million of SNPs for thousand of genes because
it process each genes in parallel in a separate thread. In addition, the epigenetic
importance can be estimated using subset of genes; and given the importance esti-
183

mated each of genes could be processed independently.
184

Appendix B: Synthetic rescue determinants of resistance and response
to cancer therapy
Extended data figures
185

186

Figure B.1: (a-e) Synthetic rescues functional truth tables: The truth tables of thefour SR and SL interaction types. Each truth table denotes the cell viability states- viable (green), non-rescued (i.e., lethal – red), and rescued (blue) - as a functionof the activity state of each of the SR pair genes (down regulated, wild-type andup-regulated). The states are enumerated as state 1 to state 9.: (a) (DU-SR): Down-regulation of a vulnerable gene is lethal but the cancer cell is rescued (retains via-bility) by the up-regulation of its rescuer partner; (b-d): Analogous functional truthtables for (DD, UD, and UU) SR types. (e) In an SL interaction, in difference, thedown-regulation of either gene alone is viable but the down-regulation of both genestogether is lethal. (f) Overview of INCISOR. INICISOR takes inputs as expression,somatic copy number of alternations (SCNA) and survival of patients sample asinput and output SR pairs. It composes of 4 steps: SoF performs 4 Wilcoxon testto compare expression between groups highlighted in red and black (and similar 4wilcox test for SCNA). Next three step survival data uses survival data and performKM analyses to compare survival between the groups highlighted in red and black.(g-i) DU-type SR network and functional characterization. (f) Pairwise gene enrich-ment analysis: The Extended Data Figure shows relationship between vulnerablegene biological processes (red) and rescuer gene biological processes. Edges betweena vulnerable process and rescuer process represents enrichment of the vulnerableprocess in vulnerable gene partner of rescuer process genes. (g) SR-DU networkof metabolic genes and functional characterization. The figure depicts syntheticrescues network with 152 vulnerable genes (green) and 210 rescuer genes (red) of131 metabolic genes (diamond) encompassing 258 interactions. The size of nodesindicates their degree in the network as in (c).
187
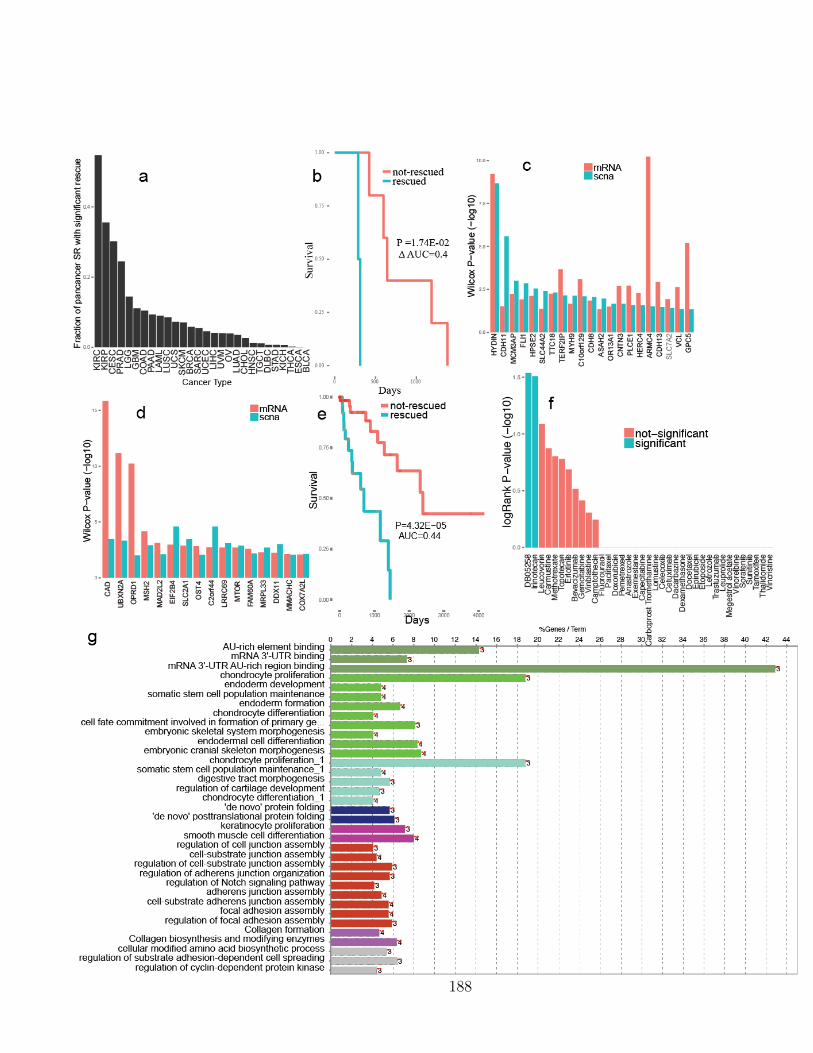
188

Figure B.2: (a) Pan-cancer clinical significance of SR network. X axis shows 23different cancer types, and Y axis shows the fraction of significant pan-cancer SR ineach cancer type. Pan-cancer TCGA dataset was divided into two halves. DU-SRnetwork was identified by applying INCISOR using one half of the data, and clinicalsignificance was determined in the other half of the data. (b) Clinical predictivepower of pancancer DU-SR pairs in an independent ovarian cancer dataset. TheKM plot compared the survival of rescued (top 5-percentile; blue) vs non-rescued(bottom 5-percentile; red) ovarian cancer samples (N=92). The rescued samplesshow worse patient survival (logrank p-value<0.017, ∆ AUC=0.4). (c-e) Rescueractivation associated with the vulnerable gene inactivation due to somatic muta-tions. (c) Rescuer activation per each vulnerable gene. The horizontal axis listsvulnerable genes with somatic mutations in TCGA samples, and the vertical axisdenotes the significance of rescuer gene-activity between samples with vs. withoutvulnerable gene mutations. (d) Rescuer activation per each rescuer. The horizontalaxis lists rescuer genes with somatic mutations in TCGA samples and the verti-cal axis denotes the significance of rescuer gene-activity between samples with vs.without vulnerable gene mutations. (e) The KM plot depicts the aggregate clinicalpredictive power of rescuers of CDH11 gene, among patient with CDH11 mutation.(f) Predictive power of SR when they are treated as SL. In this predictor an acti-vation of SR as defined as when a rescuer expression is wild type and vulnerablegene is inactive Specifically, for each patients we count number of rescuer activity iswild-type, patients with the higher count (top 10 percentile) were considered as non-responder and lower count (bottom 10 percentile) were considered as non-responder.(g) GO-term enrichment analysis with rescuers of the drug targets. Rescuers areenriched with lipid storage/transport, thioester/fatty acid metabolism, and drugefflux transporters.
189

190

Figure B.3: TCGA drug response. Drug response of top 15 anti-cancer drugs usingdrug- DU-SR in TCGA data. Each subplot represents a KM analysis of responder(red) v/s non-responders (blue) for a drug. The name of drug, log-rank p-value and∆AUC is indicated in each subplot.
191

192

Figure B.4: (a-d) SR network successfully predicts the response to cancer drugtreatments in breast cancer. (a) Expression fold change (pre- versus post- drugtreatment) is shown for the rescuer genes of the four vulnerable genes that aretargeted by a drug cocktail in a cohort of 25 clinical breast cancer patients (i.e., fromthe BC25 dataset). Box plots aggregate rescuer expression changes for all rescuersof a given vulnerable target across patients that are clinical responders (blue) andnon-responders (red). Ranksum p-values denote differences in overall rescuer foldchange between these responder groups for each target gene. (b) Expression foldchanges are shown for clinical responders and non-responders of BC25 for the 5rescuers of the gene target BCL2. In (a) and (b) significant genes are marked bystars (ranksum p-value<0.05). (c) The 20 DU gene pairs active in the BC25 datasetare ranked by degree of potency (i.e., by the ranksum p-value denoting differentialresponder- versus non-responder pre- to post- drug fold change) (y-axis), and alsoranked by their rescue effect (as calculated using the BC-DU-SR network as instep 2 of INCISOR) (x-axis). These measures correlate (Spearman = -0.54, p<1e-3). (d) Receiver Operating Characteristic (ROC) curve for an SVM predictor ofpatient treatment response, trained on the BC25 dataset. Area under the curve(AUC) is 0.71 for the predictor (blue), as compared to 0.54 for a random predictor(red). (e-k) SR network successfully predicts the response to cancer drug treatmentsin gastric cancer (e) The bar plot shows the significance of over-expression of 15rescuers of THYMS in the tumors of patients who acquired resistance to Cisplatinand Fluorouracil compared to the patients who did not acquire resistance. (f,g) TheKM plots depict the clinical significance of rescuer over-expression in patient tumorsin terms of progression free survival (f) and overall survival (g). The patients withhighly rescued tumors (>90 percentile) have significantly worse survival comparedthe patients with lowly rescued tumors (<10 percentile). The KM plot comparesthe difference in survival rates between rescued patients with many rescuers over-expressed (top 10 percentile) and non-rescued patients with fewer rescue events(bottom 10 percentile) for random chosen rescuer genes (h) for over-all survival and(i) progression-free survival. Both figures show no statistical significance.(continuedin the next page). (j) The contribution of the 4 steps of INCISOR in predicting over-activation of rescuers. The rescuers identified by combining 4 steps of INCISORshow the highest significance, and this is followed by significances of rescuers over-expression identified with each of the step separately: robust rescue effect (step3), oncogene rescuer screening (step 4), molecular survival of the fittest (step 1),vulnerable gene screening (step 2), and random control.
193

Figure B.4: (continued in the previous page): (k) The clinical significance of the res-cuer up-regulation (rescue effect) of the 4 steps of INCISOR (estimated in ∆AUC).The rescuers identified by all 4 steps of INCISOR have the most significant clini-cal impact, and this is followed by those identified by robust rescue effect (step 3),molecular survival of the fittest (step 1), oncogene rescuer screening (step 4), andvulnerable gene screening (step 2).
194
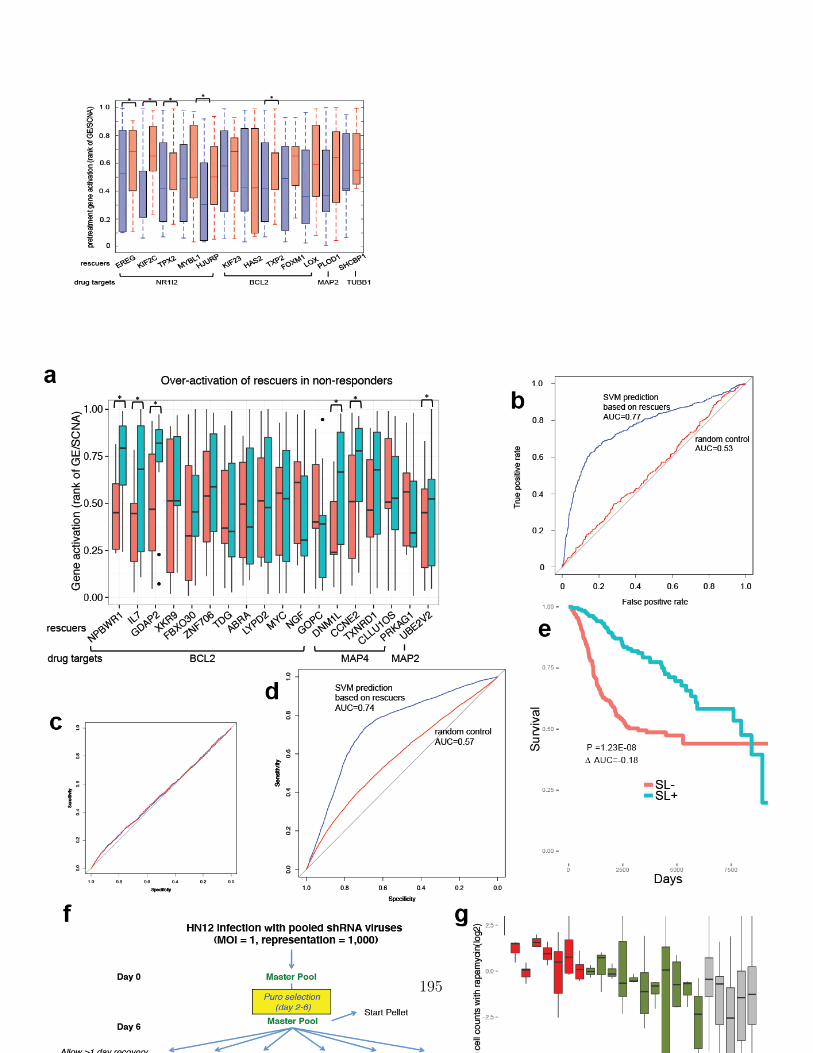
195

Figure B.5: Extended Data Figure 5. (a,c) Synthetic rescue interaction in ovariancancer dataset: (a) Rescuers are up regulated in non-responders: We compared ac-tivation of 18 rescuer genes (of the treatment drugs 3 targets) in non-responders(blue) vs. responders (red) before primary treatments. Ranksum p-values denotesignificant non-responder vs. responder expression differences. Significant genesare marked by stars (ranksum p-value<0.05). (b) A binary classifier based on pre-treatment rescuer gene expression predicts patient relapse among 32 initial respon-ders (AUC=0.77 (blue), vs. AUC=0.53 (red) for an 18-gene random classifier). (c)Pre-treatment SL partners expression is insufficient to predict future relapse amonginitial responders in ovarian cancer. An ROC plot showing the prediction accuracyobtained by a linear SVM based on 18 SL partners (AUC=0.52) compared to theaccuracy obtained based on 18 random genes (red line, AUC=0.52) in ovarian can-cer. (d) Pre-treatment rescuers expression successfully predicts future relapse amonginitial responders in breast cancer. An ROC plot in breast cancer shows the pre-diction accuracy obtained by a linear SVM (AUC=0.74) compared to the accuracyobtained based on 13 random genes (red line, AUC=0.57). (e) Clinical significanceof SL pairs identified by INCISOR Patients were scored based on number of func-tionally active SL pairs. Kaplan-Meier analysis shows the survival of patients whobelong to top 10 percentile (SL+) is better than the survival of those belonging tobottom 10 percentile (SL-). (f-g) Experimental shRNA screening validates (DD)rescue effects of mTOR. (f) Summary of pooled shRNA experiment. Time points,treated and control samples are explained in the figure. (g) 19 predicted vulnerablepartners for mTOR are knocked down using shRNA. Next, Rapamycin is used toinhibit mTOR. The vertical axes show fold change in cell counts after versus beforeRapamycin treatment (i.e., in the non-rescued versus the rescued state). SR part-ners of mTOR are compared to several control genes that are not in SR pairs withmTOR.
196

197

Figure B.6: DD-type SR network and functional characterization (a) The figuredepicts synthetic rescues network with 531 vulnerable genes (green), 422 rescuergenes (red) encompassing 977 interactions. Red denotes vulnerable genes and greendenoted rescuers genes, while the size of nodes indicates their degree in the network,such that large nodes point to major vulnerable and rescuer hub genes. (b) Vulner-able genes are enriched with transmembrane ion transport signaling. (c) Rescuersare enriched protein location processes, WNT signaling, T cell regulation, proteinfolding and proteolysis. (d-f) UD-type SR network and functional characterization(d) The figure depicts synthetic rescues network with 1134 vulnerable genes, 789rescuer genes (red) encompassing 2637 interactions. Red denotes vulnerable genesand green denoted rescuers genes, while the size of nodes indicates their degreein the network, such that large nodes point to major vulnerable and rescuer hubgenes. (e) Gene enrichment analyses of vulnerable genes. (f) Gene enrichment anal-yses of rescuer genes. (g-i) UU-type SR network and functional characterization(g) The figure depicts synthetic rescues network with 1083 vulnerable genes, 430rescuer genes (red) encompassing 1515 interactions. Red denotes vulnerable genesand green denoted rescuers genes, while the size of nodes indicates their degree inthe network, such that large nodes point to major vulnerable and rescuer hub genes.(h) Gene enrichment analyses of vulnerable genes. (i) Gene enrichment analyses ofrescuer genes.
198

199

Figure B.7: BC-SR network and its functional characterization. (a) DU: The fig-ure depicts synthetic rescues network among 433 vulnerable genes (green) and 583rescuer genes (red), encompassing 2298 interactions. Rescuers are enriched withlipoprotein metabolism and G-protein coupled and chemokine receptor pathways.Vulnerable genes are enriched with linoleic acid metabolism and IL2 signaling path-way. (b) UU: The figure depicts synthetic rescues network with 1056 vulnerablegenes (green), 311 rescuer genes (red) encompassing 3096 interactions. Rescuers areenriched with negative regulation of immune response and histone phosphorylation.Vulnerable genes are enriched with GTPase activity and extracellular matrix orga-nization. (c) UD: The figure depicts synthetic rescues network with 635 vulnerablegenes (green), 176 rescuer genes (red) encompassing 1189 interactions. Rescuers areenriched with cell morphogenesis. Vulnerable genes are enriched with cytochromeP450 and fatty acid metabolism. (d) DD: The figure depicts synthetic rescues net-work with 244 vulnerable genes (green), 110 rescuer genes (red) encompassing 781interactions. Rescuers are enriched with proteasome complex and IL6 pathway.Vulnerable genes are enriched with protein folding and methytransferase.
200
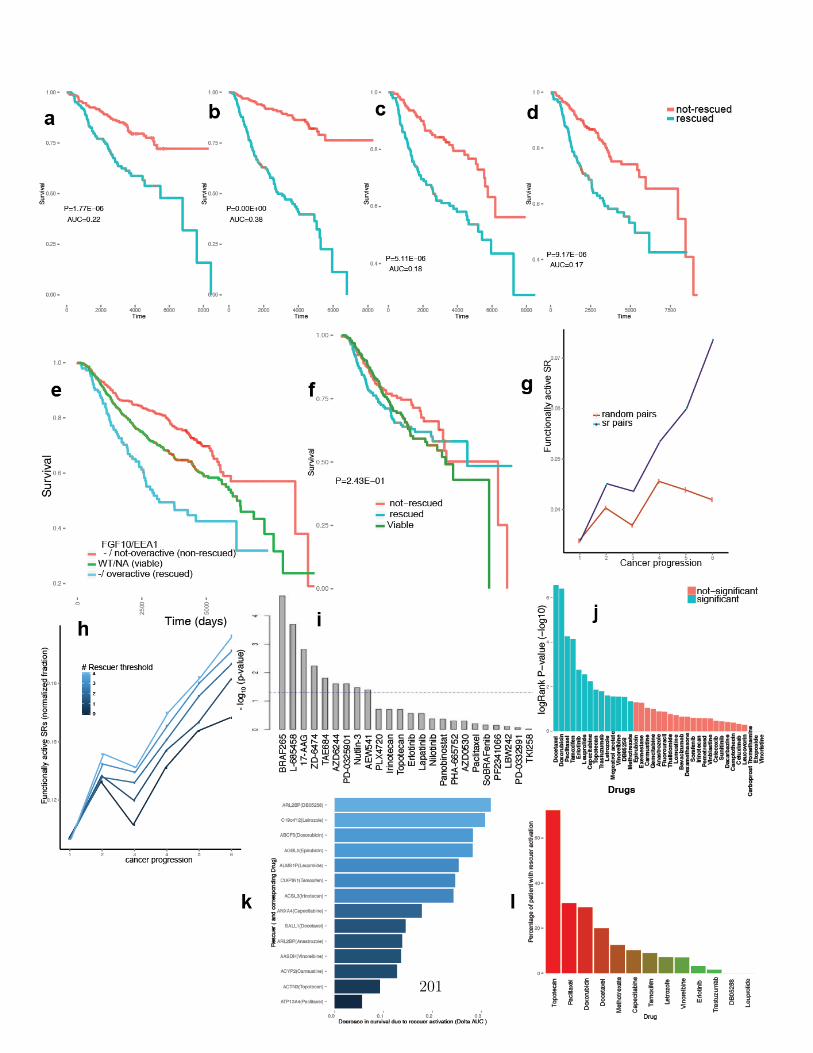
201

Figure B.8: a-d) Clinical significance of 4 types of SR interactions in breast cancer:The Kaplan Meier (KM) plot depicts the difference in clinical prognosis betweenpatients with rescued tumors (>90-percentile of number of functionally active SRpairs, blue) vs patients with non-rescued (<10- percentile of number of functionallyactive SR, red) samples. As predicted, a large number of functionally active rescuerpairs renders significantly marked worse survival based on all four different SR net-works: (a) DD, (b) DU (c) UD and (d) UU. The logrank p-values and ∆AUC aremarked, and DU shows the strongest clinical significance. (e) Illustration of effectof non-rescued, viable and rescued states on survival due to SR interaction betweenFGF10 (vulnerable gene) and EEA1 (rescuer gene) SR interaction. Patients weredivided based on state of FGF10/EEA1 SR interaction: i) in viable state EEA1was WT in patients, ii) in non-rescued state EEA1 was inactive and FGF10 wasnot over-active, and iii) in rescued stated EEA1 was inactive and FGF10 was over-active. (f) Rescue effect of SR network is due to interaction: Shuffling the vulnerablegenes in SR network and KM analysis similar to Figure 4.5e. (g-h) The functionalactivity of SR increases as cancer progresses. (g) The number of functionally activeSRs (green) and random gene pairs (red) as cancer progresses. (h) The numberof rescued inactive vulnerable genes with varying number of active rescuers (fromsingle rescuer with darkest blue line to five rescuers with the lightest blue line) ascancer progresses. (i-l) The breast cancer SR-DU network predicts drug response incell lines and cancer patients. (i) The rescuer activity profiles of individual cell-linespredict drug response of 9 out of 24 drugs. We compared the experimentally mea-sured drug response (IC50 values) between predicted rescued vs. non-rescued celllines using a ranksum test. The horizontal axis represents the 24 drugs in CCLEdatabase, and the vertical axis denotes the ranksum p-values. (j) The rescuer ac-tivity profiles successfully predict the survival of patients whose tumors are rescuedvs. those whose tumors are non- rescued (the latter patients have better survival)for 15 out of 37 drugs as quantified by a logrank test. The horizontal axis lists the37 drugs in TCGA BC dataset, and the vertical axis represents the logrank p-valuesexamining the separation between predicted rescued and non-rescued tumors. (k)The expected clinical impact of rescuer genes knockdown: Key rescuer genes andtheir corresponding drugs (in parenthesis) are listed on the vertical axis, and theexpected clinical benefit of the rescuer knockdown is presented in the horizontalaxis. The clinical impact was measured by comparing the survival of drug-treatedpatients with and without the corresponding over-active rescuer (l) The likelihoodof developing drug resistance: The probability of developing SR mediated resistance(vertical axis) for each drug (horizontal axis) is estimated by the fraction of samplesthat have non-zero over-activation of rescuers.
202

203

Figure B.9: (a-b) Characterization of rSR and bSR. (a) We identified rSR by se-lecting SR pairs whose rescuer activation (green) consistently drives the functionalactivation of SR (blue) as cancer progresses. (b) We identified bSR pairs by selectingSR pairs whose vulnerable gene inactivation (red) drives the functional activation.(c-j) Clinical impact of rSR and bSR (c,d) The KM plots depict the patients withhighly rescued tumors (red; >90 percentile) have worse survival than the patientswith lowly rescued tumors (blue; <10 percentile). The rSR shows more significantclinical rescue effect (logrank p- value<1E-300) than bSR (logrank p-value <1E-8) in comparison to rescuer controls (g) and (h). (e,f) The KM plots depict thedifference in the survival between two groups of patients whose tumors are highlyvulnerable (red; >90 percentile) vs. lowly vulnerable (blue; <10 percentile) givenover-activation of rescuer genes. The rSR shows more significant impact (logrankp-value<1E-300) than bSR (logrank p-value <1E- 8) in comparison to vulnerablecontrols (i) and (j).
204

205

Figure B.10: Clinical significance of SR network in breast cancer subtypes The KMplot depicting the differences in clinical prognosis between rescued (>90-percentileof number of functionally active SR, blue) vs non-rescued (<10-percentile of numberof functionally active SR, red) samples in her2 subtype (first row), triple-negative(second row), luminalA (third row), and luminalB (fourth row). The high fractionof rescue renders worse survival in all 4 different types of SR: DD (first column),DU (second column), UD (third column), and UU (fourth column). Their logrankp-values and the ∆AUC are represented.
206

The INCISOR pipeline
INCISOR identifies candidate synthetic rescue (SR) interactions with four
independent statistical tests, each tailored to test distinct properties of SR pairs. We
describe here in detail the identification procedure of four types of SR interaction
(Extended Data Figure 1f).
Molecular survival of the fittest (SoF) (Step 1):
To reliably define the activity of a gene, we used gene expression (GE) and
somatic copy number alteration (SCNA). A gene is inactive (respectively, overac-
tive) if its expression level is less (greater) than the 20th-percentile (80th-percentile)
across samples and its SCNA is less (greater) than -0.1 (0.1). A gene has its normal
activation level if its expression level is between the 25th and 75th percentile (across
samples).
To identify an SR pair from cancer molecular data, we performed the following
four Wilcoxon tests, examining all possible pairs of a vulnerable gene V and a rescuer
gene R.
For DU (DD) type, we confirmed if: (a) the SCNA levels of vulnerable gene V
are not significantly different in samples with wild-type levels of rescuer R from its
levels in samples where rescuer R is inactive (respectively, over-active) [Test I]; (b)
the SCNA levels of vulnerable gene V are significantly lower (higher) in the samples
where rescuer gene R is over-activated (inactivated) than in the samples where
207

rescuer R is inactivated (over-activated) [Test II] and in the samples with wild-type
levels of rescuer gene R [Test III] test I, III distinguish DU- (DD-) type SR from SL
(SDL); and (c) the SCNA levels of rescuer genes R are significantly higher (lower)
in samples when the vulnerable gene V is inactive compared to samples where gene
V is not inactive [Test IV]. (Here SDL stands for synthetic dosage lethality, where
over-activation of one gene renders lethality to another gene.)
For UU (UD) type, we confirmed if: (a) the SCNA levels of vulnerable gene
V are not significantly different in samples with wild types levels of rescuer R from
its levels in samples where rescuer R is inactive (over-active) [Test I]; (b) the SCNA
levels of vulnerable gene V are significantly higher (lower) in the samples where
rescuer gene R is over-activated (inactivated) than in samples where rescuer R is
inactivated (over-activated) [Test II] and in the samples with wild-type levels of
rescuer gene R [Test III]; and (c) the SCNA levels of rescuer genes R are significantly
higher (lower) in samples when the vulnerable gene V is overactive compared to
samples where gene V is not overactive [Test IV].
For each type, we performed, analogously, four Wilcoxon tests examining the
corresponding activity of candidate genes V and R at the gene-expression level. The
molecularly inferred SR candidates were defined as those gene pairs that pass all 4
tests.
208

Vulnerable gene screen (Step 2)
This step tests whether the candidate vulnerable gene A is actually lethal when
not specifically rescued by candidate rescuer gene B: we performed two Kaplan-Meier
(KM) analyses testing if vulnerable gene A inactivation for DU/DD (over-activation
for UU/UD) without rescue improves patient survival [test I]; and if vulnerable
gene A inactivation for DU/DD (over-activation for UU/UD) with rescue decreases
patient survival [test II]. Specifically, we calculated ∆AUC due to vulnerable gene
A inactivation in DU/DD (over-activation in UU/UD) for the patients with rescuer
B over-activated in DU/UU (inactivated in DD/UD), and for the patients where
rescuer gene B is not over-activated in DU/UU (not inactivated in DD/UD), and
then we calculated the difference in the ∆AUCs. Gene pairs with top 25percentile
of these differences were selected as final SR pairs.
Robust rescue effect (Step 3):
This step selects the candidate gene pairs that provide consistently high pre-
dictive patient survival signal across multiple datasets and across multiple cancer
types. For DU-type, we compared the survival of rescued inactive vulnerable gene A
(rescuer gene B over-activated; state 3 in Extended Data Figure 1a) vs non-rescued
gene A (states 1, 2). For DD-type, we compared the survival of rescued inactive
vulnerable gene A (rescuer gene B inactive; state 1) vs non-rescued gene A (states
2, 3). For UU-type, we compared the survival of rescued over-active vulnerable gene
A (rescuer gene B over-activated; state 9) vs non-rescued gene A (states 7, 8). For
209
UD-type, we compared the survival of rescued over-active vulnerable gene A (res-
cuer gene B inactive; state 7) vs non-rescued gene A (states 8, 9). The extent of
decrease in survival of rescued samples from non-rescued is termed as rescue effect.
We aggregated the results over 50 bootstraps of the samples set to identify robust
rescue effect across datasets [221].
Oncogene rescuer screen (Step 4):
This step tests whether the rescue effect observed so far for a given pair A->
B is mediated by true synergy between the genes as desired or is just a false positive
effect caused by a single gene, candidate rescuer B, that is not pair specific. For
each candidate rescuer gene B we calculated its rescue effect (∆AUC) when each of
the candidate vulnerable genes is inactivated for DU/DD-types (over-activated for
UU/UD-types). For the analyses only those SR pairs that show significant rescue
after FDR correction are considered. The top 10-percentile of vulnerable genes A
among those vulnerable genes with significant rescue effect was labeled as having
synergistic effect with the rescuer gene B.
Pan-cancer KM analyses: combining survival analysis of dif-
ferent cancer types.
INCISOR was applied to pan-cancer TCGA (the Cancer Genome Atlas) data
[76], and breast cancer and its four subtypes. For pan-cancer analysis INCISOR
tailors a log-rank statistical test for the three survival analyses (steps 2-4) to ac-
210

count for differences in survival time between cancer types. Specifically, to compare
survival of any two groups, we estimate expected number of deaths in each group
for each cancer type separately assuming a hypergeometric distribution. We then
sum the cancer-specific estimates of expected and observed number of deaths to
infer pan-cancer expected and observed number of deaths. Finally a 2-test compar-
ing the pan-cancer expected and observed deaths gives the final pan-cancer survival
difference between any two groups tested. For cancer type-specific analysis (breast
cancer (BC) and BC subtypes), we performed a regular log-rank test.
Pan-cancer SR network
DU network
We applied INCISOR to the pan-cancer TCGA data spanning 7,995 samples
across 28 different cancer types. SR interactions are overwhelmingly asymmet-
ric, where only 10 genes (ARL2BP, FOXL1, GLDN, JAM2, MT1A, PLEKHM2,
SLC19A3, TMEM39B, UACA, UBE3B) are both rescuers and vulnerable genes.
The pan-cancer DU-SR network has 2,033 interactions involving 686 rescuer genes
and 1,513 vulnerable genes (Figure 4.4a, full network Extended Data Figure 1g inter-
active network in Supplementary Data 1). We carried out gene enrichment analyses
using ClueGO [222] (refer to Supplementary Information Sec 3.1). Vulnerable genes
are enriched with cellular process regulation, protein metabolic and developmen-
tal processes and the rescuers are enriched with mitotic cellular, macromolecule
211

metabolic and embryo development processes (Figure 4.4b,c), and in pairwise the
inactivation of genes involved in metabolism and adenylate kinase activity is rescued
by genes in mitotic cell cycle, and nuclear membrane, respectively (Extended Data
Figure 1h). To check whether SR interaction is mediated by physical contact of pro-
teins, we compared a protein-protein interaction (PPI) network [223] and our SR
network. We found a small fraction (2.5%) of SR-DU interactions (hypergeometric
p-value=0.70) are mediated by physical protein interactions.
If a cellular response to the inhibition of a vulnerable gene results in over-
activation of an oncogenic rescuer, such inhibition will be carcinogenic. Indeed, by
mining the data of carcinogenic agents and their targets [199,200,224] we found that
drugs that inhibit vulnerable partners of known oncogenes [189] are known to be
carcinogenic (hypergeometric P<0.03, Supplementary Information). We considered
the DU-rescuer oncogenes that have more than 5 vulnerable partners, and identified
their association with the drug targets of the carcinogenic agents identified above
using DrugBank [210].
Clinical significance of SR DU network across cancer types
To determine clinical significance of DU-type network across different cancer
types, we divided the TCGA dataset by half for each cancer type into a training set
and a testing set. We first identified SR pairs by applying INCISOR to the training
set, and we tested the clinical significance of the pairs by the fraction of SR pairs
that are individually significant in testing set. Extended Data Figure 2a shows the
fraction of significant SR pairs in each different cancer types. This is a natural way
212

Factors coef exp(coef) se(coef) z Pr(>|z|) Significance
Synthetic rescue 1.45E-‐01 1.16E+00 1.85E-‐02 7.826 5.00E-‐15 ***Age at diagnosis 1.33E-‐02 1.01E+00 3.41E-‐03 3.908 9.30E-‐05 ***
Size 1.30E-‐02 1.01E+00 1.80E-‐03 7.182 6.87E-‐13 ***
Lymph nodes positive
6.65E-‐02 1.07E+00 5.50E-‐03 12.083 <2.00E-‐16 ***
Genomic instability 1.27E-‐05 1.00E+00 2.39E-‐05 0.53 0.5961
ERBB2 -‐6.66E-‐01 5.14E-‐01 3.34E-‐01 -‐1.992 0.0464 *
ESR1 2.34E-‐01 1.26E+00 9.72E-‐02 2.402 0.0163 *
ESR2 -‐5.67E-‐02 9.45E-‐01 2.22E-‐01 -‐0.256 0.7981
PGR -‐4.71E-‐01 6.24E-‐01 2.97E-‐01 -‐1.584 0.1132
Table B.1: Survival Cox regression in METABRIC dataset with features as DU-SR network and other confounding factors. The table summarizes the Cox re-gression analysis of patient survival based on DU-SR network and other factorsin METABRIC dataset. DU-SR is significant (p − value < 5E − 15) even aftercontrolling for other confounding factors.
to estimate the clinical significance in each cancer type because many of the cancer
types have lower than 200 samples in TCGA.
Clinical significance of SR DU network in other cancer types
In the main text, we identified DU-SR network (and others) using TCGA data,
and validated it in an independent METABRIC breast cancer cohort dataset [198].
We compared the survival of patients whose tumors have many vs. few functionally
active DU-SRs, and found that rescued tumor samples typically accompany worse
patient survival (Figure 2a). This collective clinical significant in METABRIC data
is not simply due to lower expression or copy number of the vulnerable genes in the
rescued samples. The mRNA expression and SCNA of the 1,513 DU-SR vulnera-
ble genes are in fact higher in non-rescued samples than rescued samples (overall
213
ranksum P<2.2E-16 for both), and found 108 (166) of them are significantly up-
regulated (amplified) and 700 (1,036) of them are significantly down-regulated (lost
their copies) in rescued samples (ranksum p-value<0.05). This shows that the clin-
ical rescue effect is not simply mediated by differential activation of the vulnerable
partners.
We also tested the clinical significance of the pan-cancer DU-SR network in
another independent dataset for an ovarian cancer patient cohort from International
Cancer Genome Consortium (ICGC) [225]. We analyzed copy number alteration,
gene expression and patient survival data of 81 patients, and compared the survival
of rescued vs non-rescued tumor samples. We observed rescued samples show worse
survival compared to non-rescued samples (logrank p-value<0.017, ∆AUC=0.4) (Ex-
tended Data Figure 2b). We also observed 9.5% of the individual pan-cancer SR-DU
pairs show significance (logrank p-value<0.05) in this dataset.
TCGA (single nucleotide) mutation analysis
We examined the TCGA mutation profile to infer causality of SR interac-
tion (DU-type) in pancancer-scale. (The single nucleotide polymorphism mutation
profile has not been used in the SR prediction pipeline and hence can serve for
independently validating INCISOR predictions.). If the vulnerable genes inactiva-
tion leads to selection for rescuer activation, we expect more rescuers will be active
(over-expressed and/or increased copy number) when their vulnerable partner suf-
fers deleterious mutation. We tested this hypothesis using TCGA mutation profile
that spans 5,031 patients of 23 cancer types, and we considered SR interactions
214

of 341 genes that have mutations in at least 30 patients. We identified the res-
cuers of the 341 genes by applying less conservative INCISOR. Using Wilcoxon test,
we statistically compared the GE and SCNA of the rescuers in patients with and
without vulnerable gene mutations. Indeed, we found that the copy number of
rescuers were significantly higher in samples with mutated vulnerable genes than
without such mutation (Wilcoxon P <1.2e-100). The expression of rescuer genes
was also significantly higher in samples with mutations in vulnerable genes than in
those where they are intact (Wilcoxon P < 1.1E-17). Overall, 81% of 341 mutated
vulnerable genes showed higher copy number of rescuers in the event they were mu-
tated; with 33% of the genes having such a statistically significant increase in their
rescuers copy number (Wilcoxon p < 0.05). Only 2.8% of the genes showed sta-
tistically significant decrease in rescuers copy number. In terms of mRNA, 17% of
the mutated vulnerable genes showed significant under-expression of corresponding
rescuers. Extended Data Figure 2c shows the key vulnerable genes, when mutated,
whose rescuers show significant increase both in copy number and gene-expression.
Extended Data Figure 2d shows the key rescuer genes that show significant increase
both in copy number and gene-expression when their vulnerable gene partners are
mutated.
Interestingly, we also identified 7 vulnerable genes whose rescuers have signifi-
cantly lower copy number variation in mutated samples. We suspected that somatic
mutations in these 7 genes might increase its activity. Indeed we found that 3 genes
mutations are significantly associated with higher copy number variation or higher
gene-expression. In particular, samples with mutations in GATA3 have both higher
215

copy number and gene expression variance.
Our analysis revealed that CDH11, a membrane protein that mediates cell-
cell adhesion and is related to ERK signaling pathways [226], is highly rescued
when mutated. It was mutated in 2.1% of TCGA samples. INCISOR predicts
IFT172 and MSH2 as DU rescuers of CDH11. MSH2 protein is part of mismatch
repair complex (MutS), whose deregulation is associated with emergence of drug
resistance. In samples where CHD11 is mutated, these rescuers shows significant
increase in copy number (Wilcoxon P<2.6E-6) and expression (Wilcoxon P<0.03).
To investigate whether the cells are indeed functionally rescued by over-expression
of rescuers genes, we examined the patients with CDH11 mutation and compared
the survival of these patients when rescuers of CDH11 are highly activated to their
survival when they are not. As anticipated, patients whose inactivated CHD11
is rescued show much poorer survival (Extended Data Figure 2e). This analysis
demonstrates that a somatic mutation that inactivates a key cancer driver gene can
be buffered/rescued by activation of rescuer genes.
Cancer-drug DU SR network
In identifying the original genome-wide SR-DU network, we have applied a
very conservative criterion (FDR < .01 wherever applicable) at each steps of IN-
CISOR. As a result, the network contained only 2033 interactions (6.2E-4 % of all
possible gene pairs), leaving out many potential rescuers of many drug targets. To
capture DU-type rescuers of anti-cancer drug targets in a more comprehensive man-
ner we modified INCISOR as follows: (i) Vulnerable gene screening was eliminated
216

(because gene targets are by definition known to inhibit cancer progression) (ii)
An FDR correction was applied only at the last step, and (iii) The SR significance
P-value threshold were relaxed to accommodate weaker SR interactions. The re-
sultant network cancer drug SR network (drug-DU-SR) includes the targets of the
majority of 37 key cancer drugs administered to patients in TCGA. drug-DU-SR
network includes 170 interactions that consists of 103 rescuers of 36 targets (vulner-
able genes) of 37 anti-cancer drugs (Figure 4.6d). A pathway enrichment analysis
shows the rescuers are highly enriched with lipid storage/transport, thioester/fatty
acid metabolism, and drug efflux transporters (Extended Data Figure 2g).
Drug response prediction in breast cancer patients
To verify that DU rescue is an adaptive response of cancer (as opposed to
occurring in some cells simply because there is higher basal expression of rescuer
genes), we sought to determine if drug treatment stimulates a larger change in res-
cuer gene expression in clinical non-responder patients versus in responder patients.
We used a dataset of 25 breast cancer patients (BC25 dataset) for which expres-
sion data was available before and after they were treated with a cocktail of three
drugs (epirubicine, cyclophosphamide, and docetaxel), which collectively target four
vulnerable genes in our treatment-specific SR-DU network [177]. Remarkably, we
found a significantly higher expression fold change (pre- versus post- drug treatment)
among the 19 predicted rescuer genes for clinical non-responders vs. responders (17
and 8 patients per group; ranksum p-value<1E-7 when pooling expression of all
rescuers across all targets per group; see Extended Data Figure 4a,b for per-target
217
breakdown). By next re-calculating this fold change metric on a per-rescuer-gene
basis, we were able to rank DU pairs (there were 20 total, incorporating the 19
rescuers) by degree of potency (i.e., by their p-values). We found this ranking to
be highly consistent with the rescue effect of the same DU pairs calculated using
the BC-DU-SR network (as in step 3 of INCISOR) (Spearman =0.54, p<1E-3; see
Extended Data Figure 4c), a reassuring cross-check.
Identification of markers to predict drug response is a key challenge. To address
this using our insights from the SR expression data, we built an SVM predictor of
treatment response of the BC25 patients based on the pre-treatment expression of
the 19 rescuer genes (AUC of 0.71, Extended Data Figure 4d). We specifically
used the rescuer overexpression profile (a binary vector specifying whether the 19
rescuers are overexpressed or not) as input for the SVM classifier. Feature selection
revealed two genes, ATAD2 and PBOV1, that are the most predictive of patient
drug responsiveness. ATAD2 is required to induce the expression of a subset of
target genes of estrogen receptor including MYC [227], and is also known to be
associated with drug resistance to Tamoxifen and 5-Fluorouracil [228,229]. PBOV1
is overexpressed in prostate and breast cancer, and its knockout was reported to
disrupt the emergence of resistance to Taxane treatment in prostate cancer.
Survival prediction in gastric cancer patients
We further studied pre-treatment and post-treatment expression from 22 gas-
tric cancer patients that acquired resistance to chemotheraphy regiment of Cisplatin
and Fluorouracil [81]. INCISOR identified 15 rescuers of TYMS gene, a target of
218
Fluorouracil using pancancer TCGA data. The expression of the rescuers was sig-
nificantly over-expressed in post-treatment samples compared to the pre-treatment
samples (Wilcoxon p < 1.3e-12). Out of 15 rescuers, 11 were significantly over-
expressed while the expression of only one rescuer was significantly down regulated
(P < 0.05, Extended Data Figure 4e). Next, we analyzed a larger cohort of 123 gas-
tric cancer patients treated with Cisplatin and Fluorouracil for which we have the
pre-treatment tumors gene expression and the patients progression-free and overall
survival rates. Based on the number of highly over-expressed rescuers in each sam-
ple, we divided the samples into predicted rescued samples and not-rescued samples.
Indeed, we found that overall survival was significantly worse in predicted rescued
samples compared with non-rescued samples (Extended Data Figure 4f), and the
progression-free survival of the patients was significantly worse in rescued samples
as compared to non-rescued samples (Extended Data Figure 4g). Reassuringly,
overall-survival and progression-free survival were not associated with randomly
chosen rescuer genes (Extended Data Figure 4h,i).
In order to benchmark the four steps of INCISOR, we identified SR pairs indi-
vidually by each step of SR using TCGA and analyzed their molecular and clinical
significance in the gastric cancer dataset. Specifically, for each INCISORs step we
ranked all possible DU rescuer of TYMS gene using TCGA pan-cancer data and
identified the top 20 most significant DU rescuer genes of TYMS gene for each
step separately. We then analyzed the over-expression of predicted rescuer in post-
treatment (acquired resistant) samples of gastric cancer relative to pre-treatment
samples (Extended Data Figure 4j). Rescuer genes identified by Robust rescue ef-
219

fect, Oncogene rescuer screening and SoF shows significant over-expression in post-
treatment samples. Expectedly rescuer genes identified by Vulnerable gene screen-
ing and random genes does not show any over-expression. Next, in order to analyze
clinical significance of each rescuer, we analyzed expression and progression-free sur-
vival of 123 gastric cancer patients. Analogous to Extended Fig 4f, we compute the
decrease in patients progression free survival (∆AUC) in rescued samples over non-
rescued samples separately for each step (Extended Data Figure 4k). The expression
of rescuer genes identified by each of the 4 steps predicts progression free survival.
Predicting acquired resistance in breast and ovarian cancer patients
Beyond initial drug response, our overarching hypothesis suggests that SR
circuits might contribute to adaptive evolution in tumors after a drug insult, and
thus to tumor relapse. To test this, we analyzed longitudinal expression and se-
quencing data of 81 stage-II, III ovarian cancer patients (OC81 dataset), who were
treated with platinum-based therapy and Taxane [179] (Figure 4.7a), focusing on
the activation level of Taxanes 18 identified rescuer genes (of its 3 drug targets),
which includes MYC known to play an important role in Taxane resistance in ovar-
ian cancer. Here, the gene activation is measured by the rank of gene expression
(GE) or SCNA across all samples in the dataset. In line with our previous ob-
servations, we first found significantly higher expression of the 18 rescuer genes in
initial non-responder versus responder patients (Wilcoxon rank-sum p-value<1.5E-
4; expression and copy number were also significantly higher than for random genes,
empirical p-value<0.045, Extended Data Figure 5a). Six out of 18 rescuers (respec-
220

tively, none) showed significant higher (lower) activation in non-responders than in
responders (individual Wilcoxon rank-sum p-value<0.05, which is not expected for
18 random genes, empirical p-value<0.036). We then went further and analyzed
the patients that initially responded but then relapsed, and found remarkably that
rescuer genes became over-active in these relapsed resistant tumors (overall ranksum
p-value< 5.8E-5), and to a significantly higher degree than 18 random genes (empiri-
cal p-value<4.0E-4, Figure 4.7b). Five out of 18 rescuers (respectively, none) showed
significant post-treatment increase in gene activation (decrease) compared to pre-
treatment (individual Wilcoxon rank-sum p-value<0.05, which is not expected for
18 random genes, empirical p-value<0.05). Characteristically high expression pro-
files of the 18 rescuer genes at the pretreatment stage gave a clear predictive signal
for future emergence of resistance (AUC=0.77 for SVM predictor, Extended Data
Figure 5b).
To get more insight into the rescuer-relapse relationship in the OC81 dataset,
we examined the rescuer genes that most contributed to the accuracy of our SVM
relapse predictor. The most important rescuer, CLLU1OS is known to be up-
regulated in chronic lymphocytic leukemia [230], and the second most predictive
rescuer, XKR9, plays an important role in apoptosis [231], and the methylation of
the third most predictive rescuer, NPBWR1, is a key prognostic factor for lung
cancer patient survival [232].
Notably, an analysis of multidrug resistance (MDR) genes expression shows
a marked inverse correlation between their activation and the level of rescue re-
programming occurring in Taxane resistant samples (Spearman correlation = -0.63
221

(p-value<0.03)). Specifically, we considered the gene activation level of 12 MDR
genes [211], and the gene expression level of 18 rescuers. Our analysis classifies two
different groups of patients who develop resistance through either MDR activation
or SR reprogramming (Figure 4.7c).
We further analyzed the expression data of 155 primary breast cancer patients
who were treated with Tamoxifen [233], where tumor relapsed in 52 patients within
5 years. With the activity states of 13 rescuers of Tamoxifens 6 drug targets, our
binary classifier was able to predict the patients whose tumor will recur (AUC=0.74,
Extended Data Figure 5d). The strongest predictor of acquired resistance, RAN,
associated with RAS oncogene and androgen receptor (AR), is known to play a
role in the resistance to anti-androgen drugs [234]. The third strongest predictor,
MAN1C1, is known to be over-activated in cancer cell lines, which would later de-
velop resistance [235]. The function of the second strongest predictor, TMEM200B,
a trans-membrane protein, is not known well, indicating its potential role in emerg-
ing drug resistance.
It is expected that the synthetic lethal partners of the drug targets will also
become active in response to the drug treatment; however, our analysis shows that
the activation profile of SL partners does not carry information on tumor relapse. To
distinguish the predictive power of SR-DU partners versus SL partners, we built an
SVM classifier based on the activity states of 18 SL partners of Taxanes 3 drug tar-
gets in ovarian cancer. The accuracy of our classifier was not higher at all compared
to the accuracy of 18 random genes (AUC=0.52, Extended Data Figure 5c).
222

Recent resistance data analysis
Due to the limited number of samples of colorectal, acute myeloid leukemia
(AML), prostate cancer, and melanoma in TCGA dataset; we combined samples
from all cancer types for identifying DU rescuers of BET, AR, EGFR, and BRAF
inhibitors [83, 84, 170–172]. To account for cancer type specific mRNA and CNV
differences, we normalized omics data within each cancer types. We then applied
INCISOR to the normalized TCGA pan-cancer data.
Gene ontology distance and moonlight gene analysis
In order to estimate functional relationship between a rescuer and its vulnera-
ble gene partner, we used most common gene ontology (GO) distance measure [236],
which quantifies semantic similarity between GO terms. When multiple GO terms
were associated with a single gene similarity score, maximum similarity score was
taken as combined similarity score (when we change the combining method to av-
erage we obtain similar significance). For each SR-DU pair (Extended Data Figure
1g), we computed the similarity measure. The significance of the similarity mea-
sure was determined with two set of controls: (a) SR-DU pairs were shuffled to
break the original SR-DU interaction. (b) Random pairs. For each set of control
we determined the similarity measure in analogous manner. Rank-Sum Wilcoxon
test provided the significance of similarity. A particularly interesting case involves
RPL23, which suppresses tumor progression by stabilizing P53 protein. It is a moon-
lighting gene [237], having two additional secondary functions as a ribosomal protein
223

and an inhibitor of cell cycle arrest [238]. A GO analysis of its 12 predicted rescuer
partners shows that they include its secondary functions (Table B2).
Deliverables
Cancer-specific Rescuer hubs Targeting the rescuer hubs, the rescuers
that have a large number of vulnerable partners, will reduce likelihood of develop-
ing resistance and should supplement current chemotherapy. For each cancer type,
we identified the rescuer hub whose activation was best associated with a decrease
in survival of patients (in TCGA). The list of genes provided in Table B3, can
serve as target whose inhibition will reduce the likelihood of developing resistance.
ODCI is a rescuer hub in general across cancer types, and specifically kidney cancer,
acute myeloid leukemia (AML), and prostate cancer. Its over-expression is known to
cause chemoresistance by overcoming drug-induced apoptosis and promoting pro-
liferation [239]. Similarly many other rescuer hubs are reported to be associated
with resistance. Interestingly, none of the rescuer hubs are targeted by current anti-
cancer therapies. This may be due to the fact that rescuers become critical for cell
proliferation only after vulnerable gene knockdown in cells. This also underscores
that targeting rescuers has not been harnessed and SR can provide an entirely new
class of drugs.
Second line of therapy against emergence of resistance Currently,
there is no mechanistic approach to recommend a second line of therapy in case
patients acquire resistance to a therapy. SR network provides a unique opportunity
to recommend such therapy based on molecular mechanism. We provide a list of
224

drug targets rescuers that get over-expressed to bypass progression lethality of drug
that can serve as an effective second line of action to the relapsed tumors for each
drug (Figure 4.7d). For each drug, we identified a rescuer of the drug target that is
most clinically significant.
Estimating the likelihood of emergence of resistance to anti-cancer
drug treatments If resistance emerges for a drug through the mechanism of SR
activation, then the proportion of patients who have rescuer over-activation will
provide a conservative estimate of the likelihood of developing resistance. To that
end, for the drug whose response is predicted by the SR network, we estimated the
drugs likelihood to foster resistance. Figure 4.7e shows the proportion of patients
with an over-activated rescuer for each drug whose response was predicted by the
SR network (Figure 4.6e). For each drug this proportion provides the likelihood
that a patient treated with the drug will acquire resistance.
SR partners of cancer drivers and metabolic genes Next, we provide
a list of SR interactions that involve main oncogenic driver genes. A rescuer or
vulnerable partner of a cancer driver gene can play an important role in cancer,
specifically in resistance emergence or drug effectiveness. These partner genes might
be a viable target for a drug to mitigate cancer progression or resistance. First
we compiled a list of oncogenic driver genes from three sources (i) CancerQuest
(http://www.cancerquest.org/), (ii) Tumor Portal [240], and (iii) oncogenic drivers
and associated genes8, summing up to 327 genes. Next, using the INCISOR pipeline,
we identified rescuers of 33 cancer genes, and the vulnerable partners of 32 cancer
genes (Table B4).
225

We also provide a list of SR interactions that involve metabolic genes. Deregu-
lated metabolism is a hallmark of cancer, and their SR partners may play important
roles in the process and offer key information on how to counteract cancer progres-
sion or resistance. We analyzed the DU-SR network of 1496 metabolic genes using
INCISOR pipeline, and identified rescuers of 83 metabolic genes, and the vulnerable
partners of 52 metabolic genes (Extended Data Figure 1g).
Pancancer DD, UD and UU networks
Next, we applied INCISOR to pancaner TCGA to identify the genome-wide
DD-SR network. The resultant network has 317 interactions that are composed of
159 vulnerable and 197 rescuer genes (Extended Data Figure 6a). Gene enrichment
analysis revealed that the vulnerable genes are enriched with processes associated
with Tolllike receptor signaling pathways and nerve development (Extended Data
Figure 6b). These vulnerable genes are rescued by extracellular matrix disassembly,
neuromuscular process and glutathione transferase activity (Extended Data Figure
6c).
In a similar manner, we identified and analyzed the UD (Extended Data Figure
6d, interactive network as Supplementary Data 3) and UU (Extended Data Figure
6g, interactive network available as Supplementary Data 4) SR networks. The UD
SR network contains 505 vulnerable genes and 371 rescuer genes, encompassing 926
interactions. The UU SR network contains 169 vulnerable genes and 68 rescuer
genes, encompassing 212 interactions. Gene enrichment of the UD network revealed
226
that vulnerable genes were enriched with processes associated with ion transport and
eNOS trafficking (Extended Data Figure 6e), which were rescued by the activation
of regulators of biosynthesis process and CD4 T-cell differentiation (Extended Data
Figure 6f). On the other hand, in the UU network vulnerable genes were associated
with cell cycle (S-phase) and beta-catenin binding (Extended Data Figure 6h); the
rescuers were associated with process associated with differentiation cell proliferation
(Extended Data Figure 6i).
Pancancer SL network and combined clinical impact of SL
and SR
We identified SL interactions in an analogous manner to SR with slight modifi-
cations. Since SL is a symmetric interaction, we performed the false positive control
of step 3 for both genes, and eliminated step 2 in the INCISOR pipeline. The
procedure led to 304 SL pairs with logrank p-value<1.23E-8.
The functional activity of SL and SR networks determines tumor aggressive-
ness and patient survival. We found that the clinical impact of the combined SR and
SL networks is more significant than any of their individual impacts (Figure 4.5f,
compare Figure 4.5a-d, Extended Data Figure 5e). We assigned a SL/SR score to
each patient, which adds the number of functionally active SL/SRs. We confirmed
that the patients (87 samples)with both higher SL score (>90 percentile) and low
SR score (<10 percentile) have significantly better survival than the patients (158
samples) with both lower SL score (<10 percentile) and high SR score (>90 per-
227
centile) (logrank p-value<6.59E-6) . This combined impact is stronger than any
single interactions.
Breast cancer SR network
SR networks
We applied INCISOR to TCGA 1098 breast cancer (BC) patient data to iden-
tify the four different types of SR networks specific to breast cancer. We have
chosen breast cancer as it has the largest numbers of samples in the TCGA col-
lection, and also has a large independent cohort METABRIC on which we could
test the emerging predictions in an independent manner. Extended Data Figure 7a
shows the resulting BC-DU-SR cancer network, on which we focus most of the sec-
tion, as it is probably the most intuitive one and, more importantly, it displays the
strongest predictive signal, successfully predicting patients survival in METABRIC
BC cohort [198].
We next used TCGA BC data to identify DD (Extended Data Figure 7d), UD
(Extended Data Figure 7c) and UU (Extended Data Figure 7b) type SR networks
that are specific to breast cancer (interactive networks are provided as Supplemen-
tary Data 5-8). DD network contains 244 vulnerable genes and 110 rescuer genes,
encompassing 781 interactions. UD network contains 635 vulnerable genes and 176
rescuer genes, encompassing 1189 interactions. Finally UU network contains 1056
vulnerable genes and 311 rescuer genes, encompassing 3096 interactions.
228
Interestingly, BC-DU-SR pairs are enriched with several immune processes:
vulnerable genes are enriched for tolerance against natural killer cells (the inacti-
vation of which will make cancer cells more susceptible to the immune system),
while rescuer genes are enriched for negative regulation of cytokines (which could
subsequently prevent cytokine-driven immune cell recruitment).
UU rescuers are enriched with macromolecular metabolism, and the vulnerable
genes are enriched with protein carboxylation (p-value <1E-4). DD vulnerable genes
are enriched with zinc-ion response and negative regulation of growth (p-value<1E-
5), and DD rescuers are enriched with nitrobenzene metabolism and detoxification
(p-value<1E-7). DU vulnerable genes are enriched with chemokine receptor binding
and DNA binding (p-value<1E-5), and DU rescuers are enriched with mitochondrial
organization and metabolic process (p-value<1E-4). The UD network is associated
with immune response: UD vulnerable genes are enriched with antigen processing
(p-value<1E-5), and UD rescuers are enriched with T-cell receptor signaling path-
way (p-value<1E-3). UU vulnerable genes are enriched with phosphatidylserine
metabolism and antigen process (p-value<1E-3), and UU rescuers are enriched with
post-translational protein folding and cell-cell adhesion (p-value<1E-3). Interest-
ingly, BC SR-DU shows a strong involvement of immune-related processes : while
vulnerable SR-DU genes are enriched with tolerance against natural killer cells (the
inactivation of which will increase the cancer cells susceptibility to the immune sys-
tem), the rescuer genes are enriched with negative regulation of cytokines (which
may prevent immune cells from being recruited by cytokines).
229

Patient survival prediction using SR networks
To generate these SR-dependent survival predictions we quantified the number
of functionally active SRs in each tumor sample - that is, the number of DU-SR pairs
where a vulnerable gene is inactive and its rescuer partner is over-activated in the
given sample. As expected, we find that breast cancer samples with a large number
of functionally active pairs have significantly worse survival than samples with fewer
active pairs, as the former are rescued (Extended Data Figure 8a-d). This finding is
true for each of the other three SR types, albeit to a lesser extent than the DU-SR
type. Combining SR with SL interactions slightly improves the survival predictive
power further (logrank p-value <1E-300, ∆AUC=0.42).
The three inherent states of SR interaction i.e. viable, non-rescued (lethal)
and rescued states display different effects on cancer progression and consequently
on patients clinical prognosis (Figure 4.5e). For example, insofar as the SR-DU
interaction between a vulnerable gene FGF10 and a rescuer EEA1: patients with
either FGF10 WT (viable state) or EEA1 over-activation (rescued state) have lower
survival than patients with non-rescued EEA1 knockdown (Extended Data Figure
8e). However, patients with the SR pair in rescued state have even lower survival
than those patients in viable state. Similarly, patients whose tumor has many SR
pairs in non-rescued state have better survival compared to those patients whose
tumor has many SR pairs in viable state. As shown in the main text, patients
harboring tumors with extensive SR reprogramming have collectively worse survival
than the other two groups of patients (Figure 4.5e), suggesting the three states of
230

SR have distinct clinical prognoses and are significantly different from each other.
Impact of inactivation of a vulnerable gene can be estimated by comparing
the survival of patients in whose tumors the gene is inactivated (non-rescued state)
to patients in whose tumors the gene is active (rescued state) (using logrank test).
In case a vulnerable gene has more than one rescuer, we collectively compared the
patient survival of rescued vs. non-rescued samples. Our analysis shows that the
vulnerable genes whose inactivation leads to much better patient survival are more
highly rescued in breast cancer. In particular, they have a larger number of rescuer
partners (Spearman = 0.11, p-value<0.02).
SR levels increase as cancer progresses
To study the dynamics of SR functional activity as cancer progresses, we strat-
ified the BC patients in the METABRIC dataset into six different cancer progression
bins by their survival times. As expected, cancer progression is accompanied by an
increase in the number of functionally active SRs in the tumors (Extended Data
Figure 8g) and by an increase in the number of inactive vulnerable genes that are
rescued (Extended Data Figure 8h).
Reprogrammed and buffered SRs
We distinguished between reprogrammed SRs (rSR), where the rescuer gene
over-activation occurs after the inactivation of its paired vulnerable gene, to buffered
SR (bSR), where the rescuer gene over-activation precedes the inactivation of the
231
vulnerable gene.
In order to infer if an SR pair is reprogrammed or buffered, we analyzed the
fraction of samples with over-active rescuers (fr), inactive vulnerable genes (fv),
and functional activation of SR (fSR) at each of 6 cancer progression bins used in
Supplementary Information Section 3.3. We classified an SR pairs as an rSR if fr
and fSR are highly correlated (Spearman correlation>0.3, p-value<0.05) while fv
and fSR are not (Spearman correlation<0 or Spearman correlation p-value>0.05),
and fSR is increasing as cancer progresses as shown in Extended Data Figure 9a.
Similarly, an SR pair was classified as bSR if fv and fSR are highly correlated while
fr and fSR are not (analogous to the conditions for rSR above), and fSR is increasing
as cancer progresses (Extended Data Figure 9b).
While in general SRs carry clinical significance irrespective of their order of
occurrence (Figure 4.5), rSRs have a significantly stronger survival predictive signal
than bSRs (Extended Data Figure 9c-j). We first considered the clinical impact
of rSR activation the decrease in survival due to rescuer over-activation given its
vulnerable partner is inactivated (which we define as rescue effect in the main text).
We confirmed that rSRs have highly significant rescue effect (Extended Data Figure
9c), and this effect arises from the pairwise interaction rather than a consequence
of single gene (rescuer) over-activation (Extended Data Figure 9g), demonstrated
by much lower p-value and higher ∆AUC (∆(∆AUC)=0.22-0.12). The rescue effect
of bSR, conversely, is not much more significant compared to the rescuer control
(Extended Data Figure 9d,h).
We then considered the clinical impact of bSR activation the decrease in
232

survival due to vulnerable gene inactivation given its rescuer partner is already over-
active. The inactivation of the bSR vulnerable gene is expected to be inconsequential
because its rescuer partner is already over-active. We confirmed that the clinical
impact of bSR is indeed minimal (Extended Data Figure 9f,j). However, we still
observed a very strong impact of rSR even in this case (Extended Data Figure
9e,i). This means the compensating rescuer activation in response to the loss of the
vulnerable gene drives the patient into an even worse state than before the loss.
This is consistent with our observation in Figure 2e and Extended Data Figure 8e,
and points to the active role of SR in the emergence of drug resistance.
SR networks predict drug response of cancer cell lines and
breast cancer patients (TCGA)
We next investigated the ability of the DU-SR network to predict the response
of cancer cell lines to treatment with commonly used anticancer drugs. The pre-
dictions are obtained in a straightforward unsupervised manner (no training data
is involved) by analyzing the cell-lines transcriptomics data to determine cell-line
specific gene activity and quantify how many of the SR rescuer partners of the in-
hibited target(s) of a specific drug tested are over-activated in a given cell line. We
analyzed the response of 24 common anti-cancer drugs in 488 cancer cell lines in
the CCLE database [65]. The SR network accurately classifies the cell lines into
responder and non-responders for 9 drugs (Extended Data Figure 8i).
Next, we used breast cancer DU SR network to predict the clinical response of
233

3873 (pan cancer) patients in the TCGA dataset, focusing on 37 common anticancer
drugs. Using the network and transcriptomics data of cancer patients we classified
each patient to be a non-responder (or a responder) to a given drug if one or more
of the rescuer partners of that drug target are over-active (and as a responder
otherwise). We then compared the survival rates of predicted responders to those
of non-responders, to examine how well our predictions separated true responders
and non-responders. As demonstrated, we quite accurately classify patients into
responder and non-responders for 15 of the drugs (Extended Data Figure 8j).
The SR network can be used to identify key genes, whose targeting will mit-
igate emergence of resistance in cancer therapies. To this end we provide a list of
major rescuers and their expected clinical utility following treatment targeting their
associated vulnerable genes (Extended Data Figure 8k), as estimated from their
effects on patients survival in the TCGA. Further, by quantifying the number of
samples with functionally active rescuers among the patients that receive a specific
drug we provide estimates of the likelihood that resistance will emerge following
treatment if these rescuers are not targeted, too (Extended Data Figure 8l).
SR buffers the lethal impact of essential genes
We identified the essential genes in breast cancer using the essentiality screen-
ing data of their knockdown in cancer cell lines [241]. Specifically, we selected those
genes that mark top 5% essentiality score in each cell line for more than 20 out of
30 breast cancer cell lines (N=304). We then checked if their inactivation leads to
234

better patient survival using mRNA, SCNA and survival data of TCGA BC and
METABRIC. We selected 118 nominal essential genes, which are essential in cell line
screening but do not significantly improve patient survival when inactivated (logrank
p-value>0.5). As control, we selected 124 actual essential genes, which show signif-
icance in patient samples (logrank p-value<0.05). A pathway enrichment analysis
shows nominal essential genes are enriched with translation initiation and actual
essential genes with cell-cycle regulation (hypergeometric p-value<1.3E-4).
We identified the SR-DU rescuers of the nominal and actual essential genes to
compare the number of their rescuer partners and clinical significance. We observed
nominal essential genes have a higher number of rescuers (t-test p-value<0.03) and
higher collective clinical significance (nominal essential genes: logrank p-value<3.5E-
10, control logrank p-value<1.2E-5).
We further tested if an advanced tumor shows higher prevalence of the SR
pairs specific to the nominal essential genes than the control SR pairs. We selected
aggressive breast cancer samples (N=103) from the most advanced progression step
in the tumor evolution analysis (Supplementary Information Section 3.3). The SR
pairs of nominal essential genes indeed show higher level of activation in advanced
tumors than in the control (ranksum p-value<1.1E-9) in a more significant man-
ner than three other groups of tumor samples: early stage breast cancer samples
from the earliest progression step, all breast cancer samples in METABRIC, and all
other cancer samples in TCGA (ranksum p-value>0.2). In particular, the difference
between the clinical impact and essentiality in cell lines measured by the ratio of
essentiality to clinical significance, positively correlates with the functional activity
235

of SR in aggressive tumors (Spearman =0.24, p-value<9.2E-4).
SR partners of cancer associated genes
We analyzed the DU-type rescuer partners of cancer driver genes. Cancer
driver genes include the genes strongly associated with cancer that are reported in
(http://www.cancerquest.org/) and Tumor Portal42, and strongly clinically relevant
genes whenover-active or under-active, based on Kaplan-Meier analysis a total of 45
genes. Using INCISOR pipeline, we identified rescuers of 13 cancer genes in breast
cancer (Table B5).
Breast cancer subtypes SR network
We applied our INCISOR pipeline to identify specific SR specific networks for
four classical subtypes of breast cancer including Her2, triple-negative, luminal-A,
and luminal-B (Supplementary Data 9-24), based on analyzing the TCGA BC data.
236
In Her2 subtype, DU vulnerable genes are enriched with cell migration and
toll-like receptor pathway, and the rescuers are enriched with non-coding RNA
metabolism, DNA recombination, and p53 binding. In basal subtype, DU vulnerable
genes are enriched with gamma-aminobutyric acid signaling, and the rescuers are en-
riched with phosphatidylglycerol metabolism. In luminal-A subtype, DU vulnerable
genes are enriched with chemokine, cytokine, G-protein coupled receptor pathway,
and the rescuers are enriched with lipoprotein receptor pathway and telomere main-
tenance. In luminal-B subtype, DU vulnerable genes are enriched with dicarboxylic
acid catabolism, and rescuers are enriched with cell growth.
The sub-type specific networks derived show significant predictive signal in
predicting patients survival (Extended Data Figure 10), even though it is less than
the predictive signal of all BC samples together (Extended Data Figure 10, due to
the much smaller sample size). Comparing different type of SRs, DU has the highest
predictive power in all cancer subtypes.
Identifying treatment-specific SR interactions
To capture DU-type rescuers of the drug targets of each drug treatment
dataset, we modified INCISOR as follows: (i) Vulnerable gene screening was elimi-
nated (because gene targets are, by definition, known to inhibit cancer progression)
(ii) An FDR correction was applied only at the last step, and (iii) The SR signif-
icance P-value threshold was relaxed to accommodate weaker SR interactions. In
case the survival data is available in the given drug treatment dataset, we then
237
quantified the clinical significance of each of the candidate SR (e.g. in case of drug
response, survival difference between responders and non-responders or in case of
resistance, survival difference of resistant vs sensitive samples). In case survival data
was not available, we used relaxed criteria as in the drug-DU-SR network without
the cross-validation against METABRIC data. The intersection of clinically signifi-
cant SR and the SR pairs from each of four steps of our pipeline constitute the final
set of SR. If there were no overlaps, thresholds of each step were adjusted such that
there was at least one SR in the intersection.
Functional enrichment
For the network level functional enrichment analysis, we used ClueGO [222]
(a Cytocscape plugin) with default settings except: (a) GO, KEGG and reactome
ontologies were included, (b) network specificity was set to medium, (c) Bonferroni
correction for multiple hypothesis correction, (d) Pathways with p-values< 0.05 were
included. To perform pairwise GO analysis for an SR network, we first identified GO
terms that are enriched in rescuer genes (using standard parameters in GOFunction
package [242]). To determine GO processes rescued by a set of rescuers in an enriched
GO term, we created a gene set composed of vulnerable partners of the rescuers.
Finally, we identified GO terms significantly enriched in the vulnerable gene set
(FDR < 0.05).
238

In-vitro validation in HNSC
To test our ability to predict and experimentally validate a key rescuer gene,
we studied the role of mTOR as a predicted rescuer gene in head and neck squa-
mous cell carcinoma (HNSC), where is it thought to play an important role [206].
Rapamycin is a highly specific mTOR inhibitor [207] and hence enables to target a
predicted rescuer gene by a highly specific drug, combined with the ability to knock
down predicted vulnerable genes in a clinically-relevant lab setting. To this end we
studied SR-DD predictions in a HNSC cell-line HN12, which, like most HNSC cells,
is highly sensitive to rapamycin [243]. For this we applied INCISOR to identify top
10 vulnerable partners and 9 rescuer partners of mTOR in a pancancer scale. We
also identified HNSC-specific DD-type vulnerable partners of mTOR. In addition to
the pancancer SRs, we tested the 19 HNSC specific vulnerable DD-SR partners of
mTOR.
Extended Data Figure 5f summarizes the experimental procedure. Each of the
mTORs vulnerable/rescuer partners together with the controls were knocked down
in HN12 cell lines, after which mTOR was inactivated via Rapamycin treatment.
HN12 cells were infected with a library of retroviral barcoded shRNAs at a repre-
sentation of 1,000 and a multiplicity of infection (MOI) of 1, including at least 2
independent shRNAs for each gene of interest and controls. At day 3 post infection
cells were selected with puromycin for 3 days (1g/ml) to remove the minority of
uninfected cells. After that, cells where expanded in culture for 3 days and then
239
an initial population-doubling 0 (PD0) sample was taken. For in vitro testing, the
cells were divided into 6 populations, 3 were kept as a control and 3 where treated
with rapamycin (100nM). Cells where propagated in the presence or not of drug for
an additional 12 doublings before the final, PD13 sample was taken. For in vivo
testing, cells were transplanted into the flanks of athymic nude mice (female, four
to six weeks old, obtained from NCI/Frederick, MD), and when the tumor volume
reached approximately 1cm3 (approximately 18 days after injection) tumors where
isolated for genomic DNA extraction. Mice studies were carried out according to
National Institutes of Health (NIH) approved protocols (ASP 10569 and 13695) in
compliance with the NIH Guide for the Care and Use of Laboratory Mice. shRNA
barcode was PCR-recovered from genomic samples and samples sequenced to calcu-
late abundance of the different shRNA probes. From these shRNA experiments, we
obtained cell counts for each gene knock-down at the following three time points:
(a) post shRNA infection (PD0, referred as initial count), (b) shRNA treatment fol-
lowed by either Rapamycin treatment (PD13, referred as treated count, 3 replicates)
or control (PD13, referred as untreated count, 3 replicates) (c) shRNA infected cell
injected to mice (tumor, referred as in-vivo count, 2 replicates). To obtain normal-
ized counts at each time point, cell counts of each shRNA at each time point were
divided by corresponding total number of cell count.
Since our in vitro experimental analyses were carried out in HNSC cell lines,
we also performed experimentally testing for HNSC specific SRs. Specifically, we
studied rSR of the HNSC specific DD type as they can be readily validated by in
vitro knockdown (KD) experiments. We obtained reversal of rapamycin treatment
240

when vulnerable partner of mTOR is knocked out (Extended Data Figure 5g; paired
Wilcoxon P <1.1E-06 for 19 pairings). This implies rapamycin treatment that
is generally not beneficial for tumor progression becomes beneficial when mTORs
vulnerable partners are knocked out.
241

MOONLIGHTING GENE RESCUER GENES
RPL23
1. Constructs part of 60S subunit, ribosomal protein
2. Binds to and inhibits a ubiquitin ligase HDM2, which stabilizes of tumor suppressor p5339.
3. Binds nucleophosmin and sequesters it in the nucleolus to block its binding to Miz1 (a transcriptional activator and repressor), playing a role in inhibiting cell-cycle arrest40.
ARNTL2 circadian and hypoxia factors
BCAT1enzyme catalyzes the reversible transamination of branched-chain alpha-keto acids to branched-chain L-amino acids essential for cell growth
BHLHE41control of circadian rhythm and cell differentiation. can interact with ARNTL
CASC1 Cancer Susceptibility Candidate 1
FGFR1OP2
Signaling by FGFR
LMRP major histocompatibility complex (MHC) class I molecules
MRPS35 Mitochondrial Ribosomal Protein
PPFIBP1axon guidance and mammary gland development. found to interact with S100A4, a calcium-binding protein related to tumor invasiveness and metastasis
REP15Regulates transferrin receptor recycling from the endocytic recycling compartment
STK38Lregulation of structural processes in differentiating and mature neuronal cells.
Table B.2: Synthetic rescue interaction of moonlight gene RPL23. The table liststhe 10 rescuer partners of moonlighting gene RPL23, marking the similarity in theircellular processes.
242

Cancer type Rescuer Hub size
Vulnerable partner genes
pancancer ODC1 16 ATP6V0D1,BBS2,CCDC79,CETP,CMTM4,DDX19A,DHX38,GABARAPL2,GLG1,GNAO1,MT1E,PSMB10,RANBP10,TRADD,TSNAXIP1,VPS4A
CESC BCL11A 14 CDH16,CES2,COTL1,DHX38,FTSJD1,FUK,KLHDC4,NOL3,PHKB,RNF166,SPATA2L,TK2,TMED6,TMEM208
CHOL C1orf122 7 ANAPC16,ANK3,ARFGAP2,DNAJB12,GPRIN2,MYBPC3,OR13A1COAD APITD1 1 CLRN3DLBC C2orf16 13 ARL2BP,CDH5,CES2,CMTM2,DPEP2,FUK,GFOD2,HERPUD1,IL34,LCAT
,NRN1L,TRADD,VPS4AGBM LRRC69 3 CCDC151,EPOR,RGL3
HNSC PMFBP1 4 ADAMTSL3,AP3B2,MRPL46,SNURFKICH BCL11A 11 CDH16,CES2,DHX38,FTSJD1,KLHDC4,NOL3,PHKB,RNF166,SPATA2L,T
K2,TMEM208KIRC C1orf122 8 ANAPC16,ANK3,DNAJB12,ERCC6,GPRIN2,HKDC1,HNRNPH3,OR13A1
KIRP ODC1 16 ATP6V0D1,BBS2,CCDC79,CETP,CMTM4,DDX19A,DHX38,GABARAPL2,GLG1,GNAO1,MT1E,PSMB10,RANBP10,TRADD,TSNAXIP1,VPS4A
LAML ODC1 16 ATP6V0D1,BBS2,CCDC79,CETP,CMTM4,DDX19A,DHX38,GABARAPL2,GLG1,GNAO1,MT1E,PSMB10,RANBP10,TRADD,TSNAXIP1,VPS4A
LGG LY6K 6 HDHD2,PIAS2,SLC14A1,SLC14A2,SMAD7,ST8SIA5LIHC CCDC30 7 DCTN6,MTMR9,MTUS1,PCM1,PHYHIP,SLC18A1,SLC25A37LUAD RLF 14 ADAMTSL1,ATP8B4,DENND4A,FAM96A,IGDCC4,INTS10,LIPC,MTMR9
,RAB11A,RAB8B,SECISBP2L,SNX1,TLN2,TRIP4LUSC GREB1 2 HP,KLHL36
OV RLF 11 DENND4A,FAM96A,IGDCC4,INTS10,LIPC,MTMR9,RAB11A,RAB8B,SNX1,TLN2,TRIP4
PAAD C1orf122 7 ANAPC16,DNAJB12,ERCC6,GPRIN2,HKDC1,HNRNPH3,OR13A1PRAD ODC1 16 ATP6V0D1,BBS2,CCDC79,CETP,CMTM4,DDX19A,DHX38,GABARAPL2,
GLG1,GNAO1,MT1E,PSMB10,RANBP10,TRADD,TSNAXIP1,VPS4ASARC PEX14 5 C10orf131,HPSE2,PDCD4,PIK3AP1,SFXN2SKCM RLF 11 ATP8B4,DENND4A,FAM96A,IGDCC4,LIPC,RAB11A,RAB8B,SECISBP2L
,SNX1,TLN2,TRIP4STAD RDH16 5 ACTR3B,KCNH2,PTN,TBXAS1,UBN2TGCT CTNNBIP1 4 C10orf131,FBXL15,LGI1,NDUFB8UCEC SAMHD1 3 COG4,NRN1L,SLC12A4UCS ARHGEF10L 5 ANXA7,PRKG1,RUFY2,SEC24C,SLC25A16
UVM FAM136A 3 COG8,NFATC3,VPS4ABRCA-all NFYC 3 JAK2,NARG2,RAB27A
BRCA-LuminalB
ACN9 2 CDH5,DPEP2
BRCA-Basal BCL11A 3 FTSJD1,FUK,TMED6
BRCA-Her2 POU3F1 6 C10orf111,DNAJC24,FAM180B,JRKL,PTER,TRAF6
Table B.3: Cancer type-specific rescuer hubs. For pancancer, each cancer type, andbreast cancer subtype, we identified the rescuer gene that has largest number ofvulnerable partners. The number (hub size) and identities of vulnerable partnersare listed.
243

Cancer genes
Vulnerable partnersCancer genes
Rescuer partners
ACVR1B
EWSR1 ACVR1B CCIN, HRCT1
AKT2 INSR APOL2 CSPP1, PVT1
ARID1BCOL23A1, FAM153A, FLT4, GJD3, KRT222, KRT27, NBR1, PTRF, WNK4
BCL2C8orf33, DYNLT1, FBXO30, PLAGL1, RNASET2, T, TFB1M, ZNF250, ZNF706
ARID2 PRODH BMPR1A C1orf94, FAM159AASXL1 C22orf34, FA2H CSF1R C5orf28, HTR1E
CBFB KLF13, SCG5 CYLDATP6V0A2, BHLHE41, BRAP, CPSF7, CTDSP2, DDB1, EPYC, ERP27, FAM60A, LRRTM4, NUP107, OAS3, PAPOLG, RASSF9, RFC5, VPS37C
CCND1 MT1L EP300 CPSF1, FOXH1, KCNV1, LRRC14, SARNP, TAC3CDH1 CYP4X1, MRPS15, OSCP1, TRAPPC3 EWSR1 ACVR1B, RNF139CDK4 CDH13 FBXW7 FUCA2, HBS1L, KLHL32
CDKN2C
ARAP1, CACNB2, CXCL12, FAM188A, IPMK, PTER, RHOD, SPAG6, SUV420H1, ZNF485
FUS STEAP1
CTCF INSC, TRIM68 GATA3 HSPA13, NTNG1, OPRD1CYLD ACSBG1, CTSH, TSPAN3 JAK3 SLC16A6
EXT1CNDP2, GPR124, KIAA1328, KLB, RPL9, SLC14A1, SPATA18, TMX3, ZNF236, ZNF407
KEAP1 C17orf64
EXT2BBS4, CALML4, CCPG1, DMXL2, IQCH, MAP2K5, MEGF11, RNF111, SLC24A1, TMOD2, TSPAN3
KIT SALL4, SLPI
FANCF ARRDC4 KLF4 DPY19L4KRAS BTNL9, ELF2, IQGAP2, SAP30L LYL1 HOXB8, KIAA0391MDM2 ZNF253 MAP3K1 IRX4MSH6 UMOD MLLT1 NT5C, RNF168
MUTYH GLB1L, IHH, OBSL1 NPM1 COL12A1, ZDHHC5MYB ARL4D, LRRC41, PLEKHM1, TBX21 PDGFB CS, RPS26, TAC3
MYCCBLN2, CCDC102B, CHST9, FAM69C, SALL3, SLC39A6, SMAD4, ZNF407
PDGFRA CASC1
MYCNACSF3, CBFA2T3, GGT5, KLHL36, NOL3, TRADD
PRDM1 RSPO2
PMS1CCL22, CDK10, CX3CL1, DEF8, GLG1, GNAO1, GPR56, TEPP, ZFP90
PTEN FIZ1, NLRP11, ZNF580
POLE ZNF676, ZNF91 SETBP1 EIF3H, EZR, FAM91A1, POU5F1B, RAET1EPRDM1 ARFIP1, NR3C2, RPS3A, TIGD4 SMAD2 C6orf70, TFB1M
RARACDH15, EPM2A, GCDH, JDP2, JUNB, OR7C1, RNF166, SNAI3, TCF21, TCF25, ZNF430
SMAD4 ANXA13, MYC, RAD21, UTP23
RET HMHA1SMARCB
1PKHD1L1
RPL5 RASSF4 SMO CNGB1SRC THUMPD1 TET2 GTF2H5, MTRF1L, PCMT1TAL1 SVIL TIAM1 OSMR
TNFAIP3
COL25A1, GUCY1A3, MGST2, MMAA, SH3RF1
TSC1 SLC25A32
WT1 ABHD2, PEX11A XPC CYP2B7P1, LYRM2ZHX2 CARD10, HDAC10, TTC38
Table B.4: SR interactions of cancer associated genes. The table lists the vulnerableand rescuer partners of cancer associated genes.
244

Cancer Genes RescuersCBFB TNFRSF21
CCNE2 CYP20A1, DUSP18, PAX3, ZNF454
CDKN1B MDH1, NCOA7, ODC1, PTPRK, STX7, TRMT11, UGP2
CTCF TNFRSF21
ESRP1 CCDC89, PAX3, ZNF454
FGF3 BNIP2, MYO5A, NRP1, USP6NL
FGF4 C6orf123, USP6NL
GATA3 PIK3R4, TNFAIP1
KRAS AIM1, AMD1, AMIGO1, CLIC4, FAM101B, IRAK2, KCNA2, PARD3B, PAX6, RSC1A1, SLC22A25, SOS1, TAF13, TCEB3, TCP11L1
NRAS ABCE1, ACSL1, CASP3, KIAA0922, PAQR3, SLC10A6
PIK3CA ACSL1, ARHGAP10, MGST1, MID1, MRPL13, NDRG1, TMEM40
BRCA1 ANKRD40, ORMDL3, SPAG9
HER2 C6orf195, RABGAP1, RC3H2, UBXN2A, PRPSAP1
Table B.5: DU-type rescuer partners of cancer genes in breast cancer. The tablelists the rescuer partners of 13 cancer genes in breast cancer DU-SR network.
245

246

Bibliography
[1] John Lonsdale, Jeffrey Thomas, Mike Salvatore, Rebecca Phillips, EdmundLo, Saboor Shad, Richard Hasz, Gary Walters, Fernando Garcia, NancyYoung, et al. The genotype-tissue expression (gtex) project. Nature genetics,45(6):580–585, 2013.
[2] Su-In Lee, Aimee M Dudley, David Drubin, Pamela a Silver, Nevan J Krogan,Dana Pe’er, and Daphne Koller. Learning a prior on regulatory potential fromeQTL data. PLoS genetics, 5(1):e1000358, January 2009.
[3] B Alberts, A Johnson, J Lewis, M Raff, K Roberts, and P And Walter. Molec-ular Biology of the Cell, volume 54. 2008.
[4] Eric C Schirmer, Laurence Florens, Tinglu Guan, John R Yates, and LarryGerace. Nuclear membrane proteins with potential disease links found bysubtractive proteomics. Science, 301(5638):1380–1382, 2003.
[5] Francis Collins. The language of life: DNA and the revolution in personalisedmedicine. Profile Books, 2010.
[6] David Eisenberg, Edward M Marcotte, Ioannis Xenarios, and Todd O Yeates.Protein function in the post-genomic era. Nature, 405(6788):823–826, 2000.
[7] T Topel, R Hofestadt, D Scheible, and F Trefz. RAMEDIS: the rare metabolicdiseases database. Appl Bioinformatics, 5:115–118, 2006.
[8] Melvin B Heyman. Lactose intolerance in infants, children, and adolescents.Pediatrics, 118(3):1279–1286, 2006.
[9] F Crick. Central dogma of molecular biology. Nature, 227(5258):561–563,1970.
[10] Gene-Wei Li and X Sunney Xie. Central dogma at the single-molecule levelin living cells. Nature, 475(7356):308–315, 2011.
[11] Melissa S Jurica and Melissa J Moore. Pre-mrna splicing: awash in a sea ofproteins. Molecular cell, 12(1):5–14, 2003.
[12] Stefan Stamm, Shani Ben-Ari, Ilona Rafalska, Yesheng Tang, Zhaiyi Zhang,Debra Toiber, TA Thanaraj, and Hermona Soreq. Function of alternativesplicing. Gene, 344:1–20, 2005.
247

[13] Jonathan MW Slack. Metaplasia and transdifferentiation: from pure biologyto the clinic. Nature Reviews Molecular Cell Biology, 8(5):369–378, 2007.
[14] James M Ntambi and Kim Young-Cheul. Adipocyte differentiation and geneexpression. The Journal of Nutrition, 130(12):3122S–3126S, 2000.
[15] Marilena V Iorio, Manuela Ferracin, Chang-Gong Liu, Angelo Veronese, Ric-cardo Spizzo, Silvia Sabbioni, Eros Magri, Massimo Pedriali, Muller Fabbri,Manuela Campiglio, et al. Microrna gene expression deregulation in humanbreast cancer. Cancer research, 65(16):7065–7070, 2005.
[16] Stephen T Smale and James T Kadonaga. The rna polymerase ii core pro-moter. Annual review of biochemistry, 72(1):449–479, 2003.
[17] Robert E Thurman, Eric Rynes, Richard Humbert, Jeff Vierstra, Matthew TMaurano, Eric Haugen, Nathan C Sheffield, Andrew B Stergachis, Hao Wang,Benjamin Vernot, Kavita Garg, Sam John, Richard Sandstrom, Daniel Bates,Lisa Boatman, Theresa K Canfield, Morgan Diegel, Douglas Dunn, Abigail KEbersol, Tristan Frum, Erika Giste, Audra K Johnson, Ericka M Johnson,Tanya Kutyavin, Bryan Lajoie, Bum-Kyu Lee, Kristen Lee, Darin London,Dimitra Lotakis, Shane Neph, Fidencio Neri, Eric D Nguyen, Hongzhu Qu,Alex P Reynolds, Vaughn Roach, Alexias Safi, Minerva E Sanchez, AmartyaSanyal, Anthony Shafer, Jeremy M Simon, Lingyun Song, Shinny Vong,Molly Weaver, Yongqi Yan, Zhancheng Zhang, Zhuzhu Zhang, Boris Lenhard,Muneesh Tewari, Michael O Dorschner, R Scott Hansen, Patrick a Navas,George Stamatoyannopoulos, Vishwanath R Iyer, Jason D Lieb, Shamil RSunyaev, Joshua M Akey, Peter J Sabo, Rajinder Kaul, Terrence S Furey, JobDekker, Gregory E Crawford, and John a Stamatoyannopoulos. The acces-sible chromatin landscape of the human genome. Nature, 489(7414):75–82,September 2012.
[18] Bradley E. Bernstein, Alexander Meissner, and Eric S. Lander. The Mam-malian Epigenome. Cell, 128(4):669–681, 2007.
[19] Anna Portela and Manel Esteller. Epigenetic modifications and human disease.Nature biotechnology, 28(10):1057–1068, 2010.
[20] Randy L Jirtle and Michael K Skinner. Environmental epigenomics and\ndisease susceptibility. Nature reviews. Genetics, 8(4):253–62, 2007.
[21] a. Bird. DNA methylation patterns and epigenetic memory. Genes and De-velopment, 16(1):6–21, 2002.
[22] Jue D Wang and Petra A Levin. Metabolism, cell growth and the bacterialcell cycle. Nature Reviews Microbiology, 7(11):822–827, 2009.
[23] Karoly Mirnics, Frank A Middleton, David A Lewis, and Pat Levitt. Analysisof complex brain disorders with gene expression microarrays: schizophrenia asa disease of the synapse. Trends in neurosciences, 24(8):479–486, 2001.
248
[24] Yael T Aminetzach, J Michael Macpherson, and Dmitri a Petrov. Pesticideresistance via transposition-mediated adaptive gene truncation in Drosophila.Science (New York, N.Y.), 309(July):764–767, 2005.
[25] Vincent Burrus and Matthew K Waldor. Shaping bacterial genomes withintegrative and conjugative elements. Research in microbiology, 155(5):376–86, 2004.
[26] Stanley a Sawyer, John Parsch, Zhi Zhang, and Daniel L Hartl. Prevalence ofpositive selection among nearly neutral amino acid replacements in Drosophila.Proceedings of the National Academy of Sciences of the United States of Amer-ica, 104(16):6504–6510, 2007.
[27] Nils Weinhold, Anders Jacobsen, Nikolaus Schultz, Chris Sander, and WilliamLee. Genome-wide analysis of noncoding regulatory mutations in cancer. Na-ture Genetics, 46(11):1160–5, 2014.
[28] Soili Kytola, Brita Nord, Elisabeth Edstrom Elder, Tobias Carling, MagnusKjellman, Bjorn Cedermark, Claes Juhlin, Anders Hoog, Jorma Isola, andCatharina Larsson. Alterations of the SDHD gene locus in midgut carcinoids,Merkel cell carcinomas, pheochromocytomas, and abdominal paragangliomas.Genes, Chromosomes & Cancer, 34(3):325–332, 2002.
[29] Franklin W Huang, Eran Hodis, Mary Jue Xu, Gregory V Kryukov, LyndaChin, and Levi a Garraway. Highly recurrent TERT promoter mutations inhuman melanoma. Science (New York, N.Y.), 339(6122):957–9, 2013.
[30] Axel Visel, Edward M Rubin, and Len a Pennacchio. Genomic views of distant-acting enhancers. Nature, 461(7261):199–205, 2009.
[31] Len a Pennacchio, Wendy Bickmore, Ann Dean, Marcelo a Nobrega, andGill Bejerano. Enhancers: five essential questions. Nature reviews. Genetics,14(4):288–95, 2013.
[32] Scott Smemo, Luciene C Campos, Ivan P Moskowitz, Jose E Krieger, Alexan-dre C Pereira, and Marcelo a Nobrega. Regulatory variation in a TBX5 en-hancer leads to isolated congenital heart disease. Human molecular genetics,21(14):3255–63, 2012.
[33] David C Rees, Thomas N Williams, and Mark T Gladwin. Sickle-cell disease.The Lancet, 376(9757):2018–2031, 2010.
[34] Nan M Laird and Christoph Lange. Family-based designs in the age of large-scale gene-association studies. Nature Reviews Genetics, 7(5):385–394, 2006.
[35] Peter M Visscher, Matthew a Brown, Mark I McCarthy, and Jian Yang. Fiveyears of GWAS discovery. American journal of human genetics, 90(1):7–24,January 2012.
249

[36] Frank W Albert and Leonid Kruglyak. The role of regulatory variation incomplex traits and disease. Nature Reviews Genetics, 16(4):197–212, 2015.
[37] Thomas a Pearson and Teri a Manolio. How to interpret a genome-wideassociation study. JAMA : the journal of the American Medical Association,299(11):1335–44, 2008.
[38] T A Manolio, F S Collins, N J Cox, D B Goldstein, L A Hindorff, D J Hunter,M I McCarthy, E M Ramos, L R Cardon, A Chakravarti, J H Cho, A EGuttmacher, A Kong, L Kruglyak, E Mardis, C N Rotimi, M Slatkin, D Valle,A S Whittemore, M Boehnke, A G Clark, E E Eichler, G Gibson, J L Haines,T F Mackay, S A McCarroll, and P M Visscher. Finding the missing heritabil-ity of complex diseases. Nature, 461(7265):747–753, 2009.
[39] John Hardy and Andrew Singleton. Genomewide association studies and hu-man disease. The New England journal of medicine, 360(17):1759–1768, 2009.
[40] Consortium. The international hapmap project. Nature, 426(6968):789–96,2003.
[41] Danielle Welter, Jacqueline MacArthur, Joannella Morales, Tony Burdett,Peggy Hall, Heather Junkins, Alan Klemm, Paul Flicek, Teri Manolio, Lu-cia Hindorff, and Helen Parkinson. The NHGRI GWAS Catalog, a cu-rated resource of SNP-trait associations. Nucleic acids research, 42(Databaseissue):D1001–6, 2014.
[42] Lucia a Hindorff, Praveen Sethupathy, Heather a Junkins, Erin M Ramos,Jayashri P Mehta, Francis S Collins, and Teri a Manolio. Potential etiologicand functional implications of genome-wide association loci for human diseasesand traits. Proceedings of the National Academy of Sciences of the UnitedStates of America, 106(23):9362–7, 2009.
[43] Lucas D Ward and Manolis Kellis. Interpreting noncoding genetic variationin complex traits and human disease. Nature biotechnology, 30(11):1095–106,November 2012.
[44] Gregory M Cooper and Jay Shendure. Needles in stacks of needles: findingdisease-causal variants in a wealth of genomic data. Nature reviews. Genetics,12(9):628–640, 2011.
[45] Montgomery Slatkin. Linkage disequilibrium–understanding the evolutionarypast and mapping the medical future. Nature reviews. Genetics, 9(6):477–85,2008.
[46] Peter Kraft and DJ Hunter. Genetic risk prediction: are we there yet? TheNew England journal of medicine, pages 1701–1703, 2009.
250

[47] Avinash Das Sahu, Radhouane Aniba, Yen-Pei Christy Chang, Sridhar Han-nenhalli, et al. Epigenomic model of cardiac enhancers with application togenome wide association studies. In Pacific Symposium on Biocomputing.Pacific Symposium on Biocomputing, pages 92–102. World Scientific, 2012.
[48] Konrad J Karczewski, Joel T Dudley, Kimberly R Kukurba, Rong Chen,Atul J Butte, Stephen B Montgomery, and Michael Snyder. Systematic func-tional regulatory assessment of disease-associated variants. Proceedings of theNational Academy of Sciences of the United States of America, 110(23):9607–12, June 2013.
[49] Daniel J Gaffney, Jean-Baptiste Veyrieras, Jacob F Degner, Roger Pique-Regi, Athma A Pai, Gregory E Crawford, Matthew Stephens, Yoav Gilad,Jonathan K Pritchard, et al. Dissecting the regulatory architecture of geneexpression qtls. Genome Biol, 13(1):R7, 2012.
[50] Jean-Baptiste Veyrieras, Sridhar Kudaravalli, Su Yeon Kim, Emmanouil TDermitzakis, Yoav Gilad, Matthew Stephens, and Jonathan K Pritchard.High-resolution mapping of expression-QTLs yields insight into human generegulation. PLoS genetics, 4(10):e1000214, October 2008.
[51] Ian Dunham, Anshul Kundaje, Shelley F Aldred, Patrick J Collins, Carrie aDavis, Francis Doyle, Charles B Epstein, Seth Frietze, Jennifer Harrow, Ra-jinder Kaul, Jainab Khatun, Bryan R Lajoie, Stephen G Landt, Burn-KyuLee, Florencia Pauli, Kate R Rosenbloom, Peter Sabo, Alexias Safi, AmartyaSanyal, Noam Shoresh, Jeremy M Simon, Lingyun Song, Nathan D Trin-klein, Robert C Altshuler, Ewan Birney, James B Brown, Chao Cheng, SarahDjebali, Xianjun Dong, Jason Ernst, Terrence S Furey, Mark Gerstein, Be-linda Giardine, Melissa Greven, Ross C Hardison, Robert S Harris, JavierHerrero, Michael M Hoffman, Sowmya Iyer, Manolis Kelllis, Pouya Kherad-pour, Timo Lassmann, Qunhua Li, Xinying Lin, Georgi K Marinov, AngelikaMerkel, Ali Mortazavi, Stephen C J Parker, Timothy E Reddy, Joel Rozowsky,Felix Schlesinger, Robert E Thurman, Jie Wang, Lucas D Ward, Troy WWhitfield, Steven P Wilder, Weisheng Wu, Hualin S Xi, Kevin Y Yip, JialiZhuang, Bradley E Bernstein, Eric D Green, Chris Gunter, Michael Snyder,Michael J Pazin, Rebecca F Lowdon, Laura a L Dillon, Leslie B Adams,Caroline J Kelly, Julia Zhang, Judith R Wexler, Peter J Good, Elise a Fein-gold, Gregory E Crawford, Job Dekker, Laura Elinitski, Peggy J Farnham,Morgan C Giddings, Thomas R Gingeras, Roderic Guigo, Tomothy J Hub-bard, Manolis Kellis, W James Kent, Jason D Lieb, Elliott H Margulies,Richard M Myers, John a Starnatoyannopoulos, Scott a Tennebaum, Zhip-ing Weng, Kevin P White, Barbara Wold, Yanbao Yu, John Wrobel, Brian aRisk, Harsha P Gunawardena, Heather C Kuiper, Christopher W Maier, LingXie, Xian Chen, Tarjei S Mikkelsen, Shawn Gillespie, Alon Goren, OrenRam, Xiaolan Zhang, Li Wang, Robbyn Issner, Michael J Coyne, Timothy
251

Durham, Manching Ku, Thanh Truong, Matthew L Eaton, Alex Dobin, An-drea Tanzer, Julien Lagarde, Wei Lin, Chenghai Xue, Brian a Williams, ChrisZaleski, Maik Roder, Felix Kokocinski, Rehab F Abdelhamid, Tyler Alioto,Igor Antoshechkin, Michael T Baer, Philippe Batut, Ian Bell, Kimberly Bell,Sudipto Chakrabortty, Jacqueline Chrast, Joao Curado, Thomas Derrien,Jorg Drenkow, Erica Dumais, Jackie Dumais, Radha Duttagupta, MeganFastuca, Kata Fejes-Toth, Pedro Ferreira, Sylvain Foissac, Melissa J Full-wood, Hui Gao, David Gonzalez, Assaf Gordon, Cedric Howald, Sonali Jha,Rory Johnson, Philipp Kapranov, Brandon King, Colin Kingswood, GuoliangLi, Oscar J Luo, Eddie Park, Jonathan B Preall, Kimberly Presaud, PaoloRibeca, Daniel Robyr, Xiaoan Ruan, Michael Sammeth, Kuljeet Singh Sandu,Lorain Schaeffer, Lei-Hoon See, Atif Shahab, Jorgen Skancke, Ana MariaSuzuki, Hazuki Takahashi, Hagen Tilgner, Diane Trout, Nathalie Walters,Huaien Wang, Yoshihide Hayashizaki, Timothy J Hubbard, Alexandre Rey-mond, Stylianos E Antonarakis, Gregory J Hannon, Yijun Ruan, Piero Carn-inci, Cricket a Sloan, Katrina Learned, Venkat S Malladi, Matthew C Wong,Galt P Barber, Melissa S Cline, Timothy R Dreszer, Steven G Heitner, DonnaKarolchik, Vaness M Kirkup, Laurence R Meyer, Jeffrey C Long, MorganMaddren, Brian J Raney, Linda L Grasfeder, Paul G Giresi, Bum-Kyu Lee,Anna Battenhouse, Nathan C Sheffield, Kimberly a Showers, Darin London,Akshay a Bhinge, Christopher Shestak, Matthew R Schaner, Seul Ki Kim,Zhuzhu Z Zhang, Piotr a Mieczkowski, Joanna O Mieczkowska, Zheng Liu,Ryan M McDaniell, Yunyun Ni, Naim U Rashid, Min Jae Kim, Sheera Adar,Zhancheng Zhang, Tianyuan Wang, Deborah Winter, Damian Keefe, Vish-wanath R Iyer, Kljeet Singh Sandhu, Meizhen Zheng, Ping Wang, Jason Gertz,Jost Vielmetter, E Christopher Partridge, Katherine E Varley, Clarke Gasper,Anita Bansal, Shirley Pepke, Preti Jain, Henry Amrhein, Kevin M Bowling,Michael Anaya, Marie K Cross, Michael a Muratet, Kimberly M Newberry,Kenneth McCue, Amy S Nesmith, Katherine I Fisher-Aylor, Barbara Pusey,Gilberto DeSalvo, Stephanie L Parker, Sreeram Balasubramanian, Nicholas SDavis, Sarah K Meadows, Tracy Eggleston, J Scott Newberry, Shawn E Levy,Devin M Absher, Wing H Wong, Matthew J Blow, Axel Visel, Len a Penna-chio, Laura Elnitski, Hanna M Petrykowska, Alexej Abyzov, Bronwen Aken,Daniel Barrell, Gemma Barson, Andrew Berry, Alexandra Bignell, VeronikaBoychenko, Govanni Bussotti, Claire Davidson, Gloria Despacio-Reyes, MarkDiekhans, Iakes Ezkurdia, Adam Frankish, James Gilbert, Jose Manuel Gon-zalez, Ed Griffiths, Rachel Harte, David a Hendrix, Toby Hunt, Irwin Jungreis,Mike Kay, Ekta Khurana, Jing Leng, Michael F Lin, Jane Loveland, Zhi Lu,Deepa Manthravadi, Marco Mariotti, Jonathan Mudge, Gaurab Mukherjee,Cedric Notredame, Baikang Pei, Jose Manuel Rodriguez, Gary Saunders, An-drea Sboner, Stephen Searle, Cristina Sisu, Catherine Snow, Charlie Steward,Electra Tapanari, Michael L Tress, Marijke J van Baren, Stefan Washieti, Lau-rens Wilming, Amonida Zadissa, Zhang Zhengdong, Michael Brent, DavidHaussler, Alfonso Valencia, Alexandre Raymond, Nick Addleman, Roger PAlexander, Raymond K Auerbach, Suganthi Balasubramanian, Keith Bet-
252

tinger, Nitin Bhardwaj, Alan P Boyle, Alina R Cao, Philip Cayting, Alexan-dra Charos, Yong Cheng, Catharine Eastman, Ghia Euskirchen, Joseph DFleming, Fabian Grubert, Lukas Habegger, Manoj Hariharan, Arif Harmanci,Susma Iyenger, Victor X Jin, Konrad J Karczewski, Maya Kasowski, PhilLacroute, Hugo Lam, Nathan Larnarre-Vincent, Jin Lian, Marianne Lindahl-Allen, Renqiang Min, Benoit Miotto, Hannah Monahan, Zarmik Moqtaderi,Xinmeng J Mu, Henriette O’Geen, Zhengqing Ouyang, Dorrelyn Patacsil, De-basish Raha, Lucia Ramirez, Brian Reed, Minyi Shi, Teri Slifer, Heather Witt,Linfeng Wu, Xiaoqin Xu, Koon-Kiu Yan, Xinqiong Yang, Zhengdong Zhang,Kevin Struhl, Sherman M Weissman, Scott a Tenebaum, Luiz O Penalva,Subhradip Karmakar, Raj R Bhanvadia, Alina Choudhury, Marc Domanus,Lijia Ma, Jennifer Moran, Alec Victorsen, Thomas Auer, Lazaro Centarin,Michael Eichenlaub, Franziska Gruhl, Stephan Heerman, Burkard Hoeck-endorf, Daigo Inoue, Tanja Kellner, Stephan Kirchmaier, Claudia Mueller,Robert Reinhardt, Lea Schertel, Stephanie Schneider, Rebecca Sinn, BeateWittbrodt, Jochen Wittbrodt, Gaurav Jain, Gayathri Balasundaram, Daniel LBates, Rachel Byron, Theresa K Canfield, Morgan J Diegel, Douglas Dunn,Abigail K Ebersol, Tristan Frum, Kavita Garg, Erica Gist, R Scott Hansen,Lisa Boatman, Eric Haugen, Richard Humbert, Audra K Johnson, Ericka MJohnson, Tattayana M Kutyavin, Kristin Lee, Dimitra Lotakis, Matthew TMaurano, Shane J Neph, Fiedencio V Neri, Eric D Nguyen, Hongzhu Qu,Alex P Reynolds, Vaughn Roach, Eric Rynes, Minerva E Sanchez, Richard SSandstrom, Anthony O Shafer, Andrew B Stergachis, Sean Thomas, Ben-jamin Vernot, Jeff Vierstra, Shinny Vong, Hao Wang, Molly a Weaver,Yongqi Yan, Miaohua Zhang, Joshua a Akey, Michael Bender, Michael ODorschner, Mark Groudine, Michael J MacCoss, Patrick Navas, George Stam-atoyannopoulos, John a Stamatoyannopoulos, Kathryn Beal, Alvis Brazma,Paul Flicek, Nathan Johnson, Margus Lukk, Nicholas M Luscombe, Daniel So-bral, Juan M Vaquerizas, Serafim Batzoglou, Arend Sidow, Nadine Hussami,Sofia Kyriazopoulou-Panagiotopoulou, Max W Libbrecht, Marc a Schaub,Webb Miller, Peter J Bickel, Balazs Banfai, Nathan P Boley, Haiyan Huang,Jingyi Jessica Li, William Stafford Noble, Jeffrey a Bilmes, Orion J Buske,Avinash O Sahu, Peter V Kharchenko, Peter J Park, Dannon Baker, JamesTaylor, and Lucas Lochovsky. An integrated encyclopedia of DNA elementsin the human genome. Nature, 489(7414):57–74, September 2012.
[52] Bradley E Bernstein, John a Stamatoyannopoulos, Joseph F Costello, BingRen, Aleksandar Milosavljevic, Alexander Meissner, Manolis Kellis, Marco aMarra, Arthur L Beaudet, Joseph R Ecker, Peggy J Farnham, Martin Hirst,Eric S Lander, Tarjei S Mikkelsen, and James a Thomson. The NIH RoadmapEpigenomics Mapping Consortium. Nature biotechnology, 28(10):1045–1048,2010.
[53] Robert A Smith, Deana Manassaram-Baptiste, Durado Brooks, VilmaCokkinides, Mary Doroshenk, Debbie Saslow, Richard C Wender, and Otis W
253

Brawley. Cancer screening in the united states, 2014: a review of currentamerican cancer society guidelines and current issues in cancer screening. CA:a cancer journal for clinicians, 64(1):30–51, 2014.
[54] Douglas Hanahan and Robert A Weinberg. Hallmarks of cancer: the nextgeneration. Cell, 144(5):646–74, 2011.
[55] Douglas Hanahan and Robert A Weinberg. The Hallmarks of Cancer. Cell,100(1):57–70, jan 2000.
[56] R a Weinberg. The retinoblastoma protein and cell cycle control. Cell,81(3):323–330, 1995.
[57] C C Harris. Structure and function of the p53 tumor suppressor gene: cluesfor rational cancer therapeutic strategies. Journal of the National CancerInstitute, 88(20):1442–1455, 1996.
[58] Yuri Lazebnik. What are the hallmarks of cancer? Nature reviews. Cancer,10(4):232–233, 2010.
[59] D A Haber, N S Gray, and J Baselga. The evolving war on cancer. Cell,145(1):19–24, 2011.
[60] TimothyJ. Stuhlmiller, SamanthaM. Miller, JonS. Zawistowski, KazuhiroNakamura, AdrianaS. Beltran, JamesS. Duncan, StevenP. Angus, KylaA.L.Collins, DeborahA. Granger, RachelA. Reuther, LeeM. Graves, ShawnM.Gomez, Pei-Fen Kuan, JoelS. Parker, Xin Chen, Noah Sciaky, LisaA. Carey,H.Shelton Earp, Jian Jin, and GaryL. Johnson. Inhibition of Lapatinib-Induced Kinome Reprogramming in ERBB2-Positive Breast Cancer by Tar-geting BET Family Bromodomains. Cell Reports, 11(3):390–404, 2015.
[61] Caitriona Holohan, Sandra Van Schaeybroeck, Daniel B Longley, andPatrick G Johnston. Cancer drug resistance: an evolving paradigm. NatureReviews Cancer, 13(10):714–726, 2013.
[62] Elizabeth Iorns, Christopher J Lord, Nicholas Turner, and Alan Ashworth.Utilizing RNA interference to enhance cancer drug discovery. Nature reviews.Drug discovery, 6(7):556–568, 2007.
[63] Rachel Brough, Jessica R Frankum, Sara Costa-Cabral, Christopher J Lord,and Alan Ashworth. Searching for synthetic lethality in cancer. CurrentOpinion in Genetics and Development, 21(1):34–41, 2011.
[64] Archana Bommi-Reddy, Ingrid Almeciga, Jacqueline Sawyer, ChristophGeisen, Wenliang Li, Ed Harlow, William G Kaelin, and Dorre a Grueneberg.Kinase requirements in human cells: III. Altered kinase requirements in VHL-/- cancer cells detected in a pilot synthetic lethal screen. Proceedings of theNational Academy of Sciences of the United States of America, 105(43):16484–16489, 2008.
254

[65] Jordi Barretina, Giordano Caponigro, Nicolas Stransky, Kavitha Venkatesan,Adam A Margolin, Sungjoon Kim, Christopher J Wilson, Joseph Lehar, Gre-gory V Kryukov, Dmitriy Sonkin, Anupama Reddy, Manway Liu, Lauren Mur-ray, Michael F. Berger, John E. Monahan, Paula Morais, Jodi Meltzer, AdamKorejwa, Judit Jane-Valbuena, Felipa A Mapa, Joseph Thibault, Eva Bric-Furlong, Pichai Raman, Aaron Shipway, Ingo H Engels, Jill Cheng, Guoying K.Yu, Jianjun Yu, Peter Aspesi, Melanie de Silva, Kalpana Jagtap, Michael DJones, Li Wang, Charles Hatton, Emanuele Palescandolo, Supriya Gupta,Scott Mahan, Carrie Sougnez, Robert C Onofrio, Ted Liefeld, Laura Mac-Conaill, Wendy Winckler, Michael Reich, Nanxin Li, Jill P Mesirov, Stacey BGabriel, Gad Getz, Kristin Ardlie, Vivien Chan, Vic E Myer, Barbara L We-ber, Jeff Porter, Markus Warmuth, Peter Finan, Jennifer L Harris, MatthewMeyerson, Todd R Golub, Michael P Morrissey, William R Sellers, RobertSchlegel, and Levi A Garraway. The Cancer Cell Line Encyclopedia enablespredictive modelling of anticancer drug sensitivity. Nature, 483(7391):603–307,2012.
[66] M J Garnett, E J Edelman, S J Heidorn, C D Greenman, A Dastur, K WLau, P Greninger, I R Thompson, X Luo, J Soares, Q S Liu, F Iorio, D Sur-dez, L Chen, R J Milano, G R Bignell, A T Tam, H Davies, J A Steven-son, S Barthorpe, S R Lutz, F Kogera, K Lawrence, A McLaren-Douglas,X Mitropoulos, T Mironenko, H Thi, L Richardson, W J Zhou, F Jewitt, T HZhang, P O’Brien, J L Boisvert, S Price, W Hur, W J Yang, X M Deng,A Butler, H G Choi, J Chang, J Baselga, I Stamenkovic, J A Engelman, S VSharma, O Delattre, J Saez-Rodriguez, N S Gray, J Settleman, P A Futreal,D A Haber, M R Stratton, S Ramaswamy, U McDermott, and C H Benes.Systematic identification of genomic markers of drug sensitivity in cancer cells.Nature, 483(7391):570–U87, 2012.
[67] Sarah A. Martin, Afshan McCarthy, Louise J. Barber, Darren J. Burgess,Suzanne Parry, Christopher J. Lord, and Alan Ashworth. Methotrexate in-duces oxidative DNA damage and is selectively lethal to tumour cells withdefects in the DNA mismatch repair gene MSH2. EMBO Molecular Medicine,1(6-7):323–337, 2009.
[68] Nicholas C Turner, Christopher J Lord, Elizabeth Iorns, Rachel Brough, SallySwift, Richard Elliott, Sydonia Rayter, Andrew N Tutt, and Alan Ashworth.A synthetic lethal siRNA screen identifying genes mediating sensitivity to aPARP inhibitor. The EMBO journal, 27(9):1368–1377, 2008.
[69] C J Lord and A Ashworth. Mechanisms of resistance to therapies targetingBRCA-mutant cancers. Nature Medicine, 19(11):1381–1388, 2013.
[70] Michael C. Bassik, Martin Kampmann, Robert Jan Lebbink, Shuyi Wang,Marco Y. Hein, Ina Poser, Jimena Weibezahn, Max a. Horlbeck, Siyuan Chen,
255

Matthias Mann, Anthony a. Hyman, Emily M. Leproust, Michael T. Mc-Manus, and Jonathan S. Weissman. A systematic mammalian genetic inter-action map reveals pathways underlying ricin susceptibility. Cell, 152(4):909–922, 2013.
[71] Livnat Jerby-Arnon, Nadja Pfetzer, YedaelY. Waldman, Lynn McGarry,Daniel James, Emma Shanks, Brinton Seashore-Ludlow, Adam Weinstock,Tamar Geiger, PaulA. Clemons, Eyal Gottlieb, and Eytan Ruppin. PredictingCancer-Specific Vulnerability via Data-Driven Detection of Synthetic Lethal-ity. Cell, 158(5):1199–1209, 2014.
[72] Alan Ashworth, Christopher J Lord, and Jorge S Reis-Filho. Genetic interac-tions in cancer progression and treatment. Cell, 145(1):30–38, 2011.
[73] Leland H Hartwell, Philippe Szankasi, Christopher J Roberts, Andrew W Mur-ray, and Stephen H Friend. Integrating genetic approaches into the discoveryof anticancer drugs. Science (New York, N.Y.), 278(5340):1064–1068, 1997.
[74] Babu V Sajesh, Brent J Guppy, and Kirk J McManus. Synthetic genetictargeting of genome instability in cancer. Cancers, 5(3):739–61, 2013.
[75] I B Weinstein. Cancer. Addiction to oncogenes–the Achilles heal of cancer.Science, 297(5578):63–64, 2002.
[76] Kyle Chang, Chad J Creighton, Caleb Davis, Lawrence Donehower, Jen-nifer Drummond, David Wheeler, Adrian Ally, Miruna Balasundaram, InancBirol, Yaron S N Butterfield, Andy Chu, Eric Chuah, Hye-Jung E Chun,Noreen Dhalla, Ranabir Guin, Martin Hirst, Carrie Hirst, Robert a Holt,Steven J M Jones, Darlene Lee, Haiyan I Li, Marco a Marra, Michael Mayo,Richard a Moore, Andrew J Mungall, a Gordon Robertson, Jacqueline ESchein, Payal Sipahimalani, Angela Tam, Nina Thiessen, Richard J Varhol,Rameen Beroukhim, Ami S Bhatt, Angela N Brooks, Andrew D Cherniack,Samuel S Freeman, Stacey B Gabriel, Elena Helman, Joonil Jung, MatthewMeyerson, Akinyemi I Ojesina, Chandra Sekhar Pedamallu, Gordon Sak-sena, Steven E Schumacher, Barbara Tabak, Travis Zack, Eric S Lander,Christopher a Bristow, Angela Hadjipanayis, Psalm Haseley, Raju Kucher-lapati, Semin Lee, Eunjung Lee, Lovelace J Luquette, Harshad S Mahadesh-war, Angeliki Pantazi, Michael Parfenov, Peter J Park, Alexei Protopopov,Xiaojia Ren, Netty Santoso, Jonathan Seidman, Sahil Seth, Xingzhi Song,Jiabin Tang, Ruibin Xi, Andrew W Xu, Lixing Yang, Dong Zeng, J ToddAuman, Saianand Balu, Elizabeth Buda, Cheng Fan, Katherine a Hoadley,Corbin D Jones, Shaowu Meng, Piotr a Mieczkowski, Joel S Parker, Charles MPerou, Jeffrey Roach, Yan Shi, Grace O Silva, Donghui Tan, Umadevi Velu-volu, Scot Waring, Matthew D Wilkerson, Junyuan Wu, Wei Zhao, Tom Bo-denheimer, D Neil Hayes, Alan P Hoyle, Stuart R Jeffreys, Lisle E Mose,Janae V Simons, Mathew G Soloway, Stephen B Baylin, Benjamin P Berman,Moiz S Bootwalla, Ludmila Danilova, James G Herman, Toshinori Hinoue,
256

Peter W Laird, Suhn K Rhie, Hui Shen, Timothy Triche, Daniel J Weisen-berger, Scott L Carter, Kristian Cibulskis, Lynda Chin, Jianhua Zhang, GadGetz, Carrie Sougnez, Min Wang, Huyen Dinh, Harsha Vardhan Doddapaneni,Richard Gibbs, Preethi Gunaratne, Yi Han, Divya Kalra, Christie Kovar, LoraLewis, Margaret Morgan, Donna Morton, Donna Muzny, Jeffrey Reid, Liu Xi,Juok Cho, Daniel Dicara, Scott Frazer, Nils Gehlenborg, David I Heiman,Jaegil Kim, Michael S Lawrence, Pei Lin, Yingchun Liu, Michael S Noble,Petar Stojanov, Doug Voet, Hailei Zhang, Lihua Zou, Chip Stewart, BradyBernard, Ryan Bressler, Andrea Eakin, Lisa Iype, Theo Knijnenburg, RogerKramer, Richard Kreisberg, Kalle Leinonen, Jake Lin, Yuexin Liu, MichaelMiller, Sheila M Reynolds, Hector Rovira, Ilya Shmulevich, Vesteinn Thors-son, Da Yang, Wei Zhang, Samirkumar Amin, Chang-Jiun Wu, Chia-Chin Wu,Rehan Akbani, Kenneth Aldape, Keith a Baggerly, Bradley Broom, Tod DCasasent, James Cleland, Chad Creighton, Deepti Dodda, Mary Edgerton,Leng Han, Shelley M Herbrich, Zhenlin Ju, Hoon Kim, Seth Lerner, Jun Li,Han Liang, Wenbin Liu, Philip L Lorenzi, Yiling Lu, James Melott, Gordon BMills, Lam Nguyen, Xiaoping Su, Roeland Verhaak, Wenyi Wang, John N We-instein, Andrew Wong, Yang Yang, Jun Yao, Rong Yao, Kosuke Yoshihara,Yuan Yuan, Alfred K Yung, Nianxiang Zhang, Siyuan Zheng, Michael Ryan,David W Kane, B Arman Aksoy, Giovanni Ciriello, Gideon Dresdner, Jian-jiong Gao, Benjamin Gross, Anders Jacobsen, Andre Kahles, Marc Ladanyi,William Lee, Kjong-Van Lehmann, Martin L Miller, Ricardo Ramirez, Gun-nar Ratsch, Boris Reva, Chris Sander, Nikolaus Schultz, Yasin Senbabaoglu,Ronglai Shen, Rileen Sinha, S Onur Sumer, Yichao Sun, Barry S Taylor,Nils Weinhold, Suzanne Fei, Paul Spellman, Christopher Benz, Daniel Carlin,Melisssa Cline, Brian Craft, Kyle Ellrott, Mary Goldman, David Haussler,Singer Ma, Sam Ng, Evan Paull, Amie Radenbaugh, Sofie Salama, ArtemSokolov, Joshua M Stuart, Teresa Swatloski, Vladislav Uzunangelov, PeterWaltman, Christina Yau, Jing Zhu, Stanley R Hamilton, Scott Abbott, RachelAbbott, Nathan D Dees, Kim Delehaunty, Li Ding, David J Dooling, Jim MEldred, Catrina C Fronick, Robert Fulton, Lucinda L Fulton, Joelle Kalicki-Veizer, Krishna-Latha Kanchi, Cyriac Kandoth, Daniel C Koboldt, David ELarson, Timothy J Ley, Ling Lin, Charles Lu, Vincent J Magrini, Elaine RMardis, Michael D McLellan, Joshua F McMichael, Christopher a Miller,Michelle O’Laughlin, Craig Pohl, Heather Schmidt, Scott M Smith, JasonWalker, John W Wallis, Michael C Wendl, Richard K Wilson, Todd Wylie,Qunyuan Zhang, Robert Burton, Mark a Jensen, Ari Kahn, Todd Pihl, DavidPot, Yunhu Wan, Douglas a Levine, Aaron D Black, Jay Bowen, Jessica Frick,Julie M Gastier-Foster, Hollie a Harper, Carmen Helsel, Kristen M Leraas,Tara M Lichtenberg, Cynthia McAllister, Nilsa C Ramirez, Samantha Sharpe,Lisa Wise, Erik Zmuda, Stephen J Chanock, Tanja Davidsen, John a Dem-chok, Greg Eley, Ina Felau, Brad a Ozenberger, Margi Sheth, Heidi Sofia, LouisStaudt, Roy Tarnuzzer, Zhining Wang, Liming Yang, Jiashan Zhang, LarssonOmberg, Adam Margolin, Benjamin J Raphael, Fabio Vandin, Hsin-Ta Wu,Mark D M Leiserson, Stephen C Benz, Charles J Vaske, Houtan Noushmehr,
257
Denise Wolf, Laura Van’t Veer, Eric a Collisson, Dimitris Anastassiou, Tai-Hsien Ou Yang, Nuria Lopez-Bigas, Abel Gonzalez-Perez, David Tamborero,Zheng Xia, Wei Li, Dong-Yeon Cho, Teresa Przytycka, Mark Hamilton, SeanMcGuire, Sven Nelander, Patrik Johansson, Rebecka Jornsten, Teresia Kling,Jose Sanchez, and Kenna R Mills Shaw. The Cancer Genome Atlas Pan-Cancer analysis project. Nature genetics, 45(10):1113–1120, 2013.
[77] Michael E Tipping. Bayesian Inference : An Introduction to Principles andPractice in Machine Learning From Least-Squares to Bayesian Inference. pages1–19, 2006.
[78] E. T. Jaynes. Probability theory: the logic of science, volume 27. 2005.
[79] Trevor Hastie, Robert Tibshirani, Jerome Friedman, T Hastie, J Friedman,and R Tibshirani. The elements of statistical learning, volume 2. Springer,2009.
[80] C E Rasmussen and Z Ghahramani. Occam’s Razor. In Advances in NeuralInformation Processing Systems 13, pages 294–300, 2001.
[81] David J. C. MacKay. Bayesian Interpolation. Neural Computation, 4(3):415–447, 1992.
[82] WHO. Global status report on noncommunicable diseases 2014. Technicalreport, 2014.
[83] Chun Yew Fong, Omer Gilan, Enid Y N Lam, Alan F Rubin, Sarah Ftouni,Dean Tyler, Kym Stanley, Devbarna Sinha, Paul Yeh, Jessica Morison, GeorgeGiotopoulos, Dave Lugo, Philip Jeffrey, Stanley Chun-wei Lee, ChristopherCarpenter, Richard Gregory, Robert G Ramsay, Steven W Lane, Omar Abdel-Wahab, Tony Kouzarides, Ricky W Johnstone, Sarah-Jane Dawson, Brian J PHuntly, Rab K Prinjha, Anthony T Papenfuss, and Mark A Dawson. BETinhibitor resistance emerges from leukaemia stem cells. Nature, 525(7570):538–542, sep 2015.
[84] Philipp Rathert, Mareike Roth, Tobias Neumann, Felix Muerdter, Jae-SeokRoe, Matthias Muhar, Sumit Deswal, Sabine Cerny-Reiterer, Barbara Pe-ter, Julian Jude, Thomas Hoffmann, ukasz M. Bory, Elin Axelsson, NorbertSchweifer, Ulrike Tontsch-Grunt, Lukas E. Dow, Davide Gianni, Mark Pear-son, Peter Valent, Alexander Stark, Norbert Kraut, Christopher R. Vakoc, andJohannes Zuber. Transcriptional plasticity promotes primary and acquired re-sistance to BET inhibition. Nature, 525(7570):543–547, sep 2015.
[85] A Bertotti, E Papp, S Jones, V Adleff, V Anagnostou, B Lupo, M Sausen,J Phallen, C A Hruban, C Tokheim, N Niknafs, M Nesselbush, K Lytle,F Sassi, F Cottino, G Migliardi, E R Zanella, D Ribero, N Russolillo, A Mel-lano, A Muratore, G Paraluppi, M Salizzoni, S Marsoni, M Kragh, J Lantto,A Cassingena, Q K Li, R Karchin, R Scharpf, A Sartore-Bianchi, S Siena, L A
258
Diaz Jr., L Trusolino, and V E Velculescu. The genomic landscape of responseto EGFR blockade in colorectal cancer. Nature, 526(7572):263–267, 2015.
[86] D T Miyamoto, Y Zheng, B S Wittner, R J Lee, H Zhu, K T Broderick, R De-sai, D B Fox, B W Brannigan, J Trautwein, K S Arora, N Desai, D M Dahl,L V Sequist, M R Smith, R Kapur, C L Wu, T Shioda, S Ramaswamy, D TTing, M Toner, S Maheswaran, and D A Haber. RNA-Seq of single prostateCTCs implicates noncanonical Wnt signaling in antiandrogen resistance. Sci-ence, 349(6254):1351–1356, 2015.
[87] Avinash Das, Michael Morley, Christine S Moravec, WHW Tang, HakonHakonarson, Kenneth B Margulies, Thomas P Cappola, Shane Jensen, Srid-har Hannenhalli, MAGNet Consortium, et al. Bayesian integration of geneticsand epigenetics detects causal regulatory snps underlying expression variabil-ity. Nature communications, 6, 2015.
[88] Avinash Das, Joo Sang Lee, Ramiro Iglesias-bartolome, Silvio J Jerby-arnon,Livnat, Sridhar Hannenhalli, and Eytan Ruppin. Synthetic rescue determi-nants of resistance and response to cancer therapy. (In preparation), (1).
[89] G. A. Maston, S. K. Evans, and M. R. Green. Transcriptional regulatoryelements in the human genome. Annu Rev Genomics Hum Genet, 7:29–59,2006.
[90] R. J. White. Transcription by rna polymerase iii: more complex than wethought. Nat Rev Genet, 12(7):459–63, 2011.
[91] S. Naranjo, K. Voesenek, E. de la Calle-Mustienes, A. Robert-Moreno,H. Kokotas, M. Grigoriadou, J. Economides, G. Van Camp, N. Hilgert,F. Moreno, B. Alsina, M. B. Petersen, H. Kremer, and J. L. Gomez-Skarmeta.Multiple enhancers located in a 1-mb region upstream of pou3f4 promote ex-pression during inner ear development and may be required for hearing. Hu-man genetics, 128(4):411–419, 2010.
[92] L. A. Lettice, S. J. Heaney, L. A. Purdie, L. Li, P. de Beer, B. A. Oostra,D. Goode, G. Elgar, R. E. Hill, and E. de Graaff. A long-range shh enhancerregulates expression in the developing limb and fin and is associated withpreaxial polydactyly. Hum Mol Genet, 12(14):1725–35, 2003.
[93] L. A. Hindorff, P. Sethupathy, H. A. Junkins, E. M. Ramos, J. P. Mehta, F. S.Collins, and T. A. Manolio. Potential etiologic and functional implications ofgenome-wide association loci for human diseases and traits. Proc Natl AcadSci U S A, 106(23):9362–7, 2009.
[94] D. J. Gaffney, J. B. Veyrieras, J. F. Degner, R. Pique-Regi, A. A. Pai, G. E.Crawford, M. Stephens, Y. Gilad, and J. K. Pritchard. Dissecting the regula-tory architecture of gene expression qtls. Genome Biol, 13(1):R7, 2012.
259

[95] V. Gotea, A. Visel, J. M. Westlund, M. A. Nobrega, L. A. Pennacchio, andI. Ovcharenko. Homotypic clusters of transcription factor binding sites are akey component of human promoters and enhancers. Genome Res, 20(5):565–77, 2010.
[96] J. Ernst and M. Kellis. Discovery and characterization of chromatin states forsystematic annotation of the human genome. Nat Biotechnol, 28(8):817–25,2010.
[97] G. E. Zentner, P. J. Tesar, and P. C. Scacheri. Epigenetic signatures distin-guish multiple classes of enhancers with distinct cellular functions. GenomeRes, 21(8):1273–83, 2011.
[98] R.Y. Birnbaum, E.J. Clowney, O. Agamy, M.J. Kim, J. Zhao, T. Yamanaka,Z. Pappalardo, S.L. Clarke, A.M. Wenger, L. Nguyen, et al. Coding ex-ons function as tissue-specific enhancers of nearby genes. Genome Research,22(6):1059–1068, 2012.
[99] J. Ernst, P. Kheradpour, T. S. Mikkelsen, N. Shoresh, L. D. Ward, C. B. Ep-stein, X. Zhang, L. Wang, R. Issner, M. Coyne, M. Ku, T. Durham, M. Kellis,and B. E. Bernstein. Mapping and analysis of chromatin state dynamics innine human cell types. Nature, 473(7345):43–9, 2011.
[100] A. Visel, M. J. Blow, Z. Li, T. Zhang, J. A. Akiyama, A. Holt, I. Plajzer-Frick,M. Shoukry, C. Wright, F. Chen, V. Afzal, B. Ren, E. M. Rubin, and L. A.Pennacchio. Chip-seq accurately predicts tissue-specific activity of enhancers.Nature, 457(7231):854–8, 2009.
[101] M. P. Creyghton, A. W. Cheng, G. G. Welstead, T. Kooistra, B. W. Carey,E. J. Steine, J. Hanna, M. A. Lodato, G. M. Frampton, P. A. Sharp, L. A.Boyer, R. A. Young, and R. Jaenisch. Histone h3k27ac separates active frompoised enhancers and predicts developmental state. Proc Natl Acad Sci U SA, 107(50):21932–6, 2010.
[102] Daniel D Lee, Bell Laboratories, Murray Hill, and H Sebastian Seung Y.Algorithms for Non-negative Matrix Factorization. (1).
[103] M. Fernandez and D. Miranda-Saavedra. Genome-wide enhancer predictionfrom epigenetic signatures using genetic algorithm-optimized support vectormachines. Nucleic Acids Res, 40(10):e77, 2012.
[104] R Jansen. Genetical genomics: the added value from segregation. Trends inGenetics, 17(7):388–391, 2001.
[105] Rachel B Brem, Gael Yvert, Rebecca Clinton, and Leonid Kruglyak. Geneticdissection of transcriptional regulation in budding yeast. Science (New York,N.Y.), 296(2002):752–755, 2002.
260

[106] D J Lunn, J C Whittaker, and N Best. A Bayesian toolkit for genetic associ-ation studies. Genet Epidemiol, 30(3):231–247, 2006.
[107] Jonathan Marchini, Bryan Howie, Simon Myers, Gil McVean, and Peter Don-nelly. A new multipoint method for genome-wide association studies by im-putation of genotypes. Nature genetics, 39(7):906–13, 2007.
[108] Robert J Klein, Caroline Zeiss, Emily Y Chew, Jen-Yue Tsai, Richard SSackler, Chad Haynes, Alice K Henning, John Paul SanGiovanni, Shrikant MMane, Susan T Mayne, Michael B Bracken, Frederick L Ferris, Jurg Ott, ColinBarnstable, and Josephine Hoh. Complement factor H polymorphism in age-related macular degeneration. Science (New York, N.Y.), 308(5720):385–9,2005.
[109] Albert O Edwards, Robert Ritter, Kenneth J Abel, Alisa Manning, CarolienPanhuysen, and Lindsay a Farrer. Complement factor H polymorphism andage-related macular degeneration. Science (New York, N.Y.), 308(5720):421–424, 2005.
[110] Kaixin Zhou and Ewan R Pearson. Insights from genome-wide associationstudies of drug response. Annual review of pharmacology and toxicology,53:299–310, 2013.
[111] Andrew R Harper and Eric J Topol. Pharmacogenomics in clinical practiceand drug development. Nature biotechnology, 30(11):1117–24, 2012.
[112] Andrew R Wood. Defining the role of common variation in the genomic andbiological architecture of adult human height. Nature genetics, 46(11), 2014.
[113] Mary Grace Goll and Timothy H Bestor. Eukaryotic cytosine methyltrans-ferases. Annual review of biochemistry, 74:481–514, 2005.
[114] Raphael Margueron, Patrick Trojer, and Danny Reinberg. The key to devel-opment: Interpreting the histone code? Current Opinion in Genetics andDevelopment, 15(2):163–176, 2005.
[115] Rudolf Jaenisch and Adrian Bird. Epigenetic regulation of gene expression:how the genome integrates intrinsic and environmental signals. Nature genet-ics, 33 Suppl(march):245–254, 2003.
[116] T R Haines, D I Rodenhiser, and P J Ainsworth. Allele-specific non-CpGmethylation of the Nf1 gene during early mouse development. DevelopmentalBiology, 240(2):585–598, 2001.
[117] B H Ramsahoye, D Biniszkiewicz, F Lyko, V Clark, a P Bird, and R Jaenisch.Non-CpG methylation is prevalent in embryonic stem cells and may be medi-ated by DNA methyltransferase 3a. Proceedings of the National Academy ofSciences of the United States of America, 97(10):5237–5242, 2000.
261

[118] A D Riggs. X inactivation, differentiation, and DNA methylation. Cytogeneticsand cell genetics, 14(1):9–25, 1975.
[119] R Holliday and J E Pugh. DNA modification mechanisms and gene activityduring development. Science (New York, N.Y.), 187(4173):226–232, 1975.
[120] A P Wolffe and M A Matzke. Epigenetics: regulation through repression.Science (New York, N.Y.), 286(5439):481–486, 1999.
[121] Fyodor D. Urnov and Alan P. Wolffe. Above and within the genome: Epige-netics past and present. Journal of Mammary Gland Biology and Neoplasia,6(2):153–167, 2001.
[122] Leonie Ringrose and Renato Paro. Epigenetic regulation of cellular memoryby the Polycomb and Trithorax group proteins. Annual review of genetics,38:413–443, 2004.
[123] C.J.C. Burges. A tutorial on support vector machines for pattern recognition.Data mining and knowledge discovery, 2(2):121–167, 1998.
[124] V.N. Vapnik. The nature of statistical learning theory. Springer-Verlag NewYork Inc, 2000.
[125] C. Cortes and V. Vapnik. Support-vector networks. Machine learning,20(3):273–297, 1995.
[126] D. May, M.J. Blow, T. Kaplan, D.J. McCulley, B.C. Jensen, J.A. Akiyama,A. Holt, I. Plajzer-Frick, M. Shoukry, C. Wright, et al. Large-scale discoveryof enhancers from human heart tissue. Nature genetics, 2011.
[127] L. Narlikar, N.J. Sakabe, A.A. Blanski, F.E. Arimura, J.M. Westlund, M.A.Nobrega, and I. Ovcharenko. Genome-wide discovery of human heart en-hancers. Genome research, 20(3):381–392, 2010.
[128] Mark Johnson, Thomas L Griffiths, Mark Johnsonbrownedu, and Tom Grif-fithsberkeleyedu. Bayesian Inference for PCFGs via Markov chain MonteCarlo.
[129] N. Frey and E. N. Olson. Cardiac hypertrophy: the good, the bad, and theugly. Annu Rev Physiol, 65:45–79, 2003.
[130] S. Hannenhalli, M. E. Putt, J. M. Gilmore, J. Wang, M. S. Parmacek, J. A.Epstein, E. E. Morrisey, K. B. Margulies, and T. P. Cappola. Transcriptionalgenomics associates fox transcription factors with human heart failure. Cir-culation, 114(12):1269–76, 2006.
[131] I. Manukyan, J. Galatioto, E. Mascareno, S. Bhaduri, and M. A. Siddiqui.Cross-talk between calcineurin/nfat and jak/stat signalling induces cardiopro-tective alphab-crystallin gene expression in response to hypertrophic stimuli.J Cell Mol Med, 14(6B):1707–16, 2010.
262

[132] J. Schlesinger, M. Schueler, M. Grunert, J. J. Fischer, Q. Zhang, T. Krueger,M. Lange, M. Tonjes, I. Dunkel, and S. R. Sperling. The cardiac transcriptionnetwork modulated by gata4, mef2a, nkx2.5, srf, histone modifications, andmicrornas. PLoS Genet, 7(2):e1001313, 2011.
[133] V. Matys, O. V. Kel-Margoulis, E. Fricke, I. Liebich, S. Land, A. Barre-Dirrie,I. Reuter, D. Chekmenev, M. Krull, K. Hornischer, N. Voss, P. Stegmaier,B. Lewicki-Potapov, H. Saxel, A. E. Kel, and E. Wingender. Transfac and itsmodule transcompel: transcriptional gene regulation in eukaryotes. NucleicAcids Res, 34(Database issue):D108–10, 2006.
[134] S. Levy and S. Hannenhalli. Identification of transcription factor binding sitesin the human genome sequence. Mamm Genome, 13(9):510–4, 2002.
[135] A. G. West and P. Fraser. Remote control of gene transcription. Hum MolGenet, 14 Spec No 1:R101–11, 2005.
[136] J. Chen, E. E. Bardes, B. J. Aronow, and A. G. Jegga. Toppgene suite forgene list enrichment analysis and candidate gene prioritization. Nucleic AcidsRes, 37(Web Server issue):W305–11, 2009.
[137] K Beyer and J Goldstein. When is nearest neighbour meaningful? DatabaseTheoryICDT’99, 1999.
[138] Joel N Hirschhorn. Genomewide association studies–illuminating biologicpathways. The New England journal of medicine, 360(17):1699–701, April2009.
[139] Tuuli Lappalainen, Michael Sammeth, Marc R Friedlander, Peter ACt Hoen,Jean Monlong, Manuel A Rivas, Mar Gonzalez-Porta, Natalja Kurbatova,Thasso Griebel, Pedro G Ferreira, et al. Transcriptome and genome sequencinguncovers functional variation in humans. Nature, 2013.
[140] Shaun Purcell, Benjamin Neale, Kathe Todd-Brown, Lori Thomas, Manuel ARFerreira, David Bender, Julian Maller, Pamela Sklar, Paul IW De Bakker,Mark J Daly, et al. Plink: a tool set for whole-genome association andpopulation-based linkage analyses. The American Journal of Human Genetics,81(3):559–575, 2007.
[141] Richard M. Durbin, David L. Altshuler, Richard M. Durbin, Goncalo R.Abecasis, David R. Bentley, Aravinda Chakravarti, Andrew G. Clark, Fran-cis S. Collins, De La Vega, M. Francisco, Peter Donnelly, Michael Egholm,Paul Flicek, Stacey B. Gabriel, Richard a. Gibbs, Bartha M. Knoppers,Eric S. Lander, Hans Lehrach, Elaine R. Mardis, Gil a. McVean, Debbie a.Nickerson, Leena Peltonen, Alan J. Schafer, Stephen T. Sherry, Jun Wang,Richard K. Wilson, Richard a. Gibbs, David Deiros, Mike Metzker, DonnaMuzny, Jeff Reid, David Wheeler, Jun Wang, Jingxiang Li, Min Jian, Guo-qing Li, Ruiqiang Li, Huiqing Liang, Geng Tian, Bo Wang, Jian Wang,
263

Wei Wang, Huanming Yang, Xiuqing Zhang, Huisong Zheng, Eric S. Lan-der, David L. Altshuler, Lauren Ambrogio, Toby Bloom, Kristian Cibulskis,Tim J. Fennell, Stacey B. Gabriel, David B. Jaffe, Erica Shefler, Carrie L.Sougnez, David R. Bentley, Niall Gormley, Sean Humphray, Zoya Kings-bury, Paula Koko-Gonzales, Jennifer Stone, Kevin J. McKernan, Gina L.Costa, Jeffry K. Ichikawa, Clarence C. Lee, Ralf Sudbrak, Hans Lehrach,Tatiana a. Borodina, Andreas Dahl, Alexey N. Davydov, Peter Marquardt,Florian Mertes, Wilfiried Nietfeld, Philip Rosenstiel, Stefan Schreiber, Alek-sey V. Soldatov, Bernd Timmermann, Marius Tolzmann, Michael Egholm, Ja-son Affourtit, Dana Ashworth, Said Attiya, Melissa Bachorski, Eli Buglione,Adam Burke, Amanda Caprio, Christopher Celone, Shauna Clark, David Con-ners, Brian Desany, Lisa Gu, Lorri Guccione, Kalvin Kao, Andrew Kebbel,Jennifer Knowlton, Matthew Labrecque, Louise McDade, Craig Mealmaker,Melissa Minderman, Anne Nawrocki, Faheem Niazi, Kristen Pareja, RaviRamenani, David Riches, Wanmin Song, Cynthia Turcotte, Shally Wang,Elaine R. Mardis, Richard K. Wilson, David Dooling, Lucinda Fulton, RobertFulton, George Weinstock, Richard M. Durbin, John Burton, David M. Carter,Carol Churcher, Alison Coffey, Anthony Cox, Aarno Palotie, Michael Quail,Tom Skelly, James Stalker, Harold P. Swerdlow, Daniel Turner, Anniek DeWitte, Shane Giles, Richard a. Gibbs, David Wheeler, Matthew Bainbridge,Danny Challis, Aniko Sabo, Fuli Yu, Jin Yu, Jun Wang, Xiaodong Fang,Xiaosen Guo, Ruiqiang Li, Yingrui Li, Ruibang Luo, Shuaishuai Tai, Hong-long Wu, Hancheng Zheng, Xiaole Zheng, Yan Zhou, Guoqing Li, Jian Wang,Huanming Yang, Gabor T. Marth, Erik P. Garrison, Weichun Huang, AmitIndap, Deniz Kural, Wan-Ping Lee, Wen Fung Leong, Aaron R. Quinlan, ChipStewart, Michael P. Stromberg, Alistair N. Ward, Jiantao Wu, Charles Lee,Ryan E. Mills, Xinghua Shi, Mark J. Daly, Mark a. DePristo, David L. Alt-shuler, Aaron D. Ball, Eric Banks, Toby Bloom, Brian L. Browning, KristianCibulskis, Tim J. Fennell, Kiran V. Garimella, Sharon R. Grossman, Robert E.Handsaker, Matt Hanna, Chris Hartl, David B. Jaffe, Andrew M. Kernytsky,Joshua M. Korn, Heng Li, Jared R. Maguire, Steven a. McCarroll, AaronMcKenna, James C. Nemesh, Anthony a. Philippakis, Ryan E. Poplin, AlkesPrice, Manuel a. Rivas, Pardis C. Sabeti, Stephen F. Schaffner, Erica Shefler,Ilya a. Shlyakhter, David Neil Cooper, Edward Vincent Ball, Matthew Ed-win Mort, Andrew David Phillips, Peter Daniel Stenson, Jonathan Sebat,Vladimir Makarov, Kenny Ye, Seungtai C. Yoon, Carlos D. Bustamante, An-drew G. Clark, Adam Boyko, Jeremiah Degenhardt, Simon Gravel, Ryan N.Gutenkunst, Mark Kaganovich, Alon Keinan, Phil Lacroute, Xin Ma, AndyReynolds, Laura Clarke, Paul Flicek, Fiona Cunningham, Javier Herrero,Stephen Keenen, Eugene Kulesha, Rasko Leinonen, William M. McLaren,Rajesh Radhakrishnan, Richard E. Smith, Vadim Zalunin, Xiangqun Zheng-Bradley, Jan O. Korbel, Adrian M. Stutz, Sean Humphray, Markus Bauer,R. Keira Cheetham, Tony Cox, Michael Eberle, Terena James, Scott Kahn,Lisa Murray, Aravinda Chakravarti, Kai Ye, De La Vega, M. Francisco, Yu-tao Fu, Fiona C. L. Hyland, Jonathan M. Manning, Stephen F. McLaughlin,
264

Heather E. Peckham, Onur Sakarya, Yongming a. Sun, Eric F. Tsung, Mark a.Batzer, Miriam K. Konkel, Jerilyn a. Walker, Ralf Sudbrak, Marcus W. Al-brecht, Vyacheslav S. Amstislavskiy, Ralf Herwig, Dimitri V. Parkhomchuk,Stephen T. Sherry, Richa Agarwala, Hoda M. Khouri, Aleksandr O. Morgulis,Justin E. Paschall, Lon D. Phan, Kirill E. Rotmistrovsky, Robert D. Sanders,Martin F. Shumway, Chunlin Xiao, Gil a. McVean, Adam Auton, Zamin Iqbal,Gerton Lunter, Jonathan L. Marchini, Loukas Moutsianas, Simon Myers, Afi-dalina Tumian, Brian Desany, James Knight, Roger Winer, David W. Craig,Steve M. Beckstrom-Sternberg, Alexis Christoforides, Ahmet a. Kurdoglu,John V. Pearson, Shripad a. Sinari, Waibhav D. Tembe, David Haussler,Angie S. Hinrichs, Sol J. Katzman, Andrew Kern, Robert M. Kuhn, MollyPrzeworski, Ryan D. Hernandez, Bryan Howie, Joanna L. Kelley, S. CordMelton, Goncalo R. Abecasis, Yun Li, Paul Anderson, Tom Blackwell, WeiChen, William O. Cookson, Jun Ding, Hyun Min Kang, Mark Lathrop, Lim-ing Liang, Miriam F. Moffatt, Paul Scheet, Carlo Sidore, Matthew Snyder,Xiaowei Zhan, Sebastian Zollner, Philip Awadalla, Ferran Casals, YoussefIdaghdour, John Keebler, Eric a. Stone, Martine Zilversmit, Lynn Jorde,Jinchuan Xing, Evan E. Eichler, Gozde Aksay, Can Alkan, Iman Hajira-souliha, Fereydoun Hormozdiari, Jeffrey M. Kidd, S. Cenk Sahinalp, Peter H.Sudmant, Elaine R. Mardis, Ken Chen, Asif Chinwalla, Li Ding, Daniel C.Koboldt, Mike D. McLellan, David Dooling, George Weinstock, John W. Wal-lis, Michael C. Wendl, Qunyuan Zhang, Richard M. Durbin, Cornelis a. Al-bers, Qasim Ayub, Senduran Balasubramaniam, Jeffrey C. Barrett, David M.Carter, Yuan Chen, Donald F. Conrad, Petr Danecek, Emmanouil T. Der-mitzakis, Min Hu, Ni Huang, Matt E. Hurles, Hanjun Jin, Luke Jostins,Thomas M. Keane, Si Quang Le, Sarah Lindsay, Quan Long, Daniel G.MacArthur, Stephen B. Montgomery, Leopold Parts, James Stalker, ChrisTyler-Smith, Klaudia Walter, Yujun Zhang, Mark B. Gerstein, Michael Sny-der, Alexej Abyzov, Suganthi Balasubramanian, Robert Bjornson, Jiang Du,Fabian Grubert, Lukas Habegger, Rajini Haraksingh, Justin Jee, Ekta Khu-rana, Hugo Y. K. Lam, Jing Leng, Xinmeng Jasmine Mu, Alexander E. Urban,Zhengdong Zhang, Yingrui Li, Ruibang Luo, Gabor T. Marth, Erik P. Garri-son, Deniz Kural, Aaron R. Quinlan, Chip Stewart, Michael P. Stromberg,Alistair N. Ward, Jiantao Wu, Charles Lee, Ryan E. Mills, Xinghua Shi,Steven a. McCarroll, Eric Banks, Mark a. DePristo, Robert E. Handsaker,Chris Hartl, Joshua M. Korn, Heng Li, James C. Nemesh, Jonathan Se-bat, Vladimir Makarov, Kenny Ye, Seungtai C. Yoon, Jeremiah Degenhardt,Mark Kaganovich, Laura Clarke, Richard E. Smith, Xiangqun Zheng-Bradley,Jan O. Korbel, Sean Humphray, R. Keira Cheetham, Michael Eberle, ScottKahn, Lisa Murray, Kai Ye, De La Vega, M. Francisco, Yutao Fu, Heather E.Peckham, Yongming a. Sun, Mark a. Batzer, Miriam K. Konkel, Jerilyn a.Walker, Chunlin Xiao, Zamin Iqbal, Brian Desany, Tom Blackwell, MatthewSnyder, Jinchuan Xing, Evan E. Eichler, Gozde Aksay, Can Alkan, Iman Ha-jirasouliha, Fereydoun Hormozdiari, Jeffrey M. Kidd, Ken Chen, Asif Chin-walla, Li Ding, Mike D. McLellan, John W. Wallis, Matt E. Hurles, Donald F.
265

Conrad, Klaudia Walter, Yujun Zhang, Mark B. Gerstein, Michael Snyder,Alexej Abyzov, Jiang Du, Fabian Grubert, Rajini Haraksingh, Justin Jee, EktaKhurana, Hugo Y. K. Lam, Jing Leng, Xinmeng Jasmine Mu, Alexander E.Urban, Zhengdong Zhang, Richard a. Gibbs, Matthew Bainbridge, DannyChallis, Cristian Coafra, Huyen Dinh, Christie Kovar, Sandy Lee, DonnaMuzny, Lynne Nazareth, Jeff Reid, Aniko Sabo, Fuli Yu, Jin Yu, Gabor T.Marth, Erik P. Garrison, Amit Indap, Wen Fung Leong, Aaron R. Quinlan,Chip Stewart, Alistair N. Ward, Jiantao Wu, Kristian Cibulskis, Tim J. Fen-nell, Stacey B. Gabriel, Kiran V. Garimella, Chris Hartl, Erica Shefler, Car-rie L. Sougnez, Jane Wilkinson, Andrew G. Clark, Simon Gravel, Fabian Gru-bert, Laura Clarke, Paul Flicek, Richard E. Smith, Xiangqun Zheng-Bradley,Stephen T. Sherry, Hoda M. Khouri, Justin E. Paschall, Martin F. Shumway,Chunlin Xiao, Gil a. McVean, Sol J. Katzman, Goncalo R. Abecasis, TomBlackwell, Elaine R. Mardis, David Dooling, Lucinda Fulton, Robert Fulton,Daniel C. Koboldt, Richard M. Durbin, Senduran Balasubramaniam, Alli-son Coffey, Thomas M. Keane, Daniel G. MacArthur, Aarno Palotie, CarolScott, James Stalker, Chris Tyler-Smith, Mark B. Gerstein, Suganthi Balasub-ramanian, Aravinda Chakravarti, Bartha M. Knoppers, Goncalo R. Abeca-sis, Carlos D. Bustamante, Neda Gharani, Richard a. Gibbs, Lynn Jorde,Jane S. Kaye, Alastair Kent, Taosha Li, Amy L. McGuire, Gil a. McVean,Pilar N. Ossorio, Charles N. Rotimi, Yeyang Su, Lorraine H. Toji, ChrisTyler-Smith, Lisa D. Brooks, Adam L. Felsenfeld, Jean E. McEwen, AssyaAbdallah, Christopher R. Juenger, Nicholas C. Clemm, Francis S. Collins,Audrey Duncanson, Eric D. Green, Mark S. Guyer, Jane L. Peterson, Alan J.Schafer, Goncalo R. Abecasis, David L. Altshuler, Adam Auton, Lisa D.Brooks, Richard M. Durbin, Richard a. Gibbs, Matt E. Hurles, and Gil a.McVean. A map of human genome variation from population-scale sequenc-ing. Nature, 473(7348):544–544, May 2011.
[142] EI George and RE McCulloch. Approaches for Bayesian variable selection.Statistica sinica, 7:339–373, 1997.
[143] Yongtao Guan and Matthew Stephens. Bayesian variable selection regres-sion for genome-wide association studies and other large-scale problems. TheAnnals of Applied Statistics, 5(3):1780–1815, September 2011.
[144] NG Polson, JG Scott, and Jesse Windle. Bayesian inference for logistic modelsusing Polya-Gamma latent variables. Journal of the American Statistical . . . ,pages 1–42, 2013.
[145] EI George and RE McCulloch. Variable Selection via gibbs sampling. Journalof the American . . . , 1993.
[146] Feng Liang, Rui Paulo, German Molina, Merlise a Clyde, and Jim O Berger.Mixtures of g Priors for Bayesian Variable Selection. Journal of the AmericanStatistical Association, 103(481):410–423, March 2008.
266
[147] Radford M Neal. Probabilistic Inference Using Markov Chain Monte CarloMethods. Technical Report, pages 1–144, 1998.
[148] Kevin P. Murphy. Machine Learning: A Probabilistic Perspective. MIT press,1991.
[149] Xiaojin Zhu, Zoubin Ghahramani, and John D Lafferty. Semi-supervised learn-ing using Gaussian fields and harmonic functions. International Conferenceon Machine Learning - ICML 2003, 20:912, 2003.
[150] David M Altshuler, Richard a Gibbs, Leena Peltonen, Emmanouil Dermitza-kis, Stephen F Schaffner, Fuli Yu, Penelope E Bonnen, Paul I W de Bakker,Panos Deloukas, Stacey B Gabriel, Rhian Gwilliam, Sarah Hunt, Michael In-ouye, Xiaoming Jia, Aarno Palotie, Melissa Parkin, Pamela Whittaker, KyleChang, Alicia Hawes, Lora R Lewis, Yanru Ren, David Wheeler, Donna MarieMuzny, Chris Barnes, Katayoon Darvishi, Matthew Hurles, Joshua M Korn,Kati Kristiansson, Charles Lee, Steven a McCarrol, James Nemesh, AlonKeinan, Stephen B Montgomery, Samuela Pollack, Alkes L Price, Nicole So-ranzo, Claudia Gonzaga-Jauregui, Verneri Anttila, Wendy Brodeur, Mark JDaly, Stephen Leslie, Gil McVean, Loukas Moutsianas, Huy Nguyen, QingrunZhang, Mohammed J R Ghori, Ralph McGinnis, William McLaren, Fumi-hiko Takeuchi, Sharon R Grossman, Ilya Shlyakhter, Elizabeth B Hostetter,Pardis C Sabeti, Clement a Adebamowo, Morris W Foster, Deborah R Gor-don, Julio Licinio, Maria Cristina Manca, Patricia a Marshall, Ichiro Mat-suda, Duncan Ngare, Vivian Ota Wang, Deepa Reddy, Charles N Rotimi,Charmaine D Royal, Richard R Sharp, Changqing Zeng, Lisa D Brooks, andJean E McEwen. Integrating common and rare genetic variation in diversehuman populations. Nature, 467(7311):52–8, September 2010.
[151] Andrey a Shabalin. Matrix eQTL: ultra fast eQTL analysis via large matrixoperations. Bioinformatics (Oxford, England), 28(10):1353–8, May 2012.
[152] B Efron and T Hastie. LEAST ANGLE REGRESSION. The Annals ofstatistics, 32(2):407–499, 2004.
[153] Bryan Howie, Christian Fuchsberger, Matthew Stephens, Jonathan Marchini,and Goncalo R Abecasis. Fast and accurate genotype imputation in genome-wide association studies through pre-phasing. Nature genetics, 44(8):955–959,2012.
[154] Jason Ernst and Manolis Kellis. ChromHMM: automating chromatin-statediscovery and characterization. Nature methods, 9(3):215–6, March 2012.
[155] Elin Grundberg, Kerrin S Small, Asa K Hedman, Alexandra C Nica, Al-fonso Buil, Sarah Keildson, Jordana T Bell, Tsun-Po Yang, Eshwar Meduri,Amy Barrett, James Nisbett, Magdalena Sekowska, Alicja Wilk, So-YounShin, Daniel Glass, Mary Travers, Josine L Min, Sue Ring, Karen Ho, Gud-mar Thorleifsson, Augustine Kong, Unnur Thorsteindottir, Chrysanthi Ainali,
267

Antigone S Dimas, Neelam Hassanali, Catherine Ingle, David Knowles, MariaKrestyaninova, Christopher E Lowe, Paola Di Meglio, Stephen B Mont-gomery, Leopold Parts, Simon Potter, Gabriela Surdulescu, Loukia Tsaprouni,Sophia Tsoka, Veronique Bataille, Richard Durbin, Frank O Nestle, StephenO’Rahilly, Nicole Soranzo, Cecilia M Lindgren, Krina T Zondervan, Kourosh RAhmadi, Eric E Schadt, Kari Stefansson, George Davey Smith, Mark I Mc-Carthy, Panos Deloukas, Emmanouil T Dermitzakis, and Tim D Spector. Map-ping cis- and trans-regulatory effects across multiple tissues in twins. NatureGenetics, 44(10):1084–1089, 2012.
[156] F. Hormozdiari, E. Kostem, E. Y. Kang, B. Pasaniuc, and E. Eskin. Identi-fying Causal Variants at Loci with Multiple Signals of Association. Genetics,198(October):genetics.114.167908–, 2014.
[157] Shane Neph, Jeff Vierstra, Andrew B Stergachis, Alex P Reynolds, Eric Hau-gen, Benjamin Vernot, Robert E Thurman, Sam John, Richard Sandstrom,Audra K Johnson, Matthew T Maurano, Richard Humbert, Eric Rynes, HaoWang, Shinny Vong, Kristen Lee, Daniel Bates, Morgan Diegel, VaughnRoach, Douglas Dunn, Jun Neri, Anthony Schafer, R Scott Hansen, TanyaKutyavin, Erika Giste, Molly Weaver, Theresa Canfield, Peter Sabo, MiaohuaZhang, Gayathri Balasundaram, Rachel Byron, Michael J MacCoss, Joshua MAkey, M a Bender, Mark Groudine, Rajinder Kaul, and John a Stamatoy-annopoulos. An expansive human regulatory lexicon encoded in transcriptionfactor footprints. Nature, 489(7414):83–90, September 2012.
[158] Geet Duggal, Hao Wang, and Carl Kingsford. Higher-order chromatin domainslink eQTLs with the expression of far-away genes. Nucleic Acids Research,42(1):87–96, 2014.
[159] Graham McVicker, Bryce van de Geijn, Jacob F Degner, Carolyn E Cain,Nicholas E Banovich, Anil Raj, Noah Lewellen, Marsha Myrthil, Yoav Gilad,and Jonathan K Pritchard. Identification of genetic variants that affect histonemodifications in human cells. Science (New York, N.Y.), 342(6159):747–9,November 2013.
[160] V Matys, O V Kel-Margoulis, E Fricke, I Liebich, S Land, a Barre-Dirrie,I Reuter, D Chekmenev, M Krull, K Hornischer, N Voss, P Stegmaier,B Lewicki-Potapov, H Saxel, a E Kel, and E Wingender. TRANSFAC and itsmodule TRANSCompel: transcriptional gene regulation in eukaryotes. Nu-cleic acids research, 34(7):D108–D110, 2006.
[161] Sridhar Hannenhalli and Klaus H Kaestner. The evolution of Fox genes andtheir role in development and disease. Nature reviews. Genetics, 10(April):233–240, 2009.
[162] Yuzhen Zhang, Nibedita Rath, Sridhar Hannenhalli, Zhishan Wang, ThomasCappola, Shioko Kimura, Elena Atochina-Vasserman, Min Min Lu, Michael F
268
Beers, and Edward E Morrisey. GATA and Nkx factors synergistically reg-ulate tissue-specific gene expression and development in vivo. Development(Cambridge, England), 134:189–198, 2007.
[163] Mary E. Putt, Sridhar Hannenhalli, Yun Lu, Philip Haines, Hareesh R. Chan-drupatla, Edward E. Morrisey, Kenneth B. Margulies, and Thomas P. Cap-pola. Evidence for coregulation of myocardial gene expression by MEF2 andNFAT in human heart failure. Circulation: Cardiovascular Genetics, 2:212–219, 2009.
[164] Rafael A Irizarry, Bridget Hobbs, Francois Collin, Yasmin D Beazer-Barclay,Kristen J Antonellis, Uwe Scherf, and Terence P Speed. Exploration, normal-ization, and summaries of high density oligonucleotide array probe level data.Biostatistics, 4(2):249–264, 2003.
[165] W Evan Johnson, Cheng Li, and Ariel Rabinovic. Adjusting batch effectsin microarray expression data using empirical bayes methods. Biostatistics,8(1):118–127, 2007.
[166] Oliver Stegle, Leopold Parts, Matias Piipari, John Winn, and Richard Durbin.Using probabilistic estimation of expression residuals (peer) to obtain in-creased power and interpretability of gene expression analyses. Nature proto-cols, 7(3):500–507, 2012.
[167] Andrew E Teschendorff, Joanna Zhuang, and Martin Widschwendter. Inde-pendent surrogate variable analysis to deconvolve confounding factors in large-scale microarray profiling studies. Bioinformatics, 27(11):1496–1505, 2011.
[168] Volker Matys, Olga V Kel-Margoulis, Ellen Fricke, Ines Liebich, Sigrid Land,A Barre-Dirrie, Ingmar Reuter, D Chekmenev, Mathias Krull, Klaus Hor-nischer, et al. Transfac R© and its module transcompel R©: transcriptional generegulation in eukaryotes. Nucleic acids research, 34(suppl 1):D108–D110, 2006.
[169] Sridhar Hannenhalli and Samuel Levy. Promoter prediction in the humangenome. Bioinformatics, 17(suppl 1):S90–S96, 2001.
[170] David T Miyamoto, Yu Zheng, Ben S Wittner, Richard J Lee, Huili Zhu,Katherine T Broderick, Rushil Desai, Douglas B Fox, Brian W Brannigan,Julie Trautwein, Kshitij S Arora, Niyati Desai, Douglas M Dahl, Lecia VSequist, Matthew R Smith, Ravi Kapur, Chin-Lee Wu, Toshi Shioda, Srid-har Ramaswamy, David T Ting, Mehmet Toner, Shyamala Maheswaran, andDaniel A Haber. RNA-Seq of single prostate CTCs implicates noncanonicalWnt signaling in antiandrogen resistance. Science, 349(6254):1351–1356, sep2015.
[171] Andrea Bertotti, Eniko Papp, Jillian Phallen, Carolyn A Hruban, CollinTokheim, Noushin Niknafs, Monica Nesselbush, Karli Lytle, Francesco Sassi,
269
Francesca Cottino, Giorgia Migliardi, Eugenia R Zanella, Dario Ribero, Na-dia Russolillo, Alfredo Mellano, Andrea Muratore, Gianluca Paraluppi, MauroSalizzoni, Silvia Marsoni, Michael Kragh, Johan Lantto, Andrea Cassingena,Qing Kay Li, Rachel Karchin, Robert Scharpf, Andrea Sartore-bianchi, Salva-tore Siena, and Luis A Diaz Jr. Then genomic landscape of response to EGFRblockade in colorectal cancer. 2015.
[172] Chong Sun, Liqin Wang, Sidong Huang, Guus J J E Heynen, Anirudh Pra-hallad, Caroline Robert, John Haanen, Christian Blank, Jelle Wesseling, Ste-fan M Willems, Davide Zecchin, Sebastijan Hobor, Prashanth K Bajpe, CorLieftink, Christina Mateus, Stephan Vagner, Wipawadee Grernrum, IngridHofland, Andreas Schlicker, Lodewyk F a Wessels, Roderick L Beijersbergen,Alberto Bardelli, Federica Di Nicolantonio, Alexander M M Eggermont, andRene Bernards. Reversible and adaptive resistance to BRAF(V600E) inhibi-tion in melanoma. Nature, 508(7494):118–122, 2014.
[173] Willy Hugo, Hubing Shi, Lu Sun, Marco Piva, Chunying Song, Xiangju Kong,Gatien Moriceau, Aayoung Hong, KimberlyB. Dahlman, DouglasB. Johnson,JeffreyA. Sosman, Antoni Ribas, and RogerS. Lo. Non-genomic and ImmuneEvolution of Melanoma Acquiring MAPKi Resistance. Cell, 162(6):1271–1285,2015.
[174] Reading List. C L Se m i n a r i n Ba y e si a n N on p a ra m e t ri c s. pages12–14, 2007.
[175] Hark Kyun Kim, Il Ju Choi, Chan Gyoo Kim, Hee Sung Kim, Akira Oshima,Aleksandra Michalowski, and Jeffrey E. Green. A gene expression signature ofacquired chemoresistance to cisplatin and fluorouracil combination chemother-apy in gastric cancer patients. PLoS ONE, 6(2), 2011.
[176] C. Hatzis, L. Pusztai, V. Valero, D. J. Booser, L. Esserman, a. Lluch, T. Vi-daurre, F. Holmes, E. Souchon, H. Wang, M. Martin, J. Cotrina, H. Gomez,R. Hubbard, J. I. Chacon, J. Ferrer-Lozano, R. Dyer, M. Buxton, Y. Gong,Y. Wu, N. Ibrahim, E. Andreopoulou, N. T. Ueno, K. Hunt, W. Yang,a. Nazario, a. DeMichele, J. O’Shaughnessy, G. N. Hortobagyi, and W. F.Symmans. A Genomic Predictor of Response and Survival Following Taxane-Anthracycline Chemotherapy for Invasive Breast Cancer. JAMA: The Journalof the American Medical Association, 305(18):1873–1881, 2011.
[177] Elmar Stickeler, Dietmar Pils, Maximilian Klar, Marzenna Orlowsk-Volk,Axel Zur Hausen, Markus Jager, Dirk Watermann, Gerald Gitsch, RobertZeillinger, and Clemens B. Tempfer. Basal-like molecular subtype and HER4up-regulation and response to neoadjuvant chemotherapy in breast cancer.Oncology Reports, 26(4):1037–1045, 2011.
[178] L Gonzalez-Malerva, J Park, L H Zou, Y H Hu, Z Moradpour, J Pearlberg,J Sawyer, H Stevens, E Harlow, and J LaBaer. High-throughput ectopic
270

expression screen for tamoxifen resistance identifies an atypical kinase thatblocks autophagy. Proceedings of the National Academy of Sciences of theUnited States of America, 108(5):2058–2063, 2011.
[179] A M Patch, E L Christie, D Etemadmoghadam, D W Garsed, J George,S Fereday, K Nones, P Cowin, K Alsop, P J Bailey, K S Kassahn, F Newell,M C Quinn, S Kazakoff, K Quek, C Wilhelm-Benartzi, E Curry, H S Leong,Study Australian Ovarian Cancer, A Hamilton, L Mileshkin, G Au-Yeung,C Kennedy, J Hung, Y E Chiew, P Harnett, M Friedlander, M Quinn, J Py-man, S Cordner, P O’Brien, J Leditschke, G Young, K Strachan, P Waring,W Azar, C Mitchell, N Traficante, J Hendley, H Thorne, M Shackleton, D KMiller, G M Arnau, R W Tothill, T P Holloway, T Semple, I Harliwong,C Nourse, E Nourbakhsh, S Manning, S Idrisoglu, T J Bruxner, A N Christ,B Poudel, O Holmes, M Anderson, C Leonard, A Lonie, N Hall, S Wood,D F Taylor, Q Xu, J L Fink, N Waddell, R Drapkin, E Stronach, H Gabra,R Brown, A Jewell, S H Nagaraj, E Markham, P J Wilson, J Ellul, O Mc-Nally, M A Doyle, R Vedururu, C Stewart, E Lengyel, J V Pearson, N Waddell,A DeFazio, S M Grimmond, and D D Bowtell. Corrigendum: Whole-genomecharacterization of chemoresistant ovarian cancer. Nature, 2015.
[180] M Costanzo, A Baryshnikova, J Bellay, Y Kim, E D Spear, C S Sevier, H MDing, J L Y Koh, K Toufighi, S Mostafavi, J Prinz, R P S Onge, B VanderSluis,T Makhnevych, F J Vizeacoumar, S Alizadeh, S Bahr, R L Brost, Y Q Chen,M Cokol, R Deshpande, Z J Li, Z Y Lin, W D Liang, M Marback, J Paw,B J S Luis, E Shuteriqi, A H Y Tong, N van Dyk, I M Wallace, J A Whitney,M T Weirauch, G Q Zhong, H W Zhu, W A Houry, M Brudno, S Ragibizadeh,B Papp, C Pal, F P Roth, G Giaever, C Nislow, O G Troyanskaya, H Bussey,G D Bader, A C Gingras, Q D Morris, P M Kim, C A Kaiser, C L Myers,B J Andrews, and C Boone. The Genetic Landscape of a Cell. Science,327(5964):425–431, 2010.
[181] William G. Kaelin. Genetic Interactions in Cancer Progression and Treatment.Nature Reviews Cancer, 5(9):689–98, 2005.
[182] E Szczurek and N Beerenwinkel. Modeling Mutual Exclusivity of CancerMutations. Plos Computational Biology, 10(3), 2014.
[183] R Kelley and T Ideker. Systematic interpretation of genetic interactions usingprotein networks. Nature Biotechnology, 23(5):561–566, 2005.
[184] S.W. James, Carolyn D Silflow, M.D. Thompson, L.P.W. Ranum, and P.A.Lefebvre. Extragenic suppression and synthetic lethality among Chlamy-domonas reinhardtii mutants resistant to anti-microtubule drugs. Genetics,122(3):567, 1989.
[185] Michael L Nonet and Richard A Young. Intragenic and extragenic suppressorsof mutations in the heptapeptide repeat domain of Saccharomyces cerevisiaeRNA polymerase II. Genetics, 123(4):715–24, dec 1989.
271
[186] Adilson E Motter, Natali Gulbahce, Eivind Almaas, and Albert-LaszloBarabasi. Predicting synthetic rescues in metabolic networks. Molecular sys-tems biology, 4(168):168, 2008.
[187] Amal Aly and Shridar Ganesan. Review BRCA 1 , PARP , and 53 BP 1 :conditional synthetic lethality and synthetic viability. Journal of MolecularCell Biology, (3):66–74, 2011.
[188] Sebastian M B Nijman. Synthetic lethality: General principles, utility anddetection using genetic screens in human cells. FEBS Letters, 585(1):1–6,2011.
[189] Bert Vogelstein, Nickolas Papadopoulos, Victor E Velculescu, Shibin Zhou,Luis a Diaz, and Kenneth W Kinzler. Cancer genome landscapes. Science(New York, N.Y.), 339(6127):1546–58, 2013.
[190] N Conde-Pueyo, A Munteanu, R V Sole, and C Rodriguez-Caso. Humansynthetic lethal inference as potential anti-cancer target gene detection. BmcSystems Biology, 3, 2009.
[191] Nigel J. O’Neil, Derek M. van Pel, and Philip Hieter. Synthetic lethalityand cancer: Cohesin and PARP at the replication fork. Trends in Genetics,29(5):290–297, 2013.
[192] O Folger, L Jerby, C Frezza, E Gottlieb, E Ruppin, and T Shlomi. Predictingselective drug targets in cancer through metabolic networks (vol 7, pg 501,2011). Molecular Systems Biology, 7, 2011.
[193] X W Lu, P R Kensche, M A Huynen, and R A Notebaart. Genome evolutionpredicts genetic interactions in protein complexes and reveals cancer drugtargets. Nature Communications, 4, 2013.
[194] C Frezza, P J Pollard, and E Gottlieb. Inborn and acquired metabolic defectsin cancer. Journal of Molecular Medicine-Jmm, 89(3):213–220, 2011.
[195] Gregory Prelich. Suppression mechanisms: themes from variations. Trends inGenetics, 15(7):261–266, 1999.
[196] D G Moerman, S Plurad, R H Waterston, and D L Baillie. Mutations in theunc-54 myosin heavy chain gene of Caenorhabditis elegans that alter contrac-tility but not muscle structure. Cell, 29(3):773–81, 1982.
[197] K Zhang and H Wang. [Cancer Genome Atlas Pan-cancer Analysis Project].Zhongguo Fei Ai Za Zhi, 18(4):219–223, 2015.
[198] Christina Curtis, Sohrab P. Shah, Suet-Feung Chin, Gulisa Turashvili, Os-car M. Rueda, Mark J. Dunning, Doug Speed, Andy G. Lynch, ShamithSamarajiwa, Yinyin Yuan, Stefan Graf, Gavin Ha, Gholamreza Haffari, AliBashashati, Roslin Russell, Steven McKinney, Carlos Caldas, Samuel Aparicio,
272

Christina Curtis, Sohrab P. Shah, Carlos Caldas, Samuel Aparicio, James D.Brenton, Ian Ellis, David Huntsman, Sarah Pinder, Arnie Purushotham, LeighMurphy, Carlos Caldas, Samuel Aparicio, Carlos Caldas, Helen Bardwell,Suet-Feung Chin, Christina Curtis, Zhihao Ding, Stefan Graf, Linda Jones,Bin Liu, Andy G. Lynch, Irene Papatheodorou, Stephen J. Sammut, GordonWishart, Samuel Aparicio, Steven Chia, Karen Gelmon, David Huntsman,Steven McKinney, Caroline Speers, Gulisa Turashvili, Peter Watson, Ian Ellis,Roger Blamey, Andrew Green, Douglas Macmillan, Emad Rakha, Arnie Pu-rushotham, Cheryl Gillett, Anita Grigoriadis, Sarah Pinder, Emanuele di Ri-naldis, Andy Tutt, Leigh Murphy, Michelle Parisien, Sandra Troup, CarlosCaldas, Suet-Feung Chin, Derek Chan, Claire Fielding, Ana-Teresa Maia,Sarah McGuire, Michelle Osborne, Sara M. Sayalero, Inmaculada Spiteri,James Hadfield, Samuel Aparicio, Gulisa Turashvili, Lynda Bell, Katie Chow,Nadia Gale, David Huntsman, Maria Kovalik, Ying Ng, Leah Prentice, Car-los Caldas, Simon Tavare, Christina Curtis, Mark J. Dunning, Stefan Graf,Andy G. Lynch, Oscar M. Rueda, Roslin Russell, Shamith Samarajiwa, DougSpeed, Florian Markowetz, Yinyin Yuan, James D. Brenton, Samuel Aparicio,Sohrab P. Shah, Ali Bashashati, Gavin Ha, Gholamreza Haffari, Steven McK-inney, Anita Langerø d, Andrew Green, Elena Provenzano, Gordon Wishart,Sarah Pinder, Peter Watson, Florian Markowetz, Leigh Murphy, Ian Ellis,Arnie Purushotham, Anne-Lise Bø rresen Dale, James D. Brenton, SimonTavare, Carlos Caldas, and Samuel Aparicio. The genomic and transcrip-tomic architecture of 2,000 breast tumours reveals novel subgroups. Nature,2012.
[199] International Agency for Research on Cancer. International Agency for Re-search on Cancer Iarc Monographs on the Evaluation of Carcinogenic RisksTo Humans. Iarc Monographs On The Evaluation Of Carcinogenic Risks ToHumans, 96:i–ix+1–390, 2002.
[200] Michael Kuhn, Monica Campillos, Ivica Letunic, Lars Juhl Jensen, and PeerBork. A side effect resource to capture phenotypic effects of drugs. Molecularsystems biology, 6:343, 2010.
[201] W. H. Goodson, L. Lowe, D. O. Carpenter, M. Gilbertson, A. ManafAli, A. Lopez de Cerain Salsamendi, A. Lasfar, A. Carnero, A. Azqueta,A. Amedei, A. K. Charles, A. R. Collins, A. Ward, A. C. Salzberg, A. Colacci,A.-K. Olsen, A. Berg, B. J. Barclay, B. P. Zhou, C. Blanco-Aparicio, C. J.Baglole, C. Dong, C. Mondello, C.-W. Hsu, C. C. Naus, C. Yedjou, C. S.Curran, D. W. Laird, D. C. Koch, D. J. Carlin, D. W. Felsher, D. Roy, D. G.Brown, E. Ratovitski, E. P. Ryan, E. Corsini, E. Rojas, E.-Y. Moon, E. La-coni, F. Marongiu, F. Al-Mulla, F. Chiaradonna, F. Darroudi, F. L. Martin,F. J. Van Schooten, G. S. Goldberg, G. Wagemaker, G. Nangami, G. M. Calaf,G. Williams, G. T. Wolf, G. Koppen, G. Brunborg, H. Kim Lyerly, H. Krish-nan, H. Ab Hamid, H. Yasaei, H. Sone, H. Kondoh, H. K. Salem, H.-Y. Hsu,
273

H. H. Park, I. Koturbash, I. R. Miousse, A. I. Scovassi, J. E. Klaunig, J. Von-dracek, J. Raju, J. Roman, J. P. Wise, J. R. Whitfield, J. Woodrick, J. A.Christopher, J. Ochieng, J. F. Martinez-Leal, J. Weisz, J. Kravchenko, J. Sun,K. R. Prudhomme, K. B. Narayanan, K. A. Cohen-Solal, K. Moorwood,L. Gonzalez, L. Soucek, L. Jian, L. S. D’Abronzo, L.-T. Lin, L. Li, L. Gulliver,L. J. McCawley, L. Memeo, L. Vermeulen, L. Leyns, L. Zhang, M. Valverde,M. Khatami, M. F. Romano, M. Chapellier, M. A. Williams, M. Wade, M. H.Manjili, M. Lleonart, M. Xia, M. J. Gonzalez, M. V. Karamouzis, M. Kirsch-Volders, M. Vaccari, N. B. Kuemmerle, N. Singh, N. Cruickshanks, N. Kle-instreuer, N. van Larebeke, N. Ahmed, O. Ogunkua, P. K. Krishnakumar,P. Vadgama, P. A. Marignani, P. M. Ghosh, P. Ostrosky-Wegman, P. Thomp-son, P. Dent, P. Heneberg, P. Darbre, P. Sing Leung, P. Nangia-Makker,Q. Cheng, R. B. Robey, R. Al-Temaimi, R. Roy, R. Andrade-Vieira, R. K.Sinha, R. Mehta, R. Vento, R. Di Fiore, R. Ponce-Cusi, R. Dornetshuber-Fleiss, R. Nahta, R. C. Castellino, R. Palorini, R. Abd Hamid, S. A. S.Langie, S. Eltom, S. A. Brooks, S. Ryeom, S. S. Wise, S. N. Bay, S. A. Harris,S. Papagerakis, S. Romano, S. Pavanello, S. Eriksson, S. Forte, S. C. Casey,S. Luanpitpong, T.-J. Lee, T. Otsuki, T. Chen, T. Massfelder, T. Sander-son, T. Guarnieri, T. Hultman, V. Dormoy, V. Odero-Marah, V. Sabbisetti,V. Maguer-Satta, W. K. Rathmell, W. Engstrom, W. K. Decker, W. H. Bisson,Y. Rojanasakul, Y. Luqmani, Z. Chen, and Z. Hu. Assessing the carcinogenicpotential of low-dose exposures to chemical mixtures in the environment: thechallenge ahead. Carcinogenesis, 36(Suppl 1):S254–S296, 2015.
[202] Elisabeth Corcelle, Marielle Nebout, Soumeya Bekri, Nils Gauthier, Paul Hof-man, Philippe Poujeol, Patrick Fenichel, and Baharia Mograbi. Disruption ofautophagy at the maturation step by the carcinogen lindane is associated withthe sustained mitogen-activated protein kinase/extracellular signal-regulatedkinase activity. Cancer Research, 66(13):6861–6870, 2006.
[203] Jer-Yen Yang, Cong S Zong, Weiya Xia, Hirohito Yamaguchi, Qingqing Ding,Xiaoming Xie, Jing-Yu Lang, Chien-Chen Lai, Chun-Ju Chang, Wei-ChienHuang, Hsin Huang, Hsu-Ping Kuo, Dung-Fang Lee, Long-Yuan Li, Huang-Chun Lien, Xiaoyun Cheng, King-Jen Chang, Chwan-Deng Hsiao, Fuu-JenTsai, Chang-Hai Tsai, Aysegul a Sahin, William J Muller, Gordon B Mills,Dihua Yu, Gabriel N Hortobagyi, and Mien-Chie Hung. ERK promotes tu-morigenesis by inhibiting FOXO3a via MDM2-mediated degradation. Naturecell biology, 10(2):138–148, 2008.
[204] S Ries, C Biederer, D Woods, O Shifman, S Shirasawa, T Sasazuki, M McMa-hon, M Oren, and F McCormick. Opposing effects of Ras on p53: transcrip-tional activation of mdm2 and induction of p19ARF. Cell, 103(2):321–330,2000.
274

[205] Amy J. Burke, Francis J. Sullivan, Francis J. Giles, and Sharon a. Glynn. Theyin and yang of nitric oxide in cancer progression. Carcinogenesis, 34(3):503–512, 2013.
[206] Ramiro Iglesias-Bartolome, Daniel Martin, and J. Silvio Gutkind. Exploitingthe head and neck cancer oncogenome: Widespread PI3K-mTOR pathwayalterations and novel molecular targets. Cancer Discovery, 3(July):722–725,2013.
[207] Panomwat Amornphimoltham, Vyomesh Patel, Kantima Leelahavanichkul,Robert T Abraham, and J Silvio Gutkind. A retroinhibition approach revealsa tumor cell-autonomous response to rapamycin in head and neck cancer.Cancer Research, 68(4):1144–1153, 2008.
[208] E. Eisenberg and E.Y. Levanon. Human housekeeping genes are compact.TRENDS in Genetics, 19(7):362–365, 2003.
[209] Leroy Hood and Stephen H Friend. Predictive, personalized, preventive, par-ticipatory (P4) cancer medicine. Nature reviews. Clinical oncology, 8(3):184–187, 2011.
[210] V Law, C Knox, Y Djoumbou, T Jewison, A C Guo, Y F Liu, A Maciejewski,D Arndt, M Wilson, V Neveu, A Tang, G Gabriel, C Ly, S Adamjee, Z TDame, B S Han, Y Zhou, and D S Wishart. DrugBank 4.0: shedding new lighton drug metabolism. Nucleic Acids Research, 42(D1):D1091–D1097, 2014.
[211] M M Gottesman, T Fojo, and S E Bates. Multidrug resistance in cancer: roleof ATP-dependent transporters. Nat Rev Cancer, 2(1):48–58, 2002.
[212] Allon Wagner, Noa Cohen, Thomas Kelder, Uri Amit, Elad Liebman, David MSteinberg, Marijana Radonjic, and Eytan Ruppin. Drugs that reverse diseasetranscriptomic signatures are more effective in a mouse model of dyslipidemia.Molecular systems biology, 11(1):791, 2015.
[213] Prerna Malaney, Santo V Nicosia, and Vrushank Dave. One mouse, one pa-tient paradigm: new avatars of personalized cancer therapy. Cancer letters,344(1):1–12, 2014.
[214] Adrian FM Smith and Gareth O Roberts. Bayesian computation via the gibbssampler and related markov chain monte carlo methods. Journal of the RoyalStatistical Society. Series B (Methodological), pages 3–23, 1993.
[215] William Valdar, Jeremy Sabourin, Andrew Nobel, and Christopher C Holmes.Reprioritizing genetic associations in hit regions using lasso-based resamplemodel averaging. Genetic epidemiology, 36(5):451–462, 2012.
[216] Verena Zuber, A Pedro Duarte Silva, and Korbinian Strimmer. A novel algo-rithm for simultaneous snp selection in high-dimensional genome-wide associ-ation studies. BMC bioinformatics, 13(1):284, 2012.
275

[217] Martin Kircher, Daniela M Witten, Preti Jain, Brian J O’Roak, Gregory MCooper, and Jay Shendure. A general framework for estimating the relativepathogenicity of human genetic variants. Nature genetics, 46(3):310–315, 2014.
[218] Gleb Kichaev, Wen-Yun Yang, Sara Lindstrom, Farhad Hormozdiari, EleazarEskin, Alkes L Price, Peter Kraft, and Bogdan Pasaniuc. Integrating func-tional data to prioritize causal variants in statistical fine-mapping studies.PLoS genetics, 10(10):e1004722, 2014.
[219] Joseph K. Pickrell. Joint analysis of functional genomic data and genome-wideassociation studies of 18 human traits. American Journal of Human Genetics,94(4):559–573, 2014.
[220] Jack J Dongarra, James R Bunch, Cleve B Moler, and Gilbert W Stewart.LINPACK users’ guide, volume 8. Siam, 1979.
[221] Bradley Efron and Robert Tibshirani. An introduction to the bootstrap. Num-ber 57. Chapman & Hall, New York, 1993.
[222] G Bindea, B Mlecnik, H Hackl, P Charoentong, M Tosolini, A Kirilovsky, W HFridman, F Pages, Z Trajanoski, and J Galon. ClueGO: a Cytoscape plug-in to decipher functionally grouped gene ontology and pathway annotationnetworks. Bioinformatics, 25(8):1091–1093, 2009.
[223] Damian Szklarczyk, Andrea Franceschini, Stefan Wyder, Kristoffer Forslund,Davide Heller, Jaime Huerta-Cepas, Milan Simonovic, Alexander Roth, Al-berto Santos, Kalliopi P Tsafou, Michael Kuhn, Peer Bork, Lars J Jensen,and Christian von Mering. STRING v10: protein-protein interaction net-works, integrated over the tree of life. Nucleic acids research, 43(Databaseissue):D447–52, 2015.
[224] National Toxicology Program (NTP). Report on Carcinogens. Technical re-port, 2014.
[225] J Zhang, J Baran, A Cros, J M Guberman, S Haider, J Hsu, Y Liang, E Rivkin,J Wang, B Whitty, M Wong-Erasmus, L Yao, and A Kasprzyk. InternationalCancer Genome Consortium Data Portal–a one-stop shop for cancer genomicsdata. Database (Oxford), 2011:bar026, 2011.
[226] P J Marie, E Hay, D Modrowski, L Revollo, G Mbalaviele, and R Civitelli.Cadherin-mediated cell-cell adhesion and signaling in the skeleton. CalcifTissue Int, 94(1):46–54, 2014.
[227] M Ciro, E Prosperini, M Quarto, U Grazini, J Walfridsson, F McBlane, P Nu-cifero, G Pacchiana, M Capra, J Christensen, and K Helin. ATAD2 Is a NovelCofactor for MYC, Overexpressed and Amplified in Aggressive Tumors. Can-cer Research, 69(21):8491–8498, 2009.
276

[228] J X Zou, Z J Duan, J J Wang, A Sokolov, J Z Xu, C Z Chen, J J Li, and H WChen. Kinesin Family Deregulation Coordinated by Bromodomain ProteinANCCA and Histone Methyltransferase MLL for Breast Cancer Cell Growth,Survival, and Tamoxifen Resistance. Molecular Cancer Research, 12(4):539–549, 2014.
[229] Kun Zhang and Bernhard Sch. Multi-Source Domain Adaptation : A CausalView. 2008.
[230] Anne Mette Buhl, Jesper Jurlander, Flemming S Jørgensen, Anne Marie Otte-sen, Jack B. Cowland, Lise Mette Gjerdrum, Brian V Hansen, and HenrikLeffers. Identification of a gene on chromosome 12q22 uniquely overexpressedin chronic lymphocytic leukemia. Blood, 107(7):2904–2911, 2006.
[231] Jun Suzuki, Daniel P Denning, Eiichi Imanishi, H Robert Horvitz, andShigekazu Nagata. Xk-related protein 8 and CED-8 promote phosphatidylser-ine exposure in apoptotic cells. Science (New York, N.Y.), 341(6144):403–6,2013.
[232] Juan Sandoval, Jesus Mendez-Gonzalez, Ernest Nadal, Guoan Chen, F. JavierCarmona, Sergi Sayols, Sebastian Moran, Holger Heyn, Miguel Vizoso, An-tonio Gomez, Montse Sanchez-Cespedes, Yassen Assenov, Fabian Muller,Christoph Bock, Miquel Taron, Josefina Mora, Lucia a. Muscarella, Triantafil-los Liloglou, Michael Davies, Marina Pollan, Maria J. Pajares, WenceslaoTorre, Luis M. Montuenga, Elisabeth Brambilla, John K. Field, Luca Roz,Marco Lo Iacono, Giorgio V. Scagliotti, Rafael Rosell, David G. Beer, andManel Esteller. A prognostic DNA methylation signature for stage I non-small-cell lung cancer. Journal of clinical oncology : official journal of theAmerican Society of Clinical Oncology, 31(32):4140–4147, 2013.
[233] M Chanrion, V Negre, H Fontaine, N Salvetat, F Bibeau, G Mac Grogan,L Mauriac, D Katsaros, F Molina, C Theillet, and J M Darbon. A geneexpression signature that can predict the recurrence of tamoxifen-treated pri-mary breast cancer. Clinical Cancer Research, 14(6):1744–1752, 2008.
[234] J A Trendel. The hurdle of antiandrogen drug resistance: drug design strate-gies. Expert Opinion on Drug Discovery, 8(12):1491–1501, 2013.
[235] E Yague, A Arance, L Kubitza, M O’Hare, P Jat, C M Ogilvie, I R Hart, C FHiggins, and S Raguz. Ability to acquire drug resistance arises early duringthe tumorigenesis process. Cancer Research, 67(3):1130–1137, 2007.
[236] Guangchuang Yu, Fei Li, Yide Qin, Xiaochen Bo, Yibo Wu, and ShengqiWang. GOSemSim: an R package for measuring semantic similarity amongGO terms and gene products. Bioinformatics (Oxford, England), 26(7):976–8,2010.
277

[237] Mu-Shui Dai, Shelya X Zeng, Yetao Jin, Xiao-Xin Sun, Larry David, and HuaLu. Ribosomal protein L23 activates p53 by inhibiting MDM2 function inresponse to ribosomal perturbation but not to translation inhibition. Molecularand cellular biology, 24(17):7654–7668, 2004.
[238] Michael Wanzel, Annika C Russ, Daniela Kleine-Kohlbrecher, EmanuelaColombo, Pier-Guiseppe Pelicci, and Martin Eilers. A ribosomal protein L23-nucleophosmin circuit coordinates Mizl function with cell growth. Nature cellbiology, 10(9):1051–61, 2008.
[239] A E Pegg. Regulation of ornithine decarboxylase. Journal of Biological Chem-istry, 281(21):14529–14532, 2006.
[240] Michael S. Lawrence, Petar Stojanov, Craig H. Mermel, James T. Robinson,Levi a. Garraway, Todd R. Golub, Matthew Meyerson, Stacey B. Gabriel,Eric S. Lander, and Gad Getz. Discovery and saturation analysis of cancergenes across 21 tumour types. Nature, 505(7484):495–501, 2014.
[241] Vivian G Cheung, Laura K Conlin, Teresa M Weber, Melissa Arcaro, Kuang-Yu Jen, Michael Morley, and Richard S Spielman. Natural variation in humangene expression assessed in lymphoblastoid cells. Nature genetics, 33(3):422–5,March 2003.
[242] J Wang, X X Zhou, J Zhu, Y Y Gu, W Y Zhao, J F Zou, and Z Guo. GO-function: deriving biologically relevant functions from statistically significantfunctions. Briefings in Bioinformatics, 13(2):216–227, 2012.
[243] Panomwat Amornphimoltham, Vyomesh Patel, Akrit Sodhi, Nikolaos G Niki-takis, John J Sauk, Edward A Sausville, Alfredo A Molinolo, and J SilvioGutkind. Mammalian Target of Rapamycin , a Molecular Target in Squa-mous Cell Carcinomas of the Head and Neck. 1(21):9953–9962, 2005.
278