SAD phasing with triiodide, softer X-rays and some help from radiation damage
7
electronic reprint Acta Crystallographica Section D Biological Crystallography ISSN 0907-4449 SAD phasing with triiodide, softer X-rays and some help from radiation damage Gwyndaf Evans, Maurizio Polentarutti, Kristina Djinovic Carugo and G´ erard Bricogne Copyright © International Union of Crystallography Author(s) of this paper may load this reprint on their own web site provided that this cover page is retained. Republication of this article or its storage in electronic databases or the like is not permitted without prior permission in writing from the IUCr. Acta Cryst. (2003). D59, 1429–1434 Evans et al. I-SAD with softer X-rays
-
Upload
independent -
Category
Documents
-
view
0 -
download
0
Transcript of SAD phasing with triiodide, softer X-rays and some help from radiation damage

electronic reprint
Acta Crystallographica Section D
BiologicalCrystallography
ISSN 0907-4449
SAD phasing with triiodide, softer X-rays and some help from radiationdamage
Gwyndaf Evans, Maurizio Polentarutti, Kristina Djinovic Carugo and GerardBricogne
Copyright © International Union of Crystallography
Author(s) of this paper may load this reprint on their own web site provided that this cover page is retained. Republication of this article or itsstorage in electronic databases or the like is not permitted without prior permission in writing from the IUCr.
Acta Cryst. (2003). D59, 1429–1434 Evans et al. � I-SAD with softer X-rays
Acta Cryst. (2003). D59, 1429±1434 Evans et al. � I-SAD with softer X-rays 1429
research papers
Acta Crystallographica Section D
BiologicalCrystallography
ISSN 0907-4449
SAD phasing with triiodide, softer X-rays and somehelp from radiation damage
Gwyndaf Evans,a Maurizio
Polentarutti,b Kristina Djinovic
Carugob and GeÂrard Bricognea*
aGlobal Phasing Ltd, Cambridge CB3 0AX,
England, and bStructural Biology Laboratory,
Sincrotrone Trieste in Area Science Park, S.S. 14
km 163.5, I-34012 Basovizza (TS), Italy
Correspondence e-mail:
# 2003 International Union of Crystallography
Printed in Denmark ± all rights reserved
SAD data on a triiodide derivative of porcine pancreatic
elastase have been recorded from a single sample using 2.0 AÊ
wavelength X-rays. The large anomalous signal of iodine at
this wavelength allowed the detection of heavy-atom sites and
subsequent structure determination using low-redundancy
data. Substantial radiation damage was observed during the
measurements and this prevented the merging together of all
data. However, a straightforward treatment of the radiation
effects on the heavy-atom model during parameter re®nement
resulted in additional phase information being gleaned from
the observed reduction in iodine occupancy factors, which in
turn produced a signi®cant improvement in the quality of the
electron-density map.
Received 7 March 2003
Accepted 5 June 2003
1. Introduction
In recent years, a number of groups have turned their atten-
tion to developing fast heavy-atom derivative preparation
methods for use either in-house or at synchrotrons. The aims
of these studies have been to provide crystallographers with a
greater variety of methods for preparing heavy-atom deriva-
tives and obtaining experimental phase information, and
thereby complement the current developments in high-
throughput structure determination (Dauter, 2002).
The developments have included short cryosoaking
methods with the halides Brÿ and Iÿ (Dauter et al., 2000), the
use of positively and negatively charged counter ions Gd3+,
Cs+, Iÿ and Clÿ (Nagem et al., 2001; Evans & Bricogne, 2002);
the use of triiodide, Iÿ3 (Evans & Bricogne, 2002); Xe deriva-
tization under pressure (see Sauer et al., 1997; Djinovic
Carugo et al., 1998; Panjikar & Tucker, 2002a, and references
therein); combinations of halides and Xe (Panjikar & Tucker,
2002b); and short soaks with traditional heavy-atom
compounds (Sun et al., 2002; Sun & Radaev, 2002). These
studies have been performed in-house with Cu K� radiation
or at synchrotron sources with wavelengths <1.6 AÊ .
The L absorption edges of a number of elements which are
interesting to macromolecular crystallographers, e.g. I, Xe and
Cs and some lanthanides, lie between 2.7 and 2.0 AÊ (4.60 and
6.2 keV). Within this range f 00 can reach as much as 14 e and
thus by recording data at longer wavelengths there is a
possible gain by a factor of two in signal compared with
measuring at 1.54 AÊ . This was indeed observed by Cianci et al.
(2001) who recorded data from a Xe derivative of lobster
apocrustacyanin A1 at a wavelength of 2.045 AÊ where
f 00(Xe) = 11.5 e. Data collection using softer1 X-rays has been
of particular use in phase-determination efforts using native S
anomalous signal (Micossi et al., 2002; Dauter, 2002) and is
1 We have adopted the term `softer' X-rays proposed by Cianci et al. (2001).
electronic reprint
research papers
1430 Evans et al. � I-SAD with softer X-rays Acta Cryst. (2003). D59, 1429±1434
indeed well on the way to becoming a routine source of
additional anomalous signal (Weiss et al., 2001).
In this paper, we investigate for the ®rst time the combi-
nation of the use of short-soak derivatization using triiodide
solutions and data collection with softer synchrotron X-rays
and attempt to take advantage of the signi®cant anomalous
signal offered by the increase in f 00 for iodine at these wave-
lengths..
2. Experimental methods
2.1. Experimental apparatus
Experiments were performed on beamline XRD1 at the
Elettra synchrotron source. The beamline uses a MAR
Research slit-box and rotation-axis assembly, and a 165 mm
MAR-CCD detector. The sample is cooled using a modi®ed
Oxford Cryosystems cryostream (K. Djinovic, personal
communication) which provides a constant ¯ow of dry He gas
at 100 K and simultaneously ¯oods the sample environment
which is enclosed and kept at a positive pressure of He
(Polentarutti & Djinovic Carugo, 2003). This provides a low-
absorption diffracted beam path between sample and detector
and reduces the effects of air scatter and air absorption at
longer wavelengths.
2.2. Sample preparation
Crystals of porcine pancreatic elastase (PPE) were
produced and a triiodide derivative was prepared as described
previously (Evans & Bricogne, 2002) by soaking a crystal for
4 min in a solution of 20 mM KI/I2, 1 mM Na2SO4, 10 mM
CH3COONa pH 5.0 and 25% glycerol. The crystal was
mounted directly from the cryosoak solution into the 100 K
He-gas stream. A test diffraction pattern showed that the
crystal diffracted to beyond 1.8 AÊ .
2.3. Data measurement and analysis
When measuring diffraction from a protein crystal of typical
size using long wavelengths, absorption effects can become
very signi®cant (Arndt, 1984). Indeed, data must be carefully
treated to correct for these effects (Weiss et al., 2001). With
this in mind, an effort was made to record diffraction data in
such a way that empirical absorption corrections could be well
determined. For this purpose, it is bene®cial to have
measurements of re¯ections which have passed through and
therefore sampled all possible absorption paths through the
crystal. Ideally, equivalent Bragg intensities should be
recorded multiple times, entering and leaving the sample
volume at all points on the absorption surface. In the rotation
method, this ideal situation can only be approximated with the
use of a multi-axis goniometer whereby the crystal can be
reoriented a number of times during the experiment to allow
the whole absorption surface of the crystal to be sampled and
later modelled by empirical means.
In the absence of a motor-controlled multi-axis goniometer,
the crystal was mounted on a twin-arc Huber goniometer head
which allowed �15� of motion around axes perpendicular to
the horizontal data-collection axis. A careful note was made of
the laboratory frame vectors describing the rotations of the
two arcs and this information was then given to the data-
integration package d*TREK (P¯ugrath, 1999) along with the
arc angle settings (�0.2�) read directly from the goniometer
head. This ensured that data sets recorded in different
orientations could be indexed using a common setting to
ensure a proper treatment of absorption.
The L edges of iodine are at 2.3898, 2.5553 and 2.7208 AÊ .
Neglecting XANES effects, which appear to produce no
signi®cant enhancement of f 00 (Konishi et al., 2001), the
maximum f 00 signal attainable in this energy regime is 13.5 e
(Cromer & Liberman, 1970) at the LI edge. One disadvantage
of measuring at long wavelengths is a reduction in data
resolution owing to the expansion of the diffraction pattern at
the detector surface. The beamline geometry means that with
� = 2.3898 AÊ the maximum resolution of data with the
detector set at 37 mm would be 2.2 AÊ . Minimum I±I distances
in polyhalides are �2.7 AÊ and individual I atoms would
probably have been resolvable with 2.22 AÊ data; however,
because of the strong diffraction properties of the sample and
the additional bene®ts of reduced absorption, it was decided
to measure data with � = 2.0 AÊ and tolerate a decrease in f 00
from 13.5 to 10.4 e. It is beyond the scope of this paper to
investigate the relative bene®ts of increased data resolution
over reduced anomalous signal.
The ®rst data set (DS1) was recorded with both arcs set to
ÿ15�. In this setting 200� of data were recorded using 0.5�
rotation widths and a 4 s exposure time. The arcs were then
reset to +15� and a further 200� of data (DS2) were measured
from the same sample using the same data-collection para-
meters. The main consideration in following this protocol was
to record data in two settings separated by as large an angle as
possible. Initial indexing of the diffraction pattern showed that
the b* axis was almost parallel to the spindle rotation axis in
the ®rst orientation. This would result in an absence of some
data owing to the blind region, but it was assumed that the
second orientation would allow any missing data to be
measured.
The integrated re¯ection data, together with complete
goniometric information from d*TREK, were converted into a
multi-record MTZ ®le (Collaborative Computational Project,
Number 4) using the program DTREK2SCALA.2 Image scale
and B factors, along with an empirical spherical harmonic
absorption correction, were determined and applied using
SCALA (Evans, 1997).
3. Results
The results from SCALA showed clear evidence of radiation
damage in the samples and of its steady increase over the
course of the experiment. The image B factor relative to the
®rst image had increased to over 15 AÊ 2 by the end of the
2 A derivative of the CCP4 program ABSURD modi®ed by GE to convertd*TREK re¯ection ®les and geometric information into MTZ format. To beincluded in CCP4 release 5.0.
electronic reprint
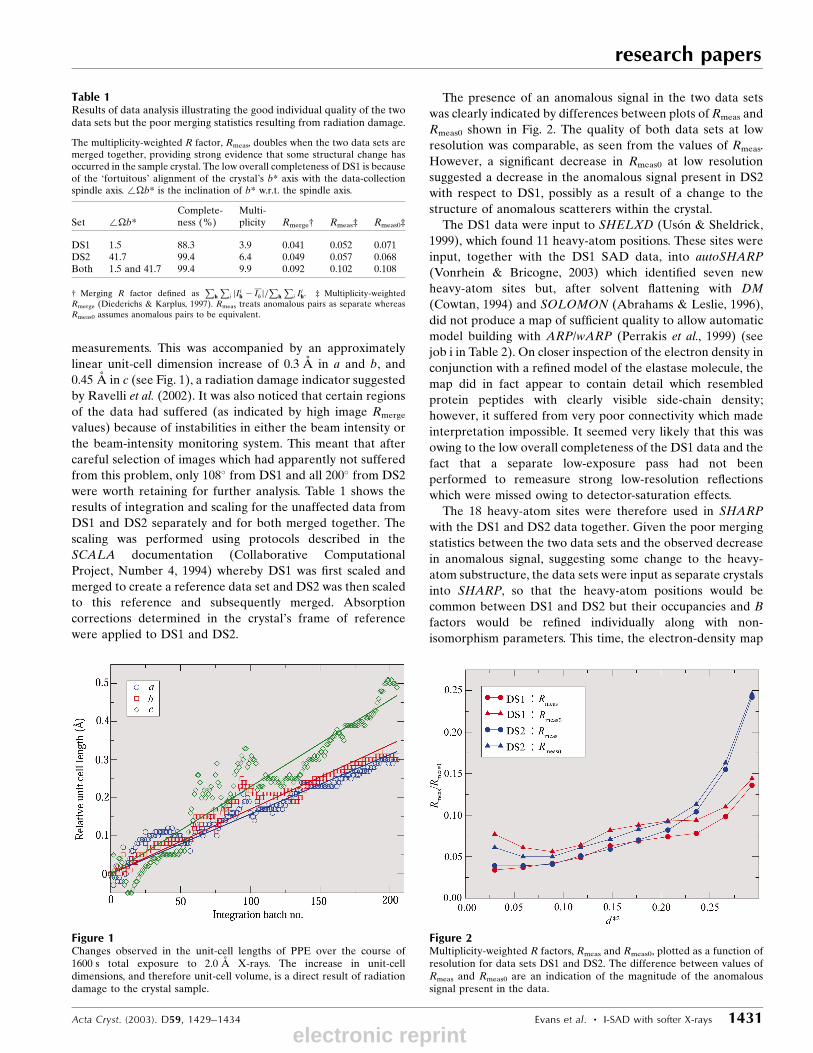
measurements. This was accompanied by an approximately
linear unit-cell dimension increase of 0.3 AÊ in a and b, and
0.45 AÊ in c (see Fig. 1), a radiation damage indicator suggested
by Ravelli et al. (2002). It was also noticed that certain regions
of the data had suffered (as indicated by high image Rmerge
values) because of instabilities in either the beam intensity or
the beam-intensity monitoring system. This meant that after
careful selection of images which had apparently not suffered
from this problem, only 108� from DS1 and all 200� from DS2
were worth retaining for further analysis. Table 1 shows the
results of integration and scaling for the unaffected data from
DS1 and DS2 separately and for both merged together. The
scaling was performed using protocols described in the
SCALA documentation (Collaborative Computational
Project, Number 4, 1994) whereby DS1 was ®rst scaled and
merged to create a reference data set and DS2 was then scaled
to this reference and subsequently merged. Absorption
corrections determined in the crystal's frame of reference
were applied to DS1 and DS2.
The presence of an anomalous signal in the two data sets
was clearly indicated by differences between plots of Rmeas and
Rmeas0 shown in Fig. 2. The quality of both data sets at low
resolution was comparable, as seen from the values of Rmeas.
However, a signi®cant decrease in Rmeas0 at low resolution
suggested a decrease in the anomalous signal present in DS2
with respect to DS1, possibly as a result of a change to the
structure of anomalous scatterers within the crystal.
The DS1 data were input to SHELXD (Uso n & Sheldrick,
1999), which found 11 heavy-atom positions. These sites were
input, together with the DS1 SAD data, into autoSHARP
(Vonrhein & Bricogne, 2003) which identi®ed seven new
heavy-atom sites but, after solvent ¯attening with DM
(Cowtan, 1994) and SOLOMON (Abrahams & Leslie, 1996),
did not produce a map of suf®cient quality to allow automatic
model building with ARP/wARP (Perrakis et al., 1999) (see
job i in Table 2). On closer inspection of the electron density in
conjunction with a re®ned model of the elastase molecule, the
map did in fact appear to contain detail which resembled
protein peptides with clearly visible side-chain density;
however, it suffered from very poor connectivity which made
interpretation impossible. It seemed very likely that this was
owing to the low overall completeness of the DS1 data and the
fact that a separate low-exposure pass had not been
performed to remeasure strong low-resolution re¯ections
which were missed owing to detector-saturation effects.
The 18 heavy-atom sites were therefore used in SHARP
with the DS1 and DS2 data together. Given the poor merging
statistics between the two data sets and the observed decrease
in anomalous signal, suggesting some change to the heavy-
atom substructure, the data sets were input as separate crystals
into SHARP, so that the heavy-atom positions would be
common between DS1 and DS2 but their occupancies and B
factors would be re®ned individually along with non-
isomorphism parameters. This time, the electron-density map
Acta Cryst. (2003). D59, 1429±1434 Evans et al. � I-SAD with softer X-rays 1431
research papers
Figure 1Changes observed in the unit-cell lengths of PPE over the course of1600 s total exposure to 2.0 AÊ X-rays. The increase in unit-celldimensions, and therefore unit-cell volume, is a direct result of radiationdamage to the crystal sample.
Table 1Results of data analysis illustrating the good individual quality of the twodata sets but the poor merging statistics resulting from radiation damage.
The multiplicity-weighted R factor, Rmeas, doubles when the two data sets aremerged together, providing strong evidence that some structural change hasoccurred in the sample crystal. The low overall completeness of DS1 is becauseof the `fortuitous' alignment of the crystal's b* axis with the data-collectionspindle axis. /b* is the inclination of b* w.r.t. the spindle axis.
Set /b*Complete-ness (%)
Multi-plicity Rmerge² Rmeas³ Rmeas0³
DS1 1.5 88.3 3.9 0.041 0.052 0.071DS2 41.7 99.4 6.4 0.049 0.057 0.068Both 1.5 and 41.7 99.4 9.9 0.092 0.102 0.108
² Merging R factor de®ned asP
h
Pi jIih ÿ Ihj=
Ph
Pi I
ih. ³ Multiplicity-weighted
Rmerge (Diederichs & Karplus, 1997). Rmeas treats anomalous pairs as separate whereasRmeas0 assumes anomalous pairs to be equivalent.
Figure 2Multiplicity-weighted R factors, Rmeas and Rmeas0, plotted as a function ofresolution for data sets DS1 and DS2. The difference between values ofRmeas and Rmeas0 are an indication of the magnitude of the anomaloussignal present in the data.
electronic reprint
research papers
1432 Evans et al. � I-SAD with softer X-rays Acta Cryst. (2003). D59, 1429±1434
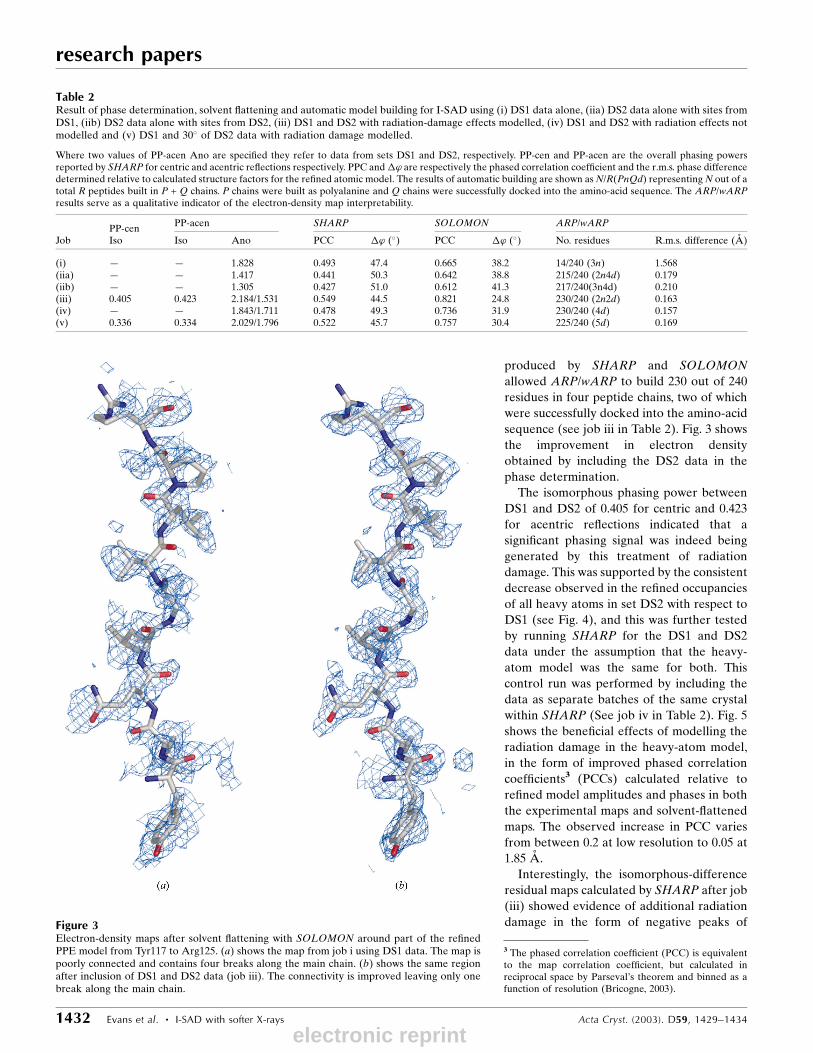
produced by SHARP and SOLOMON
allowed ARP/wARP to build 230 out of 240
residues in four peptide chains, two of which
were successfully docked into the amino-acid
sequence (see job iii in Table 2). Fig. 3 shows
the improvement in electron density
obtained by including the DS2 data in the
phase determination.
The isomorphous phasing power between
DS1 and DS2 of 0.405 for centric and 0.423
for acentric re¯ections indicated that a
signi®cant phasing signal was indeed being
generated by this treatment of radiation
damage. This was supported by the consistent
decrease observed in the re®ned occupancies
of all heavy atoms in set DS2 with respect to
DS1 (see Fig. 4), and this was further tested
by running SHARP for the DS1 and DS2
data under the assumption that the heavy-
atom model was the same for both. This
control run was performed by including the
data as separate batches of the same crystal
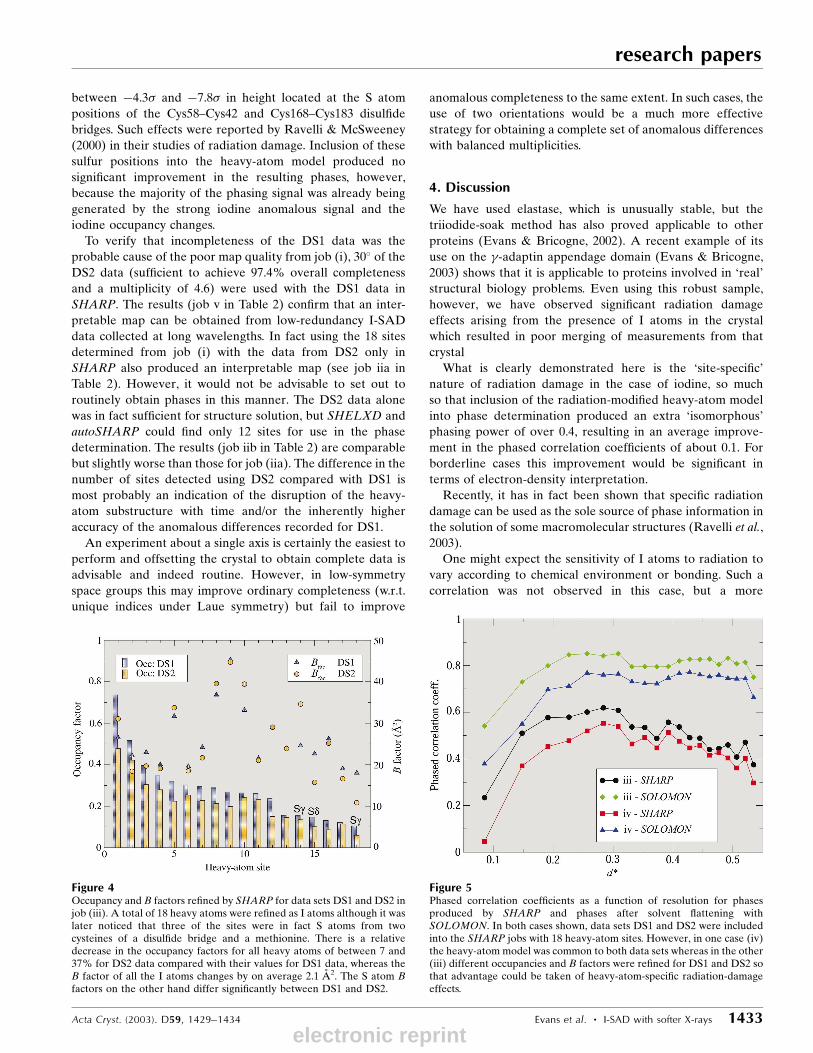
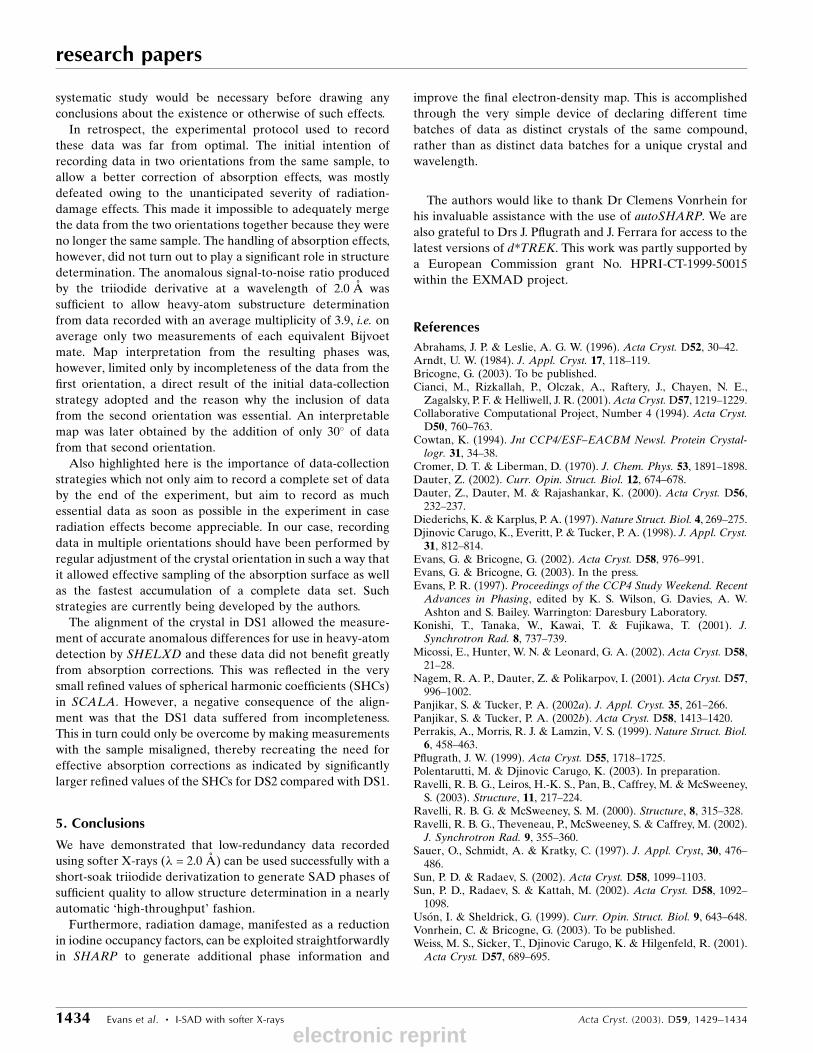
within SHARP (See job iv in Table 2). Fig. 5
shows the bene®cial effects of modelling the
radiation damage in the heavy-atom model,
in the form of improved phased correlation
coef®cients3 (PCCs) calculated relative to
re®ned model amplitudes and phases in both
the experimental maps and solvent-¯attened
maps. The observed increase in PCC varies
from between 0.2 at low resolution to 0.05 at
1.85 AÊ .
Interestingly, the isomorphous-difference
residual maps calculated by SHARP after job
(iii) showed evidence of additional radiation
damage in the form of negative peaks ofFigure 3Electron-density maps after solvent ¯attening with SOLOMON around part of the re®nedPPE model from Tyr117 to Arg125. (a) shows the map from job i using DS1 data. The map ispoorly connected and contains four breaks along the main chain. (b) shows the same regionafter inclusion of DS1 and DS2 data (job iii). The connectivity is improved leaving only onebreak along the main chain.
Table 2Result of phase determination, solvent ¯attening and automatic model building for I-SAD using (i) DS1 data alone, (iia) DS2 data alone with sites fromDS1, (iib) DS2 data alone with sites from DS2, (iii) DS1 and DS2 with radiation-damage effects modelled, (iv) DS1 and DS2 with radiation effects notmodelled and (v) DS1 and 30� of DS2 data with radiation damage modelled.
Where two values of PP-acen Ano are speci®ed they refer to data from sets DS1 and DS2, respectively. PP-cen and PP-acen are the overall phasing powersreported by SHARP for centric and acentric re¯ections respectively. PPC and�' are respectively the phased correlation coef®cient and the r.m.s. phase differencedetermined relative to calculated structure factors for the re®ned atomic model. The results of automatic building are shown as N/R(PnQd) representing N out of atotal R peptides built in P + Q chains. P chains were built as polyalanine and Q chains were successfully docked into the amino-acid sequence. The ARP/wARPresults serve as a qualitative indicator of the electron-density map interpretability.
PP-cenPP-acen SHARP SOLOMON ARP/wARP
Job Iso Iso Ano PCC �' (�) PCC �' (�) No. residues R.m.s. difference (AÊ )
(i) Ð Ð 1.828 0.493 47.4 0.665 38.2 14/240 (3n) 1.568(iia) Ð Ð 1.417 0.441 50.3 0.642 38.8 215/240 (2n4d) 0.179(iib) Ð Ð 1.305 0.427 51.0 0.612 41.3 217/240(3n4d) 0.210(iii) 0.405 0.423 2.184/1.531 0.549 44.5 0.821 24.8 230/240 (2n2d) 0.163(iv) Ð Ð 1.843/1.711 0.478 49.3 0.736 31.9 230/240 (4d) 0.157(v) 0.336 0.334 2.029/1.796 0.522 45.7 0.757 30.4 225/240 (5d) 0.169
3 The phased correlation coef®cient (PCC) is equivalentto the map correlation coef®cient, but calculated inreciprocal space by Parseval's theorem and binned as afunction of resolution (Bricogne, 2003).
electronic reprint
between ÿ4.3� and ÿ7.8� in height located at the S atom
positions of the Cys58±Cys42 and Cys168±Cys183 disul®de
bridges. Such effects were reported by Ravelli & McSweeney
(2000) in their studies of radiation damage. Inclusion of these
sulfur positions into the heavy-atom model produced no
signi®cant improvement in the resulting phases, however,
because the majority of the phasing signal was already being
generated by the strong iodine anomalous signal and the
iodine occupancy changes.
To verify that incompleteness of the DS1 data was the
probable cause of the poor map quality from job (i), 30� of the
DS2 data (suf®cient to achieve 97.4% overall completeness
and a multiplicity of 4.6) were used with the DS1 data in
SHARP. The results (job v in Table 2) con®rm that an inter-
pretable map can be obtained from low-redundancy I-SAD
data collected at long wavelengths. In fact using the 18 sites
determined from job (i) with the data from DS2 only in
SHARP also produced an interpretable map (see job iia in
Table 2). However, it would not be advisable to set out to
routinely obtain phases in this manner. The DS2 data alone
was in fact suf®cient for structure solution, but SHELXD and
autoSHARP could ®nd only 12 sites for use in the phase
determination. The results (job iib in Table 2) are comparable
but slightly worse than those for job (iia). The difference in the
number of sites detected using DS2 compared with DS1 is
most probably an indication of the disruption of the heavy-
atom substructure with time and/or the inherently higher
accuracy of the anomalous differences recorded for DS1.
An experiment about a single axis is certainly the easiest to
perform and offsetting the crystal to obtain complete data is
advisable and indeed routine. However, in low-symmetry
space groups this may improve ordinary completeness (w.r.t.
unique indices under Laue symmetry) but fail to improve
anomalous completeness to the same extent. In such cases, the
use of two orientations would be a much more effective
strategy for obtaining a complete set of anomalous differences
with balanced multiplicities.
4. Discussion
We have used elastase, which is unusually stable, but the
triiodide-soak method has also proved applicable to other
proteins (Evans & Bricogne, 2002). A recent example of its
use on the -adaptin appendage domain (Evans & Bricogne,
2003) shows that it is applicable to proteins involved in `real'
structural biology problems. Even using this robust sample,
however, we have observed signi®cant radiation damage
effects arising from the presence of I atoms in the crystal
which resulted in poor merging of measurements from that
crystal
What is clearly demonstrated here is the `site-speci®c'
nature of radiation damage in the case of iodine, so much
so that inclusion of the radiation-modi®ed heavy-atom model
into phase determination produced an extra `isomorphous'
phasing power of over 0.4, resulting in an average improve-
ment in the phased correlation coef®cients of about 0.1. For
borderline cases this improvement would be signi®cant in
terms of electron-density interpretation.
Recently, it has in fact been shown that speci®c radiation
damage can be used as the sole source of phase information in
the solution of some macromolecular structures (Ravelli et al.,
2003).
One might expect the sensitivity of I atoms to radiation to
vary according to chemical environment or bonding. Such a
correlation was not observed in this case, but a more
Acta Cryst. (2003). D59, 1429±1434 Evans et al. � I-SAD with softer X-rays 1433
research papers
Figure 5Phased correlation coef®cients as a function of resolution for phasesproduced by SHARP and phases after solvent ¯attening withSOLOMON. In both cases shown, data sets DS1 and DS2 were includedinto the SHARP jobs with 18 heavy-atom sites. However, in one case (iv)the heavy-atom model was common to both data sets whereas in the other(iii) different occupancies and B factors were re®ned for DS1 and DS2 sothat advantage could be taken of heavy-atom-speci®c radiation-damageeffects.
Figure 4Occupancy and B factors re®ned by SHARP for data sets DS1 and DS2 injob (iii). A total of 18 heavy atoms were re®ned as I atoms although it waslater noticed that three of the sites were in fact S atoms from twocysteines of a disul®de bridge and a methionine. There is a relativedecrease in the occupancy factors for all heavy atoms of between 7 and37% for DS2 data compared with their values for DS1 data, whereas theB factor of all the I atoms changes by on average 2.1 AÊ 2. The S atom Bfactors on the other hand differ signi®cantly between DS1 and DS2.
electronic reprint
research papers
1434 Evans et al. � I-SAD with softer X-rays Acta Cryst. (2003). D59, 1429±1434
systematic study would be necessary before drawing any
conclusions about the existence or otherwise of such effects.
In retrospect, the experimental protocol used to record
these data was far from optimal. The initial intention of
recording data in two orientations from the same sample, to
allow a better correction of absorption effects, was mostly
defeated owing to the unanticipated severity of radiation-
damage effects. This made it impossible to adequately merge
the data from the two orientations together because they were
no longer the same sample. The handling of absorption effects,
however, did not turn out to play a signi®cant role in structure
determination. The anomalous signal-to-noise ratio produced
by the triiodide derivative at a wavelength of 2.0 AÊ was
suf®cient to allow heavy-atom substructure determination
from data recorded with an average multiplicity of 3.9, i.e. on
average only two measurements of each equivalent Bijvoet
mate. Map interpretation from the resulting phases was,
however, limited only by incompleteness of the data from the
®rst orientation, a direct result of the initial data-collection
strategy adopted and the reason why the inclusion of data
from the second orientation was essential. An interpretable
map was later obtained by the addition of only 30� of data
from that second orientation.
Also highlighted here is the importance of data-collection
strategies which not only aim to record a complete set of data
by the end of the experiment, but aim to record as much
essential data as soon as possible in the experiment in case
radiation effects become appreciable. In our case, recording
data in multiple orientations should have been performed by
regular adjustment of the crystal orientation in such a way that
it allowed effective sampling of the absorption surface as well
as the fastest accumulation of a complete data set. Such
strategies are currently being developed by the authors.
The alignment of the crystal in DS1 allowed the measure-
ment of accurate anomalous differences for use in heavy-atom
detection by SHELXD and these data did not bene®t greatly
from absorption corrections. This was re¯ected in the very
small re®ned values of spherical harmonic coef®cients (SHCs)
in SCALA. However, a negative consequence of the align-
ment was that the DS1 data suffered from incompleteness.
This in turn could only be overcome by making measurements
with the sample misaligned, thereby recreating the need for
effective absorption corrections as indicated by signi®cantly
larger re®ned values of the SHCs for DS2 compared with DS1.
5. Conclusions
We have demonstrated that low-redundancy data recorded
using softer X-rays (� = 2.0 AÊ ) can be used successfully with a
short-soak triiodide derivatization to generate SAD phases of
suf®cient quality to allow structure determination in a nearly
automatic `high-throughput' fashion.
Furthermore, radiation damage, manifested as a reduction
in iodine occupancy factors, can be exploited straightforwardly
in SHARP to generate additional phase information and
improve the ®nal electron-density map. This is accomplished
through the very simple device of declaring different time
batches of data as distinct crystals of the same compound,
rather than as distinct data batches for a unique crystal and
wavelength.
The authors would like to thank Dr Clemens Vonrhein for
his invaluable assistance with the use of autoSHARP. We are
also grateful to Drs J. P¯ugrath and J. Ferrara for access to the
latest versions of d*TREK. This work was partly supported by
a European Commission grant No. HPRI-CT-1999-50015
within the EXMAD project.
References
Abrahams, J. P. & Leslie, A. G. W. (1996). Acta Cryst. D52, 30±42.Arndt, U. W. (1984). J. Appl. Cryst. 17, 118±119.Bricogne, G. (2003). To be published.Cianci, M., Rizkallah, P., Olczak, A., Raftery, J., Chayen, N. E.,
Zagalsky, P. F. & Helliwell, J. R. (2001). Acta Cryst. D57, 1219±1229.Collaborative Computational Project, Number 4 (1994). Acta Cryst.
D50, 760±763.Cowtan, K. (1994). Jnt CCP4/ESF±EACBM Newsl. Protein Crystal-logr. 31, 34±38.
Cromer, D. T. & Liberman, D. (1970). J. Chem. Phys. 53, 1891±1898.Dauter, Z. (2002). Curr. Opin. Struct. Biol. 12, 674±678.Dauter, Z., Dauter, M. & Rajashankar, K. (2000). Acta Cryst. D56,
232±237.Diederichs, K. & Karplus, P. A. (1997). Nature Struct. Biol. 4, 269±275.Djinovic Carugo, K., Everitt, P. & Tucker, P. A. (1998). J. Appl. Cryst.31, 812±814.
Evans, G. & Bricogne, G. (2002). Acta Cryst. D58, 976±991.Evans, G. & Bricogne, G. (2003). In the press.Evans, P. R. (1997). Proceedings of the CCP4 Study Weekend. RecentAdvances in Phasing, edited by K. S. Wilson, G. Davies, A. W.Ashton and S. Bailey. Warrington: Daresbury Laboratory.
Konishi, T., Tanaka, W., Kawai, T. & Fujikawa, T. (2001). J.Synchrotron Rad. 8, 737±739.
Micossi, E., Hunter, W. N. & Leonard, G. A. (2002). Acta Cryst. D58,21±28.
Nagem, R. A. P., Dauter, Z. & Polikarpov, I. (2001). Acta Cryst. D57,996±1002.
Panjikar, S. & Tucker, P. A. (2002a). J. Appl. Cryst. 35, 261±266.Panjikar, S. & Tucker, P. A. (2002b). Acta Cryst. D58, 1413±1420.Perrakis, A., Morris, R. J. & Lamzin, V. S. (1999). Nature Struct. Biol.6, 458±463.
P¯ugrath, J. W. (1999). Acta Cryst. D55, 1718±1725.Polentarutti, M. & Djinovic Carugo, K. (2003). In preparation.Ravelli, R. B. G., Leiros, H.-K. S., Pan, B., Caffrey, M. & McSweeney,
S. (2003). Structure, 11, 217±224.Ravelli, R. B. G. & McSweeney, S. M. (2000). Structure, 8, 315±328.Ravelli, R. B. G., Theveneau, P., McSweeney, S. & Caffrey, M. (2002).J. Synchrotron Rad. 9, 355±360.
Sauer, O., Schmidt, A. & Kratky, C. (1997). J. Appl. Cryst, 30, 476±486.
Sun, P. D. & Radaev, S. (2002). Acta Cryst. D58, 1099±1103.Sun, P. D., Radaev, S. & Kattah, M. (2002). Acta Cryst. D58, 1092±
1098.Uso n, I. & Sheldrick, G. (1999). Curr. Opin. Struct. Biol. 9, 643±648.Vonrhein, C. & Bricogne, G. (2003). To be published.Weiss, M. S., Sicker, T., Djinovic Carugo, K. & Hilgenfeld, R. (2001).Acta Cryst. D57, 689±695.
electronic reprint