s40645-020-00359-7.pdf - Progress in Earth and Planetary ...
12
METHODOLOGY Open Access Visualization of the morphology and mode of occurrence of Cenomanian rudists within a drillcore by X-ray CT scanning and 3D modeling Motoyoshi Yamanaka 1* , Shin-ichi Sano 2 , Hamad Bu Alrougha Al Zaabi 3 , Hiroshi Fujioka 4 and Yasufumi Iryu 4 Abstract Rudists are a group of bizarrely shaped marine bivalves that lived in the Tethys Ocean from the Late Jurassic to the latest Cretaceous. They are morphologically variable, including snail-like, cup-like, and horn-like shapes. In the Middle East, Cretaceous carbonates with rudists and rudist fragments are well exposed in many outcrops as well as oil and gas fields. For rudist-bearing carbonates in the subsurface, knowledge of rudist morphology and mode of occurrence must be derived from observation of drillcores; however, understanding the three-dimensional (3D) geometry of rudists from observation of core surfaces is difficult. In paleontological studies of rudists, X-ray computerized tomography (CT) scans have been carried out to reconstruct the inside texture of rudist shells for the purpose of taxonomic research. In contrast, in the oil and gas industry, application of X-ray CT scanning technology is generally focused on direct measurement of reservoir properties. Studies of rudist fossils within drillcores by means of X-ray CT have not yet been conducted. We have developed a new protocol to observe core interiors using X-ray CT. We obtained high-resolution 3D images of rudists in a drillcore by means of surface rendering, volume rendering, and 3D printing. X-ray CT and 3D modeling is a novel method for non-destructive analyses of the morphology and mode of occurrence of fossils within drillcores. Keywords: X-ray CT scan imaging, Surface rendering, Volume rendering, 3D modeling, Drillcore, Rudist, Abu Dhabi, Cretaceous 1 Introduction The Late Cretaceous was the only time interval in Earth history when bivalves were one of the major components of carbonate platforms. The bivalves were rudists, a group of bizarrely shaped marine bivalves living in the Tethys Ocean from the Late Jurassic to the latest Cretaceous. They are morphologically variable, including snail-like, cup-like, and horn-like shapes. Cretaceous rudist-bearing carbonates are proven exploration targets for hydrocarbons and form the reservoirs of a number of giant fields, including the Bu Hasa, Fateh, Fahud, Idd El Shargi, Rumaila, Shaybah, Shah, and Umm Al-Dalkh fields (Neo 1987, 1996; Scott 1990; Alsharhan and Nairn 1993; Alsharhan 1995; Al-Zaabi et al. 2010; van Buchem et al. 2011; Yamamoto et al. 2016; Kojima et al. 2017; Yamanaka et al. 2018, 2019a). In the case of the Cenomanian–lower Turonian Mishrif Formation, which is an important reservoir rock throughout the Middle East, high porosity and permeability are restricted to the rudist-bearing facies, which therefore constitute the main oil-producing reser- voir zones in this formation. (Alsharhan 1995). The mode of occurrence (presence/absence, distribution, whether au- tochthonous or allochthonous, and sedimentological roles) of rudists in carbonate platforms is of scientific © The Author(s). 2020 Open Access This article is licensed under a Creative Commons Attribution 4.0 International License, which permits use, sharing, adaptation, distribution and reproduction in any medium or format, as long as you give appropriate credit to the original author(s) and the source, provide a link to the Creative Commons licence, and indicate if changes were made. The images or other third party material in this article are included in the article's Creative Commons licence, unless indicated otherwise in a credit line to the material. If material is not included in the article's Creative Commons licence and your intended use is not permitted by statutory regulation or exceeds the permitted use, you will need to obtain permission directly from the copyright holder. To view a copy of this licence, visit http://creativecommons.org/licenses/by/4.0/. * Correspondence: [email protected] 1 JODCO Exploration Limited, 10th Floor, Tower 3, Etihad Towers, P.O. Box 2659, Abu Dhabi, UAE Full list of author information is available at the end of the article Progress in Earth and Planetary Science Yamanaka et al. Progress in Earth and Planetary Science (2020) 7:49 https://doi.org/10.1186/s40645-020-00359-7
-
Upload
khangminh22 -
Category
Documents
-
view
3 -
download
0
Transcript of s40645-020-00359-7.pdf - Progress in Earth and Planetary ...
METHODOLOGY Open Access
Visualization of the morphology and modeof occurrence of Cenomanian rudists withina drillcore by X-ray CT scanning and 3DmodelingMotoyoshi Yamanaka1*, Shin-ichi Sano2, Hamad Bu Alrougha Al Zaabi3, Hiroshi Fujioka4 and Yasufumi Iryu4
Abstract
Rudists are a group of bizarrely shaped marine bivalves that lived in the Tethys Ocean from the Late Jurassic to thelatest Cretaceous. They are morphologically variable, including snail-like, cup-like, and horn-like shapes. In theMiddle East, Cretaceous carbonates with rudists and rudist fragments are well exposed in many outcrops as well asoil and gas fields. For rudist-bearing carbonates in the subsurface, knowledge of rudist morphology and mode ofoccurrence must be derived from observation of drillcores; however, understanding the three-dimensional (3D)geometry of rudists from observation of core surfaces is difficult. In paleontological studies of rudists, X-raycomputerized tomography (CT) scans have been carried out to reconstruct the inside texture of rudist shells for thepurpose of taxonomic research. In contrast, in the oil and gas industry, application of X-ray CT scanning technologyis generally focused on direct measurement of reservoir properties. Studies of rudist fossils within drillcores bymeans of X-ray CT have not yet been conducted. We have developed a new protocol to observe core interiorsusing X-ray CT. We obtained high-resolution 3D images of rudists in a drillcore by means of surface rendering,volume rendering, and 3D printing. X-ray CT and 3D modeling is a novel method for non-destructive analyses ofthe morphology and mode of occurrence of fossils within drillcores.
Keywords: X-ray CT scan imaging, Surface rendering, Volume rendering, 3D modeling, Drillcore, Rudist, Abu Dhabi,Cretaceous
1 IntroductionThe Late Cretaceous was the only time interval in Earthhistory when bivalves were one of the major componentsof carbonate platforms. The bivalves were rudists, agroup of bizarrely shaped marine bivalves living in theTethys Ocean from the Late Jurassic to the latestCretaceous. They are morphologically variable, includingsnail-like, cup-like, and horn-like shapes. Cretaceousrudist-bearing carbonates are proven exploration targetsfor hydrocarbons and form the reservoirs of a number of
giant fields, including the Bu Hasa, Fateh, Fahud, Idd ElShargi, Rumaila, Shaybah, Shah, and Umm Al-Dalkh fields(Neo 1987, 1996; Scott 1990; Alsharhan and Nairn 1993;Alsharhan 1995; Al-Zaabi et al. 2010; van Buchem et al.2011; Yamamoto et al. 2016; Kojima et al. 2017; Yamanakaet al. 2018, 2019a). In the case of the Cenomanian–lowerTuronian Mishrif Formation, which is an importantreservoir rock throughout the Middle East, high porosityand permeability are restricted to the rudist-bearing facies,which therefore constitute the main oil-producing reser-voir zones in this formation. (Alsharhan 1995). The modeof occurrence (presence/absence, distribution, whether au-tochthonous or allochthonous, and sedimentologicalroles) of rudists in carbonate platforms is of scientific
© The Author(s). 2020 Open Access This article is licensed under a Creative Commons Attribution 4.0 International License,which permits use, sharing, adaptation, distribution and reproduction in any medium or format, as long as you giveappropriate credit to the original author(s) and the source, provide a link to the Creative Commons licence, and indicate ifchanges were made. The images or other third party material in this article are included in the article's Creative Commonslicence, unless indicated otherwise in a credit line to the material. If material is not included in the article's Creative Commonslicence and your intended use is not permitted by statutory regulation or exceeds the permitted use, you will need to obtainpermission directly from the copyright holder. To view a copy of this licence, visit http://creativecommons.org/licenses/by/4.0/.
* Correspondence: [email protected] Exploration Limited, 10th Floor, Tower 3, Etihad Towers, P.O. Box2659, Abu Dhabi, UAEFull list of author information is available at the end of the article
Progress in Earth and Planetary Science
Yamanaka et al. Progress in Earth and Planetary Science (2020) 7:49 https://doi.org/10.1186/s40645-020-00359-7
importance. The depositional environment of rudist-bearing carbonates and their porosity and permeability areclosely related and, thus, important for oil/gas exploration(e.g., Yamanaka et al. 2019b). This is the case for UpperCretaceous platform carbonates in the southern ArabianPeninsula including at Abu Dhabi (Burchette and Britton1985; Burchette 1993; Skelton et al. 1995; Cestari and Sar-torio 1995; Özer et al. 2009).Cretaceous rudist-bearing carbonates are widespread
in the Arabian Peninsula in outcrop and in the subsur-face. Observations regarding rudist morphology andtaxonomy have been mainly derived from outcropstudies (Skelton and Masse 2000; Schumann 2000), andthis knowledge is the starting point for use of rudists forsedimentological and paleontological analyses of drill-cores. However, in drillcore analyses, observations arelimited to the two-dimensional (2D) core surface and itis therefore very difficult to obtain three-dimensional(3D) information on the sedimentary structure andmorphology of macrofossils, including rudists.To increase the amount of information that can be
obtained from core observation, a 3D imaging techniqueusing X-ray computerized tomography (CT) has beenintroduced to the fields of sedimentology (Seard et al.2010) and paleontology (e.g., Sutton et al. 2014; Racicot2016), and successful outcomes have already beenachieved.Hughes et al. (2004) attempted to analyze the outer
and inner morphology of rudists within drillcores usingX-ray CT images. However, it was very difficult to delin-eate the morphology of carbonate shells embedded in acarbonate matrix with CT values achievable at that time,and only a dim outline of the outer morphology was dis-tinguished. Subsequent studies (Molineux et al. 2007;Molineux et al. 2010) of rudist morphology using X-rayCT images dealt with silicified material isolated from acarbonate matrix. Recently, the spatial resolution of X-ray CT images has been greatly increased and newimage-processing techniques such as surface renderingand volume rendering have been invented and markedlyimproved. In addition, 3D printers can create preciseplastic figures of objects at low cost. In this article, theseadvanced techniques are applied to rudist-bearing coresamples, yielding clearly delineated 3D images. Here, wedemonstrate the first use of 3D images of rudists foridentification of rudisit taxa and characterization of fossiloccurrences. These advanced techniques will be applic-able to many types of fossil and, thus, are expected tosignificantly facilitate progress in paleontology.
2 Methods/experimental2.1 MaterialIn this study, one core was collected from Cenomaniancarbonates in the “A field” located offshore of the United
Arab Emirates (UAE) and 20 km northeast of Abu DhabiCity (Fig. 1). A reservoir horizon in the A field consistsof Cenomanian shallow water, rudist-bearing carbonates(Neo 1987; Al-Zaabi et al. 2010; Yamamoto et al. 2016).Five radiolitid genera (Sphaerulites, Praeradiolites,Eoradiolites, Sauvagesia, and Durania) and one ichthyo-sarcolitid genus (Ichthyosarcolites) comprise most of therudist occurrences in the Cenomanian carbonateplatform outcrops of northern Oman (Philip et al. 1995).Similar rudist assemblages are known from Cenomanianstrata in Sinai, Egypt (Saber et al. 2009; Zakhera 2011).Broken and intact rudist shells belonging to these taxaare common to abundant and are locally associated withautochthonous specimens in the high-energy platformmargin/barrier facies of the Cenomanian–lower Turo-nian sequences on the eastern Arabian Plate (e.g.,Alsharhan and Nairn 1993; van Buchem et al. 2011).Therefore, radiolitid and ichthyosarcolitid rudists wereexpected to occur in the studied cores.A core drilled and recovered from shoal facies in this
field comprised grainstone–packstone–wackestone con-taining common gravel-sized rudists and fragments ofthose rudists. The studied material was a one-third splitof a seven-inch-diameter core (hereafter termed “thecore”; 8 cm long, 7 cm wide) of the packstone (Fig. 2a–e). Rudist fragments were randomly scattered on thecore surface.The studied material is stored in the Technical Re-
search Center of INPEX Corporation at Tokyo, Japan.
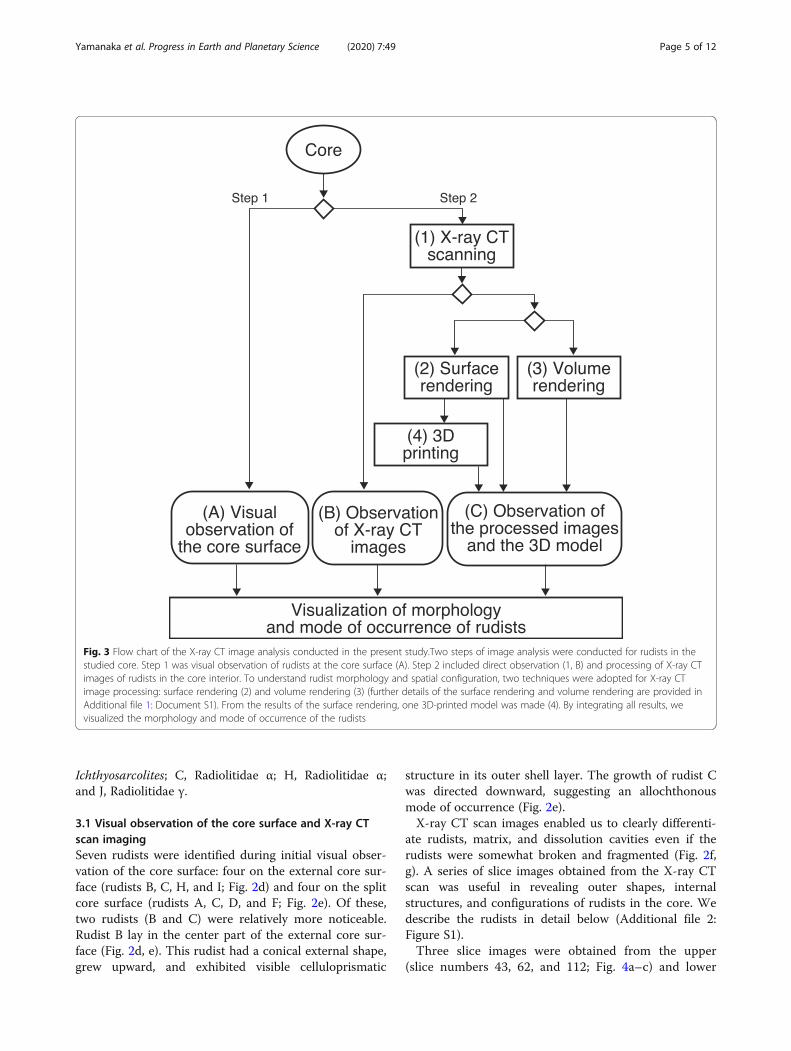
2.2 Work flowThe work flow followed in the present study is summa-rized in Fig. 3. X-ray CT scanning of the core wasundertaken after initial visual observation of the coresurface, followed by detailed visual study of fossilrudists on the core surface taking into account the X-ray CT scan results. We used a third-generation dual-source medical X-ray CT scanner (SIEMENS,SOMATOM Definition Flash, Munich, Germany) at theTechnological Research Center of the Japan Oil, Gasand Metals National Corporation, Chiba, Japan. Asingle-source X-ray was utilized with tube voltage opti-mized to 140 kV and a scanning interval of 0.5 mm.Approximately 160 slice images were obtained from thestudied core. A “CT value” represents the relative dens-ity of an object relative to water (zero) and air (− 1000)and is expressed in Hounsfield units. For example, CTvalues of hard tissues such as bones and teeth rangefrom 300 to > 1000. In typical X-ray CT images calcu-lated from CT values, darker colors represent soft tis-sues or porous areas such as pores, whereas lightercolors indicate hard tissues or dense (non-porous) areassuch as rock. As a result, gray-scale slice images can beobtained at a resolution of 0.2 mm pixel–1.
Yamanaka et al. Progress in Earth and Planetary Science (2020) 7:49 Page 2 of 12

We applied “surface rendering” and “volume render-ing” to X-ray CT scan data to visualize 3D structuresusing Molcer Plus software (White Rabbit Ltd., Tokyo,Japan). Surface rendering is a method for viewing thesurfaces of masses above a certain threshold of CT value.Volume rendering is a method for changing opacity tomake the interior contents visible. Surface rendering is adrawing of the “equality surface,” which is a closed sur-face that allows voxel data to be double-valued at a cer-tain threshold and corresponds to the topographic
contours of the material. Surface rendering is usuallycomposed of a collection of triangular polygons, whilevolume rendering displays all voxel values. We createdvolume-rendering images following three steps: at firsttime, determine any one direction, from this voxel col-umn, (1) display the highest value; (2) add a back-sidevoxel value to a front-side voxel value continuously in aline voxel and change the color (pseudo-color) andtransparency on the basis of the voxel values; and (3)prioritize where the voxel values change abruptly. One
Fig. 1 Location, schematic cross-section, and lithostratigraphy of the “A field”. a Location of the A field, indicated by a yellow star. b Stratigraphicoutline of the Upper Cretaceous succession in the Abu Dhabi to Dubai area (modified from Al-Zaabi et al. 2010 and Yamamoto et al. 2016). Thestratigraphic interval examined in this study is indicated (red square). A, rudist-bearing porous limestone facies comprising mainly rudist-bearingrudstone and floatstone with a matrix of grainstone–packstone–wackestone; B, organic-rich dark-gray mudstone–wackestone–mudstone, partiallystylolitized; C, siliciclastic sediments extensively filling the remaining accommodation space in the preceding intrashelf basin; D, platform faciescomprising argillaceous limestone in central and western Abu Dhabi; E, dark grayish-brown to black shale, locally interbedded with denselimestone. Note that the facies C, D, and E were not deposited in eastern Abu Dhabi, due to uplift of this area. c Schematic cross-section of the Afield (orange color denotes limestone-shoal facies, yellow upper-slope facies, green lower-slope facies, and blue basinal facies). Diagram modifiedfrom Neo (1996)
Yamanaka et al. Progress in Earth and Planetary Science (2020) 7:49 Page 3 of 12

3D-printed model was made to identify the growthhistory of a rudist based on the results of the surfacerendering (for more details regarding the surface andvolume rendering, see Additional file 1: Document S1).The rudist (rudist B; see below) had a thick outer shelllayer and was preserved in growth position near the cen-ter of the core sample. We created a transparent resinmodel with a 3D printer (Objet500 Connex3, Stratasys3D printer, Tokyo, Japan) at the Tokyo Metropolitan In-dustrial Technology Research Institute, Tokyo, tovisualize the internal structure of the core. We used atransparent resin, Veroclear (Stratasys Ltd., Eden Prairie,MN, USA). The outer and the inner shell layers wereproduced in different colors; magenta for the inner andcyan for the outer. The mold was polished using a
compound to remove the modeling marks. The resinmodel is stored in INPEX Corporation at Tokyo, Japan.
3 Results and discussionBy comparing the visual core surface observation,surface rendering, volume rendering, and 3D modeling,we discriminated four types of rudists: (1) Radiolitidae αwith a thick outer layer; (2) Radiolitidae β with a thinouter shell layer; (3) Radiolitidae γ, characterized by itslarge size; and (4) Ichthyosarcolites (Figs. 2, 4, and 5).Ten individual rudists assigned to the four types were
identified in the core, with the following succession fromthe bottom to the top: I, Ichthyosarcolites; A, Ichthyosar-colites; B, Radiolitidae α, showing its early growth stage;D, Radiolitidae β; E, Radiolitidae β; G, Radiolitidae β; F,
Fig. 2 Core photographs and X-ray CT images. a–e External appearance of the core. Note that rudists A–D, F, H. and I are indicated. a, d Sideview of the external core surface. b, e Side view of the split core surface. c Top view. f, g Vertical slice images of the core obtained by X-ray CT. fSide view. g Side view of the core at ~ 0.5 cm from the external surface. Horizontal slice images of the numbered horizons (43, 62, 112, 134, 139,and 153) are shown in Fig. 4. α, Radiolitidae α with a thick outer layer; β, Radiolitidae β with a thin outer shell layer; i, Ichthyosarcolites
Yamanaka et al. Progress in Earth and Planetary Science (2020) 7:49 Page 4 of 12
Ichthyosarcolites; C, Radiolitidae α; H, Radiolitidae α;and J, Radiolitidae γ.
3.1 Visual observation of the core surface and X-ray CTscan imagingSeven rudists were identified during initial visual obser-vation of the core surface: four on the external core sur-face (rudists B, C, H, and I; Fig. 2d) and four on the splitcore surface (rudists A, C, D, and F; Fig. 2e). Of these,two rudists (B and C) were relatively more noticeable.Rudist B lay in the center part of the external core sur-face (Fig. 2d, e). This rudist had a conical external shape,grew upward, and exhibited visible celluloprismatic
structure in its outer shell layer. The growth of rudist Cwas directed downward, suggesting an allochthonousmode of occurrence (Fig. 2e).X-ray CT scan images enabled us to clearly differenti-
ate rudists, matrix, and dissolution cavities even if therudists were somewhat broken and fragmented (Fig. 2f,g). A series of slice images obtained from the X-ray CTscan was useful in revealing outer shapes, internalstructures, and configurations of rudists in the core. Wedescribe the rudists in detail below (Additional file 2:Figure S1).Three slice images were obtained from the upper
(slice numbers 43, 62, and 112; Fig. 4a–c) and lower
Fig. 3 Flow chart of the X-ray CT image analysis conducted in the present study.Two steps of image analysis were conducted for rudists in thestudied core. Step 1 was visual observation of rudists at the core surface (A). Step 2 included direct observation (1, B) and processing of X-ray CTimages of rudists in the core interior. To understand rudist morphology and spatial configuration, two techniques were adopted for X-ray CTimage processing: surface rendering (2) and volume rendering (3) (further details of the surface rendering and volume rendering are provided inAdditional file 1: Document S1). From the results of the surface rendering, one 3D-printed model was made (4). By integrating all results, wevisualized the morphology and mode of occurrence of the rudists
Yamanaka et al. Progress in Earth and Planetary Science (2020) 7:49 Page 5 of 12

(slice numbers 134, 139, and 153; Fig. 4d–f) parts ofthe core. Mesh-like (celluloprismatic) shell structure(rudist C) was recognized in the central part of theuppermost slice (slice number 43; Fig. 4a). Rudist Coccurred also in the left-hand side of the upper-middle slice (slice number 62; Fig. 4b), which was 9.5mm below slice number 43. In the upper-lower slice(slice number 112; Fig. 4c), two rudist shells (rudistsB and C) were recognized. Rudist B had a thick outershell layer (red arrows in Fig. 4). Four rudist shells(rudists B, D, E, and G) occurred in the lower-upperslice (slice number 134; Fig. 4d); of these, rudist Bpreserved a thick outer shell layer. In the lower-middle slice (number 139; Fig. 4e), which was 2 mmbelow the lower-upper slice, three rudist shells(rudists B, D, and E) were discernible. Rudist B stillpossessed a thick outer shell layer. Three rudist shells(rudists A, D, and B) were present in the lowermostslice (number 153; Fig. 4f).
An outer shell layer was not recognized in rudist A.The slice images indicated that rudist B was pre-served in an upright position and had a thick outershell layer. The boundary between the inner andouter shell layers could be easily recognized, althoughthe inner shell layer was mostly dissolved. Thelattice-like (celluloprismatic) outer shell layer of rudistC was not apparent in the X-ray CT scan images,although it could be detected by visual core surfaceobservation. This difference in the visibility of thestructure is related to X-ray CT resolution. Becausethe scanning interval of the X-ray CT image was 0.5mm per slice, detail that is less than this size, such asthe celluloprismatic structure of the outer shell layer,cannot be detected.From visual observation of the core surface and X-ray
CT scan imaging, nine rudists (rudists A–I) were identi-fied. These rudists were grouped into two types on theslice images: rudists possessing a thick outer shell layer(rudists B, C, and H) and rudists lacking a thick shell
Fig. 4 Horizontal slice images obtained by X-ray CT. a Upper-upper slice (slice number 43 in Fig. 2). Note mesh-like (celluloprismatic) structure inthe center. b Upper-middle slice (slice number 62 in Fig. 2). Note rudist C on the left-hand side. c Upper-lower slice (slice number 112 in Fig. 2).Note rudists B and C. d Lower-upper slice (slice number 134 in Fig. 2). Four rudists (rudists B, D, E, and G) are present. e Lower-middle slice (slicenumber 139 in Fig. 2). Three rudists (rudists B, D, and E) are present. f Lower-lower slice (slice number 153 in Fig. 2). Three rudists (rudists A, D,and B) are discernible. Rudist B possesses the thick outer shell layer (red arrows in c, d, and e). Yellow arrows in b–f indicate individual rudists
Yamanaka et al. Progress in Earth and Planetary Science (2020) 7:49 Page 6 of 12
layer (rudists A, D–G, and I). Rudist C had a thick outershell layer, which was confirmed to be present by visualobservation of the core but not by X-ray CT imaging.
3.2 Surface renderingEvaluation of the whole morphology of rudists in drill-cores based on the limited and fragmentary informationobtained by visual core surface observation is difficult. Itis possible, by applying a surface-rendering technique toX-ray CT images of drillcores, to connect such limitedand fragmentary information together to yield a singleimage and to understand how the shells of individualrudists developed (Fig. 5; Additional file 3, Figure S2).This new information will facilitate taxonomic andpaleoecological studies of rudists.The images produced by applying the surface-
rendering technique show that rudist B, which is cone-
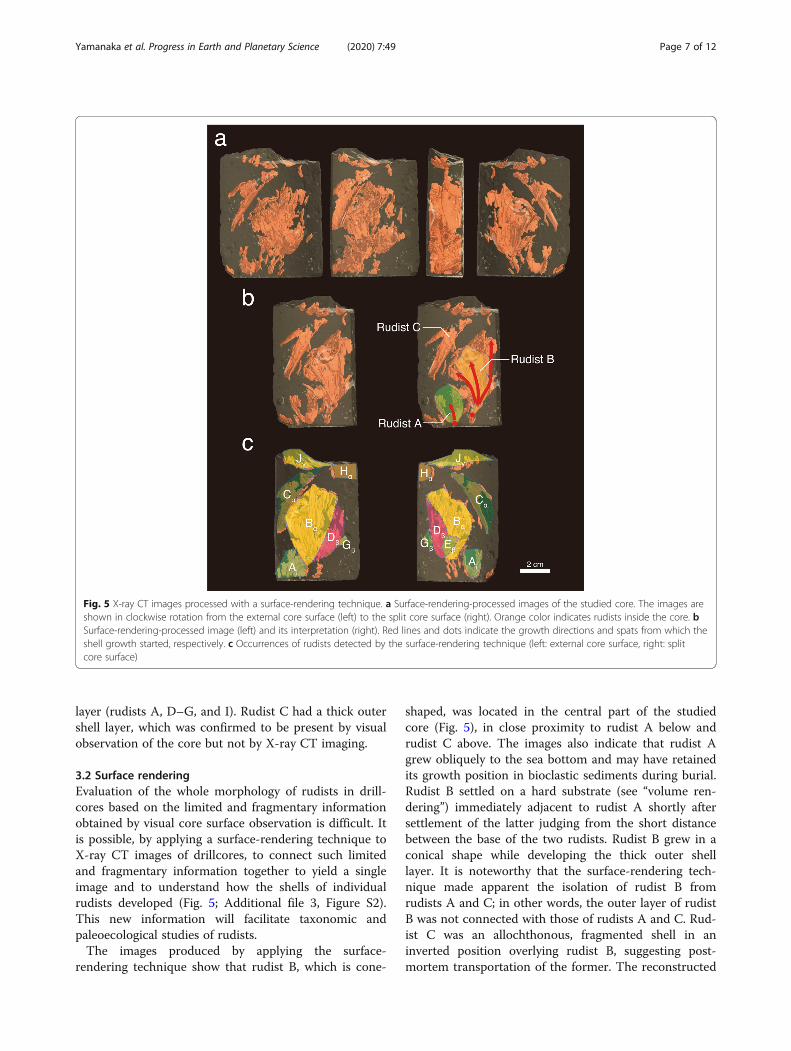
shaped, was located in the central part of the studiedcore (Fig. 5), in close proximity to rudist A below andrudist C above. The images also indicate that rudist Agrew obliquely to the sea bottom and may have retainedits growth position in bioclastic sediments during burial.Rudist B settled on a hard substrate (see “volume ren-dering”) immediately adjacent to rudist A shortly aftersettlement of the latter judging from the short distancebetween the base of the two rudists. Rudist B grew in aconical shape while developing the thick outer shelllayer. It is noteworthy that the surface-rendering tech-nique made apparent the isolation of rudist B fromrudists A and C; in other words, the outer layer of rudistB was not connected with those of rudists A and C. Rud-ist C was an allochthonous, fragmented shell in aninverted position overlying rudist B, suggesting post-mortem transportation of the former. The reconstructed
Fig. 5 X-ray CT images processed with a surface-rendering technique. a Surface-rendering-processed images of the studied core. The images areshown in clockwise rotation from the external core surface (left) to the split core surface (right). Orange color indicates rudists inside the core. bSurface-rendering-processed image (left) and its interpretation (right). Red lines and dots indicate the growth directions and spats from which theshell growth started, respectively. c Occurrences of rudists detected by the surface-rendering technique (left: external core surface, right: splitcore surface)
Yamanaka et al. Progress in Earth and Planetary Science (2020) 7:49 Page 7 of 12

succession indicates that three rudists did not bud fromindividuals located below (in other words, did not settleon individuals located below) but grew independently.The images produced with the surface-rendering tech-nique also demonstrate that rudists D and E started togrow on the flank of rudist B near its base (Fig. 5c).
3.3 Volume renderingVolume rendering, unlike surface rendering, makes iteasier to recognize objectives as hologram images (Fig.6a; Additional file 4: Figure S3). Volume renderingrevealed two modes of rudist occurrence in the core: inthe original growth position (four rudists: rudist A and
Fig. 6 X-ray CT images processed with a volume-rendering technique. a Volume-rendering-processed images of rudist B in the studied core. Theimages are shown in clockwise rotation from the external core surface (left) to the split core surface (right). b Enlarged images of the spat ofrudist B
Fig. 7 Three-dimensional modeling of rudist B. a External surface of the studied core seen diagonally from the bottom right. b, c 3D model ofrudist B seen from the external core surface (b) and the split core surface (c). Magenta and cyan colors indicate the inner and outer shelllayers, respectively
Yamanaka et al. Progress in Earth and Planetary Science (2020) 7:49 Page 8 of 12

possibly rudists B, D, and G); and fragmented and in astanding or inverted position (e.g., rudist C; Fig. 5).The detailed images (Fig. 6b) of the basal part of rudist
B clearly indicate that its growth began from the settle-ment of a juvenile (spat in Figs. 5 and 6) on a hardsubstrate such as a rock or a shell fragment. This findingis consistent with the direct observation of settling ofjuvenile specimens onto gravel or the shells of adultrudists (Gili and Götz 2018).This type of growth process is generally difficult to
infer from visual observation of core surfaces becausethe observable area is very limited (8 cm long and 7 cmwide), and the interior of the core is not visible. Volumerendering enables rotation of 3D images, which is usefulin taxonomic identification and analysis of the mode ofoccurrence of rudists. However, experience of the tech-nique is required to determine the threshold at whichCT values should be rejected as noise on the image ofthe rudist surface during 3D modeling.
3.4 3D printer modelingTo visually understand the relationship between theinner shell layer and the outer shell layer (Fig. 7;Additional file 5: Figure S4), we made a 3D-printedmodel using the surface-rendering technique for rudistB, which is preserved in an upright position and has arelatively thick outer shell layer (Fig. 8). The created 3D-printed model yielded information on the growth historyof rudist B. Figures 7 and 8 indicate that the outer shelllayer started to be developed from 7 mm above the baseof the inner shell layer, and subsequently extended up-ward to wrap around the inner shell layer. Finally, bothinner and outer shell layers grew upward together.The 3D-printed model also clearly shows the settle-
ment of the juvenile of rudist B. This is the first detec-tion of a rudist spat in the interior of a core.
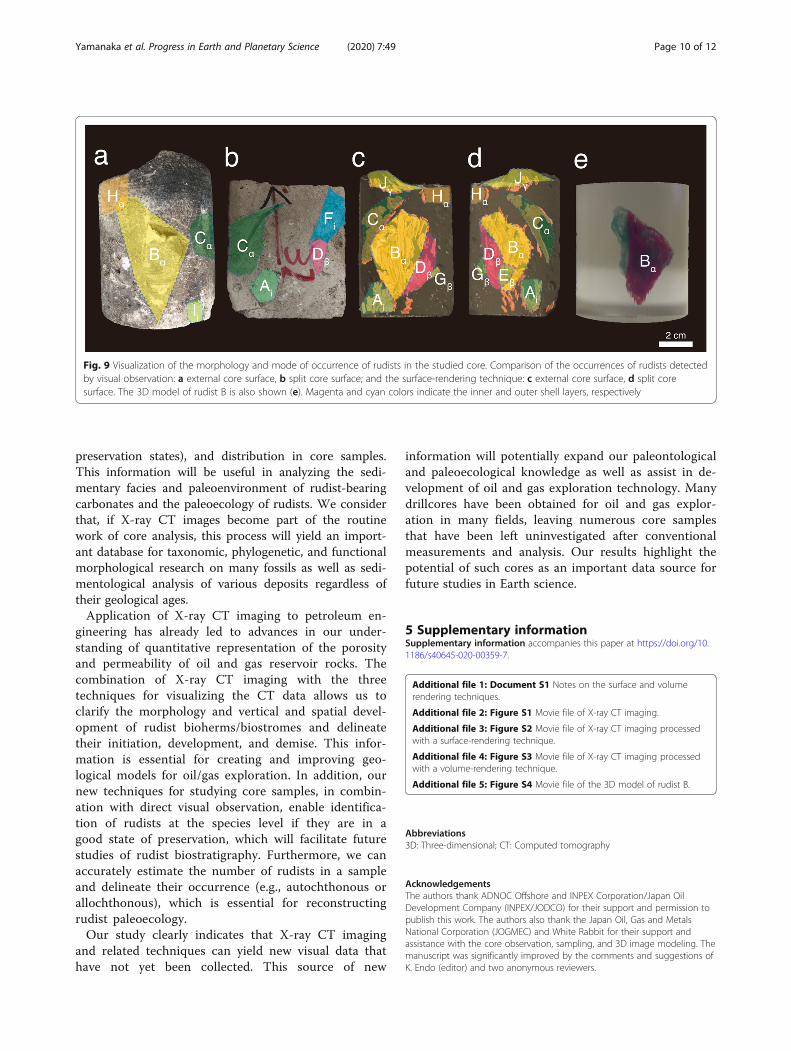
3.5 Evaluation of X-ray CT imaging and image processingWe show, in Fig. 9, a comparison of the occurrence ofrudists detected by visual observation of the core (Fig.9a, b), the surface-rendering technique (Fig. 9c, d), andthe 3D-printed model (rudist B, Fig. 9e). We identifiedseven rudists by means of visual observation of the coresurface and extracted limited information on theirmorphology and mode of occurrence (preservation state,spatial distribution, and growth history). However, thecombination of several methods allowed identification of10 rudists assigned to four types in the studied core.Surface and volume rendering were useful in identifyingthe initiation (settlement), development, and successionof rudists in the core interior. The volume-renderingtechnique and the making of a 3D model from a trans-parent resin allowed observation of the rudists from alldirections.
4 ConclusionsX-ray CT imaging, combined with surface rendering,volume rendering, and 3D modeling, allows us to obtainvarious types of information on rudists, such as theirmorphology (including the presence/absence of pores/voids within shells), mode of occurrence (including
Fig. 8 Three-dimensional printed model of rudist B. Photographs ofthe studied core (left) and images of the 3D model of rudist B(right). a High-angle images. b Images of the external core surface. cImages of the split core surface. Magenta and cyan colors indicatethe inner and outer shell layers, respectively
Yamanaka et al. Progress in Earth and Planetary Science (2020) 7:49 Page 9 of 12
preservation states), and distribution in core samples.This information will be useful in analyzing the sedi-mentary facies and paleoenvironment of rudist-bearingcarbonates and the paleoecology of rudists. We considerthat, if X-ray CT images become part of the routinework of core analysis, this process will yield an import-ant database for taxonomic, phylogenetic, and functionalmorphological research on many fossils as well as sedi-mentological analysis of various deposits regardless oftheir geological ages.Application of X-ray CT imaging to petroleum en-
gineering has already led to advances in our under-standing of quantitative representation of the porosityand permeability of oil and gas reservoir rocks. Thecombination of X-ray CT imaging with the threetechniques for visualizing the CT data allows us toclarify the morphology and vertical and spatial devel-opment of rudist bioherms/biostromes and delineatetheir initiation, development, and demise. This infor-mation is essential for creating and improving geo-logical models for oil/gas exploration. In addition, ournew techniques for studying core samples, in combin-ation with direct visual observation, enable identifica-tion of rudists at the species level if they are in agood state of preservation, which will facilitate futurestudies of rudist biostratigraphy. Furthermore, we canaccurately estimate the number of rudists in a sampleand delineate their occurrence (e.g., autochthonous orallochthonous), which is essential for reconstructingrudist paleoecology.Our study clearly indicates that X-ray CT imaging
and related techniques can yield new visual data thathave not yet been collected. This source of new
information will potentially expand our paleontologicaland paleoecological knowledge as well as assist in de-velopment of oil and gas exploration technology. Manydrillcores have been obtained for oil and gas explor-ation in many fields, leaving numerous core samplesthat have been left uninvestigated after conventionalmeasurements and analysis. Our results highlight thepotential of such cores as an important data source forfuture studies in Earth science.
5 Supplementary informationSupplementary information accompanies this paper at https://doi.org/10.1186/s40645-020-00359-7.
Additional file 1: Document S1 Notes on the surface and volumerendering techniques.
Additional file 2: Figure S1 Movie file of X-ray CT imaging.
Additional file 3: Figure S2 Movie file of X-ray CT imaging processedwith a surface-rendering technique.
Additional file 4: Figure S3 Movie file of X-ray CT imaging processedwith a volume-rendering technique.
Additional file 5: Figure S4 Movie file of the 3D model of rudist B.
Abbreviations3D: Three-dimensional; CT: Computed tomography
AcknowledgementsThe authors thank ADNOC Offshore and INPEX Corporation/Japan OilDevelopment Company (INPEX/JODCO) for their support and permission topublish this work. The authors also thank the Japan Oil, Gas and MetalsNational Corporation (JOGMEC) and White Rabbit for their support andassistance with the core observation, sampling, and 3D image modeling. Themanuscript was significantly improved by the comments and suggestions ofK. Endo (editor) and two anonymous reviewers.
Fig. 9 Visualization of the morphology and mode of occurrence of rudists in the studied core. Comparison of the occurrences of rudists detectedby visual observation: a external core surface, b split core surface; and the surface-rendering technique: c external core surface, d split coresurface. The 3D model of rudist B is also shown (e). Magenta and cyan colors indicate the inner and outer shell layers, respectively
Yamanaka et al. Progress in Earth and Planetary Science (2020) 7:49 Page 10 of 12
Authors’ contributionsMY and SS conceptualized and designed this study. MY conducted the X-rayCT imaging and image processing. SS performed paleontological analysis. SS,HAZ, HF, and YI collaborated with the corresponding author in the interpret-ation of the data and the construction of the manuscript. All authors readand approved the final manuscript.
FundingThis work was partly supported financially by JODCO Exploration Limitedand Grant-in-Aid for Scientific Research from the Japan Society for the Pro-motion of Science (JSPS KAKENHI) to Y.I. (26302008).
Availability of data and materialsPlease contact the corresponding author regarding data requests.
Competing interestsThe authors declare that they have no competing interests.
Author details1JODCO Exploration Limited, 10th Floor, Tower 3, Etihad Towers, P.O. Box2659, Abu Dhabi, UAE. 2Department of Earth System Science, School ofSustainable Design, University of Toyama, Gofuku, Toyama 930-8555, Japan.3Satah & Umm Al Dalkh Field Development Division, ADNOC Offshore, P.O.Box 303, Abu Dhabi, UAE. 4Institute of Geology and Paleontology, GraduateSchool of Science, Tohoku University, Aobayama, Sendai 980-0856, Japan.
Received: 13 February 2020 Accepted: 6 August 2020
ReferencesAlsharhan AS (1995) Facies variation, diagenesis, and exploration potential of the
Cretaceous rudist-bearing carbonates of the Arabian Gulf. AAPG Bulletin 79:531–550. https://doi.org/10.1306/8D2B1584-171E-11D7-8645000102C1865D
Alsharhan AS, Nairn AEM (1993) Carbonate Platform Models of ArabianCretaceous Reservoirs. In: Simo JA, Scott RW, Masse JP (eds) CretaceousCarbonate Platforms. AAPG Memoir, no 56, American Association ofPetroleum Geology, Tulsa, Oklahoma, USA, pp 173–184
Al-Zaabi M, Taher A, Azzam I, Witte J (2010) Geological overview of the MiddleCretaceous Mishrif Formation in Abu Dhabi. In: Abu Dhabi InternationalPetroleum Exhibition and Conference, 1–4 November, Abu Dhabi, UAE.Society of Petroleum Engineers, Richardson, Document ID: SPE-137894-MS.https://doi.org/10.2118/137894-MS
Burchette TP (1993) Mishrif Formation (Cenomanian-Turonian), southern ArabianGulf: carbonate platform growth along a cratonic basin margin. In: Simo JA,Scott RW, Masse J-P (eds) Cretaceous Carbonate Platforms. AAPG Memoir, no56, AAPG, Tulsa, Oklahoma, USA, pp 185–199
Burchette TP, Britton SR (1985) Carbonate facies analysis in the exploration forhydrocarbons: a case-study from the Cretaceous of the Middle East. In:Benchley PJ, Williams BPJ (eds) Sedimentology: recent developments andapplied aspects. Geological Society of London, Special Publications, no 18,pp 311–338
Cestari R, Sartorio D (1995) Rudists and facies of the periadriatic domain. Agip,San Donato Milanese
Gili E, Götz S (2018) Treatise Online no. 103: Part N, Volume 2, Chapter 26B:Paleoecology of rudists. Paleontological Institute, University of Kansas,Lawrence. https://doi.org/10.17161/to.v0i0.7183
Hughes GW, Shameem S, Sadler RK (2004) Computerized tomography revealsAptian rudist species and taphonomy. Geol Croat 57:67–71
Kojima K, Yamanaka M, Taniwaki T, Amo M, Chiyonobu S (2017) Evaluation of lateCretaceous Cenomanian petroleum system in offshore Abu Dhabi withgeochemical analysis. In: Abu Dhabi International Petroleum Exhibition &Conference, 13-16 November , Abu Dhabi, UAE. Society of PetroleumEngineers, Texas, Document ID: SPE-188389-MS. https://doi.org/10.2118/188389-MS
Molineux A, Scott RW, Ketcham RA, Maisano JA (2007) Rudist taxonomy using X-ray computed tomography. Paleontol Electron 10:13A http://palaeo-electronica.org/2007_3/135/index.html
Molineux A, Scott RW, Maisano J, Ketcham R, Zachos L (2010) Blending rudistswith technology; non-destructive examination of the internal and externalstructures of rudists using high quality scanning and digital imagery. Turk JEarth Sci 19:757–767
Neo S (1987) An example of sedimentary facies analysis of reefal limestones inthe Mishrif Formation in Abu Dhabi. J Jap Ass Petrol Technol 52:88–98.https://doi.org/10.3720/japt.52.88
Neo S (1996) The structural origin and relating geological framework of theupper Mishrif Formation in a Mishrif-reservoired oil field, offshore AbuDhabi. In: Abu Dhabi International Petroleum Exhibition and Conference,13-16 October, Abu Dhabi, UAE. Society of Petroleum Engineers,Richardson, Document ID: SPE-36203-MS. https://doi.org/10.2118/36203-MS
Özer S, Meriç E, Görmüs M, Kanbur S (2009) Biogeographic distribution of rudistsand benthic foraminifera: An approach to Campanian-Maastrichtianpaleobiogeography of Turkey. Geobios 42:623–628
Philip J, Borgomano J, Al-Maskiry S (1995) Cenomanian–Early Turonian carbonateplatform of Northern Oman: stratigraphy and palaeo-environments.Palaeogeogr Palaeoclimatol Palaeoecol. 119:77–92. https://doi.org/10.1016/0031-0182(95)00061-5
Racicot R (2016) Fossil secrets revealed: X-ray CT scanning and applicationsin paleontology. Paleontol Soc Pap 22:21–38. https://doi.org/10.1017/scs.2017.6
Saber SG, Salama YF, Scott RW, Abdel-Gawad GI, Aly MF (2009) Cenomanian -Turonian rudist assemblages and sequence stratigraphy on the North Sinaicarbonate shelf, Egypt. GeoArabia 14:113–134
Schumann D (2000) Paleoecology of Late Cretaceous Rudist Settlements inCentral Oman. In: Alsharhan AS, Scott RW (eds) Middle East Models ofJurassic/Cretaceous Carbonate Systems. SEPM Spec Publ 69. Society forSedimentary Geology (SEPM), Tulsa, pp 143–153
Scott RW (1990) Chronostratigraphy of the Cretaceous carbonate shelf,southeastern Arabia. In: AHF R, Searle MP, Ries AC (eds) The Geologyand Tectonics of the Oman Region. Geol Soc London Spec Publ 49.Geol Soc, London, pp 89–108. https://doi.org/10.1144/GSL.SP.1992.049.01.07
Seard C, Camoin G, Yokoyama Y, Matsuzaki H, Durand N, Bard E, Sepulcre S,Deschamps P (2010) Microbialite development patterns in the last deglacialreefs from Tahiti (French Polynesia; IODP Expedition #310): implications onreef framework architecture. Mar Geol 279:63–86. https://doi.org/10.1016/j.margeo.2010.10.013
Skelton PW, Gili E, Vicens E, Obrador A (1995) The growth fabric of gregariousrudist elevators (hippuritids) in a Santonian carbonate platform in thesouthern Central Pyrenees. Paleogeogr Paleoclimatol Paleoecol 119:107–126.https://doi.org/10.1016/0031-0182(95)00063-1
Skelton PW, Masse J-P (2000) Synoptic guide to Lower Cretaceous rudist bivalvesof Arabia. In: Alsharhan AS, Scott RW (eds) Middle East Models of Jurassic/Cretaceous Carbonate Systems. SEPM Spec Publ 69. Society for SedimentaryGeology (SEPM), Tulsa, pp 89–99
Sutton MD, Rahman IA, Garwood RJ (2014) Techniques for virtual palaeontology.John Wiley & Sons, West Sussex
van Buchem FSP, Simmons MD, Droste HJ, Davies RB (2011) Late Aptian toTuronian stratigraphy of the eastern Arabian Plate –depositional sequencesand lithostratigraphic nomenclature. Petrol Geosci 17:211–222. https://doi.org/10.1144/1354-079310-061
Yamamoto K, Obara H, Tusaka K, Tsuji Y, Al-Farhan ZA, Aljneibi MM, Takayanagi H,Kurita H, Sato T, Iryu Y (2016) A causal link between Paleoenvironmentaldynamics and borehole instability in a Cenomanian carbonate reservoir,offshore Abu Dhabi. In: Abu Dhabi International Petroleum Exhibition &Conference, 7-10 November, Abu Dhabi, UAE. Society of PetroleumEngineers, Richardson, Document ID: SPE-183194-MS. https://doi.org/10.2118/183194-MS
Yamanaka M, Nanjo T, Taniwaki T (2018) Evaluation of rudist depositionalenvironment using X ray-CT scan Late Cretaceous Cenomanian inoffshore Abu Dhabi. In: Abu Dhabi International Petroleum Exhibition &Conference, 12-15 November, Abu Dhabi, UAE. Society of PetroleumEngineers, Richardson, Document ID: SPE-192923-MS. https://doi.org/10.2118/192923-MS
Yamanaka M, Taniwaki T, Nanjo T (2019a) Application of X-ray CT scan to slabcores for extracting Cenomanian rudist fossils in Offshore Abu Dhabi as astate-of-the-art nondestructive testing methodology. J Jap Ass Petrol Technol84:52–58. https://doi.org/10.3720/japt.84.52
Yamanaka M, Taniwaki T, Nanjo T (2019b) Evaluation of porosity andpermeability vertical distribution of rudist carbonate build up platformidentified by X-ray CT and 3D modeling, Late Cretaceous Cenomanian inoffshore Abu Dhabi. In: Abu Dhabi International Petroleum Exhibition &
Yamanaka et al. Progress in Earth and Planetary Science (2020) 7:49 Page 11 of 12

Conference, 11-14 November, Abu Dhabi, UAE. Society of PetroleumEngineers, Richardson, Document ID: SPE-197747-MS. https://doi.org/10.2118/197747-MS
Zakhera MS (2011) Cenomanian-Turonian rudists from Western Sinai, Egypt:Systematic paleontology and paleoecology. Geobios 44:409–433. https://doi.org/10.1016/j.geobios.2010.10.004
Publisher’s NoteSpringer Nature remains neutral with regard to jurisdictional claims inpublished maps and institutional affiliations.
Yamanaka et al. Progress in Earth and Planetary Science (2020) 7:49 Page 12 of 12