s40635-016-0110-5.pdf - Intensive Care Medicine Experimental
11
RESEARCH Open Access Comparison of an automatic analysis and a manual analysis of conjunctival microcirculation in a sheep model of haemorrhagic shock Philip-Helge Arnemann 1*† , Michael Hessler 1† , Tim Kampmeier 1 , Andrea Morelli 2 , Hugo Karel Van Aken 1 , Martin Westphal 1 , Sebastian Rehberg 3 and Christian Ertmer 1 * Correspondence: [email protected] † Equal contributors 1 Department of Anaesthesiology, Intensive Care and Pain Therapy, Muenster University Hospital, Albert-Schweitzer-Campus 1, Building A1, 49149 Muenster, Germany Full list of author information is available at the end of the article Abstract Background: Life-threatening diseases of critically ill patients are known to derange microcirculation. Automatic analysis of microcirculation would provide a bedside diagnostic tool for microcirculatory disorders and allow immediate therapeutic decisions based upon microcirculation analysis. Methods: After induction of general anaesthesia and instrumentation for haemodynamic monitoring, haemorrhagic shock was induced in ten female sheep by stepwise blood withdrawal of 3 × 10 mL per kilogram body weight. Before and after the induction of haemorrhagic shock, haemodynamic variables, samples for blood gas analysis, and videos of conjunctival microcirculation were obtained by incident dark field illumination microscopy. Microcirculatory videos were analysed (1) manually with AVA software version 3.2 by an experienced user and (2) automatically by AVA software version 4.2 for total vessel density (TVD), perfused vessel density (PVD) and proportion of perfused vessels (PPV). Correlation between the two analysis methods was examined by intraclass correlation coefficient and Bland-Altman analysis. Results: The induction of haemorrhagic shock decreased the mean arterial pressure (from 87 ± 11 to 40 ± 7 mmHg; p < 0.001); stroke volume index (from 38 ± 14 to 20 ± 5 ml·m -2 ; p = 0.001) and cardiac index (from 2.9 ± 0.9 to 1.8 ± 0.5 L·min -1 ·m -2 ; p < 0. 001) and increased the heart rate (from 72 ± 9 to 87 ± 11 bpm; p < 0.001) and lactate concentration (from 0.9 ± 0.3 to 2.0 ± 0.6 mmol·L -1 ; p = 0.001). Manual analysis showed no change in TVD (17.8 ± 4.2 to 17.8 ± 3.8 mm*mm -2 ; p = 0.993), whereas PVD (from 15.6 ± 4.6 to 11.5 ± 6.5 mm*mm -2 ; p = 0.041) and PPV (from 85.9 ± 11.8 to 62.7 ± 29.6%; p = 0.017) decreased significantly. Automatic analysis was not able to identify these changes. Correlation analysis showed a poor correlation between the analysis methods and a wide spread of values in Bland-Altman analysis. (Continued on next page) Intensive Care Medicine Experimental © The Author(s). 2016 Open Access This article is distributed under the terms of the Creative Commons Attribution 4.0 International License (http://creativecommons.org/licenses/by/4.0/), which permits unrestricted use, distribution, and reproduction in any medium, provided you give appropriate credit to the original author(s) and the source, provide a link to the Creative Commons license, and indicate if changes were made. Arnemann et al. Intensive Care Medicine Experimental (2016) 4:37 DOI 10.1186/s40635-016-0110-5
-
Upload
khangminh22 -
Category
Documents
-
view
0 -
download
0
Transcript of s40635-016-0110-5.pdf - Intensive Care Medicine Experimental

RESEARCH Open Access
Comparison of an automatic analysis and amanual analysis of conjunctivalmicrocirculation in a sheep model ofhaemorrhagic shockPhilip-Helge Arnemann1*† , Michael Hessler1†, Tim Kampmeier1, Andrea Morelli2, Hugo Karel Van Aken1,Martin Westphal1, Sebastian Rehberg3 and Christian Ertmer1
* Correspondence:[email protected]†Equal contributors1Department of Anaesthesiology,Intensive Care and Pain Therapy,Muenster University Hospital,Albert-Schweitzer-Campus 1,Building A1, 49149 Muenster,GermanyFull list of author information isavailable at the end of the article
Abstract
Background: Life-threatening diseases of critically ill patients are known to derangemicrocirculation. Automatic analysis of microcirculation would provide a bedsidediagnostic tool for microcirculatory disorders and allow immediate therapeuticdecisions based upon microcirculation analysis.
Methods: After induction of general anaesthesia and instrumentation forhaemodynamic monitoring, haemorrhagic shock was induced in ten female sheepby stepwise blood withdrawal of 3 × 10 mL per kilogram body weight. Before andafter the induction of haemorrhagic shock, haemodynamic variables, samples forblood gas analysis, and videos of conjunctival microcirculation were obtained byincident dark field illumination microscopy. Microcirculatory videos were analysed (1)manually with AVA software version 3.2 by an experienced user and (2) automaticallyby AVA software version 4.2 for total vessel density (TVD), perfused vessel density(PVD) and proportion of perfused vessels (PPV). Correlation between the two analysismethods was examined by intraclass correlation coefficient and Bland-Altmananalysis.
Results: The induction of haemorrhagic shock decreased the mean arterial pressure(from 87 ± 11 to 40 ± 7 mmHg; p < 0.001); stroke volume index (from 38 ± 14 to 20 ±5 ml·m−2; p = 0.001) and cardiac index (from 2.9 ± 0.9 to 1.8 ± 0.5 L·min−1·m−2; p < 0.001) and increased the heart rate (from 72 ± 9 to 87 ± 11 bpm; p < 0.001) and lactateconcentration (from 0.9 ± 0.3 to 2.0 ± 0.6 mmol·L−1; p = 0.001). Manual analysisshowed no change in TVD (17.8 ± 4.2 to 17.8 ± 3.8 mm*mm−2; p = 0.993), whereasPVD (from 15.6 ± 4.6 to 11.5 ± 6.5 mm*mm−2; p = 0.041) and PPV (from 85.9 ± 11.8 to62.7 ± 29.6%; p = 0.017) decreased significantly. Automatic analysis was not able toidentify these changes. Correlation analysis showed a poor correlation between theanalysis methods and a wide spread of values in Bland-Altman analysis.(Continued on next page)
Intensive Care MedicineExperimental
© The Author(s). 2016 Open Access This article is distributed under the terms of the Creative Commons Attribution 4.0 InternationalLicense (http://creativecommons.org/licenses/by/4.0/), which permits unrestricted use, distribution, and reproduction in any medium,provided you give appropriate credit to the original author(s) and the source, provide a link to the Creative Commons license, andindicate if changes were made.
Arnemann et al. Intensive Care Medicine Experimental (2016) 4:37 DOI 10.1186/s40635-016-0110-5

(Continued from previous page)
Conclusions: As characteristic changes in microcirculation during ovinehaemorrhagic shock were not detected by automatic analysis and correlationbetween automatic and manual analyses (current gold standard) was poor, the use ofthe investigated software for automatic analysis of microcirculation cannot berecommended in its current version at least in the investigated model. Furtherimprovements in automatic vessel detection are needed before its routine use.
Keywords: Microcirculation, Analysis, Automatic, Manual, Haemorrhagic shock
BackgroundLife-threatening diseases of critically ill patients are often accompanied by changes in
microvascular perfusion [1–5], and the persistence of microcirculatory abnormalities is
associated with poor outcome [3, 4].
In recent years, methods such as sidestream dark field imaging (SDF) [6] or incident
dark field illumination imaging (IDF) [7] were developed to allow a direct observation of
the microcirculation at the bedside. Directly monitoring the microcirculation is a powerful
diagnostic tool and may help to better understand the individual problems of patients and
the effects of haemodynamic therapy in the critical care setting [8]. Based on the availabil-
ity of microcirculatory monitoring at the bedside and accumulating evidence, treatment
decisions may be made on the basis of microvascular parameters in the near future [9, 10].
A major shortcoming constraining the widespread evaluation of the microcirculation
at the bedside is the prolonged time necessary for the quantitative analysis. The current
gold standard and method of choice is a time-consuming manual analysis that includes
plotting of each vessel and quantification of flow in every individual vessel in a video
performed by an experienced user [11]. A software conducting this analysis automatic-
ally could help to establish the microcirculation as a tool for “point-of-care” diagnosis
and decision-making.
The aim of this study was to compare a software for an automatic analysis of key
microcirculatory variables, such as total vessel density (TVD), perfused vessel density
(PVD) and proportion of perfused vessels (PPV), with a manual analysis, which is the
current gold standard [11]. An additional intention was to correlate the results of these
two methods.
MethodsStudy design
Ten sheep were anaesthetized and instrumented as described below. After reaching
shock time point and the respective measurements, data acquisition for the present
study ends, and the sheep were randomised for an interventional study of haemor-
rhagic shock, whose data is not part of the present analysis. At the end of that study,
the sheep were killed with an intravenous injection of 4 mg/kg propofol and of 200 mL
potassium chloride solution (7.45%).
Anaesthesia and instrumentation
General anaesthesia was induced in ten female sheep (species Ovis orientalis aries) by
intramuscular bolus injection of 0.3 mg·kg−1 midazolame and 10 mg·kg−1 S-ketamine.
Arnemann et al. Intensive Care Medicine Experimental (2016) 4:37 Page 2 of 11

Following endotracheal intubation, balanced anaesthesia was maintained by inhalational
isoflurane with an expiratory fraction of 1.2 vol% as well as a continuous infusion of
0.3 mg·kg−1·h−1 midazolame and 1 mg·kg−1·h−1 S-ketamine. The sheep were ventilated
targeting an end-tidal carbon dioxide partial pressure of 35 ± 5 mmHg.
A pulse contour cardiac output catheter (5-Fr PiCCO™ catheter, Pulsion Medical Systems,
Munich, Germany) was placed in the left femoral artery to obtain haemodynamic variables.
A central venous line was inserted into the right jugular vein to administer drugs and to
conduct thermodilution as well as a 7.5-Fr catheter in the left jugular vein for blood
withdrawal. A Foley catheter was placed in the urinary bladder.
Afterwards, the sheep were turned into prone position and were allowed to recover
for a period of 30 min before the experimental protocol was started.
Experimental protocol
Following baseline measurements (“baseline” time point), 3 × 10 mL blood per kilogram
body weight was withdrawn stepwise over a period of 5 min each. After each of the
three blood withdrawals, there was a recovery period of 30 min. The resulting 30 mL
per kg body weight of withdrawn blood equals approximately 50–60% of the total blood
volume in the sheep [12]. If mean arterial pressure (MAP) decreased below 30 mmHg
during blood withdrawal, the current step of withdrawal was stopped immediately
resulting in less than 10 mL per kg body weight for the individual withdrawal.
After 3 cycles of blood withdrawal, each followed by 30 min of recovery time, shock
time was defined after the last recovery time. At shock time point, haemodynamic and
microcirculatory measurements were performed.
Measurements
At both time points (baseline and shock), systemic haemodynamic variables and
conjunctival microcirculation were measured and arterial blood samples were obtained
for the blood gas analysis.
Haemodynamic measurements comprised MAP, stroke volume index (SVI) and
cardiac index (CI). SVI and CI were obtained by threefold bolus thermodilution using
the PiCCO™ system. The mean of the three measurements was documented. Also, the
heart rate was read from the haemodynamic monitoring tool.
Conjunctival microcirculation was measured in five different conjunctival positions at
both measurement time points. Measurements were conducted using an IDF camera
(CytoCam™, Braedius Medical BV, Huizen, The Netherlands). The obtained videos were
reviewed for quality according to recommendations by Massey et al. [13] and discarded
if necessary.
The remaining high-quality videos were analysed (1) by an experienced user blinded for
the study protocol using a manual analysis software (AVA software version 3.2, Microvision
Medical, Amsterdam, The Netherlands) and (2) a software including an automatic video
analysis of microcirculatory videos (AVA software version 4.2, Microvision Medical,
Amsterdam, The Netherlands).
With both programs, the TVD, PVD and the PPV were determined in each video ac-
cording to an independent expert consensus conference to characterise microcircula-
tory perfusion [11].
Arnemann et al. Intensive Care Medicine Experimental (2016) 4:37 Page 3 of 11

Manual analysis with AVA software version 3.2 comprised the manual drawing of
each vessel and assigning a diameter and flow score to each vessel and has been de-
scribed thoroughly before [14]. After the manual processing, the AVA 3.2 software cal-
culated the above-mentioned parameters. In the AVA software version 4.2, the software
conducts the process of detecting the vessels and flow automatically. As the consensus
conference recommended including only vessels with a diameter of less than 20 μm in
the microcirculatory analysis, this threshold was used in both analysis methods.
Statistical analysis
Statistical analysis was performed with IBM SPSS statistics software version 22 (IBM,
Armonk, New York, USA). All data are presented as mean with standard deviation, un-
less otherwise stated.
Variables were tested to confirm the equality of variances by Levene’s test, and
Kolmogorov-Smirnov test was used to confirm normal distribution. For comparisons
between time points, paired sample t test was used. Asymptotic two-sided p values
smaller than 0.05 were assumed as statistically significant.
For the comparison of manual and automatic analyses of sheep, conjunctival micro-
circulation intraclass correlation coefficient (ICC) was determined [15]. The ICC for
normally distributed, continuous values is presented with 95% confidence intervals as a
measure of dispersion. Values below 0.40 are considered as “poor” agreement, between
0.40 and 0.59 as “fair” agreement, between 0.60 and 0.74 as “good” agreement and for
greater than 0.74, the level of agreement is “excellent” as suggested by Cicchetti [16].
In addition, the method suggested by Bland and Altman [17] was used to assess the
agreement between the two analysis methods. According to Bland and Altman, the
mean difference of the two values (manual and automatic) for each video was plotted
against the average of those two values. The mean bias (95% confidence interval) was
calculated as well as the limits of agreement (LOA) as 1.96-fold of the standard devi-
ation of the mean bias.
ResultsHaemodynamic variables and arterial blood gas analysis
24.3 ± 4.5 mL/kg of blood was withdrawn. In seven sheep, blood withdrawal was
stopped due to predefined safety measures. Withdrawal of blood resulted in a decrease
in MAP, CI and SVI and an increase in HR from baseline to shock time point. In
addition, an increase in arterial lactate concentration as well as a reduction of arterial
haemoglobin concentration was found (Table 1).
Microcirculatory variables at baseline and in haemorrhagic shock
Of the 100 videos taken of sheep conjunctival microcirculation, 85 met the predefined
quality criteria [13]. Microcirculatory variables were examined regarding differences be-
tween baseline and shock for each of the two analysis methods (Table 2). Manual ana-
lysis showed a significant decrease in PVD and a significant reduction of PPV in shock
compared to baseline, while TVD remained constant. Contrarily, no statistically signifi-
cant differences could be demonstrated between baseline and shock for any of the vari-
ables with the automatic analysis (Additional files 1 and 2).
Arnemann et al. Intensive Care Medicine Experimental (2016) 4:37 Page 4 of 11

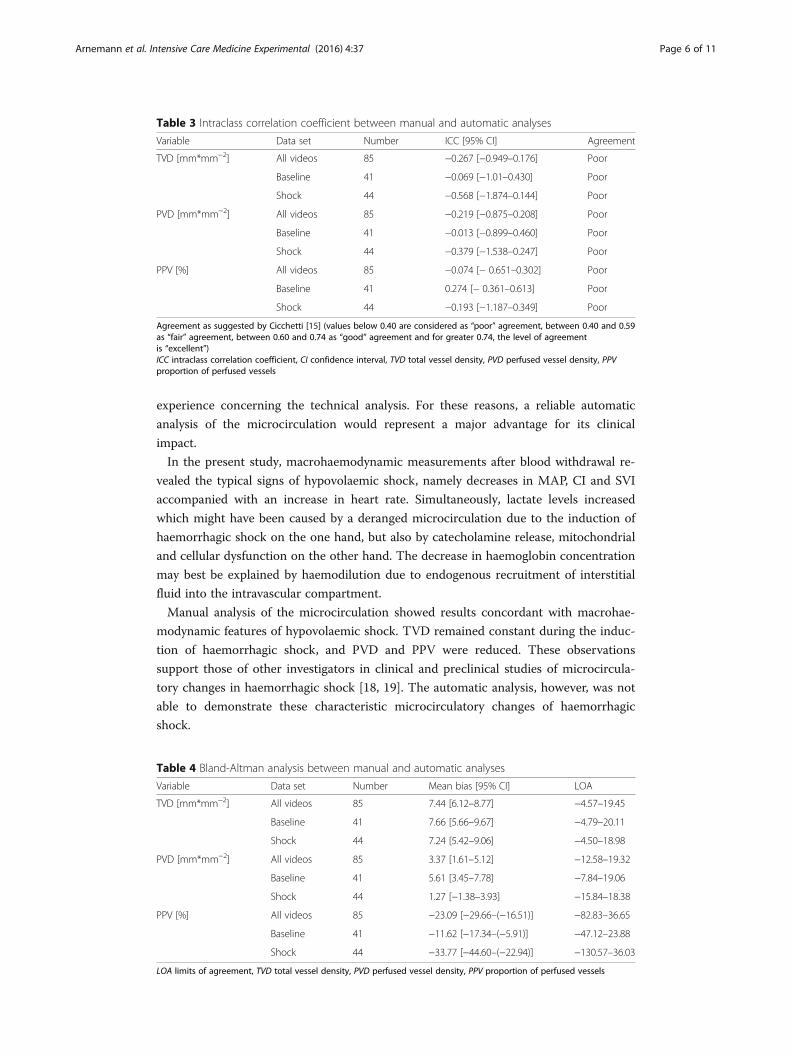
Results of intraclass correlation coefficient and Bland-Altman analysis
The ICC, calculated for the complete data set (n = 85) and for the subgroups baseline
(n = 41) and shock (n = 44), showed a poor agreement [16] for all examined variables
(Table 3).
In addition, the Bland-Altman analysis revealed a bias between manual and automatic
analyses for all tested variables with wide LOA (Table 4). Figure 1 demonstrates the re-
spective Bland-Altman plots for TVD and PVD (n = 85).
DiscussionThe main results of the present study are that ovine haemorrhagic shock induced by
blood withdrawal caused a reduction in PVD and PPV if analysis of microcirculation
was conducted manually (with AVA software version 3.2). Automatic analysis (by AVA
software version 4.2) was not able to reproduce the findings of the gold standard
method. Accordingly, there was a wide variation of values, and Bland-Altman analysis
as well as ICC revealed a poor correlation between manual and automatic analyses.
A reliable automatic analysis of microcirculation would be associated with multiple
advantages. First, this method would be markedly faster than manual analysis thus
allowing bedside application. Based upon our own experiences, automatic analysis by
AVA software version 4.2 takes approximately 3 to 4 min while manual analysis by an
experienced user takes about 20 min per video. Second, based on the faster analysis at
the bedside, monitoring of the microcirculation would become applicable for immedi-
ate therapeutic decisions. Third, the analysis would be independent of the user’s
Table 1 Haemodynamic variables and arterial blood gas analysis
Variable Baseline (n = 10) Shock (n = 10) p value
MAP [mmHg] 87 ± 11 40 ± 7 <0.001§
HR [bpm] 72 ± 9 87 ± 11 0.003§
CI [L min−1·m−2] 2.9 ± 0.9 1.8 ± 0.5 <0.001§
SVI [mL·m−2] 38 ± 14 20 ± 5 0.001§
Hb [g·dL−1] 8.6 ± 0.7 8.0 ± 0.5 0.003§
Lactate [mmol·L−1] 0.9 ± 0.3 2.0 ± 0.6 0.001§
All values are presented as mean ± standard deviation. Lactate = arterial lactate concentrationMAP mean arterial pressure, HR heart rate, CI cardiac index, SVI stroke volume index, Hb arterialhaemoglobin concentration§Significant difference between baseline and shock
Table 2 Microcirculatory variables
Analysis method Variable Baseline (n = 10) Shock (n = 10) p value
Manual analysis TVD [mm*mm−2] 17.8 ± 4.2 17.8 ± 3.8 0.993
PVD [mm*mm−2] 15.6 ± 4.6 11.5 ± 6.5 0.041§
PPV [%] 85.9 ± 11.8 62.7 ± 29.6 0.017§
Automatic analysis TVD [mm*mm−2] 10.6 ± 1.4 11.0 ± 1.9 0.460
PVD [mm*mm−2] 10.2 ± 1.4 10.8 ± 1.9 0.330
PPV [%] 96.1 ± 6. 97.9 ± 3.7 0.372
All values are presented as mean ± standard deviationTVD total vessel density, PVD perfused vessel density, PPV proportion of perfused vessels§Significant difference between baseline and shock
Arnemann et al. Intensive Care Medicine Experimental (2016) 4:37 Page 5 of 11
experience concerning the technical analysis. For these reasons, a reliable automatic
analysis of the microcirculation would represent a major advantage for its clinical
impact.
In the present study, macrohaemodynamic measurements after blood withdrawal re-
vealed the typical signs of hypovolaemic shock, namely decreases in MAP, CI and SVI
accompanied with an increase in heart rate. Simultaneously, lactate levels increased
which might have been caused by a deranged microcirculation due to the induction of
haemorrhagic shock on the one hand, but also by catecholamine release, mitochondrial
and cellular dysfunction on the other hand. The decrease in haemoglobin concentration
may best be explained by haemodilution due to endogenous recruitment of interstitial
fluid into the intravascular compartment.
Manual analysis of the microcirculation showed results concordant with macrohae-
modynamic features of hypovolaemic shock. TVD remained constant during the induc-
tion of haemorrhagic shock, and PVD and PPV were reduced. These observations
support those of other investigators in clinical and preclinical studies of microcircula-
tory changes in haemorrhagic shock [18, 19]. The automatic analysis, however, was not
able to demonstrate these characteristic microcirculatory changes of haemorrhagic
shock.
Table 3 Intraclass correlation coefficient between manual and automatic analyses
Variable Data set Number ICC [95% CI] Agreement
TVD [mm*mm−2] All videos 85 −0.267 [−0.949–0.176] Poor
Baseline 41 −0.069 [−1.01–0.430] Poor
Shock 44 −0.568 [−1.874–0.144] Poor
PVD [mm*mm−2] All videos 85 −0.219 [−0.875–0.208] Poor
Baseline 41 −0.013 [−0.899–0.460] Poor
Shock 44 −0.379 [−1.538–0.247] Poor
PPV [%] All videos 85 −0.074 [− 0.651–0.302] Poor
Baseline 41 0.274 [− 0.361–0.613] Poor
Shock 44 −0.193 [−1.187–0.349] Poor
Agreement as suggested by Cicchetti [15] (values below 0.40 are considered as “poor” agreement, between 0.40 and 0.59as “fair” agreement, between 0.60 and 0.74 as “good” agreement and for greater 0.74, the level of agreementis “excellent”)ICC intraclass correlation coefficient, CI confidence interval, TVD total vessel density, PVD perfused vessel density, PPVproportion of perfused vessels
Table 4 Bland-Altman analysis between manual and automatic analyses
Variable Data set Number Mean bias [95% CI] LOA
TVD [mm*mm−2] All videos 85 7.44 [6.12–8.77] −4.57–19.45
Baseline 41 7.66 [5.66–9.67] −4.79–20.11
Shock 44 7.24 [5.42–9.06] −4.50–18.98
PVD [mm*mm−2] All videos 85 3.37 [1.61–5.12] −12.58–19.32
Baseline 41 5.61 [3.45–7.78] −7.84–19.06
Shock 44 1.27 [−1.38–3.93] −15.84–18.38
PPV [%] All videos 85 −23.09 [−29.66–(−16.51)] −82.83–36.65
Baseline 41 −11.62 [−17.34–(−5.91)] −47.12–23.88
Shock 44 −33.77 [−44.60–(−22.94)] −130.57–36.03
LOA limits of agreement, TVD total vessel density, PVD perfused vessel density, PPV proportion of perfused vessels
Arnemann et al. Intensive Care Medicine Experimental (2016) 4:37 Page 6 of 11

Examination of the Bland-Altman plots revealed a bias in the same variables whose
dimension was high. Furthermore, LOA were too wide for all variables. According to
Bland and Altman, these signs not only indicate a constant bias between the two
methods but also a high variation making a correlation between them unlikely [17].
Fig. 1 Bland-Altman plots for a total vessel density and b perfused vessel density (each n= 85). Bland and Altmanrecommended plotting the mean of two measurement methods against the difference of both [17]. Continuousline represents the mean difference whereas upper and lower dashed lines represent the limits of agreement (LOA)(equivalent to ±1.96 SD of mean difference). Bland-Altman plots have to be inspected visually. Mean differencerepresents the mean bias between measurements. LOA are a measure of dispersion between both methods. Theevaluator has to decide whether these values are acceptable in the context of the measured variable. TVD totalvessel density, PVD perfused vessel density, SD standard deviation, LOA limits of agreement
Arnemann et al. Intensive Care Medicine Experimental (2016) 4:37 Page 7 of 11

Accordingly, the comparison of the two methods evaluated by ICC revealed a poor
agreement in all TVD, PVD and PPV.
Microcirculatory changes in haemorrhagic shock potentially could have influenced
the correlation analysis. There is a risk that vessels, which were intermittently (e.g. large
plasma gaps) or very slowly perfused by red blood cells, are better recognised by an ex-
perienced operator than by an automatic analysis software. Therefore, the correlation
at baseline (when perfusion is supposed to be physiological) might be better than in
haemorrhagic shock, where low flow vessels are more likely to be found. To exclude
this suspicion, the agreement between manual and automatic analyses was investigated
separately for each time point (baseline and shock). Notably, no correlation or agree-
ment between the two analysis methods was found when separating the values for base-
line and shock. As a consequence, an influence of the pathophysiological changes
during haemorrhagic shock on the correlation seems to be unlikely.
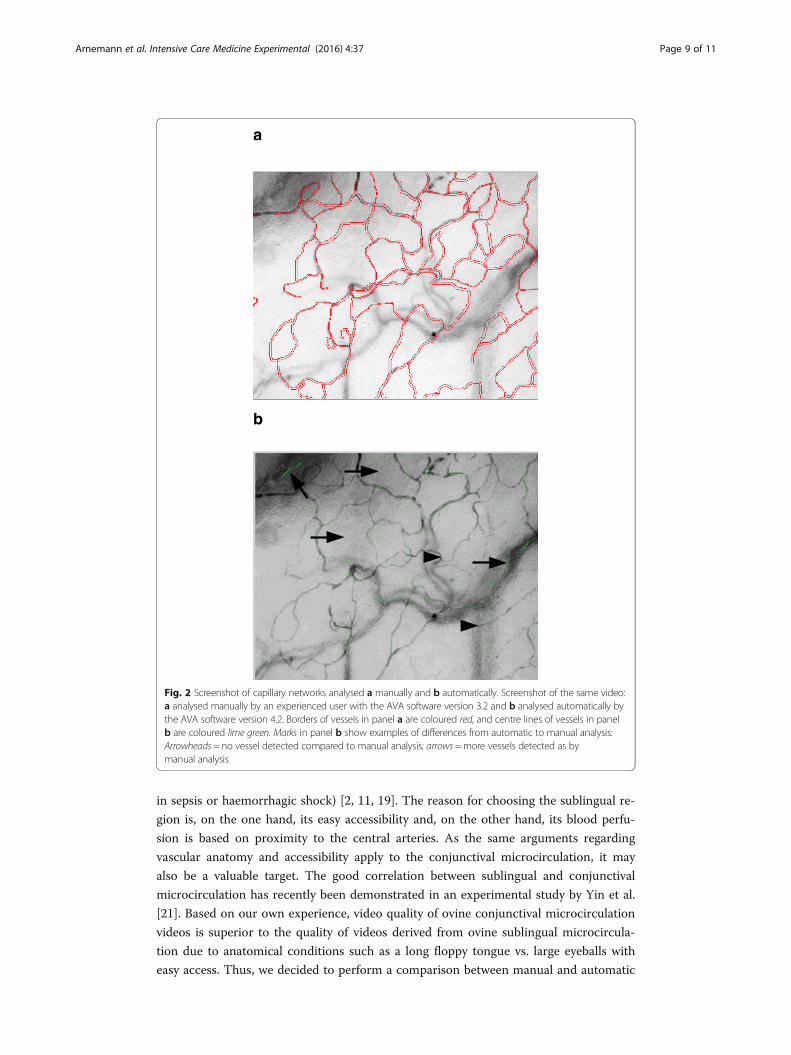
The poor correlation between both analyses could reasonably be attributed to short-
comings of the analysis algorithm for vessel detection in the automatic analysis as illus-
trated in Fig. 2. Figure 2 shows screenshots of the capillary networks drawn by
automatic analysis and manually by an experienced user in a corresponding video of
ovine conjunctival microcirculation. The automatic analysis algorithm was not able to
differentiate between different focus depths meaning that the algorithm detects vessels,
which were located outside the focal plane, and, in contrast, would not be “drawn in”
by an experienced investigator using manual analysis software. This misinterpretation
by automatic analysis leads to different values for vessel-density-dependent variables
compared to manual analysis. Further improvement of automatic analysis software will
primarily have to challenge the shortcomings of vessel detection to improve overall
quality of analysis results.
Parameters that describe flow conditions of the microcirculation are important as
they provide information about diffusion and convection [9]. Following the consensus
recommendations, evaluating the microcirculation should include a flow index [11]. An
overview of flow conditions in the microcirculation is, for example, provided by the
semi-quantitative microvascular flow index (MFI) by classifying microvascular flow into
different categories (no, intermittent, sluggish or continuous flow) [20]. The automatic
analysis provides no flow-related results except PPV and PVD, which are estimates of
the flow-dependent functional capillary density, but provide no information about the
flow itself. Thus, it was not possible to carry out a comparison of variables describing
flow between manual analysis and automatic analysis. The missing detection of differ-
ent flow states by automatic analysis would also be a likely explanation for the lack of
changes in PVD and PPV following haemorrhage as detailed above. In the flow-
independent parameter TVD (which simply detects all visible vessels), both analysis
methods revealed no changes between baseline and shock. Manual analysis was able to
detect changes in the flow-dependent variables PVD and PPV whereas automatic ana-
lysis failed to detect these.
The present study has some limitations that need to be mentioned. As videos were
obtained in an animal model of haemorrhagic shock, results may not apply to human
microcirculatory analysis. In addition, videos of ovine conjunctival microcirculation
were investigated, whereas the sublingual region is usually the area of choice for the
clinical examination of human microcirculation (especially for studying abnormalities
Arnemann et al. Intensive Care Medicine Experimental (2016) 4:37 Page 8 of 11
in sepsis or haemorrhagic shock) [2, 11, 19]. The reason for choosing the sublingual re-
gion is, on the one hand, its easy accessibility and, on the other hand, its blood perfu-
sion is based on proximity to the central arteries. As the same arguments regarding
vascular anatomy and accessibility apply to the conjunctival microcirculation, it may
also be a valuable target. The good correlation between sublingual and conjunctival
microcirculation has recently been demonstrated in an experimental study by Yin et al.
[21]. Based on our own experience, video quality of ovine conjunctival microcirculation
videos is superior to the quality of videos derived from ovine sublingual microcircula-
tion due to anatomical conditions such as a long floppy tongue vs. large eyeballs with
easy access. Thus, we decided to perform a comparison between manual and automatic
a
b
Fig. 2 Screenshot of capillary networks analysed a manually and b automatically. Screenshot of the same video:a analysed manually by an experienced user with the AVA software version 3.2 and b analysed automatically bythe AVA software version 4.2. Borders of vessels in panel a are coloured red, and centre lines of vessels in panelb are coloured lime green. Marks in panel b show examples of differences from automatic to manual analysis:Arrowheads = no vessel detected compared to manual analysis; arrows =more vessels detected as bymanual analysis
Arnemann et al. Intensive Care Medicine Experimental (2016) 4:37 Page 9 of 11

analyses using high-quality conjunctival videos. It may be possible that automatic ana-
lysis works better with sublingual videos of microcirculation. Also, the AVA software
version 4.2 was developed to automatically analyse videos obtained by SDF imaging
technique. However, as microcirculatory videos obtained by IDF technique provide bet-
ter image quality [22, 23] and can be converted to and opened in AVA software version
4.2, analysis results should be at least as good as with videos from SDF cameras. At last,
it is unclear if the results of the present study can be transferred to pathophysiological
conditions other than haemorrhagic shock as we only examined microcirculation dur-
ing the induction of haemorrhage. Further investigations are needed to address these
limitations.
ConclusionsCharacteristic changes in microcirculation during ovine haemorrhagic shock could not be
reproduced by automatic analysis with the AVA 4.2 software. No flow-quantifying variable
was given by automatic analysis, and there was only a poor correlation between automatic
analysis and the current gold standard (manual analysis). Therefore, the automatic ana-
lysis with the AVA 4.2 software cannot be recommended at present. Further improve-
ments in the detection algorithm are necessary, before an automatic analysis could be re-
evaluated for the evaluation of microcirculation in research or clinical routine.
Additional files
Additional file 1: Raw data of blood withdrawal, haemodynamics, blood gas analysis and microcirculatoryanalysis. (XLSX 10 kb)
Additional file 2: Raw data of microcirculatory analysis of individual videos. (XLSX 14 kb)
AbbreviationsCI: cardiac index; HR: heart rate; ICC: intraclass correlation coefficient; IDF: incident dark field; LOA: limits of agreement;MAP: mean arterial pressure; PPV: proportion of perfused vessels; PVD: perfused vessel density; SDF: sidestream darkfield; SVI: stroke volume index; TVD: total vessel density
AcknowledgementsNot applicable.
FundingThe study providing the data for the present investigation was an investigator-initiated trial supported by FreseniusKabi, Bad Homburg, Germany.
Availability of data and materialsThe datasets supporting the conclusions of this article are included within the article and its additional files.
Authors’ contributionsPA and MH helped in the design and conception, data acquisition, data management, interpretation of data, statisticalanalysis and preparation of the manuscript. TK, AM and SR helped in the data management and interpretation of data,revised the manuscript critically and approved the final version. HVA performed the data acquisition and interpretationof data, revised the manuscript critically and approved the final version. MW helped in the design and conception andmade profound revision of the manuscript and approved the final version. CE also helped in the design andconception, data acquisition, data management, interpretation of data and preparation of the manuscript. All authorsread and approved the final manuscript.
Competing interestsThe authors declare that they have no competing interests.
Consent for publicationNot applicable.
Ethics approvalThe present study was approved by the local veterinary authority (North Rhine-Westphalia State Environment Agency)under reference number 84-02.04.2013.A003.
Arnemann et al. Intensive Care Medicine Experimental (2016) 4:37 Page 10 of 11

Author details1Department of Anaesthesiology, Intensive Care and Pain Therapy, Muenster University Hospital,Albert-Schweitzer-Campus 1, Building A1, 49149 Muenster, Germany. 2Department of Cardiovascular, Respiratory,Nephrological, Anesthesiological and Geriatric Sciences, University of Rome, “La Sapienza”, Viale del Policlinico 155,00161 Rome, Italy. 3Department of Anaesthesiology, Greifswald University Hospital, Ferdinand-Sauerbruch-Straße,17475 Greifswald, Germany.
Received: 9 August 2016 Accepted: 7 November 2016
References1. Edul VSK, Ince C, Vazquez AR et al (2016) Similar microcirculatory alterations in patients with normodynamic and
hyperdynamic septic shock. Ann Am Thorac Soc 13:240–247. doi:10.1513/AnnalsATS.201509-606OC2. Edul VSK, Enrico C, Laviolle B et al (2012) Quantitative assessment of the microcirculation in healthy volunteers
and in patients with septic shock. Crit Care Med 40:1443–1448. doi:10.1097/CCM.0b013e31823dae593. Trzeciak S, Dellinger RP, Parrillo JE et al (2007) Early microcirculatory perfusion derangements in patients with
severe sepsis and septic shock: relationship to hemodynamics, oxygen transport, and survival. Ann EmergMed 49:88–98. doi:10.1016/j.annemergmed.2006.08.021, 98.e1–2
4. Sakr Y, Dubois M-J, De Backer D et al (2004) Persistent microcirculatory alterations are associated with organfailure and death in patients with septic shock. Crit Care Med 32:1825–1831
5. Vellinga NAR, Boerma EC, Koopmans M et al (2015) International study on microcirculatory shock occurrence inacutely ill patients. Crit Care Med 43:48–56. doi:10.1097/CCM.0000000000000553
6. Goedhart PT, Khalilzada M, Bezemer R et al (2007) Sidestream dark field (SDF) imaging: a novel stroboscopic LEDring-based imaging modality for clinical assessment of the microcirculation. Opt Express 15:15101–15114
7. Aykut G, Veenstra G, Scorcella C et al (2015) Cytocam-IDF (incident dark field illumination) imaging for bedsidemonitoring of the microcirculation. Intensive Care Med Exp 3:40. doi:10.1186/s40635-015-0040-7
8. Tanaka S, Harrois A, Nicolaï C et al (2015) Qualitative real-time analysis by nurses of sublingual microcirculation inintensive care unit: the MICRONURSE study. Crit Care 19:388. doi:10.1186/s13054-015-1106-3
9. Ince C (2015) Hemodynamic coherence and the rationale for monitoring the microcirculation. Crit Care19(Suppl 3):S8. doi:10.1186/cc14726
10. Kanoore Edul VS, Ince C, Dubin A (2015) What is microcirculatory shock? Curr Opin Crit Care 21:245–252.doi:10.1097/MCC.0000000000000196
11. De Backer D, Hollenberg S, Boerma C, et al. (2007) How to evaluate the microcirculation: report of a round tableconference. In: Crit Care. p R101
12. Hansard SL (1956) Residual organ blood volume of cattle, sheep and swine. Proc Soc Exp Biol Med 91:31–3413. Massey MJ, Larochelle E, Najarro G et al (2013) The microcirculation image quality score: development and
preliminary evaluation of a proposed approach to grading quality of image acquisition for bedsidevideomicroscopy. J Crit Care 28:913–917. doi:10.1016/j.jcrc.2013.06.015
14. Dobbe JGG, Streekstra GJ, Atasever B et al (2008) Measurement of functional microcirculatory geometry and velocitydistributions using automated image analysis. Med Biol Eng Comput 46:659–670. doi:10.1007/s11517-008-0349-4
15. Rankin G, Stokes M (1998) Reliability of assessment tools in rehabilitation: an illustration of appropriate statisticalanalyses. Clin Rehabil 12:187–199
16. Cicchetti DV (1994) Guidelines, criteria, and rules of thumb for evaluating normed and standardized assessmentinstruments in psychology. Psychol Assess 6:284–290. doi:10.1037/1040-3590.6.4.284
17. Bland JM, Altman DG (1986) Statistical methods for assessing agreement between two methods of clinicalmeasurement. Lancet 1:307–310
18. González R, Urbano J, López J et al (2016) Microcirculatory alterations during haemorrhagic shock and afterresuscitation in a paediatric animal model. Injury 47:335–341. doi:10.1016/j.injury.2015.10.075
19. Tachon G, Harrois A, Tanaka S et al (2014) Microcirculatory alterations in traumatic hemorrhagic shock. Crit CareMed 42:1433–1441. doi:10.1097/CCM.0000000000000223
20. Boerma EC, Mathura KR, van der Voort PHJ et al (2005) Quantifying bedside-derived imaging of microcirculatoryabnormalities in septic patients: a prospective validation study. Crit Care 9:R601–R606. doi:10.1186/cc3809
21. Yin L, Yang Z, Yu H et al (2016) Changes in sublingual microcirculation is closely related with that of bulbarconjunctival microcirculation in a Rat model of cardiac arrest. Shock 45:428–433. doi:10.1097/SHK.0000000000000508
22. van Elteren HA, Ince C, Tibboel D et al (2015) Cutaneous microcirculation in preterm neonates: comparisonbetween sidestream dark field (SDF) and incident dark field (IDF) imaging. J Clin Monit Comput 29:543–548.doi:10.1007/s10877-015-9708-5
23. Gilbert-Kawai E, Coppel J, Bountziouka V et al (2016) A comparison of the quality of image acquisition between theincident dark field and sidestream dark field video-microscopes. BMC Med Imaging 16:10. doi:10.1186/s12880-015-0078-8
Arnemann et al. Intensive Care Medicine Experimental (2016) 4:37 Page 11 of 11


![[MI 016-131] PR Series Platinum Resistance Temperature ...](https://static.fdokumen.com/doc/165x107/632122ff537c10e838028447/mi-016-131-pr-series-platinum-resistance-temperature-.jpg)