RWHAP Part D University of Illinois 2019 Audit Report
337
CLAconnect.com WEALTH ADVISORY OUTSOURCING AUDIT, TAX, AND CONSULTING STATE OF ILLINOIS UNIVERSITY OF ILLINOIS COMPLIANCE EXAMINATION (In Accordance with the Single Audit Act and Applicable Federal Regulations) Year Ended June 30, 2019 Performed as Special Assistant Auditors for the Auditor General, State of Illinois
-
Upload
khangminh22 -
Category
Documents
-
view
2 -
download
0
Transcript of RWHAP Part D University of Illinois 2019 Audit Report

CLAconnect.com
WEALTH ADVISORY
OUTSOURCING
AUDIT, TAX, AND CONSULTING
STATE OF ILLINOISUNIVERSITY OF ILLINOIS
COMPLIANCE EXAMINATION
(In Accordance with the Single Audit Actand Applicable Federal Regulations)
Year Ended June 30, 2019
Performed as Special Assistant Auditorsfor the Auditor General, State of Illinois

STATE OF ILLINOISUNIVERSITY OF ILLINOIS
COMPLIANCE EXAMINATIONYear Ended June 30, 2019
TABLE OF CONTENTSPage
University Officials ....................................................................................................................................................... 1
Management Assertion Letter...................................................................................................................................... 2
Compliance Report:
Summary……………..…...........................................................................................................................................4
Independent Accountants’ Report on State Compliance and on Internal Control overCompliance for State Compliance Purposes .......................................................................................... 9
Independent Auditors’ Report on Internal Control over Financial Reporting and on
Compliance and Other Matters Based on an Audit of Financial Statements Performed in Accordance with Government Auditing Standards.......................................................... 12
Independent Auditors’ Report on Compliance for Each Major Federal Program, on
Internal Control over Compliance, and on the Schedule of Expenditures of Federal Awards Required by the Uniform Guidance ......................................................................................... 14
Schedule of Findings and Questioned Costs:Summary of Auditors’ Results ..................................................................................................................... 17Current Findings - Government Auditing Standards .................................................................................... 18Current Findings - Federal Compliance....................................................................................................... 22Current Findings - State Compliance........................................................................................................... 31Prior Findings Not Repeated ....................................................................................................................... 40Table of Award Numbers Referenced in Federal Compliance Findings ...................................................... 43
Financial Related Information:Financial Related Information Summary............................................................................................................. 61Financial Related Schedules:
Schedule of Expenditures of Federal Awards.............................................................................................. 62Attachments to Schedule of Expenditures of Federal Awards:
Totals by CFDA Number for ‘Other Programs’ ................................................................................... 133Noncash Federal Awards – Federal Loans Disbursed and Capital Contributions .............................. 137Schedule of Loans Issued and Outstanding Balances – Student
Loan Disclosure .......................................................................................................................... 138Details for Pass-Through Federal Funding......................................................................................... 139
Notes to Schedule of Expenditures of Federal Awards ............................................................................. 257
Related Reports Published Under Separate Cover:
Financial Audits for the Year Ended June 30, 2019 ofUniversity of IllinoisAuxiliary Facilities SystemHealth Services Facilities System
Supplementary Financial Information Report for the Year ended June 30, 2019 of University of Illinois
Reports Required Under Government Auditing Standards for the University of Illinois,Auxiliary Facilities System and Health Services Facilities System for the Year ended June 30, 2019

STATE OF ILLINOISUNIVERSITY OF ILLINOIS
COMPLIANCE EXAMINATIONYear Ended June 30, 2019
1
UNIVERSITY OFFICIALS
Timothy L. Killeen President
Avijit Ghosh Vice President / Chief Financial Officer and Comptroller
Michael B. Bass Senior Associate Vice President for Business and Financial Services and Deputy Comptroller
Brent Rasmus Controller and Assistant Vice President for Business and Finance
Julie A. Zemaitis Executive Director of University Audits
Robert J. Jones Chancellor and Vice President, University of Illinois at Urbana-Champaign
Ginger Velazquez Interim Assistant Vice President for Business and Finance, University of Illinois at Urbana-Champaign
Michael D. Amiridis Chancellor and Vice President, University of Illinois at Chicago
Gloria Keeley Interim Assistant Vice President for Business and Finance, University of Illinois at Chicago
Susan J. Koch Chancellor and Vice President, University of Illinois at Springfield
Janet M. Ford Interim Director of Business Services, University of Illinois at Springfield
Administrative Offices are located at:
University Office of Business andFinancial Services (OBFS)238 Henry Administration Building 506 South Wright StreetUrbana, Illinois 61801
Springfield CampusBusiness Services Building Room 57Springfield, Illinois 62703
Chicago Campus809 South MarshfieldRoom 613Chicago, Illinois 60612
Urbana-Champaign Campus301 Coble Hall801 South Wright StreetChampaign, Illinois 61820


STATE OF ILLINOISUNIVERSITY OF ILLINOIS
COMPLIANCE EXAMINATIONYear Ended June 30, 2019
4 (Continued)
COMPLIANCE REPORTSUMMARY
The compliance testing performed during this examination was conducted in accordance with Government Auditing Standards and the Illinois State Auditing Act.
ACCOUNTANTS’ REPORT
The Independent Accountants’ Report on State Compliance and on Internal Control Over Compliance for State Compliance Purposes does not contain scope limitations, disclaimers, or other significant non-standard language.
SUMMARY OF FINDINGS
Number ofCurrentreport
Priorreport
Findings 12 18
Repeated Findings 11 15
Prior Recommendations Implemented or Not Repeated 7 3
SCHEDULE OF FINDINGS AND QUESTIONED COSTS
Item No. PageLast
Reported Description Finding type
FINDINGS (GOVERNMENT AUDITING STANDARDS)
2019-001 18 2018 Inadequate Procedures over Expense Deferrals and Other Cut-off RelatedIssues
Significant Deficiency
2019-002 20 2018 Inadequate Controls over University Procurement Card Transactions
Significant Deficiency
STATE OF ILLINOISUNIVERSITY OF ILLINOIS
COMPLIANCE EXAMINATIONYear Ended June 30, 2019
5 (Continued)
COMPLIANCE REPORTSUMMARY
Item No. PageLast
Reported Description Finding type
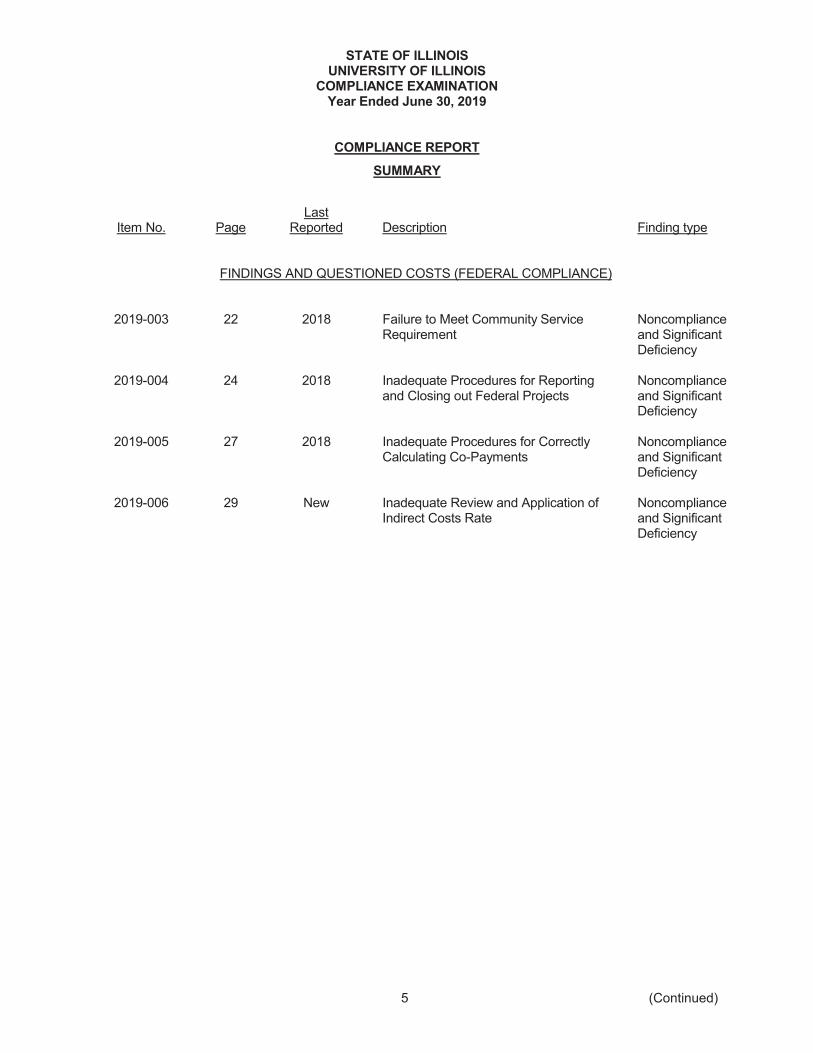
FINDINGS AND QUESTIONED COSTS (FEDERAL COMPLIANCE)
2019-003 22 2018 Failure to Meet Community ServiceRequirement
Noncompliance and Significant Deficiency
2019-004 24 2018 Inadequate Procedures for Reporting and Closing out Federal Projects
Noncompliance and Significant Deficiency
2019-005 27 2018 Inadequate Procedures for Correctly Calculating Co-Payments
Noncompliance and Significant Deficiency
2019-006 29 New Inadequate Review and Application of Indirect Costs Rate
Noncompliance and Significant Deficiency

STATE OF ILLINOISUNIVERSITY OF ILLINOIS
COMPLIANCE EXAMINATIONYear Ended June 30, 2019
6 (Continued)
COMPLIANCE REPORTSUMMARY
Item No. PageLast
Reported Description Finding type
FINDINGS (STATE COMPLIANCE)
2019-007 31 2018 Failure to Maintain Adequate Records Substantiating Written Notices
Noncompliance and Significant Deficiency
2019-008 33 2018 Failure to Follow Time Reporting Requirements
Noncompliance and Significant Deficiency
2019-009 34 2018 Inadequate Controls over University Travel Card Transactions
Noncompliance and Significant Deficiency
2019-010 36 2018 Noncompliance with the Illinois Health Policy Center Act
Noncompliance and Significant Deficiency
2019-011 37 2018 Noncompliance with University Guidelines of the Illinois Legislative Audit Commission
Noncompliance and Significant Deficiency
2019-012 38 2018 Lack of Adequate Controls over the Review of Internal Controls over Service Providers
Noncompliance and Significant Deficiency
In addition, the following findings which are reported as current findings related to Government Auditing Standards also meet the reporting requirements for State Compliance.
2019-001 18 2018 Inadequate Procedures over Expense Deferrals and Other Cut-off RelatedIssues
Noncompliance and Significant Deficiency
2019-002 20 2018 Inadequate Controls over University Procurement Card Transactions
Noncompliance and Significant Deficiency
STATE OF ILLINOISUNIVERSITY OF ILLINOIS
COMPLIANCE EXAMINATIONYear Ended June 30, 2019
7 (Continued)
COMPLIANCE REPORTSUMMARY
Item No. PageLast
Reported Description Finding type
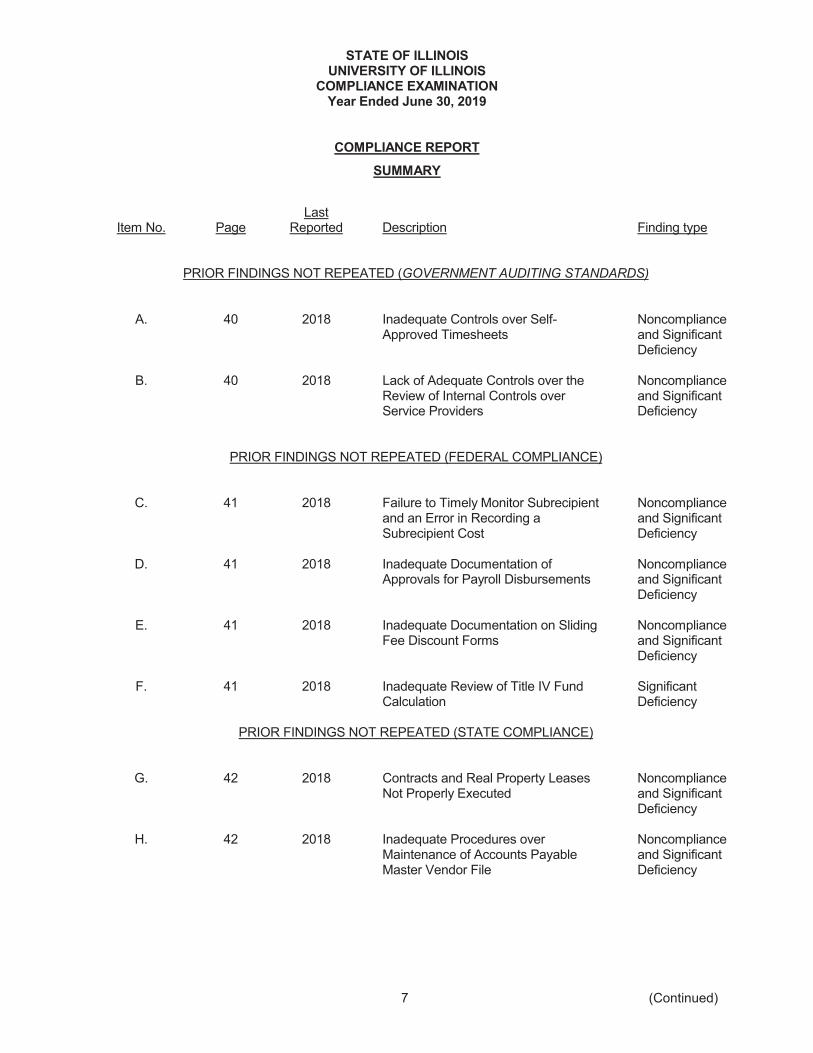
PRIOR FINDINGS NOT REPEATED (GOVERNMENT AUDITING STANDARDS)
A. 40 2018 Inadequate Controls over Self-Approved Timesheets
Noncompliance and Significant Deficiency
B. 40 2018 Lack of Adequate Controls over the Review of Internal Controls over Service Providers
Noncompliance and Significant Deficiency
PRIOR FINDINGS NOT REPEATED (FEDERAL COMPLIANCE)
C. 41 2018 Failure to Timely Monitor Subrecipient and an Error in Recording a Subrecipient Cost
Noncompliance and Significant Deficiency
D. 41 2018 Inadequate Documentation of Approvals for Payroll Disbursements
Noncompliance and Significant Deficiency
E. 41 2018 Inadequate Documentation on Sliding Fee Discount Forms
Noncompliance and Significant Deficiency
F. 41 2018 Inadequate Review of Title IV Fund Calculation
Significant Deficiency
PRIOR FINDINGS NOT REPEATED (STATE COMPLIANCE)
G. 42 2018 Contracts and Real Property Leases Not Properly Executed
Noncompliance and Significant Deficiency
H. 42 2018 Inadequate Procedures over Maintenance of Accounts Payable Master Vendor File
Noncompliance and Significant Deficiency

STATE OF ILLINOISUNIVERSITY OF ILLINOIS
COMPLIANCE EXAMINATIONYear Ended June 30, 2019
8
COMPLIANCE REPORTSUMMARY
EXIT CONFERENCE
The University waived the exit conference for the Federal Compliance OMB Uniform Guidance audit and the State Compliance examination in an email dated February 3, 2020, from Ginger Velazquez, Interim Assistant Vice President for Business and Finance of the Office of the Business and Financial Services. Responses to the findings were provided by Jennifer Erickson, Associate Director for Business and Finance in emails dated February 6, 2020 and February 7, 2020.

9
INDEPENDENT ACCOUNTANTS’ REPORTON STATE COMPLIANCE AND ON INTERNAL CONTROL OVER COMPLIANCE
FOR STATE COMPLIANCE PURPOSES
Honorable Frank J. MautinoAuditor General, State of Illinois
andBoard of TrusteesUniversity of Illinois
Compliance
As Special Assistant Auditors for the Auditor General, we have examined compliance by the University of Illinois with the specified requirements listed below, as more fully described in the Audit Guide for Financial Audits and Compliance Attestation Engagements of Illinois State Agencies (Audit Guide) as adopted by the Auditor General, during the year ended June 30, 2019. Management of the University of Illinois is responsible for compliance with the specified requirements. Our responsibility is to express an opinion on the University of Illinois’ compliance with the specified requirements based on our examination.
The specified requirements are:
A. The University of Illinois has obligated, expended, received, and used public funds of the State inaccordance with the purpose for which such funds have been appropriated or otherwise authorizedby law.
B. The University of Illinois has obligated, expended, received, and used public funds of the State inaccordance with any limitations, restrictions, conditions, or mandatory directions imposed by lawupon such obligation, expenditure, receipt, or use.
C. The University of Illinois has complied, in all material respects, with applicable laws and regulations,including the State uniform accounting system, in its financial and fiscal operations.
D. State revenues and receipts collected by the University of Illinois are in accordance with applicablelaws and regulations and the accounting and recordkeeping of such revenues and receipts is fair,accurate, and in accordance with law.
E. Money or negotiable securities or similar assets handled by the University of Illinois on behalf ofthe State or held in trust by the University of Illinois have been properly and legally administered,and the accounting and recordkeeping relating thereto is proper, accurate, and in accordance withlaw.
Our examination was conducted in accordance with attestation standards established by the American Institute of Certified Public Accountants, the standards applicable to attestation engagements contained in Government Auditing Standards issued by the Comptroller General of the United States, the Illinois State Auditing Act (Act), and the Audit Guide. Those standards, the Act, and the Audit Guide require that we plan and perform the examination to obtain reasonable assurance about whether the University of Illinoiscomplied with the specified requirements in all material respects. An examination involves performing procedures to obtain evidence about whether the University of Illinois complied with the specified requirements. The nature, timing, and extent of the procedures selected depend on our judgement, including an assessment of the risks of material noncompliance with the specified requirements, whether due to fraud or error. We believe that the evidence we obtained is sufficient and appropriate to provide a reasonable basis for our opinion.

10
Our examination does not provide a legal determination on the University of Illinois’ compliance with the specified requirements.
In our opinion, the University of Illinois complied with the specified requirements during the year ended June 30, 2019, in all material respects. However, the results of our procedures disclosed instances of noncompliance with the specified requirements, which are required to be reported in accordance with criteria established by the Audit Guide and are described in the accompanying Schedule of Findings and Questioned Costs as items 2019-001, 2019-002, and 2019-007 through 2019-012.
The University of Illinois’ responses to the compliance findings identified in our examination are described in the accompanying Schedule of Findings and Questioned Costs. The University of Illinois’ responses were not subjected to the procedures applied in the examination and, accordingly, we express no opinion on them.
The purpose of this report is solely to describe the scope of our testing and the results of that testing in accordance with the requirements of the Audit Guide. Accordingly, this report is not suitable for any other purpose.
Internal Control Over Compliance
Management of the University of Illinois is responsible for establishing and maintaining effective internal control over compliance with the specified requirements (internal control).
In planning and performing our examination, we considered the University of Illinois’ internal control to determine the examination procedures that are appropriate in the circumstances for the purpose of expressing our opinion on the University of Illinois’ compliance with the specified requirements and to test and report on the University of Illinois’ internal control in accordance with the Audit Guide, but not for the purpose of expressing an opinion on the effectiveness of the University of Illinois’ internal control. Accordingly, we do not express an opinion on the effectiveness of the University of Illinois’ internal control.
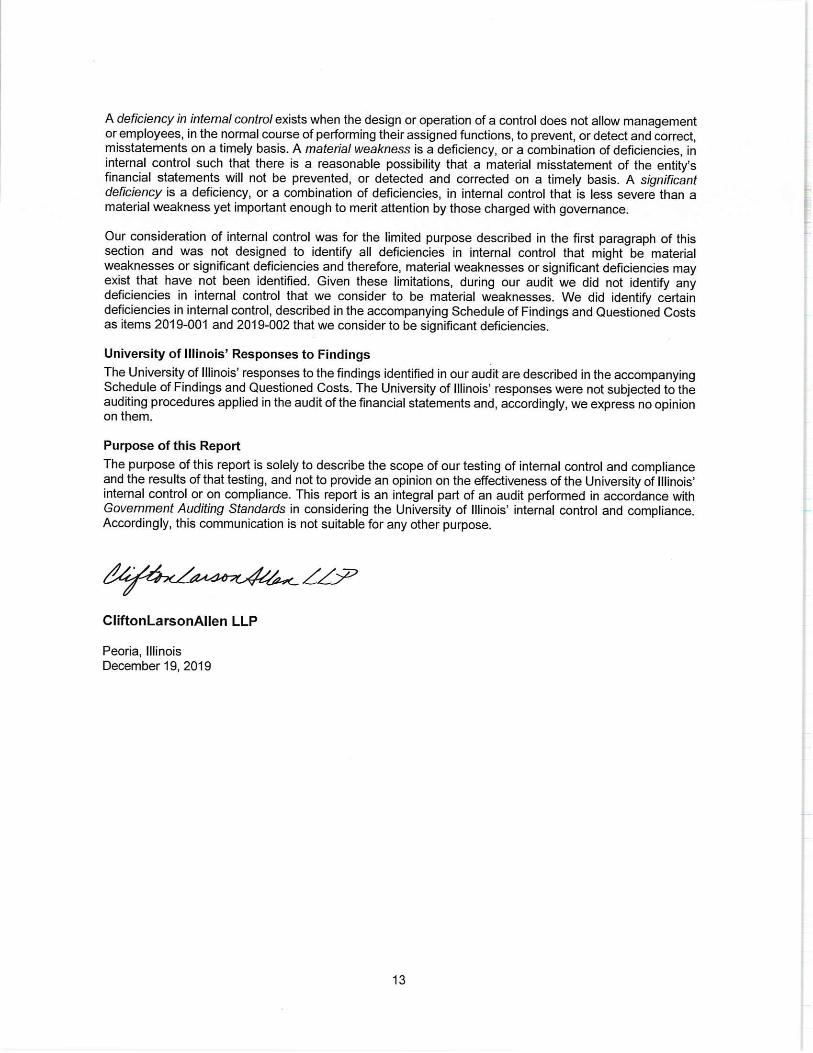
A deficiency in internal control exists when the design or operation of a control does not allow management or employees, in the normal course of performing their assigned functions, to prevent, or detect and correct, noncompliance with the specified requirements on a timely basis. A material weakness is a deficiency, or a combination of deficiencies, in internal control, such that there is a reasonable possibility that material noncompliance with the specified requirements will not be prevented, or detected and corrected, on a timely basis. A significant deficiency is a deficiency, or a combination of deficiencies, in internal control that is less severe than a material weakness, yet important enough to merit attention by those charged with governance.
Our consideration of internal control was for the limited purpose described in the first paragraph of this section and was not designed to identify all deficiencies in internal control that might be material weaknesses or significant deficiencies and, therefore, material weaknesses or significant deficiencies may exist that have not been identified. Given these limitations, during our examination, we did not identify any deficiencies in internal control that we consider to be material weaknesses. We did identify certain deficiencies in internal control, described in the accompanying Schedule of Findings and Questioned Costs as item 2019-001, 2019-002, and 2019-007 through 2019-012, that we consider to be significant deficiencies.
As required by the Audit Guide, immaterial findings excluded from this report have been reported in a separate letter.
The University of Illinois’ responses to the internal control findings identified in our examination are described in the accompanying Schedule of Findings and Questioned Costs. The University of Illinois’ responses were not subjected to the procedures applied in the examination and, accordingly, we express no opinion on them.


12
INDEPENDENT AUDITORS’ REPORT ON INTERNAL CONTROL OVER FINANCIAL REPORTING AND ON COMPLIANCE AND OTHER MATTERS BASED ON AN AUDIT
OF FINANCIAL STATEMENTS PERFORMED IN ACCORDANCE WITH GOVERNMENT AUDITING STANDARDS
Honorable Frank J. MautinoAuditor General, State of Illinois
andBoard of TrusteesUniversity of Illinois
As Special Assistant Auditors for the Auditor General, we have audited, in accordance with the auditing standards generally accepted in the United States of America and the standards applicable to financial audits contained in Government Auditing Standards issued by the Comptroller General of the United States, the financial statements of the business-type activities and the aggregate discretely presented component units of the University of Illinois, collectively a component unit of the State of Illinois, as of and for the year ended June 30, 2019, and the related notes to the financial statements, which collectively comprise the University of Illinois’ basic financial statements, and have issued our report thereon dated December 19, 2019. Our report includes a reference to other auditors who audited the financial statements of the discretely presented component units, as described in our report on the University’s financial statements. This report does not include the results of the other auditors’ testing of internal control over financial reporting or compliance and other matters that are reported on separately by those auditors.
The financial statements of the University of Illinois Foundation; University of Illinois Alumni Alliance; Wolcott, Wood, and Taylor, Inc.; Prairieland Energy, Inc.; Illinois Ventures, LLC; the University Research Park, LLC; and UI Singapore Research, LLC, component units of the University, were not audited in accordance with Government Auditing Standards and, accordingly, this report does not include reporting on internal control or compliance and other matters associated with these component units.
Compliance and Other MattersAs part of obtaining reasonable assurance about whether the University of Illinois’ financial statements are free from material misstatement, we performed tests of its compliance with certain provisions of laws, regulations, contracts, and grant agreements, noncompliance with which could have a direct and material effect on the determination of financial statement amounts. However, providing an opinion on compliance with those provisions was not an objective of our audit and, accordingly, we do not express such an opinion. The results of our tests disclosed no instances of noncompliance or other matters that are required to be reported under Government Auditing Standards.
Internal Control Over Financial ReportingManagement of the University of Illinois is responsible for establishing and maintaining effective internal control over financial reporting (internal control).
In planning and performing our audit of the financial statements, we considered the University of Illinois’ internal control to determine the audit procedures that are appropriate in the circumstances for the purpose of expressing our opinion on the financial statements, but not for the purpose of expressing an opinion on the effectiveness of the University of Illinois’ internal control. Accordingly, we do not express an opinion on the effectiveness of the University of Illinois’ internal control.

14
INDEPENDENT AUDITORS’ REPORT ON COMPLIANCE FOR EACH MAJOR FEDERAL PROGRAM, ON INTERNAL CONTROL OVER COMPLIANCE, AND
ON THE SCHEDULE OF EXPENDITURES OF FEDERAL AWARDS REQUIRED BY THE UNIFORM GUIDANCE
Honorable Frank J. MautinoAuditor General, State of Illinois
andBoard of TrusteesUniversity of Illinois
Report on Compliance for Each Major Federal ProgramAs Special Assistant Auditors for the Auditor General, we have audited compliance by the University of Illinois’ with the types of compliance requirements described in the OMB Compliance Supplement that could have a direct and material effect on each of the University of Illinois’ major federal programs for the year ended June 30, 2019. The University of Illinois’ major federal programs are identified in the Summary of Auditors’ Results section of the accompanying Schedule of Findings and Questioned Costs.
The schedule of expenditures of federal awards and our audit described below does not include expenditures of federal awards for those agencies determined to be component units of the University of Illinois for financial statement purposes.
Management’s ResponsibilityManagement is responsible for compliance with federal statutes, regulations, and the terms and conditions of its federal awards applicable to its federal programs.
Auditors’ ResponsibilityOur responsibility is to express an opinion on compliance for each of the University of Illinois’ major federal programs based on our audit of the types of compliance requirements referred to above. We conducted our audit of compliance in accordance with auditing standards generally accepted in the United States of America; the standards applicable to financial audits contained in Government Auditing Standards, issued by the Comptroller General of the United States; and the audit requirements of Title 2 U.S. Code of Federal Regulations Part 200, Uniform Administrative Requirements, Cost Principles, and Audit Requirements for Federal Awards (Uniform Guidance). Those standards and the Uniform Guidance require that we plan and perform the audit to obtain reasonable assurance about whether noncompliance with the types of compliance requirements referred to above that could have a direct and material effect on a major federal program occurred. An audit includes examining, on a test basis, evidence about University of Illinois’compliance with those requirements and performing such other procedures as we considered necessary in the circumstances.
We believe that our audit provides a reasonable basis for our opinion on compliance for each major federal program. However, our audit does not provide a legal determination of the University of Illinois’ compliance.

15
Opinion on Each Major Federal ProgramIn our opinion, the University of Illinois complied, in all material respects, with the types of compliance requirements referred to above that could have a direct and material effect on each of its major federal programs for the year ended June 30, 2019.
Other MattersThe results of our auditing procedures disclosed instances of noncompliance, which are required to be reported in accordance with the Uniform Guidance and which are described in the accompanying Schedule of Findings and Questioned Costs as items 2019-003 through 2019-006. Our opinion on each major federal program is not modified with respect to these matters.
The University of Illinois’ responses to the noncompliance findings identified in our audit are described in the accompanying Schedule of Findings and Questioned Costs. The University of Illinois’ responses were not subjected to the auditing procedures applied in the audit of compliance and, accordingly, we express no opinion on the responses.
Report on Internal Control Over ComplianceManagement of the University of Illinois’ is responsible for establishing and maintaining effective internal control over compliance with the types of compliance requirements referred to above. In planning and performing our audit of compliance, we considered the University of Illinois’ internal control over compliance with the types of requirements that could have a direct and material effect on each major federal program to determine the auditing procedures that are appropriate in the circumstances for the purpose of expressing an opinion on compliance for each major federal program and to test and report on internal control over compliance in accordance with the Uniform Guidance, but not for the purpose of expressing an opinion on the effectiveness of internal control over compliance. Accordingly, we do not express an opinion on the effectiveness of the University of Illinois’ internal control over compliance.
A deficiency in internal control over compliance exists when the design or operation of a control over compliance does not allow management or employees, in the normal course of performing their assigned functions, to prevent, or detect and correct, noncompliance with a type of compliance requirement of a federal program on a timely basis. A material weakness in internal control over compliance is a deficiency, or a combination of deficiencies, in internal control over compliance, such that there is a reasonable possibility that material noncompliance with a type of compliance requirement of a federal program will not be prevented, or detected and corrected, on a timely basis. A significant deficiency in internal control over compliance is a deficiency, or a combination of deficiencies, in internal control over compliance with a type of compliance requirement of a federal program that is less severe than a material weakness in internal control over compliance, yet important enough to merit attention by those charged with governance.
Our consideration of internal control over compliance was for the limited purpose described in the first paragraph of this section and was not designed to identify all deficiencies in internal control over compliance that might be material weaknesses or significant deficiencies and therefore, material weaknesses or significant deficiencies may exist that have not been identified. We did not identify any deficiencies in internal control over compliance that we consider to be material weaknesses. However, we identified certain deficiencies in internal control over compliance, as described in the accompanying Schedule of Findings and Questioned Costs as items 2019-003 through 2019-006 that we consider to be significant deficiencies.
The University of Illinois’ responses to the internal control over compliance findings identified in our audit are described in the accompanying Schedule of Findings and Questioned Costs. The University of Illinois’responses were not subjected to the auditing procedures applied in the audit of compliance and, accordingly, we express no opinion on the responses.
The purpose of this report on internal control over compliance is solely to describe the scope of our testing of internal control over compliance and the results of that testing based on the requirements of the Uniform Guidance. Accordingly, this report is not suitable for any other purpose.


STATE OF ILLINOISUNIVERSITY OF ILLINOIS
SCHEDULE OF FINDINGS AND QUESTIONED COSTSYear Ended June 30, 2019
17
SUMMARY OF AUDITORS’ RESULTS
Financial Statements
Type of auditors’ report issued: Unmodified
Internal control over financial reporting:! Material weakness(es) identified? Yes x No! Significant deficiencies identified? x Yes None reported
Noncompliance material to financial statements noted? Yes x No
Federal Awards
Internal control over major programs:! Material weakness(es) identified? Yes x No! Significant deficiencies identified? x Yes None reported
Type of auditors’ report issued on compliance for majorfederal programs: Unmodified
Any audit findings disclosed that are required to be reported in accordance with 2 CFR 200.516(a)? x Yes No
Identification of major programs:
CFDA Numbers Name of Federal Program or Cluster
93.575/93.596 Child Care and Development FundVarious Research and Development10.500 Cooperative Extension Service93.994 Maternal and Child Health Services Block Grant to the
States93.558 Temporary Assistance for Needy Families (TANF) Cluster
Dollar threshold used to distinguish betweenType A and Type B programs: $ 3,974,381
Auditee qualified as low-risk auditee? Yes x No

STATE OF ILLINOISUNIVERSITY OF ILLINOIS
CURRENT FINDINGS - GOVERNMENT AUDITING STANDARDSFor the Year Ended June 30, 2019
18 (Continued)
2019-001. Finding: Inadequate Procedures over Expense Deferrals and Other Cut-off RelateIssues
The University of Illinois (the University) has not established adequate internal controls over accurately identifying and recording deferred expense transactions and reporting prepaid expenses at fiscal year-end for financial reporting purposes.
During our audit, we noted that the University’s procedures to identify and record prepaid expenses include a review of all cash disbursements by University Payables (UPAY). UPAY identifies expense transactions that pertain to multiple fiscal years and codes them for further review by University Accounting and Financial Reporting (UAFR). UAFR will then post year-end journal entries to appropriately defer the identified expense transactions. In addition to the review of all cash disbursements by UPAY, UAFR also requires individual units to identify and report known accrual and deferral transactions at fiscal year-end for certain fund types. We also noted that the University’s year-end accounts payable procedures include specifically reviewing cash disbursements made subsequent to year-end through the end of October to determine which accounting period the related expense transactions pertain.
In relation to our test work over expense transactions, we reviewed 225 cash disbursement transactions (totaling $30,122,686), 60 P-Card expense transactions (totaling $368,921), and 60 T-Card expense transactions (totaling $234,802) recorded during the fiscal year. In relation to our test work over revenue transactions, we reviewed 60 cash receipt transactions recorded during the fiscal year (totaling $52,459,178). We also reviewed 18 cash disbursements occurring subsequent to year-end (totaling $67,263,877). Additionally, we separately reviewed 14 internal journal voucher transactions recorded during the fiscal year (totaling $1,054,912).
During our review of these transactions, we noted the following items were not recorded in the proper accounting period:
University of Illinois transactions! Three general and service expense cash disbursements (totaling $208,425) that were recorded as
expenses for fiscal year ended June 30, 2019, should have been fully accrued as of June 30, 2018;! One travel expense cash disbursement (totaling $6,821) that was recorded as expense for fiscal year
ended June 30, 2019, should have been fully accrued as of June 30, 2017; ! One telecommunication expense (totaling $33,625) that was recorded as expense for fiscal year ended
June 30, 2019, should have been partially deferred as of June 30, 2019 at an amount of $30,614, and then recognized as expenses for the fiscal year ended June 30, 2020;
! One printing expense (totaling $2,900) that was recorded as expense for fiscal year ended June 30, 2019, should have been fully deferred as of June 30, 2019; and
! One cash receipt (totaling $5,685) that was recorded as operating revenue for the fiscal year ended June 30, 2019, should have been fully accrued as of June 30, 2018.
University of Illinois P-card transactions! Three general expenses (totaling $11,836) that were recorded as expenses for fiscal year ended
June 30, 2019, should have been fully accrued as of June 30, 2018; and! Three general expenses (totaling $31,480) that were recorded as an expense for fiscal year ended
June 30, 2019, should have been partially deferred as of June 30, 2019 at an amount of $8,487, and then recognized as expenses for the fiscal year ended June 30, 2020.
University of Illinois T-card transactions! One general cash disbursement (totaling $3,459) that was recorded as expense for fiscal year ended
June 30, 2019, should have been fully accrued as of June 30, 2018.

STATE OF ILLINOISUNIVERSITY OF ILLINOIS
CURRENT FINDINGS - GOVERNMENT AUDITING STANDARDSFor the Year Ended June 30, 2019
19 (Continued)
Generally accepted accounting principles require transactions to be reported in the period they are incurred. Additionally, the Fiscal Control and Internal Auditing Act (30 ILCS 10/3001), requires the University to establish and maintain a system, or systems, of internal fiscal and administrative controls, which shall provide assurance that revenues, expenditures, and transfers of assets, resources, or funds applicable to operations are properly recorded and accounted for to permit the preparation of accounts and reliable financial and statistical reports and to maintain accountability over the State's resources. The University’s system of internal controls should include procedures to ensure expenses and revenues are recognized in the appropriate reporting period.
In discussing these conditions with University personnel, they stated that in many of these instances, the units associated with the exceptions did not adequately follow established procedures to record the transactions in the proper period.
Failure to accurately analyze and record cash receipts and disbursements within the proper fiscal year may result in the misstatement of the University’s financial statements. (Finding Code No. 2019-001, 2018-001, 2017-001, 2016-001, 2015-001, 2014-001, 2013-001, 12-01, 11-01, 10-03, 09-03)
Recommendation:
We recommend the University continue to review its process to assess the existence of current period revenues and expenses and consider changes necessary to ensure they are accurately identified and recorded for presentation in the University’s financial statements.
University Response:
Accepted. The University will continue taking corrective action to address the recommendation in this finding.

STATE OF ILLINOISUNIVERSITY OF ILLINOIS
CURRENT FINDINGS - GOVERNMENT AUDITING STANDARDSFor the Year Ended June 30, 2019
20 (Continued)
2019-002. Finding: Inadequate Controls over University Procurement Card Transactions
The University of Illinois (the University) has not complied with University policies and internal controls over procurement card transactions.
The University operates a procurement card program which allows individuals throughout the University to make smaller purchases (defined as less than $4,999) on a credit card which is directly paid by the University on a monthly basis. The University’s policies require employees assigned a procurement card to complete training on policies and procedures, pass a test, and sign an agreement stipulating they will use the card in accordance with University policy. This agreement is also required to be authorized by the individual’s supervisor or the department head. The University’s policies require transactions incurred on the procurement card to be assigned a reviewer.
During our test work over 63 procurement card transactions totaling $374,743, we noted the following:! Five (8%) transactions (totaling $9,756) were for charges such as transportation, prepaid tolls,
business meals and refreshments, all of which were prohibited by the University’s procurement card policies.
! One (2%) transaction (totaling $5,806) was paid in two or more installments, circumventing the card holder’s single transaction limit of $4,999.
! Twelve (19%) transactions (totaling $70,720) were not reconciled within seven days of appearance on the P-Card software, as required. The reconciliations were completed two to 51 days late.
The University has approximately 4,668 active procurement cards, and the procurement card expenditures paid for the year ended June 30, 2019 totaled $59,168,533.
The University policy states that the reconciler must review and reconcile each transaction with the Order Log and with the original, detailed, itemized receipt within seven business days of its appearance in the P-Card software, in order for the transaction to post in Banner for financial reporting.
Further, the Fiscal Control and Internal Auditing Act (30 ILCS 10/3001) requires the University to establish and maintain a system, or systems, of internal fiscal and administrative controls, to provide assurance that: (1) resources are utilized effectively, and in compliance with applicable law; (2) obligations and cost are in compliance with applicable law; (3) funds, property, and other assets and resources are safeguarded against waste, loss, unauthorized use, and misappropriation; (4) revenues, expenditures, and transfers of assets, resources or funds applicable to operations are properly recorded and accounted for to permit preparation of accounts and reliable financial and statistical reports and to maintain accountability over the State’s resources; and (5) funds held outside the State Treasury are managed, used, and obtained in strict accordance with the terms of their enabling authorities and that no unauthorized funds exist. The University’s system of internal controls should include procedures to ensure procurement card transactions are in accordance with University policies and procedures.
University management indicated the bulleted exceptions largely resulted from human error at the individual and/or unit level by not following procurement card policies and procedures.
Failure to properly review and approve procurement card transactions in accordance with University policies could result in erroneous or fraudulent transactions being recorded in the general ledger system. (Finding Code No. 2019-002, 2018-003, 2017-004, 2016-002, 2015-002, 2014-002, 2013-002, 12-02, 11-03, 10-02, 09-02, 08-03)
Recommendation:
We recommend the University continue to review and improve its internal controls over procurement card transactions to ensure compliance with University policies so that erroneous or fraudulent transactions are not recorded in the general ledger system.

STATE OF ILLINOISUNIVERSITY OF ILLINOIS
CURRENT FINDINGS - GOVERNMENT AUDITING STANDARDSFor the Year Ended June 30, 2019
21 (Continued)
University Response:
Accepted. While the procurement card is an efficient purchasing mechanism, the University recognizes the importance of procurement card process controls, training, and transaction monitoring. The University will implement the necessary corrective action related to the recommendation made in this finding.

STATE OF ILLINOISUNIVERSITY OF ILLINOIS
CURRENT FINDINGS – FEDERAL COMPLIANCEYear Ended June 30, 2019
22 (Continued)
Federal Agency: US Department of Education (USDE)
Program Name: Student Financial Assistance Cluster
CFDA # and Program Expenditures: 84.007/84.033/84.038/84.063/84.268/84.379/93.264/93.342/93.364 ($607,601,754)
Award Numbers: See Table of Award Numbers
Questioned Costs: $103,224
Finding 2019-003 – Failure to Meet Community Service Requirement
The University did not use at least 7% of its Federal Work Study (FWS) funds for students employed in community service activities.
At the University of Illinois at Chicago, we noted the federal share of FWS funds used for community service totaled $96,505, from a statistically valid sample. The total amount of federal funds spent on FWS funds totaled $2,824,193. The University is reporting at 3.4% of community service used for FWS funds out of the minimum 7% requirement. The University should have used at least 7%, or $197,694, of its FWS funds towards community service or obtained a waiver from the US Department of Education.
At the University of Illinois at Springfield, we noted the federal share of FWS funds used for community service totaled $15,227, from a statistically valid sample. The total amount of federal funds spent on FWS funds totaled $246,595. The University is reporting at 6.2% of community service used for FWS funds out of the minimum 7% requirement. The University should have used at least 7%, or $17,262, of its FWS funds towards community service or obtained a waiver from the US Department of Education.
The Code of Federal Regulations (34 CFR 675.18(g)) requires for the 2000-2001 award year and subsequent award years, an institution must use at least 7% of the sum of its initial and supplemental FWS allocations for an award year to compensate students employed in community service activities.
Uniform Grant Guidance (2 CFR 200.303) requires nonfederal entities receiving Federal awards establish and maintain internal controls designed to reasonably ensure compliance with Federal laws, regulations, and program compliance requirements. Effective internal controls should include procedures to ensure FWS funds are used according to federal guidelines or to ensure waivers are obtained.
According to University officials, the University of Illinois at Chicago was unable to adequately replace the loss of their largest community service contractor.
According to University officials, the University of Illinois at Springfield had students who left their community service positions before the end of the academic year. The University attempted to find replacements, but due to the lateness of the departures they were unable to replace the students.
If the University fails to meet any of the FWS community service requirements, then they will be required to return FWS federal funds in an amount equal to the difference between the amount a school should have spent for community service and the amount it actually spent. The University could also be denied future participation in the FWS Program and possibly other FWS programs and/or subject to a substantial fine.(Finding Code No. 2019-003, 2018-005, 2017-010)

STATE OF ILLINOISUNIVERSITY OF ILLINOIS
CURRENT FINDINGS – FEDERAL COMPLIANCEYear Ended June 30, 2019
23 (Continued)
Recommendation:
We recommend the University review current processes for calculating and tracking the students employed in community service activities for its FWS funds to meet the minimum 7% requirement.
University Response:
Accepted. The University of Illinois at Chicago will continue to increase their contract provider list for the 2019-2020 academic year. The University of Illinois at Springfield is working to recruit more students for these positions and find providers closer to campus for the 2019-2020 academic year.

STATE OF ILLINOISUNIVERSITY OF ILLINOIS
CURRENT FINDINGS – FEDERAL COMPLIANCEYear Ended June 30, 2019
24 (Continued)
Federal Agency: U.S. Department of Veterans Affairs (USVA) General Service Administration
U.S. Department of Housing & Urban Development (USHUD)U.S. Institute of Museum & Library Services (USIMLS)Social Security AdministrationU.S. Agency for International Development (USAID)U.S. Department of Agriculture (USDA) U.S. Department of Commerce (USDOC)U.S. Department of Defense (USDOD)U.S. Department of Education (USDE)U.S. Department of Energy (USDOE) U.S. Department of Homeland Security (USDHS)U.S. Department of Interior (USDOI)U.S. Department of Justice (USDOJ)U.S. Department of Labor (USDOL)U.S. Department of Transportation (USDOT)U.S. Environmental Protection Agency (EPA)U.S. Department of Health & Human Services (USDHHS)U.S. National Aeronautics and Space Administration (US NASA)U.S. National Endowment for the Humanities (USNEH)U.S. National Science Foundation (USNSF)U.S. Nuclear Regulatory Commission (USNRC)U.S. State Department
Program Name: Research and Development Cluster Cooperative Extension Services Child Care Development Funds (CCDF)
CFDA # and Program Expenditures: Various ($600,897,355)10.500 ($17,887,275)93.575/93.596 ($10,610,658)
Award Numbers: See Table of Award Numbers
Questioned Costs: None
Finding 2019-004 – Inadequate Procedures for Reporting and Closing out Federal Projects
The University does not have adequate procedures in place to ensure federal projects are closed in a timely manner and did not ensure the expenditures reported on the Schedule of Expenditures of Federal Awards contained the proper award information.
The University administers thousands of individual federal projects from several federal agencies and pass-through entities which have varying project periods and information is required to be reported accurately. The University has formally documented policies and procedures for closing out federally funded projects which generally require projects to be closed within 90 days after the project end date. Procedures have been established to send a notice of terminating accounts to the principal investigator or program coordinator 90 days prior to the project end date. The notice provides information about the process for closing projects and includes an information request for any extensions granted and other project information necessary to complete the project close out. Personnel in the Grants and Contracts Office are responsible for ensuring the University has met its obligations under the project, closing the general ledger accounts, and returning any unexpended grant funds to the federal agency or pass-through entity.

STATE OF ILLINOISUNIVERSITY OF ILLINOIS
CURRENT FINDINGS – FEDERAL COMPLIANCEYear Ended June 30, 2019
25 (Continued)
During our review of the University’s Schedule of Expenditures of Federal Awards for the year ended June 30, 2019, we noted expenditures (or negative expenditures) were reported for several projects with end dates of greater than the 90 day close out period. Specifically, we noted the following:
Upon review of the transactions recorded in the projects above, we noted transactions included a number of transfer expenditures and corrections. Periodic financial reports previously submitted for several of the University’s federally funded projects inaccurately included or excluded project expenditures which have later been revised, if applicable. Difficulties in collecting delinquent Accounts Receivable balances or completion of project deliverables can contribute to late award closeout. Additionally, some awards may remain open more than 90 days after the end date as the University awaits continuation paperwork for incrementally funded awards.
During the current year testing, 8 additional transactions were noted, including 2 in Research and Development (R&D), 5 in Cooperative Extension Services (CES), and 1 in Child Care Development Funds (CCDF), which had charges to the grants after the 90 day close out period during fiscal year 2019.
In addition, the University utilizes an accounting system to track and maintain the official financial records of the University. As Federal awards are granted to the University, individuals from the University’s post-award office enter the award details into the accounting system. During our review of 16 Cooperative Extension Service Cluster grant awards, we noted the award information contained in the University’s accounting system did not agree to the award documents for 2 awards selected for testing. More specifically, we noted there was a change to the Catalog of Federal Domestic Assistance (CFDA) numbers within the Cooperative Extension Services program. The University has updated their Schedule of Expenditures of Federal Awards to properly reflect the CFDA numbers.
Uniform Grant Guidance requires accurate, current and complete disclosure of the financial results of each federally sponsored project or program in accordance with the applicable reporting criteria. Under Uniform Grant Guidance (2 CFR 200 Section 200.343(a)) the non-Federal entity must submit, no later than 90 calendar days after the end of the period of performance, all financial, performance and other reports as required by the terms and conditions of the Federal award. The Federal awarding agency or pass-through entity may approve extensions when requested by the non-Federal entity.
Under Uniform Grant Guidance (2 CFR 200 Section 200.510(b)(3)) the auditee must prepare a Schedule of Expenditures of Federal Awards that includes the total Federal awards expended for each individual Federal program and the CFDA number or other identifying number when the CFDA information is not available.
6/30/2003 1 3 - (1,500) 6/30/2007 1 90 - (76,963) 6/30/2012 1 9 102,487 - 6/30/2013 2 9 - (190) 6/30/2015 3 27 - (42,711) 6/30/2016 6 10 - (11,700) 6/30/2017 21 424 100,509 (267,760) 6/30/2018 141 3,317 179,951 (696,112)
Total 176 3,889 382,947 (1,096,936)
Year Ended
Number of projects with end date during
fiscal year
Year ended June 30, 2019Number of
expendituresDollar amount of
positive costsDollar amount of
negative costs

STATE OF ILLINOISUNIVERSITY OF ILLINOIS
CURRENT FINDINGS – FEDERAL COMPLIANCEYear Ended June 30, 2019
26 (Continued)
Uniform Grant Guidance (2 CFR 200 Section 200.303) also requires nonfederal entities receiving federal awards establish and maintain internal control designed to reasonably ensure compliance with federal laws, regulations, and program compliance requirements. Effective internal controls should include procedures to ensure expenditures are allowable in accordance with federal regulations and are properly reported.
According to University officials, transactions post after the award end date for various reasons. At times, situations occur, beyond the University’s control. Additionally, staffing shortages, as well as the coordination and necessary participation from multiple University units contribute to the late posting of transactions. Failure to provide notification of award documents caused the reporting of incorrect CFDA numbers.
Failure to close projects and process necessary cost transfers in a timely manner may result in inaccurate periodic financial reports and unallowable costs. Also, failure to adequately record grant awards may result in inaccurate reporting on the Schedule of Expenditures of Federal Awards. (Finding Code No. 2019-004, 2018-006, 2017-007, 2016-005, 2015-005, 2014-005, 2013-005, 12-04, 11-07, 10-11, 09-13)
Recommendation:
We recommend the University review its current close out procedures and implement additional procedures to monitor the timeliness of federal account close outs. Also, we recommend the University implement procedures to ensure that the award information per the award documents received by the federal agency agrees to the award information entered in the University’s accounting system and any updates from the federal agency are properly documented.
University Response:
Accepted. The University continues to devote additional attention to close-out review and processing to improve the timeliness of project closeout. The University implemented dedicated close-out days to allow staff to focus on closing projects. In fact, the number of late closeouts has declined by 32% from the prior year. Upon further analysis of the transactions noted in the grid, 1421 are primary/direct expense transactions, while the remaining transactions are the associated fringe benefit and facilities and administrative assessments. The post-award offices are in conversation with other key University units to assist in identifying and preventing targeted late expenditure transactions.
In relation to the incorrect CFDA numbers, the University of Illinois at Urbana-Champaign will ensure central grant management and departmental staff understand the importance of timely communication of CFDA notification and updates on all awards.

STATE OF ILLINOISUNIVERSITY OF ILLINOIS
CURRENT FINDINGS – FEDERAL COMPLIANCEYear Ended June 30, 2019
27 (Continued)
Federal Agency: U.S. Health & Human Services (USHHS)
Program Name: Temporary Assistance for Needy Families (TANF)Child Care Development Funds (CCDF)
CFDA # and Program Expenditures: 93.558 ($5,989,784)93.575/93.596 ($10,610,658)
Award Numbers: See Table of Award Numbers
Questioned Costs: $15
Finding 2019-005 – Inadequate Procedures for Correctly Calculating Co-Payments
The University did not have proper procedures in place to correctly calculate co-payments for the State’s Child Care Assistance Program at the Illinois Child Care Resource Services (CCRS).
In relation to the Temporary Assistance for Needy Families Grant, CCRS is located at the University of Illinois at Champaign within the Department of Human Development and Family Studies, designated to verify eligibility for participants receiving aid under the Child Care Resource Services program. The Illinois Department of Human Services (IDHS) is responsible for setting the eligibility requirements, determining payment rates, and accrediting providers under TANF federal regulations 45 CFR 260.31 (TANF federal regulations). CCRS is responsible for the data entry process into the IDHS system, verifying eligibility per IDHS guidelines, calculating copay using IDHS spreadsheets, and retaining documentation and client files.
During our testing of 60 beneficiary payments, from a statistically valid sample, disbursements totaling $18,381 for TANF, we noted one beneficiary payment totaling $310 where CCRS did not calculate the monthly income correctly. The income per the parent co-payment calculation worksheet, which is used to determine monthly income, was improperly calculated based on TANF federal regulations. Although the error was not discovered, the participant was eligible under the program and the co-payment was not affected by the error.
In relation to the Child Care Development Funds Grant, CCRS is the department for the University of Illinois at Champaign designated to receive and administer funds and aid under the Child Care Assistance Program to assist parents with child care need under CCDF federal regulations 45 CFR 98.16 (CCDF federal regulations). During our testing for 60 beneficiary payments, from a statistically valid sample, disbursements totaling $16,389 under the Child Care Assistance Program, we noted three beneficiary files with payments totaling $414 with incorrect or incomplete information related to co-payments.
• In two cases, the income per the parent co-payment calculation worksheet was improper basedon CCDF federal regulation. The improper calculation, therefore, resulted in assessing thewrong co-payment amount for one applicant. For both applicants, child support paid was notsubtracted from the monthly gross income. Per the Illinois Administrative Code (Code) (89 Ill.Admin. Code 50.235), CCRS should reduce gross income by the child support paid out of afamily’s income. Although both applicants were eligible for the program, one applicant wasovercharged a co-pay, for a total of $15 and all errors were not caught in review.
• In another additional case, the income per the parent co-payment calculation worksheet wasimproper based on CCDF federal regulations. CCRS included inconsistent income in the grosswage calculation. Per the (Code) (89 Ill. Admin. Code 50.235), CCRS should exclude non-recurrent or inconsistent income that is not part of the family’s base income. Although the errorwas not discovered, the participant was eligible under the program and the co-payment wasnot affected by the error.
STATE OF ILLINOISUNIVERSITY OF ILLINOIS
CURRENT FINDINGS – FEDERAL COMPLIANCEYear Ended June 30, 2019
28 (Continued)
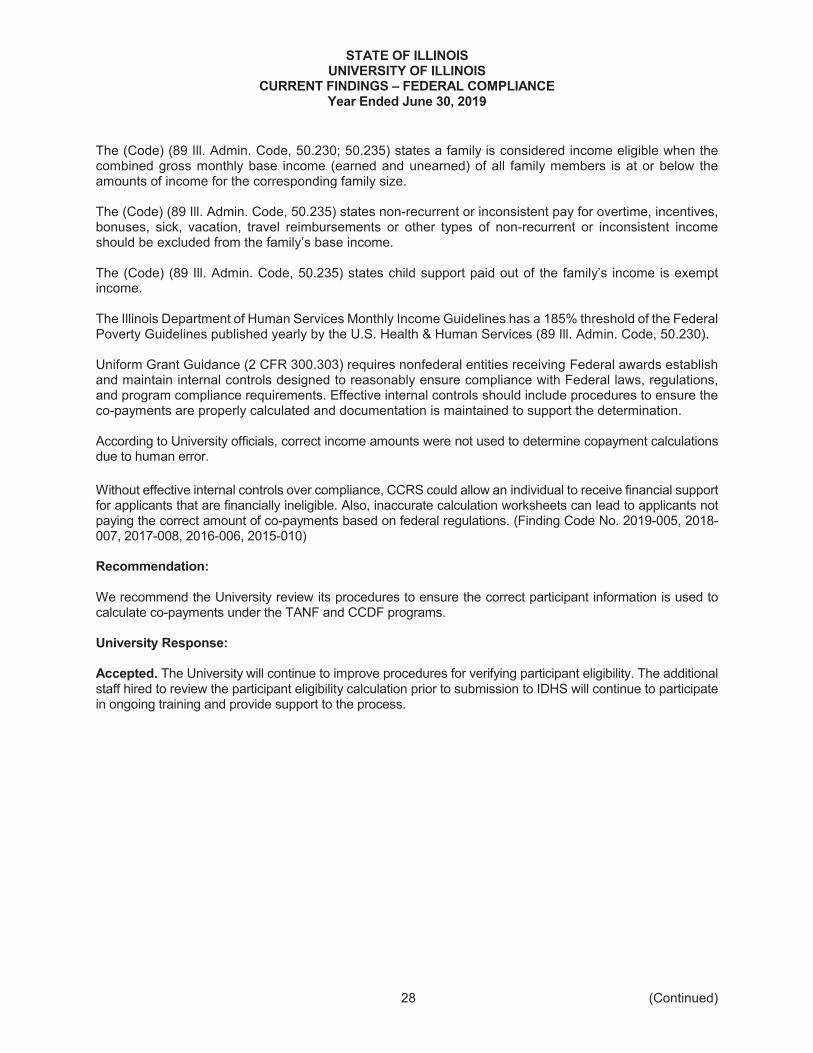
The (Code) (89 Ill. Admin. Code, 50.230; 50.235) states a family is considered income eligible when the combined gross monthly base income (earned and unearned) of all family members is at or below the amounts of income for the corresponding family size.
The (Code) (89 Ill. Admin. Code, 50.235) states non-recurrent or inconsistent pay for overtime, incentives, bonuses, sick, vacation, travel reimbursements or other types of non-recurrent or inconsistent income should be excluded from the family’s base income.
The (Code) (89 Ill. Admin. Code, 50.235) states child support paid out of the family’s income is exempt income.
The Illinois Department of Human Services Monthly Income Guidelines has a 185% threshold of the Federal Poverty Guidelines published yearly by the U.S. Health & Human Services (89 Ill. Admin. Code, 50.230).
Uniform Grant Guidance (2 CFR 300.303) requires nonfederal entities receiving Federal awards establish and maintain internal controls designed to reasonably ensure compliance with Federal laws, regulations, and program compliance requirements. Effective internal controls should include procedures to ensure the co-payments are properly calculated and documentation is maintained to support the determination.
According to University officials, correct income amounts were not used to determine copayment calculations due to human error.
Without effective internal controls over compliance, CCRS could allow an individual to receive financial support for applicants that are financially ineligible. Also, inaccurate calculation worksheets can lead to applicants not paying the correct amount of co-payments based on federal regulations. (Finding Code No. 2019-005, 2018-007, 2017-008, 2016-006, 2015-010)
Recommendation:
We recommend the University review its procedures to ensure the correct participant information is used to calculate co-payments under the TANF and CCDF programs.
University Response:
Accepted. The University will continue to improve procedures for verifying participant eligibility. The additional staff hired to review the participant eligibility calculation prior to submission to IDHS will continue to participate in ongoing training and provide support to the process.

STATE OF ILLINOISUNIVERSITY OF ILLINOIS
CURRENT FINDINGS – FEDERAL COMPLIANCEYear Ended June 30, 2019
29 (Continued)
Federal Agency: U.S. Department of Veterans Affairs (USVA) General Service Administration
U.S. Department of Housing & Urban Development (USHUD)U.S. Institute of Museum & Library Services (USIMLS)Social Security AdministrationU.S. Agency for International Development (USAID)U.S. Department of Agriculture (USDA) U.S. Department of Commerce (USDOC)U.S. Department of Defense (USDOD)U.S. Department of Education (USDE)U.S. Department of Energy (USDOE) U.S. Department of Homeland Security (USDHS)U.S. Department of Interior (USDOI)U.S. Department of Justice (USDOJ)U.S. Department of Labor (USDOL)U.S. Department of Transportation (USDOT)U.S. Environmental Protection Agency (EPA)U.S. Department of Health & Human Services (USDHHS)U.S. National Aeronautics and Space Administration (US NASA)U.S. National Endowment for the Humanities (USNEH)U.S. National Science Foundation (USNSF)U.S. Nuclear Regulatory Commission (USNRC)U.S. State Department
Program Name: Research and Development Cluster Cooperative Extension Services
CFDA # and Program Expenditures: Various ($600,897,355)10.500 ($17,887,275)
Award Numbers: See Table of Award Numbers
Questioned Costs: None
Finding 2019-006 – Inadequate Review and Application of Indirect Costs Rate
The University did not have proper review and apply indirect cost rates for the Research and Development Cluster and Cooperative Extension Services Cluster program awards.
During our testing we noted 1 out of 40 (3%) indirect cost transactions related to 1 award, from a statistically valid sample, charged to the Research and Development Cluster was not adequately executed or reviewed using the correct rate stated in the award agreement. Specifically, the University used a rate of 25.4% instead of the agreed upon rate of 31.9% which resulted in an under application of the allowed amount of indirect costs totaling $287.
During our testing we noted 3 out of 24 (13%) indirect cost transactions related to 1 award, from a statistically valid sample, charged to the Cooperative Extension Services Cluster were not adequately executed or reviewed using the correct rate stated in the award agreement. Specifically, the University used a rate of 25.4% instead of the agreed upon rate of 31.9% which resulted in an under application of the allowed amount of indirect costs totaling $177.

STATE OF ILLINOISUNIVERSITY OF ILLINOIS
CURRENT FINDINGS – FEDERAL COMPLIANCEYear Ended June 30, 2019
30 (Continued)
Uniform Grant Guidance (2 CFR 200.303) requires nonfederal entities receiving Federal awards establish and maintain internal controls designed to reasonably ensure compliance with Federal laws, regulations, and program compliance requirements. Effective internal controls should include procedures to ensure proper indirect cost rates are entered into the accounting system.
Uniform Grant Guidance (2 CFR 200.405(b)) requires all activities which benefit from the non-Federal entity’s indirect (F&A) cost, including unallowable activities and donated services by the non-Federal entity or third parties to receive an appropriate allocation of indirect costs.
According to University officials, the indirect cost rate for the Research and Development and Cooperative Extension Service Clusters was reduced from 31.9% to 25.4%, therefore causing F&A to be under assessed. These reductions were due to human error.
Failure to utilize the approved indirect cost rate could result in requesting and receiving funds in excess of amounts permitted which are unallowable costs. (Finding Code No. 2019-006)
Recommendation:
We recommend the University review its procedures relative to entering and reviewing indirect costs rates before entering them into its information systems to ensure the appropriate rates are used to calculate indirect costs charged to its federal programs.
University Response:
Accepted. The University believes a unique situation and human error caused the noted exceptions. In both cases, a lower indirect cost rate was assessed which caused no harm to the sponsor. The University will emphasize the importance of correct indirect cost rate entry.

STATE OF ILLINOISUNIVERSITY OF ILLINOIS
CURRENT FINDINGS – STATE COMPLIANCEYear Ended June 30, 2019
31 (Continued)
2019-007. Finding: Failure to Maintain Adequate Records Substantiating Written Notices
The University of Illinois Hospital (University) was unable to provide adequate records substantiating written notices were provided to patients within 24 hours after their admittance into the University Hospital indicating the patients were under observation status in accordance with the University of Illinois Hospital Act (Act) and University policies and procedures.
The University’s Patient Admissions Policy and Procedure (Policy) requires the University to issue Notice of Observation Status (Form UI-5010) to patients after their admittance into the University Hospital notifying they have been placed under outpatient observation status and have not been admitted as an inpatient. In addition, the University requires patients or their legal representative to sign the Form UI-5010 to acknowledge the receipt and understanding of their outpatient observation status.
During testing, we requested Form UI-5010s for 25 patients selected to test the University’s compliance with the Act and the Policy. The University was unable to provide Form UI-5010s for 8 (32%) patients. As a result, we were unable to determine the University’s compliance with the Act and the Policy.
The Act (110 ILCS 330/8a) states, “within 24 hours after a patient’s placement into observation status, the University of Illinois Hospital shall provide that patient with an oral and written notice that the patient is not admitted to the hospital and is under observation status. The written notice shall be signed by the patient or the patient’s legal representative to acknowledge receipt of the written notice and shall include, but not be limited to, the following information: (1) a statement that observation status may affect coverage under the federal Medicare program, the medical assistance program under Article V of the Illinois Public Aid Code, or the patient’s insurance policy for the current hospital services, including medications and other pharmaceutical supplies, as well as coverage for any subsequent discharge to a skilled nursing facility or for home and community based care; and (2) a statement that the patient should contact his or her insurance provider to better understand the implications of being placed into observation status.”
In addition, the University’s Patient Admissions Policy and Procedure requires the Notice of Observation Status form be presented to patients under observation status for their signatures.
Furthermore, the Fiscal Control and Internal Auditing Act (30 ILCS 10/3001) requires the University to establish and maintain a system, or systems, of internal fiscal and administrative controls. Effective internal controls should include procedures to ensure supporting documentation for each patient placed under observation status is maintained.
University officials stated the process involving level of care assignment is complex and involves many areas and clinicians within the health system through the use of various systems and technology. The University of Illinois Hospital (“Hospital”) has identified ongoing process opportunities in the workflow of level of care assignment and changes between outpatient, inpatient and observation status that occur during the course of patient encounter. While these workflows are properly managed in terms of final correct level of care assignment, the process to obtain signature on the observation notice on level of care changes post admission were not properly executed in all cases. In addition, certain deficiencies in processes exist due to inadequate information systems technology workflows in the Hospital’s current electronic health record (EHR).
Failure to maintain supporting documentation inhibits the auditors’ ability to test the University’s compliance with applicable laws and regulations. Further, failure to comply with the Act could subject the University to litigation risk. (Finding Code No. 2019-007, 2018-013, 2017-015)

STATE OF ILLINOISUNIVERSITY OF ILLINOIS
CURRENT FINDINGS – STATE COMPLIANCEYear Ended June 30, 2019
32 (Continued)
Recommendation:
We recommend the University strengthen its controls to ensure Notice of Observation Status forms are retained for all patients not admitted into the University Hospital, but who are under observation status.
University Response:
Accepted. The University will continue to monitor internal processes and continue to work on improving compliance with this requirement. Additionally, implementation of a new electronic health record (EHR) for the Hospital is set to occur in May 2020 which is expected to improve data capture and efficiency of process. Finally, there are occurrences where payer driven level of care changes can occur post discharge (i.e. after a patient has left the facility). The Statute did not contemplate such an occurrence which is being driven by insurance companies on a retrospective basis. Accordingly, there is no immediate action the Hospital can take for this portion of the activity. The University is working to seek a legislative remedy.

STATE OF ILLINOISUNIVERSITY OF ILLINOIS
CURRENT FINDINGS – STATE COMPLIANCEYear Ended June 30, 2019
33 (Continued)
2019-008. Finding: Failure to Follow Time Reporting Requirements
The University of Illinois (University) did not require all employees to submit time reports as required by the State Officials and Employees Ethics Act.
During testing of payroll, we selected 30 employees across all three campuses and noted the following:
! Nine employees (two from the Urbana-Champaign campus, three from the Chicago campus, three from the Springfield campus, and one from University Administration) did not file time reports as required by the State Officials and Employees Ethics Act. University management stated faculty, postdoctoral employees, instructors, and lecturers continue to track their time using a “negative” timekeeping system whereby the employee is assumed to be working, unless noted otherwise.
! One employee from the Urbana-Champaign campus, under the Academic Professional employee class, did not properly submit time reports, as required by the University policy. The employee did not submit positive-time reporting for one workweek.
The State Officials and Employees Ethics Act (Act) (5 ILCS 430/1-5) defines “State agency” to include “public institutions of higher learning...” and defines “State employee” to be “any employee of a State agency”. The Act required the Illinois Board of Higher Education (IBHE), with respect to State employees of public universities, to adopt and implement personnel policies. The Act (5 ILCS 430/5-5(c)) also states, “The policies shall require State employees to periodically submit time sheets documenting the time spent each day on official State business to the nearest quarter hour; contractual State employees may satisfy the time sheets requirement by complying with the terms of their contract, which shall provide for a means of compliance with this requirement.” The IBHE adopted personnel policies for public universities on February 3, 2004 in accordance with the Act. The University has not incorporated these policies into the University’s policies.
The University Reporting Policy for the State Officials and Employees Ethics Act (SOEEA) requires all Academic Professional and Civil Service employees to document all hours worked, using the University’s Online Reporting tool, while conducting official University business.
University officials stated they have not incorporated policies regarding time reporting for all employees as they are having continued dialogue with the academic leadership on this matter. In the meantime, the System has implemented several mechanisms to comply with the requirement for the majority of their employees such as training and weekly reminder emails; however, trying this has proven difficult to achieve full compliance due to the thousands of employees with competing priorities.
Failure to follow and ensure all employees comply with the time reporting requirements of the Act results in noncompliance with the Act. (Finding Code No. 2019-008, 2018-014, 2017-016, 2016-016, 2015-021, 2014-023, 2013-016, 12-19, 11-33, 10-37, 09-40, 08-11, 07-11, 06-06, 05-06)
Recommendation:
We recommend the University implement procedures to ensure all employees submit time sheets as required by the Act.
University Response:
Accepted. University of Illinois System leadership is initiating discussions related to regulatory relief in this area.

STATE OF ILLINOISUNIVERSITY OF ILLINOIS
CURRENT FINDINGS – STATE COMPLIANCEYear Ended June 30, 2019
34 (Continued)
2019-009. Finding: Inadequate Controls over University Travel Card Transactions
The University of Illinois (University) did not establish adequate internal controls over travel card (T-card) transactions.
The University operated a travel card program allowing individuals traveling for University business to pay for qualified travel expenses and business meals, which were then directly reimbursed by the University on a monthly basis. The University’s policies require employees assigned a travel card to complete training on University travel card policies, and sign an agreement stipulating they will use the card in accordance with the University policy. The University’s policies also require transactions incurred on a travel card to be approved in the University’s travel card system by the individual cardholder and an assigned reviewer. However, during our test work over 102 travel card transactions (totaling $323,414), including 42 transactions noted for unusual activity, we noted the following:
! One purchase (totaling $6,959) exceeded the cardholder’s single transaction limit amount. This purchase was split between two different T-card transactions. The required T-Card Exception Request Form was not properly approved by the Department Head prior to using the T-Card as required by the University travel card policies;
! Fifteen transactions (totaling $112,573) were paid in multiple installments, exceeding the cardholder’s single transaction limit of $4,999. The required T-Card Exception Request Forms were not filed prior to using the T-Cards for these purchases; and
! One transaction (totaling $8,971) was made prior to completion of the required T-Card Authorization Form.
The University has approximately 3,756 active travel cards, and the travel card expenditures paid for the year ended June 30, 2019 totaled $42,458,488.
The University’s policies and procedures state that use of the Travel Card for an expense that is normally prohibited by a policy or is above a Cardholder’s limit must be approved prior to using the T-Card for the purchase. Exceptions to University policies or procedures regarding T-Card use must be documented on a T-Card Exception Request Form. These requests may be approved when necessary to meet special circumstances or when in the best interest of the University and the State.
In addition, the Fiscal Control and Internal Auditing Act (30 ILCS 10/3001) requires the University to establish and maintain a system, or systems, of internal fiscal and administrative controls to provide assurance that: (1) resources are utilized effectively, and in compliance with applicable law; (2) obligations and cost are in compliance with applicable law; (3) funds, property, and other assets and resources are safeguarded against waste, loss, unauthorized use, and misappropriation; (4) revenues, expenditures, and transfers of assets, resources or funds applicable to operations are properly recorded and accounted for to permit preparation of accounts and reliable financial and statistical reports and to maintain accountability over the State’s resources; and (5) funds held outside the State Treasury are managed, used, and obtained in strict accordance with the terms of their enabling authorities and that no unauthorized funds exist. The University’s system of internal controls should include procedures to ensure travel card transactions are properly reviewed and approved to avoid prohibited transactions from being paid and recorded.
University management indicated the exceptions resulted from human error at the individual and/or unit level by not following established policies and procedures.
Failure to properly review and approve travel card transactions in accordance with University policies and procedures could result in prohibited or fraudulent transactions being recorded in the general ledger system.(Finding Code No. 2019-009, 2018-015, 2017-017, 2016-018)

STATE OF ILLINOISUNIVERSITY OF ILLINOIS
CURRENT FINDINGS – STATE COMPLIANCEYear Ended June 30, 2019
35 (Continued)
Recommendation:
We recommend the University review its current process for reviewing and approving travel card transactions and consider any changes necessary to ensure charges are made in accordance with University policies and procedures.
University Response:
Accepted. The University will continue to enhance transaction monitoring and training efforts.

STATE OF ILLINOISUNIVERSITY OF ILLINOIS
CURRENT FINDINGS – STATE COMPLIANCEYear Ended June 30, 2019
36 (Continued)
2019-010. Finding: Noncompliance with the Illinois Health Policy Center Act
The University of Illinois (University) did not comply with the requirements of the Illinois Health Policy Center Act (Act).
As of June 30, 2019, the University had not created the Illinois Health Policy Center (Center) as required by the Act. The purpose of the Center is to develop and implement policies to improve the health and healthcare of the people of Illinois.
The Illinois Health Policy Center Act (110 ILCS 430/10) requires the Illinois Health Policy Center to be created within the University of Illinois, to be sponsored by the University of Illinois at Chicago College of Medicine and the University of Illinois Institute of Government and Public Affairs.
University officials stated HB 3286 was passed by the Illinois General Assembly and signed into law by the Governor as Public Act 095-0986, the Illinois Health Policy Center Act. The companion legislation (HB 6299) that would have funded the proposed Health Policy Center was never passed by the General Assembly. Similarly, the Advisory Panel envisioned in Section 20 of the Act was never created by the General Assembly.
Failure to create the Center results in noncompliance with the Act. (Finding Code No. 2019-010, 2018-016, 2017-018)
Recommendation:
We recommend the University comply with the requirements of the Illinois Health Policy Center Act or seek legislative remedy.
University Response:
Accepted. The University is working to seek a legislative remedy. SB1499 was introduced to request repeal of Illinois Health Policy Center Act (110 ILCS 430/10). An additional bill will be filed this session.

STATE OF ILLINOISUNIVERSITY OF ILLINOIS
CURRENT FINDINGS – STATE COMPLIANCEYear Ended June 30, 2019
37 (Continued)
2019-011. Finding: Noncompliance with University Guidelines of the Illinois Legislative AuditCommission
The University of Illinois (University) did not adhere to the University Guidelines (1982) of the Illinois Legislative Audit Commission (LAC).
During our review of the Entity Financial Statements and Related Information of the University report on Supplementary Financial Information and Special Data Requirements for the year ended June 30, 2019, we noted that for the Departmental Activities – Professional Development Activities accounting entity, the University Springfield (UIS) campus reflected a net position deficit as of June 30, 2018 and 2019, thereby causing a subsidy of funds to occur for that entity.
The Illinois Legislative Audit Commission’s University Guidelines 1982 (as amended in 1997) state (Chapter III, Section D, Part 1) that “there shall be no subsidies between accounting entities. Subsidies include cash advances and interfund payables/receivables outstanding for more than one year.”
University officials stated revenues for this accounting entity have declined in the past three fiscal years. While efforts have been made to reduce expenses, this reduction effort has been offset by the reduced income.
The subsidy for the Professional Development Activities accounting entity is a violation of the University Guidelines. (Finding Code No. 2019-011, 2018-018)
Recommendation:
We recommend the University comply with the Legislative Audit Commission’s University Guidelines or seek remedy from the Legislative Audit Commission.
University Response:
Accepted. The University has controls in place to identify and remediate deficits within its self-supportingaccounting entities. Additionally, controls are in place to closely monitor and prevent inappropriate transfers (subsidies) between self-supporting accounting entities.
During fiscal year 2019, the University of Illinois at Springfield initiated deliberate steps to end the activity creating the deficit in this accounting entity. The University will investigate how to resolve the residual deficit in compliance with the Legislative Audit Commission University Guidelines.

STATE OF ILLINOISUNIVERSITY OF ILLINOIS
CURRENT FINDINGS – STATE COMPLIANCEYear Ended June 30, 2019
38 (Continued)
2019-012. Finding: Lack of Adequate Controls over the Review of Internal Controls over Service Providers
The University of Illinois (University) did not obtain or conduct timely independent internal control reviews over its external service providers.
As part of the examination process, we requested the University to provide the population of service providers utilized by the University in order to determine if they had reviewed the internal controls over the service providers. In response to our request, the University provided a listing of service providers utilized during the audit period. However, the University was unable to provide documentation demonstrating the completeness of the population.
Due to the conditions noted above, we were unable to conclude the University’s population records were sufficiently precise, complete, and detailed under the Professional Standards promulgated by the American Institute of Certified Public Accountants (AU-C § 330, AU-C § 530, AT-C § 205).
Although the University was unable to provide a complete population of service providers, we performed testing on the 80 service providers identified by the University. The service providers provided various services to the University:
! Claims billing,! Claims collections,! Insurance claims,! Electronic shopping, ! IT hosting service, and! Software as a Service.
During our testing, we noted the University had not obtained Service Organization Control (SOC) Reports or conducted independent internal control reviews for 30 (38%) service providers. In addition, for the 50 SOC reports received:
! The SOC Reports did not cover the entire examination period. ! The University had not conducted an analysis of all the SOC reports and the Complementary User
Entity Controls (CUEC).! The University had not conducted an analysis of the subservice organizations identified in the SOC
Reports.
In the prior examination, the University stated although SOC reports were obtained for those service providers identified as critical to the financial operations of the University, independent internal control reviews were not always obtained for other service providers. In the current examination, the University indicated the lack of resources has resulted in the noted weaknesses.
The Fiscal Control and Internal Auditing Act (30 ILCS 10/3001) requires all State agencies to establish and maintain a system, or systems, of internal fiscal and administrative controls to provide assurance that revenues, expenditures, and transfers of assets, resources, or funds applicable to operations are properly recorded and accounted for to permit the preparation of accounts and reliable financial and statistical reports and to maintain accountability over the State’s resources. In addition, generally accepted information technology guidance endorses the review and assessment of internal controls related to information systems and operations to assure the accurate processing and security of information.
Without having obtained and reviewed a SOC report or another form of independent internal controls review, the University does not have assurance the external service providers’ or subservice organizations’ internal controls are adequate to ensure the financial information is accurate and/or their information is secure. (Finding Code No. 2019-012, 2018-004)

STATE OF ILLINOISUNIVERSITY OF ILLINOIS
CURRENT FINDINGS – STATE COMPLIANCEYear Ended June 30, 2019
39 (Continued)
Recommendation:
We recommend the University identify all third-party service providers and determine and document if a review of controls is required. Additionally, the University should:
! Obtain SOC reports or perform independent reviews of internal controls for all service providers. ! Monitor and document the operation of the CUECs relevant to the University’s operations.! Either obtain and review SOC reports for subservice organizations or perform alternative
procedures to satisfy itself that the existence of the subservice organization would not impact its internal control environment.
! Document its review of the SOC reports and review all significant issues with subservice organizations to ascertain if a corrective action plan exists and when it will be implemented, any impacts to the University, and any compensating controls.
! Review contracts with service providers to ensure applicable requirements over the independent review of internal controls are included.
University Response:
Accepted. Significant progress was made over the last year to strengthen internal controls over service providers. SOC reports or some form of assurance documentation was sought for all 80 identified Service Providers with most providing various levels of documentation in response. For those service providers that provided SOC reports, the reports were reviewed and bridge letters were obtained to cover the difference in the University’s audit period for some service providers including those considered critical. The University will work to continue progress on obtaining and reviewing assurance reports from its service providers.

STATE OF ILLINOISUNIVERSITY OF ILLINOIS
PRIOR FINDINGS NOT REPEATED - GOVERNMENT AUDITING STANDARDSFor the Year Ended June 30, 2019
40
A. Finding: Inadequate Controls over Self-Approved Timesheets
During the prior audit, the auditors noted the University had not followed established internal controls over self-approved timesheets. (Finding Code No. 2018-002, 2017-002)
Status: Not Repeated
During the current year engagement, the auditors noted the University strengthened their internal controls over self-approved timesheets to ensure supervisory approval is obtained prior to payroll disbursements occurring based on our sample testing.
B. Finding: Lack of Adequate Controls over the Review of Internal Controls over Service Providers
During the prior audit, the auditors noted the University did not obtain or conduct timely independent internal control reviews over its external service providers. (Finding Code No. 2018-004)
Status: Not Repeated
During the current audit, the auditors noted the University had made some improvements over the controls of third-party service providers. However, the improvements were not sufficient enough to ensure the third-party service providers’ internal controls provided reasonable assurance. Therefore, the finding will be reported in the University's State Compliance Report as finding 2019-012.

STATE OF ILLINOISUNIVERSITY OF ILLINOIS
PRIOR FINDINGS NOT REPEATED – FEDERAL COMPLIANCEYear Ended June 30, 2019
41
C. Failure to Timely Monitor Subrecipient and an Error in Recording a Subrecipient Cost
The University did not obtain timely documentation for submonitoring and had incorrectly recorded subrecipient’s costs to the Head Start Program. (Finding Code No. 2018-008)
In the current year, similar exceptions were not identified in the samples selected.
D. Inadequate Documentation of Approvals for Payroll Disbursements
The University had inadequate documentation for approvals of the Health Center Program department payroll disbursements per its Clock-Work Time System procedures. (Finding Code No. 2018-009, 2017-013)
In the current year, similar exceptions were not identified in the samples selected.
E. Inadequate Documentation on Sliding Fee Discount Forms
The University of Illinois at Chicago – Mile Square Health Center (MSHC) did not maintain adequate documentation and did not follow the MSHC policy and procedures consistently for the Health Center cluster program. (Finding Code No. 2018-010, 2017-006)
In the current year, similar exceptions were not identified in the samples selected.
F. Inadequate Review of Title IV Fund Calculation
The University did not follow controls in place for reviewing the Return of Title IV calculations for students. (Finding Code 2018-011, 2017-012, 2016-012, 2015-018)
In the current year, similar exceptions were not identified in the samples selected.

STATE OF ILLINOISUNIVERSITY OF ILLINOIS
PRIOR FINDINGS NOT REPEATED – STATE COMPLIANCEYear Ended June 30, 2019
42
G. Finding: Contracts and Real Property Leases Not Properly Executed
The University of Illinois (University) had not established adequate internal controls over contracts and leases to ensure that all necessary approvals were received and that the agreements were executed prior to the performance and filed with the State of Illinois, Office of the Comptroller on a timely basis. (Finding Code No. 2018-012, 2017-014, 2016-015; 2015-020; 2014-022, 2013-018, 12-18, 11-32, 10-35, 09-35, 08-09, 07-10, 06-07, 05-05, 04-05, 03-06)
During the current year engagement, we noted the University continued to strengthen internal process controls, training, and transaction monitoring. This finding was moved to the immaterial letter as finding IM2019-001.
H. Finding: Inadequate Procedures over Maintenance of Accounts Payable Master Vendor File
The University had inadequate controls in place to monitor and maintain the accounts payable master vendor file. (Finding Code No. 2018-017, 2017-003, 2016-003)
During the current year engagement, we noted the University strengthened their internal controls over monitoring and maintaining the accounts payable master vendor file.

STATE OF ILLINOISUNIVERSITY OF ILLINOIS
TABLE OF AWARD NUMBERS REFERENCED IN FEDERAL COMPLIANCE FINDINGSFor the Year Ended June 30, 2019
Name of Federal Program or ClusterResearch and Development Cluster (R&D)
Award Number
43
VA 36C25218C0008 PO 537D92001/002 JBVAMAC AG 2013-67015-21243 AG Sub UMN H005722921US Dept of VA PO# 578-D92002 JBVAMC IPA AG 2015-67019-23584 AG Sub MSU RC106556FVA 093264 IPA JBVAMC IPA 086359 AG 2015-68001-23248 AG Sub Archbold 2016-67019-24988VA 092423 IPA JBVAMC IPA AG 2015-67013-22948 AG Sub CSU G-14765-7VA 091718 IPA JBVAMC IPA AG 2015-67015-23228 AG Sub TU 36 22091 347 76190VA 091717 IPA Jesse Brown VA Medical Center IPA AG 2015-67017-23074 AG Sub UFLUFDSP00011813Edward Hines Jr. Hospital VA IPA JBVAMC IPA FY19 AG 2015-67013-22965 AG Sub Auburn 17-AGR-373058-UIUCEdward Hines VA JBVAMC IPA AG 2015-67013-23173 AG sub NCSU 2016-0149-03Edward Hines Jr VA Hospital JBVAMC IPA AG 2015-67017-23089 AG Sub UMass 17 009835 B 00Edward Hines VA Hospital ZENK IPA JBVAMC IPA AG 2014-67021-22109 AG Sub MS State 012000.321743.02Edward Hines Jr VA Hospital JBVAMC IPA AG 2016-67019-25212 AG Sub SDSU 3TY640Hines VA Hospital JBVAMC IPA AG 2016-67019-25268 AG Sub SDSU 3TV640JBVAMC IPA JBVAMC IPA AG 2016-67019-25206 AG 58-5012-8-008JBVAMC IPA JBVAMC AG 2016-67030-25211 AG 2018-67007-28379JBVAMC IPA JBVAMC IPA AG 2016-68006-24836 AG 2018-67032-27709JBVAMC IPA JBVAMC IPA AG 2016-67023-24753 AG Sub CPS 2019CPS11JBVAMC IPA Jesse Brown VA Med Ctr AG 2016-67013-24812 AG Sub CPS 2018CPS03JBVAMC IPA Jesse Brown VA Med Ctr AG 2016-68004-24769 AG Sub Purdue 8000073490-AGJBVAMC IPA JBVAMC IPA AG 2016-67017-24430 AG Sub ISU 410-40-44AJBVAMC IPA JBVAMC IPA (E2080/487433) AG 2015-67023-23677 AG Sub TU 36 22091 396 76190JBVAMC IPA JBVAMC IPA AG 2016-67015-24583 AG Sub OSU 60039552 PO RF01353065JBVAMC IPA VA241 15 D 0041 PO 523C78274 AG 2017-39591-27313 AG Sub Cornell 88790-11189JBVAMC VA Pudget P0 663-D83065 AG 2017-67003-26703 AG Sub DDPSC 23019-IJBVAMC IPA GSA IPA OX0002703 FY18-19 AG 2017-67030-26505 AG Sub UMN A004448401JBVAMC-IPA GSA IPA OX0002897 FY18-19 AG 2017-67013-26536 AG Sub MS State 191000.321646.02JBVAMC IPA IP00430389 GSA IPA OX0002703 FY19 AG 2017-67013-26533 AG Sub UCR 001067JMBVAMC IPA HACC 2011-05459 AG 2016-67015-26777 IDOA SC-19-06JBVAMC IPA IN UNIV IN-4370124-UIC PO2210705 AG 2013-67015-26787 IDOA SC-19-13JBVAMC IPA IMLS RE-07-18-0054-18 AG 2017-67017-26519 IDOA SC-19-05JBVAMC IPA IMLS Sub IU BL-4348803-UL AG 2017-68007-26307 IDOA SC-19-01Jesse Brown VA Medical Laboratory t IMLS Sub CZS MG-30-17-0006-17 AG 2017-67013-26253 IDOA SC-18-10JBVAMC IPA E0665 IMLS Sub NPS LG-81-16-0151 AG 2017-67015-26629 IDOA SC-18-19JBVAMC IPA IMLS Sub NCSU 2018-0151-02 AG 2017-67019-26545 IDOA SC-17-05JBVAMC IPA Univ of Wisc 851K395 AG 2017-67007-25945 IDOA SC-17-19JBVAMC IPA Math Policy Res 40112S03050 AG NIFA 2019-67015-29262 IDOA SC-17-17JBVAMC IPA AID AID-OAA-L-14-00001 AG NIFA 2019-67013-29300 IDOA SC-16-18JBVAMC IPA AID Sub Purdue F9001228702111 AG 2019-67013-29195 IDOA SC-16-20JBVAMC IPA AID Sub MSU RC102095BHEARD-WACCI AG 2019-67021-28989 USDA RSA 58-6401-2-753Jessie Brown VA E0712 AID Sub KSU S14131 AG 2018-67015-28293 AG 59-0206-4-029JBVAMC IPA AID Sub KSU S16019 AG 2018-68002-27961 AG 58-8042-5-072JBVAMC IPA AID Sub EAI V4P-002-2017 AG 2018-68006-28097 AG 59-5012-5-009Jesse Brown VA Medical Center AID Sub KSU S19137 AG 2017-67012-28197 AG 58-5012-6-047JBVAMC IPA AG 2017-39565-27338 AG 2018-67015-28287 AG 58-5010-6-013JBVAMC 094334-00001 AS 483 FY18 McIntire-Stennis AG 2018-68002-27918 AG 59-8042-7-001JBVAMC IPA 483 FY19 McIntire-Stennis AG 2018-67017-27913 AG 58-8040-6-010JBVAMC IPA IP00406941 483 FY17 Hatch AG 2018-67019-27807 AG 59-0206-6-011JBVAMC IPA 483 FY18 Hatch AG 2018-67019-27853 AG 59-0210-6-002Jessie Brown VA Medical Center 483 FY19 Hatch AG 2018-67013-27571 AG 58-5012-8-005JBVAMC 483 FY18 Multi-State Research AG 2018-67013-27818 AG 58-5012-8-004JBVAMC IPA 483 FY19 Multi-State Research AG 2018-68005-27937 AG 58-5012-8-002JBVAMC IPA 483 FY18 Animal Health and Disease AG 2018-67015-27477 AG 58-5012-8-003JBVAMC IPA 483 FY19 Animal Health and Disease AG 2018-68008-27889 AG 58-5012-7-034JBVAMC AG 2015-51106-24198 AG 2018-67013-27537 AG 58-5020-7-070JBVAMC AG 2014-51300-22233 AG 2018-67015-27413 AG 58-5012-7-040JBVAMC IPA AG 2017-51300-27115 AG 2019-67030-29244 AG 58-5012-7-036JBVAMC IPA USDA-NIFA 2017-67017-26364 AG 00445176 Antc AG 58-5012-7-032JBVAMC IPA E1073 NIFA Award 2016-67012-24705 AG 2019-67032-29070 AG 59-5070-7-002JBVAMC IPA AG 2014-68006-22041 AG Sub UMN H004403741 AG 58-5012-6-043JBVAMC IPA 088171EC AG 2014-68006-21872 AG Sub UMN H005722945 AG 58-5012-9-004JBVA IPA AG 2013-67015-21335 AG Sub UMN H005722920 AG 58-5012-9-007

STATE OF ILLINOISUNIVERSITY OF ILLINOIS
TABLE OF AWARD NUMBERS REFERENCED IN FEDERAL COMPLIANCE FINDINGSFor the Year Ended June 30, 2019
Name of Federal Program or ClusterResearch and Development Cluster (continued)
Award Number
44
AG 58-6040-8-037 AG NR185A12XXXXC004 AF Sub UTC 18-S7700-02-C9 AF FA9550-18-1-0278AG 59-0206-8-211 AG NR193A750016C001 AF Sub MIT 7000432518 AF FA9550-18-1-0291AG 59-0206-8-205 AG 68-5A12-18-003 AF Sub Northrop 2993117 AF FA9550-18-1-0380AG 58-5012-8-030 AG 68-5A12-15-356 AF Sub U Virginia GI15207-2097551 AF FA9550-18-1-0269AG 58-5012-9-002 TNC NRCS G17-001-MAC-G AF Sub MD 0000005310 AF FA9550-18-1-0198AG 58-5012-9-001 AG 58-0111-18-019 AF Sub OSU 60038238 AF FA9550-18-1-0298AG 58-5012-8-028 NIST 60NANB12D261 AF Sub SU 27748-04168-S01 AF FA9550-18-1-0195AG 58-5012-8-026 UCR Subcontract No S-000950 AF Sub RPI A12831 AF FA9550-18-1-0101AG 58-5012-8-031 IMEC AF sub Univ of OR 230730A AF Sub UT 26020149061AG 58-5012-8-027 COM Sub CO St Univ G-00745-4 AF FA9453-15-1-0075 AF Sub OSU 1-560106-UIUCAG 58-5012-8-025 U.S. DOC ED16CHI3030029 AF FA2386-17-1-4665 AF Sub OAI-C2644-17028AG 59-5020-8-005 COM NIST 60NANB15D359 USAF FA9550-18-1-0236 AF Sub BF-5040-SK002AG 58-5012-9-003 COM Sub Woolpert UOI-18-S-017 AFOSR FA9550-16-1-0227 AF Sub UCSD 109320760AG 58-5012-8-023 Cal Poly 2018 11 48544 AFOSR FA9550-16-1-0079 Rutgers University 894363AG 58-5090-8-040 COM Sub Purdue F0008309702025 AF FA9550-12-1-0471 Sivananthan Labs 022318SUIC0001AG 58-5012-8-022 COM Sub Purdue F008309702026 AF FA9550-14-1-0295 AF Sub JHU 2001625862AG 58-5012-8-019 COM Sub Purdue F0008309702012 AF FA9550-14-1-0002 AF Sub CAL Tech 52-1096636AG 58-5012-8-017 COM Sub Purdue F0008309702010 AF FA9550-14-1-0101 AF SUB CORNELL 71656-10343AG 58-5012-8-014 COM NOAA Sub NCSU 2014-2918-04 AF FA9550-15-1-0234 AF Sub Carnegie 1150129-401220AG 58-5012-8-016 COM Sub UCAR SUBAWD000255 AF FA9550-15-1-0132 AF Sub MO S&T 00055196-01AG 58-5012-8-015 COM NIST Sub UC FP060337-A AF FA9550-15-1-0128 AF Sub UMD 56656-Z8044201AG 58-5012-8-011 NOAA NA18NMF4270221 AF FA9550-15-1-0117 ARMY W912HZ-17-P-0141AG 58-5012-8-010 NOAA NA15NMF4270315 AF FA9550-15-1-0277 895 DOD US ARL Visual ProcessingAG 00491975 ANTC COM NOAA NA16OAR4310080 AF FA9550-15-1-0087 ARMY W911NF-17-1-0171AG 59-5012-9-002 COM NA18OAR4310257 AF FA9550-15-1-0122 Army W911NF-19-1-0319AG 58-5012-9-013 COM NA18OAR4310271 AF FA9550-15-1-0035 Army W911NF-18-1-0117AG 59-3602-4-001 COM NA16OAR4590219 AF FA9550-15-1-0028 ARMY W911NF-17-2-0196AG 59-5012-9-001 COM NA17OAR4590195 AF FA9550-14-1-0343 ARMY Sub BBN 9500013029 13891 TO 16AG 00445115 ANTC COM NA17OAR4590202 AF FA9550-14-1-0146 Army Sub UC San Diego 96678768AG Sub Purdue F9001994502007 COM NA18NWS4680065 AF FA9550-16-1-0383 ARMY Sub Rutgers 0279AG Sub Purdue F9001994502009 Purdue Univ F0008309702024 AF FA9550-17-1-0001 ARMY Sub BBN 13765350AG AP18VSNVSL00C005 COM Sub Purdue F000830970211 AF FA9550-16-1-0193 Army Sub Creare S621583 USDA APHIS/WS/NWRC 2017-2018 IDNR CMPNU04 AF FA9550-16-1-0238 Army Sub AAS 092206AG Sub UCR S-000927 IDNR NOAA1708 AF FA9550-16-1-0251 ARMY Sub NC State U 2016-1652-03AG Sub AZA 089294 IDNR CMPNU03 AF FA9550-16-1-0224 ARMY sub UPittsburgh 0056411IDOA 096155 Estes IDNR NOAA1606A AF FA9550-16-1-0055 Army CERL W9132T-18-C-0010IDOA 2019 Orchard Commodity IDNR CMPNU02 AF FA9550-16-1-0017 Army W9132T-19-C-0007IDOA CAPS Infrastructure CY19 IDNR CMPN01 AF FA9550-16-1-0042 Army W9132T-19-C-0004IDOA CAPS Survey CY19 AF FA9453-15-C-0067 AF FA9550-15-1-0518 ARMY CESU W9132T-16-2-0008IDOA 2018 Grape Commodity AF FA8651-16-1-0012 AF FA9550-15-1-0470 Army CESU W9132T-16-2-0005IDOA CAPS Survey CY18 AF FA8651-16-2-0001 AF FA9550-15-1-0394 Army CESU W9132T-16-2-0007IDOA CAPS Infrastructure CY18 AF FA9550-19-1-0164 AF FA9550-18-1-0082 Army CESU W9132T-16-2-0002IDOA 2017 Forest Pest Pathway AF FA9550-19-1-0050 AF FA9550-17-1-0418 ARMY W9132T-17-2-0014IDOA 2017 Grape Commodity AF 00467481 ANTC AF FA9550-17-1-0387 ARMY CERL W9132T-17-2-0015IDOA 2017 Orchard Commodity AF FA9550-19-1-0106 AF FA2386-17-1-4071 ARMY CERL W9132T-17-2-0018AG 2012-67021-19939 AF FA9550-18-1-0293 AF FA9550-17-1-0295 Army CERL W9132T-18-2-0008AG 58-3000-7-0104 AF FA9453-18-1-0004 AF FA9550-17-1-0236 Army W9132T-18-2-0006AG Sub UKY 3048110944-15-201 AF FA9550-19-1-0242 AF FA9550-17-1-0296 Army W9132T-18-2-0004AG Sub UCR S-001079 Air Force FA87501810076 AF FA9550-17-1-0213 Army W9132T-19-2-0005USDA FNS OPS SWP 1 5 IL01 2015CN30 AF Sub CUA 2015-01942 AF FA9550-17-1-0223 ARMY W911NF-16-1-0413AG 15-JV-11242309-105 AF Sub Clemson 1872-200-2011234 AF FA9550-17-1-0127 DOD W911NF1910191AG 15-JV-11242309-075 AF Sub Next Frontier LLC 00340608 AF FA9550-17-1-0203 US Army W911NF-1820181AG 15-DG-11420004-085 AF Sub UES S-977-01A-001UIUC AF FA9550-17-1-0008 ARO W911NF-16-1-0063AG 16-DG-11132544-036 AF Sub SSI 3500-001-47 AF FA9550-17-1-0128 Army W911NF-10-1-0524AG 15-DG-11420004-156 AF Sub Clarkson UIUC16-S7700-04-C2 AF FA9550-19-1-0129 Army W911NF-13-1-0402USDA FS 15-JV-11242302-038 AF Sub NG 8140000894 AF FA9550-19-1-0010 Army W911NF-13-1-0086AG NR185A12XXXXC004 AF Sub Nano Terra 094593 AF FA9550-18-1-0388 ARMY W911NF-13-1-0217AG CESU 68-5A12-16-506 AF Sub U Tech 165852-18F5828-1915C1 AF FA9550-18-1-0405 ARMY W911NF-15-1-0588AG CESU 68-5A12-16-507 AF Sub Next Frontier 00416231 AF FA9550-18-1-0258 ARMY W911NF-15-1-0479AG NR185A12XXXXC004 AF Sub U Tenn A19-0503-S002 AF FA9550-18-1-0393 Army W911NF-15-1-0461
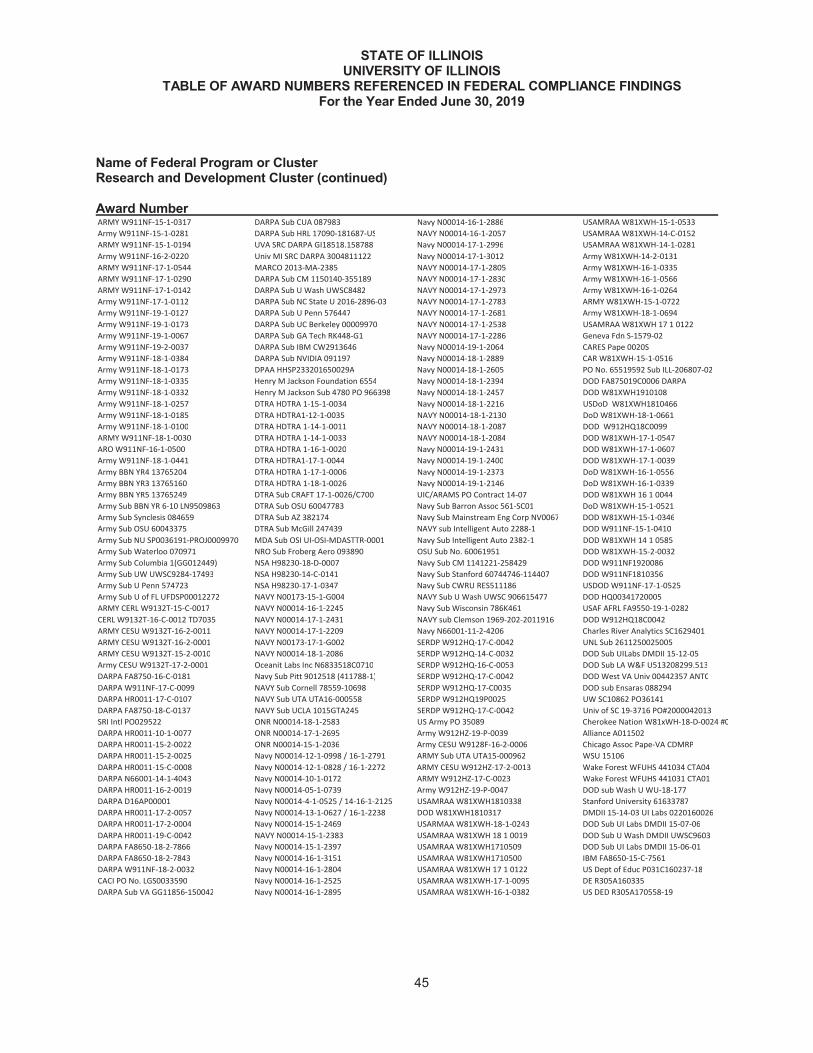
STATE OF ILLINOISUNIVERSITY OF ILLINOIS
TABLE OF AWARD NUMBERS REFERENCED IN FEDERAL COMPLIANCE FINDINGSFor the Year Ended June 30, 2019
Name of Federal Program or ClusterResearch and Development Cluster (continued)
Award Number
45
ARMY W911NF-15-1-0317 DARPA Sub CUA 087983 Navy N00014-16-1-2886 USAMRAA W81XWH-15-1-0533Army W911NF-15-1-0281 DARPA Sub HRL 17090-181687-US NAVY N00014-16-1-2057 USAMRAA W81XWH-14-C-0152ARMY W911NF-15-1-0194 UVA SRC DARPA GI18518.158788 Navy N00014-17-1-2996 USAMRAA W81XWH-14-1-0281Army W911NF-16-2-0220 Univ MI SRC DARPA 3004811122 Navy N00014-17-1-3012 Army W81XWH-14-2-0131ARMY W911NF-17-1-0544 MARCO 2013-MA-2385 NAVY N00014-17-1-2805 Army W81XWH-16-1-0335ARMY W911NF-17-1-0290 DARPA Sub CM 1150140-355189 NAVY N00014-17-1-2830 Army W81XWH-16-1-0566ARMY W911NF-17-1-0142 DARPA Sub U Wash UWSC8482 NAVY N00014-17-1-2973 Army W81XWH-16-1-0264Army W911NF-17-1-0112 DARPA Sub NC State U 2016-2896-03 NAVY N00014-17-1-2783 ARMY W81XWH-15-1-0722Army W911NF-19-1-0127 DARPA Sub U Penn 576447 NAVY N00014-17-1-2681 Army W81XWH-18-1-0694Army W911NF-19-1-0173 DARPA Sub UC Berkeley 00009970 NAVY N00014-17-1-2538 USAMRAA W81XWH 17 1 0122Army W911NF-19-1-0067 DARPA Sub GA Tech RK448-G1 NAVY N00014-17-1-2286 Geneva Fdn S-1579-02Army W911NF-19-2-0037 DARPA Sub IBM CW2913646 Navy N00014-19-1-2064 CARES Pape 0020SArmy W911NF-18-1-0384 DARPA Sub NVIDIA 091197 Navy N00014-18-1-2889 CAR W81XWH-15-1-0516Army W911NF-18-1-0173 DPAA HHSP233201650029A Navy N00014-18-1-2605 PO No. 65519592 Sub ILL-206807-02Army W911NF-18-1-0335 Henry M Jackson Foundation 6554 Navy N00014-18-1-2394 DOD FA875019C0006 DARPAArmy W911NF-18-1-0332 Henry M Jackson Sub 4780 PO 966398 Navy N00014-18-1-2457 DOD W81XWH1910108Army W911NF-18-1-0257 DTRA HDTRA 1-15-1-0034 Navy N00014-18-1-2216 USDoD W81XWH1810466Army W911NF-18-1-0185 DTRA HDTRA1-12-1-0035 NAVY N00014-18-1-2130 DoD W81XWH-18-1-0661Army W911NF-18-1-0100 DTRA HDTRA 1-14-1-0011 NAVY N00014-18-1-2087 DOD W912HQ18C0099ARMY W911NF-18-1-0030 DTRA HDTRA 1-14-1-0033 NAVY N00014-18-1-2084 DOD W81XWH-17-1-0547ARO W911NF-16-1-0500 DTRA HDTRA 1-16-1-0020 Navy N00014-19-1-2431 DOD W81XWH-17-1-0607Army W911NF-18-1-0441 DTRA HDTRA1-17-1-0044 Navy N00014-19-1-2400 DOD W81XWH-17-1-0039Army BBN YR4 13765204 DTRA HDTRA 1-17-1-0006 Navy N00014-19-1-2373 DoD W81XWH-16-1-0556Army BBN YR3 13765160 DTRA HDTRA 1-18-1-0026 Navy N00014-19-1-2146 DoD W81XWH-16-1-0339Army BBN YR5 13765249 DTRA Sub CRAFT 17-1-0026/C700 UIC/ARAMS PO Contract 14-07 DOD W81XWH 16 1 0044Army Sub BBN YR 6-10 LN9509863 DTRA Sub OSU 60047783 Navy Sub Barron Assoc 561-SC01 DoD W81XWH-15-1-0521Army Sub Synclesis 084659 DTRA Sub AZ 382174 Navy Sub Mainstream Eng Corp NV0067 DOD W81XWH-15-1-0346Army Sub OSU 60043375 DTRA Sub McGill 247439 NAVY sub Intelligent Auto 2288-1 DOD W911NF-15-1-0410Army Sub NU SP0036191-PROJ0009970 MDA Sub OSI UI-OSI-MDASTTR-0001 Navy Sub Intelligent Auto 2382-1 DOD W81XWH 14 1 0585Army Sub Waterloo 070971 NRO Sub Froberg Aero 093890 OSU Sub No. 60061951 DOD W81XWH-15-2-0032Army Sub Columbia 1(GG012449) NSA H98230-18-D-0007 Navy Sub CM 1141221-258429 DOD W911NF1920086Army Sub UW UWSC9284-17493 NSA H98230-14-C-0141 Navy Sub Stanford 60744746-114407 DOD W911NF1810356Army Sub U Penn 574723 NSA H98230-17-1-0347 Navy Sub CWRU RES511186 USDOD W911NF-17-1-0525Army Sub U of FL UFDSP00012272 NAVY N00173-15-1-G004 NAVY Sub U Wash UWSC 906615477 DOD HQ00341720005ARMY CERL W9132T-15-C-0017 NAVY N00014-16-1-2245 Navy Sub Wisconsin 786K461 USAF AFRL FA9550-19-1-0282CERL W9132T-16-C-0012 TD7035 NAVY N00014-17-1-2431 NAVY sub Clemson 1969-202-2011916 DOD W912HQ18C0042ARMY CESU W9132T-16-2-0011 NAVY N00014-17-1-2209 Navy N66001-11-2-4206 Charles River Analytics SC1629401ARMY CESU W9132T-16-2-0001 NAVY N00173-17-1-G002 SERDP W912HQ-17-C-0042 UNL Sub 2611250025005ARMY CESU W9132T-15-2-0010 NAVY N00014-18-1-2086 SERDP W912HQ-14-C-0032 DOD Sub UILabs DMDII 15-12-05Army CESU W9132T-17-2-0001 Oceanit Labs Inc N6833518C0710 SERDP W912HQ-16-C-0053 DOD Sub LA W&F U513208299.513DARPA FA8750-16-C-0181 Navy Sub Pitt 9012518 (411788-1) SERDP W912HQ-17-C-0042 DOD West VA Univ 00442357 ANTCDARPA W911NF-17-C-0099 NAVY Sub Cornell 78559-10698 SERDP W912HQ-17-C0035 DOD sub Ensaras 088294DARPA HR0011-17-C-0107 NAVY Sub UTA UTA16-000558 SERDP W912HQ19P0025 UW SC10862 PO36141DARPA FA8750-18-C-0137 NAVY Sub UCLA 1015GTA245 SERDP W912HQ-17-C-0042 Univ of SC 19-3716 PO#2000042013SRI Intl PO029522 ONR N00014-18-1-2583 US Army PO 35089 Cherokee Nation W81xWH-18-D-0024 #0DARPA HR0011-10-1-0077 ONR N00014-17-1-2695 Army W912HZ-19-P-0039 Alliance A011502DARPA HR0011-15-2-0022 ONR N00014-15-1-2036 Army CESU W9128F-16-2-0006 Chicago Assoc Pape-VA CDMRPDARPA HR0011-15-2-0025 Navy N00014-12-1-0998 / 16-1-2791 ARMY Sub UTA UTA15-000962 WSU 15106DARPA HR0011-15-C-0008 Navy N00014-12-1-0828 / 16-1-2272 ARMY CESU W912HZ-17-2-0013 Wake Forest WFUHS 441034 CTA04DARPA N66001-14-1-4043 Navy N00014-10-1-0172 ARMY W912HZ-17-C-0023 Wake Forest WFUHS 441031 CTA01DARPA HR0011-16-2-0019 Navy N00014-05-1-0739 Army W912HZ-19-P-0047 DOD sub Wash U WU-18-177DARPA D16AP00001 Navy N00014-4-1-0525 / 14-16-1-2125 USAMRAA W81XWH1810338 Stanford University 61633787DARPA HR0011-17-2-0057 Navy N00014-13-1-0627 / 16-1-2238 DOD W81XWH1810317 DMDII 15-14-03 UI Labs 0220160026DARPA HR0011-17-2-0004 Navy N00014-15-1-2469 USARMAA W81XWH-18-1-0243 DOD Sub UI Labs DMDII 15-07-06DARPA HR0011-19-C-0042 NAVY N00014-15-1-2383 USAMRAA W81XWH 18 1 0019 DOD Sub U Wash DMDII UWSC9603DARPA FA8650-18-2-7866 Navy N00014-15-1-2397 USAMRAA W81XWH1710509 DOD Sub UI Labs DMDII 15-06-01DARPA FA8650-18-2-7843 Navy N00014-16-1-3151 USAMRAA W81XWH1710500 IBM FA8650-15-C-7561DARPA W911NF-18-2-0032 Navy N00014-16-1-2804 USAMRAA W81XWH 17 1 0122 US Dept of Educ P031C160237-18CACI PO No. LGS0033590 Navy N00014-16-1-2525 USAMRAA W81XWH-17-1-0095 DE R305A160335DARPA Sub VA GG11856-150042 Navy N00014-16-1-2895 USAMRAA W81XWH-16-1-0382 US DED R305A170558-19

STATE OF ILLINOISUNIVERSITY OF ILLINOIS
TABLE OF AWARD NUMBERS REFERENCED IN FEDERAL COMPLIANCE FINDINGSFor the Year Ended June 30, 2019
Name of Federal Program or ClusterResearch and Development Cluster (continued)
Award Number
46
DED R305A170074-18 ANL 4J-30361 WO 4J-30361-0005A DOE NREL KAGN 4-42504-03 DOE DE-FG02-94ER40865DED R305A160008-18 ANL 4J-30361 WO 4J-30361-0002A NREL SUB XGJ-7-70311-01 DOE DE-SC0006028DED R305A160010-18 ANL Joint Hire Agreement ORNL 4000161907 DOE DE-FG02-08ER15960DED R305D140023 - 16 ANL 3F-32621 DOE ORNL 4000152677 DOE DE-FG02-07ER46383DE R305A130448 DOE Sub ANL 3F-31145 DOE Battelle 4000162552 DOE DE-FG02-06ER46285DE R305A160335 DOE ANL 4J-30401-0002A DOE PNNL 298347 DOE DE-FG02-05ER46217DE R305A180211 DOE Sub ANL 4F-32001 DOE PNNL 384037 DOE DE-SC0011771DED H325D160074 DOE ANL 086654 DOE PNNL 434119 DOE DE-SC0010778DE H325D150036 DOE ANL 4J-30401-0018A DOE PNNL 415431 DOE DE-SC0010717DE Sub UW Madison 00351934 ANTC DOE ANL 4J-30401-0017A DOE PNNL 408988 DOE DE-SC0010719IN Univ S004D160011 PO#1978236 DOE ANL 4J-30401-0027A DOE PNNL 402250 DOE DE-SC0014267Governors State Univ DOE ANL 9F-60019 DOE PNNL 397153 DOE DE-SC0014335Univ of MN A004497003 PF116F140033 DOE ANL 4J-30401-0025A DOE PPPL S015851-H DOE DE-SC0014084DE Sub SU OSP-02-8300-2015-0018 DOE ANL 8F-30140 DOE SNL 1205852 DOE DE-SC0014101DE Sub SU OSP-02-8300-2017-0018 DOE ANL 4J-30401-0023A DOE SNL 1667314 DOE DE-SC0014332DE sub Southern U OSP02830020160014 DOE ANL 4J-30401-0022A DOE SNL 1650552 DOE DE-SC0014328DE Sub SU OSP-02-8300-2018-0017 DOE ANL 4J-30401-0021A DOE SNL 1858048 DOE DE-SC0013897DE Sub TU 300161-UIUC Brookhaven Nat Lab 291955 DOE SNL 1853319 DOE DE-SC0012400New York Univ SRL 1221 DOE BNL 150252 DE-SC0012704 DOE SNL 1856929 DOE DE-SC0012379NYU R305A160176 F-7816-01 DOE BNL 312727 DOE Sub SNL 1851532 DOE DE-SC0012443RU R305AI50189 14072907-UIC DOE BNL 342940 DOE Sub SNL 1850099 DOE DE-SC0012504Rutgers 5668 PO 887054 DOE BNL 345391 DOE Sub SNL 1850096 DOE DE-SC0012649UCONN Subaward No 33700 DOE BPA 00070654 DOE Sub SNL 115021 PO 1840609 DOE DE-SC0012368DE Sub TU 300161-UIUC DOE DE-FG02-03ER15476 DOE SNL 1754556 DOE DE-SC0016323Univ of Oklahoma Hlth Sci DOE DE-FG02-99ER54515 DOE SNL 1760986 DOE DE-SC0016321Univ MIZZ C00055847-1 PTE DOE DOE DE-FG02-01ER45923 DOE SNL 1736375 DOE DE-SC0016322DE Sub UMASS PO B000326008 DOE DE-FG02-02ER15296 DOE SNL 1737490 DOE DE-SC0016219DE Sub Vanderbilt UNIV 58653 DOE DE-FG02-90ER14146 DOE SNL 2030002 DOE DE-SC0016264NATIONAL WRITING PRJ DOE DE-FG02-87ER13716 DOE SNL 1990386 DOE DE-SC0016026DE Sub NWP 08-IL07-SEED2017-ILI DOE LBNL 7245135 DOE SNL 1997099 DOE DE-SC0015894ISBE MY19532 FY19 DOE LBNL 7253091 DOE SNL 1990853 DOE DE-SC0015655DOE ARPA-E DE-AR0000598 DOE LBNL 7462477 DOE SNL 1987942 DOE DE-SC0015640DOE ARPA-E DE-AR0000714 FERMI National Lab 651831 DOE SNL 1973075 DOE DE-SC0018141DOE ARPA-E DE-AR0000661 2019 Junior CMS LPC Distinguished R DOE SNL 1977764 DOE DE-SC0017858DOE ARPA-E DE-AR0000876 FERMI LAB PO 645645 DOE SNL 1979611 DOE DE-SC0018420DOE ARPA-E DE-AR0000983 Fermi Lab PO No. 629940 DOE SNL 1966716 DOE DE-SC0018260DOE Sub DDPSC 22815-1 FermiLab PO No. 629731 DOE SNL 1979295 DOE DE-SC0018254DOE ARPA-E Sub UMN A005223302 Fermi Lab PO No. 582879 DOE SNL 1974427 DOE DE-SC0018102DOE Sub U VA GG11916-151520 DOE INL 00127139 DOE SNL 1961594 DOE DE-SC0017840ANL 4J-30361-0036A DOE LLNL B616571 DOE SNL 1956131 DOE DE-SC0019517ANL 4J-30361-0035A DOE LLNL B622001 DOE SNL 1966281 DOE DE-SC0019189ANL 9F-60004 DOE LLNL B622092 DOE SNL 1975290 DOE DE-SC0019192Argonne National Lab 4J3036J DOE Sub LLNL B621589 DOE SNL 1951381 DOE DE-SC0019185ANL WO 4J-30361-0033A DOE LLNL B622393 DOE SNL 1945531 DOE DE-SC0019183Argonne National Labs 4J303610032A DOE LLNL B634140 DOE SNL 1932412 DOE DE-SC0019213ANL 4J-30361-0031A DOE LLNL B633144 DOE SNL 1927876 DOE DE-SC0018963ANL 8F-30149 M0002 DOE LLNL B633725 DOE SNL 1889062 DOE DE-SC0019198ANL 8F-30149 M0002 DOE LLNL B631626 DOE SNL 1887327 DOE DE-SC0019021ANL 4J-30361-0029A DOE LLNL B631306 DOE SNL 1876147 DOE DE-SC0018904ANL 4J-303061-0030A DOE LLNL B629295 DOE SNL 1861153 DOE DE-SC0018928Joint Appoint ARGONNE LLC DOE LLNL B626875 DOE SNL 1874486 DOE DE-FE0011194ANL WO 4J-030361-0027D DOE LANL 391861 DOE DE-FG02-07ER46471 DOE DE-EE0007309ANL 4J30361 WO 4J-30361-0026B DOE LANL 422459 DOE DE-FE0029445 DOE DE-EE0008312ANL 4J-30361 WO 4J-30361-0021A DOE DE-EE0006864 DOE 00434105 ANTC DOE DE EE0007985ANL 4J-30361 WO 4J-30361-0017D DOE DE-FC26-05NT42588 DOE DE-SC0019210 DOE DE-EE0007545ANL 4J-30361 WO 4J-30361-0018A DOE NETL DE-FE0031567 DOE DE-SC0018200 DOE DE-EE0007339ANL 4J-30361 WO 4J-30361-0016A RevC DOE DE-FE0031551 DOE DE-SC0017824 DOE DE-EE0008106ANL 4J-30361 WO 4J-30361-0011D DOE DE-OE0000780 US DOE SC0018209 DOE DE-EE0008547ANL 4J-30361 WO 4J-30361-0013A DOE Sub UTRC1228251 PO 2605063 DOE DE-FG02-05ER46225 DOE DE-EE0008545ANL 4J-30361 WO 4J-30361-0004D DOE NREL KAGX-8-82290-01 DOE DE-FG02-01ER41195 DOE DE-EE0008521

STATE OF ILLINOISUNIVERSITY OF ILLINOIS
TABLE OF AWARD NUMBERS REFERENCED IN FEDERAL COMPLIANCE FINDINGSFor the Year Ended June 30, 2019
Name of Federal Program or ClusterResearch and Development Cluster (continued)
Award Number
47
DOE DE-EE0008392 DOE Sub Stanford 61614273-130113 INT G17AC00029 IDNR FWS W-188-S-1DOE DE-FE0026434 DOE Sub Editekk 089133 INT G19AC00057 IDNR FWS W-181-R-1DOE DE-FE0026588 DOE Sub PSU5606-UIUC-LSJU-4215 INT G18AP00095 IDNR FWS W-182-R-1DOE DE-FE0024431 DOE Sub NW SP0004510-PROJ0011423 INT G19AC00069 IDNR FWS FW-16-D-2DOE DE-FE 0030822 DOE Sub MIT S4688-PO244210 INT G17AC00306 IDNR RC18T117R1DOE DE-FE0029381 DOE Sub Stanford 61961559-136555 INT G14AC00244 IDNR FWS T-123-R-1DOE DE-FE0029161 DOE Sub MSU RC107504 INT G14AC00119 IDNR FWS T-104-R-2DOE DE-FE0031685 DOE Sub MIT 97564 INT G14AC00021 IDNR FWS U-3-D-1DOE DE-FE0031700 DOE Sub KU FY2019-076 INT G19AC00017 IDNR FWS T-121-R-1DOE DE-FE0031626 DOE Sub GTI S579 INT Sub UAF 17-0074 IDNR FWS T-122-R-1DOE DE-FE0031581 DOE Sub IR 084592 PO 30059038 INT G15AC00138 IDNR FWS T-120-R-1DOE DE-FE0031600 DOE Sub MI SUBK00009790 INT G18AC00236 IDNR FWS T-119-R-1DOE DE-NA0002911 DOE Sub Starfire DE-EE0008319 INT G18AC00290 IDNR FWS T-118-R-1US Dept of Energy DOE EE0008270 USAMP DOE 17-2993-AMP INT Sub USC 104713908 IDNR FWS T-113-R-1DOE DE-EE0007722 Colorado State University INT Sub Auburn 18-BS-223045-UNIVILU IDNR FWS T-110-R-1DOE DE-EE0006282 DOE MUST 00042619-02 INT Sub FDACS 025436 IDNR FWS T-115-R-1DOE DE-NE0008779 DOE Sub AIChE DE-EE0007888-10-5 INT Sub AR Game & Comm 093629 IDNR FWS T-105-R-1DOE DE-NE0008436 DOE Sub PIL DE-EE0008138 NFWF 2005.16.054421 IDNR FWS T-104-R-1DOE DE-NE0008573 DOE Sub Linde DOE FE-0031592 NFWF 56440 IDNR FWS T-108-R-1DOE DE-NE0008699 DOE Sub CIT S394492 583 USFWS IDNR Osprey/Grd Sqrrl IDNR FWS T-99-R-1DOE DE-NE0008700 DOE Sub GW 18-S21R 583 USFWS IDNR Osprey Frnk Grd Squi IDNR FWS U-2-R-1DOE DE-NE0008780 DOE Sub GW 18-S24R IDNR R16SP001 IDNR CAFWS-141BDOE DE-NA0002374 DOE Sub NCSU 2014-0501-02 INT 140F0318P0093 IDNR CAFWS-141CDOE DE AR0000903 DOE Sub UM 3003222390 INT F15AP00890 IDNR CAFWS-135ADOE DE-AR0001057 DOE Sub Berkeley 00009034 INT F15AP00758 IDNR CAFWS-135BDOE DE-EI0002864 DOE Sub KSU S17061 INT F18AP00853 IDNR CAFWS-126EDOE ADM 2015-07090 DOE Sub USCar 15540-FD21 INT F16AP00909 IDNR CAFWS-126DDOE Sub Battelle 4000148519 DOE TAMU EES M1901001 INT F18AP00819 IDNR CAFWS-126C 089334DOE Sub BEA 171793 DOE Sub UFL UFDSP00011326 INT F14AP00485 IDNR CAFWS-126 KC086813DOE Sub UT-Battelle 4000143164 Univ of Fl P0056459 UFDSP00011999 INT F17AC00845 IDNR CAFWS-123E KC086743DOE Sub Battelle 4000142519 DOE Sub UCSD 76298468 S9001463 INT F18AC00721 IDNR CAFWS-123D KC086742DOE Sub Editekk 088959 DOE Sub CA TECH S416525 INT Sub Texas A&M M1800602 IDNR CAFWS-106H 2016-05840DOE Sub RIT REMADE SA-17-01 DOE Sub Arizona 514150 IDNR FWS F-196-R-2 IDNR CAFWS-106G 2016-05213DOE Sub Honeywell N0000230256 DOE Sub Berkeley 00009812 IDNR FWS F-101-R-30 IDNR CAFWS-106E 2016-05215DOE RIT REMADE SA-17-10 DOE Sub AR SA1804209 IDNR FWS F-69-R-32 NIJ 2015-VF-GX-K031DOE Sub BEA 180195 DHS FEMA HSHQDC16AB0010 IDNR FWS F-197-R-1 NIJ/DOJ 2015-ZA-BX-0003DOE Sub ABB 085307 DHS FEMA Sub UL 7102000571 IDNR FWS F-185-R-07 NIJ/DOJ 2013-ZA-BX-0008DOE Sub ABB 085306 DHS HSHQDC-16-A-B0010 IDNR FWS F-196-R-01 DOJ 2018-DU-BX-0213DOE Sub UH R-17-0009 DHS HSHQDC-17-C-B0025 IDNR FWS F-69-R-31 DOJ 2018-R2-CX-0022DOE Sub ABB DE-OE0000896 DHS EMW-2017-FP-00635 IDNR FWS FW-16-D-2 DOJ 2017-R2-CX-0012DOE SLAC 189399 DHS 2015-ST061-CIRC01/15STCIR00001 IDNR FWS W-154-R-11 DOJ 2017-R2-CX-0012DOE Sub ARI ARI 11484-1 2015-ST-108-FRG006 IDNR FWS W-112-R-28 583 DOJ NIJ FY17 Postconv TestingDOE Sub BEA 213384 Univ of MD 37747-Z9139101 IDNR FWS W-154-R-10 583 NIJ OJP Guilty Plea and LatinoDOE BEA 214196 DHS Sub UL 7102000247 IDNR FWS W-146-R-14 Contract 2016 MU-MU-K001DOE ORNL 4000168236 DHS Sub NYU F7589-02 IDNR FWS W-162-R-9 Iowa State Sub No. 428-20-13ADOE ORNL 4000167745 DHS Sub Natl Dev Research Inst 658A IDNR FWS W-183-R-5 DOJ INTF3030HH4W22916036 YR6DOE ORNL 4000166266 DHS Sub Skidmore 32170-4 IDNR FWS W-197-R-1 Vera Institute of Justice E0851DOE Battelle 207136 DHS Sub NC State U 2017-0081-01 IDNR FWS W-157-R-9 MTC PO 220005262 01 1DOE Fermi PO 644013 DHS FEMA Sub AZ 3020190 IDNR FWS W-198-R-1 IMECANL US DOE DHS FEMA Sub UL 7102001194 IDNR FWS W-43-R-66 IDCEO 18-633090MICHIGAN MEO-19-003 DHS Sub NCSU 2018-0700-02 IDNR FWS W-112-R-27 IDCEO 18-6330905 Lakes Energy MEO-16-001 INT P18AC00175 IDNR FWS W-162-R-8 IDCEO 18-633090DOE Sub Stanford 62034963-135443 INT P17AC01515 IDNR FWS W-146-R-13 DOT FAA 14-G-016Luna Innovations INC 347901 INT P17AC01121 IDNR FWS W-43-R-65 Off DOT FAA 14-G-009State Univ. of New York 68799 INT G15AP00169 IDNR FWS W-177-R-4 DOT FAA 13-C-AJFE-UI-007 09 015 019DOE Sub MIT DE-SC0008743 USGS G16AC00275 IDNR FWS W-183-R-4 DOT FAA 13-C-AJFE-UI-005 013 016DOE Sub DDPSC 23009-UI INT USGS G15AC00280 IDNR FWS W-154-R-9 DOT FAA 13-C-AJFE-UI 017 018DOE Sub CIT S390815 INT G16AC00333 IDNR FWS W-191-R-1 2018 DETFP 693JJ1945056DOE Sub WU-15-141 PO 2922576Y INT G17AC00241 IDNR FWS W-194-R-1 U.S. Dept. Transport 693JJ31845032DOE Sub DDPSC 23021-I INT G17AC00060 IDNR FWS W-193-R-1 DOT DTFH 693JJ31750005

STATE OF ILLINOISUNIVERSITY OF ILLINOIS
TABLE OF AWARD NUMBERS REFERENCED IN FEDERAL COMPLIANCE FINDINGSFor the Year Ended June 30, 2019
Name of Federal Program or ClusterResearch and Development Cluster (continued)
Award Number
48
FHA 693JJ319P000035 IDOT R27-189 FY18 DHHS 90DD0010-04 HRSA 1C12C23652-01Sub # 16-35 -DTFH61-14-D-00011 IDOT R27-182 FY18 ACL 90CSSG0011-01 HRSA 1 M01HP31358-02-01DOT Sub GLA 091170 IDOT R27-180 FY18 SRA Lab 7261 90RTEM0001 01 01 HRSA 5 D88 HP28506 04 00IDOT 2012 So. FL. Match IDOT R27-186 FY18 BU MHHS Sub No. 19-1833 HRSA H65HA00016-17-00DOT FRA DTFR53-15-C-00002 IDOT R27-164 FY18 WSU U of WA UWSC9416 BPO 18439 5 H65HA00016 16 00DOT DTFR5317C00007 IDOT R27-151 FY18 ARA U of WA UWSC9538 BPO19171 UNC Gillings Schl 2UE7MC26282-05DOT FRA 693JJ618C000005 IDOT R27-157 FY18 SIUE RIC NIDRR CL3802 Northwestern Sub 60044781 UICDOT FRA Sub Ensco G27355 IDOT R27-178-2 FY18 SLU Rehabilitation Inst of Chgo #81758 NIH 1 R01 GM095600 ADOT Sub Ensco G27407-4000 IDOT R27-181 FY18 USGS Rehabilitation Inst of Chgo #81759 NACCHO 2018-030101DOT NAS Safety 33 SUB0001071 IDOT R27-179 FY18 SLU Univ of Washington Cinn Chil Hosp Sub No 137128DOT IL-26-07010-00 IDOT R27-120 FY18 Iowa St AHRQ 7R01HS022702 CDC NCHHSTP 5U01PS005172 03U.S. Dept. Transport 693JJ31845019 IDOT R27-171 FY18 IIT AHRQ 1R03HS025265-01A1 Chi BioSolutions R41AI126971DOT DTRT 13-G-UTC-52 IDOT R27-172 FY18 VT HHS AHRQ 1R01HS025374 NIOSH 5 T42 OH008672-13DOT DTRT 13-G-UTC-52 IDOT R27-178-1 FY18 5 R01 HS024964-03 NIOSH 5 T42 OH008672-12Rutgers University 1024089 IDOT R27-176 FY18 AHRQ 1R01HS024850-01 NIOSH 5 U19 OH011232-04DOT FAA Sub UW UWSC8427 PO765496 IDOT R27-SP37-C FY18 1RS36HS024823-01 NIOSH 5 T42 OH008672-13DOT Sub Amtrak 2500110439 IDOT R27-175 FY18 WU-19-205 NIOSH 5 T42 OH008672-12DOT Sub Olsson HR25-50 Sub 0000730 IDOT R27-174 FY18 NW Univ SP0037488-PROJ0010215 Univ of Minnesota N006894503DOT Sub APT TOPR4-15-001-RR04-UIUC IDOT R27-170A FY18 Columbia University 3 GG012713 03 NIH 2T32GM079086-11DOT Sub APT TOPR 3-15-001-RR03-UIUC IDOT R27-168 FY18 SUNY Subaward No R1045129 NIH 3T32GM079086 09S1DOT Sub APT TOPR 2-15-001-RR02-UIUC IDOT R27-149-2 FY18 Rush 15012705-Sub01 Amend03 5 T32 GM079086 09DOT Sub U of MI 3004631369 IDOT R27-127 FY18 NYAM NO 03 1 R01HS022670 01A1 NIH SNAP 5K01TW010494-04DOT FRA Sub FL UFD5P00011632 IDOT R27-RDI FY18 CDC 19IPA1916653 Fogarty 1 D43 TW010935-01DOT Sub NAS SAFETY-41 SUB0001347 IDOT R27-PC FY18 CDC/NIOSH/EID # 18IPA1816751 Fogarty 5 D43 TW009316-05DOT Sub NCE 090976 IDOT R27-ET2 FY18 CDC 17IPA1712106 NCI HHSN261201500026IDOT Sub Penn State 5920UIUCNASTY30 IDOT R27-162 FY16 CDC/NIOSH/RHD 17IPA1716605 NCI HHSN261201500026IDOT Sub FAU UR-K84 IDOT TS-18-316 CDC 200-2016-91153 NIH 3R01CA184681-04Easterseals Nat IL-2017-004-00 752 NHTSA IDOT FY19 Tele Survey CDC 200-2016-M-91106 NIH 1 R01 CA204808 ASub FP062899-D D2015-SRER-007 583 NHTSA IDOT TS FFY19 CDC/NIOSH/NPPTL 16IPA1616802 NCI R37 CA227101-01A1Univer. of Chicago FP062899-C 752 NHTSA IDOT FY18 Tele Survey CDC 6 U01CK000557 01 03 SNAP 1R03CA235109-01Univ South Florida 2117-0962-02-C 583 NHTSA IDOT IP FFY18 IPA Agreement 15IPA1511782 CDC SNAP 5R21CA231610-02DOT Sub MSU RC103194 UIUC EPA RD-83542301 NIOSH 5 U60 OH010905-05-00 SNAP NCI 4 R01 CA172726-04DOT Sub UMN H003662402 EPA RD-83543401 CDC 5 R01 OH007590 08 NIH Snp 4 R01 CA166588-05DOT Sub MO 0042134-02-1 EPA RD-83582601 CDC 1U48DP005010-01 SNAP 5R21CA194608-02DOT Sub MO C00056371-1 EPA Sub Purdue 4109-78796 CDC 1U48DP005010-01 SNP 5 R03CA178843 02 REVISEDDOT Sub MO 00042134-02-2A-2 KS State Univ S17138 CDC 1 U54 CK000445-01 Snp 5 R01 CA156164-10IDOT R27-195 FY18 AZ State University 14-495 IPHI NU58DP006508 NIH 1 R01 CA204808 AIDOT R27-192 FY18 EPA Sub UMD 40517-Z9219101 CCI 8100-001 NIH 1 R01 CA197516AIDOT R27-177 FY18 U of MA (Amherst)15-Q08462 H DO Univ of MD 1902999 Snap 5R21CA223915-02IDOT R27-154 FY16 IEMA 19UIUC RADON Johns Hopk Univ PO 2004087223 NIH SNAP 1R01CA214825-03IDOT IEPA FW-15220 Indiana Univ NCI SNAP R21 CA208610-02IDOT R27-203 FY18 IEPA 604173 U Of Alabama 000512145-002 NCI 5R01 CA178061-04 RevisedIDOT R27-SP39 FY18 IEPA 604153 Cerner Corporation 200 2015 63931 NIH 1 R33 CA177446 AIDOT R27-SP38 FY18 IEPA FWN-10301 U Of Chicago NIH 1 R33 CA196458 AIDOT R27-193-4 FY18 IDNR GLRI16005 NACDD 0402018 170-1403-5 NIH 4 R01 CA025836 IIDOT R27-193-3 FY18 IEPA FW-16102 University of Chicago NIH 1 R01 CA197488 AIDOT R27-200 FY18 HHS 90YE0185-01-00 CHSSA 1U01PS005140-01 NIH 1 R01 CA197516AIDOT R27-193-1 FY18 HHS 90YE0208-01-00 CDPH PO# 66148 NIH 7 R01 CA184091 BIDOT R27-193-2 FY18 Spaulding for Children PROJ12030RS CDPH 84850 & 99396 NIH 1 R01 CA213149 AIDOT R27-196-HS FY18 OR DHS 146499 IDPH IGA 86100009F NIH 1 R21 CA216066 AIDOT R27-197 FY18 IDPH 96180067G IDPH FY18 Environmental Health 01 NIH 1 R01 CA227699 AIDOT R27-198 FY18 ACL 90RT5032-05 IDPH 86100024F Snp 1 R21 CA234866 01A1IDOT R27-194 FY18 ACL 90RT5020-04-00 NIH FDA 1U18 FD006454 A Snap 1R03CA219764-01A1IDOT R27-190 FY18 90IF0100-02-00 CU FY19491004 AMD7Proj25A7212 NIH SNAP 1R01CA225446-01IDOT R27-188 FY18 NIDILRR 90RT5038-03-00 HHS Sub NIPTE-U01-IL-2020-001 Snp 1 R03 CA230829 01IDOT R27-183-HS FY18 DHHS 90AR5023-04-00 HHS SUB NIPTE-U01-UIL-2018-001 SNAP 5 R03CA227218-02IDOT R27-187 FY18 WSU ACL 90RT5012-01 HRSA 2 T73 MC11047-10-01 Snp 1R01CA225190-02IDOT R27-191 FY18 SIUE DHHS 90DDUC0067-01-01 HRSA T76MC00009-35-00 NIH SNAP 1 R01 CA212608 01A1IDOT R27-199 FY18 ARA ACL 90DDUC0050-01-00 HRSA G02HP27981-03-01 SNAP 5 R03 CA212890-02IDOT R27-202 FY18 VA Tech DHHS 90DD0010-05 HRSA 6 UD7HP30929 02-01 Snp 1R03CA216010-02

STATE OF ILLINOISUNIVERSITY OF ILLINOIS
TABLE OF AWARD NUMBERS REFERENCED IN FEDERAL COMPLIANCE FINDINGSFor the Year Ended June 30, 2019
Name of Federal Program or ClusterResearch and Development Cluster (continued)
Award Number
49
Snap 5R01CA216410-02 Ionic Pharmaceuticals UIC001 SNP 7 R01 EY023522 05 NHLBI 5 F30 HL136001-02Snp 3 R01 CA154406 05 SWOG S1501 Snap 5K08EY024339-05 NIH SNAP 5R01HL136946-02NIH 1 R01 CA178844 A Alliance Foundation A031501 NEI 7 U10 EY017337-05 SNAP 5R01HL133059-02NIH 1 R21 CA187592 A Alliance A011401 NIH 1 R01 EY023979A NIH 5F30HL137267-03NIH 4 R01 CA120439 C CHOP U10CA180886-02S7 NIH 1 R01 EY026965 A Snap 5R01HL137169-03NIH 1 R01 CA207584 A CHOP UG1CA189955 - NCORP - IL146 NIH 1R21 EY027612 A NIH SNAP 1K08HL135318 02NIH 1 R21 CA212732 A CHOP AALL1131 U10CA180886 NIH 1 R01 EY029397 A Snap 5R01 HL090152-12NIH 1 R21 CA198684 A CHOP NCTN IL146 U10CA180886 Jaeb NIH 1R56HL126876-01A1NIH 4 R00 CA214523 B NRG Oncology Foundation Inc. JCHR Protocol W 11 12 15 Snap 5 K08 HL133474-03NIH 1 R01 CA211875 A NU 60038196 R01CA186885 Penn State Univ. UILEY023533 SNP 5 K01 HL133370-04SNAP 7R01CA178431-06 CHOP NCTN JAEB CeNter Hlth Rsch NHLBI 5 P01 HL060678-18SNAP 7R21CA196434-04 CHOP U 10 CA180886 NHLBI 75N92O19D0001275N92O19F00044 SNAP 5R01HL104092-08Snap 5 R21 CA212907 02 OH State U P01CA125066 60045417 HHSN268201700006C SNAP 5 K23HL130524-03Snp R01 5 CA141057 07 Ohio State U Sub 6004519 NIH HHSN268201700007C Snp 4 R01 HL084153-09SNAP 5R01CA090764-18 Childrens Hospital Philadelphia NIH HHSN268201300003I 3 T32 HL082547-10S1Snp 1R01CA204962-02 MSSM 0254 7378 4605 NIH 5R21HL140531-02 NIH 1R01 HL129887-03Snp 5 R01CA211095-03 Child Hosp Phili PCR WO FP 00013013 Snp 4R00HL130581-03 SNAP 5 P01 HL077806-15Snp 5 R01CA206167-04 Child Hosp Phil SL WO FP00014251 SNAP 1R01HL141120-01A1 SNAP 5R01 HL23804-04Snp 5 R01 CA 172220-05 NCCF 98543 1194 020816 Snp 1R01HL147031-01 Snap 5 R01HL128359-04SNAP R01 CA176846 -05 NIH Sub Iria 094820 SNAP 1R01HL141255-01A1 NHLBI 1R01 HL123797-01A1NCI SNP 5 R01 CA200669-04 NIH Sub SRI 5-27191 Snp 2 R01 HL 083298 11A1 5 T32 HL007829-26Snap 5 R01 CA196930-05 Univ of Wisc Sub No 839K775 4UH3HL132368-04 Revised SNP 5 R01HL118068-03RSnap 5 R01 CA188427-05 NU 60039741 UIC Snp 1R21HL140277 01A1 NIH 1 R21 HL129115 ASnap 5 R01 CA177655-03 5 UL1TR002003 04 SNAP 5R00HL130416-04 NIH 1 R01 HL142626 ASnp 5 R01CA175380-04 5 KL2TR002002 04 NIH 1R61HL139454-01A1 NHLBI 5 P01 HL060678-18NIH 1 U01 CA198943A Northwestern 60044737 UICHI 5T32HL139439-02 SNAP 1R01HL136622-01A1NIH 1 R01 CA234025 A NIH 1F31AT010419-01 NIH 7R01HL119453-05Revised Snp 5R01HL142998-02NIH 1 R03CA223709 A NIH T32 AT007533-06 NIH 5T32HL134634-02 NIH 5R35HL140031-02NIH 2 R01 CA163336 C NIH 1F31 AT010090-02 SNAP 2R01HL112626 06A1 SNAP 5 R01 HL134971-03NIH 5U54CA202997-04 Snap 1R01At008824-04 Snap 5R01HL138737-03 NIH 5F30HL134296-03NCI 5P20CA202908-04 Snp 5 R01AT009169-04 NIH 1R56HL128342-01A1 SNAP 5R03HL135454-02NIH 5U54CA202997-04 2 P50 AT000155-20 Revised NIH 5R01HL130513 03 NIH 5U01HL134042-03Snap 1K22CA226676 01A1 NCCIH 5U41 AT008706-05 Snap 5R01HL130028-04 Snp 5 R01 HL080264-12NCI F31 CA232324-01A1 5 F31 AT008535-01A1 5 P01 HL062426-19 SNP 5R01HL130760-04National Cance Inst 1F30CA236031-01 2 P50 AT000155-20 Revised SNP 7R01HL119043 NIH SNAP 5 K23HL125984-04SNAP 5K22CA215828-02 NIH 1F30EY029578-01A1 SNP 4 R01 HL079356-09 Snp 1 R01 HL122157-04NCI 5 F30 CA 228191 02 Snp 1 R01EY029409 01A1 NIH 5 R01 HL129153-04 SNP 5R37HL039888-33NIH 5T32CA057699-27 Snap 1R01EY029339 01A1 4 R00HL125884-03 SNAP NIH 5 R01 HL125350-055 F30 CA225058 02 Snap 1R01EY030101-01 SNP 1R01HL128468 01A1 5 R01 HL124945 03NIH 5F30CA224986-02 Snap 1 R21EY028690 01 A1 NIH Snp 4 R01 HL083298 10 Snp 5R01HL062350-17NCI 5 F30 CA217079 03 Snap 2R01EY024710 04 SNAP 1 K08 HL130587-01 NIH 1 R21 HL132642 ANCI SNAP 5K01 CA193918-03 SNAP 5R01EY024363-05 SNAP 5R01HL126852-04 NIH 1 F31 HL136155 ASnap 5 K08 CA 190855-05 Snap 1R01EY029426-01 5 R01 HL126516-04 NIH 1 R01 HL140526 ANIH 4 F30 CA180723 B 2 K12EY021475 06A1 5F31HL127996-03 Utah Sub 1005178301NIH1 F30 CA206495 A SNAP 3 R21 EY027447 01A1S1 NHLBI 1F30HL128034-04 DuPage Medical NHLBICSBHV201701JSHHS Snap 5R21CA215252-02 Snp 5 R13EY027189 03 5T32HL125294-04 Northwestern 60045948 UICNCI 75N91019D00016 SNAP 1K08EY027459-02 5R01HL125356-05 Albert Einstein31195A P0704588NCI 75N91019D0017 Snp 5 R01 EY027912 03 SNAP 5R01HL073965-13Revised Massachusetts General Hospital A5332NIH 1 R01 GM107533 A SNAP 5R21EY027101-02 NHLBI 5UM1HL112856-03 NU 60025439UIC CRSDCNIH SUB Leidos 19X072 Snp 5 R01 EY010101 23 NIH 1 R01 HL126845A COPD Fdn 5 U01 HL128954-03NU 60041703 Snp 5 K23EY022949-05 NIH 1 K01 HL 130712 A Univ of CA 10455scAlliance A041701-065243 Snp 5 R01 EY023656-05 NIH 1 R21 HL131469 A Univ of WI 0000000020VUMC 67578 R01CA225005A SNAP 4R01EY022651-06 NIH 1 R01 HL147252 A U of Pittsburgh 9012549 130129 38UC Davis Sub No 201603696-06 NEI 5 F30 EY025981-04 SNAP 1R01HL142636-01A1 NIH SUB GSI 092089Med Univ of SC MUSC16-041-8B807 NIH SNP 5R01EY026004-02 Snp 2 R01 HL 084153 10A1 Dupage Medical 1R43HL142396 01Subaward No 566K101 Natl Eye Inst SNP 1R01EY02364401A1 Snap 1K08HL140222-01A1 Ann and Robert H. Lurie 901550-UICSWOG Protocol S1602 5 P30 EY001792 39 Snp 5 R01 HL105947 07 PHD Biosciences 1R43HL142402BWH 110408 NIH 1R01EY024966-01A1 Snp 5 R01 HL045638 31 Ann and Robert Lurie Children HosNRG Oncology NRG-GU006 Snp 5 R01 EY024349-04 NIH 5R01HL138628-02 NIH 4 R01 HG007406 BNRG Oncology Fdn SNAP 5 R01 EY024710-02 Snap 2R56HL105947-06 NIH 1 R25 HG007158 B

STATE OF ILLINOISUNIVERSITY OF ILLINOIS
TABLE OF AWARD NUMBERS REFERENCED IN FEDERAL COMPLIANCE FINDINGSFor the Year Ended June 30, 2019
Name of Federal Program or ClusterResearch and Development Cluster (continued)
Award Number
50
NIH Sub UM SUBK00008996 NIH 4 R01 AI015650 J NIH 1 R21 EB025327 A Snp 5R21ES027622-02NIH Sub UPenn 575330 NIH 1 R01 AI118880 A NIH 1 R21 EB023402 A NIHSNAP 7 R01 AR069564-04 NIH 1 R01 AI117210 A NIH 1 R01 EB022388 A SNAP 1R01DE028531-01NIH SNP 7R01AR066193-05 NIH 1 R01 AI123381 A NIH 1 R21 EB027396 A NIH1 F31 DE028747-01NIH NIH 1 R21 AI122202 A NIH 1 R01 EB028091 A NIH 1 F30 DE028193-01A1Snp 5R01AR061791-08 NIH 1 R21 AI122019 A NIH 1 R21 EB023403 A NIH SNAP 1R03DE026248-01NIH Snap 5 R01 AR069541-03 NIH 1 F30 AI122925A NIH 1 R01 EB025651 A NIH SNAP R01DE027404Snap 5R03AR065778-03 NIH 1 R21 AI131168 A NIH 1 R03 EB026064 A SNAP 5R01 DE027980-02NIH 2 R01 AR048914 C NIH 1 R01 AI129719 A NIH 1 R01 EB026300 A NIH 1F30DE027601-01A1NIH 1 R01 AR069645 A NIH 1 F32 AI129363 A NIH 1 R21 EB025388 A SNAP 5R03DE027147-02NIH 1 R01 AR072735 A NIH 1 R01 AI144967 A NIH 1 R21 EB024133 A NIH SNAP 2R01DE019463-04NIH Fogarty D43 TW010530-03 NIH 1 R21 AI142380 A NIH 7 R01 EB025268 B NIH 5UH3DE025483-04Rush 15091103-Sub01 1R01AR070181 NIH 1 R01 AI139246 A NIH 1 R21 EB023413 A NIH 2R56DE021040-06A1Snap 1R21DC017292-01A1 NIH 2 R01 AI015650 K NIH SNAP 1RD1EB026238-02 SNP NIH 1R21DE026259-02RSNAP 1 R21 DC016454-01 NIH 1 R21 AI130562 A NIH 1 DP2 EB024377 A NIH 5 F30DE026051 03SNP 5R01DC006456-12 NIH 1 R01 AI135812 A Snp 5R01HD089935-03 NIDCR SNAP 5R21DE025926-02NIH 1 R21 DC014765 A NIH 1 R01 AI136773 A Snp 5R01HD089935-03 5 T32 DE018381 12NIH 1 R01 DC013073 A NIH 1 R03 AI138138 A NIH SUB UMN N006925702 SNAP 5K08DE024531-04NIH 1 F31 DC015967 A HHSN272201000032I Task Order C28 NIH SUB MGH 231393 5 R01 DE011657-20 SNPJHU 2002405094 U01 DC013778-01 NIH 7 R21 AI119945 B NIH 5K23HD086295-04 NIDCR 5F30DE024352 05RNIH SUB VU UNIV60404 NIH Sub MSC CSA-NIAID-UIUC-2018-001 NIH 1UG3HD096875-01 NIDCR Snp 5R01DE021405-05REVISEDNIH SUB NU SP0044830-PROJ0012559 NIH Sub GS 00387534 ANTIC Snp 5 R01HD090887-02 NIH 1 R15 DE026401 ASnp 1R03AI128228-02 PAI Life Sciences Inc Snap 5R03HD095056-02 NIH 1 R03 DE026817 ANIAID Snap R21 AI144500-01 Global Alliance 1U194t142735 60607 5 R01 HD091210-03 NIH 1 R21 DE026582 ASNAP 1R01AI143641-01 Hektoen Subaward No 50042-324-UIC01 1K99HD092606-01 NIH 1 R01 DE026836 ASNAP 1R21AI142060-01 HJF Sub 4677 PO954508 SNAP 1R21HD084209-02 NIH 2R56DE021040-06A1Snp 1 R01 AI 139768 01 Hektoen Subaward 50713-R01-UIC01 NIH 5 F30 HD090938-02 Seattle Childrens 11526SUBNIAID F30 AI136359-01 Brigham 117550 NIH Snap 5 R01 HD089455-03 SCH 11299SUB RDE022438-04SNAP NIH 1R21AI137865 01 Hektoen Sub 50041-324-UIC01 NICHD Snap 1 R01 HD093780-02 Univ of WA BPO5399NIAID 1 F31 AI134010-02 Johns Hopkins LDR 01 MOD 5 SNAP 1R01HD088543-02 NIH 1 U54 DK107965ASnap 5R21AI133557-02 CHMC 5U54AI117804-04 Snp 5 R21 HD084953-01A1 Snap R01DK116878-01A1NIH 5R21AI137584-02 UND Subaward No. 202953UIC HHS SNAP 5R03HD084909 02R SNAP 2R01DK098170-05SNAP 1R21AI135917 01 Chgo BioSolutions 1R41AI27031 SNAP 5R01HD076018-05R Snp 5 K01 DK111771 05SNAP 1 R21AI126308- 02 Family Health HPTN 083 Snap 5 R01 HD081022-03 Snp 2 K24 DK092290 06Snp 5 R01 AI114467 03 Univ of Michigan #3003642649 SNAP 5 R01 HD081534-05 NIH SNAP 1 R21 DK116146-01A1Snp 5 K99AI128029 02 ICR M19CH00809073 Task Order 4 SNP 5 R01 HD 075777-05 SNAP 2 R01 DK054016-19SNAP 1R21AI133050-01 ICR M19CH00809073 Task Order 3 NIH 2 R01 HD054448 B NIH 5 F30 DK117535-02SNAP 5R21 AI133304-02 NIH Sub UCSC 00427039 ANTIC NIH 1 F30 HD084201A NIH 2U01DK060980-18SNAP 5R21AI128171-02 Curza Global R01AI132304-01 NIH 1 R01 HD086099 A Snp 5 R01 DK 114126 02NIH 5 R01AI091779-08 NIH 2 R01 EB009745 B NIH 1 R21 HD085530 A Snap 5R00DK107008-04SNAP 1 R01 AI125518-03 Snp 1R21EB028069-01 NIH 4 R01 HD069381 B NIH SNAP 1R01DK115747-02Snap 5R01AI083241-07 NIH SNAP 7R01EB023907-03 NIH 1 R03 HD083596A Snap 5K01DK115525-02NIAFD 4 R01 AI110369-05 NIH SNAP 4R00EB022636-03 Revised NIH 1 R21 HD091681 A Snp 1R01DK111489-02Snp 5 R01 AI121275-04 NIH SNAP 5R21EB026077-03 NIH 4 R00 HD082375 B Snap 5R01DK072231-12Snap 5R01AI125401-04 NIH SNAP 1RD1EB026238-02 NIH 1 R03 HD096157 A Snap 5R01DK111677-03SNAP 5 R21 AI119618-01A2 SNAP 1 R01 EB023924-01A1 NIH 1 R21 HD095314 A 5F30DK113703-03SNAP 1 R21 AI123640-02 SNAP 1R01EB026716-01 NIH 1 R01 HD090066 A Snap 7R01DK107605 02SNAP 5R01AI121286-04 NIH SNP 1R21EB024003 02 NIH 1 R01 HD094546 A NIH SNAP 1R01DK108994 01A1Snap 5R01AI085015-11 SNAP 5 R21EB023516-02 NIH 1 R01 HD093627 A NIH 1F31DK111183 01A1Snap 5 R21 AI112755-01A2 NIBIB Snp 5R25EB021733-04 NIH 1 R01 HD095841 A SNAP 7 R01 DK104927 04SNAP 5 R01 AI116441-04 SNP 5 R25EB018239-04 NIH 1 R21 HD094296 A Snap 5R01DK092441-07Snp 5 R01 AI107516 04 NIH 4 R37 EB002641 D JHU PO 2004023981 PI Mostafa Snp 5R01DK107615-03NIAID 5F30AI110080-04 NIH 2 R01 EB009745 B Univ of Texas 163344-163343 Snap 5R01DK108141-04Snp 1 R01 AI108546-03 NIH 1 R21 EB020766A Univ of TX 162390/162384 Snap 5R01DK109015-04Snp 1R01Ai110369 NIH 1 R21 EB021013 A Lurie Children's Hosp 901515-UIC Snp 4 R01 DK 054016-18NIH 4 R33 AI101504 B NIH 1 R21 EB018481A Harvard Sub 114205 1366 5096827 Snap 4 K24 DK092290-05NIH 5 F30 AI109825 A NIH 1 R03 EB022254A Hektoen 50675 324 UIC 02 NIH Snp 4 R01 DK081858-08NIH 1 R21 AI105664 A NIH 2 R01 EB013723 B Tulane TUL-HSC-556624-18/19 Snp 5K01DK103908-04NIH 1 R21 AI118434 A NIH 1 R01 EB023232 A NIH SUB NEU 500628-78501 5U01DK060980-17NIH 1 K22 AI116588 A NIH 1 T32 EB019944 A NIH MIR MIRC001153 SNAP 4K23DK094829 05

STATE OF ILLINOISUNIVERSITY OF ILLINOIS
TABLE OF AWARD NUMBERS REFERENCED IN FEDERAL COMPLIANCE FINDINGSFor the Year Ended June 30, 2019
Name of Federal Program or ClusterResearch and Development Cluster (continued)
Award Number
51
NIH SNP 1R01DK105118-01A1 NIH 1 R21 ES028963 A NIH 2 R01 GM097142 B SNAP 5K23MH112769-02Snp 5 R21 DK103066-02 Univ of Cincinnati 008647-087 NIH 4 R01 GM106106 B Snap 5R61MH111907-02Snap 5R01DK101536-05 Northwestern Univ 60047725 UIC NIH 2 R01 GM058822 E Snp 5 R01 MH112705 032 U01 DK060980-15S1 Univ of Chicago FP0600090-01-PR NIH 4 R01 GM065966 D Snap 5K23MH113793-03Snp 5 R01 DK072231-10 University of Pittsburgh NIH 2 R01 GM089771 B 1R21MH112330-02R SNPNIH 1 R01 DK095685 A Univ of Chicago FP048528-02-A NIH 9 U01 GM120764 A SNAP 1R21MH108363 01A1NIH 1 R01 DK099528 A NIH 1 U54 GM114838 A NIH 4 P01 GM077596 C SNP R01 MH096744NIH 1 F30 DK105760A Snap 1 R35 GM131707-01 NIH 1 P01 GM118303 A SNAP 1 R56 MH107387-01A1NIH 4 R01 DK015556 L NIGMS Snap R01 GM125943-01 NIH 1 R35 GM118145 A Snp 4 R01 MH101497-04NIH 2 R01 DK071909 C Snp 5R35GM127084-02 NIH 9 R01 GM118306 B Snp 4 R01 MH101487-04NIH 1 F30 DK108567 A Snap 5 R01 GM097042 07 NIH 1 F32 GM117765 A Snp 4 R01 MH094358-05NIH 4 R01 DK098398 B HHS 5 R35GM127134-02 NIH 1 R01 GM107140A SNAP 4R01 MH099993-04-RevisedNIH 1 R01 DK107561 A NIH Snap 5R35GM118091-04 NIH 2 R01 GM093318 Snap 5 R01 MH106565-04NIH 1 R01 DK113080 A HHS 1R25GM121212-02 NIH 1 R01 GM123998 A 5 T32 MH067631-15NIH 2 R01 DK095842 B 2 R01GM050875-25 NIH 1 R01 GM117104 A Snap 1R34MH101364-03 REVISEDNIH 2 R01 DK062777 F SNAP 1R01GM118582-01A1 NIH 1 F32 GM121033 A Snp 5 R01 MH090035-06 RevisedNIH 1 R01 DK112251 A NIH SNAP 1R01GM124235 01 NIH 1 R01 GM124316 A NIH 1 U01 MH109062 ANIH 7 K01 DK114373 B Snp 5 R01 GM120485 03 NIH 1 R35 GM125029 A NIH 1 R03 MH105655 ANIH 1 F31 DK117514 A Snap 2 R01 GM045444-23 NIH 1 R01 GM122891 A NIH 7 R01 MH094241 BNIH SNAP 1R01DK115747-02 SNAP NIGMS 5 R35 GM122530-03 NIH 2 R01 GM049640 G NIH 1 R01 MH 101145 ASNAP 5 R01 DK109709-03 Snap 2 R01 GM093827-07 NIH 2 P41 GM104601 H NIH 7 R01 MH077195 DNorthwestern Univ 60046455 UIC SNAP 5R01GM116820-03S1 NIH 2 R01 GM101012 B NIH 4 R01 MH093661 BUniv of Chicago FP035726-03 B NIGMS SNAP 5R01GM092850-07 NIH 1 R01 GM118575 A NIH 1 R21 MH110975 A Emmes Corp ID 1 UC4 DK114839 01 SNAP 4 R01 GM079804-09 NIH 1 R35 GM122525 A NIH 1 R21 MH107200AUCSF SubNo 10788sc Snp 5 R01GM078253 13 NIH 1 F32 GM120999 A NIH 1 R01 MH114600 ASUNY R1122006 Snp 4 R01 GM097042-05 NIH 1 R01 GM115584 A NIH 1 R21 MH112578 ANorthwestern Univ 60046420 UIC Snap 1 R01GM117028-01 NIH 2 R01 GM092830 B NIH 1 R21 MH113155 ALoyola University 208397 Snp 5 R01GM078492 12 NIH 1 R01 GM120782 A NIH 1 R21 MH117377 AColumbia GG012235-01 SNAP 5 R01 GM112746-04 NIH 1 R01 GM120552 A NIH 1 R01 MH114847 ARush 15120306 Sub02 5 R01 GM110018-04 NIH 1 R01 GM131272 A NIH 1 R56 MH112642 AUniversity Of Penn PO3877207 Snp 5R01GM081030-07 NIH 7 R01 GM114588 B NIH 00435044 ANTICBaylor COM 7000000039 SNP 5R01GM111320 04 NIH 2 R01 GM062211 E NIH 1 R35 GM118185 ALoyola 1U01DK106898 Snap 5 R01 GM098026-06 NIH 1 R21 GM131425 A Columbia Univ. 1 GG014809-01Rush University 12052906 Sub01 NIH 1 R01 GM097443 A 1 R01 GM129709 A NYU F1008-01 PO iB00280145EMMES CITR NIH 2 R01 GM058460 D NIH 2 R01 GM073115 C Hektoen Subaward No: 50504-324-UICBRICOH Sub# 50578.914951.6560 NIH 1 U54 GM093342 A NIH 1 F32 GM129944 A SUNY 1146332-81241Joslin Diabetes Center NIH 1 R01 GM108584 A NIH 1 R01 GM125196 A Vanderbilt Univ VUMC62963NIH Sub MC UNI-245818/PO #66257114 NIH 1 R01 GM085235 B NIH 1 R35 GM128761 A Pax NeuroscienceSnp 4 R33ES024717-04 NIH 2 R01 GM082937 B NIH 1 R01 GM127554 A Northwestern Sub 60047343 UICSnap 5R01ES028615-04 NIH 1 R01 GM117467 A NIH 1 R01 GM127497 A Icahn 0255-2911-4609SNAP 1 R01 ES028879-02 NIH 2 R01 GM079038 B NIH 1 R01 GM125845A Univ of MI 3004167515NIEHS Snap 5 R01 ES028790-02 NIH 2 R01 GM067887 D NIH 1 R01 GM127659 A Univ of Chicago FP056858 BNIEHS Snap 5 R01 ES027823-02 NIH 2 T32 GM070421 C NIH 1 R35 GM127010 A NY State Univ MedicalSnap 7 R01ES022933-05 NIH 1 R01 GM114341 A NIH 2 R01 GM061153 E SNAP 7R21DK110644-03SNAP 5 R01 ES025159-04 NIH 1 R01 GM111816 A NIH 2 R01 GM058460 E SNAP NINDS 1R03NS111554-01A1Snp 4 R01 ES022071-05 NIH 2 R01 GM072744 D NIH 00452968 ANTIC NINDS 1R21NS109837-01A1NIEHS SNAP R01 ES025179-05 NIH 2 R01 GM062211 D NIH ZK 00458515 ANTIC SNAP 2R01NS082730-06NIEH SNAP 5R01ES024423-05 NIH 1 R01 GM111566 A SNAP 1R01GM129153-01A1 NIH 4UH3NS100127 03NIH 2 T32 ES007326 D NIH 2 R01 GM065307 D U of Mass No. 16-009336 A02 Snap 1R21NS109862 01NIH 1 R03 ES023972 A NIH 2 R01 GM073115 B NIH Sub PU 11000451-034 SNAP 5R01NS102573-02NIH 1 R21 ES027878 A NIH 2 R01 GM061153 D NIH Sub UT UTA18-001197 NIH 1 F31 NS105525-01A1NIH 1 R21 ES026388 A NIH 1 R01 GM108578A NIH Sub MC UNI-242999/PO #66104865 Snap 5R03NS106308-02NIH 4 P01 ES022848 B NIH 1 R01 GM112845 A NIH SUB CWRU RES513953 SNAP 5 R21 NS099896-02NIH 1 R25 ES025059 A NIH 4 R25 GM103771B NIH Sub PhiO 095353 Snap 5R21NS095723-02NIH 1 R56 ES025147A NIH 4 R01 GM099669 B Snap 5 R34 MH115779-02 SNAP 1R21NS099556-02NIH 1F31 ES028607 A NIH 1 R01 GM123455 A NIMH Snap R01 MH116721-01 Snap 1 R56 NS083527-01A1RevisedNIH 1 R01 ES026956 A NIH 1 R01 GM120182 A SNAP R21MH117759-02 Snp 5 R01 NS065808-09NIH 1 R21 ES026896 A NIH 1 R01 GM120353 A Snp 5 R00 MH109667 04 NIH 1 R01 NS083402 ANIH 1 F31 ES030467 A NIH 1 F31 GM113486 A Snap 5R01MH086507-09 NIH 1 R01 NS097610 ANIH 1 F31 ES029833 A NIH 3 R01 GM097443 B Snap 5R01MH105488-06 NIH 1 R21 NS098174 A
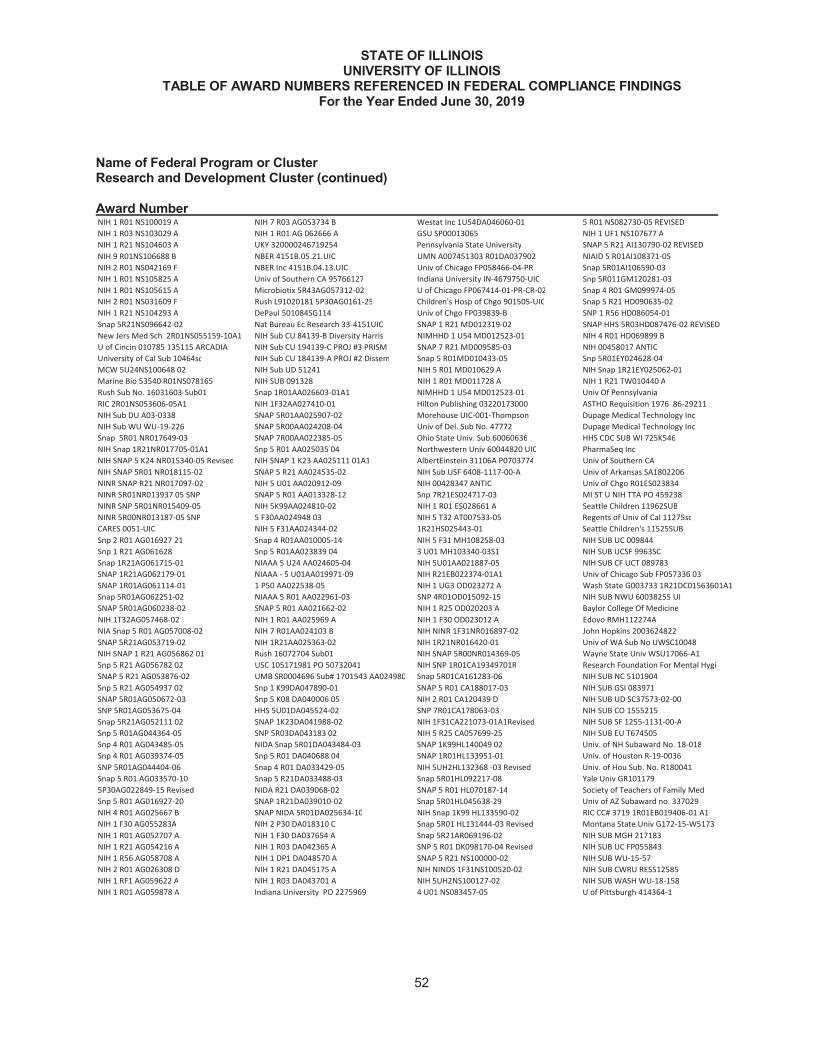
STATE OF ILLINOISUNIVERSITY OF ILLINOIS
TABLE OF AWARD NUMBERS REFERENCED IN FEDERAL COMPLIANCE FINDINGSFor the Year Ended June 30, 2019
Name of Federal Program or ClusterResearch and Development Cluster (continued)
Award Number
52
NIH 1 R01 NS100019 A NIH 7 R03 AG053734 B Westat Inc 1U54DA046060-01 5 R01 NS082730-05 REVISEDNIH 1 R03 NS103029 A NIH 1 R01 AG 062666 A GSU SP00013065 NIH 1 UF1 NS107677 ANIH 1 R21 NS104603 A UKY 320000246719254 Pennsylvania State University SNAP 5 R21 AI130790-02 REVISEDNIH 9 R01NS106688 B NBER 4151B.05.21.UIC UMN A007451303 R01DA037902 NIAID 5 R01AI108371-05NIH 2 R01 NS042169 F NBER Inc 4151B.04.13.UIC Univ of Chicago FP058466-04-PR Snap 5R01AI106590-03NIH 1 R01 NS105825 A Univ of Southern CA 95766127 Indiana University IN-4679750-UIC Snp 5R011GM120281-03NIH 1 R01 NS105615 A Microbiotix 5R43AG057312-02 U of Chicago FP067414-01-PR-CR-02 Snap 4 R01 GM099974-05NIH 2 R01 NS031609 F Rush L91020181 5P30AG0161-25 Children's Hosp of Chgo 901505-UIC Snap 5 R21 HD090635-02NIH 1 R21 NS104293 A DePaul 501084SG114 Univ of Chgo FP039839-B SNP 1 R56 HD086054-01Snap 5R21NS096642-02 Nat Bureau Ec Research 33-4151UIC SNAP 1 R21 MD012319-02 SNAP HHS 5R03HD087476-02 REVISEDNew Jers Med Sch 2R01NS055159-10A1 NIH Sub CU 84139-B Diversity Harris NIMHHD 1 U54 MD012523-01 NIH 4 R01 HD069899 BU of Cincin 010785 135115 ARCADIA NIH Sub CU 194139-C PROJ #3 PRISM SNAP 7 R21 MD009585-03 NIH 00458017 ANTICUniversity of Cal Sub 10464sc NIH Sub CU 184139-A PROJ #2 Dissem Snap 5 R01MD010433-05 Snp 5R01EY024628-04MCW 5U24NS100648 02 NIH Sub UD 51241 NIH 5 R01 MD010629 A NIH Snap 1R21EY025062-01Marine Bio 53540 R01NS078165 NIH SUB 091328 NIH 1 R01 MD011728 A NIH 1 R21 TW010440 ARush Sub No. 16031603-Sub01 Snap 1R01AA026603-01A1 NIMHHD 1 U54 MD012523-01 Univ Of PennsylvaniaRIC 2R01NS053606-05A1 NIH 1F32AA027410-01 Hilton Publishing 03220173000 ASTHO Requisition 1976 86-29211NIH Sub DU A03-0338 SNAP 5R01AA025907-02 Morehouse UIC-001-Thompson Dupage Medical Technology IncNIH Sub WU WU-19-226 SNAP 5R00AA024208-04 Univ of Del. Sub No. 47772 Dupage Medical Technology IncSnap 5R01 NR017649-03 SNAP 7R00AA022385-05 Ohio State Univ. Sub.60060636 HHS CDC SUB WI 725K546NIH Snap 1R21NR017705-01A1 Snp 5 R01 AA025035 04 Northwestern Univ 60044820 UIC PharmaSeq IncNIH SNAP 5 K24 NR015340-05 Revised NIH SNAP 1 K23 AA025111 01A1 AlbertEinstein 31106A P0703774 Univ of Southern CANIH SNAP 5R01 NR018115-02 SNAP 5 R21 AA024535-02 NIH Sub USF 6408-1117-00-A Univ of Arkansas SA1802206NINR SNAP R21 NR017097-02 NIH 5 U01 AA020912-09 NIH 00428347 ANTIC Univ of Chgo R01ES023834NINR 5R01NR013937 05 SNP SNAP 5 R01 AA013328-12 Snp 7R21ES024717-03 MI ST U NIH TTA PO 459238NINR SNP 5R01NR015409-05 NIH 5K99AA024810-02 NIH 1 R01 ES028661 A Seattle Children 11962SUBNINR 5R00NR013187-05 SNP 5 F30AA024948 03 NIH 5 T32 AT007533-05 Regents of Univ of Cal 11275scCARES 0051-UIC NIH 5 F31AA024344-02 1R21HS025443-01 Seattle Children's 11525SUBSnp 2 R01 AG016927 21 Snap 4 R01AA010005-14 NIH 5 F31 MH108258-03 NIH SUB UC 009844Snp 1 R21 AG061628 Snp 5 R01AA023839 04 3 U01 MH103340-03S1 NIH SUB UCSF 9963SCSnap 1R21AG061715-01 NIAAA 5 U24 AA024605-04 NIH 5U01AA021887-05 NIH SUB CF UCT 089783SNAP 1R21AG062179-01 NIAAA - 5 U01AA019971-09 NIH R21EB022374-01A1 Univ of Chicago Sub FP057336 03SNAP 1R01AG061114-01 1 P50 AA022538-05 NIH 1 UG3 OD023272 A Wash State G003733 1R21DC01563601A1Snap 5R01AG062251-02 NIAAA 5 R01 AA022961-03 SNP 4R01OD015092-15 NIH SUB NWU 60038255 UISNAP 5R01AG060238-02 SNAP 5 R01 AA021662-02 NIH 1 R25 OD020203 A Baylor College Of MedicineNIH 1T32AG057468-02 NIH 1 R01 AA025969 A NIH 1 F30 OD023012 A Edovo RMH112274ANIA Snap 5 R01 AG057008-02 NIH 7 R01AA024103 B NIH NINR 1F31NR016897-02 John Hopkins 2003624822SNAP 5R21AG053719-02 NIH 1R21AA025363-02 NIH 1R21NR016420-01 Univ of WA Sub No UWSC10048NIH SNAP 1 R21 AG056862 01 Rush 16072704 Sub01 NIH SNAP 5R00NR014369-05 Wayne State Univ WSU17066-A1Snp 5 R21 AG056782 02 USC 105171981 PO 50732041 NIH SNP 1R01CA19349701R Research Foundation For Mental HygiSNAP 5 R21 AG053876-02 UMB SR0004696 Sub# 1701543 AA024980 Snap 5R01CA161283-06 NIH SUB NC 5101904Snp 5 R21 AG054937 02 Snp 1 K99DA047890-01 SNAP 5 R01 CA188017-03 NIH SUB GSI 083971SNAP 5R01AG050672-03 Snp 5 K08 DA040006 05 NIH 2 R01 CA120439 D NIH SUB UD SC37573-02-00SNP 5R01AG053675-04 HHS 5U01DA045524-02 SNP 7R01CA178063-03 NIH SUB CO 1555215Snap 5R21AG052111 02 SNAP 1K23DA041988-02 NIH 1F31CA221073-01A1Revised NIH SUB SF 1255-1131-00-ASnp 5 R01AG044364-05 SNP 5R03DA043183 02 NIH 5 R25 CA057699-25 NIH SUB EU T674505Snp 4 R01 AG043485-05 NIDA Snap 5R01DA043484-03 SNAP 1K99HL140049 02 Univ. of NH Subaward No. 18-018Snp 4 R01 AG039374-05 Snp 5 R01 DA040688 04 SNAP 1R01HL133951-01 Univ. of Houston R-19-0036SNP 5R01AG044404-06 Snap 4 R01 DA033429-05 NIH 5UH2HL132368 -03 Revised Univ. of Hou Sub. No. R180041Snap 5 R01 AG033570-10 Snap 5 R21DA033488-03 Snap 5R01HL092217-08 Yale Univ GR1011795P30AG022849-15 Revised NIDA R21 DA039068-02 SNAP 5 R01 HL070187-14 Society of Teachers of Family MedSnp 5 R01 AG016927-20 SNAP 1R21DA039010-02 Snap 5R01HL045638-29 Univ of AZ Subaward no. 337029NIH 4 R01 AG025667 B SNAP NIDA 5R01DA025634-10 NIH Snap 1K99 HL133590-02 RIC CC# 3719 1R01EB019406-01 A1NIH 1 F30 AG055283A NIH 2 P30 DA018310 C Snap 5R01 HL131444-03 Revised Montana State Univ G172-15-W5173NIH 1 R01 AG052707 A NIH 1 F30 DA037654 A Snap 5R21AR069196-02 NIH SUB MGH 217183NIH 1 R21 AG054216 A NIH 1 R03 DA042365 A SNP 5 R01 DK098170-04 Revised NIH SUB UC FP055843NIH 1 R56 AG058708 A NIH 1 DP1 DA048570 A SNAP 5 R21 NS100000-02 NIH SUB WU-15-57NIH 2 R01 AG026308 D NIH 1 R21 DA045175 A NIH NINDS 1F31NS100520-02 NIH SUB CWRU RES512585NIH 1 RF1 AG059622 A NIH 1 R03 DA043701 A NIH 5UH2NS100127-02 NIH SUB WASH WU-18-158NIH 1 R01 AG059878 A Indiana University PO 2275969 4 U01 NS083457-05 U of Pittsburgh 414364-1

STATE OF ILLINOISUNIVERSITY OF ILLINOIS
TABLE OF AWARD NUMBERS REFERENCED IN FEDERAL COMPLIANCE FINDINGSFor the Year Ended June 30, 2019
Name of Federal Program or ClusterResearch and Development Cluster (continued)
Award Number
53
Vanderbilt Univ VUMC64589 Indiana University IN4687816UI NIH SUB JH 2002858053 AFC E0402Northwestern Univ 60050042 UIC MUSC17-056-8C868 NIH SUB UT UTA15-000938 AFC Ryan White Part BPalo Fdn Rsrch 388220755 0319D U of Michigan 3004018972 NIH SUB MO C00046785-1 Rush Subaward 15012901-Sub07NIH SUB DU 203-7884 Dana-Fber Cancer Institute 1215305 NIH SUB CW RU RES511788 Univ of Chicago FP056723-CNIH SUB HU 136379-5107313 National Marrow Donor Program 10050 NIH SUB TTA 086241 IDPH 932060001GNorthwestern Universit 60051122 UIC NIH SUB KC 00354320 NIH SUB LS 61330870-115277 IDPH 95780044GUniv of Pitts 005353 130910 40 Northwestern #60041881 UIC NIH Sub TTA ASU 0937777 SNP 5 R01 LM10817-08NIH Sub UK TTA 095339 Rosalind Frank Univ Sub 212800UIC NIH TTA WIH 091309 SNP 5 R01 LM10817-08Rush Medical Center 17053108 Sub01 Cincinnati Children's 1UG3DK119982- NIH SUB CWRU RES512818 Univ Of Delaware 48831Med Coll WS SPO 6052763 U of C 5P30DK092949-08 FP047431-0 NIH SUB IA W001004183 Medsocket 0418/SNAP R44LM011590Univ of VA GB10416 154840 Univ of Chicago FP035726 03 PR RIC SRAlab 5149 NIH 4 UH3 OD023272 BIIT Res Inst. 141-0-2572-002-002-RL Tulane IP0044349 RIC Shirley Ryan Ability Lab 4442 Snp 1 R21 OD 027080 01PA State Univ UILCA172169 Lurie 915771-UIC Univ of Texas 19-84538 1S10OD021745-01A1 REVISEDU of SC Sub No. 18-3418 Univ of Ghana U54DK116913-06 NWU sub 60047828 NIH 2 T35 OD011145 CNIH SUB ULRF OGMB 100625 Northwestern Univ 60047929 UIC Harvard 114205-1466-5096827 NIH 1 S10 OD023569 ANIH SUB Mayo 190118 UOC SubNo.FP035726-02-L NWU Sub 60048143 NIH 1R01 GM132302-01NIH SUB ULRF 10-625-01 Univ of PA PO 3767883 570501 RFU Subaward 212078Kim NIH Sub DU 203-7964Northwestern Subaward 60049430 UIC IL Inst Of Technology SA53810078853 UTMB 18-015 UOSPC0000001564 Northwestern UnivNIH SUB UCSD 92633820 IL Inst Of Technology SA53410138854 UMN 2R01 NS45873-09 N005884901 SAMHSA 5U79SM080017-04NIH SUB RUSH 15121006 Childrens Hosp Phil 950690RSUB Rush Sub. No. 15020202-Sub01 APA SAMHSAECOG ACRIN NIH SUB UCSD 63832772 NYU S4567-01 Indiana UniversityEnzyme By Design NIH SUB UW UWSC7928 Northwestern Univ 60040977 UIC NU Subaward No. 60044866 UICSWOG Southwest Oncology Group NIH SUB NW 60043585UIUC Yale University 5U10HD055925-07 Indiana Univ 20059Alliance A011502 CVNA00056755 132241 1 NIH SUB NWU 60040600 UOFI Indiana Univ PO# 2250712Cornell Univ Sub No. 180541 Vanderbilt University NIH SUB UKY 3200000306-16-180 American Psychiatric AssociationCHOP Sub No UG1CA189955 Vanderbilt Univ UNIV60060 NIH SUB MC UNI-208735 JBS Intl HHSS283201200002IAlliance Foundation-Protocol# E1910 Univ of CT UCHC7-93530615 NIH SUB MAYO ILL-208735 IDHS 45CXB03876Childrens Hospital Of Philadelphia Tufts Univ Sub No HH4218 NIH SUB FL UFDSP00011682 IDHS 45CWB03876 FY 18NIH SUB INU IN4684785UI Univ of Chicago FP063797-2 NIH SUB GSI 087509 BARDA HHSO100201500008INIH SUB TX 00004926 Univ of Pitts 0051163 128078-4 NIH SUB TTA ART 087381 HHS 5R01HS025177-02NIH SUB FP031042-03 A Univ. of Washington Sub. UWSC7767 NIH SUB NW 60044865UOFI AHRQ 1R01HS025586-02Northwestern Univ 60040959 UIC NIH SUB NU 093401 Univ of KY 1R56AG057589-01A1 BARDA TO HHSO10033002TSRA Lab No 7205 90REGE0005 NIH SUB DU 203-6431 Rush Univ Med Ce 5P30AG010161 28 DHHS AFCL 90DP0091-03-00NIH SUB WI 749K276 Chicago BioSolutions IP 09 00445409 Georgia Inst Tech RG680-G3 Cincinnati Childrens Hospital MedicNIH SUB WI CFO00235 Rush Univ 16020501-Sub07 UC Davis A18-0168-S009 A02 Westat 6632.01-S04NIH SUB WIDCF 437003M170000984 Northwestern Univ60049062 UIC Univ of UT 10042502-04 AIR PO# 0283200705Purdue University Sub 11000806-002 Florida State Univ R02000 Loyola Subaward no. LU 209157 U So FL TrialNet Site 3423UMN N006187430 HL136679 Univ Maryland Sub 1802369 Northwestern Univ 60044416UIC Indiana Univ Health 1H79TI081637-01NW Univ CCHMC #135406 Year 2 Univ of Pitts CNVA00050927 128399-1 Univ of Chicago FP039257-02Washington University in St Louis The Brigham and Women's Hospital Revivo Therapeutics 2R42AG0440 Northwestern Univ 60044819 UICJaeb Ctr for Health Research Saint Louis Univ ERS#40643 MSU RC105335C NWU 60047912 UICUniv of Minnesota. N006187408 Univ of NC 1R01AI123010-01A1 NW University 60041739 UIC NWU 60044175 UICUniversity of Chicago FP064434-A Rutgers Subaward PO486669 MSU RC104284UI Tango Biosciences, Inc.John Hopkins 2003130456 Univ of Chicago FP055818 (A) NIH SUB NBER 33-4151-UIUC Westat 6048-S05Wayne St Univ Sub No WSU16101 Rush Univ 1R01AI114688-01A1 NIH SUB DU 501084SG113 MHHS Grant 90DP0026WFUHS 115749 Hektoen Institute NIH SUB NBER 41600.UIUC HHS SUB GIT RF543-G3UMMC Subaward 66105170517-UIC Hektoen 50612-324-UIC1-AI034993 NIH SUB MI 660493 SPC000170 Chicago DFSS PO No 32925NIH SUB WI 086849 NIH SUB ND 202359UIUC NIH SUB MI SPC-000531 Chicago DFS 05CH0101 PO 32925Enzyme By Design Inc NIH SUB TTA SU 2016-01789 NIH SUB UP 0052186 128617-2 Spaulding for Children PROJ12030RSUniversity of Chicago NIH SUB SUNY 73669 CCF IP00408319 Age OptionsUNC at Chapel Hill 5113230 NIH SUB LS 61313381-118785 Biolight Eng. LLC R43 EY028786-0181 HHS SUB AO 90CS0050-01-00IU School of Medicine IN-4687815UIC U of PA Subaward No. 569001 Tufts Med Ctr 5016023-SERV Univ of CA San FranciscoUniv of Carolina Sub 5111457 NIH SUB UR 417084G/UR FAO GR510644 USC 91303501 REY027315-01A1 BWH 5UM1AI068636-12COPD Foundation 9012549 (131692-2) FSU R01GM126558 Sub-R01916 Univ of AL Sub #000511651-001 Nano Biotherapeutics 060TRL WA01COPD Fdn Subaward No. 001 NYU F8635-01 PO iB00151771 OHSU 1005935 EY019474 NWU SP0037006-PROJ0010061Univ of Pittsburgh9012549 130129 12 MA General Hospital Sub 224990 Tufts Univ. HH4034 2R01EY020856 Wake Forest Univ WFUHS114749Univ of Pit Sub 9012459(130129-40) Purdue Univ 4102-51420 JCHR U10EY014231 - Protocol AA UC San Diego 103915954JHU 2003043500 NIH SUB OK 2015-03 JCHR Protocol V 8 12 13 IDHS FCSXP04712 FY19University of AZ 336012 NIH SUB UCSD 76802839 Univ of Iowa S00368-01 IDPH 96180067GSIBCR AD222- UI -4 NIH SUB UC FP043359-Q Univ of Iowa 5UG4 LM012346-03 IDHS 43CWZ03218 FY 2018
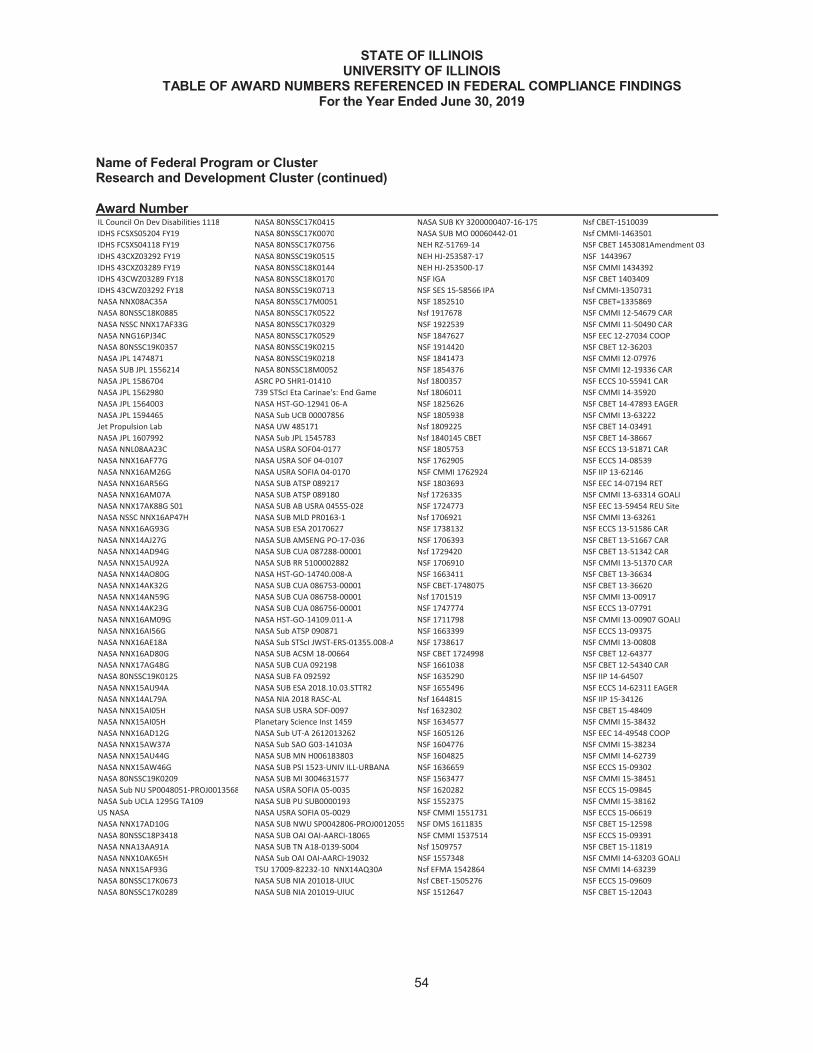
STATE OF ILLINOISUNIVERSITY OF ILLINOIS
TABLE OF AWARD NUMBERS REFERENCED IN FEDERAL COMPLIANCE FINDINGSFor the Year Ended June 30, 2019
Name of Federal Program or ClusterResearch and Development Cluster (continued)
Award Number
54
IL Council On Dev Disabilities 1118 NASA 80NSSC17K0415 NASA SUB KY 3200000407-16-175 Nsf CBET-1510039IDHS FCSXS05204 FY19 NASA 80NSSC17K0070 NASA SUB MO 00060442-01 Nsf CMMI-1463501IDHS FCSXS04118 FY19 NASA 80NSSC17K0756 NEH RZ-51769-14 NSF CBET 1453081Amendment 03IDHS 43CXZ03292 FY19 NASA 80NSSC19K0515 NEH HJ-253587-17 NSF 1443967IDHS 43CXZ03289 FY19 NASA 80NSSC18K0144 NEH HJ-253500-17 NSF CMMI 1434392IDHS 43CWZ03289 FY18 NASA 80NSSC18K0170 NSF IGA NSF CBET 1403409IDHS 43CWZ03292 FY18 NASA 80NSSC19K0713 NSF SES 15-58566 IPA Nsf CMMI-1350731NASA NNX08AC35A NASA 80NSSC17M0051 NSF 1852510 NSF CBET=1335869NASA 80NSSC18K0885 NASA 80NSSC17K0522 Nsf 1917678 NSF CMMI 12-54679 CARNASA NSSC NNX17AF33G NASA 80NSSC17K0329 NSF 1922539 NSF CMMI 11-50490 CARNASA NNG16PJ34C NASA 80NSSC17K0529 NSF 1847627 NSF EEC 12-27034 COOPNASA 80NSSC19K0357 NASA 80NSSC19K0215 NSF 1914420 NSF CBET 12-36203NASA JPL 1474871 NASA 80NSSC19K0218 NSF 1841473 NSF CMMI 12-07976NASA SUB JPL 1556214 NASA 80NSSC18M0052 NSF 1854376 NSF CMMI 12-19336 CARNASA JPL 1586704 ASRC PO SHR1-01410 Nsf 1800357 NSF ECCS 10-55941 CARNASA JPL 1562980 739 STScI Eta Carinae's: End Game Nsf 1806011 NSF CMMI 14-35920NASA JPL 1564003 NASA HST-GO-12941 06-A NSF 1825626 NSF CBET 14-47893 EAGERNASA JPL 1594465 NASA Sub UCB 00007856 NSF 1805938 NSF CMMI 13-63222Jet Propulsion Lab NASA UW 485171 Nsf 1809225 NSF CBET 14-03491NASA JPL 1607992 NASA Sub JPL 1545783 Nsf 1840145 CBET NSF CBET 14-38667NASA NNL08AA23C NASA USRA SOF04-0177 NSF 1805753 NSF ECCS 13-51871 CARNASA NNX16AF77G NASA USRA SOF 04-0107 NSF 1762905 NSF ECCS 14-08539NASA NNX16AM26G NASA USRA SOFIA 04-0170 NSF CMMI 1762924 NSF IIP 13-62146NASA NNX16AR56G NASA SUB ATSP 089217 NSF 1803693 NSF EEC 14-07194 RETNASA NNX16AM07A NASA SUB ATSP 089180 Nsf 1726335 NSF CMMI 13-63314 GOALINASA NNX17AK88G S01 NASA SUB AB USRA 04555-028 NSF 1724773 NSF EEC 13-59454 REU SiteNASA NSSC NNX16AP47H NASA SUB MLD PR0163-1 Nsf 1706921 NSF CMMI 13-63261NASA NNX16AG93G NASA SUB ESA 20170627 NSF 1738132 NSF ECCS 13-51586 CARNASA NNX14AJ27G NASA SUB AMSENG PO-17-036 NSF 1706393 NSF CBET 13-51667 CARNASA NNX14AD94G NASA SUB CUA 087288-00001 Nsf 1729420 NSF CBET 13-51342 CARNASA NNX15AU92A NASA SUB RR 5100002882 NSF 1706910 NSF CMMI 13-51370 CARNASA NNX14AO80G NASA HST-GO-14740.008-A NSF 1663411 NSF CBET 13-36634NASA NNX14AK32G NASA SUB CUA 086753-00001 NSF CBET-1748075 NSF CBET 13-36620NASA NNX14AN59G NASA SUB CUA 086758-00001 Nsf 1701519 NSF CMMI 13-00917NASA NNX14AK23G NASA SUB CUA 086756-00001 NSF 1747774 NSF ECCS 13-07791NASA NNX16AM09G NASA HST-GO-14109.011-A NSF 1711798 NSF CMMI 13-00907 GOALINASA NNX16AI56G NASA Sub ATSP 090871 NSF 1663399 NSF ECCS 13-09375NASA NNX16AE18A NASA Sub STScI JWST-ERS-01355.008-A NSF 1738617 NSF CMMI 13-00808NASA NNX16AD80G NASA SUB ACSM 18-00664 NSF CBET 1724998 NSF CBET 12-64377NASA NNX17AG48G NASA SUB CUA 092198 NSF 1661038 NSF CBET 12-54340 CARNASA 80NSSC19K0125 NASA SUB FA 092592 NSF 1635290 NSF IIP 14-64507NASA NNX15AU94A NASA SUB ESA 2018.10.03.STTR2 NSF 1655496 NSF ECCS 14-62311 EAGERNASA NNX14AL79A NASA NIA 2018 RASC-AL Nsf 1644815 NSF IIP 15-34126NASA NNX15AI05H NASA SUB USRA SOF-0097 Nsf 1632302 NSF CBET 15-48409NASA NNX15AI05H Planetary Science Inst 1459 NSF 1634577 NSF CMMI 15-38432NASA NNX16AD12G NASA Sub UT-A 2612013262 NSF 1605126 NSF EEC 14-49548 COOPNASA NNX15AW37A NASA Sub SAO G03-14103A NSF 1604776 NSF CMMI 15-38234NASA NNX15AU44G NASA SUB MN H006183803 NSF 1604825 NSF CMMI 14-62739NASA NNX15AW46G NASA SUB PSI 1523-UNIV ILL-URBANA NSF 1636659 NSF ECCS 15-09302NASA 80NSSC19K0209 NASA SUB MI 3004631577 NSF 1563477 NSF CMMI 15-38451NASA Sub NU SP0048051-PROJ0013568 NASA USRA SOFIA 05-0035 NSF 1620282 NSF ECCS 15-09845NASA Sub UCLA 1295G TA109 NASA SUB PU SUB0000193 NSF 1552375 NSF CMMI 15-38162US NASA NASA USRA SOFIA 05-0029 NSF CMMI 1551731 NSF ECCS 15-06619NASA NNX17AD10G NASA SUB NWU SP0042806-PROJ0012055 NSF DMS 1611835 NSF CBET 15-12598NASA 80NSSC18P3418 NASA SUB OAI OAI-AARCI-18065 NSF CMMI 1537514 NSF ECCS 15-09391NASA NNA13AA91A NASA SUB TN A18-0139-S004 Nsf 1509757 NSF CBET 15-11819NASA NNX10AK65H NASA Sub OAI OAI-AARCI-19032 NSF 1557348 NSF CMMI 14-63203 GOALINASA NNX15AF93G TSU 17009-82232-10 NNX14AQ30A Nsf EFMA 1542864 NSF CMMI 14-63239NASA 80NSSC17K0673 NASA SUB NIA 201018-UIUC Nsf CBET-1505276 NSF ECCS 15-09609NASA 80NSSC17K0289 NASA SUB NIA 201019-UIUC NSF 1512647 NSF CBET 15-12043

STATE OF ILLINOISUNIVERSITY OF ILLINOIS
TABLE OF AWARD NUMBERS REFERENCED IN FEDERAL COMPLIANCE FINDINGSFor the Year Ended June 30, 2019
Name of Federal Program or ClusterResearch and Development Cluster (continued)
Award Number
55
NSF CMMI 14-62773 NSF EFMA 17-45889 NSF CMMI 18-25758 Nsf 1707661NSF IIP 15-00271 NSF CBET 17-06911 NSF ECCS 18-10265 Nsf 1710049NSF CMMI 14-62749 NSF CMMI 17-28199 NSF CMMI 18-25440 NSF 1665104NSF CMMI 14-62946 NSF ECCS 17-39189 NSF CMMI 18-25300 NSF 1664296NSF CMMI 14-63558 NSF EEC 17-38186 NSF CMMI 17-61622 NSF 1720276NSF CMMI 14-63587 NSF ECCS 17-39732 NSF CMMI 17-61699 NSF DMS-1713118NSF CBET 14-54616 CAR NSF CMMI 17-27381 NSF CMMI 18-25356 NSF CHE - 1663779NSF CMMI 14-54276 CAR NSF CMMI 17-27785 NSF CMMI 18-30635 NSF 1661629NSF EEC 14-61038 REU Site NSF CMMI 16-63460 NSF CBET 18-41539 NSF 1709877NSF CMMI 14-64737 NSF EEC 17-20701 COOP NSF ECCS 18-09707 NSF 1741935NSF CMMI 14-46765 NSF CBET 17-44775 CONF NSF CBET 18-03757 Nsf 1664632NSF EEC 14-29348 NSF CMMI 17-27761 NSF CMMI 18-25938 NSF 1700898NSF CMMI 14-34147 NSF CBET 17-05804 NSF CBET 18-04453 Nsf DMS-1700095NSF ECCS 14-08558 NSF CMMI 17-42908 NSF IIP 18-34893 I-Corps NSF 1707672NSF CMMI 14-35545 GOALI NSF IIP 17-45812 NSF CMMI 17-62749 NSF 1654490NSF CMMI 14-37106 NSF CBET 17-06862 NSF CMMI 17-61189 NSF 1626065NSF CMMI 14-35371 NSF CBET 17-06575 NSF CMMI 17-52054 CAR Nsf 1624413NSF CMMI 14-37113 NSF CBET 17-06854 NSF CMMI 17-52262 CAR Nsf 1611765NSF CMMI 14-27111 NSF CBET 17-04668 NSF IIP 18-24074 I-Corps NSF CHE 1564959NSF CMMI 14-36081 GOALI NSF CMMI 17-44371 EAGER NSF CMMI 17-51945 CAR NSF PHY 1606321NSF ECCS 14-08300 NSF CMMI 16-62825 NSF CMMI 17-61696 NSF 1602070NSF CMMI 13-63231 NSF ECCS 17-11875 NSF EEC 17-57837 REU Site Nsf 1620901NSF CBET 14-37230 NSF CBET 17-06219 NSF CMMI 17-52302 CAR NSF DMS 1552766NSF ECCS 16-40196 NSF CMMI 17-01295 EAGER NSF CMMI 18-13111 CAR NSF DMR 1564950NSF ECCS 16-11279 NSF CMMI 16-62708 NSF ECCS 18-01146 CONF NSF DMS 1507067NSF CMMI 15-62010 NSF CBET 17-40737 NSF CMMI 18-02489 NSF DMR 1506886NSF CBET 16-44437 WKSP NSF IIP 17-01047 NSF CBET 19-16609 Nsf PHY 1535279NSF EFMA 16-41084 NSF CMMI 16-63566 NSF CBET 18-47404 CAR Nsf 1500031NSF CMMI 16-38346 NSF CBET 17-36181 NSF IIP 19-28901 I-Corps Nsf 1522548NSF CMMI 16-35681 NSF CMMI 16-61853 NSF DMR 1933622 NSF 1512930NSF CMMI 16-36175 NSF CMMI 16-53118 CAR NSF CHE1855833 NSF 1517583NSF CBET 16-04038 NSF IIP 16-44696 Nsf 1847451 Nsf DMS-1515705NSF ECCS 16-10897 NSF IIP 17-34697 I-Corps Nsf 1901120 Nsf 1464974NSF CMMI 16-45386 EAGER NSF CBET 16-53925 CAR NSF 1855371 Nsf 1464816NSF CMMI 16-35160 NSF IIP 17-25029 NSF PHY - 1806622 NSF 1508220NSF IIP 16-24812 I/UCRC NSF CMMI 16-53676 NSF 1821171 Nsf DMS-1454945NSF CBET 16-05290 NSF CBET 16-52150 NSF 1831406 NSF 1465011NSF CBET 16-04155 NSF IIP 17-22234 Nsf 1813351 NSF DMS 1406468NSF EEC 16-23141 NSF ECCS 16-53241 CAR NSF - DMS 1749447 NSF DMS-1407820NSF CMMI 16-43025 EAGER NSF ECCS 17-19567 Nsf 1815069 Nsf 1361620NSF ECCS 16-09370 NSF ECCS 16-52871 CAR Nsf 1813033 NSF DMS 1348092NSF CMMI 15-62276 NSF EEC 16-48454 NSF 1811291 NSF DMS 1300138NSF EFMA 16-29367 NSF CBET 18-46752 CAR NSF 1764141 Natl Science Fnd DMS 1246844NSF CMMI 15-62288 NSF ECCS 18-44708 CONF NSF 1809439 Nsf PHY-1151640NSF CMMI 15-62766 NSF CBET 18-47237 CAR NSF DMS 1834578 PSC Nsf DMS-1150427NSF CMMI 15-62694 NSF CBET 18-47389 CAREER Nsf DMR 1809372 NSF 9902395NSF CMMI 15-63087 NSF EEC 19-14735 NSF CHE1807465 NSF DMS 11-07452NSF CBET 15-54249 CAR NSF EEC 19-15830 CONF NSF 1800236 NSF PHY 10-56987NSF CMMI 15-63475 NSF CMMI 18-46732 NSF DMS 1811278 NSF PHY 10-26550NSF CBET 15-53137 CAR NSF CBET 18-34655 TRVL NSF 1809681 NSF CHE 14-05997NSF IIP 16-24112 NSF CMMI 19-01754 Nsf 1752081 NSF DMR 14-10596NSF CMMI 15-54326 CAR NSF ECCS 18-30639 Nsf 1801870 NSF DMS 14-06455NSF CMMI 15-54019 CAR NSF ECCS 18-09946 NSF 1763317 NSF CHE 13-62931NSF IIP 15-40030 NSF IIP 18-22205 NSF 1764247 NSF CHE 13-61293NSF CMMI 15-44999 NSF EFMA 18-30881 NSF 1822457 NSF DMR 14-08713NSF IIP 17-55497 I-Corps NSF CMMI 18-25466 NSF DMS 1749013 NSF DMR 14-11032NSF IIP 17-58179 I-Corps NSF ECCS 18-24320 NSF 1812354 NSF DMR 14-10209NSF EEC 17-48473 NSF CMMI 17-61243 NSF - DMS - 1800839 NSF CHE 13-61586NSF EEC 16-59794 REU Site NSF ECCS 18-09076 NSF 1806388 NSF PHY 14-40011NSF IIP 17-48498 I-Corps NSF ECCS 18-07823 NSF 1740112 NSF DMS 14-05146

STATE OF ILLINOISUNIVERSITY OF ILLINOIS
TABLE OF AWARD NUMBERS REFERENCED IN FEDERAL COMPLIANCE FINDINGSFor the Year Ended June 30, 2019
Name of Federal Program or ClusterResearch and Development Cluster (continued)
Award Number
56
NSF DMS 13-61001 NSF DMS 16-20231 NSF CHE 16-65281 NSF DMS 18-18546 CONFNSF DMS 13-45032 NSF PHY 16-02536 NSF DMR 17-09857 NSF DMS 18-02094NSF DMR 13-51895 CAR NSF DMS 16-15661 NSF AST 17-15579 NSF DMS 18-02242NSF DMR 13-50008 CAR NSF DMS 16-15418 NSF DMR 17-09327 NSF DMS 18-02044NSF DMS 13-52597 CAR NSF DMS 16-13190 NSF CHE 17-10241 NSF DMS 17-52614 CARNSF CHE 13-14064 NSF CHE 16-06791 NSF DMS 17-19242 WKSP NSF CHE 17-51725 CARNSF CHE 13-08485 NSF CHE 15-66023 NSF DMS 17-10868 NSF CHE 19-37809NSF CHE 13-07002 NSF CHE 16-49579 EAGER NSF DMS 17-36228 CONF NSF DMS 19-00916NSF DMR 13-12539 NSF AST 16-15001 NSF CHE 16-65191 NSF DMS 18-55648NSF AST 13-33612 NSF DMS 16-22370 NSF DMS 16-54725 CAR NSF DMS 18-56681 CONFNSF DMR 13-06822 NSF CHE 16-10328 NSF CHE 16-64376 NSF DMS 19-07316NSF DMS 13-08227 NSF AST 16-16199 NSF PHY 16-54495 CAR NSF EAR 1628956NSF DMS 12-66189 NSF DMR 16-41854 EAGER NSF CHE 17-44061 NSF 1600508NSF DMR 13-07354 GOALI NSF DMS 16-07489 NSF PHY 16-59598 REU Site NSF 1549920NSF DMR 13-09525 NSF DMS 16-13005 NSF DMR 16-54182 CAR Nsf AGS-1502776NSF DMS 13-08472 NSF DMR 16-10143 NSF DMR 16-54065 CAR NSF AGS 11-43523NSF DMR 13-06475 NSF CHE 16-08743 NSF DMR 16-54158 CAR NSF AGS 11-10334NSF DMR 12-54406 CAR NSF DMS 16-00650 NSF DMR 17-13068 NSF PLR 14-18339NSF DMS 12-54791 NSF DMR 16-11268 NSF CHE 16-54110 CAR NSF EAR 14-27386NSF PHY 15-04301 NSF DMS 16-00592 NSF CHE 19-25751 NSF EAR 14-17444NSF PHY 15-19407 NSF AST 15-36171 NSF DMR 19-22603 CONF NSF EAR 13-45135NSF AST 15-47364 NSF DMR 15-55278 CAR NSF DMS 18-48607 CONF NSF PLR 13-45026 EAGERNSF PHY 15-05468 NSF CHE 15-66071 NSF PHY 19-14437 CAR NSF PLR 12-46431NSF PHY 15-05008 NSF CHE 15-55337 CAR NSF DMR 18-46206 CAR NSF EAR 13-31906 COOPNSF DMR 15-07739 NSF DMR 15-55153 CAR NSF DMS 19-00575 WKSP NSF AGS 12-36814NSF PHY 15-21110 NSF DMS 16-12162 TRVL NSF DMR 18-38595 NSF AGS 12-54428 CARNSF DMR 15-07169 NSF CHE 15-55245 CAR NSF DMS 19-12897 NSF AGS 12-43071NSF DMR 14-64090 NSF DMR 15-54435 CAR NSF DMR 18-47828 CAR NSF AGS 12-59004NSF DMR 15-07985 NSF DMR 14-61952 NSF DMS 19-03192 NSF AGS 14-54839 CARNSF CHE 14-55011 CAR NSF DMS 16-06479 NSF DMS 18-39177 NSF OCE 13-56610NSF DMS 15-00121 NSF DMR 17-52517 CAR NSF PHY 18-22502 NSF EAR 15-29830NSF DMS 14-49269 NSF CHE 17-09820 NSF DMS 18-15764 NSF EAR 15-20864NSF DMS 15-10034 NSF DMR 17-51291 CAR NSF PHY 18-12325 NSF AGS 14-54089 CARNSF PHY 15-06416 NSF DMS 17-10884 NSF PHY 18-06307 NSF AGS 14-52291NSF DMR 15-08140 NSF DMR 17-20633 COOP NSF PHY 18-48815 NSF AGS 14-30292NSF CHE 15-08662 NSF DMS 17-37962 NSF PHY 18-06572 NSF AGS 14-57128NSF DMS 15-10204 NSF DMS 17-37915 NSF DMR 18-27346 NSF AGS 15-02398NSF DMS 15-02170 NSF DMR 17-27605 NSF DMR 18-28450 EQ NSF AGS 13-59098NSF CHE 15-08710 NSF DMR 17-09945 NSF DMS 18-07023 NSF EAR 14-27380NSF DMS 15-02125 NSF CHE 17-26244 EQ NSF CHE 18-28671 EQ NSF ICER 14-40315NSF DMS 15-01036 NSF DMR 17-26634 EQ NSF DMS 18-30312 NSF EAR 13-45108NSF DMS 15-00691 NSF DMS 17-16822 NSF DMS 18-11859 NSF AGS 16-28674NSF DMR 14-55264 CAR NSF DMS 17-11325 NSF DMR 18-09696 NSF OCE 16-34995NSF DMS 15-01982 NSF AST 17-15717 NSF DMR 18-09573 NSF PLR 16-03544NSF DMS 15-01041 NSF PHY 17-14042 NSF DMR 18-36710 NSF EAR 16-37481NSF DMS 15-01103 NSF DMR 17-10437 NSF CHE 17-52879 NSF AGS 16-28708NSF DMR 14-55296 CAR NSF DMR 17-29149 NSF PHY 18-12377 NSF EAR 16-20595NSF DMS 15-22670 NSF AST 17-16127 NSF CHE 18-00068 NSF AGS 15-46939NSF DMS 15-01073 WKSP NSF AST 17-16327 NSF DMS 18-21198 NSF EAR 16-20616NSF PHY 14-04330 NSF PHY 17-07731 NSF AST 18-15987 NSF EAR 15-50890NSF DMS 14-07037 NSF DMR 17-09515 NSF DMR 18-00982 NSF EAR 16-41138 EAGERNSF PHY 14-30124 COOP NSF DMR 17-25401 NSF DMS 17-64123 NSF EAR 16-02590NSF DMS 14-18961 NSF CHE 17-09718 NSF DMR 18-08163 NSF AGS 16-02580NSF AST 14-13367 NSF DMR 17-08852 NSF DMS 18-12122 NSF EAR 16-00931NSF DMS 14-04981 NSF DMR 17-45304 NSF DMS 18-11518 NSF EAR 15-65640NSF DMS 14-15308 NSF DMS 16-54756 CAR NSF DMS 18-11156 NSF EAR 15-54554 CARNSF DMR 14-11067 NSF CHE 17-09391 NSF DMS 18-11768 NSF OPP 16-45087NSF DMR 14-09953 NSF DMS 17-10966 NSF CHE 18-08678 NSF ICER 16-64078NSF DMR 16-10114 NSF CHE 17-09286 NSF DMS 18-02139 NSF AGS 17-33877NSF DMR 16-29068 NSF PHY 16-62211 NSF DMS 18-00872 NSF AGS 17-42956

STATE OF ILLINOISUNIVERSITY OF ILLINOIS
TABLE OF AWARD NUMBERS REFERENCED IN FEDERAL COMPLIANCE FINDINGSFor the Year Ended June 30, 2019
Name of Federal Program or ClusterResearch and Development Cluster (continued)
Award Number
57
NSF ICER 17-48687 CONF NSF 1652530 NSF CNS 07-20827 NSF CCF 15-33912NSF EAR 17-35788 NSF ACI 1659255 NSF CCF 07-02501 NSF CCF 15-26106NSF EAR 16-60600 NSF 1625941 NSF IIS 06-43502 CAREER NSF CCF 15-24433NSF EAR 17-39788 NSF 1633318 NSF CNS 06-15372 NSF CNS 15-18741NSF AGS 17-48578 EQ Nsf 1618126 NSF IIS 05-34462 NSF CCF 15-26875NSF EAR 17-48573 NSF 1646395 NSF CNS 05-54759 NSF CCF 15-27395NSF AGS 17-34267 NSF 1650900 NSF CNS 05-24516 NSF CNS 15-13051NSF AGS 17-25190 NSF 1640732 NSF CCR 02-37884 CAR NSF CCF 15-14245NSF AGS 16-02738 NSF 1617992 NSF ACI 02-05611 NSF ACI 15-16586NSF AGS 16-51298 Nsf 1564296 NSF CCF 14-21575 NSF CNS 15-13939NSF EAR 17-28214 NSF 1645381 NSF CCF 14-09106 NSF CCF 15-26799NSF AGS 16-61799 Nsf 1615563 NSF CCF 14-21231 NSF CMMI 14-62693NSF AGS 16-41167 NSF 1643271 NSF CCF 14-09423 NSF CNS 15-30915NSF AGS 16-61800 Nsf 1620902 NSF CNS 14-34582 NSF CCF 14-53104NSF EAR 16-56935 NSF IIS 1526499 NSF IIS 13-52936 EAGER NSF CNS 15-05790NSF EAR 16-54935 NSF CCF 1527059 NSF CNS 13-30077 NSF ACI 15-35651NSF AGS 17-19236 NSF IIS 1526379 NSF CNS 13-37732 NSF CNS 14-46229NSF OCE 17-24615 NSFIIS 1514126 NSF IIS 13-54329 NSF ACI 14-45176NSF AGS 16-02845 Nsf CNS 1514472 NSF ACI 13-39715 NSF ACI 14-40733NSF EAR 19-19714 NSF 1513899 NSF CNS 13-29886 NSF CNS 14-09416NSF ICER 18-54767 NSF DMS 1501085 NSF CNS 13-20209 NSF CCF 14-21563NSF EAR 18-48013 CAR Nsf IIS-1463990 NSF CNS 13-29991 NSF ACI 14-43013NSF EAR 17-52477 Nsf CNS-1456638 NSF IIS 13-19708 NSF ACI 14-29699 EQNSF AGS 18-49409 Nsf 1440534 NSF ACI 12-38993 COOP NSF ACI 14-43080NSF AGS 17-55501 NSF IIS 1407927 NSF CCF 13-37217 NSF CNS 14-23452NSF ICER 18-33225 Nsf IIS-1445751 NSF CNS 13-14485 NSF CNS 14-08944NSF OCE 18-34797 Nsf CCF-1422511 NSF ACI 12-61582 COOP NSF CNS 14-05883NSF AGS 17-59573 Nsf CNS-1409868 NSF CNS 13-29681 NSF CNS 14-23334NSF EAR 17-53249 CAR NSF CNS 1351058 NSF CNS 13-30491 NSF IIS 14-47879NSF EAR 18-32389 CONF Nsf 1331800 NSF CCF 13-02641 NSF CNS 14-21918NSF AGS 17-33946 Nsf 1314919 NSF CNS 13-02563 NSF IIS 14-21521NSF EAR 18-29513 Nsf IIS-1324977 NSF CCF 13-20585 NSF CCF 14-21503NSF EAR 17-53200 CAR NSF 1213013 NSF CCF 13-18191 NSF IIS 14-41563NSF AGS 18-41966 NSF CCF 1053933-01 NSF CNS 13-19657 NSF CCF 14-22798NSF CNS 12-48080 NSF CCF 12-54041 NSF CCF 13-20953 NSF CCF 14-20882NSF CNS 13-14485 NSF CNS 12-48080 NSF CNS 13-14891 NSF CCF 14-22278NSF IIS 15-15587 NSF CNS 12-19064 NSF CCF 13-02438 NSF IIS 14-41149NSF CCF 1900911 NSF CCF 11-38994 NSF CCF 13-19376 NSF CCF 14-38982NSF 1914575 NSF CCF 11-11342 NSF IIA 13-21999 NSF CCF 14-08763NSF 1912887 NSF CNS 11-11407 NSF CNS 15-45002 NSF ACI 16-42411NSF IIS 1903963 NSF CNS 10-59294 NSF CNS 15-44635 NSF CNS 16-46305NSF CNS 1903714 NSF IIS 10-53856 CAR NSF IIS 15-15587 NSF IIS 16-33755NSF CCF 1848966 NSF CNS 10-54247 CAR NSF CNS 15-57244 NSF ACI 16-49555NSF CNS 1828265 NSF OCI 10-53575 COOP NSF IIS 15-30818 NSF CNS 16-46383NSF 1838770 NSF OCI 10-47916 NSF CCF 15-51592 WKSP NSF CNS 16-39837NSF IIS 1814931 NSF CNS 10-12194 NSF ACI 15-35070 NSF CNS 16-19339NSF 1801644 NSF CNS 10-35736 NSF IIS 15-13407 NSF IIS 16-29161Nsf 1801708 NSF CNS 10-40380 NSF IIS 15-02339 NSF ACI 15-50554NSF CNS 1829152 NSF CCF 10-29035 NSF IIS 15-28036 NSF CNS 16-18627NSF CCF 1815428 NSF CNS 10-35345 NSF ACI 15-35177 NSF IIS 16-28976NSF 1816714 NSF IIS 10-17362 NSF CNS 15-27754 NSF CNS 16-19313NSF 1814717 NSF CNS 09-58314 NSF CNS 15-13906 NSF CCF 16-49432NSF 1815145 NSF CNS 09-53600 CAR NSF IIS 15-13629 NSF IIS 15-64041NSF 1758578 NSF IIS 09-17123 NSF CCF 15-35977 NSF IIS 16-19302Nsf 1738515 NSF CNS 08-34709 NSF CCF 15-27636 NSF CCF 16-47432 EAGERNSF 1644874 NSF CNS 08-34738 NSF IIS 15-50145 EAGER NSF CNS 16-29949NSF 1739396 NSF IIS 07-20482 NSF ACI 15-51492 WKSP NSF CNS 16-24811Nsf 1705058 NSF CNS 07-20593 NSF IIS 13-28018 NSF CNS 16-24790Nsf 1703425 NSF OCI 07-25070 NSF CCF 15-27223 NSF ACI 15-50514NSF CCF 1704401 NSF CNS 07-07975 NSF CCF 15-27388 NSF CCF 16-18658

STATE OF ILLINOISUNIVERSITY OF ILLINOIS
TABLE OF AWARD NUMBERS REFERENCED IN FEDERAL COMPLIANCE FINDINGSFor the Year Ended June 30, 2019
Name of Federal Program or ClusterResearch and Development Cluster (continued)
Award Number
58
NSF CCF 16-19216 NSF CNS 16-57534 NSF IOS 1455758 NSF MCB 18-18286NSF CCF 16-18366 NSF IIS 16-36929 NSF MCB 1412692 NSF DEB 17-54115NSF IIS 16-18481 NSF ACI 16-59702 REU Site Nsf 1415589 NSF MCB 18-18310NSF ACI 15-48562 COOP NSF IIS 16-36942 NSF IOS 1346826 NSF MCB 18-03786NSF CCF 16-17745 NSF CCF 18-46354 CAREER Nsf DEB-1354975 NSF IOS 18-18730NSF CCF 16-29431 NSF OAC 18-49821 Nsf MCB-1158217 Nsf 1904414NSF CCF 16-19245 NSF CNS 18-50317 NSF IOS 12-38030 Nsf 1855416NSF CCF 16-19189 NSF CNS 19-03612 NSF DEB 12-39788 NSF BCS - 1823898NSF CNS 15-44901 NSF OAC 18-35669 NSF MCB 12-44570 NSF 1823909NSF CCF 16-17488 NSF CNS 17-63841 NSF DEB 12-41212 NSF 1802773NSF CNS 16-19275 NSF IIS 18-38215 NSF MCB 12-05373 NSF 1734503NSF CCF 16-17401 NSF IIS 17-62039 NSF IOS 11-21980 NSF 1649298NSF CNS 15-64274 NSF OAC 18-41636 NSF DEB 09-53716 CAR Nsf BCS 1550850NSF IIS 15-63727 NSF IIS 18-22796 NSF DBI 05-15813 National Science Foundation 1459211NSF ACI 15-41450 COOP NSF OAC 18-41456 NSF IOS 13-54094 NSF BCS 12-46920NSF CCF 15-53452 CAR NSF OAC 18-35834 NSF MCB 14-13256 NSF BCS 11-25543NSF CCF 16-23821 NSF CNS 18-16226 NSF DEB 13-55171 NSF BCS 09-35347NSF CNS 15-45069 NSF CNS 17-63658 NSF IOS 13-54913 NSF SES 14-19297NSF CNS 15-44953 NSF OAC 18-39010 NSF DEB 13-42604 NSF BCS 14-23874NSF ACI 15-47249 NSF CCF 18-17577 NSF IOS 12-57680 NSF BCS 13-59911NSF ACI 15-47268 NSF CNS 18-16673 NSF MCB 12-43372 CAR NSF SMA 13-60188NSF IIS 15-50320 NSF CCF 17-55847 NSF DBI 12-62561 NSF BCS 13-17140NSF IIS 17-41317 NSF CNS 18-01652 NSF DBI 14-58285 NSF BCS 13-13822NSF CCF 17-33878 NSF CNS 18-01321 NSF DBI 14-57890 NSF BCS 13-39944NSF OAC 17-25729 EQ NSF CCF 18-07526 NSF DEB 14-57731 NSF SES 15-35167NSF CCF 17-25734 NSF IIS 17-47552 NSF DBI 14-58652 NSF BCS 15-50905NSF OAC 17-40310 NSF CCF 17-63788 NSF DBI 15-02735 NSF BCS 15-18026NSF CCF 17-03637 NSF CCF 1816615 NSF DBI 14-50962 EAGER NSF BCS 15-39651NSF OAC 17-40212 NSF OAC 18-27126 NSF DBI 13-56751 NSF SES 15-30589NSF CCF 17-17154 NSF CNS 18-15891 NSF DBI 15-59908 NSF BCS 14-61724 WKSPNSF CNS 17-39966 NSF CCF 18-14026 NSF DEB 16-39601 NSF SES 14-59699NSF CNS 17-17313 NSF OAC 18-29721 NSF DEB 16-49652 EAGER NSF BCS 14-41409NSF CCF 17-25544 NSF CCF 18-14613 NSF MCB 16-16874 NSF BCS 13-48522NSF OAC 17-43184 NSF CCF 18-14788 NSF IOS 15-46890 NSF BCS 14-31324NSF OAC 17-40219 NSF CCF 17-63540 NSF MCB 16-16590 NSF SMA 14-16791NSF IIS 17-36235 NSF CCF 18-33617 TRVL NSF DBI 16-45959 NSF SES 15-55701NSF CNS 17-30882 NSF CNS 17-50024 CAR NSF IOS 15-58061 NSF SMA 16-37155NSF IIS 17-18221 NSF IIS 17-50051 CAR NSF DEB 15-55053 NSF SMA 16-20239NSF CNS 17-20268 NSF IIS 17-50563 CAR NSF MCB 15-53649 CAR NSF SES 16-32704NSF OAC 16-63914 NSF IIS 18-26962 CONF NSF DEB 16-56027 NSF SES 16-32023NSF CNS 17-18270 NSF CCF 17-55829 NSF DBI 16-61490 NSF BCS 16-27808 DISSNSF CNS 17-05047 NFS CNS 17-50725 CAR NSF IOS 16-56869 NSF BCS 16-28347NSF CNS 17-40916 NSF CNS 18-24228 CAR NSF DEB 16-55665 NSF BCS 15-61176NSF CNS 17-18952 NSF CCF 17-50436 CAR NSF DEB 17-01515 DISS NSF SES 17-25418NSF CNS 17-18203 NSF CCF 17-55619 NSF DBI 16-52815 CAR NSF BCS 17-33640NSF CCF 17-17530 NSF CCF 17-55921 NSF MCB 17-23008 NSF BCS 17-32263 DISSNSF OAC 16-64119 NSF 1846021 NSF IOS 17-01676 DISS NSF BCS 17-32117 DISSNSF OAC 17-30519 NSF 1901727 NSF DEB 17-01501 DISS NSF BCS 17-35295 DISSNSF CCF 17-05007 NSF 1817955 NSF DEB 17-01777 DISS NSF BCS 16-51191NSF IIS 17-41803 TRVL NSF 1841738 NSF DEB 17-01925 DISS NSF BCS 17-25123NSF IIS 17-04532 NSF 1818067 NSF DEB 17-33854 NSF BCS 16-60412NSF CCF 17-18883 NSF 1753238 NSF IOS 16-45875 NSF BCS 16-51205 DISSNSF ACI 17-13685 NSF 1655494 NSF DBI 17-56405 NSF BCS 16-50839 DISSNSF ACI 17-13784 NSF 1715649 NSF MCB 1-45606 CAREER NSF BCS 16-51197NSF CNS 17-19337 NSF 1655692 NSF IOS 18-27533 NSF BCS 16-51183NSF OAC 17-38962 NSF 1651598 NSF MCB 18-40320 NSF BCS 16-38756NSF IIS 17-19291 NSF IOS 1557725 NSF IOS 17-55336 NSF BCS 18-44447 DISSNSF ACI 16-59293 NSF 1649160 NSF IOS 18-48671 NSF SES 17-58631NSF ACI 17-13684 NSF 1615851 NSF MCB 18-18344 NSF SES 18-24026NSF IIS 16-52750 CAR Nsf EF 1550853 NSF DEB 18-31842 NSF BCS 18-25402 DISS

STATE OF ILLINOISUNIVERSITY OF ILLINOIS
TABLE OF AWARD NUMBERS REFERENCED IN FEDERAL COMPLIANCE FINDINGSFor the Year Ended June 30, 2019
Name of Federal Program or ClusterResearch and Development Cluster (continued)
Award Number
59
NSF BCS 17-49594 NSF DUE 17-12467 Princeton Unv SUB0000184 SBC US Ignite 090837NSF BCS 18-23881 DISS NSF DGE 17-35252 U of Notre Dame PHY 1219444 SBC CalTech S421480NSF SES 18-24005 NSF DGE 17-46047 FLLW SBC Univ AZ 187735 SBC Montana St G128-14-W4596NSF BCS 18-23762 DISS NSF DRL 17-13609 SBC Cal Tech 68D-1094803 SBC Wayne State PO712869 TTANSF SES 18-24253 NSF HRD 17-40788 SBC Wisconsin 630K545 SBC NYU #F7304-01NSF BCS 17-61680 NSF DRL 16-61231 SBC LSST N51857C SBC NC State Univ 2016-0365-01NSF BCS 17-50675 NSF DRL 18-50398 SBC U Mass 18-010023C SBC Donald Danforth 23307-INSF BCS 17-57630 DISS NSF DGE 18-20531 SBC Rutgers #0083 SBC Oregon State S1809A-ANSF BCS 17-51424 NSF DGE 18-20608 SBC U Chicago FP062802-B SBC U Mass 2016-03927 TTANSF DRL 17-42466 NSF OISE 15-59530 SBC Stanford 61942784-134448 SBC Washington U WU-18-54NSF GRFP 1842398 NSF CNS 08-34480 SBC U Chicago FP070402-01-PR SBC UTA UTA17-000639Nsf 1821501 NSF CNS 09-16028 ARRA SBC NRAO SOSPA6-010 #363369 SBC U of Georgia #RR272-671NSF HRD 1826795 NSF IIS 09-05523 ARRA SBC NRAO #362693 SBC Michigan State RC106522UINsf 1813737 NSF OISE 15-45907 SBC LSST NB2522C SBC NY Botanical Garden 1802034-02NSF 1720856 NSF OIA 18-49102 SBC NRAO SOSPA5-001 359284 SBC SI 092147 TTANSF 1644182 NEIU PO#0047741 SBC NRAO SOSPA5-002 359285 SBC Maine UMS-1178NSF 1661096 SBC AERA 087137 SBC Maryland 39743-Z4761002 SBC Battelle US001-0000715250NSF DGE 1623267 SBC U Conn 331028 KFS#5648630 SBC New Mexico 133623-874A SBC Missouri C00060063-1NSF 1612455 SBC EarthSense 094952 SBC Univ Colorado 1553089 SBC Donald Danforth 092231 TTANSF 1561550 SBC Clark Univ 2A325-7532 SBC U of Southern CA 91268993 SBC Middle TN State C18-1383 TTANsf 1612113 SBC Posed2 090605 SBC New Mexico 133660-874A SBC GSU SP00011322-01 WKSPNSF DUE 1535299 UC Irvine Subaward 2017-3453 SBC Colorado Boulder 1554695 SBC Cal State A18-0036-S001NSF DUE 1504851 VCU Subaward FP00001012_SA001 SBC UCAR SUBAWD000523 SBC Minnesota H006607901Nsf DUE 1439761 Sub No. 2104-1248-00-A NSF 1634738 SBC Oklahoma 2018-11 SBC Donald Danforth 23704-INSF GRFP 1444315 NWU Sub SP0032327-PROJ0008569 Princeton Univ Sub 0000259 SBC Nebraska-Lincoln 095993 TTANsf DUE-1431926 SBC Univ TN A12-0044-S006 OHSU 1008921 UIL Univ ID NSF TTA 2019-388NSF DRL 1316736 SBC Northwestern SP0032266 IN4870700UI NSF 1502310 PO1994482 MI ST U NSF TTA PO 448957Nsf DRL-1316874 SBC Clemson 1814-206-2010820 Iowa State Univ 4206044A SBC Minnesota A005162202NSF 1241685 SBC Georgia Tech RF481-G2 DePaul U 501165SG131 1542971 SBC Minnesota H005184101Nsf DGE-1069311 SBC South Carolina 15-2847 NWU SP0029341-PROJ0007718 SBC SIUE 7761795-001NSF DGE 10-69157 IGERT SBC Ohio State EFRI-1433467 UH No MA1335 ACI-1441963 SBC San Diego State SA0000538NSF DGE 09-65918 IGERT SBC Serionix 084103 FUA SBC PURDUE 10000686-020 SBC AAG F7034-UIUCNSF HRD 13-09028 SBC CO School of Mines 401008-5801 SBC ICSI ACI-1348077 SBC Michigan State RC108528ILLNSF DUE 13-47722 SBC MIT 5710003967 SBC Univ North Texas GF1648-1 Concord Consortium Sub. No. 301-01NSF DRL 12-52389 SBC Auburn 17-CE-200642-UIUC SBC U of Chicago FP061606-A Chicago State Univ Illinois LSAMPNSF DUE 13-03455 SBC GA Tech RJ133-G1 SBC N AZ Univ 1639529 AIR 0366900002NSF DRL 12-53081 CAR SBC InnSight Technology 086715 SBIR SBC US Ignite 2016-05221 CSU Grant 53953 - HRD 1411219NSF DUE 15-44388 EAGER SBC Univ of MI 3004362737 SBC CRA #BDhub001 Chicago Zoological SocietyNSF DRL 15-60724 SBC Iowa State 4207287A SBC Indiana U #BL-4812511-UIUC SBC Univ of Chicago 2015-06142NSF DUE 14-32424 SBC Inprentus 084634 FUA SBC US Ignite 086713 SBC Frost Science 338NSF HRD 16-45072 SBC UC San Diego 79408688 SBC GA Tech Research RH206-G1 SBC Univ of Pennsylvania 570824NSF DRL 16-39340 SBC Univ of MI 3005299755 SBC NC State Univ #2016-1294 SBC Fielding NSF-2018-1NSF DUE 15-64940 SBC Johns Hopkins 2004083856 SBC Mayo UNI-249880/PO#66474932 SBC U Chicago FP068516-CNSF DUE 16-25891 SBC Purdue 10001433-003 SBC US Ignite 093998 SBC Purdue 4101-78763NSF DUE 16-08002 SBC NU SP0050691-PROJ0014192 SBC Princeton SUB0000273 SBC Arizona 436720NSF DRL 16-21253 SBC Washington Univ. WU-19-26 SBC US Ignite 092299 SBC IIE 095308NSF DRL 16-21470 SBC NU SP0046112-PROJ0012935 SBC Univ Colorado 1557076 NRC Sub ISL 18-20018NSF DUE 16-30128 WKSP SBC Iria Pharma 091562 SBC Indiana U #BL-4812534-UI NRC Sub NW SP0029021-PROJ008723NSF HRD 15-61723 SBC Northeastern U 091975 TTA SBC UC Berkeley 00009872 STATE Sub Traffic UNIILLINOIS-01-Y1NSF DRL 17-42466 SBC Texas A&M M1801377 SBC UC Berkeley 00009746 STATE Sub UM 3003690918NSF DRL 17-21236 COOP

STATE OF ILLINOISUNIVERSITY OF ILLINOIS
TABLE OF AWARD NUMBERS REFERENCED IN FEDERAL COMPLIANCE FINDINGSFor the Year Ended June 30, 2019
60
Name of Federal Program or Cluster (CFDA#):Child Care and Development Cluster (CCDF) (93.575/93.596)
Award Number IDHS 00503815 Antc IDHS FCSXI04946 FY19 IDHS FCSXI04797 FY19 IDHS FCSWI03364 FY18IDHS FCSWI04797 FY18 HHS SUB INCCRRA 090985
Cooperative Extension Services (CES) (10.500)
Award Number384 FY17 Smith-Lever 3b and 3c 384 FY18 Smith-Lever 3b and 3c 384 FY19 Smith-Lever 3b and 3c 384 FY18 SL CSRS Retirement384 FY19 SL CSRS Retirement 384 FY19 SL Food and Nutrition 384 FY18 SL Renewable Resources FY17 AgrAbilityDisaster Data/Best Practices 384 FY18 SL Food and Nutrition AG Sub UNL 25-6324-0150-116 AG Sub KSU S17140AG Sub KSU S19095 AG Sub Auburn 18-CHS-205205-UIUC AG Sub KSU S18101 AG Sub KSU S19160
Temporary Assistance for Needy Families (TANF) (93.558)
Award Number831 DHHS-ACF IDHS TANF FY19
Student Financial Assistance (84.007/84.033/84.038/84.063/84.268/84.379/93.264/93.342/93.364)
Award Number106 UIC FY19 FWS 831 DE SEOG FY19 P007A181274 DED FY17 Pell Admin Allowance FY18 Pell P063P170118106 UIC FY18 FWS FY18 SEOG P007A171306 831 DE PELL FY19 FY19 Pell Admin Allowance P063Q1801106 UIC FY17 FWS FY19 SEOG P007A181306 831 DE PELL FY18 FY19 Pell P063P180118106 UIS FY19 FWS DED FY19 Pell Grant PELL Admin Allowance DED TEACH FY19106 UIUC FY19 FWS DED FY19 Pell Admin Allowance FY16 Pell Admin Allowance DED TEACH FY18106 UIUC FY18 FWS DED FY18 Pell Admin Allowance FY17 Pell Admin Allowance 831 DE TEACH Grant FY19106 UIUC FY17 FWS DED FY18 Pell Grant FY18 Pell Admin Allow P063Q170118 FY19 TEACH P379T190118DED FY19 SEOG DED FY17 Pell Grant

STATE OF ILLINOISUNIVERSITY OF ILLINOIS
FINANCIAL RELATED INFORMATION SUMMARYYear Ended June 30, 2019
61
Financial related information presented in this section of the report includes the following:
! Financial Related Schedules:
– Schedule of Expenditures of Federal Awards– Attachments to Schedule of Expenditures of Federal Awards– Notes to the Schedule of Expenditures of Federal Awards
The Schedule of Expenditures of Federal Awards presented in this section has been subjected to the auditing procedures applied in the audit of the basic financial statements and, in the auditors’opinion, it is fairly stated, in all material respects, in relation to the basic financial statements taken as a whole.
The findings and auditors’ reports on compliance testing and questioned costs and internal control related to federal awards are presented in the Compliance Report section of this report.

UNIVERSITY OF ILLINOISSCHEDULE OF EXPENDITURES OF FEDERAL AWARDS
Year Ended June 30, 2019
Cluster/Major Agency/Fed Agency/ Award Type/CFDA Prog Title or Award Title CFDA No. Urbana Chicago Springfield Total Fed ExpMaj Prog Total Subs Out Exp
1R&DCluster:____Department of Veterans Affairs (VA)
DDepartment of Veterans Affairs (VA)
Direct AwardsDepartment of Veterans Affairs (non-specific) 64.000 103,828 346,131Y 449,959
103,828 346,131 449,959- Agency TotalsDepartment of Veterans Affairs (VA)
Edward Hines Jr VA Hospital
Direct AwardsDepartment of Veterans Affairs (non-specific) 64.000 64,438Y 64,438
Edward Hines Jr. Hospital VA IPA 64.000 6,139Y 6,139
70,577 70,577- Agency TotalsEdward Hines Jr VA Hospital
Jesse Brown VA Medical Center
Direct AwardsDepartment of Veterans Affairs (non-specific) 64.000 1,665,122Y 1,665,122
1,665,122 1,665,122- Agency TotalsJesse Brown VA Medical Center
VA Boston Healthcare System
Direct AwardsDepartment of Veterans Affairs (non-specific) 64.000 79,556Y 79,556
79,556 79,556- Agency TotalsVA Boston Healthcare System
VA Puget Sound Health Care System
Direct AwardsDepartment of Veterans Affairs (non-specific) 64.000 45,752Y 45,752
45,752 45,752- Agency TotalsVA Puget Sound Health Care System
General Services AdministrationGeneral Services Administration
1R&DGeneral Services Administration FY19 SEFA
Cluster:Major Agency: Page 62

Cluster/Major Agency/Fed Agency/ Award Type/CFDA Prog Title or Award Title CFDA No. Urbana Chicago Springfield Total Fed ExpMaj Prog Total Subs Out Exp
Direct AwardsGeneral Services Administration (non-specific) 39.000 52,336Y 52,336
52,336 52,336- Agency TotalsGeneral Services Administration
Housing & Urban Development (HUD)HHousing & Urban Development (HUD)
Pass through from Others - see also pass through detailDepartment of Housing and Urban Development (non-specific) 14.000 85,080Y 85,080
85,080 85,080- Agency TotalsHousing & Urban Development (HUD)
Institute of Museum & Library Services (IMLS)Institute of Museum & Library Services (IMLS)
Direct AwardsNational Leadership Grants 45.312 11,495Y 11,495
Laura Bush 21st Century Librarian Program 45.313 93,492Y 93,492
Pass through from Others - see also pass through detailNational Leadership Grants 45.312 68,666Y 68,666
162,158 11,495 173,653- Agency TotalsInstitute of Museum & Library Services (IMLS)
Social Security AdministrationSocial Security Administration
Pass through from Others - see also pass through detailSocial Security Research and Demonstration 96.007 308,230Y 10,293308,230
308,230 308,230- Agency Totals 10,293Social Security Administration
United States Agency for International Development (AID)United States Agency for International Development (AID)
Direct AwardsUSAID Foreign Assistance for Programs Overseas 98.001 2,186,636Y 1,129,0572,186,636
Pass through from Others - see also pass through detailAgency for International Development (non-specific) 98.000 87,005Y 25,68887,005
USAID Foreign Assistance for Programs Overseas 98.001 1,167,697Y 780,9841,167,697
1R&DUnited States Agency for International Development (AID) FY19 SEFA
Cluster:Major Agency: Page 63

Cluster/Major Agency/Fed Agency/ Award Type/CFDA Prog Title or Award Title CFDA No. Urbana Chicago Springfield Total Fed ExpMaj Prog Total Subs Out Exp
3,441,338 3,441,338- Agency Totals 1,935,729United States Agency for International Development (AID)
US Department of Agriculture (USDA)NNational Institute of Food and Agriculture/USDA
Direct AwardsGrants for Agricultural Research, Special Research Grants 10.200 731,675Y 550,000731,675
Cooperative Forestry Research 10.202 340,102Y 340,102
Payments to Agricultural Experiment Stations Under the Hatch Act 10.203 7,187,077Y 7,187,077
Animal Health and Disease Research 10.207 30,380Y 30,380
Integrated Programs 10.303 137,461Y 54,826137,461
Organic Agriculture Research and Extension Initiative 10.307 427,346Y 62,749427,346
Agriculture and Food Research Initiative (AFRI) 10.310 6,721,108 185,194Y 1,083,8396,906,302
Pass through from Others - see also pass through detailSustainable Agriculture Research and Education 10.215 47,810Y 47,810
Homeland Security Agricultural 10.304 48,770Y 48,770
Agriculture and Food Research Initiative (AFRI) 10.310 221,718Y 221,718
Sun Grant Program 10.320 112,915Y 112,915
16,006,362 185,194 16,191,556- Agency Totals 1,751,414National Institute of Food and Agriculture/USDA
US Department of Agriculture (USDA)
Direct AwardsAgricultural Research Basic and Applied Research 10.001 13,261Y 13,261
Agriculture and Food Research Initiative (AFRI) 10.310 199,189Y 199,189
Pass through from Others - see also pass through detailSpecialty Crop Block Grant Program - Farm Bill 10.170 141,871Y 141,871
Grants for Agricultural Research, Special Research Grants 10.200 405Y 405
Sustainable Agriculture Research and Education 10.215 2,441Y 2,441
1R&DUS Department of Agriculture (USDA) FY19 SEFA
Cluster:Major Agency: Page 64

Cluster/Major Agency/Fed Agency/ Award Type/CFDA Prog Title or Award Title CFDA No. Urbana Chicago Springfield Total Fed ExpMaj Prog Total Subs Out Exp
1890 Institution Capacity Building Grants 10.216 14,842Y 14,842
Higher Education - Institution Challenge Grants Program 10.217 18,942Y 18,942
Agricultural Market and Economic Research 10.290 15,138Y 15,138
Agriculture and Food Research Initiative (AFRI) 10.310 175,894Y 175,894
Crop Protection and Pest Management Competitive Grants Program 10.329 36,286Y 36,286
Pass through from State of IL - see also pass through detailSpecialty Crop Block Grant Program - Farm Bill 10.170 195,409Y 195,409
813,678 813,678- Agency TotalsUS Department of Agriculture (USDA)
UUS Department of Agriculture/Ag Research Service (ARS)
Direct AwardsAgricultural Research Basic and Applied Research 10.001 1,623,030 -1,967Y 1,621,063
Agriculture and Food Research Initiative (AFRI) 10.310 53,433Y 53,433
Pass through from Others - see also pass through detailAgricultural Research Basic and Applied Research 10.001 194,581Y 194,581
1,871,044 -1,967 1,869,077- Agency TotalsUS Department of Agriculture/Ag Research Service (ARS)
USDA Animal & Plant Health Inspection Serv (APHIS)
Direct AwardsPlant and Animal Disease, Pest Control, and Animal Care 10.025 137,212Y 137,212
Wildlife Services 10.028 12,027Y 12,027
Pass through from Others - see also pass through detailPlant and Animal Disease, Pest Control, and Animal Care 10.025 8,148Y 8,148
Pass through from State of IL - see also pass through detailPlant and Animal Disease, Pest Control, and Animal Care 10.025 156,441Y 156,441
301,801 12,027 313,828- Agency TotalsUSDA Animal & Plant Health Inspection Serv (APHIS)
USDA Coop State Rsrch Educ & Ext Serv (CSREES)
Direct AwardsAgriculture and Food Research Initiative (AFRI) 10.310 57,818Y 57,818
1R&DUS Department of Agriculture (USDA) FY19 SEFA
Cluster:Major Agency: Page 65

Cluster/Major Agency/Fed Agency/ Award Type/CFDA Prog Title or Award Title CFDA No. Urbana Chicago Springfield Total Fed ExpMaj Prog Total Subs Out Exp
57,818 57,818- Agency TotalsUSDA Coop State Rsrch Educ & Ext Serv (CSREES)
UUSDA Economic Research Service (ERS)
Direct AwardsAgricultural and Rural Economic Research, Cooperative Agreements and Collaborations
10.250 21,179Y 21,179
Pass through from Others - see also pass through detailConsumer Data and Nutrition Research 10.253 28,619Y 25,75428,619
49,798 49,798- Agency Totals 25,754USDA Economic Research Service (ERS)
USDA Farm Service Agency (FSA)
Pass through from Others - see also pass through detailPlant and Animal Disease, Pest Control, and Animal Care 10.025 27,991Y 27,991
27,991 27,991- Agency TotalsUSDA Farm Service Agency (FSA)
USDA Food and Nutrition Service (FNS)
Direct AwardsSchool Wellness Policy Cooperative Agreement 10.597 216,299Y 48,715216,299
216,299 216,299- Agency Totals 48,715USDA Food and Nutrition Service (FNS)
USDA Forest Service (FS)
Direct AwardsDepartment of Agriculture (non-specific) 10.000 31,074Y 31,074
Wood Utilization Assistance 10.674 -63Y -63
Urban and Community Forestry Program 10.675 90,811Y 47,91190,811
Forest Health Protection 10.680 837Y 837
Environmental Quality Incentives Program 10.912 11,215Y 11,215
122,659 11,215 133,874- Agency Totals 47,911USDA Forest Service (FS)
USDA Natural Resources Conservation Service (NRCS)
Direct AwardsConservation Reserve Program 10.069 10,472Y 10,472
Soil and Water Conservation 10.902 137,720Y 137,720
1R&DUS Department of Agriculture (USDA) FY19 SEFA
Cluster:Major Agency: Page 66

Cluster/Major Agency/Fed Agency/ Award Type/CFDA Prog Title or Award Title CFDA No. Urbana Chicago Springfield Total Fed ExpMaj Prog Total Subs Out Exp
Environmental Quality Incentives Program 10.912 30,934Y 26,86930,934
Agricultural Conservation Easement Program 10.931 54,115Y 54,115
Regional Conservation Partnership Program 10.932 42,829Y 42,829
Pass through from Others - see also pass through detailEnvironmental Quality Incentives Program 10.912 34,360Y 34,360
310,430 310,430- Agency Totals 26,869USDA Natural Resources Conservation Service (NRCS)
UUSDA Office of Chief Economist
Direct AwardsAgricultural Market and Economic Research 10.290 44,707Y 44,707
44,707 44,707- Agency TotalsUSDA Office of Chief Economist
US Department of CommerceNational Institute of Standards & Technology
Direct AwardsMeasurement and Engineering Research and Standards 11.609 5,688Y 5,688
Pass through from Others - see also pass through detailMeasurement and Engineering Research and Standards 11.609 52,183Y 52,183
Manufacturing Extension Partnership 11.611 1,493,116Y 1,493,116
Arrangements for Interdisciplinary Research Infrastructure 11.619 1,327,515Y 1,327,515
1,327,515 1,550,987 2,878,502- Agency TotalsNational Institute of Standards & Technology
US Department of Commerce
Direct AwardsEconomic Development Technical Assistance 11.303 64,020Y 64,020
Measurement and Engineering Research and Standards 11.609 -5,397Y -5,397
Pass through from Others - see also pass through detailDepartment of Commerce (non-specific) 11.000 84,562Y 84,562
Sea Grant Support 11.417 155,934 32,054Y 3,807187,988
National Oceanic and Atmospheric Administration (NOAA) Cooperative Institutes
11.432 1,047Y 1,047
1R&DUS Department of Commerce FY19 SEFA
Cluster:Major Agency: Page 67

Cluster/Major Agency/Fed Agency/ Award Type/CFDA Prog Title or Award Title CFDA No. Urbana Chicago Springfield Total Fed ExpMaj Prog Total Subs Out Exp
Hydrologic Research 11.462 196,314Y 104,291196,314
Measurement and Engineering Research and Standards 11.609 74,898Y 74,898
507,358 96,074 603,432- Agency Totals 108,098US Department of Commerce
UUS Dept of Commerce NOAA
Direct AwardsFisheries Development and Utilization Research and Development Grants and Cooperative Agreements Program
11.427 136,530Y 136,530
Climate and Atmospheric Research 11.431 118,530Y 118,530
Weather and Air Quality Research 11.459 173,039Y 173,039
Applied Meteorological Research 11.468 57,765Y 20,76857,765
Pass through from Others - see also pass through detailSea Grant Support 11.417 87,902 6,809Y 94,711
Pass through from State of IL - see also pass through detailCoastal Zone Management Administration Awards 11.419 633,692Y 14,378633,692
1,070,928 143,339 1,214,267- Agency Totals 35,146US Dept of Commerce NOAA
US Department of Defense (DoD)Air Force
Direct AwardsDepartment of Defense (non-specific) 12.000 558Y 558
Basic, Applied, and Advanced Research in Science and Engineering 12.630 -2,982Y -2,982
Air Force Defense Research Sciences Program 12.800 501,524Y 501,524
Research and Technology Development 12.910 113,878Y 16,962113,878
Pass through from Others - see also pass through detailDepartment of Defense (non-specific) 12.000 417,917Y 417,917
Basic, Applied, and Advanced Research in Science and Engineering 12.630 -1,788Y -1,788
Air Force Defense Research Sciences Program 12.800 418,350Y 418,350
1,333,579 113,878 1,447,457- Agency Totals 16,962Air Force
1R&DUS Department of Defense (DoD) FY19 SEFA
Cluster:Major Agency: Page 68

Cluster/Major Agency/Fed Agency/ Award Type/CFDA Prog Title or Award Title CFDA No. Urbana Chicago Springfield Total Fed ExpMaj Prog Total Subs Out Exp
AAir Force Materiel Command
Direct AwardsAir Force Defense Research Sciences Program 12.800 23,130Y 23,130
23,130 23,130- Agency TotalsAir Force Materiel Command
Air Force Office of Scientific Research (AFOSR)
Direct AwardsBasic, Applied, and Advanced Research in Science and Engineering 12.630 96,795Y 96,795
Air Force Defense Research Sciences Program 12.800 7,966,595 479,957Y 1,363,1878,446,552
Pass through from Others - see also pass through detailDepartment of Defense (non-specific) 12.000 255,019Y 255,019
Basic and Applied Scientific Research 12.300 34,162Y 34,162
Basic Scientific Research 12.431 40,551Y 40,551
Air Force Defense Research Sciences Program 12.800 330,901 34,258Y 365,159
8,683,472 554,766 9,238,238- Agency Totals 1,363,187Air Force Office of Scientific Research (AFOSR)
Army
Direct AwardsDepartment of Defense (non-specific) 12.000 10,971Y 10,971
Basic Scientific Research 12.431 587,897 13,688Y 601,585
Basic, Applied, and Advanced Research in Science and Engineering 12.630 2,151,622Y 1,523,8592,151,622
Pass through from Others - see also pass through detailDepartment of Defense (non-specific) 12.000 613,293Y 613,293
Basic Scientific Research 12.431 763,194Y 763,194
4,126,977 13,688 4,140,665- Agency Totals 1,523,859Army
Army CERL
Direct AwardsDepartment of Defense (non-specific) 12.000 87,742Y 87,742
Basic, Applied, and Advanced Research in Science and Engineering 12.630 1,462,700Y 92,1951,462,700
1R&DUS Department of Defense (DoD) FY19 SEFA
Cluster:Major Agency: Page 69

Cluster/Major Agency/Fed Agency/ Award Type/CFDA Prog Title or Award Title CFDA No. Urbana Chicago Springfield Total Fed ExpMaj Prog Total Subs Out Exp
1,550,442 1,550,442- Agency Totals 92,195Army CERL
AArmy Research Office (ARO)
Direct AwardsDepartment of Defense (non-specific) 12.000 139,954Y 139,954
Basic Scientific Research 12.431 3,871,254 424,545Y 1,796,0734,295,799
Basic, Applied, and Advanced Research in Science and Engineering 12.630 43,085 10,872Y 53,957
Pass through from Others - see also pass through detailDepartment of Defense (non-specific) 12.000 442,844Y 442,844
Basic Scientific Research 12.431 1,042,080Y 1,042,080
5,539,217 435,417 5,974,634- Agency Totals 1,796,073Army Research Office (ARO)
CERL Champaign
Direct AwardsDepartment of Defense (non-specific) 12.000 42,726Y 42,726
Military Construction, National Guard 12.400 -365Y -365
Basic, Applied, and Advanced Research in Science and Engineering 12.630 96,330Y 96,330
138,691 138,691- Agency TotalsCERL Champaign
Defense Advanced Research Projects Agency (DARPA)
Direct AwardsDepartment of Defense (non-specific) 12.000 7,848,834Y 1,288,0547,848,834
Air Force Defense Research Sciences Program 12.800 115,598Y 115,598
Research and Technology Development 12.910 4,167,768Y 1,314,0164,167,768
Pass through from Others - see also pass through detailDepartment of Defense (non-specific) 12.000 593,017 53,784Y 646,801
Basic and Applied Scientific Research 12.300 94,323Y 94,323
Research and Technology Development 12.910 1,307,828Y 01,307,828
14,011,770 169,382 14,181,152- Agency Totals 2,602,070Defense Advanced Research Projects Agency (DARPA)
1R&DUS Department of Defense (DoD) FY19 SEFA
Cluster:Major Agency: Page 70

Cluster/Major Agency/Fed Agency/ Award Type/CFDA Prog Title or Award Title CFDA No. Urbana Chicago Springfield Total Fed ExpMaj Prog Total Subs Out Exp
DDefense POW/MIA Accounting Agency (DPAA)
Direct AwardsDepartment of Defense (non-specific) 12.000 274,125Y 274,125
Pass through from Others - see also pass through detailDepartment of Defense (non-specific) 12.000 77,354Y 77,354
Past Conflict Accounting 12.740 91,894Y 91,894
443,373 443,373- Agency TotalsDefense POW/MIA Accounting Agency (DPAA)
Defense Threat Reduction Agency (DTRA)
Direct AwardsScientific Research - Combating Weapons of Mass Destruction 12.351 1,144,024 11,218Y 329,8861,155,242
Pass through from Others - see also pass through detailDepartment of Defense (non-specific) 12.000 90,143Y 90,143
Scientific Research - Combating Weapons of Mass Destruction 12.351 143,729Y 143,729
1,377,896 11,218 1,389,114- Agency Totals 329,886Defense Threat Reduction Agency (DTRA)
Missile Defense Agency (MDA)
Pass through from Others - see also pass through detailDepartment of Defense (non-specific) 12.000 32,979Y 32,979
32,979 32,979- Agency TotalsMissile Defense Agency (MDA)
National Reconnaissance Office
Pass through from Others - see also pass through detailDepartment of Defense (non-specific) 12.000 186,889Y 186,889
186,889 186,889- Agency TotalsNational Reconnaissance Office
National Security Agency
Direct AwardsDepartment of Defense (non-specific) 12.000 471,277Y 12,395471,277
Mathematical Sciences Grants 12.901 -2,597Y -2,597-2,597
Information Security Grants 12.902 166,365Y 166,365
635,045 635,045- Agency Totals 9,798National Security Agency
1R&DUS Department of Defense (DoD) FY19 SEFA
Cluster:Major Agency: Page 71

Cluster/Major Agency/Fed Agency/ Award Type/CFDA Prog Title or Award Title CFDA No. Urbana Chicago Springfield Total Fed ExpMaj Prog Total Subs Out Exp
NNaval Research Laboratory (NRL)
Direct AwardsBasic and Applied Scientific Research 12.300 17,165Y 17,165
17,165 17,165- Agency TotalsNaval Research Laboratory (NRL)
Navy
Direct AwardsBasic and Applied Scientific Research 12.300 1,208,036Y 340,4251,208,036
Pass through from Others - see also pass through detailDepartment of Defense (non-specific) 12.000 36,731Y 36,731
Basic and Applied Scientific Research 12.300 719,050Y 719,050
1,927,086 36,731 1,963,817- Agency Totals 340,425Navy
Office of Naval Research (ONR)
Direct AwardsBasic and Applied Scientific Research 12.300 6,312,981 299,452Y 1,606,1046,612,433
Pass through from Others - see also pass through detailDepartment of Defense (non-specific) 12.000 202,320 8,158Y 210,478
Basic and Applied Scientific Research 12.300 758,495 28,551Y 787,046
7,273,796 336,161 7,609,957- Agency Totals 1,606,104Office of Naval Research (ONR)
SPAWAR Systems Center Pacific
Direct AwardsResearch and Technology Development 12.910 -1,308Y -1,308
-1,308 -1,308- Agency TotalsSPAWAR Systems Center Pacific
Strategic Environmental Research & Development Prog (SERDP)
Direct AwardsDepartment of Defense (non-specific) 12.000 877,941 136,190Y 348,4001,014,131
877,941 136,190 1,014,131- Agency Totals 348,400Strategic Environmental Research & Development Prog (SERDP)
US Army Corps of Engineers
Direct Awards
1R&DUS Department of Defense (DoD) FY19 SEFA
Cluster:Major Agency: Page 72

Cluster/Major Agency/Fed Agency/ Award Type/CFDA Prog Title or Award Title CFDA No. Urbana Chicago Springfield Total Fed ExpMaj Prog Total Subs Out Exp
Department of Defense (non-specific) 12.000 57,632Y 57,632
Basic, Applied, and Advanced Research in Science and Engineering 12.630 39,949Y 39,949
Legacy Resource Management Program 12.632 -1,139Y -1,139
Pass through from Others - see also pass through detailDepartment of Defense (non-specific) 12.000 24,158Y 24,158
62,968 57,632 120,600- Agency TotalsUS Army Corps of Engineers
UUS Army Engineer Research and Development Center
Direct AwardsDepartment of Defense (non-specific) 12.000 140,101Y 3,587140,101
140,101 140,101- Agency Totals 3,587US Army Engineer Research and Development Center
US Army Medical Research Acquisition
Direct AwardsMilitary Medical Research and Development 12.420 1,195,808 2,390,368Y 325,4103,586,176
Pass through from Others - see also pass through detailMilitary Medical Research and Development 12.420 141,069Y 141,069
1,195,808 2,531,437 3,727,245- Agency Totals 325,410US Army Medical Research Acquisition
US Department of Defense (DoD)
Direct AwardsDepartment of Defense (non-specific) 12.000 159,570Y 5,722159,570
Military Medical Research and Development 12.420 371,423 2,100,211Y 175,4282,471,634
Basic Scientific Research 12.431 118,968Y 118,968
Basic, Applied, and Advanced Research in Science and Engineering 12.630 389,515Y 389,515
Legacy Resource Management Program 12.632 75,158Y 75,158
Air Force Defense Research Sciences Program 12.800 171,389Y 40,080171,389
Pass through from Others - see also pass through detailDepartment of Defense (non-specific) 12.000 11,297 178,749Y 16,604190,046
1R&DUS Department of Defense (DoD) FY19 SEFA
Cluster:Major Agency: Page 73

Cluster/Major Agency/Fed Agency/ Award Type/CFDA Prog Title or Award Title CFDA No. Urbana Chicago Springfield Total Fed ExpMaj Prog Total Subs Out Exp
Basic and Applied Scientific Research 12.300 15,956Y 15,956
Military Construction, National Guard 12.400 723Y 723
Military Medical Research and Development 12.420 212,408 456,350Y 668,758
Basic Scientific Research 12.431 15,197Y 15,197
Basic, Applied, and Advanced Research in Science and Engineering 12.630 466,113 90,840Y 193,143556,953
Research and Technology Development 12.910 157,105Y 157,105
1,153,078 3,837,894 4,990,972- Agency Totals 430,977US Department of Defense (DoD)
US Department of EducationUUS Department of Education
Direct AwardsHigher Education Institutional Aid 84.031 949,725Y 949,725
Education Research, Development and Dissemination 84.305 637,746 1,850,075Y 402,5612,487,821
Special Education - Personnel Development to Improve Services and Results for Children with Disabilities
84.325 271,042 237,768Y 508,810
Pass through from Others - see also pass through detailDepartment of Education (non-specific) 84.000 -36,345Y -36,345
Civil Rights Training and Advisory Services (also known as Equity Assistance Centers)
84.004 28,386Y 28,386
Higher Education Institutional Aid 84.031 30,450Y 30,450
Fund for the Improvement of Postsecondary Education 84.116 28,852Y 28,852
Rehabilitation Training Technical Assistance Centers 84.264 354,832Y 354,832
Education Research, Development and Dissemination 84.305 49,254 305,602Y 354,856
Research in Special Education 84.324 220,722 4,066Y 224,788
Supporting Effective Instruction State Grants (formerly Improving Teacher Quality State Grants)
84.367 6,030 4,002Y 10,032
Pass through from State of IL - see also pass through detailSpecial Education Grants to States 84.027 131,665Y 131,665
1,634,946 3,438,926 5,073,872- Agency Totals 402,561US Department of Education
1R&DUS Department of Education FY19 SEFA
Cluster:Major Agency: Page 74

Cluster/Major Agency/Fed Agency/ Award Type/CFDA Prog Title or Award Title CFDA No. Urbana Chicago Springfield Total Fed ExpMaj Prog Total Subs Out Exp
US Department of Energy (DOE)AAdvanced Research Projects Agency - Energy (ARPA-E)
Direct AwardsAdvanced Research Projects Agency - Energy 81.135 2,610,894Y 1,025,3552,610,894
Pass through from Others - see also pass through detailAdvanced Research Projects Agency - Energy 81.135 297,365Y 297,365
2,908,259 2,908,259- Agency Totals 1,025,355Advanced Research Projects Agency - Energy (ARPA-E)
Argonne National Lab
Direct awards from DOE lab - see also pass through detailDepartment of Energy (non-specific) 81.000 1,858,983 2,090,522Y 3,949,505
1,858,983 2,090,522 3,949,505- Agency TotalsArgonne National Lab
Brookhaven National Lab
Direct awards from DOE lab - see also pass through detailDepartment of Energy (non-specific) 81.000 720,529 55,857Y 776,386
720,529 55,857 776,386- Agency TotalsBrookhaven National Lab
DOE Bonneville Power Administration
Direct AwardsDepartment of Energy (non-specific) 81.000 20,666Y 20,47220,666
20,666 20,666- Agency Totals 20,472DOE Bonneville Power Administration
DOE Chicago operations
Direct AwardsOffice of Science Financial Assistance Program 81.049 966,905Y 184,648966,905
966,905 966,905- Agency Totals 184,648DOE Chicago operations
E.O. Lawrence Berkeley National Laboratory
Direct awards from DOE lab - see also pass through detailDepartment of Energy (non-specific) 81.000 19,155Y 4,21019,155
19,155 19,155- Agency Totals 4,210E.O. Lawrence Berkeley National Laboratory
Fermilab
Direct awards from DOE lab - see also pass through detail
1R&DUS Department of Energy (DOE) FY19 SEFA
Cluster:Major Agency: Page 75

Cluster/Major Agency/Fed Agency/ Award Type/CFDA Prog Title or Award Title CFDA No. Urbana Chicago Springfield Total Fed ExpMaj Prog Total Subs Out Exp
Department of Energy (non-specific) 81.000 482,548Y 482,548
482,548 482,548- Agency TotalsFermilab
IIdaho National Engr & Env Lab
Direct awards from DOE lab - see also pass through detailDepartment of Energy (non-specific) 81.000 25,479Y 25,479
25,479 25,479- Agency TotalsIdaho National Engr & Env Lab
Lawrence Livermore National Lab
Direct awards from DOE lab - see also pass through detailDepartment of Energy (non-specific) 81.000 721,966Y 721,966
721,966 721,966- Agency TotalsLawrence Livermore National Lab
Los Alamos National Lab
Pass through from Others - see also pass through detailDepartment of Energy (non-specific) 81.000 235,519Y 235,519
235,519 235,519- Agency TotalsLos Alamos National Lab
National Energy Technology Laboratory (NETL)
Direct awards from DOE lab - see also pass through detailConservation Research and Development 81.086 4,585Y 4,585
Fossil Energy Research and Development 81.089 3,197,624Y 1,071,0123,197,624
Electricity Delivery and Energy Reliability, Research, Development and Analysis
81.122 4,675,976Y 3,075,2714,675,976
Pass through from Others - see also pass through detailElectricity Delivery and Energy Reliability, Research, Development and Analysis
81.122 209,078Y 22,670209,078
8,087,263 8,087,263- Agency Totals 4,168,953National Energy Technology Laboratory (NETL)
National Renewable Energy Lab
Direct awards from DOE lab - see also pass through detailDepartment of Energy (non-specific) 81.000 30,444Y 30,444
Office of Science Financial Assistance Program 81.049 98,987Y 98,987
30,444 98,987 129,431- Agency TotalsNational Renewable Energy Lab
Oak Ridge National Lab
1R&DUS Department of Energy (DOE) FY19 SEFA
Cluster:Major Agency: Page 76

Cluster/Major Agency/Fed Agency/ Award Type/CFDA Prog Title or Award Title CFDA No. Urbana Chicago Springfield Total Fed ExpMaj Prog Total Subs Out Exp
Direct awards from DOE lab - see also pass through detailDepartment of Energy (non-specific) 81.000 14,859 106,594Y 121,453
14,859 106,594 121,453- Agency TotalsOak Ridge National Lab
PPacific Northwest National Lab
Direct awards from DOE lab - see also pass through detailDepartment of Energy (non-specific) 81.000 325,224Y 325,224
325,224 325,224- Agency TotalsPacific Northwest National Lab
Princeton Plasma Physics Laboratory
Direct awards from DOE lab - see also pass through detailDepartment of Energy (non-specific) 81.000 135,843Y 135,843
135,843 135,843- Agency TotalsPrinceton Plasma Physics Laboratory
Sandia National Lab
Direct awards from DOE lab - see also pass through detailDepartment of Energy (non-specific) 81.000 1,862,017Y 1,862,017
1,862,017 1,862,017- Agency TotalsSandia National Lab
US Department of Energy (DOE)
Direct AwardsDepartment of Energy (non-specific) 81.000 1,621,994Y 53,1031,621,994
Office of Science Financial Assistance Program 81.049 26,548,016 1,381,126Y 5,625,72427,929,142
University Coal Research 81.057 6,915Y 6,9146,915
Conservation Research and Development 81.086 615,434Y 615,434
Renewable Energy Research and Development 81.087 568,095 498,062Y 411,4101,066,157
Fossil Energy Research and Development 81.089 8,549,177Y 5,211,8378,549,177
Stewardship Science Grant Program 81.112 153,617Y 153,617
Energy Efficiency and Renewable Energy Information Dissemination, Outreach, Training and Technical Analysis/Assistance
81.117 1,016,649Y 19,7721,016,649
Nuclear Energy Research, Development and Demonstration 81.121 915,486 115,210Y 85,0061,030,696
1R&DUS Department of Energy (DOE) FY19 SEFA
Cluster:Major Agency: Page 77

Cluster/Major Agency/Fed Agency/ Award Type/CFDA Prog Title or Award Title CFDA No. Urbana Chicago Springfield Total Fed ExpMaj Prog Total Subs Out Exp
Predictive Science Academic Alliance Program 81.124 4,107,043Y 195,1914,107,043
Advanced Research Projects Agency - Energy 81.135 53,974 312,943Y 366,917
State Heating Oil and Propane Program 81.138 265Y 265
Pass through from Others - see also pass through detailDepartment of Energy (non-specific) 81.000 2,094,258Y 109,8242,094,258
Environmental Monitoring, Independent Research, Technical Analysis 81.005 5,153Y 5,153
State Energy Program 81.041 10,130Y 10,130
Priorities and Allocations for Energy Programs and 81.048 41,532Y 41,532
Office of Science Financial Assistance Program 81.049 963,576 68,281Y 1,031,857
Conservation Research and Development 81.086 326,660Y 326,660
Renewable Energy Research and Development 81.087 167,245 6,346Y 173,591
Fossil Energy Research and Development 81.089 80,366Y 80,366
Stewardship Science Grant Program 81.112 168,419Y 168,419
Defense Nuclear Nonproliferation Research 81.113 471,026Y 471,026
Nuclear Energy Research, Development and Demonstration 81.121 335,200Y 335,200
Electricity Delivery and Energy Reliability, Research, Development and Analysis
81.122 1,305Y 1,305
Predictive Science Academic Alliance Program 81.124 22,635Y 22,635
Advanced Research Projects Agency - Energy 81.135 737,826 98,403Y 836,229
48,549,799 3,512,568 52,062,367- Agency Totals 11,718,781US Department of Energy (DOE)
US Department of Homeland Security(USDHS)FFederal Emergency Management Agency (FEMA)
Direct AwardsFederal Emergency Management Agency (non-specific) 83.000 5,874Y 5,874
Pass through from Others - see also pass through detail
1R&DUS Department of Homeland Security(USDHS) FY19 SEFA
Cluster:Major Agency: Page 78
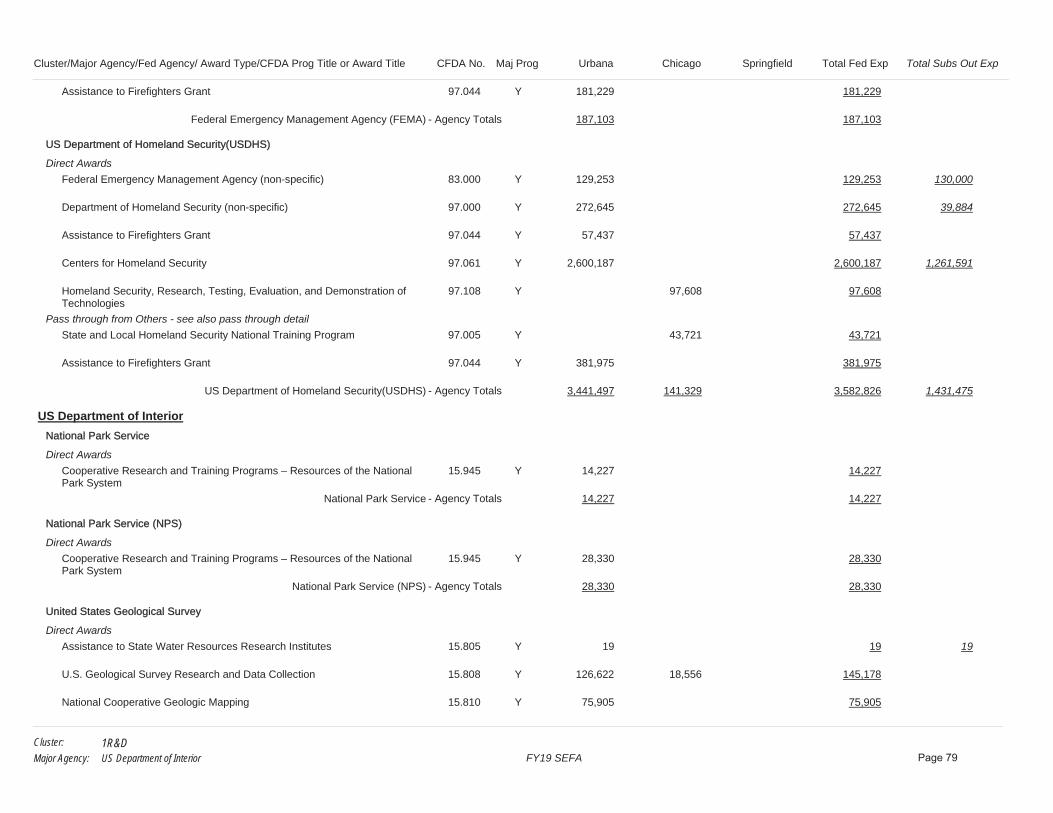
Cluster/Major Agency/Fed Agency/ Award Type/CFDA Prog Title or Award Title CFDA No. Urbana Chicago Springfield Total Fed ExpMaj Prog Total Subs Out Exp
Assistance to Firefighters Grant 97.044 181,229Y 181,229
187,103 187,103- Agency TotalsFederal Emergency Management Agency (FEMA)
UUS Department of Homeland Security(USDHS)
Direct AwardsFederal Emergency Management Agency (non-specific) 83.000 129,253Y 130,000129,253
Department of Homeland Security (non-specific) 97.000 272,645Y 39,884272,645
Assistance to Firefighters Grant 97.044 57,437Y 57,437
Centers for Homeland Security 97.061 2,600,187Y 1,261,5912,600,187
Homeland Security, Research, Testing, Evaluation, and Demonstration of Technologies
97.108 97,608Y 97,608
Pass through from Others - see also pass through detailState and Local Homeland Security National Training Program 97.005 43,721Y 43,721
Assistance to Firefighters Grant 97.044 381,975Y 381,975
3,441,497 141,329 3,582,826- Agency Totals 1,431,475US Department of Homeland Security(USDHS)
US Department of InteriorNational Park Service
Direct AwardsCooperative Research and Training Programs – Resources of the National Park System
15.945 14,227Y 14,227
14,227 14,227- Agency TotalsNational Park Service
National Park Service (NPS)
Direct AwardsCooperative Research and Training Programs – Resources of the National Park System
15.945 28,330Y 28,330
28,330 28,330- Agency TotalsNational Park Service (NPS)
United States Geological Survey
Direct AwardsAssistance to State Water Resources Research Institutes 15.805 19Y 1919
U.S. Geological Survey Research and Data Collection 15.808 126,622 18,556Y 145,178
National Cooperative Geologic Mapping 15.810 75,905Y 75,905
1R&DUS Department of Interior FY19 SEFA
Cluster:Major Agency: Page 79

Cluster/Major Agency/Fed Agency/ Award Type/CFDA Prog Title or Award Title CFDA No. Urbana Chicago Springfield Total Fed ExpMaj Prog Total Subs Out Exp
National Geospatial Program: Building The National Map 15.817 51,425Y 51,425
Upper Mississippi River Restoration Long Term Resource Monitoring 15.978 974,077Y 974,077
Pass through from Others - see also pass through detailCooperative Research Units 15.812 6,392Y 6,392
1,234,440 18,556 1,252,996- Agency Totals 19United States Geological Survey
UUS Department of Interior
Direct AwardsU.S. Geological Survey Research and Data Collection 15.808 422,930Y 422,930
National Cooperative Geologic Mapping 15.810 84,492Y 84,492
Pass through from Others - see also pass through detailDepartment of the Interior (non-specific) 15.000 23,000Y 23,000
Wildlife Restoration and Basic Hunter Education 15.611 8,511Y 8,511
Cooperative Endangered Species Conservation Fund 15.615 11,325Y 11,325
State Wildlife Grants 15.634 26,670Y 26,670
Great Lakes Restoration 15.662 102Y 102
Fish and Wildlife Coordination and Assistance 15.664 19,720Y 1,99119,720
Pass through from State of IL - see also pass through detailWildlife Restoration and Basic Hunter Education 15.611 172,856Y 172,856
State Wildlife Grants 15.634 2,472Y 2,472
579,400 19,822 172,856 772,078- Agency Totals 1,991US Department of Interior
US Fish & Wildlife
Direct AwardsDepartment of the Interior (non-specific) 15.000 74,640Y 74,640
Fish and Wildlife Management Assistance 15.608 8,799Y 5208,799
Rhinoceros and Tiger Conservation Fund 15.619 6,287Y 6,287
1R&DUS Department of Interior FY19 SEFA
Cluster:Major Agency: Page 80

Cluster/Major Agency/Fed Agency/ Award Type/CFDA Prog Title or Award Title CFDA No. Urbana Chicago Springfield Total Fed ExpMaj Prog Total Subs Out Exp
African Elephant Conservation Fund 15.620 5,886Y 5,886
Migratory Bird Conservation 15.647 27,269Y 1,17027,269
Pass through from Others - see also pass through detailCooperative Ecosystem Studies Units 15.678 10,521Y 10,521
Pass through from State of IL - see also pass through detailSport Fish Restoration 15.605 1,789,713Y 1,789,713
Wildlife Restoration and Basic Hunter Education 15.611 2,463,332Y 28,5672,463,332
State Wildlife Grants 15.634 779,871 100,584Y 880,455
Great Lakes Restoration 15.662 1,093,852Y 76,6941,093,852
6,260,170 100,584 6,360,754- Agency Totals 106,951US Fish & Wildlife
US Department of Justice (DOJ)NNational Institute of Justice
Direct AwardsNational Institute of Justice Research, Evaluation, and Development Project Grants
16.560 46,399 427,451Y 68,189473,850
National Institute of Justice W.E.B. DuBois Fellowship Program 16.566 15,416Y 3,48715,416
61,815 427,451 489,266- Agency Totals 71,676National Institute of Justice
US Department of Justice (DOJ)
Direct AwardsNational Institute of Justice Research, Evaluation, and Development Project Grants
16.560 55,004 105,847Y 160,851
Postconviction Testing of DNA Evidence 16.820 282,599Y 282,599
Pass through from Others - see also pass through detailDepartment of Justice (non-specific) 16.000 245,512Y 245,512
National Institute of Justice Research, Evaluation, and Development Project Grants
16.560 13,562 43,557Y 11,18057,119
Edward Byrne Memorial Justice Assistance Grant Program 16.738 48,540Y 48,540
68,566 443,456 282,599 794,621- Agency Totals 11,180US Department of Justice (DOJ)
US Department of Labor (DOL)
1R&DUS Department of Labor (DOL) FY19 SEFA
Cluster:Major Agency: Page 81

Cluster/Major Agency/Fed Agency/ Award Type/CFDA Prog Title or Award Title CFDA No. Urbana Chicago Springfield Total Fed ExpMaj Prog Total Subs Out Exp
MMgt & Training Corp-Chicago Job Corps
Direct AwardsDepartment of Labor (non-specific) 17.000 40,140Y 40,140
40,140 40,140- Agency TotalsMgt & Training Corp-Chicago Job Corps
US Department of Labor (DOL)
Pass through from Others - see also pass through detailH-1B Job Training Grants 17.268 29,826Y 29,826
Pass through from State of IL - see also pass through detailWIOA Adult Program 17.258 1,780Y 1,780
WIOA Youth Activities 17.259 1,892Y 1,892
WIOA Dislocated Worker Formula Grants 17.278 2,784Y 2,784
6,456 29,826 36,282- Agency TotalsUS Department of Labor (DOL)
US Department of Transportation (DOT)Federal Aviation Administration (FAA)
Direct AwardsDepartment of Transportation (non-specific) 20.000 77,281Y 77,281
Aviation Research Grants 20.108 1,325Y 1,325
Air Transportation Centers of Excellence 20.109 190,462Y 4,531190,462
269,068 269,068- Agency Totals 4,531Federal Aviation Administration (FAA)
Federal Highway Administration (FHWA)
Direct AwardsHighway Training and Education 20.215 89,501 5,905Y 95,406
99 Other - FHA 693JJ319P000035 99.999 3,150Y 3,150
Pass through from Others - see also pass through detailDepartment of Transportation (non-specific) 20.000 -181Y -181
Highway Research and Development Program 20.200 16,371Y 16,371
Pass through from State of IL - see also pass through detail
1R&DUS Department of Transportation (DOT) FY19 SEFA
Cluster:Major Agency: Page 82

Cluster/Major Agency/Fed Agency/ Award Type/CFDA Prog Title or Award Title CFDA No. Urbana Chicago Springfield Total Fed ExpMaj Prog Total Subs Out Exp
Highway Planning and Construction 20.205 -1Y -1
105,872 8,873 114,745- Agency TotalsFederal Highway Administration (FHWA)
FFederal Railroad Administration
Direct AwardsDepartment of Transportation (non-specific) 20.000 317,302Y 317,302
Pass through from Others - see also pass through detailDepartment of Transportation (non-specific) 20.000 131,600Y 131,600
448,902 448,902- Agency TotalsFederal Railroad Administration
TRB/IDEA Program Office
Direct AwardsRailroad Research and Development 20.313 70,218Y 70,218
70,218 70,218- Agency TotalsTRB/IDEA Program Office
US Department of Transportation (DOT)
Direct AwardsDepartment of Transportation (non-specific) 20.000 488,745Y 488,745
Highway Training and Education 20.215 2,875Y 2,875
University Transportation Centers Program 20.701 522,715 3,547Y 135,708526,262
Pass through from Others - see also pass through detailDepartment of Transportation (non-specific) 20.000 683,558 76,872Y 760,430
Highway Research and Development Program 20.200 16,389Y 16,389
Railroad Research and Development 20.313 18,171Y 18,171
Public Transportation Research, Technical Assistance, and Training 20.514 175,005Y 175,005
University Transportation Centers Program 20.701 36,549 45,235Y 36,47881,784
Pass through from State of IL - see also pass through detailHighway Planning and Construction 20.205 2,785,267 455,475Y 954,7833,240,742
Metropolitan Transportation Planning and State and Non-Metropolitan Planning and Research
20.505 2,601Y 2,601
1R&DUS Department of Transportation (DOT) FY19 SEFA
Cluster:Major Agency: Page 83

Cluster/Major Agency/Fed Agency/ Award Type/CFDA Prog Title or Award Title CFDA No. Urbana Chicago Springfield Total Fed ExpMaj Prog Total Subs Out Exp
State and Community Highway Safety 20.600 486,875Y 486,875
4,551,394 761,610 486,875 5,799,879- Agency Totals 1,126,969US Department of Transportation (DOT)
US Environmental Protection Agency (EPA)UUS Environmental Protection Agency (EPA)
Direct AwardsScience To Achieve Results (STAR) Research Program 66.509 972,603Y 96,937972,603
Pass through from Others - see also pass through detailSurveys, Studies, Investigations, Demonstrations, and Training Grants and Cooperative Agreements - Section 104(b)(3) of the Clean Water Act
66.436 2,261Y 2,261
Science To Achieve Results (STAR) Research Program 66.509 59,451 24,190Y 83,641
Research, Development, Monitoring, Public Education, Outreach, Training, Demonstrations, and Studies
66.716 8,448Y 7,7508,448
Pass through from State of IL - see also pass through detailState Indoor Radon Grants 66.032 16,926Y 16,926
Water Pollution Control State, Interstate, and Tribal Program Support 66.419 35,070Y 35,070
Water Quality Management Planning 66.454 13,035Y 13,035
Nonpoint Source Implementation Grants 66.460 1,223Y 1,223
Great Lakes Program 66.469 46,028Y 46,028
Performance Partnership Grants 66.605 13,557Y 13,557
1,160,154 32,638 1,192,792- Agency Totals 104,687US Environmental Protection Agency (EPA)
US Health & Human Services (HHS)Administration for Children and Families (ACF)
Direct AwardsChild Care and Development Block Grant 93.575 14,272Y 14,272
Pass through from Others - see also pass through detailAdoption Opportunities 93.652 81,259Y 81,259
Foster Care Title IV-E 93.658 -1Y -1
Pass through from State of IL - see also pass through detail
1R&DUS Health & Human Services (HHS) FY19 SEFA
Cluster:Major Agency: Page 84

Cluster/Major Agency/Fed Agency/ Award Type/CFDA Prog Title or Award Title CFDA No. Urbana Chicago Springfield Total Fed ExpMaj Prog Total Subs Out Exp
Social Services Block Grant 93.667 32,496Y 32,496
14,271 113,755 128,026- Agency TotalsAdministration for Children and Families (ACF)
AAdministration for Community Living
Direct AwardsACL National Institute on Disability, Independent Living, and Rehabilitation Research
93.433 2,273,781Y 788,5052,273,781
University Centers for Excellence in Developmental Disabilities Education, Research, and Service
93.632 567,937Y 567,937
Empowering Older Adults and Adults with Disabilities through Chronic Disease Self-Management Education Programs – financed by Prevention
93.734 174,081Y 174,081
Pass through from Others - see also pass through detailACL National Institute on Disability, Independent Living, and Rehabilitation Research
93.433 475,989Y 23,302475,989
3,491,788 3,491,788- Agency Totals 811,807Administration for Community Living
Agency for Healthcare Research and Quality (AHRQ)
Direct AwardsResearch on Healthcare Costs, Quality and Outcomes 93.226 1,400,271Y 423,9761,400,271
Pass through from Others - see also pass through detailResearch on Healthcare Costs, Quality and Outcomes 93.226 261,372Y 261,372
1,661,643 1,661,643- Agency Totals 423,976Agency for Healthcare Research and Quality (AHRQ)
Centers for Disease Control and Prevention (CDC)
Direct AwardsDepartment of Health and Human Services (non-specific) 93.000 238,449Y 238,449
Prevention of Disease, Disability, and Death by Infectious Diseases 93.084 235,085Y 138,906235,085
Centers for Research and Demonstration for Health Promotion and Disease Prevention
93.135 15,885Y 15,885
Occupational Safety and Health Program 93.262 319,797Y 319,797
Health Promotion and Disease Prevention Research Centers: PPHF - Affordable Care Act Projects
93.542 1,282,914Y 1,282,914
Ebola Support: Transmission and Prevention Control, Public Health Preparedness, Vaccine Development
93.823 261,925Y 261,925
Pass through from Others - see also pass through detailDepartment of Health and Human Services (non-specific) 93.000 48,005Y 48,005
1R&DUS Health & Human Services (HHS) FY19 SEFA
Cluster:Major Agency: Page 85

Cluster/Major Agency/Fed Agency/ Award Type/CFDA Prog Title or Award Title CFDA No. Urbana Chicago Springfield Total Fed ExpMaj Prog Total Subs Out Exp
Prevention of Disease, Disability, and Death by Infectious Diseases 93.084 91,995Y 91,995
Injury Prevention and Control Research and State and Community Based Programs
93.136 102,419Y 102,419
Disabilities Prevention 93.184 73,276Y 73,276
Centers for Disease Control and Prevention Investigations and Technical Assistance
93.283 -67,120Y -67,120
NON-ACA/PPHF—Building Capacity of the Public Health System to Improve Population Health through National Nonprofit Organizations
93.424 -1,848Y -1,848
HIV Prevention Activities Health Department Based 93.940 26,500Y 26,500
HIV Demonstration, Research, Public and Professional Education Projects 93.941 714Y 714
Human Immunodeficiency Virus (HIV)/Acquired Immunodeficiency Virus Syndrome (AIDS) Surveillance
93.944 225,003Y 225,003
Sexually Transmitted Diseases (STD) Prevention and Control Grants 93.977 84,788Y 84,788
Pass through from State of IL - see also pass through detailCenters for Disease Control and Prevention Investigations and Technical Assistance
93.283 16,242Y 16,242
Epidemiology and Laboratory Capacity for Infectious Diseases (ELC) 93.323 -2Y -2
Cancer Prevention and Control Programs for State, Territorial and Tribal Organizations
93.898 87,992Y 87,992
-2 3,042,021 3,042,019- Agency Totals 138,906Centers for Disease Control and Prevention (CDC)
FFood and Drug Administration (FDA)
Direct AwardsFood and Drug Administration Research 93.103 107,255Y 107,255
Pass through from Others - see also pass through detailFood and Drug Administration Research 93.103 15,355 175,188Y 67,001190,543
122,610 175,188 297,798- Agency Totals 67,001Food and Drug Administration (FDA)
Health Resources and Services Administration (HRSA)
Direct AwardsMaternal and Child Health Federal Consolidated Programs 93.110 990,484Y 22,356990,484
Substance Abuse and Mental Health Services Projects of Regional and National Significance
93.243 -1,141Y -1,141
Nurse Education, Practice Quality and Retention Grants 93.359 425,576Y 425,576
1R&DUS Health & Human Services (HHS) FY19 SEFA
Cluster:Major Agency: Page 86

Cluster/Major Agency/Fed Agency/ Award Type/CFDA Prog Title or Award Title CFDA No. Urbana Chicago Springfield Total Fed ExpMaj Prog Total Subs Out Exp
Grants for School-Based Health Center Capital Expenditures 93.501 29,462Y 29,462
Mental and Behavioral Health Education and Training Grants 93.732 493,578Y 493,578
Grants for Primary Care Training and Enhancement 93.884 446,392Y 446,392
Ryan White HIV/AIDS Dental Reimbursement and Community Based Dental Partnership Grants
93.924 227,829Y 101,192227,829
Pass through from Others - see also pass through detailMaternal and Child Health Federal Consolidated Programs 93.110 245,774Y 245,774
Grants for Primary Care Training and Enhancement 93.884 99,217Y 99,217
2,957,171 2,957,171- Agency Totals 123,548Health Resources and Services Administration (HRSA)
HHHS Office of the Director
Direct AwardsTrans-NIH Research Support 93.310 -51Y -51
-51 -51- Agency TotalsHHS Office of the Director
HRSA/BHPR/DADPHP (Health Resources and Services)
Pass through from Others - see also pass through detailNational Organizations of State and Local Officials 93.011 40,000Y 40,000
Sickle Cell Treatment Demonstration Program 93.365 39,765Y 39,765
79,765 79,765- Agency TotalsHRSA/BHPR/DADPHP (Health Resources and Services)
National Center for HIV STD and TB Prevention
Direct AwardsSexually Transmitted Diseases (STD) Provider Education Grants 93.978 438,557Y 12,181438,557
438,557 438,557- Agency Totals 12,181National Center for HIV STD and TB Prevention
National Center for Infectious Diseases
Pass through from Others - see also pass through detailAllergy and Infectious Diseases Research 93.855 24,066Y 24,066
24,066 24,066- Agency TotalsNational Center for Infectious Diseases
National Institute for Occupational Safety & Health
Direct Awards
1R&DUS Health & Human Services (HHS) FY19 SEFA
Cluster:Major Agency: Page 87

Cluster/Major Agency/Fed Agency/ Award Type/CFDA Prog Title or Award Title CFDA No. Urbana Chicago Springfield Total Fed ExpMaj Prog Total Subs Out Exp
Occupational Safety and Health Program 93.262 97,554 2,274,688Y 26,4072,372,242
97,554 2,274,688 2,372,242- Agency Totals 26,407National Institute for Occupational Safety & Health
NNatl Center for Chronic Disease Prev & Health Promotion
Pass through from Others - see also pass through detailCenters for Research and Demonstration for Health Promotion and Disease Prevention
93.135 26,953Y 26,953
26,953 26,953- Agency TotalsNatl Center for Chronic Disease Prev & Health Promotion
NIH / Center for Scientific Review
Direct AwardsBiomedical Research and Research Training 93.859 524,003Y 524,003
524,003 524,003- Agency TotalsNIH / Center for Scientific Review
NIH / John E Fogarty International Center
Direct AwardsCancer Research Manpower 93.398 179,667Y 179,667
International Research and Research Training 93.989 381,320Y 89,642381,320
560,987 560,987- Agency Totals 89,642NIH / John E Fogarty International Center
NIH / National Cancer Institute
Direct AwardsDepartment of Health and Human Services (non-specific) 93.000 765,908Y 765,908
Family Smoking Prevention and Tobacco Control Act Regulatory Research 93.077 800,550Y 51,909800,550
Cancer Cause and Prevention Research 93.393 447,013 437,349Y 319,960884,362
Cancer Detection and Diagnosis Research 93.394 2,672,233 911,959Y 555,1623,584,192
Cancer Treatment Research 93.395 1,489,953 1,259,457Y 380,7582,749,410
Cancer Biology Research 93.396 587,406 4,653,339Y 357,0675,240,745
Cancer Centers Support Grants 93.397 6,192 1,597,676Y 67,1691,603,868
Cancer Research Manpower 93.398 88,798 923,103Y 15,3711,011,901
Cancer Control 93.399 158,163Y 71,651158,163
1R&DUS Health & Human Services (HHS) FY19 SEFA
Cluster:Major Agency: Page 88

Cluster/Major Agency/Fed Agency/ Award Type/CFDA Prog Title or Award Title CFDA No. Urbana Chicago Springfield Total Fed ExpMaj Prog Total Subs Out Exp
Biological Basis Research in the Neurosciences 93.854 4,614Y 4,614
Biomedical Research and Research Training 93.859 120,576Y 1,644120,576
Pass through from Others - see also pass through detailDepartment of Health and Human Services (non-specific) 93.000 18,440Y 18,440
Trans-NIH Research Support 93.310 -19,109Y -19,109
National Institutes of Health Pediatric Research Loan Repayment Program (B)
93.385 366Y 366
Cancer Cause and Prevention Research 93.393 299,981Y 299,981
Cancer Treatment Research 93.395 86,305 630,313Y 12,500716,618
Cancer Biology Research 93.396 25,695Y 25,695
Cancer Centers Support Grants 93.397 87,899Y 87,899
5,516,916 12,537,263 18,054,179- Agency Totals 1,833,191NIH / National Cancer Institute
NNIH / National Center for Advancing Translational Sciences
Direct AwardsNational Center for Advancing Translational Sciences 93.350 4,799,474Y 53,0604,799,474
Pass through from Others - see also pass through detailNational Center for Advancing Translational Sciences 93.350 135,399Y 135,399
4,934,873 4,934,873- Agency Totals 53,060NIH / National Center for Advancing Translational Sciences
NIH / National Center for Complementary & Integrative Health
Direct AwardsResearch and Training in Complementary and Integrative Health 93.213 1,611 3,599,965Y 499,3183,601,576
1,611 3,599,965 3,601,576- Agency Totals 499,318NIH / National Center for Complementary & Integrative Health
NIH / National Eye Institute
Direct AwardsVision Research 93.867 682,225 6,394,430Y 378,2967,076,655
Pass through from Others - see also pass through detailVision Research 93.867 15,336Y 15,336
1R&DUS Health & Human Services (HHS) FY19 SEFA
Cluster:Major Agency: Page 89

Cluster/Major Agency/Fed Agency/ Award Type/CFDA Prog Title or Award Title CFDA No. Urbana Chicago Springfield Total Fed ExpMaj Prog Total Subs Out Exp
682,225 6,409,766 7,091,991- Agency Totals 378,296NIH / National Eye Institute
NNIH / National Heart Lung & Blood Institute
Direct AwardsDepartment of Health and Human Services (non-specific) 93.000 1,870,568Y 150,9041,870,568
Cancer Cause and Prevention Research 93.393 228,948Y 8,954228,948
Cardiovascular Diseases Research 93.837 759,847 10,531,020Y 951,68011,290,867
Lung Diseases Research 93.838 178,831 12,198,439Y 705,41012,377,270
Blood Diseases and Resources Research 93.839 857,474 5,787,588Y 1,119,2476,645,062
Pass through from Others - see also pass through detailDepartment of Health and Human Services (non-specific) 93.000 24,054Y 24,054
Utah Sub 1005178301 93.000 6,917Y 6,917
Cardiovascular Diseases Research 93.837 98,945Y 98,945
Lung Diseases Research 93.838 46,102 295,398Y 341,500
Blood Diseases and Resources Research 93.839 112,811Y 112,811
1,842,254 31,154,688 32,996,942- Agency Totals 2,936,195NIH / National Heart Lung & Blood Institute
NIH / National Human Genome Research Institute
Direct AwardsHuman Genome Research 93.172 317,914Y 285,979317,914
Pass through from Others - see also pass through detailHuman Genome Research 93.172 189,994Y 189,994
507,908 507,908- Agency Totals 285,979NIH / National Human Genome Research Institute
NIH / National Inst of Arthritis & Musculoskeletal & Skin Diseases
Direct AwardsArthritis, Musculoskeletal and Skin Diseases Research 93.846 1,167,263 1,099,923Y 38,3522,267,186
International Research and Research Training 93.989 144,759Y 54,810144,759
Pass through from Others - see also pass through detail
1R&DUS Health & Human Services (HHS) FY19 SEFA
Cluster:Major Agency: Page 90

Cluster/Major Agency/Fed Agency/ Award Type/CFDA Prog Title or Award Title CFDA No. Urbana Chicago Springfield Total Fed ExpMaj Prog Total Subs Out Exp
Arthritis, Musculoskeletal and Skin Diseases Research 93.846 125,066Y 125,066
1,167,263 1,369,748 2,537,011- Agency Totals 93,162NIH / National Inst of Arthritis & Musculoskeletal & Skin Diseases
NNIH / National Inst on Deafness & Other Communication Disorders
Direct AwardsResearch Related to Deafness and Communication Disorders 93.173 434,490 515,514Y 950,004
Pass through from Others - see also pass through detailResearch Related to Deafness and Communication Disorders 93.173 125,487 154,008Y 279,495
559,977 669,522 1,229,499- Agency TotalsNIH / National Inst on Deafness & Other Communication Disorders
NIH / National Institute of Allergy & Infectious Diseases
Direct AwardsEnvironmental Health 93.113 59,716Y 59,716
Allergy and Infectious Diseases Research 93.855 5,132,801 6,782,764Y 584,53811,915,565
Microbiology and Infectious Diseases Research 93.856 15,036 376,997Y 1,340392,033
Pass through from Others - see also pass through detailDepartment of Health and Human Services (non-specific) 93.000 70,965Y 70,965
NIH Sub GS 00387534 ANTIC 93.000 4,425Y 4,425
Allergy and Infectious Diseases Research 93.855 34,296 1,649,770Y 1,684,066
Biomedical Research and Research Training 93.859 78,686Y 78,686
5,257,523 8,947,933 14,205,456- Agency Totals 585,878NIH / National Institute of Allergy & Infectious Diseases
NIH / National Institute of Biomedical Imaging & Bioengineering
Direct AwardsDiscovery and Applied Research for Technological Innovations to Improve Human Health
93.286 4,004,281 1,368,408Y 700,4135,372,689
Trans-NIH Research Support 93.310 328,376Y 328,376
Child Health and Human Development Extramural Research 93.865 90,932 430,681Y 521,613
Pass through from Others - see also pass through detailDiscovery and Applied Research for Technological Innovations to Improve Human Health
93.286 115,561Y 115,561
1R&DUS Health & Human Services (HHS) FY19 SEFA
Cluster:Major Agency: Page 91

Cluster/Major Agency/Fed Agency/ Award Type/CFDA Prog Title or Award Title CFDA No. Urbana Chicago Springfield Total Fed ExpMaj Prog Total Subs Out Exp
4,539,150 1,799,089 6,338,239- Agency Totals 700,413NIH / National Institute of Biomedical Imaging & Bioengineering
NNIH / National Institute of Child Health & Human Development
Direct AwardsMental Health Research Grants 93.242 177,341Y 177,341
Child Health and Human Development Extramural Research 93.865 2,048,775 3,279,571Y 877,7365,328,346
Pass through from Others - see also pass through detailChild Health and Human Development Extramural Research 93.865 35,353 458,194Y 493,547
2,084,128 3,915,106 5,999,234- Agency Totals 877,736NIH / National Institute of Child Health & Human Development
NIH / National Institute of Dental & Craniofacial Research
Direct AwardsEnvironmental Health 93.113 148,376Y 64,872148,376
Oral Diseases and Disorders Research 93.121 494,341 3,403,935Y 11,7253,898,276
Pass through from Others - see also pass through detailOral Diseases and Disorders Research 93.121 125,642Y 125,642
494,341 3,677,953 4,172,294- Agency Totals 76,597NIH / National Institute of Dental & Craniofacial Research
NIH / National Institute of Diabetes & Digestive & Kidney Diseases
Direct AwardsTrans-NIH Research Support 93.310 1,713,391Y 1,051,1131,713,391
Diabetes, Digestive, and Kidney Diseases Extramural Research 93.847 3,309,744 9,114,619Y 733,24712,424,363
Biomedical Research and Research Training 93.859 253,731Y 253,731
Pass through from Others - see also pass through detailNursing Research 93.361 39,781Y 39,781
Diabetes, Digestive, and Kidney Diseases Extramural Research 93.847 14,319 675,453Y 689,772
5,037,454 10,083,584 15,121,038- Agency Totals 1,784,360NIH / National Institute of Diabetes & Digestive & Kidney Diseases
NIH / National Institute of Environmental & Health Sciences
Direct AwardsEnvironmental Health 93.113 1,725,372 3,461,791Y 1,174,8065,187,163
Pass through from Others - see also pass through detail
1R&DUS Health & Human Services (HHS) FY19 SEFA
Cluster:Major Agency: Page 92

Cluster/Major Agency/Fed Agency/ Award Type/CFDA Prog Title or Award Title CFDA No. Urbana Chicago Springfield Total Fed ExpMaj Prog Total Subs Out Exp
Environmental Health 93.113 855,274Y 855,274
NIEHS Superfund Hazardous Substances_Basic Research and Education 93.143 4,976Y 4,976
1,725,372 4,322,041 6,047,413- Agency Totals 1,174,806NIH / National Institute of Environmental & Health Sciences
NNIH / National Institute of General Medical Sciences
Direct AwardsTrans-NIH Research Support 93.310 914,300Y 282,214914,300
Biomedical Research and Research Training 93.859 21,216,962 7,795,569Y 2,299,32629,012,531
Child Health and Human Development Extramural Research 93.865 38,156Y 38,156
Pass through from Others - see also pass through detailBiomedical Research and Research Training 93.859 331,756 26,295Y 358,051
22,463,018 7,860,020 30,323,038- Agency Totals 2,581,540NIH / National Institute of General Medical Sciences
NIH / National Institute of Mental Health
Direct AwardsMental Health Research Grants 93.242 1,343,004 4,700,961Y 588,0606,043,965
Biomedical Research and Research Training 93.859 496,948Y 496,948
Pass through from Others - see also pass through detailMental Health Research Grants 93.242 480,585Y 480,585
Research, Prevention, and Education Programs on Lyme Disease in the United States
93.942 20,704Y 20,704
1,839,952 5,202,250 7,042,202- Agency Totals 588,060NIH / National Institute of Mental Health
NIH / National Institute of Neurological Disorders & Stroke
Direct AwardsDiabetes, Digestive, and Kidney Diseases Extramural Research 93.847 134,620Y 50,000134,620
Extramural Research Programs in the Neurosciences and Neurological Disorders
93.853 4,071,604 1,152,544Y 50,4935,224,148
Aging Research 93.866 90,486Y 90,486
Pass through from Others - see also pass through detailExtramural Research Programs in the Neurosciences and Neurological Disorders
93.853 488,674 180,249Y 668,923
1R&DUS Health & Human Services (HHS) FY19 SEFA
Cluster:Major Agency: Page 93

Cluster/Major Agency/Fed Agency/ Award Type/CFDA Prog Title or Award Title CFDA No. Urbana Chicago Springfield Total Fed ExpMaj Prog Total Subs Out Exp
4,560,278 1,557,899 6,118,177- Agency Totals 100,493NIH / National Institute of Neurological Disorders & Stroke
NNIH / National Institute of Nursing Research
Direct AwardsNursing Research 93.361 1,765,268Y 491,0071,765,268
Pass through from Others - see also pass through detailNursing Research 93.361 126,283Y 126,283
1,891,551 1,891,551- Agency Totals 491,007NIH / National Institute of Nursing Research
NIH / National Institute on Aging
Direct AwardsAging Research 93.866 1,617,209 5,474,624Y 149,7577,091,833
Pass through from Others - see also pass through detailAging Research 93.866 173,034 381,929Y 554,963
1,790,243 5,856,553 7,646,796- Agency Totals 149,757NIH / National Institute on Aging
NIH / National Institute on Alcohol Abuse & Alcoholism
Direct AwardsAlcohol Research Programs 93.273 507,661 5,472,861Y 618,8545,980,522
Child Health and Human Development Extramural Research 93.865 190,065Y 190,065
Pass through from Others - see also pass through detailAlcohol Research Programs 93.273 96,670Y 96,670
507,661 5,759,596 6,267,257- Agency Totals 618,854NIH / National Institute on Alcohol Abuse & Alcoholism
NIH / National Institute on Drug Abuse
Direct AwardsDrug Abuse and Addiction Research Programs 93.279 978,371 2,230,923Y 259,9013,209,294
Pass through from Others - see also pass through detailDepartment of Health and Human Services (non-specific) 93.000 58,500Y 58,500
Family Smoking Prevention and Tobacco Control Act Regulatory Research 93.077 331,713Y 99,628331,713
Drug Abuse and Addiction Research Programs 93.279 352,149Y 352,149
978,371 2,973,285 3,951,656- Agency Totals 359,529NIH / National Institute on Drug Abuse
1R&DUS Health & Human Services (HHS) FY19 SEFA
Cluster:Major Agency: Page 94

Cluster/Major Agency/Fed Agency/ Award Type/CFDA Prog Title or Award Title CFDA No. Urbana Chicago Springfield Total Fed ExpMaj Prog Total Subs Out Exp
NNIH / National Institute on Minority Health & Health Disparities
Direct AwardsMinority Health and Health Disparities Research 93.307 884,385 2,330,761Y 692,3243,215,146
Pass through from Others - see also pass through detailMinority Health and Health Disparities Research 93.307 48,057 432,022Y 480,079
932,442 2,762,783 3,695,225- Agency Totals 692,324NIH / National Institute on Minority Health & Health Disparities
NIH / National Institutes of Health
Direct AwardsDepartment of Health and Human Services (non-specific) 93.000 41,303Y 41,303
Environmental Health 93.113 113,747 48,339Y 162,086
Research and Training in Complementary and Integrative Health 93.213 55,751Y 55,751
Research on Healthcare Costs, Quality and Outcomes 93.226 12,340Y 12,340
Mental Health Research Grants 93.242 -2,486Y -10,022-2,486
Alcohol Research Programs 93.273 -65,619Y -65,619
Discovery and Applied Research for Technological Innovations to Improve Human Health
93.286 153,755Y 27,408153,755
Trans-NIH Research Support 93.310 861,022Y 750,125861,022
Research Infrastructure Programs 93.351 259,616 507,685Y 25,909767,301
Nursing Research 93.361 173,012Y 173,012
Cancer Cause and Prevention Research 93.393 151,045Y 151,045
Cancer Treatment Research 93.395 212,669 28,639Y 29,882241,308
Cancer Biology Research 93.396 281,752Y 281,752
Cancer Research Manpower 93.398 -14,616Y -14,616
Cardiovascular Diseases Research 93.837 273,225Y 115,156273,225
Lung Diseases Research 93.838 -23,417Y -23,417
1R&DUS Health & Human Services (HHS) FY19 SEFA
Cluster:Major Agency: Page 95

Cluster/Major Agency/Fed Agency/ Award Type/CFDA Prog Title or Award Title CFDA No. Urbana Chicago Springfield Total Fed ExpMaj Prog Total Subs Out Exp
Blood Diseases and Resources Research 93.839 139,394Y 139,394
Arthritis, Musculoskeletal and Skin Diseases Research 93.846 93,644Y 17,87393,644
Diabetes, Digestive, and Kidney Diseases Extramural Research 93.847 5,126Y 5,126
Extramural Research Programs in the Neurosciences and Neurological Disorders
93.853 623,430 1,011,373Y 332,5951,634,803
Allergy and Infectious Diseases Research 93.855 517,373Y 193,069517,373
Biomedical Research and Research Training 93.859 231,793Y 231,793
Child Health and Human Development Extramural Research 93.865 15,518 225,040Y 240,558
Vision Research 93.867 -17,990Y -17,990
International Research and Research Training 93.989 59,376Y 59,376
Pass through from Others - see also pass through detailDepartment of Health and Human Services (non-specific) 93.000 123,289Y 123,289
Prevention of Disease, Disability, and Death by Infectious Diseases 93.084 321,081Y 321,081
Food and Drug Administration Research 93.103 6,374Y 6,374
Environmental Health 93.113 10,952 32,082Y 43,034
Oral Diseases and Disorders Research 93.121 1,962Y 1,962
NIEHS Hazardous Waste Worker Health and Safety Training 93.142 133,983Y 133,983
Human Genome Research 93.172 416,196Y 416,196
Research Related to Deafness and Communication Disorders 93.173 185,578Y 185,578
Research and Training in Complementary and Integrative Health 93.213 9,890Y 9,890
Research on Healthcare Costs, Quality and Outcomes 93.226 4,338Y 4,338
Mental Health Research Grants 93.242 268,114 189,325Y 457,439
Alcohol Research Programs 93.273 41,097Y 41,097
Drug Abuse and Addiction Research Programs 93.279 129,779Y 129,779
1R&DUS Health & Human Services (HHS) FY19 SEFA
Cluster:Major Agency: Page 96

Cluster/Major Agency/Fed Agency/ Award Type/CFDA Prog Title or Award Title CFDA No. Urbana Chicago Springfield Total Fed ExpMaj Prog Total Subs Out Exp
Discovery and Applied Research for Technological Innovations to Improve Human Health
93.286 232,857 4,814Y 237,671
Minority Health and Health Disparities Research 93.307 5,842Y 5,842
Trans-NIH Research Support 93.310 55,543 4,104,904Y 52,7744,160,447
National Center for Advancing Translational Sciences 93.350 167,616Y 167,616
Research Infrastructure Programs 93.351 42,072Y 42,072
Nursing Research 93.361 40,857Y 40,857
Cancer Cause and Prevention Research 93.393 12,714 94,370Y 107,084
Cancer Detection and Diagnosis Research 93.394 117,740 31,420Y 149,160
Cancer Treatment Research 93.395 127,292 -134,708Y -7,416
Cancer Biology Research 93.396 15,930Y 15,930
Cancer Centers Support Grants 93.397 16,348Y 16,348
ACL National Institute on Disability, Independent Living, and Rehabilitation Research
93.433 90,445 49,985Y 140,430
Foster Care Title IV-E 93.658 193,633Y 193,633
Child Abuse and Neglect State Grants 93.669 71,410Y 71,410
Elder Abuse Prevention Interventions Program 93.747 54,795Y 54,795
Cardiovascular Diseases Research 93.837 210,124 309,457Y 519,581
Lung Diseases Research 93.838 926,341Y 926,341
Blood Diseases and Resources Research 93.839 59,348 261,164Y 320,512
Arthritis, Musculoskeletal and Skin Diseases Research 93.846 89,618Y 89,618
Diabetes, Digestive, and Kidney Diseases Extramural Research 93.847 323,521 307,143Y 630,664
Extramural Research Programs in the Neurosciences and Neurological Disorders
93.853 2,043 136,105Y 138,148
Allergy and Infectious Diseases Research 93.855 317,071 982,556Y 1,299,627
1R&DUS Health & Human Services (HHS) FY19 SEFA
Cluster:Major Agency: Page 97

Cluster/Major Agency/Fed Agency/ Award Type/CFDA Prog Title or Award Title CFDA No. Urbana Chicago Springfield Total Fed ExpMaj Prog Total Subs Out Exp
Microbiology and Infectious Diseases Research 93.856 14,512Y 14,512
National Collaboration to Support Health, Wellness and Academic Success of School-Age Children
93.858 41,395Y 41,395
Biomedical Research and Research Training 93.859 661,200 337,063Y 998,263
Child Health and Human Development Extramural Research 93.865 687,496 822,590Y 1,510,086
Aging Research 93.866 82,457 852,396Y 934,853
Vision Research 93.867 207,293Y 207,293
Medical Library Assistance 93.879 27,623Y 27,623
HIV Emergency Relief Project Grants 93.914 174,974Y 174,974
HIV Care Formula Grants 93.917 28,393Y 28,393
PPHF Geriatric Education Centers 93.969 20,535Y 20,535
International Research and Research Training 93.989 3,542Y 3,542
Pass through from State of IL - see also pass through detailDepartment of Health and Human Services (non-specific) 93.000 96,770Y 96,770
HIV Care Formula Grants 93.917 15,948Y 15,948
6,691,188 14,549,248 21,240,436- Agency Totals 1,534,769NIH / National Institutes of Health
NNIH / National Library of Medicine
Direct AwardsMedical Library Assistance 93.879 64,217 434,901Y 286,508499,118
Pass through from Others - see also pass through detailMedical Library Assistance 93.879 175,871Y 175,871
64,217 610,772 674,989- Agency Totals 286,508NIH / National Library of Medicine
NIH / Office of the Director of National Institute of Health
Direct AwardsTrans-NIH Research Support 93.310 1,113,983Y 718,3401,113,983
Research Infrastructure Programs 93.351 71,053 29,878Y 100,931
1R&DUS Health & Human Services (HHS) FY19 SEFA
Cluster:Major Agency: Page 98

Cluster/Major Agency/Fed Agency/ Award Type/CFDA Prog Title or Award Title CFDA No. Urbana Chicago Springfield Total Fed ExpMaj Prog Total Subs Out Exp
Biomedical Research and Research Training 93.859 56,779Y 56,779
Pass through from Others - see also pass through detailTrans-NIH Research Support 93.310 12,748Y 12,748
21st Century Cures Act - Precision Medicine Initiative 93.368 18,100Y 18,100
1,197,784 104,757 1,302,541- Agency Totals 718,340NIH / Office of the Director of National Institute of Health
SSubstance Abuse & Mental Health Services Admin (SAMHSA)
Direct AwardsSubstance Abuse and Mental Health Services Projects of Regional and National Significance
93.243 733,766Y 733,766
Pass through from Others - see also pass through detailSubstance Abuse and Mental Health Services Projects of Regional and National Significance
93.243 18,268Y 18,268
Substance Abuse and Mental Health Services-Access to Recovery 93.275 10,125Y 10,125
Opioid STR 93.788 24,239Y 24,239
Block Grants for Prevention and Treatment of Substance Abuse 93.959 44,002Y 44,002
Pass through from State of IL - see also pass through detailSubstance Abuse and Mental Health Services Projects of Regional and National Significance
93.243 142,570Y 142,570
972,970 972,970- Agency TotalsSubstance Abuse & Mental Health Services Admin (SAMHSA)
US Health & Human Services (HHS)
Direct AwardsDepartment of Health and Human Services (non-specific) 93.000 -13,477Y -13,477
Research on Healthcare Costs, Quality and Outcomes 93.226 357,497Y 59,787357,497
Biomedical Advanced Research and Development Authority (BARDA), Biodefense Medical Countermeasure Development
93.360 1,340,103Y 1,340,103
ACL National Institute on Disability, Independent Living, and Rehabilitation Research
93.433 1,121,341Y 93,8891,121,341
Pass through from Others - see also pass through detailDepartment of Health and Human Services (non-specific) 93.000 72,639Y 72,639
Substance Abuse and Mental Health Services Projects of Regional and National Significance
93.243 58,251Y 58,251
Alcohol Research Programs 93.273 32,865Y 32,865
1R&DUS Health & Human Services (HHS) FY19 SEFA
Cluster:Major Agency: Page 99

Cluster/Major Agency/Fed Agency/ Award Type/CFDA Prog Title or Award Title CFDA No. Urbana Chicago Springfield Total Fed ExpMaj Prog Total Subs Out Exp
Minority Health and Health Disparities Research 93.307 106,020Y 106,020
Trans-NIH Research Support 93.310 -176,315Y -176,315
National Center for Advancing Translational Sciences 93.350 49,590Y 49,590
Cancer Control 93.399 14,476Y 14,476
ACL National Institute on Disability, Independent Living, and Rehabilitation Research
93.433 25,046 110,236Y 135,282
Head Start 93.600 1,206Y 10,0001,206
Adoption Opportunities 93.652 103,799Y 103,799
Empowering Older Adults and Adults with Disabilities through Chronic Disease Self-Management Education Programs – financed by Prevention
93.734 -2,607 7,197Y 4,590
Elder Abuse Prevention Interventions Program 93.747 28,240Y 28,240
Cardiovascular Diseases Research 93.837 64,250Y 64,250
Lung Diseases Research 93.838 204,224Y 204,224
Arthritis, Musculoskeletal and Skin Diseases Research 93.846 108,152Y 108,152
Aging Research 93.866 78,997Y 78,997
Pass through from State of IL - see also pass through detailAffordable Care Act (ACA) Personal Responsibility Education Program 93.092 129,965Y 129,965
Family Planning Services 93.217 143,116Y 143,116
Substance Abuse and Mental Health Services Projects of Regional and National Significance
93.243 10Y 10
Developmental Disabilities Basic Support and Advocacy Grants 93.630 96,699Y 96,699
Maternal, Infant and Early Childhood Home Visiting Grant 93.870 475,049Y 475,049
Block Grants for Prevention and Treatment of Substance Abuse 93.959 498,842Y 498,842
1,126,295 3,909,116 5,035,411- Agency Totals 163,676US Health & Human Services (HHS)
US NASAAAmes Research Center
Direct Awards
1R&DUS NASA FY19 SEFA
Cluster:Major Agency: Page 100

Cluster/Major Agency/Fed Agency/ Award Type/CFDA Prog Title or Award Title CFDA No. Urbana Chicago Springfield Total Fed ExpMaj Prog Total Subs Out Exp
National Aeronautics and Space Administration (non-specific) 43.000 -930Y -930
-930 -930- Agency TotalsAmes Research Center
GGlenn Research Center at Lewis Field
Direct AwardsAeronautics 43.002 20,975Y 20,975
Space Operations 43.007 41,547Y 41,547
20,975 41,547 62,522- Agency TotalsGlenn Research Center at Lewis Field
Goddard Space Flight Center
Direct AwardsNational Aeronautics and Space Administration (non-specific) 43.000 -14,269Y -14,269
Science 43.001 4,205Y 4,205
-10,064 -10,064- Agency TotalsGoddard Space Flight Center
Jet Propulsion Laboratory
Direct AwardsNational Aeronautics and Space Administration (non-specific) 43.000 995,059Y 995,059
Science 43.001 144,885 45,663Y 190,548
1,139,944 45,663 1,185,607- Agency TotalsJet Propulsion Laboratory
Langley Research Center
Direct AwardsNational Aeronautics and Space Administration (non-specific) 43.000 -1,648Y -1,648
-1,648 -1,648- Agency TotalsLangley Research Center
NASA Headquarters
Direct AwardsAeronautics 43.002 119,801Y 119,801
Space Operations 43.007 427,011Y 159,397427,011
546,812 546,812- Agency Totals 159,397NASA Headquarters
NASA Shared Services Center
Direct Awards
1R&DUS NASA FY19 SEFA
Cluster:Major Agency: Page 101

Cluster/Major Agency/Fed Agency/ Award Type/CFDA Prog Title or Award Title CFDA No. Urbana Chicago Springfield Total Fed ExpMaj Prog Total Subs Out Exp
National Aeronautics and Space Administration (non-specific) 43.000 387,189Y 86,411387,189
Science 43.001 961,939 580,669Y 104,4601,542,608
Aeronautics 43.002 370,557Y 370,557
Education 43.008 709,085 28,417Y 474,679737,502
Space Technology 43.012 383,863Y 383,863
Pass through from Others - see also pass through detailNational Aeronautics and Space Administration (non-specific) 43.000 12,655Y 12,655
Science 43.001 -496Y -496
2,824,792 609,086 3,433,878- Agency Totals 665,550NASA Shared Services Center
UUS NASA
Direct AwardsNational Aeronautics and Space Administration (non-specific) 43.000 132,703 1,921Y 134,624
Science 43.001 1,304,426Y 62,9691,304,426
Aeronautics 43.002 377,013Y 377,013
Space Technology 43.012 500,579 113,318Y 25,314613,897
Pass through from Others - see also pass through detailNational Aeronautics and Space Administration (non-specific) 43.000 847,217 3,032 12,346Y 862,595
Science 43.001 298,620 54,904Y 353,524
Aeronautics 43.002 285,217Y 285,217
Education 43.008 58,750 9,167Y 67,917
Space Technology 43.012 120,269Y 120,269
3,924,794 182,342 12,346 4,119,482- Agency Totals 88,283US NASA
US National Endowment for the Humanities (NEH)US National Endowment for the Humanities (NEH)
Direct Awards
1R&DUS National Endowment for the Humanities (NEH) FY19 SEFA
Cluster:Major Agency: Page 102

Cluster/Major Agency/Fed Agency/ Award Type/CFDA Prog Title or Award Title CFDA No. Urbana Chicago Springfield Total Fed ExpMaj Prog Total Subs Out Exp
Promotion of the Humanities Research 45.161 19,155Y 19,155
Promotion of the Humanities Office of Digital Humanities 45.169 118,574Y 12,147118,574
137,729 137,729- Agency Totals 12,147US National Endowment for the Humanities (NEH)
US National Science Foundation (NSF)UUS National Science Foundation (NSF)
Direct AwardsNational Science Foundation (non-specific) 47.000 86,435 80,994Y 167,429
Engineering 47.041 15,985,772 4,424,537Y 2,731,82620,410,309
Mathematical and Physical Sciences 47.049 23,568,791 5,182,895Y 584,83228,751,686
Geosciences 47.050 6,909,004 122,682Y 1,109,4747,031,686
Computer and Information Science and Engineering 47.070 70,337,392 4,142,436Y 27,560,78174,479,828
Biological Sciences 47.074 6,029,052 2,077,793Y 535,4248,106,845
Social, Behavioral, and Economic Sciences 47.075 2,291,601 226,693Y 27,2462,518,294
Education and Human Resources 47.076 8,112,097 3,048,540Y 704,04911,160,637
Office of International Science and Engineering 47.079 82,787Y 82,787
Office of Cyberinfrastructure 47.080 -1,057Y -1,057
Trans-NSF Recovery Act Reasearch Support 47.082 -4,349Y -4,349
Integrative Activities 47.083 1,059,402Y 237,8011,059,402
Pass through from Others - see also pass through detailNational Science Foundation (non-specific) 47.000 344,060 22,972Y 367,032
Engineering 47.041 2,449,551 355,418Y 14,0082,804,969
Mathematical and Physical Sciences 47.049 5,423,744 54,429Y 5,478,173
Geosciences 47.050 497,290Y 497,290
Computer and Information Science and Engineering 47.070 1,409,285 799,063Y 2,208,348
1R&DUS National Science Foundation (NSF) FY19 SEFA
Cluster:Major Agency: Page 103
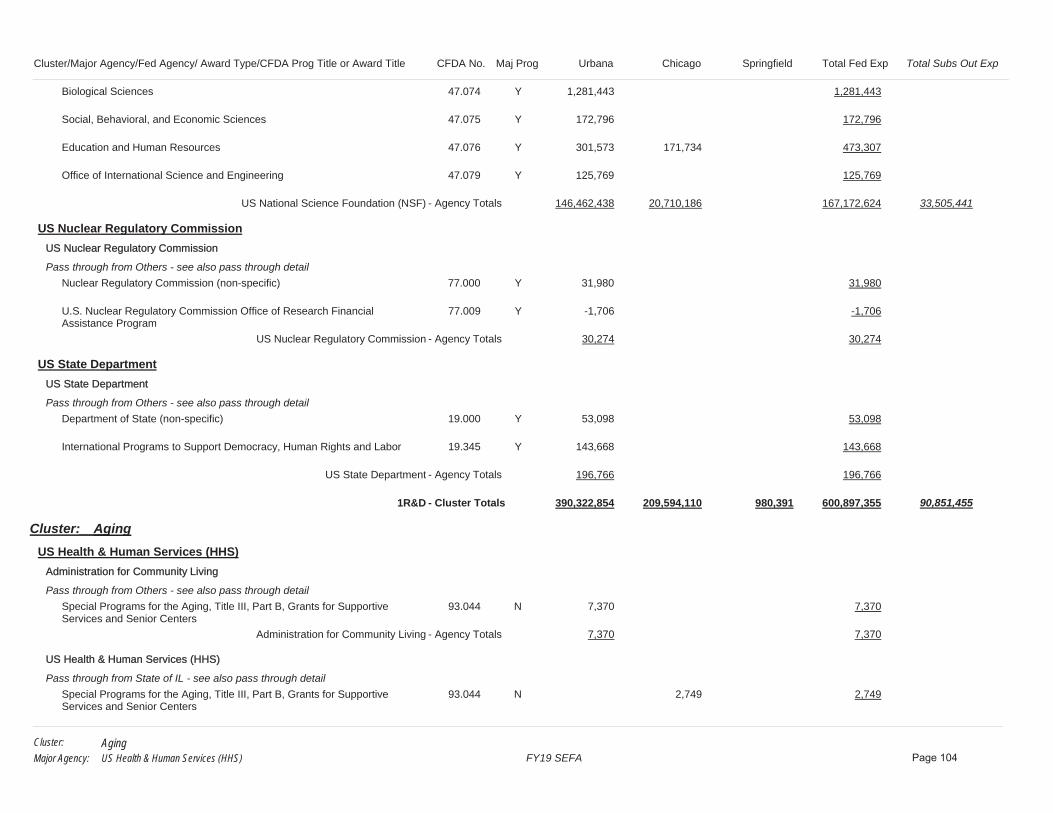
Cluster/Major Agency/Fed Agency/ Award Type/CFDA Prog Title or Award Title CFDA No. Urbana Chicago Springfield Total Fed ExpMaj Prog Total Subs Out Exp
Biological Sciences 47.074 1,281,443Y 1,281,443
Social, Behavioral, and Economic Sciences 47.075 172,796Y 172,796
Education and Human Resources 47.076 301,573 171,734Y 473,307
Office of International Science and Engineering 47.079 125,769Y 125,769
146,462,438 20,710,186 167,172,624- Agency Totals 33,505,441US National Science Foundation (NSF)
US Nuclear Regulatory CommissionUUS Nuclear Regulatory Commission
Pass through from Others - see also pass through detailNuclear Regulatory Commission (non-specific) 77.000 31,980Y 31,980
U.S. Nuclear Regulatory Commission Office of Research Financial Assistance Program
77.009 -1,706Y -1,706
30,274 30,274- Agency TotalsUS Nuclear Regulatory Commission
US State DepartmentUS State Department
Pass through from Others - see also pass through detailDepartment of State (non-specific) 19.000 53,098Y 53,098
International Programs to Support Democracy, Human Rights and Labor 19.345 143,668Y 143,668
196,766 196,766- Agency TotalsUS State Department
- Cluster Totals 390,322,854 209,594,110 980,391 600,897,355 90,851,4551R&D
AgingCluster:____US Health & Human Services (HHS)
Administration for Community Living
Pass through from Others - see also pass through detailSpecial Programs for the Aging, Title III, Part B, Grants for Supportive Services and Senior Centers
93.044 7,370N 7,370
7,370 7,370- Agency TotalsAdministration for Community Living
US Health & Human Services (HHS)
Pass through from State of IL - see also pass through detailSpecial Programs for the Aging, Title III, Part B, Grants for Supportive Services and Senior Centers
93.044 2,749N 2,749
AgingUS Health & Human Services (HHS) FY19 SEFA
Cluster:Major Agency: Page 104

Cluster/Major Agency/Fed Agency/ Award Type/CFDA Prog Title or Award Title CFDA No. Urbana Chicago Springfield Total Fed ExpMaj Prog Total Subs Out Exp
2,749 2,749- Agency TotalsUS Health & Human Services (HHS)
- Cluster Totals 7,370 2,749 10,119Aging
CCDFCluster:____US Health & Human Services (HHS)
AAdministration for Children and Families (ACF)
Non-Cash Federal AssistanceChild Care and Development Block Grant 93.575 4,931,866Y 4,931,866
Child Care Mandatory and Matching Funds of the Child Care and Development Fund
93.596 3,336,387Y 3,336,387
Pass through from State of IL - see also pass through detailChild Care Mandatory and Matching Funds of the Child Care and Development Fund
93.596 2,297,357Y 9,5012,297,357
10,565,610 10,565,610- Agency Totals 9,501Administration for Children and Families (ACF)
US Health & Human Services (HHS)
Pass through from Others - see also pass through detailChild Care and Development Block Grant 93.575 45,048Y 45,048
45,048 45,048- Agency TotalsUS Health & Human Services (HHS)
- Cluster Totals 10,610,658 10,610,658 9,501CCDF
Child NutritionCluster:____US Department of Agriculture (USDA)
US Department of Agriculture (USDA)
Pass through from State of IL - see also pass through detailSummer Food Service Program for Children 10.559 3,754N 3,754
3,754 3,754- Agency TotalsUS Department of Agriculture (USDA)
- Cluster Totals 3,754 3,754Child Nutrition
Economic DevelopmentCluster:____US Department of Commerce
Economic Development Administration
Direct AwardsEconomic Adjustment Assistance 11.307 149,820N 149,820
Economic DevelopmentUS Department of Commerce FY19 SEFA
Cluster:Major Agency: Page 105

Cluster/Major Agency/Fed Agency/ Award Type/CFDA Prog Title or Award Title CFDA No. Urbana Chicago Springfield Total Fed ExpMaj Prog Total Subs Out Exp
149,820 149,820- Agency TotalsEconomic Development Administration
- Cluster Totals 149,820 149,820Economic Development
Fish and WildlifeCluster:____US Department of Interior
UUS Fish & Wildlife
Pass through from State of IL - see also pass through detailWildlife Restoration and Basic Hunter Education 15.611 140,589N 140,589
140,589 140,589- Agency TotalsUS Fish & Wildlife
- Cluster Totals 140,589 140,589Fish and Wildlife
Health Center ProgramCluster:____US Health & Human Services (HHS)
Health Resources and Services Administration (HRSA)
Direct AwardsHealth Center Program (Community Health Centers, Migrant Health Centers, Health Care for the Homeless, and Public Housing Primary Care)
93.224 422,688N 422,688
Grants for New and Expanded Services under the Health Center Program 93.527 3,581,293N 3,581,293
4,003,981 4,003,981- Agency TotalsHealth Resources and Services Administration (HRSA)
- Cluster Totals 4,003,981 4,003,981Health Center Program
Highway Planning and ConstructionCluster:____US Department of Transportation (DOT)
Federal Highway Administration (FHWA)
Pass through from Others - see also pass through detailHighway Planning and Construction 20.205 21,350N 21,350
21,350 21,350- Agency TotalsFederal Highway Administration (FHWA)
US Department of Transportation (DOT)
Pass through from Others - see also pass through detailHighway Planning and Construction 20.205 21,146N 21,146
21,146 21,146- Agency TotalsUS Department of Transportation (DOT)
Highway Planning and ConstructionUS Department of Transportation (DOT) FY19 SEFA
Cluster:Major Agency: Page 106

Cluster/Major Agency/Fed Agency/ Award Type/CFDA Prog Title or Award Title CFDA No. Urbana Chicago Springfield Total Fed ExpMaj Prog Total Subs Out Exp
- Cluster Totals 42,496 42,496Highway Planning and Construction
Housing VoucherCluster:____Housing & Urban Development (HUD)
HHousing & Urban Development (HUD)
Pass through from Others - see also pass through detailSection 8 Housing Choice Vouchers 14.871 195,242N 117,782195,242
195,242 195,242- Agency Totals 117,782Housing & Urban Development (HUD)
- Cluster Totals 195,242 195,242 117,782Housing Voucher
Other ProgramsCluster:____Corporation for National & Community Service
Corporation for National & Community Service
Pass through from State of IL - see also pass through detailAmeriCorps 94.006 149,687N 142,208149,687
149,687 149,687- Agency Totals 142,208Corporation for National & Community Service
Department of Veterans Affairs (VA)Department of Veterans Affairs (VA)
Direct AwardsVA 2016-01151 IPA 64.000 6,946N 6,946
Vet Admin Allowance 64.000 3,750N 3,750
VA Homeless Providers Grant and Per Diem Program 64.024 73,924N 73,924
Research and Development 64.054 8,514N 8,514
6,946 82,438 3,750 93,134- Agency TotalsDepartment of Veterans Affairs (VA)
Jesse Brown VA Medical Center
Direct AwardsJBVAMC PO 537-C70172 64.000 91,568N 91,568
91,568 91,568- Agency TotalsJesse Brown VA Medical Center
Housing & Urban Development (HUD)Housing & Urban Development (HUD)
Other ProgramsHousing & Urban Development (HUD) FY19 SEFA
Cluster:Major Agency: Page 107

Cluster/Major Agency/Fed Agency/ Award Type/CFDA Prog Title or Award Title CFDA No. Urbana Chicago Springfield Total Fed ExpMaj Prog Total Subs Out Exp
Direct AwardsHousing Opportunities for Persons with AIDS 14.241 404,432N 404,432
Pass through from Others - see also pass through detailHUD Sub East St. Louis 094541 14.000 6,062N 6,062
HUD Sub Normal 093384 14.000 37,400N 37,400
IL Facilities Fund 14.000 613N 613
Housing Opportunities for Persons with AIDS 14.241 15,358N 15,358
Pass through from State of IL - see also pass through detailCommunity Development Block Grants/State's program and Non-Entitlement Grants in Hawaii
14.228 761,397 11,405N 772,802
Housing Opportunities for Persons with AIDS 14.241 164,360N 164,360
804,859 596,168 1,401,027- Agency TotalsHousing & Urban Development (HUD)
Institute of Museum & Library Services (IMLS)IInstitute of Museum & Library Services (IMLS)
Direct AwardsNational Leadership Grants 45.312 103,633N 103,633
Laura Bush 21st Century Librarian Program 45.313 201,956N 54,593201,956
Pass through from Others - see also pass through detailMuseums for America 45.301 10,089N 10,089
Pass through from State of IL - see also pass through detailLaura Bush 21st Century Librarian Program 45.313 75N 75
315,678 75 315,753- Agency Totals 54,593Institute of Museum & Library Services (IMLS)
International Joint CommissionInternational Joint Commission
Direct Awards99 Other - IJC 1042-801705 99.999 12,570N 12,570
12,570 12,570- Agency TotalsInternational Joint Commission
Japan-US Friendship CommissionJapan-US Friendship Commission
Other ProgramsJapan-US Friendship Commission FY19 SEFA
Cluster:Major Agency: Page 108
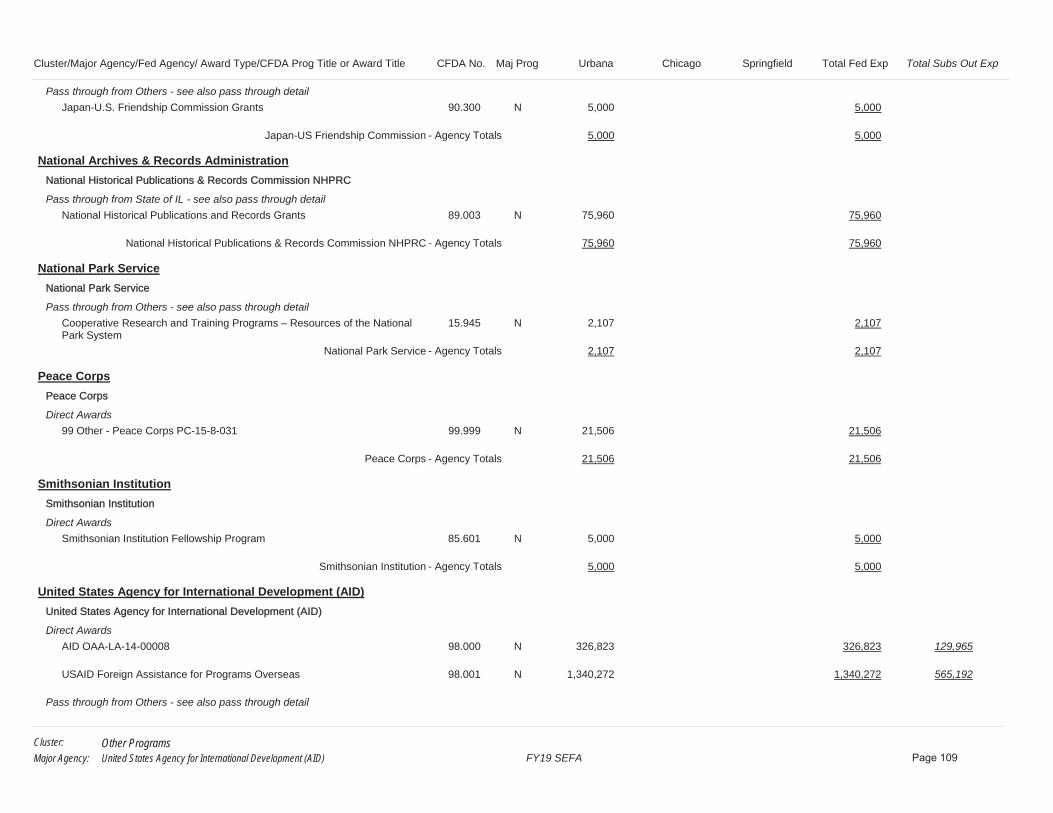
Cluster/Major Agency/Fed Agency/ Award Type/CFDA Prog Title or Award Title CFDA No. Urbana Chicago Springfield Total Fed ExpMaj Prog Total Subs Out Exp
Pass through from Others - see also pass through detailJapan-U.S. Friendship Commission Grants 90.300 5,000N 5,000
5,000 5,000- Agency TotalsJapan-US Friendship Commission
National Archives & Records AdministrationNNational Historical Publications & Records Commission NHPRC
Pass through from State of IL - see also pass through detailNational Historical Publications and Records Grants 89.003 75,960N 75,960
75,960 75,960- Agency TotalsNational Historical Publications & Records Commission NHPRC
National Park ServiceNational Park Service
Pass through from Others - see also pass through detailCooperative Research and Training Programs – Resources of the National Park System
15.945 2,107N 2,107
2,107 2,107- Agency TotalsNational Park Service
Peace CorpsPeace Corps
Direct Awards99 Other - Peace Corps PC-15-8-031 99.999 21,506N 21,506
21,506 21,506- Agency TotalsPeace Corps
Smithsonian InstitutionSmithsonian Institution
Direct AwardsSmithsonian Institution Fellowship Program 85.601 5,000N 5,000
5,000 5,000- Agency TotalsSmithsonian Institution
United States Agency for International Development (AID)United States Agency for International Development (AID)
Direct AwardsAID OAA-LA-14-00008 98.000 326,823N 129,965326,823
USAID Foreign Assistance for Programs Overseas 98.001 1,340,272N 565,1921,340,272
Pass through from Others - see also pass through detail
Other ProgramsUnited States Agency for International Development (AID) FY19 SEFA
Cluster:Major Agency: Page 109

Cluster/Major Agency/Fed Agency/ Award Type/CFDA Prog Title or Award Title CFDA No. Urbana Chicago Springfield Total Fed ExpMaj Prog Total Subs Out Exp
AID Sub MSU RC102095 98.000 18,935N 18,935
AID Sub Palladium 217707-IL-02 TO#4 98.000 98,658N 42,68298,658
AID Sub Palladium 217707-IL-02-02 98.000 22,832N 22,832
AID Sub Palladium T001 98.000 38,663N 9,73138,663
AID Sub Palladium TO#3 98.000 3,413N 3,413
AID Sub UFL UFDSP00011880 98.000 130,990N 130,990
AID Sub Univ Indonesia 090834 98.000 6,969N 6,969
USAID Foreign Assistance for Programs Overseas 98.001 120,221N 120,221
2,107,776 2,107,776- Agency Totals 747,570United States Agency for International Development (AID)
US Department of Agriculture (USDA)NNational Institute of Food and Agriculture/USDA
Direct AwardsAG 084486 ICorp 10.000 1,838N 1,838
Higher Education – Graduate Fellowships Grant Program 10.210 55,390N 55,390
Agriculture and Food Research Initiative (AFRI) 10.310 210,583N 210,583
Crop Protection and Pest Management Competitive Grants Program 10.329 1,273,504 5,944N 672,2091,279,448
Cooperative Extension Service 10.500 17,674,010Y 17,674,010
Renewable Resources Extension Act and National Focus Fund Projects 10.515 44,291N 44,291
Export Guarantee Program 10.610 27,950N 27,950
Pass through from Others - see also pass through detailGrants for Agricultural Research, Special Research Grants 10.200 95,524N 95,524
Sustainable Agriculture Research and Education 10.215 18,953N 18,953
Higher Education - Institution Challenge Grants Program 10.217 6,178N 6,178
Integrated Programs 10.303 5,215N 5,215
Other ProgramsUS Department of Agriculture (USDA) FY19 SEFA
Cluster:Major Agency: Page 110

Cluster/Major Agency/Fed Agency/ Award Type/CFDA Prog Title or Award Title CFDA No. Urbana Chicago Springfield Total Fed ExpMaj Prog Total Subs Out Exp
Agriculture and Food Research Initiative (AFRI) 10.310 438N 438
Capacity Building for Non-Land Grant Colleges of Agriculture (NLGCA) 10.326 13,525N 13,525
Cooperative Extension Service 10.500 9,767Y 9,767
19,437,166 5,944 19,443,110- Agency Totals 672,209National Institute of Food and Agriculture/USDA
UUS Department of Agriculture (USDA)
Pass through from Others - see also pass through detailAG Sub UK 3200002185-19-076 10.000 24,741N 24,741
Local Food Promotion Program 10.172 21,256N 21,256
Grants for Agricultural Research, Special Research Grants 10.200 -8,889N -8,889
Sustainable Agriculture Research and Education 10.215 4,780N 4,780
Capacity Building for Non-Land Grant Colleges of Agriculture (NLGCA) 10.326 423N 423
Cooperative Extension Service 10.500 203,498Y 203,498
Pass through from State of IL - see also pass through detailSpecialty Crop Block Grant Program - Farm Bill 10.170 3,483N 3,483
WIC Special Supplemental Nutrition Program for Women, Infants, and Children
10.557 169,603N 169,603
Child and Adult Care Food Program 10.558 41,490 19,359N 60,849
State Administrative Expenses for Child Nutrition 10.560 871,469N 871,469
Cooperative Forestry Assistance 10.664 189,064N 189,064
1,351,315 188,962 1,540,277- Agency TotalsUS Department of Agriculture (USDA)
US Department of Agriculture/Ag Research Service (ARS)
Direct AwardsAG 085706 TTA 10.000 2,314N 2,314
AG 089120 FUA 10.000 1,153N 1,153
AG 092411 TTA PO 1232SD18P0457 10.000 20,867N 20,867
Agricultural Research Basic and Applied Research 10.001 39,552N 39,552
Other ProgramsUS Department of Agriculture (USDA) FY19 SEFA
Cluster:Major Agency: Page 111

Cluster/Major Agency/Fed Agency/ Award Type/CFDA Prog Title or Award Title CFDA No. Urbana Chicago Springfield Total Fed ExpMaj Prog Total Subs Out Exp
Hispanic Serving Institutions Education Grants 10.223 52,062N 52,062
Pass through from Others - see also pass through detailAgricultural Research Basic and Applied Research 10.001 2,124N 2,124
66,010 52,062 118,072- Agency TotalsUS Department of Agriculture/Ag Research Service (ARS)
UUSDA Animal & Plant Health Inspection Serv (APHIS)
Direct AwardsPlant and Animal Disease, Pest Control, and Animal Care 10.025 48,818N 48,818
Pass through from Others - see also pass through detailWildlife Services 10.028 3,437N 3,437
52,255 52,255- Agency TotalsUSDA Animal & Plant Health Inspection Serv (APHIS)
USDA Farm Service Agency (FSA)
Direct AwardsAG 58-0510-4-002N PO7600041547 10.000 227,322N 218,402227,322
227,322 227,322- Agency Totals 218,402USDA Farm Service Agency (FSA)
USDA Food and Nutrition Service (FNS)
Pass through from State of IL - see also pass through detailChild and Adult Care Food Program 10.558 15,549N 15,549
15,549 15,549- Agency TotalsUSDA Food and Nutrition Service (FNS)
USDA Forest Service (FS)
Direct AwardsAG 17-CS-11090800-004 10.000 2,700N 2,700
Urban and Community Forestry Program 10.675 9,008N 9,008
International Forestry Programs 10.684 6,343N 6,343
Pass through from Others - see also pass through detailAG SUB Oregon State Univ 094346 10.000 10,486N 10,486
Pass through from State of IL - see also pass through detailCooperative Forestry Assistance 10.664 5,680N 5,680
27,874 6,343 34,217- Agency TotalsUSDA Forest Service (FS)
Other ProgramsUS Department of Agriculture (USDA) FY19 SEFA
Cluster:Major Agency: Page 112

Cluster/Major Agency/Fed Agency/ Award Type/CFDA Prog Title or Award Title CFDA No. Urbana Chicago Springfield Total Fed ExpMaj Prog Total Subs Out Exp
UUSDA Natural Resources Conservation Service (NRCS)
Direct AwardsSoil and Water Conservation 10.902 35,166N 35,166
35,166 35,166- Agency TotalsUSDA Natural Resources Conservation Service (NRCS)
USDA Office of Chief Economist
Direct AwardsAgricultural Market and Economic Research 10.290 55,336N 55,336
55,336 55,336- Agency TotalsUSDA Office of Chief Economist
US Department of CommerceUS Department of Commerce
Direct AwardsScience, Technology, Business and/or Education Outreach 11.620 90N 90
Pass through from Others - see also pass through detailSea Grant Support 11.417 214,162N 214,162
Climate and Atmospheric Research 11.431 31,102N 31,102
National Oceanic and Atmospheric Administration (NOAA) Cooperative Institutes
11.432 83,454N 57,04283,454
Hydrologic Research 11.462 65,135N 65,135
Measurement and Engineering Research and Standards 11.609 1,193N 1,193
395,136 395,136- Agency Totals 57,042US Department of Commerce
US Dept of Commerce NOAA
Direct AwardsCOM 1333MJ18PNRMA0058 11.000 9,892N 9,892
COM NOAA AB-133E-16-CQ-0024 11.000 473,872N 473,872
COM NOAA RA-133R-16-SE-0081 11.000 8,280N 8,280
Sea Grant Support 11.417 783,680N 616,471783,680
Pass through from Others - see also pass through detailNational Oceanic and Atmospheric Administration (NOAA) Cooperative Institutes
11.432 52,274N 52,274
Other ProgramsUS Department of Commerce FY19 SEFA
Cluster:Major Agency: Page 113

Cluster/Major Agency/Fed Agency/ Award Type/CFDA Prog Title or Award Title CFDA No. Urbana Chicago Springfield Total Fed ExpMaj Prog Total Subs Out Exp
Pass through from State of IL - see also pass through detailCoastal Zone Management Administration Awards 11.419 30,212N 30,212
1,358,210 1,358,210- Agency Totals 616,471US Dept of Commerce NOAA
US Department of Defense (DoD)AAir Force
Pass through from Others - see also pass through detailAF Sub UES 089234 119-010-052 12.000 148N 148
148 148- Agency TotalsAir Force
Army
Direct AwardsBasic Scientific Research 12.431 15,889N 15,889
Pass through from Others - see also pass through detailArmy Sub AAS 089497 12.000 1,000N 1,000
Army Sub Drasgow 083804 12.000 50,777N 50,777
Army Sub MATSYS 092633 TTA 12.000 8,595N 8,595
Basic, Applied, and Advanced Research in Science and Engineering 12.630 6,489N 6,489
82,750 82,750- Agency TotalsArmy
Army CERL
Direct AwardsArmy CERL W9132T-17-A-0001-0006 FUA 12.000 2,362N 2,362
Army CERL W9132T-17-A-0001-0007 FUA 12.000 1,479N 1,479
Army W9132T-14-P-0059 FUA 12.000 11,205N 11,205
Army W9132T-17-A-0001-0008 FUA 12.000 2,208N 2,208
Army W9132T-17-A-0001-009 FUA 12.000 8,621N 8,621
Pass through from Others - see also pass through detailARMY sub Keanetech 17C0022-S1 12.000 2,103N 2,103
27,978 27,978- Agency TotalsArmy CERL
Other ProgramsUS Department of Defense (DoD) FY19 SEFA
Cluster:Major Agency: Page 114
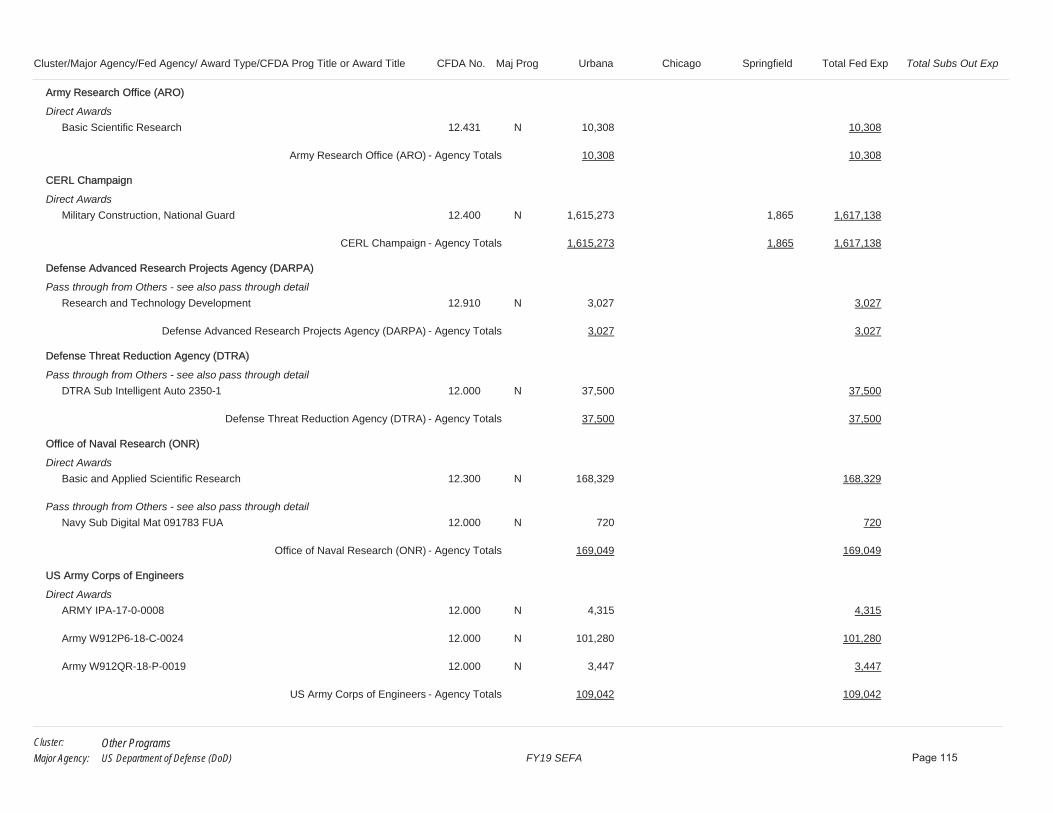
Cluster/Major Agency/Fed Agency/ Award Type/CFDA Prog Title or Award Title CFDA No. Urbana Chicago Springfield Total Fed ExpMaj Prog Total Subs Out Exp
AArmy Research Office (ARO)
Direct AwardsBasic Scientific Research 12.431 10,308N 10,308
10,308 10,308- Agency TotalsArmy Research Office (ARO)
CERL Champaign
Direct AwardsMilitary Construction, National Guard 12.400 1,615,273 1,865N 1,617,138
1,615,273 1,865 1,617,138- Agency TotalsCERL Champaign
Defense Advanced Research Projects Agency (DARPA)
Pass through from Others - see also pass through detailResearch and Technology Development 12.910 3,027N 3,027
3,027 3,027- Agency TotalsDefense Advanced Research Projects Agency (DARPA)
Defense Threat Reduction Agency (DTRA)
Pass through from Others - see also pass through detailDTRA Sub Intelligent Auto 2350-1 12.000 37,500N 37,500
37,500 37,500- Agency TotalsDefense Threat Reduction Agency (DTRA)
Office of Naval Research (ONR)
Direct AwardsBasic and Applied Scientific Research 12.300 168,329N 168,329
Pass through from Others - see also pass through detailNavy Sub Digital Mat 091783 FUA 12.000 720N 720
169,049 169,049- Agency TotalsOffice of Naval Research (ONR)
US Army Corps of Engineers
Direct AwardsARMY IPA-17-0-0008 12.000 4,315N 4,315
Army W912P6-18-C-0024 12.000 101,280N 101,280
Army W912QR-18-P-0019 12.000 3,447N 3,447
109,042 109,042- Agency TotalsUS Army Corps of Engineers
Other ProgramsUS Department of Defense (DoD) FY19 SEFA
Cluster:Major Agency: Page 115

Cluster/Major Agency/Fed Agency/ Award Type/CFDA Prog Title or Award Title CFDA No. Urbana Chicago Springfield Total Fed ExpMaj Prog Total Subs Out Exp
UUS Army Engineering District
Direct AwardsArmy W912P6-13-C-0015 12.000 29,345N 29,345
29,345 29,345- Agency TotalsUS Army Engineering District
US Department of Defense (DoD)
Direct AwardsEconomic Adjustment Assistance for State Governments 12.617 249,054 839,544N 634,2971,088,598
Pass through from Others - see also pass through detailCommercial Technologies for Maintenance Activities Program 12.225 56,031N 56,031
Research and Technology Development 12.910 7,624N 7,624
312,709 839,544 1,152,253- Agency Totals 634,297US Department of Defense (DoD)
US Department of EducationUS Department of Education
Direct AwardsNational Resource Centers Program for Foreign Language and Area Studies or Foreign Language and International Studies Program and
84.015 1,606,721N 345,7881,606,721
Overseas Programs - Doctoral Dissertation Research Abroad 84.022 27,979N 27,979
Higher Education Institutional Aid 84.031 336,232N 336,232
Graduate Assistance in Areas of National Need 84.200 552,463N 552,463
Special Education - Personnel Development to Improve Services and Results for Children with Disabilities
84.325 645,578 1,309,546N 1,955,124
Child Care Access Means Parents in School 84.335 16,854N 16,854
Pass through from Others - see also pass through detailDE Sub CCUSD4 84.000 36,372N 36,372
DE Sub McREL 00070296 YR 3 ANTC 84.000 24,643N 24,643
National Resource Centers Program for Foreign Language and Area Studies or Foreign Language and International Studies Program and
84.015 145,736N 145,736
Special Education - Personnel Development to Improve Services and Results for Children with Disabilities
84.325 184,481N 184,481
Supporting Effective Instruction State Grants (formerly Improving Teacher Quality State Grants)
84.367 108,508N 108,508
Other ProgramsUS Department of Education FY19 SEFA
Cluster:Major Agency: Page 116

Cluster/Major Agency/Fed Agency/ Award Type/CFDA Prog Title or Award Title CFDA No. Urbana Chicago Springfield Total Fed ExpMaj Prog Total Subs Out Exp
Education Innovation and Research (formerly Investing in Innovation (i3) Fund)
84.411 27,797N 27,797
Race to the Top Early Learning Challenge 84.412 66,182N 66,182
Pass through from State of IL - see also pass through detailAdult Education - Basic Grants to States 84.002 58,525N 58,525
Title I Grants to Local Educational Agencies 84.010 95,866N 95,866
Career and Technical Education -- Basic Grants to States 84.048 308,697N 308,697
Mathematics and Science Partnerships 84.366 131,222N 66,752131,222
3,794,618 1,888,784 5,683,402- Agency Totals 412,540US Department of Education
US Department of Energy (DOE)AArgonne National Lab
Direct awards from DOE lab - see also pass through detailDOE ANL 00474739 ANTC 81.000 278N 278
DOE ANL 4J-30401-0010A 81.000 14,639N 14,639
DOE ANL 4J-30401-0019A TTA 81.000 1,929N 1,929
DOE ANL 4J30401-0024A 81.000 44,426N 44,426
DOE ANL 4J-30401-0026A TTA 81.000 15,014N 15,014
DOE ANL 5A-39120 TTA 81.000 1,260N 1,260
DOE ANL 7E-30028 81.000 1,962N 1,962
79,508 79,508- Agency TotalsArgonne National Lab
DOE CSGF UIUC DO NOT USE
Direct AwardsDOE OR FELLOW 81.000 5,902N 5,902
5,902 5,902- Agency TotalsDOE CSGF UIUC DO NOT USE
Los Alamos National Lab
Pass through from Others - see also pass through detailDOE ARS Int'l 2015-01499 TTA 81.000 11,244N 11,244
Other ProgramsUS Department of Energy (DOE) FY19 SEFA
Cluster:Major Agency: Page 117

Cluster/Major Agency/Fed Agency/ Award Type/CFDA Prog Title or Award Title CFDA No. Urbana Chicago Springfield Total Fed ExpMaj Prog Total Subs Out Exp
11,244 11,244- Agency TotalsLos Alamos National Lab
OOak Ridge Institute for Science and Education ORISE
Direct AwardsDOE ORISE 088519 81.000 -8,025N -8,025
-8,025 -8,025- Agency TotalsOak Ridge Institute for Science and Education ORISE
Pacific Northwest National Lab
Direct awards from DOE lab - see also pass through detailDOE PNNL 390304 81.000 82,223N 82,223
82,223 82,223- Agency TotalsPacific Northwest National Lab
US Department of Energy (DOE)
Direct AwardsOffice of Science Financial Assistance Program 81.049 29,595N 29,595
Nuclear Energy Research, Development and Demonstration 81.121 18,911N 18,911
Pass through from Others - see also pass through detailDOE Sub FNAL 629961 81.000 16,567N 16,567
Office of Science Financial Assistance Program 81.049 156,515N 156,515
Electricity Delivery and Energy Reliability, Research, Development and Analysis
81.122 112,618N 112,618
Pass through from State of IL - see also pass through detailState Energy Program 81.041 909,718N 909,718
Weatherization Assistance for Low-Income Persons 81.042 812,073N 1,856812,073
2,055,997 2,055,997- Agency Totals 1,856US Department of Energy (DOE)
US Department of Homeland Security(USDHS)Federal Emergency Management Agency (FEMA)
Direct AwardsAssistance to Firefighters Grant 97.044 624,603 39,684N 321,157664,287
Cooperating Technical Partners 97.045 2,462,029N 2,462,029
Pass through from State of IL - see also pass through detail
Other ProgramsUS Department of Homeland Security(USDHS) FY19 SEFA
Cluster:Major Agency: Page 118

Cluster/Major Agency/Fed Agency/ Award Type/CFDA Prog Title or Award Title CFDA No. Urbana Chicago Springfield Total Fed ExpMaj Prog Total Subs Out Exp
Pre-Disaster Mitigation 97.047 125,342N 125,342
3,211,974 39,684 3,251,658- Agency Totals 321,157Federal Emergency Management Agency (FEMA)
UUS Department of Homeland Security(USDHS)
Direct AwardsDHS HSTS02-16-H-SLR830 97.000 85,984N 85,984
State Fire Training Systems Grants 97.043 34,131N 34,131
Assistance to Firefighters Grant 97.044 238,659N 238,659
Cooperating Technical Partners 97.045 278,516N 278,516
Pass through from State of IL - see also pass through detailHomeland Security Grant Program 97.067 2,047,990N 2,047,990
2,685,280 2,685,280- Agency TotalsUS Department of Homeland Security(USDHS)
US Department of InteriorNational Park Service (NPS)
Direct AwardsCooperative Research and Training Programs – Resources of the National Park System
15.945 774N 774
774 774- Agency TotalsNational Park Service (NPS)
United States Geological Survey
Direct AwardsINT IPA 094416 15.000 10,358N 10,358
Assistance to State Water Resources Research Institutes 15.805 1,196,544 1,197N 643,9981,197,741
National Geological and Geophysical Data Preservation 15.814 26,908N 26,908
National Ground-Water Monitoring Network 15.980 103,721N 103,721
Water Use and Data Research 15.981 97,657N 97,657
1,435,188 1,197 1,436,385- Agency Totals 643,998United States Geological Survey
US Fish & Wildlife
Direct AwardsINT CESU F16PX01530 15.000 41,748N 41,748
Other ProgramsUS Department of Interior FY19 SEFA
Cluster:Major Agency: Page 119

Cluster/Major Agency/Fed Agency/ Award Type/CFDA Prog Title or Award Title CFDA No. Urbana Chicago Springfield Total Fed ExpMaj Prog Total Subs Out Exp
INT CESU F17PX01834 15.000 346N 346
Pass through from Others - see also pass through detailState Wildlife Grants 15.634 40,845N 40,845
Pass through from State of IL - see also pass through detailGreat Lakes Restoration 15.662 75,376N 75,376
158,315 158,315- Agency TotalsUS Fish & Wildlife
US Department of Justice (DOJ)NNational Institute of Justice
Pass through from Others - see also pass through detailPostconviction Testing of DNA Evidence 16.820 1,940N 1,940
1,940 1,940- Agency TotalsNational Institute of Justice
US Department of Justice (DOJ)
Direct AwardsMissing Alzheimer's Disease Patient Assistance Program 16.015 57,453N 57,453
Criminal Justice Research and Development Graduate Research Fellowships
16.562 46,306N 46,306
Public Safety Partnership and Community Policing Grants 16.710 192,943N 192,943
Pass through from Others - see also pass through detailOVW Technical Assistance Initiative 16.526 62,980N 62,980
National Institute of Justice Research, Evaluation, and Development Project Grants
16.560 8,132N 8,132
Crime Victim Assistance/Discretionary Grants 16.582 8,318 223,523N 231,841
Public Safety Partnership and Community Policing Grants 16.710 220,357N 220,357
Juvenile Mentoring Program 16.726 49,959N 49,959
Pass through from State of IL - see also pass through detailJuvenile Justice and Delinquency Prevention 16.540 113,230N 10,123113,230
Crime Victim Assistance 16.575 -667N -667
225,945 756,589 982,534- Agency Totals 10,123US Department of Justice (DOJ)
US Department of Labor (DOL)
Other ProgramsUS Department of Labor (DOL) FY19 SEFA
Cluster:Major Agency: Page 120

Cluster/Major Agency/Fed Agency/ Award Type/CFDA Prog Title or Award Title CFDA No. Urbana Chicago Springfield Total Fed ExpMaj Prog Total Subs Out Exp
MMgt & Training Corp-Chicago Job Corps
Direct AwardsMTC 17.000 65,765N 65,765
65,765 65,765- Agency TotalsMgt & Training Corp-Chicago Job Corps
US Department of Labor (DOL)
Direct AwardsLabor Force Statistics 17.002 7,264N 7,264
Occupational Safety and Health Susan Harwood Training Grants 17.502 127,297N 127,297
Pass through from Others - see also pass through detailDOL Sub NGG 2016-00903 17.000 17,594N 17,594
Trade Adjustment Assistance Community College and Career Training (TAACCCT) Grants
17.282 12,870N 12,870
157,761 7,264 165,025- Agency TotalsUS Department of Labor (DOL)
US Department of Transportation (DOT)Federal Aviation Administration (FAA)
Direct AwardsAviation Research Grants 20.108 246,847N 246,847
Pass through from State of IL - see also pass through detailAirport Improvement Program 20.106 451,319N 451,319
698,166 698,166- Agency TotalsFederal Aviation Administration (FAA)
Federal Highway Administration (FHWA)
Direct AwardsHighway Training and Education 20.215 3,500N 3,500
3,500 3,500- Agency TotalsFederal Highway Administration (FHWA)
US Department of Transportation (DOT)
Pass through from State of IL - see also pass through detailFormula Grants for Rural Areas and Tribal Transit Program 20.509 10,714N 10,714
Interagency Hazardous Materials Public Sector Training and Planning Grants
20.703 341,768N 341,768
341,768 10,714 352,482- Agency TotalsUS Department of Transportation (DOT)
Other ProgramsUS Department of Transportation (DOT) FY19 SEFA
Cluster:Major Agency: Page 121

Cluster/Major Agency/Fed Agency/ Award Type/CFDA Prog Title or Award Title CFDA No. Urbana Chicago Springfield Total Fed ExpMaj Prog Total Subs Out Exp
US Environmental Protection Agency (EPA)UUS Environmental Protection Agency (EPA)
Direct AwardsEPA NP-00E02049 66.000 86,456N 86,456
Great Lakes Program 66.469 79,725N 24,16879,725
Pollution Prevention Grants Program 66.708 162,738N 162,738
Source Reduction Assistance 66.717 31,631N 31,631
Pass through from Others - see also pass through detailEPA Sub MACTEC EP-W-16-015 66.000 11,254N 11,254
EPA Sub Pegasus PO UIUC-18-001 66.000 28,215N 28,215
EPA Sub Pegasus PO UIUC-19-001R 66.000 6,016N 6,016
Surveys, Studies, Investigations, Demonstrations, and Training Grants - Section 1442 of the Safe Drinking Water Act
66.424 111,797N 111,797
Surveys, Studies, Investigations, Demonstrations, and Training Grants and Cooperative Agreements - Section 104(b)(3) of the Clean Water Act
66.436 529,536N 529,536
National Estuary Program 66.456 9,245N 9,245
Great Lakes Program 66.469 10,639N 10,639
Research, Development, Monitoring, Public Education, Outreach, Training, Demonstrations, and Studies
66.716 3,070N 3,070
1,070,322 1,070,322- Agency Totals 24,168US Environmental Protection Agency (EPA)
US Health & Human Services (HHS)Administration for Children and Families (ACF)
Non-Cash Federal AssistanceSocial Services Block Grant 93.667 59,578N 59,578
Pass through from Others - see also pass through detailHead Start 93.600 4,244,153N 862,3424,244,153
Pass through from State of IL - see also pass through detailChildren's Justice Grants to States 93.643 167,543N 167,543
Social Services Block Grant 93.667 51,211N 51,211
Other ProgramsUS Health & Human Services (HHS) FY19 SEFA
Cluster:Major Agency: Page 122

Cluster/Major Agency/Fed Agency/ Award Type/CFDA Prog Title or Award Title CFDA No. Urbana Chicago Springfield Total Fed ExpMaj Prog Total Subs Out Exp
Child Abuse and Neglect State Grants 93.669 95,000N 95,000
59,578 4,557,907 4,617,485- Agency Totals 862,342Administration for Children and Families (ACF)
AAdministration for Community Living
Pass through from Others - see also pass through detailACL National Institute on Disability, Independent Living, and Rehabilitation Research
93.433 -14,816N -14,816
-14,816 -14,816- Agency TotalsAdministration for Community Living
Centers for Disease Control and Prevention (CDC)
Direct AwardsCDC 200-207-M-95803 93.000 13,700N 13,700
CDC 75D30118P02172 93.000 55,323N 55,323
CDC/NIOSH 200-2016-M-90184 93.000 23,795N 23,795
Environmental Public Health and Emergency Response 93.070 198,288N 32,274198,288
Pass through from Others - see also pass through detailCooperative Agreements to Promote Adolescent Health through School-Based HIV/STD Prevention and School-Based Surveillance
93.079 6,613N 6,613
Health Program for Toxic Substances and Disease Registry 93.161 209,017N 30,551209,017
Disabilities Prevention 93.184 8,733N 8,733
Viral Hepatitis Prevention and Control 93.270 174,659N 174,659
NON-ACA/PPHF—Building Capacity of the Public Health System to Improve Population Health through National Nonprofit Organizations
93.424 18,092N 18,092
HIV Prevention Activities Health Department Based 93.940 44,033N 44,033
Pass through from State of IL - see also pass through detailCancer Prevention and Control Programs for State, Territorial and Tribal Organizations
93.898 50,658N 50,658
802,911 802,911- Agency Totals 62,825Centers for Disease Control and Prevention (CDC)
Centers for Medicare and Medicaid Services
Direct AwardsHealth Care Innovation Awards (HCIA) 93.610 695,004N 695,004
695,004 695,004- Agency TotalsCenters for Medicare and Medicaid Services
Other ProgramsUS Health & Human Services (HHS) FY19 SEFA
Cluster:Major Agency: Page 123
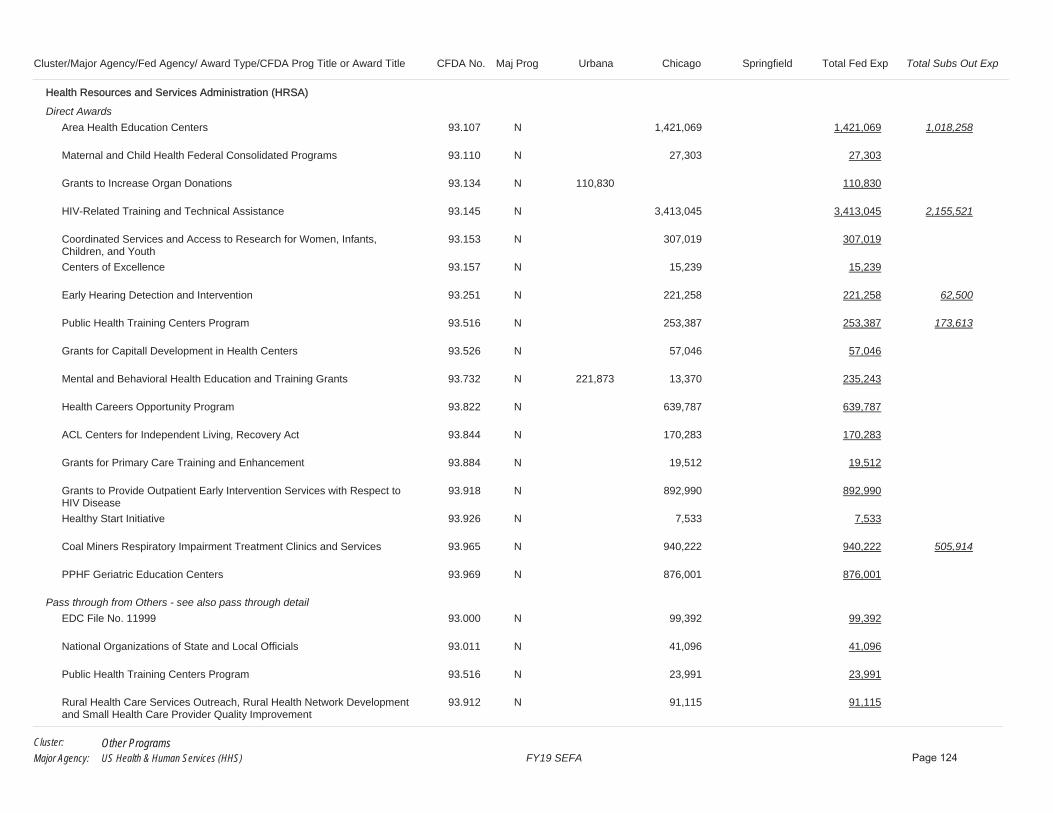
Cluster/Major Agency/Fed Agency/ Award Type/CFDA Prog Title or Award Title CFDA No. Urbana Chicago Springfield Total Fed ExpMaj Prog Total Subs Out Exp
HHealth Resources and Services Administration (HRSA)
Direct AwardsArea Health Education Centers 93.107 1,421,069N 1,018,2581,421,069
Maternal and Child Health Federal Consolidated Programs 93.110 27,303N 27,303
Grants to Increase Organ Donations 93.134 110,830N 110,830
HIV-Related Training and Technical Assistance 93.145 3,413,045N 2,155,5213,413,045
Coordinated Services and Access to Research for Women, Infants, Children, and Youth
93.153 307,019N 307,019
Centers of Excellence 93.157 15,239N 15,239
Early Hearing Detection and Intervention 93.251 221,258N 62,500221,258
Public Health Training Centers Program 93.516 253,387N 173,613253,387
Grants for Capitall Development in Health Centers 93.526 57,046N 57,046
Mental and Behavioral Health Education and Training Grants 93.732 221,873 13,370N 235,243
Health Careers Opportunity Program 93.822 639,787N 639,787
ACL Centers for Independent Living, Recovery Act 93.844 170,283N 170,283
Grants for Primary Care Training and Enhancement 93.884 19,512N 19,512
Grants to Provide Outpatient Early Intervention Services with Respect to HIV Disease
93.918 892,990N 892,990
Healthy Start Initiative 93.926 7,533N 7,533
Coal Miners Respiratory Impairment Treatment Clinics and Services 93.965 940,222N 505,914940,222
PPHF Geriatric Education Centers 93.969 876,001N 876,001
Pass through from Others - see also pass through detailEDC File No. 11999 93.000 99,392N 99,392
National Organizations of State and Local Officials 93.011 41,096N 41,096
Public Health Training Centers Program 93.516 23,991N 23,991
Rural Health Care Services Outreach, Rural Health Network Development and Small Health Care Provider Quality Improvement
93.912 91,115N 91,115
Other ProgramsUS Health & Human Services (HHS) FY19 SEFA
Cluster:Major Agency: Page 124

Cluster/Major Agency/Fed Agency/ Award Type/CFDA Prog Title or Award Title CFDA No. Urbana Chicago Springfield Total Fed ExpMaj Prog Total Subs Out Exp
HIV Emergency Relief Project Grants 93.914 353,074N 353,074
HIV Care Formula Grants 93.917 113,790N 113,790
Pass through from State of IL - see also pass through detailHIV Care Formula Grants 93.917 591,307N 591,307
Maternal and Child Health Services Block Grant to the States 93.994 5,890,129Y 5,890,129
332,703 16,478,958 16,811,661- Agency Totals 3,915,806Health Resources and Services Administration (HRSA)
HHRSA/BHPR/DADPHP (Health Resources and Services)
Pass through from Others - see also pass through detailRural Health Care Services Outreach, Rural Health Network Development and Small Health Care Provider Quality Improvement
93.912 3,641N 3,641
HIV Emergency Relief Project Grants 93.914 1,592,009N 1,592,009
Pass through from State of IL - see also pass through detailHIV Care Formula Grants 93.917 194,377N 194,377
1,790,027 1,790,027- Agency TotalsHRSA/BHPR/DADPHP (Health Resources and Services)
National Center for Health Statistics
Direct AwardsCDC Contract No. 75D30118P02249 93.000 364N 364
364 364- Agency TotalsNational Center for Health Statistics
National Hansens Disease Programs (NHDP)
Direct AwardsNHDP HHSH258201300011C 93.000 112,419N 112,419
112,419 112,419- Agency TotalsNational Hansens Disease Programs (NHDP)
Natl Center for Chronic Disease Prev & Health Promotion
Pass through from Others - see also pass through detailPartnerships to Improve Community Health 93.331 5,386N 5,386
5,386 5,386- Agency TotalsNatl Center for Chronic Disease Prev & Health Promotion
NIH / National Institute of General Medical Sciences
Direct AwardsBiomedical Research and Research Training 93.859 135,996N 135,996
Other ProgramsUS Health & Human Services (HHS) FY19 SEFA
Cluster:Major Agency: Page 125

Cluster/Major Agency/Fed Agency/ Award Type/CFDA Prog Title or Award Title CFDA No. Urbana Chicago Springfield Total Fed ExpMaj Prog Total Subs Out Exp
135,996 135,996- Agency TotalsNIH / National Institute of General Medical Sciences
NNIH / National Institutes of Health
Pass through from Others - see also pass through detailTrans-NIH Research Support 93.310 24,086N 24,086
Cancer Treatment Research 93.395 5,097N 5,097
Arthritis, Musculoskeletal and Skin Diseases Research 93.846 376N 376
Biomedical Research and Research Training 93.859 376N 376
24,838 5,097 29,935- Agency TotalsNIH / National Institutes of Health
Substance Abuse & Mental Health Services Admin (SAMHSA)
Direct AwardsSubstance Abuse and Mental Health Services Projects of Regional and National Significance
93.243 67,273 124,692N 60,807191,965
Pass through from Others - see also pass through detailSubstance Abuse and Mental Health Services Projects of Regional and National Significance
93.243 50,968N 50,968
Pass through from State of IL - see also pass through detailSubstance Abuse and Mental Health Services Projects of Regional and National Significance
93.243 150,990 117,171N 268,161
Opioid STR 93.788 7N 7
Block Grants for Prevention and Treatment of Substance Abuse 93.959 120,886 577,567N 698,453
339,156 870,398 1,209,554- Agency Totals 60,807Substance Abuse & Mental Health Services Admin (SAMHSA)
US Health & Human Services (HHS)
Direct AwardsTraining in General, Pediatric, and Public Health Dentistry 93.059 192,068N 192,068
Substance Abuse and Mental Health Services Projects of Regional and National Significance
93.243 248,667N 248,667
ACL National Institute on Disability, Independent Living, and Rehabilitation Research
93.433 241,179N 2,870241,179
Pass through from Others - see also pass through detailIowa Department of Public Health 93.000 27,799N 27,799
Food and Drug Administration Research 93.103 7,783N 7,783
Other ProgramsUS Health & Human Services (HHS) FY19 SEFA
Cluster:Major Agency: Page 126

Cluster/Major Agency/Fed Agency/ Award Type/CFDA Prog Title or Award Title CFDA No. Urbana Chicago Springfield Total Fed ExpMaj Prog Total Subs Out Exp
Substance Abuse and Mental Health Services Projects of Regional and National Significance
93.243 1,814 55,309N 57,123
ACA-Transforming Clinical Practice Initiative: Practice Transformation Networks (PTNs)
93.638 75,727N 75,727
Pass through from State of IL - see also pass through detailFamily Planning Services 93.217 68,712N 68,712
Teenage Pregnancy Prevention Program 93.297 83,434N 83,434
Low-Income Home Energy Assistance 93.568 812,073N 1,856812,073
State Court Improvement Program 93.586 66,434N 66,434
Block Grants for Prevention and Treatment of Substance Abuse 93.959 99,317N 99,317
Maternal and Child Health Services Block Grant to the States 93.994 3,437Y 3,437
1,070,855 857,589 55,309 1,983,753- Agency Totals 4,726US Health & Human Services (HHS)
US NASAGGoddard Space Flight Center
Direct AwardsScience 43.001 29,601N 29,601
29,601 29,601- Agency TotalsGoddard Space Flight Center
Jet Propulsion Laboratory
Direct AwardsNASA SUB JPL 1591515 43.000 35,355N 35,355
35,355 35,355- Agency TotalsJet Propulsion Laboratory
NASA Headquarters
Pass through from Others - see also pass through detailScience 43.001 -5,873N -5,873
-5,873 -5,873- Agency TotalsNASA Headquarters
NASA Shared Services Center
Direct AwardsNASA NNX16AO86H FLLW 43.000 45,102N 45,102
Science 43.001 32,013N 6,86132,013
Other ProgramsUS NASA FY19 SEFA
Cluster:Major Agency: Page 127

Cluster/Major Agency/Fed Agency/ Award Type/CFDA Prog Title or Award Title CFDA No. Urbana Chicago Springfield Total Fed ExpMaj Prog Total Subs Out Exp
Education 43.008 52,134N 62352,134
Space Technology 43.012 330,154N 330,154
459,403 459,403- Agency Totals 7,484NASA Shared Services Center
UUS NASA
Direct AwardsScience 43.001 58,330N 58,330
Space Technology 43.012 226,549N 226,549
Pass through from Others - see also pass through detailNASA SUB FA 090998 43.000 8,789N 8,789
NASA Sub NIA 095825 43.000 7,394N 7,394
NASA SUB ODURF 088355 FLLW 43.000 5,536N 5,536
NASA SUB ODURF 088356 FLLW 43.000 5,953N 5,953
Education 43.008 15,089N 15,089
327,640 327,640- Agency TotalsUS NASA
US National Endowment for the Arts (NEA)US National Endowment for the Arts (NEA)
Direct AwardsPromotion of the Arts Grants to Organizations and Individuals 45.024 7,140N 7,140
Pass through from Others - see also pass through detailPromotion of the Arts Grants to Organizations and Individuals 45.024 14,987N 14,987
Promotion of the Arts Partnership Agreements 45.025 4,000N 4,000
26,127 26,127- Agency TotalsUS National Endowment for the Arts (NEA)
US National Endowment for the Humanities (NEH)US National Endowment for the Humanities (NEH)
Direct AwardsPromotion of the Humanities Challenge Grants 45.130 28,659N 28,659
Other ProgramsUS National Endowment for the Humanities (NEH) FY19 SEFA
Cluster:Major Agency: Page 128

Cluster/Major Agency/Fed Agency/ Award Type/CFDA Prog Title or Award Title CFDA No. Urbana Chicago Springfield Total Fed ExpMaj Prog Total Subs Out Exp
Promotion of the Humanities Division of Preservation and Access 45.149 65,683N 65,683
Promotion of the Humanities Fellowships and Stipends 45.160 237,790N 237,790
Promotion of the Humanities Research 45.161 78,617N 78,617
Promotion of the Humanities Teaching and Learning Resources and Curriculum Development
45.162 32,789N 32,789
Promotion of the Humanities Professional Development 45.163 86,869N 86,869
Pass through from Others - see also pass through detailPromotion of the Humanities Office of Digital Humanities 45.169 10,304N 10,304
392,394 148,317 540,711- Agency TotalsUS National Endowment for the Humanities (NEH)
US National Science Foundation (NSF)UUS National Science Foundation (NSF)
Direct AwardsEducation and Human Resources 47.076 3,849N 3,849
Pass through from Others - see also pass through detailBiological Sciences 47.074 689N 689
4,538 4,538- Agency TotalsUS National Science Foundation (NSF)
US Nuclear Regulatory CommissionUS Nuclear Regulatory Commission
Direct AwardsU.S. Nuclear Regulatory Commission Scholarship and Fellowship Program 77.008 487,729N 487,729
487,729 487,729- Agency TotalsUS Nuclear Regulatory Commission
US State DepartmentUS State Department
Direct AwardsPublic Diplomacy Programs 19.040 249N 249
Program for Study of Eastern Europe and the Independent States of the Former Soviet Union
19.300 211,248N 211,248
Global Counterterrorism Programs 19.701 47,279N 47,279
Pass through from Others - see also pass through detail
Other ProgramsUS State Department FY19 SEFA
Cluster:Major Agency: Page 129

Cluster/Major Agency/Fed Agency/ Award Type/CFDA Prog Title or Award Title CFDA No. Urbana Chicago Springfield Total Fed ExpMaj Prog Total Subs Out Exp
STATE Sub USIEF OSI/2015/03 19.000 4,933N 4,933
Academic Exchange Programs - Scholars 19.401 86,329N 86,329
302,759 47,279 350,038- Agency TotalsUS State Department
- Cluster Totals 48,657,584 31,275,549 78,488 80,011,621 9,470,624Other Programs
SNAPCluster:____US Department of Agriculture (USDA)
UUSDA Food and Nutrition Service (FNS)
Pass through from State of IL - see also pass through detailState Administrative Matching Grants for the Supplemental Nutrition Assistance Program
10.561 9,977,149 3,087,252N 13,064,401
9,977,149 3,087,252 13,064,401- Agency TotalsUSDA Food and Nutrition Service (FNS)
- Cluster Totals 9,977,149 3,087,252 13,064,401SNAP
Special Education (IDEA)Cluster:____US Department of Education
US Department of Education
Pass through from State of IL - see also pass through detailSpecial Education Grants to States 84.027 534N 534
534 534- Agency TotalsUS Department of Education
- Cluster Totals 534 534Special Education (IDEA)
Student Financial AssistanceCluster:____US Department of Education
Federal Work Study programs
Direct AwardsFederal Work-Study Program 84.033 2,364,768 2,320,348 233,541N 4,918,657
2,364,768 2,320,348 233,541 4,918,657- Agency TotalsFederal Work Study programs
Office of Federal Student Aid
Non-Cash Federal AssistanceFederal Perkins Loan 84.038 13,464,962 17,154,054N 30,619,016
Student Financial AssistanceUS Department of Education FY19 SEFA
Cluster:Major Agency: Page 130

Cluster/Major Agency/Fed Agency/ Award Type/CFDA Prog Title or Award Title CFDA No. Urbana Chicago Springfield Total Fed ExpMaj Prog Total Subs Out Exp
Federal Direct Student Loans 84.268 205,612,690 238,268,369 17,381,704N 461,262,763
219,077,652 255,422,423 17,381,704 491,881,779- Agency TotalsOffice of Federal Student Aid
UUS Department of Education
Direct AwardsFederal Supplemental Educational Opportunity Grants 84.007 1,040,106 825,931 132,470N 1,998,507
Federal Pell Grant Program 84.063 39,691,707 52,236,991 4,360,701N 96,289,399
Teacher Education Assistance for College and Higher Education Grants (TEACH Grants)
84.379 24,333 17,428 6,538N 48,299
40,756,146 53,080,350 4,499,709 98,336,205- Agency TotalsUS Department of Education
US Health & Human Services (HHS)Health Resources and Services Administration (HRSA)
Non-Cash Federal AssistanceNurse Faculty Loan Program (NFLP) 93.264 196,160N 196,160
Health Professions Student Loans, Including Primary Care Loans/Loans for Disadvantaged Students
93.342 3,150,987 8,228,784N 11,379,771
Nursing Student Loans 93.364 889,182N 889,182
3,150,987 9,314,126 12,465,113- Agency TotalsHealth Resources and Services Administration (HRSA)
- Cluster Totals 265,349,553 320,137,247 22,114,954 607,601,754Student Financial Assistance
TANFCluster:____US Health & Human Services (HHS)
Administration for Children and Families (ACF)
Non-Cash Federal AssistanceTemporary Assistance for Needy Families 93.558 5,929,195Y 5,929,195
Pass through from State of IL - see also pass through detailTemporary Assistance for Needy Families 93.558 60,589Y 60,589
5,929,195 60,589 5,989,784- Agency TotalsAdministration for Children and Families (ACF)
- Cluster Totals 5,929,195 60,589 5,989,784TANF
TRIOCluster:____US Department of Education
TRIOUS Department of Education FY19 SEFA
Cluster:Major Agency: Page 131

Cluster/Major Agency/Fed Agency/ Award Type/CFDA Prog Title or Award Title CFDA No. Urbana Chicago Springfield Total Fed ExpMaj Prog Total Subs Out Exp
UUS Department of Education
Direct AwardsTRIO Student Support Services 84.042 345,193 251,140N 596,333
TRIO Talent Search 84.044 310,500N 310,500
TRIO Upward Bound 84.047 450,432 395,026N 845,458
TRIO McNair Post-Baccalaureate Achievement 84.217 306,306N 306,306
1,412,431 646,166 2,058,597- Agency TotalsUS Department of Education
- Cluster Totals 1,412,431 646,166 2,058,597TRIO
WIOACluster:____US Department of Labor (DOL)
US Department of Labor (DOL)
Pass through from Others - see also pass through detailWIOA Youth Activities 17.259 12,923N 12,923
12,923 12,923- Agency TotalsUS Department of Labor (DOL)
- Cluster Totals 12,923 12,923WIOA
GRAND TOTALS: 732,613,156 568,946,050 23,234,422
Urbana Chicago SpringfieldMajor Program Codes:
Y - Cluster, program, or award tested as a major programN - Not tested as a major program
Schedule of Expenditures of Federal Awards presentation:See also the notes to the Schedule of Expenditures of Federal Awards; these notes are an integral part of this Schedule.
Total Fed Exp Total Subs Out Exp
1,324,793,628 100,449,362
"Total Subs Out Exp" column contains totals of payments out to subrecipientsthese amounts are included in "Total Fed Exp" and are not additional expenditures
WIOAUS Department of Labor (DOL) FY19 SEFA
Cluster:Major Agency: Page 132

CFDA # Total Fed Exp Total Subs Out Exp CFDA Program description
10.000 Department of Agriculture (non-specific) 291,421 $218,40210.001 Agricultural Research Basic and Applied Research 41,67610.025 Plant and Animal Disease, Pest Control, and Animal Care 48,81810.028 Wildlife Services 3,43710.170 Specialty Crop Block Grant Program - Farm Bill 3,48310.172 Local Food Promotion Program 21,25610.200 Grants for Agricultural Research, Special Research Grants 86,63510.210 Higher Education – Graduate Fellowships Grant Program 55,39010.215 Sustainable Agriculture Research and Education 23,73310.217 Higher Education - Institution Challenge Grants Program 6,17810.223 Hispanic Serving Institutions Education Grants 52,06210.290 Agricultural Market and Economic Research 55,33610.303 Integrated Programs 5,21510.310 Agriculture and Food Research Initiative (AFRI) 211,02110.326 Capacity Building for Non-Land Grant Colleges of Agriculture (NLGCA) 13,94810.329 Crop Protection and Pest Management Competitive Grants Program 1,279,448 672,20910.500 Cooperative Extension Service 17,887,27510.515 Renewable Resources Extension Act and National Focus Fund Projects 44,29110.557 WIC Special Supplemental Nutrition Program for Women, Infants, and Children 169,60310.558 Child and Adult Care Food Program 76,39810.560 State Administrative Expenses for Child Nutrition 871,46910.610 Export Guarantee Program 27,95010.664 Cooperative Forestry Assistance 194,74410.675 Urban and Community Forestry Program 9,00810.684 International Forestry Programs 6,34310.902 Soil and Water Conservation 35,16611.000 Department of Commerce (non-specific) 492,04411.417 Sea Grant Support 997,842 $616,47111.419 Coastal Zone Management Administration Awards 30,21211.431 Climate and Atmospheric Research 31,10211.432 National Oceanic and Atmospheric Administration (NOAA) Cooperative Institutes 135,728 $57,04211.462 Hydrologic Research 65,13511.609 Measurement and Engineering Research and Standards 1,19311.620 Science, Technology, Business and/or Education Outreach 9012.000 Department of Defense (non-specific) 265,10512.225 Commercial Technologies for Maintenance Activities Program 56,03112.300 Basic and Applied Scientific Research 168,32912.400 Military Construction, National Guard 1,617,13812.431 Basic Scientific Research 26,19712.617 Economic Adjustment Assistance for State Governments 1,088,598 $634,29712.630 Basic, Applied, and Advanced Research in Science and Engineering 6,48912.910 Research and Technology Development 10,65114.000 Department of Housing and Urban Development (non-specific) 44,07514.228 Community Development Block Grants/State's program and Non-Entitlement Grants in Haw 772,80214.241 Housing Opportunities for Persons with AIDS 584,15015.000 Department of the Interior (non-specific) 52,45215.634 State Wildlife Grants 40,84515.662 Great Lakes Restoration 75,37615.805 Assistance to State Water Resources Research Institutes 1,197,741 643,99815.814 National Geological and Geophysical Data Preservation 26,90815.945 Cooperative Research and Training Programs – Resources of the National Park System 2,88115.980 National Ground-Water Monitoring Network 103,72115.981 Water Use and Data Research 97,65716.015 Missing Alzheimer's Disease Patient Assistance Program 57,45316.526 OVW Technical Assistance Initiative 62,98016.540 Juvenile Justice and Delinquency Prevention 113,230 10,123
FY19 SEFA Totals by CFDA program code, "Other Programs" only Page 133
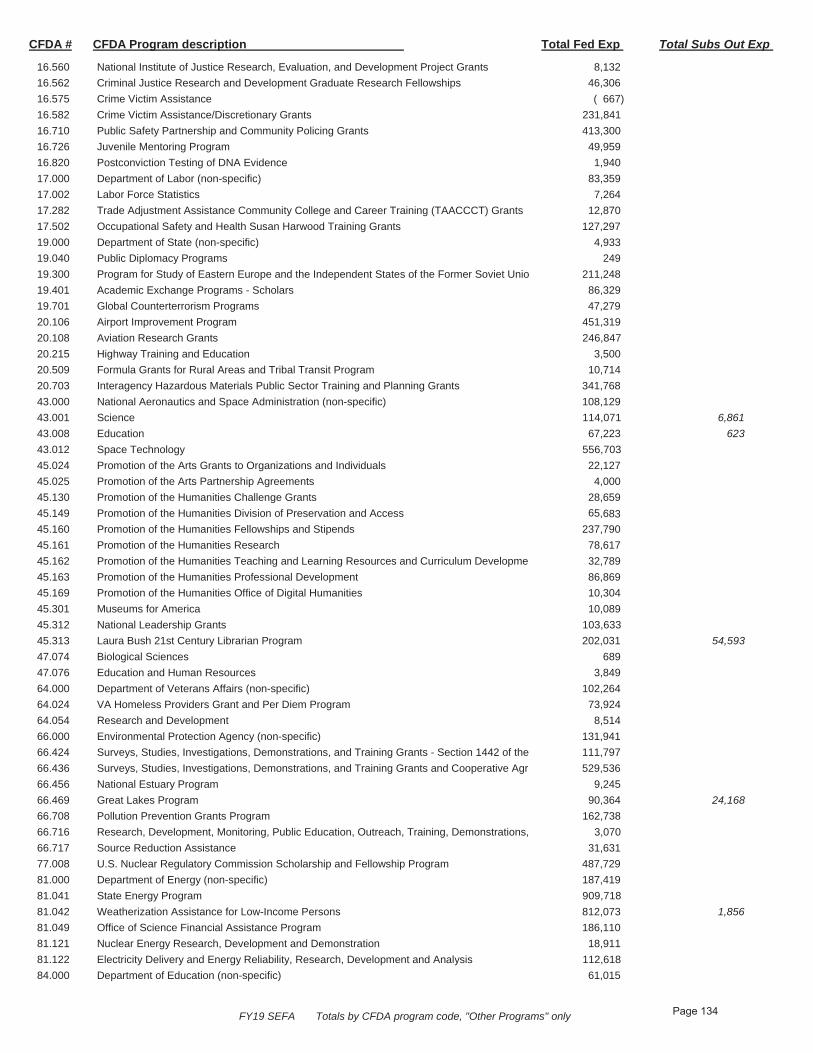
CFDA # Total Fed Exp Total Subs Out Exp CFDA Program description
16.560 National Institute of Justice Research, Evaluation, and Development Project Grants 8,13216.562 Criminal Justice Research and Development Graduate Research Fellowships 46,30616.575 Crime Victim Assistance ( 667)16.582 Crime Victim Assistance/Discretionary Grants 231,84116.710 Public Safety Partnership and Community Policing Grants 413,30016.726 Juvenile Mentoring Program 49,95916.820 Postconviction Testing of DNA Evidence 1,94017.000 Department of Labor (non-specific) 83,35917.002 Labor Force Statistics 7,26417.282 Trade Adjustment Assistance Community College and Career Training (TAACCCT) Grants 12,87017.502 Occupational Safety and Health Susan Harwood Training Grants 127,29719.000 Department of State (non-specific) 4,93319.040 Public Diplomacy Programs 24919.300 Program for Study of Eastern Europe and the Independent States of the Former Soviet Unio 211,24819.401 Academic Exchange Programs - Scholars 86,32919.701 Global Counterterrorism Programs 47,27920.106 Airport Improvement Program 451,31920.108 Aviation Research Grants 246,84720.215 Highway Training and Education 3,50020.509 Formula Grants for Rural Areas and Tribal Transit Program 10,71420.703 Interagency Hazardous Materials Public Sector Training and Planning Grants 341,76843.000 National Aeronautics and Space Administration (non-specific) 108,12943.001 Science 114,071 6,86143.008 Education 67,223 62343.012 Space Technology 556,70345.024 Promotion of the Arts Grants to Organizations and Individuals 22,12745.025 Promotion of the Arts Partnership Agreements 4,00045.130 Promotion of the Humanities Challenge Grants 28,65945.149 Promotion of the Humanities Division of Preservation and Access 65,68345.160 Promotion of the Humanities Fellowships and Stipends 237,79045.161 Promotion of the Humanities Research 78,61745.162 Promotion of the Humanities Teaching and Learning Resources and Curriculum Developme 32,78945.163 Promotion of the Humanities Professional Development 86,86945.169 Promotion of the Humanities Office of Digital Humanities 10,30445.301 Museums for America 10,08945.312 National Leadership Grants 103,63345.313 Laura Bush 21st Century Librarian Program 202,031 54,59347.074 Biological Sciences 68947.076 Education and Human Resources 3,84964.000 Department of Veterans Affairs (non-specific) 102,26464.024 VA Homeless Providers Grant and Per Diem Program 73,92464.054 Research and Development 8,51466.000 Environmental Protection Agency (non-specific) 131,94166.424 Surveys, Studies, Investigations, Demonstrations, and Training Grants - Section 1442 of the 111,79766.436 Surveys, Studies, Investigations, Demonstrations, and Training Grants and Cooperative Agr 529,53666.456 National Estuary Program 9,24566.469 Great Lakes Program 90,364 24,16866.708 Pollution Prevention Grants Program 162,73866.716 Research, Development, Monitoring, Public Education, Outreach, Training, Demonstrations, 3,07066.717 Source Reduction Assistance 31,63177.008 U.S. Nuclear Regulatory Commission Scholarship and Fellowship Program 487,72981.000 Department of Energy (non-specific) 187,41981.041 State Energy Program 909,71881.042 Weatherization Assistance for Low-Income Persons 812,073 1,85681.049 Office of Science Financial Assistance Program 186,11081.121 Nuclear Energy Research, Development and Demonstration 18,91181.122 Electricity Delivery and Energy Reliability, Research, Development and Analysis 112,61884.000 Department of Education (non-specific) 61,015
FY19 SEFA Totals by CFDA program code, "Other Programs" only Page 134

CFDA # Total Fed Exp Total Subs Out Exp CFDA Program description
84.002 Adult Education - Basic Grants to States 58,52584.010 Title I Grants to Local Educational Agencies 95,86684.015 National Resource Centers Program for Foreign Language and Area Studies or Foreign Lan 1,752,457 345,78884.022 Overseas Programs - Doctoral Dissertation Research Abroad 27,97984.031 Higher Education Institutional Aid 336,23284.048 Career and Technical Education -- Basic Grants to States 308,69784.200 Graduate Assistance in Areas of National Need 552,46384.325 Special Education - Personnel Development to Improve Services and Results for Children w 2,139,60584.335 Child Care Access Means Parents in School 16,85484.366 Mathematics and Science Partnerships 131,222 66,75284.367 Supporting Effective Instruction State Grants (formerly Improving Teacher Quality State Gra 108,50884.411 Education Innovation and Research (formerly Investing in Innovation (i3) Fund) 27,79784.412 Race to the Top Early Learning Challenge 66,18285.601 Smithsonian Institution Fellowship Program 5,00089.003 National Historical Publications and Records Grants 75,96090.300 Japan-U.S. Friendship Commission Grants 5,00093.000 Department of Health and Human Services (non-specific) 332,79293.011 National Organizations of State and Local Officials 41,09693.059 Training in General, Pediatric, and Public Health Dentistry 192,06893.070 Environmental Public Health and Emergency Response 198,288 32,27493.079 Cooperative Agreements to Promote Adolescent Health through School-Based HIV/STD Pr 6,61393.103 Food and Drug Administration Research 7,78393.107 Area Health Education Centers 1,421,069 1,018,25893.110 Maternal and Child Health Federal Consolidated Programs 27,30393.134 Grants to Increase Organ Donations 110,83093.145 HIV-Related Training and Technical Assistance 3,413,045 2,155,52193.153 Coordinated Services and Access to Research for Women, Infants, Children, and Youth 307,01993.157 Centers of Excellence 15,23993.161 Health Program for Toxic Substances and Disease Registry 209,017 30,55193.184 Disabilities Prevention 8,73393.217 Family Planning Services 68,71293.243 Substance Abuse and Mental Health Services Projects of Regional and National Significanc 816,884 60,80793.251 Early Hearing Detection and Intervention 221,258 62,50093.270 Viral Hepatitis Prevention and Control 174,65993.297 Teenage Pregnancy Prevention Program 83,43493.310 Trans-NIH Research Support 24,08693.331 Partnerships to Improve Community Health 5,38693.395 Cancer Treatment Research 5,09793.424 NON-ACA/PPHF—Building Capacity of the Public Health System to Improve Population He 18,09293.433 ACL National Institute on Disability, Independent Living, and Rehabilitation Research 226,363 2,87093.516 Public Health Training Centers Program 277,378 173,61393.526 Grants for Capitall Development in Health Centers 57,04693.568 Low-Income Home Energy Assistance 812,073 1,85693.586 State Court Improvement Program 66,43493.600 Head Start 4,244,153 862,34293.610 Health Care Innovation Awards (HCIA) 695,00493.638 ACA-Transforming Clinical Practice Initiative: Practice Transformation Networks (PTNs) 75,72793.643 Children's Justice Grants to States 167,54393.667 Social Services Block Grant 110,78993.669 Child Abuse and Neglect State Grants 95,00093.732 Mental and Behavioral Health Education and Training Grants 235,24393.788 Opioid STR 793.822 Health Careers Opportunity Program 639,78793.844 ACL Centers for Independent Living, Recovery Act 170,28393.846 Arthritis, Musculoskeletal and Skin Diseases Research 37693.859 Biomedical Research and Research Training 136,37293.884 Grants for Primary Care Training and Enhancement 19,51293.898 Cancer Prevention and Control Programs for State, Territorial and Tribal Organizations 50,658
FY19 SEFA Totals by CFDA program code, "Other Programs" only Page 135

CFDA # Total Fed Exp Total Subs Out Exp CFDA Program description
93.912 Rural Health Care Services Outreach, Rural Health Network Development and Small Health 94,75693.914 HIV Emergency Relief Project Grants 1,945,08393.917 HIV Care Formula Grants 899,47493.918 Grants to Provide Outpatient Early Intervention Services with Respect to HIV Disease 892,99093.926 Healthy Start Initiative 7,53393.940 HIV Prevention Activities Health Department Based 44,03393.959 Block Grants for Prevention and Treatment of Substance Abuse 797,77093.965 Coal Miners Respiratory Impairment Treatment Clinics and Services 940,222 505,91493.969 PPHF Geriatric Education Centers 876,00193.994 Maternal and Child Health Services Block Grant to the States 5,893,56694.006 AmeriCorps 149,687 142,20897.000 Department of Homeland Security (non-specific) 85,98497.043 State Fire Training Systems Grants 34,13197.044 Assistance to Firefighters Grant 902,946 321,15797.045 Cooperating Technical Partners 2,740,54597.047 Pre-Disaster Mitigation 125,34297.067 Homeland Security Grant Program 2,047,99098.000 Agency for International Development (non-specific) 647,283 182,37898.001 USAID Foreign Assistance for Programs Overseas 1,460,493 565,19299.999 Other Awards (non-specific) 34,076
$80,011,621Grand Totals $9,470,624
Total Fed Exp Total Subs Out Exp
FY19 SEFA Totals by CFDA program code, "Other Programs" only Page 136
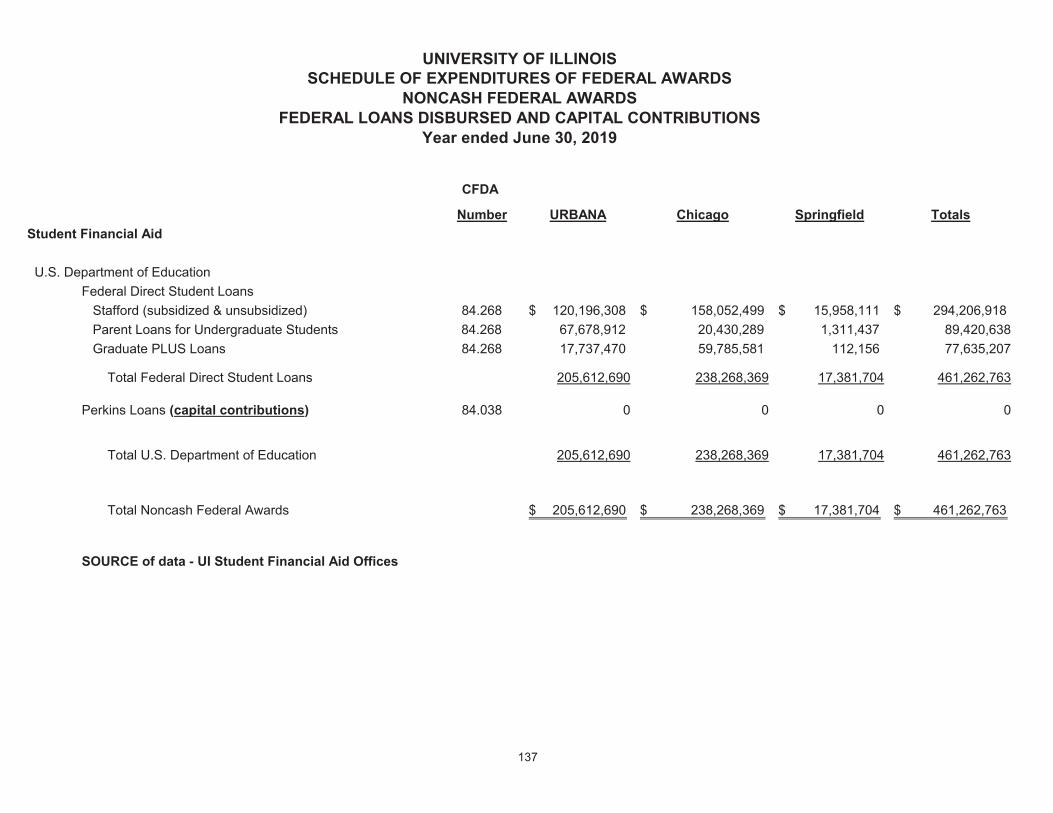
UNIVERSITY OF ILLINOISSCHEDULE OF EXPENDITURES OF FEDERAL AWARDS
NONCASH FEDERAL AWARDSFEDERAL LOANS DISBURSED AND CAPITAL CONTRIBUTIONS
Year ended June 30, 2019
CFDA
Number URBANA Chicago Springfield TotalsStudent Financial Aid
U.S. Department of EducationFederal Direct Student Loans
Stafford (subsidized & unsubsidized) 84.268 120,196,308$ 158,052,499$ 15,958,111$ 294,206,918$ Parent Loans for Undergraduate Students 84.268 67,678,912 20,430,289 1,311,437 89,420,638Graduate PLUS Loans 84.268 17,737,470 59,785,581 112,156 77,635,207
Total Federal Direct Student Loans 205,612,690 238,268,369 17,381,704 461,262,763
Perkins Loans (capital contributions) 84.038 0 0 0 0
Total U.S. Department of Education 205,612,690 238,268,369 17,381,704 461,262,763
Total Noncash Federal Awards 205,612,690$ 238,268,369$ 17,381,704$ 461,262,763$
SOURCE of data - UI Student Financial Aid Offices
137

CFDA Number URBANA CHICAGO SPRINGFIELD Totals
Value of Perkins loans administrative allowance 84.038 -$ -$ -$ -$
Value of new loans issued to students for Perkins 84.038 0 0 0 0
Value of new loans issued to students for HPSL 93.342 651,200 1,334,346 0 1,985,546
Value of new loans issued to students for NFLP 93.264 0 0 0 0
Value of new loans issued to students for Nursing 93.364 0 249,344 0 249,344
Value of new loans issued for LDS 93.342 88,800 115,000 0 203,800
Total value of new loans issued 740,000$ 1,698,690$ -$ 2,438,690$
Loan Balance Outstanding - Perkins 84.038 11,527,377 13,805,901.00 0 25,333,278
Loan Balance Outstanding - HPSL 93.342 2,319,700 6,967,294 0 9,286,994
Loan Balance Outstanding - NFLP 93.264 0 165,959 0 165,959
Loan Balance Outstanding - Nursing 93.364 0 737,822 0 737,822
Loan Balance Outstanding - LDS 93.342 454,276 360,550 0 814,826
Total balance outstanding 14,301,353$ 22,037,526$ -$ 36,338,879$
Perkins = Federal Perkins Loan Program
HPSL = Health Professions Student Loans
NFLP = Nurse Faculty Loan Program SOURCE of data - UI Student Financial Aid Offices
Nursing = Nursing Student Loans Program
LDS = Loans to Disadvantaged Students
Student Loan Disclosure
UNIVERSITY OF ILLINOISSCHEDULE OF LOANS ISSUED AND OUTSTANDING BALANCES
Year ended June 30, 2019
138

UNIVERSITY OF ILLINOISSCHEDULE OF EXPENDITURES OF FEDERAL AWARDS
Year Ended June 30, 2019
Details for Pass-Through Federal Funding Received by UI as Subawardee and Funding Received from DOE Labs
Urbana Chicago SpringfieldTotal for Pass-Through Detail
Pass-Through Entity
CFDA Number / U of I Grant Code / Pass-Through Award Title
ClusterFed Agency Major
Program
55 Lakes Energy LLC1R&DCluster:
US Department of Energy (DOE)Fed Agency:1 15 Lakes Energy MEO-16-00181.041 G3649/ / Y
1 1Pass-through entity total:
ABB Incorporated1R&DCluster:
US Department of Energy (DOE)Fed Agency:290,308 290,308DOE Sub ABB 08530781.000 AE879/ / Y171,869 171,869DOE Sub ABB 08530681.000 AE880/ / Y32,045 32,045DOE Sub ABB DE-OE000089681.000 AF017/ / Y
494,222 494,222Pass-through entity total:
Academy of Applied Sciences1R&DCluster:
ArmyFed Agency:3,999 3,999Army Sub AAS 09220612.000 AF579/ / Y
Other ProgramsCluster:ArmyFed Agency:
1,000 1,000Army Sub AAS 08949712.000 AF885/ / N
4,999 4,999Pass-through entity total:
Administrative Offices of Illinois CourtsOther ProgramsCluster:
US Health & Human Services (HHS)Fed Agency:29,554 29,554AOIC CIPTRNG-G-180293.586 D5647/ / N36,880 36,880AOIC CIPTRNG-G-170193.586 D5805/ / N
66,434 66,434Pass-through entity total:
FY19 SEFA Pass-through detailsAdministrative Offices of Illinois Courts Page 139

Urbana Chicago SpringfieldTotal for Pass-Through Detail
Pass-Through Entity
CFDA Number / U of I Grant Code / Pass-Through Award Title
ClusterFed Agency Major
Program
AAdministrators of the Tulane Edctnl Fund/Tulane University1R&DCluster:
NIH / National Institute of Child Health & Human DevelopmentFed Agency:14,524 14,524Tulane TUL-HSC-556624-18/1993.865 E3331/ / Y
NIH / National Institutes of HealthFed Agency:23,142 23,142Tulane IP004434993.847 E0752/ / Y
37,666 37,666Pass-through entity total:
Advanced Reproductive Testing LLC1R&DCluster:
NIH / National Institutes of HealthFed Agency:58,611 58,611NIH SUB TTA ART 08738193.865 AE494/ / Y
58,611 58,611Pass-through entity total:
Aerodyne Research Inc1R&DCluster:
US Department of Energy (DOE)Fed Agency:2,440 2,440DOE Sub ARI ARI 11484-181.000 AF103/ / Y
2,440 2,440Pass-through entity total:
AgeOptions1R&DCluster:
US Health & Human Services (HHS)Fed Agency:-2,607 -2,607HHS SUB AO 90CS0050-01-0093.734 AC596/ / Y
7,197 7,197Age Options93.734 E0922/ / YAgingCluster:
Administration for Community LivingFed Agency:7,370 7,370HHS SUB AO 09328193.044 AF332/ / N
4,763 7,197 11,960Pass-through entity total:
AIDS Foundation of Chicago1R&DCluster:
NIH / National Institutes of HealthFed Agency:174,974 174,974AFC E040293.914 E0402/ / Y28,393 28,393AFC Ryan White Part B93.917 E0376/ / Y
Other ProgramsCluster:Health Resources and Services Administration (HRSA)Fed Agency:
353,074 353,074AIDS Fdn of Chicago93.914 E0835/ / N
FY19 SEFA Pass-through detailsAIDS Foundation of Chicago Page 140

Urbana Chicago SpringfieldTotal for Pass-Through Detail
Pass-Through Entity
CFDA Number / U of I Grant Code / Pass-Through Award Title
ClusterFed Agency Major
Program
113,790 113,790AIDS Fdn of Chgo93.917 E0857/ / N
670,231 670,231Pass-through entity total:
AAlbert Einstein College of Medicine1R&DCluster:
NIH / National Heart Lung & Blood InstituteFed Agency:113,946 113,946Albert Einstein31195A P070458893.837 E1313/ / Y
NIH / National Institute on Minority Health & Health DisparitiesFed Agency:16,886 16,886AlbertEinstein 31106A P070377493.307 E1455/ / Y
130,832 130,832Pass-through entity total:
Alliance for Clinical Trials in Oncology Foundation1R&DCluster:
NIH / National Cancer InstituteFed Agency:366 366Alliance A041701-06524393.385 E0489/ / Y67 67Alliance Foundation A03150193.395 E0888/ / Y
161 161Alliance A01140193.395 E0893/ / YNIH / National Institutes of HealthFed Agency:
343 343Alliance A01150293.395 E1194b/ / Y1,494 1,494Alliance Foundation-Protocol# E191093.395 E2815/ / Y
US Department of Defense (DoD)Fed Agency:399 399Alliance A01150212.420 E1194a/ / Y
2,830 2,830Pass-through entity total:
AMEC Incorporated/AMEC E&I IncorporatedOther ProgramsCluster:
US Environmental Protection Agency (EPA)Fed Agency:11,254 11,254EPA Sub MACTEC EP-W-16-01566.000 AE757/ / N
11,254 11,254Pass-through entity total:
American Academy of PediatricsOther ProgramsCluster:
Centers for Disease Control and Prevention (CDC)Fed Agency:209,017 209,017AAP Subaward no. 771105_UIC93.161 E2361/ / N
209,017 209,017Pass-through entity total:
FY19 SEFA Pass-through detailsAmerican Academy of Pediatrics Page 141

Urbana Chicago SpringfieldTotal for Pass-Through Detail
Pass-Through Entity
CFDA Number / U of I Grant Code / Pass-Through Award Title
ClusterFed Agency Major
Program
AAmerican College of Sports Medicine (ACSM)1R&DCluster:
US NASAFed Agency:7,169 7,169NASA SUB ACSM 18-0066443.000 AF339/ / Y
7,169 7,169Pass-through entity total:
American Educational Research Assoc (AERS)1R&DCluster:
US National Science Foundation (NSF)Fed Agency:2,000 2,000SBC AERA 08713747.000 AE354/ / Y
2,000 2,000Pass-through entity total:
American Institute Chemical Engineers (AICHE)1R&DCluster:
US Department of Energy (DOE)Fed Agency:106,340 106,340DOE Sub AIChE DE-EE0007888-10-581.087 AF226/ / Y
106,340 106,340Pass-through entity total:
American Institutes for Research1R&DCluster:
US Health & Human Services (HHS)Fed Agency:24,955 24,955AIR PO# 028320070593.000 E0769/ / Y
US National Science Foundation (NSF)Fed Agency:68,583 68,583AIR 036690000247.076 E2374/ / Y
93,538 93,538Pass-through entity total:
American Planning AssociationOther ProgramsCluster:
US Department of CommerceFed Agency:11,514 11,514COM NOAA Sub APA 08393411.431 AE781/ / N
11,514 11,514Pass-through entity total:
American Psychiatric Association1R&DCluster:
Substance Abuse & Mental Health Services Admin (SAMHSA)Fed Agency:250 250APA SAMHSA93.243 E0522/ / Y
28,073 28,073American Psychiatric Association93.959 E0580/ / Y
FY19 SEFA Pass-through detailsAmerican Psychiatric Association Page 142

Urbana Chicago SpringfieldTotal for Pass-Through Detail
Pass-Through Entity
CFDA Number / U of I Grant Code / Pass-Through Award Title
ClusterFed Agency Major
Program
28,323 28,323Pass-through entity total:
AAnn & Robert H Lurie Childrens Hospital of Chicago1R&DCluster:
NIH / National Institutes of HealthFed Agency:4,060 4,060 Lurie 915771-UIC93.847 E0961/ / Y
4,060 4,060Pass-through entity total:
Ann & Robert H Lurie Children's Hospital of Chicago1R&DCluster:
NIH / National Heart Lung & Blood InstituteFed Agency:19,765 19,765Ann and Robert H. Lurie 901550-UIC93.839 E0553/ / Y53,349 53,349Ann and Robert Lurie Children Hos93.839 E1042/ / Y
NIH / National Institute of Child Health & Human DevelopmentFed Agency:18,952 18,952Lurie Children's Hosp 901515-UIC93.865 E1033/ / Y
NIH / National Institute on Drug AbuseFed Agency:24,911 24,911Children's Hosp of Chgo 901505-UIC93.279 E1926/ / Y
116,977 116,977Pass-through entity total:
Applied Material Systems Engineering Inc (AMSENG)1R&DCluster:
US NASAFed Agency:292 292NASA SUB AMSENG PO-17-03643.000 AE476/ / Y
292 292Pass-through entity total:
Applied Pavement Technology Inc1R&DCluster:
US Department of Transportation (DOT)Fed Agency:72,899 72,899DOT Sub APT TOPR4-15-001-RR04-UIUC20.000 AE147/ / Y
3,663 3,663DOT Sub APT TOPR 3-15-001-RR03-UIUC20.000 AE269/ / Y25,542 25,542DOT Sub APT TOPR 2-15-001-RR02-UIUC20.000 AE270/ / Y
102,104 102,104Pass-through entity total:
Archbold Expeditions/MacArthur Agro-Ecology Research Center1R&DCluster:
National Institute of Food and Agriculture/USDAFed Agency:15,661 15,661AG Sub Archbold 2016-67019-2498810.310 AC265/ / Y
FY19 SEFA Pass-through detailsArchbold Expeditions/MacArthur Agro-Ecology Research Center Page 143

Urbana Chicago SpringfieldTotal for Pass-Through Detail
Pass-Through Entity
CFDA Number / U of I Grant Code / Pass-Through Award Title
ClusterFed Agency Major
Program
15,661 15,661Pass-through entity total:
AArcher Daniels Midland Company1R&DCluster:
US Department of Energy (DOE)Fed Agency:71,051 71,051DOE ADM 2015-0709081.000 AB305/ / Y
71,051 71,051Pass-through entity total:
Argonne National Lab1R&DCluster:
Argonne National LabFed Agency:16,199 16,199DOE Sub ANL 3F-3114581.000 AA882/ / Y
102,610 102,610DOE ANL 4J-30401-0002A81.000 AB504/ / Y235,277 235,277DOE Sub ANL 4F-3200181.000 AB670/ / Y95,921 95,921DOE ANL 08665481.000 AE450/ / Y67,471 67,471DOE ANL 4J-30401-0018A81.000 AE625/ / Y31,945 31,945DOE ANL 4J-30401-0017A81.000 AE778/ / Y
9,420 9,420DOE ANL 4J-30401-0027A81.000 AF177/ / Y163,501 163,501DOE ANL 9F-6001981.000 AF228/ / Y78,428 78,428DOE ANL 4J-30401-0025A81.000 AF628/ / Y
963,898 963,898DOE ANL 8F-3014081.000 AF646/ / Y55,480 55,480DOE ANL 4J-30401-0023A81.000 AF731/ / Y36,031 36,031DOE ANL 4J-30401-0022A81.000 AF939/ / Y
2,802 2,802DOE ANL 4J-30401-0021A81.000 AF969/ / Y5,849 5,849ANL 4J-30361-0036A81.000 E0495/ / Y6,263 6,263ANL 4J-30361-0035A81.000 E0502/ / Y
20,530 20,530ANL 9F-6000481.000 E0574/ / Y104,946 104,946Argonne National Lab 4J3036J81.000 E0600/ / Y69,963 69,963ANL WO 4J-30361-0033A81.000 E0738/ / Y38,964 38,964Argonne National Labs 4J303610032A81.000 E0770/ / Y71,267 71,267ANL 4J-30361-0031A81.000 E0774/ / Y
204,646 204,646ANL 8F-30149 M000281.000 E0779/ / Y209,135 209,135ANL 8F-30149 M000281.000 E0803/ / Y118,698 118,698ANL 4J-30361-0029A81.000 E0891/ / Y203,378 203,378ANL 4J-303061-0030A81.000 E0908/ / Y125,741 125,741Joint Appoint ARGONNE LLC81.000 E1299/ / Y72,166 72,166ANL WO 4J-030361-0027D81.000 E1365/ / Y
241,041 241,041ANL 4J30361 WO 4J-30361-0026B81.000 E1371/ / Y
FY19 SEFA Pass-through detailsArgonne National Lab Page 144

Urbana Chicago SpringfieldTotal for Pass-Through Detail
Pass-Through Entity
CFDA Number / U of I Grant Code / Pass-Through Award Title
ClusterFed Agency Major
Program
100,502 100,502ANL 4J-30361 WO 4J-30361-0021A81.000 E1401/ / Y116,536 116,536ANL 4J-30361 WO 4J-30361-0017D81.000 E1741/ / Y60,211 60,211ANL 4J-30361 WO 4J-30361-0018A81.000 E1906/ / Y90,095 90,095ANL 4J-30361 WO 4J-30361-0016A RevC81.000 E1912/ / Y44,721 44,721ANL 4J-30361 WO 4J-30361-0011D81.000 E2016/ / Y74,146 74,146ANL 4J-30361 WO 4J-30361-0013A81.000 E2084/ / Y12,538 12,538ANL 4J-30361 WO 4J-30361-0004D81.000 E2310/ / Y
1,380 1,380ANL 4J-30361 WO 4J-30361-0005A81.000 E2311/ / Y9,482 9,482ANL 4J-30361 WO 4J-30361-0002A81.000 E2328/ / Y
88,251 88,251ANL Joint Hire Agreemnt81.000 E2329/ / Y73 73ANL 3F-3262181.000 E2904/ / Y
Other ProgramsCluster:Argonne National LabFed Agency:
14,639 14,639DOE ANL 4J-30401-0010A81.000 AB099/ / N1,260 1,260DOE ANL 5A-39120 TTA81.000 AB193/ / N1,962 1,962DOE ANL 7E-3002881.000 AE395/ / N1,929 1,929DOE ANL 4J-30401-0019A TTA81.000 AE500/ / N
278 278DOE ANL 00474739 ANTC81.000 AF067/ / N15,014 15,014DOE ANL 4J-30401-0026A TTA81.000 AF227/ / N44,426 44,426DOE ANL 4J30401-0024A81.000 AF497/ / N
1,938,491 2,090,522 4,029,013Pass-through entity total:
AArgonne National Laboratory1R&DCluster:
US Department of Energy (DOE)Fed Agency:5,153 5,153ANL US DOE81.005 E0371/ / Y
5,153 5,153Pass-through entity total:
Arizona State University1R&DCluster:
NIH / National Institutes of HealthFed Agency:30,245 30,245NIH Sub TTA ASU 093777793.859 AF240/ / Y
US Environmental Protection Agency (EPA)Fed Agency:8,507 8,507AZ State University 14-49566.509 E2691/ / Y
30,245 8,507 38,752Pass-through entity total:
FY19 SEFA Pass-through detailsArizona State University Page 145

Urbana Chicago SpringfieldTotal for Pass-Through Detail
Pass-Through Entity
CFDA Number / U of I Grant Code / Pass-Through Award Title
ClusterFed Agency Major
Program
AArkansas State Game and Fish Commission1R&DCluster:
US Department of InteriorFed Agency:26,670 26,670INT Sub AR Game & Comm 09362915.634 AF171/ / Y
26,670 26,670Pass-through entity total:
ARS InternationalOther ProgramsCluster:
Los Alamos National LabFed Agency:11,244 11,244DOE ARS Int'l 2015-01499 TTA81.000 AB395/ / N
11,244 11,244Pass-through entity total:
Arts MidwestOther ProgramsCluster:
US National Endowment for the Arts (NEA)Fed Agency:14,987 14,987NEA Sub Arts 0002185045.024 AF730/ / N
4,000 4,000NEA Sub Arts 09347845.025 AF316/ / N
18,987 18,987Pass-through entity total:
ASRC Federal Holding Company1R&DCluster:
US NASAFed Agency:3,032 3,032ASRC PO SHR1-0141043.000 E0996/ / Y
3,032 3,032Pass-through entity total:
Assoc of State and Territorial Health Officials ASTHO1R&DCluster:
NIH / National Institutes of HealthFed Agency:4,107 4,107ASTHO Requisition 1976 86-2921193.000 E0561/ / Y
Other ProgramsCluster:Centers for Disease Control and Prevention (CDC)Fed Agency:
8,092 8,092Assn of State and Territorial Hlth93.424 E0968/ / N
12,199 12,199Pass-through entity total:
Association for Asian Studies IncorporatedOther ProgramsCluster:
Japan-US Friendship CommissionFed Agency:5,000 5,000JUSFC NEAC AAS 09357490.300 AF155/ / N
FY19 SEFA Pass-through detailsAssociation for Asian Studies Incorporated Page 146

Urbana Chicago SpringfieldTotal for Pass-Through Detail
Pass-Through Entity
CFDA Number / U of I Grant Code / Pass-Through Award Title
ClusterFed Agency Major
Program
5,000 5,000Pass-through entity total:
AAssociation of American Geographers1R&DCluster:
US National Science Foundation (NSF)Fed Agency:111,419 111,419SBC AAG F7034-UIUC47.075 AF236/ / Y
111,419 111,419Pass-through entity total:
Association of Zoos & Aquariums1R&DCluster:
USDA Animal & Plant Health Inspection Serv (APHIS)Fed Agency:5,816 5,816AG Sub AZA 08929410.025 AF994/ / Y
5,816 5,816Pass-through entity total:
ATSP Innovations1R&DCluster:
US NASAFed Agency:-282 -282NASA SUB ATSP 08921743.000 AE057/ / Y
-2 -2NASA SUB ATSP 08918043.000 AE058/ / Y57,767 57,767NASA Sub ATSP 09087143.000 AF072/ / Y
57,483 57,483Pass-through entity total:
Auburn University1R&DCluster:
National Institute of Food and Agriculture/USDAFed Agency:75,251 75,251AG Sub Auburn 17-AGR-373058-UIUC10.310 AE284/ / Y
US Department of InteriorFed Agency:8,511 8,511INT Sub Auburn 18-BS-223045-UNIVILU15.611 AF334/ / Y
US National Science Foundation (NSF)Fed Agency:5,023 5,023SBC Auburn 17-CE-200642-UIUC47.041 AE052/ / Y
Other ProgramsCluster:National Institute of Food and Agriculture/USDAFed Agency:
95,524 95,524AG Sub AU 15-CHS-205205-UIUC10.200 AC719/ / NUS Department of Agriculture (USDA)Fed Agency:
188,778 188,778AG Sub Auburn 18-CHS-205205-UIUC10.500 AF880/ / Y
373,087 373,087Pass-through entity total:
FY19 SEFA Pass-through detailsAuburn University Page 147
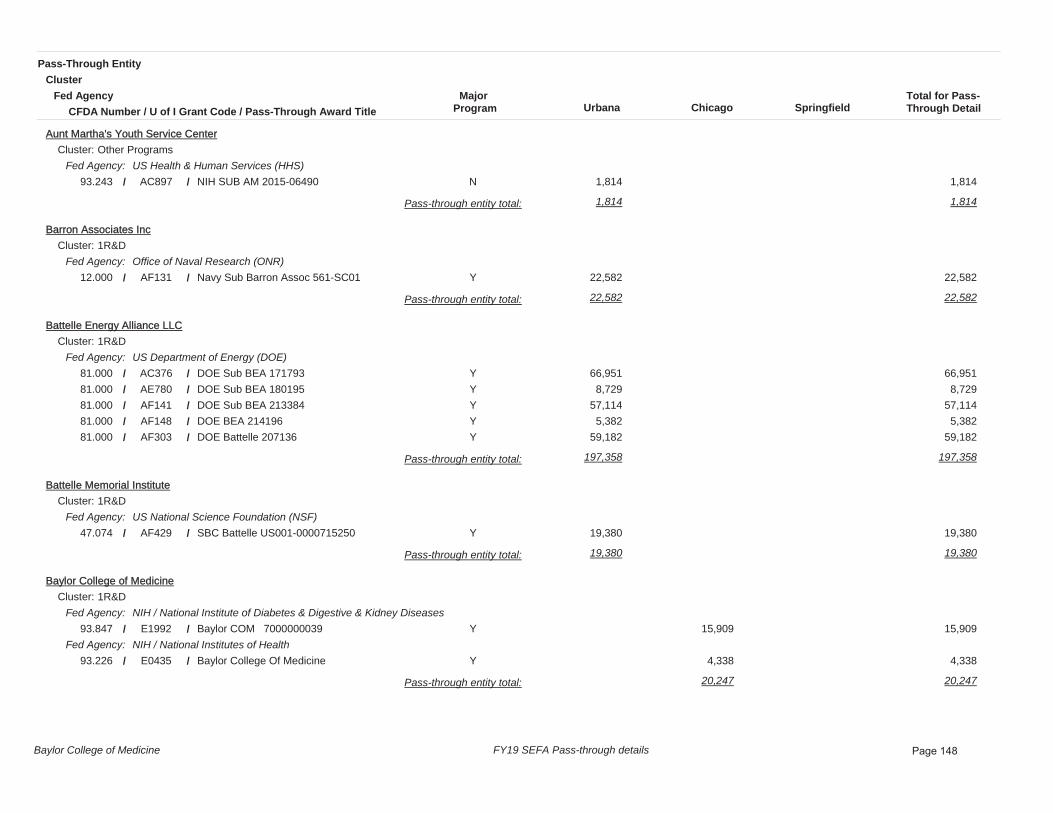
Urbana Chicago SpringfieldTotal for Pass-Through Detail
Pass-Through Entity
CFDA Number / U of I Grant Code / Pass-Through Award Title
ClusterFed Agency Major
Program
AAunt Martha's Youth Service CenterOther ProgramsCluster:
US Health & Human Services (HHS)Fed Agency:1,814 1,814NIH SUB AM 2015-0649093.243 AC897/ / N
1,814 1,814Pass-through entity total:
Barron Associates Inc1R&DCluster:
Office of Naval Research (ONR)Fed Agency:22,582 22,582Navy Sub Barron Assoc 561-SC0112.000 AF131/ / Y
22,582 22,582Pass-through entity total:
Battelle Energy Alliance LLC1R&DCluster:
US Department of Energy (DOE)Fed Agency:66,951 66,951DOE Sub BEA 17179381.000 AC376/ / Y
8,729 8,729DOE Sub BEA 18019581.000 AE780/ / Y57,114 57,114DOE Sub BEA 21338481.000 AF141/ / Y
5,382 5,382DOE BEA 21419681.000 AF148/ / Y59,182 59,182DOE Battelle 20713681.000 AF303/ / Y
197,358 197,358Pass-through entity total:
Battelle Memorial Institute1R&DCluster:
US National Science Foundation (NSF)Fed Agency:19,380 19,380SBC Battelle US001-000071525047.074 AF429/ / Y
19,380 19,380Pass-through entity total:
Baylor College of Medicine1R&DCluster:
NIH / National Institute of Diabetes & Digestive & Kidney DiseasesFed Agency:15,909 15,909Baylor COM 700000003993.847 E1992/ / Y
NIH / National Institutes of HealthFed Agency:4,338 4,338Baylor College Of Medicine93.226 E0435/ / Y
20,247 20,247Pass-through entity total:
FY19 SEFA Pass-through detailsBaylor College of Medicine Page 148

Urbana Chicago SpringfieldTotal for Pass-Through Detail
Pass-Through Entity
CFDA Number / U of I Grant Code / Pass-Through Award Title
ClusterFed Agency Major
Program
BBBN Technologies Corporation1R&DCluster:
ArmyFed Agency:10,197 10,197ARMY Sub BBN 9500013029 13891 TO 1612.000 AC737/ / Y60,419 60,419ARMY Sub BBN 1376535012.000 AE582/ / Y
Army Research Office (ARO)Fed Agency:-6,898 -6,898Army BBN YR4 1376520412.000 A0052/ / Y-7,065 -7,065Army BBN YR3 1376516012.000 A0846/ / Y-6,084 -6,084Army BBN YR5 1376524912.000 AA424/ / Y
441,085 441,085Army Sub BBN YR 6-10 LN950986312.000 AB679/ / Y
491,654 491,654Pass-through entity total:
Beckman Research Institute City of Hope1R&DCluster:
NIH / National Institute of Diabetes & Digestive & Kidney DiseasesFed Agency:113,415 113,415BRICOH Sub# 50578.914951.656093.847 E4574/ / Y
113,415 113,415Pass-through entity total:
Binghamton Univ1R&DCluster:
NIH / National Institutes of HealthFed Agency:7,768 7,768NIH SUB SUNY 7366993.855 AE785/ / Y
7,768 7,768Pass-through entity total:
Biolight Engineering LLC1R&DCluster:
NIH / National Institutes of HealthFed Agency:22,842 22,842Biolight Eng. LLC R43 EY028786-018193.867 E0526/ / Y
22,842 22,842Pass-through entity total:
Boise State UniversityOther ProgramsCluster:
National Institute of JusticeFed Agency:1,940 1,940583 DOJ NIJ BSU Bloodsworth Subawar16.820 K9452/ / N
1,940 1,940Pass-through entity total:
FY19 SEFA Pass-through detailsBoise State University Page 149

Urbana Chicago SpringfieldTotal for Pass-Through Detail
Pass-Through Entity
CFDA Number / U of I Grant Code / Pass-Through Award Title
ClusterFed Agency Major
Program
BBoston Fusion Corp1R&DCluster:
Air Force Office of Scientific Research (AFOSR)Fed Agency:108,910 108,910AF Sub BF-5040-SK00212.000 AF996/ / Y
108,910 108,910Pass-through entity total:
Brandeis UniversityOther ProgramsCluster:
Administration for Community LivingFed Agency:-14,816 -14,816Brandeis University 40331593.433 E1459/ / N
-14,816 -14,816Pass-through entity total:
Brigham & Women Hospital Inc1R&DCluster:
NIH / National Cancer InstituteFed Agency:68,276 68,276BWH 11040893.395 E0571/ / Y
NIH / National Institute of Allergy & Infectious DiseasesFed Agency:143,797 143,797Brigham 11755093.855 E1028/ / Y
NIH / National Institutes of HealthFed Agency:-13,304 -13,304The Brigham and Women's Hospital93.855 E1373/ / Y
US Health & Human Services (HHS)Fed Agency:64,250 64,250BWH 5UM1AI068636-1293.837 E0610/ / Y
263,019 263,019Pass-through entity total:
Brookhaven National Lab1R&DCluster:
Brookhaven National LabFed Agency:170,469 170,469DOE BNL 150252 DE-SC001270481.000 A2779/ / Y
9,822 9,822DOE BNL 31272781.000 AC418/ / Y530,261 530,261DOE BNL 34294081.000 AF696/ / Y
9,977 9,977DOE BNL 34539181.000 AF838/ / Y55,857 55,857Brookhaven Nat Lab 29195581.000 E2153/ / Y
720,529 55,857 776,386Pass-through entity total:
CACI Ever Vigilant1R&DCluster:
Defense Advanced Research Projects Agency (DARPA)Fed Agency:53,784 53,784CACI PO No. LGS003359012.000 E0654/ / Y
FY19 SEFA Pass-through detailsCACI Ever Vigilant Page 150

Urbana Chicago SpringfieldTotal for Pass-Through Detail
Pass-Through Entity
CFDA Number / U of I Grant Code / Pass-Through Award Title
ClusterFed Agency Major
Program
53,784 53,784Pass-through entity total:
CCal Poly Corporation Sponsored Programs1R&DCluster:
US Department of CommerceFed Agency:32,054 32,054Cal Poly 2018 11 4854411.417 E0809/ / Y
32,054 32,054Pass-through entity total:
California Institute of Technology1R&DCluster:
Air Force Office of Scientific Research (AFOSR)Fed Agency:28,206 28,206AF Sub CAL Tech 52-109663612.800 AB330/ / Y
US Department of Energy (DOE)Fed Agency:-15,310 -15,310DOE Sub CIT S39081581.049 A2780/ / Y61,152 61,152DOE Sub CIT S39449281.112 AA059/ / Y
150,695 150,695DOE Sub CA TECH S41652581.135 AC862/ / YUS NASAFed Agency:
56,406 56,406NASA Sub JPL 154578343.000 AC573/ / YUS National Science Foundation (NSF)Fed Agency:
14,637 14,637SBC Cal Tech 68D-109480347.049 AA394/ / Y1,847 1,847SBC CalTech S42148047.070 AG996/ / Y
297,633 297,633Pass-through entity total:
California State University Northridge1R&DCluster:
US National Science Foundation (NSF)Fed Agency:61,322 61,322SBC Cal State A18-0036-S00147.074 AF818/ / Y
61,322 61,322Pass-through entity total:
Carnegie Mellon University1R&DCluster:
Air Force Office of Scientific Research (AFOSR)Fed Agency:106,282 106,282AF Sub Carnegie 1150129-40122012.800 AF634/ / Y
Defense Advanced Research Projects Agency (DARPA)Fed Agency:94,323 94,323DARPA Sub CM 1150140-35518912.300 AC371/ / Y
Office of Naval Research (ONR)Fed Agency:-1,711 -1,711Navy Sub CM 1141221-25842912.300 A1460/ / Y
FY19 SEFA Pass-through detailsCarnegie Mellon University Page 151

Urbana Chicago SpringfieldTotal for Pass-Through Detail
Pass-Through Entity
CFDA Number / U of I Grant Code / Pass-Through Award Title
ClusterFed Agency Major
Program
198,894 198,894Pass-through entity total:
CCarter Consulting Inc1R&DCluster:
Centers for Disease Control and Prevention (CDC)Fed Agency:22,848 22,848CCI 8100-00193.000 E1443/ / Y
22,848 22,848Pass-through entity total:
Case Western Reserve University1R&DCluster:
NIH / National Institute of General Medical SciencesFed Agency:34,573 34,573NIH SUB CWRU RES51395393.859 AG943/ / Y
NIH / National Institutes of HealthFed Agency:94,717 94,717NIH SUB CWRU RES51258593.286 AE016/ / Y-9,466 -9,466NIH SUB CW RU RES51178893.859 AE634/ / Y
118,424 118,424NIH SUB CWRU RES51281893.859 AF856/ / YOffice of Naval Research (ONR)Fed Agency:
246,565 246,565Navy Sub CWRU RES51118612.300 AC125/ / Y
484,813 484,813Pass-through entity total:
Center for Produce Safety1R&DCluster:
US Department of Agriculture (USDA)Fed Agency:22,077 22,077AG Sub CPS 2019CPS1110.170 AF211/ / Y
119,794 119,794AG Sub CPS 2018CPS0310.170 AF931/ / Y
141,871 141,871Pass-through entity total:
Cerner Corporation1R&DCluster:
Centers for Disease Control and Prevention (CDC)Fed Agency:9,843 9,843Cerner Corporation 200 2015 6393193.283 E1931/ / Y
9,843 9,843Pass-through entity total:
Champaign Community Schools Unit 4Other ProgramsCluster:
US Department of EducationFed Agency:36,372 36,372DE Sub CCUSD484.000 AF674/ / N
FY19 SEFA Pass-through detailsChampaign Community Schools Unit 4 Page 152

Urbana Chicago SpringfieldTotal for Pass-Through Detail
Pass-Through Entity
CFDA Number / U of I Grant Code / Pass-Through Award Title
ClusterFed Agency Major
Program
36,372 36,372Pass-through entity total:
CChampaign County Regional Planning CommissionWIOACluster:
US Department of Labor (DOL)Fed Agency:-1,252 -1,252DOL Sub CCRPC 17-1Y-4050-YETP17.259 AE436/ / N14,175 14,175DOL Sub CCRPC 18-1Y-4050-YETP17.259 AF714/ / N
12,923 12,923Pass-through entity total:
Charles River Analytics Inc1R&DCluster:
US Department of Defense (DoD)Fed Agency:81,498 81,498Charles River Analytics SC162940112.000 E0944/ / Y
81,498 81,498Pass-through entity total:
Cherokee Nation Technology Solutions LLC1R&DCluster:
US Department of Defense (DoD)Fed Agency:24,728 24,728Cherokee Nation W81xWH-18-D-0024 #012.420 E0831/ / Y
24,728 24,728Pass-through entity total:
Chicago Association for Research and Education in Science1R&DCluster:
NIH / National Institute of Nursing ResearchFed Agency:126,283 126,283CARES 0051-UIC93.361 E1654/ / Y
US Army Medical Research AcquisitionFed Agency:40,724 40,724CARES Pape 0020S12.420 E1532/ / Y37,879 37,879CAR W81XWH-15-1-051612.420 E1897/ / Y
US Department of Defense (DoD)Fed Agency:-180 -180Chicago Assoc Pape-VA CDMRP12.420 E2412/ / Y
204,706 204,706Pass-through entity total:
Chicago BioSolutions Inc1R&DCluster:
National Center for Infectious DiseasesFed Agency:24,066 24,066Chi BioSolutions R41AI12697193.855 E1673/ / Y
NIH / National Institute of Allergy & Infectious DiseasesFed Agency:2 2Chgo BioSolutions 1R41AI2703193.855 E1745/ / Y
FY19 SEFA Pass-through detailsChicago BioSolutions Inc Page 153
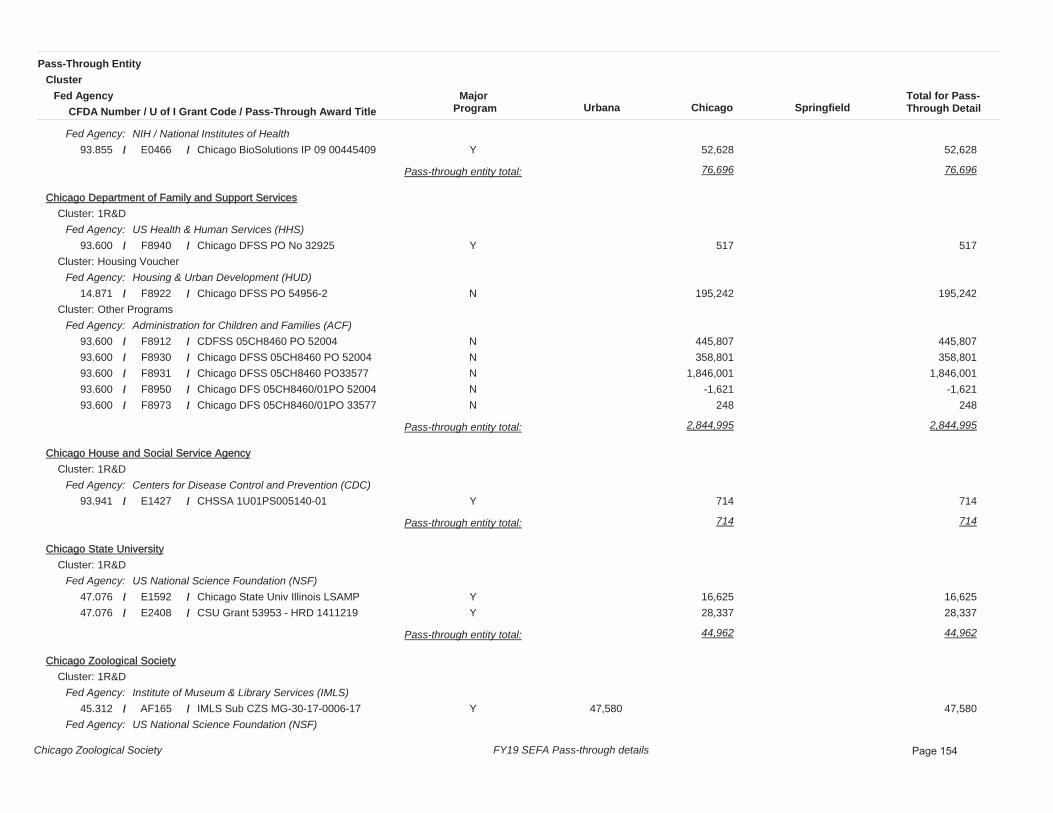
Urbana Chicago SpringfieldTotal for Pass-Through Detail
Pass-Through Entity
CFDA Number / U of I Grant Code / Pass-Through Award Title
ClusterFed Agency Major
Program
NIH / National Institutes of HealthFed Agency:52,628 52,628Chicago BioSolutions IP 09 0044540993.855 E0466/ / Y
76,696 76,696Pass-through entity total:
CChicago Department of Family and Support Services1R&DCluster:
US Health & Human Services (HHS)Fed Agency:517 517Chicago DFSS PO No 3292593.600 F8940/ / Y
Housing VoucherCluster:Housing & Urban Development (HUD)Fed Agency:
195,242 195,242Chicago DFSS PO 54956-214.871 F8922/ / NOther ProgramsCluster:
Administration for Children and Families (ACF)Fed Agency:445,807 445,807CDFSS 05CH8460 PO 5200493.600 F8912/ / N358,801 358,801Chicago DFSS 05CH8460 PO 5200493.600 F8930/ / N
1,846,001 1,846,001Chicago DFSS 05CH8460 PO3357793.600 F8931/ / N-1,621 -1,621Chicago DFS 05CH8460/01PO 5200493.600 F8950/ / N
248 248Chicago DFS 05CH8460/01PO 3357793.600 F8973/ / N
2,844,995 2,844,995Pass-through entity total:
Chicago House and Social Service Agency1R&DCluster:
Centers for Disease Control and Prevention (CDC)Fed Agency:714 714CHSSA 1U01PS005140-0193.941 E1427/ / Y
714 714Pass-through entity total:
Chicago State University1R&DCluster:
US National Science Foundation (NSF)Fed Agency:16,625 16,625Chicago State Univ Illinois LSAMP47.076 E1592/ / Y28,337 28,337CSU Grant 53953 - HRD 141121947.076 E2408/ / Y
44,962 44,962Pass-through entity total:
Chicago Zoological Society1R&DCluster:
Institute of Museum & Library Services (IMLS)Fed Agency:47,580 47,580IMLS Sub CZS MG-30-17-0006-1745.312 AF165/ / Y
US National Science Foundation (NSF)Fed Agency:
FY19 SEFA Pass-through detailsChicago Zoological Society Page 154

Urbana Chicago SpringfieldTotal for Pass-Through Detail
Pass-Through Entity
CFDA Number / U of I Grant Code / Pass-Through Award Title
ClusterFed Agency Major
Program
26,204 26,204Chicago Zoological Society47.076 E2686/ / Y
47,580 26,204 73,784Pass-through entity total:
CChildren's Hospital of Philadelphia1R&DCluster:
NIH / National Cancer InstituteFed Agency:1,210 1,210CHOP U10CA180886-02S793.395 E1138/ / Y1,979 1,979CHOP UG1CA189955 - NCORP - IL14693.395 E1486/ / Y5,012 5,012CHOP AALL1131 U10CA18088693.395 E1824/ / Y
31,694 31,694CHOP NCTN IL146 U10CA18088693.395 E1883/ / Y62,846 62,846CHOP NCTN93.395 E2448/ / Y38,454 38,454CHOP U 10 CA18088693.395 E2449/ / Y
-23,021 -23,021Childrens Hospital Philadelphia93.395 E3099/ / Y9,304 9,304Child Hosp Phili PCR WO FP 0001301393.395 E3215/ / Y3,736 3,736Child Hosp Phil SL WO FP0001425193.395 E3216/ / Y
NIH / National Institutes of HealthFed Agency:6,628 6,628CHOP Sub No UG1CA18995593.395 E1960/ / Y
-235,490 -235,490Childrens Hospital Of Philadelphia93.395 E3214/ / Y35,202 35,202Childrens Hosp Phil 950690RSUB93.847 E4147/ / Y
Other ProgramsCluster:NIH / National Institutes of HealthFed Agency:
5,097 5,097CHOP U10CA09854393.395 E3213/ / N
-57,349 -57,349Pass-through entity total:
Cincinnati Childrens Hospital Medical Center1R&DCluster:
HRSA/BHPR/DADPHP (Health Resources and Services)Fed Agency:39,765 39,765Cinn Chil Hosp Sub No 13712893.365 E1077/ / Y
NIH / National Institute of Allergy & Infectious DiseasesFed Agency:16,019 16,019CHMC 5U54AI117804-0493.855 E1361/ / Y
NIH / National Institutes of HealthFed Agency:69,795 69,795Cincinnati Children's 1UG3DK119982-93.847 E0488/ / Y11,561 11,561CCHMC #135406 Year 293.855 E1362/ / Y
US Health & Human Services (HHS)Fed Agency:26,654 26,654Cincinnati Childrens Hospital Medic93.000 E0493/ / Y
163,794 163,794Pass-through entity total:
FY19 SEFA Pass-through detailsCincinnati Childrens Hospital Medical Center Page 155

Urbana Chicago SpringfieldTotal for Pass-Through Detail
Pass-Through Entity
CFDA Number / U of I Grant Code / Pass-Through Award Title
ClusterFed Agency Major
Program
CCity of Chicago1R&DCluster:
Centers for Disease Control and Prevention (CDC)Fed Agency:225,003 225,003CDPH PO# 6614893.944 F8924/ / Y84,788 84,788CDPH 84850 & 9939693.977 F8914/ / Y
US Health & Human Services (HHS)Fed Agency:689 689Chicago DFS 05CH0101 PO 3292593.600 F8957/ / Y
Other ProgramsCluster:Administration for Children and Families (ACF)Fed Agency:
1,594,917 1,594,917CDFSS 05CH8460 PO33577 493.600 F8913/ / NHRSA/BHPR/DADPHP (Health Resources and Services)Fed Agency:
476,771 476,771CDPH PO 7314693.914 F8925/ / N997,939 997,939CDPH PO 7314793.914 F8926/ / N
4,456 4,456CDPH 36728 293.914 F8948/ / N-9,238 -9,238CDPH PO 37404-293.914 F8951/ / N
3,375,325 3,375,325Pass-through entity total:
City Of GalesburgOther ProgramsCluster:
Housing & Urban Development (HUD)Fed Agency:11,405 11,405IDPH Agreem No. 18-IGAUIC-HEL[14.228 H7567/ / N
11,405 11,405Pass-through entity total:
City of PeoriaOther ProgramsCluster:
Housing & Urban Development (HUD)Fed Agency:15,358 15,358City of Peoria 18P1414.241 F8927/ / N
15,358 15,358Pass-through entity total:
Clark University1R&DCluster:
US National Science Foundation (NSF)Fed Agency:241,358 241,358SBC Clark Univ 2A325-753247.000 AF829/ / Y
241,358 241,358Pass-through entity total:
FY19 SEFA Pass-through detailsClark University Page 156

Urbana Chicago SpringfieldTotal for Pass-Through Detail
Pass-Through Entity
CFDA Number / U of I Grant Code / Pass-Through Award Title
ClusterFed Agency Major
Program
CClarkson Aerospace Corporation1R&DCluster:
Air ForceFed Agency:24,995 24,995AF Sub Clarkson UIUC16-S7700-04-C212.000 AE873/ / Y
24,995 24,995Pass-through entity total:
Clemson University1R&DCluster:
Air ForceFed Agency:1,399 1,399AF Sub Clemson 1872-200-201123412.000 AC134/ / Y
Office of Naval Research (ONR)Fed Agency:164,907 164,907NAVY sub Clemson 1969-202-201191612.300 AE127/ / Y
US National Science Foundation (NSF)Fed Agency:40,808 40,808SBC Clemson 1814-206-201082047.041 AB235/ / Y
207,114 207,114Pass-through entity total:
Cleveland Clinic Lerner College of Medicine1R&DCluster:
NIH / National Institutes of HealthFed Agency:23,110 23,110CCF IP0040831993.867 E0469/ / Y
23,110 23,110Pass-through entity total:
Colorado School of Mines1R&DCluster:
US National Science Foundation (NSF)Fed Agency:4,798 4,798SBC CO School of Mines 401008-580147.041 AC665/ / Y
4,798 4,798Pass-through entity total:
Colorado State Univ1R&DCluster:
National Institute of Food and Agriculture/USDAFed Agency:2,068 2,068AG Sub CSU G-14765-710.310 AC300/ / Y
National Institute of Standards & TechnologyFed Agency:1,327,515 1,327,515COM Sub CO St Univ G-00745-411.619 AB496/ / Y
US Department of Energy (DOE)Fed Agency:6,346 6,346Colorado State University81.087 E0464/ / Y
1,329,583 6,346 1,335,929Pass-through entity total:
FY19 SEFA Pass-through detailsColorado State Univ Page 157

Urbana Chicago SpringfieldTotal for Pass-Through Detail
Pass-Through Entity
CFDA Number / U of I Grant Code / Pass-Through Award Title
ClusterFed Agency Major
Program
CColumbia Univ1R&DCluster:
Agency for Healthcare Research and Quality (AHRQ)Fed Agency:13,804 13,804Columbia University 3 GG012713 0393.226 E1413/ / Y
Army Research Office (ARO)Fed Agency:67,670 67,670Army Sub Columbia 1(GG012449)12.431 AC390/ / Y
NIH / National Institute of Diabetes & Digestive & Kidney DiseasesFed Agency:171,240 171,240Columbia GG012235-0193.847 E1200/ / Y
NIH / National Institute of Mental HealthFed Agency:19,027 19,027Columbia Univ. 1 GG014809-0193.242 E0550/ / Y
67,670 204,071 271,741Pass-through entity total:
Computing Research Association1R&DCluster:
US National Science Foundation (NSF)Fed Agency:-17 -17SBC CRA #BDhub00147.070 AC569/ / Y
-17 -17Pass-through entity total:
Concord Consortium Inc1R&DCluster:
US National Science Foundation (NSF)Fed Agency:31,985 31,985Concord Consortium Sub. No. 301-0147.076 E1209/ / Y
31,985 31,985Pass-through entity total:
Cook County HospitalOther ProgramsCluster:
Natl Center for Chronic Disease Prev & Health PromotionFed Agency:5,386 5,386CCHHS H14-25-013193.331 F8981/ / N
5,386 5,386Pass-through entity total:
COPD Foundation Inc1R&DCluster:
NIH / National Heart Lung & Blood InstituteFed Agency:2,560 2,560COPD Fdn 5 U01 HL128954-0393.838 E0777/ / Y
NIH / National Institutes of HealthFed Agency:16,128 16,128COPD Foundation 9012549 (131692-2)93.838 E0957/ / Y60,573 60,573COPD Fdn Subaward No. 00193.838 E0958/ / Y
FY19 SEFA Pass-through detailsCOPD Foundation Inc Page 158

Urbana Chicago SpringfieldTotal for Pass-Through Detail
Pass-Through Entity
CFDA Number / U of I Grant Code / Pass-Through Award Title
ClusterFed Agency Major
Program
79,261 79,261Pass-through entity total:
CCornell University1R&DCluster:
Air Force Office of Scientific Research (AFOSR)Fed Agency:15,395 15,395AF SUB CORNELL 71656-1034312.800 AB644/ / Y
NavyFed Agency:258,292 258,292NAVY Sub Cornell 78559-1069812.300 AC311/ / Y
NIH / National Institute on AgingFed Agency:24,868 24,868NIH Sub CU 84139-B Diversity Harris93.866 AF060/ / Y49,109 49,109NIH Sub CU 194139-C PROJ #3 PRISM93.866 AF061/ / Y35,662 35,662NIH Sub CU 184139-A PROJ #2 Dissem93.866 AF062/ / Y
NIH / National Institutes of HealthFed Agency:4,111 4,111Cornell Univ Sub No. 18054193.395 E1343/ / Y
US Department of Agriculture (USDA)Fed Agency:15,138 15,138AG Sub Cornell 88790-1118910.290 AF023/ / Y
398,464 4,111 402,575Pass-through entity total:
County of SuffolkOther ProgramsCluster:
US Environmental Protection Agency (EPA)Fed Agency:2,857 2,857CAL EPA 2014-AMO-1-08-NY9666.456 AF185/ / N6,388 6,388CAL EPA 2014-NTN-1-5666.456 AF186/ / N
9,245 9,245Pass-through entity total:
CRAFT Tech1R&DCluster:
Defense Threat Reduction Agency (DTRA)Fed Agency:90,143 90,143DTRA Sub CRAFT 17-1-0026/C70012.000 AE472/ / Y
90,143 90,143Pass-through entity total:
Creare Inc1R&DCluster:
ArmyFed Agency:67,097 67,097Army Sub Creare S62112.000 AF269/ / Y
67,097 67,097Pass-through entity total:
FY19 SEFA Pass-through detailsCreare Inc Page 159

Urbana Chicago SpringfieldTotal for Pass-Through Detail
Pass-Through Entity
CFDA Number / U of I Grant Code / Pass-Through Award Title
ClusterFed Agency Major
Program
CCU Aerospace LLC1R&DCluster:
Air ForceFed Agency:-56 -56AF Sub CUA 2015-0194212.000 AB190/ / Y
Defense Advanced Research Projects Agency (DARPA)Fed Agency:102,630 102,630DARPA Sub CUA 08798312.000 AE411/ / Y
US NASAFed Agency:-1,002 -1,002NASA SUB CUA 087288-0000143.000 AE509/ / Y86,989 86,989NASA SUB CUA 086753-0000143.000 AE611/ / Y
120,891 120,891NASA SUB CUA 086758-0000143.000 AE612/ / Y25,026 25,026NASA SUB CUA 086756-0000143.000 AE613/ / Y49,842 49,842NASA SUB CUA 09219843.000 AF447/ / Y
384,320 384,320Pass-through entity total:
Curators of the University of Missouri on Behalf of the Univ1R&DCluster:
Air Force Office of Scientific Research (AFOSR)Fed Agency:51,450 51,450AF Sub MO S&T 00055196-0112.800 AF983/ / Y
Other ProgramsCluster:US Health & Human Services (HHS)Fed Agency:
55,309 55,309583 DHHS UMSL Project FORECAST93.243 K9454/ / N
51,450 55,309 106,759Pass-through entity total:
Curza Global LLC1R&DCluster:
NIH / National Institute of Allergy & Infectious DiseasesFed Agency:78,686 78,686Curza Global R01AI132304-0193.859 E1004/ / Y
78,686 78,686Pass-through entity total:
Dana-Farber Cancer Institute Inc1R&DCluster:
NIH / National Institutes of HealthFed Agency:46,882 46,882Dana-Fber Cancer Institute 121530593.839 E3158/ / Y
46,882 46,882Pass-through entity total:
FY19 SEFA Pass-through detailsDana-Farber Cancer Institute Inc Page 160

Urbana Chicago SpringfieldTotal for Pass-Through Detail
Pass-Through Entity
CFDA Number / U of I Grant Code / Pass-Through Award Title
ClusterFed Agency Major
Program
DDE Technologies IncOther ProgramsCluster:
Defense Advanced Research Projects Agency (DARPA)Fed Agency:3,027 3,027DARPA Sub DET 084703 TTA12.910 AE962/ / N
3,027 3,027Pass-through entity total:
Delta InstituteOther ProgramsCluster:
US Department of Agriculture (USDA)Fed Agency:21,256 21,256AG Sub Delta Inst 092149 TTA10.172 AF622/ / N
21,256 21,256Pass-through entity total:
DePaul Univ1R&DCluster:
NIH / National Institute on AgingFed Agency:50,650 50,650DePaul 501084SG11493.866 E2406/ / Y
NIH / National Institutes of HealthFed Agency:44,746 44,746NIH SUB DU 501084SG11393.866 AB649/ / Y
US National Science Foundation (NSF)Fed Agency:10,004 10,004DePaul U 501165SG131 154297147.070 E1767/ / Y
44,746 60,654 105,400Pass-through entity total:
Digital Materials LLCOther ProgramsCluster:
Office of Naval Research (ONR)Fed Agency:720 720Navy Sub Digital Mat 091783 FUA12.000 AF426/ / N
720 720Pass-through entity total:
Donald Danforth Plant Science Center1R&DCluster:
Advanced Research Projects Agency - Energy (ARPA-E)Fed Agency:57,183 57,183DOE Sub DDPSC 22815-181.135 AB112/ / Y
US Department of Agriculture (USDA)Fed Agency:122,245 122,245AG Sub DDPSC 23019-I10.310 AC460/ / Y
US Department of Energy (DOE)Fed Agency:-951 -951DOE Sub DDPSC 23009-UI81.049 A0206/ / Y
483,927 483,927DOE Sub DDPSC 23021-I81.049 AE028/ / YUS National Science Foundation (NSF)Fed Agency:
FY19 SEFA Pass-through detailsDonald Danforth Plant Science Center Page 161

Urbana Chicago SpringfieldTotal for Pass-Through Detail
Pass-Through Entity
CFDA Number / U of I Grant Code / Pass-Through Award Title
ClusterFed Agency Major
Program
479,814 479,814SBC Donald Danforth 23307-I47.074 AC403/ / Y3,059 3,059SBC Donald Danforth 092231 TTA47.074 AF598/ / Y
74,531 74,531SBC Donald Danforth 23704-I47.074 AF991/ / YOther ProgramsCluster:
US Department of Energy (DOE)Fed Agency:11,867 11,867DOE Sub DDPSC 092228 TTA81.049 AF599/ / N15,161 15,161DOE Sub DDPSC 092229 TTA81.049 AF600/ / N
1,246,836 1,246,836Pass-through entity total:
DDrasgow Consulting GroupOther ProgramsCluster:
ArmyFed Agency:50,777 50,777Army Sub Drasgow 08380412.000 AC109/ / N
50,777 50,777Pass-through entity total:
Duke University1R&DCluster:
NIH / National Institute of Neurological Disorders & StrokeFed Agency:258,879 258,879NIH Sub DU A03-033893.853 AF209/ / Y
NIH / National Institutes of HealthFed Agency:7,273 7,273NIH SUB DU 203-788493.310 AF607/ / Y
-1 -1NIH SUB DU 203-643193.853 AF988/ / YNIH / Office of the Director of National Institute of HealthFed Agency:
12,748 12,748NIH Sub DU 203-796493.310 AF220/ / Y
278,899 278,899Pass-through entity total:
Dupage Medical Technologies Inc1R&DCluster:
NIH / National Heart Lung & Blood InstituteFed Agency:24,054 24,054DuPage Medical NHLBICSBHV201701JS93.000 E1493/ / Y12,655 12,655Dupage Medical 1R43HL142396 0193.839 E0518/ / Y
NIH / National Institutes of HealthFed Agency:122,038 122,038Dupage Medical Technology Inc93.000 E1015/ / Y
-6,694 -6,694Dupage Medical Technology Inc93.000 E1349/ / Y
152,053 152,053Pass-through entity total:
FY19 SEFA Pass-through detailsDupage Medical Technologies Inc Page 162

Urbana Chicago SpringfieldTotal for Pass-Through Detail
Pass-Through Entity
CFDA Number / U of I Grant Code / Pass-Through Award Title
ClusterFed Agency Major
Program
EE.O. Lawrence Berkeley National Laboratory1R&DCluster:
E.O. Lawrence Berkeley National LaboratoryFed Agency:2,548 2,548DOE LBNL 724513581.000 AB074/ / Y4,210 4,210DOE LBNL 725309181.000 AC894/ / Y
12,397 12,397DOE LBNL 746247781.000 AF044/ / Y
19,155 19,155Pass-through entity total:
Earth Networks Inc/WeatherBugOther ProgramsCluster:
US Dept of Commerce NOAAFed Agency:52,274 52,274COM Sub Earth Networks 08631311.432 AE325/ / N
52,274 52,274Pass-through entity total:
EarthSense Inc1R&DCluster:
US National Science Foundation (NSF)Fed Agency:31,428 31,428SBC EarthSense 09495247.000 AF427/ / Y
31,428 31,428Pass-through entity total:
Easter Seals1R&DCluster:
US Department of Transportation (DOT)Fed Agency:71,281 71,281Easterseals Nat IL-2017-004-0020.514 E0987/ / Y
71,281 71,281Pass-through entity total:
ECOG-ACRIN Cancer Research Group1R&DCluster:
NIH / National Institutes of HealthFed Agency:91 91ECOG ACRIN93.395 E0546/ / Y
91 91Pass-through entity total:
Education Development Center IncOther ProgramsCluster:
Health Resources and Services Administration (HRSA)Fed Agency:99,392 99,392EDC File No. 1199993.000 E0899/ / N
99,392 99,392Pass-through entity total:
FY19 SEFA Pass-through detailsEducation Development Center Inc Page 163

Urbana Chicago SpringfieldTotal for Pass-Through Detail
Pass-Through Entity
CFDA Number / U of I Grant Code / Pass-Through Award Title
ClusterFed Agency Major
Program
EEmmes Corporation1R&DCluster:
NIH / National Institute of Diabetes & Digestive & Kidney DiseasesFed Agency:2,464 2,464 Emmes Corp ID 1 UC4 DK114839 0193.847 E0731/ / Y2,015 2,015EMMES CITR93.847 E3108/ / Y
4,479 4,479Pass-through entity total:
Emory University1R&DCluster:
NIH / National Institutes of HealthFed Agency:46,473 46,473NIH SUB EU T67450593.242 AE894/ / Y
46,473 46,473Pass-through entity total:
Empirical Systems Aerospace Inc1R&DCluster:
US NASAFed Agency:11,070 11,070NASA SUB ESA 2017062743.000 AE438/ / Y
125,099 125,099NASA SUB ESA 2018.10.03.STTR243.000 AF449/ / Y
136,169 136,169Pass-through entity total:
Energy Driven Technologies LLC1R&DCluster:
US Department of Energy (DOE)Fed Agency:26 26DOE Sub Editekk 08895981.000 AE273/ / Y
144,218 144,218DOE Sub Editekk 08913381.049 AE324/ / Y
144,244 144,244Pass-through entity total:
Engineering & Software Consultants Inc1R&DCluster:
Federal Highway Administration (FHWA)Fed Agency:-181 -181Sub # 16-35 -DTFH61-14-D-0001120.000 E1711/ / Y
-181 -181Pass-through entity total:
Ensaras Inc1R&DCluster:
US Department of Defense (DoD)Fed Agency:723 723DOD sub Ensaras 08829412.400 AF923/ / Y
FY19 SEFA Pass-through detailsEnsaras Inc Page 164

Urbana Chicago SpringfieldTotal for Pass-Through Detail
Pass-Through Entity
CFDA Number / U of I Grant Code / Pass-Through Award Title
ClusterFed Agency Major
Program
723 723Pass-through entity total:
EENSCO INC1R&DCluster:
Federal Railroad AdministrationFed Agency:24,692 24,692DOT FRA Sub Ensco G2735520.000 AB285/ / Y
106,908 106,908DOT Sub Ensco G27407-400020.000 AF313/ / Y
131,600 131,600Pass-through entity total:
Enzyme By Design Inc1R&DCluster:
NIH / National Institutes of HealthFed Agency:87,991 87,991Enzyme By Design93.395 E0801/ / Y19,821 19,821Enzyme By Design Inc93.838 E0431/ / Y
107,812 107,812Pass-through entity total:
Equal Access International1R&DCluster:
United States Agency for International Development (AID)Fed Agency:3,582 3,582AID Sub EAI V4P-002-201798.001 AE236/ / Y
3,582 3,582Pass-through entity total:
eXtension FoundationOther ProgramsCluster:
US Environmental Protection Agency (EPA)Fed Agency:3,070 3,070EPA Sub eXtension FDN SA-2017-3766.716 AF900/ / N
3,070 3,070Pass-through entity total:
Family Health International1R&DCluster:
NIH / National Institute of Allergy & Infectious DiseasesFed Agency:986,483 986,483Family Health HPTN 08393.855 E1762/ / Y
986,483 986,483Pass-through entity total:
Fermi Research Alliance LLC/Fermi National Accelerator Lab1R&DCluster:
US Department of Energy (DOE)Fed Agency:92,089 92,089DOE Fermi PO 64401381.000 AF817/ / Y
FY19 SEFA Pass-through detailsFermi Research Alliance LLC/Fermi National Accelerator Lab Page 165

Urbana Chicago SpringfieldTotal for Pass-Through Detail
Pass-Through Entity
CFDA Number / U of I Grant Code / Pass-Through Award Title
ClusterFed Agency Major
Program
Other ProgramsCluster:US Department of Energy (DOE)Fed Agency:
16,567 16,567DOE Sub FNAL 62996181.000 AE840/ / N
108,656 108,656Pass-through entity total:
FFermilab1R&DCluster:
FermilabFed Agency:18,935 18,935FERMI National Lab 65183181.000 E0533/ / Y24,121 24,1212019 JUnior CMS LPC Distinguished R81.000 E0567/ / Y8,376 8,376FERMI LAB PO 64564581.000 E0869/ / Y
231,359 231,359Fermi Lab PO No. 62994081.000 E1535/ / Y100,828 100,828FermiLab PO No. 62973181.000 E1538/ / Y98,929 98,929Fermi Lab PO No. 58287981.000 E4352/ / Y
482,548 482,548Pass-through entity total:
Fielding Graduate University1R&DCluster:
US National Science Foundation (NSF)Fed Agency:42,914 42,914SBC Fielding NSF-2018-147.076 AF139/ / Y
42,914 42,914Pass-through entity total:
Florida Atlantic University1R&DCluster:
US Department of Transportation (DOT)Fed Agency:1,173 1,173DOT Sub FAU UR-K8420.313 AF934/ / Y
1,173 1,173Pass-through entity total:
Florida Department of Agriculture and Consumer Services1R&DCluster:
US Department of InteriorFed Agency:11,325 11,325INT Sub FDACS 02543615.615 AF454/ / Y
11,325 11,325Pass-through entity total:
Florida State University1R&DCluster:
NIH / National Institutes of HealthFed Agency:17,074 17,074Florida State Univ R0200093.855 E0943/ / Y
FY19 SEFA Pass-through detailsFlorida State University Page 166

Urbana Chicago SpringfieldTotal for Pass-Through Detail
Pass-Through Entity
CFDA Number / U of I Grant Code / Pass-Through Award Title
ClusterFed Agency Major
Program
-11,199 -11,199FSU R01GM126558 Sub-R0191693.859 E1097/ / Y
5,875 5,875Pass-through entity total:
FFroberg Aerospace LLC1R&DCluster:
National Reconnaissance OfficeFed Agency:186,889 186,889NRO Sub Froberg Aero 09389012.000 AF266/ / Y
US NASAFed Agency:24,932 24,932NASA SUB FA 09259243.000 AF448/ / Y
Other ProgramsCluster:US NASAFed Agency:
8,789 8,789NASA SUB FA 09099843.000 AF504/ / N
220,610 220,610Pass-through entity total:
Gas Technology Institute1R&DCluster:
US Department of Energy (DOE)Fed Agency:41,960 41,960DOE Sub GTI S57981.086 AC849/ / Y
41,960 41,960Pass-through entity total:
General Hospital Corporation/Massachusetts General Hospital1R&DCluster:
NIH / National Heart Lung & Blood InstituteFed Agency:-45,976 -45,976Massachusets General Hospital A533293.837 E2122/ / Y
NIH / National Institute of Biomedical Imaging & BioengineeringFed Agency:64,150 64,150NIH SUB MGH 23139393.286 AF689/ / Y
NIH / National Institutes of HealthFed Agency:-5,495 -5,495NIH SUB MGH 21718393.286 A1398/ / Y
224,748 224,748MA General Hospital Sub 22499093.859 E2522/ / Y
58,655 178,772 237,427Pass-through entity total:
Geneva Foundation1R&DCluster:
US Army Medical Research AcquisitionFed Agency:8,970 8,970Geneva Fdn S-1579-0212.420 E0577/ / Y
8,970 8,970Pass-through entity total:
FY19 SEFA Pass-through detailsGeneva Foundation Page 167
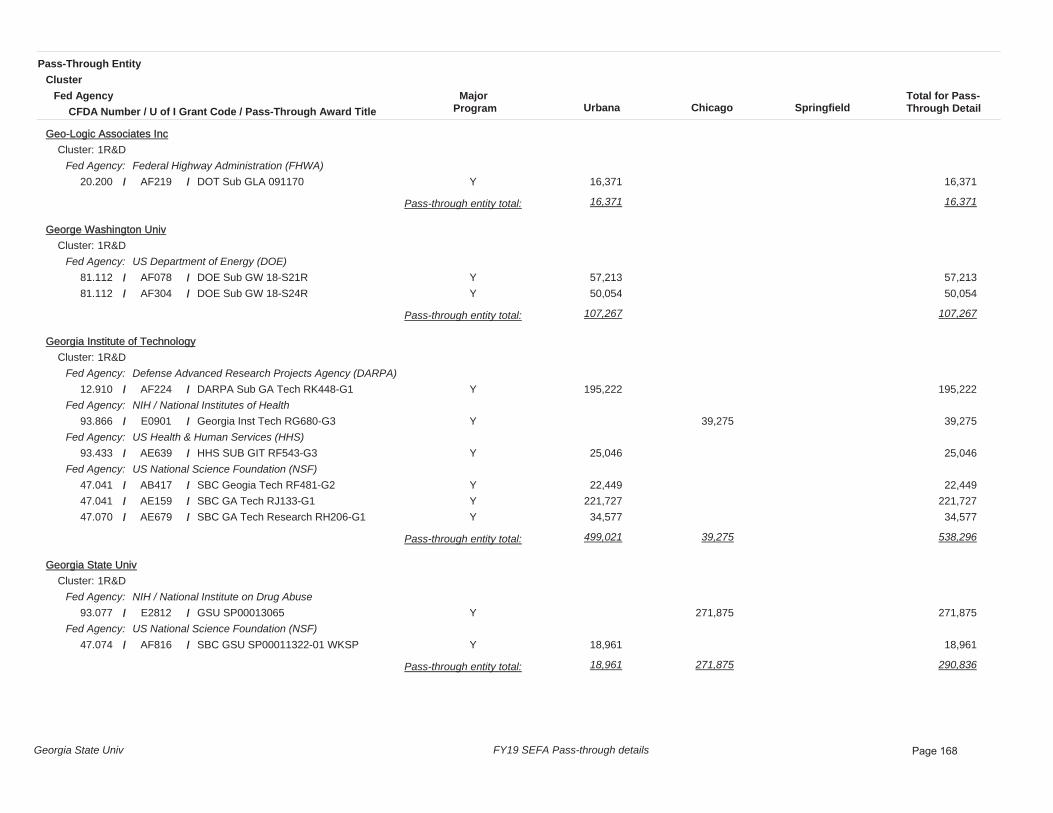
Urbana Chicago SpringfieldTotal for Pass-Through Detail
Pass-Through Entity
CFDA Number / U of I Grant Code / Pass-Through Award Title
ClusterFed Agency Major
Program
GGeo-Logic Associates Inc1R&DCluster:
Federal Highway Administration (FHWA)Fed Agency:16,371 16,371DOT Sub GLA 09117020.200 AF219/ / Y
16,371 16,371Pass-through entity total:
George Washington Univ1R&DCluster:
US Department of Energy (DOE)Fed Agency:57,213 57,213DOE Sub GW 18-S21R81.112 AF078/ / Y50,054 50,054DOE Sub GW 18-S24R81.112 AF304/ / Y
107,267 107,267Pass-through entity total:
Georgia Institute of Technology1R&DCluster:
Defense Advanced Research Projects Agency (DARPA)Fed Agency:195,222 195,222DARPA Sub GA Tech RK448-G112.910 AF224/ / Y
NIH / National Institutes of HealthFed Agency:39,275 39,275Georgia Inst Tech RG680-G393.866 E0901/ / Y
US Health & Human Services (HHS)Fed Agency:25,046 25,046HHS SUB GIT RF543-G393.433 AE639/ / Y
US National Science Foundation (NSF)Fed Agency:22,449 22,449SBC Geogia Tech RF481-G247.041 AB417/ / Y
221,727 221,727SBC GA Tech RJ133-G147.041 AE159/ / Y34,577 34,577SBC GA Tech Research RH206-G147.070 AE679/ / Y
499,021 39,275 538,296Pass-through entity total:
Georgia State Univ1R&DCluster:
NIH / National Institute on Drug AbuseFed Agency:271,875 271,875GSU SP0001306593.077 E2812/ / Y
US National Science Foundation (NSF)Fed Agency:18,961 18,961SBC GSU SP00011322-01 WKSP47.074 AF816/ / Y
18,961 271,875 290,836Pass-through entity total:
FY19 SEFA Pass-through detailsGeorgia State Univ Page 168

Urbana Chicago SpringfieldTotal for Pass-Through Detail
Pass-Through Entity
CFDA Number / U of I Grant Code / Pass-Through Award Title
ClusterFed Agency Major
Program
GGlobal Alliance for TB Drug Development1R&DCluster:
NIH / National Institute of Allergy & Infectious DiseasesFed Agency:209,415 209,415Global Alliance 1U194t142735 6060793.855 E0599/ / Y
209,415 209,415Pass-through entity total:
GlucoSentient Inc1R&DCluster:
NIH / National Heart Lung & Blood InstituteFed Agency:46,102 46,102NIH SUB GSI 09208993.838 AF654/ / Y
NIH / National Institute of Allergy & Infectious DiseasesFed Agency:4,425 4,425NIH Sub GS 00387534 ANTIC93.000 AG993/ / Y
NIH / National Institutes of HealthFed Agency:562 562NIH SUB GSI 08397193.242 AC083/ / Y
31,992 31,992NIH SUB GSI 08750993.865 AE481/ / Y
83,081 83,081Pass-through entity total:
Governors State University1R&DCluster:
US Department of EducationFed Agency:30,450 30,450Governors State Univ84.031 E1989/ / Y
30,450 30,450Pass-through entity total:
Harvard College1R&DCluster:
NIH / National Institutes of HealthFed Agency:48,270 48,270NIH SUB HU 136379-510731393.310 AF610/ / Y
48,270 48,270Pass-through entity total:
Harvard School of Public Health1R&DCluster:
NIH / National Institute of Child Health & Human DevelopmentFed Agency:89,387 89,387Harvard Sub 114205 1366 509682793.865 E1225/ / Y
NIH / National Institutes of HealthFed Agency:590,447 590,447Harvard 114205-1466-509682793.865 E0751/ / Y
679,834 679,834Pass-through entity total:
FY19 SEFA Pass-through detailsHarvard School of Public Health Page 169

Urbana Chicago SpringfieldTotal for Pass-Through Detail
Pass-Through Entity
CFDA Number / U of I Grant Code / Pass-Through Award Title
ClusterFed Agency Major
Program
HHektoen Institute for Medical Research LLC1R&DCluster:
NIH / National Institute of Allergy & Infectious DiseasesFed Agency:3,912 3,912Hektoen Subaward No 50042-324-UIC0193.855 E0653/ / Y3,104 3,104Hektoen Subaward 50713-R01-UIC0193.855 E0895/ / Y
-5 -5Hektoen Sub 50041-324-UIC0193.855 E1154/ / YNIH / National Institute of Child Health & Human DevelopmentFed Agency:
20,411 20,411Hektoen 50675 324 UIC 0293.865 E3057/ / YNIH / National Institute of Mental HealthFed Agency:
3,914 3,914Hektoen Subaward No: 50504-324-UIC93.242 E0675/ / YNIH / National Institutes of HealthFed Agency:
17,062 17,062Hektoen Institute93.855 E2979/ / Y9,189 9,189Hektoen 50612-324-UIC1-AI03499393.855 E3330/ / Y
57,587 57,587Pass-through entity total:
Henry M Jackson Fdn for the Advancement of Military Medicine1R&DCluster:
Defense POW/MIA Accounting Agency (DPAA)Fed Agency:77,354 77,354Henry M Jackson Foundation 655412.000 E0529/ / Y91,894 91,894Henry M Jackson Sub 4780 PO 96639812.740 E0484/ / Y
NIH / National Institute of Allergy & Infectious DiseasesFed Agency:163,622 163,622HJF Sub 4677 PO95450893.855 E0768/ / Y
332,870 332,870Pass-through entity total:
Hillard HeintzeOther ProgramsCluster:
US Department of Justice (DOJ)Fed Agency:13,250 13,250Hillard Heintze E100616.710 E1006/ / N
13,250 13,250Pass-through entity total:
Hilton Publishing Inc/HPC1R&DCluster:
NIH / National Institute on Minority Health & Health DisparitiesFed Agency:14,953 14,953Hilton Publishing 0322017300093.307 E0532/ / Y
14,953 14,953Pass-through entity total:
FY19 SEFA Pass-through detailsHilton Publishing Inc/HPC Page 170

Urbana Chicago SpringfieldTotal for Pass-Through Detail
Pass-Through Entity
CFDA Number / U of I Grant Code / Pass-Through Award Title
ClusterFed Agency Major
Program
HHoneywell1R&DCluster:
US Department of Energy (DOE)Fed Agency:1,071 1,071DOE Sub Honeywell N000023025681.000 AE499/ / Y
1,071 1,071Pass-through entity total:
Housing Authority of Champaign County1R&DCluster:
Housing & Urban Development (HUD)Fed Agency:85,080 85,080HACC 2011-0545914.000 B8961/ / Y
85,080 85,080Pass-through entity total:
HRL Laboratories1R&DCluster:
Defense Advanced Research Projects Agency (DARPA)Fed Agency:131,118 131,118DARPA Sub HRL 17090-181687-US12.000 AF631/ / Y
131,118 131,118Pass-through entity total:
Icahn School of Medicine at Mount Sinai1R&DCluster:
NIH / National Cancer InstituteFed Agency:-3,908 -3,908MSSM 0254 7378 460593.395 E3137/ / Y
NIH / National Institute of Mental HealthFed Agency:56,927 56,927Icahn 0255-2911-460993.242 E1199/ / Y
53,019 53,019Pass-through entity total:
Idaho National Engr & Env Lab1R&DCluster:
Idaho National Engr & Env LabFed Agency:25,479 25,479DOE INL 0012713981.000 A0363/ / Y
25,479 25,479Pass-through entity total:
IDHS Division of Mental Health1R&DCluster:
Substance Abuse & Mental Health Services Admin (SAMHSA)Fed Agency:1,946 1,946IDHS 45CWB03876 FY 1893.243 H7626/ / Y
1,946 1,946Pass-through entity total:
FY19 SEFA Pass-through detailsIDHS Division of Mental Health Page 171

Urbana Chicago SpringfieldTotal for Pass-Through Detail
Pass-Through Entity
CFDA Number / U of I Grant Code / Pass-Through Award Title
ClusterFed Agency Major
Program
IIDNR Office of Resource Conservation1R&DCluster:
US Fish & WildlifeFed Agency:115,681 115,681IDNR FWS FW-16-D-215.605 D6732a/ / Y115,682 115,682IDNR FWS FW-16-D-215.611 D6732b/ / Y
231,363 231,363Pass-through entity total:
IIT Research Institute (IITRI)1R&DCluster:
NIH / National Institutes of HealthFed Agency:5,839 5,839IIT Res Inst. 141-0-2572-002-002-RL93.393 E1184/ / Y
5,839 5,839Pass-through entity total:
IL Community College BoardOther ProgramsCluster:
US Department of EducationFed Agency:58,525 58,525IL CCB 508Ul1984.002 H7557/ / N
199,190 199,190ICCB F-UI-CTEL1900184.048 D5687/ / N85,134 85,134ICCB F-UI-CTEL1800184.048 D5832/ / N
-315 -315ICCB F-UI-CTEL1700184.048 D6008/ / N
284,009 58,525 342,534Pass-through entity total:
IL Council on Developmental Disabilities1R&DCluster:
US Health & Human Services (HHS)Fed Agency:96,699 96,699IL Council On Dev Disabilities 111893.630 E1003/ / Y
96,699 96,699Pass-through entity total:
IL Criminal Justice Information AuthorityOther ProgramsCluster:
US Department of Justice (DOJ)Fed Agency:-667 -667ICJIA 21618716.575 H7609/ / N
-667 -667Pass-through entity total:
IL Department of Children & Family Services (DCFS)Other ProgramsCluster:
Administration for Children and Families (ACF)Fed Agency:100,000 100,000IDCFS 171491901993.643 H7544a/ / N
FY19 SEFA Pass-through detailsIL Department of Children & Family Services (DCFS) Page 172

Urbana Chicago SpringfieldTotal for Pass-Through Detail
Pass-Through Entity
CFDA Number / U of I Grant Code / Pass-Through Award Title
ClusterFed Agency Major
Program
70,891 70,891IDCFS 2285979019 9410010968193.643 H7594a/ / N-5,486 -5,486DCFS MERIT 171491901893.643 H7628/ / N2,138 2,138DCFS 228597901893.643 H7663/ / N
35,000 35,000IDCFS 171491901993.669 H7544b/ / N60,000 60,000IDCFS 2285979019 9410010968193.669 H7594b/ / N
262,543 262,543Pass-through entity total:
IIL Department of Commerce & Economic Opportunity (DCEO)1R&DCluster:
US Department of Labor (DOL)Fed Agency:1,780 1,780IDCEO 18-63309017.258 D5612a/ / Y1,892 1,892IDCEO 18-63309017.259 D5612b/ / Y2,784 2,784IDCEO 18-63309017.278 D5612c/ / Y
Other ProgramsCluster:Housing & Urban Development (HUD)Fed Agency:
761,397 761,397IDCEO 08-35506114.228 D5950/ / NUS Department of Energy (DOE)Fed Agency:
815,808 815,808IDCEO FY19 HWAP81.042 D5734a/ / N-3,735 -3,735IDCEO FY18 HWAP81.042 D5911a/ / N
US Health & Human Services (HHS)Fed Agency:815,808 815,808IDCEO FY19 HWAP93.568 D5734b/ / N
-3,735 -3,735IDCEO FY18 HWAP93.568 D5911b/ / N
2,391,999 2,391,999Pass-through entity total:
IL Department of Human Services (IDHS)1R&DCluster:
Substance Abuse & Mental Health Services Admin (SAMHSA)Fed Agency:140,624 140,624IDHS 45CXB0387693.243 H7576/ / Y
US Health & Human Services (HHS)Fed Agency:129,965 129,965IDHS FCSXP04712 FY1993.092 D5731/ / Y
10 10IDHS 43CWZ03218 FY 201893.243 H7636/ / Y32,710 32,710IDHS FCSXS05204 FY1993.870 D5617/ / Y
442,339 442,339IDHS FCSXS04118 FY1993.870 D5732/ / Y196,147 196,147IDHS 43CXZ03292 FY1993.959 D5726/ / Y302,671 302,671IDHS 43CXZ03289 FY1993.959 D5727/ / Y
5 5IDHS 43CWZ03289 FY1893.959 D5917/ / Y19 19IDHS 43CWZ03292 FY1893.959 D5920/ / Y
CCDFCluster:
FY19 SEFA Pass-through detailsIL Department of Human Services (IDHS) Page 173

Urbana Chicago SpringfieldTotal for Pass-Through Detail
Pass-Through Entity
CFDA Number / U of I Grant Code / Pass-Through Award Title
ClusterFed Agency Major
Program
Administration for Children and Families (ACF)Fed Agency:864 864IDHS 00503815 Antc93.596 D5557/ / Y
53,672 53,672IDHS FCSXI04946 FY1993.596 D5702/ / Y2,212,846 2,212,846IDHS FCSXI04797 FY1993.596 D5710/ / Y
12,841 12,841IDHS FCSWI03364 FY1893.596 D5831/ / Y17,134 17,134IDHS FCSWI04797 FY1893.596 D5888/ / Y
Other ProgramsCluster:Substance Abuse & Mental Health Services Admin (SAMHSA)Fed Agency:
150,990 150,990IDHS 43CXZ03303 FY1993.243 D5730a/ / N117,171 117,171IDHS 43CXZ0321893.243 H7570/ / N
7 7IDHS 43CWZ03304 FY1893.788 D5856/ / N120,886 120,886IDHS 43CXZ03303 FY1993.959 D5730b/ / N
395,360 395,360IDHS IGA 43CXC0308293.959 H7583/ / N42,155 42,155IDHS 43CWC0308293.959 H7637/ / N
140,052 140,052IDHS 43CWC0301193.959 H7638/ / NUS Department of Agriculture (USDA)Fed Agency:
147,253 147,253IDHS FCSXQ0338510.557 H7559/ / N22,350 22,350IDHS FCSXQ0338610.557 H7560/ / N
US Department of Justice (DOJ)Fed Agency:113,230 113,230IDHS FCSXR03370 FY1916.540 D5729/ / N
US Health & Human Services (HHS)Fed Agency:83,434 83,434IDHS FCSXP03995 FY1993.297 D5725/ / N99,317 99,317IDHS 43CXZ03277 FY1993.959 D5728/ / N
SNAPCluster:USDA Food and Nutrition Service (FNS)Fed Agency:
9,972,194 3,088,766 13,060,960IDHS SNAP FCSXQ03623 FY1910.561 D5759/ / N4,955 -1,514 3,441IDHS SNAP FCSWQ03623 FY1810.561 D5916/ / N
TANFCluster:Administration for Children and Families (ACF)Fed Agency:
60,589 60,589831 DHHS-ACF IDHS TANF FY1993.558 M9044/ / Y
13,946,226 4,092,227 60,589 18,099,042Pass-through entity total:
IIL Department of Natural Resources (IDNR)1R&DCluster:
US Department of InteriorFed Agency:172,630 172,630583 USFWS IDNR Osprey/Grd Sqrrl15.611 M9048/ / Y
226 226583 USFWS IDNR Osprey Frnk Grd Squi15.611 M9120/ / Y2,472 2,472IDNR R16SP00115.634 D6097/ / Y
FY19 SEFA Pass-through detailsIL Department of Natural Resources (IDNR) Page 174
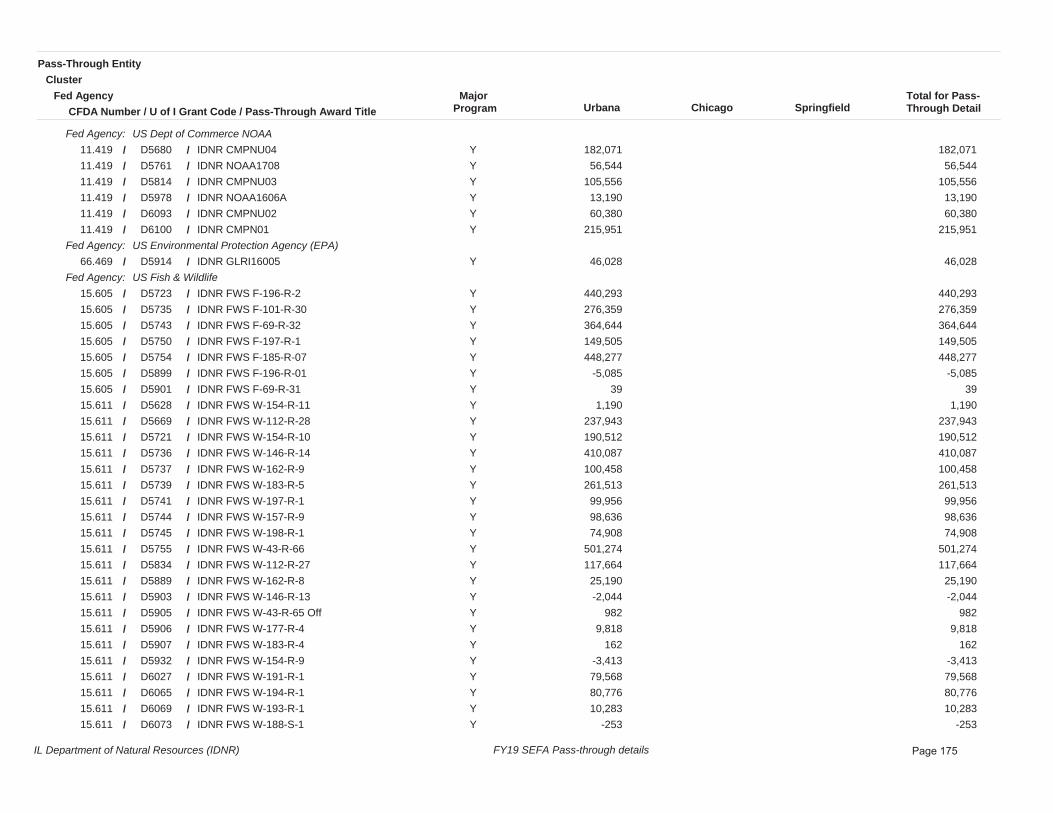
Urbana Chicago SpringfieldTotal for Pass-Through Detail
Pass-Through Entity
CFDA Number / U of I Grant Code / Pass-Through Award Title
ClusterFed Agency Major
Program
US Dept of Commerce NOAAFed Agency:182,071 182,071IDNR CMPNU0411.419 D5680/ / Y56,544 56,544IDNR NOAA170811.419 D5761/ / Y
105,556 105,556IDNR CMPNU0311.419 D5814/ / Y13,190 13,190IDNR NOAA1606A11.419 D5978/ / Y60,380 60,380IDNR CMPNU0211.419 D6093/ / Y
215,951 215,951IDNR CMPN0111.419 D6100/ / YUS Environmental Protection Agency (EPA)Fed Agency:
46,028 46,028IDNR GLRI1600566.469 D5914/ / YUS Fish & WildlifeFed Agency:
440,293 440,293IDNR FWS F-196-R-215.605 D5723/ / Y276,359 276,359IDNR FWS F-101-R-3015.605 D5735/ / Y364,644 364,644IDNR FWS F-69-R-3215.605 D5743/ / Y149,505 149,505IDNR FWS F-197-R-115.605 D5750/ / Y448,277 448,277IDNR FWS F-185-R-0715.605 D5754/ / Y
-5,085 -5,085IDNR FWS F-196-R-0115.605 D5899/ / Y39 39IDNR FWS F-69-R-3115.605 D5901/ / Y
1,190 1,190IDNR FWS W-154-R-1115.611 D5628/ / Y237,943 237,943IDNR FWS W-112-R-2815.611 D5669/ / Y190,512 190,512IDNR FWS W-154-R-1015.611 D5721/ / Y410,087 410,087IDNR FWS W-146-R-1415.611 D5736/ / Y100,458 100,458IDNR FWS W-162-R-915.611 D5737/ / Y261,513 261,513IDNR FWS W-183-R-515.611 D5739/ / Y99,956 99,956IDNR FWS W-197-R-115.611 D5741/ / Y98,636 98,636IDNR FWS W-157-R-915.611 D5744/ / Y74,908 74,908IDNR FWS W-198-R-115.611 D5745/ / Y
501,274 501,274IDNR FWS W-43-R-6615.611 D5755/ / Y117,664 117,664IDNR FWS W-112-R-2715.611 D5834/ / Y25,190 25,190IDNR FWS W-162-R-815.611 D5889/ / Y-2,044 -2,044IDNR FWS W-146-R-1315.611 D5903/ / Y
982 982IDNR FWS W-43-R-65 Off15.611 D5905/ / Y9,818 9,818IDNR FWS W-177-R-415.611 D5906/ / Y
162 162IDNR FWS W-183-R-415.611 D5907/ / Y-3,413 -3,413IDNR FWS W-154-R-915.611 D5932/ / Y79,568 79,568IDNR FWS W-191-R-115.611 D6027/ / Y80,776 80,776IDNR FWS W-194-R-115.611 D6065/ / Y10,283 10,283IDNR FWS W-193-R-115.611 D6069/ / Y
-253 -253IDNR FWS W-188-S-115.611 D6073/ / Y
FY19 SEFA Pass-through detailsIL Department of Natural Resources (IDNR) Page 175

Urbana Chicago SpringfieldTotal for Pass-Through Detail
Pass-Through Entity
CFDA Number / U of I Grant Code / Pass-Through Award Title
ClusterFed Agency Major
Program
52,678 52,678IDNR FWS W-181-R-115.611 D6372/ / Y-238 -238IDNR FWS W-182-R-115.611 D6422/ / Y
7,707 7,707IDNR FWS T-123-R-115.634 D5619/ / Y21,114 21,114IDNR FWS T-104-R-215.634 D5659/ / Y11,175 11,175IDNR FWS U-3-D-115.634 D5673/ / Y43,244 43,244IDNR FWS T-121-R-115.634 D5675/ / Y
7,637 7,637IDNR FWS T-122-R-115.634 D5681/ / Y54,198 54,198IDNR FWS T-120-R-115.634 D5685/ / Y59,783 59,783IDNR FWS T-119-R-115.634 D5686/ / Y66,207 66,207IDNR FWS T-118-R-115.634 D5803/ / Y
110,667 110,667IDNR FWS T-113-R-115.634 D5933/ / Y59,558 59,558IDNR FWS T-110-R-115.634 D5934/ / Y56,687 56,687IDNR FWS T-115-R-115.634 D5938/ / Y71,617 71,617IDNR FWS T-105-R-115.634 D6101/ / Y
115,224 115,224IDNR FWS T-104-R-115.634 D6118/ / Y7,647 7,647IDNR FWS T-108-R-115.634 D6119/ / Y
86,744 86,744IDNR FWS T-99-R-115.634 D6141/ / Y662 662IDNR FWS U-2-R-115.634 D6234/ / Y
100,584 100,584IDNR RC18T117R115.634 H7590/ / Y20,369 20,369IDNR CAFWS-141B15.662 D5620/ / Y15,228 15,228IDNR CAFWS-141C15.662 D5621/ / Y
176 176IDNR CAFWS-135A15.662 D5641/ / Y73,278 73,278IDNR CAFWS-135B15.662 D5643/ / Y
148,820 148,820IDNR CAFWS-126E15.662 D5770/ / Y324,378 324,378IDNR CAFWS-126D15.662 D5771/ / Y396,469 396,469IDNR CAFWS-126C 08933415.662 D5797/ / Y36,800 36,800IDNR CAFWS-126 KC08681315.662 D5931/ / Y26,126 26,126IDNR CAFWS-123E KC08674315.662 D5935/ / Y
152 152IDNR CAFWS-123D KC08674215.662 D5936/ / Y40,186 40,186IDNR CAFWS-106H 2016-0584015.662 D6053/ / Y11,344 11,344IDNR CAFWS-106G 2016-0521315.662 D6089/ / Y
526 526IDNR CAFWS-106E 2016-0521515.662 D6090/ / YFish and WildlifeCluster:
US Fish & WildlifeFed Agency:140,589 140,589IDNR FWS W-188-S-215.611 D5738/ / N
Other ProgramsCluster:US Department of Agriculture (USDA)Fed Agency:
114,077 114,077IDNR RC18VFAIFS10.664 D5661/ / N
FY19 SEFA Pass-through detailsIL Department of Natural Resources (IDNR) Page 176
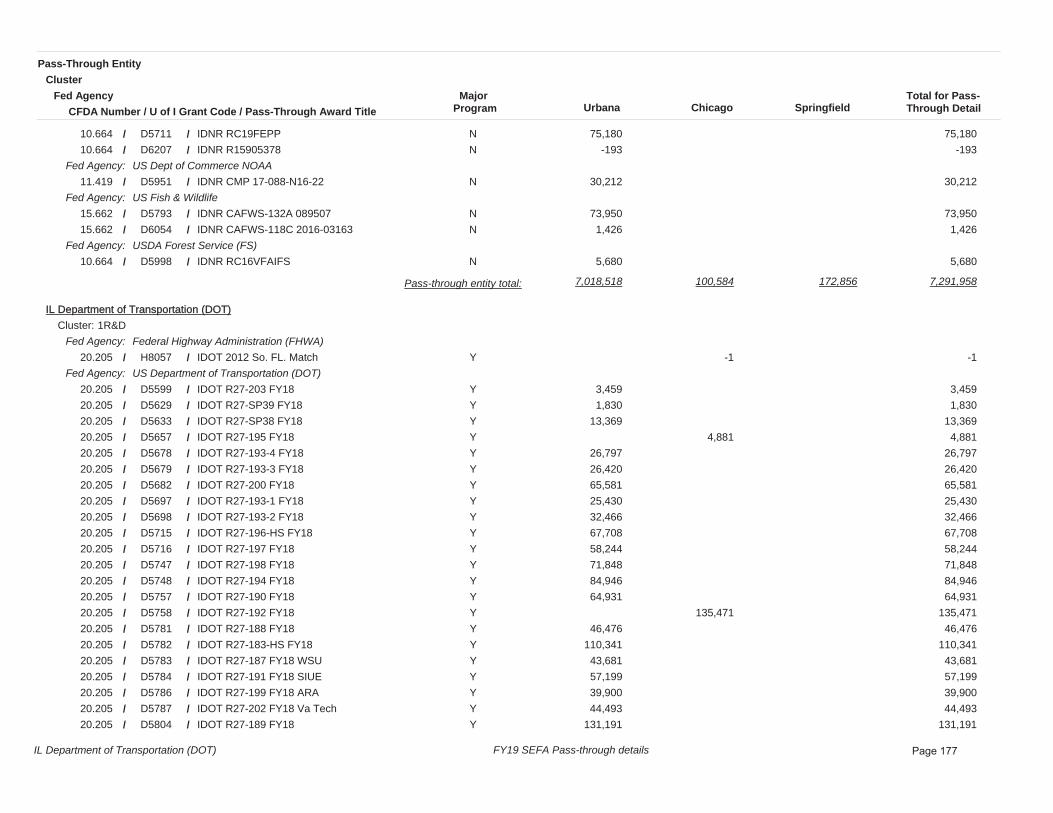
Urbana Chicago SpringfieldTotal for Pass-Through Detail
Pass-Through Entity
CFDA Number / U of I Grant Code / Pass-Through Award Title
ClusterFed Agency Major
Program
75,180 75,180IDNR RC19FEPP10.664 D5711/ / N-193 -193IDNR R1590537810.664 D6207/ / N
US Dept of Commerce NOAAFed Agency:30,212 30,212IDNR CMP 17-088-N16-2211.419 D5951/ / N
US Fish & WildlifeFed Agency:73,950 73,950IDNR CAFWS-132A 08950715.662 D5793/ / N
1,426 1,426IDNR CAFWS-118C 2016-0316315.662 D6054/ / NUSDA Forest Service (FS)Fed Agency:
5,680 5,680IDNR RC16VFAIFS10.664 D5998/ / N
7,018,518 100,584 172,856 7,291,958Pass-through entity total:
IIL Department of Transportation (DOT)1R&DCluster:
Federal Highway Administration (FHWA)Fed Agency:-1 -1IDOT 2012 So. FL. Match20.205 H8057/ / Y
US Department of Transportation (DOT)Fed Agency:3,459 3,459IDOT R27-203 FY1820.205 D5599/ / Y1,830 1,830IDOT R27-SP39 FY1820.205 D5629/ / Y
13,369 13,369IDOT R27-SP38 FY1820.205 D5633/ / Y4,881 4,881IDOT R27-195 FY1820.205 D5657/ / Y
26,797 26,797IDOT R27-193-4 FY1820.205 D5678/ / Y26,420 26,420IDOT R27-193-3 FY1820.205 D5679/ / Y65,581 65,581IDOT R27-200 FY1820.205 D5682/ / Y25,430 25,430IDOT R27-193-1 FY1820.205 D5697/ / Y32,466 32,466IDOT R27-193-2 FY1820.205 D5698/ / Y67,708 67,708IDOT R27-196-HS FY1820.205 D5715/ / Y58,244 58,244IDOT R27-197 FY1820.205 D5716/ / Y71,848 71,848IDOT R27-198 FY1820.205 D5747/ / Y84,946 84,946IDOT R27-194 FY1820.205 D5748/ / Y64,931 64,931IDOT R27-190 FY1820.205 D5757/ / Y
135,471 135,471IDOT R27-192 FY1820.205 D5758/ / Y46,476 46,476IDOT R27-188 FY1820.205 D5781/ / Y
110,341 110,341IDOT R27-183-HS FY1820.205 D5782/ / Y43,681 43,681IDOT R27-187 FY18 WSU20.205 D5783/ / Y57,199 57,199IDOT R27-191 FY18 SIUE20.205 D5784/ / Y39,900 39,900IDOT R27-199 FY18 ARA20.205 D5786/ / Y44,493 44,493IDOT R27-202 FY18 Va Tech20.205 D5787/ / Y
131,191 131,191IDOT R27-189 FY1820.205 D5804/ / Y
FY19 SEFA Pass-through detailsIL Department of Transportation (DOT) Page 177

Urbana Chicago SpringfieldTotal for Pass-Through Detail
Pass-Through Entity
CFDA Number / U of I Grant Code / Pass-Through Award Title
ClusterFed Agency Major
Program
130,996 130,996IDOT R27-182 FY1820.205 D5806/ / Y75,090 75,090IDOT R27-180 FY1820.205 D5811/ / Y99,085 99,085IDOT R27-186 FY18 BU20.205 D5817/ / Y44,698 44,698IDOT R27-164 FY18 WSU20.205 D5818/ / Y76,332 76,332IDOT R27-151 FY18 ARA20.205 D5819/ / Y
8,571 8,571IDOT R27-157 FY18 SIUE20.205 D5820/ / Y56,742 56,742IDOT R27-178-2 FY18 SLU20.205 D5821/ / Y
109,685 109,685IDOT R27-181 FY18 USGS20.205 D5822/ / Y66,169 66,169IDOT R27-179 FY18 SLU20.205 D5823/ / Y99,979 99,979IDOT R27-120 FY18 Iowa St20.205 D5825/ / Y98,166 98,166IDOT R27-171 FY18 IIT20.205 D5826/ / Y
-152 -152IDOT R27-172 FY18 VT20.205 D5827/ / Y57,370 57,370IDOT R27-178-1 FY1820.205 D5833/ / Y
62,089 62,089IDOT R27-177 FY1820.205 D5837/ / Y39,221 39,221IDOT R27-176 FY1820.205 D5838/ / Y
6,176 6,176IDOT R27-SP37-C FY1820.205 D5839/ / Y259,617 259,617IDOT R27-175 FY1820.205 D5862/ / Y73,051 73,051IDOT R27-174 FY1820.205 D5863/ / Y65,798 65,798IDOT R27-170A FY1820.205 D5864/ / Y35,039 35,039IDOT R27-168 FY1820.205 D5866/ / Y
6,623 6,623IDOT R27-149-2 FY1820.205 D5874/ / Y149,177 149,177IDOT R27-127 FY1820.205 D5878/ / Y17,761 17,761IDOT R27-RDI FY1820.205 D5882/ / Y
154,864 154,864IDOT R27-PC FY1820.205 D5883/ / Y39,008 39,008IDOT R27-ET2 FY1820.205 D5884/ / Y
-109 -109IDOT R27-162 FY1620.205 D6250/ / Y-84 -84IDOT R27-154 FY1620.205 D6276/ / Y
253,118 253,118IDOT20.205 H7540/ / Y2,601 2,601IDOT TS-18-31620.505 H7539/ / Y
22,957 22,957752 NHTSA IDOT FY19 Tele Survey20.600 M9037/ / Y334,226 334,226583 NHTSA IDOT TS FFY1920.600 M9038/ / Y18,572 18,572752 NHTSA IDOT FY18 Tele Survey20.600 M9055/ / Y
111,120 111,120583 NHTSA IDOT IP FFY1820.600 M9058/ / YOther ProgramsCluster:
Federal Aviation Administration (FAA)Fed Agency:255,837 255,837IDOT Airport CMI-470320.106 D5653/ / N167,590 167,590IDOT Airport CMI-450320.106 D5941/ / N26,691 26,691IDOT Airport CMI-438220.106 D6111/ / N
FY19 SEFA Pass-through detailsIL Department of Transportation (DOT) Page 178

Urbana Chicago SpringfieldTotal for Pass-Through Detail
Pass-Through Entity
CFDA Number / U of I Grant Code / Pass-Through Award Title
ClusterFed Agency Major
Program
452 452IDOT Airport CMI-440820.106 D6112/ / N749 749IDOT Airport CMI-434720.106 D6231/ / N
US Department of Transportation (DOT)Fed Agency:10,714 10,714IDOT18-0338-518920.509 H7622/ / N
3,236,586 468,789 486,875 4,192,250Pass-through entity total:
IIL Primary Health Care AssnOther ProgramsCluster:
Centers for Disease Control and Prevention (CDC)Fed Agency:10,000 10,000IPHCA93.424 E0609/ / N
10,000 10,000Pass-through entity total:
IL State ArchivesOther ProgramsCluster:
National Historical Publications & Records Commission NHPRCFed Agency:75,960 75,960ISA 17AV01381089.003 D5949/ / N
75,960 75,960Pass-through entity total:
IL State Board of Education (ISBE)1R&DCluster:
US Department of EducationFed Agency:131,665 131,665ISBE MY19532 FY1984.027 D5699/ / Y
Child NutritionCluster:US Department of Agriculture (USDA)Fed Agency:
3,754 3,754ISBE 09010545051 FY1810.559 H7551/ / NOther ProgramsCluster:
US Department of Agriculture (USDA)Fed Agency:41,490 19,359 60,849ISBE 0901054505110.558 H8222/ / N
871,469 871,469ISBE MY1684210.560 D6109/ / NUS Department of EducationFed Agency:
92,412 92,412ISBE MY16622 FY1984.010 D5692/ / N3,454 3,454ISBE MY16622 FY1884.010 D5845/ / N
24,688 24,688ISBE 18-4720-00-09-010-5450-5184.048 D5816/ / N128,194 128,194ISBE 18-4936-7B-09-010-5450-5184.366 D5807/ / N
3,028 3,028ISBE 17-4936-7B-09-010-5450-5184.366 D5926/ / NUSDA Food and Nutrition Service (FNS)Fed Agency:
15,549 15,549Child/Adult Food Prg10.558 M9496/ / NSpecial Education (IDEA)Cluster:
FY19 SEFA Pass-through detailsIL State Board of Education (ISBE) Page 179

Urbana Chicago SpringfieldTotal for Pass-Through Detail
Pass-Through Entity
CFDA Number / U of I Grant Code / Pass-Through Award Title
ClusterFed Agency Major
Program
US Department of EducationFed Agency:534 534ISBE MY16537 FY1884.027 D5846/ / N
1,296,934 23,113 15,549 1,335,596Pass-through entity total:
IIL State LibraryOther ProgramsCluster:
Institute of Museum & Library Services (IMLS)Fed Agency:75 75967 IMLS ISL Targeting Autism 17-1845.313 M9064/ / N
75 75Pass-through entity total:
Illinois Coalition Against Sexual AssaultOther ProgramsCluster:
US Department of Justice (DOJ)Fed Agency:62,980 62,980IL Coalition Against Sexual Assault16.526 E0510/ / N
62,980 62,980Pass-through entity total:
Illinois Department of Agriculture1R&DCluster:
US Department of Agriculture (USDA)Fed Agency:5,666 5,666IDOA SC-19-0610.170 D5631/ / Y
160 160IDOA SC-19-1310.170 D5634/ / Y5,724 5,724IDOA SC-19-0510.170 D5635/ / Y
10,173 10,173IDOA SC-19-0110.170 D5636/ / Y41,272 41,272IDOA SC-18-1010.170 D5772/ / Y23,660 23,660IDOA SC-18-1910.170 D5794/ / Y
2,879 2,879IDOA SC-17-0510.170 D5946/ / Y44,566 44,566IDOA SC-17-1910.170 D5948/ / Y39,210 39,210IDOA SC-17-1710.170 D5979/ / Y17,414 17,414IDOA SC-16-1810.170 D6103/ / Y
4,685 4,685IDOA SC-16-2010.170 D6104/ / YUSDA Animal & Plant Health Inspection Serv (APHIS)Fed Agency:
3,709 3,709IDOA 096155 Estes10.025 D5608/ / Y6,315 6,315IDOA 2019 Orchard Commodity10.025 D5609/ / Y
34,781 34,781IDOA CAPS Infrastructure CY1910.025 D5644/ / Y8,480 8,480IDOA CAPS Survey CY1910.025 D5646/ / Y
29,093 29,093IDOA 2018 Grape Commodity10.025 D5749/ / Y16,218 16,218IDOA CAPS Survey CY1810.025 D5800/ / Y52,573 52,573IDOA CAPS Infrastructure CY1810.025 D5801/ / Y
FY19 SEFA Pass-through detailsIllinois Department of Agriculture Page 180

Urbana Chicago SpringfieldTotal for Pass-Through Detail
Pass-Through Entity
CFDA Number / U of I Grant Code / Pass-Through Award Title
ClusterFed Agency Major
Program
-1,191 -1,191IDOA 2017 Forest Pest Pathway10.025 D5927/ / Y3,476 3,476IDOA 2017 Grape Commodity10.025 D5928/ / Y2,987 2,987IDOA 2017 Orchard Commodity10.025 D5929/ / Y
Other ProgramsCluster:US Department of Agriculture (USDA)Fed Agency:
3,483 3,483IDOA SC-19-0210.170 D5645/ / N
355,333 355,333Pass-through entity total:
IIllinois Department of Public Health (IDPH)1R&DCluster:
Administration for Children and Families (ACF)Fed Agency:32,496 32,496IDPH 96180067G93.667 H7546b/ / Y
Centers for Disease Control and Prevention (CDC)Fed Agency:16,242 16,242IDPH IGA 86100009F93.283 H7635/ / Y
-2 -2IDPH FY18 Environmental Health 0193.323 D5859/ / Y87,992 87,992IDPH 86100024F93.898 H7601/ / Y
NIH / National Institutes of HealthFed Agency:96,770 96,770IDPH 932060001G93.000 H7550/ / Y15,948 15,948IDPH 95780044G93.917 H7517/ / Y
US Health & Human Services (HHS)Fed Agency:143,116 143,116IDPH 96180067G93.217 H7546a/ / Y
Other ProgramsCluster:Administration for Children and Families (ACF)Fed Agency:
25,574 25,574IDPH 96380022G93.667 H7577a/ / N27,210 27,210IDPH Agreement No 86180067F93.667 H7613b/ / N-1,573 -1,573IDPH Agreement 86380022F93.667 H7644/ / N
Centers for Disease Control and Prevention (CDC)Fed Agency:51,624 51,624IDPH 93206001G93.898 H7549/ / N
-966 -966IDPH 83204001F93.898 H7617/ / NCorporation for National & Community ServiceFed Agency:
134,379 134,379IDPH 97380020G94.006 H7561/ / N15,308 15,308IDPH 87380020F94.006 H7615/ / N
Health Resources and Services Administration (HRSA)Fed Agency:591,307 591,307IDPH 75780032E93.917 H7679a/ / N23,484 23,484IDPH IGA# 96300017G93.994 H7536/ / Y
3,712,964 3,712,964IDPH IGA 96300015G93.994 H7563/ / Y54,302 54,302IDPH 96380022G93.994 H7577b/ / Y
299,771 299,771IDPH 090226KN 86380010F93.994 H7619/ / Y
FY19 SEFA Pass-through detailsIllinois Department of Public Health (IDPH) Page 181

Urbana Chicago SpringfieldTotal for Pass-Through Detail
Pass-Through Entity
CFDA Number / U of I Grant Code / Pass-Through Award Title
ClusterFed Agency Major
Program
1,799,147 1,799,147IDPH contract no. 86380011F93.994 H7625/ / Y461 461IDPH Agreement no. 86380014F93.994 H7642/ / Y
Housing & Urban Development (HUD)Fed Agency:164,360 164,360IDPH 75780032E14.241 H7679b/ / N
HRSA/BHPR/DADPHP (Health Resources and Services)Fed Agency:187,695 187,695IDPH 85780044F93.917 H7595/ / N
6,682 6,682IDPH 75780037E93.917 H7671/ / NUS Health & Human Services (HHS)Fed Agency:
68,712 68,712IDPH Agreement No 86180067F93.217 H7613a/ / N3,437 3,437IDPH FY2017-OWH-00393.994 H7756/ / Y
-2 7,556,442 7,556,440Pass-through entity total:
IIllinois Department on AgingAgingCluster:
US Health & Human Services (HHS)Fed Agency:2,749 2,749IDoA U12061261093.044 H8910/ / N
2,749 2,749Pass-through entity total:
Illinois Environmental Protection Agency1R&DCluster:
US Environmental Protection Agency (EPA)Fed Agency:35,070 35,070IEPA FW-1522066.419 D6269/ / Y11,320 11,320IEPA 60417366.454 D5677/ / Y
1,715 1,715IEPA 60415366.454 D6140/ / Y1,223 1,223IEPA FWN-1030166.460 D7249/ / Y
13,557 13,557IEPA FW-1610266.605 D6061/ / YOther ProgramsCluster:
US Department of Energy (DOE)Fed Agency:442,728 442,728IEPA SEP19000181.041 D5712/ / N154,633 154,633IEPA SEP19000381.041 D5714/ / N312,535 312,535IEPA SEP19000281.041 D5724/ / N
1 1IEPA SEP18000281.041 D5760/ / N-179 -179IEPA SEP18000181.041 D5792/ / N
972,603 972,603Pass-through entity total:
FY19 SEFA Pass-through detailsIllinois Environmental Protection Agency Page 182

Urbana Chicago SpringfieldTotal for Pass-Through Detail
Pass-Through Entity
CFDA Number / U of I Grant Code / Pass-Through Award Title
ClusterFed Agency Major
Program
IIllinois Facilities FundOther ProgramsCluster:
Housing & Urban Development (HUD)Fed Agency:613 613IL Facilities Fund14.000 E0401/ / N
613 613Pass-through entity total:
Illinois Head Start AssociationOther ProgramsCluster:
US Department of EducationFed Agency:66,182 66,182IHSA DE 2014-0315084.412 C3778/ / N
66,182 66,182Pass-through entity total:
Illinois Institute of Technology1R&DCluster:
NIH / National Institutes of HealthFed Agency:6,923 6,923IL Inst Of Technology SA5381007885393.847 E2802/ / Y
10,442 10,442IL Inst Of Technology SA5341013885493.847 E2804/ / Y
17,365 17,365Pass-through entity total:
Illinois Manufacturing Extension Center (IMEC)1R&DCluster:
National Institute of Standards & TechnologyFed Agency:1,493,116 1,493,116IMEC11.611 E1571a/ / Y
US Department of Labor (DOL)Fed Agency:29,826 29,826IMEC17.268 E1571b/ / Y
1,522,942 1,522,942Pass-through entity total:
Illinois Network of Child Care Resource & Referral/INCCRRACCDFCluster:
US Health & Human Services (HHS)Fed Agency:45,048 45,048HHS SUB INCCRRA 09098593.575 AF659/ / Y
45,048 45,048Pass-through entity total:
Illinois Public Health Institute1R&DCluster:
Centers for Disease Control and Prevention (CDC)Fed Agency:25,157 25,157IPHI NU58DP00650893.000 E0559/ / Y
FY19 SEFA Pass-through detailsIllinois Public Health Institute Page 183

Urbana Chicago SpringfieldTotal for Pass-Through Detail
Pass-Through Entity
CFDA Number / U of I Grant Code / Pass-Through Award Title
ClusterFed Agency Major
Program
25,157 25,157Pass-through entity total:
IIllinois State UniversityOther ProgramsCluster:
National Institute of Food and Agriculture/USDAFed Agency:438 438ISU TTA PO# BD18666110.310 B8059a/ / N
NIH / National Institutes of HealthFed Agency:376 376ISU TTA PO# BD18666193.846 B8059d/ / N376 376ISU TTA PO# BD18666193.859 B8059c/ / N
US National Science Foundation (NSF)Fed Agency:689 689ISU TTA PO# BD18666147.074 B8059b/ / N
1,879 1,879Pass-through entity total:
Indiana DNR Division of Fish & WildlifeOther ProgramsCluster:
US Fish & WildlifeFed Agency:40,845 40,845INT IDNR PO# 001755726615.634 AE610/ / N
40,845 40,845Pass-through entity total:
Indiana University1R&DCluster:
Centers for Disease Control and Prevention (CDC)Fed Agency:102,419 102,419Indiana Univ93.136 E0614/ / Y
Institute of Museum & Library Services (IMLS)Fed Agency:9,717 9,717IMLS Sub IU BL-4348803-UL45.312 AE376/ / Y
NIH / National Institute on Drug AbuseFed Agency:58,500 58,500Indiana University PO 227596993.000 E0612/ / Y53,416 53,416Indiana University IN-4679750-UIC93.279 E0611/ / Y
NIH / National Institutes of HealthFed Agency:76,063 76,063NIH SUB INU IN4684785UI93.395 AE004/ / Y
159,271 159,271Indiana University IN4687816UI93.839 E0634/ / YSubstance Abuse & Mental Health Services Admin (SAMHSA)Fed Agency:
7,245 7,245Indiana University93.243 E0613/ / Y10,125 10,125Indiana Univ 2005993.275 E0602/ / Y24,239 24,239Indiana Univ PO# 225071293.788 E0632/ / Y
US Department of EducationFed Agency:28,386 28,386IN Univ S004D160011 PO#197823684.004 E1385/ / Y
US National Science Foundation (NSF)Fed Agency:
FY19 SEFA Pass-through detailsIndiana University Page 184

Urbana Chicago SpringfieldTotal for Pass-Through Detail
Pass-Through Entity
CFDA Number / U of I Grant Code / Pass-Through Award Title
ClusterFed Agency Major
Program
545,888 545,888SBC Indiana U #BL-4812511-UIUC47.070 AC833/ / Y40,111 40,111SBC Indiana U #BL-4812534-UI47.070 AF301/ / Y
7,220 7,220IN4870700UI NSF 1502310 PO199448247.070 E1305/ / YOther ProgramsCluster:
US Department of EducationFed Agency:33,259 33,259DE Sub IN Univ BL-4225901-UL NRC84.015 AF436/ / N67,989 67,989DE Sub IN Univ BL-4225900-UL FLAS84.015 AF437/ / N
773,027 450,821 1,223,848Pass-through entity total:
IIndiana University Health Incorporated1R&DCluster:
US Health & Human Services (HHS)Fed Agency:58,251 58,251Indiana Univ Health 1H79TI081637-0193.243 E0460/ / Y
58,251 58,251Pass-through entity total:
Indiana University School of Medicine1R&DCluster:
NIH / National Institutes of HealthFed Agency:117,470 117,470IU School of Medicine IN-4687815UIC93.838 E0507/ / Y
117,470 117,470Pass-through entity total:
Information Systems Laboratories Inc1R&DCluster:
US Nuclear Regulatory CommissionFed Agency:31,980 31,980NRC Sub ISL 18-2001877.000 AF356/ / Y
31,980 31,980Pass-through entity total:
Ingersoll-Rand Co1R&DCluster:
US Department of Energy (DOE)Fed Agency:33,735 33,735DOE Sub IR 084592 PO 3005903881.086 AE957/ / Y
33,735 33,735Pass-through entity total:
InnSight Technology Inc1R&DCluster:
US National Science Foundation (NSF)Fed Agency:50,688 50,688SBC InnSight Technology 086715 SBIR47.041 AE550/ / Y
FY19 SEFA Pass-through detailsInnSight Technology Inc Page 185

Urbana Chicago SpringfieldTotal for Pass-Through Detail
Pass-Through Entity
CFDA Number / U of I Grant Code / Pass-Through Award Title
ClusterFed Agency Major
Program
50,688 50,688Pass-through entity total:
IInprentus Incorporated1R&DCluster:
US National Science Foundation (NSF)Fed Agency:21,997 21,997SBC Inprentus 084634 FUA47.041 AE916/ / Y
21,997 21,997Pass-through entity total:
Institute for Clinical Research Inc.1R&DCluster:
NIH / National Institute of Allergy & Infectious DiseasesFed Agency:-37,205 -37,205ICR M19CH00809073 Task Order 493.855 E3514/ / Y-8,995 -8,995ICR M19CH00809073 Task Order 393.855 E4843/ / Y
-46,200 -46,200Pass-through entity total:
Institute of International Education1R&DCluster:
US National Science Foundation (NSF)Fed Agency:1,601 1,601SBC IIE 09530847.079 AG905/ / Y
Other ProgramsCluster:US State DepartmentFed Agency:
86,329 86,329STATE Sub IIE 09111619.401 AF833/ / N
87,930 87,930Pass-through entity total:
Intelligent Automation Inc1R&DCluster:
Office of Naval Research (ONR)Fed Agency:30,000 30,000NAVY sub Intelligent Auto 2288-112.000 AF962/ / Y24,913 24,913Navy Sub Intelligent Auto 2382-112.000 AG912/ / Y
Other ProgramsCluster:Defense Threat Reduction Agency (DTRA)Fed Agency:
37,500 37,500DTRA Sub Intelligent Auto 2350-112.000 AF800/ / N
92,413 92,413Pass-through entity total:
International Business Machines Corp (IBM)1R&DCluster:
Defense Advanced Research Projects Agency (DARPA)Fed Agency:335,757 335,757DARPA Sub IBM CW291364612.910 AF342/ / Y
FY19 SEFA Pass-through detailsInternational Business Machines Corp (IBM) Page 186

Urbana Chicago SpringfieldTotal for Pass-Through Detail
Pass-Through Entity
CFDA Number / U of I Grant Code / Pass-Through Award Title
ClusterFed Agency Major
Program
US Department of Defense (DoD)Fed Agency:157,105 157,105IBM FA8650-15-C-756112.910 E2158/ / Y
335,757 157,105 492,862Pass-through entity total:
IInternational Computer Science Institute1R&DCluster:
US National Science Foundation (NSF)Fed Agency:47,660 47,660SBC ICSI ACI-134807747.070 AA529/ / Y
47,660 47,660Pass-through entity total:
Ionic Pharmaceuticals LLC1R&DCluster:
NIH / National Cancer InstituteFed Agency:27,970 27,970Ionic Pharmaceuticals UIC00193.395 E0715/ / Y
27,970 27,970Pass-through entity total:
Iowa State University1R&DCluster:
US Department of Agriculture (USDA)Fed Agency:2,441 2,441AG Sub ISU 410-40-44A10.215 AC630/ / Y
US Department of Justice (DOJ)Fed Agency:43,557 43,557Iowa State Sub No. 428-20-13A16.560 E1020/ / Y
US National Science Foundation (NSF)Fed Agency:-41,374 -41,374SBC Iowa State 4207287A47.041 AE689/ / Y
63,122 63,122Iowa State Univ 4206044A47.070 E1505/ / YOther ProgramsCluster:
US Health & Human Services (HHS)Fed Agency:7,783 7,783HHS SUB IA 430-30-01F93.103 AC490/ / N
-31,150 106,679 75,529Pass-through entity total:
Iria Pharma LLC1R&DCluster:
NIH / National Cancer InstituteFed Agency:28,084 28,084NIH Sub Iria 09482093.395 AF054/ / Y
US National Science Foundation (NSF)Fed Agency:70,000 70,000SBC Iria Pharma 09156247.041 AF620/ / Y
98,084 98,084Pass-through entity total:
FY19 SEFA Pass-through detailsIria Pharma LLC Page 187

Urbana Chicago SpringfieldTotal for Pass-Through Detail
Pass-Through Entity
CFDA Number / U of I Grant Code / Pass-Through Award Title
ClusterFed Agency Major
Program
JJaeb Center for Health Research1R&DCluster:
NIH / National Eye InstituteFed Agency:285 285Jaeb93.867 E1017/ / Y
2,830 2,830JCHR Protocol W 11 12 1593.867 E1798/ / Y11,144 11,144JAEB CeNter Hlth Rsch93.867 E3528/ / Y
NIH / National Institutes of HealthFed Agency:360 360Jaeb Ctr for Health Research93.837 E1018/ / Y526 526JCHR U10EY014231 - Protocol AA93.867 E2354/ / Y
8,064 8,064JCHR Protocol V 8 12 1393.867 E2788/ / Y
23,209 23,209Pass-through entity total:
Jail Education Solutions Inc/Edovo1R&DCluster:
NIH / National Institutes of HealthFed Agency:49,496 49,496Edovo RMH112274A93.242 E0753/ / Y
49,496 49,496Pass-through entity total:
James Madison UniversityOther ProgramsCluster:
National Park ServiceFed Agency:2,107 2,107AG-INT Sub JMU 094742 TTA15.945 AF039b/ / N
USDA Animal & Plant Health Inspection Serv (APHIS)Fed Agency:3,437 3,437AG-INT Sub JMU 094742 TTA10.028 AF039a/ / N
5,544 5,544Pass-through entity total:
JBS International Inc1R&DCluster:
Substance Abuse & Mental Health Services Admin (SAMHSA)Fed Agency:15,929 15,929JBS Intl HHSS283201200002I93.959 E2091/ / Y
15,929 15,929Pass-through entity total:
Johns Hopkins University1R&DCluster:
Air Force Office of Scientific Research (AFOSR)Fed Agency:7,635 7,635AF Sub JHU 200162586212.800 A0092/ / Y
Centers for Disease Control and Prevention (CDC)Fed Agency:38,899 38,899Johns Hopk Univ PO 200408722393.084 E0745/ / Y
FY19 SEFA Pass-through detailsJohns Hopkins University Page 188

Urbana Chicago SpringfieldTotal for Pass-Through Detail
Pass-Through Entity
CFDA Number / U of I Grant Code / Pass-Through Award Title
ClusterFed Agency Major
Program
NIH / National Inst on Deafness & Other Communication DisordersFed Agency:154,008 154,008JHU 2002405094 U01 DC013778-0193.173 E2420/ / Y
NIH / National Institute of Allergy & Infectious DiseasesFed Agency:29,488 29,488Johns Hopkins LDR 01 MOD 593.855 E1293/ / Y
NIH / National Institute of Child Health & Human DevelopmentFed Agency:49,797 49,797JHU PO 2004023981 PI Mostafa93.865 E0607/ / Y
NIH / National Institutes of HealthFed Agency:66,270 66,270John Hopkins 200362482293.242 E0977/ / Y
66 66John Hopkins 200313045693.837 E1507/ / Y7,946 7,946JHU 200304350093.838 E1596/ / Y
86,097 86,097NIH SUB JH 200285805393.859 AC647/ / YUS National Science Foundation (NSF)Fed Agency:
1,144 1,144SBC Johns Hopkins 200408385647.041 AF172/ / Y
94,876 346,474 441,350Pass-through entity total:
JJoslin Diabetes Center Inc1R&DCluster:
NIH / National Institute of Diabetes & Digestive & Kidney DiseasesFed Agency:450 450Joslin Diabetes Center93.847 E6026/ / Y
450 450Pass-through entity total:
Justice Research and Statistics AssociationOther ProgramsCluster:
US Department of Justice (DOJ)Fed Agency:8,318 8,318DOJ Sub JRSA BTUI-5200-00916.582 AF831/ / N
8,318 8,318Pass-through entity total:
Kalocyte Incorporated1R&DCluster:
NIH / National Institutes of HealthFed Agency:59,348 59,348NIH SUB KC 0035432093.839 AE539/ / Y
59,348 59,348Pass-through entity total:
Kansas State Univ1R&DCluster:
United States Agency for International Development (AID)Fed Agency:92,956 92,956AID Sub KSU S1413198.001 AA134/ / Y
1,061,352 1,061,352AID Sub KSU S1601998.001 AB078/ / Y
FY19 SEFA Pass-through detailsKansas State Univ Page 189

Urbana Chicago SpringfieldTotal for Pass-Through Detail
Pass-Through Entity
CFDA Number / U of I Grant Code / Pass-Through Award Title
ClusterFed Agency Major
Program
9,807 9,807AID Sub KSU S1913798.001 AF018/ / YUS Department of Energy (DOE)Fed Agency:
123,713 123,713DOE Sub KSU S1706181.121 AE787/ / YUS Environmental Protection Agency (EPA)Fed Agency:
15,683 15,683KS State Univ S1713866.509 E1430/ / YOther ProgramsCluster:
National Institute of Food and Agriculture/USDAFed Agency:-471 -471AG Sub KSU S1714010.500 AE744/ / Y
US Department of Agriculture (USDA)Fed Agency:4,930 4,930AG Sub KSU S1909510.500 AF073/ / Y8,683 8,683AG Sub KSU S1810110.500 AF953/ / Y1,107 1,107AG Sub KSU S1916010.500 AG936/ / Y
1,302,077 15,683 1,317,760Pass-through entity total:
KKeaneTech LLCOther ProgramsCluster:
Army CERLFed Agency:2,103 2,103ARMY sub Keanetech 17C0022-S112.000 AF986/ / N
2,103 2,103Pass-through entity total:
Lawrence Livermore National Lab1R&DCluster:
Lawrence Livermore National LabFed Agency:101,693 101,693DOE LLNL B61657181.000 AC623/ / Y80,939 80,939DOE LLNL B62200181.000 AE660/ / Y
1,387 1,387DOE LLNL B62209281.000 AE661/ / Y5,765 5,765DOE Sub LLNL B62158981.000 AE710/ / Y
69,317 69,317DOE LLNL B62239381.000 AE812/ / Y4,398 4,398DOE LLNL B63414081.000 AF008/ / Y
56,966 56,966DOE LLNL B63314481.000 AF053/ / Y95,395 95,395DOE LLNL B63372581.000 AF056/ / Y72,061 72,061DOE LLNL B63162681.000 AF275/ / Y88,526 88,526DOE LLNL B63130681.000 AF318/ / Y54,749 54,749DOE LLNL B62929581.000 AF643/ / Y90,770 90,770DOE LLNL B62687581.000 AF987/ / Y
721,966 721,966Pass-through entity total:
FY19 SEFA Pass-through detailsLawrence Livermore National Lab Page 190

Urbana Chicago SpringfieldTotal for Pass-Through Detail
Pass-Through Entity
CFDA Number / U of I Grant Code / Pass-Through Award Title
ClusterFed Agency Major
Program
LLeidos Biomedical Research Inc1R&DCluster:
NIH / National Cancer InstituteFed Agency:18,440 18,440NIH SUB Leidos 19X07293.000 AF013/ / Y
18,440 18,440Pass-through entity total:
Linde North America Inc/Linde LLC1R&DCluster:
US Department of Energy (DOE)Fed Agency:80,366 80,366DOE Sub Linde DOE FE-003159281.089 AF857/ / Y
80,366 80,366Pass-through entity total:
Los Alamos National Security LLC1R&DCluster:
Los Alamos National LabFed Agency:69,885 69,885DOE LANL 39186181.000 AC086/ / Y
165,634 165,634DOE LANL 42245981.000 AE665/ / Y
235,519 235,519Pass-through entity total:
Louisiana Dept of Wildlife and Fisheries1R&DCluster:
US Department of Defense (DoD)Fed Agency:13,853 13,853DOD Sub LA W&F U513208299.51312.300 AF099/ / Y
13,853 13,853Pass-through entity total:
Loyola University Chicago1R&DCluster:
NIH / National Institute of Diabetes & Digestive & Kidney DiseasesFed Agency:15,837 15,837Loyola University 20839793.847 E1142/ / Y
230,286 230,286Loyola 1U01DK10689893.847 E2166/ / YNIH / National Institutes of HealthFed Agency:
131,423 131,423Loyola Subaward no. LU 20915793.866 E1175/ / Y
377,546 377,546Pass-through entity total:
LSST Data Management Corporation1R&DCluster:
US National Science Foundation (NSF)Fed Agency:4,756,037 4,756,037SBC LSST N51857C47.049 AB622/ / Y
FY19 SEFA Pass-through detailsLSST Data Management Corporation Page 191

Urbana Chicago SpringfieldTotal for Pass-Through Detail
Pass-Through Entity
CFDA Number / U of I Grant Code / Pass-Through Award Title
ClusterFed Agency Major
Program
51,980 51,980SBC LSST NB2522C47.049 AF317/ / Y
4,808,017 4,808,017Pass-through entity total:
LLuna Innovations1R&DCluster:
US Department of Energy (DOE)Fed Agency:38,736 38,736Luna Innovations INC 34790181.049 E0783/ / Y
38,736 38,736Pass-through entity total:
Mainstream Engineering Corporation1R&DCluster:
Office of Naval Research (ONR)Fed Agency:124,825 124,825Navy Sub Mainstream Eng Corp NV006712.000 AF341/ / Y
124,825 124,825Pass-through entity total:
Marine Biological Laboratory1R&DCluster:
NIH / National Institute of Neurological Disorders & StrokeFed Agency:43,307 43,307Marine Bio 53540 R01NS07816593.853 E1074/ / Y
43,307 43,307Pass-through entity total:
Massachusetts Department of Public Health1R&DCluster:
US Department of Justice (DOJ)Fed Agency:13,562 13,562DOJ INTF3030HH4W22916036 YR616.560 AE443/ / Y
13,562 13,562Pass-through entity total:
Massachusetts Institute of Technology1R&DCluster:
Air ForceFed Agency:56,860 56,860AF Sub MIT 700043251812.000 AF352/ / Y
US Department of Energy (DOE)Fed Agency:-59,558 -59,558DOE Sub MIT DE-SC000874381.049 A0041/ / Y24,159 24,159DOE Sub MIT S4688-PO24421081.049 AF217/ / Y65,084 65,084DOE Sub MIT 9756481.049 AF920/ / Y
US National Science Foundation (NSF)Fed Agency:1,163,630 1,163,630SBC MIT 571000396747.041 AC768/ / Y
Other ProgramsCluster:
FY19 SEFA Pass-through detailsMassachusetts Institute of Technology Page 192

Urbana Chicago SpringfieldTotal for Pass-Through Detail
Pass-Through Entity
CFDA Number / U of I Grant Code / Pass-Through Award Title
ClusterFed Agency Major
Program
US Department of Defense (DoD)Fed Agency:7,624 7,624DOD Sub MIT 094387 TTA12.910 AF145/ / N
1,257,799 1,257,799Pass-through entity total:
MMathematica Pollicy Research1R&DCluster:
Social Security AdministrationFed Agency:242,337 242,337Math Policy Res 40112S0305096.007 E3064/ / Y
242,337 242,337Pass-through entity total:
MATSYS IncOther ProgramsCluster:
ArmyFed Agency:8,595 8,595Army Sub MATSYS 092633 TTA12.000 AF486/ / N
8,595 8,595Pass-through entity total:
Mayo Clinic1R&DCluster:
NIH / National Institute of Diabetes & Digestive & Kidney DiseasesFed Agency:14,319 14,319NIH Sub MC UNI-245818/PO #6625711493.847 AF202/ / Y
NIH / National Institute of General Medical SciencesFed Agency:70,142 70,142NIH Sub MC UNI-242999/PO #6610486593.859 AF830/ / Y
NIH / National Institutes of HealthFed Agency:75,514 75,514NIH SUB Mayo 19011893.393 AB942/ / Y-2,886 -2,886NIH SUB MC UNI-20873593.865 AC769/ / Y13,282 13,282NIH SUB MAYO ILL-20873593.865 AE141/ / Y
US Army Medical Research AcquisitionFed Agency:53,496 53,496PO No. 65519592 Sub ILL-206807-0212.420 E1901/ / Y
US National Science Foundation (NSF)Fed Agency:24,410 24,410SBC Mayo UNI-249880/PO#6647493247.070 AF087/ / Y
194,781 53,496 248,277Pass-through entity total:
McGill University1R&DCluster:
Defense Threat Reduction Agency (DTRA)Fed Agency:4,429 4,429DTRA Sub McGill 24743912.351 AF589/ / Y
4,429 4,429Pass-through entity total:
FY19 SEFA Pass-through detailsMcGill University Page 193

Urbana Chicago SpringfieldTotal for Pass-Through Detail
Pass-Through Entity
CFDA Number / U of I Grant Code / Pass-Through Award Title
ClusterFed Agency Major
Program
MMcREL InternationalOther ProgramsCluster:
US Department of EducationFed Agency:24,643 24,643DE Sub McREL 00070296 YR 3 ANTC84.000 AF925/ / N
24,643 24,643Pass-through entity total:
Medical College of Wisconsin1R&DCluster:
NIH / National Institute of Neurological Disorders & StrokeFed Agency:8,261 8,261MCW 5U24NS100648 0293.853 E0989/ / Y
NIH / National Institutes of HealthFed Agency:35,193 35,193Med Coll WS SPO 605276393.393 E0828/ / Y
210,124 210,124NIH SUB WI 08684993.837 AE505/ / Y
210,124 43,454 253,578Pass-through entity total:
Medical Science and Computing LLC1R&DCluster:
NIH / National Institute of Allergy & Infectious DiseasesFed Agency:70,965 70,965NIH Sub MSC CSA-NIAID-UIUC-2018-00193.000 AF235/ / Y
70,965 70,965Pass-through entity total:
Medical University of South Carolina1R&DCluster:
NIH / National Cancer InstituteFed Agency:87,810 87,810Med Univ of SC MUSC16-041-8B80793.393 E1723/ / Y
NIH / National Institutes of HealthFed Agency:22,185 22,185MUSC17-056-8C86893.839 E1032/ / Y
109,995 109,995Pass-through entity total:
Medsocket1R&DCluster:
NIH / National Library of MedicineFed Agency:46,525 46,525Medsocket 0418/SNAP R44LM01159093.879 E1241/ / Y
46,525 46,525Pass-through entity total:
FY19 SEFA Pass-through detailsMedsocket Page 194

Urbana Chicago SpringfieldTotal for Pass-Through Detail
Pass-Through Entity
CFDA Number / U of I Grant Code / Pass-Through Award Title
ClusterFed Agency Major
Program
MMemorial Hermann Health System1R&DCluster:
Administration for Community LivingFed Agency:137,270 137,270MHHS Sub No. 19-183393.433 E1026/ / Y
US Health & Human Services (HHS)Fed Agency:110,236 110,236MHHS Grant 90DP002693.433 E1785/ / Y
247,506 247,506Pass-through entity total:
Michigan State University1R&DCluster:
National Institute of Food and Agriculture/USDAFed Agency:48,770 48,770AG Sub MSU RC106556F10.304 AE918/ / Y
NIH / National Institutes of HealthFed Agency:10,952 10,952MI ST U NIH TTA PO 45923893.113 B8004/ / Y
-473 -473MSU RC105335C93.866 E1781/ / Y11,099 11,099MSU RC104284UI93.866 E2322/ / Y
United States Agency for International Development (AID)Fed Agency:68,336 68,336AID Sub MSU RC102095BHEARD-WACCI98.000 AF864/ / Y
US Department of Energy (DOE)Fed Agency:73,067 73,067DOE Sub MSU RC10750481.049 AF476/ / Y
US Department of Transportation (DOT)Fed Agency:-10,339 -10,339DOT Sub MSU RC103194 UIUC20.701 AA220/ / Y
US National Science Foundation (NSF)Fed Agency:10,245 10,245SBC Michigan State RC106522UI47.074 AE671/ / Y22,003 22,003MI ST U NSF TTA PO 44895747.074 B8018/ / Y4,190 4,190SBC Michigan State RC108528ILL47.075 AF690/ / Y
Other ProgramsCluster:National Institute of Food and Agriculture/USDAFed Agency:
5,215 5,215AG Sub MSU RC108938UI10.303 AF212/ / NUnited States Agency for International Development (AID)Fed Agency:
18,935 18,935AID Sub MSU RC10209598.000 AB311/ / NUS Department of CommerceFed Agency:
19,588 19,588COM Sub MSU RC106491 UIUC11.431 AF676/ / N
270,962 10,626 281,588Pass-through entity total:
FY19 SEFA Pass-through detailsMichigan State University Page 195

Urbana Chicago SpringfieldTotal for Pass-Through Detail
Pass-Through Entity
CFDA Number / U of I Grant Code / Pass-Through Award Title
ClusterFed Agency Major
Program
MMicrobiotix Inc1R&DCluster:
NIH / National Institute on AgingFed Agency:70,887 70,887Microbiotix 5R43AG057312-0293.866 E1169/ / Y
70,887 70,887Pass-through entity total:
Microelectronics Advanced Research Corporation1R&DCluster:
Defense Advanced Research Projects Agency (DARPA)Fed Agency:-265 -265MARCO 2013-MA-238512.000 C4432/ / Y
-265 -265Pass-through entity total:
MicroLink Devices Incorporated1R&DCluster:
US NASAFed Agency:-13,836 -13,836NASA SUB MLD PR0163-143.000 AE334/ / Y
-13,836 -13,836Pass-through entity total:
Middle Tennessee State University1R&DCluster:
US National Science Foundation (NSF)Fed Agency:13,600 13,600SBC Middle TN State C18-1383 TTA47.074 AF615/ / Y
13,600 13,600Pass-through entity total:
Minnesota Department of TransportationHighway Planning and ConstructionCluster:
US Department of Transportation (DOT)Fed Agency:21,146 21,146DOT Sub MNDOT 102917720.205 AF785/ / N
21,146 21,146Pass-through entity total:
Mississippi State University1R&DCluster:
National Institute of Food and Agriculture/USDAFed Agency:27,931 27,931AG Sub MS State 012000.321743.0210.310 AF214/ / Y
US Department of Agriculture (USDA)Fed Agency:54,752 54,752AG Sub MS State 191000.321646.0210.310 AF737/ / Y
82,683 82,683Pass-through entity total:
FY19 SEFA Pass-through detailsMississippi State University Page 196

Urbana Chicago SpringfieldTotal for Pass-Through Detail
Pass-Through Entity
CFDA Number / U of I Grant Code / Pass-Through Award Title
ClusterFed Agency Major
Program
MMissouri University of Science and Technology1R&DCluster:
US Department of Energy (DOE)Fed Agency:20,637 20,637DOE MUST 00042619-0281.087 AA385/ / Y
US Department of Transportation (DOT)Fed Agency:-7,601 -7,601DOT Sub MO 0042134-02-120.701 AB888/ / Y-1,898 -1,898DOT Sub MO 00042134-02-2A-220.701 AE008/ / Y
US NASAFed Agency:94,610 94,610NASA SUB MO 00060442-0143.012 AF919/ / Y
105,748 105,748Pass-through entity total:
Montana State University1R&DCluster:
NIH / National Institutes of HealthFed Agency:2,715 2,715Montana State Univ G172-15-W517393.286 E2471/ / Y
13,088 13,088NIH SUB TTA 08624193.859 AE657/ / YUS National Science Foundation (NSF)Fed Agency:
62 62SBC Montana St G128-14-W459647.074 AA407/ / Y
13,150 2,715 15,865Pass-through entity total:
Morehouse School of Medicine1R&DCluster:
NIH / National Institute on Minority Health & Health DisparitiesFed Agency:168,771 168,771Morehouse UIC-001-Thompson93.307 E0537/ / Y
168,771 168,771Pass-through entity total:
Morgridge Institute for Research Inc1R&DCluster:
NIH / National Institute of Child Health & Human DevelopmentFed Agency:10,683 10,683NIH MIR MIRC00115393.865 AF362/ / Y
10,683 10,683Pass-through entity total:
Museum of Science/Phillip and Patricia Frost Museum of Sci1R&DCluster:
US National Science Foundation (NSF)Fed Agency:157,410 157,410SBC Frost Science 33847.076 AE615/ / Y
157,410 157,410Pass-through entity total:
FY19 SEFA Pass-through detailsMuseum of Science/Phillip and Patricia Frost Museum of Sci Page 197

Urbana Chicago SpringfieldTotal for Pass-Through Detail
Pass-Through Entity
CFDA Number / U of I Grant Code / Pass-Through Award Title
ClusterFed Agency Major
Program
NNano Biotherapeutics Inc.1R&DCluster:
US Health & Human Services (HHS)Fed Agency:204,224 204,224Nano Biotherapeutics 060TRL WA0193.838 E0703/ / Y
204,224 204,224Pass-through entity total:
Nano Terra Inc1R&DCluster:
Air ForceFed Agency:965 965AF Sub Nano Terra 09459312.000 AF079/ / Y
965 965Pass-through entity total:
National 4-H CouncilOther ProgramsCluster:
US Department of Justice (DOJ)Fed Agency:49,959 49,959DOJ Sub 4-H YR8 2017-JU-FX-001616.726 AF924/ / N
49,959 49,959Pass-through entity total:
National Academy of Sciences1R&DCluster:
US Department of Transportation (DOT)Fed Agency:16,620 16,620DOT Sub NAS SAFETY-41 SUB000134720.000 AG992/ / Y
16,620 16,620Pass-through entity total:
National Association of Chronic Disease Directors NACDD1R&DCluster:
Centers for Disease Control and Prevention (CDC)Fed Agency:-1,848 -1,848NACDD 0402018 170-1403-593.424 E1500/ / Y
-1,848 -1,848Pass-through entity total:
National Association of County & City Health Officials1R&DCluster:
HRSA/BHPR/DADPHP (Health Resources and Services)Fed Agency:40,000 40,000NACCHO 2018-03010193.011 E0862/ / Y
Other ProgramsCluster:Health Resources and Services Administration (HRSA)Fed Agency:
41,096 41,096NACCHO contract #2018-08270193.011 E0627/ / N
FY19 SEFA Pass-through detailsNational Association of County & City Health Officials Page 198

Urbana Chicago SpringfieldTotal for Pass-Through Detail
Pass-Through Entity
CFDA Number / U of I Grant Code / Pass-Through Award Title
ClusterFed Agency Major
Program
81,096 81,096Pass-through entity total:
NNational Bureau of Economic Research Inc1R&DCluster:
NIH / National Institute on AgingFed Agency:50,197 50,197NBER 4151B.05.21.UIC93.866 E0642/ / Y
1 1NBER Inc 4151B.04.13.UIC93.866 E0883/ / Y60,444 60,444Nat Bureau Ec Research 33-4151UIC93.866 E2658/ / Y
NIH / National Institutes of HealthFed Agency:57,911 57,911NIH SUB NBER 33-4151-UIUC93.866 AA294/ / Y
1,200 1,200NIH SUB NBER 41600.UIUC93.866 AC352/ / Y
59,111 110,642 169,753Pass-through entity total:
National Childhood Cancer Foundation1R&DCluster:
NIH / National Cancer InstituteFed Agency:16,024 16,024NCCF 98543 1194 02081693.395 E5103/ / Y
16,024 16,024Pass-through entity total:
National Development and Research Institutes Inc1R&DCluster:
US Department of Homeland Security(USDHS)Fed Agency:121,443 121,443DHS Sub Natl Dev Research Inst 658A97.044 AE041/ / Y
121,443 121,443Pass-through entity total:
National Energy Technology Laboratory (NETL)1R&DCluster:
National Energy Technology Laboratory (NETL)Fed Agency:4,585 4,585DOE DE-EE000686481.086 AB722/ / Y
2,859,999 2,859,999DOE DE-FC26-05NT4258881.089 A5507/ / Y53,815 53,815DOE NETL DE-FE003156781.089 AF808/ / Y
283,810 283,810DOE DE-FE003155181.089 AF995/ / Y4,675,976 4,675,976DOE DE-OE000078081.122 AC995/ / Y
7,878,185 7,878,185Pass-through entity total:
FY19 SEFA Pass-through detailsNational Energy Technology Laboratory (NETL) Page 199

Urbana Chicago SpringfieldTotal for Pass-Through Detail
Pass-Through Entity
CFDA Number / U of I Grant Code / Pass-Through Award Title
ClusterFed Agency Major
Program
NNational Fish & Wildlife Foundation1R&DCluster:
US Department of InteriorFed Agency:102 102NFWF 2005.16.05442115.662 E1375/ / Y
19,720 19,720NFWF 5644015.664 E0953/ / Y
19,822 19,822Pass-through entity total:
National Forum to Accelerate Mid-Grades ReformOther ProgramsCluster:
US Department of EducationFed Agency:108,508 108,508DE Sub National Forum 2016-0272184.367 AC899/ / N27,797 27,797Natl Forum U411C130028 DOE84.411 B8649/ / N
136,305 136,305Pass-through entity total:
National Institute for Pharmaceutical Technology & Education1R&DCluster:
Food and Drug Administration (FDA)Fed Agency:5,080 5,080HHS Sub NIPTE-U01-IL-2020-00193.103 AF001/ / Y
10,275 10,275HHS SUB NIPTE-U01-UIL-2018-00193.103 AF791/ / Y
15,355 15,355Pass-through entity total:
National Institute of Aerospace1R&DCluster:
US NASAFed Agency:1,994 1,994NASA NIA 2018 RASC-AL43.000 AF763/ / Y
-1,556 -1,556NASA SUB NIA 201018-UIUC43.008 AE262/ / Y60,306 60,306NASA SUB NIA 201019-UIUC43.008 AF954/ / Y
Other ProgramsCluster:US NASAFed Agency:
7,394 7,394NASA Sub NIA 09582543.000 AG929/ / N
68,138 68,138Pass-through entity total:
National Marrow Donor Program1R&DCluster:
NIH / National Institutes of HealthFed Agency:11,086 11,086National Marrow Donor Program 1005093.839 E4046/ / Y
11,086 11,086Pass-through entity total:
FY19 SEFA Pass-through detailsNational Marrow Donor Program Page 200

Urbana Chicago SpringfieldTotal for Pass-Through Detail
Pass-Through Entity
CFDA Number / U of I Grant Code / Pass-Through Award Title
ClusterFed Agency Major
Program
NNational Mentoring Partnership1R&DCluster:
US Department of Justice (DOJ)Fed Agency:245,512 245,512Contract 2016 MU-MU-K00116.000 E1558/ / Y
245,512 245,512Pass-through entity total:
National Radio Astronomy Observatory (NRAO)1R&DCluster:
US National Science Foundation (NSF)Fed Agency:8,817 8,817SBC NRAO SOSPA6-010 #36336947.049 AF188/ / Y
11,851 11,851SBC NRAO #36269347.049 AF300/ / Y14,855 14,855SBC NRAO SOSPA5-001 35928447.049 AF974/ / Y13,540 13,540SBC NRAO SOSPA5-002 35928547.049 AF976/ / Y
49,063 49,063Pass-through entity total:
National Railroad Passenger Corp (AMTRAK)1R&DCluster:
US Department of Transportation (DOT)Fed Agency:142,773 142,773DOT Sub Amtrak 250011043920.000 AC087/ / Y
142,773 142,773Pass-through entity total:
National Renewable Energy Lab1R&DCluster:
National Renewable Energy LabFed Agency:23,011 23,011DOE NREL KAGX-8-82290-0181.000 AF085/ / Y
7,433 7,433DOE NREL KAGN 4-42504-0381.000 AF957/ / Y98,987 98,987NREL SUB XGJ-7-70311-0181.049 E1085/ / Y
30,444 98,987 129,431Pass-through entity total:
National Rural Electric Coop AssocOther ProgramsCluster:
US Department of Energy (DOE)Fed Agency:112,618 112,618DOE Sub NRECA ITI-Sub 201781.122 AE051/ / N
112,618 112,618Pass-through entity total:
FY19 SEFA Pass-through detailsNational Rural Electric Coop Assoc Page 201

Urbana Chicago SpringfieldTotal for Pass-Through Detail
Pass-Through Entity
CFDA Number / U of I Grant Code / Pass-Through Award Title
ClusterFed Agency Major
Program
NNational Writing Project Corporation1R&DCluster:
US Department of EducationFed Agency:6,030 6,030DE Sub NWP 08-IL07-SEED2017-ILI84.367 AE569/ / Y
4,002 4,002NATIONAL WRITING PRJ84.367 E1420/ / Y
6,030 4,002 10,032Pass-through entity total:
New Age Services CorporationOther ProgramsCluster:
Substance Abuse & Mental Health Services Admin (SAMHSA)Fed Agency:53,639 53,639NASC RFA TI 14 01393.243 E2240/ / N
53,639 53,639Pass-through entity total:
New Growth GroupOther ProgramsCluster:
US Department of Labor (DOL)Fed Agency:17,594 17,594DOL Sub NGG 2016-0090317.000 AC892/ / N12,870 12,870DOL Sub NGG 2015-0027117.282 AB908/ / N
30,464 30,464Pass-through entity total:
New Jersey Medical School1R&DCluster:
NIH / National Institute of Neurological Disorders & StrokeFed Agency:33,056 33,056New Jers Med Sch 2R01NS055159-10A193.853 E0639/ / Y
33,056 33,056Pass-through entity total:
New York Academy of Medicine1R&DCluster:
Agency for Healthcare Research and Quality (AHRQ)Fed Agency:7,091 7,091NYAM NO 03 1 R01HS022670 01A193.226 E2451/ / Y
7,091 7,091Pass-through entity total:
New York Botanical Garden1R&DCluster:
US National Science Foundation (NSF)Fed Agency:6,546 6,546SBC NY Botanical Garden 1802034-0247.074 AF136/ / Y
6,546 6,546Pass-through entity total:
FY19 SEFA Pass-through detailsNew York Botanical Garden Page 202

Urbana Chicago SpringfieldTotal for Pass-Through Detail
Pass-Through Entity
CFDA Number / U of I Grant Code / Pass-Through Award Title
ClusterFed Agency Major
Program
NNew York Univ1R&DCluster:
NIH / National Institute of Mental HealthFed Agency:14,970 14,970NYU F1008-01 PO iB0028014593.242 E0604/ / Y
NIH / National Institutes of HealthFed Agency:19,266 19,266NYU F8635-01 PO iB0015177193.859 E1483/ / Y21,863 21,863NYU S4567-0193.865 E1786/ / Y
US Department of EducationFed Agency:21,436 21,436New York Univ SRL 122184.305 E1010/ / Y
136,517 136,517NYU R305A160176 F-7816-0184.305 E1498/ / YUS Department of Homeland Security(USDHS)Fed Agency:
13 13DHS Sub NYU F7589-0297.044 AC629/ / YUS National Science Foundation (NSF)Fed Agency:
29,863 29,863SBC NYU #F7304-0147.074 AB636/ / Y
29,876 214,052 243,928Pass-through entity total:
Next Frontier LLC1R&DCluster:
Air ForceFed Agency:1,116 1,116AF Sub Next Frontier LLC 0034060812.000 AE226/ / Y
52,560 52,560AF Sub Next Frontier 0041623112.000 AF173/ / Y
53,676 53,676Pass-through entity total:
NextGen Aeronautics Inc1R&DCluster:
Office of Naval Research (ONR)Fed Agency:8,158 8,158UIC/ARAMS PO Contract 14-0712.000 E2349/ / Y
8,158 8,158Pass-through entity total:
Nichols Consulting Engineers1R&DCluster:
US Department of Transportation (DOT)Fed Agency:16,389 16,389DOT Sub NCE 09097620.200 AF246/ / Y
16,389 16,389Pass-through entity total:
FY19 SEFA Pass-through detailsNichols Consulting Engineers Page 203

Urbana Chicago SpringfieldTotal for Pass-Through Detail
Pass-Through Entity
CFDA Number / U of I Grant Code / Pass-Through Award Title
ClusterFed Agency Major
Program
NNorman Public Schools1R&DCluster:
Institute of Museum & Library Services (IMLS)Fed Agency:7,386 7,386IMLS Sub NPS LG-81-16-015145.312 AF245/ / Y
7,386 7,386Pass-through entity total:
North Carolina State University1R&DCluster:
ArmyFed Agency:188,974 188,974ARMY Sub NC State U 2016-1652-0312.431 AC284/ / Y
Defense Advanced Research Projects Agency (DARPA)Fed Agency:447,802 447,802DARPA Sub NC State U 2016-2896-0312.910 AE716/ / Y
Institute of Museum & Library Services (IMLS)Fed Agency:3,983 3,983IMLS Sub NCSU 2018-0151-0245.312 AF930/ / Y
National Institute of Food and Agriculture/USDAFed Agency:12,557 12,557AG sub NCSU 2016-0149-0310.310 AE402/ / Y
US Department of CommerceFed Agency:1,047 1,047COM NOAA Sub NCSU 2014-2918-0411.432 AC666/ / Y
US Department of Energy (DOE)Fed Agency:369,657 369,657DOE Sub NCSU 2014-0501-0281.113 AB839/ / Y
US Department of Homeland Security(USDHS)Fed Agency:112,143 112,143DHS Sub NC State U 2017-0081-0197.044 AE470/ / Y77,081 77,081DHS Sub NCSU 2018-0700-0297.044 AF903/ / Y
US National Science Foundation (NSF)Fed Agency:34,577 34,577SBC NC State Univ #2016-129447.070 AE682/ / Y43,287 43,287SBC NC State Univ 2016-0365-0147.074 AC161/ / Y
1,291,108 1,291,108Pass-through entity total:
Northeastern Univ IL1R&DCluster:
US National Science Foundation (NSF)Fed Agency:22,972 22,972NEIU PO#004774147.000 E1954/ / Y
22,972 22,972Pass-through entity total:
Northeastern Univ MA1R&DCluster:
NIH / National Institute of Child Health & Human DevelopmentFed Agency:24,670 24,670NIH SUB NEU 500628-7850193.865 AF254/ / Y
FY19 SEFA Pass-through detailsNortheastern Univ MA Page 204

Urbana Chicago SpringfieldTotal for Pass-Through Detail
Pass-Through Entity
CFDA Number / U of I Grant Code / Pass-Through Award Title
ClusterFed Agency Major
Program
US National Science Foundation (NSF)Fed Agency:31,485 31,485SBC Northeastern U 091975 TTA47.041 AF649/ / Y
56,155 56,155Pass-through entity total:
NNorthern Arizona University1R&DCluster:
US National Science Foundation (NSF)Fed Agency:92,052 92,052SBC N AZ Univ 163952947.070 AC162/ / Y
92,052 92,052Pass-through entity total:
Northern Ohio Recovery Association IncOther ProgramsCluster:
Substance Abuse & Mental Health Services Admin (SAMHSA)Fed Agency:-2,671 -2,671NORA93.243 E1842/ / N
-2,671 -2,671Pass-through entity total:
Northrop Grumman Corp1R&DCluster:
Air ForceFed Agency:13,852 13,852AF Sub NG 814000089412.000 AE958/ / Y25,415 25,415AF Sub Northrop 299311712.000 AF439/ / Y
39,267 39,267Pass-through entity total:
Northwestern University1R&DCluster:
Agency for Healthcare Research and Quality (AHRQ)Fed Agency:156,701 156,701NW Univ SP0037488-PROJ001021593.226 E1397/ / Y
Army Research Office (ARO)Fed Agency:538,017 538,017Army Sub NU SP0036191-PROJ000997012.431 AC285/ / Y
Health Resources and Services Administration (HRSA)Fed Agency:99,217 99,217Northwestern Sub 60044781 UIC93.884 E1389/ / Y
NASA Shared Services CenterFed Agency:12,655 12,655NASA Sub NU SP0048051-PROJ001356843.000 AF230/ / Y
NIH / National Cancer InstituteFed Agency:-19,109 -19,109NU 6004170393.310 E1462/ / Y
2,108 2,108NU 60038196 R01CA18688593.395 E2426/ / Y87,899 87,899NU 60039741 UIC93.397 E2040/ / Y
NIH / National Center for Advancing Translational SciencesFed Agency:
FY19 SEFA Pass-through detailsNorthwestern University Page 205

Urbana Chicago SpringfieldTotal for Pass-Through Detail
Pass-Through Entity
CFDA Number / U of I Grant Code / Pass-Through Award Title
ClusterFed Agency Major
Program
135,399 135,399Northwestern 60044737 UICHI93.350 E1395/ / YNIH / National Heart Lung & Blood InstituteFed Agency:
39,385 39,385Northwestern 60045948 UIC93.837 E1149/ / Y-8,410 -8,410NU 60025439UIC CRSDC93.837 E3490/ / Y
NIH / National Inst on Deafness & Other Communication DisordersFed Agency:39,191 39,191NIH SUB NU SP0044830-PROJ001255993.173 AF285/ / Y
NIH / National Institute of Diabetes & Digestive & Kidney DiseasesFed Agency:39,781 39,781Northwestern Univ 60046455 UIC93.361 E1247/ / Y26,600 26,600Northwestern Univ 60046420 UIC93.847 E1019/ / Y
NIH / National Institute of Environmental & Health SciencesFed Agency:263,791 263,791Northwestern Univ 60047725 UIC93.113 E1131/ / Y
NIH / National Institute of Mental HealthFed Agency:87,146 87,146Northwestern Sub 60047343 UIC93.242 E1191/ / Y
NIH / National Institute on Minority Health & Health DisparitiesFed Agency:147,130 147,130Northwestern Univ 60044820 UIC93.307 E1315/ / Y
NIH / National Institutes of HealthFed Agency:9,890 9,890NIH SUB NWU 60038255 UI93.213 AF913/ / Y
4,082,068 4,082,068Northwestern Univ 60050042 UIC93.310 E0884/ / Y39,884 39,884Northwestern Universit 60051122 UIC93.350 E0556/ / Y31,420 31,420Northwestern Subaward 60049430 UIC93.394 E0576/ / Y16,348 16,348Northwestern Univ 60040959 UIC93.397 E0718/ / Y2,679 2,679NW Univ93.837 E0620/ / Y
89,372 89,372Northwestern #60041881 UIC93.846 E1502/ / Y127,843 127,843NIH SUB NW 60043585UIUC93.847 AE909/ / Y
19,959 19,959Northwestern Univ 60047929 UIC93.847 E0966/ / Y2,044 2,044NIH SUB NU 09340193.853 AF295/ / Y
22,465 22,465Northwestern Univ60049062 UIC93.855 E0903/ / Y109,025 109,025NIH SUB NWU 60040600 UOFI93.865 AB243/ / Y118,232 118,232NIH SUB NW 60044865UOFI93.865 AE857/ / Y
21,862 21,862NWU sub 6004782893.865 E0724/ / Y13,493 13,493NWU Sub 6004814393.865 E0954/ / Y13,797 13,797Northwestern Univ 60040977 UIC93.865 E2009/ / Y
134,949 134,949Northwestern Univ 60044416UIC93.866 E1367/ / Y14,702 14,702NW University 60041739 UIC93.866 E1865/ / Y
NIH / Office of the Director of National Institute of HealthFed Agency:18,100 18,100Northwestern Univ93.368 E0348/ / Y
Substance Abuse & Mental Health Services Admin (SAMHSA)Fed Agency:10,773 10,773NU Subaward No. 60044866 UIC93.243 E1404/ / Y
FY19 SEFA Pass-through detailsNorthwestern University Page 206

Urbana Chicago SpringfieldTotal for Pass-Through Detail
Pass-Through Entity
CFDA Number / U of I Grant Code / Pass-Through Award Title
ClusterFed Agency Major
Program
US Department of Energy (DOE)Fed Agency:-255 -255DOE Sub NW SP0004510-PROJ001142381.049 AE939/ / Y
US Health & Human Services (HHS)Fed Agency:106,020 106,020Northwestern Univ 60044819 UIC93.307 E1537/ / Y21,017 21,017NWU 60047912 UIC93.310 E0915/ / Y
-197,332 -197,332NWU 60044175 UIC93.310 E1663/ / Y108,152 108,152NWU SP0037006-PROJ001006193.846 E1464/ / Y
US NASAFed Agency:21,423 21,423NASA SUB NWU SP0042806-PROJ001205543.001 AF928/ / Y
US National Science Foundation (NSF)Fed Agency:-20,371 -20,371SBC Northwestern SP003226647.041 AB135/ / Y44,795 44,795SBC NU SP0050691-PROJ001419247.041 AF222/ / Y
6,108 6,108SBC NU SP0046112-PROJ001293547.041 AF593/ / Y64,327 64,327NWU Sub SP0032327-PROJ000856947.041 E1939/ / Y47,793 47,793NWU SP0029341-PROJ000771847.070 E2217/ / Y
US Nuclear Regulatory CommissionFed Agency:-1,706 -1,706NRC Sub NW SP0029021-PROJ00872377.009 AB388/ / Y
Other ProgramsCluster:Centers for Disease Control and Prevention (CDC)Fed Agency:
6,613 6,613NU 60041787 UIC93.079 E2104/ / NUS Department of CommerceFed Agency:
1,193 1,193Com Sub NWU 08591611.609 AE734/ / NUS Health & Human Services (HHS)Fed Agency:
75,727 75,727Northwestern 60041550 UIC93.638 E1787/ / NUS NASAFed Agency:
15,089 15,089NASA SUB NU SP0036513-PROJ001105643.008 AE867/ / N
1,023,173 5,821,826 6,844,999Pass-through entity total:
NNRG Oncology Foundation Inc.1R&DCluster:
NIH / National Cancer InstituteFed Agency:-3 -3NRG Oncology NRG-GU00693.395 E0669/ / Y88 88NRG Oncology Fdn93.395 E0670/ / Y
2,715 2,715NRG Oncology Foundation Inc.93.395 E2414/ / Y
2,800 2,800Pass-through entity total:
FY19 SEFA Pass-through detailsNRG Oncology Foundation Inc. Page 207

Urbana Chicago SpringfieldTotal for Pass-Through Detail
Pass-Through Entity
CFDA Number / U of I Grant Code / Pass-Through Award Title
ClusterFed Agency Major
Program
NNVIDIA Corporation1R&DCluster:
Defense Advanced Research Projects Agency (DARPA)Fed Agency:124,304 124,304DARPA Sub NVIDIA 09119712.910 AF718/ / Y
124,304 124,304Pass-through entity total:
Oak Ridge National Lab1R&DCluster:
Oak Ridge National LabFed Agency:-1,001 -1,001DOE ORNL 400015267781.000 AE809/ / Y15,860 15,860DOE Battelle 400016255281.000 AF645/ / Y
106,594 106,594ORNL 400016190781.000 E0948/ / Y
14,859 106,594 121,453Pass-through entity total:
Oceanit1R&DCluster:
NavyFed Agency:36,731 36,731Oceanit Labs Inc N6833518C071012.000 E0648/ / Y
36,731 36,731Pass-through entity total:
Ohio Aerospace Institute1R&DCluster:
Air Force Office of Scientific Research (AFOSR)Fed Agency:22,757 22,757AF Sub OAI-C2644-1702812.000 AE501/ / Y
US NASAFed Agency:26,473 26,473NASA SUB OAI OAI-AARCI-1806543.002 AE019/ / Y59,102 59,102NASA Sub OAI OAI-AARCI-1903243.002 AF026/ / Y
108,332 108,332Pass-through entity total:
Ohio State Univ1R&DCluster:
Air ForceFed Agency:102,388 102,388AF Sub OSU 6003823812.800 AA797/ / Y
Army Research Office (ARO)Fed Agency:170,239 170,239Army Sub OSU 6004337512.431 AA252/ / Y
Defense Threat Reduction Agency (DTRA)Fed Agency:60,245 60,245DTRA Sub OSU 6004778312.351 AB438/ / Y
NIH / National Cancer InstituteFed Agency:
FY19 SEFA Pass-through detailsOhio State Univ Page 208

Urbana Chicago SpringfieldTotal for Pass-Through Detail
Pass-Through Entity
CFDA Number / U of I Grant Code / Pass-Through Award Title
ClusterFed Agency Major
Program
81,534 81,534OH State U P01CA125066 6004541793.395 E2671/ / Y303,941 303,941Ohio State U Sub 600451993.395 E2672/ / Y
NIH / National Institute on Minority Health & Health DisparitiesFed Agency:17,984 17,984Ohio State Univ. Sub.6006063693.307 E1124/ / Y
Office of Naval Research (ONR)Fed Agency:28,551 28,551OSU Sub No. 6006195112.300 E1104/ / Y
US Department of Agriculture (USDA)Fed Agency:18,942 18,942AG Sub OSU 60039552 PO RF0135306510.217 AA284/ / Y
US National Science Foundation (NSF)Fed Agency:36,111 36,111SBC Ohio State EFRI-143346747.041 AB780/ / Y
387,925 432,010 819,935Pass-through entity total:
OOklahoma State University1R&DCluster:
Air Force Office of Scientific Research (AFOSR)Fed Agency:80,881 80,881AF Sub OSU 1-560106-UIUC12.000 AE383/ / Y
80,881 80,881Pass-through entity total:
Old Dominion UniversityOther ProgramsCluster:
US NASAFed Agency:5,536 5,536NASA SUB ODURF 088355 FLLW43.000 AE237/ / N5,953 5,953NASA SUB ODURF 088356 FLLW43.000 AE240/ / N
11,489 11,489Pass-through entity total:
Olsson Associates1R&DCluster:
US Department of Transportation (DOT)Fed Agency:7,005 7,005DOT Sub Olsson HR25-50 Sub 000073020.000 AC427/ / Y
7,005 7,005Pass-through entity total:
Optimal Synthesis Inc1R&DCluster:
Missile Defense Agency (MDA)Fed Agency:32,979 32,979MDA Sub OSI UI-OSI-MDASTTR-000112.000 AF726/ / Y
32,979 32,979Pass-through entity total:
FY19 SEFA Pass-through detailsOptimal Synthesis Inc Page 209

Urbana Chicago SpringfieldTotal for Pass-Through Detail
Pass-Through Entity
CFDA Number / U of I Grant Code / Pass-Through Award Title
ClusterFed Agency Major
Program
OOregon Department of Human Services1R&DCluster:
Administration for Children and Families (ACF)Fed Agency:-1 -1OR DHS 14649993.658 B8608/ / Y
-1 -1Pass-through entity total:
Oregon Health Sciences Univ1R&DCluster:
NIH / National Institutes of HealthFed Agency:10,445 10,445OHSU 1005935 EY01947493.867 E1884/ / Y
US National Science Foundation (NSF)Fed Agency:20,546 20,546OHSU 1008921 UIL47.070 E1281/ / Y
30,991 30,991Pass-through entity total:
Oregon State University1R&DCluster:
US National Science Foundation (NSF)Fed Agency:120,290 120,290SBC Oregon State S1809A-A47.074 AC626/ / Y
Other ProgramsCluster:USDA Forest Service (FS)Fed Agency:
10,486 10,486AG SUB Oregon State Univ 09434610.000 AF143/ / N
130,776 130,776Pass-through entity total:
Pacific Northwest National Lab1R&DCluster:
Pacific Northwest National LabFed Agency:12,539 12,539DOE PNNL 29834781.000 AC542/ / Y
130,555 130,555DOE PNNL 38403781.000 AE014/ / Y55,718 55,718DOE PNNL 43411981.000 AF292/ / Y37,410 37,410DOE PNNL 41543181.000 AF496/ / Y10,386 10,386DOE PNNL 40898881.000 AF677/ / Y24,186 24,186DOE PNNL 40225081.000 AF809/ / Y54,430 54,430DOE PNNL 39715381.000 AF867/ / Y
Other ProgramsCluster:Pacific Northwest National LabFed Agency:
82,223 82,223DOE PNNL 39030481.000 AF883/ / N
407,447 407,447Pass-through entity total:
FY19 SEFA Pass-through detailsPacific Northwest National Lab Page 210

Urbana Chicago SpringfieldTotal for Pass-Through Detail
Pass-Through Entity
CFDA Number / U of I Grant Code / Pass-Through Award Title
ClusterFed Agency Major
Program
PPAI Life Sciences Inc1R&DCluster:
NIH / National Institute of Allergy & Infectious DiseasesFed Agency:32 32PAI Life Sciences Inc93.855 E0463/ / Y
32 32Pass-through entity total:
Palladium International LLCOther ProgramsCluster:
United States Agency for International Development (AID)Fed Agency:98,658 98,658AID Sub Palladium 217707-IL-02 TO#498.000 AF137/ / N
3,413 3,413AID Sub Palladium TO#398.000 AF686/ / N22,832 22,832AID Sub Palladium 217707-IL-02-0298.000 AF762/ / N38,663 38,663AID Sub Palladium T00198.000 AF943/ / N
163,566 163,566Pass-through entity total:
Palo Alto Medical Foundation1R&DCluster:
NIH / National Institutes of HealthFed Agency:-5,304 -5,304Palo Fdn Rsrch 388220755 0319D93.310 E2035/ / Y
-5,304 -5,304Pass-through entity total:
Palo Alto Veterans Institute for Research (PAVIR)Other ProgramsCluster:
NIH / National Institutes of HealthFed Agency:24,086 24,086NIH SUB TTA P 2015-0232593.310 AB642/ / N
24,086 24,086Pass-through entity total:
Pax Neuroscience Inc1R&DCluster:
NIH / National Institute of Mental HealthFed Agency:105,807 105,807Pax Neuroscience93.242 E1120/ / Y
105,807 105,807Pass-through entity total:
Pegasus Technical ServicesOther ProgramsCluster:
US Environmental Protection Agency (EPA)Fed Agency:28,215 28,215EPA Sub Pegasus PO UIUC-18-00166.000 AE065/ / N
6,016 6,016EPA Sub Pegasus PO UIUC-19-001R66.000 AF066/ / N
FY19 SEFA Pass-through detailsPegasus Technical Services Page 211

Urbana Chicago SpringfieldTotal for Pass-Through Detail
Pass-Through Entity
CFDA Number / U of I Grant Code / Pass-Through Award Title
ClusterFed Agency Major
Program
34,231 34,231Pass-through entity total:
PPennsylvania State Univ1R&DCluster:
NIH / National Institutes of HealthFed Agency:8 8PA State Univ UILCA17216993.393 E1727/ / Y
US Department of Energy (DOE)Fed Agency:22,285 22,285DOE Sub PSU5606-UIUC-LSJU-421581.049 AE565/ / Y
22,285 8 22,293Pass-through entity total:
Pennsylvania State University1R&DCluster:
NIH / National Eye InstituteFed Agency:1,077 1,077Penn State Univ. UILEY02353393.867 E2644/ / Y
NIH / National Institute on Drug AbuseFed Agency:2,618 2,618Pennsylvania State University93.279 E0387/ / Y
US Department of Transportation (DOT)Fed Agency:16,998 16,998DOT Sub Penn State 5920UIUCNASTY3020.313 AF181/ / Y
16,998 3,695 20,693Pass-through entity total:
Peoria Park DistrictOther ProgramsCluster:
Institute of Museum & Library Services (IMLS)Fed Agency:10,089 10,089IMLS Sub Peoria 07559782345.301 AF832/ / N
10,089 10,089Pass-through entity total:
Pharmaseq Incorporated1R&DCluster:
NIH / National Institutes of HealthFed Agency:6,374 6,374PharmaSeq Inc93.103 E0370/ / Y
6,374 6,374Pass-through entity total:
PHD Biosciences1R&DCluster:
NIH / National Heart Lung & Blood InstituteFed Agency:27,042 27,042PHD Biosciences 1R43HL14240293.839 E0838/ / Y
27,042 27,042Pass-through entity total:
FY19 SEFA Pass-through detailsPHD Biosciences Page 212

Urbana Chicago SpringfieldTotal for Pass-Through Detail
Pass-Through Entity
CFDA Number / U of I Grant Code / Pass-Through Award Title
ClusterFed Agency Major
Program
PPhi Optics Inc1R&DCluster:
NIH / National Institute of General Medical SciencesFed Agency:14,291 14,291NIH Sub PhiO 09535393.859 AG998/ / Y
14,291 14,291Pass-through entity total:
Planetary Science Institute1R&DCluster:
US NASAFed Agency:18,609 18,609NASA SUB PSI 1523-UNIV ILL-URBANA43.001 AE061/ / Y
54,904 54,904Planetary Science Inst 145943.001 E1685/ / Y
18,609 54,904 73,513Pass-through entity total:
posed2 Inc1R&DCluster:
US National Science Foundation (NSF)Fed Agency:6,688 6,688SBC Posed2 09060547.000 AF912/ / Y
6,688 6,688Pass-through entity total:
Potluck LLC1R&DCluster:
NIH / National Institute on AgingFed Agency:46,018 46,018NIH SUB 09132893.866 AF647/ / Y
46,018 46,018Pass-through entity total:
Power Integration Laboratory LLC1R&DCluster:
US Department of Energy (DOE)Fed Agency:40,268 40,268DOE Sub PIL DE-EE000813881.087 AF381/ / Y
40,268 40,268Pass-through entity total:
PPG Industries IncOther ProgramsCluster:
US Department of Defense (DoD)Fed Agency:56,031 56,031DOD Sub PPG 092134 TTA12.225 AF452/ / N
56,031 56,031Pass-through entity total:
FY19 SEFA Pass-through detailsPPG Industries Inc Page 213

Urbana Chicago SpringfieldTotal for Pass-Through Detail
Pass-Through Entity
CFDA Number / U of I Grant Code / Pass-Through Award Title
ClusterFed Agency Major
Program
PPrinceton Plasma Physics Laboratory1R&DCluster:
Princeton Plasma Physics LaboratoryFed Agency:135,843 135,843DOE PPPL S015851-H81.000 AF907/ / Y
135,843 135,843Pass-through entity total:
Princeton Univ1R&DCluster:
US NASAFed Agency:185,935 185,935NASA SUB PU SUB000019343.001 AE547/ / Y
US National Science Foundation (NSF)Fed Agency:53,372 53,372Princeton Unv SUB000018447.049 E1407/ / Y
71,369 71,369SBC Princeton SUB000027347.070 AF237/ / Y31,068 31,068Princeton Univ Sub 000025947.070 E0754/ / Y
257,304 84,440 341,744Pass-through entity total:
Public Health Institute of Metropolitan ChicagoOther ProgramsCluster:
HRSA/BHPR/DADPHP (Health Resources and Services)Fed Agency:122,081 122,081PHIMC 092699 AS93.914 E0912/ / N
122,081 122,081Pass-through entity total:
Purdue University1R&DCluster:
NIH / National Institute of General Medical SciencesFed Agency:1,185 1,185NIH Sub PU 11000451-03493.859 AF111/ / Y
NIH / National Institutes of HealthFed Agency:54,795 54,795Purdue University Sub 11000806-00293.747 E0519/ / Y
104,248 104,248Purdue Univ 4102-5142093.859 E3224/ / YUnited States Agency for International Development (AID)Fed Agency:
18,669 18,669AID Sub Purdue F900122870211198.000 AE675/ / YUS Department of Agriculture (USDA)Fed Agency:
405 405AG Sub Purdue 8000073490-AG10.200 AC664/ / YUS Department of Agriculture/Ag Research Service (ARS)Fed Agency:
91,195 91,195AG Sub Purdue F900199450200710.001 AC070/ / Y103,386 103,386AG Sub Purdue F900199450200910.001 AE086/ / Y
US Department of CommerceFed Agency:9,982 9,982COM Sub Purdue F000830970202511.417 AF179/ / Y
FY19 SEFA Pass-through detailsPurdue University Page 214

Urbana Chicago SpringfieldTotal for Pass-Through Detail
Pass-Through Entity
CFDA Number / U of I Grant Code / Pass-Through Award Title
ClusterFed Agency Major
Program
11,308 11,308COM Sub Purdue F00830970202611.417 AF265/ / Y32,582 32,582COM Sub Purdue F000830970201211.417 AF761/ / Y
102,062 102,062COM Sub Purdue F000830970201011.417 AF776/ / YUS Dept of Commerce NOAAFed Agency:
87,902 87,902COM Sub Purdue F00083097021111.417 AF840/ / Y6,809 6,809Purdue Univ F000830970202411.417 E0645/ / Y
US Environmental Protection Agency (EPA)Fed Agency:2,261 2,261EPA Sub Purdue 4109-7879666.436 AE616/ / Y
US National Science Foundation (NSF)Fed Agency:60,092 60,092SBC Purdue 10001433-00347.041 AF215/ / Y
264,062 264,062SBC PURDUE 10000686-02047.070 A2209/ / Y-1 -1SBC Purdue 4101-7876347.076 AF947/ / Y
Other ProgramsCluster:National Institute of Food and Agriculture/USDAFed Agency:
6,178 6,178AG Sub Purdue F900271190201610.217 AF453/ / NUS Department of CommerceFed Agency:
214,162 214,162COM Sub Purdue F000830970200311.417 AF753/ / N
1,005,430 165,852 1,171,282Pass-through entity total:
RRector and Visitors of the University of Virginia1R&DCluster:
Advanced Research Projects Agency - Energy (ARPA-E)Fed Agency:102,733 102,733DOE Sub U VA GG11916-15152081.135 AC728/ / Y
Air ForceFed Agency:31,979 31,979AF Sub U Virginia GI15207-209755112.000 AG983/ / Y
Defense Advanced Research Projects Agency (DARPA)Fed Agency:90,512 90,512DARPA Sub VA GG11856-15004212.000 AC716/ / Y38,942 38,942UVA SRC DARPA GI18518.15878812.000 C1774/ / Y
NIH / National Institutes of HealthFed Agency:53,303 53,303Univ of VA GB10416 15484093.393 E1123/ / Y
264,166 53,303 317,469Pass-through entity total:
Regents of the University of California (San Diego)1R&DCluster:
Air Force Office of Scientific Research (AFOSR)Fed Agency:34,162 34,162AF Sub UCSD 10932076012.300 AF299/ / Y
ArmyFed Agency:417,903 417,903Army Sub UC San Diego 9667876812.000 AE151/ / Y
FY19 SEFA Pass-through detailsRegents of the University of California (San Diego) Page 215

Urbana Chicago SpringfieldTotal for Pass-Through Detail
Pass-Through Entity
CFDA Number / U of I Grant Code / Pass-Through Award Title
ClusterFed Agency Major
Program
NIH / National Institutes of HealthFed Agency:54,168 54,168NIH SUB UCSD 9263382093.394 AE160/ / Y89,918 89,918NIH SUB UCSD 6383277293.847 AB169/ / Y95,523 95,523NIH SUB UCSD 7680283993.859 AC001/ / Y
US Department of Energy (DOE)Fed Agency:239,952 239,952DOE Sub UCSD 76298468 S900146381.135 AC281/ / Y
US Health & Human Services (HHS)Fed Agency:33,819 33,819UC San Diego 10391595493.866 E0890/ / Y
US National Science Foundation (NSF)Fed Agency:281,872 281,872SBC UC San Diego 7940868847.041 AE923/ / Y
1,213,498 33,819 1,247,317Pass-through entity total:
RRegents of the University of California (San Francisco)1R&DCluster:
NIH / National Heart Lung & Blood InstituteFed Agency:188,973 188,973Univ of CA 10455sc93.838 E1007/ / Y
NIH / National Institute of Diabetes & Digestive & Kidney DiseasesFed Agency:17,715 17,715UCSF SubNo 10788sc93.847 E0785/ / Y
NIH / National Institute of Neurological Disorders & StrokeFed Agency:-4,242 -4,242University of Cal Sub 10464sc93.853 E0914/ / Y
NIH / National Institutes of HealthFed Agency:4,601 4,601Regents of Univ of Cal 11275sc93.121 E0433/ / Y
308,611 308,611NIH SUB UCSF 9963SC93.172 AE764/ / YUS Health & Human Services (HHS)Fed Agency:
28,240 28,240Univ of CA San Francisco93.747 E0931/ / Y
308,611 235,287 543,898Pass-through entity total:
Regents of the University of California (Santa Cruz)1R&DCluster:
NIH / National Institute of Allergy & Infectious DiseasesFed Agency:34,296 34,296NIH Sub UCSC 00427039 ANTIC93.855 AF112/ / Y
34,296 34,296Pass-through entity total:
Regents of the University of California Berkeley1R&DCluster:
Defense Advanced Research Projects Agency (DARPA)Fed Agency:91,744 91,744DARPA Sub UC Berkeley 0000997012.910 AF157/ / Y
US Department of Energy (DOE)Fed Agency:
FY19 SEFA Pass-through detailsRegents of the University of California Berkeley Page 216
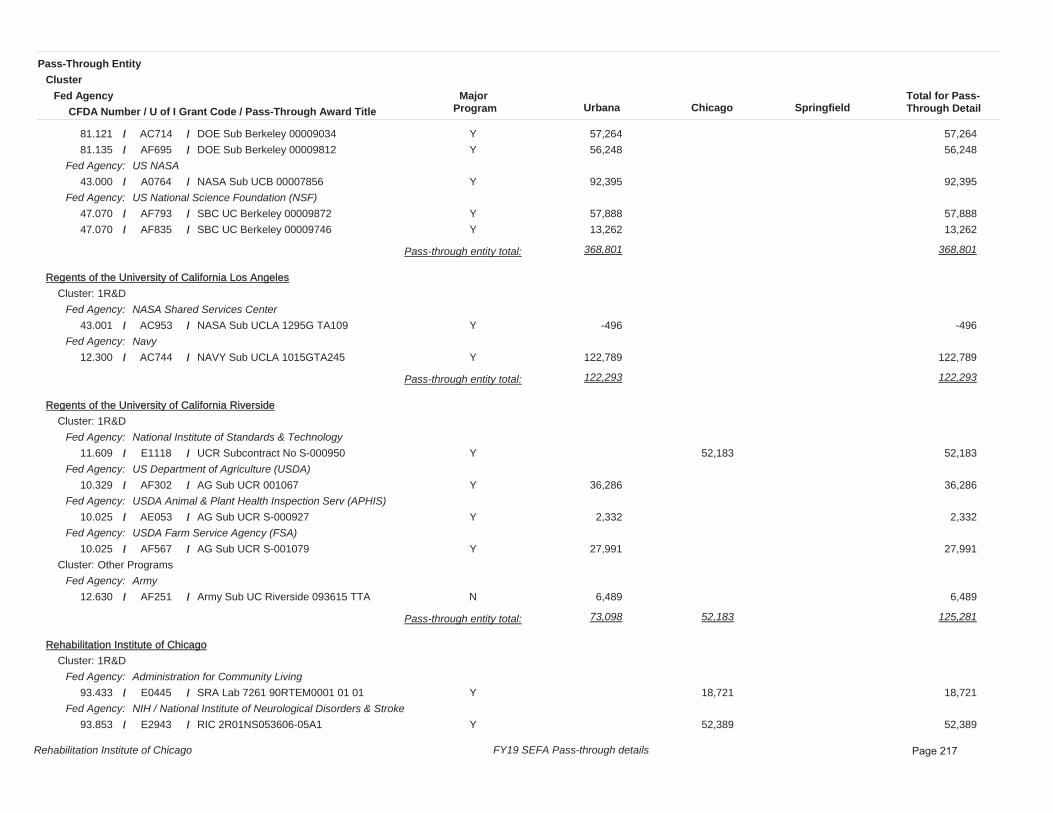
Urbana Chicago SpringfieldTotal for Pass-Through Detail
Pass-Through Entity
CFDA Number / U of I Grant Code / Pass-Through Award Title
ClusterFed Agency Major
Program
57,264 57,264DOE Sub Berkeley 0000903481.121 AC714/ / Y56,248 56,248DOE Sub Berkeley 0000981281.135 AF695/ / Y
US NASAFed Agency:92,395 92,395NASA Sub UCB 0000785643.000 A0764/ / Y
US National Science Foundation (NSF)Fed Agency:57,888 57,888SBC UC Berkeley 0000987247.070 AF793/ / Y13,262 13,262SBC UC Berkeley 0000974647.070 AF835/ / Y
368,801 368,801Pass-through entity total:
RRegents of the University of California Los Angeles1R&DCluster:
NASA Shared Services CenterFed Agency:-496 -496NASA Sub UCLA 1295G TA10943.001 AC953/ / Y
NavyFed Agency:122,789 122,789NAVY Sub UCLA 1015GTA24512.300 AC744/ / Y
122,293 122,293Pass-through entity total:
Regents of the University of California Riverside1R&DCluster:
National Institute of Standards & TechnologyFed Agency:52,183 52,183UCR Subcontract No S-00095011.609 E1118/ / Y
US Department of Agriculture (USDA)Fed Agency:36,286 36,286AG Sub UCR 00106710.329 AF302/ / Y
USDA Animal & Plant Health Inspection Serv (APHIS)Fed Agency:2,332 2,332AG Sub UCR S-00092710.025 AE053/ / Y
USDA Farm Service Agency (FSA)Fed Agency:27,991 27,991AG Sub UCR S-00107910.025 AF567/ / Y
Other ProgramsCluster:ArmyFed Agency:
6,489 6,489Army Sub UC Riverside 093615 TTA12.630 AF251/ / N
73,098 52,183 125,281Pass-through entity total:
Rehabilitation Institute of Chicago1R&DCluster:
Administration for Community LivingFed Agency:18,721 18,721SRA Lab 7261 90RTEM0001 01 0193.433 E0445/ / Y
NIH / National Institute of Neurological Disorders & StrokeFed Agency:52,389 52,389RIC 2R01NS053606-05A193.853 E2943/ / Y
FY19 SEFA Pass-through detailsRehabilitation Institute of Chicago Page 217
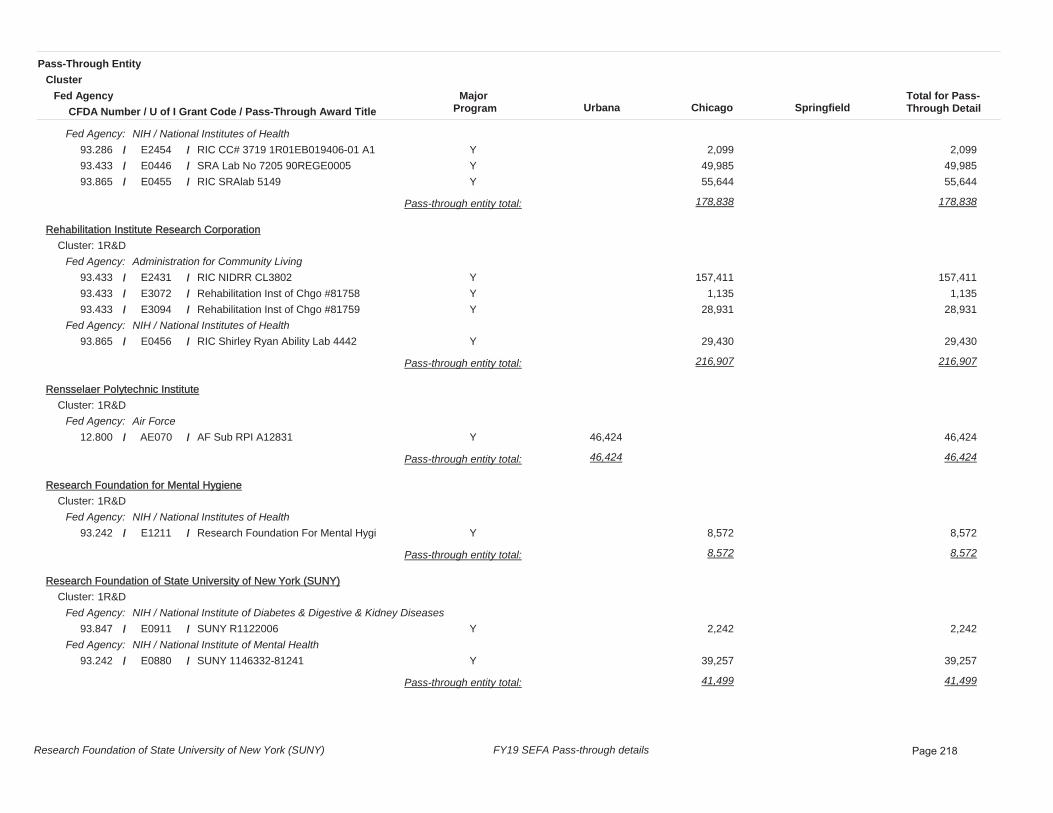
Urbana Chicago SpringfieldTotal for Pass-Through Detail
Pass-Through Entity
CFDA Number / U of I Grant Code / Pass-Through Award Title
ClusterFed Agency Major
Program
NIH / National Institutes of HealthFed Agency:2,099 2,099RIC CC# 3719 1R01EB019406-01 A193.286 E2454/ / Y
49,985 49,985SRA Lab No 7205 90REGE000593.433 E0446/ / Y55,644 55,644RIC SRAlab 514993.865 E0455/ / Y
178,838 178,838Pass-through entity total:
RRehabilitation Institute Research Corporation1R&DCluster:
Administration for Community LivingFed Agency:157,411 157,411RIC NIDRR CL380293.433 E2431/ / Y
1,135 1,135Rehabilitation Inst of Chgo #8175893.433 E3072/ / Y28,931 28,931Rehabilitation Inst of Chgo #8175993.433 E3094/ / Y
NIH / National Institutes of HealthFed Agency:29,430 29,430RIC Shirley Ryan Ability Lab 444293.865 E0456/ / Y
216,907 216,907Pass-through entity total:
Rensselaer Polytechnic Institute1R&DCluster:
Air ForceFed Agency:46,424 46,424AF Sub RPI A1283112.800 AE070/ / Y
46,424 46,424Pass-through entity total:
Research Foundation for Mental Hygiene1R&DCluster:
NIH / National Institutes of HealthFed Agency:8,572 8,572Research Foundation For Mental Hygi93.242 E1211/ / Y
8,572 8,572Pass-through entity total:
Research Foundation of State University of New York (SUNY)1R&DCluster:
NIH / National Institute of Diabetes & Digestive & Kidney DiseasesFed Agency:2,242 2,242SUNY R112200693.847 E0911/ / Y
NIH / National Institute of Mental HealthFed Agency:39,257 39,257SUNY 1146332-8124193.242 E0880/ / Y
41,499 41,499Pass-through entity total:
FY19 SEFA Pass-through detailsResearch Foundation of State University of New York (SUNY) Page 218

Urbana Chicago SpringfieldTotal for Pass-Through Detail
Pass-Through Entity
CFDA Number / U of I Grant Code / Pass-Through Award Title
ClusterFed Agency Major
Program
RRevivo Therapeutics1R&DCluster:
NIH / National Institutes of HealthFed Agency:-4,732 -4,732Revivo Therapeutics 2R42AG044093.866 E1562/ / Y
-4,732 -4,732Pass-through entity total:
Rolls-Royce Corporation1R&DCluster:
US NASAFed Agency:128,974 128,974NASA SUB RR 510000288243.000 AE536/ / Y
128,974 128,974Pass-through entity total:
Rosalind Franklin University of Medicine and Science1R&DCluster:
NIH / National Institutes of HealthFed Agency:246 246Rosalind Frank Univ Sub 212800UIC93.846 E2039/ / Y
8,794 8,794RFU Subaward 212078Kim93.865 E0972/ / Y
9,040 9,040Pass-through entity total:
Rural Community Assistance Partnership, IncorporatedOther ProgramsCluster:
US Environmental Protection Agency (EPA)Fed Agency:111,797 111,797EPA Sub RCAP X6-83700001-0166.424 AF945/ / N12,531 12,531EPA Sub RCAP X7-8393850166.436 AF243/ / N85,486 85,486EPA Sub RCAP X6-8393870166.436 AF263/ / N
152,364 152,364EPA Sub RCAP X7-8393880166.436 AF264/ / N238,971 238,971EPA Sub RCAP 83697601-066.436 AF944/ / N40,184 40,184EPA Sub RCAP X7-83740001-166.436 AF946/ / N
641,333 641,333Pass-through entity total:
Rush University Medical Center1R&DCluster:
Agency for Healthcare Research and Quality (AHRQ)Fed Agency:13,184 13,184Rush 15012705-Sub01 Amend0393.226 E1902/ / Y
NIH / National Inst of Arthritis & Musculoskeletal & Skin DiseasesFed Agency:125,066 125,066Rush 15091103-Sub01 1R01AR07018193.846 E1485/ / Y
NIH / National Institute of Diabetes & Digestive & Kidney DiseasesFed Agency:25,253 25,253Rush 15120306 Sub0293.847 E1329/ / Y
FY19 SEFA Pass-through detailsRush University Medical Center Page 219

Urbana Chicago SpringfieldTotal for Pass-Through Detail
Pass-Through Entity
CFDA Number / U of I Grant Code / Pass-Through Award Title
ClusterFed Agency Major
Program
15,708 15,708Rush University 12052906 Sub0193.847 E2432/ / YNIH / National Institute of Neurological Disorders & StrokeFed Agency:
47,451 47,451Rush Sub No. 16031603-Sub0193.853 E1083/ / YNIH / National Institute on AgingFed Agency:
102,775 102,775Rush L91020181 5P30AG0161-2593.866 E1567/ / YNIH / National Institute on Alcohol Abuse & AlcoholismFed Agency:
46,302 46,302Rush 16072704 Sub0193.273 E0512/ / YNIH / National Institutes of HealthFed Agency:
40,857 40,857Rush Medical Center 17053108 Sub0193.361 E0721/ / Y63,572 63,572NIH SUB RUSH 1512100693.394 AE883/ / Y
82,658 82,658Rush Univ 16020501-Sub0793.855 E0591/ / Y63,435 63,435Rush Univ 1R01AI114688-01A193.855 E2012/ / Y17,145 17,145Rush Sub. No. 15020202-Sub0193.865 E1601/ / Y14,977 14,977Rush Univ Med Ce 5P30AG010161 2893.866 E0684/ / Y20,535 20,535Rush Subaward 15012901-Sub0793.969 E0573/ / Y
US Department of EducationFed Agency:20,883 20,883RU R305AI50189 14072907-UIC84.305 E1838/ / Y
63,572 636,229 699,801Pass-through entity total:
RRutgers The State University of New Jersey1R&DCluster:
ArmyFed Agency:53,678 53,678ARMY Sub Rutgers 027912.000 AE274/ / Y
NIH / National Institutes of HealthFed Agency:281,102 281,102Rutgers Subaward PO48666993.855 E1671/ / Y
US Department of EducationFed Agency:16,472 16,472Rutgers 5668 PO 88705484.305 E2042/ / Y
US Department of Transportation (DOT)Fed Agency:76,872 76,872Rutgers University 102408920.000 E0686/ / Y
US National Science Foundation (NSF)Fed Agency:16,109 16,109SBC Rutgers #008347.049 AE626/ / Y
69,787 374,446 444,233Pass-through entity total:
Rutgers Univ1R&DCluster:
Air Force Office of Scientific Research (AFOSR)Fed Agency:40,551 40,551Rutgers University 89436312.431 E0740/ / Y
FY19 SEFA Pass-through detailsRutgers Univ Page 220

Urbana Chicago SpringfieldTotal for Pass-Through Detail
Pass-Through Entity
CFDA Number / U of I Grant Code / Pass-Through Award Title
ClusterFed Agency Major
Program
40,551 40,551Pass-through entity total:
SSan Diego State University Foundation1R&DCluster:
US National Science Foundation (NSF)Fed Agency:4,857 4,857SBC San Diego State SA000053847.075 AE627/ / Y
4,857 4,857Pass-through entity total:
Sandia National Lab1R&DCluster:
Sandia National LabFed Agency:-13,000 -13,000DOE SNL 120585281.000 A0636/ / Y14,527 14,527DOE SNL 166731481.000 AC611/ / Y
3,726 3,726DOE SNL 165055281.000 AC668/ / Y53,880 53,880DOE SNL 185804881.000 AE026/ / Y48,278 48,278DOE SNL 185331981.000 AE031/ / Y92,159 92,159DOE SNL 185692981.000 AE056/ / Y24,544 24,544DOE Sub SNL 185153281.000 AE076/ / Y
110,205 110,205DOE Sub SNL 185009981.000 AE077/ / Y134,444 134,444DOE Sub SNL 185009681.000 AE078/ / Y86,506 86,506DOE Sub SNL 115021 PO 184060981.000 AE139/ / Y
565 565DOE SNL 175455681.000 AE777/ / Y21,605 21,605DOE SNL 176098681.000 AE779/ / Y15,204 15,204DOE SNL 173637581.000 AE975/ / Y57,026 57,026DOE SNL 173749081.000 AE982/ / Y15,733 15,733DOE SNL 203000281.000 AF016/ / Y28,891 28,891DOE SNL 199038681.000 AF164/ / Y19,330 19,330DOE SNL 199709981.000 AF167/ / Y34,186 34,186DOE SNL 199085381.000 AF178/ / Y77,825 77,825DOE SNL 198794281.000 AF225/ / Y60,050 60,050DOE SNL 197307581.000 AF249/ / Y44,172 44,172DOE SNL 197776481.000 AF250/ / Y41,072 41,072DOE SNL 197961181.000 AF256/ / Y29,131 29,131DOE SNL 196671681.000 AF257/ / Y13,690 13,690DOE SNL 197929581.000 AF267/ / Y95,452 95,452DOE SNL 197442781.000 AF277/ / Y43,454 43,454DOE SNL 196159481.000 AF287/ / Y26,618 26,618DOE SNL 195613181.000 AF296/ / Y
FY19 SEFA Pass-through detailsSandia National Lab Page 221

Urbana Chicago SpringfieldTotal for Pass-Through Detail
Pass-Through Entity
CFDA Number / U of I Grant Code / Pass-Through Award Title
ClusterFed Agency Major
Program
35,130 35,130DOE SNL 196628181.000 AF349/ / Y20,630 20,630DOE SNL 197529081.000 AF353/ / Y42,428 42,428DOE SNL 195138181.000 AF493/ / Y34,993 34,993DOE SNL 194553181.000 AF588/ / Y59,443 59,443DOE SNL 193241281.000 AF693/ / Y
108,929 108,929DOE SNL 192787681.000 AF722/ / Y24,692 24,692DOE SNL 188906281.000 AF732/ / Y96,815 96,815DOE SNL 188732781.000 AF911/ / Y64,442 64,442DOE SNL 187614781.000 AF940/ / Y96,122 96,122DOE SNL 186115381.000 AF951/ / Y99,120 99,120DOE SNL 187448681.000 AF968/ / Y
1,862,017 1,862,017Pass-through entity total:
SScripps Research Institute1R&DCluster:
NIH / National Cancer InstituteFed Agency:58,221 58,221NIH Sub SRI 5-2719193.395 AF563/ / Y
58,221 58,221Pass-through entity total:
Seattle Children’s Research Institute1R&DCluster:
NIH / National Institute of Dental & Craniofacial ResearchFed Agency:3,335 3,335Seattle Childrens 11526SUB93.121 E1206/ / Y
NIH / National Institutes of HealthFed Agency:932 932Seattle Children 11962SUB93.121 E0396/ / Y
4,267 4,267Pass-through entity total:
Seattle Instit for Biomedical & Clinical Resrch (SIBCR)1R&DCluster:
NIH / National Institutes of HealthFed Agency:76,669 76,669SIBCR AD222- UI -493.838 E2048/ / Y
76,669 76,669Pass-through entity total:
Seattles Childrens Hospital1R&DCluster:
NIH / National Institute of Dental & Craniofacial ResearchFed Agency:929 929SCH 11299SUB RDE022438-0493.121 E1882/ / Y
NIH / National Institutes of HealthFed Agency:
FY19 SEFA Pass-through detailsSeattles Childrens Hospital Page 222

Urbana Chicago SpringfieldTotal for Pass-Through Detail
Pass-Through Entity
CFDA Number / U of I Grant Code / Pass-Through Award Title
ClusterFed Agency Major
Program
-3,571 -3,571Seattle Children's 11525SUB93.121 E1480/ / Y
-2,642 -2,642Pass-through entity total:
SSerionix Inc.1R&DCluster:
US National Science Foundation (NSF)Fed Agency:212 212SBC Serionix 084103 FUA47.041 AC003/ / Y
212 212Pass-through entity total:
Simon Wiesenthal Center IncOther ProgramsCluster:
US Department of Justice (DOJ)Fed Agency:207,107 207,107Simon Wiesenthal Center Inc E093816.710 E0938/ / N
207,107 207,107Pass-through entity total:
Sivanathan Laboratories1R&DCluster:
Air Force Office of Scientific Research (AFOSR)Fed Agency:34,258 34,258Sivananthan Labs 022318SUIC000112.800 E0608/ / Y
34,258 34,258Pass-through entity total:
Skidmore College1R&DCluster:
US Department of Homeland Security(USDHS)Fed Agency:31,113 31,113DHS Sub Skidmore 32170-497.044 AE097/ / Y
31,113 31,113Pass-through entity total:
Smithsonian Astrophysical Observatory1R&DCluster:
US NASAFed Agency:1,613 1,613NASA Sub SAO G03-14103A43.001 AC653/ / Y
1,613 1,613Pass-through entity total:
Smithsonian Institution1R&DCluster:
US National Science Foundation (NSF)Fed Agency:46,012 46,012SBC SI 092147 TTA47.074 AF229/ / Y
FY19 SEFA Pass-through detailsSmithsonian Institution Page 223

Urbana Chicago SpringfieldTotal for Pass-Through Detail
Pass-Through Entity
CFDA Number / U of I Grant Code / Pass-Through Award Title
ClusterFed Agency Major
Program
46,012 46,012Pass-through entity total:
SSociety of Teachers of Family Medicine1R&DCluster:
NIH / National Institutes of HealthFed Agency:6,873 6,873Society of Teachers of Family Med93.279 E1445/ / Y
6,873 6,873Pass-through entity total:
South Dakota State University1R&DCluster:
National Institute of Food and Agriculture/USDAFed Agency:58,727 58,727AG Sub SDSU 3TY64010.320 AE746/ / Y54,188 54,188AG Sub SDSU 3TV64010.320 AE913/ / Y
Other ProgramsCluster:US Department of Agriculture/Ag Research Service (ARS)Fed Agency:
2,124 2,124AG Sub SDSU 089019 TTA10.001 AE087/ / N
115,039 115,039Pass-through entity total:
Southern Illinois University Edwardsville1R&DCluster:
US National Science Foundation (NSF)Fed Agency:11,153 11,153SBC SIUE 7761795-00147.075 AE511/ / Y
Other ProgramsCluster:National Institute of Food and Agriculture/USDAFed Agency:
13,525 13,525AG Sub SIUE 761622-002 PO# 13457410.326 AF064/ / NUS Department of Agriculture (USDA)Fed Agency:
423 423AG Sub SIUE 761622-003 PO 13523610.326 AG925/ / N
25,101 25,101Pass-through entity total:
Southern University1R&DCluster:
US Department of EducationFed Agency:-698 -698DE Sub SU OSP-02-8300-2015-001884.264 AC148/ / Y
123,396 123,396DE Sub SU OSP-02-8300-2017-001884.264 AE027/ / Y-1,178 -1,178DE sub Southern U OSP0283002016001484.264 AE166/ / Y
233,312 233,312DE Sub SU OSP-02-8300-2018-001784.264 AF297/ / Y
354,832 354,832Pass-through entity total:
FY19 SEFA Pass-through detailsSouthern University Page 224

Urbana Chicago SpringfieldTotal for Pass-Through Detail
Pass-Through Entity
CFDA Number / U of I Grant Code / Pass-Through Award Title
ClusterFed Agency Major
Program
SSouthwest Oncology Group1R&DCluster:
NIH / National Cancer InstituteFed Agency:51 51SWOG Protocol S160293.395 E0517/ / Y75 75SWOG S150193.395 E0878/ / Y
NIH / National Institutes of HealthFed Agency:124 124SWOG Southwest Oncology Group93.395 E1177/ / Y
250 250Pass-through entity total:
Space Telescope Science Institute1R&DCluster:
US NASAFed Agency:4,530 4,530NASA HST-GO-12941 06-A43.000 A0037/ / Y7,216 7,216NASA HST-GO-14740.008-A43.000 AE567/ / Y
30,420 30,420NASA HST-GO-14109.011-A43.000 AE811/ / Y6,513 6,513NASA Sub STScI JWST-ERS-01355.008-A43.000 AF076/ / Y
12,346 12,346739 STScI Eta Carinae's: End Game43.000 J9372/ / Y
48,679 12,346 61,025Pass-through entity total:
Spaulding for Children1R&DCluster:
Administration for Children and Families (ACF)Fed Agency:81,259 81,259Spaulding for Children PROJ12030RS93.652 E1071/ / Y
US Health & Human Services (HHS)Fed Agency:103,799 103,799Spaulding for Children PROJ12030RS93.652 E0554/ / Y
185,058 185,058Pass-through entity total:
Special Olympics InternationalOther ProgramsCluster:
Centers for Disease Control and Prevention (CDC)Fed Agency:8,733 8,733Special Olympics International93.184 E0441/ / N
8,733 8,733Pass-through entity total:
Spectral Sciences Inc1R&DCluster:
Air ForceFed Agency:66,674 66,674AF Sub SSI 3500-001-4712.000 AE830/ / Y
FY19 SEFA Pass-through detailsSpectral Sciences Inc Page 225

Urbana Chicago SpringfieldTotal for Pass-Through Detail
Pass-Through Entity
CFDA Number / U of I Grant Code / Pass-Through Award Title
ClusterFed Agency Major
Program
66,674 66,674Pass-through entity total:
SSpringfield Sangamon County Regional Planning CommissionHighway Planning and ConstructionCluster:
Federal Highway Administration (FHWA)Fed Agency:21,350 21,350SSCRPC FHWA TTA 09498320.205 B7992/ / N
21,350 21,350Pass-through entity total:
St Clair CountyOther ProgramsCluster:
Housing & Urban Development (HUD)Fed Agency:6,062 6,062HUD Sub East St. Louis 09454114.000 AG928/ / N
6,062 6,062Pass-through entity total:
St Louis University1R&DCluster:
NIH / National Institutes of HealthFed Agency:305,831 305,831Saint Louis Univ ERS#4064393.855 E1386/ / Y
305,831 305,831Pass-through entity total:
Stanford University1R&DCluster:
NIH / National Institutes of HealthFed Agency:16,340 16,340NIH SUB TTA SU 2016-0178993.855 AC971/ / Y
125,317 125,317NIH SUB LS 61313381-11878593.855 AE927/ / Y121,184 121,184NIH SUB LS 61330870-11527793.859 AE866/ / Y
Office of Naval Research (ONR)Fed Agency:152,765 152,765Navy Sub Stanford 60744746-11440712.300 AB787/ / Y
US Department of Defense (DoD)Fed Agency:15,197 15,197Stanford University 6163378712.431 E1239/ / Y
US Department of Energy (DOE)Fed Agency:12,738 12,738DOE SLAC 18939981.000 AF035/ / Y41,532 41,532DOE Sub Stanford 62034963-13544381.048 AF086/ / Y71,520 71,520DOE Sub Stanford 61614273-13011381.049 AE072/ / Y
108,978 108,978DOE Sub Stanford 61961559-13655581.049 AF319/ / YUS National Science Foundation (NSF)Fed Agency:
9,903 9,903SBC Stanford 61942784-13444847.049 AF108/ / Y
FY19 SEFA Pass-through detailsStanford University Page 226

Urbana Chicago SpringfieldTotal for Pass-Through Detail
Pass-Through Entity
CFDA Number / U of I Grant Code / Pass-Through Award Title
ClusterFed Agency Major
Program
660,277 15,197 675,474Pass-through entity total:
SStarfire Industries LLC1R&DCluster:
US Department of Energy (DOE)Fed Agency:115,310 115,310DOE Sub Starfire DE-EE000831981.086 AF138/ / Y
Other ProgramsCluster:US Department of Energy (DOE)Fed Agency:
129,487 129,487DOE Sub Starfire 083698 TTA81.049 AC007/ / N
244,797 244,797Pass-through entity total:
State of Arizona1R&DCluster:
Defense Threat Reduction Agency (DTRA)Fed Agency:79,055 79,055DTRA Sub AZ 38217412.351 AE653/ / Y
79,055 79,055Pass-through entity total:
State of Illinois Emergency Management Agency (IEMA)1R&DCluster:
US Environmental Protection Agency (EPA)Fed Agency:16,926 16,926IEMA 19UIUC RADON66.032 D5654/ / Y
Other ProgramsCluster:Federal Emergency Management Agency (FEMA)Fed Agency:
125,342 125,342IEMA 089774 PDM97.047 D5769/ / NUS Department of Homeland Security(USDHS)Fed Agency:
138,853 138,853IEMA 16IFSI297.067 D5637/ / N282,769 282,769IEMA 18IFSI97.067 D5660/ / N89,357 89,357IEMA 18IFSIUASI97.067 D5662/ / N
1,213 1,213IEMA 15IFSI2 - Vehicles97.067 D5752/ / N1,291,200 1,291,200IEMA 17IFSI ITTF97.067 D5812/ / N
242,722 242,722IEMA 17IFSIUASI97.067 D5813/ / N1,876 1,876IEMA ITTF KC08457897.067 D5981/ / N
US Department of Transportation (DOT)Fed Agency:341,768 341,768IEMA 085279 HMEP 2016-1920.703 D5980/ / N
2,532,026 2,532,026Pass-through entity total:
FY19 SEFA Pass-through detailsState of Illinois Emergency Management Agency (IEMA) Page 227

Urbana Chicago SpringfieldTotal for Pass-Through Detail
Pass-Through Entity
CFDA Number / U of I Grant Code / Pass-Through Award Title
ClusterFed Agency Major
Program
SState of Iowa - Department of Public HealthOther ProgramsCluster:
US Health & Human Services (HHS)Fed Agency:27,799 27,799Iowa Department of Public Health93.000 H7569/ / N
27,799 27,799Pass-through entity total:
State of Michigan1R&DCluster:
US Department of Energy (DOE)Fed Agency:10,129 10,129MICHIGAN MEO-19-00381.041 E0513/ / Y
10,129 10,129Pass-through entity total:
State of Oklahoma/University of Oklahoma1R&DCluster:
NIH / National Institutes of HealthFed Agency:10,700 10,700NIH SUB OK 2015-0393.859 AB850/ / Y
US Department of EducationFed Agency:4,246 4,246Univ of Oklahoma Hlth Sci84.324 E0733/ / Y
US National Science Foundation (NSF)Fed Agency:165,456 165,456SBC Oklahoma 2018-1147.050 AF937/ / Y
176,156 4,246 180,402Pass-through entity total:
State Univ of New York - Buffalo1R&DCluster:
Agency for Healthcare Research and Quality (AHRQ)Fed Agency:20,845 20,845SUNY Subaward No R104512993.226 E1444/ / Y
20,845 20,845Pass-through entity total:
State University of New York(SUNY)1R&DCluster:
NIH / National Institute of Mental HealthFed Agency:20,704 20,704NY State Univ Medical93.942 E0637/ / Y
US Department of Energy (DOE)Fed Agency:29,545 29,545State Univ. of New York 6879981.049 E2533/ / Y
50,249 50,249Pass-through entity total:
FY19 SEFA Pass-through detailsState University of New York(SUNY) Page 228

Urbana Chicago SpringfieldTotal for Pass-Through Detail
Pass-Through Entity
CFDA Number / U of I Grant Code / Pass-Through Award Title
ClusterFed Agency Major
Program
SStephenson County Health DepartmentOther ProgramsCluster:
Health Resources and Services Administration (HRSA)Fed Agency:91,115 91,115Stephenson Co D04RH3164893.912 E0900/ / N
HRSA/BHPR/DADPHP (Health Resources and Services)Fed Agency:3,641 3,641SCHD D04RH2841393.912 F8979/ / N
94,756 94,756Pass-through entity total:
Sustainable Manufacturing Innovation Alliance1R&DCluster:
US Department of Energy (DOE)Fed Agency:342,529 342,529DOE Sub RIT REMADE SA-17-0181.000 AE424/ / Y134,392 134,392DOE RIT REMADE SA-17-1081.000 AE520/ / Y
476,921 476,921Pass-through entity total:
Synclesis Inc1R&DCluster:
Army Research Office (ARO)Fed Agency:21,806 21,806Army Sub Synclesis 08465912.000 AE941/ / Y
21,806 21,806Pass-through entity total:
Syracuse University1R&DCluster:
Air ForceFed Agency:73,665 73,665AF Sub SU 27748-04168-S0112.800 AC350/ / Y
73,665 73,665Pass-through entity total:
Tango Biosciences Inc1R&DCluster:
US Health & Human Services (HHS)Fed Agency:49,590 49,590Tango Biosciences, Inc.93.350 E0849/ / Y
49,590 49,590Pass-through entity total:
Temple University1R&DCluster:
US Department of EducationFed Agency:49,254 33,477 82,731DE Sub TU 300161-UIUC84.305 AB831/ / Y
FY19 SEFA Pass-through detailsTemple University Page 229

Urbana Chicago SpringfieldTotal for Pass-Through Detail
Pass-Through Entity
CFDA Number / U of I Grant Code / Pass-Through Award Title
ClusterFed Agency Major
Program
49,254 33,477 82,731Pass-through entity total:
TTexas A&M Engineering Experiment Station1R&DCluster:
US Department of Energy (DOE)Fed Agency:1,305 1,305DOE TAMU EES M190100181.122 AF105/ / Y
1,305 1,305Pass-through entity total:
Texas A&M University1R&DCluster:
US Fish & WildlifeFed Agency:10,521 10,521INT Sub Texas A&M M180060215.678 AE032/ / Y
US National Science Foundation (NSF)Fed Agency:178,069 178,069SBC Texas A&M M180137747.041 AF893/ / Y
Other ProgramsCluster:NASA HeadquartersFed Agency:
-5,873 -5,873NASA Sub TAMU 02-S15029043.001 AC854/ / N
182,717 182,717Pass-through entity total:
Texas State University1R&DCluster:
US NASAFed Agency:9,167 9,167TSU 17009-82232-10 NNX14AQ30A43.008 E1491/ / Y
9,167 9,167Pass-through entity total:
The Nature Conservancy1R&DCluster:
USDA Natural Resources Conservation Service (NRCS)Fed Agency:34,360 34,360TNC NRCS G17-001-MAC-G10.912 C2604/ / Y
34,360 34,360Pass-through entity total:
Town of NormalOther ProgramsCluster:
Housing & Urban Development (HUD)Fed Agency:37,400 37,400HUD Sub Normal 09338414.000 AF333/ / N
37,400 37,400Pass-through entity total:
FY19 SEFA Pass-through detailsTown of Normal Page 230

Urbana Chicago SpringfieldTotal for Pass-Through Detail
Pass-Through Entity
CFDA Number / U of I Grant Code / Pass-Through Award Title
ClusterFed Agency Major
Program
TTraffic International1R&DCluster:
US State DepartmentFed Agency:53,098 53,098STATE Sub Traffic UNIILLINOIS-01-Y119.000 AF805/ / Y
53,098 53,098Pass-through entity total:
Tufts Medical Center Inc1R&DCluster:
NIH / National Institutes of HealthFed Agency:113,324 113,324Tufts Med Ctr 5016023-SERV93.867 E0601/ / Y
113,324 113,324Pass-through entity total:
Tufts University1R&DCluster:
NIH / National Institutes of HealthFed Agency:-5,896 -5,896Tufts Univ Sub No HH421893.853 E1406/ / Y25,731 25,731Tufts Univ. HH4034 2R01EY02085693.867 E2256/ / Y
19,835 19,835Pass-through entity total:
Tuskegee University1R&DCluster:
National Institute of Food and Agriculture/USDAFed Agency:25,216 25,216AG Sub TU 36 22091 347 7619010.310 AC635/ / Y
US Department of Agriculture (USDA)Fed Agency:14,842 14,842AG Sub TU 36 22091 396 7619010.216 AC435/ / Y
40,058 40,058Pass-through entity total:
U of MS Medical Center1R&DCluster:
NIH / National Institutes of HealthFed Agency:962 962UMMC Subaward 66105170517-UIC93.837 E2324/ / Y
962 962Pass-through entity total:
UES Inc1R&DCluster:
Air ForceFed Agency:-101 -101AF Sub UES S-977-01A-001UIUC12.000 AE771/ / Y
Other ProgramsCluster:
FY19 SEFA Pass-through detailsUES Inc Page 231

Urbana Chicago SpringfieldTotal for Pass-Through Detail
Pass-Through Entity
CFDA Number / U of I Grant Code / Pass-Through Award Title
ClusterFed Agency Major
Program
Air ForceFed Agency:148 148AF Sub UES 089234 119-010-05212.000 AE018/ / N
47 47Pass-through entity total:
UUI Labs1R&DCluster:
US Department of Defense (DoD)Fed Agency:11,297 11,297DOD Sub UILabs DMDII 15-12-0512.000 AE831/ / Y
152,304 152,304DOD Sub UI Labs DMDII 15-07-0612.630 AC264/ / Y303,676 303,676DOD Sub UI Labs DMDII 15-06-0112.630 AE887/ / Y
90,840 90,840DMDII 15-14-03 UI Labs 022016002612.630 E1458/ / Y
467,277 90,840 558,117Pass-through entity total:
Underwriters Laboratories Inc1R&DCluster:
Federal Emergency Management Agency (FEMA)Fed Agency:181,229 181,229DHS FEMA Sub UL 710200057197.044 AE506/ / Y
US Department of Homeland Security(USDHS)Fed Agency:17,422 17,422DHS Sub UL 710200024797.044 AC601/ / Y
1,452 1,452DHS FEMA Sub UL 710200119497.044 AF170/ / Y
200,103 200,103Pass-through entity total:
United States - India Educational Foundation (USIEF)Other ProgramsCluster:
US State DepartmentFed Agency:4,933 4,933STATE Sub USIEF OSI/2015/0319.000 AC727/ / N
4,933 4,933Pass-through entity total:
United States Automotive Materials Partnership1R&DCluster:
US Department of Energy (DOE)Fed Agency:108,747 108,747USAMP DOE 17-2993-AMP81.086 C2232/ / Y
108,747 108,747Pass-through entity total:
United Technologies Corporation (UIS)1R&DCluster:
National Energy Technology Laboratory (NETL)Fed Agency:209,078 209,078DOE Sub UTRC1228251 PO 260506381.122 AE600/ / Y
FY19 SEFA Pass-through detailsUnited Technologies Corporation (UIS) Page 232

Urbana Chicago SpringfieldTotal for Pass-Through Detail
Pass-Through Entity
CFDA Number / U of I Grant Code / Pass-Through Award Title
ClusterFed Agency Major
Program
209,078 209,078Pass-through entity total:
UUniversal Technology Corporation1R&DCluster:
Air ForceFed Agency:34,996 34,996AF Sub U Tech 165852-18F5828-1915C112.000 AF160/ / Y60,111 60,111AF Sub UTC 18-S7700-02-C912.000 AF309/ / Y
95,107 95,107Pass-through entity total:
Universitas IndonesiaOther ProgramsCluster:
United States Agency for International Development (AID)Fed Agency:6,969 6,969AID Sub Univ Indonesia 09083498.000 AF314/ / N
6,969 6,969Pass-through entity total:
Universities Space Research Association (USRA)1R&DCluster:
US NASAFed Agency:-12,200 -12,200NASA USRA SOF04-017743.000 AC583/ / Y
4,074 4,074NASA USRA SOF 04-010743.000 AC585/ / Y2,400 2,400NASA USRA SOFIA 04-017043.000 AC587/ / Y
-3,572 -3,572NASA SUB AB USRA 04555-02843.000 AE098/ / Y34,935 34,935NASA SUB USRA SOF-009743.000 AF887/ / Y
7,000 7,000NASA USRA SOFIA 05-003543.001 AE373/ / Y16,257 16,257NASA USRA SOFIA 05-002943.001 AE664/ / Y
48,894 48,894Pass-through entity total:
University Cape Town Health Sciences Campus1R&DCluster:
NIH / National Institutes of HealthFed Agency:107,585 107,585NIH SUB CF UCT 08978393.172 AF890/ / Y
107,585 107,585Pass-through entity total:
University Corporation for Atmospheric Research1R&DCluster:
US Department of CommerceFed Agency:196,314 196,314COM Sub UCAR SUBAWD00025511.462 AF933/ / Y
US National Science Foundation (NSF)Fed Agency:
FY19 SEFA Pass-through detailsUniversity Corporation for Atmospheric Research Page 233

Urbana Chicago SpringfieldTotal for Pass-Through Detail
Pass-Through Entity
CFDA Number / U of I Grant Code / Pass-Through Award Title
ClusterFed Agency Major
Program
3,805 3,805SBC UCAR SUBAWD00052347.050 AF804/ / YOther ProgramsCluster:
US Department of CommerceFed Agency:65,135 65,135COM Sub UCAR SUBAWD00431 P000479811.462 AF898/ / N
265,254 265,254Pass-through entity total:
UUniversity of Alabama @ Birmingham1R&DCluster:
Centers for Disease Control and Prevention (CDC)Fed Agency:73,276 73,276U Of Alabama 000512145-00293.184 E1660/ / Y
NIH / National Institutes of HealthFed Agency:73,704 73,704Univ of AL Sub #000511651-00193.867 E1441/ / Y
146,980 146,980Pass-through entity total:
University of Alaska - Fairbanks1R&DCluster:
United States Geological SurveyFed Agency:6,392 6,392INT Sub UAF 17-007415.812 AE786/ / Y
6,392 6,392Pass-through entity total:
University of Arizona1R&DCluster:
NIH / National Institutes of HealthFed Agency:76,918 76,918Univ of AZ Subaward no. 33702993.279 E1802/ / Y
368,038 368,038University of AZ 33601293.838 E1697/ / YUS Department of Energy (DOE)Fed Agency:
172,086 172,086DOE Sub Arizona 51415081.135 AF134/ / YUS Department of Homeland Security(USDHS)Fed Agency:
21,308 21,308DHS FEMA Sub AZ 302019097.044 AE596/ / YUS National Science Foundation (NSF)Fed Agency:
-843 -843SBC Univ AZ 18773547.049 AA162/ / Y124,168 124,168SBC Arizona 43672047.079 AF927/ / Y
316,719 444,956 761,675Pass-through entity total:
University of Arkansas1R&DCluster:
NIH / National Institutes of HealthFed Agency:24,935 24,935Univ of Arkansas SA180220693.113 E0886/ / Y
FY19 SEFA Pass-through detailsUniversity of Arkansas Page 234

Urbana Chicago SpringfieldTotal for Pass-Through Detail
Pass-Through Entity
CFDA Number / U of I Grant Code / Pass-Through Award Title
ClusterFed Agency Major
Program
US Department of Energy (DOE)Fed Agency:118,845 118,845DOE Sub AR SA180420981.135 AF807/ / Y
118,845 24,935 143,780Pass-through entity total:
UUniversity of California - Davis1R&DCluster:
NIH / National Cancer InstituteFed Agency:111,116 111,116UC Davis Sub No 201603696-0693.393 E1255/ / Y
NIH / National Institutes of HealthFed Agency:408,785 408,785UC Davis A18-0168-S009 A0293.866 E0927/ / Y
519,901 519,901Pass-through entity total:
University of California - Irvine1R&DCluster:
US National Science Foundation (NSF)Fed Agency:151,162 151,162UC Irvine Subaward 2017-345347.041 E1301/ / Y
151,162 151,162Pass-through entity total:
University of Chicago1R&DCluster:
Centers for Disease Control and Prevention (CDC)Fed Agency:-76,963 -76,963U Of Chicago93.283 E7565/ / Y26,500 26,500University of Chicago93.940 E0520/ / Y
NIH / National Institute of Diabetes & Digestive & Kidney DiseasesFed Agency:31,579 31,579Univ of Chicago FP035726-03 B93.847 E0673/ / Y
NIH / National Institute of Environmental & Health SciencesFed Agency:588,663 588,663Univ of Chicago FP0600090-01-PR93.113 E1228/ / Y
4,976 4,976Univ of Chicago FP048528-02-A93.143 E1309/ / YNIH / National Institute of Mental HealthFed Agency:
38,965 38,965Univ of Chicago FP056858 B93.242 E1934/ / YNIH / National Institute on Drug AbuseFed Agency:
37,903 37,903Univ of Chicago FP058466-04-PR93.279 E0544/ / Y13,550 13,550U of Chicago FP067414-01-PR-CR-0293.279 E0874/ / Y
219,349 219,349Univ of Chgo FP039839-B93.279 E2244/ / YNIH / National Institutes of HealthFed Agency:
-2,215 -2,215Univ of Chgo R01ES02383493.113 E2576/ / Y182,246 182,246Univ of Chicago Sub FP057336 0393.173 E0951/ / Y
114,378 114,378NIH SUB UC FP05584393.286 AA083/ / Y
FY19 SEFA Pass-through detailsUniversity of Chicago Page 235

Urbana Chicago SpringfieldTotal for Pass-Through Detail
Pass-Through Entity
CFDA Number / U of I Grant Code / Pass-Through Award Title
ClusterFed Agency Major
Program
15,930 15,930NIH SUB FP031042-03 A93.396 AA282/ / Y24,510 24,510University of Chicago FP064434-A93.837 E1076/ / Y5,307 5,307University of Chicago93.838 E0434/ / Y
16,560 16,560U of C 5P30DK092949-08 FP047431-093.847 E0678/ / Y91,555 91,555Univ of Chicago FP035726 03 PR93.847 E0683/ / Y
-958 -958UOC SubNo.FP035726-02-L93.847 E1388/ / Y42,683 42,683Univ of Chicago FP063797-293.853 E1410/ / Y
-155,284 -155,284Univ of Chicago FP055818 (A)93.855 E1820/ / Y29,236 29,236NIH SUB UC FP043359-Q93.859 AC552/ / Y
3,542 3,542Univ of Chicago FP056723-C93.989 E1738/ / YUS Department of CommerceFed Agency:
74,898 74,898COM NIST Sub UC FP060337-A11.609 AC741/ / YUS Department of Transportation (DOT)Fed Agency:
33,872 33,872Sub FP062899-D D2015-SRER-00720.514 E1771/ / Y69,852 69,852Univer. of Chicago FP062899-C20.514 E1807/ / Y
US Health & Human Services (HHS)Fed Agency:32,865 32,865Univ of Chicago FP039257-0293.273 E2588/ / Y
US National Science Foundation (NSF)Fed Agency:270,853 270,853SBC U Chicago FP062802-B47.049 AE810/ / Y23,852 23,852SBC U Chicago FP070402-01-PR47.049 AF154/ / Y
103,731 103,731SBC U of Chicago FP061606-A47.070 AC135/ / Y7,498 7,498SBC Univ of Chicago 2015-0614247.076 AC863/ / Y
17,027 17,027SBC U Chicago FP068516-C47.076 AF790/ / YOther ProgramsCluster:
Centers for Disease Control and Prevention (CDC)Fed Agency:174,659 174,659Univ of Chi FP058209-A93.270 E2499/ / N44,248 44,248University of Chicago93.940 E1431/ / N
-215 -215Univ of Chicago FP05743993.940 E1779/ / NUS Department of Justice (DOJ)Fed Agency:
8,132 8,132DOJ Sub Univ of Chicago 094506 TTA16.560 AF144/ / N
665,535 1,447,749 2,113,284Pass-through entity total:
UUniversity of Cincinnati1R&DCluster:
NIH / National Institute of Environmental & Health SciencesFed Agency:61 61Univ of Cincinnati 008647-08793.113 E1095/ / Y
NIH / National Institute of Neurological Disorders & StrokeFed Agency:27 27U of Cincin 010785 135115 ARCADIA93.853 E0860/ / Y
FY19 SEFA Pass-through detailsUniversity of Cincinnati Page 236

Urbana Chicago SpringfieldTotal for Pass-Through Detail
Pass-Through Entity
CFDA Number / U of I Grant Code / Pass-Through Award Title
ClusterFed Agency Major
Program
NIH / National Institutes of HealthFed Agency:133,983 133,983NIH SUB UC 00984493.142 AB155/ / Y
133,983 88 134,071Pass-through entity total:
UUniversity of Colorado1R&DCluster:
Food and Drug Administration (FDA)Fed Agency:175,188 175,188CU FY19491004 AMD7Proj25A721293.103 E2809/ / Y
NIH / National Institutes of HealthFed Agency:103,532 103,532NIH SUB CO 155521593.242 AE597/ / Y
US National Science Foundation (NSF)Fed Agency:4,843 4,843SBC Univ Colorado 155308947.050 AC949/ / Y
12,991 12,991SBC Colorado Boulder 155469547.050 AF734/ / Y12,467 12,467SBC Univ Colorado 155707647.070 AF258/ / Y
133,833 175,188 309,021Pass-through entity total:
University of Colorado - Denver1R&DCluster:
NIH / National Institutes of HealthFed Agency:50,447 50,447NIH SUB UD SC37573-02-0093.242 AE445/ / Y
50,447 50,447Pass-through entity total:
University of Connecticut1R&DCluster:
NIH / National Institutes of HealthFed Agency:45,685 45,685Univ of CT UCHC7-9353061593.853 E1233/ / Y
US Department of EducationFed Agency:76,817 76,817UCONN Subaward No 3370084.305 E3040/ / Y
US National Science Foundation (NSF)Fed Agency:62,586 62,586SBC U Conn 331028 KFS#564863047.000 AF260/ / Y
62,586 122,502 185,088Pass-through entity total:
University of Delaware1R&DCluster:
NIH / National Institute on AgingFed Agency:17,377 17,377NIH Sub UD 5124193.866 AF252/ / Y
NIH / National Institute on Minority Health & Health DisparitiesFed Agency:66,298 66,298Univ of Del. Sub No. 4777293.307 E1063/ / Y
FY19 SEFA Pass-through detailsUniversity of Delaware Page 237

Urbana Chicago SpringfieldTotal for Pass-Through Detail
Pass-Through Entity
CFDA Number / U of I Grant Code / Pass-Through Award Title
ClusterFed Agency Major
Program
NIH / National Library of MedicineFed Agency:129,346 129,346Univ Of Delaware 4883193.879 E1025/ / Y
17,377 195,644 213,021Pass-through entity total:
UUniversity of Florida1R&DCluster:
Army Research Office (ARO)Fed Agency:85,926 85,926Army Sub U of FL UFDSP0001227212.431 AF592/ / Y
National Institute of Food and Agriculture/USDAFed Agency:61,025 61,025AG Sub UFLUFDSP0001181310.310 AE043/ / Y
US Department of Energy (DOE)Fed Agency:22,635 22,635DOE Sub UFL UFDSP0001132681.124 AC160/ / Y
98,403 98,403Univ of Fl P0056459 UFDSP0001199981.135 E1050/ / Y
169,586 98,403 267,989Pass-through entity total:
University of Florida Research Foundation Inc1R&DCluster:
NIH / National Institutes of HealthFed Agency:25,295 25,295NIH SUB FL UFDSP0001168293.865 AE398/ / Y
US Department of Transportation (DOT)Fed Agency:-884 -884DOT FRA Sub FL UFD5P0001163220.000 AE619/ / Y
Other ProgramsCluster:United States Agency for International Development (AID)Fed Agency:
130,990 130,990AID Sub UFL UFDSP0001188098.000 AF973/ / N
155,401 155,401Pass-through entity total:
University of Georgia1R&DCluster:
US National Science Foundation (NSF)Fed Agency:17,966 17,966SBC U of Georgia #RR272-67147.074 AE564/ / Y
17,966 17,966Pass-through entity total:
University of Ghana1R&DCluster:
NIH / National Institutes of HealthFed Agency:20,470 20,470Univ of Ghana U54DK116913-0693.847 E0965/ / Y
20,470 20,470Pass-through entity total:
FY19 SEFA Pass-through detailsUniversity of Ghana Page 238

Urbana Chicago SpringfieldTotal for Pass-Through Detail
Pass-Through Entity
CFDA Number / U of I Grant Code / Pass-Through Award Title
ClusterFed Agency Major
Program
UUniversity of Hawaii1R&DCluster:
US National Science Foundation (NSF)Fed Agency:619,310 619,310UH No MA1335 ACI-144196347.070 E2675/ / Y
619,310 619,310Pass-through entity total:
University of Houston1R&DCluster:
NIH / National Institutes of HealthFed Agency:20,861 20,861Univ. of Houston R-19-003693.279 E0498/ / Y13,119 13,119Univ. of Hou Sub. No. R18004193.279 E0928/ / Y
US Department of Energy (DOE)Fed Agency:204,132 204,132DOE Sub UH R-17-000981.000 AE987/ / Y
204,132 33,980 238,112Pass-through entity total:
University of Idaho1R&DCluster:
US National Science Foundation (NSF)Fed Agency:13,824 13,824Univ ID NSF TTA 2019-38847.074 B8001/ / Y
13,824 13,824Pass-through entity total:
University of Iowa1R&DCluster:
NIH / National Institutes of HealthFed Agency:39,851 39,851NIH SUB IA W00100418393.859 AF977/ / Y
13,082 13,082Univ of Iowa S00368-0193.879 E0521/ / Y14,541 14,541Univ of Iowa 5UG4 LM012346-0393.879 E0807/ / Y
39,851 27,623 67,474Pass-through entity total:
University of Kansas1R&DCluster:
US Department of Energy (DOE)Fed Agency:21,541 21,541DOE Sub KU FY2019-07681.049 AG933/ / Y
21,541 21,541Pass-through entity total:
FY19 SEFA Pass-through detailsUniversity of Kansas Page 239

Urbana Chicago SpringfieldTotal for Pass-Through Detail
Pass-Through Entity
CFDA Number / U of I Grant Code / Pass-Through Award Title
ClusterFed Agency Major
Program
UUniversity of Kentucky1R&DCluster:
NIH / National Institutes of HealthFed Agency:42,072 42,072NIH Sub UK TTA 09533993.351 AF004/ / Y
333,945 333,945NIH SUB UKY 3200000306-16-18093.865 AC546/ / Y17,282 17,282Univ of KY 1R56AG057589-01A193.866 E0398/ / Y
US NASAFed Agency:25,659 25,659NASA SUB KY 3200000407-16-17543.012 AC488/ / Y
Other ProgramsCluster:US Department of Agriculture (USDA)Fed Agency:
24,741 24,741AG Sub UK 3200002185-19-07610.000 AF091/ / N
426,417 17,282 443,699Pass-through entity total:
University of Kentucky Research Foundation1R&DCluster:
NIH / National Institute on AgingFed Agency:4,321 4,321UKY 32000024671925493.866 E0372/ / Y
USDA Economic Research Service (ERS)Fed Agency:28,619 28,619AG Sub UKY 3048110944-15-20110.253 AC888/ / Y
28,619 4,321 32,940Pass-through entity total:
University of Louisville Research Foundation1R&DCluster:
NIH / National Institutes of HealthFed Agency:-41,471 -41,471NIH SUB ULRF OGMB 10062593.393 A1579/ / Y-21,329 -21,329NIH SUB ULRF 10-625-0193.393 AC799/ / Y
-62,800 -62,800Pass-through entity total:
University of Maine1R&DCluster:
US National Science Foundation (NSF)Fed Agency:54,861 54,861SBC Maine UMS-117847.074 AF329/ / Y
Other ProgramsCluster:US Department of EducationFed Agency:
44,488 44,488DE Sub ME UMS-108784.015 AE813/ / N
99,349 99,349Pass-through entity total:
FY19 SEFA Pass-through detailsUniversity of Maine Page 240

Urbana Chicago SpringfieldTotal for Pass-Through Detail
Pass-Through Entity
CFDA Number / U of I Grant Code / Pass-Through Award Title
ClusterFed Agency Major
Program
UUniversity of Maryland1R&DCluster:
Air ForceFed Agency:-1,788 -1,788AF Sub MD 000000531012.630 A3457/ / Y
Air Force Office of Scientific Research (AFOSR)Fed Agency:121,933 121,933AF Sub UMD 56656-Z804420112.800 AF989/ / Y
Centers for Disease Control and Prevention (CDC)Fed Agency:53,096 53,096Univ of MD 190299993.084 E0744/ / Y
NIH / National Institute on Alcohol Abuse & AlcoholismFed Agency:9,132 9,132UMB SR0004696 Sub# 1701543 AA02498093.273 E1334/ / Y
NIH / National Institutes of HealthFed Agency:265,674 265,674Univ Maryland Sub 180236993.855 E1057/ / Y
US Department of Homeland Security(USDHS)Fed Agency:43,721 43,721Univ of MD 37747-Z913910197.005 E1683/ / Y
US Environmental Protection Agency (EPA)Fed Agency:59,451 59,451EPA Sub UMD 40517-Z921910166.509 AE972/ / Y
US National Science Foundation (NSF)Fed Agency:127,769 127,769SBC Maryland 39743-Z476100247.050 AC037/ / Y
307,365 371,623 678,988Pass-through entity total:
University of Massachusetts Amherst1R&DCluster:
National Institute of Food and Agriculture/USDAFed Agency:2,009 2,009AG Sub UMass 17 009835 B 0010.310 AE435/ / Y
NIH / National Institute of General Medical SciencesFed Agency:26,295 26,295U of Mass No. 16-009336 A0293.859 E1664/ / Y
US Environmental Protection Agency (EPA)Fed Agency:8,448 8,448U of MA (Amherst)15-Q08462 H DO66.716 E1263/ / Y
US National Science Foundation (NSF)Fed Agency:90,246 90,246SBC U Mass 18-010023C47.049 AE030/ / Y
92,255 34,743 126,998Pass-through entity total:
University of Massachusetts Boston1R&DCluster:
US Department of EducationFed Agency:24,020 24,020DE Sub UMASS PO B00032600884.324 AB158/ / Y
US National Science Foundation (NSF)Fed Agency:3,439 3,439SBC U Mass 2016-03927 TTA47.074 AC797/ / Y
FY19 SEFA Pass-through detailsUniversity of Massachusetts Boston Page 241

Urbana Chicago SpringfieldTotal for Pass-Through Detail
Pass-Through Entity
CFDA Number / U of I Grant Code / Pass-Through Award Title
ClusterFed Agency Major
Program
27,459 27,459Pass-through entity total:
UUniversity of Miami1R&DCluster:
NIH / National Institutes of HealthFed Agency:-79,118 -79,118NIH SUB MI 660493 SPC00017093.866 AE370/ / Y-17,232 -17,232NIH SUB MI SPC-00053193.866 AE666/ / Y
-96,350 -96,350Pass-through entity total:
University of Michigan1R&DCluster:
Defense Advanced Research Projects Agency (DARPA)Fed Agency:230,080 230,080Univ MI SRC DARPA 300481112212.000 C2003/ / Y
NIH / National Human Genome Research InstituteFed Agency:40,987 40,987NIH Sub UM SUBK0000899693.172 AF203/ / Y
NIH / National Institute of Allergy & Infectious DiseasesFed Agency:58,511 58,511Univ of Michigan #300364264993.855 E2121/ / Y
NIH / National Institute of Mental HealthFed Agency:75,370 75,370Univ of MI 300416751593.242 E1466/ / Y
NIH / National Institutes of HealthFed Agency:21,740 21,740U of Michigan 300401897293.839 E2927/ / Y
US Department of Energy (DOE)Fed Agency:26,908 26,908DOE Sub MI SUBK0000979081.086 AF015/ / Y
101,369 101,369DOE Sub UM 300322239081.113 AB840/ / YUS Department of Transportation (DOT)Fed Agency:
336,534 336,534DOT Sub U of MI 300463136920.000 AE555/ / YUS NASAFed Agency:
21,597 21,597NASA SUB MI 300463157743.001 AE105/ / YUS National Science Foundation (NSF)Fed Agency:
128,898 128,898SBC Univ of MI 300436273747.041 AE551/ / Y23,526 23,526SBC Univ of MI 300529975547.041 AF147/ / Y
US State DepartmentFed Agency:143,668 143,668STATE Sub UM 300369091819.345 AC874/ / Y
Other ProgramsCluster:Health Resources and Services Administration (HRSA)Fed Agency:
23,991 23,991Univ of Michigan SUBK0000884993.516 E0691/ / NUS Department of CommerceFed Agency:
83,454 83,454COM Sub U MI 300465879011.432 AF972/ / N
FY19 SEFA Pass-through detailsUniversity of Michigan Page 242

Urbana Chicago SpringfieldTotal for Pass-Through Detail
Pass-Through Entity
CFDA Number / U of I Grant Code / Pass-Through Award Title
ClusterFed Agency Major
Program
1,137,021 179,612 1,316,633Pass-through entity total:
UUniversity of Minnesota1R&DCluster:
Advanced Research Projects Agency - Energy (ARPA-E)Fed Agency:137,449 137,449DOE ARPA-E Sub UMN A00522330281.135 AC309/ / Y
National Institute of Food and Agriculture/USDAFed Agency:1,055 1,055AG Sub UMN H00440374110.215 AC705/ / Y
11,506 11,506AG Sub UMN H00572294510.215 AE013/ / Y39 39AG Sub UMN H00572292010.215 AE250/ / Y
35,210 35,210AG Sub UMN H00572292110.215 AE696/ / YNatl Center for Chronic Disease Prev & Health PromotionFed Agency:
26,953 26,953Univ of Minnesota N00689450393.135 E0565/ / YNIH / National Institute of Biomedical Imaging & BioengineeringFed Agency:
51,411 51,411NIH SUB UMN N00692570293.286 AF261/ / YNIH / National Institute on Drug AbuseFed Agency:
402 402UMN A007451303 R01DA03790293.279 E0432/ / YNIH / National Institutes of HealthFed Agency:
5,893 5,893UMN N006187430 HL13667993.837 E0423/ / Y11,384 11,384Univ of Minnesota. N00618740893.837 E1061/ / Y28,002 28,002UMN 2R01 NS45873-09 N00588490193.865 E1416/ / Y
US Department of Agriculture (USDA)Fed Agency:-1,103 -1,103AG Sub UMN A00444840110.310 AC795/ / Y
US Department of EducationFed Agency:28,852 28,852Univ of MN A004497003 PF116F14003384.116 E2413/ / Y
US Department of Transportation (DOT)Fed Agency:56,812 56,812DOT Sub UMN H00366240220.701 AB711/ / Y
US NASAFed Agency:13,574 13,574NASA SUB MN H00618380343.001 AE049/ / Y
US National Science Foundation (NSF)Fed Agency:34,287 34,287SBC Minnesota H00660790147.074 AF941/ / Y20,993 20,993SBC Minnesota A00516220247.075 AC528/ / Y20,184 20,184SBC Minnesota H00518410147.075 AC868/ / Y
Other ProgramsCluster:National Institute of Food and Agriculture/USDAFed Agency:
14,372 14,372AG Sub Univ of MN H00440371010.215 AB560/ / N4,581 4,581AG Sub UMN H00717932810.215 AF005/ / N
US Department of Agriculture (USDA)Fed Agency:
FY19 SEFA Pass-through detailsUniversity of Minnesota Page 243

Urbana Chicago SpringfieldTotal for Pass-Through Detail
Pass-Through Entity
CFDA Number / U of I Grant Code / Pass-Through Award Title
ClusterFed Agency Major
Program
4,780 4,780AG Sub UMN H00717934210.215 AF058/ / NUS Environmental Protection Agency (EPA)Fed Agency:
10,639 10,639EPA Sub UMN D00532215566.469 AC146/ / N
415,789 101,486 517,275Pass-through entity total:
UUniversity of Missouri1R&DCluster:
NIH / National Institutes of HealthFed Agency:-2 -2NIH SUB MO C00046785-193.859 AC896/ / Y
US Department of EducationFed Agency:-180 -180Univ MIZZ C00055847-1 PTE DOE84.324 E1052/ / Y
US Department of Transportation (DOT)Fed Agency:-425 -425DOT Sub MO C00056371-120.701 AC051/ / Y
US National Science Foundation (NSF)Fed Agency:18,630 18,630SBC Missouri C00060063-147.074 AF582/ / Y
18,203 -180 18,023Pass-through entity total:
University of Nebraska - Lincoln1R&DCluster:
US Department of Defense (DoD)Fed Agency:97,251 97,251UNL Sub 261125002500512.000 E1041/ / Y
US National Science Foundation (NSF)Fed Agency:31,775 31,775SBC Nebraska-Lincoln 095993 TTA47.074 AG854/ / Y
Other ProgramsCluster:National Institute of Food and Agriculture/USDAFed Agency:
10,238 10,238AG Sub UNL 25-6324-0150-11610.500 AE585/ / Y
42,013 97,251 139,264Pass-through entity total:
University of New Mexico1R&DCluster:
US National Science Foundation (NSF)Fed Agency:22,958 22,958SBC New Mexico 133623-874A47.050 AC871/ / Y
142,446 142,446SBC New Mexico 133660-874A47.050 AE210/ / Y
165,404 165,404Pass-through entity total:
FY19 SEFA Pass-through detailsUniversity of New Mexico Page 244

Urbana Chicago SpringfieldTotal for Pass-Through Detail
Pass-Through Entity
CFDA Number / U of I Grant Code / Pass-Through Award Title
ClusterFed Agency Major
Program
UUniversity of North Carolina1R&DCluster:
Health Resources and Services Administration (HRSA)Fed Agency:245,774 245,774UNC Gillings Schl 2UE7MC26282-0593.110 E1588/ / Y
NIH / National Institutes of HealthFed Agency:3,949 3,949NIH SUB NC 510190493.242 AB085/ / Y
12,632 12,632Univ of Carolina Sub 511145793.838 E0584/ / Y22,465 22,465Univ of NC 1R01AI123010-01A193.855 E1627/ / Y
3,949 280,871 284,820Pass-through entity total:
University of North Carolina at Chapel Hill1R&DCluster:
NIH / National Institutes of HealthFed Agency:43,648 43,648UNC at Chapel Hill 511323093.838 E0458/ / Y
43,648 43,648Pass-through entity total:
University of North Texas1R&DCluster:
US National Science Foundation (NSF)Fed Agency:-5,804 -5,804SBC Univ North Texas GF1648-147.070 AA968/ / Y
-5,804 -5,804Pass-through entity total:
University of Notre Dame1R&DCluster:
NIH / National Institute of Allergy & Infectious DiseasesFed Agency:81,590 81,590UND Subaward No. 202953UIC93.855 E1527/ / Y
NIH / National Institutes of HealthFed Agency:167,646 167,646NIH SUB ND 202359UIUC93.855 AA036/ / Y
US National Science Foundation (NSF)Fed Agency:1,057 1,057U of Notre Dame PHY 121944447.049 E3135/ / Y
Other ProgramsCluster:US National Endowment for the Humanities (NEH)Fed Agency:
10,304 10,304NEH Sub ND 202920UIUC45.169 AE517/ / N
177,950 82,647 260,597Pass-through entity total:
FY19 SEFA Pass-through detailsUniversity of Notre Dame Page 245

Urbana Chicago SpringfieldTotal for Pass-Through Detail
Pass-Through Entity
CFDA Number / U of I Grant Code / Pass-Through Award Title
ClusterFed Agency Major
Program
UUniversity of Oregon1R&DCluster:
Air ForceFed Agency:195,873 195,873AF sub Univ of OR 230730A12.800 AE800/ / Y
195,873 195,873Pass-through entity total:
University of Pennsylvania1R&DCluster:
Army Research Office (ARO)Fed Agency:68,261 68,261Army Sub U Penn 57472312.431 AF425/ / Y
Defense Advanced Research Projects Agency (DARPA)Fed Agency:33,866 33,866DARPA Sub U Penn 57644712.910 AF080/ / Y
NIH / National Human Genome Research InstituteFed Agency:149,007 149,007NIH Sub UPenn 57533093.172 AF221/ / Y
NIH / National Institute of Diabetes & Digestive & Kidney DiseasesFed Agency:4,740 4,740University Of Penn PO387720793.847 E1497/ / Y
NIH / National Institutes of HealthFed Agency:3,838 3,838Univ Of Pennsylvania93.000 E0385/ / Y9,993 9,993Univ of PA PO 3767883 57050193.847 E1435/ / Y2,944 2,944CVNA00056755 132241 193.853 E0415/ / Y
14,512 14,512U of PA Subaward No. 56900193.856 E2965/ / YUS National Science Foundation (NSF)Fed Agency:
76,725 76,725SBC Univ of Pennsylvania 57082447.076 AE735/ / Y
327,859 36,027 363,886Pass-through entity total:
University of Pittsburgh1R&DCluster:
ArmyFed Agency:574,220 574,220ARMY sub UPittsburgh 005641112.431 AE059/ / Y
NavyFed Agency:-14,425 -14,425Navy Sub Pitt 9012518 (411788-1)12.300 AB827/ / Y
NIH / National Heart Lung & Blood InstituteFed Agency:2,144 2,144U of Pittsburgh 9012549 130129 3893.838 E1283/ / Y
NIH / National Institute of Environmental & Health SciencesFed Agency:2,759 2,759University of Pittsburgh93.113 E1887/ / Y
NIH / National Institutes of HealthFed Agency:5,842 5,842Uof Pittsburgh 414364-193.307 E0399/ / Y
127,732 127,732Univ of Pitts 005353 130910 4093.350 E0716/ / Y
FY19 SEFA Pass-through detailsUniversity of Pittsburgh Page 246

Urbana Chicago SpringfieldTotal for Pass-Through Detail
Pass-Through Entity
CFDA Number / U of I Grant Code / Pass-Through Award Title
ClusterFed Agency Major
Program
-8 -8Univ of Pittsburgh9012549 130129 1293.838 E1250/ / Y198,117 198,117Univ of Pit Sub 9012459(130129-40)93.838 E1559/ / Y
-5,771 -5,771Univ of Pitts 0051163 128078-493.853 E1437/ / Y74,950 74,950NIH SUB UP 0052186 128617-293.866 AE908/ / Y
83,379 83,379Univ of Pitts CNVA00050927 128399-193.866 E1419/ / Y
634,745 414,194 1,048,939Pass-through entity total:
UUniversity of Rochester1R&DCluster:
NIH / National Institutes of HealthFed Agency:41,395 41,395NIH SUB UR 417084G/UR FAO GR51064493.858 AE540/ / Y
41,395 41,395Pass-through entity total:
University of South Carolina1R&DCluster:
NIH / National Institutes of HealthFed Agency:27 27U of SC Sub No. 18-341893.393 E2941/ / Y
US Department of Defense (DoD)Fed Agency:87,763 87,763Univ of SC 19-3716 PO#200004201312.420 E0660/ / Y
US Department of Energy (DOE)Fed Agency:154,223 154,223DOE Sub USCar 15540-FD2181.121 AE986/ / Y
US National Science Foundation (NSF)Fed Agency:21,288 21,288SBC South Carolina 15-284747.041 AB508/ / Y
175,511 87,790 263,301Pass-through entity total:
University of South Florida1R&DCluster:
NIH / National Institute on Minority Health & Health DisparitiesFed Agency:48,057 48,057NIH Sub USF 6408-1117-00-A93.307 AF158/ / Y
NIH / National Institutes of HealthFed Agency:63,151 63,151NIH SUB SF 1255-1131-00-A93.242 AE776/ / Y
US Department of Transportation (DOT)Fed Agency:45,235 45,235Univ South Florida 2117-0962-02-C20.701 E2130/ / Y
US Health & Human Services (HHS)Fed Agency:32 32U So FL TrialNet Site 342393.000 E3435/ / Y
US National Science Foundation (NSF)Fed Agency:105,442 105,442Sub No. 2104-1248-00-A NSF 163473847.041 E1831/ / Y
FY19 SEFA Pass-through detailsUniversity of South Florida Page 247

Urbana Chicago SpringfieldTotal for Pass-Through Detail
Pass-Through Entity
CFDA Number / U of I Grant Code / Pass-Through Award Title
ClusterFed Agency Major
Program
111,208 150,709 261,917Pass-through entity total:
UUniversity of Southern California1R&DCluster:
NIH / National Institute on AgingFed Agency:42,654 42,654Univ of Southern CA 9576612793.866 E1048/ / Y
NIH / National Institute on Alcohol Abuse & AlcoholismFed Agency:41,236 41,236USC 105171981 PO 5073204193.273 E0622/ / Y
NIH / National Institutes of HealthFed Agency:9,362 9,362Univ of Southern CA93.113 E0797/ / Y
-70,453 -70,453USC 91303501 REY027315-01A193.867 E1141/ / YUS Department of InteriorFed Agency:
23,000 23,000INT Sub USC 10471390815.000 AF626/ / YUS National Science Foundation (NSF)Fed Agency:
17,022 17,022SBC U of Southern CA 9126899347.050 AE029/ / Y
40,022 22,799 62,821Pass-through entity total:
University of Tennessee1R&DCluster:
US NASAFed Agency:199,642 199,642NASA SUB TN A18-0139-S00443.002 AE333/ / Y
US National Science Foundation (NSF)Fed Agency:59,173 59,173SBC Univ TN A12-0044-S00647.041 AA091/ / Y
258,815 258,815Pass-through entity total:
University of Tennessee Space Institute1R&DCluster:
Air ForceFed Agency:47,152 47,152AF Sub U Tenn A19-0503-S00212.000 AF204/ / Y
47,152 47,152Pass-through entity total:
University of Texas - Austin1R&DCluster:
NavyFed Agency:352,394 352,394NAVY Sub UTA UTA16-00055812.300 AC342/ / Y
NIH / National Institute of General Medical SciencesFed Agency:211,565 211,565NIH Sub UT UTA18-00119793.859 AF382/ / Y
NIH / National Institutes of HealthFed Agency:
FY19 SEFA Pass-through detailsUniversity of Texas - Austin Page 248

Urbana Chicago SpringfieldTotal for Pass-Through Detail
Pass-Through Entity
CFDA Number / U of I Grant Code / Pass-Through Award Title
ClusterFed Agency Major
Program
125,749 125,749NIH SUB UT UTA15-00093893.859 AC864/ / YUS Army Corps of EngineersFed Agency:
24,158 24,158ARMY Sub UTA UTA15-00096212.000 AC840/ / YUS National Science Foundation (NSF)Fed Agency:
11,049 11,049SBC UTA UTA17-00063947.074 AE516/ / Y
724,915 724,915Pass-through entity total:
UUniversity of Texas - Galveston1R&DCluster:
NIH / National Institutes of HealthFed Agency:6,660 6,660Univ of Texas 19-8453893.865 E0552/ / Y
14,619 14,619UTMB 18-015 UOSPC000000156493.865 E0985/ / Y
21,279 21,279Pass-through entity total:
University of Texas Arlington1R&DCluster:
Air Force Office of Scientific Research (AFOSR)Fed Agency:42,471 42,471AF Sub UT 2602014906112.000 AC860/ / Y
US NASAFed Agency:12,612 12,612NASA Sub UT-A 261201326243.001 AA211/ / Y
55,083 55,083Pass-through entity total:
University of Texas Health Science Center at San Antonio1R&DCluster:
NIH / National Institute of Child Health & Human DevelopmentFed Agency:242,061 242,061Univ of Texas 163344-16334393.865 E0698/ / Y23,062 23,062Univ of TX 162390/16238493.865 E0929/ / Y
265,123 265,123Pass-through entity total:
University of Texas MD Anderson Cancer Center1R&DCluster:
NIH / National Institutes of HealthFed Agency:51,229 51,229NIH SUB TX 0000492693.395 AE722/ / Y
51,229 51,229Pass-through entity total:
FY19 SEFA Pass-through detailsUniversity of Texas MD Anderson Cancer Center Page 249

Urbana Chicago SpringfieldTotal for Pass-Through Detail
Pass-Through Entity
CFDA Number / U of I Grant Code / Pass-Through Award Title
ClusterFed Agency Major
Program
UUniversity of Utah1R&DCluster:
NIH / National Heart Lung & Blood InstituteFed Agency:6,917 6,917Utah Sub 100517830193.000 E0451/ / Y
NIH / National Institutes of HealthFed Agency:1,730 1,730Univ of UT 10042502-0493.866 E1170/ / Y
8,647 8,647Pass-through entity total:
University of Washington1R&DCluster:
Administration for Community LivingFed Agency:60,672 60,672U of Wa UWSC9416 BPO 1843993.433 E1494/ / Y72,611 72,611U of WA UWSC9538 BPO1917193.433 E2400/ / Y
-762 -762Univ of Washington93.433 E3621/ / YArmy Research Office (ARO)Fed Agency:
53,371 53,371Army Sub UW UWSC9284-1749312.431 AE938/ / YDefense Advanced Research Projects Agency (DARPA)Fed Agency:
79,133 79,133DARPA Sub U Wash UWSC848212.910 AB021/ / YNIH / National Institute of Dental & Craniofacial ResearchFed Agency:
121,378 121,378Univ of WA BPO539993.121 E2348/ / YNIH / National Institutes of HealthFed Agency:
6,958 6,958Univ of WA Sub No UWSC1004893.242 E1054/ / Y105,760 105,760NIH SUB UW UWSC792893.847 AC895/ / Y
4,284 4,284Univ. of Washington Sub. UWSC776793.853 E2789/ / YOffice of Naval Research (ONR)Fed Agency:
110,838 110,838NAVY Sub U Wash UWSC 90661547712.300 AC624/ / YUS Department of Defense (DoD)Fed Agency:
83,393 83,393UW SC10862 PO3614112.420 E0504/ / Y10,133 10,133DOD Sub U Wash DMDII UWSC960312.630 AE796/ / Y
US Department of Transportation (DOT)Fed Agency:79,406 79,406DOT FAA Sub UW UWSC8427 PO76549620.000 AB454/ / Y
US NASAFed Agency:-823 -823NASA UW 48517143.000 A3766/ / Y
437,818 348,534 786,352Pass-through entity total:
FY19 SEFA Pass-through detailsUniversity of Washington Page 250

Urbana Chicago SpringfieldTotal for Pass-Through Detail
Pass-Through Entity
CFDA Number / U of I Grant Code / Pass-Through Award Title
ClusterFed Agency Major
Program
UUniversity of Waterloo1R&DCluster:
Army Research Office (ARO)Fed Agency:58,596 58,596Army Sub Waterloo 07097112.431 AC322/ / Y
58,596 58,596Pass-through entity total:
University of Wisconsin - Madison1R&DCluster:
NIH / National Cancer InstituteFed Agency:73,584 73,584Subaward No 566K10193.393 E2492/ / Y25,695 25,695Univ of Wisc Sub No 839K77593.396 E0728/ / Y
NIH / National Heart Lung & Blood InstituteFed Agency:101,721 101,721Univ of WI 000000002093.838 E1008/ / Y
NIH / National Institutes of HealthFed Agency:321,081 321,081HHS CDC SUB WI 725K54693.084 AE691/ / Y90,445 90,445NIH SUB WI 749K27693.433 AE194/ / Y
Office of Naval Research (ONR)Fed Agency:85,131 85,131Navy Sub Wisconsin 786K46112.300 AE064/ / Y
Social Security AdministrationFed Agency:65,893 65,893Univ of Wisc 851K39596.007 E0562/ / Y
US Department of EducationFed Agency:-36,345 -36,345DE Sub UW Madison 00351934 ANTC84.000 AE410/ / Y
US National Science Foundation (NSF)Fed Agency:141,907 141,907SBC Wisconsin 630K54547.049 AB050/ / Y
602,219 266,893 869,112Pass-through entity total:
University System of New Hampshire1R&DCluster:
NIH / National Institutes of HealthFed Agency:41,097 41,097Univ.of NH Subaward No. 18-01893.273 E0990/ / Y
41,097 41,097Pass-through entity total:
US Ignite Inc1R&DCluster:
US National Science Foundation (NSF)Fed Agency:14,826 14,826SBC US Ignite 2016-0522147.070 AC377/ / Y16,365 16,365SBC US Ignite 08671347.070 AE116/ / Y
9,997 9,997SBC US Ignite 09399847.070 AF163/ / Y
FY19 SEFA Pass-through detailsUS Ignite Inc Page 251

Urbana Chicago SpringfieldTotal for Pass-Through Detail
Pass-Through Entity
CFDA Number / U of I Grant Code / Pass-Through Award Title
ClusterFed Agency Major
Program
10,000 10,000SBC US Ignite 09229947.070 AF241/ / Y20,017 20,017SBC US Ignite 09083747.070 AG917/ / Y
71,205 71,205Pass-through entity total:
UUT-Battelle LLC1R&DCluster:
US Department of Energy (DOE)Fed Agency:91,337 91,337DOE Sub Battelle 400014251981.000 AC914/ / Y
91,337 91,337Pass-through entity total:
UT-Battelle LLC/Oak Ridge National Laboratory1R&DCluster:
US Department of Energy (DOE)Fed Agency:228,163 228,163DOE Sub Battelle 400014851981.000 AC137/ / Y67,334 67,334DOE Sub UT-Battelle 400014316481.000 AC902/ / Y61,781 61,781DOE ORNL 400016823681.000 AF150/ / Y
4,393 4,393DOE ORNL 400016774581.000 AF166/ / Y89,202 89,202DOE ORNL 400016626681.000 AF291/ / Y
450,873 450,873Pass-through entity total:
Valdosta State UniversityOther ProgramsCluster:
US Department of Agriculture (USDA)Fed Agency:-8,889 -8,889AG Sub VSU 15-ACES-379834-VSU10.200 AE673/ / N
-8,889 -8,889Pass-through entity total:
Vanderbilt University1R&DCluster:
NIH / National Cancer InstituteFed Agency:27,471 27,471VUMC 67578 R01CA225005A93.393 E0535/ / Y
NIH / National Inst on Deafness & Other Communication DisordersFed Agency:86,296 86,296NIH SUB VU UNIV6040493.173 AF283/ / Y
NIH / National Institute of Mental HealthFed Agency:39,202 39,202Vanderbilt Univ VUMC6296393.242 E1065/ / Y
NIH / National Institutes of HealthFed Agency:28,140 28,140Vanderbilt Univ VUMC6458993.310 E0816/ / Y24,005 24,005Vanderbuilt University93.853 E0416/ / Y28,171 28,171Vanderbilt Univ UNIV6006093.853 E0973/ / Y
FY19 SEFA Pass-through detailsVanderbilt University Page 252

Urbana Chicago SpringfieldTotal for Pass-Through Detail
Pass-Through Entity
CFDA Number / U of I Grant Code / Pass-Through Award Title
ClusterFed Agency Major
Program
US Department of EducationFed Agency:196,702 196,702DE Sub Vanderbilt UNIV 5865384.324 AC114/ / Y
Other ProgramsCluster:US Department of EducationFed Agency:
184,481 184,481Vanderbilt Univ Sub 5882084.325 E2512/ / N
282,998 331,470 614,468Pass-through entity total:
VVera Institute of Justice1R&DCluster:
US Department of Justice (DOJ)Fed Agency:48,540 48,540Vera Institute of Justice E085116.738 E0851/ / Y
48,540 48,540Pass-through entity total:
Virginia Commonwealth University1R&DCluster:
US National Science Foundation (NSF)Fed Agency:34,487 34,487VCU Subaward FP00001012_SA00147.041 E1639/ / Y
34,487 34,487Pass-through entity total:
Wake Forest University1R&DCluster:
NIH / National Institutes of HealthFed Agency:36,038 36,038WFUHS 11574993.837 E1978/ / Y
US Department of Defense (DoD)Fed Agency:123,841 123,841Wake Forest WFUHS 441034 CTA0412.420 E2714/ / Y136,326 136,326Wake Forest WFUHS 441031 CTA0112.420 E2715/ / Y
US Health & Human Services (HHS)Fed Agency:45,178 45,178Wake Forest Univ WFUHS11474993.866 E0790/ / Y
341,383 341,383Pass-through entity total:
Washington State University1R&DCluster:
NIH / National Institutes of HealthFed Agency:3,332 3,332Wash State G003733 1R21DC01563601A193.173 E1326/ / Y
3,332 3,332Pass-through entity total:
FY19 SEFA Pass-through detailsWashington State University Page 253

Urbana Chicago SpringfieldTotal for Pass-Through Detail
Pass-Through Entity
CFDA Number / U of I Grant Code / Pass-Through Award Title
ClusterFed Agency Major
Program
WWashington University1R&DCluster:
Agency for Healthcare Research and Quality (AHRQ)Fed Agency:49,747 49,747WU-19-20593.226 E0736/ / Y
NIH / National Institute of Neurological Disorders & StrokeFed Agency:229,795 229,795NIH Sub WU WU-19-22693.853 AF337/ / Y
NIH / National Institutes of HealthFed Agency:-2,834 -2,834NIH SUB WU-15-5793.286 AB639/ / Y32,091 32,091NIH SUB WASH WU-18-15893.286 AE407/ / Y
47,327 47,327Washington University in St Louis93.837 E0649/ / YUS Department of Defense (DoD)Fed Agency:
212,408 212,408DOD sub Wash U WU-18-17712.420 AE060/ / YUS Department of Energy (DOE)Fed Agency:
24,871 24,871DOE Sub WU-15-141 PO 2922576Y81.049 AB638/ / YUS National Science Foundation (NSF)Fed Agency:
37,403 37,403SBC Washington Univ. WU-19-2647.041 AF306/ / Y145,804 145,804SBC Washington U WU-18-5447.074 AE252/ / Y
679,538 97,074 776,612Pass-through entity total:
Wayne State University1R&DCluster:
NIH / National Institutes of HealthFed Agency:58,029 58,029Wayne State Univ WSU17066-A193.242 E1129/ / Y
180,238 180,238Wayne St Univ Sub No WSU1610193.837 E1750/ / YUS Department of Defense (DoD)Fed Agency:
80 80WSU 1510612.420 E2703/ / YUS National Science Foundation (NSF)Fed Agency:
833 833SBC Wayne State PO712869 TTA47.074 AB472/ / Y
833 238,347 239,180Pass-through entity total:
West Virginia University1R&DCluster:
US Department of Defense (DoD)Fed Agency:2,103 2,103DOD West VA Univ 00442357 ANTC12.300 AG907/ / Y
2,103 2,103Pass-through entity total:
FY19 SEFA Pass-through detailsWest Virginia University Page 254

Urbana Chicago SpringfieldTotal for Pass-Through Detail
Pass-Through Entity
CFDA Number / U of I Grant Code / Pass-Through Award Title
ClusterFed Agency Major
Program
WWestat1R&DCluster:
NIH / National Institute on Drug AbuseFed Agency:59,838 59,838Westat Inc 1U54DA046060-0193.077 E0630/ / Y
US Health & Human Services (HHS)Fed Agency:20,998 20,998Westat 6632.01-S0493.000 E0570/ / Y14,476 14,476Westat 6048-S0593.399 E2803/ / Y
95,312 95,312Pass-through entity total:
Wisconsin Department of Children and Families1R&DCluster:
NIH / National Institutes of HealthFed Agency:193,633 193,633NIH SUB WI CFO0023593.658 AA874/ / Y71,410 71,410NIH SUB WIDCF 437003M17000098493.669 AE044/ / Y
265,043 265,043Pass-through entity total:
Women's and Infants Hospital of Rhode Island1R&DCluster:
NIH / National Institutes of HealthFed Agency:571 571NIH TTA WIH 09130993.859 AF489/ / Y
571 571Pass-through entity total:
Woolpert Inc1R&DCluster:
US Department of CommerceFed Agency:84,562 84,562COM Sub Woolpert UOI-18-S-01711.000 AF675/ / Y
84,562 84,562Pass-through entity total:
World VisionOther ProgramsCluster:
United States Agency for International Development (AID)Fed Agency:120,221 120,221AID Sub WV AID-636-A-14-00001-UIUC98.001 AF668/ / N
120,221 120,221Pass-through entity total:
Yale University1R&DCluster:
NIH / National Institutes of HealthFed Agency:12,008 12,008Yale Univ GR10117993.279 E0967/ / Y
FY19 SEFA Pass-through detailsYale University Page 255

Urbana Chicago SpringfieldTotal for Pass-Through Detail
Pass-Through Entity
CFDA Number / U of I Grant Code / Pass-Through Award Title
ClusterFed Agency Major
Program
834 834Yale University 5U10HD055925-0793.865 E2294/ / Y
12,842 12,842Pass-through entity total:
YYouth AliveOther ProgramsCluster:
US Department of Justice (DOJ)Fed Agency:223,523 223,523Youth Alive16.582 E1805/ / N
223,523 223,523Pass-through entity total:
GRAND TOTALS for pass-through funding detail: 91,759,995 51,935,979 805,539 144,501,513
Urbana Chicago SpringfieldTotal for Pass-Through Detail
Major Program Codes:Y - Cluster, program, or award tested as a major programN - Not tested as a major program
Schedule of Expenditures of Federal Awards presentation:See also the notes to the Schedule of Expenditures of Federal Awards; these notes are an integral part of this Schedule.
FY19 SEFA Pass-through detailsYouth Alive Page 256

STATE OF ILLINOISUNIVERSITY OF ILLINOIS
NOTES TO SCHEDULE OF EXPENDITURES OF FEDERAL AWARDSJune 30, 2019
257
Note 1. Basis of Presentation
The accompanying Schedule of Expenditures of Federal Awards (the “Schedule”) includes the federal award activity of the University of Illinois (University) under programs of the federal government for the fiscal year ended June 30, 2019. The information in this Schedule is presented in accordance with the requirements of Title 2 U.S. Code of Federal Regulations Part 200, Uniform Administrative Requirement, Cost Principles, and Audit Requirements for Federal Awards (“Uniform Guidance”). Because the Schedule presents only a selected portion of the operations of the University, it is not intended to and does not present the financial position, changes in net position, or cash flows of the University of Illinois.
The schedule designates federal awards as direct and pass-through. Direct awards represent federal funding awarded directly to the University by a federal agency, pass-through awards are federal awards passed through a non-federal entity. Pass-through identifying information is presented when available and when applicable.
Note 2. Summary of Significant Accounting Policies
Expenditures reported on the Schedule are presented on a modified cash basis of accounting. The methodology for determining federal awards expended is:
Direct costs are reported as federal expenditures on a cash basis, with the following exceptions:
1. Academic Year (nine-month) faculty salaries charged to sponsored projects are earned over nine months and paid over 12 months.
2. Salaries and wages earned between the last payroll date in June and June 30 are accruedand included as a current year federal expenditure.
3. Payroll related fringe benefits costs that are charged on an actuarial basis are included as a current year federal expenditure.
Indirect costs are assessed as a percentage of direct costs and are included as a current year federal expenditure.
Expenditures reported on the Schedule meet the cost principles contained in OMB Circular A-21, Cost Principles for Educational Institutions, and/or in the Uniform Guidance, wherein certain types of expenditures are not allowable or are limited as to reimbursement. Negative amounts shown on the Schedule represent adjustments or credits made in the normal course of business to amounts reported as expenditures in prior years.
The University of Illinois has not elected to use the 10-percent de minimis indirect cost rate allowed under the Uniform Guidance. The University has approved federally recognized indirect cost rates negotiated between the University and the Federal Government.

STATE OF ILLINOISUNIVERSITY OF ILLINOIS
NOTES TO SCHEDULE OF EXPENDITURES OF FEDERAL AWARDSJune 30, 2019
258
Note 3. Federal Student Loan Programs
As disclosed in the Schedule of Expenditures of Federal Awards, the Federal Direct Student Loans Program (CFDA 84.268) administered by the University of Illinois awarded approximately $205.61 million at Urbana, $238.27 million at Chicago, and $17.38 million at Springfield.
In addition, the University of Illinois administers a series of loan programs as part of the Student Financial Assistance Cluster program. Loan balances subject to continuing compliance requirements during the year ended June 30, 2019 under the Federal Perkins Loan Program (Perkins), Health Professional Student Loans (HPSL), Nursing Faculty Loan Program (NFLP), Nursing Student Loan Program (Nursing), and Loans for Disadvantaged Students (LDS) programs were as follows:
Perkins (84.038)
HPSL (93.342)
NFLP (93.264)
Nursing (93.364)
LDS (93.342)
Beginning loan balances 30,619,016 8,448,954 196,160 639,838 741,471
New loans issued - 1,985,546 - 249,344 203,800
Federal capital contributions - - - - -
Administrative cost allowance - - - - -
Total 30,619,016 10,434,500 196,160 889,182 945,271
The total loan balances outstanding at June 30, 2019 were approximately $25.33 million for Perkins, $9.29 million for HPSL, $166 thousand for NFLP, $738 thousand for Nursing, and $815 thousand for LDS.
Perkins = Federal Perkins Loan ProgramHPSL = Health Professions Student LoansNFLP = Nurse Faculty Loan ProgramNursing = Nursing Student Loans ProgramLDS = Loans to Disadvantaged Students

STATE OF ILLINOISUNIVERSITY OF ILLINOIS
NOTES TO SCHEDULE OF EXPENDITURES OF FEDERAL AWARDSJune 30, 2019
259
Note 4. Non-Cash Federal Assistance
The University of Illinois received a pass-through grant from Illinois Department of Human Services (IDHS) to review the applications of families seeking subsidized day care under the Temporary Assistance Needy Families cluster, the Child Care Development Funds cluster, and the Social Service Block Grant programs. The applications were reviewed according to guidelines set by IDHS, the prime recipient of the federal funds.
As a result of the University’s application review, the Illinois State Comptroller distributed $14,257,026 of federal funds to day care providers as follows:
Program Number Assistance
Temporary Assistance Needy Families 93.558 $ 5,929,195
Child Care Development Funds Cluster:
Child Care Development Block Grant 93.575 4,931,866Child Care Mandatory and Matching Funds of the
Child Care and Development Fund 93.596 3,336,387
Social Service Block Grant 93.667 59,578
Total non-cash federal assistance: $14,257,026
These federal funds, which are paid directly by the State of Illinois to the day care providers, are considered to be non-cash federal assistance to the University of Illinois. The amounts are reported on the Schedule and have been included for purposes of determination of major programs.
Note 5. Federal Insurance Disclosure
Federally funded medical malpractice insurance was in effect under the Federal Tort Claims Act for Health Resources and Services Administration Deeming Notice Number 1-F00000300-17-01 from July 1, 2018 to December 31, 2018 and Deeming Notice Number 1-F00000300-18-01 from January 1, 2019 throughJune 30, 2019.
Note 6. Federal Depository Library
The University’s “Government Information” library (Urbana), “Albert E. Jenner Jr. Memorial Law Library” (Urbana), “Richard J. Daley Library” (Chicago), and “Norris L. Brookens Library” (Springfield) serve as depository libraries in the U.S. Government Publishing Office’s Federal Depository Library. The Federal Depository Library Program gives the public free access to government information. The University is the legal custodian of government publications received under this program; however, these publications remain the property of the federal government.

UNIVERSITY OF ILLINOIS
Annual Financial Report
June 30, 2019
(With Independent Auditors’ Report Thereon)

THE BOARD OF TRUSTEES
EX OFFICIO MEMBER The Governor of Illinois
Honorable JB Pritzker ..................................................................................................................................................................................................... Springfield
MEMBERS
Ramón Cepeda ....................................................................................................................................................................................................................... Darien Kareem Dale ......................................................................................................................................................................................................................... Chicago Donald J. Edwards ............................................................................................................................................................................................................... Chicago Ricardo Estrada .................................................................................................................................................................................................................... Chicago Patricia Brown Holmes ........................................................................................................................................................................................................ Chicago Naomi D. Jakobsson ............................................................................................................................................................................................................. Urbana Stuart C. King.................................................................................................................................................................................................................. Champaign Edward L. McMillan ........................................................................................................................................................................................................ Greenville Jill B. Smart .............................................................................................................................................................................................................. Downers Grove
STUDENT TRUSTEES
Trayshawn N. W. Mitchell ....................................................................................................................................... University of Illinois at Urbana – Champaign Darius M. Newsome ..................................................................................................................................................................... University of Illinois at Chicago Shaina Humphrey ..................................................................................................................................................................... University of Illinois at Springfield
BOARD OFFICERS
Donald J. Edwards ................................................................................................................................................................................................................... Chair Lester H. McKeever, Jr. ..................................................................................................................................................................................................... Treasurer Avijit Ghosh .................................................................................................................................................................... Chief Financial Officer and Comptroller Thomas R. Bearrows .......................................................................................................................................................................................... University Counsel Dedra M. Williams ............................................................................................................................................................................................................. Secretary
ADMINISTRATIVE OFFICERS
Timothy L. Killeen ............................................................................................................................................................................................................. President Robert Jones .......................................................................................................... Chancellor and Vice President, University of Illinois at Urbana – Champaign Michael D. Amiridis .................................................................................................................. Chancellor and Vice President, University of Illinois at Chicago Susan J. Koch ........................................................................................................................ Chancellor and Vice President, University of Illinois at Springfield Michael B. Bass .......................................................................................... Senior Associate Vice President for Business and Finance and Deputy Comptroller Brent Rasmus ......................... Interim Controller and Assistant Vice President for Business and Finance (effective May 1, 2018 through February 15, 2019) .................................................................................................................. Controller and Assistant Vice President (effective February 16, 2019) Julie A. Zemaitis .............................................................................................................................................................. Executive Director of University Audits

UNIVERSITY OF ILLINOIS
Annual Financial Report
June 30, 2019
Table of Contents
Page
Letter of Transmittal 1
Independent Auditors’ Report 2
Management’s Discussion and Analysis (Unaudited) 5
Financial Statements:
Statement of Net Position 13
Statement of Revenues, Expenses and Changes in Net Position 14
Statement of Cash Flows 15
Notes to Financial Statements 17
Required Supplementary Information 67
Supplementary Information 70
Other Information 71

1

2
INDEPENDENT AUDITORS’ REPORT Honorable Frank J. Mautino Auditor General, State of Illinois and Board of Trustees University of Illinois Report on the Financial Statements As Special Assistant Auditors for the Auditor General, we have audited the accompanying financial statements of the business-type activities and aggregate discretely presented component units of University of Illinois (the University), collectively a component unit of the State of Illinois, as of and for the year ended June 30, 2019, and the related notes to the financial statements, which collectively comprise the University’s basic financial statements as listed in the table of contents. Management’s Responsibility for the Financial Statements Management is responsible for the preparation and fair presentation of these financial statements in accordance with accounting principles generally accepted in the United States of America; this includes the design, implementation, and maintenance of internal control relevant to the preparation and fair presentation of financial statements that are free from material misstatement, whether due to fraud or error. Auditors’ Responsibility Our responsibility is to express an opinion on these financial statements based on our audits. We did not audit the financial statements of the University’s aggregate discretely presented component units (the University Related Organizations), as described in Note 1 of the financial statements. Those statements were audited by other auditors whose reports thereon have been provided to us, and our opinion on the financial statements, insofar as it relates to the amounts included for the University Related Organizations, is based solely on the reports of the other auditors. We conducted our audits in accordance with auditing standards generally accepted in the United States of America and the standards applicable to financial audits contained in Government Auditing Standards, issued by the Comptroller General of the United States. Those standards require that we plan and perform the audit to obtain reasonable assurance about whether the financial statements are free from material misstatement. The financial statements of The University of Illinois Foundation; The University of Illinois Alumni Alliance; Wolcott, Wood, and Taylor, Inc.; Prairieland Energy, Inc.; Illinois Ventures, LLC; The University of Illinois Research Park, LLC, and UI Singapore Research, LLC (discretely presented component units) were not audited in accordance with Government Auditing Standards.

Honorable Frank J. Mautino Auditor General, State of Illinois and Board of Trustees University of Illinois
3
An audit involves performing procedures to obtain audit evidence about the amounts and disclosures in the financial statements. The procedures selected depend on the auditors’ judgment, including the assessment of the risks of material misstatement of the financial statements, whether due to fraud or error. In making those risk assessments, the auditor considers internal control relevant to the entity’s preparation and fair presentation of the financial statements in order to design audit procedures that are appropriate in the circumstances, but not for the purpose of expressing an opinion on the effectiveness of the entity’s internal control. Accordingly, we express no such opinion. An audit also includes evaluating the appropriateness of accounting policies used and the reasonableness of significant accounting estimates made by management, as well as evaluating the overall presentation of the financial statements. We believe that the audit evidence we have obtained is sufficient and appropriate to provide a basis for our audit opinions. Opinions In our opinion, based on our audit and the reports of other auditors, the financial statements referred to above present fairly, in all material respects, the respective financial position of the business-type activities of University of Illinois and its aggregate discretely presented component units as of June 30, 2019, and the respective changes in financial position and, where applicable, cash flows thereof for the year then ended in accordance with accounting principles generally accepted in the United States of America. Other Matters Report on Summarized Comparative Information We have previously reported on the University of Illinois’ 2018 financial statements, and we expressed an unmodified audit opinion on those audited financial statements in our report dated December 19, 2018. In our opinion, the summarized comparative information presented herein as of and for the year ended June 30, 2018, is consistent, in all material respects, with the audited financial statements from which it has been derived. Required Supplementary Information Accounting principles generally accepted in the United States of America require that the management’s discussion and analysis on pages 5 through 12, the Schedule of Share of the Net Pension Liability and Schedule of Contributions on page 67 and Schedule of the University’s Proportionate Share of the Net OPEB Liability on page 69 be presented to supplement the basic financial statements. Such information, although not a part of the basic financial statements, is required by the Governmental Accounting Standards Board, who considers it to be an essential part of financial reporting for placing the basic financial statements in an appropriate operational, economic, or historical context. We have applied certain limited procedures to the required supplementary information in accordance with auditing standards generally accepted in the United States of America, which consisted of inquiries of management about the methods of preparing the information and comparing the information for consistency with management’s responses to our inquiries, the basic financial statements, and other knowledge we obtained during our audits of the basic financial statements. We do not express an opinion or provide any assurance on the information because the limited procedures do not provide us with sufficient evidence to express an opinion or provide any assurance.

Honorable Frank J. Mautino Auditor General, State of Illinois and Board of Trustees University of Illinois
4
Other Information Our audit was conducted for the purpose of forming opinions on the financial statements that collectively comprise the University of Illinois’s basic financial statements. The Letter of Transmittal on page 1 and the Tables of Operating Expenses on pages 70 and 71 are presented for purposes of additional analysis and are not a required part of the basic financial statements. The Table of Operating Expenses for the year ended June 30, 2019 on page 70 is the responsibility of management and was derived from and relates directly to the underlying accounting and other records used to prepare the basic financial statements. Such information has been subjected to the auditing procedures applied in the audit of the basic financial statements and certain additional procedures, including comparing and reconciling such information directly to the underlying accounting and other records used to prepare the basic financial statements or to the basic financial statements themselves, and other additional procedures in accordance with auditing standards generally accepted in the United States of America. In our opinion, the Table of Operating Expenses for the year ended June 30, 2019 is fairly stated, in all material respects, in relation to the basic financial statements as a whole. The Letter of Transmittal on page 1 and the Table of Operating Expenses for the year ended June 30, 2018 on page 71 have not been subjected to the auditing procedures applied in the audit of the basic financial statements, and accordingly, we do not express an opinion or provide any assurance on them. Other Reporting Required by Government Auditing Standards In accordance with Government Auditing Standards, we have also issued under separate cover our report dated December 19, 2019, on our consideration of University of Illinois’ internal control over financial reporting and on our tests of its compliance with certain provisions of laws, regulations, contracts, and grant agreements and other matters. The purpose of that report is solely to describe the scope of our testing of internal control over financial reporting and compliance and the results of that testing, and not to provide an opinion on the effectiveness of the University’s internal control over financial reporting or on compliance. That report is an integral part of an audit performed in accordance with Government Auditing Standards in considering University of Illinois’s internal control over financial reporting and compliance.
CliftonLarsonAllen LLP
Peoria, Illinois December 19, 2019

UNIVERSITY OF ILLINOIS
Management’s Discussion and Analysis (Unaudited)
June 30, 2019
5 (Continued)
Introduction and Background
The following Management’s Discussion and Analysis (MD&A) provides an overview of the financial position and activities of the University of Illinois (University) for the year ended June 30, 2019. The MD&A should be read in conjunction with the audited financial statements and notes appearing in this report.
The University serves the people of Illinois through a commitment to excellence in teaching, research, public service, economic development and healthcare. With main campus locations in Urbana-Champaign, Chicago and Springfield, the University System currently enrolls nearly 86,000 talented students to hundreds of programs-many of them ranked among the best in the nation. Faculty members are world leaders in research and discovery and contribute new knowledge and life changing breakthroughs to a variety of fields. In addition to the three main campuses, the University System has teaching and service facilities, including regional campuses and extension offices, located throughout the State of Illinois.
Using the Financial Statements
The University’s financial report includes three financial statements: the Statement of Net Position; the Statement of Revenues, Expenses and Changes in Net Position; and the Statement of Cash Flows. The financial statements are prepared in accordance with Governmental Accounting Standards Board (GASB) principles, which establish standards for external financial reporting for public colleges and universities and require that financial statements focus on the University as a whole.
The financial statements encompass the University and its discretely presented component units: University of Illinois Foundation; University of Illinois Alumni Alliance; Wolcott, Wood and Taylor, Inc.; Illinois Ventures, LLC; University of Illinois Research Park, LLC; Prairieland Energy, Inc.; and UI Singapore Research, LLC. This MD&A excludes the discretely presented component units. Condensed financial information regarding those component units is disclosed separately in Note 16 to the financial statements. Financial Highlights and Key Trends
The University’s financial results in fiscal year 2019 were positive, marked by steady revenue streams and prudent use of resources. Consistent revenues and disciplined spending policies resulted in a $378 million increase in net position for the year. As in the past, the University relied on diverse sources of funding to support its mission.

6 (Continued)
Statement of Net Position
The Statement of Net Position presents the financial position of the University at the end of the fiscal year and includes all assets, deferred outflows of resources, liabilities, and deferred inflows of resources of the University using the accrual basis of accounting. Net position is one indicator of the current financial condition of the institution. The changes in net position that occur over time indicate improvement or deterioration in financial condition. Generally, assets and liabilities are reported at cost with the exception of investments, which are reported at fair value. Capital assets are reported at historical cost less accumulated depreciation. A summarized comparison of the University’s assets, deferred outflows of resources, liabilities, deferred inflows of resources and net position at June 30, 2019 and 2018 is as follows:
2019 2018(In thousands)
Current assets:Cash and investments $ 1,097,618 1,103,131 Accounts and notes receivable 521,057 546,026 Appropriations receivable from State of Illinois 33,710 45,181 Other current assets 90,822 81,839
Noncurrent assets:Cash and investments 2,513,717 2,163,436 Notes receivable 41,862 44,569 Capital assets, net of accumulated depreciation 3,873,254 3,761,293 Other noncurrent assets 42,303 31,554
Deferred outflows of resources 89,588 99,704
Total assets and deferred outflows of resources $ 8,303,931 7,876,733
Current liabilities:Accounts payable, accrued liabilities and unearned revenue $ 869,673 792,654 Bonds payable 62,271 56,028 Leaseholds payable and other obligations 50,300 44,067 Other postemployment benefits 26,574 30,221 Other current liabilities 104,751 113,961
Noncurrent liabilities:Bonds payable 1,253,707 1,171,945 Leaseholds payable and other obligations 195,349 239,727 Other postemployment benefits 1,133,965 1,284,539 Other noncurrent liabilities 400,676 383,787
Deferred inflows of resources 415,876 346,539
Total liabilities and deferred inflows of resources 4,513,142 4,463,468
Net position 3,790,789 3,413,265
$ 8,303,931 7,876,733 Total liabilities, deferred inflows of resources and net position
Total assets and deferred outflows of resources increased by $427 million or 5.4% during fiscal year 2019. The largest component of this change resulted from the significant increase in cash and investments due to an increase in fair value of investments along with reinvestment of interest and capital gains.
Total liabilities and deferred inflows of resources increased $50 million, or 1.1% for fiscal year 2019. This change primarily resulted from the issuance of Auxiliary Facilities System Revenue Bonds during fiscal year 2019.

7 (Continued)
Capital Assets and Long-Term Debt
The University’s policy requires the capitalization of equipment at $5,000, software and other intangibles at $100,000, buildings and improvements at $100,000, infrastructure at $1,000,000 and all land and collection purchases regardless of cost. The University depreciates capital assets on a straight-line basis, using estimated useful lives ranging from 3 to 50 years. The following table illustrates the composition of the University’s capital assets, net of accumulated depreciation, by category:
Capital Assets, Net of Accumulated Depreciation(In thousands)
2019 2018
Buildings $ 2,742,302 70.8% $ 2,719,038 72.2%Improvements and infrastructure 245,700 6.3 247,047 6.6Construction in progress 335,549 8.7 267,032 7.1Land 138,374 3.6 138,374 3.7Equipment and software 273,092 7.0 251,157 6.7Collections 138,237 3.6 138,645 3.7
$ 3,873,254 100.0% $ 3,761,293 100.0%
Capital assets, net of accumulated depreciation, increased by $112 million in fiscal year 2019. This increase included current year additions to construction in progress, buildings and equipment. Facilities improvements under construction were funded by revenue bonds, federal grants, private gifts, internal funds and State capital appropriations. Improvements to existing buildings included the Food Service Building – Illinois Student Residence Hall and Memorial Stadium. Another addition is the 3i Integrated Information Infrastructure software project.
The University has historically utilized revenue bonds to finance capital projects related to the Auxiliary Facilities System (AFS), the Health Services Facilities System (HSFS) and the University of Illinois – Chicago (UIC) South Campus project. The following table details the various bonded debt outstanding at June 30, 2019 and 2018:
Bonds Payable(In thousands)
2019 2018
AFS $ 1,186,947 1,088,798 HSFS 105,613 109,253 UIC South Campus 23,418 29,922
$ 1,315,978 1,227,973
The University has issued Certificates of Participation (Certificates), which are reported as leaseholds payable in the financial statements. The outstanding Certificates have funded projects such as utility infrastructure, College of Medicine facilities and deferred maintenance on medical, academic and research facilities. The reduction in the outstanding balance of the Certificates was due to scheduled redemptions. The outstanding balances of the Certificates as of June 30, 2019 and 2018 were $157,667,000 and $194,132,000 respectively.

8 (Continued)
Net Position
The University’s resources are classified into net position categories on the Statement of Net Position. These categories are defined as (a) Net investment in capital assets, (b) Restricted nonexpendable – net position restricted by externally imposed stipulations, (c) Restricted expendable – net position subject to externally imposed restrictions that can be fulfilled by actions of the University pursuant to those stipulations or that expire by the passage of time and (d) Unrestricted – net position not subject to externally imposed stipulations but may be designated for specific purposes by action of management or the Board of Trustees. The University’s net position increased by $378 million during fiscal year 2019. Net position balances are below:
Net Position(In thousands)
2019 2018
Net position:Net investment in capital assets $ 2,504,507 2,386,445 Restricted 761,080 763,199 Unrestricted 525,202 263,621
$ 3,790,789 3,413,265
The overall increase in net position of $378 million included growth in net investment in capital assets and resources unrestricted for capital projects, institutional support and quasi endowments.

9 (Continued)
Statement of Revenues, Expenses and Changes in Net Position
The Statement of Revenues, Expenses and Changes in Net Position presents the University’s results of operations. In accordance with GASB reporting standards, revenues and expenses are classified as either operating or nonoperating. A summarized comparison of the University’s Statement of Revenues, Expenses and Changes in Net Position for the years ended June 30, 2019 and 2018 is as follows:
2019 2018(In thousands)
Operating revenues:Student tuition and fees $ 1,193,419 1,193,322 Hospital, medical service plans and other medical activities 1,037,721 1,041,026 Grants and contracts 894,843 860,254 Auxiliary enterprises and independent operations 446,202 427,852 Educational activities 337,160 338,287 Other 25,294 23,213
Total operating revenues 3,934,639 3,883,954
Operating expenses 5,730,781 6,311,865
Operating loss (1,796,142) (2,427,911)
Nonoperating revenues (expenses):State appropriations, on behalf payments, and special funding 1,646,467 2,598,849 Transfer of state appropriation to the Illinois Hospital Services Fund (20,000) (20,000) Private gifts 189,534 193,680 Grants, nonoperating 186,571 244,332 Investment income 119,892 58,082 Change in fair value of investments 22,240 7,704 Interest expense (63,380) (65,038) Other nonoperating revenues, net 76,671 26,341
Net nonoperating revenues 2,157,995 3,043,950
Capital state appropriations and capital gifts and grants 15,474 18,097 Endowment gifts 197 4,197
Increase in net position 377,524 638,333
Net position, beginning of year 3,413,265 4,374,586 Change in accounting principle (1,599,654)
Net position, end of year $ 3,790,789 3,413,265
Revenues
The University’s revenues are generated from multiple sources, which supplement what is received from state appropriations and student tuition and fees. GASB reporting standards require revenues to be categorized as operating or nonoperating. Operating revenues are derived from activities associated with providing goods and services by the University and generally result from exchange transactions where each of the parties to the transaction either give up or receive something of equal or similar value. The University also relies on revenue, such as state appropriations, gifts, certain grants and investment income to support operations, which GASB reporting standards define as nonoperating.

10 (Continued)
The following graph illustrates the revenues by source (both operating and certain nonoperating), which were used to fund the University’s operating activities for the year ended June 30, 2019:
Operating revenues experienced a net increase of $51 million in fiscal year 2019 due to growth in grants and contracts and auxiliary enterprises and independent operations revenue.
Nonoperating revenues decreased by $953 million in fiscal year 2019. State appropriation revenue decreased during fiscal year 2019 in the amount of $287 million due to the timing of additional appropriations received in fiscal year 2018 that were intended for fiscal year 2017 expenses.
The most significant reason for the decrease in nonoperating revenues resulted from a $665 million decrease in on-behalf and special funding revenues from the State of Illinois (State). This fiscal year 2019 decrease was due to the allocation of negative non-operating revenue and negative operating expense of $406 million related to other postemployment benefit (OPEB) costs incurred by the State Employee Group Insurance Plan (SEGIP) administered by the Department of Central Management Services (CMS). For comparison, the University’s allocation of special funding OPEB nonoperating revenue for fiscal year 2018 was a positive $454 million, resulting in a variance of $860 million. This is primarily the result of changes in estimating the total employees when determining the University’s proportionate share and estimating the average cost per employee as calculated by CMS. When GASB Statement #75 regarding OPEB was initially implemented in fiscal year 2018, CMS estimated the University’s allocated share of special funding OPEB nonoperating revenue by using full-time equivalent employees. In fiscal year 2019, CMS used the number of University employees actually enrolled in SEGIP to estimate the University’s proportionate share.
27%
20%
17%
15%
8%
7%6%
Revenues
27% Nonoperating state appropriations, on‐behalf and special funding, $1,626.5 million
20% Student tuition and fees, $1,193.4 million
17% Hospital, medical service plan and other medical services, $1,037.7 million
15% Grants and contracts, operating, $894.8 million
8% Private gifts, nonoperating grants, and investment income, $496 million
7% Auxiliary enterprises and independent operations, $446.2 million
6% Educational activities and other operating revenues, $362.5 million

11 (Continued)
The differences in OPEB accounting estimates involving the change in the University’s proportionate share percentage and the average cost per employee between FY19 and FY18 represents an outcome of estimation uncertainty as described in Note 12(d). The allocation of negative operating expenses caused by this change in estimate also had a significant impact on the University’s operating expenses as described below.
Expenses
The majority of the University’s expenses are exchange transactions, which GASB standards define as operating expenses. Nonoperating expenses include capital financing and other costs related to capital assets.
2019 2018(In thousands)
Operating expenses:Instruction $ 1,449,939 25.3% $ 1,682,740 26.7%Research 815,345 14.2 858,576 13.6Public service 427,006 7.5 482,127 7.6Support services 1,060,115 18.5 1,167,985 18.5Hospital and medical activities 951,286 16.6 1,044,824 16.6Auxiliary enterprises and
independent operations 391,016 6.8 418,470 6.6Scholarships and fellowships 57,257 1.0 70,122 1.1Operation and maintenance of plant 334,632 5.8 332,016 5.3Depreciation 244,185 4.3 255,005 4.0
Total operating expenses $ 5,730,781 100.0% $ 6,311,865 100.0%
As explained earlier, the decrease in the University’s allocated share of special funding OPEB expense contributed to the overall decrease in operating expenses of $581 million, or 9.2%. The University’s proportionate share of special funding and on-behalf fringe benefits, including OPEB, is spread among various functional operating expenses. Users of these financial statements may find additional detail in this area helpful to better understand the components of total compensation and benefits and the impact on functional operating expenses. The University has two tables in this report to show the impact of these allocations on the functional operating expenses. The table for fiscal year 2019 that shows this additional detail can be found on page 70 and the table for fiscal year 2018 is presented on page 71.
Excluding the decrease in special funding and on-behalf expenses, operating expenses increased by $84 million, or 1.8%. This modest increase illustrates management’s focus on disciplined spending and prudent use of resources.
The University reported its expenses by functional classifications in the Statement of Revenues, Expenses and Changes in Net Position. For the reader’s information, the expenses are displayed in their natural classifications in Note 14.

12
The following graph illustrates the $5,730.8 million of operating expenses by natural classification:
The University’s Economic Outlook
The University continues to maintain its level of excellence in service to students, patients, the research community, and the citizens of the State. A critical element to the University's future continues to be a strong partnership with the State, since State appropriations from the Governor and General Assembly provide essential operating support for University programs. Appropriations of $629 million were enacted on June 5, 2019 to fund fiscal year 2020 expenditures, an increase of 4.7% from the $601 million appropriated for fiscal year 2019.
Tuition rates are largely being held level between fiscal years 2019 and 2020. However, based on multiple factors (such as enrollment levels and student mix), the University projects an increase in the tuition revenue budget of approximately $60 million. Undergraduate students have a four-year tuition guarantee. The incremental tuition revenue for fiscal year 2020 includes planned increases in total enrollment, changes in enrollment patterns, and varying increases in graduate and professional programs. Approximately $25 million of this increase in tuition revenue budget is associated with the acquisition of the UIC John Marshall Law School (see Note 17).
The University consistently ranks among the top universities in research and development expenditures in the country. Research leading to the development of new products and services is also an engine driving economic development, an important component of the University's mission. The University continues to advance the economic development mission by supporting research and innovation activities that elevate ideas into sustainable businesses and global solutions.
Patient care is yet another way the University serves the citizens of the State. Patient visits to the University of Illinois Hospital (Hospital) and clinics continues to grow. The Hospital provides state-of-the-art, comprehensive medical care to patients from across the region, including some of the State’s most vulnerable citizens.
To maintain its financial position, the University continues to develop multiple sources of revenue to support its mission of teaching, research, public service, healthcare and economic development. The University's Board of Trustees, the administration, faculty and staff are committed to upholding the University's outstanding academic reputation and strong financial condition.
65%
29%
4%
2%
Operating Expenses
65% Compensation and benefits, $3,702.1 million 29% Supplies and services, $1,665.4 million
4% Depreciation, $244.2 million 2% Student aid, $119.1 million
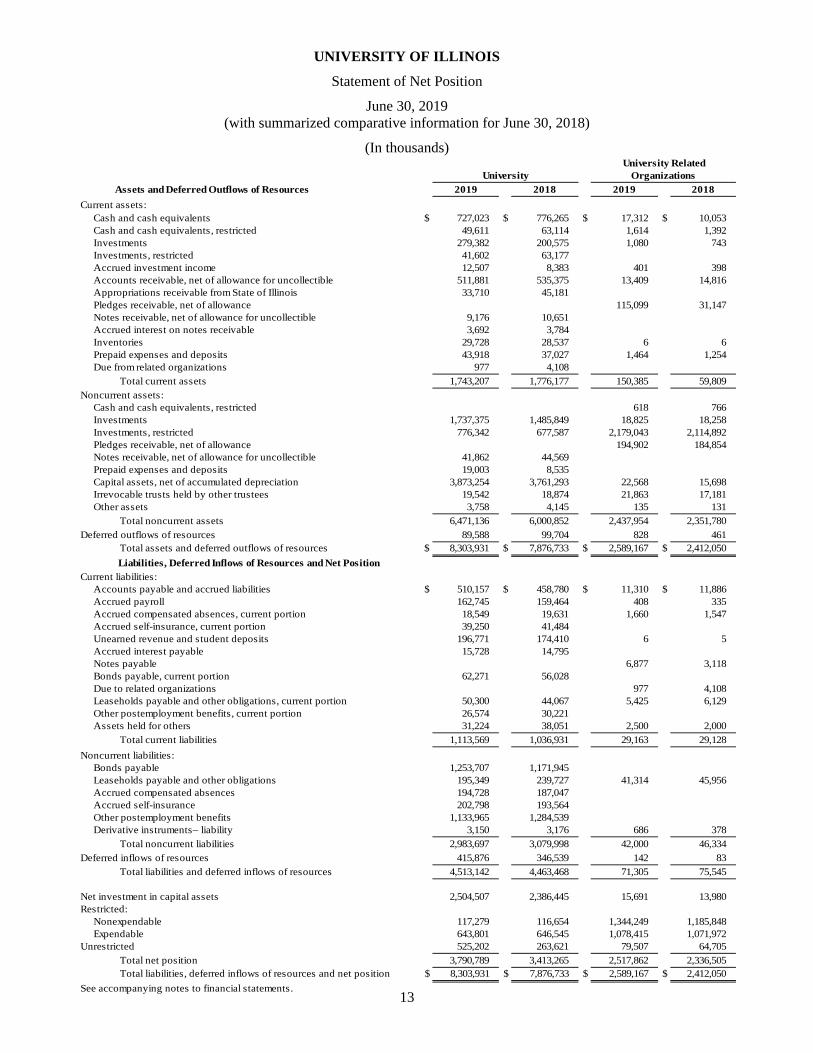
UNIVERSITY OF ILLINOIS
Statement of Net Position
June 30, 2019 (with summarized comparative information for June 30, 2018)
(In thousands)
13
University RelatedUniversity Organizations
Assets and Deferred Outflows of Resources 2019 2018 2019 2018
Current assets:Cash and cash equivalents $ 727,023 $ 776,265 $ 17,312 $ 10,053 Cash and cash equivalents, restricted 49,611 63,114 1,614 1,392 Investments 279,382 200,575 1,080 743 Investments, restricted 41,602 63,177 Accrued investment income 12,507 8,383 401 398 Accounts receivable, net of allowance for uncollectible 511,881 535,375 13,409 14,816 Appropriations receivable from State of Illinois 33,710 45,181 Pledges receivable, net of allowance 115,099 31,147 Notes receivable, net of allowance for uncollectible 9,176 10,651 Accrued interest on notes receivable 3,692 3,784 Inventories 29,728 28,537 6 6 Prepaid expenses and deposits 43,918 37,027 1,464 1,254 Due from related organizations 977 4,108
Total current assets 1,743,207 1,776,177 150,385 59,809 Noncurrent assets:
Cash and cash equivalents, restricted 618 766 Investments 1,737,375 1,485,849 18,825 18,258 Investments, restricted 776,342 677,587 2,179,043 2,114,892 Pledges receivable, net of allowance 194,902 184,854 Notes receivable, net of allowance for uncollectible 41,862 44,569 Prepaid expenses and deposits 19,003 8,535 Capital assets, net of accumulated depreciation 3,873,254 3,761,293 22,568 15,698 Irrevocable trusts held by other trustees 19,542 18,874 21,863 17,181 Other assets 3,758 4,145 135 131
Total noncurrent assets 6,471,136 6,000,852 2,437,954 2,351,780 Deferred outflows of resources 89,588 99,704 828 461
Total assets and deferred outflows of resources $ 8,303,931 $ 7,876,733 $ 2,589,167 $ 2,412,050
Liabilities, Deferred Inflows of Resources and Net PositionCurrent liabilities:
Accounts payable and accrued liabilities $ 510,157 $ 458,780 $ 11,310 $ 11,886 Accrued payroll 162,745 159,464 408 335 Accrued compensated absences, current portion 18,549 19,631 1,660 1,547 Accrued self-insurance, current portion 39,250 41,484 Unearned revenue and student deposits 196,771 174,410 6 5 Accrued interest payable 15,728 14,795 Notes payable 6,877 3,118 Bonds payable, current portion 62,271 56,028 Due to related organizations 977 4,108 Leaseholds payable and other obligations, current portion 50,300 44,067 5,425 6,129 Other postemployment benefits, current portion 26,574 30,221 Assets held for others 31,224 38,051 2,500 2,000
Total current liabilities 1,113,569 1,036,931 29,163 29,128
Noncurrent liabilities:Bonds payable 1,253,707 1,171,945 Leaseholds payable and other obligations 195,349 239,727 41,314 45,956 Accrued compensated absences 194,728 187,047 Accrued self-insurance 202,798 193,564 Other postemployment benefits 1,133,965 1,284,539 Derivative instruments– liability 3,150 3,176 686 378
Total noncurrent liabilities 2,983,697 3,079,998 42,000 46,334 Deferred inflows of resources 415,876 346,539 142 83
Total liabilities and deferred inflows of resources 4,513,142 4,463,468 71,305 75,545
Net investment in capital assets 2,504,507 2,386,445 15,691 13,980 Restricted:
Nonexpendable 117,279 116,654 1,344,249 1,185,848 Expendable 643,801 646,545 1,078,415 1,071,972
Unrestricted 525,202 263,621 79,507 64,705 Total net position 3,790,789 3,413,265 2,517,862 2,336,505 Total liabilities, deferred inflows of resources and net position $ 8,303,931 $ 7,876,733 $ 2,589,167 $ 2,412,050
See accompanying notes to financial statements.

UNIVERSITY OF ILLINOIS
Statement of Revenues, Expenses and Changes in Net Position
Year Ended June 30, 2019 (with summarized comparative information for the year ended June 30, 2018)
(In thousands)
14
University RelatedUniversity Organizations
2019 2018 2019 2018Operating revenues:
Student tuition and fees, net of scholarship allowance of $403,809 $ 1,193,419 $ 1,193,322 $ $Federal appropriations 23,755 21,309 Federal grants and contracts 683,579 652,271 State of Illinois grants and contracts 72,473 64,942 Private and other government agency grants and contracts 138,791 143,041 162,261 175,753 Educational activities 337,160 338,287 Auxiliary enterprises, net 434,532 416,319 Hospital and other medical activities, net 800,547 784,909 Medical service plan 237,174 256,117 Independent operations 11,670 11,533 Interest and service charges on student loans 1,539 1,904 Allocation from the University 15,784 15,638 Other sources 83,032 78,840
Total operating revenues 3,934,639 3,883,954 261,077 270,231 Operating expenses:
Instruction 1,449,939 1,682,740 Research 815,345 858,576 Public service 427,006 482,127 Academic support 546,057 619,524 Student services 217,124 237,794 Institutional support 296,934 310,667 105,655 108,332 Operation and maintenance of plant 334,632 332,016 Scholarships and fellowships 57,257 70,122 Auxiliary enterprises 382,124 406,300 Hospital and medical activities 951,286 1,044,824 Independent operations 8,892 12,170 Depreciation and amortization 244,185 255,005 1,994 1,816 Distributions on behalf of the University 208,317 208,413
Total operating expenses 5,730,781 6,311,865 315,966 318,561 Operating loss (1,796,142) (2,427,911) (54,889) (48,330)
Nonoperating revenues (expenses):State appropriations 600,983 888,361 Transfer of state appropriations to the Illinois Hospital Services Fund (20,000) (20,000) Private gifts 189,534 193,680 Grants, nonoperating 186,571 244,332 On-behalf for fringe benefits 257,496 215,967 Special funding situation for fringe benefits 787,988 1,494,521 Net investment income (net of investment expense of $6,189) 119,892 58,082 (1,394) 6,439 Net increase in the fair value of investments 22,240 7,704 69,469 143,769 Interest expense (63,380) (65,038) (78) (153) Loss on disposal of capital assets (4,339) (2,755) Other nonoperating revenues, net 81,010 29,096 9,850 26
Net nonoperating revenues 2,157,995 3,043,950 77,847 150,081 Income before other revenues 361,853 616,039 22,958 101,751
Capital state appropriations 11,707 12,858 Capital gifts and grants 3,767 5,239 Private gifts for endowment purposes 197 4,197 158,399 138,413
Increase in net position 377,524 638,333 181,357 240,164 Net position, beginning of year 3,413,265 4,374,586 2,336,505 2,096,341 Cumulative effect of change in accounting principle (1,599,654) Net position, beginning of year, as adjusted 3,413,265 2,774,932 2,336,505 2,096,341 Net position, end of year $ 3,790,789 $ 3,413,265 $ 2,517,862 $ 2,336,505
See accompanying notes to financial statements.

UNIVERSITY OF ILLINOIS
Statement of Cash Flows
Year ended June 30, 2019 (with summarized comparative information for the year ended June 30, 2018)
(In thousands)
15 (Continued)
University
2019 2018
Cash flows from operating activities:Student tuition and fees $ 1,194,386 $ 1,197,196 Federal appropriations 25,812 20,877 Federal, state, and local grants and contracts 749,010 743,569 Other governmental agencies and private grants and contracts 149,695 154,524 Sales and services of educational activities 332,043 334,108 Auxiliary activities and independent operations 446,624 426,079 Hospital and other medical activities 819,938 776,675 Medical service plan 242,339 262,187 Payments to employees and for benefits (2,734,601) (2,642,604) Payments to suppliers (1,602,074) (1,534,437) Payments for scholarships and fellowships (118,405) (117,565) Student loans issued (5,030) (6,755) Student loans collected 8,525 9,681 Student loan interest and fees collected 1,631 2,246
Net cash used in operating activities (490,107) (374,219)
Cash flows from noncapital financing activities:State appropriations 592,454 823,894 Gifts transferred from University of Illinois Foundation 189,534 193,680 Direct lending receipts 462,223 471,914 Direct lending payments (461,308) (470,249) Grants, nonoperating 186,571 244,332 Private gifts for endowment purposes 197 4,197 Repayments from related organizations, net 3,131 15 Other receipts 79,983 66,424 Other disbursements (1,493) (1,236)
Net cash provided by noncapital financing activities 1,051,292 1,332,971
Cash flows from capital and related financing activities:Proceeds from issuance of capital debt 166,872 State capital appropriations 769 Capital gifts and grants 16 206 Purchase of capital assets (325,947) (237,337) Principal payments on bonds, capital leases, and other obligations (118,597) (96,764) Interest payments on bonds, capital leases, and other obligations (62,910) (62,443) Upfront deposits related to public-private partnership projects (9,738) (8,535) Payment of capital debt issuance costs (2,031) (77)
Net cash used in capital and related financing activities (351,566) (404,950)
Cash flows from investing activities:Interest and dividends on investments, net 66,137 36,689 Proceeds from sales and maturities of investments 2,657,432 2,258,614 Purchase of investments (2,995,933) (2,490,068)
Net cash used in investing activities (272,364) (194,765)
Net (decrease) increase in cash and cash equivalents (62,745) 359,037
Cash and cash equivalents, beginning of year 839,379 480,342
Cash and cash equivalents, end of year $ 776,634 $ 839,379

UNIVERSITY OF ILLINOIS
Statement of Cash Flows
Year ended June 30, 2019 (with summarized comparative information for the year ended June 30, 2018)
(In thousands)
16
University2019 2018
Reconciliation of operating loss to net cash used in operating activities:Operating loss $ (1,796,142) $ (2,427,911) Adjustments to reconcile operating loss to net cash used in operating activities:
On-behalf and special funding situation for fringe benefits expense 1,045,484 1,710,488 Depreciation expense 244,185 255,005 Changes in assets, deferred outflows of resources, liabilities and deferred inflows of resources:
Accounts receivable, net 4,387 23,944 Notes receivable, net 4,182 3,702 Accrued interest on notes receivable 92 343 Inventories (1,191) 3,480 Prepaid expenses and deposits (6,864) (1,895) Deferred outflow of resources 4,552 447 Accounts payable and accrued liabilities 64,346 35,423 Accrued payroll 3,281 3,248 Unearned revenue and student deposits 22,361 9,221 Accrued compensated absences 6,599 3,782 Accrued self-insurance 7,000 (4,437) Other postemployment benefits (154,221) (317,640) Deferred inflows of resources 68,669 327,665 Assets held for others (6,827) 916
Net cash used in operating activities $ (490,107) $ (374,219)
Noncash investing, capital, and financing activities:On-behalf for fringe benefits nonoperating revenue $ 257,496 $ 215,967 Special funding for fringe benefits nonoperating revenue 787,988 1,494,521 State appropriation 20,382 39,589 Transfers of state appropriations to Illinois Hospital Services Fund (20,000) (20,000) Net increase in fair value of investments 22,240 7,704 Gifts in kind – capital assets 3,748 4,971 Increase of capital asset obligations in accounts payable 10,459 10,208 Capital asset acquisitions by Capital Development Board 10,938 12,858 Capital asset acquisitions via leaseholds payable 5,144 145 Net interest capitalized 3,360 2,161 Other capital asset adjustments 889 73 Loss on disposal of capital assets (4,339) (2,755) Capital appreciation on bonds payable $ 4,422 $ 5,364

UNIVERSITY OF ILLINOIS
Notes to Financial Statements
June 30, 2019
17 (Continued)
(1) Organization and Summary of Significant Accounting Policies
Organization
The University of Illinois (University), a federal land grant institution, founded in 1867 and a component unit of the State, conducts education, research, public service and related activities principally at its three locations in Urbana-Champaign, Chicago, which includes the Hospital and other healthcare facilities, and Springfield. In addition, the University has a Medical Service Plan for the University’s College of Medicine faculty in Chicago, Rockford and Peoria, which allows the faculty to charge for their professional services. The governing body of the University is The Board of Trustees of the University of Illinois (Board).
As required by U.S. generally accepted accounting principles, as prescribed by the Governmental Accounting Standards Board (GASB), these financial statements present the financial position and financial activities of the University (the primary government) and its component units as well as certain activities and expenses funded by other State agencies on behalf of the University or its employees. The component units discussed below are included in the University’s financial reporting entity (Entity) because of the significance of their financial relationship with the University.
The University Related Organizations (UROs) column in the financial statements includes the financial data of the University’s discretely presented component units. The University of Illinois Foundation (Foundation), the University of Illinois Alumni Alliance (Alumni Alliance), Wolcott, Wood and Taylor, Inc. (WWT), Prairieland Energy, Inc. (Prairieland), Illinois Ventures, LLC (Illinois Ventures), the University of Illinois Research Park, LLC (Research Park) and UI Singapore Research, LLC (Singapore Research) are included in the University’s reporting entity because of the significance of their operational or financial relationship with the University. These component units are discretely presented in a separate column and are legally separate from the University.
The Foundation was formed for the purpose of providing fundraising and other assistance to the University in order to attract private gifts to support the University’s instructional, research and public service activities. In this capacity, the Foundation solicits, receives, holds and administers gifts for the benefit of the University. Complete financial statements for the Foundation may be obtained by writing to the Chief Financial Officer, 400 Harker Hall, 1305 W. Green Street, Urbana, Illinois 61801.
The Alumni Alliance was formed to promote the general welfare of the University and to encourage and stimulate interest among students, former students and others in the University’s programs. In this capacity, the Alumni Alliance offers memberships in the Alumni Alliance to former students, conducts various activities for students and alumni, and publishes periodicals for the benefit of alumni. Complete financial statements for the Alumni Alliance may be obtained by writing to the Chief Financial Officer, Alice Campbell Alumni Center, 601 S. Lincoln Avenue, Urbana, Illinois 61801.
WWT was formed to provide practice management support services and operate as a billing/collection entity for healthcare activities under the laws of the State. Complete financial information may be obtained by writing to the President and CEO, 200 W. Adams, Suite 225, Chicago, Illinois 60606.
Prairieland Energy, Inc. was approved by the Board of Trustees of the University in September 1996 to provide low-cost energy for the benefit of the University and others. Prairieland provides an efficient vehicle for flexible, nimble and real-time participation in wholesale energy markets, resulting in cost savings and other benefits to the University. Complete financial information may be obtained by writing to the Controller, 807 S. Wright Street, Suite 340, Champaign, Illinois 61820.

18 (Continued)
Illinois Ventures exists to facilitate the development of new companies commercializing technology originated or developed by faculty, staff, students and/or alumni of the University and other organizations. The University desires Illinois Ventures to foster technology commercialization and economic development in accordance with the teaching, research and public service missions of the University. Complete financial information may be obtained by writing to the CEO and Managing Director, 2242 W. Harrison, Suite 201, Chicago, Illinois 60612.
Research Park was formed to aid and assist the University and other organizations by establishing and operating a research park with offices located in Champaign, Illinois. Research Park’s jurisdiction extends to oversight of the research park in Urbana-Champaign. This jurisdiction also extends to potential research parks in Illinois where the University has some operating responsibility by statute or contract. The Research Park was designed to promote the development of new companies, which commercialize University technologies and attract established companies to partner with the University in research and development activities and to prepare the workforce for the next generation. Complete financial information may be obtained by writing to the Associate Director of Administration, University of Illinois Research Park, LLC, 60 Hazelwood Drive, Champaign, Illinois 61820.
Singapore Research was formed to organize, develop, hold and operate, through a Singapore entity, a research center in Singapore to encourage and facilitate research, development and commercialization of the intellectual assets of the University and to foster economic development. Complete financial information may be obtained by writing to the Treasurer, UI Singapore Research, LLC, 349 Henry Administration Building, 506 South Wright Street, Urbana, Illinois 61801.
The Foundation, Alumni Alliance, WWT, Prairieland, Illinois Ventures, Research Park and Singapore Research are related organizations as defined under University Guidelines adopted by the State’s Legislative Audit Commission.
The University is a component unit of the State for financial reporting purposes. The financial balances and activities included in these financial statements are, therefore, also included in the State’s comprehensive annual financial report.
Significant Accounting Policies
(a) Financial Statement Presentation and Basis of Accounting
University
The University prepared its financial statements as a Business-Type Activity, as defined by GASB Statement No. 35, Basic Financial Statements – and Management’s Discussion and Analysis – for Public Colleges and Universities, using the economic resources measurement focus and the accrual basis of accounting. Business-Type Activities are those financed in whole or in part by fees charged to external parties for goods and services.
Under the accrual basis, revenues are recorded when earned, and expenses are recorded when a liability is incurred, regardless of the timing of the related cash flows. Grant and contract revenues, which are received or receivable from external sources, are recognized as revenues to the extent of related expenses or satisfaction of eligibility requirements. Advances are classified as unearned revenue. Appropriations made from the State for the benefit of the University are recognized as nonoperating revenues when eligibility requirements are satisfied.
The financial statements include certain prior year comparative information, which has been derived from the University’s 2018 financial statements. Such information does not include all of the information required to constitute a presentation in conformity with U.S. generally accepted accounting principles. Accordingly, such information should be read in conjunction with the University’s financial statements for the year ended June 30, 2018.

19 (Continued)
Certain items in the June 30, 2018 comparative information have been reclassified to correspond to the June 30, 2019 financial statement presentation.
UROs
The financial statements of WWT, Prairieland, Illinois Ventures, Research Park and Singapore Research are prepared using the same presentation and basis of accounting as the University, as described above.
The Foundation and Alumni Alliance are nonprofit organizations that report under FASB standards, including Topic 958. As such, certain revenue recognition criteria and presentation features are different from GASB revenue recognition criteria and presentation features. No modifications have been made to the Foundation or Alumni Alliance financial information in the University's financial reporting entity for these differences. Only certain reclassifications have been made for consistency with the University’s GASB reporting format.
(b) Cash and Cash Equivalents
The Statement of Cash Flows details the change in the cash and cash equivalents balance for the fiscal year. Cash and cash equivalents include bank accounts and investments with original maturities of ninety days or less at the time of purchase. Such investments consist primarily of money market funds.
(c) Inventories
Inventories are stated at the lower of cost or market. Cost is determined principally by the average cost method or the first-in, first-out method, depending on the type of inventory.
(d) Investments
Investments are reported at fair value in accordance with guidelines defined by GASB Statement No. 72. Fair value is determined for the University’s investments based upon a framework described in Note 2(f). The fair values of farm properties held as investments are determined by a periodic appraisal of the property by a certified real estate appraiser. Fair value for investments in certain mutual funds, hedge funds and private equity is determined using net asset values (NAV) as provided by external investment managers. Bank deposits, money market funds, and Illinois public treasurer’s investment pool are recorded at cost.
Changes in fair value during the reporting period are reported as a net increase (decrease) in the fair value of investments. Net investment income includes interest, dividends, and realized gains and losses.
(e) Endowments
For donor-restricted endowments, the Uniform Prudent Management of Institutional Funds Act (UPMIFA), as adopted in Illinois, permits the respective Boards of both the University and the Foundation to appropriate an amount of realized and unrealized endowment appreciation as they determine to be prudent. The University’s policy is to retain the realized and unrealized appreciation (net appreciation) within the endowment pool after spending rule distributions.
University
The University’s endowment pool investment policy follows the total return concept. The focus is to preserve the real value or purchasing power of endowment pool assets and the annual support the assets provide. Distributions are made from the University Endowment Fund to the University entities that benefit from the endowment funds. The endowment spending rule provides for an annual distribution of 4.0% of the two-quarter lagged, six-year moving average market value of fund units.

20 (Continued)
At June 30, 2019, net appreciation of $117,275,000 was available to be spent, of which $90,443,000 was restricted to specific purposes.
URO – Foundation
Interpretation of Relevant Law: The board of directors of the Foundation interprets UPMIFA to require consideration of the following factors, if relevant, in making a determination to appropriate or accumulate donor-restricted endowment funds:
The duration and preservation of the endowment fund The purposes of the institution and the endowment fund General economic conditions The possible effect of inflation or deflation The expected total return from income and the appreciation of investments Other resources of the institution The investment policy of the institution
In accordance with the Foundation’s interpretation of UPMIFA, absent explicit donor stipulations to the contrary, the Foundation shall classify as permanently restricted net assets (restricted – nonexpendable) the original value of the gifts donated to the permanent endowment, but such classification does not limit the expenditures from the endowment fund only to income, interest, dividends, or rents, issues or profits. The portion of the fund’s value spendable annually for the donor-designated purpose is to be determined, from time to time, by the Foundation’s board of directors, acting in good faith, with the care that an ordinarily prudent person in a like position would exercise under similar circumstances, considering the above relevant factors. The Foundation’s Board approved spending was $91,504,000 for fiscal year ended June 30, 2019.
(f) Capital Assets
Capital assets are recorded at cost or, if donated, at acquisition value at the date of a gift. Depreciation and amortization of the capital assets is calculated on a straight-line basis over the estimated useful lives (noted below) of the assets. The University’s policy requires the capitalization of land and collection purchases regardless of cost, equipment over $5,000, software, easements, buildings and improvements over $100,000 and infrastructure over $1,000,000. The University does not capitalize collections, such as works of art or historical treasures, which are held for public exhibition, education or research in furtherance of public service rather than capital gain, unless they were previously capitalized as of June 30, 1999. Proceeds from the sale, exchange or other disposal of any item belonging to a collection must be applied to the acquisition of additional items for the same collection. Estimated useful lives for capital assets are as follows:
Useful life Useful life(in years) (in years)
Buildings: Improvements other than buildings:Shell 50 Site improvements 20 Service systems 25 Infrastructure 25 Fixed equipment 15 Remodeling 25 Moveable equipment 3 – 20
Intangibles:Software 5 – 10 Exhaustible collections 10

21 (Continued)
(g) Deferred Outflows of Resources
Under hedge accounting, the University has determined that the interest rate swap agreements on bonds payable, as hedging derivative instruments, are an effective hedge. Accordingly, changes in the fair values of the interest rate swaps, since being associated with the related outstanding bonds, are reported as deferred outflows of resources on the accompanying Statement of Net Position. Additionally, interest rate swaps reassigned to new debt, after a refunding of debt that the swap was previously hedging, normally have an other than zero fair value upon the reassociation. For swaps with a fair value of other than zero upon reassociation with a hedgeable item, the fair value is amortized as an adjustment to interest expense in a systematic manner.
Losses on refunding of the University’s bonds and certificates of participation are reported as deferred outflow of resources on the accompanying Statement of Net Position. The losses on refundings are amortized over the life of the debt using the straight-line method.
Employer pension and OPEB contributions made in fiscal year 2019 are also reported as deferred outflows of resources.
Deferred Outflow of Resources
Beginning Change in Ending balance Additions Deductions fair value balance
$ 1,407 395 (25) $ 1,777
30,515 10 5,943 24,582 Pension contributions 37,139 36,359 37,139 36,359 OPEB (note 12) 30,643 1,851 5,624 26,870
$ 99,704 38,615 48,706 (25) $ 89,588
Interest rate swap agreementsUnamortized deferred loss on refunding
Total deferred outflow of resources
(In thousands)
(h) Compensated Absences
Accrued compensated absences for University personnel are charged as an operating expense, using the vesting method, based on earned but unused vacation and sick leave days including the University’s share of Medicare taxes.
(i) Premiums
Premiums for bonds and certificates of participation are reported within bonds payable and leaseholds payable, respectively, and are amortized over the life of the debt issue using the straight-line method.
(j) Deferred Inflows of Resources
The University has split-interest agreements where the University is a beneficiary. At the inception of these agreements the University recognizes assets, liabilities and deferred inflows of resources on the accompanying Statement of Net Position.
The difference between the expected and actual OPEB liability is also reported as deferred inflows of resources.

22 (Continued)
Deferred Inflow of Resources
Beginning Change in Ending balance Additions Deductions fair value balance
$ 18,874 1,519 1,069 218 $ 19,542 OPEB (note 12) 327,665 128,808 60,139 396,334
$ 346,539 130,327 61,208 218 $ 415,876
Irrevocable trusts (note 10)
Total deferred inflow of resources
(In thousands)
(k) Net Position
The Entity’s resources are classified into net position categories and reported in the Statement of Net Position. These categories are defined as (a) Net investment in capital assets – capital assets net of accumulated depreciation and related outstanding debt balances attributable to the acquisition, construction, or improvement of those assets; (b) Restricted nonexpendable – net position restricted by externally imposed stipulations; (c) Restricted expendable – net position subject to externally imposed restrictions that can be fulfilled by actions of the Entity pursuant to those stipulations or that expire by the passage of time, and (d) Unrestricted – net position not subject to externally imposed stipulations but may be designated for specific purposes by action of management or the Board. The Entity first applies resources in restricted net position when an expense or outlay is incurred for purposes for which resources in both restricted and unrestricted net positions are available.
(l) Classification of Revenues
The Statement of Revenues, Expenses and Changes in Net Position classifies the Entity’s fiscal year activity as operating and nonoperating. Operating revenues generally result from exchange transactions such as payments received for providing goods and services, including tuition and fees, net of scholarships and fellowships, certain grants and contracts, sales and services of educational activities, hospital, medical service plans, and auxiliary enterprises revenues. Certain revenue sources that the Entity relies on to provide funding for operations including State appropriations, gifts, on-behalf for fringe benefits and investment income are defined by GASB Statement No. 35 as nonoperating revenues. In addition, transactions related to capital and financing activities are components of nonoperating revenues.
In fiscal year 2019, the University designated $20,000,000 of State appropriations for transfer to the University of Illinois Hospital Services Fund, which is a special fund established in the State Treasury pursuant to the State Finance Act, 30 ILCS 105/6z-30. This fund is owned and operated by the Illinois Department of Healthcare and Family Services. It is not part of or a related organization of the University.
(m) Tuition, Scholarships and Fellowships
Scholarships and fellowships of $403,809,000 and $26,037,000 are netted against student tuition and fees and auxiliary enterprises revenues, respectively. Stipends and other payments made directly to students are reported as scholarship and fellowship expense. Graduate and other employment related remissions are included with compensation and benefits and presented in instruction, research and other functional categories of operating expenses. Net tuition and fees, except for summer session, are recognized as revenues as they are assessed. The portion of summer session tuition and fees applicable to the following fiscal year are unearned and recognized in the next fiscal year.

23 (Continued)
(n) Patient Services Revenue – Hospital
With respect to the Hospital, patient service revenue is reported at the estimated net realizable amounts from patients, third-party payors and others for services rendered, including estimated adjustments under reimbursement agreements with third-party payors, some of which are subject to audit by administrating agencies. These adjustments are accrued on an estimated basis and are adjusted in future periods. The Hospital has agreements with third-party payors that provide for payments to the Hospital at amounts different from its established rates. Payment arrangements include prospectively determined rates, discounted charges and per diem payments. Approximately 90% of the Hospital’s net patient service revenues were derived from Medicare, Medicaid and managed care programs for the year ended June 30, 2019. Reimbursement under these programs provided for payments to the Hospital at amounts different from its established rates, based on a specific amount per case, or a contracted price, for rendering services to program beneficiaries. The Hospital records contractual allowances in the current period representing the difference between charges for services rendered and the expected payments under these programs, and adjusts them in future periods as final settlements through cost reports or other means are determined. For the year ended June 30, 2019, the contractual allowances totaled $1,942,349,000.
The policy of the Hospital is to treat patients in immediate need of medical services without regard to their ability to pay for such services. The Hospital provides care without charge or at amounts less than its established rates to patients who meet the criteria of its charity care policy. This policy defines charity care and provides guidelines for assessing a patient’s ability to pay. Eligibility is based on a patient qualification, financial resources and service criteria. Because the Hospital does not pursue collection of amounts determined to be charity care, they are not reported as revenue.
The Hospital maintains records to identify and monitor the level of charity care provided. These records include the amount of estimated costs for services rendered and supplies furnished under its charity care policy. The estimated cost of charity care using the Hospital’s cost-to-charge ratio was $18,283,000 for fiscal year 2019. The ratio of costs to charges is calculated based on the Hospital’s total operating expenses. Unreimbursed costs of providing care to Medicare and Medicaid patients are not included as charity care.
(o) Classification of Expenses
The majority of the Entity’s expenses are exchange transactions, which GASB defines as operating expenses for financial statement presentation. Nonoperating expenses include transfers of state appropriations and capital financing costs.
(p) Employment Contracts
Employment contracts for certain academic personnel provide for twelve monthly salary payments, although the contracted services are rendered during a nine-month period. The liability for those employees who have completed their contracted services, but have not yet received final payment, was $68,877,000 at June 30, 2019 and is recorded in the accompanying financial statements as accrued payroll. This amount will be paid from revenues to be recognized in fiscal year 2020 rather than from the unrestricted net position available at June 30, 2019.

24 (Continued)
(q) On-behalf for fringe benefits
In accordance with GASB Statement No. 24, Accounting and Financial Reporting for Certain Grants and Other Financial Assistance, the University has reported outside sources of financial assistance provided by the State on behalf of the University during the year ended June 30, 2019, as described below.
Substantially all active employees participate in group insurance plans provided by the State and administered by CMS, primary providing healthcare benefits. In order to fund SEGIP’s pay-as-you-go obligations for both current employees and retirees, State statutes require contributions based upon total employee compensation paid from any State fund, including the University’s state appropriation funds. Additionally, the University shall not be required to make contributions for employees who are fully compensated from the University’s Income Fund and auxiliary enterprises. Pursuant to a long-standing State policy, the State’s General Fund covers the contributions for employees who are fully compensated from the University’s Income Fund and auxiliary enterprises. This relationship may be modified through the enactment of a Public Act by the State’s highest level of decision-making authority exercised by the Governor and the General Assembly pursuant to the State’s Constitution.
During the year ended June 30, 2019, total estimated group insurance contributions for the University’s employees paid from the University’s Income Fund and auxiliary enterprises were $275,360,000. The University made a voluntary appropriation repayment from either its State appropriation or locally-held resources that was not considered a contribution of $17,864,000 to help offset the amount the State needed to provide for current employees under the situation described in the preceding paragraph. As such, the State contributed the estimated remaining balance of $257,496,000 on-behalf of the University to meet this obligation for current employees.
As the University is not legally responsible to pay for the on-behalf support provided by the State, the University recognizes non-operating revenues and operating expenses allocated to the related function performed by the employees within the University’s financial statements for its current employees’ participation in group insurance.
(r) Pensions
For purposes of measuring the net pension liability, deferred outflows and inflows of resources related to pensions, and pension expense, information about the SURS plan net position and additions to/deductions from the SURS’ plan net position has been determined on the same basis as they are reported by the SURS. For this purpose, benefit payments (including refunds of employee contributions) are recognized when due and payable in accordance with the benefit terms. Investments are reported at fair value.
For the financial reporting purposes, the State and its public universities and community colleges are under a special funding situation. A special funding situation exists when a non-employer entity (the State) is legally responsible for making contributions directly to a pension plan that is used to provide pensions to the employees of another entity (the University) and the non-employer (the State) is the only entity with a legal obligation to make contributions directly to a pension plan. The University recognizes its proportionate share of the State’s pension expense relative to the University’s employees as non-operating revenue and pension expense, with the expense further allocated to the related function performed by the employees.

25 (Continued)
(s) OPEB
The State Employees Group Insurance Act of 1971 (Act) (5 ILCS 375) authorizes the State Employees Group Insurance Program (SEGIP), which includes activity for both active employees and retirees, to provide health, dental, vision and life insurance benefits as a single-employer defined benefit OPEB plan not administered as a trust. Substantially all State and State public Universities’ employees become eligible for these OPEB plan benefits when they become annuitants of one of the State sponsored pension plans. CMS administers these benefits for the annuitants with the assistance of the public retirement systems sponsored by the State, including the General Assembly Retirement System (GARS), Judges Retirement System (JRS), State Employees Retirement System (SERS), Teachers’ Retirement System (TRS), and SURS.
In order to fund SEGIP’s pay-as-you-go obligations for both current employees and retirees, the Act (5 ILCS 375/11) requires contributions based upon total employee compensation paid from any State fund, including the University’s State Appropriations Funds. Additionally, the University shall not be required to make contributions for employees who are fully compensated from University’s Income Fund and auxiliary enterprises. Pursuant to a long-standing State policy, the State’s General Fund covers the contributions for employees who are fully compensated from the University’s Income Fund and auxiliary enterprises. This relationship may be modified through the enactment of a Public Act by the State’s highest level of decision-making authority exercised by the Governor and the General Assembly pursuant to the State’s Constitution.
Given the preceding environment, the University has two separate components of OPEB administered within SEGIP. The (1) State of Illinois and its public universities are under a special funding situation for employees who are not paid from trust, federal, and other similar funds, while (2) the University is responsible for OPEB employer contributions when University employees are paid from trust, federal, and other similar funds.
Special Funding Situation Portion of OPEB A special funding situation exists when a non-employer entity (the State) is legally responsible for making contributions directly to an OPEB plan that is used to provide OPEB to the employees of another entity (the University) and the non-employer (the State) is the only entity with a legal obligation to make contributions directly to an OPEB plan.
During the OPEB measurement period ended June 30, 2018, the University made a voluntary appropriation repayment from either its State appropriation or locally-held resources that was not considered a contribution of $11,189,000 to help offset the amount the State needed to provide for retirees under the special funding situation described in the preceding paragraph.
The University recognizes the proportionate share of the State’s OPEB expense relative to the University’s employees as non-operating revenue and OPEB expense, with the expense further allocated to the related function performed by the employees.
University’s Portion of OPEB
The University reports a liability, expense allocated to the related function performed by the employees, and related deferred inflows and outflows of resources for OPEB based on the University’s proportionate share of amounts paid to SEGIP pursuant to the Act for its employees paid from trust, federal, and other funds compared to the collective amounts paid to SEGIP pursuant to the Act. The collective amounts paid to SEGIP pursuant to the Act includes (1) payments from State agencies for State employees, (2) the amount calculated by CMS to represent the amount paid by the General Fund related to the special funding situation, (3) the total voluntary appropriation repayment from all of the universities, and (4) the total of all payments from the universities for employees paid from trust,
26 (Continued)
federal, and other funds. This methodology has been determined by the State to be the best estimate of how future OPEB payments will be determined. Deferred inflows and outflows of resources are recognized in OPEB expense at the beginning of the current period, using a systematic and rational method over a closed period, equal to the average expected remaining service lives of all employees, either active or inactive, provided with OPEB through SEGIP, determined as of the beginning of the measurement period.
(t) Use of Estimates
The preparation of financial statements in conformity with U.S. generally accepted accounting principles requires management to make estimates and assumptions that affect the reported amounts of assets and liabilities and disclosure of contingent assets and liabilities at the date of the financial statements and the reported amounts of revenues and expenses during the reported period. Actual results could differ from those estimates.
(u) New Accounting Pronouncements
The University adopted the provisions of GASB Statement No. 83, Certain Asset Retirement Obligations, which was effective for periods beginning after June 15, 2018. This statement establishes criteria for determining the timing and pattern of recognition of a liability and a corresponding deferred outflow of resources for asset retirement obligations (AROs). This Statement requires the measurement of an ARO to be based on the best estimate of the current value of outlays expected to be incurred with subsequent adjustments for the effects of general inflation or deflation at least annually. In addition, it requires a government to evaluate all relevant factors at least annually to determine whether the effects of one or more of the factors are expected to significantly change the estimated asset retirement outlays. This Statement also requires disclosure of information about the nature of a government’s AROs, the methods and assumptions used for the estimates of the liabilities, and the estimated remaining useful life of the associated tangible capital asset. Implementation of this pronouncement did not impact the University’s financial statements.
The University adopted the provisions of GASB Statement No. 88, Certain Disclosures Related to Debt, including Direct Borrowings and Direct Placements, which was effective for periods beginning after June 15, 2018. The primary objective of this Statement is to improve the information that is disclosed in notes to financial statements related to debt, including direct borrowings and direct placements. It also clarifies which liabilities should be included when disclosing information related to debt. This Statement requires that additional essential information related to debt be disclosed in notes to the financial statements, including unused lines of credit; assets pledged as collateral for debt; and terms specified in debt agreements related to significant events of default with finance-related consequences, significant termination events with finance-related consequences, and significant subjective acceleration clauses. Implementation of this pronouncement required additional disclosures related to the University’s long-term debt.
(2) Cash, Cash Equivalents and Investments
The carrying amount of the University’s cash totaled $9,566,000 at June 30, 2019. The June 30, 2019 total bank account balances for the University aggregated $22,843,000 all of which was covered by federal depository insurance or by collateral held by an agent in the University’s name.
The Board follows the State of Illinois Uniform Prudent Management of Institutional Funds Act, 760 ILCS 51/1-11, when managing the University’s investments. The Board fulfills its fiduciary responsibility for the management of investments, including endowment farm real estate, by adopting policies to maximize investment return with a prudent level of risk.

27 (Continued)
Nearly all of the University’s investments are managed by external professional investment managers, who have full discretion to manage their portfolios subject to investment policy and manager guidelines established by the University, and in the case of mutual funds and other commingled vehicles, in accordance with the applicable prospectus or limited partnership agreement.
The following details the carrying value of the University’s cash, cash equivalents and investments as of June 30, 2019:
University Cash, Cash Equivalents and Investments(In thousands)
U.S. Treasury bonds and bills $ 459,159 U.S. government agencies 178,988 International government bonds and governmental agencies 4,026 Nongovernment mortgage-backed securities 80,714 Asset backed securities 366,473 Corporate bonds 1,051,368 Commercial paper 43,858 Municipal bonds 21,641 Bond funds 3,805 Money market funds 691,845 Illinois public treasurer’s investment pool 64,811
Subtotal before cash deposits, equities and other investments 2,966,688
Equities 27,009 Equity funds 359,958 Hedge funds 47,685 Private equity 57,989 Farm properties 102,173 Real estate 40,267 Cash deposits (net of outstanding checks) 9,566
Total $ 3,611,335
(a) Interest Rate Risk
Interest rate risk is the risk that changes in interest rates will adversely affect the fair value of an investment. In accordance with its investment policy, the University employs multiple investment managers, of which each has specific maturity assignments related to the operating funds. The funds are structured with different layers of liquidity. Funds expected to be used within one year are invested using the Barclay’s Capital 90-Day and Bank of America Merrill Lynch 12 month Treasury Bill Index as performance benchmarks. Core operating funds are invested in longer maturity investments. Core operating funds investment managers’ performance benchmarks are the Barclays Capital one-year to three-year Government Bond Index, the Barclays Capital one-year to three-year Government Credit Bond Index, the Barclays Capital Intermediate Government Credit Bond Index and the Barclays Capital Intermediate Aggregate Bond Index.

28 (Continued)
The University’s investment maturities at June 30, 2019 are illustrated below:
University Investment Maturities(In thousands)
Less than Greater thanTotal 1 year 1 - 5 years 5 - 10 years 10 years
U.S. Treasury bonds and bills $ 459,159 92,802 287,409 58,040 20,908 U.S. government agencies 178,988 9,479 15,939 13,732 139,838 International government bonds
and governmental agencies 4,026 2,074 1,530 422 Nongovernment mortgage-
backed securities 80,714 80,714 Asset backed securities 366,473 2,057 314,213 27,374 22,829 Corporate bonds 1,051,368 260,379 689,004 84,208 17,777 Commercial paper 43,858 43,858 Municipal bonds 21,641 4,904 8,571 4,301 3,865 Bond funds 3,805 1,099 737 1,969 Money market funds 691,845 691,845 Illinois public treasurer’s
investment pool 64,811 64,811
Total $ 2,966,688 1,171,234 1,317,947 191,154 286,353
At June 30, 2019, the University’s operating funds pool portfolio had an effective duration of 1.4 years.
(b) Credit Risk
Credit risk is the risk that an issuer or other counterparty to an investment will not fulfill its obligations. The University’s investment policy requires that the University’s short-term operating funds be invested in fixed income securities and other short-term fixed income instruments (e.g., money markets). Fixed income securities shall be rated investment grade or better by one or more nationally recognized statistical rating organizations at purchase. Unrated securities are not allowed unless specifically permitted by an individual manager’s guidelines. Securities that fall below the stated minimum credit requirements subsequent to initial purchase may be held at the manager’s discretion.
The University reports the credit ratings of fixed income securities and short term instruments using Standard and Poor’s and Moody’s ratings. Securities with split ratings or with a different rating assignment are disclosed using the rating indicative of the greatest degree of risk.

29 (Continued)
The University’s investment quality ratings at June 30, 2019 are illustrated below:
University Investments Quality Ratings(In thousands)
LessAA/Aa/ than BB or
Total AAA/Aaa TSY/AGY[1] A/A [2] BBB/Baa BB/Ba not rated
U.S. Treasury bonds and bills $ 459,159 459,159 U.S. government agencies 178,988 178,988 International government bonds
and governmental agencies 4,026 1,712 982 204 1,128 Nongovernment mortgage-
backed securities 80,714 70,838 2,996 334 6,546 Asset backed securities 366,473 351,825 10,020 8 511 4,109 Corporate bonds 1,051,368 8,603 127,035 539,347 364,649 11,062 672 Commercial paper 43,858 43,858 Municipal bonds 21,641 558 15,371 4,053 1,659 Bond funds 3,805 655 1,626 694 717 9 104 Money market funds 691,845 691,845 Illinois public treasurer’s
investment pool 64,811 64,811
Total $ 2,966,688 1,190,847 796,177 588,164 368,998 11,071 11,431
[1] TSY (U.S. Treasury Securities) & AGY (U.S. Agency Securities) is a reporting convention used by the University’s custodian to identify investments that have not received individual security ratings. These securities have an explicit or implicit guarantee by the U.S. government which has been rated AA+ by Standard and Poor’s and Aaa by Moody’s.Short term Standard and Poor's ratings of A-1+ are placed in this category.
[2] Short term Standard and Poor's ratings of A-1 and A-2 and Moody’s short-term ratings of P1 and P2 are placedin this category.
(c) Custodial Credit Risk
Custodial credit risk is the risk that in the event of the failure of the counterparty, the University will not be able to recover the value of its investments or collateral securities that are in the possession of an outside party. Exposure to custodial credit risk relates to investment securities that are held by someone other than the University and are not registered in the University’s name. The University investment policy does not limit the value of investments that may be held by an outside party. At June 30, 2019, the University’s investments were not subject to custodial credit risk.
(d) Concentration of Credit Risk
Concentration of credit risk is the risk of loss attributed to the magnitude of the University’s investment in a single issuer. The University’s investment policy provides that the total operating funds portfolio will be broadly diversified across securities in a manner that is consistent with fiduciary standards of diversification. Issuer concentrations are limited to 5% per issuer of the total market value of the portfolio at the time of purchase, or in the case of securitized investments (e.g., mortgage-backed securities), concentration is limited to an individual issuance trust (e.g., pooled receivables). These concentration limits do not apply to investments in pooled investment products, tri-party repurchase agreements or obligations of, or issues guaranteed by, the U.S. Treasury, U.S. agencies or U.S. government sponsored enterprises.
As of June 30, 2019, not more than 5% of the University’s total investments were invested in securities of any one issuer, excluding pooled investment products, tri-party repurchase agreements or obligations of, or issues guaranteed by, the U.S. Treasury, U.S. agencies or U.S. government sponsored enterprises.

30 (Continued)
(e) Foreign Currency Risk
Foreign currency risk is the risk that changes in exchange rates will adversely affect the fair value of an investment or deposit. The University’s operating fund investments generally are not exposed to foreign currency risk. The University does not have an overarching policy related to foreign currency risk; however, under each investment manager’s respective fund agreement, the portfolio’s foreign currency exposure may be unhedged or hedged back into U.S. dollars.
The University invests in non-U.S. developed and emerging markets through commingled funds invested in non-U.S. equities, fixed income, private equity and absolute return strategies. As these funds are reported in U.S. dollars, both price changes of the underlying securities in local markets and changes to the value of local currencies relative to the U.S. dollar are embedded in investment returns.
(f) Investments and Fair Value Measurements
GASB standards established a framework for measuring fair value. That framework provides a fair value hierarchy that prioritizes the inputs to valuation techniques used to measure fair value. The hierarchy gives the highest priority to unadjusted quoted prices in active markets for identical assets or liabilities (Level 1 measurements) and the lowest priority to unobservable inputs (Level 3 measurements). The fair value hierarchy is as follows: Level 1 - Quoted prices (unadjusted) for identical assets or liabilities in active markets that the University has the ability to access as of the measurement date. Level 1 inputs would also include investments valued at prices in active markets that the University has access to where transactions occur with sufficient frequency and volume to provide reliable pricing information. Level 2 - Significant other observable inputs other than Level 1 prices such as quoted prices for similar assets or liabilities; quoted prices in markets that are not active, or other inputs that are observable or can be corroborated by observable market data.
Level 3 - Significant unobservable inputs that reflect a reporting entity’s own assumptions about what market participants would use in pricing an asset or liability. A description of the valuation methodologies used for assets and liabilities measured at fair value, as well as the general classification of such instruments pursuant to the valuation hierarchy, is set forth below. Investments may be classified as Level 1 when the values are based upon unadjusted quoted prices in active markets for identical assets and generally include active listed equities. Publicly-traded investments that have no or insignificant restrictions are classified in Level 1 of the fair value hierarchy. Level 1 securities would include bond funds, equity funds and exchange traded equities. Investments may be classified as Level 2 when the values include inputs that are directly observable for an asset (including quoted prices for similar assets), as well as inputs that are not directly observable for the asset. These inputs are derived principally from or corroborated by observable market data through correlation or by other means (market corroborated inputs). The concept of market-corroborated inputs is intended to incorporate observable market data (such as interest rates and yield curves that are observable at commonly quoted intervals) based upon an assessment of factors relevant to the asset or liability. Level 2 securities include US Treasury bonds and bills, US government agencies, international government bonds and agencies, nongovernment mortgage-backed securities, asset backed securities, corporate bonds, commercial paper, and municipal bonds.

31 (Continued)
Investments may be classified as Level 3 when the values include inputs that are unobservable and Level 1 and Level 2 inputs are not available. The values are based upon the best information available under the circumstances and may include management’s own data. Level 3 securities include equities and farm properties. There have been no changes in valuation techniques used for any assets measured at fair value during the year ended June 30, 2019. The following table summarizes assets measured at fair value as of June 30, 2019, segregated by the level of the valuation inputs within the fair value hierarchy utilized to measure fair value:
University Fair Value Measurements as of June 30, 2019(In thousands)
Quoted prices Significant other Quoted pricesin active observable unobservablemarkets inputs inputs
Total (Level 1) (Level 2) (Level 3)
U.S. Treasury bonds and bills $ 459,159 459,159 U.S. government agencies 178,988 178,988 International government bonds
and governmental agencies 4,026 4,026 Nongovernment mortgage-
backed securities 80,714 80,714 Asset backed securities 366,473 366,473 Corporate bonds 1,051,368 1,051,368 Commercial paper 43,858 43,858 Municipal bonds 21,641 21,641 Bond funds 3,805 3,805 Equities 27,009 26,910 99 Equity funds 8,971 8,971 Farm properties 102,173 102,173
Total subject to fair value hierarchy 2,348,185 39,686 2,206,227 102,272
Investments measured at the NAVEquity funds 350,987 Hedge funds 47,685 Private equity 57,989 Real estate 40,267
Total investments measured at NAV 496,928
Investments measured at costMoney market funds 691,845 Cash deposits 9,566 Illinois public treasurer's investment pool 64,811
Total investments measured at cost 766,222
Total cash, cash equivalents and investments $ 3,611,335

32 (Continued)
The following table sets forth additional disclosure of the University’s investments whose fair value is estimated using NAV per share (or its equivalent) as of June 30, 2019:
Unfunded Redemption Redemption
Fair value commitment frequency notice period
(In thousands)Investments:
Equity funds (A) 350,987 (A) (A)
Hedge funds (B) 47,685 (B) (B)
Private equity (C) 57,989 36,912 (C) (C)
Real estate (D) 40,267 9,933 (D) (D)
$ 496,928 $ 46,845
(A) The funds in this category invest in marketable equities that are exchange traded in the United
States of America (USA) and in countries outside of the USA. These funds can be redeemed with same business day to two business days redemption notification requirement determined by the managers. Settlement may take up to seven business days. The fund values of these investments have been estimated using the NAV per share provided by the fund manager.
(B) The funds in this category are generally not restricted in the types of securities in which they can invest. They may invest in limited partnership vehicles or directly in equity, fixed income and derivative instruments to achieve a stated investment objective. These funds can be redeemed monthly (subject to a redemption charge) or quarterly depending on the partnership agreement within redemption notice periods of 30 to 60 days. The fund values of these investments have been estimated using the NAV per share provided by the fund manager.
(C) The funds in this category invest in the following types of investments in the USA and outside of the USA: venture capital partnerships, buyout partnerships, mezzanine/subordinated debt partnerships, restructuring/distressed debt partnerships, special situation partnerships, and directly in portfolio companies. These investments cannot be redeemed during the life of the partnership; however they may be able to be transferred to another eligible investor. Distributions will be received as the underlying investments of the funds are liquidated over time. The fair value of this investment has been estimated using the NAV provided by the fund manager and an adjustment determined by management for the time period between the dates of the last available NAV and June 30, 2019.
(D) The funds in this category invest in real estate. Subject to general partner approval and available cash, these funds can be redeemed quarterly with up to a 3 month notice period. Distributions of operating cash flow are paid out on a quarterly basis as determined by the general partner. The fair value of this investment has been estimated using the NAV provided by the fund manager and an adjustment determined by management for the time period between the dates of the last available NAV and June 30, 2019.
(g) URO – Foundation Investments
As the investments of the University’s URO-Foundation are considered material to the Entity’s financial statements taken as a whole, the following disclosures are made:
The Foundation financial statements follow FASB standards; therefore, the required disclosures, within the Entity’s statements, for the Foundation investments differ from GASB requirements.
FASB standards have established a framework for measuring fair value. That framework provides a fair value hierarchy that prioritizes the inputs to valuation techniques used to measure fair value. The

33 (Continued)
hierarchy gives the highest priority to unadjusted quoted prices in active markets for identical assets or liabilities (Level 1 measurements) and the lowest priority to unobservable inputs (Level 3 measurements). The fair value hierarchy is as follows:
Level 1 – Quoted prices (unadjusted) for identical assets or liabilities in active markets that the Foundation has the ability to access as of the measurement date. Level 1 inputs would also include investments valued at prices in active markets that the Foundation has access to where transactions occur with sufficient frequency and volume to provide reliable pricing information.
Level 2 – Significant other observable inputs other than Level 1 prices such as quoted prices for similar assets or liabilities; quoted prices in markets that are not active; or other inputs that are observable or can be corroborated by observable market data.
Level 3 – Significant unobservable inputs that reflect a reporting entity’s own assumptions about the assumptions that market participants would use in pricing an asset or liability.
A description of the valuation methodologies used for assets and liabilities measured at fair value, as well as the general classification of such instruments pursuant to the valuation hierarchy, is set forth below.
Investments: Where quoted prices are available in an active market, securities are classified within Level 1 of the valuation hierarchy. Level 1 securities would include highly liquid government bonds, exchange-traded equities and mutual funds.
If quoted market prices are not available, then the fair values are estimated by using pricing models, quoted prices of securities with similar characteristics and other valuation methodologies. Level 2 securities would include mortgage-backed agency securities, certain corporate securities and other certain securities. These securities are valued primarily through a multi-dimensional relational model including standard inputs such as benchmark yields, reported trades, broker/dealer quotes, issuer spreads, two-sided markets, benchmark securities, offers and reference data.
In certain cases where there is limited activity or less transparency around inputs to the valuation, including alternative investments, securities are classified within Level 3 of the valuation hierarchy and may include equity and/or debt securities issued by private entities. Level 3 investments include direct private investments and co-investments using performance multiples applicable to the investment’s industry, determined through the use of a market-based approach, which utilizes comparable companies’ data and equity mutual funds that have underlying marketable securities but have significant redemption restrictions.
Farms: The fair market value of the Foundation’s farms is determined by a contracted professional agricultural services company. The company employs the use of several inputs in determining a farm’s fair market value. Quarterly and annual publications by the federal government, professional farm managers, and rural appraisers that discuss current farm values, lease trends, and credit conditions are used as one input. The company also uses comparative sales data for farmland in the area surrounding each specific farm, assembled from in-house real estate transactions, county assessor data, and other local data sources. These inputs serve as benchmarks and each farm is then evaluated based on soil productivity, drainage quality, topography, and other physical characteristics to determine the fair market value.
Beneficial interest in trusts and trusts held by others: The values of the beneficial interest in trusts are derived from the underlying investments of the trusts. The value of those investments is determined in the same manner as investments described above. The value of trusts held by others is based on the Foundation owning an interest in trust and not the underlying investments. The estimated future value of that interest in the trust is based on management’s estimate of the trusts’ expected performance

34 (Continued)
which is then present valued back to the date of the financial statements based on life expectancy factors published by the Internal Revenue Service.
The following table summarizes assets measured at fair value on a recurring basis as of June 30, 2019, segregated by the level of the valuation inputs within the fair value hierarchy utilized to measure fair value:
URO – Foundation Fair Value Measurements as of June 30, 2019(In thousands)
Fair value Level 1 Level 2 Level 3
Cash surrender value of life insurance $ 6,020 6,020 Common stock:
Domestic 52,135 52,135 International 13,395 13,395
Farms 61,425 61,425 International government bonds 2,362 2,362 International index linked government bonds 37,921 37,921 Money market mutual funds 52,618 52,618 Mutual Funds:
Blended, Domestic 10,554 10,554 Blended, International 50 50 Bond 22,726 22,726 Equity, Domestic 36,199 36,199 Equity, International 59,603 59,603
Partnerships - Non US developed marketsequity 92,903 92,903
Private equity funds 133,905 133,905 Private real estate funds 29,568 29,568 U.S. treasury bonds and bills 2,682 2,682 U.S. index linked government bonds 22,083 22,083 Variable annuity contract 3,444 3,444 Beneficial interest in trusts 52,758 52,758 Trusts held by others 21,863 21,863
$ 714,214 247,280 129,917 337,017
There have been no changes in valuation techniques used for any assets measured at fair value during the year ended June 30, 2019. The investments above exclude $2,397,000 of real estate that is carried at cost, $12,817,000 of private equities and other assets carried at cost, and $1,472,224,000 of investments where values are based on NAV using the practical expedient. The Foundation’s level 3 investments have been valued based on unadjusted NAV (or equivalent) of investments in private investment companies or unadjusted account statement balances as reported by insurance companies or trustees. As a result, there were no unobservable inputs that have been internally developed by the Foundation in determining the fair values of its investments at June 30, 2019. During the year ended June 30, 2019 the Foundation did not have any transfers of assets between any levels of the fair value hierarchy.

35 (Continued)
The following table presents additional information about investments measured at fair value on a recurring basis for which the URO – Foundation has utilized Level 3 inputs to determine fair value:
(In thousands)
Purchases Sales or additions or deductions
Other investments $ $ (4) Private equity funds 27,490 (25,702) Private real estate 15,999 (1,637) Trusts held by others 5,954 (668) Cash surrender value of life insurance 12 (472)
Total $ 49,455 $ (28,483)
as of June 30, 2019
URO - Foundation Significant Unobservable Inputs (Level 3)
The Foundation invests in alternative investment funds including limited partnerships, private capital and private real estate funds. The fair values of these investments are valued utilizing the NAV, as a practical expedient, provided by the underlying private investment companies when the NAVs of the investments are determined using a measurement basis consistent with U.S. GAAP for investment companies. The Foundation may only utilize the practical expedient if the investment does not have a readily determinable fair value and the investee is an investment company within the scope of ASC Topic 946, Financial Services – Investment Companies.

36 (Continued)
The following table sets forth the Foundation’s investments whose fair value is estimated using NAV per share (or its equivalent) as of June 30, 2019:
URO – Foundation Investments, Fair Value Estimated Using NAV (or its equivalent)
(In thousands)
Unfunded Redemption
Fair value commitment Redemption frequency notice period
Investments:
Credit (A) $ 228,198daily, monthly, quarterly, or
annually **/*** 5 to 90 days
Developed markets - non
U.S. equity (B) 111,836 5 to 90 days
Emerging markets (C) 134,826daily, monthly, quarterly, or
annually *** 5 to 90 days
Global bonds (D) 133,411daily, monthly, quarterly, or
annually 5 to 90 days
Global equity (E) 274,432daily, monthly, quarterly, or
annually *** 5 to 90 days
Natural resources (F) 27,008daily, monthly, quarterly, or
annually 5 to 90 daysPrivate credit (G) 64,757 31,937 not eligible* N/APrivate equity -
healthcare (H) 37,602 11,750 not eligible* N/APrivate equity - global
growth (I) 64,779 21,456 not eligible* N/APrivate equity - venture
capital (J) 21,975 23,298 not eligible* N/APrivate natural
resources (K) 80,234 39,214 not eligible* N/AReal estate (L) 72,930 40,907 not eligible* N/A
U.S. equity (M) 220,236daily, monthly, quarterly, or
annually 5 to 90 days
$ 1,472,224 $ 168,562
daily, monthly, quarterly, or annually
* In the case of private funds, capital is returned as monetization events occur which may be infrequent in nature and the timing is not known. Generally, capital is committed to a partnership for a period of up to 10 years with the ability of the general partner to extend the life of the fund one to three additional years. Generally in the early years of a fund’s life, the general partner, in order to facilitate its funding of investments, will call capital from the limited partners up to the amount of its commitment. As of June 30, 2019, there were $193,562,000 of unfunded commitments relating to private fund investments. The unfunded commitments at June 30, 2019 included $25,000,000 in commitments to funds that have not called any capital as of June 30, 2019 and therefore do not appear in the balances on the Statement of Net Position, Statement of Revenues, Expenses, and Changes in Net Position, or elsewhere in the notes. ** There are certain investments with fair value of $26,606,000 in the above category that cannot be redeemed until June 30, 2020 – after which can be redeemed monthly with 90 day notice. *** There are certain investments in the above categories for which redemption has been requested and will occur during fiscal year 2020. The fair value of the redemption requests at June 30, 2019 total $121,803,000.

37 (Continued)
(A) This category includes investments with both long and short positions in both debt and equity related to leveraged or distressed companies, residential mortgage backed securities, risk arbitrage and financial instruments that are subject to legal or contractual restrictions. These investments include both U.S. and Non-U.S. securities/companies.
(B) This category includes investments with both long and short positions in equity or equity-related securities primarily in Western Europe.
(C) This category includes investments with both long and short positions in equity or equity-related securities in global emerging markets including Latin America and Asia.
(D) This category includes investments in primarily debt or debt-like securities that are globally diversified.
(E) This category includes investments with both long and short positions in equity or equity-related securities listed or traded on an exchange or regulated market on a global basis.
(F) This category includes investments with both long and short positions in both debt and equity or related securities in energy, gas, mining and oil fields. These investments include both public and private companies.
(G) This category includes investment positions in both distressed debt and equity securities and other event driven investments such as broken merger or acquisition deals. These investments include both U.S. and Non-U.S. securities/companies.
(H) This category includes investments in private equity in the healthcare industry.
(I) This category includes investments in private equity within growth sectors around the globe including China, the Nordic Region and Sub-Saharan Africa.
(J) This category includes investments in venture capital private equity.
(K) This category includes investments in both debt and equity positions in the sectors of agriculture, oil and gas exploration and power, utility and energy infrastructure.
(L) This category includes investments in both debt and equity positions in real estate and real estate related securities and businesses.
(M) This category includes investments with both long and short positions in equity or equity-related securities in the U.S. in a range of industries including banking and healthcare.
All URO – Foundation investments are considered noncurrent assets.

38 (Continued)
(3) Accounts, Notes and Pledges Receivable
The University provides allowances for uncollectible accounts and notes receivable based upon management’s best estimate considering type, age, collection history of receivables and any other factors as considered appropriate. Accounts and notes receivable are reported net of allowances at June 30, 2019.
The composition of accounts receivable and notes and pledges receivable at June 30, 2019 is summarized as follows:
University Accounts Receivable, Net of Allowance(In thousands)
Gross Allowance for Netreceivables uncollectible receivables
Receivables from sponsoring agencies $ 183,159 (2,521) 180,638 Hospital and other medical activities 331,371 (178,433) 152,938 Student tuition and fees 58,266 (21,884) 36,382 Auxiliaries 16,751 (6,028) 10,723 Medical service plan 86,030 (27,921) 58,109 Educational activities 62,516 (13,171) 49,345 Other 24,049 (303) 23,746
Total $ 762,142 (250,261) 511,881
Notes and Pledges Receivable(In thousands)
Student notes receivable – University:
Student notes outstanding - Perkins loan program* $ 24,485 Student notes outstanding - other programs 29,522 Allowance for uncollectible loans (2,969)
Total student notes receivable, net $ 51,038
* Perkins loan program expired on September 30, 2017. The University recorded a long-term obligation to recognize the federal contribution to the program that will be paid backas loans are paid off.
Gift pledges receivable, URO – Foundation: $ 334,554 Less:
Allowance for doubtful pledges (18,000) Present value discount (6,554)
Total gift pledges outstanding, net $ 310,000
(4) Capital Assets
Net interest cost incurred on borrowed funds during the period of construction of capital assets is capitalized as a component of the cost of acquiring those assets. Net interest of $3,360,000 was capitalized during the year ended June 30, 2019.

39 (Continued)
Capital assets activity during the year ended June 30, 2019 is summarized as follows:
University Capital Assets(In thousands)
Beginning Endingbalance Additions Retirements Transfers balance
Nondepreciable capital assets:Land $ 138,374 $ 138,374 Construction in progress 267,032 248,440 (179,923) 335,549 Inexhaustible collections 24,121 910 (78) 24,953
Total nondepreciablecapital assets 429,527 249,350 (78) (179,923) 498,876
Depreciable capital assets:Buildings 4,646,886 (1,070) 146,862 4,792,678 Improvements and
infrastructure 737,788 22,225 760,013 Equipment 1,289,299 88,754 (89,562) 7,093 1,295,584 Software 196,398 3,743 200,141 Exhaustible collections 658,561 22,381 (2,975) 677,967
Total depreciable and amortizablecapital assets 7,528,932 111,135 (93,607) 179,923 7,726,383
Less accumulated depreciation and amortization:Buildings 1,927,848 123,513 (985) 2,050,376 Improvements and
infrastructure 490,741 23,572 514,313 Equipment 1,054,140 68,333 (85,386) 1,037,087 Software 180,400 5,146 185,546 Exhaustible collections 544,037 23,621 (2,975) 564,683
Total accumulateddepreciation and amortization 4,197,166 244,185 (89,346) — 4,352,005
Total net depreciablecapital assets 3,331,766 (133,050) (4,261) 179,923 3,374,378
Total $ 3,761,293 116,300 (4,339) — $ 3,873,254
(5) Accrued Self-Insurance and Loss Contingency
The University’s accrued self-insurance liability of $242,048,000, as of June 30, 2019 covers hospital patient liability; hospital and medical professional liability; estimated general and contract liability, and workers’ compensation liability related to employees paid from local funds. The accrued self-insurance liability was discounted at rates of 2% to 4.5% at June 30, 2019. Amounts increasing the accrued self-insurance liability are charged as expenses based upon estimates made by actuaries and the University’s risk management division. An additional workers’ compensation self-insurance liability of $20,778,000 at June 30, 2019 is included in the University’s accounts payable. These claims will be paid in the year in which the claims are finalized, rather than from unrestricted net position as of June 30, 2019.

40 (Continued)
The accrued self-insurance liability includes $167,793,000 at June 30, 2019 for the currently estimated ultimate cost of uninsured medical malpractice liabilities. Ultimate cost consists of amounts estimated by the University’s risk management division and independent actuaries for asserted claims, unasserted claims arising from reported incidents, expected litigation expenses and amounts determined by actuaries using relevant industry data and hospital specific data to cover projected losses for claims incurred but not reported. Because the amounts accrued are estimates, the aggregate claims actually incurred could differ significantly from the accrued self-insurance liability at June 30, 2019. Changes in these estimates will be reflected in the Statement of Revenues, Expenses and Changes in Net Position in the period when additional information is available.
Changes in Accrued Self-Insurance(In thousands)
2019
Balance, beginning of year $ 235,048 Claims incurred and changes in estimates 65,048 Claim payments and other deductions (58,048)
Balance, end of year 242,048
Less current portion (39,250)
Balance, end of year – noncurrent portion $ 202,798
The University has contracted with several commercial carriers to provide varying levels and upper limits of excess liability coverage. These coverages have been considered in determining the required accrued self-insurance liability. There were no material settlements that exceeded insurance coverage during the last three years.
The University purchases excess liability coverage for certain areas such as commercial general liability, Board legal liability, and hospital and medical liability.
(6) Accrued Compensated Absences
Accrued compensated absences includes personnel earned and unused vacation and sick leave, including the University’s share of Medicare taxes, valued at the current rate of pay.
Section 14a of the State Finance Act (30 ILCS 105/14a) provides that employees eligible to participate in the State Universities Retirement System or the Federal Retirement System are eligible for compensation at time of resignation, retirement, death or other termination of University employment for one-half (1/2) of the unused sick leave earned between January 1, 1984 and December 31, 1997. Any sick leave days that were earned before or after this period of time are noncompensable.
Changes in Compensated Absences Balance(In thousands)
Balance, beginning of year $ 206,678 Additions 24,597 Deductions (17,998)
Balance, end of year 213,277
Less current portion (18,549)
Balance, end of year – noncurrent portion $ 194,728

41 (Continued)
(7) Bonds Payable
On October 17, 2018, the University issued $142,110,000 of AFS Revenue Bonds, Series 2018A. Proceeds of these bonds were used to finance the renovation and expansion of the Illinois Street Residence Hall dining facility and the construction of a new football performance center. Proceeds also were used to provide for the refunding of the outstanding principal of Series 2008, and to fund all costs incidental to the issuance of the Series 2018A Bonds. The refunding resulted in a projected loss over the life of the issue at a net present value of $3,116,000. The difference between the reacquisition price and the net carrying amount of the old debt, loss on refunding, was $10,000. This loss is deferred and amortized as a component of interest expense over the remaining life of the old debt or the life of the new debt, whichever is shorter.
On October 17, 2018, the University issued $20,030,000 of AFS Revenue Bonds, Series 2018B. Proceeds of these bonds were used to finance the construction of Demirjian Park, a new soccer and track complex, and the reorientation and replacement of certain track and field facilities.
Bonds payable activity for the year ended June 30, 2019 consists of the following:
Bonds Payable(In thousands)
Maturity Beginning Ending Currentdates balance Additions Deductions balance portion
Auxiliary Facilities System:Current interest bonds 2020 – 2048 $ 962,330 162,140 (50,995) $ 1,073,475 $ 29,635 Capital appreciation bonds 2020 – 2030 82,295 (18,055) 64,240 20,905
Health Services Facilities System 2020 – 2043 108,760 (3,620) 105,140 3,755 UIC South Campus 2020 – 2023 29,905 (6,500) 23,405 7,190
1,183,290 162,140 (79,170) 1,266,260 61,485
Unaccreted appreciation (15,351) 4,422 (10,929) (3,361)
1,167,939 166,562 (79,170) 1,255,331 58,124
Unamortized debt premium 60,034 4,732 (4,119) 60,647 4,147
Total $ 1,227,973 171,294 (83,289) $ 1,315,978 $ 62,271
None of the University’s bonds described above constitute obligations of the State.
Capital appreciation bonds of $64,240,000 outstanding at June 30, 2019 do not require current interest payments and have a net unappreciated value of $53,311,000. The University records the annual increase in the principal amount of these bonds as interest expense and accretion on bonds payable.
Included in bonds payable is $85,880,000 of variable rate demand bonds. These bonds mature serially through April 2044. These bonds have variable interest rates that are adjusted periodically (e.g., daily, weekly, or monthly), generally with interest paid at the beginning of each month. The bonds are subject to purchase on the demand of the holder at a price equal to principal plus accrued interest on seven days notice and delivery to the University’s several remarketing agents. The University pays the remarketing agent fees on the outstanding bond balance. If the remarketing agent is unable to resell any bonds that are “put” to the agent, the University has several letter of credit arrangements with liquidity facilities. The fees on the letters of credit are based on outstanding bonds plus pro forma interest. The University, in the event a liquidity facility is utilized, has reimbursement agreements with associated financial entities. Generally, the reimbursement provisions require repayment in eight equal quarterly installments, at an interest rate initially set at slightly above prime or the federal funds rate. The due date of the initial payment per the reimbursement agreements varies depending upon the variable rate bond issue. The reimbursement agreements require an initial payment due date of at least 366 days after a liquidity advance. The letter of credit agreements contain

42 (Continued)
provisions that the University may terminate and replace the letter of credit agreements so long as the University has paid all of the obligations owed to the liquidity facility.
In the event of default, the bond owners may sue to command performance of the University. The liquidity facilities may cause the bonds to be subject to a mandatory tender or appropriate the pledged revenues by invoking the “set off” provisions in the bond documents.
The required future interest payments for these variable rate bonds have been calculated using the current interest rate, based upon short-term rates, or the synthetic fixed rate, as illustrated in the table below. Other outstanding bond issues bear interest at fixed rates ranging from 2.50% to 6.25%.
Variable Rate Bonds
Interestrate at
June 30, Remarketing Remarketing Liquidity facility LiquidityBond issues 2019 agent fee Bank Expiration Insured by fee
UIC South Campus, Series 2008 1.95% JPMorgan Securities 0.075% JPMorgan Chase 1/20/2022 Letter of Credit 0.250%
AFS, Series 2014C 2.35 Wells Fargo 0.080 Northern Trust 2/19/2024 Letter of Credit 0.350
HSFS, Series 1997B 1.95 JPMorgan Securities 0.070 Wells Fargo 5/30/2024 Letter of Credit 0.635
HSFS, Series 2008 1.85 Goldman Sachs 0.070 Wells Fargo 5/30/2024 Letter of Credit 0.635
(a) Interest Rate Swap Agreements on Bonds Payable
The University has entered into three separate pay-fixed/receive-variable interest rate swap agreements. The objective of these swaps was to effectively change the University’s variable interest rate on the bonds to a synthetic fixed rate. The notional amount of the interest rate swaps is equal to the par amount of the related bonds, except for HSFS Series 2008, of which $195,000 is not covered by the swap agreement. In addition, the swaps were entered at the same time as the original bonds were issued and terminate with maturity of the existing bonds. No cash was paid or received when the original swap agreements were entered into.
Credit Risk – As of June 30, 2019, the University was not exposed to credit risk because the swaps had a negative fair value. If interest rates change and the fair value of the swap became positive, the University would be exposed to credit risk in the amount of the derivative’s fair value. The terms, fair values and credit ratings of the outstanding swaps as of June 30, 2019 are listed below:
Interest Rate Swaps
Outstanding Fixed Level 2 Swap Counterpartynotional Effective rate Variable rate Fair termination credit rating
Bond issues amount date paid received value date Counterparty (S&P/Moody’s)
HSFS 2008 $ 23,860 Nov 2008* 3.534% 68% of LIBOR** $ (2,180) Oct-2026 Loop BBB+/A3UIC SC 2008 10,395 Feb 2006* 4.086 68% of LIBOR** (492) Jan-2022 Morgan Stanley BBB+/A3UIC SC 2008 10,130 Feb 2006* 4.092 68% of LIBOR** (478) Jan-2022 JPMorgan Chase A+/Aa2
* Swap agreement was transferred from original issue to refunded bond issues.** LIBOR – London Interbank Offered Rate
(In thousands)
The University engaged a third-party consultant to determine the fair value of the swap agreements. The fair values provided by the consultant were derived from proprietary models based upon well-recognized financial principles and reasonable estimates about relevant market conditions. Since these are negative numbers, they represent an approximation of the amount of money that the University may have to pay a swap provider to terminate the swap. The counterparty may have to post collateral in the University’s favor in certain conditions, and the University would never be required to post collateral in the counterparty’s favor.

43 (Continued)
Interest Rate Risk – Since inception of the swaps, declining interest rates exposed the University to interest rate risk, which adversely affected the fair values of the swap agreements.
Termination Risk – The University has the option to terminate any of the swaps early. The University or the counterparties may terminate a swap if the other party fails to perform under the terms of the contract. The University may terminate a swap if both credit ratings of the counterparties fall below BBB+ as issued by Standard & Poor’s and Baa1 as issued by Moody’s Investors Service. If a swap is terminated, the variable-rate bonds would no longer carry a synthetic fixed interest rate. In addition, if at the time of termination, a swap has a negative fair value, the University would be liable to the counterparties for a payment equal to the swap’s fair value.
Basis Risk – The swaps expose the University to basis risk should the relationship between LIBOR and the variable weekly rate determined by remarketing agents change, changing the synthetic rate on the bonds. If a change occurs that results in the difference in rates widening, the expected cost savings may not be realized.
Other Risks – Since the swap agreements extend to the maturity of the related bond, the University is not exposed to rollover risk. In addition, the University is not exposed to foreign currency risk or to market access risk as of June 30, 2019. However, if the University decides to issue refunding bonds and credit is more costly at that time, it could be exposed to market access risk.
(b) Pledged Revenues and Debt Service Requirements
The University has pledged specific revenues, net of specified operating expenses, to repay the principal and pay the interest of revenue bonds. The following is a schedule of the pledged revenues and related debt:
Pledged RevenuesDebt serviceto pledged
Source of Future revenuesrevenue revenues Term of (current
Bond issues Purpose pledged pledged 2 commitment year)(In thousands)
AFS Refunding, various improvements and Net AFS revenue, student additions to the System tuition and fees $ 1,725,476 2048 8.30%
HSFS Additions to System and Net HSFS revenue, Medical refunding Service Plan revenue net of bad
debt expense, College ofMedicine net tuition revenue 183,224 2043 2.65
UIC South Campus South Campus Defined Tax IncrementDevelopment Project1 Financing District revenue, and refunding student tuition and fees, and
sales of certain land in the UICSouth Campus project 25,161 2023 2.10
Total future revenues pledged $ 1,933,861
1An integrated academic, residential, recreational and commercial development south of UIC’s main campus2Total estimated future principal and interest payments on debt

44 (Continued)
Future debt service requirements for all bonds outstanding at June 30, 2019 are as follows:
Debt Service Requirements
Principal Interest
2020 $ 61,485 $ 54,963 2021 69,045 53,073 2022 72,030 50,816 2023 56,430 47,598 2024 54,010 45,002 2025 – 2029 285,995 186,953 2030 – 2034 273,200 123,660 2035 – 2039 170,820 70,400 2040 – 2044 189,910 31,754 2045 – 2048 33,335 3,382
Total $ 1,266,260 $ 667,601
(In thousands)
Using the actual rates of 1.95% (UIC South Campus, Series 2008) and 1.85% (Health Services Facilities System, Series 2008), in effect as of June 30, 2019, debt service requirements of the variable-rate debt and net swap payments, assuming current interest rates remain the same for their term, were as follows. As rates vary, variable-rate bond interest payments and net swap payments will also vary.
UIC South Campus Revenue Refunding Bonds, Series 2008Variable-Rate Debt Service Requirements
(In thousands)
Variable-rate bonds Interest ratePrincipal Interest swaps, net Total
2020 6,520 400 338 7,258 2021 6,845 273 194 7,312 2022 7,160 140 42 7,342
Total $ 20,525 813 574 $ 21,912
Health Services Facilities System Revenue Bonds, Series 2008Variable-Rate Debt Service Requirements
(In thousands)
Variable-rate bonds Interest ratePrincipal Interest swaps, net Total
2020 $ 2,655 445 339 $ 3,439 2021 2,700 396 294 3,390 2022 2,845 346 245 3,436 2023 2,900 293 197 3,390 2024 3,060 240 145 3,445 2025 - 2027 9,895 369 101 10,365
Total $ 24,055 2,089 1,321 $ 27,465

45 (Continued)
Certain bonds of the University (AFS Series 1991) have debt service reserve requirements. The Maximum Annual Net Debt Service for those bonds, as defined, is $14,927,000.
(8) Leaseholds Payable and Other Obligations
Leaseholds payable and other obligations activity for the year ended June 30, 2019 consists of the following:
Leaseholds Payable and Other Obligations(In thousands)
Beginning Ending Currentbalance Additions Deductions balance portion
University:Certificates of participation $ 180,250 (33,510) $ 146,740 $ 34,670 Unamortized debt premium 13,882 (2,955) 10,927 2,954
194,132 — (36,465) 157,667 37,624
Other capital leases 24,171 4,394 (2,756) 25,809 2,316 Energy services agreement
installment payment contracts 34,400 (3,237) 31,163 3,334 Perkins loans 31,010 31,010 7,026 Environmental remediation
liability 81 (81) —
Total University 283,794 4,394 (42,539) 245,649 50,300
URO – Foundation:Annuities payable 48,630 1,255 (6,129) 43,756 5,425 Other liabilities 3,325 (485) 2,840
Total URO –Foundation $ 51,955 1,255 (6,614) $ 46,596 $ 5,425
The University leases various plant facilities and equipment under capital leases. This includes assets obtained with certificates of participation proceeds and recorded as capital leases, as well as, other capital lease agreements funded through operations. In the event of default on certificates of participation, the Trustee may pursue legal action for the payments in default or require the University to turn over possession of the financed assets to the Trustee bank. If the University exercises the option to terminate the agreement, the future installment payments are subject to mandatory prepayment. In the event of default on energy services agreement installment payment contracts, the University may be required to pay all amounts due, or relinquish possession of the financed assets. There are termination provisions that also require the University to pay all amounts due, return equipment, or pay rent on the equipment with a higher interest rate on amounts not paid.

46 (Continued)
(a) Capital Leases (includes Certificates of Participation)
Assets held under capital leases are included in capital assets at June 30, 2019 as follows:
Assets Held Under Capital Lease(In thousands)
Land $ 6,471 Buildings 140,486 Improvements 181,919 Equipment 5,322
Subtotal 334,198
Less accumulated depreciation 160,800
Total $ 173,398
The net present value of outstanding capital leases at June 30, 2019 is as follows:
Outstanding Capital Leases(In thousands)
Certificates of participation:Series 2007A $ 15,300 Series 2007B 9,725 Series 2014A 16,125 Series 2014B 6,360 Series 2014C 21,855 Series 2016A 53,925 Series 2016B 4,495 Series 2016C 10,465 Series 2016D 8,490
Other capital leases 25,809
Net present value $ 172,549
As of June 30, 2019, future minimum lease payments under capital leases are as follows:
Future Minimum Lease PaymentsUnder Capital Leases
(In thousands)
2020 $ 44,453 2021 44,136 2022 31,947 2023 15,074 2024 14,367 2025-2029 45,032 2030-2033 7,006
Total minimum lease payments 202,015
Amount representing interest (29,466)
Net present value $ 172,549

47 (Continued)
(b) Other Obligations
As part of energy services agreements, the University has entered into installment payment contracts to finance energy conservation measures. As of June 30, 2019, future minimum lease payments under installment payment contracts are as follows:
Future Minimum Lease PaymentsUnder Installment Payment Contracts
(In thousands)
2020 $ 4,215 2021 4,216 2022 4,216 2023 4,215 2024 4,215 2025 – 2029 14,338
Total minimum lease payments 35,415
Amount representing interest (4,252)
Net present value $ 31,163
At June 30, 2019, the URO – Foundation had annuities payable outstanding of $43,756,000. The Foundation recalculates the present value of these payments through the use of Internal Revenue Service (IRS) discount rates and IRS life expectancy tables.
(c) Operating Leases
The University also leases various buildings and equipment under operating lease agreements. Total rental expense under these agreements was $13,006,000 for the year ended June 30, 2019. The future minimum lease payments (excluding those leases renewed on an annual basis) are as follows:
Future Minimum Operating Lease Payments(In thousands)
2020 $ 10,552 2021 7,429 2022 5,976 2023 4,721 2024 3,345 2025 – 2029 6,318
Total $ 38,341

48 (Continued)
(9) Net Position
As discussed in Note 1(k), the University’s net position is classified for accounting and reporting purposes into one of four net position categories according to externally imposed restrictions. The following tables include detail of the net position balances for the University and the URO-Foundation including major categories of restrictions and internal designation of unrestricted funds.
University Net Position(In thousands)
Net investment in capital assets $ 2,504,507 Restricted – nonexpendable:
Invested in perpetuity to produce income expendable for – scholarships,academic programs, fellowships and research 117,279
Restricted – expendable for:Scholarships, academic programs, fellowships and research 276,206 Auxilary Facilities System 36,043 Loans 44,285 Service plans 112,580 Retirement of indebtedness 24,193 Capital projects 150,494
Unrestricted:Designated 525,202
Total $ 3,790,789
URO – Foundation Net Position(In thousands)
Net investment in capital assets $ 9,157 Restricted – nonexpendable:
Invested in perpetuity to produce income expendable for academic programs,scholarships, fellowships and research 1,344,232
Restricted – expendable for:Academic programs, scholarships, fellowships and research 1,078,415
Unrestricted 46,920
Total $ 2,478,724
(10) Funds Held in Trust by Others
The University and URO-Foundation are income beneficiaries of several irrevocable trusts which are held and administered by outside trustees. The University and URO-Foundation have no control over these funds as to either investment decisions or income distributions. In accordance with GASB and FASB standards, $19,542,000 and $21,863,000, respectively, have been recorded in the accompanying financial statements. The fair value of these funds at June 30, 2019 and the amount of income received from the trusts during the year then ended were as follows:
Funds Held in Trust by Others(In thousands)
URO –University Foundation
Fair value of funds held in trust by others $ 54,291 $ 67,939 Income received from funds held in trust by others 1,537 1,680

49 (Continued)
(11) State Universities Retirement System
(a) General Information about the Pension Plan
Plan Description: The University contributes to SURS, a cost-sharing multiple-employer defined benefit plan with a special funding situation whereby the State makes substantially all actuarially determined required contributions on behalf of the participating employers. SURS was established July 21, 1941 to provide retirement annuities and other benefits for staff members and employees of State universities, certain affiliated organizations, and certain other State educational and scientific agencies and for survivors, dependents and other beneficiaries of such employees. SURS is considered a component unit of the State’s financial reporting entity and is included in the State’s financial reports as a pension trust fund. SURS is governed by Chapter 40, Act 5. Article 15 of the Illinois Compiled Statutes. SURS issues a publicly available financial report that includes financial statements and required supplementary information. That report may be obtained by accessing the website at www.surs.org.
Benefits Provided: A traditional benefit plan was established in 1941. Public Act 90-0448 enacted effective January 1, 1998, established an alternative defined benefit program known as the portable benefit package. The traditional and portable plan Tier 1 refers to members that began participation prior to January 1, 2011. Public Act 96-0889 revised the traditional and portable benefit plans for members who begin participation on or after January 1, 2011, and who do not have other eligible Illinois reciprocal system services. The revised plan is referred to as Tier 2. New employees are allowed 6 months after their date of hire to make an irrevocable election. A summary of the benefit provisions as of June 30, 2018 can be found in the SURS’ comprehensive annual financial report (CAFR) Notes to the Financial Statements.
Eligible employees must participate upon initial employment. Employees are ineligible to participate if (a) employed after having attained age 68; (b) employed less than 50% of full time, or (c) employed less than full time and attending classes with an employer. Of those University employees ineligible to participate, the majority are students at the University.
Contributions: The State is primarily responsible for funding SURS on behalf of the individual employers at an actuarially determined amount. Public Act 88-0593 provides a Statutory Funding Plan consisting of two parts: (i) a ramp-up period from 1996 to 2010 and (ii) a period of contributions equal to a level percentage of the payroll of active members of SURS to reach 90% of the total Actuarial Accrued Liability by the end of Fiscal Year 2045. Employer contributions from “trust, federal, and other funds” are provided under Section 15-155(b) of the Illinois Pension Code and require employers to pay contributions which are sufficient to cover the accruing normal costs on behalf of applicable employees. The employer normal cost for fiscal year 2018 and 2019 respectively, was 12.46% and 12.29% of employee payroll. The normal cost is equal to the value of current year’s pension benefit and does not include any allocation for the past unfunded liability or interest on the unfunded liability. Plan members are required to contribute 8.0% of their annual covered salary except for police officers and fire fighters who contribute 9.5% of their earnings. The contribution requirements of plan members and employers are established and may be amended by the Illinois General Assembly.
Participating employers make contributions toward separately financed specific liabilities under Section 15-139.5(e) of the Illinois Pension Code (relating to contributions payable due to the employment of “affected annuitants” or specific return to work annuitants), Section 15-155(g) (relating to contributions payable due to earning increases exceeding 6% during the final rate of earnings period), and Section 15-155(j-5) (relating to contributions payable due to earnings exceeding the salary set for the Governor).

50 (Continued)
(b) Pension Liabilities, Expense, and Deferred Outflows of Resources and Deferred Inflows of Resources Related to Pensions
Net Pension Liability: The net pension liability was measured as of June 30, 2018. At June 30, 2018, SURS reported a net pension liability of $27,494,557,000.
Employer Proportionate Share of Net Pension Liability: The amount of the proportionate share of the net pension liability to be recognized for the University is $0. The proportionate share of the State’s net pension liability associated with the University is $12,228,864,000. This amount should not be recognized in the financial statement. The net pension liability and total pension liability as of June 30, 2018 was determined based on the June 30, 2017 actuarial valuation rolled forward. The basis of allocation used in the proportionate share of net pension liability is the actual reported pensionable contributions made to SURS during fiscal year 2018.
Pension Expense: At June 30, 2018 SURS reported a collective net pension expense of $2,685,323,000.
Employer Proportionate Share of Pension Expense: The employer proportionate share of collective pension expense is recognized as nonoperating revenue with matching operating expense (compensation and benefits) in the financial statements. The basis of allocation used in the proportionate share of collective pension expense is the actual reported pensionable contributions made to SURS during fiscal year 2018. As a result, the University recognized revenue and pension expense of $1,194,362,000 from this special funding situation during the year ended June 30, 2019.
Deferred Outflows of Resources and Deferred Inflows of Resources Related to Pensions: Deferred outflows of resources are the consumption of net position by SURS that is applicable to future reporting periods.
Deferred Outflows Deferred Inflows
of Resources of Resources
$ 65,522 $ 181,032
1,286,257 123,218
26,811
Total $ 1,378,590 $ 304,250
Difference between expected and actual experience
Changes in assumption
Net difference between projected and actual earnings on pension plan investments
SURS Collective Deferred Outflows and Deferred Inflows of Resources by Sources
(In thousands)
Year Ending June 30 Net Deferred Outflows of Resources2019 $ 763,1712020 540,4432021 (192,612)2022 (36,662)2023
Thereafter
Total $ 1,074,340
SURS Collective Deferred Outflows and Deferred Inflows of Resources by Year to be Recognized in Future Pension Expenses
(In thousands)

51 (Continued)
(c) Employer Deferral of Fiscal Year 2018 Pension Expense
The University paid $36,359,000 in federal, trust or grant contributions for fiscal year ended June 30, 2019. These contributions were made subsequent to the pension liability date of June 30, 2018 and are recognized as Deferred Outflows of Resources as of June 30, 2019.
(d) Assumptions and Other Inputs
Actuarial assumptions: The actuarial assumptions used in the June 30, 2018 valuation were based on the results of an actuarial experience study for the period June 30, 2014 – 2017. The total pension liability in the June 30, 2018 actuarial valuation was determined using the following actuarial assumptions, applied to all periods included in the measurement:
Inflation 2.25 percentSalary increases 3.25 to 12.25 percent, including inflationInvestment rate of return 6.75 percent beginning with the actuarial
valuation as of June 30, 2018
Mortality rates were based on the RP2014 Combined Mortality Table with projected generational mortality and a separate mortality assumption for disabled participants.
The long-term expected rate of return on pension plan investments was determined using a building-block method in which best-estimate ranges of expected future real rates of return (expected returns, net of pension plan investment expense and inflation) are developed for each major asset class. These ranges are combined to produce the long-term expected rate of return by weighting the expected future real rates of return by the target asset allocation percentage and by adding expected inflation. Best estimates of arithmetic real rates of return were adopted by the plan’s trustees after considering input from the plan’s investment consultant(s) and actuary(s). For each major asset class that is included in the pension plan’s target asset allocation as of June 30, 2018, these best estimates are summarized in the following table:
Asset Class Target Allocation
Weighted Average Long-Term Expected Real
Rate of Return
U.S. Equity 23% 5.00%Private Equity 6% 8.50%Non-U.S. Equity 19% 6.45%Global Equity 8% 6.00%Fixed Income 19% 1.50%Treasury-Inflation Protected Securities 4% 0.75%Emerging Market Debt 3% 3.65%Real Estate REITS 4% 5.45%Direct Real Estate 6% 4.75%Commodities 2% 2.00%Hedged Strategies 5% 2.85%Opportunity Fund 1% 7.00%Total 100% 4.55%Inflation 2.75%Expected Arithmetic Return 7.30%
Discount Rate: A single discount rate of 6.65% was used to measure the total pension liability. This single discount rate was based on an expected rate of return on pension plan investments of 6.75% and a municipal bond rate of 3.62% (based on the weekly rate closest to but not later than the measurement

52 (Continued)
date of the 20-Year Bond Buyer Index as published by the Federal Reserve). The projection of cash flows used to determine this single discount rate were the amounts of contributions attributable to current plan members and assumed that plan member contributions will be made at the current contribution rate and that employer contributions will be made at rates equal to the statutory contribution rates under SURS’ funding policy. Based on these assumptions, the pension plan’s fiduciary net position and future contributions were sufficient to finance the benefit payments through the year 2075. As a result, the long-term expected rate of return on pension plan investments was applied to projected benefit payments through the year 2075, and the municipal bond rate was applied to all benefit payments after that date.
Sensitivity of the SURS’ Net Pension Liability to Changes in the Discount Rate: Regarding the sensitivity of the net pension liability to changes in the single discount rate, the following presents the plan’s net pension liability, calculated using a single discount rate of 6.65%, as well as what the plan’s net pension liability would be if it were calculated using a single discount rate that is 1-percentage-point lower or 1-percentage-point higher:
1% Decrease 5.65% 1% Increase 7.65%
$33,352,189 $22,650,652
Current Single Discount Rate Assumption 6.65%
$27,494,557(In thousands)
Additional information regarding the SURS basic financial statements including the Plan Net Position can be found in the SURS comprehensive annual financial report by accessing the website at www.SURS.org.
(12) OPEB
(a) Plan Description
The State Employees Group Insurance Act of 1971 (Act), as amended, authorizes the SEGIP to provide health, dental, vision, and life insurance benefits for certain retirees and their dependents. Substantially all of the University’s full-time employees are members of SEGIP. Members receiving monthly benefits from the GARS, JRS, SERS, TRS, and SURS are eligible for OPEB. The eligibility provisions for SURS are defined within Note 11.
CMS administers OPEB for annuitants with the assistance of GARS, JRS, SERS, TRS and SURS. The State recognizes SEGIP OPEB benefits as a single-employer defined benefit plan, which does not issue a stand-alone financial report.
(b) Benefits Provided
The health, dental, and vision benefits provided to and contribution amounts required from annuitants are the result of collective bargaining between the State and the various unions representing the State’s and the state public universities’ employees in accordance with limitations established in the Act. Therefore, the benefits provided and contribution amounts are subject to periodic change. Coverage through SEGIP becomes secondary to Medicare after Medicare eligibility has been reached. Members must enroll in Medicare Parts A and B to receive the subsidized SEGIP premium available to Medicare eligible participants. The Act requires the State to provide life insurance benefits for annuitants equal to their annual salary as of the last day of employment until age 60, at which time, the benefit amount becomes $5,000.
(c) Funding Policy and Annual Other Postemployment Benefit Cost
OPEB offered through SEGIP are financed through a combination of retiree premiums, SEGIP contributions pursuant to the Act, and Federal government subsidies from the Medicare Part D program. These contributions are deposited in the Health Insurance Reserve Fund, which covers both

53 (Continued)
active State employees and retiree members. Annuitants may be required to contribute towards health and vision benefits with the amount based on factors such as date of retirement, years of credited service with the State, whether the annuitant is covered by Medicare, and whether the annuitant has chosen a managed health care plan. Annuitants who retired prior to January 1, 1998, and who are vested in the GARS, JRS, SERS, TRS, and SURS do not contribute toward health and vision benefits. For annuitants who retired on or after January 1, 1998, the annuitant’s contribution amount is reduced five percent for each year of credited service with the State allowing those annuitants with twenty or more years of credited service to not have to contribute towards health and vision benefits. All annuitants are required to pay for dental benefits regardless of retirement date. The Director of CMS, on an annual basis, determines the amount of contributions necessary to fund the basic program of group benefits. State contributions are made primarily from the State’s General Fund on a pay-as-you-go basis. No assets are accumulated or dedicated to funding the retiree health insurance benefit and a separate trust has not been established for the funding of OPEB.
For fiscal year 2019, the annual cost of the basic program of group health, dental, and vision benefits before the State’s contribution was $11,269 ($6,699 if Medicare eligible) if the annuitant chose benefits provided by a health maintenance organization and $13,824 ($4,984 if Medicare eligible) if the annuitant chose other benefits. The State is not required to fund the plan other than the pay-as-you-go amount necessary to provide the current benefits to retirees.
(d) CMS changes in estimates
For the measurement date of June 30, 2018, CMS experienced two significant changes within its estimation process. The OPEB for both the special funding situation and the portion of OPEB where the University is responsible for employer contributions were both significantly impacted by (1) the University’s participants in SEGIP and (2) the average cost per employee within SEGIP. CMS made changes to its estimation methodology that resulted in significant differences within its estimates which represent an outcome of estimation uncertainty that, as time has passed and new sources of better data have become available, continued to be refined to achieve a more representative reflection of the actual outcome of the estimate in future periods. As such, the University experienced a significant decrease in its OPEB liability and expense and in the nonoperating revenue and operating expenses recognized from the special funding situation.
(e) Special funding situation portion of OPEB
The proportionate share of the State’s OPEB expense relative to the University’s retirees totaled ($406,373,000) during the year ended June 30, 2019. This amount was recognized by the University as non-operating special funding situation revenue and operating expense allocated to the related function performed by the employees during the year ended June 30, 2019.
While the University is not required to record the portion of the State’s OPEB liability related to the University’s employees resulting from the special funding situation, the University is required to disclose this amount. The following chart displays the proportionate share of the State’s contributions related to the University’s special funding situation relative to all employer contributions during the years ended June 30, 2018 and 2017, each based on the June 30, 2017 and 2016, respectively, actuarial valuation rolled forward:

54 (Continued)
June 30, 2018 June 30, 2017
$ 7,052,321 $ 10,142,951
SEGIP total OPEB liability $ 40,093,248 $ 41,323,859
17.59% 24.55%Proportionate share of the total OPEB liability
Measurement Date:
(in thousands)
State of Illinois’ OPEB liability related to the University under the Special Funding Situation
(f) University’s Portion of OPEB and Disclosures Related to SEGIP:
The total OPEB liability, as reported at June 30, 2019, was measured as of June 30, 2018, with an actuarial valuation as of June 30, 2017, which was rolled forward to the measurement date. The following chart displays the proportionate share of the University’s contributions relative to all employer contributions during the years ended June 30, 2018 and 2017, each based on the June 30, 2017 and 2016, respectively, actuarial valuation rolled forward:
June 30, 2018 June 30, 2017
$ 1,160,539 $ 1,314,760
SEGIP total OPEB liability $ 40,093,248 $ 41,323,859
2.89% 3.18%Proportionate share of the total OPEB liability
Measurement Date:
(in thousands)
University's OPEB liability
The University’s portion of the OPEB liability was based on the University’s proportion share amount determined under the methodology in note 1(s) during the year ended June 30, 2018. As of the current year measurement date of June 30, 2018, the University’s proportion declined 0.29% from its proportion measured as of the prior year measurement date of June 30, 2017.
The University recognized OPEB expense for the year ended June 30, 2019, of $(25,968,000).

55 (Continued)
At June 30, 2019, the University reported deferred outflows and deferred inflows of resources, as of the measurement date of June 30, 2018, from the following sources (amounts expressed in thousands):
Deferred outflows of resourcesDifferences between expected
and actual experience 297 Changes in proportion — University contributions subsequent
to the measurement date 26,573 Total deferred outflows of resources $ 26,870
Deferred inflows of resourcesDifferences between expected
and actual experience 25,555 Changes of assumptions 108,986 Changes in proportion and differences
between employer contributions andproportionate share of contributions 261,793 Total deferred inflows of resources $ 396,334
The amounts reported as deferred outflows of resources related to OPEB resulting from University contributions subsequent to the measurement date will be recognized as a reduction to the OPEB liability in the year ended June 30, 2020. Other amounts reported as deferred outflows and deferred inflows of resources related to OPEB will be recognized in OPEB expense as follows (amounts expressed in thousands):
Year ended June 30,
2020 $ (107,539)2021 (107,539)2022 (107,539)2023 (68,359)2024 (5,061)
Total $ (396,037)
(g) Actuarial Methods and Assumptions
The total OPEB liability was determined by an actuarial valuation using the following actuarial assumptions, applied to all periods included in the measurement unless otherwise specified. The actuarial valuation for the SEGIP was based on GARS, JRS, SERS, TRS, and SURS active, inactive, and retiree data as of June 30, 2017, for eligible SEGIP employees, and SEGIP retiree data as of June 30, 2017.

56 (Continued)
The valuation date of June 30, 2017, below was rolled forward to June 30, 2018.
Valuation Date June 30, 2017
Measurement Date June 30, 2018
Actuarial Cost Method Entry Age Normal
Inflation Rate 2.75%
Projected Salary Increases* 3.00% - 15.00%
Discount Rate 3.62%
Healthcare Cost Trend Rate:Medical (Pre-Medicare)
Medical (Post-Medicare) 9.0% grading down 0.5% per year over 9 years to 4.5%Dental and Vision 6.0% grading down 0.5% per year over 6 years to 4.5%
Retirees' share of benefit-related costs
*Dependent upon service and participation in the respective retirement systems. Includes inflation rate listed.
8.0% grading down 0.5% in the first year to 7.5%, then grading down 0.08% in the second year to 7.42%, followed by grading down of 0.5% per year over 5 years to 4.92% in year 7
Healthcare premium rates for members depend on the date of retirement and the years of service earned at retirement. Members who retired before January 1, 1998, are eligible for single coverage at no cost to the member. Members who retire after January 1, 1998, are eligible for single coverage provided they pay a portion of the premium equal to 5 percent for each year of service under 20 years. Eligible dependents receive coverage provided they pay 100 percent of the required dependent premium. Premiums for plan year 2018 and 2019 are based on actual premiums. Premiums after 2019 were projected based on the same healthcare cost trend rates applied to per capita claim costs but excluding the additional trend rate that estimates the impact of the Excise Tax.
Additionally, the demographic assumptions used in this OPEB valuation are identical to those used in the June 30, 2017 valuations for GARS, JRS, SERS, TRS, and SURS as follows:

57 (Continued)
Retirement age experience study^ Mortality^^
GARS July 2012 - June 2015
JRS July 2012 - June 2015
SERS July 2009 - June 2013
TRS July 2014 - June 2017
SURS July 2014 - June 2017
^ The actuarial assumptions used in the respective actuarial valuations are based on the results of actuarial experience studies for the periods defined. A modified experience review was completed for SERS for the 3-year period ending June 30, 2015. Changes were made to the assumptions regarding investment rate of return, projected salary increases, inflation rate, and mortality based on this review. All other assumptions remained unchanged.
^^ Mortality rates are based on mortality tables published by the Society of Actuaries' Retirement Plans Experience Committee.
RP-2014 White Collar Total Healthy Annuitant mortality table, sex distinct, set forward 1 year for males and set back 1 year for females and generational mortality improvements using MP-2014 two-dimensional mortality improvement scales
RP-2014 White Collar Total Healthy Annuitant mortality table, sex distinct, set forward 1 year for males and set back 1 year for females and generational mortality improvements using MP-2014 two-dimensional mortality improvement scales
105 percent of the RP 2014 Healthy Annuitant mortality table, sex distinct, with rates projected to 2015; generational mortality improvement factors were added
RP-2014 with future mortality improvements on a fully generational basis using projection table MP-2017
RP-2014 White Collar, gender distinct, projected using MP-2014 two dimensional mortality improvement scale, set forward one year for male and female annuitants
Since the last measurement date on June 30, 2018, the State has not made any significant changes to the benefit terms affecting the measurement of the collective total OPEB liability. Further, no changes have occurred since the measurement date and the University’s fiscal year end on June 30, 2019, that are expected to have a significant impact on the University’s proportionate share of the total collective OPEB liability.
(h) Discount Rate
Retirees contribute a percentage of the premium rate based on service at retirement. The State contributes additional amounts to cover claims and expenses in excess of retiree contributions. Because plan benefits are financed on a pay-as-you-go basis, the single discount rate is based on a tax-exempt municipal bond rate index of 20-year general obligation bonds with an average AA credit rating as of the measurement date. A single discount rate of 3.56% at June 30, 2017, and 3.62% at June 30, 2018, was used to measure the total OPEB liability.
(i) Sensitivity of total OPEB liability to changes in the single discount rate
The following presents the plan’s total OPEB liability, as reported at June 30, 2019, calculated using a Single Discount Rate of 3.62%, as well as what the plan’s total OPEB liability would be if it were calculated using a Single Discount rate that is one percentage point higher (4.62%) or lower (2.62%) than the current rate (amounts expressed in thousands):

58 (Continued)
1% Decrease (2.62%)
Current Single Discount Rate Assumption
(3.62%)1% Increase
(4.62%)University's proportionate share of total OPEB liability 1,360,591 1,160,539 1,001,731
(j) Sensitivity of Total OPEB Liability to Changes in the Healthcare Cost Trend Rate
The following presents the plans total OPEB liability as reported at June 30, 2019, calculated using the healthcare cost trend rates as well as what the plan’s total OPEB liability would be if it were calculated using a healthcare cost trend rate that is one percentage point higher or lower, than the current healthcare cost trend rates (amounts in table expressed in thousands). The key trend rates are 8.0% in 2019 decreasing to an ultimate trend rate of 4.92% in 2026, for non-Medicare coverage, and 9.0% decreasing to an ultimate trend rate of 4.5% in 2028 for Medicare coverage. For the 1% decrease for calculating the healthcare cost trend rates assumption, the key trend rates are 7.00% in 2019 decreasing to an ultimate trend rate of 3.92% in 2026, for non-Medicare coverage, and 8.00% in 2019 decreasing to an ultimate trend rate of 3.50% in 2028 for Medicare coverage. For the 1% increase for calculating the healthcare cost trend rates assumption, the key trend rates are 9.00% in 2019 decreasing to an ultimate trend rate of 5.92% in 2026, for non-Medicare coverage, and 10.00% in 2019 decreasing to an ultimate trend rate of 5.50% in 2028 for Medicare coverage.
1% Decrease
Current Healthcare Cost Trend Rates
Assumption 1% Increase University's proportionate share of total OPEB liability 980,202 1,160,539 1,394,824
(k) Total OPEB Liability Associated with the University, Regardless of Funding Source:
The University is required to disclose all OPEB liabilities related to it, including (1) the portion of the State’s OPEB liability related to the University’s employees resulting from the special funding situation the University is not required to record and (2) the portion of OPEB liability recorded by the University for its employees paid from trust, federal, and other funds. The following chart displays the proportionate share of contributions, regardless of funding source, associated with the University’s employees relative to all employer contributions during the years ended June 30, 2018 and 2017, each based on the June 30, 2017 and 2016, respectively, actuarial valuation rolled forward:
June 30, 2018 June 30, 2017
$ 1,160,539 $ 1,314,760
7,052,321 10,142,951
8,212,860 11,457,711
SEGIP total OPEB liability $ 40,093,248 $ 41,323,859
20.48% 27.73%Proportionate share of the OPEB liability associated with the University
Measurement Date:
University's OPEB liability
(in thousands)
State of Illinois' OPEB liability related to the University under the Special Funding Situation
Total OPEB liability associated with the University

59 (Continued)
(13) Commitments and Contingencies
At June 30, 2019, the University had commitments on various construction projects, contracts for repairs and renovation of facilities and software projects of $416,215,000.
The University purchases the majority of natural gas and electricity from Prairieland and guarantees payment by Prairieland to its energy suppliers. Unconditional guaranty agreements are in place with Prairieland’s energy suppliers for an aggregate amount not to exceed $39,000,000. The exposure related to Prairieland at June 30, 2019 is $7,354,000 for all energy suppliers. This exposure includes the mark-to-market positions on forward contracts and the accounts payable accrued for each vendor.
The University receives moneys from federal and state government agencies under grants and contracts for research and other activities. The costs, both direct and indirect, charged to these grants and contracts are subject to audit and disallowance by the granting agency. The University believes that any disallowances or adjustments would not have a material effect on the University’s financial position.
The University also receives moneys under third-party payor arrangements for payment of medical services rendered at its hospital and clinics. Some of these arrangements allow for settlement adjustments based on costs and other factors. The University believes that any adjustments would not have a material effect on the University’s financial position.
The University is a defendant in a number of legal actions primarily related to medical malpractice. These legal actions have been considered in estimating the University’s accrued self-insurance liability. The total of amounts claimed under these legal actions, including potential settlements and amounts relating to losses incurred but not reported, could exceed the amount of the self-insurance liability. In the opinion of the University’s administrative officers, the University’s self-insurance liability and limited excess indemnity insurance coverage from commercial carriers are adequate to cover the ultimate liability of these legal actions, in all material respects.
The University has operational coal-fired boilers that produce steam heat for its facilities. The University will have legal and regulatory costs associated with environmental remediation activities as a result of their eventual disposals. In addition, the University utilizes classes of medical devices and x-ray machines that also have legally imposed costs associated with their eventual disposal. The University does not have sufficient information available to reasonably estimate the timing and/or cost related to these future retirement obligations.
Public-private partnerships
During fiscal year 2018, the University entered into several agreements with private enterprises in order to construct a mixed use facility providing student housing, academic and retail space. The University has partnered with an affiliate of the Collegiate Housing Foundation, CHF - Chicago, LLC (CHF), and its student housing developer, American Campus Communities SC Management, LLC (ACC). Through agreements among the parties, ACC has implemented the design, development, construction, equipment, and operations of the facility. The Illinois Finance Authority (IFA) provided financing through public bonds. CHF is the owner of the facility and debtor on the IFA bonds issued to finance the project. The IFA bonds have a service period of thirty-two years which includes a two year period for construction. The University provided an up-front deposit to the project of $8.5 million and leased the land on which the facility lies to the CHF over a period of forty years. Upon the termination or expiration of the land lease, the facility, any improvements, fixtures, equipment and all personal property attached to or within the facility shall be the absolute property of the University.

60 (Continued)
Construction has started and completion will be in fiscal year 2020. Once the facility is completed, the University will recognize a capital asset. The day-to-day operations of the student housing portion of the facility will be managed by ACC. In accordance with generally accepted accounting principles, the student housing portion will be reported as a service concession arrangement by the University effective fiscal year 2020. The day-to-day operations of the academic and retail portions of the facility will be managed by the University through a sublease agreement with CHF. The academic and retail portion of the facility will be reported as a capital lease effective fiscal year 2020.
During fiscal year 2019, the University entered into several agreements with private enterprises in order to construct a feed technology center and a campus instructional facility. The University has partnered with Provident Group-UIUC Properties LLC (Provident) and its developer, Vermilion Campbell Development, LLC (Vermilion). Through agreements among the parties, Provident has implemented the design, development, and construction of the facilities. The Illinois Finance Authority (IFA) provided financing through public bonds. Provident is the owner of the facilities and debtor on the IFA bonds issued to finance the project. The IFA bonds have a service period of thirty-two years which includes a two year period for construction. The University provided an up-front deposit to the projects of $9,738,000 million and leased the land on which the facilities lie to Provident over a period of forty years. Upon the termination or expiration of the land lease, the facility, any improvements, fixtures, equipment and all personal property attached to or within the facility shall be the absolute property of the University.
Construction has started and completion is anticipated in fiscal year 2021. Once each facility is completed, the University will recognize an asset. The day-to-day operations of the facilities will be managed by University. The use of the facilities will be reported in accordance with lease accounting standards effective fiscal year 2021.
(14) Operating Expenses by Natural Classification
Operating expenses by natural classification for the year ended June 30, 2019 for the University and the URO – Foundation are summarized as follows:
University Operating Expenses by Natural Classification(In thousands)
Compensation Supplies andand benefits services Student aid Depreciation Total
Instruction $ 1,322,902 119,628 7,409 $ 1,449,939 Research 544,371 261,381 9,593 815,345 Public service 257,261 167,980 1,765 427,006 Academic support 393,578 138,348 14,131 546,057 Student services 152,228 55,193 9,703 217,124 Institutional support 237,054 59,764 116 296,934 Operation and maintenance
of plant 78,397 249,291 6,944 334,632 Scholarships and fellowships 3,269 1,197 52,791 57,257 Auxiliary enterprises 164,507 200,977 16,640 382,124 Hospital and medical activities 546,873 404,413 951,286 Independent operations 1,698 7,194 8,892 Depreciation 244,185 244,185
Total $ 3,702,138 1,665,366 119,092 244,185 $ 5,730,781

61 (Continued)
URO – Foundation Operating Expenses by Natural Classification(In thousands)
Distributionson behalf of Institutional
the University support Depreciation Total
Fund-raising $ 19,402 $ 19,402 Distributions on behalf of
the University 208,317 208,317 General and administrative 13,646 13,646 Depreciation 1,429 1,429
Total $ 208,317 33,048 1,429 $ 242,794
(15) Segment Information
The following information represents identifiable activities within the University financial statements for which one or more revenue bonds are outstanding. (a) The Auxiliary Facilities System (AFS)
AFS financial activity mainly comprises housing, parking and student activities, which span across the three campuses of the University. The operating revenues of the AFS largely consist of student service fees, various user fees, room and board charges, sales from merchandise/vending and rental of certain facilities. Facilities primarily consist of buildings and other structures that have been constructed or remodeled with funding provided from issuance of related revenue bonds. AFS facilities include Memorial Stadium, the State Farm Center, student unions, housing residence halls, parking and other structures. Operating expenses of the AFS include all necessary current maintenance charges, expenses for reasonable upkeep and repairs, allocations of a share of certain charges for insurance and other expenses incidental to the operations of all of the various activities and facilities of the AFS in accordance with the bond indentures.
(b) The Health Services Facilities System (HSFS)
HSFS is comprised of the University of Illinois Hospital and associated clinical facilities providing patient care at, but not limited to, the University of Illinois at Chicago Medical Center. HSFS is a tertiary care facility located primarily in Chicago, Illinois offering a full range of clinical services. HSFS does not include the operations of the University Medical Service Plan or College of Medicine. Management of the HSFS is the responsibility of the University.

62 (Continued)
Condensed Statements of Net Position
June 30, 2019(In thousands)
AFS HSFS Total
Assets and deferred outflow of resources:Current assets $ 232,371 493,607 $ 725,978 Noncurrent assets:
Capital assets, net of accumulateddepreciation 1,167,475 221,979 1,389,454
Other noncurrent assets 93,462 23,056 116,518 Deferred outflow of resources 16,754 3,430 20,184
Total assets and deferredoutflow of resources $ 1,510,062 742,072 $ 2,252,134
Liabilities:Current liabilities $ 110,658 187,514 $ 298,172 Noncurrent liabilities:
Long-term debt 1,135,775 103,602 1,239,377 Other liabilities 10,549 28,260 38,809
Total liabilities 1,256,982 319,376 1,576,358
Net position:Net investment in capital assets 91,328 117,751 209,079 Restricted:
Expendable 18,884 23,059 41,943 Unrestricted 142,868 281,886 424,754
Total net position 253,080 422,696 675,776
Total liabilities and net position $ 1,510,062 742,072 $ 2,252,134
Condensed Statement of Revenues, Expenses and Changes in Net Position
Year ended June 30, 2019(In thousands)
AFS HSFS Total
Operating revenues $ 366,822 828,151 $ 1,194,973 Operating expenses 302,471 997,938 1,300,409 Depreciation expense 43,562 21,760 65,322
Operating income (loss) 20,789 (191,547) (170,758)
Nonoperating revenues, net 1,293 225,206 226,499
Increase in net position 22,082 33,659 55,741
Net position, beginning of year 230,998 389,037 620,035
Net position, end of year $ 253,080 422,696 $ 675,776

63 (Continued)
Condensed Statement of Cash Flows
Year ended June 30, 2019(In thousands)
AFS HSFS Total
Net cash flows provided by operating activities $ 108,950 75,137 $ 184,087
Net cash flows provided by noncapitalfinancing activities 869 29,713 30,582
Net cash flows used in capital and relatedfinancing activities (40,006) (46,620) (86,626)
Net cash flows (used in) provided byinvesting activities (66,290) 15,843 (50,447)
Net increase in cashand cash equivalents 3,523 74,073 77,596
Cash and cash equivalents, beginningof year 207,155 249,683 456,838
Cash and cash equivalents, end of year $ 210,678 323,756 $ 534,434
(16) University Related Organizations
The Entity’s financial statements include the activities of the UROs, which are presented as discretely presented component units in the accompanying financial statements. Since these component units are discretely presented, the activities between them and the University are not eliminated on the Entity’s financial statements. Conversely, the University and its component units are consolidated on the State’s comprehensive annual financial report, therefore, the following disclosure is presented.
Presented to Facilitate State of Illinois Reporting (In thousands)
Distributions Advances from Services/Goods Services/Goodson behalf of (Repayments to) Provided to Provided by University University, net University University Total
Foundation $ 208,317 10,655 (10,655) $ 208,317
Alumni Alliance 2,837 (2,837) -
WWT 20,433 (20,433) -
Illinois Ventures 2,393 (2,393) -
Research Park 430 (430) -
Prairieland 40,548 (40,548) -
Singapore Research (2,696) 598 (598) (2,696)
Total $ 208,317 (2,696) 77,894 (77,894) $ 205,621
University and University Related Organizations Transactions
The transactions disclosed in the table above are not all inclusive and represent those transactions the University deemed significant. Additional details regarding these transactions are provided on the financial statements of each related organization.

64 (Continued)
Below are condensed financial statements by organization:
Alumni IllinoisFoundation Alliance WWT Ventures
Assets and deferred outflow of resources:Current assets $ 126,990 8,481 1,732 3,191 Noncurrent assets:
Capital assets, net of accumulated depreciation 16,034 4,089 476 9 Other noncurrent assets 2,396,494 14,823 4,069
Deferred outflow of resources
Total assets and deferred outflow of resources $ 2,539,518 27,393 2,208 7,269
Liabilities and deferred inflow of resources:Current liabilities $ 19,489 215 2,219 277 Due to related organizationsNoncurrent liabilities 41,305 9 Deferred inflow of resources
60,794 224 2,219 277
Net position:Net investment in capital assets 9,157 4,089 476 9 Restricted:
Nonexpendable 1,344,232 17 Expendable 1,078,415
Unrestricted 46,920 23,080 (487) 6,966
Total net position 2,478,724 27,169 (11) 6,992
$ 2,539,518 27,393 2,208 7,269
June 30, 2019Condensed Statements of Net Position
(In thousands)
Total liabilities and deferred inflow of resources
Total liabilities, deferred inflow of resources and net position
Operating revenues $ 188,995 4,731 19,787 2,831 Operating expenses 241,365 5,578 19,732 2,706 Depreciation expense 1,429 352 58
Operating income (loss) (53,799) (1,199) (3) 125 Nonoperating revenues (expenses), net 66,365 10,801 (30) 441 Contributions to endowments 158,399
Increase in net position 170,965 9,602 (33) 566
Net position, beginning of year 2,307,759 17,567 22 6,426
Net position, end of year $ 2,478,724 27,169 (11) 6,992
Condensed Statement of Revenues, Expenses and Changes in Net PositionYear ended June 30, 2019
(In thousands)

65 (Continued)
Research SingaporePark Prairieland Research Total
Assets and Deferred Outflow of Resources:Current assets $ 805 7,050 2,136 $ 150,385 Noncurrent assets:
Capital assets, net of accumulated depreciation 1,883 4 73 22,568 Other noncurrent assets 2,415,386
Deferred outflow of resources 828 828
Total assets and deferred outflow of resources $ 2,688 7,882 2,209 $ 2,589,167
Liabilities and Deferred Inflow of Resources:Current liabilities $ 77 5,115 794 $ 28,186 Due to related organizations 977 977 Noncurrent liabilities 686 42,000 Deferred inflow of resources 142 142
77 5,943 1,771 71,305
Net position:Net investment in capital assets 1,883 4 73 15,691 Restricted:
Nonexpendable 1,344,249 Expendable 1,078,415
Unrestricted 728 1,935 365 79,507
Total net position 2,611 1,939 438 2,517,862
$ 2,688 7,882 2,209 $ 2,589,167
June 30, 2019Condensed Statements of Net Position
(In thousands)
Total liabilities and deferred inflow of resources
Total liabilities, deferred inflow of resources, and net position
Operating revenues $ 977 40,474 3,282 $ 261,077 Operating expenses 822 40,651 3,118 313,972 Depreciation expense 95 2 58 1,994
Operating income (loss) 60 (179) 106 (54,889) Nonoperating revenues (expenses), net 247 23 77,847 Contributions to endowments 158,399
Increase in net position 60 68 129 181,357
Net position, beginning of year 2,551 1,871 309 2,336,505
Net position, end of year $ 2,611 1,939 438 $ 2,517,862
Condensed Statement of Revenues, Expenses and Changes in Net PositionYear ended June 30, 2019
(In thousands)

66
(17) Subsequent Events
On October 25, 2019, the University issued Auxiliary Facilities System Revenue Bonds, Series 2019A in the amount of $41,935,000. The proceeds from the Series 2019A bonds will be used, together with other lawfully available moneys, to (i) finance the renovation and addition of certain residence hall facilities on the University’s Urbana-Champaign campus and (ii) pay costs of issuing the Series 2019A bonds.
In July 2018, the Board of Trustees of both the University and The John Marshall Law School voted to create UIC John Marshall Law School. Upon receiving approvals from the Illinois Board of Higher Education, the Higher Learning Commission, the American Bar Association and the U.S. Department of Education, the merger was completed Aug. 16, 2019. Operations commenced as of this date and all subsequent activity will be reported in the University fiscal year 2020 audited financial statements. Initial enrollment for UIC John Marshall Law School in fall of 2019 was 1066 students.
As mentioned in note 13, the University entered into several agreements with private enterprises in order to construct a mixed use facility providing student housing, academic and retail space. The construction of this mixed use facility was completed and the facility was placed into service in August 2019. In fiscal year 2020, the University will recognize a capital asset, capital lease liability, and deferred inflow of resources related to this facility. The capital asset costs to be recognized are $118,737,000. The student housing portion is to be recognized as a deferred inflow of resources of $70,828,000, in accordance with GASB statement No. 60, Accounting and Financial Reporting for Service Concession Arrangements. The academic portion is to be recognized as a capital lease of $38,817,000. The University deposit of $9,092,000 during construction is also included in costs for the facility.

UNIVERSITY OF ILLINOIS
Required Supplementary Information Year Ended June 30, 2019
(In thousands)
67 (Continued)
Fiscal Year 2018
Fiscal Year 2017
Fiscal Year 2016
Fiscal Year 2015
Fiscal Year 2014
(a) Proportion Percentage of the
Collective Net Pension Liability 0% 0% 0% 0% 0%
(b) Proportion Amount of the
Collective Net Pension Liability $0 $0 $0 $0 $0
(c) Portion of Nonemployer
Contributing Entities' Total
Proportion of Collective Net
Pension Liability associated
with Liability Employer $12,228,864 $10,990,307 $10,996,379 $9,957,590 $8,995,845
Total (b) + (c) $12,228,864 $10,990,307 $10,996,379 $9,957,590 $8,995,845
Employer defined benefit Covered
Payroll* $1,576,353 $1,542,724 $1,546,902 $1,546,992 $1,520,177
Proportion of Collective Net Pension
Liability associated with Employer as
a percentage of DB covered payroll 775.77% 712.40% 710.86% 643.67% 591.76%
SURS Plan Net Position as a Percentage
of Total Pension Liability 41.27% 42.04% 39.57% 42.37% 44.39%
Fiscal Year 2019
Fiscal Year 2018
Fiscal Year 2017
Fiscal Year 2016
Fiscal Year 2015
Fiscal Year 2014
Federal, trust, grant and other contribution 36,359$ 37,139$ 35,483$ 34,753$ 33,473$ 34,200$ Contribution in relation to requiredcontribution 36,359 37,139 35,483 34,753 33,473 34,200 Contribution deficiency (excess) - - - - - - Employer covered payroll 2,177,991$ 2,094,807$ 2,026,330$ 2,000,474$ 1,973,650$ 1,902,256$ Contributions as a percentage ofcovered payroll 1.67% 1.77% 1.75% 1.74% 1.70% 1.80%
Schedule of Share of the Net Pension Liability
Schedule of Contributions
* GASB Statement #82 amended GASB Statements #67 & #68 to require the presentation of covered payroll, defined as payroll on which contributions to a pension plan are based, and ratios that use that measure. For the SURS plans, the covered payroll are those employees within the defined benefit plan.

UNIVERSITY OF ILLINOIS
Notes to Required Supplementary Information Year Ended June 30, 2019
68 (Continued)
Changes of benefit terms. There were no benefit changes recognized in the Total Pension Liability as of June 30, 2018.
Changes of assumptions. In accordance with Illinois Compiled Statutes, an actuarial review is to be performed at least once every three years to determine the reasonableness of actuarial assumptions regarding the retirement, disability, mortality, turnover, interest and salary of the members and benefit recipients of SURS. An experience review for the years June 30, 2014 to June 30, 2017 was performed in February 2018, resulting in the adoption of new assumptions as of June 30, 2018.
Salary increase. Decrease in the overall assumed salary increase rates, ranging from 3.25 percent to 12.25 percent based on years of service, with underlying wage inflation of 2.25 percent.
Investment return. Decrease the investment return assumption to 6.75 percent. This reflects maintaining an assumed real rate of return of 4.50 percent and decreasing the underlying assumed price inflation to 2.25 percent.
Effective rate of interest. Decrease the long-term assumption for the ERI for crediting the money purchase accounts to 6.75 percent (effective July 2, 2019).
Normal retirement rates. A slight increase in the retirement rate at age 50. No change to the rates for ages 60-61, 67-74 and 80+, but a slight decrease in rates at all other ages. A rate of 50 percent if the member has 40 or more years of service and is younger than age 80.
Early retirement rates. Decrease in rates for all Tier 1 early retirement eligibility ages (55-59).
Turnover rates. Change rates to produce lower expected turnover for members with less than 10 years of service and higher turnover for members with more than 10 years of service.
Mortality rates. Maintain the RP-2014 mortality tables with projected generational mortality improvement. Update the projection scale from the MP-2014 to the MP-2017 scale.
Disability rates. Decrease current rates to reflect that certain members who receive disability benefits do not receive the benefits on a long-term basis.
*Note: The University implemented GASB No. 68 in fiscal year 2015. The information above is presented for as many years as available. The Schedule is intended to show information for 10 years.

UNIVERSITY OF ILLINOIS
Required Supplementary Information Year Ended June 30, 2019
(in thousands)
69
June 30, 2018 June 30, 2017
2.89% 3.18%
$ 1,160,539 $ 1,314,760
7,052,321 10,142,951
8,212,860 11,457,711
Covered employee payroll $ 2,106,226 $ 2,023,794
389.93% 566.15%
Schedule of the University's Proportionate Share of the Net OPEB Liability
For the Plan Year Ended June 30
Proportionate share of the total OPEB liability as a percentage of its covered employee payroll
Measurement Date:
Proportionate percentage of the collective total OPEB liability
Proportionate share of the collective total OPEB liability
(in thousands)
Estimated proportionate amount of collective total OPEB liability associated with the University - State supported portion
Total OPEB liability associated with the University
*Note: The University implemented GASB No. 75 in fiscal year 2018; however, the amount reported for fiscal year 2018 was based on an actuarial date as of 6/30/17. The information above is presented for as many years as available. The Schedule is intended to show information for 10 years.

UNIVERSITY OF ILLINOIS
TABLE OF OPERATING EXPENSES For the Year Ended June 30, 2019
(In thousands)
70
Sa laries1
Benefi ts2
OPEB3
Pens ion Sub‐Tota l Benefi ts2
OPEB3
Pens ion Sub‐Tota l Tota l
Educational and genera l :
Ins truction 797,895 116,842 (5,149) 6,725 916,313 104,672 (165,190) 467,107 406,589 1,322,902 127,037 1,449,939
Research 358,917 150,261 (42,579) 17,314 483,913 14,665 (23,144) 68,937 60,458 544,371 270,974 815,345
Publ ic service 200,661 31,218 (26,963) 10,335 215,251 10,065 (15,884) 47,829 42,010 257,261 169,745 427,006
Academic support 248,753 14,239 (6,029) 3,414 260,377 31,576 (49,833) 151,458 133,201 393,578 152,479 546,057
Student services 93,753 10,626 (154) 444 104,669 12,263 (19,352) 54,648 47,559 152,228 64,896 217,124
Ins ti tutional support 147,241 6,523 (453) 1,387 154,698 19,707 (31,101) 93,750 82,356 237,054 59,880 296,934
Operation and
maintenance of plant 53,270 2,875 (15) 49 56,179 5,269 (8,316) 25,265 22,218 78,397 256,235 334,632
Scholarships and
fel lowships 1,696 1,640 (170) 36 3,202 13 (20) 74 67 3,269 53,988 57,257
Auxi l iary enterprises 108,357 5,208 ‐ 28 113,593 11,901 (18,782) 57,795 50,914 164,507 217,617 382,124
Hospi ta l and medica l
activi ties 345,233 1,339 (3) 474 347,043 47,300 (74,648) 227,178 199,830 546,873 404,413 951,286
Independent operations 721 345 (264) 613 1,415 65 (103) 321 283 1,698 7,194 8,892
Depreciation ‐ ‐ ‐ ‐ ‐ ‐ ‐ ‐ ‐ 244,185 244,185
Tota l 2,356,497 341,116 (81,779) 40,819 2,656,653 257,496 (406,373) 1,194,362 1,045,485 3,702,138 2,028,643 5,730,781 1 Salaries includes employer contributions for Socia l Securi ty, Medicare, and unemployment.2 Benefi ts includes certa in group insurance costs , such as healthcare and l i fe insurance. For the Univers i ty, i t also includes employer § 403(b) contributions .3 OPEB refers to other post‐employment benefi ts .
Compensation and Benefi ts
Other
Expenses
Tota l
Operating
Expenses
Univers i ty's Expenses State of I l l inois ' Expenses

UNIVERSITY OF ILLINOIS
TABLE OF OPERATING EXPENSES For the Year Ended June 30, 2018
(In thousands)
71
Salaries1
Benefi ts2
OPEB3
Pens ion Sub‐Tota l Benefi ts2
OPEB3
Pens ion Sub‐Tota l Tota l
Educationa l and general :
Ins truction 766,301 115,148 870 6,335 888,654 88,912 186,825 410,612 686,349 1,575,003 107,737 1,682,740
Research 349,169 149,613 6,329 16,947 522,058 12,179 25,592 58,565 96,336 618,394 240,182 858,576
Publ ic service 203,001 25,711 3,756 9,683 242,151 8,658 18,194 42,785 69,637 311,788 170,339 482,127
Academic support 239,945 14,841 1,042 2,569 258,397 26,189 55,029 131,005 212,223 470,620 148,904 619,524
Student services 89,260 10,177 17 54 99,508 10,226 21,487 48,028 79,741 179,249 58,545 237,794
Ins ti tutional support 137,942 5,921 57 517 144,437 16,355 34,365 80,849 131,569 276,006 34,661 310,667
Operation and
maintenance of plant 51,895 2,892 3 18 54,808 4,307 9,050 21,641 34,998 89,806 242,210 332,016
Scholarships and
fel lowships 1,607 14,363 16 40 16,026 23 49 125 197 16,223 53,899 70,122
Auxi l iary enterprises 105,379 4,628 ‐ 96 110,103 10,061 21,140 50,939 82,140 192,243 214,057 406,300
Hospita l and medica l
activi ties 322,044 1,045 ‐ 12 323,101 39,006 81,962 195,905 316,873 639,974 404,850 1,044,824
Independent operations 1,031 482 39 228 1,780 51 107 267 425 2,205 9,965 12,170
Depreciation ‐ ‐ ‐ ‐ ‐ ‐ ‐ ‐ ‐ ‐ 255,005 255,005
Total 2,267,574 344,821 12,129 36,499 2,661,023 215,967 453,800 1,040,721 1,710,488 4,371,511 1,940,354 6,311,865
1 Sa laries includes employer contributions for Socia l Securi ty, Medicare, and unemployment.2 Benefi ts includes certa in group insurance costs , such as heal thcare and l i fe insurance. For the Univers i ty, i t a lso includes employer § 403(b) contributions .3 OPEB refers to other post‐employment benefi ts .
Compensation and Benefi ts
Other
Expenses
Tota l
Operating
Expenses
Univers i ty's Expenses State of I l l inois ' Expenses

Office of Business Services 301 Coble Hall, MC-335
801 South Wright Street Champaign, Illinois 61820
University of Illinois FY19 Federal Compliance Audit Corrective Action Plans
Finding 2019-003 Failure to Meet Community Service Requirement
Plan: UIC: The University of Illinois at Chicago will continue to increase their contract provider list for the 2019-2020 academic year. UIS: The University of Illinois at Springfield is working to recruit more students for these positions and find providers closer to campus for the 2019-2020 academic year.
Expected Implementation Date: UIC: June 30, 2020 UIS: June 30, 2020 Contact: Kiely Fletcher, Director of Financial Aid and Scholarships Office of Student Financial Aid University of Illinois at Chicago 1200 W. Harrison (M/C 334), Suite 1800 Chicago, IL 60607 312-996-5563 Gerald Joseph, Associate Provost for Budget and Administrative Planning
Office of the Vice Chancellor for Academic Affairs One University Plaza, MS PAC 506 Springfield, IL 62703-5407 217-206-6003
Finding 2019-004 – Inadequate Procedures for Reporting and Closing out Federal Projects
Plan: The University continues to devote additional attention to close-out review and processing to improve the timeliness of project closeout. The post-award offices are in conversation with key University units to assist in identifying and preventing targeted late expenditure transactions. In relation to the incorrect CFDA numbers, the University of Illinois at Urbana-Champaign will ensure central grant management and departmental staff understand the importance of timely communication of CFDA notification and updates on all awards.

Phone 217 244 4483 • Fax 217 265 8197
Expected Implementation Date:
On-going
Contact: Linda Gregory, Director, Sponsored Programs Administration Post-Award University of Illinois at Urbana-Champaign 1901 S. First Street, Champaign, IL 61820 217-333-4881 Karen McCormack, Executive Director, Office of Sponsored Programs University of Illinois at Chicago 809 S. Marshfield Ave., MC 551 Chicago, Illinois 60612 312-996-0624
Finding 2019-005 – Inadequate Procedures for Verifying Participant Eligibility Plan: The University will continue to improve procedures for verifying participant eligibility. The additional staff hired to review the participant eligibility calculation prior to submission to IDHS will continue to participate in ongoing training and provide support to the process.
Expected Implementation Date: April 2019
Contact: Linda Gregory, Director, Sponsored Programs Administration Post-Award University of Illinois at Urbana-Champaign 1901 S. First Street, Champaign, IL 61820 217-333-4881
Finding 2019-006 Improper Indirect Cost Rates
Plan: The University will emphasize the importance of correct indirect cost rate entry.
Expected Implementation Date: April 2020 Contact: Linda Gregory, Director, Sponsored Programs Administration Post-Award University of Illinois at Urbana-Champaign 1901 S. First Street, Champaign, IL 61820 217-333-4881