Russian Duma Elections in the Territorial Districts: Explaining Patterns of Proliferation of...
296
Russian Duma Elections in the Territorial Districts: Explaining Patterns of Proliferation of Independent Candidates, 1993-1999 Carlo Gallo London School of Economics and Political Science, University of London Thesis submitted in partial fulfilment of the requirements for the degree of Doctor of Philosophy 2004
Transcript of Russian Duma Elections in the Territorial Districts: Explaining Patterns of Proliferation of...

Russian Duma Elections in the Territorial Districts:
Explaining Patterns of Proliferation of
Independent Candidates, 1993-1999
Carlo Gallo
London School of Economics and Political Science,
University of London
Thesis submitted in partial fulfilment of the
requirements for the degree of Doctor of Philosophy
2004
2
Declaration
I certify that the thesis I have presented for examination for the MPhil/PhD degree of
the London School of Economics and Political Science is solely my own work other
than where I have clearly indicated that it is the work of others (in which case the extent
of any work carried out jointly by me and any other person is clearly identified in it).
The copyright of this thesis rests with me as its author. Quotation from it is
permitted, provided that full acknowledgement is made. This thesis may not be
reproduced without my prior written consent.
I warrant that this authorisation does not, to the best of my belief, infringe the rights
of any third party.
I declare that my thesis consists of 88,082 words.
Abstract
In the first decade after the collapse of the Soviet Union, independent candidates have
proved remarkably successful in Russian parliamentary elections, more so than in other
post-communist countries with comparable electoral systems. Existing explanations of
the proliferation of the independents have been mostly cursorily and have focused on
the national level, thus failing to address wide sub-national variations.
This thesis presents a quantitative analysis of the sub-national variation in the
proliferation of independent candidates in the first three Duma elections. A macro-
political framework relies on aggregate data, with single-member districts constituting
the units of analysis, in order to study how causal relationships vary across federal units.
The phenomenon under study, i.e. independents’ success, is measured as the district
vote share received collectively by non-partisans.
Explanatory variables are measured at the level of federal units and electoral
districts. Given that the data structure is hierarchical (i.e. districts are nested within
regions) and that the proposed explanatory framework posits regional level effects,
multi-level modelling provides the appropriate quantitative tool of analysis. The main
findings include the positive impact of centre-regional conflicts on independents'
success under institutional rules discouraging regionalist parties, and the growing
importance of the political alignment of regional governors.

3
Contents
FIGURES, TABLES AND MAPS ............................................................................................... 6
ACRONYMS ................................................................................................................................ 9
RUSSIAN POLITICAL PARTIES, ELECTORAL BLOCS AND ASSOCIATIONS .............................. 9
OTHER .................................................................................................................................. 9
A NOTE ON TRANSLITERATION ......................................................................................... 10
ACKNOWLEDGEMENTS ........................................................................................................ 11
1. INTRODUCTION: INDEPENDENTS, PARTIES AND DEMOCRACY ...................... 14
1.1 PARTIES, DEMOCRATIC CONSOLIDATION AND FEDERAL STABILITY ......................... 16
Parties and democratic consolidation ................................................................. 17
Parties and federal stability ................................................................................. 20
1.2 RUSSIA AND THE OTHER PARTY SYSTEMS OF THE THIRD WAVE .............................. 22
Party system (under)institutionalisation .............................................................. 24
Patterns of independents' proliferation in Russian SMDs ................................... 27
1.3 RESEARCH DESIGN .................................................................................................... 40
CONCLUSION AND PLAN OF THE THESIS ............................................................................ 43
2. RUSSIAN PARTY UNDERDEVELOPMENT: THE EXISTING LITERATURE ....... 46
2.1 EARLY INVESTIGATIONS: FROM DESCRIPTION TO EXPLANATION (1988-1993) ........ 49
The causes of the initial underdevelopment ......................................................... 52
2.2 THE UNFOLDING OF PARTY POLITICS (1995-1999): PESSIMISTS AND OPTIMISTS ...... 64
2.3 TERRITORIAL DISTRICTS AND TERRITORIAL POLITICS .............................................. 69
CONCLUSION ..................................................................................................................... 77
3. EXPLANATORY FRAMEWORK ..................................................................................... 79
3.1 THE MAIN HYPOTHESIS: TERRITORIAL CLEAVAGES AND INDEPENDENTS'
COMPETITIVE ADVANTAGE ....................................................................................... 81
The independents' representation function .......................................................... 83

Contents
4
What is a territorial cleavage and what is it in the Russian context? ................. 87
3.2 THE MODERATING EFFECT OF CENTRAL APPEASEMENT AND (PSEUDO-)REGIONALIST
PARTIES ..................................................................................................................... 90
(Pseudo-)regionalist and interregional parties ................................................... 91
Central response to regionalist demands ............................................................ 92
Sub-regional assertiveness? ................................................................................ 94
3.3 THE "SUPPLY SIDE": NOTABLE CANDIDATES AND PARTY CHALLENGERS ................. 96
Candidates' personal resources ........................................................................... 96
Party challenge .................................................................................................... 98
Geographic accessibility of regions..................................................................... 98
3.4 ADMINISTRATIVE RESOURCES ................................................................................ 100
The governor's support of Duma candidates ..................................................... 101
Governor's control of regional politics .............................................................. 101
CONCLUSION ................................................................................................................... 103
4. FROM HYPOTHESES TO DATA: OPERATIONAL DEFINITIONS ........................ 108
4.1 "MEASURING" REGIONALIST ASSERTIVENESS ........................................................ 110
Dowley's index ................................................................................................... 111
For a time-specific index ................................................................................... 114
Corroborating the index .................................................................................... 119
Central appeasement ......................................................................................... 124
4.2 THE SUPPLY SIDE OF THE ELECTORAL MARKET ...................................................... 128
Notable candidates ............................................................................................ 128
Party challengers ............................................................................................... 131
The electoral process and Governor's involvement ........................................... 132
Urbanisation and Campaign access to districts ................................................ 135
CONCLUSION ................................................................................................................... 137
5. DESIGNING THE EMPIRICAL ANALYSIS ................................................................. 138
5.1 THE DEPENDENT VARIABLE: UNIT OF ANALYSIS AND MEASUREMENT ................... 139
A) The district winner ........................................................................................ 142
B) Highest ranking ............................................................................................. 142
C) Average ranking ............................................................................................ 143
D) Total vote share ............................................................................................ 143
5.2 CASE SELECTION AND DATA STRUCTURE ............................................................... 145
Data structure: SMDs in regions ....................................................................... 146

Contents
5
SMDs socio-demographic characteristics ......................................................... 148
5.3 THE STUDY OF CONTEXT ......................................................................................... 150
Quantitative technique: Multilevel modelling ................................................... 152
CONCLUSION ................................................................................................................... 158
6. THE 1993 DUMA ELECTIONS ....................................................................................... 160
6.1 BACKGROUND ......................................................................................................... 161
The contestants .................................................................................................. 162
Federal relations in the 1991-1993 period ........................................................ 165
6.2 ANALYSIS ................................................................................................................ 168
The models ......................................................................................................... 175
CONCLUSION ................................................................................................................... 187
7. THE 1995 DUMA ELECTIONS ....................................................................................... 188
7.1 BACKGROUND ......................................................................................................... 189
The contestants .................................................................................................. 189
Federal relations in the 1994-1995 period ........................................................ 194
7.2 ANALYSIS ................................................................................................................ 195
The models ......................................................................................................... 203
CONCLUSION ................................................................................................................... 215
8. THE 1999 DUMA ELECTIONS ....................................................................................... 217
8.1 BACKGROUND ......................................................................................................... 218
The contestants .................................................................................................. 218
Federal relations in the 1996-1999 period ........................................................ 221
8.2 ANALYSIS ................................................................................................................ 223
The models ......................................................................................................... 229
CONCLUSION ................................................................................................................... 240
9. CONCLUSION ................................................................................................................... 242
9.1 A SUMMARY OF THE THESIS .................................................................................... 242
9.2 IMPLICATIONS FOR THE SCHOLARLY UNDERSTANDING OF RUSSIAN ELECTIONS ... 249
9.3 COMPARATIVE IMPLICATIONS ................................................................................. 251
APPENDIX .............................................................................................................................. 255
BIBLIOGRAPHY ................................................................................................................... 263

6
Figures, Tables and Maps
Figures Page
Figure 1.1: Total number of candidates, 1993, 1995 and 1999 .................................................. 29
Figure 1.2: Average independents' success, 1993, 1995 and 1999 ............................................. 30
Figure 1.3: Effective number of candidates, 1993, 1995 and 1999 ............................................. 31
Figure 1.4: Percentage of SMD candidates running as independents, 1993, 1995 and 1999 .... 32
Figure 1.5: Average vote share "against all", 1993, 1995 and 1999 .......................................... 32
Figure 1.6: Independents' success by federal status and year .................................................... 37
Figure 1.7: Independents' success by economic region. Averages across the three elections .... 38
Figure 1.8: Independents' success by economic region and year ............................................... 39
Figure 3.1: Diagram of causal paths posited by the theoretical framework ............................. 106
Figure 4.1: Average assertiveness of regions across time ........................................................ 116
Figure 4.2: Regional assertiveness in the periods before and after 1993 elections. ................. 116
Figure 4.3: Is Dowley's index consistent with Alexseev's typology? ......................................... 120
Figure 4.4: Federal status and Dowley's index ......................................................................... 121
Figure 4.5: Effect of economic dependency on assertiveness, by federal status ....................... 122
Figure 4.6: Dowley's index and regional ethnic composition ................................................... 122
Figure 4.7: Interaction between share of Russians and fragmentation of non-Russian
populations ............................................................................................................. 123
Figure 6.1: Main hypothesis: predicted bivariate relationship, from final model .................... 182
Figures 6.2-3: Nomination of Russia's Choice candidates in regions scoring below (left) and
above (right) the median score of regionalist assertiveness. ................................. 183
Figure 6.4: The impact of regional assertiveness on KPRF entry decisions ............................. 186
Figure 6.5: The impact of regional assertiveness on LDPR entry decisions............................. 186
Figure 7.1: Number of SMD candidates, 1993 and 1995 .......................................................... 190
Figure 7.2: Main hypothesis, predicted bivariate relationship, from final model .................... 212
Figure 7.3: The impact of regional assertiveness on KRO entry decisions............................... 214
Figure 8.1: Number of SMD candidates, 1993, 1995 and 1999 ................................................ 220
Figure 8.2: Governor's support for SMD candidates, by party ................................................. 234

Figures, Tables and Maps
7
Figure 8.3: The cross-level interaction between Governor's support and freedom of speech .. 238
Figure A.6.1: The impact of regional assertiveness on APR entry decisions ........................... 261
Figure A.6.2: The impact of regional assertiveness on Russia's Choice entry decisions ......... 261
Figure A.6.3: The impact of urbanisation on Russia's Choice entry decisions ........................ 262
Tables Page
Table 1.1: Transience of major Russian parties in the 1990s ..................................................... 26
Table 1.2: Cross-district variability in key traits of electoral competition (1993) ..................... 28
Table 1.3: Regions' federal status ............................................................................................... 35
Table 1.4: Regions with independent winners in all three elections ........................................... 36
Table 1.5: Regions with party winners in all three elections ...................................................... 36
Table 3.1: Summary of explanatory framework ........................................................................ 104
Table 4.1: Dowley's index (the type of federal arrangement favoured by a region) ................. 112
Table 4.2: Ranking of regions on Dowley's index ..................................................................... 113
Table 4.3: Population living in areas difficult to reach (%), selected regions. ........................ 136
Table 5.1: Example of district electoral results (SMD 32, 1999) ............................................. 141
Table 5.2: Data structure .......................................................................................................... 146
Table 5.3: Number of SMDs in regions..................................................................................... 147
Table 5.4: Variability of sociological characteristics of SMDs ................................................ 149
Table 6.1: Party nominations in the SMDs (totals)................................................................... 164
Table 6.2: Variables used in the models of the 1993 election, descriptive statistics ................ 172
Table 6.3: Predicting independents' success. Estimated multilevel models (0-2) ..................... 176
Table 6.4: Predicting independents' success. Estimated multilevel models (3-4) ..................... 178
Table 6.5: Predicting independents' success. Estimated multilevel model 5 ............................ 181
Table 6.6: Predicting party entry in SMD races. Logistic multilevel models ........................... 185
Table 7.1: Party nominations and victories in the SMDs ......................................................... 192
Table 7.2: Independent variables in models, descriptive statistics ........................................... 200
Table 7.3: Predicting independents' success. Estimated multilevel models (0-2) ..................... 204
Table 7.4: Predicting independents' success. Estimated multilevel models (3-5) ..................... 206
Table 7.5: Predicting independents' success. Estimated multilevel models (6-7) ..................... 210
Table 7.6: Predicting party entry decision. Logistic multilevel models .................................... 213
Table 7.7: Predicting the nomination decisions of notable candidates.
Logistic multilevel models ........................................................................................ 214
Table 8.1: Party nominations and victories in the SMDs ......................................................... 219

Figures, Tables and Maps
8
Table 8.2: Independent variables in models, descriptive statistics ........................................... 226
Table 8.3: Predicting independents' success. Estimated multilevel "Null model" .................... 229
Table 8.4: Predicting independents' success. Estimated multilevel models (1-3) ..................... 230
Table 8.5: Predicting independents' success. Estimated multilevel models (4-6) ..................... 231
Table 8.6: Predicting independents' success. Estimated multilevel model 7 ............................ 233
Table 8.7: Predicting independents' success. Estimated multilevel models (8-10) ................... 235
Table 8.8: Predicting independents' success. Estimated multilevel models (11-12) ................. 239
Table A.1.1: Federal units in economic regions ....................................................................... 255
Table A.4.1: Ranking of regions on Dowley's index, with time-specific mean scores .............. 256
Table A.4.2: Ranking of regions on Dowley's index adjusted for 1999 .................................... 259
Maps Page
Map 1.1: District winners, 1993, 1995 and 1999 ....................................................................... 34
Map 4.1: Cross-regional variation on Dowley's index ............................................................. 118
Map 4.2: Regional levels of freedom of speech ........................................................................ 134
Map 5.1: Measuring the success of independent candidates as total vote share, 1995 ............ 144
Map 5.2: SMDs in Regions. European Russia, the Urals and North Caucasus ....................... 148
Map 8.1: Regional concentration of the OVR vote, PR tier, 1999 Duma elections .................. 236

9
Acronyms
The adopted acronyms for parties, electoral blocs and associations are the most widely
used forms in the western literature. In some cases, these correspond to the transliterated
Russian acronyms. In such cases, the English translation of the full name is given in the
list below (e.g. OVR for Otechestvo - Vsya Rossiya, "Fatherland-All Russia"). When the
most common version is the English one, the transliterated Russian acronym is added in
parentheses in the list below (e.g. CEC for Central Electoral Commission (TsIK)).
Russian political parties, electoral blocs and associations
APR Agrarian Party of Russia
DPR Democratic Party of Russia
KEDR Constructive Ecological Movement of Russia
KPRF Communist Party of the Russian Federation
КRO Congress of Russian Communities
LDPR Liberal Democratic Party of Russia
NDR Our Home is Russia
NRPR National-Republican Party of Russia
OVR Fatherland - All Russia
PRES Party of Russian Unity and Concord
PST Party of Workers' Self-Government
RDDR Russian Movement for Democratic Reforms
SPS Union of Right Forces
SSR Union of collective owners of Russia
Other
ANCOVA Analysis of Covariance
CEC Central Electoral Commission (TsIK)

Acronyms and Transliteration
10
CPSU Communist Party of the Soviet Union (KPSS)
GIS Geographic Information Systems
IGLS Iterative Generalised Least Squares
OLS Ordinary Least Square
NRB New Russia Barometer
PSOE Socialist Workers' Party (Spain)
RIGLS Restricted Iterative Generalised Least Squares
SMD Single-Member District
VTsIOM All-Russian Centre for the Study of Public Opinion
A Note on Transliteration
Russian names have been transliterated according to the Library of Congress system.
Exceptions have been made to conform to widely used forms. In particular, the Russian
letters ю and я are transliterated as 'yu', 'ya', respectively (e.g. 'Chechnya' instead of
'Chechnia'). The letter й is rendered with 'i'. Moreover, the transliterated form of
surnames starting with the Russian е begins with 'Ye' (e.g. 'Yeltsin' instead of 'Eltsin'),
while surnames ending with the Russian -uй, end with 'y' (e.g. 'Ostrogorsky', instead of
'Ostrogorskii'). Finally, the characters ' and '' for the Russian soft and hard signs have
been omitted.

11
Acknowledgements
The writing of this Ph.D. thesis has been fundamentally an individual endeavour.
However, I have been privileged enough to receive valuable advice from many quarters,
primarily from the academic staff of the LSE, where I carried out most of my doctoral
work.
My supervisor at LSE, Dr. James Hughes, has been the steadiest source of advice
along all the stages of the PhD process. His patient look over my work has made me
aware of numerous potential pitfalls, while exposing me to his expertise on Russian
regionalism and Russian politics in general.
I am deeply grateful to Dr. Torun Dewan for accepting to join the supervision of my
thesis as adjunct advisor. I learnt extensively from his advice on methodology and
statistical modelling. Torun has also been a meticulous and tireless reader of subsequent
chapter drafts.
Several other members of the LSE Government Department got involved in the three
annual reviews of my progress. This gave me the opportunity to receive focused
comments from a wide range of perspectives. In chronological order, I want to thank
Professor Gordon Smith, Dr. Vesselin Dimitrov, Dr. Gwen Sasse, and Professor
Dominic Lieven for their insightful remarks.
Additionally, I am warmly grateful to Dr. Cheryl Schonhardt-Bailey, for reviewing
an early draft of statistical analysis, and to Professor Rodney Barker for his guidance in
the first year, as Convenor of the Departmental Research Seminar, and thereafter for his
availability to all research-related enquiries. I am also grateful to fellow LSE students
and to the convenors of research seminars run within the department, for their feedback
on work in progress. In other colleges and schools of the University of London, I had
very stimulating talks on Russian party politics with Dr. Ruth Brown of the School of
Slavonic and East European Studies and on quantitative techniques of analysis with Dr.
Peter John of Birbeck College. I thank both for their kind availability.

Acknowledgements
12
The interaction with the institution of formal registration, however, only accounts for
a part of the intellectual debt accumulated over the years. Since 1996, Professor Victor
Zaslavsky, my first-degree mentor at LUISS University (Rome), has been an invaluable
and continuing source of inspiration, advice and support. His scholarship fundamentally
shaped the way I see Russian politics well in advance of the start of the doctoral
programme.
Scholars based in Italy with whom, at different stages of my research, I was lucky to
exchange ideas include Philippe Schmitter, Gianfranco Poggi and Stefano Bartolini at
the European University Institute and with Leonardo Morlino at the University of
Florence. To all go my warm thanks.
A European Union Tempus mobility grant allowed me to spend three months at the
European University in St. Petersburg (EUSP), in the autumn/winter of 2001-02. There,
I could exchange views with two influential Russian political scientists, Dr. Vladimir
Gelman and Dr. Grigory Golosov, whom I thank for sharing their time. Additionally, I
spent three months in Moscow. Among the Russian experts and scholars contacted
during that period, special thanks are due to Dr. Lev Gudkov, vice-director of VTsIOM
(now "Tsentr-Levada") and to his collaborators, as well as to Dmitri Oreshkin, Director
of the Merkator Institute, Moscow. Their direct experience and close observation of
Russian electoral politics proved extremely valuable and different from many simplistic
western accounts. I am also grateful to the several Russian fellow aspiranty and friends
I met during my Russian stay. They were all very generous in contributing their views
on Russian current affairs and in introducing me to their way of living.
An important input to my work also came from the US, in the form of data that a
number of academics were kind enough to share with me. I am very grateful to
Professor Henry Hale of Indiana University for letting me use his data on two of the
variables I use in the analysis of the 1999 elections. I am also indebted to Professor
Kathleen Dowley (SUNY-New Paltz University), who allowed me to use her raw data
on Russian regions' autonomism. I also wish to thank Dmitri Sharkov and Alexander
Perepechko (University of Washington) for sharing the GIS data that allowed me to
produce the maps of Russia included in this thesis. Many thanks are also due to
Professor Timothy Colton at Harvard and Professor Robert Moser at University of

Acknowledgements
13
Texas at Austin for sending me a copy of the unpublished 1993 vote count in the
territorial districts.
For substantial financial support I am deeply grateful to the LSE Government
Department, which awarded me a three-year Doctoral Research Fellowship, and to the
Economic and Social Research Council, for covering the school fees (scholarship
number R42200034319).
Finally, none of the above could match the unabated moral and material support I
received from my family and, in recent years, from Paula.
All errors and omissions remain mine.

14
1
Introduction: Independents, Parties and Democracy
"Are party-political politicians good for
democracy? Politicians are elected to serve
their constituents. More often than not they
turn their backs on their constituents and toe
a party line. Having independent politicians
ought to be mandatory and not simply a
novelty".
Paul "R.", UK1
The anonymous participant to a BBC on-line forum, quoted in the epigraph, was
probably dismayed at the results of the 2001 British parliamentary election, which
returned no independent candidate. By contrast, it seems, Paul "R" would be very happy
of electoral returns like post-communist Russia's …at least in terms of independents'
success. Indeed, Russian parliamentary elections have seen non-party candidates gain
between 34 and 64 percent of the plurality seats in the first three elections held after the
collapse of the Soviet Union.2 Contrary to Paul "R", most political scientists agree that
political parties are necessary to the functioning of democracy and this is why the
proliferation of independent candidates is an important and alarming phenomenon.
There are very good reasons why Russian and British voting behaviour should differ
markedly in the success of the independents. On the one hand, this is just one aspect of
a more general difference in the degree of party system institutionalisation between
established and young democracies, particularly of the post-communist kind. On the
other hand, Russia has shown a particularly marked pattern of party weakness, even
1 Contributor to the on-line forum on "Are independent politicians good for democracy?", hosted by the
BBC NEWS web site, in the section "Talking Point", 23 May 2001. Accessed August 2003 at:
http://news.bbc.co.uk/vote2001/hi/english/talking_point/newsid_1330000/1330549.stm . 2 In the latest vote of December 2003, the independents won 30 percent of the plurality seats. The scope
of this thesis, however, is confined to the elections of the 1990s.

1. Introduction 15
compared to other post-communist cases. A combination of these two perspectives, i.e.
the typical party underdevelopment observed in transitional settings and the specific
problems of Russian party weakness, is usually invoked to explain the proliferation of
independent candidates. In this vein, the phenomenon is seen as caused by socio-
economic and cultural legacies of the Soviet system and by the new institutional and
strategic choices of post-communist Russian rulers.
This conventional wisdom is based on national factors. As such, it can aptly inform
cross-national comparisons, such as between the UK and Russia, but cannot solve the
intellectual paradox of sub-national variation. Clearly, accounts based on country effects
are liable to miss a good deal of information if the phenomenon to be explained varies
significantly within the country.
This thesis aims to address this intellectual paradox and explain sub-national
differences in the proliferation of independent candidates in Russian Duma elections.
The Duma is the Lower House of the Russian Federal Parliament, the most important of
the two chambers of the Parliament and the only elective one.3 The Duma is elected
through a mixed electoral formula. Half of its members, or 225 deputies, are chosen
from closed party lists in one all-Russian proportional representation constituency,
subject to a 5 percent threshold. The other half of the Duma is elected in 225 Single-
Mandate Districts (SMDs) with plurality method, provided that at least 25 percent of
eligible voters turn out to vote and that the winner receives more votes than the option
"against all candidates".4 This mixed electoral system is "parallel", in the sense that
"there is no linkage between tiers in the allocation of seats to parties" (Shugart and
Wattenberg 2001: 13-14).
In the terminology of Russian law, the "independent candidate" is an individual who
"presents himself" or is "presented by a group of voters" for election, as opposed to
candidates who register as party-affiliated with the electoral commission.5
By
definition, independent candidates cannot appear on the proportional representation
(PR) ballot, which includes lists of candidates affiliated with political parties or
3 The other chamber of the Parliament, the Council of the Federation, was only elected the first time in
1993. It has been formed by co-optation or by appointment thereafter. 4 In addition to expressing a preference for a candidate, the Russian voter can also tick the box "against all
candidates" on the SMD ballot.

1. Introduction 16
electoral associations. Therefore, the independents are a phenomenon of the plurality
tier only.6 For this reason, this thesis is only concerned with the vote in the SMDs.
This chapter has a number of tasks. The first section (1.1) motivates a study of the
independents in the light of ongoing theoretical debates on the role of parties in the
consolidation of democracy and in the stabilisation of federations. The second section
(1.2) compares Russia with other cases of recent democratisation along key dimensions
of party system institutionalisation, including independent candidates' proliferation. The
same section also presents a description of the spatial variability in independents'
success across Russia, or the variance of the "dependent variable" of this thesis. Based
on this descriptive account, the case is argued for a large-n research design (section 1.3,
the details on data and research design are deferred to chapters 4 and 5). A concluding
section presents the chapter structure of the thesis.
1.1 Parties, democratic consolidation and federal stability
Why should anybody be interested in the proliferation of independent candidates? The
most common view on this question, shared by virtually all works on Russian elections,
is that the independents are a sign of party weakness (White, Rose and McAllister 1997;
Munro and Rose 2002; Golosov 1997, 2002; Moser 1999, 2001).7 This, in turn, is
alarming because parties are considered fundamental institutions of democracy, key
instruments for democratic consolidation, and primary agents of federal stability. In
short, the success of independent candidates is important because parties are.
To be sure, the claim that parties are the only agents of democratic electoral
representation and national integration is, to some degree, subject to qualification (see
this section, below). However, this conventional wisdom provides a preliminary
justification for the subject of this research.
5 The electoral rules were initially introduced by presidential decree on 1 October 1993. The main
subsequent electoral legislation (in English translation) is available at the website of the Essex University
project on elections, www.essex.ac.uk/elections/. 6 However, in 1995, one electoral bloc defined itself as a gathering of independent candidates, the "Bloc
of Independents", and ran in both PR and SMD tiers. In the literature, it is considered a marginal party
because it only received 0.1 percent of the list vote. However, it will be shown that it did have an impact
on the chances of "individual" independents in the plurality districts.

1. Introduction 17
Usually, a corollary of this view is that the independents are a form of disturbance or
"noise" which hampers the smooth functioning of elections. In fact, a central argument
of this thesis is that the independents should be seen under a different light, as providers
of a specific function of democratic representation, rather than just signals of party
weakness. This interpretation will be elaborated upon in the chapter on the explanatory
framework (chapter 3) and in the analysis part (chapters 6-8). At this stage, the
justification of this research can be preliminarily based on the widely shared view that
the independents reflect party underdevelopment and that parties are important
institutions. The reminder of this section reviews these claims.
Parties and democratic consolidation
If political parties play a key role in the working and consolidation of democracy, and
democracy is a valued outcome, then the proliferation of independent candidates
represents an important problem. Indeed, by the first half of the last century, few
arguments in political science had received so much and so clear support than the
proposition that modern (i.e. representative) democracy is only conceivable in terms of
party democracy (Kelsen 1929; Finer 1949; Schattchneider 1942).8 This consensus,
however, has not always gone unchallenged. Fierce opponents to the very idea of
"party" were among the founders the first modern democracy, the USA.9 Even the first
systematic students of political parties, Bryce (1888), Ostrogorsky (1912), and Michels
(1915), while admitting the central role that they had come to play in modern
democracies, sharply criticised their organisational distortions.
In the contemporary debate as well Philippe Schmitter has stressed that other
agencies of representation, namely corporatist organisations, have replaced parties in
7 For a study that uses the proliferation of the independents as a quantitative indicator of party
underdevelopment, see Ishiyama and Kennedy (2001). 8 Some emblematic quotes include the following. "Parties are inevitable. No one has shown how
representative government could be worked without them" (Bryce 1921: 119). "Modern democracy
depends directly on political parties, whose importance becomes the greater the more strongly the
democratic principle is realised" (Kelsen 1929: 19). "Representative government is party government"
(Finer 1949: 237) -the latter two are quoted in Hofstadter (1969: 7). "The political parties created
democracy . . . and modern democracy is unthinkable save in terms of the parties" (Schattchneider 1942:
1). 9 The distrust of parties, seen as factions endangering social harmony and unity, has a long tradition from
Rousseau to the Founding Fathers. "And so strong was this tradition that even as late as 1861, long after
his own country was well launched upon the development of its two-party system, John Stuart Mill could
write an entire treatise, Considerations on Representative Government, in which he never elaborated upon
the role of party" (Hofstadter 1969: 51-2).

1. Introduction 18
important policy domains. More specifically, in terms of democratic consolidation,
Schmitter argues that parties are not the only key actors, and that interest groups should
not be overlooked (Schmitter 1992, 2001). Finally, today, the most established
democracies are precisely those showing the clearest signs of 'party decline'. The role of
parties in political life declined precisely where they are supposed to be more stable,
more deeply rooted in society, more cohesive, and better organised (Wattenberg 1996;
Pharr and Putnam 2000; Dalton and Wattenberg 2000). On the other hand, Katz and
Mair (1993) and Mair (1994) show that it is only one type of party, the traditional mass
party, that is declining. Parties as such are still 'alive and kicking' in Western
democracies. They virtually monopolise access to public office (especially legislative
office) and have secured state funding and other resources for their survival.
For the USA, Aldrich reminds us that "the path to office for nearly every major
politician begins today, as it has for over 150 years. … All serious candidates seek their
party's nomination, and they become serious candidates in the general election only
because they have won their party's endorsement" (Aldrich 1995: 14). Even candidates
endowed with personal resources follow this pattern, if it is true that "autonomous,
ambitious candidates are nonetheless overwhelmingly partisans" (Aldrich 1995: 289).
Moreover, if the importance of the party institution is declining in established
democracies, this can be distinguished from its contribution to the process of
establishing new democracies.10
In this regard, Morlino has described the process of
democratic consolidation in Southern Europe as "party-centred" and political parties as
its "protagonists" (Morlino 1995, 1998). This is because of their peculiar ability in
"forming, maintaining, expressing, and deepening attitudes relating to regime
legitimacy or illegitimacy" (Morlino 1995: 315).
Parties can fulfil this legitimising role by stabilising electoral behaviour (reducing
electoral volatility, reducing the chances for successful new parties), by establishing
stable links with civil society, and by 'controlling' the electorate and reducing anti-
system alienation through their organisational roots in society (Morlino 1995: 330-1).
All these developments are empirically associated with successful consolidations.
10
This parallels Rustow's distinction between the study of the conditions sustaining established
democracy and those for the genesis of democracy (Rustow 1970: 337-40). He claimed that to study the
genesis of democracy is a peculiar task, quite distinct from the study of the conditions that sustain an
already established democracy.

1. Introduction 19
However, not all consolidations have required these developments. As Toka notes, in
Eastern Europe, masses and elites have accepted democracy as 'the only game in town'
before political parties came to play a significant role in politics.11
Another possible way to argue that parties are important for democracy is in relation
to the values underpinning the chosen definition of democracy. To paraphrase Katz's
observation on the role of elections, "the debate over the value and the place of parties
in modern democracy stems from the problem of defining democracy itself" (Katz
1997: 4, where the word is elections instead of parties). One key value of normative
definitions of democracy is the accountability of rulers towards the ruled. In the context
of the present inquiry, it can be argued that individualised representation by non-party
candidates, while at least as good as party representation for a number of purposes (e.g.
for the articulation and expression of interests), is inferior to party representation in
terms of structuring the political arena and allowing the collective accountability of
elected officials. "Within the mass societies of modern states, if some degree of
responsibility and accountability is to be enforced, candidates need also to be organized
in competing teams, i.e. political parties. Thus office-holders who are little known to
most individual electors can at least be associated with a definite group, which is tied
both to a specific record in government and to certain pronouncements about future
performance" (Budge and Keman 1990: 5).
Therefore, in the most common normative definitions of democracy, political parties
are seen as essential in relation to such values as structured representation and
accountability implicit in the definition. As MacIver (1947: 210) put it: "The principle
of representation had to be vitalized by the conflict of parties. When parties flourish we
have in effect passed from a pre-democratic mode of representative government to a
genuinely democratic one".12
Aldrich points more precisely to the link between parties
and the collective accountability of rulers:
"Each official can be held accountable for his or her own personal actions by
the constituency that elects and reelects that official. But government policy
11
The alleged impact of the institutionalisation of the party system on democratic consolidation is
understood by Mainwaring and Scully as mediated by the increase in the efficiency of policy making, but
government stability and quality of policies do not seem to be associated. Neither, has party system
institutionalisation much to do with the legitimacy of the democratic regime. East and West Europe do
not differ in popular trust of elected officials, despite having different levels of party system
institutionalisation (Toka 1997: 118). 12
Quoted in Hofstadter (1969: 7).

1. Introduction 20
is determined by the collective actions of many individual office holders. No
one person either can or should be held accountable for actions taken by the
House, Senate, and president together. The political party as a collective
enterprise, organizing competition for the full range of offices, provides the
only means for holding elected officials responsible for what they do
collectively" (Aldrich 1995: 3).
Clearly, it is not only partisan vs. non-partisan representation that matters. The type
of parties that emerge also has a bearing on the "viability of democracy".13
In the
context of third-wave and post-communist party systems, moreover, a positive effect of
the institutionalised party system has been noted on the quality of democracy, i.e. the
capacity to go beyond democracy's procedural minimum and "give meaning" to
elections (Mainwaring 1999; Toka 1997; Kitchelt et al. 1999).14
In sum, despite trends of party decline in advanced democracies, and the possibility
of party substitutes in the form of interest groups and corporatist organisations, the party
institution is still necessary to achieve the collective accountability of rulers, the
legitimisation of newly established democracies and their consolidation through
improved "quality".
Parties and federal stability
The conventional view that political parties are the main agents of representation and
channelling of popular demands also includes parties' role with regard to regionalist
demands. In other words, "in democratic societies political parties are the main agents
responsible for articulating interests including those based on regional or provincial
distinctiveness" (McKay 2000: 5-6). However, the often-posited role of parties in
centre-regional relations goes well beyond mere representation. Contrary to the 18th
century view of parties as factions that would inevitably threaten the integrity of any
political community, such as shared, for example, by the authors of the American
Federalist Papers (Hofstadter 1969), in the last four or five decades great hopes came to
be attached to the role that parties can play in moderating regionalist demands and
fostering federal stability.
13
"The way parties operate and create linkages of accountability and responsiveness to citizens is likely
to have major consequences for the viability of democracy and the quality of its outputs" (Kitschelt et al.
1999: 15). 14
"Without parties to structure the campaign, to provide continuity from one election to the next, and to
provide links among candidates in different localities and for different offices, the resulting elections are
unlikely to be meaningful, even if they are technically free." (Katz 1980: 1; quoted in Toka 1997: 122).

1. Introduction 21
William Riker, Donald Horowitz and many others have stressed this link between
party development, national integration and to federal stability. Riker (1964) argues that
centralised party systems tend to foster centralised federations. To that end, it is
important that the parties in charge of national government are also in control of lower
levels of administration. This argument is based on the view that national parties can
integrate and moderate centrifugal forces, primarily territorial cleavages in federal
settings.
A recent formulation of this thesis is due to Filippov, Ordeshook and Shvetsova
(2004), who argue that well-crafted institutional arrangements can induce the
emergence of a particular type of party, the "integrated party", in which ambitious
politicians face an incentive to avoid mobilising divisive issues and to moderate
centrifugal demands from their territorial constituents. This concept is based on the
historical experience of the US party system, but is considered potentially exportable in
all federations, given the correct set of institutional incentives. Office seekers will be
willing to be "imperfect representatives of their constituents" because they need to be
part of a nation-wide organisation in order to win as much as possible, mainly counting
on the coattail effect produced by popular presidents or presidential candidates. As they
put it, "local and regional politicians will not seek to disrupt unduly the functions of the
federal government for fear of damaging the electoral standing of national politicians
from their party and, thereby, their own subsequent electoral chances" (Filippov et al.
2004: 194).
With reference to the US case, Aldrich notes that, up to the emergence of the
Republicans to national prominence, when the North-South division became a party
cleavage, American parties had represented "complex institutions designed to maintain
national unity by avoiding division among regions, especially over slavery" (Aldrich
1995: 65). This example is used to illustrate that a successful integrated party can
absorb territorial cleavages within its ranks, rather than letting these divisions define
inter-party competition. "It was the complex set of partisan and other institutional
arrangements that kept the regional issues, especially slavery, from being addressed at
all, and certainly from being resolved on terms suitable to those who would soon
become the Republicans" (Aldrich 1995: 285).

1. Introduction 22
It is apparent that this party ideal-type is contingent on a number of institutional and
political conditions. Firstly, parties must be truly national, in the sense that they must
successfully compete at different levels of government. Secondly, presidential elections
should be partisan, thus inducing benefit seekers (motivated by prospect of winning the
spoils of presidential office), as well as policy seekers, to preserve the electoral
coalition. It should be noted that this model implies a sharp aversion for regionalist
parties, i.e. "parties which derive their support primarily from a single federal subject or
subset of subjects" (Filippov et al. 2004: 188). It is fair to say that the proponents of this
model would certainly approve of institutional rules discouraging regionalist parties, as
they exist for example in the Russian Federation,15
under the assumption that the
emergence of the "integrated national party" should be promoted instead.
The prevailing view, then, is that political parties have a potentially important role to
play in fostering national integration and inducing federal stability. As with the thesis
that parties are necessary for democratic consolidation, the argument that fostering the
"integrated party" is conducive to federal stability will be discussed critically in the
concluding chapter of the thesis, on the basis of the findings of this research.
1.2 Russia and the other party systems of the Third Wave
Once established that party institutionalisation is important, it is worth discussing how
Russia compares along this dimension to other political systems, especially in terms of
the independents' phenomenon. There are three elements to this comparison. Firstly,
Russia falls into the category of transitional systems, which sets her aside from
established democracies such as the UK. Secondly, among transition countries, post-
communist cases such as Russia face special obstacles towards party development.
Finally, even compared to most other post-communist cases, Russia presents several
signs of low party institutionalisation, including the phenomenon of independents'
proliferation.
In the latest UK election to the House of Commons of 2001, 118 independent
candidates (compared to 643 conservative and 640 labour candidates) ran in about 20
15
See Chapter 3 for a discussion of the electoral rules discouraging regionalist parties in the Russian case.

1. Introduction 23
percent of 659 UK constituencies. As noted at the start of this chapter, none of the
independents managed to win a seat. Indeed, it had come as a surprise when in the
previous election of 1997, for the first time since 1950, one independent did manage to
win a seat.16
In general, all post-communist countries have initially relegated political parties to
secondary roles. In contrast with most other third-wave experiences, post-communist
parties "formed after or during the first elections rather than preceding these
fundamental democratic initiatives or playing much of a role in channelling the
pressures that led to them being held at all". The organisation of the opposition "took
the form of social informality in contrast to the officialdom and patterns of authority set
by party bureaucracy", while previously compulsory participation in party activities,
produced a deep aversion to the very notion of party (Lewis 2000: 19-20, 33).
True, as Von Beyme reminds us, also in post-1945 Western Europe "encompassing
notions such as 'Union', 'Front' and 'Rassemblement' were preferred" to the idea of
"party" (1996: 125). In Western Europe, however, party identification had a much more
solid base due to the longer time-span of party institutions, which re-emerged after
dictatorship and war and had been already created in previous democratic or liberal
regimes. Moreover, while parties are personalistic, weakly organised, and unstable, in
all third wave democracies, they do monopolise access to national legislatures in both
Latin America and East-Central Europe. Therefore, if Russia's parties could be
considered similar to those of Peru or Ecuador on several dimensions of
(under)institutionalisation, only Ukraine has reached Russian low levels in terms of
party candidate recruitment (Moser 2001a: 48-49).17
In the first post-communist elections held in Ukraine, parties played an even more
marginal role than in Russia. In 1994 non-party candidates received a large majority of
the vote, with only 34 percent being cast for emerging parties (Lewis 2000: 20). A
similar pattern in Belarus was associated with more openly authoritarian tendencies of
16
Independent Martin Bell won with over 60 percent of the district votes, in the Tatton constituency,
where Liberal Democrat and Labour candidates had withdrawn in order to support his candidacy. Before
Bell, the 1945-1950 Parliament included three MPs who had been elected as independents in by-elections.
Similarly notable as an exceptional occurrence, independent Ken Livingstone was elected mayor of
London in 2000. 17
The uniqueness of Russia's party failure in candidate selection is even more evident in regional Russian
elections. Only 13.8 percent of the elected candidates in 1993-94, and 16.8 percent in 1995-97 has had
any party affiliation (Stoner-Weiss 2000: 12).

1. Introduction 24
the president Lukashenka. Here also the first parliamentary elections, in 1995, saw a
majority of winners nominated as independents (Lewis 2000: 25).
To show Russia's low level of party institutionalisation, it is useful to use
Mainwaring's (1999) and Mainwaring and Scully's (1995) framework, elaborated for
third-wave party systems. According to this typology, Peru and Russia emerge as the
least institutionalised cases (Mainwaring's 1999).
Party system (under)institutionalisation
One key dimension of party system institutionalisation is electoral volatility. According
to Mainwaring, "party systems range form very stable (the United States, Switzerland,
Finland and Sweden) to extremely volatile (Bolivia, Brazil, Ecuador, Peru, Poland and
Russia)". Here, party system volatility is measured as the sum of the percentage of votes
gained or lost by each party from one election to the next divided by two (Mainwaring
1999: 28). The US average volatility for Congress elections (1944-94) is only 4 percent
of the aggregate vote, in Peru it is 58 percent and in Russia (between the 1993 and 1995
elections) it is 54 percent (Mainwaring 1999: 28-9). A lack of stable party identities in
the electorate and of social roots among parties is shown also by high levels of split-
ticket voting across tiers of a mixed electoral system. White et al. (1997, reported in
Mainwaring 1999) have estimated that in Russia 70 percent of the voters planned to
split their vote across the two tiers of the election in 1993, and that only 22 percent
identified in any sense with any party.
A more precise notion implies two types of electoral volatility: a) voters' volatility,
and b) elite volatility. In the first case, large numbers of voters shift their electoral
support across parties in consecutive elections, but the political-supply side of the
equation remains broadly the same (i.e. the same parties contest consecutive elections).
This reflects a lack of party identification in the electorate, which in turn testifies to the
absence of clear and stable social constituencies "frozen" in their relationship with
parties. Social cleavages are either missing or are not activated at the political level.
In the second case, electoral volatility is due to elite volatility. The supply-side of the
electoral equation changes markedly form one election to the next. Politicians have
weak party loyalties, new parties are formed and previous parties disappear. The most
prominent personalities can create their own parties, or join into personalistic and

1. Introduction 25
unstable alliances (blocs), to enhance their electoral prospects and visibility. For Russia,
Richard Rose has stressed the supply-side sources of volatility (Rose 2000; Munro and
Rose 2002).
"Supply-side initiatives of political elites are the primary cause of Duma
seats changing hands . . . There is a big turnover in parties on the ballot from
one election to the next. In the 1993 Duma election there were 13 parties on
the proportional representation ballot; in 1995, there were 43; and in 1999,
the number was down to 26. In a new democracy, party formation invariably
involves a certain amount of trial and error, but in Russia the turnover of
parties has been so abnormal that it has become an obstacle to accountable
government" (Rose 2000: 3).
In particular, the last election considered in this thesis, held in 1999 after almost a
decade of post-communist transformations, lends support to Von Beyme's observation
that "literature on Russian parties seemed to describe each year a new phenomenon"
(1996: 122). Probably, the most striking feature of the 1999 Duma election has been the
high level of electoral volatility, overwhelmingly due to changes in the supply side of
the electoral equation. Table 1.1 lists all Russian parties that have crossed the 5% PR
barrier at least in one election in the 1990s. They are grouped according to the number
of elections they contested, thus showing their transience. In 1999, more than 50 percent
of the PR votes went to parties that not only were contesting their first election, but also
were very 'recent' (Unity, OVR and SPS). All of them had formed within one year
before the election, with Unity, the second most successful party, being formed less
than six months before the polling day. This means that most parties had little roots in
society and that the electorate was extremely "available", in the sense of "electoral
availability" adopted in Bartolini and Mair's study of electoral change in Western
Europe (Bartolini and Mair 1990).18
The spectacular rise of 'Unity', was largely due to the 'Putin factor'. 'Unity''s popularity
skyrocketed when the popular President publicly endorsed it in November.19
This suggests
18
To be sure, the quick success of new parties is also known in the West, although it takes similar
dimension only in conditions of party-system transition, like in the Italian case. Here, in 1994,
Berlusconi's 'Forza Italia' emerged as the first party in an election held within a few months from its
founding. 19
This is revealed clearly by public opinion surveys conducted at that time by the VTsIOM (VTsIOM
2000: 11, 13).

1. Introduction 26
that in Russia a very large proportion of the electorate was still lacking any stable party
identity and was available for last-minute mobilisation.
Table 1.1: Transience of major Russian parties in the 1990s
Duma elections 1993 1995 1999
(% proportional representation vote)
Three elections 51.3 45 38.2
Communist 12.4 22.3 24.3
Liberal Dem./Zhirinovsky 22.9 11.2 6.0
Yabloko 7.9 6.9 5.9
Women of Russia 8.1 4.6 2.0
Two elections 30.3 18.2 1.2
Russia's Choice 15.5 3.9 n.a.
Agrarian Party 8.0 3.8 n.a.
Russian Unity & Concord 6.8 0.4 n.a.
Our Home Is Russia n.a. 10.1 1.2
One election 18.4 36.8 62.6
Democratic Party of Russia 5.5 n.a. n.a.
Unity (Medved) n.a. n.a. 23.3
Fatherland n.a. n.a. 13.3
Union of Right Forces n.a. n.a. 8.5
Others 12.9 36.8 17.5
Source: Rose (2000: 4).
With reference to party system institutionalisation, Mainwaring explicitly mentions
the issue of independent candidates: "the ability of non-partisan and antiparty candidates
to win office serves as another indicator of party rootedness in society" (Mainwaring
1999: 33). In Russia, non-partisan candidates are not confined to parliamentary
elections. President Yeltsin was never committed to any party allegiance (except for the
Communist Party of the Soviet Union in pre-democratic times, of course), President
Putin's association with 'Unity' in 1999 was not institutionalised either, and one can also
note the initial success of independent presidential candidate Alexander Lebed in 1996.
In another post-communist country like Poland, presidential candidate Tyminski also
ran as independent in 1990, but the trend has been for partisan election overall.
In Latin America independents are also popular, though not in the same proportions
as in Russia or Ukraine. Several examples can be mentioned in Chile's congressional

1. Introduction 27
and presidential elections, as well as in Paraguay and in Peru in the second half of the
20th
century (Mainwaring and Scully 1995: 126, 304, 320 & 347).
Patterns of independents' proliferation in Russian SMDs
The previous section has stressed the conceptual link between the independents'
proliferation and party underinstitutionalisation and has placed the Russian case in a
comparative perspective. It is now necessary to describe more closely the proliferation
of independent candidates in the territorial districts in the three Russian Duma elections
of the 1990s. The description starts with some statistics of central tendency (mean) and
dispersion (standard deviation, maximum and minimum values). Subsequently, the
focus shifts to the spatial variation in the success of the independents across the country.
This geographical variability constitutes the phenomenon the present study seeks to
explain, i.e. the dependent variable of the statistical analysis to follow.
For the 1995 and 1999 elections, the data on the dependent variable comes from the
official publications of the Russian Central Electoral Commission (CEC) (TsIK, 1996,
2000). For the 1993 elections, I have used an unpublished report by the CEC, kindly
provided by Timothy Colton and Robert Moser, as well as data included in a CD-ROM
published by the Central Electoral Commission and the Merkator Centre in Moscow
(TsIK and Merkator 1999).
Table 1.2 provides a quick glance at some basic indicators of electoral competition
and independents' proliferation for the first post-communist competitive vote of 1993.
The first line of the table shows that the average district-level success for the
independents, measured as the joint vote share of all non-partisans running in an SMD,
was 50.2 percent. However, around this all-Russian average, independents' success
varied markedly: it was null where no independent ran at all, but it reached as much as
99 percent of the district vote, in Ingushetiya (SMD n.12), where they did run. The
second line describes the distribution of the number of candidates, both party and
independent, across SMDs. This statistic ranged from the legal minimum of 2 (in nine
SMDs) to 20, around a mean of about 7.

1. Introduction 28
Table 1.2: Cross-district variability in key traits of electoral competition (1993)
1993 Mean StDev Min Max
Independents Success* 50.2 24.0 0.0 98.9
Number of candidates 6.9 3.2 2.0 20.0
% of Independent candidates** 55.1 24.7 0.0 100.0
Against All 16.6 5.9 1.1 38.1
Effective number of candidates 4.8 2.0 1.5 15.6
Total candidates 1,519 (700 Party, 819 Indep)
* Measured as the joint vote share of all independents running in an SMD. ** The percentage of candidates running as independents in an SMD. Source: own elaboration of data from the Central Electoral Commission of the Russian Federation (CEC), see text for details.
The third line of the table shows that in the 1993 election, the independents made up
over half of the candidates of a typical SMD. However, in some districts they did not
run at all (in ten SMDs), while in as many as 22 SMDs voters could only choose among
independents (and the "against all" option). That this variability was not simply due to
"outlier" districts with extreme values, but was a main feature of the distribution, is
shown by the large standard deviations associated with mean values. The following line
shows that, in the typical 1993 SMD, as much as 16.6 percent of the voters took
advantage of the remarkable possibility, granted by the Russian ballot, to vote "against
all candidates".
Finally, a widely used statistic in political science to detect the number of viable
candidates and vote fragmentation is the effective number of candidates (Laakso and
Taagepera 1979). The fifth line of Table 1.2 shows that the fragmentation of the vote
was rather high for a plurality system, with a mean of almost five effective candidates
per district, ranging up to the very large maximum of 15.6.
These descriptive statistics point to the fact that electoral competition in SMDs took
many different shapes across the huge territory of Russia. However, the description
above is focused on the 1993 election only. It is often noted in the literature that the first
Duma elections were marked by exceptional circumstances, such as their abrupt timing,
unstable political context, unprepared political forces, etc. (Lentini 1995; White, Rose
and McAllister 1997). Does it mean that this picture of spatial volatility and variability
was also exceptional? Or was it a stable feature of the majoritarian tier of Russian
elections in the 1990s? An answer to this question can draw upon the comparison

1. Introduction 29
between the indicators of spatial variability mentioned above for the 1993 election and
those of the following two elections (1995 and 1999). This is best done with the help of
Figures 1.1 to 1.4.
Figure 1.1 reports the number of candidates per SMD. The average number of
candidates running in an SMD significantly increased from 1993 to 1995, to decline
somewhat in 1999. To assess whether the high cross-district variability observed in
1993 was repeated in 1995 and 1999, however, it is necessary to focus on the change in
the standard deviation. This is a measure of the average gap existing between the
average value and the value recorded in each SMD.
Figure 1.1: Total number of candidates, 1993, 1995 and 1999
6.9
3.22.0
20.0
11.7
4.6
2.0
24.0
9.9
3.83.0
20.0
0
5
10
15
20
25
30
Mean Standard Dev Min Max
1993 1995 1999
This indicator shows that the variability in the number of candidates did not subside
in 1995 or 1999 compared to 1993. Thus, if the first Duma elections were more fluid
and unstructured due to their exceptional circumstances, this is not reflected in the
longitudinal change of this key trait of SMD competition. Not only the number of
candidates increased on average, but also its territorial variability increased itself, as
confirmed by the larger range of the variable (from a minimum of 2 to a maximum of
24 in 1995).
Source: own elaboration of CEC data.

1. Introduction 30
Figure 1.2 deals with the success of the independents, measured as the vote share for
all independents running in an SMD. The graph shows that both the average value and
the variability around that value decreased from 1993 to 1995, but rose again in 1999.
Indeed, independent candidates were less successful in 1995 than in the other two
elections, while the territorial spread of their electoral support was more homogeneous
in 1995.
Figure 1.2: Average independents' success, 1993, 1995 and 1999
50.2
24.0
33.5
20.6
97.0
43.2
23.9
98.9 96.6
0.00
20
40
60
80
100
120
Mean Standard Dev Min Max
1993 1995 1999
%
An impression of consolidation is suggested by the fact that the range of the effective
number of candidates decreases with time, as shown by Figure 1.3. However, there is no
consolidation in terms of spatial (cross-district) variability, as the standard deviation of
the indicator remains virtually unchanged. The average number of effective candidates
actually increases in 1995 and remained high in 1999. Fragmentation of the vote has
remained a stable feature of Russian voting behaviour in the SMD races of the 1990's.
Source: own elaboration of CEC data.

1. Introduction 31
Figure 1.3: Effective number of candidates, 1993, 1995 and 1999
4.8
2.01.5
15.6
5.9
2.1 1.9
4.6
1.81.1
13.0
9.6
0
2
4
6
8
10
12
14
16
18
Mean Standard Dev Min Max
1993 1995 1999
An indication of a gradual national homogenisation in electoral competition is
provided by Figure 1.4, on the "visibility" of the independents (i.e. the proportion of
SMD candidates running without party affiliation). While the share of candidates
running as independents in the typical SMD goes down in 1995 and then up again in
1999, following the pattern of their success (Figure 1.2), the territorial variability of this
indicator does decrease rather markedly from 1993 to both 1995 and 1999. This seems
consistent with expectations expressed in the literature on the nationalisation of politics
through territorial penetration by parties (Rokkan 1970; Duverger 1959 [1951]).
Not only on average are less independents running (i.e. more party candidates), but
the territorial variability in their visibility is reduced. The average becomes more
representative of central tendency. Further indication of the stabilisation of electoral
competition over time is provided by the changes in the vote cast "against all"
candidates in the SMDs, shown in Figure 1.5.
Source: own elaboration of CEC data.

1. Introduction 32
Figure 1.4: Percentage of SMD candidates running as independents,
1993, 1995 and 1999
24.7
40.0
17.4
50.8
19.5
55.1
0
10
20
30
40
50
60
Mean Standard Dev
1993 1995 1999
%
The fact that cross district variability (standard deviation) of this indicator decreased
between 1993 and 1995 (but rose again in 1999), is compounded by the parallel
observation that the top value registered dropped from almost 40 to 21 percent.
Figure 1.5: Average vote share "against all", 1993, 1995 and 1999
16.6
5.9
1.1
38.1
10.0
3.5
0.0
11.8
4.6
1.2
21.0 21.0
0
5
10
15
20
25
30
35
40
45
Mean Standard Dev Min Max
1993 1995 1999
The descriptions provided by Figures 1.2-1.5 suggest that the high territorial
volatility of competition in SMDs, masked under national averages, is not a feature of
%
Source: own elaboration of CEC data.
Source: own elaboration of CEC data.

1. Introduction 33
the "exceptional" 1993 elections only. Rather, it is still a prominent feature of the two
subsequent waves of SMD races as well. However, this can only suggest tentative
interpretations in terms of trends and temporal patterns, as a much longer time span of
observations is needed to derive conclusions on consolidation dynamics. This is the
reason why this thesis does not pursue the explanation of diachronic changes in the
success of independent candidates. Rather, the focus will be on explaining spatial
patterns of variation in each election separately. Three maps of Russian SMDs, one for
each election, help visualise the spatial distribution of independents' victories in each
election (Map 1.1).20
The boundaries in the maps mark the Single-Member Districts. The SMDs that
returned an independent winner are coloured in blue, the remaining districts, in light
green, are won by party candidates. This means that the maps show "electoral success"
measured as victory of the district seat. This is different from the measure of success
discussed so far, and summarised in Table 1.2 and in Figure 1.2, which is the total vote
share received by all the independents in an SMD, regardless of who won the district
seat. The latter measurement will be used in the statistical analysis. A full discussion of
the advantages and disadvantages of different measures of electoral success is provided
in Chapter 5 of this thesis. The maps, by focusing on the district winner, provide a clear
dichotomous picture of the territorial distribution of the proliferation of independent
candidates.
A survey of spatial patterns can conveniently begin by exploring the distribution of
independents' success among the constituent units of the Federation. The Russian
Federation is made up of 89 such "constituent units". When referred to collectively, all
units are called "regions" in this thesis. The 89 regions vary dramatically in terms of
territorial size, population size, population density, and economic and geographic
outlook. Moreover, regions differ in "federal status". Differences in federal status
denote different degrees of autonomy within the Russian Federation and are associated
to different ethnic make-ups.
20
The maps were produced with ArcViewGIS software. I thank Dmitri Sharkov and Alexander
Perepechko (University of Washington) for sharing their raw Geographic Information Systems (GIS) data
on rayon shapes. These maps do not show the districts located within cities (e.g. Moscow city has 15
SMDs), due to their small territorial size.
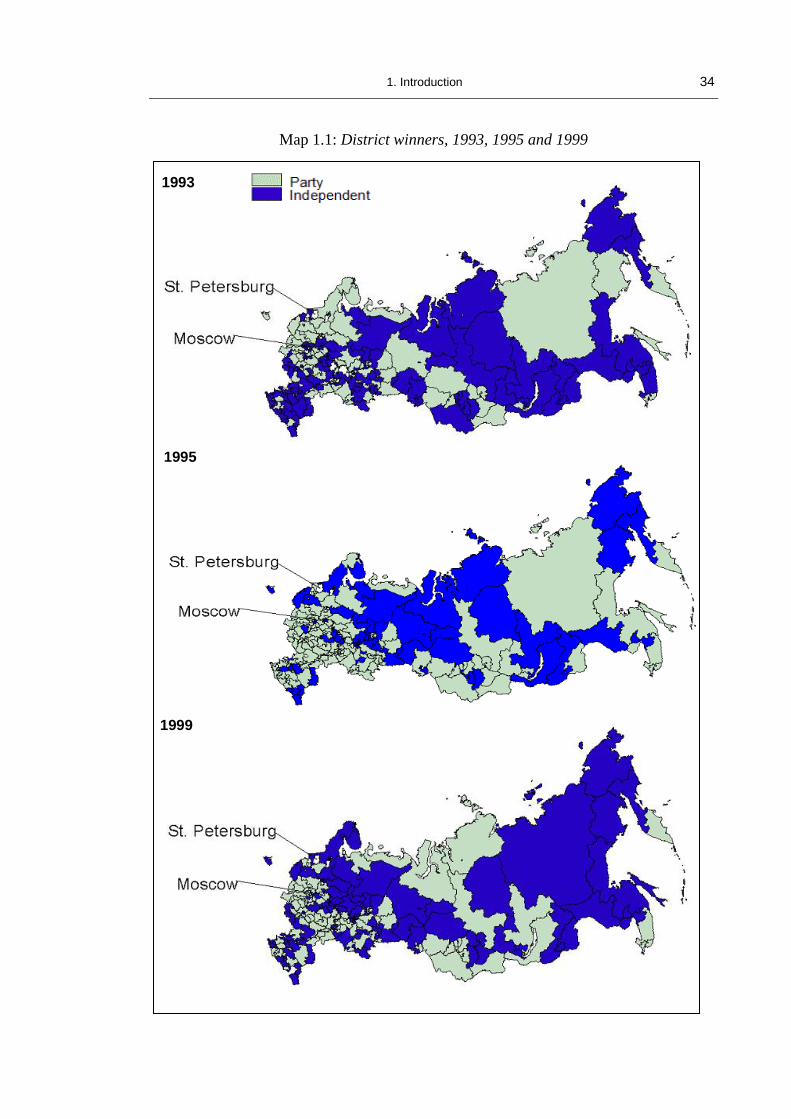
1. Introduction 34
Map 1.1: District winners, 1993, 1995 and 1999
1993
1995
1999

1. Introduction 35
As summarised in Table 1.3, twenty-one regions are recognised as republics, ten are
autonomous okrugs ("districts") and one is an autonomous oblast ("regions"). These
units possess relatively larger shares of non-Russian ethnic groups. To all of them the
1993 constitution granted special rights of cultural and linguistic autonomy, while the
republics also enjoy political rights, such as having their own republican constitutions.21
The remaining 57 regions (oblasts, krays -territories-, and the two federal cities of
Moscow and St. Petersburg) are non-autonomous and overwhelmingly Russian in ethnic
composition.
Table 1.3: Regions' federal status
Category of Federal Status Number of regions
Republics
21
Autonomous Okrugs 10
Jewish Aut Okrugs 1
City of Federal Status 2 (Moscow and St. Petersburg)
Oblasts 49
Krays 6
A close look at the maps (Map 1.1) shows that some districts consistently returned
independent winners in all three elections, while others consistently returned party
winners. In terms of federal units, there are 12 regions where Duma seats were always
and exclusively won by independent candidates (Table 1.4). Among these regions,
republics and autonomous okrugs are relatively more represented than non-autonomous
units (oblasts, krays). Indeed, one fifth and one third of all republics and all autonomous
okrugs, respectively, appear in this list of regions that are very favourable to the
independents, while the same applies to less than one tenth of the Russian oblasts and
krays.
At a first glance, it appears that these regions are located in remote and sparsely
populated areas, some in the extreme outreaches of Russia, or in areas of ethno-national
concentration. It is interesting to contrast this pattern to the one revealed by the set of
21
In fact, the distribution of autonomy rights and fiscal privileges, even among republics, is rather
uneven. This is mainly a product of bilateral agreements signed by Yeltsin with individual republics in
1994-95, and is feature of Russian "asymmetric federalism", discussed in greater detail in chapters 4, 6-8.
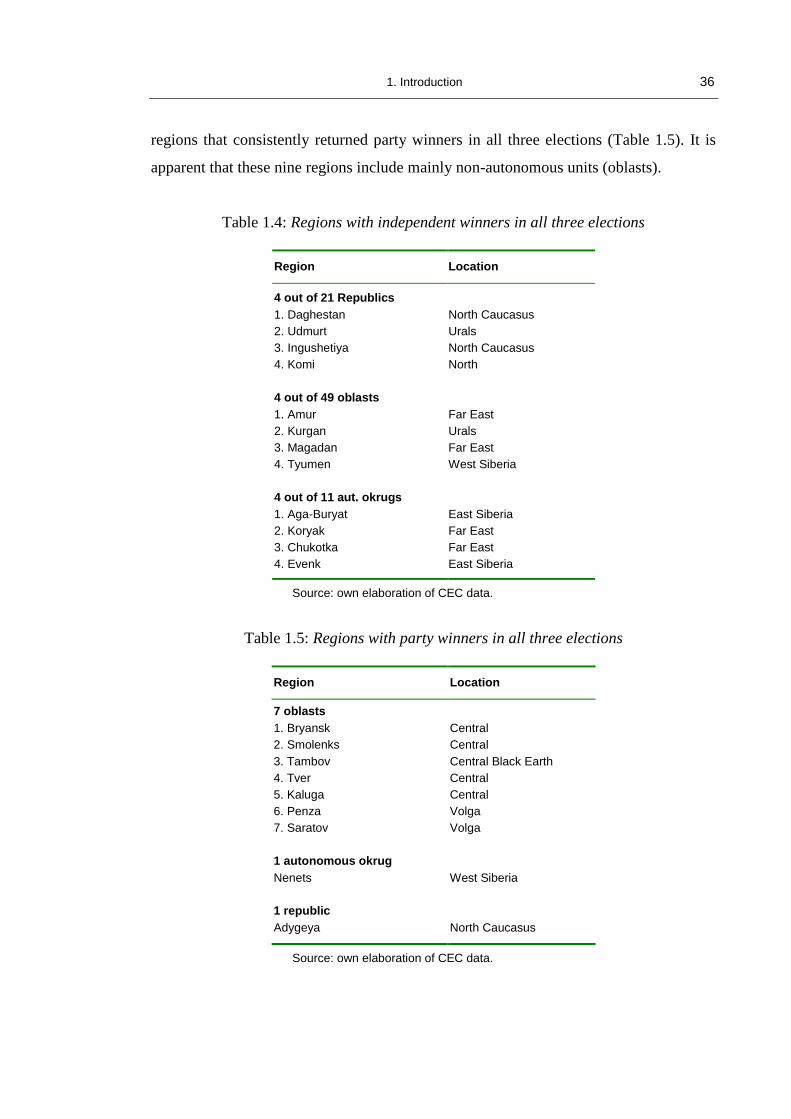
1. Introduction 36
regions that consistently returned party winners in all three elections (Table 1.5). It is
apparent that these nine regions include mainly non-autonomous units (oblasts).
Table 1.4: Regions with independent winners in all three elections
Region Location
4 out of 21 Republics
1. Daghestan North Caucasus
2. Udmurt Urals
3. Ingushetiya North Caucasus
4. Komi North
4 out of 49 oblasts
1. Amur Far East
2. Kurgan Urals
3. Magadan Far East
4. Tyumen West Siberia
4 out of 11 aut. okrugs
1. Aga-Buryat East Siberia
2. Koryak Far East
3. Chukotka Far East
4. Evenk East Siberia
Source: own elaboration of CEC data.
Table 1.5: Regions with party winners in all three elections
Region Location
7 oblasts
1. Bryansk Central
2. Smolenks Central
3. Tambov Central Black Earth
4. Tver Central
5. Kaluga Central
6. Penza Volga
7. Saratov Volga
1 autonomous okrug
Nenets West Siberia
1 republic
Adygeya North Caucasus
Source: own elaboration of CEC data.

1. Introduction 37
These considerations impressionistically point to the possible impact of federal status
on independents' success. It is therefore useful to directly compare levels of success
across categories of federal status, and across elections, to explore more closely the
possibility of a relationship between the two variables. Success is again measured as the
joint vote share for the independents running in an SMD. The comparison is presented
in Figure 1.6, where each bar of the figure represents the average electoral success of
the independents in the SMDs belonging to the regions with a given federal status, in a
given election. It emerges that, of the units endowed with autonomous status, it is really
the autonomous okrugs, more than the republics, which provide fertile ground for
independents' proliferation. The oblasts, by contrast, tend to discourage this
phenomenon. However, this pattern is less evident in 1999, when the independents saw
increased success in the oblasts. Moreover, autonomous okrugs are related to
independents' success particularly in 1995, while in oblasts and krays these candidates
fare particularly poorly in that year.
Figure 1.6: Independents' success by federal status and year
20
30
40
50
60
70
Republics Aut Okrugs Federal Cities Oblasts Krays
1993 1995 1999
%
Therefore, the picture of the relationship between federal status and independents'
success that emerges from these comparisons seems more complex than expected. It is
reasonable to believe that other factors are at play in addition to or in interaction with
Source: own elaboration of CEC data.
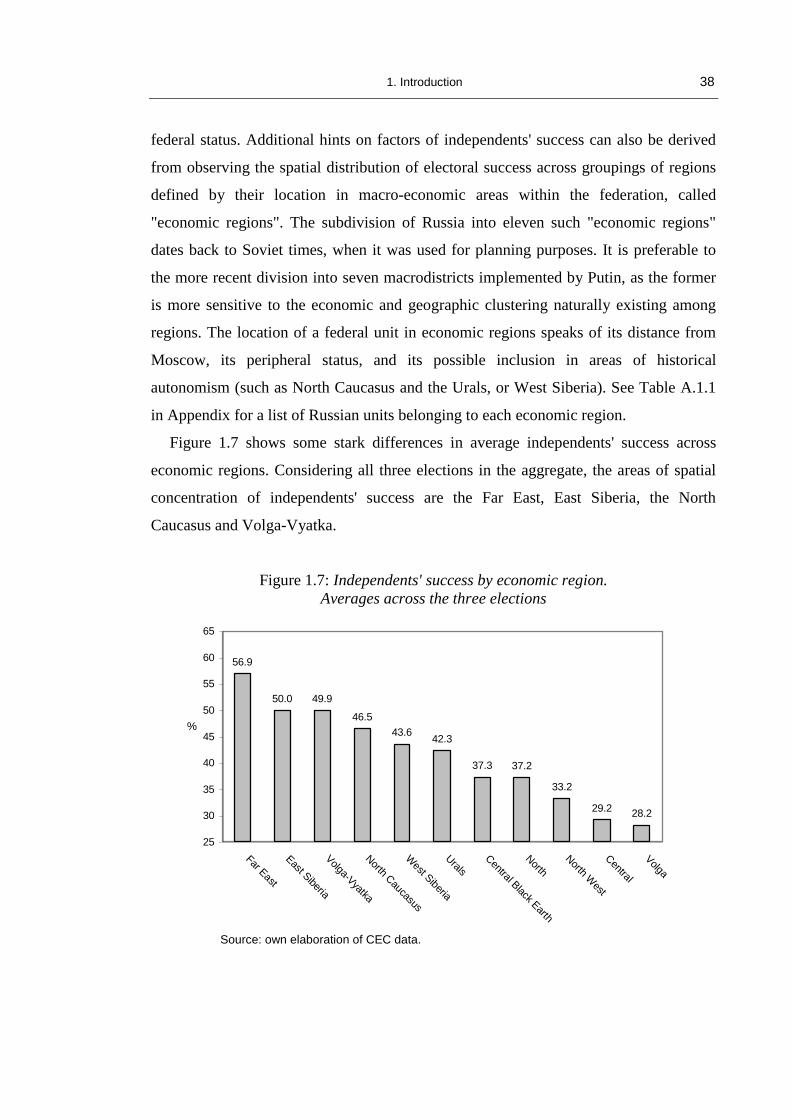
1. Introduction 38
federal status. Additional hints on factors of independents' success can also be derived
from observing the spatial distribution of electoral success across groupings of regions
defined by their location in macro-economic areas within the federation, called
"economic regions". The subdivision of Russia into eleven such "economic regions"
dates back to Soviet times, when it was used for planning purposes. It is preferable to
the more recent division into seven macrodistricts implemented by Putin, as the former
is more sensitive to the economic and geographic clustering naturally existing among
regions. The location of a federal unit in economic regions speaks of its distance from
Moscow, its peripheral status, and its possible inclusion in areas of historical
autonomism (such as North Caucasus and the Urals, or West Siberia). See Table A.1.1
in Appendix for a list of Russian units belonging to each economic region.
Figure 1.7 shows some stark differences in average independents' success across
economic regions. Considering all three elections in the aggregate, the areas of spatial
concentration of independents' success are the Far East, East Siberia, the North
Caucasus and Volga-Vyatka.
Figure 1.7: Independents' success by economic region.
Averages across the three elections
56.9
50.0 49.9
46.5
43.642.3
37.3 37.2
33.2
29.228.2
25
30
35
40
45
50
55
60
65
Far East
East S
iberia
Volga-V
yatka
North C
aucasus
West S
iberia
Urals
Central B
lack Earth
North
North W
est
Central
Volga
%
Source: own elaboration of CEC data.

1. Introduction 39
Breaking down these trends by year of election, however, allows for a more precise
picture. This is done in Figure 1.8, which reveals that, for example, the Volga-Vyatka
region was the most conducive to independents' proliferation in 1993, but not in 1995.
Similarly, as far as the North Caucasus is concerned, it is only in 1993 and 1999 only
that independents win disproportionally (compared to national average success). In the
Central Black Hearth region, 1995 constitutes a particularly negative year for
independents (reflecting the strength of the KPRF in the SMDs that year). It is in sum
the Far East, and more moderately East Siberia, that, in all three elections, show a
marked improvement of independents' chances well over the national average. These
are the most distant areas from Moscow.
Figure 1.8: Independents' success by economic region and year
These comparisons aim at showing the wide spatial variability of the phenomenon
under study. This emerges whether the region or the wider economic region is taken as
the reference spatial unit. Clearly, however, these comparisons cannot provide a
systematic account of the causal factors at play. The patterns of proliferation of
independent candidates described above seem kaleidoscopic and provide little ground
for inferring (even impressionistically) a causal mechanism. The description above
0
10
20
30
40
50
60
70
Far East
East Siberia
Volga-Vyatka
North C
aucasus
West Siberia
Urals
Central Black Earth
North
North W
est
Central
Volga
1993 1995 1999
%
Source: own elaboration of CEC data.

1. Introduction 40
rather resembles the cartographic approach that was typical of the first studies of
electoral geography, pioneered by André Siegfried in 1913, when maps were juxtaposed
to one another in the search for associations in the distribution of dependent and
independent variables (Taylor and Johnston 1979: 24). A crucial improvement of
modern statistical analysis over this approach is the possibility to test for explanatory
hypotheses derived from the literature while controlling for a number of other relevant
factors. This allows the analyst to posit a complex explanatory framework.
1.3 Research design
This thesis adopts a large-n, statistical approach based on multiple regression. A
detailed discussion of analysis design can be found in chapter 5. At this point, it is
worth outlining the basic features of the present research design. The basic unit of
spatial aggregation of electoral results is the Single-Member District (SMD), thus the
225 districts constitute the number of cases. Because SMDs are grouped within regions,
and regional effects are deemed to be important in explaining independents' success (see
chapter 3), the correct tool of quantitative analysis is multilevel modelling. This
technique takes into account the nested nature of the data (i.e. SMDs nested within
regions) and avoids the problems of estimation that conventional (one-level) ordinary
least square regression would produce given the data structure (see chapter 5 for
details).
It should be noted that the quantitatively inclined student of Russia is often
confronted with problems of data availability and reliability. Official statistics on many
important economic and social indicators are not available, are incomplete or are
aggregated at higher levels than needed. Regional authorities, in some cases, have their
own statistical services, but adding together regional estimates will almost certainly
impair consistency of measurement across the territory. These considerations would
point to the advantages of the single-case study design, in which one or two regions are
studied "in depth" through extensive fieldwork research. This is not the place to review
in detail the merits and problems of case study vs. large-n designs. However, a number
of considerations are worth noticing that have tilted the balance in favour of the large-n

1. Introduction 41
statistical approach for the present research. Most importantly, one task of this thesis is
to link the scholarly understanding of Russian regional-level politics to federal-level
elections, to the independents' success in particular. This should be done systematically
across the whole territory, to uncover patterns and regularities. In the absence of
systematic accounts of cross-regional variation in the proliferation of the independents
there appears to be little theoretical ground to select a small subset of regions for a deep
case study.
In fact, the relationship between case study and large-n designs does not need to be
mutually exclusive. Existing case studies of SMD elections in single regions do provide
valuable descriptive material and conjectures that can (and do) inform the explanatory
framework of the present statistical analysis (see chapter 3). In this sense, the present
approach can be seen to complement the small-n one. The value of the large-n approach
consists in being able to derive estimates of the effect of some indicators upon
independents' success, while case studies can only suggest these effects. Case studies
can also aptly follow the large-n investigation. Once the latter has highlighted
significant relationships, a case study can focus on an outlier case, which does not
conform to the expected pattern. While such case study could not constitute a valid test
of the relationship (King, Keohane and Verba 1994: 209-212), it could point to
previously omitted variables.
Among large-n, quantitative, studies of voting behaviour this research is atypical.
Since the 1950s, most students rely on opinion surveys of a sample of voters,
representative of the whole national electorate. Several important studies of Russian
elections have followed this approach (e.g. White, Rose and McAllister 1997; Colton
2000; Munro and Rose 2002) and some of their conclusions are noted in the literature
review chapter (chapter 2). This is a highly useful method, especially in order to
investigate the impact of individual characteristics, such as education, exposure to
media, interest in politics, income, religious affiliation, ethnic group membership, etc.,
on voting choice. A limitation of such approach, however, lies in the difficulty (or
virtual impossibility) to have large enough samples drawn in each region (Linz 1969).
With regard to the US, Hofferbert has stressed this problem (1972: 22-23, quoted in
Erikson et al. 1994: 7):

1. Introduction 42
"To make equally accurate estimates about the residents of all fifty states,
one would have to interview fifty times as many people as are included in
the national sample. Neither the resources, nor the motivation to do a sample
survey of 75,000 people has yet risen to the task".
This type of geographically comprehensive opinion survey is certainly not available
and very difficult to conceive for a huge country as Russia. Rather than focusing on
individual voting behaviour, this thesis takes the district aggregate of such behaviour as
the unit of analysis. Indeed, even if suitable individual-level surveys of opinion were
available, not all interesting questions on voting behaviour are best asked at the
individual level (Erikson, Mackuen and Stimson 2002: 10). In this thesis, the questions
being asked are about the cross-district and cross-regional variability of the outcome. As
a consequence, the impact of individual characteristics within SMDs is less interesting
than variables aggregated or measured at the level of SMD or higher (King 1991: 17-
18). This strategy also has the advantage of considering all 225 SMDs and all 89
regions of the Russian Federation. Naturally, this macro design prevents the
applicability of the findings that it generates to individual voters, as cross-level
inference would lead to the problem of ecological fallacy (Robinson 1950, Alker 1969).
Another way in which the phenomenon at hand could be studied is by asking
candidates about their decisions to stand as party or independent candidates. Regina
Smyth (1998), for example, studied the nature of the mass-party link emerging in early
post-Soviet Russia with a survey of candidates. While this method has the benefit of
depth of analysis, practical limitations similar to those encountered by opinion surveys,
make it difficult to obtain a picture of candidates' choices representative of regional
variations, let alone of SMD variations.
The macro approach (using aggregate data) of this thesis does not preclude the
examination of SMD traits based on the aggregation of lower level variables. For
example, information pertaining to the candidate level, such as candidate's occupational
status, incumbency or the support received from financial-industrial groups and/or from
the regional governor, can be aggregated at the SMD level, by considering the
proportion of candidates of a given kind running in the district.22

1. Introduction 43
Conclusion and plan of the thesis
This introductory chapter has covered a number of tasks. Firstly, it has presented the
research task of the thesis - the explanation of sub-national variations in the success of
independent candidates. These sub-national variations constitute an "intellectual
paradox" in the light of conventional accounts of party weakness that apply at the
national level. Secondly, this chapter has argued that the subject of the thesis deserves
attention because the under-institutionalisation of political parties, of which
independents' proliferation is an aspect, has important negative consequences for
democratic consolidation and federal stability.
After a brief comparison with other transitional settings with poorly institutionalised
party systems, the attention has moved to the description of the diachronic and,
especially, sub-national variability in independents' success in the Russian case. Spatial
variability has been explored at several levels of aggregation (SMDs, regions, economic
regions, etc.). Aggregation by federal status has suggested the potential importance of
levels of autonomy and ethnic composition as explanatory factors. However, this
"cartographic" descriptive approach could not provide firm leads into the casual
mechanisms behind a kaleidoscopic variability. The final part of this chapter has,
therefore, presented the main features of the research strategy that this thesis adopts in
order to explain such variability. It is a large-n, statistical investigation that takes the
district vote share for the independents as the unit of analysis. The advantages of this
kind of aggregate, macro approach have been stressed compared to taking the individual
voter as the unit of analysis (with opinion surveys) and compared to case studies of
individual regions. The motivations can be reduced to the type of "macro" research
question being asked and to the all-Russian scope of the independents' phenomenon.
The remainder of the thesis consists of seven chapters (numbered 2-8) and a
conclusion. The first part (chapter 2) contains a review of the existing literature
concerned with party underdevelopment in Russia. The vast majority of the most
influential studies have confined themselves to the national dimension, focusing on the
PR tier of the election.
22
The operational definition of the independent variables is the subject of chapter 4.

1. Introduction 44
Those who have dealt with the sub-national dimension of variability could not
consider all areas of the country (Colton and Hough 1998; Moser 1999; Hutcheson
2003); have chosen to look at regional instead of federal elections (Golosov 1997, 1999;
Gelman and Golosov 1998) or could not advance solid explanations (Moser 1999;
Golosov 2002). Studies that specifically focused on regional factors, such as the use of
regional administrative resources (e.g. Matsuzato 2000; Hale 1999, 2005), or that are
based on the direct observation of Duma campaigns in the SMDs (the case-study
chapters in Colton and Hough 1998), are more useful. These contributions can suggest
hypotheses for addressing the research question.
Following from the discussion of the existing literature, chapter 3 sets out to improve
current explanations by devising an original explanatory framework, which is
subsequently empirically tested in chapters 6-8. The main explanatory hypothesis is
based on the linkage between the electoral process and the wider process of federal
bargaining that was unfolding in Russia in the 1990s. In dealing with the centre, regions
advocated different ideal types of federalism (from very decentralised to highly
centralised). The greater the autonomy demands of the regions, the lower the popularity
of national political parties based in Moscow. Given the virtual absence of regionalist
parties, discouraged by electoral rules, the independents were left in a privileged
position to articulate and represent the territorial cleavage created by the federalisation
process. Therefore, the main hypothesis of the thesis is that the greater the anti-centralist
assertiveness of a region, the greater the advantage of independent candidates over
political parties. Parallel to this relationship, one has to take into account Moscow's
response to regional demands, which often managed to appease and defuse anti-
centralist sentiments. Other explanatory factors presented in chapter 3 include the
partisan use of regional administrative resources and financial backing for the 1999
vote; the inhospitable geographic conditions of some regions; and the strategic posture
of key actors of SMD races -political parties and notable candidates.
Bridging from hypotheses to actual empirical testing, the following two chapters (4
and 5) respectively present the operational definitions of the variables and discuss the
methodology to investigate expected relationships. Given the posited explanatory
framework, a crucial task is to find a quantitative indicator of regionalist assertiveness.
This is achieved with an index elaborated by Kathleen Dowley and presented in her

1. Introduction 45
1998 article. The operationalisation of other variables is more straightforward (chapter
4). As for the design of the empirical analysis presented in chapter 5, the most important
point is the presentation of the general characteristics of multilevel models, necessary to
take into account the properties of the hierarchical data structure (SMDs nested within
regions).
Finally, the empirical models testing the hypotheses of the explanatory framework
are presented in three chapters, one for each Duma election (chapters 6, 7, and 8). The
first two elections, held in 1993 and 1995, conform closely to the expectations of
chapter 3. In particular, regionalist assertiveness is confirmed to be a significant factor
of independents' success, controlling for instances of central appeasement. The third
election, held in 1999, however, exhibits a different dynamic, which can still be
understood within the explanatory framework of the thesis. In 1999 a number of leaders
of assertive regions managed for the first time to form an interregional political party
with a view to increasing their influence on federal politics and to prepare for the key
electoral prize of the presidency, which would be at stake the following year (2000).
This development meant that regionalist feelings could be, to a large extent, channelled
through the new party, instead of sustaining independents' success.
The last section of the thesis consists of a concluding chapter (number 9). It
summarises the main steps taken by the research and the main results of the analysis.
Moreover, it explores the implications of the findings for the scholarly understanding of
Russian electoral politics and for broader debates in comparative politics, with a view to
suggesting qualifications to some prevailing assumptions in the field.
As mentioned, the task of next chapter is to review the existing literature in search
for explanations for the intellectual paradox presented above -why have independent
candidates been more successful in some areas (districts, regions) than in others, given
that most explanations of party weakness apply at the national level?

46
2
Russian Party Underdevelopment:
The Existing Literature
"Party rivalry distorts the national will. The
principle of party-mindedness necessarily
involves the suppression of individuality,
and every party reduces and coarsens the
personal element. An individual will have
views, while a party offers an ideology"
Alexander Solzhenitsyn23
This chapter is devoted to reviewing the existing literature in the search for explanations
of the empirical problem outlined in the Introduction to this thesis. It will emerge that,
despite its theoretical importance for democratic consolidation and federal stability, as
outlined in the Introduction, the phenomenon of the independents has received
relatively little attention compared to other concerns of Russian electoral and party
politics.
The literature related to Russian party politics, in the last ten to fifteen years, has
touched a wide range of aspects. Key works have been published on the legislative
behaviour of party groups in the Duma, and the institutional rules governing that body
(Remington and Smith 2001, Ostrow 2000), on the overall role of the Duma vis-à-vis
the presidency (Chaisty and Gleisner 2000; Chaisty and Schleiter 2002; Morgan-Jones
and Schleiter 2004), on party organisation (Fish 1995a; Gelman 1998; March 2002,
Ishiyama 1998, 1999, 1999b, 2000, Hutcheson 2003), and on the link between party
formation and the peculiarities of the Russian transition (McFaul 1993, Golosov 1995).
Naturally, the study of individual elections or electoral cycles has also flourished, in its
23
Solzhenitsyn (1991: 70), quoted in Sakwa (1993: 10).
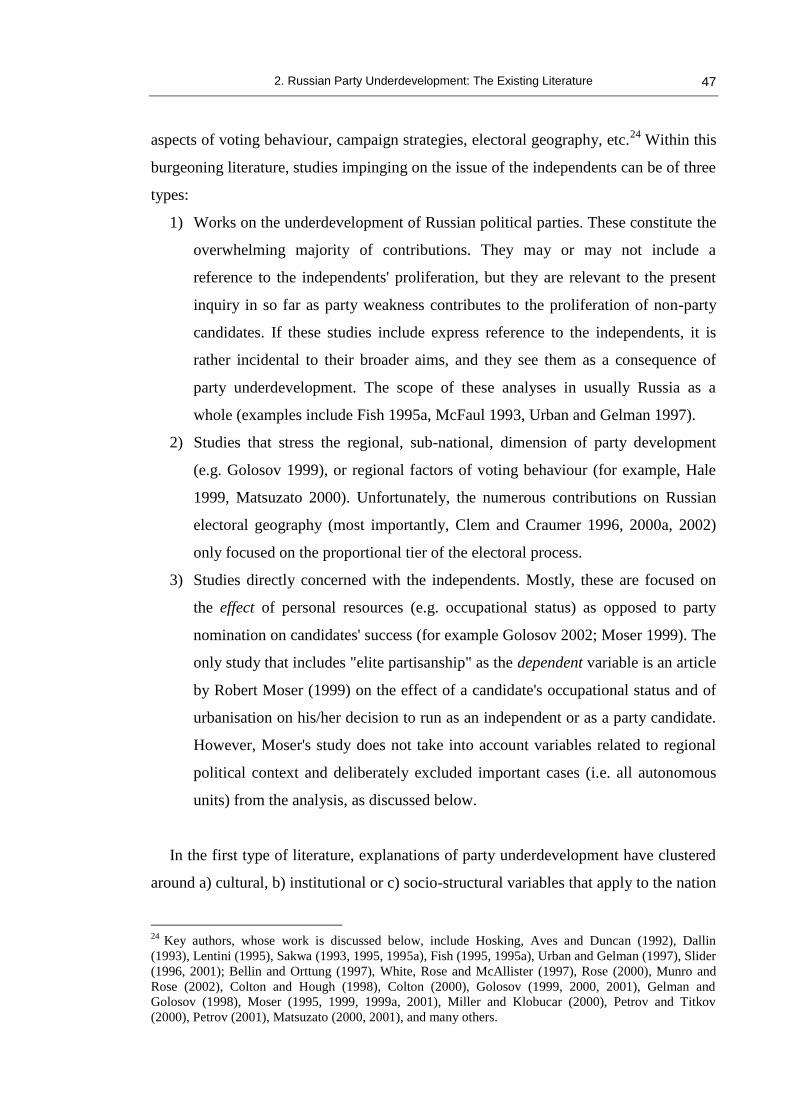
2. Russian Party Underdevelopment: The Existing Literature
47
aspects of voting behaviour, campaign strategies, electoral geography, etc.24
Within this
burgeoning literature, studies impinging on the issue of the independents can be of three
types:
1) Works on the underdevelopment of Russian political parties. These constitute the
overwhelming majority of contributions. They may or may not include a
reference to the independents' proliferation, but they are relevant to the present
inquiry in so far as party weakness contributes to the proliferation of non-party
candidates. If these studies include express reference to the independents, it is
rather incidental to their broader aims, and they see them as a consequence of
party underdevelopment. The scope of these analyses in usually Russia as a
whole (examples include Fish 1995a, McFaul 1993, Urban and Gelman 1997).
2) Studies that stress the regional, sub-national, dimension of party development
(e.g. Golosov 1999), or regional factors of voting behaviour (for example, Hale
1999, Matsuzato 2000). Unfortunately, the numerous contributions on Russian
electoral geography (most importantly, Clem and Craumer 1996, 2000a, 2002)
only focused on the proportional tier of the electoral process.
3) Studies directly concerned with the independents. Mostly, these are focused on
the effect of personal resources (e.g. occupational status) as opposed to party
nomination on candidates' success (for example Golosov 2002; Moser 1999). The
only study that includes "elite partisanship" as the dependent variable is an article
by Robert Moser (1999) on the effect of a candidate's occupational status and of
urbanisation on his/her decision to run as an independent or as a party candidate.
However, Moser's study does not take into account variables related to regional
political context and deliberately excluded important cases (i.e. all autonomous
units) from the analysis, as discussed below.
In the first type of literature, explanations of party underdevelopment have clustered
around a) cultural, b) institutional or c) socio-structural variables that apply to the nation
24
Key authors, whose work is discussed below, include Hosking, Aves and Duncan (1992), Dallin
(1993), Lentini (1995), Sakwa (1993, 1995, 1995a), Fish (1995, 1995a), Urban and Gelman (1997), Slider
(1996, 2001); Bellin and Orttung (1997), White, Rose and McAllister (1997), Rose (2000), Munro and
Rose (2002), Colton and Hough (1998), Colton (2000), Golosov (1999, 2000, 2001), Gelman and
Golosov (1998), Moser (1995, 1999, 1999a, 2001), Miller and Klobucar (2000), Petrov and Titkov
(2000), Petrov (2001), Matsuzato (2000, 2001), and many others.

2. Russian Party Underdevelopment: The Existing Literature
48
as a whole. Each of these three perspectives is reviewed in section 2.1 below. As a
whole, they account for the general weakness of Russian parties, and therefore they
provide the background knowledge to understand the proliferation of the independents.
However, because they focus on countrywide effects, they cannot explain cross-regional
variations in the phenomenon under study. Indeed, this is the intellectual paradox that
motivates this thesis (see Introduction).
The second type of literature provides some hypotheses on regional factors of party
development and, therefore, can shed some light on the cross-regional variation in the
proliferation of independent candidates. Finally, the third approach takes a more direct
interest in the independents, but not necessarily in the cross-regional variation in their
success. The closest such studies get to the spatial perspective is when they consider
such space-related variables as levels of urbanisation (Moser 1999, for the 1993 and
1995 elections) or regional governors' support for SMD candidates (Hale 2005, for the
1999 election). One would expect the literature on voting behaviour to be relevant for
the present purposes. Unfortunately, however, these studies, relying on opinion surveys,
have confined themselves to the analysis of the proportional side of the vote only, thus
asking the question of what party receive whose support, and not whether parties or the
independents are preferred.
The organisation of this chapter is threefold. The first section contains a survey of the
literature that covers the developments of 1988-1993, from the emergence of informal
movements in the late Soviet Union to the first competitive elections of post-communist
Russia. Special attention is devoted to the hypotheses put forward in the literature to
explain the underdevelopment of Russian parties. Some of these accounts had a lasting
influence on the interpretation of party politics in Russia. The second section of the
chapter reviews the scholarly contributions on the unfolding of the Russian party system
in connection with the 1995 and 1999 Duma elections. Patterns of consolidation are
discussed and contrasted to elements of persistent fluidity: here the literature can be
divided into the camps of optimists and pessimists depending on whether signs of
institutionalisation or volatility, respectively, are stressed.25
The literature of the first
type, highlighted above, is treated within these two sections.
25
The labels of “optimists” and “pessimists” for authors on Russian party development come from Hale
(2005). The substance of present review, however, differs from Hale’s.

2. Russian Party Underdevelopment: The Existing Literature
49
The third part is then devoted to the literature focused on sub-national trends in party
politics (regional elections, regional variations in federal elections, federal races in
single-member districts). This body of literature is the closest to the concerns of this
thesis and provides a useful starting point. Nevertheless, its deficiencies are also
exposed, thus identifying the gap that this thesis aims to fill and locating this work
within the scholarly debate.
2.1 Early investigations: from description to explanation (1988-1993)
The first wave of scholarly publications on Russian parties traced the roots of party
emergence, which, in the comparative literature, is believed to carry long-lasting
consequences for the further development of parties (Panebianco 1988). This phase
includes several steps. The first was the proliferation of social, informal movements
spurred by Gorbachev's liberalisation of 1988. This was followed by the formation of
independent political groups in parallel to the officially sponsored Popular Fronts.
Finally, political parties alternative to the communist (CPSU)26
were legalised in 1990.
The literature on this phase produced a picture of highly fragmented, fluid and
precarious formations (Hough 1997; Hosking, Aves and Duncan 1992; McFaul 1993;
Urban and Gelman 1997). Some patterns were observed in late Soviet social
mobilisation that will become stable. These include a popular distrust of organised,
disciplined parties (McFaul 1993: 18), the related rejection by party founders of rigid
organisations and hierarchies, and the difficulty in establishing social roots and links
with specific social constituencies (Fish 1995, 1995a).
At a time when the popular Fronts were still the dominant form of popular
mobilisation (Sakwa 1996: 78), Democratic Union (founded 1988) was the first group
to call itself a "political party", long before this would be legal. It represented the typical
umbrella organisation observed in other post-communist transitions: highly informal in
structure, made up of heterogeneous forces with fluid and overlapping memberships
(Lewis 1996, 2000).
26
CPSU stands for Communist Party of the Soviet Union.

2. Russian Party Underdevelopment: The Existing Literature
50
An early encounter with semi-competitive elections came with the 1989 selection of
the USSR Congress of People's Deputies, and the 1990 votes at the level of Soviet
Republics and lower levels. Most authors agree that the democratic potential of these
elections, which formally introduced the possibility of non-CPSU nominations, was
seriously limited by several factors. Most importantly, limitations derived from the
persistence of a legal ban on political parties other than the CPSU and from the de facto
power of the "CPSU and other reactionary forces to manipulate or obstruct meetings'
proceedings" (Lentini 1995: 44), where common citizens were to present their
candidates. Better chances of independent nomination characterised the 1990 elections
than the 1989 ones, though, with the average number of candidates per district passing
from 1.9 to 6.3 (Hough 1998: 43).27
On both occasions, political parties other than the
CPSU could not legally support candidates.28
Therefore, those who were not supported
by the CPSU29
were known as the “independents” (Smyth 1998: 180). It seems
reasonable to assume that a positive connotation to the label "independent" may have
originated at this stage and persisted in later Russian electoral discourse. Indeed, in
1990 the label designated candidates opposing the de-legitimised and unpopular CPSU
establishment.
The most effective of the 1990 electoral associations supporting the "independents"
was Democratic Russia, an umbrella organisation, whose affiliated MPs won 40 percent
of the seats in the Russian Congress. The party was able to reach a relatively solid
organisational presence (counting 3-400.000 members at its founding in October 1990)
and an unprecedented territorial penetration. It supported Yeltsin's election to the
chairmanship of the Russian Supreme Soviet, and later his electoral bid to the Russian
presidency in June 1991, while managing to mobilise masses of demonstrators against
the 1991 August putsch. However, in the absence of parliamentary elections after 1990,
27
In her study of party activity in Astrakhan, Samara and Chelyabinsk Oblasts, Ruth Brown has noted the
effect of a smaller size for SMDs in the 1990 elections "the smaller and more numerous constituencies in
the local elections gave members of the new political groups more opportunity to compete than in 1989"
(Brown 1998: 11-2). 28
While the historic constitutional amendment of Article 6 of the constitution put an end to the
constitutional power monopoly of the CPSU in March 1990, the new Law on Public Associations which
disciplined party activities will come into effect only on January 1st 1991, thus testifying to the Soviet
authorities' tactic of liberalising on paper, while reducing the practical impact of reforms (Lentini 1995:
50). 29
The CPSU "supported" but did not directly nominate candidates in 1990, nor in 1989 (Hough 1998:
43).

2. Russian Party Underdevelopment: The Existing Literature
51
Democratic Russia disintegrated.30
Urban and Gelman have noted how the democratic
forces of this phase represented the greatest victims of the transition to democracy,
showing the largest share of intra-party divisions and conflict among leaders and
between leadership and members (Urban and Gelman 1997: 189).
After 1990, the legalisation of pluripartism (effective from 1991) spurred party
formation. But the new forces were atomised groups: Richard Sakwa reported that, in
May 1993, around 1800 political organisations were registered with the authorities,
prompting him to comment that from a mono-party system, Russia had morphed into a
system without parties (Sakwa 1996: 80). Indeed, for reasons addressed in the next
paragraph, the political organisations of this phase have been inward looking, ridden by
divisions and debates on their own identity, rather than concerned with the "politics of
interests", i.e. the search for electoral support from social interests (Urban and Gelman
1997: 185).
Political parties were highly fluid and weakly institutionalised, had little
organisational strength and small memberships, showed little capacity for coalition
building and consolidation, and were created "from above"31
by members of
bureaucratic factions or by second-order nomenklatura personalities for their own
access to power (Gudkov and Dubin 2000: 4). They did not aim at representing clearly
defined social groups (which themselves lacked collective organisation) and generally
did not posses social roots. Some of these traits are still observable in present day
Russia. Even the three most visible organisations, the Social democratic Party of Russia
(SDPR),32
the Russian Democratic Party (DPR) led by Nikolai Travkin, and the
Republican Party of Russia (RPR) originated within the CPSU, could not escape
extinction. Travkin's DPR, in fact, showed a more pragmatic and effective approach to
internal organisation (Fish 1995a). This was the only party, among those that emerged
in the last years of the Soviet Union, to run as a distinct political party in the 1993
30
Its remnants will join Gaidar's Russia's Choice at the 1993 Duma elections, and it will re-emerge as a
distinct party at the 1995 Duma elections, only to withdraw before the vote in support of the liberal party
Yabloko. 31
The practice of creating parties from above, "parties of power", by will of executive authority is not
new in Russia. This point was recently stressed on the Izvestiya (Leskov 2003: 5), which reported the
archival finding, by Irina Glebova, of a letter written in September 1905 by interior minister Dmitri
Trepov to Tsar Nichola II, asking for the creation of a conservative party in the Duma. 32
This party, derived from an informal movement, achieved some organisational presence in towns
across the union, relied on an effective self-financing method, created an independent trade union

2. Russian Party Underdevelopment: The Existing Literature
52
Duma elections and to cross the 5 percent proportional representation barrier, even
though it will not outlive the 1995 elections.
This period was characterised by the institutional conflict between the Russian
Congress and the presidency, and by the absence of fresh elections until their sudden
convocation for December 1993. “Parties” lacked the electoral incentive that normally
drives their development. They constituted small and fluid factions in the parliament,
where their role was increasingly subordinate to the leadership of the speaker
Kashbulatov. In the institutional conflict with the presidency, the Russian Congress and
Presidency came to represent the only two real parties - one allied with the regional
Soviets, the other with the presidential administration. The only two organisations
belonging to that Parliament that became stable parties, and are still represented in the
Duma at present, are Zhirinovsky's LDPR and the Communists (KPRF), while Yabloko
(formed to contest the 1993 Duma elections) also gained representation in all three post-
communist Duma elections of the 1990s.33
The causes of the initial underdevelopment
As for the causes of the underdevelopment, the literature on this stage of Russian
politics has pointed to a number of factors, broadly falling within two categories:
contingent and structural factors. To be sure, structural factors also impact upon
contingent choices, by limiting the range of possible courses of action for political
actors. The latter, however, retain an important degree of purpose and independence, so
that their choices are not totally endogenous to inherited structures. Indeed, the early
failure in party development is explained by a combination of structural long-term
factors and contingent short-term choices.
Structural factors
Structural factors share a common root in the type of non-democratic regime that
preceded the transition. They include the peculiarities of post-Soviet social structure and
political culture.
Identity crisis and “flattened” society. The engineered social structure of the Soviet
system curbed social differentiation and ensured the systemic allegiance of (state-
(SOTsPROF) and managed to publish a relatively large range of newspapers at national and regional level
(Urban and Gelman 1997). 33
But recently Yabloko failed to gain any list seat in the 2003 elections.

2. Russian Party Underdevelopment: The Existing Literature
53
dependent) middle classes, defined as the well-educated, white-collar, higher-income
part of the population (Zaslavsky 1994; Fish 1995, 1995a). An influential study by Linz
and Stepan (1996: 62, Table 4,3) describes the kind of civil society produced by a
totalitarian system as "flattened ", in the sense that it has little resources for independent
organisation and does not show clearly demarcated social groups for parties to
represent.34
In the last years of the Soviet Union, informal groups and protoparties had defined
their identity in negative terms, by means of their opposition to the CPSU and its
political system. With the collapse of the old regime, these organisations abruptly lost
such reference point, and found it difficult to define themselves in positive terms (Fish
1995a: 81-82; Urban and Gelman 1997: 186). In particular, seventy years of Soviet rule
made it difficult for parties to "locate a constituency" (Fish 1995a: 97), and most groups
declared to represent all society or the “average citizen”. Absence of private property
and, therefore, of the market, effectively prevented the emergence of the foundations of
civil society, the latter understood in the western sense of independent self-organisation
of society from below (Fish 1995a).
This legacy of the Soviet system is often linked to the absence of traditional social
cleavages in Russia. However, if traditional cleavages such as State-Church, ethnic,
centre-periphery, management-working class, etc. (Lipset and Rokkan 1967) are weak,
new patterns of voting behaviour are emerging. Indeed, socio-demographic traits such
as younger age and higher levels of education are positively associated with pro-reform
voting (and vice versa). This is a general post-communist regularity, which reflects
different positions toward change. Those who are better positioned (i.e. the young and
the educated) to take advantage from the opening of the economic system vote
differently from those whose age and skills militate against adaptation to the
transformation (Kitschelt 1995: 458-59). One traditional cleavage that does structure
Russian voting behaviour is rural-urban differences, which gave rise to what several
34
Along the lines of the convergence thesis of industrial systems, and contrary to the argument presented
here, authors such as Jerry Hough (1977) have argued that the Soviet Union had by the 1970s reached
levels of social pluralism and differentiation similar to those of Western advanced economies. This
perspective seems misleading as it overlooks basic differences in social organisation. Even when regime
modernisation spurred and required the emergence of a highly educated and urbanised white collar
stratum, the regime successfully co-opted these sectors granting them privileged life standards. As a
result, even though social stratification indicators came to resemble western middle-class-dominated

2. Russian Party Underdevelopment: The Existing Literature
54
analysts have called a North-South divide (Hahn 1997: 159-60; Myagkov, Ordeshook
and Sobyanin 1997). This geographical pattern is discussed in section 2.3. Most
importantly, this thesis argues that one Rokkanian cleavage that structured voting
behaviour for much of the 1990s in Russia is the territorial cleavage, a line of division
that runs between individual subsections of the territory and the rest. This point is
developed in chapter 3, where it is placed at the heart of the thesis explanatory
framework.
The lack of independent bases of social organisation also meant that no counter-elite
could emerge and press for democratisation from below, participate in roundtables and
pact-making, as in other Eastern European cases. The early protoparties which
campaigned in 1989-1990 where, in fact, supporting the lower echelons of the same
nomenklatura rather than outsiders. These candidates had adopted the reformers'
ideological banner in a bid for power against the (higher-level) incumbents (Gudkov
and Dubin 2000). Ruth Brown also notes that "it is a significant indication of the
influence of the informals that their endorsement was sought by the members of the
nomenklatura - even ones as elevated as the First Secretary of the Chelyabinsk gorkom
(communist party city committee), Vadim Solovev, who was endorsed by the local
popular front". Similarly, "the Samara Voter's Union had to reach an agreement with the
gorkom on backing 'progressive CPSU candidates' in exchange for registration" (Brown
1998: 12). Friedgut and Hahn 1994 stressed that nomenklatura candidates won most of
the seats in the early elections, up to the 1994 regional elections. Due to the historic lack
of independent professional politicians and the lack of institutionalised parties, elections
“served as legitimisation for the status of party officials and party-appointed members
of the nomenklatura” (Hahn 1994, 8; Hughes 1997). This view is also shared by Helf
and Hahn, who noted that elections in 1990 reproduced the effect of the Soviet practice
of nomeklatura recruitment given that the winners were members of the local
administrative and economic leadership. They had skills of political participation and
local recognition that allowed their adaptation to post-Soviet electoral politics (Helf and
Hahn 1992).
Gudkov and Dubin (2000) see a continuation of the Soviet mentality in the fact that
politics is understood as a matter for the administrative official to care, or the
configurations, in fact all groups always remained state-shaped and state-dependent (Zaslavsky 1995a:

2. Russian Party Underdevelopment: The Existing Literature
55
bureaucracy to deal with, on the basis of a supposed expertise in administrative matters
(upravlenie). This technocratic assumption leaves little room for programmatic or
ideological motivations at the polls. Laura Belin and Robert Orttung (1997: 87) also
report a similar approach by voters to the 1995 Duma campaign. They observed the
widespread assumption that ideological convictions hindered the ability to solve
problems and were incompatible with professionalism. This led to attempts at
portraying one's electoral association as "non-party" associations ("Transformation of
the Fatherland") or supra-party associations (KRO and "Power to the People"). This is
especially linked to independents' success in the SMDs. Indeed, "professionalism was a
common theme among independent candidates … A director of a local gas enterprise in
Perm, for example, successfully campaigned for a single-member seat as someone who
knew how to provide steady work at a good salary" (Belin and Orttung 1997: 88).
The emphasis on professionalism as the key quality of candidates can also help
explain the success of "machine politics", a notion used by Brie for Moscow (Brie
1997), and by Hale for Bashkortostan and other regions (Hale 1999), to indicate voters
mobilisation from above, by regional authorities (Matsuzato 2000: 144-7).35
Arguably,
it can also contribute to the fortunes of technocratic “party of powers”, created by the
authorities.
Distrust of political parties. Virtually all observers of Russian party politics have
mentioned that party development was hindered by the psychological and cultural
rejection by Russian citizens of the very idea of "party", due to their previous
experience with compulsory and routinised participation in CPSU activities and in non-
competitive elections. This is thought to contribute to the low figures observed for party
membership. For example, Miller, White and Heywood (1996) write that "the
dominance of 'the party' through 70 years of Soviet experience left voters in the former
Soviet Union peculiarly allergic to the idea of committing themselves to any party"
(quoted in Miller, Reisinger and Hesli 1998). Similarly, Peter Lentini stresses that
"because of its experience under CPSU rule, the Russian electorate harbours negative
attitudes towards political parties" (Lentini 1995a: 247).
To this, some observers have added the widespread fear that candidates, and
especially list candidates, would be prisoners of party leaders, of Yeltsin's
266).

2. Russian Party Underdevelopment: The Existing Literature
56
administration or of regional bosses, and won't represent popular interests - a pattern
reminiscent of the "democratic centralism" of Soviet times.36
In Smyth's interpretation,
reform leaders feared that "membership rules, dues, hierarchical structures, clearly
articulated programmes would decrease their popular support" (Smyth 1998: 182).
Along similar lines, Fish (1995a) explains that party distrust led to lack of organisation
and party discipline in most early Russian parties. Interestingly, such fears of the anti-
individualist, oppressive nature of party internal workings37
have been likened to the
distrust of parties by the American "founding fathers" (Sakwa 1993: 10, Smyth 1998:
182). However, the latter distrust reflected the mentality of that age, well before the
advent of mass politics (Hosfstadter 1969).
Similar observations have been made not only on Russia, but also more generally on
post-communist transitions. Linz and Stepan have noted the wide currency of anti-
political attitudes among post-communist citizens, which include the reluctance of
voters to give one's allegiance to a part, rather than to the whole. This explains the anti-
party mentality of many leaders in post-communist transitions (Linz and Stepan 1996:
272-75; Taras 1998: 105) and facilitates the emergence of personalistic or charismatic
movements, rather than real parties.38
In his study of political culture in the two Russian
communities of Sktyvkar and Kirov, James Alexander also notes that "Soviet rule
conditioned people against self-initiated, independent participatory activity" (Alexander
2000: 150), thus reinforcing the Tsarist legacy. In fact, in addition to the
cultural/psychological explanation for low levels of popular political participation,
Alexander also mentions the impact of material deprivation, in as much as "Maslow's
hierarchy of needs predicts that subsistence living leads to a politically inactive
population" (Alexander 2000: 151).39
The structural legacy of an authoritarian political
culture and patterns of patronage has also been suggested to explain Russian
predisposition for patrimonial or clientelistic modalities of mass-party linkages, as
opposed to programmatic ones (Kitschelt et al. 1999; Kitschelt and Smyth 2002).
35
More on this in section 2.3. 36
Yurii Buida, "Russkii noyabr: oppozitsionnost vkhodit v modu", Nezavisimaya gazeta, 2 December
1993, pp.1, 3, reported by Lentini (1995: 248, fn.5). 37
As exemplified by the quote from Solzhenitsyn (1991) in the epigraph of this chapter. 38
Although, admittedly, this attitude is not confined to post-communist polities (Poguntke and Scarrow
1996; Schedler 1997), it has there specific roots and intensity and it is not primarily associated with
extreme right positioning as in the West. 39
For the theory on the hierarchy of needs, see Maslow (1968).

2. Russian Party Underdevelopment: The Existing Literature
57
Kostelecky has also noticed a strong repulsion for the idea of party at the beginning
of all Eastern European transitions. Also in those countries, the idea of party was
associated with the past experience of the communist party, which used coercion, did
not represent society and lacked legitimacy. New formations chose to avoid labelling
themselves "parties", often preferring to call themselves "movements". Only the ex-
communists and the historic parties used that word. Similarly to the pattern followed by
Russian reformers, the idea of party as a tight organisation has also been rejected in
Eastern Europe to adopt very open and decentralised structures, which allowed the
building of loose alliances among heterogeneous local forces.
Despite the similarities, "in Russia internal conflict in organisations has been deeper,
more pervasive, and more crippling in its effect than in most other cases of transition
polities" (Fish 1995a: 66). In this sense, Fish stresses that the cultural/psychological
explanation of party weakness based on anti-party feelings cannot be decisive. In the
light of the experience of other advanced post-communist transitions, the question arises
as to why, despite a similar initial distrust of parties, party organisation grew
substantially in the Czech Republic or Slovakia. A key difference with Russia is that in
the most advanced transitions of Eastern Europe (Poland, Hungary, Czech Republic)
political practice has shown the advantages of tighter organisational formats. Gradually,
the necessities of electoral campaigning and parliamentary work have brought about a
transformation towards more hierarchical internal structures (Kostelecky 2002: 154-
55).40
It should also be noted that Eastern European countries are mostly parliamentary,
therefore a cohesive majority in the parliament is necessary for government formation
and survival. Moreover, once they came to dominate parliaments, major parties could
define "the rules of the game" to benefit themselves and penalise movements,
associations and independents, not only in national but also in local elections.41
However important, long-term structural factors of party weakness should not lead to
overlook the role of the state. Indeed, "the character and development of Russia's new
autonomous political society has been shaped above all by the structure, nature, and
40
Already at the time of the 1992 elections, in Czechoslovakia, five of the six main parties possessed real
internal structure and organisation. Also in Slovakia, by 1994, the repeated electoral victories of Meciar
and his party, made the organised party the dominant format (Kostelecky 2002: 155, 157). 41
For example, in the Czech Republic the law has gradually increased the number of signatures which is
required to support candidates and has extended the territorial size of districts, while a law passed at the
start of 2000 only allowed national parties to contest regional elections (Kostelecky 2002: 158).

2. Russian Party Underdevelopment: The Existing Literature
58
policy of the state, rather than by socio-economic modernisation, political culture and
psychology, or the cumulative weight of centuries of Russian historical tradition" (Fish
1995a: 77). This interpretation is more convincing than linking Russian party weakness
to the general crisis of mass parties and traditional cleavages due to the emergence of
post-material values, currently experienced in advanced democracies (Sakwa 1995:
190). If it is true that nowadays parties are characterised by "light" organisational
structures, changing basis of support and high electoral volatility both in the advanced
democracies of the West (Wattenberg 1996; Pharr and Putnam 2000; Dalton and
Wattenberg 2000) and in Russia, it is still necessary to distinguish the trajectories which
produced this state of affairs in the two settings. Indeed, it is not post-industrial
affluence, the growth of middle classes, the blurring of class boundaries, the emergence
of post-material "values" (feminism, environmental concerns, …) that are confronting
post-communist parties, but rather a weak civil society, embryonic social differentiation
into groups and interests, the rejection of the very notion of "party", and mass poverty.
It is, in sum, still the bitter legacies of Soviet-type regimes.
The importance of previous regime type, with its damaging legacies, is also likely to
reduce the validity of comparisons of Russia with other systems in other ages, such as,
for example, the observation that, similarly to the Russian case, "In England as late as
1761 … not a single member of parliament was elected because of his party. Rather, the
parliament member assumed a party label once in parliament." (Hough 1998: 40). The
point is not so much that party consolidation takes time, which is generally true, but that
in Russia the process is much slower than in other post-authoritarian and post-
communist countries.
Contingent factors
Contingent explanations of party weakness found in the literature include the modality
of the Russian transition process, the strategic choices of the main actors, institutional
rules and the timing of elections.
Founding elections? The negative impact on party development of the institutional
conflict between the Congress and the presidency (end of 1991 - Fall 1993) has already
been mentioned. It hindered the programmatic differentiation of the parties making up
the Russian Congress, which sided as a whole against the president. In the same period,

2. Russian Party Underdevelopment: The Existing Literature
59
outside the Congress, there was little incentive for party building, in the absence of
elections. Steven Fish has noted that, not only the delay in calling fresh elections after
1991, but also the sequence of 1989 and 1990 partially open contests, negatively
affected party development. "The 'opening' of 1989-90 was both too sudden and too
partial. It strongly -and negatively- influenced the growth and effectiveness of
alternative political parties" (Fish 1995a: 73).
In general, Russia did not have clear-cut founding elections of the kind typically
observed in transitions to democracy (O'Donnell, Schmitter and Whitehead 1986: 44),
where they play a major role in stimulating party development and structuring of the
vote. Because 'founding elections' are defined as the first competitive elections by which
key positions of authority are filled, in the Russian case no single election qualifies. The
effect of founding elections was effectively "spread" over more than one consultation
ranging from the 1993 Duma elections, the first competitive ones for the legislative
assembly, to the 1996 presidential vote, the first post-Soviet vote for the top position of
authority in the country (Gelman 2003).
Institutional design. The negative impact of a presidential form of government, like
Russia's, on party development has been noted by many (e.g. Sakwa 1996: 91). In the
comparative literature, Juan Linz (1994) has forcefully proposed this line of argument,
drawing from Latin American examples. Linz has argued that presidential systems have
a structural necessity for weak party systems and weak parties. The lack of internal
party discipline allows the president to pass his policies through the assembly and, thus,
to overcome legislative deadlock through co-optation of parliamentarians, in the event
he cannot count on a sympathetic majority (Linz 1994: 34-35). In fact, a similar
observation was already made by Epstein with regard to the US system (Epstein 1975:
264). Also Bagehot in his The English Constitution, as Shugart and Carey remind us,
had stressed the positive effect of parliamentarism on the chances for the emergence of
programmatic parties (Shugart and Carey 1992: 8-9):
“Because governments were made and unmade according to the composition
of the majority of parliament, a voter’s choice of parliamentary candidate was
also a choice of executive. Elections thus came to turn on the voters’
preferences for government and, by extension, on policy rather than on more
purely local concerns (such as 'pork' and patronage). As a result, neither
elections nor the legislative process turned on distribution of particularistic
goods by means of logrolling across districts. Instead elections offered an

2. Russian Party Underdevelopment: The Existing Literature
60
'efficient' choice from among competing policy options, and legislation is the
domain of the majority party and its cabinet".
According to the Russian Constitution of 1993, the President can bypass the
Parliament and enact legislation by decree in areas not yet covered by legislation. The
president can also veto legislation approved by the parliament and his veto can be
overridden only by two thirds of the members of each of the two chambers of the
Federal Assembly. Finally, it is the President who appoints the Prime minister and the
other ministers. The Duma can reject his nominee but risks being disbanded by the
president (with new Duma elections being called) in the event that opposition is
repeated in three consecutive votes. To indicate the dominance of the presidency in
Russia's form of government, Stephen Holmes (1994) and, more recently, Steven Fish
(1997; 2001), have used the term "superpresidentialism". Others, on the other hand,
stressed that the Duma did play a key role in enacting a high number of important
pieces of legislation (Remington 2001; Chaisty and Schleiter 2002), and in influencing
government composition (Morgan-Jones and Schleiter 2004). These authors tend to
consider the Russian system as "president-parliamentary", following Shugart and
Carey's typology (Shugart and Carey 1992).
The standard argument that relates the weakness of Russian political parties to the
presidential form of government posits that a weak Duma represents a relatively small
prize for parties to win and provides only moderate incentives for party organisation
building. Moreover, presidentialism also means that government stability does not
directly depend on the presence of a stable majority coalition in the Duma, thus
reducing the incentives for the emergence of cohesive and disciplined political parties.
On the other hand, it should be noted that party weakness can also have a negative
feedback into the weakness of the Duma itself. Paul Chaisty and Petra Schleiter
conclude that in the Yeltsin years "the weakness of parties in structuring the work of the
lower house, and in linking the legislative priorities of different branches of
government" explained the poor public image of the Duma. This is due to the fact that
1) it prevented "the effective prioritisation" of pressing issues, such as the Chechen war
or the August 1998 financial crisis, and 2) it hampered co-ordination with the executive
branch of government and induced the latter to legislate by decree (Chaisty and
Schleiter 2002: 717).

2. Russian Party Underdevelopment: The Existing Literature
61
Yeltsin's attitude. In addition to the impact of institutional design, the personal
attitude of the first president, Yeltsin, towards party building has undermined the
emergence of stable parties. Although he was part of Democratic Russia, he soon
withdrew its membership in, and his commitment to, this umbrella organisation once
elected chairman of the Russian Congress in May 1990. In keeping with the noted
propensity of post-communist leaders elsewhere, he cultivated as much as possible the
image of a charismatic leader above parties (White, Rose and McAllister 1997: 169).
Another instance of this approach occurred in April 1994, when Yeltsin attempted to
reach a ‘social pact’ by pressing for the adoption of his ‘Charter of Civic Accord’,
drafted with no consultation of parties, but claiming to represent the ‘national interest’
above party divisions.
Finally, Yeltsin created 'presidential representatives' in the provinces. Drawing form
local cadres, these appointments should have provided the kind of 'eyes and ears' of the
centre which, in Soviet times, were provided by Party functionaries and performed
essential co-ordinating and feedback tasks. It is possible to see these institutions as
administrative substitutes for national political parties. The recruitment function was
carried out not by political parties, but through "informal networks" and "direct co-
optation" to state posts (Sakwa 1993: 11). Similarly, a bridging function between centre
and periphery was the preserve, not of a national party, but of federal agencies which
had the task to recruit 'promising' regional leaders for promotion to the national level
(Huskey 1999: 191, 201).
Electoral system. In the literature on institutional factors affecting party
development, the electoral system figures prominently (classics are Duverger’s book of
1951 and Sartori’s of 1976). For the State Duma, Russia adopts a mixed system.42
Half
seats (225) are allocated through party list proportional competition (PR) in a single all-
Russian electoral district. Party lists are confronted with a 5 percent threshold at the
national level. The composition of the other half of the Duma is decided in 225 single-
member districts (SMDs) where a plurality of the vote is required to win the contest,
provided that turnout reaches at least 25 percent of the eligible voters. The requirement
that parties collect no more that 15 percent (7 percent starting from 1995) of the
42
Within the post-communist camp, mixed systems were also employed, with different degrees of
continuity, in Bulgaria, Croatia, Hungary, Lithuania (Shvetsova 1999), and Ukraine.

2. Russian Party Underdevelopment: The Existing Literature
62
required 100.000 (200.000 from 1995) signatures from any one region of the federation,
made it very difficult for parties based in one or few region to contest Duma elections.43
The way legislative work is carried out by the Upper Chamber of the Russian
Parliament, the Federation Council, has also been credited with limiting the ability of
parties to articulate regional issues. Thomas Remington, in a study covering up to 1997,
noted that the Federation Council was totally deprived of party factions and groups, and
that the left-right dimension is not salient in its work (also because such issues are
filtered by the Duma). Its primary concern is rather federal-regional relations (it has
rejected legislation threatening regions’ rights and autonomy). Therefore, centre-regions
issues are not channelled through political parties also because of the non-partisan
principle of organisation of the Federation Council (Remington 1998: 220). In addition
to this, one can also assume that this task of parties channelling regional concerns was
hampered by the sheer size of the country (Sakwa 1993: 13).
Belin and Orttung noted that the local elite found in the SMDs a congenial arena.
"Because half of the deputies were elected in single-member districts, the parties had
great difficulty in singing up members of the local elite. Regional notables could easily
win election in the districts on the strength of their reputation among local voters and
gained nothing from being associated with a party. Many well-known figures even saw
party membership as a liability because of the negative connotations attached to the
very idea of political parties at that time [1993 elections]" (Belin and Orttung 1997:
21).44
If the SMD tier did lead to parochialism in district races, the expected reductionist
effect on the number of parties, typically produced by majoritarian electoral formulas in
advanced democracies, did not materialise. In the absence of institutionalised parties,
voters lacked the information on the (expected) relative strength of contestants that is
assumed to be at the root of strategic voting (Moser 1999a: 364). In fact, the
majoritarian tier produced higher proliferation of parties than the PR tier. However, the
43
On the details of party and candidate registration rules, see Remington and Smith (1996); Hough
(1998); White and McAllister (1999) and Moser (2001a). 44
In fact, in 1993 the SMD ballot did not record the party affiliation of candidates. However, the
affiliation of many could be found on the PR ballot, if they occupied the first three positions on party lists
(both federal and regional sub-lists). Ninety-six percent of the party candidates running in the districts
were also running on PR lists in 1993 (Colton 1998: 21). Moreover, the ballot paper did report some
biographical information about the candidate (year of birth, place of residence and occupation).

2. Russian Party Underdevelopment: The Existing Literature
63
mixed system did fulfil Yeltsin's expectations on the extent to which the Duma is
structured by parties. "Yeltsin designed the electoral system rules to serve his personal
interests. He wanted to enhance the role of political parties in the Duma because he
believed that in a legislature structured by party loyalty, it would be more difficult for a
figure like Khasbulatov to dominate the proceedings. (Khasbulatov had exerted
considerable influence over the deputies in the Supreme Soviet, particularly the
independents)" (Belin and Orttung 1997: 19).
Between the 1993 and the 1995 election the boundaries of several SMDs were also
altered and the electoral law was amended to the effect that candidates appearing on the
party lists beyond the 12th
position had to appear in regional sub-lists. Their electoral
chances would then depend on the amount of votes received by the party in the region
(or grouping of regions) linked to the party sub-list. This represented a concession to
regional elites, who aimed at correcting the tendency of party lists to be filled with
Moscow politicians (White and McAllister 1999: 32). One unintended consequence of
this change was to encourage party proliferation for the 1995 elections, as candidates
who could not be included in the first 12 positions on a party list, tried to form their own
lists.45
Anti-incumbent sentiment. Belin and Orttung also note that candidates standing for
re-election, often preferred to leave their parties, to avoid the general resentment
towards incumbents in times of widespread economic hardship, thus trying to escape
accountability. This "anti-incumbent sentiment" seems to be confirmed by the campaign
banner of the (minor) formation 'Bloc of independents', which "urged voters to pick new
faces in December [1995] and not to trust anyone who had been elected two years
earlier" (Belin and Orttung 1997: 86-87).46
The two co-authors also argue that anti-
incumbent feelings made politicians not just change party, but also run as independents.
Especially candidates belonging to NDR and KPRF, "saw advantages to posing as
independents in single-member districts" (Belin and Orttung 1997: 87), while "in
Nizhnii Novgorod, an NDR candidate was denied registration after she was caught
posing as an independent while collecting signatures."47
Therefore, when the occupation declared was "party official" or "activist", party affiliation could be
revealed (Gould-Davis 1998: 450). 45
Twelve is the minimum number of seats that a party crossing the 5 percent threshold can hope to win. 46
St. Petersburg television, "Vybory-95", 8 December 1995. Reported in Belin and Orttung (1997: 87). 47
Nizhegorodskii Robochii, 11 October 1995, p.3. Reported in Belin and Orttung (1997: 87).

2. Russian Party Underdevelopment: The Existing Literature
64
2.2 The unfolding of party politics (1995-1999): pessimists and
optimists
The lines of interpretation discussed above emerged already quite clearly in the
literature dealing with the mobilisation phase of Russian post-communist politics, up to
the 1993 Duma elections. The 1995 Duma election contained some elements of
discontinuity with the preceding one: it was the first to be regularly scheduled, the first
under the new constitution, and the first to be held during ordinary times (as opposed to
the institutional crisis that had preceded the 1993 vote). In terms of electoral results,
another novelty was represented by the success of the Communists (KPRF). The KPRF
dramatically improved its performance, especially in the SMDs, and emerged as the
only territorially organised party of Russia, or "the party of the provinces in 1995"
(March 2002: 178). This will remain a stable feature in the following election, along
with the decline of the LDPR. Finally, the share of independents, both among
candidates and among winners in the SMDs decreased from over 60 percent to about 30
percent.
However, elements of continuity form 1993 are also evident. In the intervening two
years most parties did not dramatically improve their organisation, their membership
levels and there were little signs of party system consolidation. On the contrary, parties
proliferated, with the entry on the PR ballot box of a large number of marginal
groupings. These forces have been labelled "irrational", due to the fact that they had
little hopes of crossing the 5 percent proportional representation barrier (White, Rose
and McAllister 1997: 198). Indeed, of the 43 parties registered, only 4 cleared such
hurdle. The tendency for "parties of power" to disappoint was also replicated (with
NDR and the 'Bloc of Ivan Rybkin', taking the place of Russia's Choice and PRES).
The 1999 elections also did not provide much scope for confidence in the
consolidation of Russian parties. On the positive side, three parties (Yabloko, KPRF,
and LDPR) confirmed their ability to win representation in all three Duma elections by
clearing the 5 percent hurdle. However, the most striking phenomenon of 1999 was the
sudden emergence of powerful blocs created from above, by regional governors (OVR,

2. Russian Party Underdevelopment: The Existing Literature
65
"Fatherland-All Russia") and/or by instigation of the presidential administration and
government ministers (Unity). Their success testifies to the extreme volatility of
Russian party politics, and shows a lack of stable party identification among voters. In
1999 over 50 percent of the PR votes went to parties which not only were contesting
their first elections, but also were very 'recent', being formed within one year before the
election day. Unity, the second winning party, was formed less than six months before the
election. This means that parties did not have roots in society and that the electorate could
swing its mass support easily. Gudkov and Dubin explain the success of 'Unity' with
reference to the concept of "negative mobilisation from above". The presidential
administration, and the state media, managed to mobilise citizenry to vote "against an
enemy". The enemy in question was represented by the Chechens who allegedly had
planted bombs in Moscow apartments and other locations in Russia at the end of the
summer preceding the 1999 vote. This campaign portrayed Putin as the necessary
energetic and determinate leader who would bring back order (Gudkov and Dubin 2000:
8). 'Unity' benefited from this environment as the party closest to president Putin.
Munro and Rose have pointed out that in September 1999, i.e. two-three months
before the vote, pre-election polls revealed that "47% of the electorate had no
inclination toward a party with a chance of winning list seats in the Duma" (Munro and
Rose 2002: 123). 'Unity' had not even been formed yet. The two co-authors stress that
"in NRB [New Russia Barometer] surveys, political parties are consistently the most
distrusted of all institutions in society, and the Duma comes a close second. In the
survey immediately after the Duma election, only 9 per cent expressed trust in political
parties, compared to 75 per cent actively distrusting parties, and the remaining sixth
neutral" (Munro and Rose 2002: 123). The conclusion is that in Russia a "floating
system of parties" is observed, characterised by the appearance and disappearance of
parties from one election to the next, where no stable political accountability is possible
(Munro and Rose 2002: 8).
On the other hand, it is apparent that, with the partial exception of OVR, the new
parties fared much worse than older ones in the territorial districts. Indeed, even though
'Unity' came very close to KPRF in the proportional count, its total number of seats was
significantly smaller than the communists' because of the very different performance in
the SMDs. Unity managed to participate in only 18 percent of the constituency contests.

2. Russian Party Underdevelopment: The Existing Literature
66
Moreover, the number of majoritarian seats contested is not necessarily correlated with
the number of successful nominations. Zhirinovsky's bloc made a tremendous
organisational effort to be present in nearly all SMDs, as it did in 1995. Similarly to its
1995 campaign, however, Zhirinvsky's candidates performed very poorly: in 1999 they
could not win any territorial race. As for the independents, in comparison with the
previous Duma election, the number of successful non-party candidates rose again to
112 (half of all SMD winners).
The picture that emerges from this account is dominated by negative conclusions and
by pessimism on the development of Russian parties and party system. However,
parallel to this pattern in the literature, another one can be noted that has generated more
positive findings and more encouraging interpretations. Positive assessments of party
development in Russia have tended to rely on opinion surveys. One strand in this
literature measures party development as the degree to which citizens are "attached to"
or "identify with" political parties (Miller, Erb, Reisinger and Hesli 2000; Miller and
Klobucar 2000; Pammett and DeBardeleben 2000; Miller, Reisinger and Hesli 1998;
Evans and Whitefield 1998; McAllister and White 1998; Wyman, White and Oates
1998; Tóka 1998; Miller, White and Heywood 1996; Wyman, White, Miller and
Heywood 1995). Some authors who figure prominently in this strand of literature, such
as Arthur Miller, were previously interested in party identification in the USA or in
other established western democracies (for example, Miller and Wattenberg 1983). In
several cases, concepts that are standard in the analysis of advanced democratic systems
can be misleading when referred to such post-communist cases as Russia. Matthew
Wyman, Stephen White, Bill Miller and Paul Heywood (1995), for example, are among
the first observers to use the concept of party identification with reference to voting
behaviour in the 1993 Duma elections. They find evidence of an emerging multi-party
system that consists of a number of established parties. These parties, according to the
authors, are beginning (in 1993) to undertake some of the critical functions necessary to
the development of a stable democracy, while levels of party identification have risen
quickly.
Also Geoffrey Evans and Stephen Whitefield (1998) write of party “identification”.
With regards to cleavages, they also found that, contrary to assumption of a flattened or
homogeneous society, cleavages, mainly economic positions towards the market

2. Russian Party Underdevelopment: The Existing Literature
67
reforms (but not ethnic or confessional ones), are emerging and becoming stable,
despite the fluctuation of parties and candidates. In direct contrast to the theory of
political cleavages, which posits the activating role of institutions such as political
parties (Bartolini and Mair 1990: 216), they conclude that “the absence of strong parties
or institutions of civil society should by no means be expected to prevent such divisions
from emerging…", and therefore, that post-communist Europe should not be seen as a
"social wasteland" of "voters deprived of their social identities". At the same time, they
admit that Russia has some specificity in this regard, as "Russian politics contains
relatively few distinctive independent bases for ideological divisions" (Evans and
Whitefield 1998: 70).
One of the boldest statement in the optimist camp is perhaps authored by Ian
McAllister and Stephen White (1998) who find party identification to be the most
important determinant of electoral behaviour, compared to institutional and sociological
factors. In turn, Miller, Reisinger and Hesli (1998) adjust somehow the aim of these
contributions with their finding that it is in fact voters' attachment to leaders, rather than
party identification, that constitutes the best predictor of voting behaviour. Finally, the
editors of the 1998 volume, which includes both contributions mentioned in this
paragraph, seem to take a more cautious approach. They observe that “seeing voting as
a result of party identification would be, to say the least, eccentric in Russian
conditions, . . . The lack of strong parties is likely to mean low levels of partisanship for
years to come” (Wyman, White and Oates 1998: 6).
The lucid tone of the latter statement, seems however, rather exceptional among
scholars using opinion surveys. In general, this tool tends to lead the analyst to
overestimate party attachments among voters. The respondent may be induced to
indicate a party preference by the very fact that the questionnaire asks him/her to do so,
sometimes presenting him with a list of party labels. His choice may reveal which party
or leader he feels closest to, but this is rather different from the deep, stable and positive
link that is implied by the concept of "party identification". In any case, because it
designates a lasting and deep attachment over time (White, Rose and McAllister 1997:
134), by definition, the concept of "party identification" can only be applied after a
number of elections have been held. This seems to rule out the rigorous use of the
concept with reference to the 1993 Duma elections, the first competitive ones, and cast

2. Russian Party Underdevelopment: The Existing Literature
68
doubts on its validity even for the 1995 Duma elections, held only two years after the
first.
One exception to the optimism of students of public opinion is represented by a
highly informative and comprehensive account of Russian elections, How Russia Votes
(White, Rose and McAllister 1997). On the issue of party identification, the authors find
that "more than three-quarters of the electorate lack any party identification", which is
also confirmed by the high levels of split-ticket voting (White, Rose and McAllister
1997: 135, 139).48
Munro and Rose, more recently, reached similar negative
conclusions, also based on opinion surveys (Munro and Rose 2002). Timothy Colton
seems to take the middle ground between optimists and pessimists in his analysis of
Russian voting behaviour.49
While sceptical on whether party identification in the
Western sense is already emerging, he finds evidence that a sizeable share of Russian
voters are developing a "precursor" to it, an "elective affinity" to parties, which he refers
to as "transitional partisanship" (2000: 25, 110). The survey questions used by Colton
are carefully worded not to prompt an answer in the positive or negative sense, and are
designed to detect degrees of partisanship (Colton 2000: 114). The results show that
slightly over 50 percent of Russians are absolute non-partisans. Most of the rest falls
within the category which Colton labels "weak partisans", still free from any stable or
deep attachment to any party. In sum, less than a third of Russians clearly identifies a
party as "their own". Nevertheless, the author concludes, "Russian political parties, . . .
do seem to strike a chord with the public" (Colton 2000: 115).
It appears that the approach based on opinion surveys tends to portray parties as
more real and important than they are. This is a consequence of the heavy bias suffered
by the study of Russian voting behaviour, focused as it is on the proportional tier of the
election. As much as half of the electoral process, the majoritarian half, is overlooked
by these studies while cross-regional differences go unnoticed because opinion surveys
cannot be implemented in 225 SMDs, nor in 89 regions (Colton 2000: 3).50
As a result,
48
A survey conducted by VTsIOM before the 1993 elections found that 70 percent of the respondents
who knew how they would vote, were planning to split their votes in the two tiers of the Duma election
(White, Rose and McAllister 1997: 139). 49
Although published in 2000, this volume only studies the first two Duma elections (PR tier only) and
the 1996 presidential election. 50
As mentioned in the Introduction to this thesis, surveys would need thousands of respondents in each
region to be representative of regional variations. Such numbers are beyond the resources of even the
most reputable agencies for the study of public opinion. A point confirmed in a personal talk with Lev
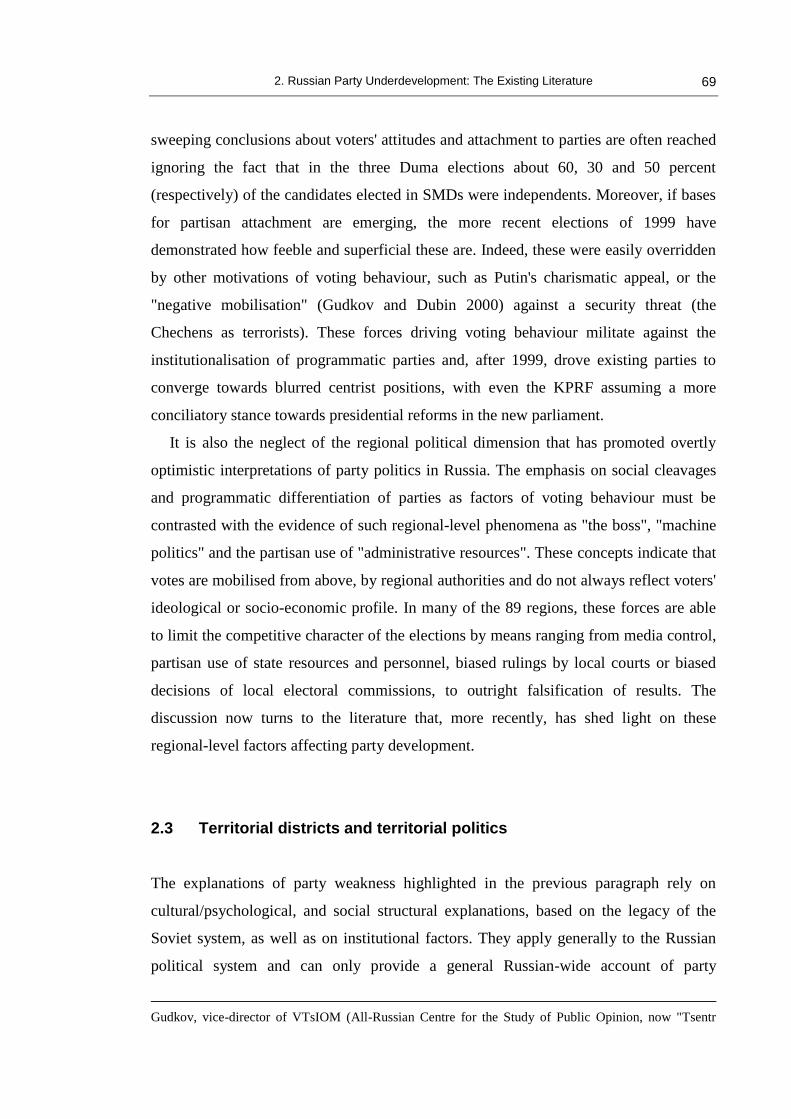
2. Russian Party Underdevelopment: The Existing Literature
69
sweeping conclusions about voters' attitudes and attachment to parties are often reached
ignoring the fact that in the three Duma elections about 60, 30 and 50 percent
(respectively) of the candidates elected in SMDs were independents. Moreover, if bases
for partisan attachment are emerging, the more recent elections of 1999 have
demonstrated how feeble and superficial these are. Indeed, these were easily overridden
by other motivations of voting behaviour, such as Putin's charismatic appeal, or the
"negative mobilisation" (Gudkov and Dubin 2000) against a security threat (the
Chechens as terrorists). These forces driving voting behaviour militate against the
institutionalisation of programmatic parties and, after 1999, drove existing parties to
converge towards blurred centrist positions, with even the KPRF assuming a more
conciliatory stance towards presidential reforms in the new parliament.
It is also the neglect of the regional political dimension that has promoted overtly
optimistic interpretations of party politics in Russia. The emphasis on social cleavages
and programmatic differentiation of parties as factors of voting behaviour must be
contrasted with the evidence of such regional-level phenomena as "the boss", "machine
politics" and the partisan use of "administrative resources". These concepts indicate that
votes are mobilised from above, by regional authorities and do not always reflect voters'
ideological or socio-economic profile. In many of the 89 regions, these forces are able
to limit the competitive character of the elections by means ranging from media control,
partisan use of state resources and personnel, biased rulings by local courts or biased
decisions of local electoral commissions, to outright falsification of results. The
discussion now turns to the literature that, more recently, has shed light on these
regional-level factors affecting party development.
2.3 Territorial districts and territorial politics
The explanations of party weakness highlighted in the previous paragraph rely on
cultural/psychological, and social structural explanations, based on the legacy of the
Soviet system, as well as on institutional factors. They apply generally to the Russian
political system and can only provide a general Russian-wide account of party
Gudkov, vice-director of VTsIOM (All-Russian Centre for the Study of Public Opinion, now "Tsentr

2. Russian Party Underdevelopment: The Existing Literature
70
weakness. The analysis of cross-regional differences in party development and
independents' proliferation, on the contrary, demands explanations at the level of region.
And Russian regions do differ on many accounts. The Russian territory is huge and
diverse, stretching over ten time zones, encompassing very heterogeneous territorial
conditions, highly variable regional resource endowments, and economic and social
conditions. The adopted form of state (as resulting from the Russian constitution and
bilateral treaties with individual republics) is "asymmetric federalism", which grants
different degrees of autonomy to different units of the Federation, some of which are
characterised by distinct ethnic/religious outlooks. In such a fragmented and
heterogeneous context, all-Russian averages, in most field of social inquiry, are bound
to give a very partial account, if not a misleading and distorting one.
It is by now well known that Russian regions differ, for example, in their degree of
openness and political pluralism. This is shown by studies of individual regions (for
example Orttung 1995; Melvin 1998; Farukhshin 2002),51
and by comparative cross-
regional studies (Tsygankov 1998; Gelman 1999; McMann and Petrov 2000; Reisinger
and Moraski 2003). Also in terms of local self-government, federal units present
different degrees of democracy. In Tatarstan not only counties, but also cities are
"statified" (i.e. headed by unelected administrative officials), while, in the ethnically
Russian regions, chief executives of all levels of government are popularly elected
(Matsuzato 2001: 183). More generally, on "civil society", Richard Sakwa has pointed
out that western notions have little meaning in the Russian context, where "dependency
networks" dominate the scene and are "rooted in local production and supply
communities, and regional identities" (Sakwa 2002: 5). Not only in relation to the
federal level, but also relative to the sub-regional local and municipal levels, the
regional dimension plays a key role. Indeed, "regional governance provides a better
analytical tool than local governance in Russia at this time. Alliances form, interact, and
implement policy at the regional scale, not at the urban scale" (Mitchneck 2002: 174).
In terms of electoral results, cross-regional differences are also evident. A clear
geographical pattern is observed starting from the April 1993 Yeltsin's referendum and
Levada"), at their headquarters in Moscow, in February 2002. 51
For example, Farukhshin on Tatarstan concludes that "the degree of autonomy they won, essentially
independence from the federal centre, was used to establish a regime based on personal power"
(Farukhshin 2002: 194).

2. Russian Party Underdevelopment: The Existing Literature
71
continuing with the two Duma races and the 1996 presidential elections. According to
this pattern, Yeltsin's supporters were concentrated in the areas north of the 60th
parallel,
while his support was weakest "in a more or less contiguous band to the south and south
west of Moscow, stretching from Bryansk to Novosibirsk." (Treisman 1999: 82;
O'Loughlin, Shin and Talbot 1996; Clem and Craumer 1996; Slider, Gimpelson and
Chugrov 1994).52
Explanations for this North-South divide have focused on the degree
of urbanisation. Rural areas are concentrated in the South, see higher turnout rates and
vote predominantly for conservative forces, while urban areas tend to support reformers
and have low levels of turnout. This interpretation has been questioned by Kimitaka
Matsuzato, who stresses that "the famous 'Red Belt' is not agrarian" (Matsuzato 2000:
143).
Matsuzato notes that, contrary to widespread assumption on the explanatory power
of socio-economic conditions for voting behaviour, in 1996 Yeltsin received an
"unexpectedly large" share of his votes from voters with low levels of education, low
income, aged over 50 years of age, living in rural areas or towns under 10,000, and
thinking that "their economic situation had worsened in the previous year”. Indeed,
Yeltsin only got less than half of his 40.2 million votes from the 100 largest cities
(Matsuzato 2000: 193-5). Also Hough and Lehmann noted the "mystery" of anti-reform
voters voting for Yeltsin in the 1996 presidential elections. For the authors, “part of the
explanation lies in Yeltsin’s obfuscation of his own position on economic reform in the
early part of the campaign and his offering of subsidies to every group and region he
visited” (Hough and Lehmann 1998: 192). Instead of taking root in society as an all-
national formation, the Russian party of power artificially extends its territorial and
social reach using as a resource regional power structures (Kholodkovskij 2000: 187).
Matsuzato has proposed an interpretation of voting behaviour which, while rejecting
the North-South argument and the related explanations based on urbanisation and living
standards, is sensitive to the regional dimension of Russian politics. In his view, the key
factor is mobilisation from above (Matsuzato 2000: 143). This means that regional
authorities are able to influence the vote in their regions, albeit to different degrees.
They do so through their control of the regional media, the use of administrative
personnel for campaign purposes, and their control of the regional economy. This has
52
Even as early as the 1989 elections, Kolosov, Petrov and Smirnyagin (1990) noted a division along the

2. Russian Party Underdevelopment: The Existing Literature
72
also been observed by Henry Hale, who writes of administrative influences on the 1993
SMD contests. Such resources appeared to play a key role in Tatarstan, Kalmykia,
Mordovia, Kemerovo and Orel, in addition to Hale's case study, Bashkortostan. Indeed,
these are regions where elections in general (i.e. including and especially regional ones)
seem to be rather 'controlled' (Hale 1999: 106).
Given these forces corrupting local competitiveness, party organisational efforts at
territorial penetration are not a guarantee of success in the SMDs. This is exemplified
by the case of the LDPR, which managed to nominate its candidates in a very large
number (188) of SMDs in 1995, but obtained only one victory. The same pattern
occurred in the regional legislative elections of 1995-98, where Zhirinovsky’s LDPR
nominated candidates in 58 regions, but won seats only in six (Golosov 1999: 1341). In
his analysis of this cycle of regional elections, Golosov explained cross-regional
differences in party development in terms of the nature of intra-elite conflicts, an
hypotheses already proposed for the case of Sverdlovsk oblast in an article co-authored
with Vladimir Gelman (Gelman and Golosov 1998). If regional elites are divided and
unable to subdue one another, then the chances of one side starting to build a political
party, as a tool of political competition, are higher. In most cases, on the contrary,
regional politics is monistic and controlled by the governors, who "simply do not need
the 'party of power' as a means of translating their influence into assembly seats"
(Golosov 1999: 1339). This means that the most common scenario in the 1995-98
regional legislative elections can be summarised as follows. "Where executive power
belongs to left-wing governors, Our Home is Russia has disappeared, to be replaced
with the Communist Party (KPRF) or its local mutants . . . Non-communist governors
prefer to support independent candidates -or anybody who is willing to co-operate"
(Golosov 1999: 1340). The marginality of national political parties in regional elections
is even more apparent in gubernatorial elections. Petrov notes that a number of strong
gubernatorial candidates choose not to publicise their party links and even distanced
themselves from parties, movements and blocs, with whom they had previously closely
collaborated. They appeared mainly as representatives of the 'party of voters' (Petrov
2001: 4).
55
th parallel, with CPSU establishment candidates winning in the South, and reformers in the North.

2. Russian Party Underdevelopment: The Existing Literature
73
Most recently, Hutcheson (2003) has also addressed the issue of party development
at the regional level. Based on fieldwork in three regions of central Russia, his work is
primarily concerned with the role of the regional branches of national-parties in regional
politics. It examines six parties chosen for their ability to clear the 5 percent
representation threshold in the proportional tier of the latest 1999 Duma elections. The
choice of the regional dimension of party activity is a welcome novelty for a single-
authored book. However, the focus on party organisation, and the reliance on interviews
with party officials may have produced a false impression of party solidity. In fact, the
input of national-party branches in regional politics is negligible in most cases. Most
such branches had a precarious and volatile life in the 1990s (Golosov 1999). Moreover,
Hutcheson’s work, while rich in information and insight into local party activity, cannot
provide a solid basis for generalisations. This is because it is based on only three
regions (Tatarstan, Samara, and Ulyanovsk), all located in the same economic macro-
region, and jointly representing under 1 percent of Russian territory and 6 percent of the
population, as the author admits (Hutcheson 2003: 5). Perhaps, most differently from
the perspective adopted here, the selection of parties that form the object of Hutcheson's
study is based on their clearing the 5 percent threshold in the PR tier. In so doing the
book continues the sidestepping of Duma races in the territorial districts. This is even
more surprising given the focus on territorial party organisations, which should find in
the SMDs their proper arena.
In general in the 1990s national political parties have played a uniformly marginal
role in regional elections, with the partial exception of the communist party (KPRF).
This means that there is too little variance along this dimension to consider it as a
potential explanatory variable in a model predicting different regional levels of
independents' success in Duma elections. On the contrary, Petrov and Titkov (2000)
note an example of regional-level dynamics likely to affect the independents' success in
a federal election. In their study of the regional dimension of the 1999 Duma election,
they stress the increased role of regional elites (on the background of a weakened centre
after the 1998 political crises and the August default). While at the time of the 1995
Duma elections most regional governors had been appointed by Yeltsin, by 1999 most
had been popularly elected. This gave them a stronger hold on regional political and
economic power, and, in turn, sharply increased the role of administrative resources in

2. Russian Party Underdevelopment: The Existing Literature
74
elections. In 1999 regional governors started to see Duma elections as important
channels of influence and, therefore, began to employ considerable resources in these
races, including forming a number of electoral alliances that effectively challenged the
independents (Petrov and Titkov 2000: 231).53
Up to this point, this section has noted prominent examples in the literature that
indicate the importance of the regional dimension in politics and electoral politics in
particular. How does this relate to the study of independent candidates? It is a
contention of this thesis that the region represents an important political context that
significantly shapes the district races and levels of independents' proliferation (see
chapter 3). The existing literature, however, has overlooked the link between SMD
results and regional politics. Even political and electoral geographers, who have
emphasised regional variations in electoral patters, have focused on proportional vote
only, rather than studying the 225 electoral districts (O'Loughlin, Shin and Talbot 1996;
Clem and Craumer 1996, 2000, 2000a, 2002; Marsh and Warola 2001).
One contribution that can illuminate on cross-regional differences in SMD results is
represented by Hale's study of the 1999 elections, in which the success of non-party
candidates is linked to the availability of electoral resources that are alternative to those
supplied by political parties. Namely, these "party substitutes" are the support that a
candidate may receive from the regional governor, and the backing of regional
industrial and financial groups (Hale 2005). This is an example of how regional factors
can account for cross-regional differences in the success of the independents. Thanks to
data provided by Henry Hale, this thesis will incorporate these two factors in the model
of 1999 independents' success.54
Another factor that this thesis can derive form the existing literature is closely related
to the above-mentioned stress on "party substitutes" - governor's control of
administrative resources. This phenomenon has been described in Matsuzato (2000) and
Hale's (1999) contributions discussed above in this section. Different regional governors
"control" their regions to different extents. The degree of control is likely to interact
with the possible support that a candidate or a party may receive from a governor - this
support is more valuable, the greater the degree of control the governor is able to exert
53
This point is developed in chapter 3 and 8. 54
Details on these data are provided in chapter 4.

2. Russian Party Underdevelopment: The Existing Literature
75
on the regional politics, e.g. on the regional media. Therefore, this dynamic could
account for part of the cross-regional variance in the success of independent candidates.
Moreover, a "classic" spatial hypothesis that can be used here is the positive effect of
urbanisation on party development. According to this thesis, already proposed by
Huntington (1968) and by Rokkan (1970), parties initially thrive in urban settings and
then try and penetrate the countryside. Moser has investigated the effect of urbanisation
on "elite partisanship" and found no confirmation of this hypothesis (Moser 1999).
However, this may be due to some limitations applying to Moser's methodology. Most
importantly, no firm conclusions on a relationship between two variables can be derived
from a two-way cross-tabulation, as this does not allow the analyst to control for other
factors. Additionally, Moser excludes all autonomous units from the analysis, bringing
the number of SMDs considered down to 179 in 57 regions, compared to a total of 225
SMDs in 89 regions. Urbanisation will be included in the statistical models of this
thesis.
Moser does find a relationship between candidate's non-partisanship and
occupational status. Indeed, this is the standard explanation for independents'
proliferation. Independents are successful because local elites (defined as having a given
occupational status, mostly membership in regional or federal political structures) can
rely on their own personal campaign resources and do not need party sponsoring to win
an election. Golosov originally advanced this thesis in terms of the regional "bosses"
avoiding party affiliation (Golosov 1997). The "bosses" (nachalstvo) are local
"administrative and economic managers" who already occupy a "prominent position in
Russia's power structure" before contesting national elections (Golosov 1997: 6). Other
formulations of this phenomenon include Hughes analysis of "directorates" of
"interlocked" elites (Hughes 1997: 1031). Golosov and Shevchenko (2000, 2002), in
their statistical analysis, found an important effect of personal resources on candidates'
success in one of the few studies of the Duma elections specifically focused on the
SMD races.55
55
Occupational status was also at the heart of John Ishiyama's analysis of the Duma members elected in
1993 and 1995. The author derived an index of 'notability' for each deputy, which expresses the degree to
which he is endowed with personal resources as opposed to being dependent on party sponsoring for his
candidacy. He finds support for the traditional view that cadre parties are fluid organisation that tend to
rely on local notables, while programmatic mass parties are more cohesive and disciplined, and tend to
promote candidates from their own ranks (Ishiyama 1999b: 49-51, 65).

2. Russian Party Underdevelopment: The Existing Literature
76
The hypothesis that occupational status is at the root of independents' success is well
grounded. Indeed, prominent local elites, or notable candidates, face an advantage over
other candidates thanks to their personal resources. They do not need party nomination
and often run as successful independents. This hypothesis, however, does not have
much purchase on the question of cross-regional variations in independents' success.
Why are independents more successful in some regions than in others? If this self-
selection of notable candidate into independent nomination only applies to some
regions, what explains this difference? Answers are suggested in the next chapter and
tested with the statistical models of chapters 7 and 8.
Similarly, another widespread explanation of independents' success posits that they
portray themselves as the defenders of local interests, something which elections in
territorial districts tend to give a premium to. Indeed, "candidates in single-member
districts frequently promised to lobby for local interests". But it was specifically
independent standing that was perceived as a more credible avenue to represent
local/regional interests (Belin and Orttung 1997: 84). This is an important insight and is
developed in the next chapter. However, on its own it does not account for cross-
regional variation in independents' success. In fact, this hypothesis should guarantee the
same high levels of success to the independent in all SMDs, in all regions, given that the
territorial nature of district races makes local interests salient in all SMDs.
In sum, what is still missing in the literature is an explanatory framework that is
sensitive to regional political context. This is needed in order to transform the dominant
explanations relying on the occupational status of notable candidates and on the salience
of local interests from national constants into variables that produce different effects in
different regions. Golosov and Shevchenko have explored the effect of one regional
structural factor on party development, as "the strategies of candidates are to be
understood in their social context" (Golosov and Shevchenko 2000: 135). However, the
factor they consider, i.e. the negative impact of networks inherited from Soviet times,
seems rather weakly operationalised as migratory flows between regions (Golosov and
Shevchenko 2000, 2002).
In the next chapter, another structural factor is suggested as the main explanatory
hypothesis of this thesis, namely centre-regional relations and the process of federal
bargaining of the 1990s.

2. Russian Party Underdevelopment: The Existing Literature
77
Conclusion
Ten years after the first competitive elections in the new Russia, the literature on party
development appears both copious and heterogeneous in focus. Apart from the initial
descriptive emphasis, there have been two broad perspectives. On the one hand, most
authors have stressed the underdevelopment of Russian party politics. They have
pointed to the genetic defects of Russian parties in the early mobilisation phase at the
end of the Soviet era and in the early post-Soviet years. Causes have been found in a
wide range of factors, broadly falling into either long-term, structural ones, rooted in the
regime type exemplified by the Soviet system, or short-term, contingent ones.
On the other hand, other observers have reached more positive conclusions and have
detected increasing levels of party attachment (if not traditional party identification).
Some of these conclusions, however, seem contradicted by recent events, namely the
1999 Duma elections.
Both streams of literature, however, have failed to provide a comprehensive picture
of the electoral process in Russia, as they are largely limited to the all-Russian, average,
perspective. This is the product of an over-reliance on the PR tier of the electoral
process and has led many analysts to overlook cross-regional differences in voting
patterns. In particular, works interested in voting behaviour have based their
conclusions on opinion surveys that could note take into full account territorial
differences.
To be sure, a rich literature has also addressed problems of party development at the
regional level. Recent studies have shed light on non-competitive practices of voter
mobilisation used at the regional level (machine politics, administrative resources, the
"bosses"), which provide useful tools to investigate Duma races in the SMDs. However,
most studies of party development in the regions have dealt with regional elections, in
individual regions or in a comparative fashion, and have not investigated the impact of
regional politics on federal elections through SMDs. When the link between territorial
politics and federal electoral results has been considered, mostly by electoral
geographers, the focus has been confined to the spatial distribution of PR voting.

2. Russian Party Underdevelopment: The Existing Literature
78
Works that have studied Duma races in the SMDs, have produced highly valuable
accounts, but largely limited to only a few districts, or to only one election, or have
focused on explanations on the supply side of the elections only (i.e. candidates’
personal resources). A systematic explanation of cross-regional differences in party
success, which can integrate the experience of the three Duma elections and the most
perceptive findings on Russian regional-level politics, is still missing.

79
3
Explanatory Framework
“Even in highly centralized systems, there
will be marked local differences in the range
and character of the alternatives presented
to the citizens on polling day, not just
because of the variations in the group
appeals of the party candidates but even
more because of the variations in the extent
of local resistance to partisan conflict".
Stein Rokkan (1970: 15).
Two important points made by preceding chapters have been that the success of the
independents varies widely across Russian regions (see Introduction), and that existing
explanations of party underdevelopment, including the sketchy works that touch upon
the issue of the independents, are found wanting in explaining this variability (chapter
2). This chapter presents the explanatory framework of the thesis.
The task of identifying the causes of spatial differences in the outcome necessarily
involves finding explanatory factors that also vary across regions and electoral districts.
The main hypothesis of this investigation is based on two considerations. Firstly, the
electoral process cannot be abstracted from the context of the broader political
transformation. Secondly, in the 1990's one key dimension of such transformation was
the process of defining centre-regional relations. After seventy years of fictitious
federalism under the Soviet system, the transition process of the late 1980s/early 1990s
opened the door to the process of federal bargaining between the constituent units of the
federation (the regions) and the federal central government.
Differences in regional stances towards the federalisation process (ranging from the
demand of greater regional autonomy to the call for stronger centralisation) gave rise to
a territorial cleavage that political parties failed to represent or absorb. The reasons for

3. Explanatory Framework
80
this failure lie in the nature of Russian political parties, national in rhetoric and
Moscow-based in fact. In turn, the absence of parties appealing to the most assertive
regions was favoured by electoral regulations strongly discouraging regionalist parties.
This set of circumstances opened up a window of opportunity for non-party
candidates to fulfil the function of representing the territorial cleavage. This window of
opportunity was wide open in the early 1990s, but became increasingly narrow by the
time of the 1999 elections. Indeed, by that time, the gap between regionalist
assertiveness and the party system narrowed considerably due to the direct involvement
of regional leaders in party building. Therefore, for the 1993 and 1995 elections, the
main hypothesis is that different levels of regionalist assertiveness across regions are
associated with cross-regional differences in independents' success. For the 1999
elections, regionalist assertiveness is not expected to operate in the same way. Rather,
independents will be more or less successful depending on whether the regional
governor supports a party or an independent candidate, and on the extent to which he is
able to stir his region's "administrative resources" towards influencing the district
campaigns.
Clearly, not only do spatial variations in the outcome variable occur at the level of
regions, but also across electoral districts within regions. Indeed, the district level
context is the most proximate to electoral returns. There is a large literature on factors
affecting district electoral outcomes in established democracies adopting SMDs. Data
availability constrains the range of factors that it is possible to consider in the Russian
case. However, such conventional dimensions of district races as the effect of
incumbency, the candidates' elite status, financial backing, the support of regional
governors, and the effect of challenger candidates can all be assessed to some extent.
Moreover, region-level and district-level factors should be thought of as forming a two-
stage causal order (Davies 1985). In other words, district factors not only influence the
dependent variable, but are also "caused" by regional factors. The latter regional factors,
then, have both direct and indirect (mediated by district factors) effects on the outcome.
For example, the decision of the incumbent to run as independent or as party candidate
is likely to be influenced by the region's autonomist sentiments. In a highly assertive
(autonomist) region, the incumbent may well prefer to avoid any connection with
Moscow-based parties and run as independent. If this is so, regionalist assertiveness will

3. Explanatory Framework
81
have two types of effects on the outcome. One effect will be direct, favouring
independents’ success, and another effect will be indirect, favouring the decision of the
incumbent to run as independent, thus further increasing the share of votes received by
non-party candidates through the positive effect of incumbency.
In terms of causal paths, this means that two arrows will link regionalist
assertiveness to independents' success, one reaching the outcome directly, and the other
passing through incumbency. In technical terms, this typical causal path is often said to
involve a "mediating effect" between the dependent and the independent variable. The
causal relationships posited by the explanatory framework of this thesis are graphically
represented in the path diagram of Figure 3.1.
Unfortunately, the available data do not support a comprehensive model for the 1993
elections. However, more complex designs can be implemented for the 1995 and,
especially, for the 1999 elections. A summary of which hypothesis can be tested for
which election is presented in the last column of Table 3.1 in the concluding section of
this chapter. The following four sections of this chapter discus one explanatory
hypothesis each, with the exception of section 3.3 which deals with candidates’ personal
resources, party challengers and geographic accessibility.
3.1 The main hypothesis: territorial cleavages and independents'
competitive advantage
As discussed in the previous chapter (chapter 2), the literature suggests a number of
explanations for the proliferation of independent candidates. Most observers have seen
independents' success as favoured by party weakness (organisational underdevelopment,
lack of voters' attachment, or general distrust in the party as institution). They have
noted that weak parties cannot offer significant campaign resources to viable candidates.
As a consequence, candidates who can rely on personal resources (especially the local
notables or "bosses") do not need political parties and run as independents.
The conventional wisdom, in sum, paints a picture of independents' success centred
on the generalised malaise of the Russian party (or pseudo-party). Under such
conditions, the story goes, the candidates who are best equipped with personal resources

3. Explanatory Framework
82
self-select themselves into independent nomination (Golosov 1997, 2000, 2002, Moser
1999).
These appear to be meaningful, but overly general explanations. They cannot explain
why parties do attract viable candidates and do win seats in some districts, but not in
others. For example, the hypothesis that independents' success is due to their personal
resources (local notability) is not sufficient in the light of the fact that notable
candidates are present in every district, but independents are not equally successful in
all districts. Clearly, in districts where independents are not successful, either personal
resources are not effective, or candidates with personal resources choose to run as party
candidates. Additional takes on the sources of independents' advantage over party
candidates have been proposed, which also fall prey to the same inadequacy. In one
passage of her doctoral thesis, Regina Smyth suggests that independent candidates
enjoy an advantage over party candidates because the former can move "more freely
anywhere on the political spectrum" (Smyth 1998: 273). Further specifying this
hypothesis, a very widely shared perception has the independents capitalise over their
claim to be the genuine representatives of local interests and above ideological
divisions. In this vein, Laura Belin and Robert Orttung note that "candidates in single-
member districts frequently promised to lobby for local interests. A successful
candidate in Khabarovsk Kray, for example, claimed that all Duma deputies should be
independent of parties and 'be guided only by the interests of their own voters and
regions'".56
To a large extent, this dynamic is part and parcel of any plurality electoral system
based on SMDs. Robert Moser recognises that “plurality elections parochialise the
competition for seats to the Duma, enhancing the role of regional elites and
counteracting the dominance of the Moscow-based elites on the PR lists” (Moser 2001:
514). This has been perceived widely, ever since the first free elections of 1993, when
"in the local constituencies the voters supported representatives of local interests rather
than party people, for 129 of those elected were classed as independents” (Friedgut and
Hahn 1994: 9).
56
Election appeal by Valentin Tsoi, published in Tikhookeanskaya zvezda (Khabarovsk), 3 November
1995, p.2. Quoted in Belin and Orttung (1997: 84).

3. Explanatory Framework
83
The salience of "local interests" is also observed in other countries' SMD systems,
where it is said to enhance the value of personal candidate recognition (the "personal
vote") over the value of the party label. On the USA, it has been noted that “…in
single/member district systems, representatives have geographical areas to call their
own. These systems present an opportunity and create motivations for relationships
between represented and representatives that are more personal, particularistic, and
idiosyncratic than in any other kind of system. Such relationships are often based on
relatively non-partisan, non-ideological, and non-programmatic constituency service”
(Cain, Ferejohn and Fiorina 1986: 8).
The idea that the independents enjoy an advantage over party candidates because
they can move more freely over the ideological spectrum (Smyth 1998), or because they
can claim to be closer to "local interests" (Moser 2001, Belin and Ortung 1997, Friedgut
and Hahn 1994) provides important clues that are at the basis of the main explanatory
hypothesis of this thesis. However, this line of explanation, in its own terms, cannot
shed light on why independents are not equally successful from district to district. In the
face of cross-district variability in the outcome, one cannot escape one of two
conclusions - in districts where the independents fail, either 1) local interests are not
important; or 2) they are better represented by parties.57
And yet, no study has attempted
to find out why these hypotheses apply to some districts and not to others. The main
hypothesis of this thesis suggests an answer to this question.
The independents' representation function
An important precondition for answering that question is to see independents' success as
more than mere party failure. In fact, under Russian conditions, both parties and
independents should be seen as constituting distinct forms of political representation,
each best suited to carry out a specific representation function. Namely, parties are the
most effective channels of national representation and political co-ordination across
districts, both for politicians and voters. The independents, on the other hand, are best
suited to channel not just any "local interest", but territorial cleavages.
57
Indeed, Smyth notes that in some SMDs the independents' advantage of greater mobility along the issue
spectrum does not prevent communist candidates "to win the day" (Smyth 1998: 273). Unfortunately, the
author doesn't pursue this point any further, thus leaving open the question of why the independents'
advantage should vary systematically across districts.

3. Explanatory Framework
84
In Rokkan's language of cleavages, national parties arise from and stir up functional
cleavages that cut across territorial units (Flora, Kuhnle, et al. 1999: 281-84). By
contrast, regionalist parties and, in Russia, the independents activate and express
territorial cleavages, i.e. lines of political opposition dividing individual territorial units
from the rest of the country.
The class fracture constitutes a typical example of a functional cleavage, uniting
workers across territorial units. On the other hand, the peripheral resistance to the
centralising drive of nation builders, in Rokkan’s analysis, typically gave rise to a
territorial cleavage, expressing and cementing voters' bonds within territorial units
(Flora, Kuhnle, et al. 1999: 320-26). Therefore, depending on whether the dominant
cleavage in a given SMD is territorial or functional, independents and regionalist
parties, or national parties, respectively, constitute the most apt form of political
representation. In the Russian case, as mentioned, regionalist parties face high
thresholds of entering, and succeeding in, national elections, which virtually leaves the
territorial cleavage to independents to represent.
It should be noted that the notion of territorial cleavage does not overlap with the
more general one of "local interest". It is necessary to distinguish between
predominantly functional "local concerns" and territorialised local issues. Without this
distinction, attention to "local concerns" can hardly explain the cross-district variability
of independents' electoral success, as all voters in all districts care for "local
conditions". As noted above, the SMD system itself tends to produce territorial patterns
of representation everywhere. The point is that "local concerns" can lead to demands for
functional representation. For example, drawing form the US experience, Cain,
Ferejohn, and Fiorina explain that local interests may coincide with functional
representation, “territorial and functional representation are not always and everywhere
in conflict. A sponsored union candidate in a heavily unionised constituency, for
example, might feel no conflict about representing union and local interests at the same
time” (Cain et al. 1986: 19).
There is only one kind of "local concern" that is salient in several Russian units and
is eminently territorialised - demands for regional autonomy. These demands are best
represented by the independents and vary in intensity from region to region. In sum,
while all voters have local concerns, only in some regions local concerns take the form

3. Explanatory Framework
85
of autonomist or regionalist demands, thus constituting a territorial cleavage and giving
the independents a competitive advantage over national parties.58
To be sure, this framework does not assume a rigid division of labour between party
candidates and independent candidates, with the latter only articulating territorial
cleavages and the former only concerning themselves with national issues. It is
important to stress that this is not the case in practice and that the present hypothesis
does not assume so. The key point is not what type of issues candidates articulate, but
what they can credibly, and therefore effectively, articulate. The hypothesis is that a
party candidate (of a national party) that portrays himself as a defender of local interests
is less credible than an independent that attempts to play the same card, if the district
has a strong territorial cleavage, and all other factors are equal. Similarly,
independents can and do win by campaigning on national issues in districts with or
without territorial cleavages. Independents can be electorally strong for all sorts of
reasons, not just because they can credibly claim to represent local interests. The point
is that, other reasons for success being equal, an independent has a competitive
advantage over a candidate of a national party if he runs in a district with a territorial
cleavage.
Before passing to discuss in further detail what constitutes a “territorial cleavage” in
the comparative literature and in today’s Russia, it is helpful to clarify the assumptions
behind the main hypothesis. Beyond the obvious requirement that the electoral system
legally allows independent nomination (as opposed to systems fully based on list votes),
the hypothesis requires three conditions:
1. Territorial electoral districts (like Russia’s SMDs) in which political representation
is linked to a sub-national constituency territorially defined. This is necessary for a
territorial cleavage to become an electoral cleavage, something a candidate can
articulate. To illustrate this point, the Russian presidential electoral system can be
considered. It is a majoritarian system allowing independent candidates, but it is
based on one all-Russian constituency. In such conditions an independent candidate
that promises to advance the interests of one region only does so at his own risk and
certainly does not face a competitive advantage over national party candidates.
58
Not only are regional parties strongly discouraged under electoral rules, but also regions have found it
very difficult to coordinate their efforts due to the divergent positions taken by autonomous and ordinary
regions on the preferred federal arrangement (Solnick 1996).

3. Explanatory Framework
86
2. Early stages of electoral competition and party formation. As party development
unfolds, not only are national parties more and more able to respond to social
cleavages, but also to shape and selectively activate them. A national party, through
its organisational presence over the territory can help integrate the national
electorate into one community. Advanced democracies characterised by long-
standing centre-regional conflicts can have successful branches of national parties in
their most restive regions (see the example of the Spanish PSOE in Catalonia,
Blondel 1981: 327). At its best, a national party can approximate the "integrated
party" ideal type.59
3. Electoral rules that strongly discourage regionalist parties. Regionalist parties are
"based on linguistic, territorial, and ethnic claims that refer specifically to the
distinctiveness of the cultural and economic region from which they draw support"
(Caramani 2004: 162). In principle, regionalist parties face the same competitive
advantage of independents compared to national party candidates. In practice, this
competitive advantage belongs to the independents only, if the electoral discourages
regionalist parties from appearing on the ballot in the first place. Despite demanding
registration rules and a very high representation threshold,60
at least one regionalist
party did appear in Russian elections. In some cases, national parties attempt to
spouse regionalist themes. The possibility that these parties effectively challenge the
independents will be investigated.
These are necessary conditions for this hypothesis to work. They are not sufficient
conditions for independents’ success, which is why the hypothesis predicts
independents’ success only in some districts. The mentioned conditions apply to the
country as a whole, and require high levels of regionalist assertiveness, only present in
some regions, to promote independents' success.
59
The "integrated party" is considered by many essential for federal stability (Filippov et al. 2004), as
discussed in the Introduction to this thesis. The emergence of such party, however, requires a number of
institutional and political conditions, not merely the passage of time. 60
The Russian threshold at 5 percent is “very high” not in absolute term, but relative to the size of the
constituency to which it applies (i.e. the whole country).

3. Explanatory Framework
87
What is a territorial cleavage and what is it in the Russian context?
Social structure and social cleavages have provided a standard framework to approach
the study of elections and party systems, most prominently since Rokkan and Lipset's
famous contribution (1967). It is worth briefly reviewing this approach. According to
the two authors, West European party systems have been shaped by different
combinations of four types of cleavages (Rokkan and Lipset 1967). Two cleavages were
produced by the "national revolution", namely 1) the contrast between the nation
building drive and the "resistance of ethnic, linguistic, religious subject populations in
the provinces";61
and 2) the opposition between the "centralising, standardising and
mobilising nation-state versus the corporate privileges of the Church". Two additional
cleavages originated from the industrial revolution, namely 1) the conflict between
landed interests and the "new industrial entrepreneurs"; and 2) the division between
owners and employers versus "tenants, labourers, and workers" (Rokkan, in Flora 1999:
285).
The typical example of a territorial cleavage in Rokkan's treatment is the first of the
four types listed in the previous paragraph. This is the centre-periphery fracture,
opposing traditional local communities to the modernising drive of the centre in the
newly established nation-states of Western Europe in the 19th
and early 20th
centuries.
The typical example of a functional cleavage, on the other hand, is the class one. As
Lipset and Rokkan explain, the difference between territorial and functional cleavages is
the following: "in the one case the decisive criterion of alignment is commitment to the
locality and its dominant culture: you vote with your community and its leaders
irrespective of your economic position. In the other the criterion is commitment to a
class and its collective interests: you vote with others in the same position as yourself
whatever their localities, and you are willing to do so even if this brings you into
opposition with members of your community" (Lipset and Rokkan 1967: 13; quoted in
Johnston 1990: 124). This means that a functional cleavage is potentially national in
scope, in the sense of allowing and requiring cross-regional political co-ordination. The
class cleavage (workers versus employers), for example, typically divides territorial
communities into two camps, each of which is part of a national camp.
61
This may be a territorial cleavage but not necessarily because the cultural or religious resistance
movement may "find allies in the central areas and thus contribute to the development of cross-local and
cross regional fronts."

3. Explanatory Framework
88
In a district where the dominant cleavage is territorial, on the other hand, the main
source of political identity for voters is membership in the local community.
Membership in functional groups (as defined by occupation) is secondary. This means
that the line dividing the main opposing camps overlaps with territorial boundaries.
Under such circumstances, a national political party is not well suited to mobilise
voters. An institution claiming to provide genuine representation must have a local
raison d’être. The history of Western Europe shows that cleavages rarely remained
purely territorial after completion of the industrialisation phase, the universal extension
of suffrage and the advent of mass politics at the turn of the 20th
century (Caramani
2003: 434, Rokkan 1970). But where the territorial component remained key to the
identity of local communities, it supported the emergence of regionalist parties (Spain
and Canada are examples).
In most cases, cleavages are functional but may have a pronounced territorial
dimension if their support base is geographically concentrated. It is worth noting the
difference between a territorial cleavage and a territorially-concentrated functional
cleavage. In the first case, "territorial defence" (demands for cultural, linguistic or
administrative autonomy) is the content of the cleavage and territorial boundaries are
essential to its definition. In the case of a functional cleavage, the fact that electoral
support may be territorially concentrated is accidental to its policy contents. A district
predominantly inhabited by working-class dwellers does not constitute a territorially
distinct group if workers are also present, albeit in lower numbers, in other parts of the
country. This distinction is connected to the difference between a regionalist party and a
party with regional support (or regional party). The first mobilises a territorial cleavage,
the second mobilises a territorially-concentrated functional cleavage. Examples of the
former are the Basque 'Partido Nacionalista Vasco' and the Italian 'Northern League',
while the German 'Christian Social Union' provides an example of the latter.62
Russia, of course, has long passed through the historical phases that gradually
reduced the relative importance of territorial divisions in Western Europe (masses have
62
In keeping with his centre-periphery model, Rokkan labels "peripheral parties" what is here called
"regionalist parties" (Rokkan and Urwin 1983: 154-65). I prefer to avoid the ambiguity of the term
"periphery", which implies a peripheral geographical location, or a subordination of a culturally and
economically backward region towards the centre. These connotations are potentially misleading as many
"peripheries" rather see themselves as alternative "centres". For this reason the more neutral term "region"
is preferred, as in "centre-regional relations" and "regionalist party".

3. Explanatory Framework
89
been politically mobilised and the country has long achieved the industrialisation of the
economy). However, one of the challenges produced with the collapse of the Soviet
Union has been the redefinition of Russia's state structure, or the process of
"refederalisation" (Hughes 2002). This means that, particularly in the 1990s, aspects of
the state-building process were still open. The relationship between the federal centre
and federal units had to be bargained and defined. The centre-regional fracture was
particularly deep for a small number of federal units, whose leadership adopted sharp
autonomist stances. This increased the salience of a territorial cleavage opposing the
territorial community (unit of the federation) to the centre. Indeed, "evidence suggests a
relatively strong and growing identification of Russians with their regions and regional
leaders rather than with the nation as a whole or central leaders in Moscow" (Lapidus
and Walker 1995: 106).
With the exception of Chechnya, the other units that advocated strong autonomist
requests entered a process of bargaining with the centre that saw different and
alternating degrees of success in the 1990s. Not only did the strength of regionalist
demands vary across regions but also across time, and was often heightened when the
federal centre was in a weak bargaining position. Some authors have adopted the
metaphor of a pendulum to describe the ebb and flow of centralisation/decentralisation
phases in 1990s Russia (Petrov 1999). With the Federal Treaty of 1992, the units
endowed with republican status63
, especially Tatarstan, Bashkortostan, and Sakha,
obtained extensive rights and prerogatives, most importantly in the tax sphere. They lost
some of these rights with the new Russian constitution of 1993, and regained specific
concessions with bilateral treaties starting in 1994.
The regions that did not initially receive special rights were of two types. One groups
is made up of regions heavily dependent on central subsidies (see Lavrov and
Makushkin 2001 for centre-regional financial flows). The second group includes
wealthier regions, net contributors to the federal coffers, but lacking an ethnic
component to their populations (e.g. Sverdlovsk oblast). The first type of regions
resented and opposed "asymmetric" federal arrangements, advocating a more
centralised federation, or even a unitary form of state. The second type of regions
63
See the Introduction to this thesis for a description of regions' federal status.

3. Explanatory Framework
90
resented the ethnic principle at the basis of the distribution of benefits among units and
demanded greater autonomy from the centre.
The dynamics of Russian refederalisation is briefly reviewed in the chapters devoted
to the analysis of individual elections (chapters 6, 7 and 8). As a result of these
processes, it is theoretically possible to locate Russian federal units along a continuum
according to their stance on centre-regional relations. At one extreme, independence and
strong autonomism are advocated, at the opposite extreme, centralisation and even
unitarism are demanded. It is important to note that regionalist assertiveness is taken
here as exogenous to the explanatory framework. This means that the variable is taken
as a given and that the focus is on its effect on electoral outcomes, not on its causes.64
Indeed, the consequences of a strongly autonomist stance in a region include the
emergence of a territorial cleavage, aligning the region against the federal centre. This,
in turn, reinforces the necessity for territorially based channels of political
representation, which give a competitive advantage to independent candidate over
national party candidates. As mentioned above, regional (and regionalist) parties would
also benefit from a territorial, centre-regional, cleavage, but they are virtually absent
from Russian federal elections because they are strongly discouraged by Russian
campaign laws and by the 5 percent representation threshold at the national level.
3.2 The moderating effect of central appeasement and (pseudo-)
regionalist parties
The relationship between autonomism (here called "regionalist assertiveness") and
independents' success is complicated by two sorts of considerations that point to the fact
that even highly autonomist stances may fail to translate into popular support for the
64
On the explanation of the different levels of autonomistic assertiveness of the Russian regions, James
Hughes lists several factors: border vs. enclave location of the region; self-dependent economy vs.
dependency from federation; ethnic composition; historical assimilation into the Russian empire (Hughes
2002: 44). Gorenburg adopts an institutionalist perspective that, following Brubaker's (1996) seminal
approach, emphasises the legacy on the Soviet nationality policies, which resulted in the
institutionalisation of ethnicity (Gorenburg 2003). Dowley (1998), in her statistical analysis, finds that
factors pertaining to the theoretical framework of "essentialism" increase the chances of autonomistic
assertiveness. These factors are 1) the historical legacy of stalinist ethnic persecution; 2) the presence of a
non-orthodox religious plurality, and 3) the percentage of regional population using its native language
(ethnic regions only).

3. Explanatory Framework
91
independents. The first possibility is that, rather exceptionally under Russian electoral
incentives, a regionalist party may arise and compete with the independents as a genuine
channel of territorial representation (the best approximation of this is the 1995,
Sverdlovsk-based, party 'Transformation of the Fatherland'). Alternatively, regional
leaders may overcome difficulties of co-ordination and actively form/join an
interregional party. If this is the case (as for several regions in 1999, with OVR and
Unity), the popular vote would flow towards party support, and away from the
independents.
A second moderating effect can derive from the response of the federal centre to
regional demands. The federal centre may appease the strongest autonomist challenges
with financial transfers or with the political/legal recognition of rights and privileges.
This accommodation strategy defuses autonomist demands.
(Pseudo-)regionalist and interregional parties
With regard to the first moderating effect -the emergence of "parties of the regions"-, it
should be noted that even national parties may indeed portray themselves as defenders
of the interests of the regions. This is a difficult task because different regions have
different agenda with regard to centre-regional relations, but if this strategy is
successful, it can be expected to close the party-independents gap in the credibility of
advocating local interests, thus reducing the suggested positive effect of autonomism on
independents' success. In the Russian case, the only example of such a party is Shakrai's
'Party of Russian Unity and Accord' (PRES) which, while being a national party,
claimed to represent the interests of the regions along a centre-periphery issue
dimension in its 1993 campaign. However, the effectiveness of this strategy was limited
(it ran candidates in 63 SMDs, but won only three of them). Shakrai was, after all, a key
figure in Yeltsin's administration and had organised the (unelected) constitutional
assembly which proposed a recentralisation of the federal arrangement compared to the
Federal Treaty of 1992, a move naturally opposed by the leaders of the most vocal
regions.
In contrast to PRES, the 1995 party "Transformation of the Fatherland" was
genuinely regional, as it originated from one regions, Sverdlovsk oblast. The party
represented an extension of 'Transformation of the Urals', and was led by the oblast

3. Explanatory Framework
92
governor Rossel. This party had an interesting trajectory in the light of the main
hypothesis of this thesis. Conflict with Moscow first spurred the formation (by
Sverdlovsk authorities) of a regional party, initially to contest regional elections. As
Gelman and Golosov put it, "the rich resource potential of Sverdlovsk oblast makes
such claims [against Moscow] feasible, and this provides for the very possibility of
independent locally based parties" (Gelman and Golosov 1998: 41).65
The regional party then provided the springboard for the project of a regionalist party
in the 1995 federal elections. Predictably, given the 5 percent representation threshold,
the project failed to make any noticeable impact on the PR tier of the Duma elections.
Even in the Svedlovsk portion of the SMD tier, however, "Transformation of the
Fatherland" did not achieve much. It nominated candidates in four out of seven regional
SMDs, winning one seat (and achieving a second place). By contrast, the independents
won four seats out of seven in that region. Perhaps, this disappointing performance can
be explained with reference to the fact that Rossel, recently elected governor of the
region, had been sacked by Yeltsin in 1993 for his regionalist challenge and was
dropping his most vocal anti-centralist rhetoric. In fact, around the time of the 1995
Duma vote, he was negotiating with Moscow the rather advantageous terms of a
bilateral treaty to be signed shortly after the election (Solnick 2000: 155, fn 49).
Finally, before the 1999 election, the political context had changed and several
regional governors, traditional advocates of greater autonomy, took active participation
in the formation of two national electoral blocs, OVR and Unity. This new phenomenon
of party building by a coalition of regional leaders should be taken into account as a
moderating factor against the suggested relationship between autonomism and
independents' success.
Central response to regionalist demands
The second possible moderating effect is the response by the centre towards the most
vocal regions. Indeed, the process of Russian re-federalisation was shaped by two levels
of actors, the centre and the regions. The task has been complicated by the legacy of
65
However, the decisive reason for the exceptional success of party building in the region is rather to be
found in intra-elite conflicts that did not result in a winner-take-all scenario and that found expression in
the electoral arena. This differs from most regional settings, where "generally, conflicts with Moscow, if
waged by unified regional elites, tend to reduce political competitiveness on the regional level, so
impeding party development" (Gelman and Golosov 1998: 42).

3. Explanatory Framework
93
Soviet federalism, which had already granted (largely nominal) rights to constituent
units in an asymmetric way. At the early stages of Soviet federalism, Russian
administrative sub-divisions were created with different (formal) status on the basis of
the overriding principle of ethnic diversity. The result was a federalised RSFSR, "a
Federation within the larger Federation of the USSR" (Shaw 1999: 53). In fact, the
degree of real autonomy granted to constituent units of the USSR and of the Russian
'sub-federation' was rather limited. Although, to some important extent, regions were
free to manage the linguistic and cultural plans for themselves, in practice, the Party
firmly kept together a unitary structure of administration.
With the collapse of the Soviet Union and the end of the CPSU (Communist Party of
the Soviet Union), what amounted to an effective mix of co-optation and coercion,
which used to underpin the hierarchical line of command of the Party from the centre
outward, ceased to exist. Since then, in the 1990s, it is possible to identify several stages
in the search for an equilibrium in centre-regional relations, each characterised by
different dominant models of federalism (Hughes 2002). Part of this process included
attempts by the Kremlin to appease the most recalcitrant regions. Solnick notes that the
centre effectively split the generally recalcitrant camp of the republics by offering
"selective benefits" to a subset of them (Solnick 1996: 22). An example of the centre's
success at dividing regional coalitions seeking greater autonomy (this time a coalition of
oblasts) is provided by the fate of the Grand Urals Association (Hughes 1994). When
the regional association threatened to transform itself into a "Urals Republic" in 1993,
the centre offered selective inducements to one member region, Orenburg Oblast,
managing to divide the association (Solnick 2000: 148).
This strategy arguably attenuated the saliency of the territorial cleavage in these
regions, and therefore reduced the competitive advantage of the independents based on
that cleavage. In other words, despite (or thanks to) the strongly autonomist average
stance of the 1991-1995 period, a number of regions had some of their autonomist
demands met by the centre. Thus, the level of independents' success should be lower
than in regions with the same degree of autonomist grievances but deprived of Yeltsin's
selective accommodation measures. In particular, one form of central appeasement
noted in the comparative literature is made up by tactical financial transfers by the
incumbent government (for an example outside Russia, see Dahlberg and Johnsson

3. Explanatory Framework
94
2002). In the Russian case, the motivations behind federal transfers to the regions took
several forms. They were aimed at defusing secessionist and autonomist threats
(Treisman 1999); at rewarding compliant regional behaviour (Popov 2002: 72); or at
alleviating the need for heavy subsidies (Solnick 1996: 18). However, regardless of the
motivations, federal transfers are likely to correlate with a moderation of regionalist
demands (either through economic cooptation or dependency), thus reducing the
chances of independents' success.
These avenues for influencing the regional stances towards the centre (ranging from
legal/symbolic to financial appeasement), amount to different sorts of "carrots". To be
sure, in addition to the "carrot", the centre could also use the "stick". This refers to
covert repressive measures and threats that the Kremlin was able to wield against
"recalcitrant" regions when the centre is strong, such as with Putin and the start of the
economic recovery of 1999-2000 (Chirikova and Lapina 2001: 391). However, for
much of the 1990s, the federal centre was too weak to wield such negative incentives
effectively and consistently. This weakness was due to the institutional conflict between
the parliament and the presidency escalating in 1993, Yeltsin's difficult re-election bid
in 1996, and the economic and political crisis of 1998. Because the centre was not in a
position to consistently use a repressive approach, it had to resort to accommodation
and appeasement with the most vocal restive regions.66
Sub-regional assertiveness?
From the above discussion, it should be clear that positions on the federal arrangement
are articulated and advocated primarily by the regional authorities, not by sub-regional
units. The region is the administrative unit that is immediately below the federal level in
the Russian Federation. As constituent units of the federation, they are entitled to some
degree of self-rule and their executive and legislative branches are popularly elected. In
short, the regions are the main subjects facing the centre in the negotiations of centre-
periphery relations of the 1990s. On the contrary, sub-regional units, even regional
capital cities,67
are constitutionally subordinated to the regions to which they belong and
66
One phase of attempted recentralisation occurred in 1997, starting with the initiatives of premier
Chubais to bring the regions under greater central control (Petrov 1999: 58). This, however, was
interrupted by the August 1998 financial crisis. 67
Moscow and St. Petersburg are "regions" (units of the federation) themselves, not sub-regional
municipalities.
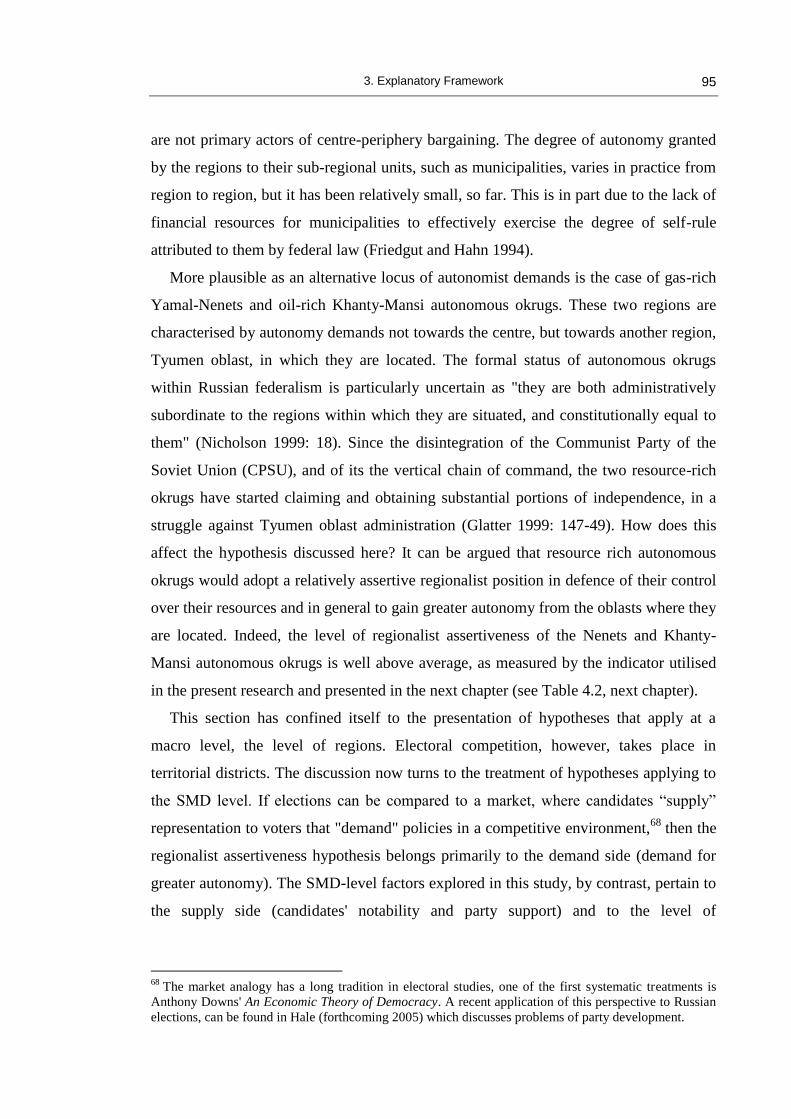
3. Explanatory Framework
95
are not primary actors of centre-periphery bargaining. The degree of autonomy granted
by the regions to their sub-regional units, such as municipalities, varies in practice from
region to region, but it has been relatively small, so far. This is in part due to the lack of
financial resources for municipalities to effectively exercise the degree of self-rule
attributed to them by federal law (Friedgut and Hahn 1994).
More plausible as an alternative locus of autonomist demands is the case of gas-rich
Yamal-Nenets and oil-rich Khanty-Mansi autonomous okrugs. These two regions are
characterised by autonomy demands not towards the centre, but towards another region,
Tyumen oblast, in which they are located. The formal status of autonomous okrugs
within Russian federalism is particularly uncertain as "they are both administratively
subordinate to the regions within which they are situated, and constitutionally equal to
them" (Nicholson 1999: 18). Since the disintegration of the Communist Party of the
Soviet Union (CPSU), and of its the vertical chain of command, the two resource-rich
okrugs have started claiming and obtaining substantial portions of independence, in a
struggle against Tyumen oblast administration (Glatter 1999: 147-49). How does this
affect the hypothesis discussed here? It can be argued that resource rich autonomous
okrugs would adopt a relatively assertive regionalist position in defence of their control
over their resources and in general to gain greater autonomy from the oblasts where they
are located. Indeed, the level of regionalist assertiveness of the Nenets and Khanty-
Mansi autonomous okrugs is well above average, as measured by the indicator utilised
in the present research and presented in the next chapter (see Table 4.2, next chapter).
This section has confined itself to the presentation of hypotheses that apply at a
macro level, the level of regions. Electoral competition, however, takes place in
territorial districts. The discussion now turns to the treatment of hypotheses applying to
the SMD level. If elections can be compared to a market, where candidates “supply”
representation to voters that "demand" policies in a competitive environment,68
then the
regionalist assertiveness hypothesis belongs primarily to the demand side (demand for
greater autonomy). The SMD-level factors explored in this study, by contrast, pertain to
the supply side (candidates' notability and party support) and to the level of
68
The market analogy has a long tradition in electoral studies, one of the first systematic treatments is
Anthony Downs' An Economic Theory of Democracy. A recent application of this perspective to Russian
elections, can be found in Hale (forthcoming 2005) which discusses problems of party development.

3. Explanatory Framework
96
competitiveness of the electoral market itself ("administrative resources"). The next two
sections deal with these district-level factors.
3.3 The "supply side": notable candidates and party challengers
Candidates' personal resources
It has been noted that elections in SMDs are more personalised and candidate-centred
than in other electoral systems. The personal qualities of the contestants, or the bases of
their "personal vote", are likely to become salient (Canon 1990). Among the
characteristics that are usually credited with increasing a candidate's chances, the most
important include 1) the incumbency advantage, 2) candidate's notability and 3)
financial backing. Candidates endowed with these characteristics are viable candidates
and their decision to run as independent vs party candidates can be expected to affect
the chances of the independents. In other words, if these "prominent candidates" run
disproportionally as non-partisans, independents' electoral returns will be greater, other
factors being equal. The measurement of these variables is presented in the next chapter
(chapter 4).
The incumbency variable is rather straightforward, measuring the decision of the
district incumbent to stand as a party or as an independent (if he stands at all). The only
caution is that this variable is not measured for the 1993 elections, because these have
been the first competitive ones and are hardly comparable to the electoral process under
the Soviet Union.69
The notion of notability, on the other hand, can take many forms. A common
indicator, however, is elite occupational status. For example, Golosov has looked at this
variable in his study of the role of personal resources in SMD Duma elections (Golosov
2002). In this thesis, the attention is focused on the political elite, distinguishing
between regional/local and federal political elite. As Golosov admits, it is not possible
to take into account the elite status derived from economic positions because the
69
Moreover, the previous elections comparable to the vote for the Duma would have been the election to
the Russian Congress of Peoples' Deputies of 1990. However, these elections were held in many more
SMDs over the Russian territory, due to the higher number of seats to allocate, thus potentially leading to
several "incumbents" running in each Duma SMD.

3. Explanatory Framework
97
importance of the private-sector occupations declared by candidates to the electoral
commissions is hardly discernible from the mere indication of the name of the firm or
enterprise (Golosov 2002: 27). With respect to political elite status, the hypothesis,
therefore, is that the more these occupational traits are found among the independents
(relative to party candidates), the greater the chances for non-partisans.
Finally, the literature on SMD elections, especially in the USA and the UK, attributes
great importance to campaign funding (Jacobson 1980). Direct data on this dimension is
unfortunately unavailable for the Russian SMD races. However, for the 1999 elections
an approximation can be gained by using the data collected by Henry Hale and used in
his article on "party substitutes" (Hale 2005).70
The variable measures whether a
candidate was backed by a major regional or federal financial-industrial group. Clearly,
the expectation is that candidates backed by these groups stand greater chances of
success, assuming larger availability of campaign finance than for the average
candidate.
This subsection has discussed the expected effect of personal resources, namely the
effect of the strategic decision of such prominent candidates as described above to stand
as independents as opposed to party candidates. However, it is reasonable to expect that
these strategic decisions, in turn, will be affected by another variable of the model,
regionalist assertiveness that also has a direct effect on the outcome. Indeed, nomination
decisions of prominent prospective candidates are driven by their expectations of
success (they will run as independents where they think this is the winning choice, and
vice versa). But expectations of success cannot be separated from the competitive
advantage that a territorial cleavage is expected to give the independents.
In other words, the causal path flowing from regionalist assertiveness to
independents' success will be both direct and indirect (i.e. mediated through the
personal resources variables). This can be rendered visually in a path diagram (see
Figure 1 below) by direct and indirect arrows stemming from "regionalist assertiveness"
and reaching "independents' success" (the outcome variable). The statistical
implications of this complex causal path, based on a "mediating effect", are discussed in
the chapter on the design of the statistical analysis (chapter 5).
70
I thank Henry Hale for letting me use these data in the present research. Details on his sources follow in
chapter 4.

3. Explanatory Framework
98
Party challenge
Party labels in established democracies have a positive value for candidates'
campaigning. They reduce the information-gathering costs of voters and provide
candidates with a "brand name" that voters know and trust (Aldrich 1995). In the
Russian case, by contrast, as discussed in the Introduction to this thesis and in chapter 2,
Russian political parties are organisationally weak and rather transient. In these
circumstances only a subset of parties can be expected to provide a "brand name" effect
to their candidates, or have name recognition. However, in case some parties did just
that, they are expected to reduce the chance of the independents, in the SMDs where
they decide to nominate a candidate. As a rule of thumb, a test of the party challenge
faced by the independents can be extended to those parties that cross the 5% threshold
of PR representation or perpetuate themselves from election to election.
In addition to this "brand name" effect of the main parties, it should be remembered
that also national parties with a regionalist rhetoric, or genuine regionalist parties, are
expected to challenge the independents in the SMDs where they stand (see above,
Section 3.2). Indeed, if they have a regionalist appeal, they are expected to neutralise the
competitive advantage of the independents in representing territorial cleavages. Thus
variables can be entered expressing whether either a major party or a
(pseudo)regionalist party nominated candidates in the given district.
Finally, considerations similar to those noted for the personal resources variables
suggest that the presence of a party challenge in the district should, in turn, depend on
regionalist assertiveness. Especially in the early stages of party development, parties are
induced to concentrate their campaign efforts where they stand greater chances of
success. For national parties this means avoiding highly assertive regions, while for
regionalist or pseudo-regionalist parties the opposite incentive applies. Therefore,
another indirect effect of regionalist assertiveness can be expected to be mediated by the
party challenge variables (see path diagram in Figure 3.1 at the end of this chapter).
Geographic accessibility of regions
Finally, the geographical location of voters is likely to affect parties' ability to reach
them in the campaign. More precisely, remote location and cold weather increase the

3. Explanatory Framework
99
costs of reaching those voters locally when election time comes in December.71
These
costs are likely to be higher for national parties than for local independent candidates.
As Timothy Colton has observed, "the geography of the largest country on the planet -
sprawling and northerly, with tens of millions of people still inhabiting villages and
towns with poor and seasonally unreliable transport links and erratic postal services-
adds a gruelling aspect to the logistics of a Russian campaign" (Colton 2000: 51). His
survey data show that "the larger the local settlement, and so the closer it is to
transportation and communication nodes, the more efficiently parliamentary and
presidential contenders dispense political materials [literature, posters and billboards] to
the electorate in Russia".72
Fiona Hill and Clifford Gaddy have recently stressed the economic and social costs
associated with the Siberian cold and the un-connectedness of local communities. They
have also reminded students of Russia that "because of the continental effect -the large
distance of most of Russia to the oceans- it is movement to the east, just as much as to
the north, that lowers temperatures. And, for Russians, there is much more room to the
east than to the north" (Hill and Gaddy 2003: 33). This is despite the programme of one
Moscow district candidate of 1993 titled "Subtropical Russia", in which he promised to
bring about a temperature of 20°C all through the country and in all seasons.73
In addition to low temperatures, the spatial accessibility of regions can also be
impaired by a mountainous territorial configuration. A combined index of the share of
regional populations living in areas too cold to be reached by regular supply all around
the year, and living in mountainous areas is used to reflect the problem of campaign
accessibility (see next chapter for the operational definition of the variable). The
hypothesis is that the independents should be advantaged, due to their greater local
rootedness, in the areas that national parties find difficult to reach.
Related to problems of campaign access for political parties, another factor is
traditionally credited with fostering party development - the factor of urbanisation.
71
For a recent study on the "cost of cold" bore by productive activities in Siberia, see Hill and Gaddy
2003. 72
However, it seems that the analysts conducting Colton's survey, just like party campaigners, were also
overwhelmed by the difficult logistics of Russia. Indeed, as Appendix B in Colton's book reveals, among
the areas excluded from the sample are "territories in the north and east of the Russian mainland with very
low population density, severe weather, or transportation difficulties" (Colton 2000: 237). To the extent
that a "geography factor" affects party campaigning, such strategy of sample selection is likely to miss
important information.
3. Explanatory Framework
100
Huntington (1968) and Rokkan (1970) are among the first contemporary students to
emphasise that parties are originally urban phenomena. In urban centres, parties find
their leaders (within the intellectual stratum) and their likely followers (literate,
educated citizens, or industrial working classes for leftist parties). Indeed, in the
historical experience of western European countries, parties spread from urban centres
towards the countryside, a process favoured by the diffusion of literacy and
communications in the early twentieth century.
However, the Russian post-communist context is different from the western
European one at the turn of the 19th
century that Rokkan analysed. Russia has already
reached advanced levels of literacy and education, as well as developed means of mass
communication. For this reason, the urban-rural divide is more important as a correlate
of pro-reform vs. conservative voting behaviour, as reflected also in the North-South
division of reform support mentioned in chapter 2, than as a factor of party development
per se (or of independents' success, for that matter). Nevertheless, while literacy and
television are spread nation-wide, levels of urbanisation are still linked to different
levels of physical connectedness of Russian communities, in terms of access to the
railroad and road networks. In this sense, urbanisation is positively related to the
possibility for political parties to conduct an effective traditional campaign on the
ground. For this reason, the level of urbanisation of each electoral district is controlled
for in the models predicting independents' success.
3.4 Administrative resources
The last element of the market analogy is electoral "competition" itself. In order for
results to reflect the free interplay of supply and demand, the competitiveness of the
electoral process should be ensured. If this ideal condition is hardly realised in any
existing democracy, Russia is certainly no exception. In fact, the partisan use of
administrative resources has led many to question the existence of the minimum
standards of procedural democracy in the most affected regions (Brie 1997; Hale 1998,
1999; Oreshkina 2000; Tikunov and Oreshkina 2000; Oreshkin 2001).
73
Mentioned in D.A. Levchik (1996), quoted in Colton 2000 (fn.14, p.106).

3. Explanatory Framework
101
The governor's support of Duma candidates
Particularly in 1999, in federal elections, Russian regional governors are known to have
used state resources to support a party or specific candidates in Duma campaigns, but
they varied in their capacity to control regional politics and elections. The
administrative resources at their disposal range from controlling the local media, mostly
heavily dependent on regional subsidies, to pressuring local business to contribute to the
campaign of the "right" candidate, up to controlling local law-enforcement agencies and
local electoral commissions. Local electoral commissions, in turn, allegedly can
selectively enforce the rules on candidate registration, or disqualify registered
candidates for irregularities in their campaign, or even directly rig the vote count. The
target of "administrative support" in the SMDs can be a party candidate or an
independent. The hypothesis therefore is that independents' success will be higher
where the local governor actively supports an independent, and lower where he supports
a party candidate. In turn, both effects will be stronger, the tighter the governor's control
is over regional politics, thus positing an interaction effect between governor's
preference for a candidate and degree of control over regional political process.
The assessment of the governor's preference, i.e. which party/candidate he supports,
has become the subject of several works in connection to the Duma 1999 elections
(Kaspe and Petrokovskij 2000; Petrov and Titkov 2000; Strokanov 2003). However,
these are mostly assessments of generic support or loose alliance, except for governors
directly involved in party building (and even here with noticeable exceptions). These
accounts generally do not detect governor's support for candidates in individual SMDs.
One version that attempts exactly this is based on the information gathered by Henry
Hale and used in his forthcoming article (Hale: 2005).74
His data on governor's support
will be used in the 1999 analysis.
Governor's control of regional politics
The second component of the administrative resources hypothesis, i.e. governors'
capacity to control regional politics, has been studied under the labels of "machine
politics" (Brie 1997, Hale 1999), "caciquismo" (Matsuzato 2000, 2001) or simply

3. Explanatory Framework
102
"electoral control" (ypravlyaemost in Oreshkina 2000; Tikunov and Oreshkina 2000;
Oreshkin 2001). Tikunov and Oreshkina (2000) elaborated an index of the "electoral
irregularity" of regions in the Presidential elections of 26 March 2000. On top of the list
are almost all Caucasian Republics and virtually all the autonomous okrugs. The only
national formations not included are the republics of Kareliya, Khakasiya, Karachaevo-
Cherkesiya, while the syndrome is not entirely in place in such republics as Kalmykiya,
Komi, Mariy El, Udmurtiya, and Chuvashiya.
They calculate that in the 2000 presidential elections, 14% of the Russian territory
belonged to regions considered "highly controlled", with very high rates of turnout and
of support for Putin (61.3 percent, while the main challenger, Zyuganov, received 24.5
percent of the vote in such areas). In the 1999 Duma elections, these "highly controlled"
regions had concentrated even more clearly their support to benefit the list of
"Fatherland-All Russia" (OVR). Three quarters of the total votes received nationally by
OVR were cast in those areas (Tatarstan, Bashkortostan, Mordoviya, Kabardino-
Balkariya and Daghestan), whose executive heads supported OVR and even occupied
leadership posts in the movement.75
Unfortunately, these analysts only report the first twenty regions or so top-ranking in
terms of "controlled electorates". For the purposes of quantitative analysis, it is
necessary to have a coherent measure for all regions. One such measurement, used in
this thesis, relates to one key aspect of regional administrative resources -control over
the regional media. The "Public examination project", conducted by the Russian Union
of Journalists and other associations, produced comprehensive indexes of freedom of
speech in Russian regions for the year 1999.76
In addition to regional governors, the Kremlin is also actively trying to influence
Duma elections by means of state resources, mainly by granting favourable coverage on
state TV channels to sympathetic candidates and parties. Under Yeltsin, the use of
federal "administrative resources" has included federal administration agencies, as the
74
I am again grateful to Henry Hale for sharing his data. Details on his sources are reported in the next
chapter. 75
In her article, Oreshkina also includes Ingushtiya, and Ust-Ordinskii Buryatskii Autonomous Okrug
(Oreshkina 2000). 76
Several reputed independent media organisation took part in the project “Public Examination:
Evaluation of Freedom of Speech in Russia (1999-2000)”. They complied indexes for several aspects of
freedom of speech in Russian regions. Www.freepress.ru/win/english.html. Accessed June 2003, pp.14-
15. See next chapter (chapter 5) for details.

3. Explanatory Framework
103
president refrained from seriously attempting to build a national party (Huskey 1999:
191). Federal agencies, rather than a national party, where explicitly charged with the
task of recruiting 'promising' regional leaders for promotion to the national level
(Huskey 1999: 201). However, this strategy did not produce encouraging results and the
foundation of presidential influence at regional and local level has been shaky in the
1990s.
The presidential administration also tried to influence the outcome of elections in
territorial districts. In 1995, it was once again a federal agency (the Administration for
Work with the Territories) that was charged with a task that would normally be of a
presidential political party. In co-operation with several presidential representatives in
the regions, it aimed at ensuring 'favourable local conditions' for the SMD candidates
put forward by NDR ('Our home is Russia'), the party led by the then prime minister
Chernomyrdin. Eleven such candidates were the presidential representatives themselves,
but only one succeeded (Huskey 1999: 201).77
These indications of a meagre success of
federal administrative resources under Yeltsin suggest that the research can aptly focus
on regional administrative resources alone. Moreover, one key campaign asset for the
federal “party of power” lies in the favourable treatment by national media, especially
national television (Hughes 1994a). In this sense, this advantage applies equally
throughout the Russian territory and cannot explain spatial patterns.
Conclusion
This chapter has built an explanatory framework to explain the spatial variability in
independents’ success. As Table 3.1 summarises, the hypotheses cover the different
elements of the "electoral market". On the "demand side", the main hypothesis of this
thesis posits that the independents will cater for the representation demands that are
based on a territorial cleavage. This cleavage takes the form of regionalist assertiveness
in the context of Russia's process of federal bargaining of the 1990s. The greater the
77
The same federal agency worked to enhance the chances of 'sympathetic' candidates in executive and
legislative elections in the regions, also in an attempt to have a more manageable Federation Council, as a
consequence. The degree of success of these efforts appears to have been limited (Huskey 1999: 201).
After all, with the 1995-97 round of elections of regional governors, "the federal influence in regional
politics became even more insignificant" (Gelman 1999: 93).

3. Explanatory Framework
104
anti-centralist stance of the region, the greater the success of the independents (as
discussed in section 3.1). In studying this effect, however, it is necessary to control for
the centre's reaction to regionalist demands. Among strongly assertive regions, those
appeased by the centre (with political/symbolic concessions, or with financial largesse),
will exhibit lower levels of independents' success than the rest.
Table 3.1: Summary of explanatory framework
Territorial
cleavage1
Regionalist
assertivenessRegion 1993 1995 1999
2 Political appeasement Region 1993 1995 1999
3Financial
appeasementRegion 1993 1995 1999
1 Incumbency District 1995 1999
2 Political elite status District 1995 1999
3 Financial backing District 1999
1 Major party District 1993 1995 1999
2(Pseudo)-Regionalist
partyDistrict 1993 1995 1999
Geographic
accessibility1
Share of population in
remote areasRegion 1993 1995 1999
1 Governor's support District 1999
2Freedom of speech in
regionRegion 1999
Administrative
resources
Competitiveness of
electoral process
Electoral market Level
OTHER
HYPOTHESES
Supply side
Party challenge
Candidates'
Personal
resources
(notability)
Appeasement
Demand side
Hypothesis Explanatory variable
MAIN
HYPOTHESIS
Data availability
The main hypothesis represents a macro-variable as it applies to the regional level.
Within regions, however, elections take place at the level of electoral district. To take
into account district-level electoral dynamics, two sets of hypotheses focus respectively
on the characteristics of the candidates in "supply" in each district, and on the
possibility that the fairness of the electoral process may be distorted by the partisan use
of administrative resources by regional governors. As for the first dimension -the
quality of the candidates "supplied" in the districts-, the independents will score higher
returns the more notable candidates appear in their ranks. Notable candidates are

3. Explanatory Framework
105
defined as the district incumbent, members of the regional or federal political elite, and
candidates backed by major financial interests.
On the other hand, the independents will have comparatively lower chances where
they face contestants nominated by a major party or by a regionalist party. Major parties
are those with the greatest visibility in the campaign and higher returns in the PR tier.
Because no party nominates candidates in all districts, this variable can illuminate on
the cross-district variability in the outcome. Moreover, parties that are not major players
in national terms, but stress regionalist themes in their campaigning, can also be
expected to reduce the chances of the independents because they can compete for the
same "market niche", i.e. the representation of the territorial cleavage.78
Inhospitable geographic conditions are also expected to affect independents' success
through their effect on candidate supply. Namely, because campaigning conditions are
more difficult in very cold or mountainous areas, national parties will be less visible and
even less organisationally present than in the average regions. Therefore, they will
attract notable candidates, or generally nominate candidates, more rarely than in other
regions.
Finally, district electoral results are likely to be influenced by the possible use of
"administrative resources" by the regional governor, in support of his preferred
candidate. In districts where the candidate supported by the governor is a party
candidate, the returns for independents can be expected to be lower than elsewhere,
other factors being equal. A positive effect on the outcome is, vice versa, expected when
the candidate supported by the governor is an independent.
The effect of governor's support, however, is reinforced proportionally to the degree
of "control" that he exerts on the political process in his region, which is known to vary
from region to region. One key indicator of this "control", used in the following
analyses, is the level of control over the regional media. Therefore, governor's candidate
preference and "degree of control" are expected to interact in their effect on the
outcome.
In addition to this, the models posit another complex relationship between
explanatory variables (see Figure 3.1). Indeed, not all variables combine linearly to
account for the outcome. Some have indirect effects, mediated by other variables.

3. Explanatory Framework
106
Namely, the district-level variables for the personal resources of candidates and for the
party challenge mediate (part of) the effect of regionalist assertiveness, as explained in
section 3.3. The fact that regionalist assertiveness can have both a direct and an indirect
effect is represented in the path diagram of Figure 3.1 by the arrows stemming form the
variable.
One arrow is directly connected to the outcome, while other two pass through the
variables related to candidates' supply. This means that the latter variables are both
cause and caused, exogenous and endogenous to the model.
Figure 3.1: Diagram of causal paths posited by the theoretical framework
For a concise treatment of the problems of "causal order" and "mediating effects",
see Davies 1985, or Allison (1999: 60-62). For the rest, the path diagram in Figure 3.1
shows each variable in boxes and groups regional-level variables to the right, within the
78
As noted in section 3.2 above, electoral rules make it difficult for a genuinely regionalist party to
emerge.
Administrativeresources
Appeasement
Notablesstand as
independents
DifficultGeographicalaccessibility
National Partychallenge
Urbanisation
Region
levelSMDlevel
negative
positivepositive
negative
negativenegative
positive
negativeAdministrative
resourcesAdministrative
resources
Appeasement
Notablesstand as
independents
DifficultGeographicalaccessibility
National Partychallenge
National Partychallenge
Urbanisation
Region
levelSMDlevel
negative
positivepositive
negative
negativenegative
positive
negative
Independents ’
successpositive
Regionalist
assertiveness

3. Explanatory Framework
107
pale grey area, and SMD-level variables at the centre, on a dark grey area. The leftmost
box represents the dependent variable, as signalled by the fact that all arrows converge
to it.
Finally, a note on why regionalist assertiveness is here labelled the "main"
hypothesis. The expectation of a competitive advantage accruing to the independents in
assertive regions integrate and specify the two most-cited explanations for independents'
success mentioned above. Indeed, based on the territorial/functional character of SMD
cleavages, one can explain why the personal resources of notable independents translate
into electoral success only in some SMDs, as well as why local interests are paramount
for independents' success only in some SMDs. This strategy of explanation of
independents' success is the most important in the causal framework of the thesis
because it is original in Russian electoral studies and it bridges an unwarranted gap
between the study of centre-regional relations and federal elections in the territorial
districts in Russia.
The next chapter contains the operational definition of the variables introduced in
this chapter. The sources of related data are also mentioned.
108
4
From Hypotheses to Data: Operational Definitions
“The difference between quantitative and
qualitative measurement involve how data
are represented, not the theoretical status of
measurement. Qualitative researchers use
words like “more” or “less”, “larger” or
“smaller”, and “strong” or “weak” for
measurements; quantitative researchers use
numbers”.
King, Keohane and Verba (1994: 152)
The aim of this chapter is to translate the hypotheses of the explanatory framework,
outlined in chapter 3, into variables that can be used test hypotheses by means of a
large-n, quantitative analysis. Students of social sciences designing quantitative studies
are aware of the difficulties inherent in finding faithful indicators for complex
phenomena. Often, quantitative measures are only pale approximations of social reality,
and some subjectivity is introduced in the analysis when the analyst has to use his/her
own judgement to codify and quantify events and observations. However, as noted by
the quote in the epigraph, qualitative measurements are not fundamentally better.
For this study the difficulties are compounded by the fact that the official collection
of reliable data on Russia's political and social features has been poor in the first decade
of post-communism, especially in the early 1990s. Suffice it to think that there is no
official release of the vote counts in the SMD races of the first parliamentary elections
of 1993.79 The sheer size of the country also contributes to the difficulty of assembling
uniform data at the local level. Official statistics are even less reliable in some specific
79
For his discussion of the 1993 district results Timothy Colton had to obtain an unpublished report by
the Central Electoral Commission, see Colton (1998: 20, fn.44). I am grateful to him for passing the same
manuscript to me.

4. From Hypotheses to Data
109
areas, such as intergovernmental financial transfers. A large part of these centre-
regional financial relations take the form of subsidies to local industries, tax benefits,
and other channels that eschew systematic monitoring (Lavrov and Makushkin 2001:
xxi).
In the present study, the problem of finding suitable data is primarily linked to the
challenge of finding reasonable quantitative measures for eminently qualitative
dimensions. This is the problem with operationalising the concept of "regionalist
assertiveness", a key element of the explanatory framework presented in this study. On
the other hand, the quantitative indicator used for this variable was elaborated
independently of the present research, by a different author and for different purposes.
This clears all suspicions that the index was twisted or biased in such a way as to
produce the expected results. The scholarly understanding of political processes in post-
communist Russia is still at an early stage, particularly as far as the electoral politics of
the territorial districts is concerned. Thus, even less-than-ideal data can generate
interesting new perspectives. Even with all limitations, this study claims to detect an
important part of the regularity or mechanism that was at work in the Russian SMDs of
the 1990s.
The chapter proceeds to discuss the choice of variables, and the methods of their
operationalisation, for each of the explanatory hypotheses that have been identified in
the previous chapter. The structure of this chapter follows the organisation of
hypotheses in the explanatory framework. The first section tackles the measurement of
the main hypothesis, the positive effect of regionalist assertiveness on independents'
success. The task here is to introduce the quantitative index used in the analysis, to
show how its original author, Kathleen Dowley, produced it, and how it has been
adjusted. The index is then compared to common expectation in the literature as to the
correlates of regionalist assertiveness. This is in order to have at least an impressionistic
confirmation that the numbers measure the phenomenon of interest. In the last part of
the first section, the measurement of the main instances of central appeasement of
regionalist demands can be found.
The second section of the chapter is devoted to the other hypotheses, mainly
belonging to the supply side of the "electoral market". Variables on the supply of
candidate include a measure of the extent to which district candidates endowed with
4. From Hypotheses to Data
110
personal resources run as independents in a given SMD. The personal resources
considered are district incumbency, political elite occupational status, and financial
backing. Other supply-side factors are the challenges posed by party nominations in the
SMDs. The section also considers the problem of governors' support for individual
candidates in the 1999 district races based on Henry Hale' data, and the geographic
factors of party campaigning.
4.1 "Measuring" regionalist assertiveness
It is impossible to quantify such a phenomenon as regionalist assertiveness in a fully
objective way. Any analyst will use a good deal of subjective judgement when deciding
which observed event or statement counts as evidence of what degree of assertiveness.
This problem can be alleviated in three ways: 1) by using an index produced
independently of this thesis, by a different scholar and for a different purpose, but
measuring the same dimension as needed in the present inquiry. This heterogeneity of
purposes makes it very unlikely that any original bias potentially built in the index will
be systematic relative to purposes of the second user. 2) By "triangulating" the index
with other indicators conventionally deemed to reflect aspects of the phenomenon being
measured. If all indicators are consistent with each other, this can provide a rough
confirmation that the index is broadly reflecting the underlying phenomenon. 3) By
explicitly stating the criteria followed to elaborate the measure, so that the scholarly
community can know exactly where the index comes from. In this section, the chosen
indicator for "regionalist assertiveness" is introduced and discussed in the light of these
three points.
Firstly, the chosen measure is based on an index produced independently from the
present author by Kathleen Dowley, for a study published in 1998. The original purpose
of that index was to provide a measure for the dependent variable of her analysis. On
the contrary, it is here used to measure an independent variable, expected to affect a
phenomenon (independents' success) that was totally extraneous to Dowley's interests.
This means that if there was any bias or "systematic error" in Dowley's estimates of
4. From Hypotheses to Data
111
regional autonomism, it is unlikely to be systematic relative to the present focus of
analysis (King, Keohane and Verba 1994: 63-65).
Secondly, in order to have a rough idea of whether the indicator is broadly consistent
with widely shared understandings of regionalist assertiveness in Russia, it is compared
below to other dimensions conventionally associated with regionalist sentiments.
Finally, in her 1998 article, Dowley describes the criteria that informed her decisions on
the coding of observations, in order for future scholars to be able to replicate and
possibly improve her approach. The discussion starts with a presentation of Dowley's
index.
Dowley's index
In her article, Kathleen Dowley (1998) is interested in explaining the different
preferences held by Russian regions as to the degree of centralisation/decentralisation
that federal relations should embody. In different passages, she refers to her dependent
variable as a region's "preferred federal arrangement", its "preferences for economic and
political autonomy", or its position along a "political autonomy dimension". The types
of federal solutions advocated by the regions range from high centralisation (as in a
unitary state), to full independence.
The measure presented in Table 1 of Dowley's article (1998: 370) is built by
examining "public speeches, declarations and communications" by regional leaders:
heads of regional administrations, called "presidents" in the republics, and speakers of
regional legislative assemblies (Dowley 1998: 368). As Dowley explains, "events of
relevance" include:
- "Responses to central decrees relating to the division of powers between the
centre and the regions";
- "boycotts of federal referendums or elections";
- "withholding of federal taxes";
- "petitions" and "communiqués" to the federal government (Dowley 1998: 364).
In the 1991-1995 period, Dowley recorded 1460 such events using the Current
Digest of Post-Soviet Press (CDSP) and the Open Media Research Institute (OMRI)
Daily Digest as sources. Each event was coded 1, 2, 3, 4 or 5, according to the type of

4. From Hypotheses to Data
112
preferred centre-regional relations that it indicated. The code is ordinal in the sense that
a greater number corresponds to greater decentralisation, as summarised in Table 4.1
(below). The number of observations (events, speeches, and statements) varies widely
from region to region. It ranges from as little as 1 event recorded for the Koriak
autonomous okrug and Ryazan oblast, and 3 events for many regions (especially
autonomous okrugs and some oblasts), up to as many as 46 events for Bashkortostan
and 62 for Chechnya. The codes attributed to events of the same region are averaged, so
that each region is attributed a mean score for the 1991-1995 period, ranging from 1 to
5. Across regions, the mean score constitutes a continuous, scale measurement.80
Table 4.1: Dowley's index (the type of federal arrangement favoured by a region)
Score Meaning Description
1 Unitarism
(full centralisation)
The position according to which all important decisions,
appointments of personnel, "allocations and extractions are
made at the centre".
2
Strong federal centre Guidelines for important decisions should be defined in
Moscow, such as those on privatisation, banking, trade, and
the type of local political institutions. The centre should have
"final authority" in conflicts with the regions, but local
governments should be elected.
3 Territorial confederation Greater autonomy on local natural resources, foreign
investment, privatisation, land reform, etc. The centre should
control the defence function and the single currency system.
Regions should have equal status (thus regions in this
category criticised the Federal Treaty of 1992). The federal
centre should not have last authority in disputes, contrary to
stipulations in the 1993 constitution.
4 "Cantonalism" or
ethnofederalism
Drawing from the example of Swiss cantons, the region is
morally superior to the national state. These regions demand
recognition as separate nations within the federation, and
expect more autonomy than other provinces that are not
nations.
5 No federal relations
(Full independence)
This is a nationalist position (a state should correspond to the
nation), not federalist at all. Full independence is the goal.
Source: Dowley (1998).
80
More details on the rules followed by Dowley for the codification of events, leaders' speeches and
statements, are presented in her article (Dowley 1998: 365-66).

4. From Hypotheses to Data
113
The main advantage of Dowley's index is that it considers all 89 regions, while other
studies of similar problems have focused on a much more limited number of cases.81
In
the ranking of regions according to Dowley's index (Table 4.2), only Chechnya and
Tatarstan receive a mean score above 4. This reflects the fact that, on average, their
leaders demanded more autonomy than the rest of the regions between 1991 and 1995.
The least autonomist stance (the most assertive support of centralism) is observed for
Kursk Oblast, with a score of 1.6. This means that its leaders publicly advocated a
federal arrangement which can be roughly classified as falling between a unitary state
(i.e. a score of 1, see Table 4.1) and a federation with a strong centre (a score of 2).
Table 4.2: Ranking of regions on Dowley's index
Rank
Region
Mean score
No of events
recorded Rank
Region
Mean score
No of events
recorded
1 Chechen Republic 4.62 62 46 Voronezh Oblast 2.71 7
2 Tatarstan Republic 4.33 43 47 Novosibirsk Oblast 2.69 16
3 Bashkortostan Republic 4.00 46 48 Primorsky Kray 2.67 12
4 Mariy El Republic 3.86 7 49 Astrakhan Oblast 2.67 3
5 Tyva Republic 3.80 15 50 Ivanovo Oblast 2.67 3
6 Sakha Yakut Republic 3.68 41 51 Kurgan Oblast 2.67 3
7 Khakass Republic 3.64 11 52 Murmansk Oblast 2.67 3
8 Adygey Republic 3.62 8 53 Novgorod Oblast 2.67 6
9 Chuvash Republic 3.62 13 54 Orlovskaya Oblast 2.67 6
10 Karelian Republic 3.56 25 55 Pskov Oblast 2.67 3
11 Buryat Republic 3.50 15 56 Chita Oblast 2.67 12
12 Ingushetiya Republic 3.50 30 57 Kemerovo Oblast 2.64 14
13 Komi Republic 3.44 16 58 Krasnoyarsk Kray 2.63 24
14 Udmurt Republic 3.43 14 59 Volgograd Oblast 2.62 8
15 Altay Republic 3.33 6 60 Amur Oblast 2.60 5
16 Nenets Aut. Okrug 3.33 3 61 Leningrad Oblast 2.60 5
17 Khanty Mansiysk A. Okrug 3.33 6 62 Altay Kray 2.57 7
18 Chukotka Aut. Okrug 3.33 3 63 Arkhangelsk Oblast 2.57 7
19 Kalmikiya Republic 3.29 17 64 Tomsk Oblast 2.57 7
20 Yamalo-Nenets Aut. Okrug 3.25 4 65 Samara Oblast 2.54 13
21 Mordovian Republic 3.20 15 66 Kaluga Oblast 2.50 2
22 Taymyrskiy Aut. Okrug 3.17 6 67 Kamchatka Oblast 2.50 2
23 Tyumen Oblast 3.13 8 68 Kirov Oblast 2.50 2
24 North Osetian Republic 3.12 34 69 Penza Oblast 2.50 4
25 Kabardin-Balkar Republic 3.05 21 70 Perm Oblast 2.50 6
26 Sverdlovsk Oblast 3.04 23 71 Saratov Oblast 2.50 12
81
Treisman (1997) only considered ethnic regions.

4. From Hypotheses to Data
114
27 Karachay-Cherkess Rep. 3.00 11 72 Tambov Oblast 2.50 4
28 Aga-Buryat Aut. Okrug 3.00 3 73 Yaroslavl Oblast 2.50 4
29 Permyak Aut. Okrug 3.00 3 74 Moscow Oblast 2.43 7
30 Ust-Ordynskiy Buryat A.O. 3.00 3 75 Orenburg Oblast 2.43 7
31 Irkutsk Oblast 2.88 16 76 Tula Oblast 2.43 7
32 Vologoda Oblast 2.86 7 77 Sakhalin Kray 2.38 8
33 Daghestan Rep 2.84 19 78 Ulyanovsk Oblast 2.38 8
34 Khabarovsk Kray 2.83 6 79 Krasnodar Kray 2.36 11
35 St. Petersburg 2.82 22 80 Kostroma Oblast 2.33 3
36 Omsk Oblast 2.80 5 81 Smolensk Oblast 2.33 3
37 Jewish Autonomous Oblast 2.80 5 82 Stravropol Kray 2.25 12
38 Kaliningrad Oblast 2.79 14 83 Belgorod Oblast 2.25 4
39 Nizhny Novgorod Oblast 2.79 14 84 Rostov Oblast 2.20 10
40 Vladimir Oblast 2.75 4 85 Ryazan Oblast 2.00 1
41 Magadan Oblast 2.75 4 86 Tver Oblast 2.00 2
42 Chelyabinsk Oblast 2.75 12 87 Koryak Aut. Okrug 2.00 1
43 Evenk Autonomous Okrug 2.75 4 88 Lipetsk Oblast 1.75 4
44 Moscow City 2.72 25 89 Kursk Oblast 1.60 5
45 Bryansk Oblast 2.71 7 Russian average 2.84 10.89
Source: Table 1 in Dowley (1998: 370).
The ranking of Russian region according to Dowley's index (Table 4.2) shows that
all regions with a mean score of 4 or above are ethnic units (republics or autonomous
okrugs), with the exceptions of Sverdlovsk and Tyumen Oblasts. However, not all
ethnic units are above 3 and among those who are, mean scores vary significantly.
North Ossetian, Kabardin-Balkar, Daghestan, Karachay-Cherkess and Altay republics
have a mean score around or below 3, indicating support for a loose, but not ethnically
defined federation. Dowley attributes this difference among republics to the fact that
those with lower levels of autonomism, except Altay, are located in the North Caucasus,
"a region torn apart by interethnic strife" (Dowley 1998: 369). She points to the fact that
these regions are characterised by difficult ethnic equilibria within their borders, with
minority ethnic groups demanding equal rights as the other nationalities, or forming
separatist movements. For these reasons, the leaders of these republics may prefer not to
play the nationalist card in their relationship with Moscow (Dowley 1998: 369).
For a time-specific index
With Dowley’s index, each region receives a score that summarises its level of
assertiveness over the 1991-1995 period. While this time-averaging may arguably be
suitable in order to study the impact of regionalist demands on the December 1995

4. From Hypotheses to Data
115
elections, it is less convincing in a model of the 1999 elections, and it is not satisfactory
in a model of the 1993 elections. For a study of the 1993 elections, the index should be
decomposed to reflect only observations occurred before December 1993. Indeed, it is
clear that observations occurred after that date cannot possibly help explaining 1993
voting behaviour. This decomposition implies going back to the raw data originally
used by Dowley to generate the 1991-95 average, and calculating partial averages
reflecting only the observations occurred until the election of December 1993. This has
been possible thanks to the kind permission I received from Kathleen Dowley to use her
dataset of coded observations.82
The raw data coverage extends back to 1988 (the upper limit, 1995, is the same as in
the measure published in Dowley's 1998 article). For a measure of regionalist
assertiveness before 1993, therefore, two time spans can be considered: the 1988-93
period, the maximum for which observations are available, or the more limited, post-
communist, 1992-93 period. The first measure corresponds to the notion that regional
leaders' preferences over autonomism are likely to only approximate voters' sentiments
in their long-term, underlying and stable component. This way, arguably, a more
systematic trend should emerge, rather than short-term fluctuations in leaders'
bargaining positions towards the centre. Moreover, within a wider time span, more
observations can be used to estimate the average, which means that the average score is
less likely to reflect chance fluctuations.
On the other hand, the 1992-93 measure has the advantage to be potentially a more
precise measure of the pulse of the regionalist sentiments at pre-electoral time. Regional
assertiveness scores in sub-periods are presented in Table A.4.1 in Appendix. The
overall trend in centre-regional relations 1988-1995, as captured by Dowley's
measurements, is shown in Figure 4.1.
A breaking of the time line at the point of the 1993 elections shows the pattern in the
two pre-electoral periods. For the post-soviet period, this is presented in Figure 4.2
82
This is an SPSS file in which over 1400 regional events, declarations or speeches were coded according
to the level of political autonomism they indicated. The precise criteria for the coding are explained in
Dowley's article (1998). The events were also coded according to the time and the region they occurred
at/in. The present author recoded the data to match his dataset, aggregated the observations in several
time periods to perform the analysis for different elections (chapters 6, 7 and 8), and to display trends in
this chapter.

4. From Hypotheses to Data
116
where the level of assertiveness of a famously vocal region, Tatarstan, is compared to
the general one.
Figure 4.1: Average assertiveness of regions across time
Time (four-month period)
May-Aug 95
Sep-Dec 94
Jan-Apr 94
May-Aug 93
Sep-Dec 92
Jan-Apr 92
May-Aug 91
Sep-Dec 90
Jan-Apr 90
May-Aug 89
Sep-Dec 88
Jan-Apr 88
Dow
ley'
s in
dex
(all
regio
ns)
4.0
3.5
3.0
2.5
2.0
Figure 4.2: Regional assertiveness in the periods before and after 1993 elections.
Tatarstan Republic and all regions compared
Time (four-month intervals)
Sep-Dec 95
May-Aug 95
Jan-Apr 95
Sep-Dec 94
May-Aug 94
Jan-Apr 94
Sep-Dec 93
May-Aug 93
Jan-Apr 93
Sep-Dec 92
May-Aug 92
Jan-Apr 92
Dow
ley'
s in
dex
5.5
5.0
4.5
4.0
3.5
3.0
2.5
2.0
All Regions
Tatarstan Rep.
Source: elaborated from Dowley's dataset.
Source: elaborated from Dowley's dataset.

4. From Hypotheses to Data
117
The 1999 elections, on the other hand, pose a different problem. Dowley only
gathered observations until the end of 1995. Ideally, the same index should cover the
whole period of the three elections. Absent such an index, this study follows two
approaches. Firstly, the 1991-1995 average is used also in the 1999 election, under the
assumption that what counts are stable underlying patterns of regionalist sentiments,
rather than short-term fluctuations. The second option is to review the main events
related to centre-regional relations occurred between the 1995 and the 1999 elections
and to "adjust" Dowley's index to reflect the changes.
The limit of the first option is that it assumes the fundamental stability of centre-
regional relations between the 1991-95 and the 1996-99 periods. On the other hand, it
has the advantage of eliminating any further subjectivity derived from the analyst's
"adjusting" Dowley's index to reflect post-1995 changes, as in the second option. In the
empirical analysis of the 1999 elections both approaches will be used in parallel. The
procedure used here to adjust Dowley's index to the subsequent period is the following.
Two starting points are possible, depending on which baseline value gets "adjusted". It
is possible to start from the 1991-1995 or from the 1994-95 average of Dowley's
observations. The first route leads to variable "Asser99a1", the second to "Asser99b1".
In both cases, the post-1995 events leading to adjust Dowley's representation of
regionalist assertiveness are:
1) Instances of centre-regional confrontation occurred in 1998, as reported in Petrov
(1999: 59). This applies to: direct attempts by the Kremlin to re-centralise control
over Primorski Kray and Sakha Republic; Yeltsin's decree forcing the Republic
of Udmurtia to comply with federal law; exemplary attacks on corruption and big
oil companies in Kursk Oblast, Tatarstan and Bashkortostan Republics; tension
with the Republic of Ingushetia, due to the Chechen refugee crisis; and Yeltsin's
conflict with the leaders of Samara and Sverdlovsk.
2) Regional measures of economic protectionism, in violation of federal law, as a
reaction to the August 1998 financial default and economic crisis. Stark examples
occurred in Kalmikiya Republic, Sakha Republic, North Ossetian Republic,
Tatarstan Republic and Chuvash Republic (Kahn 2002: 166).

4. From Hypotheses to Data
118
3) Legal non-compliance in regional constitutions and charters. The most dissonant
cases regard the republics of Bashkortostan, Sakha, and Tatarstan (Drobizheva
1998: 36).
In "adjusting" Dowley's index to take into account these observation, a score of 3.5 is
attributed to each republic that figures in one of the three categories above. A score of 4
is attributed if the republic appears twice, and 4.5 if it belongs to all three groups. For
non-ethnic federal units, a score of three is attributed to reflect advocacy of a
decentralised federal arrangement, if they appear in at least one group. The resulting
scores for the relevant regions are then averaged with Dowley's index (1991-95 or 1994-
94) to produce the adjusted score. Finally, a marginal value of 0.5 is added to those
regions that held a gubernatorial election after 1995. This applies to a very large number
of oblasts and is often mentioned as one important reason for the greater assertiveness
of these regions on the federal plane.
Map 4.1: Cross-regional variation on Dowley's index
Regionalist assertiveness (Dowley's index)1.6 - 2.52.5 - 33 - 3.53.5 - 4.62
Indeed, in the pre-1996 period, the heads of oblast administrations lacked an
independent popular mandate and were still appointed by Yeltsin (Petrov and Titkov
2000). The ranking of regions resulting from this process is presented in Table A.4.2 in

4. From Hypotheses to Data
119
Appendix. As it is apparent, the exercise of "adjusting" Dowley's index for use in the
1999 models is bound to add further subjective judgement on top of Dowley's. This
would suggest using the original Dowley's 1991-95 index. In the analysis of the 1999
vote both strategies are followed in parallel. In fact, the limits of using the index for the
analysis of 1999 are less damaging than it might appear. This is because, contrary to the
1993 and 1995 elections, regionalist assertiveness is not expected to be a key factor of
the 1999 electoral results, when one takes into account the different political context of
the 1999 vote (see chapter 3 and 8). The next sub-section compares the adopted index of
regionalist assertiveness to several (partial) dimensions of the problem, following
conventional expectations as to the correlates of regionalist assertiveness. If the
indicator conforms to these expectations, confidence in its use is enhanced. Map 4.1
contains a map of Russia that classifies the regions according Dowley's index.83
Corroborating the index
Even with the mentioned limits due to subjective judgement and time coverage,
Dowley’s index has the advantage of providing a continuous measurement of a complex
phenomenon across all 89 regions, and across several years. Rather than taking it at face
value, however, some confirmation of its merits can be derived from a comparison of
the index with 1) a different index built by a different author, Alexseev (1999), to
measure a similar dimension; and 2) with other measurements and dimensions
conventionally deemed to correlate with autonomy demands.
Alexseev (1999: 265) has produced a typology (i.e. not a continuous measure) of
regions based on their integrationist vs. separatist stance. This concept is very similar to
the autonomist stance measured by Dowley. If the latter is a faithful indicator, its
distribution should be broadly consistent with Alexseev's typology. This is what Figure
4.3 confirms. To increasing levels of separatism on Alexseev's measure (horizontal axis)
correspond increasing levels of autonomism on Dowley's index (vertical axis).
83
In the Map 4.1, regions are grouped into classes according to their score on Dowley's index. The
criterion for the definition of class breaks is the default method in the GIS mapping software ArcView
(version 3.2). This method aims at showing “natural breaks", or breaks "inherent” in the data. As the
"Help" function of ArcView explains, “this method identifies breakpoints between classes using a
statistical formula (Jenk’s optimisation). This method is rather complex, but basically the Jenk’s method
minimises the sum of the variance within each of the classes".

4. From Hypotheses to Data
120
Figure 4.3: Is Dowley's index consistent with Alexseev's typology?
Alexseev's typology of regions
Separatist catalyst
Separatist follower
Bargainer
Integrationist
Mea
n s
core
on D
ow
ley's
in
dex
5.0
4.0
3.0
2.0
1.0
4.6
3.3
2.9
2.6
Further, impressionistic, confirmation that Dowley's index is a sensible measure of
the regionalist/centralist stance of Russian regions comes from the graphic depiction of
its correlations with three structural factors, widely held to be linked to regionalist
assertiveness -federal status, ethnic composition and economic potential.
Federal status is believed to affect autonomy demands, in particular in the literature
that stresses the institutional causes of nationalist mobilisation. The claim is that the
impact of ethnicity is reinforced by the institutional recognition of special rights to
ethnic groups. Under Soviet times, one such special right afforded to some ethnic
groups was official recognition of their "titular status" in a given territorial unit. In that
unit, members of the titular ethnic group would enjoy cultural and symbolic rights.
According to the institutionalist view, these special rights fostered the development of a
distinct identity in the minds of the members of the privileged group (Zaslavsky 1993;
Gorenburg 2003).
The territorial units with the greatest privileges would develop greater sense of
distinct identity and potential for separatist mobilisation. Since Soviet times, in the
hierarchy of ethnically designated territorial units within the Russian Federation, the
most privileged units were the Republics (ASSRs), followed by the autonomous okrugs
and the Jewish autonomous oblast. Oblasts, by contrast, represented purely
administrative divisions, lacking ethnic designation. Figure 4.4 shows that Dowley's
Source: Dowley (1998: 370) and Alexseev (1999: 265).

4. From Hypotheses to Data
121
index is consistent with the institutional factor of ethnic mobilisation. Indeed, Republics
score highest on the index, followed by autonomous okrugs and, then, by oblasts and
krays.84
Figure 4.4: Federal status and Dowley's index
Federal status
Oblasts & KraysAut. okrugsRepublics
Mea
n s
core
on D
ow
ley's
in
dex
3.6
3.4
3.2
3.0
2.8
2.6
2.4
2.5
3.0
3.5
The distribution of Dowley's index is also consistent with the widely held
expectation that separatism is more likely to grow in territorial units endowed with
independent economic potential. As Figure 4.5 indicates, among republics and
autonomous okrugs, which on average are the most assertive types of units, Dowley's
index decreases as the economic dependency on the federal centre increases. In this
Figure, the categories of economic dependency from the centre are taken from
Stavrakis, DeBardeleben and Black (1997: 227-229).85
Of the structural conditions plausibly conducive to greater assertiveness, the last to
be considered here is the ethnic distinctiveness of the region.86
The simplest expectation
84
In the graph of Figure 4.4, the cities of Moscow and St. Petersburg, which constitute federal units in
their own right, are grouped in the third category (oblasts and krays) because they lack ethnic designation. 85
These authors, in turn, based their categorisation on Rossiiskie vesti - Spetsial'ni vypusk, n.2, April
1996. 86
Other such structural factors have been noted in the literature. These include, for example, the
geopolitical location of the region: border position, the presence of important transport gateways, and the
potential for foreign trade, as could be argued for Primorskii and Khabarovsk krays, and for Amur and
Sakhalin oblasts (Lapidus 1999: 81). Because the aim of this section is simply to provide impressionistic
Source: own elaboration from Table 1 in Dowley 1998: 370.

4. From Hypotheses to Data
122
is that regions with larger shares of ethnic, non-Russian, populations would have a
greater potential for regionalist activation.
Figure 4.5: Effect of economic dependency on assertiveness, by federal status
Economic dependency on the federal centre
highly sub
moderately sub
subsidised
slightly sub
non-subsidised
Me
an
sco
re o
n D
ow
ley'
s in
dex
4.5
4.0
3.5
3.0
2.5
2.0
Federal status
Republics
Aut. Okrugs
Oblasts & Krays
Figure 4.6: Dowley's index and regional ethnic composition
Share of Russians living in region
1.0.8.6.4.20.0
Mea
n s
core
on
Do
wle
y in
dex
5
4
3
2
1 Rsq = 0.4629
support for the validity of Dowley's index, not to explain regionalist assertiveness, it is beyond the scope
of this enquiry to produce a detailed comparison with all such factors.
Source: elaborated from Table 1 in Dowley (1998: 370) and Stavrakis et al. (1997: 227-229)
Source: own elaboration from Table 1 in Dowley (1998: 370) and 1989 Census.

4. From Hypotheses to Data
123
Dowley's index appears to conform to this hypothesis (see Figure 4.6). The level of
regionalist assertiveness (vertical axis) decreases as the percentage of Russians in the
region increases (horizontal axis). The Rsq of .46 indicates a strong association.
It is possible to specify further this simple tendency. In particular, stronger autonomy
demands should be expected where the non-Russian population is more homogenous.
By contrast, greater difficulty in playing the nationalist card in federal bargaining with
the centre should be expected where the non-Russian population is fragmented into
several different groups. It has been noted87
, for example, that secession is unlikely in
the North Caucasus republics that have two or more titular nationalities (such as
Daghestan, Kabardino-Balkaria, Karachaevo-Cherkessia) because this would induce
claims to "internal secession" and internal conflicts (Payin 1998: 20). Dowley's index
conforms to the expectation of a moderating effect produced by the ethnic
fragmentation of non-Russians. Indeed, as Figure 4.7 shows, the effect of the size of the
Russian community in the region (the more Russians, the smaller the regionalist stance)
applies to very different extents according to the degree of ethnic fragmentation of the
remaining, non-Russian, population. In the title of the Figure's legend, "Fragmentation
of NRs", "NRs" stands for non-Russians.
Figure 4.7: Interaction between share
of Russians and fragmentation of non-Russian populations
Share of Russians
1.0.8.6.4.20.0
Mea
n sc
ore
on D
owle
y's
inde
x
5
4
3
2
1
Fragmentation of NRs
Highly fragmented
(> 4)
Rsq = 0.0610
Moderately
Fragmented (2.5 - 4)
Rsq = 0.3445
Concentrated
(< 2.5)
Rsq = 0.5767
87
See section 4.1, subsection on Dowley's index, final paragraph.
Source: own elaboration from Table 1 in Dowley (1998: 370) and 1989 Census.

4. From Hypotheses to Data
124
The effect is strongest where non-Russians are concentrated in a small number of
groups. The "effective number of groups" is calculated following Laakso and
Taagepera's (1979) formula for the "effective number of parties". In the graph legend,
regions with a smaller "effective number of groups" are labelled "concentrated" (they
have an effective number of groups smaller than 2.5, as reported in parentheses in the
key to graph groupings). The relationship between "Share of Russians" and Dowley's
index for these regions is represented by the dashed regression line, which has a
noticeable negative slope. The Rsq value of .57 indicates a rather strong association for
this sub-group of regions.
The relationship between size of the Russian community and assertiveness is weaker
for regions where the non-Russians are "moderately fragmented" (i.e. there are between
2.5 and 4 effective non-Russian groups). For this grouping, the Rsq is .34, smaller than
for the "concentrated" grouping. Furthermore, the relationship does not exist at all
where non-Russians are "highly fragmented" (there are more than 4 effective ethnic
groups). In this case, the dotted line is virtually flat, and Rsq is only .06. In such regions
the size of the Russian community does not affect the region's level of assertiveness. In
sum, the relationship between ethnic composition (including the complex interaction
with the level of fragmentation of non-Russians) and Dowley's index conforms to the
expectations, thus reinforcing a belief in the broad accuracy of the latter.
Central appeasement
A key element of the main hypothesis is that the effect of regionalist assertiveness on
electoral results should be investigated while controlling for the response that such
assertiveness meets from the federal Centre. There is evidence to suggest that Moscow
has selectively used political/legal and financial tools of appeasement of the most vocal
regions (see chapter 3).
Students of the Russian (re-)federalisation process of the 1990s, through which the
terms of the federal relations were being negotiated and bargained upon, have noted
several instances of asymmetric political appeasement. In this way, a sub-set of regions
received privileged treatment from the Centre. In the two periods leading up to the 1993
and to the 1995 Duma elections, regions can be roughly grouped according to the level
of appeasement they managed to extract from the Centre.

4. From Hypotheses to Data
125
In the first period, from the collapse of the Soviet regime to the end of 1993,
arguably the most important form of appeasement were the special rights and privileges
that a few regions received as inducement to sign the Federal Treaty of March 1992.
These concessions were not enshrined in the Federal Treaty itself but represented side-
deals. This applies to the republics of Bashkortostan, Kalmikiya, Karelia, Komi and
Sakha (Kahn 2002: 126; Treisman 1999: 34). Another set of regions, while not
receiving special treatment to the same extent, also managed to extract important
concessions from the Centre. These include the Soviet-era Autonomous oblasts that
were upgraded to republican status in 1991 (and became the republics of Adygeya,
Altay, Karachaevo-Cherkessya, and Khakassya). The federal units where Yeltsin-
appointed heads of administration were removed by the Russian president to appease
local elites should also be added to this group (Matsuzato 2000). These are Krasnodar
kray, Krasnoyarsk kray, Voronezh oblast, and Pskov oblast. All these units are
considered "politically appeased" for the purposes of modelling the 1993 elections. A
dichotomous variable is therefore produced for the 1993 models that marks these
regions from the rest.
For the 1995 elections, primary examples of appeasement are represented by the first
bilateral treaties signed by the Russian president with selected republics, starting with
Tatarstan in February 1994. The first such treaties granted extensive rights and
privileges (in the spheres of regional budgetary policies, taxation, control over natural
resources and cultural autonomy). Subsequent treaties signed with other regions varied
in their contents, but generally and progressively carried less substantial benefits.
Moreover, most regions did not receive any treaty until after the Duma elections and the
start of the 1996 presidential campaign. In 1994 and 1995, only republics received
bilateral treaties, not oblasts. The republics that received substantial privileges by means
of a bilateral treaty before the 1995 elections are Bashkortostan, Kabardino-Balkaria,
Sakha, North Ossetia, and Tatarstan (Kahn 2002: 158ff). These regions can be
considered the recipients of clear political appeasement in the 1994-95 period.
To take into account the cumulative effect of appeasement occurred before that
period, the main instances of appeasement observed for the 1993 elections are also
counted for the 1995 vote. As a result, for the 1995 models, appeased regions are those
that either received substantial inducements to sign the Federal Treaty of 1992, or were
4. From Hypotheses to Data
126
granted important privileges and concessions in the bilateral treaties of 1994-95. This
cumulative approach seems justified also in the light of the temporal proximity of the
1993 and the 1995 elections.
In the 1996-1999 period, leading up to the third Duma elections, centre-regional
relations were characterised by waves of conflict and appeasement. Centre-regional
conflict was heightened in 1997, when Chubais attempted to establish firmer central
control over some recalcitrant regions (see chapter 8). Appeasement occurred in 1999,
when Primakov forged a new tacit alliance with key regions. In general the scope for
central appeasement of vocal regions was limited in this period due to the 1998
financial crisis (see chapter 8). The units that can be considered relatively appeased are
those that received a bilateral treaty after the 1995 Duma elections,88
although the
contents of such treaties were less advantageous than those of earlier pacts. The
extension of the bilateral treaty process to the non-autonomous (oblasts and krays) units
was meant to cement an alliance between Yeltsin and the governors in view of the June
1996 presidential elections. Closer in time to the 1999 elections, the Kremlin confirmed
its alliance with Tatarstan, when prime minister Primakov renewed the bilateral treaty
of 1994 that gave the republic extensive privileges. Moreover, signs of bilateral
accommodation can be seen in the fact that the Kremlim devolved shares of state
companies to a selected number of regions (Khakass Republic, Krasnoyarsk Kray,
Kemerovo Oblast and Novosibirsk Oblast). Regions are coded as "politically appeased"
if they received any of the mentioned concessions from the Centre in the 1996-99
period.
In addition to the mentioned tools of central appeasement, it is useful to take into
account also central financial transfers to the regions. There is a literature finding that
financial flows, from the Centre to selected regions, aimed at appeasing the strongest
Yeltsin's opponents in preparation for his re-election bid of June 1996 (Treisman 1999).
Similarly, centre-regional financial relations could also be used as an addition tool of
88
These regions are Komi Republic, Mariy El Republic, Chechen Republic, Chuvash Republic, Altay
Kray, Krasnodar Kray, Krasnoyarsk Kray, Khabarovsk Kray, Amur Oblast, Astrakhan Oblast, Bryansk
Oblast, Vologoda Oblast, Voronezh Oblast, Ivanovo Oblast, Irkutsk Oblast, Kaliningrad Oblast, Kirov
Oblast, Kostroma Oblast, Leningrad Oblast, Magadan Oblast, Moscow Oblast, Murmansk Oblast, Nizhny
Novgorod Oblast, Omsk Oblast, Orenburg Oblast, Perm Oblast, Rostov Oblast, Samara Oblast, Saratov
Oblast, Sakhalin Oblast, Sverdlovsk Oblast, Tver Oblast, Ulyanovsk Oblast, Chelyabinsk Oblast,
Yaroslavl Oblast, St. Petersburg, Permyak Aut. Okrug, Taymyrskiy (Dolgano-N.) Aut. Okrug, Ust-
Ordynskiy Buryat Aut. Okrug, and Evenk Aut. Okrug.

4. From Hypotheses to Data
127
appeasement of the most assertive regions in other periods (Lavrov 1998; Kuznetsova
2001). However, there are three cautions in this respect. On the one hand, it is notorious
that financial flows between Moscow and the regions are extremely difficult to monitor.
They can take several forms (direct transfers, tax relief, and subsidies to regional
enterprises, etc.) and a large part goes undetected because it is covert or flows through
informal channels. Nevertheless, specialists do use the available information if only to
gauge at broad and partial trends. On the other hand, the privileged financial treatment
granted to key regions is often enshrined in what is here called "political appeasement",
especially in the early bilateral treaties. This means that part of the possible effect of
financial appeasement is already captured by the variables discussed above. Finally,
federal transfers to poorer regions may also aim at alleviating need, rather than at
appeasing regionalist demands. However, this is not troubling in the present context
because both types of transfers can be expected to induce lower assertiveness,
regardless of whether this is due to economic dependency on the centre or to financial
appeasement.
In any case, the variable on the financial transfers will only have a tentative role in
the model, as a control for any residual effect, beyond the one channelled through the
other appeasement tools. The variable for federal transfers is measured so as to include
budget loans, and it is calculated as percentage of regional expenditures. For 1993, the
source of this data is Lev Freinkman, Daniel Treisman, and Stepan Titov's Subnational
Budgeting in Russia: preempting a potential crisis (1999).89
Unfortunately, this volume
does not cover 1999 and, for the elections of that year, data on federal transfers to
regional budgets comes from Raj Desai, Lev Freinkman, and Itzhak Goldberg's Fiscal
Federalism and Regional Growth: Evidence from the Russian Federation in the 1990s
(2003).90
This data is the average transfers received by the regions in 1996-1999.
This section has presented the operationalisation choices for the main hypothesis,
regionalist assertiveness, and for the control variables of central political appeasement.
The next section is devoted to the operational definition of the other hypotheses and
variables in the models. These variables relate to the "supply side" of the electoral
89
More precisely, the data is contained in Annex Table 3, "Budget Arrears, transfers, and Deficit as
Percentage of Expenditures" (pp. 88-90) and it is the authors' estimate based on the data from the
Ministry of Finance and Roskomstat. 90
The table that contains the data is titled "Budgetary transfers as percentage of regional governmental
revenue, 1996-1999 average", on pp. 15-16.

4. From Hypotheses to Data
128
market or to the fairness of the electoral process itself (in terms of Governor's
involvement in the election and of his use of administrative resources to affect results).
4.2 The supply side of the electoral market
Similar to the market equilibrium, electoral outcomes are the product of both demand
and supply forces. Voters demand policies, and candidates offer themselves as channels
of representation (Dawns 1957). On the demand side, it is argued here that a
fundamental distinction affecting the electoral chances of the independents runs
between functional and territorial demands or issues. On the supply side, the quality of
candidates depends on 1) their personal qualities (finances, notoriety, control of local
media, etc.); and 2) the added value of their party label (in the case of party candidates).
Candidates' personal characteristics will affect the district returns for the
independents based on whether such personal qualities are found predominantly among
independent or party candidates in the given district. As for the impact of party labels,
they can affect independents' success in a district if candidates of valued parties are
nominated in the given SMD. Each of these supply-side factors is operationalised in the
next sub-sections.
Notable candidates
The first type of supply-side factors to be considered is the personal qualities of
candidates. The literature on electoral studies suggests that some candidates stand
greater (a priori) chances of success than others because they can finance richer
campaigns, they are more visible, or better connected than others, or because they can
count on their record of constituency servicing as district incumbents. In short some
candidates can rely on a "personal vote" or personal resources (Herrera and Yawn 1999;
Cain, Ferejohn and Fiorina 1986; Ansolabehere, Snyder and Stewart 2000; Carey and
Shugart 1995; for Russia, Golosov 2002; Hale 2005).
Of all types of personal qualities (political and economic elite status, and
incumbency), those emanating from economic positions cannot be fully studied here.
This is because the information that candidates submitted to the Central Electoral

4. From Hypotheses to Data
129
Commission (CEC) in the 1990s, though rather extensive, does not include any hint as
to the importance of the economic interest linked to the candidate. In other words, it is
virtually impossible, without a detailed, case by case, study of thousands of candidates
in hundreds of districts, to determine whether the company they declare to head is
marginal or fundamental to the district economy (see chapter 3). This is unfortunate,
given that it prevents the examination of the effect of economic notability. Also on
campaign spending there is no information for SMD candidates. As a partial remedy,
expert assessments of the financial backing received by a candidate, gathered by Henry
Hale, will be used for the 1999 elections only (more on this variable below).
As for the political elite status, federal and regional/local political officials are
considered separately. High regional political officials are more visible and command
more administrative resources than the average candidate. The coding of candidates as
members of federal or regional political elites is taken from the Essex University
Election Database, files on Russian elections in the SMDs.91
The Essex database
contains some discrepancies with the official data of the CEC, which had to be
rectified.92
The information on occupational status, naturally, is measured at the
candidate level. For example, federal political positions range form high federal state
officials, such as federal ministers (or vice ministers), to judges of federal courts, army
officials, members of federal state agencies, etc. Regional political elite members
include, for example, members of regional executive or legislative branches (regional
ministers or members of the office of executive heads), regional capital city mayor (and
official of capital city governments), members of regional or local legislative
assemblies, etc.
For the present purposes it is necessary to aggregate the information at the district
level, which is the unit of analysis of this study (see chapter 5). The focus here is not on
inter-candidate differences within districts, but on inter-district differences in the pools
of independent vs. party candidates. The district aggregate measure of the nomination of
the political elite in each district is achieved by counting how many of the district
candidates falling within a given occupational category run as independents and how
many run as party candidates. A dichotomous variable assigns a code of 1 to the
91
The webpage of the Essex project is www.essex.ac.uk/elections/. 92
For example, the last-ranked candidate of SMD 68 of the Essex 1999 database does not appear in the
official results published by the CEC and has been deleted from the analysis.

4. From Hypotheses to Data
130
districts where a majority of the regional political elite runs as independent (0 for all
other SMDs). Another binary variable does the same for the federal elite occupations.
This results in the two variables "RegPol" and "FedPol" of the analysis chapters (6 to 8).
The effect of incumbency is also expressed by means of a dummy variable. Districts
where one of the independents is the district incumbent are coded 1, all other districts
are given a value of 0. The variable is labelled "Incumb".
For the 1999 elections only, data originally gathered by Henry Hale allows the study
of the impact of financial backing on the success of the independents in district races.
The data draws from several sources close to the district races, and has been collated by
Henry Hale, as described in his forthcoming article (Hale 2005), where it is used to
investigate the impact of financial-industrial groups as substitutes for parties. As Hale
explains, the sources of his data on the backing received by candidates from "Financial-
Industrial Groups" (FIGs) include "one major party’s campaign headquarters’ internal
assessments as of November 11, 1999; written reports on the Duma elections submitted
by the East-West Institute’s network of observers; Russian-language radio reports by
Radio Svoboda correspondents (broadcasts during fall 1999, transcripts at
http://www.svoboda.org/archive/elections99), and the following sources: The Moscow
Times, December 21, 1999, ISI Emerging Markets; Nezavisimaya Gazeta, October 19,
1999, ISI Emerging Markets; and anonymous regional analysts in personal
communication with the author" (Hale 2005).
To perform the analysis presented in this thesis, this author has linked the data to
information on candidates' nomination (party vs. independent), and aggregated it at the
district level. The number of candidates that, according to Hale's coding, are sponsored
by large economic interests have been counted for each district.93
A categorical variable,
"FigCat", has been created and specified into two dummy variables. The first dummy
variable, "FigInd", assigns a value of one to districts where a majority of FIG-backed
candidates run as independent, and zero to all other SMDs. The second dummy
variable, labelled "FigPar", marks the SMDs where this type of candidates tends to run
under a party banner. Districts where either no backing at all was detected or it was
evenly shared by the two pools of candidates represent the base category.
93
Usually, no more than one candidate per district belongs to such category.

4. From Hypotheses to Data
131
Party challengers
In terms of electoral value to the candidates, not all party labels are the same.
Established labels have a clear image in voters' minds, which helps the latter make their
voting choices. Voters know what they can broadly expect of a candidate from his party
attachment, which thus provides an informational shortcut for ill-informed voters to
make complex decisions. This "brand name effect" is observed in established
democracies with stable and rooted party systems. It is much less plausible in the fluid
and young Russian electoral context. It is nevertheless worth testing the impact of a
challenge by major parties to the independents, and observing if this effect increases
with time, as the notion of the emergence of a brand name effect would suggest.
In addition to major parties, regionalist parties are of special interest given the
hypotheses being tested in this study. To the extent that a party can claim to have
genuine local roots, it can neutralise the advantage that the independents are expected to
enjoy over national parties in articulating and representing regionalist demands. As
noted in the preceding chapter, true regionalist parties are very rare. In fact, in the
course of the three Duma elections under analysis, only the 1995 "Transformation of the
Fatherland" can be considered genuinely regionalist in the sense of defending the
interests of one region only (i.e. Sverdlovsk or the broader Urals area). There are,
however, parties that advertise their supposed closeness to the interests of the regions
generally, despite lacking a territorial basis of support. Examples include the 1993 and
1995 'Party of Russian Unity and Accord' (PRES), and the 1995 "Bloc of 89 regions",
which can be called "pseudo-regionalist". The operationalisation of the challenge posed
by candidates of major, regionalist and pseudo-regionalist parties to the independents is
very straightforward. Each party has its own dummy variable and each district is coded
1 if the given party nominated its candidate there, zero if not. It should be emphasised
that these party dummies do not belong to one categorical variable, but are separate
variables. Indeed, because the unit of analysis is the SMD (not the candidates), cases
take a value of 1 on more than one party dummy simultaneously, as more than one party
usually contest an SMD.

4. From Hypotheses to Data
132
The electoral process and Governor's involvement
To continue with the market analogy, the smooth operation of the mechanism of supply
and demand assumes that market forces operate in a fair and competitive environment.
In economics this assumption is sometimes relaxed to study the effect of oligopolistic
settings on prices. Similarly, the level of competitiveness of the electoral environment
affects electoral results and should be taken into account.
As explained in chapter 3, the hypothesis is that regional "administrative resources"
can be used by the governor to bend the electoral process to the advantage of a preferred
candidate. The governorship94
is arguably the most influential political institution at the
regional level. The degree of control exerted by regional governors over of regional
politics varies from region to region. Those who enjoy greater influence are often able
to control the regional media, and to influence regional economic interests and law
enforcement agencies (both police and courts). This state of affairs also varied with
time. In the oblasts, governors' grip on regional politics has increased towards the 1999
Duma elections, after they passed from being appointed by Yeltsin to being popularly
elected.
To measure the impact of "administrative resources" on the chance of independent
candidates, two steps are necessary. On the one hand, it is necessary to determine which
candidate (independent or party-nominated) received governor's support in each SMD
(if any). On the other hand, in order for such a support to be effective, the governor
must be in control of the political process in his regions. Each of these two elements
individually taken cannot convey the full picture of the impact of administrative
resources. Indeed, the effect of governor's support for a given candidate can be expected
to interact with his control over regional politics.
On the first dimension (which candidate received his governor's support in each
SMD), this thesis utilised data gathered by Henry E. Hale, as used and described in his
forthcoming article (Hale 2005). Hale has been one of the first students of the
phenomenon of "administrative resources" (or "machine politics") in the regions. Most
recently, he argues that administrative tools in the hands of regional governors have
constituted a functional substitute to political parties by providing candidates with the
94
It should be remembered that, for the sake of simplicity, with the term "governor" I indicate all
executive heads of the units of the Russian federation, despite the fact that in most republics these are
formally called "presidents".

4. From Hypotheses to Data
133
campaign benefits that normally accrue to party candidate in western, established,
democracies (Hale 2005). However, Hale does not distinguish between independent and
party candidates as recipients of governors' support and cannot assess whether the
impact of administrative resources differs for party or independent candidates.
Moreover, Hale's discussion of governors' support does not take into account that this
factor should be expected to affect the elections to different extents in different regions.
As mentioned, this is because regional governors vary in their ability to control the
political process in their respective regions.
Instead, these questions are key concerns of this thesis (see chapter 8). The data used
by Hale in his study was kindly supplied to this author, and forms the basis for a
categorical variable, labelled here "GovSup". The sources of Hale's data to some extent
overlap with those he used to detect candidate backing from financial-industrial groups.
The sources used by Hale include "assessments by the East-West Institute, Radio
Svoboda correspondents, and a major party’s campaign headquarters’ internal
assessments as of November 11, 1999" (Hale: 2005). Of the two indicators used by
Hale, it is the "liberal" version that is used here.95
On the basis of this data, a categorical
variable is created and entered in the 1999 models. The variable, "GovCat", has three
categories, and two dummy variables. The first, "GovInd", codes "1" the districts where
the governor supported an independent; the second, "GovPar", marks districts where he
supported a party candidate. The base category is the remaining scenario, in which no
governor's support was observed.
However, as mentioned above, it is not sufficient to detect the governor's preference
for one candidate or the other. It is also necessary to assess the degree of
competitiveness vs. control exhibited by regional politics. Indeed, a preference for a
given candidate may remain ineffectual if the governor does not have the means to
translate it into actual electoral advantages. There are several ways to understand
95
As Hale explains, "when assessments from different sources conflicted, judgement calls were made by
Henry Hale based on the content of their reports. When there was insufficient information in the
assessments to make a judgement, preference was given to East-West Institute assessments since their
evaluative process was the most systematic". The "liberal" version of Hale's coding, used as a basis in the
present analysis, eliminates a large number of missing observations. It codes as “governor supports no
one” (instead of "missing") the cases when there is no indication in any of the sources cited that the
governor supported any SMD candidate. Also "when there is some indication that a governor backs a
candidate but it is not conclusive enough to count for" his stricter version of the indicator, the liberal
version codes the candidate as supported by the governor (Hale 2005).

4. From Hypotheses to Data
134
political competitiveness and control,96
but a key dimension related to the fairness of the
electoral process is related to media control and regulation. An index of this dimension
has been compiled within a project called "Public Examination",97
conducted by the
Russian Union of Journalists and other association. This index, called "freedom of
speech", is the result of a comprehensive investigation of several aspects related to
levels of pluralism in the production and dissemination of information in each region in
1999. The variable using this index in the following analysis is labelled "Freesp". The
map in Map 4.2 shows cross regional variations along this variable.
Map 4.2: Regional levels of freedom of speech
Freedom of speech10 - 23 24 - 3233 - 4344 - 63
The variable is used to indicate the degree of control exerted by regional governors
over the political process in their regions. In the map, darker areas correspond to higher
control (i.e. lower freedom of speech).
96
Reisinger and Moraski (2003) have recently studied regional levels of democracy and competitiveness.
Other authors who worked on the subject include McMann and Petrov (2000). 97
"Public Examination: Evaluation of Freedom of Speech in Russia (1999-2000)". The index used here is
at pp.14-15. At www.freepress.ru/win/english.html (accessed June 2003).

4. From Hypotheses to Data
135
Urbanisation and Campaign access to districts
Two additional variables are introduced in the models. The first one is the degree of
urbanisation of the district (specified as the share of the district population living in
urban centres, that is towns of more than 100,000 inhabitants). The data come from a
publication of the Moscow Carnegie Center (McFaul, Petrov and Ryabov 2000: 565-
72), which has the merit to present some socio-demographic indicators, derived from
the 1989 population census aggregated at the level of electoral district. The role of
urbanisation on party development is a traditional hypothesis dating back to Stein
Rokkan and to his studies of the emergence of party systems during the transition to
mass politics at the turn of the 19th
century, particularly concerned with the experience
of the European Nordic countries. It is posited that parties first develop in urbanised
areas, and then attempt to penetrate the less urbanised provinces. The explanation for
this pattern focused on the greater circulation of printed media and concentration of
educated citizens in urban centres (Rokkan 1970). In the Russian case, as noted in
chapter 3, urban centres are more accessible to party organisation than rural areas.
A second aspect of this accessibility problem points to the lack of transport
infrastructures in remote areas to explain why parties initially neglect them in their
mobilisation efforts. This is here captured by a separate variable, which measures the
share of a region's population living in areas "difficult to reach". Data on this variable is
taken from the Russian ministry of finance,98
where it figures as one of the elements of
a formula used by the ministry to calculate the financial transfers needed by each
region. The variable, labelled "Remote", is a composite index of two other variables.
The first variable ("Var. A" in Table 4.3) is the proportion of the regional population
living in areas where deliveries of goods can only occur within limited periods of the
year;99
the second variable ("Var. B") is the proportion of the regional population living
in mountains areas.
98
Data taken from www.minfin.ru (accessed August 2003). 99
The formula used by the Ministry of Finance can be translated as "share of population in districts
characterised by limited periods of deliveries" (the original version refers to the population "в районах с
ограниченными сроками завоза продукции").

4. From Hypotheses to Data
136
Table 4.3: Population living in areas difficult to reach (%), selected regions.
Region Var. A Var. B "Remote"
Magadan Oblast 100% 0% 100%
Koryak Aut. Okrug 100% 0% 100%
Nenets Aut. Okrug 100% 0% 100%
Taimyr Aut. Okrug 100% 0% 100%
Chukotka Aut. Okrug 100% 0% 100%
Evenk Aut. Okrug 100% 0% 100%
Sakha (Yakutia), Republic of 84% 0% 84%
Karachevo-Cherkess, Republic of 0% 49% 49%
Altay, Republic of 46% 25% 46%
Yamalo-Nenets Aut. Okrug 45% 0% 45%
Khanty-Mansi Aut. Okrug 40% 0% 40%
Dagestan, Republic of 0% 38% 38%
Kabardin-Balkar, Republic of 0% 36% 36%
North Ossetia, Republic of 0% 31% 31%
Komi-Permyak Aut. Okrug 28% 0% 28%
Tomsk Oblast 23% 0% 23%
Buryatia, Republic of 7% 19% 19%
Tyva Republic 19% 2% 19%
Ingushetia, Republic of 0% 18% 18%
Krasnoyarsk Krai 16% 0% 16%
Kamchatka Oblast 16% 0% 16%
Komi, Republic of 14% 0% 14%
Amur Oblast 12% 0% 12%
Sakhalin Oblast 12% 0% 12%
Arkhangelsk Oblast 12% 0% 12%
Adygeya, Republic of 0% 10% 10%
Khabarovsk Krai 9% 0% 9%
Irkutsk Oblast 9% 0% 9%
Jewish Aut. Okrug 8% 0% 8%
Chita Oblast 7% 0% 7%
Karelia, Republic of 5% 0% 5%
Tyumen Oblast 5% 0% 5%
Perm Oblast 2% 0% 2%
Primorsky Krai 2% 0% 2%
Murmansk Oblast 2% 0% 2%
Russian Federation 3% 1% 3%
Var. A: Percentage of regional population leaving in areas with limited periods of
goods deliveries. Var. B: Percentage of regional population living in mountain areas. "Remote": Percentage of regional population living in areas difficult to reach.
All other regions (not listed) score 0% on all three variables. Source: Russian Ministry of Finance, www.minfin.ru (accessed August 2003).

4. From Hypotheses to Data
137
The source of data used by the ministry of finance are the regions themselves in the
first case, and bill of laws/decrees ("проект постановления") in the second case. The
"Remote" variable is a composite index of the two variables, which takes simply the
maximum between the two variables. In practice this means taking the values of the
second variable for most regions, and the values of the first variable only for the
republics of Adygeya, Dagestan, Ingushetiya, Kabardino Balkaria, Karachaevo-
Cherkessia, North Ossetia, and Buryatiya (See Table 4.3).
Conclusion
This chapter has presented the operational definition of the independent variables called
for by the theoretical framework of chapter 3. Some variables that are specific to one
election only (e.g. party challengers take different party labels in different elections)
will be presented in detail in the context of the actual empirical analysis of the given
election. Moreover, descriptive statistics will also be presented in the chapters
containing the statistical analysis (chapter 6-8).
The difficulty of identifying a single satisfactory indicator for such complex social
phenomena as "regionalist assertiveness", across all regions and several years has been
noted. The case for using Dowley's index rests on the fact that any alternative measure
that aims at synthetically describing the whole set of 89 regions along such dimension is
bound to embody a degree of subjective judgement. Some descriptive/impressionistic
corroboration of the chosen index could be derived from its comparison with other
indicators of relevant dimensions. While not perfect, the data allows a meaningful
statistical analysis to explore new aspects of Russian voting behaviour. Given the early
stage of the scholarly understanding of Russian electoral process in the SMDs, this kind
of analysis seems useful. The next chapter present the methodological strategy adopted
for the analysis, which includes the operational definition of the dependent variable.

138
5
Designing the Empirical Analysis
“Once you know that hierarchies
exist, you see them everywhere”
Kreft and De Leeuw (1998: 1)
100
This chapter marks the last step before the empirical analysis of the vote. After the
elaboration of the explanatory framework and the operational definition of the
independent variables (chapters 3 and 4), the last terrain to be covered include: the
definition and measurement of the dependent variable; a discussion of the strategy of
case selection; the presentation of the data structure and a discussion of how to translate
the test the hypotheses posited in the explanatory framework, which leads to the study
of context and to multilevel modelling as the statistical technique of choice.
Up to this point, the phenomenon under investigation has been referred to as "success
of the independents". In this chapter this notion receives an operational definition so
that it can be measured and constitute the dependent variable of statistical models. This
task implies a prior definition of the unit of analysis: should individuals, districts or
regions constitute the level of inquiry? Both steps - the definition of the unit of analysis
and the operationalisation of the dependent variable - are presented in the first section of
this chapter.
Furthermore, no quantitative analysis can be carried out without the definition and
justification of a strategy of case selection, and a discussion of the problems of selection
bias. This is done in the second section of this chapter. The second part of that section
also describes the nested, or “hierarchical” structure of the data. This means that the
units of the analysis (SMDs) are nested within higher-order units (regions). The
100
Quoted in Jones and Gould (2003: 1c).

5. Designing the Empirical Analysis
139
hierarchical data structure, coupled with the fact that key explanatory variables apply at
the higher level (regions), is important in determining the type of quantitative technique
to be used in order to test the explanatory framework and invites a reflection on the role
of context in political science explanations. The study of "context" and the related
choice of multilevel modelling as the quantitative technique to be used constitute the
material of the third and final paragraph of the chapter.
5.1 The dependent variable: unit of analysis and measurement
It is by now clear that the aim of this research is to explain cross-district differences in
the electoral success of independent candidates, but how should "success of independent
candidates" be conceptualised and measured?
The basic concept behind the formula "success of independent candidates" is a highly
simplified, indeed dichotomised, approach to electoral politics. All independents are
grouped together, in opposition to all party candidates. Obviously, in reality, these two
"camps" are internally highly heterogeneous along several dimensions. The reason for
overlooking this heterogeneity is to study partisanship as such. With this goal in mind,
the important diving line among candidates becomes their party vs. non-party (i.e.
independent) nomination. However, as noted in chapter 3, and as it will be clear from
the analysis, this dichotomous approach does not preclude an assessment of which
party/ies in particular pose the greatest challenge to independents in the SMDs.
Another element of simplification is that candidates running as "independents" are
often party men that prefer to shed their party membership for the purposes of
campaigning. Conversely, some of the candidates nominated by parties, even those
elected through party lists, are in fact independent politicians who lack party
membership. Of the deputies elected to the first Duma through party lists, only 70%
were in fact party members (White, Rose and McAllister 1997: 183). Even the most
"disciplined" Russian party, the KPRF, in 1999 had about 15 percent of non-members
on its PR list (Golosov and Shevchenko 2002: 147). Despite this gap between formal
nomination and real membership, it seems reasonable to posit that nomination decisions
are not made lightly nor by chance. On the contrary, these decisions reflect the

5. Designing the Empirical Analysis
140
perception of the likely success associated with each option (independent vs. party
nomination). For this reason, it is especially interesting to include the case of party men
deciding to run as independents because their case is even more revealing of strategy.
As for the operationalisation and measurement of "success of independents", several
options are conceivable. This section shows advantages and limitations of several
plausible measurements of the dependent variable, and argues for the overall merits of
the chosen one. The first step in the process of selecting a way to operationalise the
dependent variable is to choose the unit of analysis. Should "success of independents"
be measured at the level of electoral districts, at the level of the units of the Russian
Federation (regions), or at the level of individual candidates? If candidates are the units
of analysis, the dependent variable can be measured as candidates' vote shares.
More precisely, to find factors of cross-district variability, only independent
candidates should form the sample and their electoral returns should be related to the
characteristics of the districts they run in, while controlling for the personal traits of
individual candidates (incumbency, campaign resources, …). Alternatively, both
independent and party candidates can be included in the sample in order to study the
effect of independent nomination on electoral returns and the variability of such effect
across districts. A problem with these two approaches is that electoral returns for an
individual candidate (the dependent variable) are directly and inversely related to the
score on the same variable for the other candidates running in the same district. This
violates the assumption of regression analysis that measurements on the dependent
variable should be independent from one another.101
One simple way to avoid this problem is to measure electoral success at the level of
electoral district. The choice of SMDs as units of analysis is also backed by the
substantive argument that electoral competition occurs at this level -votes are counted
at, and results apply to, the level of district. Indeed, a candidate's vote share has little
substantive meaning when abstracted from the district he runs in.102
Moreover, the
concern of this study is to explain cross-district differences in independents' success.
Thus, the choice of district as the micro-unit of analysis can be supported by the
101
Golosov has addressed this problem by taking into account the success of the challengers faced by
each candidates (Golosov 2000), but this does not seem to solve the issue. 102
Moreover, several variables discussed below (explanatory or control variables) are aggregated at the
level of district.

5. Designing the Empirical Analysis
141
consideration that "the different levels of analysis permit different questions to be
addressed and lead to different understandings" (Erikson et al. 2002: 11).
The limitation of taking districts as the unit is that all conclusions of the analysis will
refer not to voters but to districts showing this or that aggregate characteristic of voters.
The dependent variable is the district aggregate vote for independents, rather than
individual voter's preferences. This implies a "shift of meaning" from individuals to
SMDs (Hüttner 1981, in Snijder and Bosker 1999: 13) and is related to the problem of
"ecological fallacy", which warns against inferring individual voters' behaviour from
patterns observed at the aggregate level (Robinson 1950). However, conclusions
generated at the aggregate level have a legitimate purpose in their own right, as they
answer specific questions about aggregate phenomena. In other words, since Emile
Durkheim, a strong case can be made that social phenomena are not always strictly
reducible to methodological individualism. One recent study has reminded us that
“political behaviour is social; groups of people interacting with one another do things,
which are different from what would have occurred from the summation of atomized
individuals” (Erikson et al. 2002: 10).
If "independents' success" is a property of districts, how is it measured at this level?
Determining the unit of analysis narrows down the range of plausible measurements of
the dependent variable, but such range is still rather wide. To help visualise the options,
Table 5.1 presents an example of district electoral returns. Pros and cons of the main
possible measurements are reviewed:
Table 5.1: Example of district
electoral results (SMD 32, 1999)
Candidate Nomination Vote share (%)
A Party 40.26
B Indep 35.57
C Indep 6.96
D Party 3.62
E Indep 2.60
F Party 2.49
Against all 4.73% Invalid votes 3.80 %

5. Designing the Empirical Analysis
142
A) The district winner
One intuitive strategy would be to focus on the district winner. If he/she is an
independent, then independents are "successful" in the SMD. If the winner is a party
candidate, independents are "unsuccessful", as in the example of Table 5.1. This
measurement of the dependent variable equates "success" of the independents with their
winning the district seat. This has the advantage of being a very intuitive and
consequential notion of success. On the other hand, this measurement is not free from
limitations, as it overlooks a great deal of information on the candidates who run in the
SMD but do not happen to win.
In multicandidate districts like Russia's the average number of candidates has been
around 7, 12 and 10 in the three elections, with several SMDs having over 15
candidates). If attention is focused on the SMD winner only, this implies a rather large
loss of information. Imagine that a party candidate wins the seat with 30 percent of the
vote, but that the remaining 70 percent goes to the independents. In such case, it seems
interesting to understand why 70 percent of the voters preferred independent candidates,
even though this vote did not translate into a victory for any of them.
B) Highest ranking
A measurement that takes into account some information beyond the district winner is
the highest ranking obtained by any independent in the given SMD. In the example
provided by Table 5.1, this would take the values of 2 (i.e. the best position achieved by
independents is a second place). Thus, even though the district winner in Table 5.1 is
not an independent, this measurement does reflect the fact that independents performed
rather well. However, there are three problems with this measurement:
Firstly, comparison across districts is problematic. Two districts may both score 2
(i.e. a second place is the highest rank achieved by independents), but at the same time
they may have very different numbers of candidates -one district may have ten
candidates running, the other only two. In this case a score of 2 would mean very
different things in the two districts.
Secondly, it does not reflect the level of support that is associated with a given
ranking. A second place could be associated with any vote share between 0 and 49.9
percent.

5. Designing the Empirical Analysis
143
Thirdly and similarly to the previous one, this measurement discards a great deal of
information on the other independent candidates running in the SMD. One independent
(the most successful) may achieve a second place, but the others may turn out to be 9th
and 10th
.
C) Average ranking
The third limitation of measurement B is partially avoided if one considers the average,
instead of the highest, ranking reached by the independents. In the example of Table
5.1, this would be (2+3+5=10, 10/3=) 3.3. As an average, this does take into account the
ranking of all independents. However, it is subject to the first two limitations of
measurement B. It is insensitive to the number of independent candidates running (for
example a score of 3 can be obtained both where only four candidates run, and where as
many as 8 do, thus overlooking a substantive difference); and there is no way to gauge
the level of support (vote share) associated with a given score. Moreover, it only
marginally improves the third problem of measurement B, as it is insensitive to the
"spread" around the mean of the ranking of individual independents.
D) Total vote share
A measurement that takes into account the level of support of all the independents in the
district is the total of their vote shares. In the example of Table 5.1, this variable takes
the values of 45 percent (i.e. the sum of the vote shares received by independent
candidates B, C and E). In comparison to other measurements, this has the advantage of
using information related to all independents running in the SMD. It also offers a quick
measure of whether independents or party candidates received a majority of the vote in
the district. However, measurement D also has a limitation in its comparability across
districts. For example, a large value of measurement D can be due to 1) a few strong
candidates, or 2) a large number of electorally marginal independents. In other words,
the measurement is insensitive to the concentration of the vote for the independents.
Indeed, equating the two scenarios may seem counterintuitive, as independents'
success seems to be greater in situation 1) than in 2). However, this is not necessarily
the case, as one can argue that what counts is the total share of the district voters who
prefer independent to party candidates, regardless of how well such voters and

5. Designing the Empirical Analysis
144
candidates co-ordinate and concentrate their votes. This view seems best grounded for
the present purposes. To see the advantages of this measurement compared to just
looking at the district winner, Map 5.1 (above) can be contrasted to Map 1.1 in the
Introduction to the thesis. The former clearly conveys a greater deal of information and
detail.
Map 5.1: Measuring the success of independent candidates as total vote share, 1995
As it appears from the above discussion, the selection of a measurement for the
dependent variable implies some degree of subjective judgement over the notion of
"electoral success". No measurement is free from a degree of subjectivism. Among
plausible measurements, D seems the best suited to investigate cross-district differences
in independents' support. It improves on key flaws of other measurements by taking into
account a great deal of information on all independents in the district. Its limitation -
insensitivity to the level of concentration of the vote for independents- is tolerable given
the underlying notion of electoral success that is chosen in this study.

5. Designing the Empirical Analysis
145
5.2 Case selection and data structure
Given the concept and measurement of "success of independents" and the choice of
districts as the unit of analysis, described above, which cases should be selected for
analysis? That is, which districts (SMDs) should be considered? The question is
relevant because, in a number of SMDs, independents did not run at all,103
while in
others only independents did.104
One strategy would be to drop the cases where either only independents or no
independents at all stood for election. This, however, is not acceptable because it would
entail a great loss of valuable information. Indeed, the fact that the candidate supply of a
district is so skewed in either direction (party or independent) is, on average, a symptom
of the fact that the district is deeply unfavourable to either party or independent
candidates, which is precisely the kind of phenomenon this study seeks to explain. The
adopted strategy, therefore, is to include all SMDs for which official results are
available.105
By doing so, it should be acknowledged that the adopted understanding of
“success of the independents” is somewhat stretched to include the notion that total
absence and total presence of independent candidates denote extreme low and extreme
high “success”, respectively. This is consistent with the focus of the inquiry being on
“what factors make districts favourable/unfavourable to the independents”. As seen in
chapter 3, some of these factors operate directly, while others also have an effect on the
entry decisions of party and independent candidates. Excluding cases with only/no
independents would prevent that second element of the analysis.
In the analysis, such complexity of the causal order posited by the explanatory
framework (chapter 3) will be taken into account. In particular, statistical tests have to
reflect the fact that such region-level explanatory variables as regionalist assertiveness
and geographic accessibility have both direct and mediated effects on the independents’
103
There were 10, 5 and 3 districts with no independent candidate in 1993, 1995 and 1999, respectively. 104
This occurred in 22, 2 and 5 SMDs in 1993, 1995 and 1999, respectively. 105
In 1993, the election did not take place in the five districts of the Republic of Tatarstan, where the
authorities boycotted the vote, and in the only district of Chechnya (N = 219). In 1995 elections were held
in all 225 districts, while in 1999 the Chechen war meant that the election could not take place in the
Chechen district (N = 224). In some districts the election was invalid, and was repeated several months
later, because the option "against all" received a plurality of the votes. These districts are included in the
analysis. To take the repeat election instead, would mean to abstract from the context of the election
campaign, which would make these races less than comparable to the rest (the number of contestants is
generally low and there is hardly any party candidate running repeat elections).
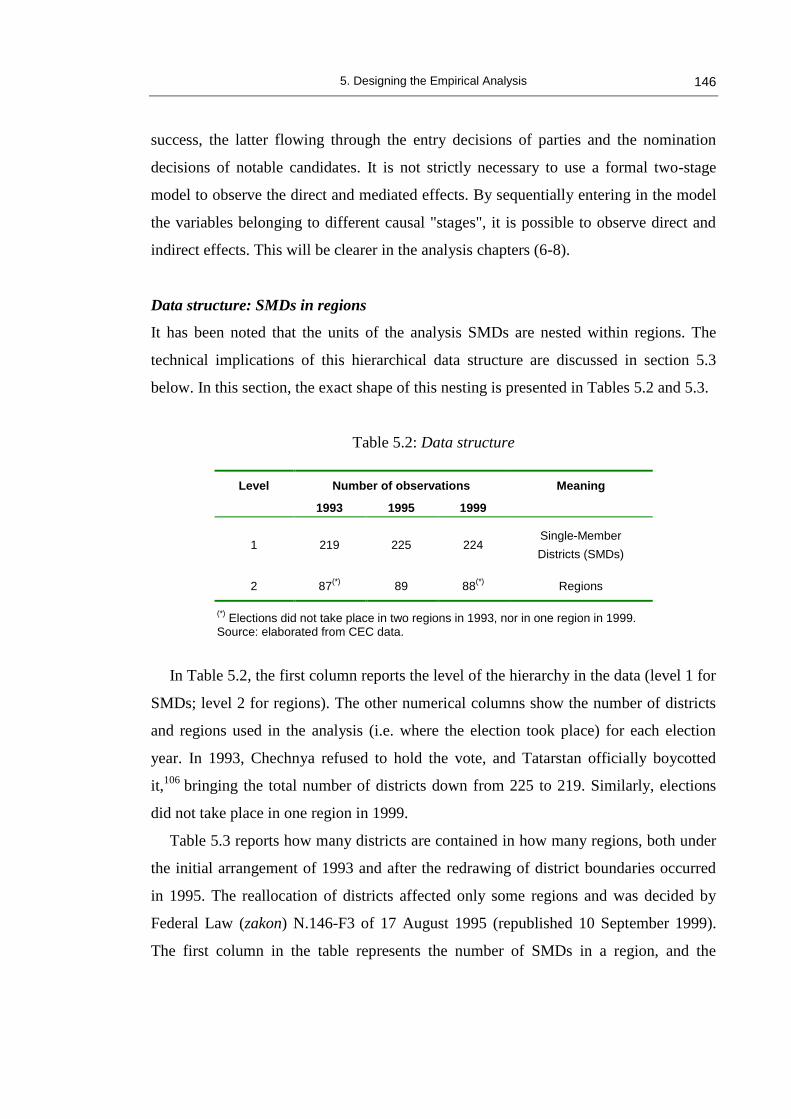
5. Designing the Empirical Analysis
146
success, the latter flowing through the entry decisions of parties and the nomination
decisions of notable candidates. It is not strictly necessary to use a formal two-stage
model to observe the direct and mediated effects. By sequentially entering in the model
the variables belonging to different causal "stages", it is possible to observe direct and
indirect effects. This will be clearer in the analysis chapters (6-8).
Data structure: SMDs in regions
It has been noted that the units of the analysis SMDs are nested within regions. The
technical implications of this hierarchical data structure are discussed in section 5.3
below. In this section, the exact shape of this nesting is presented in Tables 5.2 and 5.3.
Table 5.2: Data structure
Level Number of observations Meaning
1993 1995 1999
1 219 225 224 Single-Member
Districts (SMDs)
2 87(*)
89 88(*)
Regions
(*) Elections did not take place in two regions in 1993, nor in one region in 1999.
Source: elaborated from CEC data.
In Table 5.2, the first column reports the level of the hierarchy in the data (level 1 for
SMDs; level 2 for regions). The other numerical columns show the number of districts
and regions used in the analysis (i.e. where the election took place) for each election
year. In 1993, Chechnya refused to hold the vote, and Tatarstan officially boycotted
it,106
bringing the total number of districts down from 225 to 219. Similarly, elections
did not take place in one region in 1999.
Table 5.3 reports how many districts are contained in how many regions, both under
the initial arrangement of 1993 and after the redrawing of district boundaries occurred
in 1995. The reallocation of districts affected only some regions and was decided by
Federal Law (zakon) N.146-F3 of 17 August 1995 (republished 10 September 1999).
The first column in the table represents the number of SMDs in a region, and the
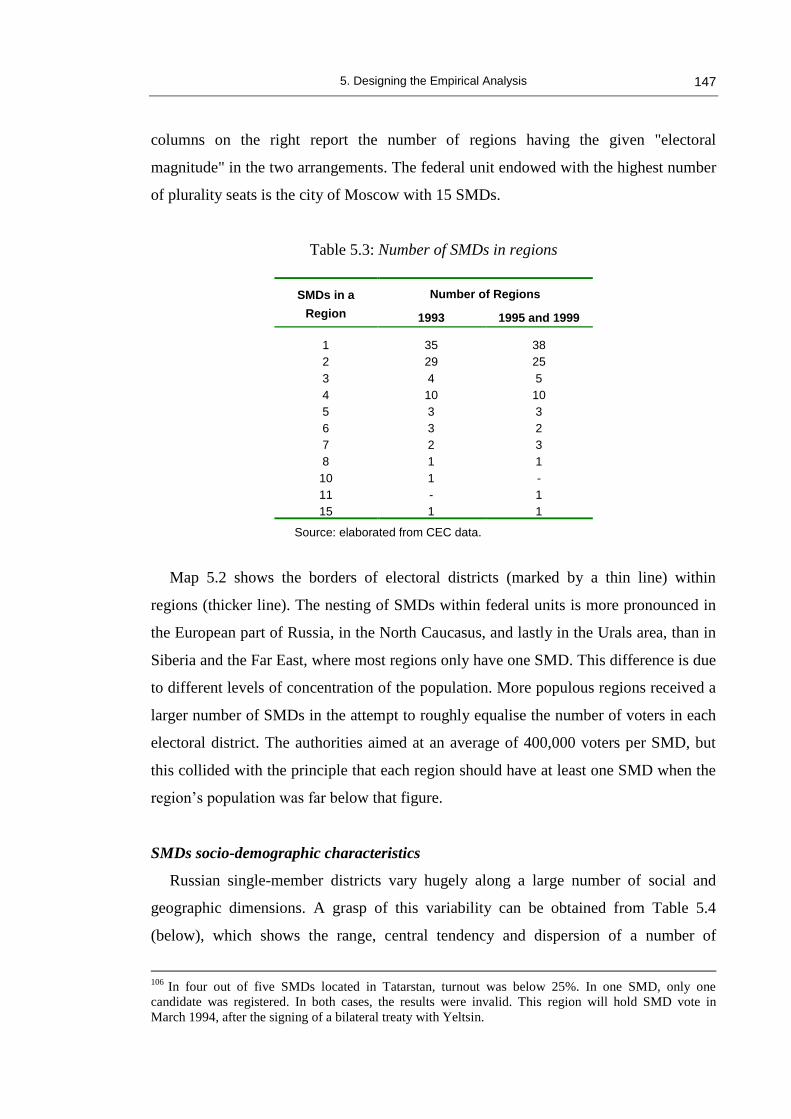
5. Designing the Empirical Analysis
147
columns on the right report the number of regions having the given "electoral
magnitude" in the two arrangements. The federal unit endowed with the highest number
of plurality seats is the city of Moscow with 15 SMDs.
Table 5.3: Number of SMDs in regions
SMDs in a
Region
Number of Regions
1993 1995 and 1999
1 35 38
2 29 25
3 4 5
4 10 10
5 3 3
6 3 2
7 2 3
8 1 1
10 1 -
11 - 1
15 1 1
Source: elaborated from CEC data.
Map 5.2 shows the borders of electoral districts (marked by a thin line) within
regions (thicker line). The nesting of SMDs within federal units is more pronounced in
the European part of Russia, in the North Caucasus, and lastly in the Urals area, than in
Siberia and the Far East, where most regions only have one SMD. This difference is due
to different levels of concentration of the population. More populous regions received a
larger number of SMDs in the attempt to roughly equalise the number of voters in each
electoral district. The authorities aimed at an average of 400,000 voters per SMD, but
this collided with the principle that each region should have at least one SMD when the
region’s population was far below that figure.
SMDs socio-demographic characteristics
Russian single-member districts vary hugely along a large number of social and
geographic dimensions. A grasp of this variability can be obtained from Table 5.4
(below), which shows the range, central tendency and dispersion of a number of
106
In four out of five SMDs located in Tatarstan, turnout was below 25%. In one SMD, only one
candidate was registered. In both cases, the results were invalid. This region will hold SMD vote in
March 1994, after the signing of a bilateral treaty with Yeltsin.

5. Designing the Empirical Analysis
148
geographic and social indicators across the SMDs, elaborated from data presented in
McFaul, Petrov and Ryabov (2000: 565-72). In terms of territorial size, SMDs range
from 0.6 (a district in St. Petersburg) to 3100 Km2
(SMD 20, the whole Sakha
Republic), with a mean of 83 Km2
and a standard deviation of over 257. This variability
is even wider than the one observed in the territorial size of Russian units of the
Federation.
Map 5.2: SMDs in Regions. European Russia, the Urals and North Caucasus
Electoral districts also vary widely along several social indicators, such as size of the
electorate, level of urbanisation, ethnic composition. In terms of population and
electorate living in a district, SMDs range from the minimum of the Evenk Autonomous
Okrug (SMD 224) with less than 25,000 residents (and 12,400 registered voters), to the
maximum of a district in the Komi Republic (17), with 1,250,000 population (768,000
voters).
It is evident that Russian SMDs are entirely different from SMDs in smaller and
more territorially homogeneous countries. In the UK, for example, where all House of

5. Designing the Empirical Analysis
149
Commons MPs are elected in as many as 659 districts, SMDs on average include only
69,932 voters (ranging from a maximum of 103,480 to a minimum of 50,690 voters). In
terms of territory, the largest SMD, which coincides with the territory of Sakha
Republic, extends over an area larger than the whole UK, although with an extremely
law population density.
In Russia, the percentage of district population living in urban vs. rural areas also
varies noticeably from SMD to SMD. In the least urbanised SMD, coinciding with the
Ust-Ordynskiy Buryat Autonomous Okrug (SMD n.220), over 80 percent of the
population live in rural areas (the most urbanised SMD are, of course, those wholly
belonging to large cities - 100 percent urban).
Table 5.4: Variability of sociological characteristics of SMDs
Te
rrit
ory
(K
m2)
Po
pu
lati
on
(1
00
0s
)
%
Ele
cto
rate
%
Urb
an
po
p
%
Ru
ral
po
p
%
Yo
un
ge
r
th
an
14
*
%
Old
er
th
an
60
*
%
Hig
he
r
ed
uc
ati
on
*
%
Ru
ss
ian
s*
Mean 83.6 662.5 466.6 72.5 27.4 15.3 16.4 11.1 80.7
St.Dev. 256.2 182.1 125.4 20.8 20.8 2.6 5.0 6.0 19.2
Max 3103.2 1250.8 768.4 100.0 81.4 24.9 27.9 26.6 97.8
Min 0.6 24.8 12.4 18.6 0.0 11.1 1.4 4.1 2.4
*1989 Census. Source: own elaboration of data in McFaul, Petrov and Ryabov (2000: 565-72).
Data on a number of individual social traits is also available at the aggregate level of
SMDs. These include the age structure of the population, its levels of education and its
ethnic composition, although this information dates back to the 1989 national census.107
According to this data, the "youngest" SMDs of the Federation are SMD n.10, in the
Republic of Daghestan, with about one quarter of its population less than 14 years of
age, and SMD n.223, in the Chukotka Autonomous Okrug, with the smallest share of
residents older that 60, 1.4 percent.
The "oldest" SMDs, by contrast, are located in Tula Oblast (176), with only 11
percent of its residents below 14 years of age, and in Ryazan Oblast (150), with almost
28 percent aged 60 or above. As for education, the proportion of highly educated
inhabitants ranges the Moscow value of 26.6 percent, to the 4.1 percent of SMD n.12 in
107
Data from the 2002 census is not yet publicly available at the time of writing.

5. Designing the Empirical Analysis
150
Ingushetiya Republic. Finally, the share of ethnic Russians ranges from the 98 percent
of a district in Lipetsk Oblast (n.101) to the 2.4 percent found in the Daghestan
Republic (n.10).
5.3 The study of context
This chapter has established that the basic unit of analysis of this investigation is the
electoral district, the level of aggregation at which the dependent variable is measured.
It has also emerged that districts are grouped within regions, thus producing a nested or
"hierarchical" data structure. In the terminology of hierarchical data structures, districts
therefore represent level-1 units and regions are level-2 units. It can also be said that
regions constitute the context of districts.
In recent years, the field of electoral studies has become more and more aware of the
impact of context (Marsh 2002). One of the first works on British elections aimed at
explaining sub-national variations is Butler and Stokes (1974, chapter 6), while the first
important statistical treament by means of multilevel modelling is due to Jones,
Johnston and Pattie (1992). The great majority of such works takes individual voter's
behaviour (observed through opinion surveys) as the unit of analysis and different
higher-level units as context (neighbouhoods, counties, regions, etc.). The fact that this
study instead takes district aggregate results as level-1 units and regions as level-2 units
doesn't fundamentally alter the logic of contextual analysis.
In practice, vote patterns can change across regions (across contexts) simply because
of "compositional effect", for example labour vote can be expected to be higher in
regions where working class voters are more numerous. In this case, controlling for
working class presence will "explain context away" because contextual differences are
simply due to different "compositions" of regions in terms of working class residents.
Clearly, these compositional effects are not properly contextual because they can be
reduced to lower-level variables.
Contextual effects, in a more rigorous sense, can be of two types: 1) effects produced
by the aggregation of lower-level characteristics, when the effect cannot be explained in

5. Designing the Empirical Analysis
151
terms of mere composition (e.g. neighbourhood effect, contagion effect -see below); and
2) factors genuinely applying at the higher (contextual) level.
In the first case, the contextual factor is a summary measure of lower level
characteristics and can be disaggregated back to its original individual level. A
neighbourhood effect, for example, is posited when middle-class voters vote for Labour
in predominantly working class districts. According to the neighbourhood effect
hypothesis, this occurs because, where a majority of district voters are workers, even
non-workers will be exposed, in their daily exchanges with their neighbours, to
information flaws in which the Labour Party is seen favourably. This leads to greater
returns for Labour than one would expect in terms of mere working class composition
of the district. In sum, contextual effects of the first type derive from the spatial
concentration of individual characteristics and individual "behaviour is contingent upon
the environment created by the aggregation of individual traits" (Johnson, Phillips
Shively and Stein 2002: 221).
The second type of contextual effect is directly measured at the context level, and not
aggregated from lower level units. Indeed, this type is called "global" effect because it
cannot be disaggregated to lower level units. In the explanatory framework of this
thesis, for example, regionalist assertiveness or central political appeasement can be
considered global contextual effects. They apply at the level of region, and are not
aggregate measures of district characteristics.
It should be noted that, contrary to the political geographer (e.g. O'Loughlin 2003),
the political scientist is generally sceptical of the thesis that "context matters" per se and
that location in a given environment affects individual behaviour in its own right, as
with the neighbourhood effect (King 1996). The political scientist aims at "explaining
context away". For example, if voters behave differently across regions it must be
because of some regional characteristic that is generalisable (e.g. level of urbanisation);
this may act directly on the dependent variable or be mediated by some other lower-
level characteristic. Once the factor responsible for cross-context variation is found,
context, in the geographical sense, is not a factor anymore and the contextual effect is
simply compositional.
According to this view, it is useful to insert a variable for context, usually a series of
dummy variables coding location in one-level OLS regression. This is done in order to

5. Designing the Empirical Analysis
152
avoid the missing variable bias (i.e. error term correlated with the dependent variable)
when it is not clear which factors lie behind cross-context variation. For example, after
all independent variables supported by theory have been entered into a model, part of
the variance of the dependent variable may still be significantly related to location. If
there are no clues as to what makes different locations affect the dependent variable, it
is necessary to insert location as a categorical variable. Context, in this sense, is a
residual category for unspecified and unknown effects. It does not mater per se.
On the other hand, the geographer has a quite different mind frame. Here, context
matters per se, not as the carrier of some yet-to-specify hidden variable. A typical
example of the purely contextual effect investigated by the geographer is the
"neighbourhood effect" mentioned above. These effects are generated by the spatial
concentration of lower-level characteristics and go beyond the effect one would expect
on the basis of composition.
In this thesis, SMD results are seen within the wider context of regional politics
(centre-regional relations, in particular). The SMD is the unit and the region is the
context. The effects that apply at the level of regions are global contextual effects in the
sense defined above. Context does not matter per se, but only as carrier of a global
effects (regionalist assertiveness and others). At the same time, this study shares the
geographer's concern for the statistical implications of contextual effects, something that
recently is finding its way into political and electoral studies as well (Marsh 2002).
These technical implications for statistical analysis are discussed in the next section.
Quantitative technique: Multilevel modelling
Since the late 1980s the question of how to best treat nested data structures has found an
increasingly popular answer in multilevel modelling. This technique has been originally
applied to geographical or educational studies, then finding application in virtually all
scientific fields, wherever the analyst deals with multilevel data. The simplest multilevel
data structure involves two levels, such as in the case of this thesis. The units of analysis
(here SMDs) are called "level 1 units", and the higher level groups (regions) are called
"level 2 units".
Recent introductory to intermediate works that explain the advantages of multilevel
modelling over conventional techniques include Snijder and Bosker (1999),

5. Designing the Empirical Analysis
153
Steenbergen and Jones (2002), Stoker and Bowers (2002), Bryk and Raundenbush
(1992). As mentioned, one of the first comprehensive applications to electoral data is
Jones, Johnston and Pattie (1992). The basic advantage of multilevel modelling over
other techniques is that it solves the problem of "autocorrelation" that may arise when
the data structure is nested. Autocorrelation, or "intra-class correlation", refers to the
similarity of units belonging to the same group. This occurs with stratified or cluster
sampling, when individuals sampled from the same higher-level unit are subject to the
same group influence. But it can also be present whenever the data structure is nested
and there are reasons to expect contextual effects.
Autocorrelation means that the error terms of the units belonging to the same groups
are correlated. This violates the assumption that error terms are independent, which lies
at the basis of conventional techniques such as the Analysis of variance (Anova) and
OLS regression. If the latter techniques are employed in the presence of autocorrelation,
the standard errors of the estimated coefficients will be underestimated, thus leading to
overestimate the level of significance of the main effects.
The formula for the coefficient of autocorrelation (ρ) corresponds to the proportion
of total variance occurring between level 2 units. The higher this value, the more similar
the level 1 units within groups:
ρ =
Variance between level 2 units
Total variance
The most widely used conventional method to take into account the multilevel nature
of the data used to be entering a series of dummy variables, one for each context or level
2 unit (except the dummy for the base category, if the constant is in the model). This
method is often called analysis of covariance (ANCOVA). It solves the autocorrelation
problem but has two important limitations compared to multilevel modelling. The first
limitation is that dummy variables indicate contexts, but do not allow an explanation of
the differences across contexts (Snijders and Bosker 1999: 42; Steenbergen and Jones
2002: 221). This is because the dummy indicators for level-2 units already "absorb" all
variability linked to that level. On the contrary, it is often interesting to test the effect of
level-2 variables, which requires the presence of unexplained variability across level-2
units. Multilevel modelling allows the use of random coefficients for level-2 variables,

5. Designing the Empirical Analysis
154
whose effect can be estimated and tested. This is of crucial importance for this thesis, as
level-2 factors (such as regionalist assertiveness) are at the centre of the explanatory
framework of this inquiry.
The second limitation of ANCOVA (and the advantage of multilevel modelling)
emerges when level-2 units only contain relatively few level-1 units, as in the present
case, and when the additional assumption of "exchangeability" among level-2 units can
be made (Snijders and Bosker 1999: 43-44). Formally, this assumption requires that
level-2 effects are independently and identically distributed. "Stated less formally: the
unexplained group effects are governed by 'mechanisms' that are roughly similar from
one group to the next, and operate independently between the groups" (Snijders and
Bosker 1999: 43). If this is the case, level-2 effects are treated as belonging to one
distribution, which "helps counteract the paucity of the data that is implied by a
relatively small" size of level-2 units (Snijders and Bosker 1999: 43). On the contrary,
with dummy variables, each context is independent from the other, rather than coming
from one distribution, it is like running n separate models, one for each context. Finally,
if there is a high number of level 2 units, the dummy variable approach requires a
correspondingly high number of variables, which is "not very efficient nor
parsimonious" (Hox and Kreft 1994: 287).
Given the same assumption of "exchangeability" and of normality for the
distributions of random coefficients, multilevel modelling also efficiently deals with
"imbalance" in the data, which arises when level-2 groups have different sizes. Indeed,
the estimation procedure of multilevel software, the RIGLS procedure in the present
case,108
takes into account the fact that information is not equally present in all level 2
groups. It weights down the contribution to the estimation of coefficients made by small
level 2 units when they show extreme values.
To sum-up, in the present case, multilevel modelling allows one to study the effect
on level-1 variables (here, success of the independents) of independent variables that
can be either other level-1 variables (e.g. incumbency) or level-2 variables (e.g. support
of regional governor). It also allows the estimation of interactions between level-1 and
108
The estimation procedure utilised in the following chapters of analysis is called "Restricted Iterative
Generalised Least Squares" (RIGLS). This procedure, introduced by Goldstein, is somewhat slower but
more precise than the alternative provided in MLwiN, "Iterative Generalised Least Squares" (IGLS)
(Goldstein 1986).

5. Designing the Empirical Analysis
155
level-2 variables. All these advantages are achieved while taking into account the
hierarchical structure of the data (Stoker and Bowers 2002: 241).
The general characteristics and equations for multilevel models are as follows. If the
data structure is two-level hierarchical, with level-1 units nested within level-2 groups
(e.g. SMDs nested in regions), the micro model with two fixed predictors can be written
as:
Ŷij = β0x0 + β1x1ij + β2 x2ij + ij (1)
Where the indexes i and j represent level-1 units and level-2 units, respectively. For
brevity, in this section, level-1 units (SMDs) will be referred to simply as "units" and
level-2 units (regions) as "groups". Ŷij indicates the estimated value of the dependent
variable for each unit. Ŷij is a linear combination of the constant x0 ; two independent
variables x1ij + x2ij (i and j indexed, i.e. measured at the level of units); and the residual
"unexplained" variance around predicted values, ij, also measured at unit level.
In this hypothetical model all variables can take different values for each observed
unit, as indicated by their i and j indexes, but the effects (coefficients) of the variables
are fixed. Indeed, the coefficients are not i and j indexed and represent the average
effect across all units. This is the approach of conventional, one-level, OLS regression.
In this model, the residual term ij is considered "error", a nuisance, the amount of
variability around predicted values Ŷij that the model cannot "explain".
Multilevel modelling is still regression-based, but aims at explicitly modelling the
residual variance ij. Instead of considering it "error", it investigates whether this
variability has structure that can be accounted for by allowing the coefficients for the
constant and the predictors to vary across level-2 groups.
In its simplest form, a multilevel model only includes the constant (or "intercept") as
predictor. This model is called the "Null model" because no predictors are entered. We
can write this model as:
Ŷij = β0ij (2)
The j and i indexes indicate that the parameter is allowed to vary across groups and
across units within groups. It therefore equals a fixed value β0 (the "grand mean" or the
mean Y value across all units, in all groups), plus a group-specific differential μ0j, and a
unit-specific differential e0ij:
β0j = β0 + μ0j + e0ij (3)

5. Designing the Empirical Analysis
156
When, in addition to the constant, the effect of one of the independent variable is also
allowed to be random (i.e. to be estimated), the coefficient for this variable takes the j
index (4):
Ŷij = β0j + β1jx1ij + β2 x2ij + ij (4)
In model (4) only the constant and β1j are random at level-2. In addition to the macro
model for the constant (3), another one can be written in which the coefficient of x1 is
the dependent variable:
β1j = β1+ μ1j (5)
Where the coefficient (slope) of the independent variable x1 is the result of the fixed,
average effect, plus a level-2 specific differential (μ1j). The result is a distribution of
coefficients (slopes). Both the constant β0j and the slope β1j are assumed to be normally
distributed random variables with mean equal to their fixed value (β0 and β1,
respectively), and with standard deviation equal to the square root of the variance of
their differentials (μ0j and μ1j, respectively).
Substituting (3) and (5) into (4) leads to:
Ŷij = β0 + μ0j + (β1+ μ1j)x1ij + β2x2ij + ij (6)
For clarity, on the right hand side of the equation, the fixed part of the model is usually
written first and the random part second:
Ŷij = β0 + β1x1ij + β2x2ij + μ0j + μ1j x1ij + ij (7)
The random part (μ0j + μ1jx1ij + ij) has two components, level-2 residuals (j indexed)
and level-1 residuals (i and j indexed). This division of the random part into two levels
is what makes the model a multilevel one. Because of the term μ1jx1ij (due to the random
slope), level-2 residuals are not independent of x, as assumed in conventional one-level
OLS, rather the variability around predicted values of Y (variance) varies for different
levels of x. This is known as heteroskedasticity. Level-2 variance can depend on x either
linearly (8) or quadratically (9):
Level-2 var (Yij x1ij) = var(μ0j) + 2cov(μ0j , μ1) x1ij (8)
Level-2 var (Yij x1ij) = var(μ0j) + 2cov(μ0j , μ1) x1ij + var(μ1) x1ij2 (9)
In this model, level-1 variance is simply var(ij). However, complex variability
(heterogeneity) can also be modelled at level-1 as a function (linear or quadratic) of x
(heteroskedasticity at level-1), when x is allowed to be random at level 1. In that case,

5. Designing the Empirical Analysis
157
the random part at level 1 will be (0ij + 1ij x1ij), and its linear and quadratic variance
functions will be (10) and (11), respectively.
Level-1 var (Yij x1ij) = var(0ij) + 2cov(0ij , 1ij) x1ij (10)
Level-1 var (Yij x1ij) = var(0ij) + 2cov(0ij , 1ij) x1ij + var(1ij) x1ij2 (11)
In addition to modelling heteroskedasticity, or complex variability, at level 1 and 2,
multilevel modelling allows the analyst to try and explain this variability. It has been
noted that the random, residual, part of a multilevel model has at least two parts, one for
each level. By entering additional level-1 and level-2 variables, it is possible to reduce
the residuals at that level-1 and at level-2, respectively. However, given the causal
framework to be tested here, the most interesting option is to try and explain why the
coefficients of variables random at level-2 vary across groups. In other words, if there is
significant variation in the effect of a variable across groups, a group-level variable
could be responsible. This means that the coefficients for the constant and for the x will
depend on this level-2 variable (W1j):
β0j = β0 + 1W1j + μ0j (12)
Β1j = β1+ 2W1j + μ1j (13)
Substituting (12) and (13) into (4), leads to:
Ŷij = β0 + 1W1j + μ0j + (β1+ 2W1j + μ1j)x1ij + β2 x2ij + ij (14)
…and re-arranging into fixed and random parts:
Ŷij = β0 + 1W1j + β1x1i+ 2W1jx1i + β2 x2ij + μ0j + μ1jx1ij + ij (15)
The random part is unchanged, compared to (7), while in the fixed part there is a term
for the main effect of the group-level variable (1W1j), and an interaction term
(2W1jx1i). This is the specification of a multilevel model with a cross-level interaction.
Such interaction can be entered and tested in the model to explain a significant
random slope of a level-1 variable. But it can also be entered when the level-1 variable
does not have a significant random slope, if there are substantive expectations of the
interaction (Snijders and Bosker 1999: 74-75).
From this review of the general features of multilevel modelling, three kinds of
specifications emerge as typical. Firstly, the most simple specification of the "Null,
random intercept model"; secondly, the specification with "random intercept and
random slope/s"; and thirdly, models with cross-level interactions. These types of
models are estimated for each of the three elections in the next chapters. In the present

5. Designing the Empirical Analysis
158
study the analysis is run with a software specifically designed for multilevel modelling,
MLwiN (version 1.10.0006). Among different types of software specifically designed
for multilevel modelling, MLwiN is the "most extensive multilevel package" (Snijders
and Bosker 1999: 243).109
Conclusion
This chapter has completed the presentation of the information that is preliminary to the
statistical models discussed in the next chapters. This task has involved several steps.
Firstly, it was necessary to explain the reasons behind the adopted operationalisation of
"independents' success", the dependent variable. Four possible measurements of this
dimension have been discussed and the case has been made for choosing the measure
consisting of the joint vote share received collectively by the independents in a given
SMD.
Secondly, the arguments for taking the electoral district as the unit of analysis and for
an inclusive strategy of case selection have also been presented. All districts (for which
there are electoral returns) are included in the analysis. Furthermore, an appreciation of
the multilevel (or nested) nature of the data structure was crucial in order to understand
the connected statistical problems of autocorrelation, and the necessity for a relatively
new (in electoral studies) technique of quantitative analysis -multilevel modelling.
This section has argued for the substantive and technical advantages of this technique
over more conventional tools of quantitative analysis, such as one-level OLS regression.
The formal characteristics of the multilevel equations have also been illustrated. They
form the basis for the estimated models of independents' success discussed in the next
three chapters. Moreover, procedures have been suggested to deal with the complex
causal order, and the related mediating effects, posited by the explanatory framework of
chapter 3.
In the next chapter the first multiparty election of post-communist Russia is analysed
under the prism of the explanatory framework described in chapters 3, with the
operational definitions of chapter 4, and with the design outlined in this chapter. Due to
109
MLwiN is written by members of the London Institute of Education. Further information can be found

5. Designing the Empirical Analysis
159
problems in data availability for the 1993 vote, the empirical models will be tested in
their full extent with the analysis of the 1995 and 1999 Duma elections.
at the Institute's website (www.ioe.ac.uk).

160
6
The 1993 Duma Elections
"The logic of post-communist revolutions offers a
parsimonious and convincing explanation for the
defeat of Russia's Choice. However, this level of
analysis leaves several questions . . . unanswered
and cannot explain several important paradoxes of
the Russian case. . . . Why, for instance, did Russia's
Choice win only 27.1 percent of the popular vote in
Perm' oblast, but only 16.7 in Samara oblast, two
regions with similar economic profiles and
geographic location?"
Michael McFaul (1998: 132)
This thesis aims to contribute to solving the kind of "important paradox" that McFaul
highlights in the epigraph. In his essay, McFaul is concerned with explaining the defeat
of the pro-Kremlin party "Russia's Choice" in the PR tier of the 1993 Duma elections.110
By contrast, this thesis only deals with the SMD tier. However, the same kind of
paradoxes is also generated by spatial variations in SMD results.
This chapter is the first of three that put to test the explanatory framework presented
in chapter 3, with the data described in chapter 4 and the design outlined in chapter 5.
The first section provides the necessary background information on the political context
of the election. Subsequently, the estimated statistical models are presented. As detailed
in preceding chapters, the empirical analysis consists of predicting the joint vote share
obtained by the independent candidates running in each of 219 SMD. The statistical
technique adopted is multilevel modelling, with the SMD as the unit of analysis, and
explanatory variables applied at the level of both regions and SMDs. The main
hypothesis is that the independents constituted a better channel of representation for

6. The 1993 Duma Elections
161
territorial cleavages than political parties. Therefore, other factors being equal, these
candidates are expected to be more successful where territorial cleavages are prominent.
In the Russia of the 1990s, a territorial cleavage emerged in proportion to levels of
regionalist assertiveness (regional autonomy demands). This variable should provide a
significant contribution to the explanation of cross-regional variations in the success of
independent candidates. Due to data availability, compared to the 1995 and 1999
models, the analysis of the 1993 vote for the independents is carried out through a
simpler model specification, which only allows the testing of a subset of the hypotheses
included in the explanatory framework.
6.1 Background
The 1993 Duma vote was the first competitive election after the collapse of the Soviet
system, which means the first meaningful and competitive mass vote in Russian
history.111
However, the political context surrounding the vote was particularly difficult,
as the election was called at the end of a bitter institutional struggle between the
presidency and the parliament. The conflict, which had been escalating in the months
preceding the vote, was rooted in the unclear separation of power between the two
organs of federal government, and in the parliamentary opposition to the economic
reforms of the government. After a protracted period of confrontation and stalemate, on
September 21st, Yeltsin disbanded the assembly by decree and called for new elections
to be held on December, 12th
. The parliament building had to be stormed by armed
forces to prevail over several hundreds deputies who had resisted Yeltsin's decree. Some
opposition leaders had also called for popular action against the president.
Before the solution of the institutional conflict in late September, the date for Duma
elections had not been set, and was the subject of presidential-parliamentary
negotiations. The announcement of the Duma vote to be held on December 12th
gave
110
Cross-regional variations in support are not the primary focus of his essay, and McFaul does not
provide a satisfactory answer to the "paradox" he poses. 111
In November 1917, Russian citizens voted for the Constituent Assembly after the fall of the Tsarist
regime. The Assembly, however, was soon disbanded by the Bolsheviks, in January 1918.

6. The 1993 Duma Elections
162
parties only two and a half months to prepare. Six out of thirteen parties competing in
the proportional tier were founded in this short period.
For the voters, the hurried campaign was confusing for additional reasons, such as
the fact that candidates' party affiliation was not reported on the ballot paper. However,
mitigating this lack of information, 96 percent of SMD party candidates also appeared
in their party's PR list, almost always in the subsection of the region where they were
standing (Colton 1998: 21). Even if a candidate's party affiliation was known, "the value
of a party label [was] extremely uncertain: voters [did] not know what parties stand for
and leaders and candidates [did] not know if the party will be discredited or defunct by
the next election" (Smyth 1998: 469). Moreover, the informational cost that the voter is
required to bear in order to vote meaningfully was multiplied by the fact that, in
addition to the vote for the Duma, voters were asked to cast their vote for the election of
the higher chamber of the Parliament (the Federation Council), for the referendum on
the new constitution, and, in some cases, for the election of local organs.
The contestants
Political Parties had lacked the electoral incentives to organise and mobilise voters since
their legalisation in 1990, with the exception of the presidential election of 1991, when
Democratic Russia helped Yeltsin become president. By the time of the 1993 elections,
parties were little more than parliamentary factions, deprived of meaningful
organisations on the ground. Even the Communists (KPRF), who inherited the sizeable
local organisations of the Communist Party of the Soviet Union, were far less effective
than they would become in the next two years. In fact, the Communist party had been
banned by presidential decree in 1991, for its involvement in the reactionary August
putsch. On 30 November 1992, the Constitutional Court, while confirming the ban
against communist federal level organisations, denied that it could apply to local
branches. This ruling increased the fragmentation of the leftist political spectrum, and
spurred the emergence of the Agrarian Party (APR).
When the communist party was reinstated in February 1993 as the Communist Party
of the Russian Federation (KPRF), it took the shape of a loose association of diverse
regional organisations (Golosov 1999: 1336). Following the 1993 Autumn crisis, on 4
October, Yeltsin outlawed the KPRF again, together with other organisations (especially

6. The 1993 Duma Elections
163
right nationalist). The party was re-legalised at the end of October and joined the
electoral campaign (Colton 1998: 8, 12). In 1993, in any case, the KPRF did not yet
possess a solid organisation in many regions, where local branches were ridden by
internal conflicts. In Kursk oblast, for example, both independent communist or agrarian
candidates and official communist competed with each other in the same SMD in the
1993 Duma vote (Melvin 1998b: 507-8).
In the PR tier, thirteen parties managed to gather 100,000 signatures and appeared on
the ballot paper. Signatures had to be collected in at least seven different units of the
federation (i.e. no more than 15% in any single region).112
On the proportional half of
the ballot, the ideological spectrum of the contestants ranged from the pro-reform, and
pro-Yeltsin, Russia's Choice, sponsored by the Kremlin, to the nationalist Liberal
Democratic Party of Russia (LDPR) led by Zhirinovsky, and from the Communist Party
(KPRF) to the Agrarian Party of Russia (APR). More moderate pro-reform parties
included Yabloko and the Kremlin-supported "Party of Russian Unity and Accord"
(PRES), while centrist positions were advocated by the Democratic Party of Russia
(DPR), and by "Women of Russia". The remaining five parties on the ballot, i.e. the
industrialists' group "Civic Union", the ecologist KEDR and other smaller formations,
did not cross the 5% barrier of representation.
In the majoritarian tier of the election, 1520 candidates ran in 225 districts. However,
the election was boycotted in 6 SMDs, bringing the total to 219 (with 1502
candidates).113
Contrary to all following Duma elections, all political parties and
electoral blocs running in the PR tier, also nominated candidates in the SMDs, and all
parties running in the SMDs also ran in the PR tier. The total number of independent
candidates in the districts was 820 (54%), while party candidates made up the remaining
700 (46%). The ranking of parties according to their nomination effort in the SMDs is
reported in Table 6.1. It emerges that the best locally rooted parties were Yabloko, APR,
and Civic Union, in addition to the parties of the Kremlin, Russia's Choice and PRES.
112
This requirement will become stricter in 1995, when the minimum number of regions where signatures
should be collected will become 15 (i.e. no more than 7% of the signatures could come from any single
unit). 113
The election was not held in the one district of Chechnya and was boycotted in the 5 districts of
Tatarstan.

6. The 1993 Duma Elections
164
Table 6.1: Party nominations in the SMDs (totals)114
Party No. of Cands.
No. of Winners
Success Rate
Russia's Choice 103 25 24.3%
Yabloko 85 6 7.1%
Civic Union 72 7 9.7%
Agrarian Party of Russia 69 16 23.2%
PRES 63 3 4.8%
LDPR 60 6 10.0%
RDDR 59 5 8.5%
Democratic Party of Russia 58 1 1.7%
KPRF 55 10 18.2%
Russia's Future - New names 33 1 3.0%
KEDR 22 0 0.0%
Dignity and Charity 15 3 20.0%
Women of Russia 6 2 33.3%
Independents 820 134 16.3%
PRES, Party of Russian Unity and Concord. LDPR, Liberal Democratic Party of Russia. RDDR, Russian movement for democratic reforms. KPRF, Communist Party of the Russian Federation. KEDR, Constructive ecological movement of Russia. Source: elaborated from CEC data.
In comparison to trends that will become established later on, it is remarkable to note
that as early as 1993, the communists (KPRF) could nominate their candidates in only
half as many SMDs as Russia's Choice, or in a quarter of the total. By contrast, the
organisational strength of the agrarian APR was also suggested by the fact that it
presented the largest amount of signatures (500,000), in excess of the 100,000 required.
The average party only presented 170,000 signatures (Colton 1998: 17).
It is important to note that none of the parties registered for the 1993 elections can be
defined as a regionalist party. On the contrary, inaugurating a well-established pattern,
most parties in 1993 were based in Moscow and dominated by Moscow elites. With the
partial exception of PRES, party programmes advocated greater centralisation in federal
relations. Centralisation was proposed for different reasons, ranging from the right-wing
nationalistic position of the LDPR that entailed a strong, unitary state, to the
114
In 1993, some parties formally supported two candidates in the same SMD. The parties APR, Russia's
Choice, Civic Union, and RDDR did so in two SMDs each; while Yabloko, PRES, and DPR did so in one
SMD each. This means that, for those parties, the number of SMDs contested is lower than the number of
candidates supported.

6. The 1993 Duma Elections
165
paternalistic view of the "liberals" that ethnic regions cannot by themselves live up to
the standards of democracy. In 1993, the only party trying to appeal to the autonomy
aspirations of the regions was PRES. This can help explain the relatively good
performance of this party in highly assertive regions such as Bashkortostan in the PR
section of the vote (Hale 1998: 613). PRES may reasonably have represented the lesser
evil for regionalist voters compared to the centralising position of the other parties in the
PR section. However, in the SMDs, where voters usually have a choice not to vote for
any party and can prefer an independent, PRES did not fare very well. In Bashkortostan,
only one of the six winners was a PRES candidate, the rest being four independents and
one agrarian. Generally, in the SMD tier PRES only achieved three victories out of 62
SMDs contested.
Federal relations in the 1991-1993 period
Given the nature of the main hypothesis posited by the explanatory framework of this
thesis, an important element of the political context of the vote is represented by the
state of centre-regional relations. The salience of this dimension was heightened in 1993
by the fact that on the same day of the Duma vote, a new draft constitution was to be
approved in a national referendum. The “key sticking point" (Lapidus and Walker 1995:
98) during the process of constitutional drafting had been precisely that of centre-
regional relations. Indeed, of the three periods leading-up to the three Duma elections
analysed in this study, the 1991-1993 phase has been characterised by the highest levels
of fluidity in federal relations. This is not surprising in view of the fact that the collapse
of the Soviet system in 1991 dramatically opened-up the necessity of defining the
federal bargain anew.
In the last year of existence of the Soviet Union (1991), the government of what was
then called the Russian Socialist Federative Republic (RSFSR) could not afford
antagonising its internal units because it was struggling with the USSR government to
gain sovereignty. This phase was marked by the conflict between Yeltsin and
Gorbachev, which induced each side to outbid the other in an attempt to muster the
support of the ethnic republics within Russia.
Already in August 1990, during his visit to Tatarstan, Yeltsin pronounced his famous
statement that autonomous units should "take as much sovereignty as they can

6. The 1993 Duma Elections
166
swallow". His attitude began to change in view of the new Union Treaty promoted by
Gorbachev, and of the demands of assertive regions, such as Tatarstan, which demanded
to sign the Treaty with equal status as the RSFSR. Tatarstan also started boycotting
federal elections with the June 1991 Russian presidential election (Lapidus and Walker
1995: 84), continuing with the 1993 Duma elections.
Moreover, replicating the example of Union Republics, between July 1990 and July
1991, all autonomous formations within the Russian Federation declared their
sovereignty, including the four autonomous oblasts which will be upgraded to
"autonomous republics" in 1991. The pre-1993 period also saw explicit acts of regional
defiance towards federal authorities, such as the withholding of federal taxes, or the
issuing of separate surrogate money, in response to the shortages and chaos created by
the inflation of spring and summer 1992.
One of the arenas where regional regionalist assertiveness emerged most clearly is
the negotiations over the Federal Treaty (finally signed 12 March 1992) that was to
settle centre-regional relations and divide spheres of authority. While Chechnya and
Tatarstan refused to sign, thus expressing a radical anti-centralist position, some other
regions managed to extract special concessions in addenda to the treaty or in agreements
connected to it. Bashkortostan's signature to the treaty, for example, can be explained
with reference to the special rights it obtained from Moscow shortly before the signing.
These included the "right of ownership of natural resources on its territory, freedom to
engage directly in foreign economic transactions, and the right to an independent system
of taxation. Earlier, the Bashkortostan parliament had voted to suspend the jurisdiction
of the Russian Federation's new Constitutional Court on its territory" (Moscow News,
No.16, p.5, in Lapidus and Walker 1995: fn.24). Other units that were to obtain large
autonomy from secret addenda to the treaty include the Republics of Komi and Karelia.
Autonomous okrugs were given equal status to the oblasts, ending their formal
subordination to the regions in which they are located.
The Federal Treaty reflected a rather decentralised conception of federalism and
recognised extensive rights to the republics. On the other hand, this spurred the
resentment of ordinary regions, especially the net contributors to the federal budget,
which did not obtain special privileges with the treaty. Some oblasts formed inter-
regional associations, the most important being the associations of regions in the Urals,

6. The 1993 Duma Elections
167
in Siberia and in the Far East (Hughes 2002: 48). These inter-regional associations
contained the potential to develop into an arena for collective mobilisation vis-à-vis the
federal centre. Of eight such experiments, the "Great Urals Association" did have a
phase of high anti-centralist activation. Even though co-ordination ultimately failed, the
governor of Sverdlovsk oblast, Rossel, declared a Urals Republic. Similarly, other
oblasts, independently from the association they might have belonged to, self-declared
their republican status.
As in 1990-1991, also in 1992-1993 the bargaining position of the federal centre
towards the regions was weak, this time due to the mentioned executive-legislative
conflict. When the latter conflict ended with Yeltsin's victory, a degree of
recentralisation obtained with the disbanding of the federal parliament in October 1993,
as it spurred the disbanding of regional soviets and the dismissal of the regional
governors who had opposed the president, including Rossel (Petrov 1999: 59).
In the meantime, agreement on a new constitutional text was proving elusive due to
disagreements between republics on one side, and oblasts and krays on the other.
Tatarstan exited the negotiations disappointed by the reduction in autonomy that was
emerging from the draft text. The finalisation of a draft was precipitated by the abrupt
solution to the institutional conflict between the Russian presidency and the parliament.
As mentioned, Yeltsin forcibly disbanded the parliament, called for new parliamentary
elections and for a simultaneous referendum on the new constitution. Chechnya did not
hold the vote, and Tatarstan boycotted it. Some other assertive regions, such as Sakha
republic, did endorse the constitution, as a temporary solution and with qualifications,
by virtue of side deals struck with Yeltsin.
This brief and sketchy account only serves as an indication of the political problems
surrounding federal relations in the period leading-up to the 1993 Duma vote. In the
statistical models below the quantitative indicator of regionalist assertiveness derives
from Dowley index, as described in chapter 4. The effect of regionalist assertiveness
should be investigated while controlling for instances of central appeasement of
regional demands. It has been noted that in the period leading-up to the 1993 Duma
elections, key examples of appeasement are constituted by the granting, to selected
regions, of important privileges in order to induce them to sign the Federation Treaty of
March 1992. These regions are the republics of Bashkortostan, Kalmikiya, Karelia,

6. The 1993 Duma Elections
168
Komi and Sakha (Kahn 2002: 126; Treisman 1999: 34). Two other groups of regions
received appeasing concessions from the centre. Firstly, these are the Soviet-era
Autonomous oblasts whose status was upgraded to that of "republic" in 1991 (the
republics of Adygeya, Altay, Karachaevo-Cherkessya, and Khakassya), and, secondly,
the units whose Yeltsin-appointed head of regional administration was removed by
Yeltsin to appease local elites (Matsuzato 2000), which means Krasnodar Kray,
Krasnoyarsk Kray, Voronezh Oblast, and Pskov Oblast. These three sets of regions are
considered "politically appeased" in the models.
6.2 Analysis
It is important to recall from chapter 5 that the success of the independents (dependent
variable) is measured as the share of the district vote obtained jointly by all the non-
partisans.115
It follows that the unit of analysis is not the individual candidate, but the
electoral district (SMD). Moreover, while the models to follow are regression-based,
conventional single-level OLS regression is not a satisfactory quantitative tool in this
case, due to the nested data structure (SMDs are grouped within regions). This suggests
the need for a multilevel analysis, whose features have been discussed in chapter 5. This
technique allows one to partition the variance of the outcome into two portions,
occurring at the level of regions and at the level of SMDs. Variable coefficients (effects)
are allowed to be random (i.e. to be estimated) to account for such residual variability.
For this reason, the models in the tables below include a random part, in addition to the
conventional fixed part of single-level designs.
The operational definition of the independent variables was also treated in a
preceding chapter. Here, it should be remembered that regionalist assertiveness can be
measured with two variables, drawing from Dowley's data, based on two time periods of
different length preceding the vote. The variable labelled "Dow88-93" is an average of
assertiveness scores recorded over the wider time lapse (1988 to 1993), while "Dow92-
93" reflects evidence of assertiveness recorded in just the last two years before the vote
115
The merits of this approach compared to alternative ones are discussed in chapter 5.
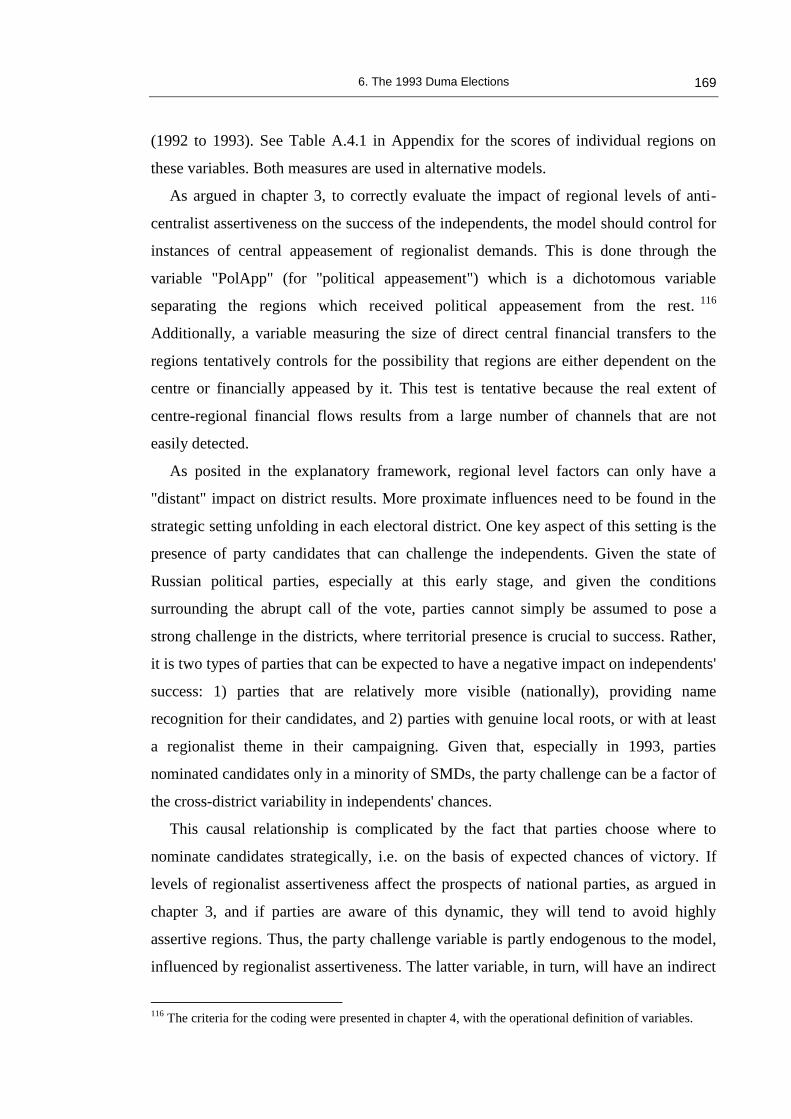
6. The 1993 Duma Elections
169
(1992 to 1993). See Table A.4.1 in Appendix for the scores of individual regions on
these variables. Both measures are used in alternative models.
As argued in chapter 3, to correctly evaluate the impact of regional levels of anti-
centralist assertiveness on the success of the independents, the model should control for
instances of central appeasement of regionalist demands. This is done through the
variable "PolApp" (for "political appeasement") which is a dichotomous variable
separating the regions which received political appeasement from the rest.116
Additionally, a variable measuring the size of direct central financial transfers to the
regions tentatively controls for the possibility that regions are either dependent on the
centre or financially appeased by it. This test is tentative because the real extent of
centre-regional financial flows results from a large number of channels that are not
easily detected.
As posited in the explanatory framework, regional level factors can only have a
"distant" impact on district results. More proximate influences need to be found in the
strategic setting unfolding in each electoral district. One key aspect of this setting is the
presence of party candidates that can challenge the independents. Given the state of
Russian political parties, especially at this early stage, and given the conditions
surrounding the abrupt call of the vote, parties cannot simply be assumed to pose a
strong challenge in the districts, where territorial presence is crucial to success. Rather,
it is two types of parties that can be expected to have a negative impact on independents'
success: 1) parties that are relatively more visible (nationally), providing name
recognition for their candidates, and 2) parties with genuine local roots, or with at least
a regionalist theme in their campaigning. Given that, especially in 1993, parties
nominated candidates only in a minority of SMDs, the party challenge can be a factor of
the cross-district variability in independents' chances.
This causal relationship is complicated by the fact that parties choose where to
nominate candidates strategically, i.e. on the basis of expected chances of victory. If
levels of regionalist assertiveness affect the prospects of national parties, as argued in
chapter 3, and if parties are aware of this dynamic, they will tend to avoid highly
assertive regions. Thus, the party challenge variable is partly endogenous to the model,
influenced by regionalist assertiveness. The latter variable, in turn, will have an indirect
116
The criteria for the coding were presented in chapter 4, with the operational definition of variables.

6. The 1993 Duma Elections
170
effect on the success of the independents, mediated by the strategic entry decisions of
political parties. This means that, in the estimated models, the coefficient of regionalist
assertiveness should drop when the party variables are entered.
Furthermore, party campaigning is hampered by climatic and geographic conditions
that make some voters more difficult to reach, thus improving the chances for the
independents and negatively affecting the endogenous variables for party challenge. The
physical accessibility of regions is rendered by the variable "Remote", for each region's
share of population located in remote areas, as defined in chapter 4. Finally, a variable
for urbanisation is considered to control for the traditional Rokkanian hypothesis that
political parties thrive in urban environments, before attempting to penetrate the
countryside. Due to 1993 data constraints, more variables and hypotheses will be
discussed in connection to the 1995 and 1999 elections.
A summary description of the distribution of the explanatory variables is available in
Table 6.2.117
Six variables have continuous or scale measurements. In the models, these
have been centred around their overall mean in order to allow for a meaningful
interpretation of the estimated coefficient of the constant and of the interaction terms in
the models.
The following section presents the estimated models and coefficients. The
presentation of statistical results follows several steps, through which increasing
complexity is introduced in the models by means of additional sets of variables. In this
way, it is possible to note the effect of the new variables on the coefficients of those
already included. Finally, random terms (beyond the constant) are considered in the last
specifications. It turns out that only the effect of "presence of a Russia's Choice
candidate" varies significantly across regions, therefore "RuChoice" is the only random
variable at level 2 and level 1 in the last model (model 5, Table 6.5). The last model is
the most complete possible with the available data. The multilevel equation of the
complete model is anticipated here to motivate the estimations of the models. The
equation includes all variables belonging to the explanatory framework discussed in
chapter 3 and follows the format of the general multilevel equation presented in the
previous chapter. The "micro model" is:

6. The 1993 Duma Elections
171
Ŷij = β0j (CONS) + β1 (DOW92-93)j + β2 (POLAPP)j + β3 (TRANSF)j
+ β4 (REMOTE)j + β5 (URBAN)ij + β6 (PRES)ij + β7 (LDPR)ij + β8 (APR)ij
+ β9j (RUCHOICE)ij + β10 (YABL)ij + β11 (DIGN&CH) ij + β12 (DPR)ij
+ β13 (CIVICUN)ij + β14 (KPRF)ij + β15 (KEDR)ij + β16 (WOFRUSS)ij
+ β17 (RUSFUT)ij + β18 (RDDR)ij + ij
Where the coefficients for CONS and RUCHOICE are random, thus requiring two
"macro models":
β0j = β0 + μ0j
β9j = β9 + μ9j + e9ij
Substituting the four macro models into the micro model, and rearranging with the fixed
part preceding the random part, the equation takes the following form:
Ŷij = β0 (CONS) + β1 (DOW92-93)j + β2 (POLAPP)j + β3 (TRANSF)j
+ β4 (REMOTE)j + β5 (URBAN)ij + β6 (PRES)ij + β7 (LDPR)ij + β8 (APR)ij
+ β9 (RUCHOICE)ij + β10 (YABL)ij + β11 (DIGN&CH) ij + β12 (DPR)ij
+ β13 (CIVICUN)ij + β14 (KPRF)ij + β15 (KEDR)ij + β16 (WOFRUSS)ij
+ β17 (RUSFUT)ij + β18 (RDDR)ij + μ0j (CONS) + μ9j (RUCHOICE)
+ e9i (RUCHOICE) + e19ij (No RUCHOICE)ij
The term e19ij (No RUCHOICE)ij is due to the fact that the dummy for Russia's Choice
is allowed to vary at level 1 and that "separate coding", instead of contrast coding, was
used to specify the variable.
117
The dependent variable, independents' success, has been described in the introduction to the thesis and
in chapter 5.

6. The 1993 Duma Elections
172
Table 6.2: Variables used in the models of the 1993 election, descriptive statistics
Hypothesis
Level
Variable Label
Type of Variable
Description
Categorical: Percent of cases (N)
Mean
Std. Dev.
Min.
Max.
Cases
Missing
Regionalist assertiveness
2 DOW88-93 Continuous Average score on Dowley's index based on 1988-93 observations
2.9 0.6 1.6 4.4 225 0
2 DOW92-93 Continuous As above but based on 1992-
93 observations 2.9 0.6 1.3 4.6 225 0
Appeasement 2 POLAPP Categorical Region received political
appeasement 0 86.2% (194) 225 0
1 13.8% (31) 2 TRANSF Continuous Financial transfers from Centre
to region 18.7 20.5 0 94.1 224 1
Geographic accessibility of region
2 REMOTE Continuous Percent of regional population living in difficult areas
0.1 0.2 0 1.0 224 1
Party challenge 1 KPRF Categorical Candidate nominated by
"KPRF" is running 0 75.6% (170) 225 0
1 24.4% (55) 1 LDPR Categorical Candidate nominated by
"LDPR" is running 0 73.3% (165) 225 0
1 26.7% (60)
Table continues on next page.

6. The 1993 Duma Elections
173
Table 6.2: continued. Hypothesis
Level
Variable Label
Type of Variable
Description
Categorical: Percent of cases (N)
Mean
Std. Dev.
Min.
Max.
Cases
Missing
1 YABL Categorical Candidate nominated by
"Yabloko" is running 0 62.7% (141) 225 0
1 37.3% (84) 1 WOFRUSS Categorical Candidate nominated by
"Women of Russia" is running 0 97.3% (219) 225 0
1 2.7% (6) 1 KEDR Categorical Candidate nominated by
"KEDR" is running 0 90.2% (203) 225 0
1 9.8% (22) 1 PRES Categorical Candidate nominated by
"PRES" is running 0 72.4% (163) 225 0
1 27.6% (62) 1 APR Categorical Candidate nominated by
"APR" is running 0 70.2% (158) 225 0
1 29.8% (67) 1 RUCHOICE Categorical Candidate nominated by
"Russia's Choice" is running 0 55.1% (126) 225 0
1 44.9% (101) 1 DIGN&CH Categorical Candidate nominated by
"Dignity and Charity" is running 0 86.4% (110) 225 0
1 13.6% (15) 1 RUSFUT Categorical Candidate nominated by
"Russia's Future" is running 0 82.8% (192) 225 0
1 17.2% (33) 1 DPR Categorical Candidate nominated by
"DPR" is running 0 66.1% (168) 225 0
1 33.9% (57)
Table continues on next page.

6. The 1993 Duma Elections
174
Table 6.2: continued. Hypothesis
Level
Variable Label
Type of Variable
Description
Categorical: Percent of cases (N)
Mean
Std. Dev.
Min.
Max.
Cases
Missing
1 CIVICUN Categorical Candidate nominated by "Civic
Union" is running 0 54.8% (155) 225 0
1 45.2% (70) 1 RDDR Categorical Candidate nominated by
"RDDR" is running 0 66.1% (168) 225 0
1 33.9% (57)
Control 1 URBAN Continuous Percent of population living in
urban centres 72.4 21.2 18.6 100.0 225 0
Note: in the models, all continuous variables have been mean-centred, in order to facilitate the interpretation of the constant.

6. The 1993 Duma Elections
175
The models
Tables 6.3-6.5 present the six estimated models (numbered 0 to 5) for the 1993
elections. In the tables, each column is devoted to one model, and the fixed part is
followed by a random part, as explained in the section on the general multilevel model
in chapter 5. The random part contains the variance in the success of independents
occurring at level 2 (regions) and, below, the variance occurring at level 1 (SMDs). It
should be remembered that, when there is only one random term at a given level, the
variance at that level is simply the variance of the random term. On the other hand,
when there is more than one random term, the variance is jointly defined by their
variances and covariances.118
In that case, it is not sufficient to look at the significance
of each individual term to determine whether the variance at that level is significantly
different from zero, and but a joint test is necessary. Such test is reported for the most
important and complete models. Furthermore, the conventional t-test for significance of
individual coefficients is only valid for fixed terms (those appearing only in the fixed
part).119
An "R" indicates that the term is random and that its significance cannot be
assessed with the t-test. Rather, the question becomes the significance of the overall
variance to which that variable contributes at a given level.
The simplest multilevel model presented in Table 6.3 is Model 0, the "Null Model".
This includes only the constant as predictor, which represents the overall, all-Russian,
mean success of the independents.120
In addition, because the constant is allowed to be
random at level 2 and level 1, it is possible to formally assess the variability of
independents' success across regions and across SMD/within regions, thus adding to the
impressionistic presentation of the spatial variability given in the introduction to the
thesis.
118
In the random part of models 5 and 6, the covariance terms are separated by "/" (e.g.
CONS/RUCHOICE is the covariance between the constant and "RUCHOICE"). Single terms in the
random part are individual variances. 119
For these, the conventional marking is reported to the right of the standard error in each column (* for
a t-value greater than 1.96 and statistical significance at the 0.05 level; ** for a t-value greater than 2.58
and significance at the 0.01 level; and, finally, *** for a t-value greater than 3.28 and significance at the
0.001 level). 120
The coefficient of the constant in a multilevel "Null Model" represents a weighted average of the
dependent variable, not the simple mean that single-level OLS regression would produce. The multilevel
software MLwiN follows a complex estimation procedure (in this case called RIGLS, see chapter 5). To
simplify matters, it can be said that the procedure takes into account the fact that some level 2 groups may
only contain a few level 1 units, and assigns them less weight in the estimation.

6. The 1993 Duma Elections
176
Table 6.3: Predicting independents' success. Estimated multilevel models (0-2)
Hypothesis Variable
Lev. Estim. Estim. Estim.
Fixed part
CONS 51.245 2.083 R 51.608 2.140 R 51.797 2.176 R
DOW92-93 2 11.086 3.900 **
DOW88-93 2 11.973 4.434 **
POLAPP 2 -7.371 5.921 -7.554 6.003
TRANSF 2 0.194 0.102 0.188 0.103
Accessibility REMOTE 2 1.378 9.946 0.531 10.049
Control URBAN 1 -0.110 0.086 -0.120 0.086
Random part
Level 2
CONS 159.793 57.504 ** 104.985 47.914 * 109.477 48.627 *
Level 1
CONS 430.533 51.109 *** 402.306 49.750 *** 401.020 49.698 ***
-2*Log likelihood
N
1813.087 1813.739
219 201 201
Appeasement
2000.650
Regionalist
Assertiveness
Model 0 Model 1 Model 2
S.Err. S.Err. S.Err.
*p < 0.05 **p < 0.01 ***p < 0.001
Indeed, in Model 0 the portion of variability in independents' success that occurs
between regions (i.e. the variance at level 2) is fully described just by the variance of the
constant at level 2, which is the only element of the random part of the model. Its
significance is directly interpretable as the significance of the cross-regional differences
in independents' success. In particular, the fact that the portion of variance belonging at
level 2 (159.8) is significantly different from zero indicates that the phenomenon under
study varies across regions in a more systematic fashion than would occur by chance.
This means that a multilevel model is necessary. At the same time, however, the
variance occurring at level 1 (430.5), across SMDs within regions, is significant and
larger than that at level 2. The coefficient of autocorrelation which indicates the
proportion of total variance occurring across regions is (ρ = 159.8/590.3 =) 27 percent.
This is the portion of variance "targeted" by regional level variables, such as those
specifying the main hypothesis. The bulk of the variability, however, occurs between
SMDs, within regions. Part of this variance, can be structured by level one predictors,
such as those for party challenge in subsequent models. At the bottom of the column, an
N of 219 reflects the fact that the election did not take place in 6 districts (the 5 of
6. The 1993 Duma Elections
177
Tatarstan and the 1 of Chechnya). When the N drops below this point, it is due to
missing values on the independent variables.
Models 1 and 2 introduce the set of variables linked to the main hypothesis, with
alternative measurements for regionalist assertiveness. Both in Model 1 and Model 2 the
variable expressing the main hypothesis, regionalist assertiveness, is statistically
significant (at p<0.01), while controlling for political appeasement ("PolApp"), for
direct financial transfers from the centre ("Transf"), for the share of regional population
living in remote areas ("Remote") and for the degree of district urbanisation ("Urban").
This means that, with 99 percent of confidence, the more assertive a region is in its
autonomy demands, the greater the electoral chances for the independents. More
precisely, a unit increase in assertiveness (Dow92-93) is predicted to produce an
increase of 11 percentage points in the success of the independents. A unit increase
corresponds, for example, to passing from a region advocating a decentralised
federation (a score of 3 on Dowley's index) to one advocating an ethnofederal
arrangement, with privileges for ethnic units (a score of 4 on the index). The other
variables of models 1 and 2 are not significant and it is not possible to reject the null
hypothesis that these variables have no effect on independents' success. The size of the
unexplained variance at both levels has dropped, especially at level 2, due to the
entering of the mentioned predictors. It can be also noted that the -2*Log likelihood also
decreased significantly. The difference between model 0 and model 1 is about 187, well
above 11, the critical value of the log likelihood test statistic asymptotically distributed
as Chi-sq, with 5 degrees of freedom, at the 0.05 level of significance.
The main hypothesis of this study is therefore confirmed for the 1993 election.
However, the present explanatory framework (see chapter 3) also allows for the effect
of regionalist assertiveness to be mediated by intervening variables at the district level.
As the remainder of this analysis shows (models 3-5), taking into account party entry
strategies illuminates this mediating effect, adding to the sophistication of the causal
paths. Rather than regionalist assertiveness directly impacting upon the returns for the
independents, it affects the decisions of parties on whether to contest a given SMD,
which, in turn, affects the chances of the independents.

6. The 1993 Duma Elections
178
This mediating effect is shown in Models 3 and 4. A series of thirteen dummy
variables is entered, one for each political party which nominated at least one candidate
in the 225 SMDs (Table 6.4).
Table 6.4: Predicting independents' success. Estimated multilevel models (3-4)
Hypothesis Variable
Lev. Estim. Estim.
Fixed part
CONS 73.069 2.968 R 73.097 2.954 R
DOW92-93 2 0.687 3.669
DOW88-93 2 2.450 4.123
POLAPP 2 -2.119 5.411 -2.834 5.427
TRANSF 2 0.138 0.089 0.130 0.090
KPRF 1 -6.088 3.353 -5.943 3.354
PRES 1 -5.088 2.847 -5.155 2.849
LDPR 1 -9.457 3.234 ** -9.266 3.231 **
APR 1 -12.352 3.121 *** -12.247 3.106 ***
KEDR 1 -7.279 4.752 -7.287 4.749
RUCHOICE 1 -13.939 2.724 *** -13.876 2.728 ***
YABL 1 -6.044 2.966 * -6.019 2.964 *
DIGN&CH 1 -9.842 5.100 -9.905 5.101
WOFRUSS 1 -10.151 8.616 -9.807 8.621
RUSSFUT 1 -2.615 3.856 -2.359 3.857
DPR 1 -7.097 3.180 * -7.246 3.188 *
CIVICUN 1 -7.083 2.930 * -6.987 2.931 *
RDDR 1 1.235 3.205 1.281 3.206
Accessibility REMOTE 2 -6.869 8.640 -7.448 8.665
Control URBAN 1 0.029 0.074 0.025 0.074
Random part
Level 2
CONS 119.383 39.287 ** 116.971 38.756 **
Level 1
CONS 243.203 30.688 *** 243.858 30.803 ***
-2*Log likelihood
N
S.Err.
Model 3
201
1714.362
Appeasement
Party challenge
Regionalist
Assertiveness
201
1714.000
S.Err.
Model 4
*p < 0.05 **p < 0.01 ***p < 0.001
It is worth noting that, contrary to conventional designs found in the literature for
similar issues, the unit of analysis here is the SMD, not the candidate. Obviously, more
than one party can and do nominate candidates in the same SMD. Therefore, the party

6. The 1993 Duma Elections
179
dummies entered here are distinct variables, not mutually exclusive states of a single
categorical variable.
Two main points should be noted with regard to Models 3 and 4. The first interesting
finding is that the coefficient for regionalist assertiveness sharply decreases, and indeed
loses significance. This is consistent with the notion of parties mediating the effect of
regionalist assertiveness, as outlined above and posited in chapter 3, and it should not
lead one to conclude that regionalist assertiveness does not have a significant effect. The
second point to note is that only six of the thirteen parties contesting the SMDs have a
significant impact on the chances of the independents. Indeed, as noted in chapter 2,
most parties lacked the territorial presence or name recognition needed to perform well
in the SMDs. Parties with significant effects are all "national" parties, in the sense that
they lack regionalist themes or roots, with the partial exception of the agrarian party
(APR), which is strongly organised in the territories dominated by collective farming.
The "party of the regions", PRES, did not pose a significant threat to the independents,
despite its potential challenge to independents' competitive advantage in representing
regionalist sentiments. This suggests that the true nature of the PRES as a creature of
the Kremlin came across to the voters animated by anti-centralist sentiments, despite the
party's regionalist rhetoric.
On the other hand, it is interesting to note that the Democratic Party of Russia (DPR)
did challenge the independents, as did the Civic Union. The latter party, especially, is
usually overlooked by accounts of the 1993 Duma vote because it performed poorly in
the PR tier of the election (with 1.9 percent). In the districts, however, it made more of a
difference than parties that received high shares of the PR vote, such as the KPRF,
PRES, Women of Russia, and KEDR. It is also interesting to note specifically the
weakness of the communist party (KPRF) in the 1993 district races, as the party's
territorial organisations were still fragmented (see above).
As for the magnitude of the estimates, on average the presence of a candidate of
"Russia's Choice" reduces the chances of the independents by about as much as 14
percent points compared to a district not contested by the party. Similar strong effects
are estimated for the APR, and in descending order for the LDPR, the DPR and Civic
Union, and Yabloko. In an hypothetical SMD where all parties with a significant effect

6. The 1993 Duma Elections
180
enter the contest, the predicted vote share gained by the independents is reduced to
roughly 16 percent, where all other variables have average values.
Finally, a sharp decrease in the level 1 variance between models 1-2 and 3-4 (from
over 400 to 243) is due to the partial structuring of the cross-district variability achieved
with the party variables. Interestingly, at the same time, the level 2 variance increases
despite the level two variables remaining the same. This means that part of the variance
previously attributed to level 1, can be considered level 2 variance. This confounding of
the variance between the two levels may occur due to the fact that several regions only
have one SMD, so that the two levels overlap. The -2*Log likelihood also decreases
(from 1813 to 1714), which is a significant improvement over model 2, in terms of the
log likelihood ratio test, for 13 degrees of freedom.
So far, the only coefficient allowed to vary across regions and SMDs has been the
constant, reflecting the fact that the level of independents' success for average SMDs
(the predictors are mean centred) vary significantly across regions. Model 5, expands
the complexity of the model by allowing one of the other coefficients to be random at
both levels. This is done under the assumption that the complexity of social reality
implies complex patterns of variability in relationships between variables. The
coefficient with a cross-regional variability closest to statistical significance is the effect
of "RuChoice" (for the party "Russia's Choice"). The level 2 variance term due to
"RuChoice" is 175 (with a std. error of 103). This means that the effect of a challenge
posed by Russia's Choice in the SMDs does not vary significantly from region to
region.121
Even so, the mere fact that a more complex variability is explored (and level 1
heteroskedasticity allowed for), makes the model more precise, as evidenced by the
decrease in -2*log likelihood and by the fact that a previously insignificant effect,
namely the challenge by the party "Dignity and Charity" becomes significant and
important. Model 5 is the final model for 1993. The equation predicting independents'
success in model 5 has been introduced above, before the presentation of the estimated
models.
121
The effects of other parties turned out to be even less variable across regions.

6. The 1993 Duma Elections
181
Table 6.5: Predicting independents' success. Estimated multilevel model 5
Hypothesis Variable
Lev. Estim.
Fixed part
CONS 73.416 2.948 R
DOW92-93 2 1.787 3.675
DOW88-93 2
POLAPP 2 -2.859 5.348
TRANSF 2 0.125 0.087
KPRF 1 -5.839 3.092
PRES 1 -5.748 2.712 *
LDPR 1 -10.922 3.107 ***
APR 1 -12.037 2.913 ***
KEDR 1 -5.569 4.434
RUCHOICE 1 -13.315 3.273 R
YABL 1 -6.406 2.894 *
DIGN&CH 1 -13.629 4.983 **
WOFRUSS 1 -13.572 7.878
RUSSFUT 1 -2.333 3.641
DPR 1 -7.435 3.124 *
CIVICUN 1 -6.277 2.791 *
RDDR 1 1.468 3.002
Accessibility REMOTE 2 -8.144 8.434
Control URBAN 1 0.021 0.067
Random part
Level 2
CONS 196.789 52.516
RUCHOICE 175.599 103.133
CONS/RUCHOICE -120.247 62.755
Level 1
RUCHOICE 286.844 58.598
NoRUCHOICE 131.387 26.997
NoRUCHOICE/RUCHOICE n.a. n.a.
-2*Log likelihood
N
Model 5
S.Err.
201
1704.523
Regionalist
assertiveness
Appeasement
Party challenge
*p < 0.05 **p < 0.01 ***p < 0.001 N.a. = non-applicable, because separate coding was used for the categories of a dummy variable (all categories have a dummy variable). By definition the two categories are mutually exclusive and cannot covary.
Based on model 5, Figure 6.1 shows the bivariate relationship between regionalist
assertiveness and the success of independent candidates, while controlling for the entire
model. Triangular shapes represent regions. It is apparent that the two variables are
related, which confirms the main hypothesis of this thesis for the 1993 Duma elections.

6. The 1993 Duma Elections
182
In other words, the graph confirms that, roughly, the greater the level of regionalist
assertiveness, the greater the predicted success for the independents, controlling for the
rest of model 5. It has been also noted, based on models 1 to 5, that this relationship is
in part mediated by the presence/absence of political parties that challenge the
independents and is in turn affected by regionalist assertiveness. It is worth looking at
the latter causal path in greater detail. If the notion of a mediating effect is valid, the
nomination decisions of at least some of the political parties in models 3 to 5 should, in
turn, be predicted by levels of regionalist assertiveness.
Figure 6.1: Main hypothesis: predicted bivariate relationship, from final model
A descriptive confirmation of this dynamic for the party Russia's Choice is shown by
Figures 6.2-3. The first pie chart represents all SMDs in regions with medium to low
levels of regionalist assertiveness (i.e. DOW92-93 lower than 3.0); the second
represents only the SMDs of regions with high levels of autonomist demands (i.e.
DOW92-93 above 3.0). If regionalist assertiveness has an impact on the entry decisions
of Russia's Choice, the party should nominate its candidates more often in regions with
low assertiveness, and only in a few of the districts located in highly assertive units. The
Chart confirms this expectation. While Russia's Choice contested as much as half the

6. The 1993 Duma Elections
183
SMDs with low assertiveness, it only contested about one quarter of the SMDs in highly
assertive areas.
Figures 6.2-3: Nomination of Russia's Choice candidates in regions scoring below (left)
and above (right) the median score of regionalist assertiveness.
(In boxes: number and percent of districts contested by Russia's Choice)
Source: elaborated from Dowely's dataset and CEC data.
A more accurate test of the hypothesis that party entry strategies mediate the effect of
regionalist assertiveness can be obtained by testing whether party entry decisions are
significantly predicted by this variable. To this end, a series of logistic multilevel
models have been run each with a party dummy as dependent variable. The models for
the four parties whose entry decisions are indeed significantly affected by regionalist
assertiveness are reported in Table 6.6 below. Each column is devoted to a model, for a
party's entry decisions.
Table 6.6 shows that APR, LDPR and especially KPRF and Russia's Choice were
significantly affected by considerations of the anti-centralist sentiments of regions in
their strategic allocation of campaign resources and candidates across the Russian
territory. The effects are all negative, suggesting strategic withdrawal from hostile
regions. The coefficients in the models represent the effect on the logit of the dependent
variables. To facilitate interpretation, these are transformed into the probability of
nominating a candidate in the SMDs (ranging from 0 to 1) reported in Figures 6.4 and
6.5, below (further Figures A.6.1, A.6.2 and A.6.3 are in Appendix). The relationship
No RussChoice cand.
93 / 51%
RussChoice cand.
91 / 49%
Regions that score below 3 on "Do92-93"
No RussChoice cand.
31 / 76%
RussChoice cand.
10 / 24%
Regions that score above 3 on "Do92-93"

6. The 1993 Duma Elections
184
between the probability that these parties contest a given SMD and regionalist
assertiveness is evident and clearly negative, as expected.
The logistic models of party entry strategies and the related graphs support the
interpretation given above of the drop in statistical significance of the coefficient for
regionalist assertiveness when party challenges are considered in models 3-5 (Tables 6.4
and 6.5). The drop should not induce one to think that the variable is not a significant
predictor of the success of the independents. Rather it should be read as confirmation
that most of its effect is mediated. Because the effect of regionalist assertiveness on the
probability of party nomination is negative, and, in turn the effect of party challenge on
the success of the independents is also negative, the net indirect effect of the first
variable on the last is positive, as expected.
A precise quantification of this mediating effect can be reached by two
considerations. Firstly, the coefficient for regionalist assertiveness in model 1 (Table
6.3), which equals 11, represents the "total effect" of the variable (i.e. direct plus
indirect). Secondly, the coefficient in the final model (model 5, Table 6.5), which equals
1.8, is the direct effect. As a result it can be concluded that the size of the indirect,
party-mediated, effect is (11-1.8=) 9.2. It should be noted that the "direct effect" might
well in fact be mediated by variables not included in the models. In particular, in the
analysis of the 1995 elections (next chapter), with greater data availability, it is possible
to see that a second mediating effect can be produced by the strategic decisions of
notable candidates at the district level.
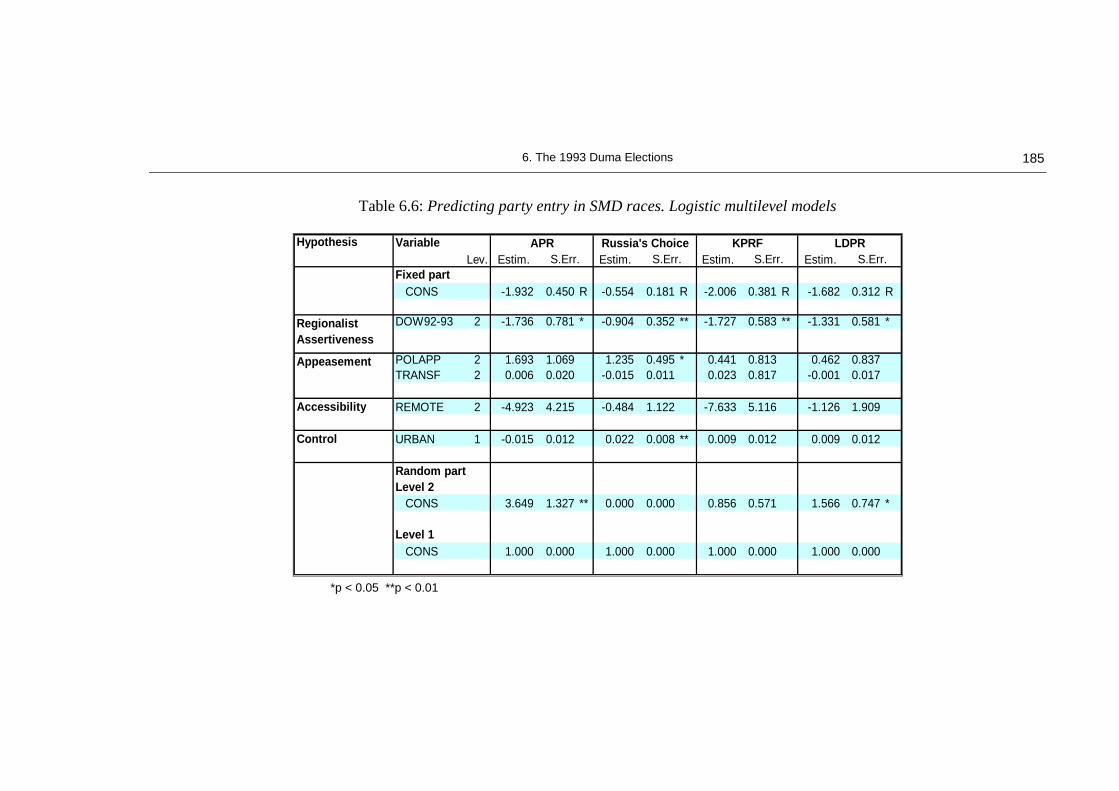
6. The 1993 Duma Elections
185
Table 6.6: Predicting party entry in SMD races. Logistic multilevel models
Hypothesis Variable
Lev. Estim. Estim. Estim. Estim.
Fixed part
CONS -1.932 0.450 R -0.554 0.181 R -2.006 0.381 R -1.682 0.312 R
DOW92-93 2 -1.736 0.781 * -0.904 0.352 ** -1.727 0.583 ** -1.331 0.581 *
POLAPP 2 1.693 1.069 1.235 0.495 * 0.441 0.813 0.462 0.837
TRANSF 2 0.006 0.020 -0.015 0.011 0.023 0.817 -0.001 0.017
Accessibility REMOTE 2 -4.923 4.215 -0.484 1.122 -7.633 5.116 -1.126 1.909
Control URBAN 1 -0.015 0.012 0.022 0.008 ** 0.009 0.012 0.009 0.012
Random part
Level 2
CONS 3.649 1.327 ** 0.000 0.000 0.856 0.571 1.566 0.747 *
Level 1
CONS 1.000 0.000 1.000 0.000 1.000 0.000 1.000 0.000
Russia's Choice
S.Err.
Regionalist
Assertiveness
Appeasement
APR
S.Err.
LDPR
S.Err.
KPRF
S.Err.
*p < 0.05 **p < 0.01

6. The 1993 Duma Elections
186
Figure 6.4: The impact of regional assertiveness on KPRF entry decisions
(Predicted from the "KPRF" logistic model in Table 6.6)
Figure 6.5: The impact of regional assertiveness on LDPR entry decisions
(Predicted from the "LDPR" logistic model in Table 6.6)

6. The 1993 Duma Elections
187
Conclusion
The empirical analysis of the 1993 elections indicates that the main hypothesis of this
thesis is confirmed by the data. As posited in the explanatory framework, regionalist
assertiveness has both direct and mediated positive effects on the success of the
independents. In other words, autonomism affects first and foremost the strategic
decisions of parties on where to nominate candidates. Where key parties do nominate
candidates, they pose a significant challenge to the independents.
This pattern emerges despite the exceptional circumstances of the 1993 campaign.
Such circumstances included the little time that most parties had to prepare for the vote,
the omission of candidates' party affiliation from the ballot paper, and the inability of
young parties to project a brand name image. In short parties failed to constitute the
informational shortcuts that voters need, especially if overwhelmed by several
simultaneous elections.
In sum, the 1993 elections confirm the main expectations of the present explanatory
framework. However, greater data availability for the 1995 and 1999 elections allows
richer and better specified models. In the next chapter, a consideration of the personal
resources of candidates is added to the analysis of the 1995 Duma elections.

7. The 1995 Duma Elections
188
7
The 1995 Duma Elections
“We, for example, have excellent relations with
Moscow. We received a great deal of autonomy,
we don’t have demands on the centre. I dispute
the view that ‘relations based on bilateral
treaties lead to a break-up’, I firmly disagree”.
M.G. Rakhimov,
President of the Republic of Bashkortostan,
interviewed 17 March 1999122
According to the Russian Constitution, the first post-communist Duma was to last two
years, half the normal term. As a consequence, a new vote took place in December
1995, only two years after the first one. Despite this proximity, the election was marked
by high levels of volatility, both in terms of voters' preferences, and in terms of party
supply.
If party system institutionalisation was evidently still weak, individual parties grew
in organisational strength. This applies primarily to the KPRF, which could dramatically
improve its penetration of, and its electoral performance in, the SMDs. In comparison to
the previous chapter, the statistical models for 1995 can look at one additional factor -
candidates' personal resources. This allows a study of party performance that controls
for the role of campaign assets, such as personal resources, independent from the party
label.
As for the main hypothesis, the models confirm the findings of the previous chapter.
Regionalist assertiveness has a significant, positive, impact on the chances of
independent candidates. The direct portion of this impact increased, while the indirect
portion of the effect, mediated through party entry decisions, decreased. This suggests
122
Interviewed by V.L. Filippov (Filippov 2001: 96), own translation.

7. The 1995 Duma Elections
189
that parties were starting to compete in SMDs previously written off as “hostile”. In this
chapter, confirmation is provided for the fact that the strategic decisions of local notable
candidates, on whether to run as a party or as an independent candidate, are (partly)
affected by consideration of anti-centralist sentiments in the regions. This means that
such decisions provide a second channel for the mediation of the impact of regionalist
assertiveness on the chances of the independents.
7.1 Background
The contestants
One of the most startling aspects of the 1995 Duma election is the proliferation of
parties and electoral blocs. Forty-three organisations crowded the proportional ballot.
Fifteen of these were "associations" or "movements", rather than parties or electoral
blocs.
In the SMD tier of the election, between 1993 and 1995, the number SMD candidates
generally rose considerably. However, while the number of independent candidates rose
by 29 percent (from 819 to 1057), the ranks of party candidates grew several times
faster, by 124 percent. Indeed, the number of party candidates more than doubled since
the previous election, passing from 700 to 1571 (see Figure 7.1). Therefore, even
though their absolute number grew between 1993 and 1995, the share of candidates
running as independents dropped from 54 percent to 40 percent. In terms of electoral
success, in 1995 the independents won 77 of 225 plurality races, which means that only
7 percent of all independent candidates won a seat (77/1057). By contrast, in 1993 the
independents had won in 134 SMDs, with a rate of success relative to their total
numbers of (134/819=) 16 percent.
The 43 organisations registered for the PR race nominated 1459 candidates in the
SMDs; an additional 114 were nominated by twenty-one "electoral unions and blocs"
(TsIK 1998: 145) which did not appear on the PR ballot paper and collectively obtained
only about 2 percent of the district votes. A number of explanations have been advanced
for the multiplication of electoral organisations running in 1995, which is responsible
for the sharp rise in the number of party candidates noted above.

7. The 1995 Duma Elections
190
Figure 7.1: Number of SMD candidates, 1993 and 1995
Year of election
19951993
Num
ber o
f can
dida
tes
1800
1600
1400
1200
1000
800
600
400
Independent
Party
Institutionalist accounts stress that a change in the electoral rules made it easier to
register an organisation for the election. Indeed, social organisations, such as the "Union
of Housing and Municipal Workers", in addition to explicitly political ones, were
allowed to put candidates forward by a ruling of the Supreme Court, correcting the
previous interpretation of the electoral law by the Central Electoral Commission (CEC)
(Orttung and Belin 1997: 60).
Moreover, campaign rules also granted state funds and free TV time to parties
registered in the PR tier. As a result, small parties with no chance of crossing the 5%
all-Russian PR representation threshold, were set up just for the purpose of receiving
free campaign resources that could be used in the districts, where chances were higher.
This incentive may have overcome the increased difficulty of forming a regionalist
party derived from more stringent requirements for party registration (the required
number of signatures to be collected increased from 100,000 to 200,000, while the
maximum share that was allowed to be collected in any one region dropped from 15 to
7 percent). After all, there is evidence to suggest that signatures could be bought quite
easily from voters, and that this would cost a party less than the 115 million roubles
received from the state as campaign aid (Belin and Orttung 1997: 59).
Indeed, these campaign benefits seem to have created an incentive for small and
personalistic formations to register party lists and may also plausibly explain why
Source: own elaboration of CEC data.

7. The 1995 Duma Elections
191
"parties" with a regionalist flavour appeared in 1995 (and not in 1993 or 1999) even
though they had no chances of crossing the PR threshold. In particular, this applies to
the only truly regionalist party of Russian elections to date, "Transformation of the
Fatherland" (see chapter 4, and below), and to an electoral bloc called "89" after the 89
regions of Russia. As Belin and Orttung explain, "Bloc 89 had its roots in the Russia's
Choice movement in 1993 but could also be considered an interest group party
representing the eighty-nine regions of Russia" (Belin and Orttung 1997: 61). Moreover,
even a number of independents themselves decided to form a party, the "Bloc of
Independent Candidates". These three parties, however, were inconsequential for the PR
electoral results (they received only 0.5, 0.06, and 0.12 percent of the PR votes,
respectively). Another formation trying to appeal to regionalist sentiments, PRES, was
more established, having run the 1993 campaign already (see chapter 6). Deprived of
Kremlin's support, however, PRES only gathered 0.36 percent of the proportional vote,
even less than in the previous election, while failing to make an impact in the SMDs.
Other explanations for the proliferation of party candidates in 1995 have pointed out
that a limit to 12 was introduced in the number of candidates that could appear on the
federal part of a party's PR list. Additional candidates beyond the top 12 would have to
be listed in regional sub-lists. This was meant to reduce the predominance of Moscow
politicians in PR lists, and to spur greater inclusion of candidates from the provinces.
One unintended consequence, it is suggested, was to lead prominent Moscow
politicians, who could not find a place among the first 12 places on parties' federal lists,
to form their own party, thus contributing to the increase in the number of electoral
organisations contesting the 1995 election (Moser 2001: 502).
A third hypothesis points to the benefits, for parties' PR support, of running in the
SMDs. This is because the party receives additional local visibility from the SMD
campaign (Herron 2002). This view of party SMD nomination decisions has to be
qualified by the finding of this thesis. Indeed, parties chose where to concentrate their
resources on the basis of their expected chances of victory and these chances varied
across the territory partly according to levels of regionalist assertiveness (as noted for
the 1993 vote in chapter 6). However, in comparison to the difficult organisational
situation of the 1993 campaign, this research does suggests that in 1995 parties were

7. The 1995 Duma Elections
192
extending their reach further into the provinces, running even where their chances of
winning SMD seats were small (see below).
Thus, in 1995 more than in 1993, it is plausible that the strategic incentive for cross-
tier contamination came to weight more heavily in parties' entry decisions. However,
even without relying on special explanations, in general, the very fact of the 1993
elections had put parties back in business, and the PR tier of the election had
strengthened them (Petrov 1999: 59). Major national parties, while refraining to support
regionalist demands, became aware of the need to improve their connection to the
regions. The party of federal power, "Our Home is Russia" (NDR) included 60 "senior
officials from the regions" in its political council (Belin and Orttung 1997: 34), while
the third place on the communist KPRF party list was occupied by Aman Tuleev, the
speaker of Kemerovo oblast legislative assembly.
Table 7.1: Party nominations and victories in the SMDs
Party, electoral bloc or association No. of Cands.
No. of Winners
Success Rate
Liberal Democratic Party of Russia 188 1 0.5%
Communist Party of the Russian Federation 130 58 44.6%
Our Home is Russia (NDR) 104 10 9.6%
Congress of Russian Communities (КRO) 90 5 5.6%
Agrarian Party of Russia 87 20 23.0%
Democratic Choice of Russia (DVR)123
80 9 11.3%
Yabloko 69 14 20.3%
Forward, Russia! 67 3 4.5%
Communists, Workers of Russia - for the Soviet Union 64 1 1.6%
Bloc of Ivan Rybkin 64 3 4.7%
Power - To the People 41 9 22.0%
Trade Unions and Industrialists of Russia - Labour Union 40 1 2.5%
Pamfilova-Gurov-Lysenko 33 2 6.1%
Social Democrats 29 0 0.0%
Party of Workers' Self-Government (PST) 27 1 3.7%
Strong Power ("Derzhava") 25 0 0.0%
Bloc of Stanislav Govorukhin 25 1 4.0%
Party of Russian Unity and Concord (PRES) 23 1 4.3%
Women of Russia 20 3 15.0%
Russian Ecological Party "KEDR" 19 0 0.0%
My Fatherland 18 1 5.6%
Stable Russia 18 0 0.0%
123
In three SMDs, DVR nominated two candidates.

7. The 1995 Duma Elections
193
Russian All-Peoples Movement 18 0 0.0%
Bloc of Independent Candidates 17 1 5.9%
Association of Russian Lawyers 15 0 0.0%
Party of Economic Freedom 15 1 6.7%
Party - People's Union 15 0 0.0%
Transformation of the Fatherland 15 1 6.7%
Education - Future of Russia 14 0 0.0%
Duma-96 14 0 0.0%
Political Party Christian-Democratic Union-Christians of Russia 13 0 0.0%
Federal-Democratic Movement 11 0 0.0%
For the Motherland! 11 0 0.0%
Union of Patriots 11 0 0.0%
All-Russian Socio-Political Movement of Transport workers 11 0 0.0%
Party of Beer's Lovers 11 0 0.0%
"Zemskii Sobor" 9 0 0.0%
Inter-National Union 9 0 0.0%
Party of Peace and Good (bloc includes several formations) 7 0 0.0%
Non-Party Political Voters' Movement "Common Cause" 7 1 14.3%
Faith, Labour, Conscience 6 0 0.0%
Union of Housing-Communal Workers 6 0 0.0%
All-Russian Muslim Movement "Nur" (light) 6 0 0.0%
"89" (89 regions of Russia) 6 1 16.7%
Russian Party 5 0 0.0%
Fronteer Generation 5 0 0.0%
We Serve Russia! 5 0 0.0%
Bloc of Tikhonov-Тupolev-Тikhonov 5 0 0.0%
Rebirth 5 0 0.0%
League of Independent Scholars of Russia 5 0 0.0%
Democratic Alternative 4 0 0.0%
Party in Support of Lowering Taxes 4 0 0.0%
Union of Communists 4 0 0.0%
Our Future 3 0 0.0%
Conservative Party 3 0 0.0%
Russian Party of Car Drivers 3 0 0.0%
Union of Russian Muslims 3 0 0.0%
Pre-electoral Bloc including leaders of the Party for the Protection
of Pensioners and other parties
3
0
0.0%
National-Republican Party of Russia (NRPR) 2 0 0.0%
Workers' Collectives and Greens for SSR 1 0 0.0%
National Salvation Front 1 0 0.0%
Russian Union of Local Self-Government 1 0 0.0%
European Liberal Democratic Party 1 0 0.0%
Independents 1057 77 7.3%
SSR (Soyuz Sovladelzev Rossii), Union of Collective Owners of Russia.
Source: own elaboration of CEC data.

7. The 1995 Duma Elections
194
Federal relations in the 1994-1995 period
It is worth presenting a brief overview of the main development in centre-regional
relations to provide the background information on the main hypothesis of the
explanatory framework of this thesis. The starkest development in this context was
certainly the armed invasion of Chechnya at the end of 1994. This set an example for
other potentially recalcitrant regions, while, on the other hand, it stimulated the need for
Moscow "to form a belt of regions politically loyal to the federal center around
Chechnya" (Lavrov 1998: 31). This aim was pursued, for example, by granting
economic concessions to the Caucasus republics of Ingushetia, Dagestan, Karachaevo-
Cherlessia (which were granted a free economic zone in 1994), Kabardino-Balkaria, and
North Ossetia (Lavrov 1998: 31). This arguably defused the potential for regionalist
assertiveness in these regions.
Apart from the escalation of Chechen separatism and the Russian armed intervention
there, the period following the 1993 Duma elections up to the December 1995 vote, was
marked by a progressive settlement and cristallisation of federal relations. A crucial
difference with the previous period was the fact that a new Constitution had been
approved in the December 1993 referendum. The federal arrangement institutionalised
by the constitution marked a step towards centralisation of centre-regional relations if
compared to the Federal Treaty of the previous year (Petrov 1999: 59). However, the
Constitutional draft still represented a compromise between the two prevalent and
diverging views on the ideal form of federal arrangements -the one advocating a
centralised state where all units would be equal to each other, and the one demanding
that ethnically-designated units preserve their special status and privileges.
This divergence made it difficult to reach a compromise between the autonomous
units (republics and autonomous okrugs) and ordinary regions and resulted in key
passages of the constitution, defining the distribution of authority between centre and
different types of units, being left deliberately vague or worded in a mutually
contradictory manner. Nevertheless, by and large, the passage of the fundamental text
did usher in a period of more moderate regionalist assertiveness compared to the 1991-
1993 one. The main indication of this detente in centre-regional relation was marked by
the start of the stipulation of bilateral treaties between Yeltsin and the executive powers
of selected regions. In particular, the first bilateral treaty, signed in 1994 with Tatarstan,

7. The 1995 Duma Elections
195
formally reconciled this assertive region with the Russian state-building process. This
treaty granted important shares of autonomy and economic benefits to Tatarstan so that
it "defused the conflict" with Moscow (Lapidus and Walker 1995: 107). Internally to the
region, the bilateral treaty also "severely weakened the positions of radical nationalist
forces in the republic, whose influence was based almost entirely on fear of an 'imperial
enemy'" (Payin 1998: 18).
Seven treaties were signed before the December 1995 elections with the most vocal
republics, a practice that reinforced the elements of asymmetry in Russian federalism by
granting them special rights and privileges. Such bilateral treaties can be considered a
systematic tool used by the Centre to appease the most recalcitrant regions and preserve
the integrity of the federation (Hughes 2002). However, demands for equality of
treatment among regions were raised by regions which did not receive special privileges
in the 1994-1995 bilateral agreements and treaties. Perm oblast and net contributors to
the federal budget, such as Sverdlovsk oblast, Krasnoyarsk kray, and the city of St.
Petersburg, are examples of resented units (Lavrov 1998: 29). This will lead to new
special agreements in 1995-96 with several oblasts, i.e. after the Duma elections and in
view of the presidential vote of June 1996 (Hughes 1996).
The general atmosphere of regionalist appeasement can also be inferred from the
signing of the 1994 Agreement on Public Accord. Signed by all republics, the Accord
included a passage stating that "…the rights of the Federation's subjects can be realized
only if the state integrity of Russia and its political, economic and legal unity is
maintained" (Payin 1998: 18).
7.2 Analysis
The quantitative analysis of independents' success across SMDs and regions follows the
pattern used in the preceding chapter on the 1993 elections. This means that the models
reported in Tables 7.3-7.7 are multilevel models, which have the general characteristics
described in chapter 5, and require tables of coefficients to be divided into a fixed and a
random part. The dependent variable is the success of independent candidates, measured
as the joint vote share received by the independents in each SMD and the 225 SMDs

7. The 1995 Duma Elections
196
constitute the units of analysis. As in the previous chapter, continuous variables have
been mean-centred to facilitate interpretation.
For the details on the operational definitions of the independent variables, chapter 4
should be consulted. Two measures of regionalist assertiveness, drawing from different
time spans, are included in alternative models. The variable which averages
observations over the longest time (1991-95) is "Dow". This is just the mean score on
Dowley's index as published in her 1998 article. The other measurement, "Dow94-95" is
more time-specific, based on the 1994-95 years only (regional scores on these two
variables are listed in Table A.4.1 in Appendix).
Estimated models control for key concessions made by the central government to
appease regionalist demands (through the variable "PolApp"), and for the effect of
central financial transfers to the regions. Political appeasement is, in 1995, achieved
with the signing of bilateral treaties when these included substantial concessions to the
federal units, which applies to five republics. Additionally, units that had received
substantial concessions in the process of signing the Federal Treaty of 1992 are also
considered still appeased in 1995. The two groups of regions mostly, but not
completely, overlap (see chapter 4). While other instances of appeasement can be
thought of, the two mentioned here stand out of the crowd as the strongest in most of
the literature (for example Kahn 2002).
In addition to regional level variables, the models also test for the effect of party
challenges to the independents in the SMDs. Parties expected to perform well in the
SMDs, thus challenging the independents, are first and foremost "major" national
parties (being relatively more visible in the national campaign). This category includes
the main party of power, "Our Home is Russia", headed by prime minister Victor
Chernomyrdin. The "Bloc of Ivan Rybkin", named after its leader, the speaker of the
first Duma, also represented an incarnation of the party of power sponsored by the
Kremlin, although one that was meant to appeal to the electorate of centre-left. The
party "Congress of Russian Communities" (KRO) is also included, despite being
neglected in the most of the academic literature due to its poor PR results. This party
made an impressive organisational effort nominating candidates in as many as 90 SMDs
(see Table 7.1).

7. The 1995 Duma Elections
197
The second type of party to be considered is the regionalist one. The party
"Transformation of the Fatherland" is the only genuinely regionalist formation in 1995.
The PRES can also be added to the analysis, as a pseudo-regionalist party (see chapter
3). Moreover, an additional set of party variables aims at testing the hypotheses that the
1995 proliferation of small parties, formed around a single or a few leaders, explains the
decrease in the number and success of independents. This proliferation of personalistic
formations, in turn, is attributed to the above-mentioned new incentives for party
registration which appeared in 1995. This type of party is exemplified by the "Bloc of
Tikhonov-Tupolev-Tikhonov", the "Bloc of Pamfilova-Gurov-Lysenko", etc. (see party
variables in Table 7.2).
Moreover, the data available for the 1995 elections, allows for the consideration of
more complex strategic scenarios unfolding in the SMDs than those based solely on
party supply (as in the models for the 1993 elections). Indeed, in addition to the party
challenge, the analysis of the 1995 vote takes into account the effect of candidates'
personal resources (or notability). As detailed in chapter 4, two dummy variables reflect
whether the distribution of regional and federal political elite members, across the
party/independent pools, is skewed in favour of the independents ("Regpol" and
"Fedpol"). A third dummy variable, "Incumb", marks the districts where one of the
independents is the district incumbent.
Both dimensions of the district candidate supply (party presence and candidates'
personal resources in the two pools) can be expected to have a complex role in the
model. As explained in chapter 3, and noted in the previous chapter with reference to
the party variables, these factors are at the same time causes of independents' success
and consequences of regionalist assertiveness. In terms of candidates' notability, for
example, the decision of notable candidates (regional, federal political elite or the
incumbent) to run as independent is strategic, i.e. affected by the fact that, in regionally
assertive regions, the chances of parties are lower (other factors being equal). Both the
party and the notability variables, therefore, are expected to mediate the effect of
regionalist assertiveness. This means that, in the sequence of estimated models, the
coefficient for regionalist assertiveness should decrease twice, firstly when the party
variables are entered, and then, even further, when the notability variables are
considered.

7. The 1995 Duma Elections
198
The remaining variables follow the motivations of the preceding chapter. "Remote"
measures the share of regional population affected by adverse climatic and geographic
conditions that make it difficult for national parties to enter the contest and campaign.
This variable, therefore, is positively related to the chances for the independents, but,
similarly to regionalist assertiveness, it has an indirect effect, mediated through the
party and notability variables. Indeed, the difficulty of party involvement in the
campaigns taking place in remote regions negatively affects the chances that parties
nominate candidates (party variables), and/or reduces the ability of parties to contribute
to a candidate's campaigning, thus inducing local notables to run as independents
(notability variables). Finally, the "Urban" variable controls for levels of urbanisations,
according to widely shared expectations on party development, detailed in chapter 3.
The final model of this chapter (Model 7), where the whole explanatory framework
is tested, given data availability, is described by the following equation. It requires a
"micro" and two "macro" models. The micro model is:
Ŷij = β0j (CONS) + β1 (DOW)j + β2 (POLAPP)j + β3 (TRANSF)j + β4 (REMOTE)j
+ β5 (URBAN)ij + β6 (NDR)ij + β7 (No KPRF)ij + β8 (BLOKIND)ij + β9 (APR)ij
+ β10 (KRO)ij+ β11 (RYBKIN)ij + β12 (REGPOL)ij + β13 (FEDPOL)ij
+ β14ij (INCUMB)ij + ij
Where two coefficients (for CONS and INCUMB) are random, thus requiring the macro
models:
β0j = β0 + μ0j
β14ij = β14 + μ14j + e14ij
Substituting the four macro models into the micro model and rearranging with the fixed
part preceding the random part:
Ŷij = β0 (CONS) + β1 (DOW)j + β2 (POLAPP)j + β3 (TRANSF)j
+ β4 (REMOTE)j + β5 (URBAN)ij + β6 (NDR)ij + β7 (No KPRF)ij + β8 (BLOKIND)ij
+ β9 (APR)ij + β10 (KRO)ij+ β11 (RYBKIN)ij + β12 (REGPOL)ij + β13 (FEDPOL)ij
+ β14 (INCUMB)ij + μ0j (CONS) + μ14j (INCUMB) + e14ij (INCUMB)
+ e15ij (No INCUMB)ij
The term e15ij (No INCUMB)ij is due to the fact that the dummy for incumbency is
allowed to vary at level one and that "separate coding", instead of contrast coding, was
7. The 1995 Duma Elections
199
used to specify the variable. A description of the explanatory variables can be found in
Table 7.2.124
124
The dependent variable, the independents' success, has been described in the introduction to the thesis
and in chapter 5.

7. The 1995 Duma Elections
200
Table 7.2: Independent variables in models, descriptive statistics
Hypothesis
Level
Variable Label
Type of Variable
Description
Categorical: Percent of cases (N)
Mean
Std. Dev.
Min.
Max.
Cases
Missing
Regionalist assertiveness
2 DOW Continuous Dowley's index (1991-1995 average)
2.8 0.5 1.6 4.6 225 0
2 DOW94-95 Continuous Dowley's index (1994-95 average)
2.53 0.59 1.67 4.72 225 0
Appeasement 2 POLAPP Categorical Region received substantial
political inducements 0 92.4% (208)
1 7.6% (17)
2 TRANSF Continuous Financial transfers from Centre to region
15.1 16.0 0.0 81.3 224 1
Geographic accessibility of region
2 REMOTE Continuous Percent of regional population living in remote areas
0.1 0.2 0.0 1.0 224 1
Notability 1 INCUMB Categorical One of the indeps is the incumbent
0 74% (167) 225 0
1 26% (58)
Table continues on next page.

7. The 1995 Duma Elections
201
Table 7.2: continued. Hypothesis
Level
Variable Label
Type of Variable
Description
Categorical: Percent of cases (N)
Mean
Std. Dev.
Min.
Max.
Cases
Missing
1 REGPOL Categorical Reg pol elite tends to run as
indep 0 73% (164) 225 0
1 27% (61) 1 FEDPOL Categorical Fed pol elite tends to run as
indep 0 82% (185) 225 0
1 18% (40)
Party challenge 1 No KPRF Categorical Candidate nominated by
"KPRF" is not running 0 57.8% (130) 225 0
1 42.2% (95) 1 No LDPR Categorical Candidate nominated by LDPR
is not running 0 83.6% (188) 225 0
1 16.4% (37) 1 YABLOKO Categorical Candidate nominated by
Yabloko is running 0 69.3% (156) 225 0
1 30.7% (69) 1 NDR Categorical Candidate nominated by NDR
is running 0 53.8% (121) 225 0
1 46.2% (104) 1 RYBKIN Categorical "Bloc of Ivan Rybkin" 0 71.6% (161) 225 0 1 28.4% (64) 1 PRES Categorical Candidate nominated by
PRES is running 0 89.8% (202) 225 0
1 10.2% (23) 1 APR Categorical Candidate nominated by APR
is running 0 61.3% (138) 225 0
1 38.7% (87)
Table continues on next page.

7. The 1995 Duma Elections
202
Table 7.2: continued. Hypothesis
Level
Variable Label
Type of Variable
Description
Categorical: Percent of cases (N)
Mean
Std. Dev.
Min.
Max.
Cases
Missing
1 TRANSFA Categorical Candidate nominated by
"Transformation of the Fatherland" is running
0 93.3% (210) 225 0 1 6.7% (15) 1 KRO Categorical Congress of Russian
Communities (KRO) 0 60.0% (135) 225 0
1 40.0% (90) 1 BLOKIND Categorical Candidate nominated by "Bloc
of Independents" is running 0 92.4% (208) 225 0
1 7.6% (17) 1 PAMFIL Categorical "Bloc of Pamfilova-Gurov-
Lysenko" 0 85.3% (192) 225 0
1 14.7% (33) 1 GOVOR Categorical "Bloc of Stanislav Govorukhin" 0 88.9% (200) 225 0 1 11.1% (25) 1 COMMCA Categorical Non-Party Political Voters'
Movement "Common Cause" 0 96.9% (218) 225 0
1 3.1% (7) 1 TIKH Categorical "Bloc of Tikhonov-Tupolev-
Tikhonov" 0 97.8% (220) 225 0
1 2.2% (5)
Control 1 URBAN Continuous Percent of population living in
urban centres 72.4 21.2 18.6 100.0 225 0

7. The 1995 Duma Elections
203
The models
As already seen for the 1993 models, the presentation of statistical results in the next
section follows the strategy of gradually increasing the scope of the model in order to
note the effect of new variables on the coefficients of those already included. In each
step, entire sets of variables are entered to illustrate the working of a given hypothesis.
Model expansion and specification is, therefore, driven by theoretical considerations,
rather than by the mechanic observation of changes in model fit due to single additional
variables. Moreover, the gradual expansion of the model aptly meets one key concern of
the explanatory framework, which is to detect both the direct and indirect effects of
regionalist assertiveness. This can be done by first entering the predictors of the main
hypothesis, then adding the mediating effects and observing the resulting variation in
the main variable's coefficient.125
A final element of complexity, allowed by the
multilevel design, is the consideration of random effects at level 2, undertaken in the
last models, after having discussed the fixed effects. It is useful to start the discussion of
the estimated models from the "Null model", which includes only the constant as a
predictor (Model 0 in Table 7.3).
In this specification, the coefficient for the constant corresponds to the average, all-
Russian, share of the vote received by the independents across the districts, that is to say
36.4 percent.126
However, this model also reveals that the level of success of the
independents varies significantly around this overall, Grand Mean. More precisely,
multilevel modelling partitions the variance between variability across regions, and
within regions/across districts. In the null model, the variance of the constant, random at
both levels, is precisely the variance of the outcome. In this case, the variance occurring
at both levels is significantly different from zero (p < 0.001). In comparison to the
variance structure of the 1993 elections, a larger portion of the variability in the success
of the independents occurs at the level of region, namely 40 percent, as indicated by the
coefficient of autocorrelation,127
ρ = 190.8/(190.8+284.3) = 40. Differences among
regions can be expected to play a greater role in 1995 than in 1993. This estimate of the
125
For a simple textbook example of "mediating effects", see Allison (1999: 60-2). For a more general
treatment of causal order, see Davis (1985). The latter includes the treatment of direct and indirect effects
(Davies 1985: 22-27). 126
As mentioned in chapter 6, this is a weighted average, produced by the RIGLS estimation procedure of
MLwiN. 127
In 1993, ρ = 27.

7. The 1995 Duma Elections
204
partition of the variance is based on the full range of SMDs, as the vote was regularly
held in all districts in 1995 (N = 225).
Table 7.3: Predicting independents' success. Estimated multilevel models (0-2)
Hypothesis Variable
Lev. Estim. Estim. Estim.
Fixed part
CONS 36.436 1.971 R 34.714 1.628 34.418 1.540
DOW91-95 2 11.109 3.916 **
DOW94-95 2 10.425 3.329 **
POLAPP 2 -14.387 7.068 * -13.730 6.570 *
TRANSF 2 0.212 0.102 * 0.246 0.100 *
Accessibility REMOTE 2 23.027 7.715 ** 24.575 7.554 **
Control URBAN 1 -0.010 0.071 -0.005 0.071
Random part
Level 2
CONS 190.822 52.086 *** 52.844 29.313 37.554 26.425
Level 1
CONS 284.276 33.749 *** 316.698 35.982 *** 325.564 36.545 ***
-2*Log likelihood
N
Model 2
1948.158 1946.813
Appeasement
Model 1Model 0
Regionalist
assertiveness
224
S.Err. S.Err.
225 224
1987.195
S.Err.
*p < 0.05 **p < 0.01 ***p < 0.001
The first two models with independent variables in addition to the constant (Models
1 and 2) are identical except for the measurement of regionalist assertiveness, which, as
explained above can be based on two different time spans. Regardless of which of the
two measures is considered, Models 1 and 2 find that regionalist assertiveness has a
highly significant impact on the success of independent candidates (p < 0.01). For a unit
increase in regionalist assertiveness (for example, passing from a region advocating a
unitary state, to one demanding a centralised federation), the average increase in the
vote for the independents is 10-11 percent, keeping the other variables constant. It
should be remembered that this coefficient reflects both the direct and indirect effect of
regionalist assertiveness, as part of the causal impact is expected to flow through SMD-
level variables, such as party challenge (as shown for 1993). Indeed, as subsequent
models (from Model 3 onwards) introduce SMD-level variables, the size and
significance of the coefficient for regionalist assertiveness decreases.
A similar dynamic should be bore in mind when observing the coefficient for
"Remote". In Models 1 and 2, the effect of this variable appears very important and

7. The 1995 Duma Elections
205
significant (p < 0.01). A one percent increase in the share of the regional population
living in areas difficult to reach (see chapter 4 for details on the operational definition),
is predicted to have a boosting impact of over 23 percent on the collective vote share of
the independents. As for regionalist assertiveness, this effect turns out to be largely
indirect, i.e. mediated by SMD-level variables, as shown below.
As for the appeasement hypothesis, the estimated coefficient for "PolApp" is also
significant and important in size. As expected the sign of the coefficient is negative. The
regions that had received political appeasement from the Kremlin, for example in the
form of bilateral treaties granting important privileges and spheres of autonomy, see the
independents receive a vote share 14 percentage points lower than other regions.
The "Transf" variable is also statistically significant. Its sign, however, is surprising
in the light of the present theoretical framework. It was expected that greater transfers
from the centre to the regions should reflect either regional dependency on the federal
budget, or financial appeasement of regionalist demands, in both cases reducing anti-
centralist sentiments and, therefore, the chances of the independents. Under this
hypothesis, the sign of the coefficient should be negative. The fact that the coefficient
for "Transf" is positive and significant disproves the mentioned hypothesis. However, it
could also simply be that the data on this dimension is not suitable to detect the real
extent of centre-regional financial transfers, a problem mentioned in chapter 4. For this
reason, the test for this hypothesis was announced to be tentative at best. For the present
purposes, it can be noted that, while a detailed analysis of centre-regional financial
flaws lies beyond the scope of this thesis, the finding is marginal to the explanatory
framework and does not impair its main arguments.
The only variable to lack statistical significance in models 1 and 2 is the level of
urbanisation, suggesting that the traditional pattern of party success in urban centres is
not confirmed in the Russian case of 1995 (nor of 1993 for that matter). Finally, it is
interesting to note two points in relation to the distribution of the variance at the two
levels. On the one hand, there is a sharp drop in the unexplained variance at level 2,
from model 0 to models 1-2, passing from 190 to 52. This is the expected effect of
entering level-2 variables that explain most of the cross regional differences in the
success of the independents. In fact, after taking into account the regional-level
hypotheses of this study, the remaining variability across regions is not significant

7. The 1995 Duma Elections
206
anymore. On the other hand, a less obvious difference between model 0 and models 1-2
is that the variance at level 1 increases somewhat (from 284 to 316). This indicates that
more variability in the outcome occurs between SMDs than previously gauged by
looking at the Null model. In other words differences previously attributed to the level
of regions, now turn out to be due to differences among SMDs. To try and explain this
level 1 variability, the following models enter level 1 variables.
Table 7.4: Predicting independents' success. Estimated multilevel models (3-5)
Hypothesis Variable
Lev. Estim. Estim. Estim.
Fixed part
CONS 46.401 2.779 R 45.974 2.758 R 45.355 2.482 R
DOW 2 6.522 3.391 6.907 3.195 *
DOW94-95 2 6.557 2.965 *
POLAPP 2 -14.359 5.960 * -14.142 5.527 * -14.624 5.660 **
TRANSF 2 0.269 0.089 ** 0.287 0.089 ** 0.262 0.085 **
Accessibility REMOTE 2 11.240 6.828 12.239 6.759 12.378 6.665
Control URBAN 1 0.008 0.071 0.007 0.071 -0.020 0.066
NDR 1 -9.380 2.345 *** -8.857 2.351 *** -9.067 2.269 ***
No KPRF 1 7.315 2.391 ** 7.380 2.376 ** 7.314 2.317 **
No LDPR 1 1.792 3.130 1.688 3.116
YABL 1 -2.185 2.546 -2.092 2.534
BLOKIND 1 -10.593 4.373 * -10.876 4.361 * -10.855 4.273 *
TRANFA 1 -0.548 4.881 -0.868 4.856
APR 1 -12.251 2.574 *** -12.482 2.549 *** -12.468 2.479 ***
PRES 1 -3.218 3.796 -3.591 3.778
KRO 1 -4.776 2.473 -4.486 2.476 -5.014 2.389 *
PAMFIL 1 -1.676 3.415 -1.620 3.392
RYBKIN 1 -7.456 2.540 ** -7.496 2.532 ** -7.304 2.482 **
GOVOR 1 -0.608 3.776 -0.977 3.765
COMMCA 1 2.089 6.698 1.134 6.738
TIKH 1 -3.152 7.894 -2.730 7.874
Random part
Level 2
CONS 2.991 14.568 0.000 0.000 0.376 13.430
Level 1
CONS 274.855 29.515 *** 275.840 25.902 *** 270.474 28.840 ***
-2*Log likelihood
N 224
1874.649
224 224
1876.102 1878.435
Appeasement
S.Err.
Party challenge
Regionalist
assertiveness
Model 3
S.Err.
Model 4 Model 5
S.Err.
*p < 0.05 **p < 0.01 ***p < 0.001
The first set of SMD-level predictors to be entered is related to the hypothesis that
some parties in particular may pose effective challenges to the independents. Models 3
and 4 present a first test for the challenge posed by party candidates by means of
7. The 1995 Duma Elections
207
dummy variables measuring whether a candidate of the given party contested the district
or not. Note that, uniquely among all parties, the KPRF and the LDPR nominated
candidates in a majority of SMDs. In order to facilitate the interpretation of the
coefficient for the constant, it is advisable to choose the most frequent state (presence or
absence) as the base category of dummy variables. For those two parties the base
category, coded 0, is "presence" of a party candidate. Thus, the value of 1 is assigned to
"absence" of party candidate. For this reason the variables are labelled in negative form,
"No KPRF" and "No LDPR", and their coefficients have positive signs.
As explained above, in 1995 the range of parties considered include "major" parties,
a regionalist party ("Transformation of the Fatherland") and also minor, personalistic,
formations that are sometimes credited in the literature with the drop in the success of
the independents observed between 1993 and 1995. Of the 14 parties considered, only 5
pose a significant challenge to the independents (i.e. where they stand, the independents
consistently suffer lower success rates). These five parties include such expected names
as the parties of power (mainly NDR, but also the "Bloc of Ivan Rybkin"), the
communists of the KPRF and the agrarian party (APR) which could count on a network
of local organisations. However, interestingly, a significant effect is also registered for
an utterly "minor" party, the oxymoronic "Bloc of independent candidates". This points
to the competition that the "bloc of the independents" represented for the "real"
independents (causing a decrease of over 10 percent in independents' ratings) in the
SMDs that the bloc managed to contest (17), even though it actually won only 1 SMD
seat (Table 7.1). This shows that the importance of similar small parties in subtracting
votes from the independents can be underestimated when analysts only look at the
number of winners claimed by parties.
Similar considerations apply to the "Bloc of Ivan Rybkin", which is predicted to
subtract an average of 7.5 percentage points from the total share of the independents
(even though it only won three races) in the 64 SMDs it contested. Among smaller
formations, the effect of KRO is almost significant. As for non-significant party effects,
findings include the irrelevance of the LDPR, despite it running 188 district campaigns
(more than any other party in 1995), and the weakness of Yabloko and PRES, as well as
of Rossel's regionalist experiment, "Transformation of the Fatherland". Also, the other
three personalistic parties did not make a difference in terms of independents' chances
7. The 1995 Duma Elections
208
(they only contested between 33 and 5 SMDs). The inclusion of level-1 variables in
models 3 and 4 resulted in the expected drop in the level 1 variance from 316-25 to 274-
75. Also level 2 variance decreased, suggesting that part of the variability across SMDs
was previously emerging at the level of regions.
Model 5 simply shows the elimination of non-significant party variables,
implemented to obtain a more parsimonious design.128
The variable for the KRO party
is retained because, of all non-significant party coefficients, it is the nearest to
significance in models 3-4. Indeed, once the other parties are eliminated, the effect of
KRO becomes statistically significant in model 5. Other non-significant variables are
kept in the model for their theoretical interest within the explanatory framework
("Remote") or as a control effect ("Urban"). The elimination of the non-significant eight
party variables only increases the -2*log likelihood by 4 points.
An important result to note is that, contrary to the 1993 models, the coefficient for
regionalist assertiveness is still significant after entering the mediating effect of party
nominations (in models 4-5, it is only marginally lower than the significance level in
model 3). However, the coefficients for "Dow" or "Dow94-95" are smaller than in the
models without party variables, confirming that part of the effect is indeed mediated
through party decisions on where to nominate candidates, as discussed in the previous
chapter for the 1993 models. Moreover, additional mediating effects can be represented
by the next set of SMD-level variables, on the personal characteristics of the candidates
forming the two pools (independent/party candidates). This hypothesis is tested in the
models of Table 7.5.
The variables on candidate notability are entered in Model 6. The candidates'
characteristics being tested relate to their occupational status (regional and federal
political elite positions) and to district incumbency. Two dichotomous variables,
"Regpold" and "Fedpold", mark the districts in which a majority of the regional or
federal political elite runs as independents from all other districts. Finally, along the
"Incumb" dummy variable, SMDs where the district incumbent runs as an independent
are coded 1, all others are coded 0.
All coefficients for these three variables are statistically significant. Where regional
political elites tend to run disproportionally as independents, this fact increases the

7. The 1995 Duma Elections
209
success of the non-partisans by 7.5 percentage points, compared to other SMDs and
controlling for other variables. Where most candidates occupying federal political
positions run as independents, this is predicted to boost their chances by 12.5 percentage
points. As for incumbency, where the district incumbent decides to run as an
independent, the percentage of votes obtained by the independents is predicted to rise by
7 points.
The introduction of these level 1 variables brings the value of -2*log likelihood down
to 1832 (from 1878 of Model 5), a statistically significant improvement of model fit.
Also, the total unexplained variance registered at level 1 drops from 270 to 223, as
expected when important level 1 factors are entered. Another consequence of these
three variables is that two of the party variables lose importance. Namely, the parties
KRO and "Bloc of Ivan Rybkin" cannot be said to significantly affect independents'
returns, once the personal characteristics of candidates in the independent/party pools
are controlled for. This may suggest that the impact of these formations was in fact due
to the personal qualities of their candidates, rather than to the party label per se. This is
consistent with the nature of such parties, created from above and centred on a few key
political elites, rather than autonomous institutions. Conversely, it is worth noting that
not only such major parties as NDR, KPRF and the APR, but also a formation
conventionally deemed marginal, the "Bloc of the independents", are still emerging as a
significant challenge to the independents after controlling for candidates' elite status and
incumbency.
Finally, it is interesting to note that the coefficient for regionalist assertiveness
further decreases (from 7 to 4.6), compared to the model with the party variables. This
confirms the expectation that part of the effect of that variable on the success of the
independents is mediated by the notability variables. In other words, both federal
political elites and the district incumbent tend to run as independents in proportion to
the anti-centralist sentiments of the region. In turn, when they do run as independents,
they bring valuable personal characteristics to the pool of independent candidates, thus
increasing their electoral returns.
128
It should be remembered from chapters 4 and 6 that the party variables are not dummies of a single
variable, but separate variables.

7. The 1995 Duma Elections
210
Table 7.5: Predicting independents' success. Estimated multilevel models (6-7)
Hypothesis Variable
Lev. Estim. Estim.
Fixed part
CONS 35.721 2.686 R 35.858 2.364 R
DOW 2 4.636 2.954 5.973 2.852 *
DOW94-95 2
POLAPP 2 -7.825 5.260 -7.101 4.760
TRANSFERS 2 0.228 0.077 ** 0.250 0.069 ***
Accessibility REMOTE 2 3.618 6.340 0.633 6.044
Control URBAN 1 -0.009 0.060 0.005 0.048
NDR 1 -7.607 2.135 *** -7.534 1.784 ***
No KPRF 1 6.807 2.113 ** 6.270 1.848 ***
No LDPR 1
YABL 1
BLOKIND 1 -8.522 3.929 * -9.064 3.814 *
TRANFA 1
APR 1 -11.298 2.268 *** -11.201 2.108 ***
PRES 1
KRO 1 -3.134 2.203 -3.936 2.007 *
PAMFIL 1
RYBKIN 1 -3.220 2.326 -3.280 2.267
GOVOR 1
COMMCA 1
TIKH 1
REGPOL 1 7.498 2.521 ** 9.072 2.377 ***
FEDPOL 1 12.534 3.402 *** 13.551 2.909 ***
INCUMB 1 7.095 2.880 * 6.495 2.886 R
Random part
Level 2
CONS 0.456 11.126 32.618 18.110
INCUMB 189.738 81.087
CONS/INCUMB -94.653 36.271
Level 1
CONS 222.948 23.785 ***
INCUMB 134.586 36.974
No INCUMB 219.175 27.779
No INCUMB/INCUMB n.a. n.a.
-2*Log likelihood
N
Appeasement
Party challenge
Candidate
notability
Regionalist
assertiveness
Model 7Model 6
S.Err. S.Err.
224
1832.294 1819.919
224
*p < 0.05 **p < 0.01 ***p < 0.001
N.a. = non-applicable, because separate coding was used for the categories of the dummy variable. By definition the two categories are mutually exclusive and cannot covary.

7. The 1995 Duma Elections
211
The specification of the fixed part of the final Model 7 is the same as the previous
model (model 6), the only difference in the final model being the inclusion of a random
component to the effect of "Incumb", at both levels. It is important to check whether
any of the level 1 variables have random effects across regions, in order to better
approximate the complex variability of the real world. In other words, complex
variability should be assumed, constant effects should be proved. This approach is
controversial and cannot be discussed in its full (philosophical) implications in this
context. However, it should be noted here that, of all level 1 factors, only the coefficient
for incumbency varies significantly across regions and across SMDs (based on joint chi-
sq tests for the two random parts). Allowing the model to reflect this complex
variability, thus relaxing the conventional assumption of homoskedasticity at level 1,
results in a more precise model, as evidenced by the lower value of -2*log likelihood.
In this final model the significance of other variables is slightly altered, as regionalist
assertiveness and the KRO party variable regain significance (at p < 0.05). In sum, once
the indirect effects of regionalist assertiveness are controlled for, the coefficient of
"Dow" in model 7, represents the direct portion of its effect in the posited casual
framework. Namely, the direct effect of regionalist assertiveness on independents'
success is such that, regardless of party strategic decisions and of the personal
characteristics of the candidate pools, a unit increase in "Dow" produces an increase of
6 points in the joint vote share of the independents, controlling for political
appeasement financial transfers, district geographic accessibility and levels of
urbanisation. If this value is subtracted from the coefficient for regionalist assertiveness
in model 1, the size of the indirect effect of regionalist assertiveness can be computed to
be (11 - 6 =) 5. In other words, for a unit increase in "Dow", the independents are
predicted to collectively gain 5 extra percentage points through the induced strategic
decisions of parties and notable candidates.

7. The 1995 Duma Elections
212
Figure 7.2: Main hypothesis, predicted bivariate relationship, from final model
The relationship posited by the main hypothesis of this thesis is graphically rendered
by Figure 7.2, where the success of independent candidates is predicted by regionalist
assertiveness only, based on the specification of model 7. The graph confirms the
positive relationship between the two variables, expected on the basis of the explanatory
framework.
As was the case for the 1993 analysis, the fact that part of the effect of regionalist
assertiveness is mediated by SMD-level variables can be tested with the help of logistic
models. These predict the probability that parties nominate candidates in a given SMD
(Table 7.6), or the probability that elite candidates decide to run predominantly as
independents (Table 7.7). The variables in these models are the level 2 variables whose
effect is understood to be mediated in the explanatory framework (i.e. primarily
regionalist assertiveness, but also, potentially, remote location and urbanisation).
The two models in Table 7.6 show that, of the parties that are considered for the
1995 elections, APR and KRO based their entry decisions to a significant extent on
considerations of the regionalist sentiments of the regions. The agrarian party APR was
also influenced, understandably, by the level of urbanisation of the SMDs, and by the
geographic accessibility of populations. Variables indicating these factors have
significant coefficients, whose sign follows the expectations. To interpret the

7. The 1995 Duma Elections
213
coefficients, the effect on the logit is transformed into effect on probabilities in Figure
7.3, which shows the decreasing probability that the party KRO enters an SMD race, as
levels of regionalist assertiveness increase.
Table 7.6: Predicting party entry decision. Logistic multilevel models
Hypothesis Variable
Lev. Estim. Estim.
Fixed part
CONS -0.594 0.169 R -0.514 0.172 R
DOW91-95 2 -0.901 0.433 * -1.339 0.484 **
POLAPP 2 0.132 0.822 -0.018 0.961
TRANSF 2 0.002 0.012 0.001 0.013
Accessibility REMOTE 2 -3.200 1.443 * -0.745 1.070
Control URBAN 1 -0.039 0.009 *** 0.023 0.009 *
Random part
Level 2
CONS 0.000 0.000 0.110 0.228
Level 1
BCONS 1.000 0.000 1.000 0.000
KRO
S.Err.
Regionalist
assertiveness
Appeasement
APR
S.Err.
*p < 0.05 **p < 0.01 ***p < 0.001
In addition to parties, the variables on candidates' personal resources are also
expected to mediate the effect of regionalist assertiveness and remote location. If this is
true, the entry decisions of at least some notable candidates should be predicted by the
mediated variables (regionalist assertiveness and remote location). The models in Table
7.7 confirm this expectation by predicting the probability that regional and federal
political elites run predominantly as independents. It is found that this probability for
federal political elites is significantly and positively affected by regionalist sentiments,
as expected. Interestingly, the probability that these candidates run as independents is
negatively affected by the political appeasement that a region may have received. In
other words, the probability that these candidates run as independents is smaller in
politically appeased regions than in the rest of the country, regionalist assertiveness and
the other variables being equal.

7. The 1995 Duma Elections
214
Figure 7.3: The impact of regional assertiveness on KRO entry decisions
(Predicted from the "KRO" logistic model in Table 7.6)
Table 7.7: Predicting the nomination decisions of notable candidates.
Logistic multilevel models
Hypothesis Variable
Lev. Estim. Estim.
Fixed part
CONS -1.530 0.204 R -0.969 0.161 R
DOW91-95 2 1.284 0.511 * -0.321 0.463
POLAPP 2 -2.019 1.018 * -1.259 1.016
TRANSF 2 0.017 0.013 -0.012 0.012
Accessibility REMOTE 2 0.886 0.876 4.303 1.268 ***
Control URBAN 1 -0.002 0.010 -0.008 0.009
Random part
Level 2
CONS 0.160 0.409 0.000 0.000
Level 1
BCONS 1.000 0.000 1.000 0.000
REGPOL
S.Err.
FEDPOL
S.Err.
Regionalist
assertiveness
Appeasement
*p < 0.05 ***p < 0.001

7. The 1995 Duma Elections
215
For regional political elite, a very significant effect is produced by the geographic
remoteness of regions. The greater the share of voters living in areas difficult to reach,
the greater the probability that regional political elite run as independents. This can be
attributed to the fact that parties tend to avoid stretching their campaign resources to
reach geographically inhospitable areas. Indeed, this has been found to be the case for
the APR party in the logistic model mentioned above (Table 7.6).
Conclusion
The independents represented a smaller proportion of both candidates and winners in
the 1995 Duma elections, compared to 1993. The literature has advanced several
hypothesis, mainly institutional, that can plausibly account for this general change. In
the context of the explanatory framework of this thesis, it can be added that regionalist
assertiveness was generally lower in the 1994-1995 period than in 1993 (see Figure 4.2,
chapter 4), which arguably reduced the need for non-party representation. However, the
question remains as to why the independents proliferated relatively more in some areas
than in others. This is the question addressed by this thesis and cross-regional
differences in levels of anti-centralist sentiments are found in this chapter to constitute a
significant part of the answer.
Moreover, in comparison to the 1993 district campaigns, major political parties
started competing in a wider range of districts, thanks to improved organisational
preparation, including areas previously deemed off limits due to regionalist
assertiveness. The communist KPRF became a major challenger to the independents in
the district races. This change is also evinced by the fact that only for two parties (APR
and KRO) their SMD entry decisions where negatively affected by levels of regionalist
assertiveness. In 1993 this was found for four major parties.
Nevertheless, party entry decisions and strategic decisions by notable candidates in
the SMDs still mediated the effect of regionalist assertiveness. While in 1993, however,
almost all the effect was mediated by party decisions, in 1995 regionalist assertiveness
retained a statistically significant direct effect on the outcome, in addition to important
indirect influences. The only true regionalist party, "Transformation of the Fatherland",

7. The 1995 Duma Elections
216
based in only one region, could not make a significant impact on the causal mechanism
of regionalist assertiveness and did not effectively challenge the independents. Even in
its native Sverdlovsk oblast, the party's performance did not convince (as noted in
chapter 4). All this was to change in preparation of the third Duma vote, in 1999. The
next chapter presents a different political context in which the independents are
challenged by an interregional political party created by powerful regional governors
themselves, as a vehicle to take a firmer hold of national politics and to advance the
presidential ambitions of its leader.

217
8
The 1999 Duma Elections
“No matter what party we create,
it always turns out to be the CPSU”.
Viktor Chernomyrdin129
The 1999 Duma elections show a markedly different pattern of proliferation of
independent candidates from the 1993 and 1995 ones, due to a different political
context. One distinguishing trait of the 1999 vote is the much more direct and
generalised involvement of regional governors. The reason for this is ultimately linked
to the fact that, contrary to the 1995 elections, all regional leaders by December 1999
had been popularly elected at least once, and to the weakness of the federal centre
resulting from the August 1998 financial crisis. The popular mandate (as opposed to
being appointed by Yeltsin) gave governors a new degree of independence from the
centre (Petrov 2001). At the same time, the August 1998 financial and political crisis
brought to an end the attempted recentralisation of 1997 and significantly reduced the
financial means that the centre had used to keep dependent regions under control and to
appease restive units.
For the present purposes, the most important product of this state of affairs is that, for
the first time, several regions' heads joined together to form a national political party.
This applies mainly to the "Fatherland-All Russia" (OVR) party, as Unity was promoted
by the Kremlin. In addition to the considerations just mentioned, a trigger of this
unprecedented regional activation was the sharp increase in the stakes associated with
the Duma vote. One authoritative observer of Russian politics, Richard Sakwa, has
129
In Remington (2003: 232).
8. The 1999 Duma Elections
218
recently wrote of the 1999 elections as the attempt by the Regions to "storm the
Kremlin".
Contrary to the 1995 situation (when a presidential election was also in sight),
Yeltsin could not stand for re-election (for legal and health reasons) and the most
assertive regions joined behind a new presidential hopeful, Primakov. In this light, it is
clear that the elections were not anymore (only) an occasion for bargaining with the
centre and extracting privileges as appeasement, but they were seen as an instrument to
take over the centre directly. It is difficult to overestimate the impact of this change on
the operation of the core hypothesis of this thesis. Because the regions forming and
leading OVR included some of the units which manifested the greatest potential for
conflict with the centre, the channelling of regional assertiveness, for the first time, was
carried out by a party rather than providing a competitive advantage to independents.
And regional administrative resources where the key instrument used by regional
leaders to achieve this shift.
8.1 Background
The contestants
In 1993 and 1995 parties registered for the PR portion of the vote have also been the
main (although not the only) suppliers of party candidates in the districts. The 1999
campaign followed this pattern and the decline in the number of party lists from 43 to
26 since 1995 was translated into a decline of party candidates in the SMDs (see Figure
8.1). While the number of independent candidates rose slightly since the previous vote
(from 1057 to 1143), the number of party candidates decreased by over 30 percent,
passing from 1571 to 1083.
This is despite the fact that new parties were formed. Of these new forces, however,
the pro-Kremlin party "Unity" was too recent to organise a large pool of nominations in
the districts. Despite the sizeable campaign (especially media) resources mobilised by
the Kremlin in its support, Unity only entered 31 SMD races (see Table 8.1).
Nevertheless, the statistical analysis below shows that where it did run it had a
significant challenging impact on the chances of the independents.

8. The 1999 Duma Elections
219
Table 8.1: Party nominations and victories in the SMDs
Party, electoral bloc or association No. of Cands.
No. of Winners
Success Rate
Communist Party of the Russian Federation 129 47 36%
Electoral Alliance "Yabloko" 114 7 6%
All-Russian Sociopolitical Movement "Spiritual Heritage" 107 1 1%
Fatherland - All Russia (OVR) 91 31 34%
Bloc of Zhirinovsky/Russian Liberal Democratic Party 90 0 0%
Electoral union "Our Home is Russia'" 90 7 8%
Bloc of General A. Nikolaev, of Academic S. Fedorov 68 1 1%
Union of Right Forces (SPS) 66 5 8%
Russian Socialist Party 63 1 2%
Congress of Russian Communities
And Yurii Boldyrev's Movement
45
1
2%
Interregional Movement "Unity" ("Medved") 31 10 32%
Pensioners' Party 28 1 4%
Russian All People's Union 28 2 7%
Electoral bloc "Communists, Workers of Russia –
for the Soviet Union"
20
0
0%
All-Russian Political Movement "In Support of the Army" 20 2 10%
Peace, Labour, May 18 0 0%
Russian Ecological Party "Kedr" 15 0 0%
All-Russian Sociopolitical Movement "For Civil Dignity" 13 0 0%
Women of Russia 12 1 8%
Movement of Patriotic Forces - The Case for Russia 10 0 0%
Stalinist Bloc for the USSR 7 0 0%
Socialist Party of Russia 6 0 0%
Social-Democrats 5 0 0%
Russian Party 3 0 0%
Russian Patriotic Popular Movement 2 0 0%
Party of Peace and Unity 1 0 0%
Russian Conservative Party of Entrepreneurs 1 0 0%
Independents 1143 107 9%
Note: No party nominated more than one candidate per district, contrary to what happened in 1993 and 1995. Source: own elaboration of CEC data.
Confronted with the decline in the number of parties on the PR ballot compared to
1995, analysts have resorted to institutional factors in search for explanations. Colton
and McFaul found that a 1997 change in the law on party registration extended the
minimum time that had to elapse between registration with the Ministry of Justice and

8. The 1999 Duma Elections
220
the vote (from 6 months to one year). Moreover, parties that registered by submitting a
financial deposit would lose it if they received less than 3 percent of the PR vote. If the
party received less than 2 percent, it would have to refund the state for the free TV and
radio exposure received during the campaign (Colton and McFaul 2003: 23). Thus, the
incentives that had unintentionally stimulated party proliferation in 1995 were largely
withdrawn in 1999.
Figure 8.1: Number of SMD candidates, 1993, 1995 and 1999
Year of election
199919951993
Num
ber
of c
andi
date
s
1800
1600
1400
1200
1000
800
600
400
Independent
Party
As a result, the share of SMD candidates running as independents rose from 40 to 51
percent since 1995. In both 1995 and 1999 the relative distribution of candidates in the
two pools (independent vs. party) has been a good predictor of the relative success of
the two pools. Over the 1990s, when the independents won a smaller share of seats (as
in 1995) they had also made up a smaller share of the candidates, and vice versa. In this
sense, the rate of success of the independents (number of seats won / number of
candidates) did not change much from 1995 to 1999, nor indeed with the 2003 latest
poll (always ranging between 7 and 10 percent). It can be derived that the nomination
stage (when candidates decide whether to run as party or as independent candidates) is
decisive for the overall level of success. This confirms the importance of rules
providing incentives for party vs. independent nomination (such as those in place for the
Source: own elaboration of CEC data.

8. The 1999 Duma Elections
221
1995 elections, which favoured party proliferation, see chapter 7) for explaining
temporal patterns.
These considerations, however, only explain differences in the aggregate level of
success between elections. The interesting question remains unanswered as to why
levels of success vary substantially below the aggregate, sub-nationally, at any given
election. Indeed, this is the research question of the thesis. So far, for the 1993 and 1995
elections, evidence has been presented that levels of success for the independents are
higher in those regions where they provided a channel of expression for salient
regionalist sentiments.
In the case of the 1999 vote, this explanatory mechanism could not apply anymore.
To understand why this was not the case anymore, the empirical tests must be preceded
by a brief review of the main developments in centre-regional relations leading up to the
Duma elections.
Federal relations in the 1996-1999 period
For its impact on the Duma vote, the most significant element in the centre-regional
relations of this period is the formation of a motley alliance of regions, with
traditionally different aims and interest, behind the "Fatherland-All Russia" (OVR)
party in 1999. The party united the powerful and popular mayor of Moscow, Luzhkov,
head of the "Fatherland" movement, with the leaders of such regionally assertive
republics as Tatarstan and Bashkortostan, grouped in the loose movement "All Russia"
together with St. Petersburg's "governor" Yakovlev. Tatarstan's president, Shaimiev,
had been the main promoter of the "All Russia" movement. This formation represented
"the most vigorous attempt to get the governors to act in concert", in order to "promote
decentralization within a stable federation, and at a minimum to foreclose any rollback
on the concessions the governors had wrested from Moscow in the 1990s" (Colton and
McFaul 2003: 83). When the Duma election approached, the union between
"Fatherland" and "All Russia" had enlisted many other regional governors and speakers
of regional assemblies.
The OVR party cannot be strictly considered a regionalist party, based in one unit
only or on the support of one ethnic group only and in opposition to the federal centre.
However, the "All Russia" component did mark the first electoral coalition of governors

8. The 1999 Duma Elections
222
generated from below, from the regions, rather than patronised by the Kremlin, such as
previously with NDR's ties to key governors. The main aim of the alliance of governors
was certainly to influence the shape of federal arrangements, in particular for
traditionally assertive regions to defend their autonomy. Why was such an alliance
formed for the 1999 elections and not before?
The answer lies in the changes in federal relations in the 1996-99 period. Firstly,
regions became more assertive as a result of holding their first gubernatorial elections,
mostly in 1996 (Petrov 1999: 59). With a popular mandate, regional governors gained
an independent basis of power, as opposed to being appointed by Yeltsin as before.
Secondly, the centre's strategy of appeasing regions with bilateral treaties (48 were
signed) had to be terminated due to the August 1998 financial crisis. The central
weakness resulting from the financial crack also put an end to the recentralisation that
had been attempted by prime ministers Chubais and Kirienko from 1997. The
centralising measures had included the appointment of presidential representatives to
the republics, a confrontation with the regions of Primorskii kray, and the republics of
Sakha and Udmurtia over compliance with federal law; and, under Kirienko (April-May
1998), exemplary attacks against corruption in Kursk oblast and against big oil
companies in Tatarstan and Bashkortostan (Petrov 1999: 59).
With the August 1998 financial crisis, the centre also lost the means to fund
appeasement. In particular, the crisis meant that in 1999 the practice of central loans to
the regions, which had been a prime channel for politically motivated financial flows
undetected by the budget law, virtually stopped (Kuznetsova 2001: 75). Similarly,
Luzhkov's Moscow lost the transfers it used to receive for its functions as "federal
capital". In addition to undermining the vertical links between centre and regions, the
1998 crisis also had some positive effects for cross-regional, horizontal economic co-
operation. The devaluation of the rouble made imports prohibitively expensive, thus
stimulating domestic industries and trade (Alexseev 1999: 269). An integrated Russian
market became more evident, which is in sharp contrast to the situation of the early
1990s, when regions behaved like islands (Smyrnyagin 1998: 3-4).
The weakness of the centre, and of the presidency in particular, was signalled by the
unprecedented successful imposition by the Duma of Primakov as the new prime
minister after the August crisis, in contrast to Yeltsin's preference for Chernomyrdin. A

8. The 1999 Duma Elections
223
new power configuration emerged with a prime minister, Primakov, who did not owe
his post to the president. This allowed a de-coupling of regions relations with the
president from those with the government. Indeed, while Yeltsin was growing
unpopular, and his health was unstable, Primakov allied with some important regions by
attracting them in the federal government and forged an alliance with Tatarstan's
Shaimiev, sanctioned by the renewal of the bilateral treaty with that region. He also
devolved shares of state companies to regional control (Petrov and Titkov 2001: 40).
When Primakov was ousted by Yeltsin, in May 1999, he became the leader of the
"Fatherland-All Russia" (OVR) alliance. Another example of an assertive regional
leader forming an electoral bloc is Samara's Titov, who formed "Golos Russiya" and
allied with the party SPS, (Petrov and Titkov 2001: 45). However, many governors who
had initially joined the initiative left the project when it became clear that OVR was the
horse to bet on.
8.2 Analysis
In this section, the analysis of the 1999 elections follows the pattern of the previous two
chapters on the 1993 and 1995 elections. A series of multilevel models is presented that
expand the specification and complexity of the analysis by sequentially entering
additional sets of variables grouped on the basis of the hypothesis they are meant to test.
This strategy has the advantage of showing the effect of entering new variables on those
already included and is especially useful when multiple causal stages are posited, such
as when some independent variables have not only direct, but also indirect effects, i.e.
mediated by other independent variables.
The range of variables examined is larger here than for the 1993 and 1995 elections
(see Table 8.2). Indeed, the literature has stressed that the 1999 vote saw an extensive
use of "administrative resources" by regional governors willing to play a greater role in
federal politics and to influence the result of Duma elections (see chapter 3). The impact
of this factor on the success of independent candidates is studied in this chapter through
two interacting variables. The first is "GovCat" (standing for "Governor Categorical"),
derived from Henry Hale's data and detecting whether it was an independent or a party

8. The 1999 Duma Elections
224
candidate (if any) that received governor's support in a given SMD. The second variable
is "Freesp", measuring regional levels of freedom in the circulation of information and
therefore indicating the extent to which regional politics is "controlled" by the
governor.130
Hale's data also allow the consideration of another new variable of the
1999 models, "FigCat". This is a categorical predictor that aims at detecting the effect of
the backing by Financial-Industrial Groups (FIGs) on independent candidates' chances.
These three variables did not appear in neither the 1993 nor the 1995 models.
The remaining variables are already familiar to the reader of chapters 6 and 7. Partial
exceptions are constituted by the individual parties expected to challenge the
independents, and by the two measures of regionalist assertiveness that aim at adjusting
Dowley's index for the centre-regional relations occurred after 1995. As for the party
variables, the fluidity of the supply side of Russia's party system (discussed in chapters
1 and 2) means that important parties were new to the 1999 elections (OVR, Unity,
SPS, and Spiritual Heritage). The other listed parties had already contested one or both
of the previous elections (Yabloko, KPRF, LDPR, and NDR).
As also noted in chapter 7, two of the dummy variables for party challenges, "No
KPRF" and "No Yabloko", are coded in negative terms, i.e. the value of 1 is assigned to
districts where no candidate of that party was running. This is the opposite of the coding
rule followed for other parties, and it is due to the fact that these two parties nominated
candidates in a majority of districts. In order for the constant in the models to represent
the value of Y for the average district, it is useful to set the base category of dummies to
be the most common state of the variable. This coding explains the positive sign of the
effect of these two variables in the models below, as opposed to the negative ones
recorded for the other party challenges.
As for the measurement of regionalist assertiveness, the variables "Asser99a" and
"Asser99b" represent an attempt to correct Dowley's index and take into account key
development in centre-regional relation occurred after 1995 (see chapter 4 for details).
These are used as alternative measures to the original Dowley's index (which is based
on 1991-95 only). The equation for the final model (Model 12, discussed below) is the
following. The "micro model" is:
Ŷij = β0j (CONS) + β1 (DOW)j + β2 (POLAPP)j + β3 (TRANSF)j + β5 (REMOTE)j
130
See chapters 3 and 4 for details on the variables and their operational definition.

8. The 1999 Duma Elections
225
+ β5 (URBAN)ij + β6 (UNITY)ij + β7 (No KPRF)ij + β8 (OVR)ij + β9 (NDR)ij
+ β10 (REGPOL)ij + β11 (FEDPOL)ij + β12 (INCUMB)ij + β13 (FIGPAR)ij
+ β14 (FIGIND)ij + β15ij (GOVPAR)ij + β16ij (GOVIND)ij + β17 (FREESP)j
+ β18 (FREESP*GOVIND)ij + β19 (FREESP*GOVPAR)ij + ij
Where three coefficients (for CONS, GOVIND and GOVPAR) are random, thus
requiring three "macro models":
β0j = β0 + μ0j
β15ij = β15 + μ15j + e15ij
β16ij = β16 + μ16j + e16ij
Substituting the three macro models into the micro model, and rearranging with the
fixed part preceding the random part:
Ŷij = β0 (CONS) + β1 (DOW)j + β2 (POLAPP)j + β3 (TRANSF)j + β5 (REMOTE)j
+ β5 (URBAN)ij + β6 (UNITY)ij + β7 (No KPRF)ij + β8 (OVR)ij + β9 (NDR)ij
+ β10 (REGPOL)ij + β11 (FEDPOL)ij + β12 (INCUMB)ij + β13 (FIGPAR)ij
+ β14 (FIGIND)ij + β15 (GOVPAR)ij + β16 (GOVIND)ij + β17 (FREESP)j
+ β18 (FREESP*GOVIND)ij + β19 (FREESP*GOVPAR)ij + μ0j (CONS)
+ μ15j (GOVPAR)ij + μ16j (GOVIND)ij + e15i (GOVPAR)ij + e16i (GOVIND)ij
+ e20ij (No GOVSUPP)ij
A schematic description of the variables used in the models of this chapter is provided
in Table 8.2.

8. The 1999 Duma Elections
226
Table 8.2: Independent variables in models, descriptive statistics
Hypothesis
Level
Variable Label
Type of Variable
Description
Categorical: Percent of cases (N)
Mean
Std. Dev.
Min.
Max.
Cases
Missing
Regionalist Assertiveness
2 DOW Continuous Dowley's index (1991-95 average)
2.8 0.5 1.6 4.3 224 1
2 ASSER99A Continuous Dowley's index corrected 1 3.1 0.5 1.8 4.6 224 1 2 ASSER99B Continuous Dowley's index corrected 2 2.8 0.6 1.7 4.7 224 1
Appeasement 2 POLAPP Categorical Regions who received political
inducements 0 39.7% (89) 224 1
1 60.3% (135) 2 TRANSF Continuous Financial transfer from Centre to
region (1996-99 average) 18.1 13.2 0.7 69.8 224 1
Geographic accessibility of region
2 REMOTE Continuous Percent of regional population living in difficult areas
0.1 0.2 0.0 1.0 224 1
Administrative resources
2 FREESP Continuous Index of Freedom of Speech 36.2 11.5 0.0 63.1 224 1
1 GovCat Categorical No clear support 0 14.7% (33) 224 1 GOVIND Gov supp indep 1 39.3% (88)
GOVPAR Gov supp party 2 46.0% (103)
Table continues on next page.

8. The 1999 Duma Elections
227
Table 8.2: continued. Hypothesis
Level
Variable Label
Type of Variable
Description
Categorical: Percent of cases (N)
Mean
Std. Dev.
Min.
Max.
Cases
Missing
Financial resources
1 FIGCat Categorical No clear support 0 77% (171) 224 1
FIGIND FIGs support indep. candidate 1 15% (34)
FIGPAR FIGs support party candidate 2 8% (19)
Notability 1 INCUMB Categorical One of the independents is the incumbent
0 76% (171) 224 1
1 24% (53)
1 REGPOL Categorical Regional political elite tends to
run as indep 0 71% (158) 224 1
1 29% (66)
1 FEDPOL Categorical Federal political elite tends to run as indep
0 88% (198) 224 1 1 12% (26)
Party challenge
1 No KPRF Categorical Candidate nominated by "KPRF" is not running
0 42.7% (96) 224 1
1 57.3% (129)
1 LDPR Categorical Candidate nominated by LDPR
is running 0 60.0% (135) 224 1
1 40.0% (90) 1 No Yabloko Categorical Candidate nominated by
Yabloko is not running 0 49.3% (111) 224 1
1 50.7% (114) 1 Unity Categorical Candidate nominated by Unity is
running 0 86.2% (194) 224 1
1 13.8% (31)
Table continues on next page.

8. The 1999 Duma Elections
228
Table 8.2: continued. Hypothesis
Level
Variable Label
Type of Variable
Description
Categorical: Percent of cases (N)
Mean
Std. Dev.
Min.
Max.
Cases
Missing
1 OVR Categorical Candidate nominated by OVR is
running 0 59.6% (134) 224 1
1 40.4% (91) 1 SPS Categorical Candidate nominated by SPS is
running 0 70.7% (159) 224 1
1 29.3% (66) 1 SPIRHER Categorical Candidate nominated by
"Spiritual Heritage" is running 0 52.4% (118)
1 47.6% (107)
Control 1 URBAN Continuous Percent of SMD population living
in urban centres 72.4 21.2 18.6 100.0 225 0

8. The 1999 Duma Elections
229
The models
The first finding on the 1999 elections is that the level of success of independent
candidates varies significantly from region to region, as shown by the fact that the level
2 variance of the constant in Model 0 is significantly different from zero (p < 0.01). A
multilevel approach is warranted (Table 8.3).
Table 8.3: Predicting independents' success.
Estimated multilevel "Null model"
Hypothesis Variable
Lev. Estim.
Fixed part
CONS 46.091 2.076 R
DOW 2
ASSER99A 2
ASSER99B 2
POLAPP 2
TRANSF 2
Accessibility REMOTE 2
Control URBAN 1
Random part
Level 2
CONS 169.603 57.296 **
Level 1
CONS 408.727 47.872 ***
-2*Log likelihood
N 224
2038.496
Model 0
Appeasement
Regionalist
assertiveness
S.Err.
**p < 0.01 ***p < 0.001
Similarly to the 1993 situation, however, the proportion of variability occurring at
the level of regions is rather small, with a coefficient of autocorrelation (ρ) of (169.6 /
408.7=) 0.29. The "Null model" also reveals that the average success of the
independents across the SMDs, weighted according to the RIGLS estimation
procedure,131
is 44.5 percent of the vote. The number of cases for the Null model is 224
because the vote did not take place in the separatist Chechen Republic, where a new
Russian military campaign had recently started.
131
See chapter 5.
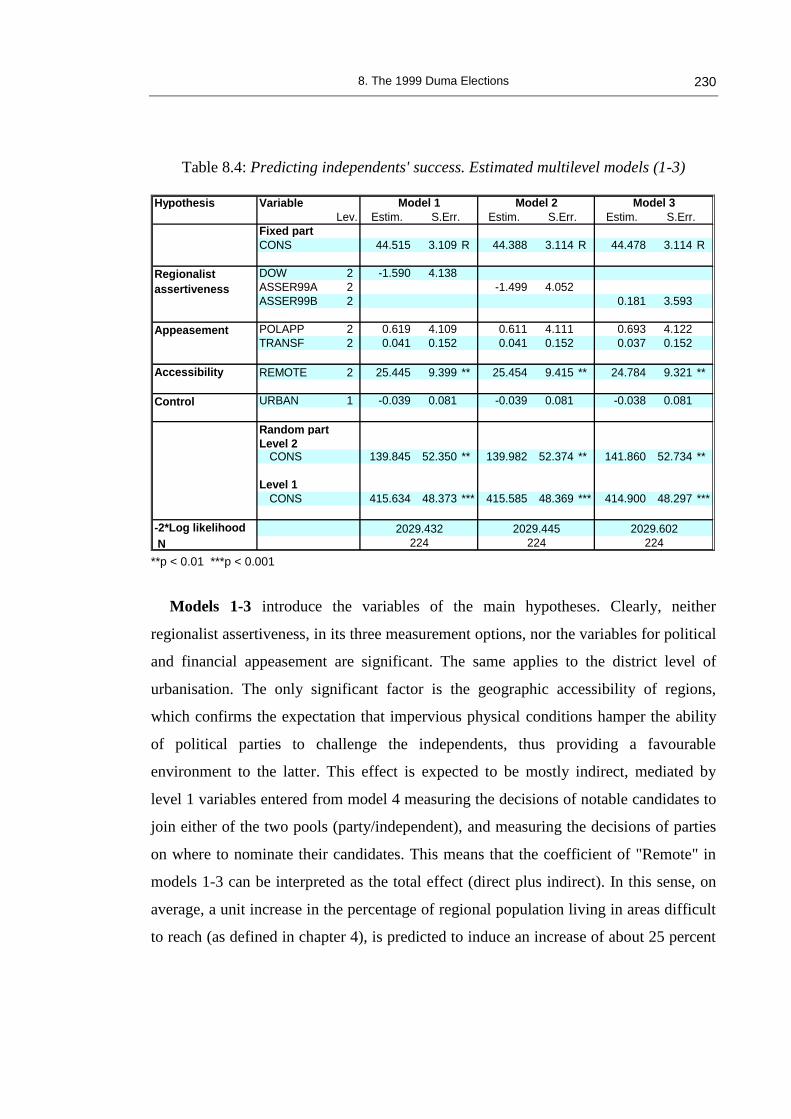
8. The 1999 Duma Elections
230
Table 8.4: Predicting independents' success. Estimated multilevel models (1-3)
Hypothesis Variable
Lev. Estim. Estim. Estim.
Fixed part
CONS 44.515 3.109 R 44.388 3.114 R 44.478 3.114 R
DOW 2 -1.590 4.138
ASSER99A 2 -1.499 4.052
ASSER99B 2 0.181 3.593
POLAPP 2 0.619 4.109 0.611 4.111 0.693 4.122
TRANSF 2 0.041 0.152 0.041 0.152 0.037 0.152
Accessibility REMOTE 2 25.445 9.399 ** 25.454 9.415 ** 24.784 9.321 **
Control URBAN 1 -0.039 0.081 -0.039 0.081 -0.038 0.081
Random part
Level 2CONS 139.845 52.350 ** 139.982 52.374 ** 141.860 52.734 **
Level 1
CONS 415.634 48.373 *** 415.585 48.369 *** 414.900 48.297 ***
-2*Log likelihood
N
Model 3Model 2Model 1
Regionalist
assertiveness
S.Err. S.Err. S.Err.
224 224 224
Appeasement
2029.432 2029.445 2029.602
**p < 0.01 ***p < 0.001
Models 1-3 introduce the variables of the main hypotheses. Clearly, neither
regionalist assertiveness, in its three measurement options, nor the variables for political
and financial appeasement are significant. The same applies to the district level of
urbanisation. The only significant factor is the geographic accessibility of regions,
which confirms the expectation that impervious physical conditions hamper the ability
of political parties to challenge the independents, thus providing a favourable
environment to the latter. This effect is expected to be mostly indirect, mediated by
level 1 variables entered from model 4 measuring the decisions of notable candidates to
join either of the two pools (party/independent), and measuring the decisions of parties
on where to nominate their candidates. This means that the coefficient of "Remote" in
models 1-3 can be interpreted as the total effect (direct plus indirect). In this sense, on
average, a unit increase in the percentage of regional population living in areas difficult
to reach (as defined in chapter 4), is predicted to induce an increase of about 25 percent

8. The 1999 Duma Elections
231
in the success of the independents. This is an average value that should be read while
bearing in mind that most regions have values of zero on this variable.132
Table 8.5: Predicting independents' success. Estimated multilevel models (4-6)
Hypothesis Variable
Lev. Estim. Estim. Estim.
Fixed part
CONS 48.571 3.441 R 48.091 3.469 R 47.960 3.450 R
DOW 2 -4.766 2.864
ASSER99A 2 -1.301 3.085
ASSER99B 2 -0.731 2.714
POLAPP 2 -0.132 2.837 0.145 2.874 0.157 2.866
TRANSF 2 0.060 0.107 0.053 0.108 0.054 0.108
UNITY 1 -8.292 3.562 * -7.991 3.583 * -7.940 3.582 *OVR 1 -15.320 2.619 *** -15.475 2.637 *** -15.557 2.632 ***No KPRF 1 18.706 2.491 *** 18.662 2.507 *** 18.688 2.507 ***LDPR 1 -5.786 2.511 * -5.662 2.524 * -5.625 2.526 *No YABL 1 4.519 2.480 4.400 2.495 4.392 2.500SPS 1 -8.669 2.777 ** -8.307 2.808 ** -8.219 2.794 **NDR 1 -3.680 2.539 -3.411 2.549 -3.367 2.548SPIRHER 1 -2.090 2.537 -1.708 2.574 -1.602 2.552
Accessibility REMOTE 2 12.786 7.124 11.868 7.302 11.447 7.179
Control URBAN 1 -0.009 0.065 -0.011 0.065 -0.012 0.065
Random part
Level 2CONS 28.196 22.408 31.448 23.252 30.538 23.068
Level 1
CONS 290.429 32.448 *** 291.861 32.710 *** 292.678 32.770 ***
-2*Log likelihood
N 224 224
1910.359
224
1913.168 1913.256
Party challenge
Model 4 Model 6
S.Err.
Model 5
S.Err. S.Err.
Regionalist
assertiveness
Appeasement
*p < 0.05 **p < 0.01 ***p < 0.001
The first level 1 variables to be entered are those under the label of "party challenge",
starting from Model 4. In the first, simple, models to include party variables (Models 4-
6), it emerges that, of the parties that nominated their candidates in the SMDs, only
Unity, OVR, KPRF, SPS and LDPR have significant impacts in challenging the
independents.
132
Regions that have a non-zero share of population located in difficult areas are listed in chapter 4 (Table
4.3).

8. The 1999 Duma Elections
232
By contrast, Yabloko, "Spiritual Heritage" and NDR do not pose a significant
challenge to the independents despite having nominated candidates in 114, 107, and 90
SMDs respectively. The size (and the statistical significance) of the challenge effect is
especially large for the OVR and the KPRF.
As expected, the inclusion of party variables causes a decrease in the coefficient of
"Remote", whose effect is mediated by the party variables, and in the value of the -
2*log likelihood. Moreover, a sharp drop in the variance is observed not only at level 1,
where it is expected, but also at level 2, suggesting that part of the variability previously
attributed to differences across the regions, is derived in fact from level 1 variations.
The only difference among Models 4 to 6 is the use of alternative measurements of
regionalist assertiveness (as described in chapter 4). The findings are robust to these
changes. Because the -2log likelihood level is lower when "Dow" is used for regionalist
assertiveness, this variable is preferred to the alternative measures of that dimension in
the next models.
Model 7 expands the analysis to consider the effect of the distribution of notable
candidates in the two pools. It is interesting to note that, contrary to the 1995 case, the
decision of federal political elite members to run as independents did not significantly
improve the chances of the non-partisans. It is, instead, regional political occupational
status and district incumbency that can alter the results. In particular, where the
incumbent is an independent, this fact increases the vote share of the non-partisans by
almost 13 percentage points.
Two additional variables measured at level 1 are entered in Models 8 and 9, which
were not considered in the 1995 models. The categorical variable "FigCat" is elaborated
on the basis of data gathered by Henry Hale, as used in his forthcoming article in
Comparative Politics 2005 (see chapter 4). The variable, as built for this thesis, reflects
whether the financial backing by what Hale calls "Financial-Industrial Groups" (FIGs),
detected in a given district was predominantly aimed at independent vs. party
candidates. It is entered in the form of two dummies, "FIGPar" and "FIGInd", to reflect,
respectively, the fact that FIGs were supporting (predominantly) independents, or party
candidates. In both cases the effect is compared to SMDs where no clear support was
detected by Hale's sources, which constitute the base category of the variable.

8. The 1999 Duma Elections
233
Table 8.6: Predicting independents' success.
Estimated multilevel model 7
Hypothesis Variable
Lev. Estim.
Fixed part
CONS 42.628 3.561 R
DOW 2 -3.550 2.691
ASSER99A 2
ASSER99B 2
POLAPP 2 0.810 2.664
TRANSF 2 0.072 0.100
UNITY 1 -7.759 3.379 *
OVR 1 -14.910 2.497 ***
No KPRF 1 14.820 2.484 ***
LDPR 1 -3.931 2.414
No YABL 1 3.243 2.379
SPS 1 -6.195 2.684 *
NDR 1 -3.197 2.435
SPIRHER 1 -1.187 2.429
REGPOL 1 5.379 2.663 *
FEDPOL 1 3.802 3.634
INCUMB 1 12.854 2.873 ***
Accessibility REMOTE 2 12.182 6.854
Control URBAN 1 -0.062 0.062
Random part
Level 2
CONS 20.556 19.186
Level 1
CONS 264.604 29.399 ***
-2*Log likelihood
N
Candidate
notability
Regionalist
assertiveness
Appeasement
S.Err.
Party challenge
1883.255
224
Model 7
*p < 0.05 ***p < 0.001
This variable tests one important aspect of campaign finance, the backing that
candidates may receive from financial-industrial groups. It appears from model 8, that
financial backing for the independents markedly improved their chances. However, this
effect disappears when governor's support is considered in model 9. In model 8, it is
possible to observe that the LDPR challenge is not significant anymore, once the

8. The 1999 Duma Elections
234
financial support is considered. This suggests that the impact of the LDPR candidates
was mainly based on their financial backing.
Also based on Hale's data, the support that independent and party candidates may
receive from the regional governor is measured by the categorical variable "GovCat".
This introduces the effect of "administrative resources" into the equation. It is specified
by two dummy variables, "GovPar" and "GovInd", coded in a way similar to "FigCat".
Namely, "GovPar" takes a value of 1 for SMDs where the governor supports a party
candidate. "GovInd" takes a value of 1 where the governor supports an independent
candidate. When both dummies take the value of 0, no governor support was detected in
the SMD. The significance of the "GovPar" term confirms the expectation that
governor's support for a party candidate is a strong negative factor affecting the 1999
chances of independent candidates.
Figure 8.2: Governor's support for SMD candidates, by party
(based on Hale's data)
Candidate supported by governor
Mov. Supp. Arm
y
Spiritual heritage
Russian Party
SPSNDR
Unity
KPRF
OVR
Independent
Nu
mb
er
of
dis
tric
ts
100
80
60
40
20
0 69
27
43
89
Source: own elaboration of CEC data.

8. The 1999 Duma Elections
235
Table 8.7: Predicting independents' success. Estimated multilevel models (8-10)
Hypothesis Variable
Lev. Estim. Estim. Estim.
Fixed part
CONS 41.249 3.484 R 46.780 4.148 R 49.036 3.900 R
DOW 2 -2.316 2.754 -4.203 2.637 -3.148 2.540
ASSER99A 2
ASSER99B 2
POLAPP 2 1.251 2.701 2.382 2.548 3.228 2.543
TRANSF 2 0.056 0.101 0.060 0.094 0.060 0.094
UNITY 1 -9.416 3.347 ** -8.124 3.043 ** -8.255 2.908 **
OVR 1 -13.421 2.470 *** -7.484 2.361 ** -6.793 2.021 ***
No KPRF 1 14.451 2.424 *** 10.161 2.251 *** 10.210 2.063 ***
LDPR 1 -2.947 2.367 -0.710 2.167 -1.400 2.034
No YABL 1 2.655 2.354 2.977 2.116 3.452 1.940
SPS 1 -5.513 2.619 * -1.772 2.401 -2.763 2.271
NDR 1 -3.656 2.377 -4.080 2.144 -4.487 1.950 *
SPIRHER 1 -1.324 2.371 -2.237 2.166 -3.244 1.860
REGPOL 1 6.221 2.612 * 6.335 2.351 ** 5.172 2.235 *
FEDPOL 1 3.756 3.540 3.829 3.187 1.181 3.032
INCUMB 1 12.199 2.799 *** 12.258 2.507 *** 11.586 2.394 ***
FIGCAT
FIGIND 1 10.148 3.320 ** 5.238 3.067 4.456 2.717
FIGPAR 1 -4.923 3.618 -2.080 3.317 -4.092 3.107
GOVCAT
GOVPAR 1 -17.709 3.423 *** -18.951 2.226 R
GOVIND 1 -0.708 3.292 -2.303 2.674 R
FREESP 2 -0.199 0.138 -0.196 0.137
Accessibility REMOTE 2 8.666 6.913 2.949 6.418 2.410 6.028
Control URBAN 1 -0.070 0.062 -0.040 0.058 -0.070 0.053
Random part
Level 2
CONS 30.373 20.326 34.790 18.284 92.131 41.685
GOVPAR -48.031 16.585
GOVIND 51.852 51.852
CONS/GOVPAR 29.009 18.377
CONS/GOVIND -44.413 37.955
GOVPAR/GOVIND -78.253 16.842
Level 1
CONS 243.493 27.435 *** 189.250 21.579 ***
GOVPAR 199.161 30.762
GOVIND 111.540 25.292
No GOVSUPP 136.715 39.480
GOVPAR/GOVIND n.a. n.a.
GOVPAR/NoGOVSUPP n.a. n.a.
GOVIND/NoGOVSUPP n.a. n.a.
-2*Log likelihood
N
Model 10Model 8
S.Err.
Candidate
notability
Model 9
Financial support
Regionalist
assertiveness
Appeasement
Admin. resources
Party challenge
S.Err. S.Err.
1870.210 1819.163 1800.292
224 224 224 *p < 0.05 **p < 0.01 ***p < 0.001

8. The 1999 Duma Elections
236
Districts where the regional governor supports a party candidate see the joint share of
the independents drop by about 18 percentage points, compared to districts where no
candidate had the backing of the governor. It is interesting to note the lack of
significance of the specular effect, i.e. governor's support for an independent. Where
the governor backed an independent, this did not translate into a significant advantage,
compared to SMDs where the governor did not appear to back any candidate. While
about half of all governor-supported candidates were independents (Figure 8.2), the
most powerful governors seem to have backed party candidates. This is true of the OVR
party which was sponsored by some of the strongest regional "bosses", including
Luzhkov of the City of Moscow and Shaimiev of Tatarstan. Map 8.1 shows the regions
where OVR's share of the PR vote was above its all-Russian average. These regions are
the City of Moscow, Moscow oblast, the Republics of Bashkortostan, Tatarstan,
Mordovia, Chuvashya, Ingushetia, Dagestan, Karachaevo Cherkessia, Kabardino
Balkaria, and North Ossetia, and the autonomous okrugs of Aga Buriat and Nenets.
Many of these units' leaders had joined. or affiliated with, OVR.
Map 8.1: Regional concentration of the OVR vote, PR tier, 1999 Duma elections
OVRs share of regional vote (1999)Below averageAbove average
8. The 1999 Duma Elections
237
It is worth noting that entering the "GovCat" variable also eliminates the significance
of the party challenge of SPS, while reducing the effect of OVR and KPRF. This
finding points to the collinearity of these variables with "GovCat", which confirms that
the impact of these parties was partially due to the support received from regional
governors and to their administrative resources. A description of the distribution of
Governor's support across candidates and districts is presented in Figure 8.2 above.
Model 10 allows for complex variability to be modelled. The effect of governor's
support is allowed to vary across regions and across SMDs. In other words, the rigid
assumption that the variance is constant along the values of the predictors is relaxed for
the "GovCat" variable. Indeed, based on model 10, the assumption of homoskedasticity
at level one must be rejected, as the variance terms are (both individually and jointly)
significantly different from zero. Level 2 variance is also significant (joint chi-sq test).
As for the heterogeneity of the effect of "GovCat" at level two, it is expected that the
effect of governor's support is not constant across regions, but that it increases the more
tightly he controls the regional political process. This cross-level interaction is explored
in the last two models. It can be noted that the more complex specification produces a
more precise model, with a lower -2*log likelihood.
Finally, Models 11 and 12 add the interaction between governor's support (the two
dummies of "GovCat") and freedom of speech, based on the expectation that support by
the governor should count more in regions with lower levels of freedom in the
information sphere. Indeed, one key avenue for the governor to control regional politics
is through his control of the regional media. This is confirmed by the fact that the
interaction term for governor's support of a party candidate is significant. This means
that that districts where a party candidate is supported by the governor are less
favourable to the independents, but also that this negative effect increases the more
controlled the circulation of information is in a region (i.e. the worse a region scores on
"Freesp"). In Model 12 the non-significant party variables are eliminated.
The interaction effect between "GovSupp" and "Freesp" is graphically depicted in
Figure 8.3 below. The three regression lines are obtained with the MLwiN "predictions"
tool, by predicting Y by means of "Freesp", "GovCat" and "Freesp*GovCat" only, but
based on the specification of the whole Model 12. In this way, a simple relationship is

8. The 1999 Duma Elections
238
singled out from a multiple regression model, while controlling for all other variables in
that model. The regression lines are then plotted against the scatter of observations.
The lower line with a positive slope represents the relationship between freedom of
speech and independents' success for districts where the governor supports a party. Of
the other two lines, the dark blue one, with a smaller slope, represents the relationship
for districts with no clear governor's support. The difference between these two lines is
shown to be significant in Model 12. On the contrary, the difference between the third
line (green, steep negative slope), representing districts where the governor supports an
independent, and the line for "no clear support", is not significant.
Figure 8.3: The cross-level interaction
between Governor's support and freedom of speech
(Predicted from Model 12, overlap with plot of observed cases)
In short, the graph quite clearly shows that, among districts where the governor
supports a party challenger, independents' success is generally lower than in other
districts, but it grows as the media environment becomes freer (positive slope line). On
the contrary, among districts where the governor supports an independent, independents'
success is higher on the whole, but decreases for higher levels of freedom of speech
(green, negative slope line).

8. The 1999 Duma Elections
239
Table 8.8: Predicting independents' success. Estimated multilevel models (11-12)
Hypothesis Variable
Lev. Estim. Estim.
Fixed part
CONS 49.606 3.983 R 47.495 3.287 R
DOW 2 -3.159 2.495 -2.703 2.476
ASSER99A 2
ASSER99B 2
POLAPP 2 3.568 2.532 3.823 2.457
TRANSF 2 0.060 0.093 0.064 0.093
UNITY 1 -7.484 2.938 * -6.553 2.959 *OVR 1 -7.217 2.294 ** -7.193 2.223 **No KPRF 1 9.651 2.100 *** 8.951 2.125 ***LDPR 1 -0.957 2.044No YABL 1 2.861 2.006SPS 1 -2.422 2.262NDR 1 -4.137 2.050 * -4.259 2.020 *SPIRHER 1 -3.320 1.941
REGPOL 1 5.562 2.238 * 6.694 2.233 **
FEDPOL 1 2.061 3.055
INCUMB 1 11.811 2.393 *** 12.899 2.353 ***
FIGCAT
FIGIND 1 4.934 2.748 5.700 2.735 *
FIGPAR 1 -3.284 3.212 -2.199 3.128
GOVCAT
GOVPAR 1 -20.587 2.438 R -20.625 2.337 R
GOVIND 1 -4.091 2.735 R -3.666 2.595 R
FREESP 2 -0.123 0.213 -0.268 0.227
FREESPxGOVIND 1x2 -0.290 0.235 -0.186 0.242
FREESPxGOVPAR 1x2 0.237 0.153 0.371 0.181 *
Accessibility REMOTE 2 1.902 6.154 1.738 6.377
Control URBAN 1 -0.092 0.053 -0.118 0.052 *
Random part
Level 2CONS 93.578 41.826 120.516 50.249 R
GOVPAR -37.672 18.020 -3.364 24.442
GOVIND 36.395 45.111 24.181 44.949
CONS/GOVPAR 17.737 20.011 -19.306 29.301
CONS/GOVIND -38.213 34.789 -41.252 38.447
GOVPAR/GOVIND -80.955 19.954 -72.282 25.672
Level 1
CONS
GOVPAR 192.839 31.052 180.669 31.424
GOVIND 113.587 26.016 119.600 27.782
No GOVSUPP 148.658 46.490 146.934 50.810
GOVPAR/GOVIND n.a. n.a. n.a. n.a.
GOVPAR/No GOVSUPP n.a. n.a. n.a. n.a.
GOVIND/No GOVSUPP n.a. n.a. n.a. n.a.
-2*Log likelihood
N 224 224
1796.273 1803.151
Cross-level
interactions
Candidate
notability
Financial support
Regionalist
assertiveness
Appeasement
Admin. resources
Model 12Model 11
S.Err. S.Err.
Party challenge
*p < 0.05 **p < 0.01 ***p < 0.001

8. The 1999 Duma Elections
240
In other words, governor's support makes a great deal of difference in regions where
the public sphere is tightly controlled (as reflected in the freedom of speech index). This
is shown by the wide gap between the two lines on the left side of the graph. However,
governor's support makes less of a difference as freedom of speech increases, to the
point that it makes virtually no difference in regions with pluralistic information
domains, as illustrated by the narrow gap between the two lines on the right side of the
graph. This provides solid confirmation that governor's preference, on its own, only
reflects part of the story on administrative resources and that the cross-level interaction
provides a more realistic perspective.
Conclusion
This chapter reaches sharply different conclusions than the previous two. It has been
shown that in 1999 regionalist assertiveness is not correlated with independents' success
anymore. Autonomism is not affecting the outcome in a mediated way either, through
political parties' nomination decisions, as in 1993 and 1995. However, parties do appear
to mediate the effect of physical accessibility of districts. Indeed, the coefficient for
"Remote" decreases once party variables are entered.
The irrelevance of regionalist assertiveness can be explained with reference to the
change in the political environment. In particular, the fact that the leaders of restive
regions managed to form a viable political alliance culminating in the formation of the
OVR party. This deprived the hypothesis of a key precondition for its operation -the
absence of meaningful "parties of the regions". In this sense, the findings of the 1999
model are consistent with the explanatory framework presented in the thesis.
It should be noted that the overall level of success of the independents (high in 1993,
lower in 1995 and high again in 1999) is not necessarily connected to the operation of
the core hypothesis. The latter hypothesis aims at explaining why the independents are
more successful in some district than in others, not the overall, average levels. To
explain diachronic changes, the literature has already pointed to the effect of changing
institutional rules. The validity of these explanations, which all apply at the national
level, may be debated but they certainly face the paradox of sub-national differences

8. The 1999 Duma Elections
241
and patterns. In 1999, if regionalist assertiveness cannot explain these spatial
differences, the emergence of administrative resources as a main tool of voters'
mobilisation can. This is, however, not just a story of governors supporting party
candidates, thus reducing the chances of the independents. The effect of governor's
support is significantly dependent on cross-regional differences in the level of political
pluralism, first of all pluralism in the realm of production and dissemination of
information.

242
9
Conclusion
The task of this last chapter is twofold. The first part summarises the main points of the
whole thesis. These include the research question, the limits of the existing literature,
the adopted research design and explanatory framework, and the findings of the
empirical analysis. The second task is to discuss the implications of the findings for a
number of scholarly debates. In this respect, the most direct contribution of the thesis is
in the field of Russian party and electoral studies, on notions of party identification and
on the determinants of voting behaviour generally (section 9.2). The implications of the
empirical findings, however, can reach beyond Russia's borders, and help qualifying
widely spread assumption on the role of parties in the processes of democratic
consolidation and federal building (section 9.3).
9.1 A summary of the thesis
The research question
The thesis has presented an empirical investigation of the causes of sub-national
variation in the success of independent candidates in Russian elections to the Duma, the
Lower House of the Federal Parliament. The introductory chapter of the thesis has
stressed that independent candidates' proliferation has been one of the starkest signs of
party weakness in the 1990s. It has been argued that this is an important subject because
political parties are essential to the functioning of modern democracy. Indeed, only
institutionalised parties can provide the collective accountability of rulers (Aldrich
1995).

9. Conclusion
243
The proliferation of the independents has two main dimensions. At the national
level, the independents have received a very substantial share of the vote cast in
territorial districts, ranging from 35 to 60 percent across the first three post-communist
elections. These are very large figures compared to established democracies such as the
U.K., but they are also large compared to other post-communist young democracies, the
only comparable levels being observed in Ukraine. This picture, however, only captures
part of the phenomenon. There is much to be learnt about independents' proliferation
from the sub-national level. Indeed, the introductory chapter has shown that the level of
success for parties/independent candidates varies widely across the territory of the
Russian Federation. Two images of such variability are presented in Map 1.1 and Map
5.1.
The existing literature
The task of the thesis has been to explain this sub-national variation in independent
candidates' proliferation. This angle is heuristically fruitful because it challenges the
conventional wisdom based on the national picture, and adds a new dimension to the
scholarly understanding of party development in Russia. Chapter 2 has illustrated the
lack of suitable explanations in the existing literature. Indeed, while some scholars have
studied party development in the regions, they have chosen a limited number of federal
units (e.g. Colton and Hough 1998; Moser 1999; Hutcheson 2003); have investigated
regional-level elections (e.g. Golosov 1997, 1999; Gelman and Golosov 1998); or have
failed to adopt a convincing explanatory framework or methodology (e.g. Moser 1999;
Golosov 2002; Golosov and Shevchenko 2000). As a result, the approach to party
weakness that receives most currency takes two shapes, both confined to the national
average and the stereotypical aspects of the phenomenon.
The first type includes empirical studies based on opinion surveys and on the
proportional representation (PR) side of Russia's mixed electoral system (e.g. White,
Rose and McAllister 1997; Colton 2000; Colton and McFaul 2003). Because PR ballots
by definition only include party labels, these works can study the determinants of
support for one party vs. the other, but not the causes of partisanship as such. This
limitation also affects the contributions of electoral geographers that have sought to

9. Conclusion
244
explain spatial patterns in the distribution of PR votes (e.g. Clem and Craumer 1996,
2000).
The second type of studies includes qualitative approaches that link party weakness
to the legacies of the Soviet regime ("flattened" social structure and authoritarian
political culture, e.g. Linz and Stepan 1996 and Eckstein et al. 1998, respectively), or to
contingent factors (presidentialism, the electoral system, above-parties stance of the first
president, e.g. Huskey 1999, Moser 2001 and Fish 1995a, respectively). Useful as it is
for explaining Russia's party weakness at the national level, this approach is of little
help in explaining sub-national variations because the proposed factors are constant
across the regions.
Research design
How should the research question be addressed then? As the Introduction and chapter 5
have explained, this thesis has adopted a statistical large-n design that takes into account
all districts in all regions where the Duma vote took place in 1993, 1995 and 1999. The
focus of attention has been on the sub-national variability in the success of independent
candidates, measured as the total vote share received by the independents in each of 225
single-member districts (SMDs). SMDs constituted the unit of analysis, the smallest
level at which the data are gathered or aggregated. The design took into account the fact
that electoral districts are grouped within regions. This is important because key
explanatory factors of cross-regional variation in the outcome apply at the level of
region and make SMDs belonging to the same region more similar to each other than
SMDs randomly taken.
In the jargon of statistics this phenomenon is called autocorrelation and leads to
biased estimates if not dealt with in the quantitative analysis. The best way to take this
data property into account is to use multilevel modelling. One key advantage over the
more traditional analysis of variance technique is that multilevel modelling allows one
not only to detect cross-regional differences, but also to explain them by means of
regional variables (chapter 5). Indeed, the main variables of the explanatory framework
of this thesis apply at the level of regions, while other variables are properties of
districts. Just which variables were expected to explain sub-national variations in the
success of the independents is summarised in the next sub-section.

9. Conclusion
245
The explanatory framework
Chapter 3 has shown that the explanations put forward in this thesis revolve around the
notion that the electoral process should be placed in its wider political context. In
particular, it has been argued that it is important to link voting behaviour to the process
of federal bargaining unfolding over much of the 1990s, after seventy years of fictitious
federalism under the Soviet regime. In this respect, the 89 Russian federal units
("regions" for brevity) can be ideally placed on a continuum according to the degree of
autonomism advocated in the federalisation process. Some regions demanded a
federation in which units had greater autonomy or even independence (Chechnya),
while at the opposite end of the spectrum other regions advocated greater centralisation
in centre-regional relations. A quantitative measure of regional autonomy stances was
adapted from an index elaborated by Kathleen Dowley (1998).
A key claim of this thesis has been that regionalist assertiveness (the degree of
autonomy demands) had a positive effect on the success of independent candidates. This
hypothesis rested on two considerations. Firstly, the more assertive a region, the
stronger its anti-centralist sentiments and the less popular national parties based in
Moscow. Secondly, regionalist parties, which could be popular in assertive regions, are
heavily discouraged under the electoral system (registration rules, and PR barrier of
representation) and have been absent from the ballots. Under these circumstances,
regionalist assertiveness constituted a territorial cleavage (in the sense defined by Lipset
and Rokkan 1967) that gave the independents a competitive advantage over political
parties in articulating and representing regionalist sentiments. However, centre-regional
relations clearly involved two actors -the regions and the federal centre. In addition to
regional demands, therefore, it was necessary to consider (and statistically control for)
central responses. In particular, Moscow tried to appease the most vocal regions by
means of bilateral treaties and other concessions that defused anti-centralist sentiments.
Moreover, regional "administrative resources" were also considered for the 1999
models. This factor refers to the support that a regional governor can provide for a given
candidate. Data kindly made available by Henry Hale were used to identify which
candidate received governor's support in which district. The effect of such support was
expected to be greater the tighter the governor's control over regional politics (as
indicated by the level of freedom of speech observed in the region). The independents

9. Conclusion
246
would be advantaged/penalised according to whether the governor supported an
independent or a party candidate. For the 1999 vote, Hale's data also allowed a test of
the impact of financial backing on independents' success. Geographic accessibility
has also been considered as an explanatory factor of spatial differences in the
proliferation of the independents. This effect has been posited to be indirect, as it
negatively affects the ability of national parties to nominate their candidates in regions
with very cold temperatures or stretching over mountainous territories, especially as the
elections are held in December.
The explanatory factors mentioned so far apply at the level of region. Independents'
success, however, was observed at the sub-regional level of electoral districts and varied
widely among SMDs. Clearly, this portion of variability had to be addressed by district-
level factors. Two such factors were identified in the strategic decisions of key actors of
SMD races - political parties and notable candidates. As for political parties, the
expectation was that major national parties are endowed with greater name
recognition (brand name effect) and could be expected to reduce the chances for the
independents by simply entering an SMD race (no party managed to nominate its
candidate in all, and very few in most, districts). It should be remembered that
regionalist parties are virtually absent due to electoral rules (chapters 3 and 7 discussed
marginal exceptions). With regard to notable candidates, the assumption was that they
have greater a priori chances of success (due to their local visibility, resources,
connections with the local administration, incumbency, etc.). Therefore, they would
boost or dampen the success of the independents according to their decision to stand as
independent or party candidates, respectively.
The explanatory framework also took into account the fact that the decisions of
parties to enter a given race, and of notables to stand as independent vs. party
candidates, are strategic. This means that such decisions are affected by the expectation
of success/failure that are associated with them. In other words, parties were expected to
be more likely to enter an SMD race where they hoped for greater chances of success.
Similarly, notables were expected to be more likely to stand as independents where they
felt that party nomination would reduce their chances of success. One key factor
determining these actors' expectations of success was regionalist assertiveness.

9. Conclusion
247
It follows that notable candidates were expected to be more likely to run as
independents, and parties to avoid entering the contest, the greater regionalist
assertiveness. As a result, in addition to its direct effect, regionalist assertiveness was
expected to have a positive indirect effect on independents' success, mediated through
the strategic decisions of notables and parties. A similar indirect effect was also
expected for geographic accessibility. A path diagram of direct and indirect causal
relations has been portrayed in Figure 3.1.
The findings
All the main hypotheses summarised above received confirmation to some extent in the
statistical analysis, although the causal dynamic of 1999 vote was different from the
mechanism behind the previous two elections. Chapters 6 and 7 showed that
independent candidates enjoyed a competitive advantage over national parties in
articulating territorial cleavages in the first two elections. Indeed, controlling for
instances of central appeasement, levels of regionalist assertiveness had a statistically
significant and positive effect on the electoral chances of independent candidates in
1993 and 1995. This effect is not observed in the 1999 elections, when the leaders of
assertive regions managed to form a political party to "storm the Kremlin" in view of
the 2000 presidential elections (chapter 8). This meant that voters in a number of
assertive regions would be induced to support the new interregional party, instead of
independent candidates. This explains why, in the models for 1999, the coefficient for
regionalist assertiveness, while not meeting conventional levels of statistical
significance, had a negative sign.
In the 1999 case, the widespread belief that regional administrative resources were
paramount has been partially confirmed by the analysis of the SMD vote. Governor's
support indeed helped parties challenge the independents, but it did not appear to make
a significant difference when it was geared towards the independents. This is because
the "weight" of regional leaders backing parties, especially OVR, and those backing
individual independent candidates, was markedly different. The "big khozyains"
(bosses) were behind OVR candidates, not the independents. Also, not surprisingly,
governor's support appeared to be collinear with the support of large financial interests.

9. Conclusion
248
Even so, the backing of Financial-Industrial Groups (FIGs) significantly increased the
chances of independent candidates (chapter 8).
It is important to note that, when it did apply, i.e. in 1993 and 1995, the effect of
regionalist assertiveness on independents' success has been confirmed to be both
direct and indirect. As expcted, the indirect portion of the effect was mediated through
the strategic considerations of key electoral actors - political parties and notable
candidates. The analysis confirmed that parties tended to nominate candidates in
favourable environments (low regionalist assertiveness) and to write some SMDs off as
too impervious. However, already in 1995, parties appeared to start widening their
spatial reach and contesting districts located in less favourable regions. Indeed, in 1995
major parties contested a lager number of SMDs than in 1993. Nevertheless, both in
1993 and 1995, levels of regionalist assertiveness were shown to play a significant role
in the strategic entry decisions for several parties (chapters 6 and 7).
The impact of the nomination decisions of major political parties and local notables
were also confirmed to be statistically significant. In terms of party challenges to the
independents, in 1999 an effective threat was represented, in descending order, by the
KPRF, OVR, "Unity" and, somewhat surprisingly given its poor PR performance, NDR
(chapter 8). In 1995, the independents were effectively challenged by the APR, the
"Bloc of Independents", NDR and the KPRF (chapter 7). In 1993, the greatest
challenges were posed by "Dignity and Charity", "Russia's Choice", the APR, the
LDPR, the DPR, Yabloko, "Civic Union", and the PRES (chapter 6). As for notable
candidates, in 1995 the independents were significantly more successful where they
could count members of the regional and federal elite, or the district incumbent in their
ranks. In 1999 this effect was confined to incumbency and regional elite status.133
Moreover, purely geographic considerations also played a significant role in
determining party resource allocations to the SMDs. For some parties, the difficulty of
reaching populations located in remote and inhospitable areas significantly reduced the
probability of entering the race. In addition to the effect of regionalist assertiveness and
geographic accessibility, levels of urbanisation are confirmed to be significantly
associated with a high probability that parties like Yabloko and Russia's Choice
nominate candidates. Geographic remoteness also negatively affected the probability
133
This variable could not be tested for the 1993 elections due to data availability constraints.

9. Conclusion
249
that local elites would run as party candidates (as shown by the model on "Regpol" in
chapter 7, Table 7.7).
9.2 Implications for the scholarly understanding of Russian elections
This study leads to an important reinterpretation of the phenomenon of the
independents. As noted in chapters 2 and 3, the prevalent view is that the independents
are just a sign of party failure. They proliferated because most parties lack the
organisational capacity to campaign effectively in the districts, and fail to attract local
notables to their ranks. Because parties cannot offer much in the way of campaign
resources, candidates endowed with personal assets (or supported by the governor
and/or by financial groups) decide to run as independents. This account is only partially
accurate.
This research has shown that the independents are not merely a sign of party failure.
A significant portion of their success is due to the fact that they fulfil a positive
articulation and representation function. Where territorial cleavages are salient the
independents face a competitive advantage over national parties, regardless of the latter
organisational resources. This advantage also takes the form of a disincentive for
national parties to even contest the districts in areas of high regionalist assertiveness.
The influence of regionalist assertiveness on the entry decisions of political parties
also suggests a qualification to the cross-contamination hypothesis according to which
the mixed electoral system provides parties with the incentive to nominate candidates in
as many SMDs as possible. In so doing, parties gain in local visibility and improve their
vote returns in the PR tier of the vote, even if they don't stand a chance to win the
district seat (Herron 2002). This view needs to be qualified by noting that party
incentives to nominate candidates in the SMDs also have a territorial dimension linked
to regional anti-centralist sentiments. The contamination effect posited by Herron
should not be taken to apply equally across the territory. However, the thesis that the
incentives for cross-tier contamination were stronger in 1995 (Belin and Orttung 1997),
is consistent with the finding that fewer parties were affected by levels of regionalist
assertiveness, in their SMD entry decision, than in 1993.

9. Conclusion
250
Moreover, as explained in chapter 3, the findings of this study help specify the
assertion found in the literature that the independents benefit from posing as the true
representative of "local interests". It is not just any kind of local interest that provides
them a competitive advantage over national parties. Local interests may well coincide
with the articulation of functional cleavages that are the domain of party representation.
For example a "local interest" may lie in the continued flow of central subsidies to a big
local plant, so that the district population remains employed. This issue is local but it
may well be articulated by a left-wing national party, because it connects to general,
nation-wide problems of state involvement in the economy. Only local interests that
coincide with a territorial cleavage, setting a territorial community aside from the rest of
the country, can be expected to provide an advantage to the independents. Regionalist
demands provide a clear example of such a territorial cleavage because they rooted in
individual regions. Even if several federal units demanded greater autonomy, their co-
ordination proved difficult until 1999 due to the different claims generating regionalist
(mainly ethno-cultural defence vs. resistance to fiscal exploitation) (Solnick 1996).
Perhaps, the most direct contribution made by this study to the literature on Russian
electoral politics regards the issue of "party identification". The reliance on opinion
surveys, based on the PR tier, meant that this literature has missed a great deal of
relevant information related to the proliferation of the independents in the SMDs. This
study suggests that the weakness of party attachments is not generalised, nor randomly
distributed across the country. Because attachment to regionalist parties is practically
ruled out by the electoral system, the only party attachment that voters can develop (to
national parties) is more likely to grow where centre-regional relations are co-operative
rather than conflictive, other factors being equal. Moreover, the analysis of the 1999
vote confirms the cynicism of those who stressed the mobilisational sources of Russian
voting behaviour. The governors of important regions can induce their voters to show
"attachment" to the "right" party.
The importance of administrative resources also qualifies, with regard to the 1999
elections, the view that the Russian electorate is becoming structured along social
cleavages. Some persistent lines of division among voters are indeed linked to social
traits (education, age, income, etc.) or to the urban/rural cleavage. However, to these
individual-level perspectives, macro-political regional effects should added. Namely,

9. Conclusion
251
the re-opening of the nation- and state-building processes after the collapse of the Soviet
system, and the ensuing process of centre-regional bargaining, has brought back to
prominence the territorial type of cleavage.
9.3 Comparative implications
One starting assumption of this research has been the importance of the party institution
for the functioning of democracy and for democratic consolidation. In addition to
representing the only way to ensure the collective accountability of the rulers towards
the ruled, parties are deemed to perform the vital task of deepening the legitimacy of the
political system, possibly integrating all sectors of society into the political process. As
a result, institutionalised parties can prevent that alienated and anti-systemic sentiments
explode outside democratic institutions (Huntington 1968; Morlino 1998).
In the case of federal systems, one possible source of anti-system stance is the
articulation of strong autonomy demands. Political parties are considered a key
institution that can counter this danger and help sustaining federal stability, by
integrating and moderating centrifugal forces. In the paradigmatic formulation of the
"integrated party", the party is expected to bridge "sectional" (territorial) divisions
because it needs to be a national organisation in order to conquer highly desired
national offices (primarily the presidency). The party cannot afford internal divisions,
and each individual member politicians is inclined to moderate the demands of his
particular constituency in order to advance a common cause and to keep the reputation
of the whole (Aldrich 1995, Cox 1997, Filippov et al. 2004). In this literature, the
requirements for the emergence of such integrated party are mainly institutional. Parties
should aspire to win important national office, and control its spoils, in order to have an
incentive to be national and to bridge territorial cleavages. If integrated parties are the
solution, regionalist parties are part of the problem. Indeed, one clear implication of the
theory of the "integrated party" is that regionalist parties, i.e. parties based in one
federal unit (or a subset of units) and representing the territorial (sectional) cleavage,
should be avoided as inimical to federal stability.

9. Conclusion
252
This approach to federal stability, parallels the discussion of the role of parties in
democratic consolidation in that it focuses on the type of party that can best promote the
outcome134
, while the prior logical step of whether the party institution is necessary at
all is usually skipped.135
This thesis, by looking at non-party candidates, suggests taking
a step back and considering the question of "whether parties". The relationship between
party development and federal stability is inherently different for transitional and
consolidated democracies. In established federations like the USA and Canada,
territorial cleavages emerged after the development of the party system. The party was
the natural channel for regionalist grievances, if only because an organisation was
needed to compete with existing party organisations. By contrast, in a transitional
setting, especially in one as difficult as post-communist transformations, parties are
doomed to be organisationally weak and deprived of local and social roots. In Russia,
the federalisation process began at the very beginning of the transition from Soviet
system, even before the formal birth of sovereign Russia, and could not find an effective
channel of representation in the party institution.
In a transitional setting the very emergence of parties should be taken as problematic.
It makes more sense to ask what is the impact of centre-regional relations on party
development, than the opposite question of what type of party can best stabilise federal
relations (as with the "integrated party" approach). Indeed, this thesis has shown how
centre-regional relations can become a key casual factor of uneven party development
across the country, at least under Russian conditions. Clearly, the drafters of the Russian
electoral law sought to undermine the possibility for genuine and viable regionalist
parties to emerge. At the same time, however, the parties that did emerge, while
"national" in name, did not live up to the standards of the "integrated party" model.
Especially, they could not effectively "bridge" territorial/sectional divisions and
completely replace regionalist with national loyalties. As a result, regionalist sentiments
were salient in some regions, especially in the first half of the 1990's, and this favoured
the independents in the 1993 and 1995 elections.
134
The effect of centre-regional relations on party type is sometimes explored. See, for example,
Tuschhoff (1999) and Thorlakson (2002). 135
Both in the field of democratisation and in federal relations, the role of corporatist institutions, instead
of political parties, is sometimes explored (Pelinka 1999, Encarnacion 1999).

9. Conclusion
253
The Russian case suggests that, in the absence of strong national parties, and given
that regionalist parties are to be avoided, non-party electoral representation in the form
of the independents can provide a suitable compromise solution for federal stability. On
the one hand, the possibility to vote for independent candidates gives a "voice"
opportunity to regionalist sentiments, which would otherwise lack any channel of
expression absent regionalist parties. Lacking a "voice" option would increase the
alienation from the political process and feed into the anti-systemic potential of
regionalist sentiments.
While the independents would provide such a "voice" for autonomy demands, they
lack the ability to effectively promote the regionalist agenda. Indeed, the independents
failed to constitute a cohesive and disciplined group in the Duma. Many joined party
factions immediately after elected or decided form different groups.136
They come from
different regions, whose interests can be expected to be difficult to reconcile. Their
policy impact is less dramatic than would be that of a cohesive regionalist party based in
one or few regions.137
In this sense, the independents (unwittingly) contributed to
federal stability.
They provided a "safeguard valve" for the expression of anti-systemic pressures,
while ultimately failing to constitute an effective opposition to the centralisation drive
in federal relations that prevailed after 1999, with Putin. On the contrary, regionalist
parties would have entrenched and helped crystallise territorial cleavages, subjecting the
stability of the federation to far greater pressure than the independents could ever
manage. The independents, therefore, introduced an element of flexibility in the Russian
political system, that (together with more prominent flexibility tools, such as bilateral
negotiations) allowed the federal arrangement to survive the peak phase of regionalist
assertiveness.
By casting some doubts on the desirability of purely party-based representation under
transitional conditions in unstable federations, this research invites a reconsideration of
136
Parliamentary 'factions' formed primarily by independent candidates are "New Regional Policy" in the
first Duma, "Russia's Regions" in the second and third Duma, and "People's Deputy" in the third Duma. 137
Prominent students of the roll call voting in the Duma (Smith and Remington 2001; Remington 2003),
have not investigated the effect of independent nomination on legislators' policy attitudes. Smith and
Remington (2001) have seen the Duma as dominated by policy debates on the left-right dimension, while
regionalist issue would be salient in the Federation Council. Much as this is true, this research invites an
exploration of the stances of deputies elected as independents in the Duma voting. The names of the

9. Conclusion
254
the role of parties in the general task of democratic consolidation. The function of
articulation and representation of interests are not always best carried out by political
parties when these are weak and federal stability is threatened. Under such
circumstances, while it is sensible to discourage regionalist parties, it might be
advantageous for stability to allow regionalist sentiments to find a channel in non-party
representatives.
parliamentary factions (see previous fn.) formed by so many independents, indeed suggests a regionalist
concern.
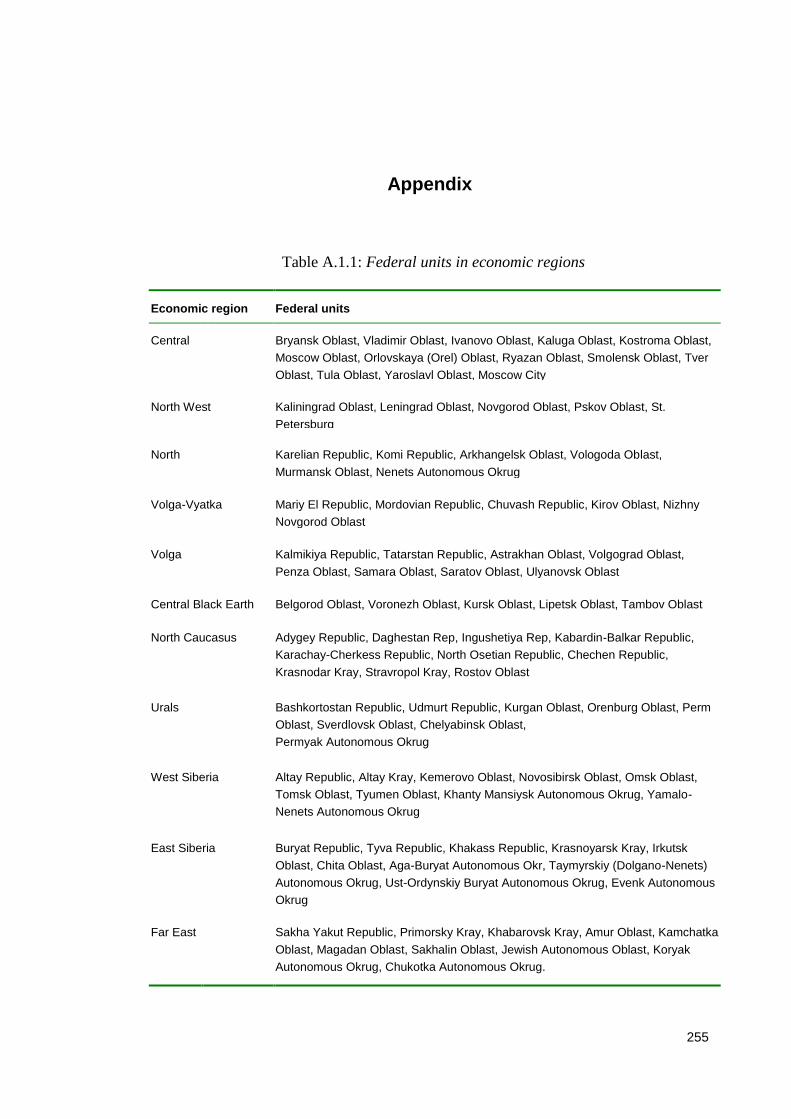
255
Appendix
Table A.1.1: Federal units in economic regions
Economic region Federal units
Central Bryansk Oblast, Vladimir Oblast, Ivanovo Oblast, Kaluga Oblast, Kostroma Oblast,
Moscow Oblast, Orlovskaya (Orel) Oblast, Ryazan Oblast, Smolensk Oblast, Tver
Oblast, Tula Oblast, Yaroslavl Oblast, Moscow City
North West Kaliningrad Oblast, Leningrad Oblast, Novgorod Oblast, Pskov Oblast, St.
Petersburg
North Karelian Republic, Komi Republic, Arkhangelsk Oblast, Vologoda Oblast,
Murmansk Oblast, Nenets Autonomous Okrug
Volga-Vyatka Mariy El Republic, Mordovian Republic, Chuvash Republic, Kirov Oblast, Nizhny
Novgorod Oblast
Volga Kalmikiya Republic, Tatarstan Republic, Astrakhan Oblast, Volgograd Oblast,
Penza Oblast, Samara Oblast, Saratov Oblast, Ulyanovsk Oblast
Central Black Earth Belgorod Oblast, Voronezh Oblast, Kursk Oblast, Lipetsk Oblast, Tambov Oblast
North Caucasus Adygey Republic, Daghestan Rep, Ingushetiya Rep, Kabardin-Balkar Republic,
Karachay-Cherkess Republic, North Osetian Republic, Chechen Republic,
Krasnodar Kray, Stravropol Kray, Rostov Oblast
Urals Bashkortostan Republic, Udmurt Republic, Kurgan Oblast, Orenburg Oblast, Perm
Oblast, Sverdlovsk Oblast, Chelyabinsk Oblast,
Permyak Autonomous Okrug
West Siberia Altay Republic, Altay Kray, Kemerovo Oblast, Novosibirsk Oblast, Omsk Oblast,
Tomsk Oblast, Tyumen Oblast, Khanty Mansiysk Autonomous Okrug, Yamalo-
Nenets Autonomous Okrug
East Siberia Buryat Republic, Tyva Republic, Khakass Republic, Krasnoyarsk Kray, Irkutsk
Oblast, Chita Oblast, Aga-Buryat Autonomous Okr, Taymyrskiy (Dolgano-Nenets)
Autonomous Okrug, Ust-Ordynskiy Buryat Autonomous Okrug, Evenk Autonomous
Okrug
Far East Sakha Yakut Republic, Primorsky Kray, Khabarovsk Kray, Amur Oblast, Kamchatka
Oblast, Magadan Oblast, Sakhalin Oblast, Jewish Autonomous Oblast, Koryak
Autonomous Okrug, Chukotka Autonomous Okrug.

Appendix
256
Table A.4.1: Ranking of regions on Dowley's index, with time-specific mean scores
Rank Region Dowley's index (1991-95 mean)
1988-93 mean score
1992-93 mean score
1994-95 mean score
1 Chechen Republic 4.62 4.37 4.58 4.72
2 Tatarstan Republic 4.33 4.37 4.44 4.07
3 Bashkortostan Republic 4.00 3.97 4.09 3.69
4 Mariy El Republic 3.86 3.40 3.60 3.50
5 Tyva Republic 3.80 3.71 3.82 3.57
6 Sakha Yakut Republic 3.68 3.49 3.58 3.77
7 Khakass Republic 3.64 3.56 3.75 3.33
8 Adygey Republic 3.62 3.30 3.38 .
9 Chuvash Republic 3.62 3.27 3.25 3.57
10 Karelian Republic 3.56 3.52 3.58 3.25
11 Buryat Republic 3.50 3.69 3.67 2.33
12 Ingushetiya Republic 3.50 3.50 3.53 3.31
13 Komi Republic 3.44 3.36 3.23 2.40
14 Udmurt Republic 3.43 3.38 3.78 4.00
15 Altay Republic 3.33 3.25 3.40 3.00
16 Nenets Autonomous Okrug 3.33 4.00 4.00 3.00
17 Khanty Mansiysk Aut Okrug 3.33 3.25 3.67 3.00
18 Chukotka Autonomous Okrug 3.33 3.75 3.00 2.00
19 Kalmikiya Republic 3.29 3.65 3.73 2.50
20 Yamalo-Nenets Aut. Okrug 3.25 3.60 3.50 2.50
21 Mordovian Republic 3.20 3.31 3.25 2.33
22 Taymyrskiy Aut. Okrug 3.17 3.67 3.67 2.75
23 Tyumen Oblast 3.13 3.08 3.20 2.33
24 North Osetian Republic 3.12 3.03 3.11 3.18
25 Kabardin-Balkar Republic 3.05 3.16 3.16 3.80
26 Sverdlovsk Oblast 3.04 2.95 2.90 3.07
27 Karachay-Cherkess Republic 3.00 3.31 2.88 2.33
28 Aga-Buryat Autonomous Okrug 3.00 3.00 3.00 2.50
29 Permyak Autonomous Okrug 3.00 3.50 4.00 3.00
30 Ust-Ordynskiy Buryat Aut. Okrug 3.00 3.00 3.00 2.50
31 Irkutsk Oblast 2.88 2.91 2.88 2.86
32 Vologoda Oblast 2.86 3.00 3.00 2.50
33 Daghestan Rep 2.84 2.90 2.94 2.20
34 Khabarovsk Kray 2.83 3.00 3.00 2.67
35 St. Petersburg 2.82 2.76 2.70 2.60
36 Omsk Oblast 2.80 2.00 2.00 2.67
37 Jewish Autonomous Oblast 2.80 3.00 3.33 2.50
38 Kaliningrad Oblast 2.79 2.88 3.20 2.43

Appendix
257
39 Nizhny Novgorod Oblast 2.79 2.82 2.90 2.71
40 Vladimir Oblast 2.75 2.50 3.00 2.67
41 Magadan Oblast 2.75 2.50 2.40 2.33
42 Chelyabinsk Oblast 2.75 2.75 2.73 2.33
43 Evenk Autonomous Okrug 2.75 3.00 3.00 2.50
44 Moscow City 2.72 2.70 2.50 2.71
45 Bryansk Oblast 2.71 2.50 2.50 2.00
46 Voronezh Oblast 2.71 2.67 2.75 2.67
47 Novosibirsk Oblast 2.69 2.73 2.67 2.14
48 Primorsky Kray 2.67 3.17 3.00 2.64
49 Astrakhan Oblast 2.67 3.00 3.00 2.00
50 Ivanovo Oblast 2.67 2.50 2.50 2.00
51 Kurgan Oblast 2.67 3.00 3.00 2.00
52 Murmansk Oblast 2.67 3.00 3.00 2.25
53 Novgorod Oblast 2.67 3.00 3.00 2.60
54 Orlovskaya (Orel) Oblast 2.67 2.57 2.50 1.80
55 Pskov Oblast 2.67 2.75 2.33 2.50
56 Chita Oblast 2.67 2.78 2.83 2.20
57 Kemerovo Oblast 2.64 2.71 2.57 2.50
58 Krasnoyarsk Kray 2.63 2.67 2.72 2.44
59 Volgograd Oblast 2.62 2.50 2.40 1.80
60 Amur Oblast 2.60 2.40 2.40 2.20
61 Leningrad Oblast 2.60 2.75 2.67 2.00
62 Altay Kray 2.57 2.40 2.67 2.33
63 Arkhangelsk Oblast 2.57 2.75 2.75 2.33
64 Tomsk Oblast 2.57 2.38 2.33 2.33
65 Samara Oblast 2.54 2.50 2.67 2.50
66 Kaluga Oblast 2.50 2.33 2.00 2.00
67 Kamchatka Oblast 2.50 3.00 3.00 2.67
68 Kirov Oblast 2.50 3.00 . 2.00
69 Penza Oblast 2.50 2.25 2.25 1.67
70 Perm Oblast 2.50 2.50 2.50 2.33
71 Saratov Oblast 2.50 2.75 2.88 2.20
72 Tambov Oblast 2.50 2.00 2.00 2.50
73 Yaroslavl Oblast 2.50 3.20 3.00 2.00
74 Moscow Oblast 2.43 2.50 2.50 2.33
75 Orenburg Oblast 2.43 3.00 3.00 1.67
76 Tula Oblast 2.43 2.50 2.33 2.29
77 Sakhalin Kray 2.38 2.25 2.00 2.00
78 Ulyanovsk Oblast 2.38 2.50 2.50 2.00
79 Krasnodar Kray 2.36 2.75 2.71 2.63
80 Kostroma Oblast 2.33 3.00 3.00 2.00
81 Smolensk Oblast 2.33 1.60 1.33 2.00
82 Stravropol Kray 2.25 2.71 2.50 2.27

Appendix
258
83 Belgorod Oblast 2.25 2.00 2.00 2.00
84 Rostov Oblast 2.20 2.56 2.60 2.10
85 Ryazan Oblast 2.00 2.00 2.00 2.00
86 Tver Oblast 2.00 2.67 2.00 2.00
87 Koryak Autonomous Okrug 2.00 . . 2.00
88 Lipetsk Oblast 1.75 1.67 1.80 2.00
89 Kursk Oblast 1.60 1.60 1.75 2.00
Russian Federation 2.84 2.91 2.91 2.53
The ranking is based on Column 3.

Appendix
259
Table A.4.2: Ranking of regions on Dowley's index adjusted for 1999
Rank Region Asser99a Asser99b
1 Chechen Republic 4.62 4.72
2 Tatarstan Republic 4.42 4.29
3 Sakha Yakut Republic 4.09 4.14
4 Bashkortostan Republic 4.00 3.85
5 Mariy El Republic 3.86 3.50
6 Nenets Autonomous Okrug 3.83 3.50
7 Khanty Mansiysk Aut Okrug 3.83 3.50
8 Chukotka Autonomous Okrug 3.83 2.50
9 Tyva Republic 3.80 3.57
10 Yamalo-Nenets Aut. Okrug 3.75 3.00
11 Taymyrskiy (Dolgano-N.) Aut. Okrug 3.67 3.25
12 Khakass Republic 3.64 3.33
13 Tyumen Oblast 3.63 2.83
14 Adygey Republic 3.62 3.62
15 Karelian Republic 3.56 3.25
16 Chuvash Republic 3.56 3.54
17 Buryat Republic 3.50 2.33
18 Ingushetiya Republic 3.50 3.41
19 Aga-Buryat Autonomous Okrug 3.50 3.00
20 Permyak Autonomous Okrug 3.50 3.50
21 Ust-Ordynskiy Buryat Aut. Okrug 3.50 3.00
22 Udmurt Republic 3.47 3.75
23 Komi Republic 3.44 2.40
24 Kalmikiya Republic 3.40 3.00
25 Vologoda Oblast 3.36 3.00
26 Altay Republic 3.33 3.00
27 Khabarovsk Kray 3.33 3.17
28 North Ossetian Republic 3.31 3.34
29 Jewish Autonomous Oblast 3.30 3.00
30 Kaliningrad Oblast 3.29 2.93
31 Samara Oblast 3.27 3.25
32 Vladimir Oblast 3.25 3.17
33 Magadan Oblast 3.25 2.83
34 Evenk Autonomous Okrug 3.25 3.00
35 Bryansk Oblast 3.21 2.50
36 Voronezh Oblast 3.21 3.17
37 Mordovian Republic 3.20 2.33
38 Astrakhan Oblast 3.17 2.50
39 Ivanovo Oblast 3.17 2.50
40 Kurgan Oblast 3.17 2.50
41 Murmansk Oblast 3.17 2.75
42 Pskov Oblast 3.17 3.00
43 Chita Oblast 3.17 2.70

Appendix
260
44 Kemerovo Oblast 3.14 3.00
45 Volgograd Oblast 3.12 2.30
46 Amur Oblast 3.10 2.70
47 Leningrad Oblast 3.10 2.50
48 Altay Kray 3.07 2.83
49 Arkhangelsk Oblast 3.07 2.83
50 Kabardin-Balkar Republic 3.05 3.80
51 Sverdlovsk Oblast 3.02 3.04
52 Karachay-Cherkess Republic 3.00 2.33
53 Kaluga Oblast 3.00 2.50
54 Kamchatka Oblast 3.00 3.17
55 Kirov Oblast 3.00 2.50
56 Perm Oblast 3.00 2.83
57 Saratov Oblast 3.00 2.70
58 Tula Oblast 2.93 2.79
59 Irkutsk Oblast 2.88 2.86
60 Sakhalin Oblast 2.88 2.50
61 Ulyanovsk Oblast 2.88 2.50
62 Krasnodar Kray 2.86 3.13
63 Daghestan Rep 2.84 2.20
64 Primorsky Kray 2.84 2.82
65 Kostroma Oblast 2.83 2.50
66 St. Petersburg 2.82 2.60
67 Omsk Oblast 2.80 2.67
68 Nizhny Novgorod Oblast 2.79 2.71
69 Stravropol Kray 2.75 2.77
70 Chelyabinsk Oblast 2.75 2.33
71 Moscow City 2.72 2.71
72 Rostov Oblast 2.70 2.60
73 Novosibirsk Oblast 2.69 2.14
74 Novgorod Oblast 2.67 2.60
75 Orlovskaya (Orel) Oblast 2.67 1.80
76 Krasnoyarsk Kray 2.63 2.44
77 Tomsk Oblast 2.57 2.33
78 Penza Oblast 2.50 1.67
79 Ryazan Oblast 2.50 2.50
80 Tambov Oblast 2.50 2.50
81 Yaroslavl Oblast 2.50 2.00
82 Koryak Autonomous Okrug 2.50 2.50
83 Moscow Oblast 2.43 2.33
84 Orenburg Oblast 2.43 1.67
85 Smolensk Oblast 2.33 2.00
86 Belgorod Oblast 2.25 2.00
87 Kursk Oblast 2.10 2.50
88 Tver Oblast 2.00 2.00
89 Lipetsk Oblast 1.75 2.00
Russian Federation 3.11 2.82

Appendix
261
Figure A.6.1: The impact of regional assertiveness on APR entry decisions
(Predicted from the "APR" logistic model in Table 6.6)
Figure A.6.2: The impact of regional assertiveness on Russia's Choice entry decisions
(Predicted from the "Russia's Choice" logistic model in Table 6.6)
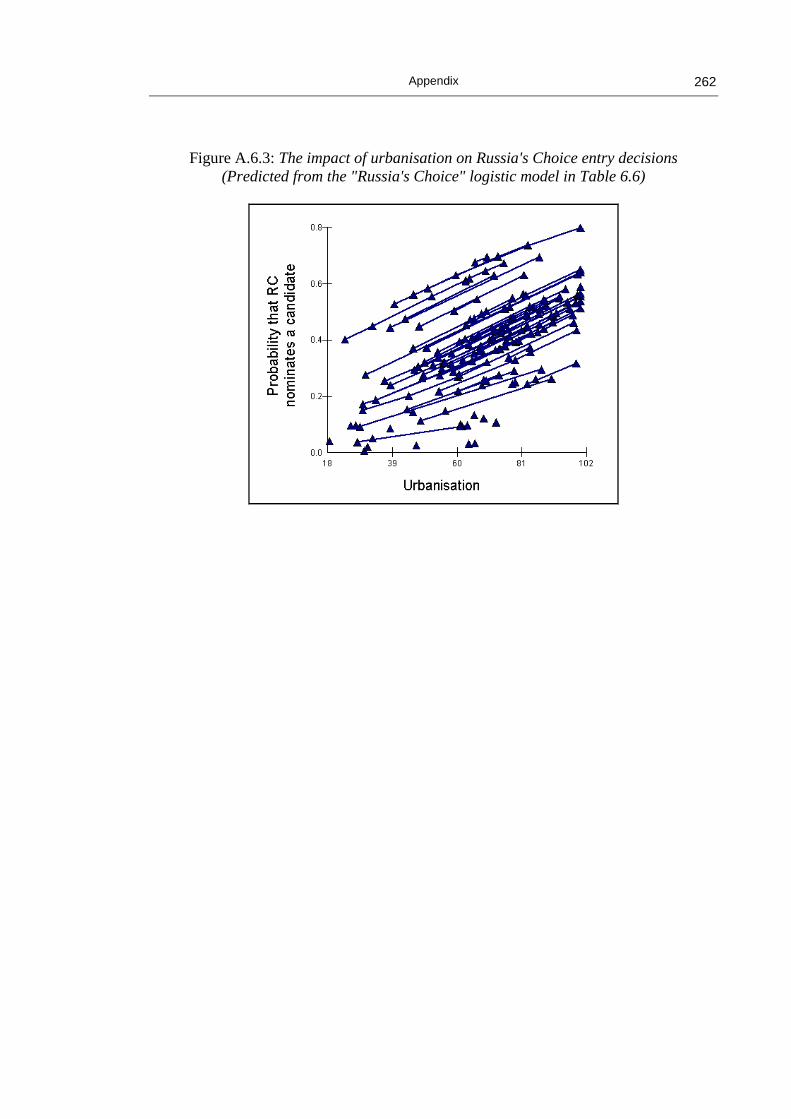
Appendix
262
Figure A.6.3: The impact of urbanisation on Russia's Choice entry decisions
(Predicted from the "Russia's Choice" logistic model in Table 6.6)

263
Bibliography
Achen, C. and W. Shively (1995). Cross-Level Inference. Chicago: University of
Chicago Press.
Aldrich, J. H. (1995). Why Parties? The Origin and Transformation of Political Parties
in America. Chicago and London: The University of Chicago Press.
Alexander, J. (2000). Political Culture in Post-Communist Russia: Formlessness and
Recreation in a Traumatic Transition. London and New York: Macmillan and St.
Martin's.
---- (2002). “Komi and the Center: Developing Federalism in an Era of Socioeconomic
Crisis.” in Centre-Periphery Relations in the Former Soviet Union: Unity or
Separation. Edited by D. R. Kempton and T. D. Clark, Westport (Connecticut)
and London: Praeger.
Alexseev, M. A. (1999). “Asymmetric Russia: Promises and Dangers.” in Center-
Periphery Conflict in Post-Soviet Russia. Edited by M. A. Alexseev, London:
Macmillan.
Alker, H. R. (1969). “A Typology of Ecological Fallacies.” in Quantitative Ecological
Analysis in the Social Sciences. Edited by M. Dogan and S. Rokkan, Cambridge
(MA) and London: MIT Press.
Allison, P. D. (1999). Multiple Regression. Thousand Oaks (CA), London, and New
Dehli: Pine Forge Press.

Bibliography
264
Ansolabehere, S., J. M. Snyder, Jr. and C. Stewart, III (2000). “Old Voters, New Voters,
and the Personal Vote: Using Redistricting to Measure the Incumbency.”
American Journal of Political Science, 44 (1): 17-34.
Azrael, J. R., E. Payin, Center for Russian and Eurasian Studies (Rand Corporation), et
al. (1998). Conflict and Consensus in Ethno-Political and Center-Periphery
Relations in Russia. Santa Monica, CA: Rand.
Balzer, M. M. (1999). “Dilemmas of Federalism in Siberia.” in Center-Periphery
Conflict in Post-Soviet Russia. Edited by M. A. Alexseev, London: Macmillan.
Bartolini, S. and P. Mair (1990). Identity, Competition, and Electoral Availability: The
Stabilisation of European Electorates 1885-1985. Cambridge: Cambridge
University Press.
Belin, L. and R. W. Orttung (1997). The Russian Parliamentary Elections of 1995.
Armonk, NY and London, England: M.E. Sharpe.
Blondel, J. (1981). “Political Integration and the Role of Political Parties: The Case of
Spain.” in Mobilization, Center-Periphery Structures and Nation-Building: A
Volume in Commemoration of Stein Rokkan. Edited by T. Per, Oslo:
Universitetsforlaget.
Brie, M. (1997). The Political Regime of Moscow - Creation of a New Urban Machine?
Berlin: Wissenschaftszentrum Berlin für Sozialforschung.
Brown, R. (1998). “Party Development in the Regions: When Did Parties Start to Play a
Part in Politics?” in Party Politics in Post-Communist Russia. Edited by J.
Löwenhardt, London: Frank Cass.
Brubaker, R. (1996). Nationalism Reframed. Cambridge: Cambridge University Press.
Bibliography
265
Brudny, Y. M. (1998). “St. Petersburg: The Election in the Democratic Metropolis.” in
Growing Pains: Russian Democracy and the Election of 1993. Edited by T. J.
Colton and J. F. Hough, Washington D.C.: Brookings Institution Press.
Bryce, J. (1888). The American Commonwealth. London: Macmillan.
---- (1921). Modern Democracies. London: Macmillan.
Bryk, A. S. and S. W. Raundenbush (1992). Hierarchical Linear Models. Newbury
Park, CA: Sage.
Budge, I. and H. Keman (1990). Parties and Democracy: Coalition Formation and
Government Functioning in Twenty States. Oxford: Oxford University Press.
Burns, K. G. (1998). “Primor'e: Local Politics and a Coalition for Reform.” in Growing
Pains: Russian Democracy and the Election of 1993. Edited by T. J. Colton and J.
F. Hough, Washington D.C.: Brookings Institution Press.
Butler, D. and D. E. Stokes (1974, 2nd edition). Political Change in Britain: Forces
Shaping Electoral Choice. London: Macmillan.
Cain, B. E., J. A. Ferejohn and M. P. Fiorina (1986). The Personal Vote: Constituency
Service and Electoral Independence. Cambridge, Mass.: Harvard University
Press.
Campbell, A., P. E. Converse, W. E. Miller, et al. (1960). The American Voter. New
York: John Wiley and Sons.
Canon, D. T. (1990). Actors, Athletes, and Astronauts: Political Amateurs in the United
States Congress. Chicago: University of Chicago Press.

Bibliography
266
Caramani, D. (2003). “The End of Silent Elections: The Birth of Electoral Competition,
1832-1915.” Party Politics, 9 (4): 411-44.
---- (2004). The Nationalization of Politics: The Formation of National Electorates and
Party Systems in Western Europe. Cambridge: Cambridge University Press.
Carey, J. M. and M. S. Shugart (1995). “Incentives to Cultivate a Personal Vote: A
Rank Ordering of Electoral Formulas.” Electoral Studies, 14 (4): 417-39.
Chaisty, P. and J. Gleisner (2000). “The Consolidation of Russian Parliamentarism: The
State Duma, 1993-8.” in Institutions and Political Change in Russia. Edited by N.
Robinson, London and New York: Macmillan and St. Martin's Press.
Chaisty, P. and P. Schleiter (2002). “Productive but Not Valued: The Russian State
Duma, 1994-2001.” Europe-Asia Studies, 54 (5): 701-24.
Chirikova, A. and N. Y. Lapina (2001). “Political Power and Political Stability in the
Russian Regions.” in Contemporary Russian Politics. Edited by A. Brown,
Oxford: Oxford University Press.
Clem, R. S. and P. R. Craumer (1996). “The Geography of the Russian 1995
Parliamentary Election: Continuity, Change and Correlates.” Post-Soviet
Geography, 36 (10): 587-616.
---- (1998). “Regional Patterns in Voter Turnout.” in Elections and Voters in Post-
Communist Russia. Edited by M. Wyman, S. White and S. Oates, Cheltenham,
UK; Northampton, MA, USA: Edward Elgar.
---- (2000). “Regional Patterns of Political Preference in Russia: The December 1999
Duma Elections.” Post-Soviet Geography and Economics, 41 (1): 1-29.

Bibliography
267
---- (2000a). “Spatial Patterns of Political Choice in the Post-Yel’tsin Era: The Electoral
Geography of Political Choice of Russia's 2000 Presidential Election.” Post-Soviet
Geography and Economics, 41 (7): 465-82.
---- (2002). “Urban and Rural Effects on Party Preference in Russia: New Evidence
from the Recent Duma Election.” Post-Soviet Geography and Economics, 43 (1):
1-12.
Colton, T. J. (1998). “Introduction. The 1993 Election and the New Russian Politics.” in
Growing Pains: Russian Democracy and the Election of 1993. Edited by T. J.
Colton and J. F. Hough, Washington D.C.: Brookings Institution Press.
---- (1998a). “Determinants of the Party Vote.” in Growing Pains: Russian Democracy
and the Election of 1993. Edited by T. J. Colton and J. F. Hough, Washington
D.C.: Brookings Institution Press.
---- (2000). Transitional Citizens: Voters and What Influences Them in the New Russia.
Cambridge (MA) and London: Harvard University Press.
Colton, T. J. and J. F. Hough, Eds. (1998). Growing Pains: Russian Democracy and the
Election of 1993. Washington D.C.: Brookings Institution Press.
Colton, T. J. and M. McFaul (2003). Popular Choice and Managed Democracy: The
Russian Elections of 1999 and 2000. Washington, D.C.: Brookings Institution
Press.
Cox, G. W. (1997). Making Votes Count: Strategic Coordination in the World's
Electoral Systems. Cambridge: Cambridge University Press.
Crowley, S. (1998). “The Kuzbass: Liberals, Populists, and Labor.” in Growing Pains:
Russian Democracy and the Election of 1993. Edited by T. J. Colton and J. F.
Hough, Washington D.C.: Brookings Institution Press.

Bibliography
268
Dahlberg, M. and E. Johnsson (2002). “On the Vote-Purchasing Behaviour of
Incumbent Governments.” American Political Science Review, 96 (1): 27-40.
Dallin, A., Ed. (1993). Political Parties in Russia. Berkeley: University of California at
Berkeley.
Dalton, R. J. and M. P. Wattenberg, Eds. (2000). Parties without Partisans: Political
Change in Advanced Industrial Democracies. Oxford: Oxford University Press.
Davis, J. A. (1985). The Logic of Causal Order. Beverly Hills, London and New Delhi:
Sage.
Dawns, A. (1957). An Economic Theory of Democracy. New York: Harper and Row.
Desai, R. M., L. M. Freinkman and I. Goldberg (2003). Fiscal Federalism and Regional
Growth: Evidence from the Russian Federation in the 1990s. Washington: The
World Bank.
Dowley, K. M. (1998). “Striking the Federal Bargain in Russia: Comparative Regional
Government Strategies.” Communist and Post-Communist Studies, 31 (4): 359-80.
Drobizheva, L. M. (1998). Asimmetrichnaya Federatsiya: Vzglyad Iz Tsentra, Respublik
I Oblastei. Moskva: Izdatelstvo instituta sotsiologii RAN.
Duverger, M. (1959 [1951]). Political Parties: Their Organization and Activity in the
Modern State. London and New York: Methuen and John Wiley.
Epstein, L. D. (1975). “Political Parties.” in Handbook of Political Science. Edited by
G. F.I. and P. N.W., Reading (Mass.): Addison-Wesley. IV.

Bibliography
269
Erikson, R. R., M. B. Mackuen and J. A. Stimson (2002). The Macro Polity.
Cambridge: Cambridge University Press.
Erikson, R. R., G. C. Wright and J. P. McIver (1994). Statehouse Democracy.
Cambridge: Cambridge University Press.
Evans, G. and S. Whitefield (1998). “The Emerging Structure of Partisan Divisions in
Russian Politics.” in Elections and Voters in Post-Communist Russia. Edited by
M. Wyman, S. White and S. Oates, Cheltenham, UK; Northampton, MA, USA:
Edward Elgar.
Farukhshin, M. (2002). “Tatarstan: Syndrome of Authoritarianism.” in Regional Politics
in Russia. Edited by C. Ross, Manchester and New York: Manchester University
Press.
Filippov, M., P. C. Ordeshook and O. Shvetsova (2004). Designing Federalism: A
Theory of Self-Sustainable Federal Institutions. Cambridge: Cambridge
University Press.
Filippov, V. L. (2001). “M.G. Rakhimov. Prezident Respubliki Bashkiriya.” in
Federalizm kak on ect... Intervyu s rukovoditelyami subektov RF o federalizme i
regionalnoi politike. Edited by V. L. Filippov and D. v. Grushkin, Moscow:
Rossiiskaya Akademiya Nauk Tsentr Tsivilizatsionnykh i regionalhykh
issledovanii; Institut "Vostok-Zapad".
Finer, H. (1949). Theory and Practice of Modern Government. New York: H. Holt.
Fish, S. M. (1995). “The Advent of Multipartism in Russia, 1993-95.” Post Soviet
Affairs, 11 (4): 340-83.
---- (1995a). Democracy from Scratch: Opposition and Regime in the New Russian
Revolution. Princeton: Princeton University Press.

Bibliography
270
---- (1997). “The Pitfalls of Russian Superpresidentialism.” Current History, 96 (612):
326-30.
---- (2001). “The Dynamics of Democratic Erosion.” in Postcommunism and the Theory
of Democracy. Edited by R. D. J. Anderson, S. M. Fish, S. E. Hansonet al,
Princeton and Oxford: Princeton University Press.
Flora, P., S. Kuhnle and D. Urwin, Eds. (1999). State Formation, Nation-Building and
Mass Politics in Europe: The Theory of Stein Rokkan: Based on His Collected
Works. Oxford: Oxford University Press.
Freinkman, L., D. Treisman, and S. Titov (1999). Subnational Budgeting in Russia:
preempting a potential crisis. Washington (DC): World Bank.
Friedgut, T. H. and J. W. Hahn, Eds. (1994). Local Power and Post-Soviet Politics.
Armonk, N.Y.: M.E. Sharpe.
Gelman, V. (1998). “The Iceberg of Russian Political Finance.” in Funding
Democratization. Edited by P. Burnell and A. Ware, Manchester and New York:
Manchester University Press.
---- (1999). “Second Europe-Asia Lecture. Regime Transition, Uncertainty and
Prospects for Democratisation: The Politics of Russia's Regions in a Comparative
Perspective.” Europe-Asia Studies, 51 (6): 939-956.
---- (1999a). “Subnational Institutions in Contemporary Russia.” in Institutions and
Political Change in Contemporary Russia. Edited by N. Robinson, London and
New York: MacMillan, St. Martin's Press.
---- (2003). “Post-Soviet Transitions and Democratizations: Towards Theory Building.”
Democratization, 10 (2): 87-104.

Bibliography
271
Gelman, V. and G. V. Golosov (1998). “Regional Party System Formation in Russia:
The Deviant Case of the Sverdlovsk Oblast.” in Party Politics in Post-Communist
Russia. Edited by J. Löwenhardt, London ; Portland, OR: F. Cass.
Glatter, P. (1999). “Federalization, Fragmentation, and the West Siberian Oil and Gas
Province.” in The Political Economy of the Russian Oil. Edited by D. Lane,
Lanham and Oxford: Rowman and Littlefield Publishers.
Goldstein, H. (1986). “Multilevel Mixed Linear Model Analysis Using Iterative
Generalised Least Squares.” Biometrika, 73: 43-55.
Golosov, G. V. (1995). “New Russian Political Parties and the Transition to
Democracy.” Government and Opposition, 30 (1): 110-19.
---- (1997). “Russian Political Parties and the 'Bosses': Evidence from the 1994
Provincial Elections in Western Siberia.” Party Politics, Vol.3 (No.1): 5-21.
---- (1999). “From Adygeya to Yaroslav: Factors of Party Development in the Regions
of Russia, 1995-1998.” Europe-Asia Studies, Vol.51 (8): 1333-65.
---- (2002). “Party Support or Personal Resources? Factors of Success in the Plurality
Portion of the 1999 National Legislative Elections in Russia.” Communist and
Post-Communist Studies, 35: 23-38.
Golosov, G. V. and Y. D. Shevchenko (2000). “Faktori Elektoralnogo Uspekha V
Odnomandatnykh Okrugakh.” in Pervyj Elektoralnogo Zikl V Rossii: 1993-
1996gg. Edited by V. Gelman, G. V. Golosov and E. Melenshkina, Moskva: Ves
Mir.

Bibliography
272
---- (2002). “Strategii Pereizbraniya Incumbentov Na Dumskikh Vyborakh.” in Vtoroi
Elektoralnyi Tsikl V Rossii: 1999-2000gg. Edited by V. Gelman, G. V. Golosov
and E. Y. Meleshkina, Moscow: Ves Mir.
Gorenburg, D. P. (2003). Minority Ethnic Mobilization in the Russian Federation.
Cambridge: Cambridge University Press.
Gould-Davis, N. (1998). “Nizhnii Novgorod: The Dual Structure of Political Space.” in
Growing Pains: Russian Democracy and the Election of 1993. Edited by T. J.
Colton and J. F. Hough, Washington D.C.: Brookings Institution Press.
Gudkov, L. and B. Dubin (2000). Rossiiskie Vybory: Vremiya Serykh. VTsIOM,
Moscow.
Hahn, J. W. (1997). “Democratization and Political Participation in Russian Regions.”
in Democratic Changes and Authoritarian Reactions in Russia, Ukraine, Belarus,
and Moldova. Edited by K. Dawisha and B. Parrott, Cambridge: Cambridge
University Press.
---- (2002). “The Development of Political Institutions in Three Regions of the Russian
Far East.” in Regional Politics in Russia. Edited by C. Ross, Manchester and New
York: Manchester University Press.
Hale, H. E. (1998). “Bashkortostan: The Logic of Ethnic Machine Politics and
Democratic Consolidation.” in Growing Pains: Russian Democracy and the
Election of 1993. Edited by T. J. Colton and J. F. Hough, Washington D.C.:
Brookings Institution Press.
---- (1999). “Machine Politics and Institutionalised Electorates: A Comparative
Analysis of Six Duma Elections in Bashkortostan.” Journal of Communist Studies
and Transition Politics, Vol.15 (No.4): 70-110.

Bibliography
273
---- (forthcoming 2005). “Why Not Parties? Electoral Markets, Party Substitutes, and
Stalled Democratization in Russia.” Comparative Politics.
Hanson, P., and Michael Bradshaw, Ed. (2000). Regional Economic Change in Russia.
Cheltenham, UK and Northampton, MA, USA: Edward Elgar.
Heckman, J. J. (1979). “Sample Selection Bias as a Specification Error.” Econometrica,
47 (1): 153-62.
Helf, G. and J. W. Hahn (1992). “Old Dogs and New Tricks: Party Elites in the Russian
Regional Elections of 1990.” Slavic review, 51 (3): 511-30.
Herrera, R. and M. Yawn (1999). «The Emergence of the Personal Vote.» Journal of
Politics, 61 (1): 136-50.
Herron, E. S. (2002). “Mixed Electoral Rules and Party Strategies.” Party Politics, 8
(6): 719-33.
Hill, F. and C. G. Gaddy (2003). The Siberian Curse: How Communist Planners Left
Russia out in the Cold. Washington D.C.: Brookings Institution Press.
Hofferbert, R. I. (1972). “State and Community Policy Studies: A Review of
Comparative Input-Output Analyses.” in Political Science Annual. Vol. 3. Edited
by J. A. Robinson, Indianapolis: Bobbs-Merrill.
Hofstadter, R. (1969). The Idea of a Party System: The Rise of Legitimate Opposition in
the United States, 1780-1840. Berkeley, Los Angeles and London: University of
California Press.
Holmes, S. (1994). “Superpresidentialism and Its Problems.” East European
Constitutional Review, 3 (1): 123-26.

Bibliography
274
Hosking, G., J. Aves and P. J. S. Duncan (1992). The Road to Post-Communism:
Independent Political Movements in the Former Soviet Union. London; New
York: Pinter Publishers.
Hough, J. F. (1977). The Soviet Union and Social Science Theory. Cambridge, Mass.;
London: Harvard University Press.
---- (1997). Democratization and Revolution in the Ussr, 1985-1991. Washington, D.C.:
Brookings Institution.
---- (1998). “Institutional Rules and Party Formation.” in Growing Pains: Russian
Democracy and the Election of 1993. Edited by T. J. Colton and J. F. Hough,
Washington D.C.: Brookings Institution Press.
Hough, J. F. and S. G. Lehmann (1998). “The Mistery of Opponents of Economic
Reform among the Yeltsin Voters.” in Elections and Voters in Post-Communist
Russia. Edited by M. Wyman, S. White and S. Oates, Cheltenham, UK;
Northampton, MA, USA: Edward Elgar.
Hox, J. J. and I. G. G. Kreft (1994). “Multilevel Analysis Methods.” Sociological
Methods and Research, 22 (3): 283-99.
Huckfeldt, R. and J. Sprague (1993). “Citizens, Contexts and Politics.” in Political
Science: The State of the Discipline 2. Edited by A. Finifter, Washington D.C.:
APSA.
Hughes, J. (1994). “Regionalism in Russia: The Rise and Fall of the Siberian
Agreement.” Europe-Asia Studies, 46 (7): 1133-61.
---- (1994a). “The 'Americanization' of Russian Politics: Russia's First Television
Election, December 1993.” The Journal of Communist Studies and Transition
Politics, 10 (2): 125-50.

Bibliography
275
---- (1996). “Moscow's Bilateral Treaties Add to Confusion.” Transition, 20 September:
39-43.
---- (1997). “Sub-National Élites and Post-Communist Transformation in Russia: A
Reply to Kryshtanovskaya & White.” Europe-Asia Studies, Vol.49 (No.6): 1017-
36.
---- (2002). “Managing Secession Potential in the Russian Federation.” in Ethnicity and
Territory in the Former Soviet Union: Regions in Conflict. Edited by J. Hughes
and G. Sasse, London and Portland (OR): Frank Cass.
Huntington, S. P. (1968). Political Order in Changing Societies. New Haven and
London: Yale University Press.
Huskey, E. (1999). Presidential Power in Russia. Armonk, NY: M.E. Sharpe.
Hutcheson, D. (2003). Political Parties in the Russian Regions. London and New York:
RoutledgeCurzon.
Ishiyama, J. (1998). “Red Versus Expert: Candidate Recruitment and Communist Party
Adaptation in Post-Soviet Politics.” Party Politics, 4 (3): 297-318.
---- (1999). “Partii-Preemnitsy Kommunisticheskikh I Organizatsionnoe Razvitie Partii
V Postkommunisticheskoi Politike.” Polis, 4 (52): 148-67.
---- (1999a). “Political Integration and Political Parties in Post-Soviet Russian Politics.”
Demokratizatsiya, 7 (2): 121-38.
---- (1999b). “Political Parties and Candidate Recruitment in Post-Soviet Russian
Politics.” Journal of Communist Studies and Transition Politics, Vol.15 (No.4):
41-69.

Bibliography
276
---- (2000). “Candidate Recruitment, Party Organisation and the Communist Successor
Parties: The Cases of the Mszp, the Kprf, and the Lddp.” Europe-Asia Studies, 52
(5): 875-96.
Ishiyama, J. and R. Kennedy (2001). “Superpresidentialism and Political Party
Development in Russia, Ukraine, Armenia and Kyrgyzstan.” Europe-Asia Studies,
53 (8): 1177-91.
Jacobson, G. C. (1980). Money in Congressional Elections. New Haven and London:
Yale University Press.
Johnson, M., W. Phillips Shively and R. M. Stein (2002). “Contextual Data and the
Study of Elections and Voting Behavior: Connecting Individuals to
Environments.” Electoral Studies, 21: 219-33.
Johnston, R. J. (1990). “Lipset and Rokkan Revisited: Electoral Cleavages, Electoral
Geography, and Electoral Strategy in Great Britain.” in Developments in Electoral
Geography. Edited by R. J. Johnston, F. M. Shelley and P. J. Taylor, London and
New York: Routledge.
Jones, K. and M. Gould (2003). Multilevel Analysis, 1g. Course-Pack for the Course in
Multilevel Analysis, Essex Summer School for Social Science Data Analysis.
Jones, K., R. J. Johnston and C. J. Pattie (1992). “People, Places and Regions:
Exploring the Use of Multi-Level Modelling in the Analysis of Electoral Data.”
British Journal of Political Science, 22 (3): 343-80.
Jones, M. P. and S. Mainwaring (2003). “The Nationalization of Parties and Party
Systems: An Empirical Measure and an Application to the Americas.” Party
Politics, 9 (2): 139-66.

Bibliography
277
Kahn, J. (2002). Federalism, Democratisation, and the Rule of Law in Russia. Oxford:
Oxford University Press.
Kaspe, S. I. and A. I. Petrokovskij (2000). “Administrativnye I Informatsionnye
Resursy V Kontekste Vyborov-99.” Politiya, 16 (2): 5-28.
Katz, R. S. (1980). A Theory of Parties and Electoral Systems. Baltimore: Johns
Hopkins University Press.
---- (1997). Democracy and Elections. Oxford: Oxford University Press.
Katz, R. S. and P. Mair (1993). “The Evolution of Party Organizations in Europe: The
Three Faces of Party Organization.” The American Review of Politics, Vol.14
(Winter): 593-617.
Kelsen, H. (1929). Vom Wesen Und Wert Der Demokraties. Tübingen: J.C.B. Mohr
(Paul Siebeck).
Kholodkovskij, K. G. (2000). “Politicheskoe Strukturovanie Rossijskogo Obschestva:
Vliyanie Parlamentskikh Vyborov 1999g.” in Kuda Idiet Rossiya? Vlast,
Obschestvo, Lichnost 2000. Edited by T. I. Zaslavskaya, Moskva: Moskovskaya
Vysshaya Shkola Sozialnikh i Ekonomicheskikh Nauk.
Kim, C. L., J. Green and S. C. Patterson (1976). “Partisanship in the Recruitment and
Performance of American State Legislators.” in Elite Recruitment in Democratic
Politics. Comparative Studies across Nations. Edited by H. Eulau and M. M.
Czudnowski, New York and London: Sage Publications.
King, G. (1991). “On Political Methodology.” Political Analysis, 2: 1-30.
---- (1997). A Solution to the Ecological Inference Problem: Reconstructing Individual
Behavior from Aggregate Data. Princeton NJ: Princeton University Press.

Bibliography
278
King, G., R. O. Keohane and S. Verba (1994). Designing Social Enquiry: Scientific
Inference in Qualitative Research. Princeton: Princeton University Press.
Kitschelt, H. (1995). “Formation of Party Cleavages in Post-Communist Democracies.
Theoretical Propositions.” Party Politics, 1 (4): 447-72.
Kitschelt, H., Z. Mansfeldova, R. Markowski, et al. (1999). Post-Communist Party
Systems. Competition, Representation, and Inter-Party Cooperation. Cambridge:
Cambridge University Press.
Kitschelt, H. and R. Smyth (2002). “Programmatic Party Cohesion in Emerging
Postcommunist Democracies: Russia in Comparative Context.” Comparative
political studies, 35 (10): 1228-56.
Klimanov, V. V. (2000). “Politicheskie Aspekty Mezhregionalnogo Ekonomicheskogo
Sotrudnichestva.” in Politika I Ekonomika V Regionalnom Izmerenii. Edited by V.
V. Klimanov and N. y. V. Zubarevich, Moskva and Sankt-Peterburg.
Kolosov, V. A., N. V. Petrov and L. V. Smirnyagin (1990). Vesna 1989. Geografiya i
Anatomiya Parlamentskikh Vyborov. Moscow: Progress.
Kostelecky, T. (2002). Political Parties after Communism: Developments in East-
Central Europe. Baltimore and London: Johns Hopkins University Press.
Kreft, I. and J. De Leeuw (1998). Introducing Multilevel Modeling. London: Sage.
Kullberg, J. S. (1998). “Preserving the Radical Stronghold: The Election in Moscow.”
in Growing Pains: Russian Democracy and the Election of 1993. Edited by T. J.
Colton and J. F. Hough, Washington D.C.: Brookings Institution Press.

Bibliography
279
Kuznetsova, O. g. (2001). “Regionalnye Byudzhety.” in Regioni Rossii V 1999 G.:
Ezhegodnoe Prilozhenie K "Politicheskomy Almanakhy Rossii". Edited by N.
Petrov, Moscow: Moscow Carnegie Center, "Gendalf".
Laakso, M. and R. Taagepera (1979). “Effective Number of Parties: A Measure with
Applications to West Europe.” Comparative political studies, 12: 3-27.
Lapidus, G. W. (1999). “Asymmetrical Federalism and State Breakdown in Russia.”
Post-Soviet Affairs, 15 (1): 74-82.
Lapidus, G. W. and E. W. Walker (1995). “Nationalism, Regionalism, and Federalism:
Center-Periphery Relations in Post-Communist Russia.” in The New Russia:
Troubled Transformation. Edited by G. W. Lapidus, Boulder, San Francisco and
London: Westview Press.
Lavrov, A. M. (1998). “Budgetary Federalism.” in Conflict and Consensus in Ethno-
Political and Center-Periphery Relations in Russia. Edited by J. R. Azrael and E.
Payin, Santa Monica, CA: Center for Russian and Eurasian Studies (Rand
Corporation), and Center for Ethnopolitical and Regional Research.
Lavrov, A. M. and A. G. Makushkin (2001). The Fiscal Structure of the Russian
Federation: Financial Flows between the Center and the Regions. Armonk, N.Y.,
and London: M.E. Sharpe.
Lazarsfeld, P. F., B. Berelson and H. Gaudet (1968 [1944]). The People's Choice: How
the Voter Makes up His Mind in a Presidential Campaign. New York: Columbia
University Press.
Lentini, P. (1995). “Reforming the Soviet Electoral System.” in Elections and Political
Order in Russia: The Implications of the 1993 Elections to the Federal Assembly.
Edited by P. Lentini, Budapest, London, New York: Central European University
Press.

Bibliography
280
---- (1995a). “Conclusion.” in Elections and Political Order in Russia: The Implications
of the 1993 Elections to the Federal Assembly. Edited by P. Lentini, Budapest,
London, New York: Central European University Press.
Leskov, S. (2003). “Partiyu Vlasti Zadumali Pri Imperatore. Retseptam Rossiiskoi
Politekhnologii Uzhe 100 Let.” Izvestiya, 7 June, 5.
Levada, Y. (1996). “Chelovek Politicheskii: Tsena I Roli Perekhodnogo Perioda.” in
Prezidentskie Vybori 1996 Goda I Obshestvennoe Mnenie. Edited by VTsIOM,
Moskva.
Levchik, D. A. (1996). “Politicheskii 'Kheppening'.” Sotsiologicheskie Issledovaniya,
(8, August): 51-56.
Lewis, P. G. (1996). “Introduction and Theoretical Overview.” in Party Structure and
Organization in East-Central Europe. Edited by id., Cheltenham.
---- (2000). Political Parties in Post-Communist Eastern Europe. London and New
York: Routledge.
Linz, J. J. (1969). “Ecological Analysis and Survey Research.” in Quantitative
Ecological Analysis in the Social Sciences. Edited by M. Dogan and S. Rokkan,
Cambridge (MA) and London: MIT Press.
---- (1994). “Presidential or Parliamentary Democracy: Does It Make a Difference?” in
The Failure of Presidential Democracy. Edited by J. J. Linz and A. Valenzuela,
Baltimore: Johns Hopkins University Press.
Linz, J. J. and A. C. Stepan (1996). Problems of Democratic Transition and
Consolidation: Southern Europe, South America, and Post-Communist Europe.
Baltimore: Johns Hopkins University Press.

Bibliography
281
Lipset, S. M. and S. Rokkan (1967). “Cleavage Structures, Party Systems and Voter
Alignments: An Introduction.” in Party Systems and Voter Alignments: Cross
National Perspectives. Edited by L. S. M. and S. Rokkan, New York: Free Press.
MacIver, R. (1947). The Web of Government. New York: Macmillan.
Mainwaring, S. and T. R. Scully, Eds. (1995). Building Democratic Institutions: Party
Systems in Latin America. Stanford: Stanford University Press.
Mainwaring, S. P. (1999). Rethinking Party Systems in the Third Wave of
Democratization: The Case of Brazil. Stanford: Stanford University Press.
Mair, P. (1994). “Party Organizations: From Civil Society to the State.” in How Parties
Organize: Change and Adaptation in Party Organizations in Western
Democracies. Edited by R. S. Katz and P. Mair, London: Sage Publications.
March, L. (2002). The Communist Party in Post-Soviet Russia. Manchester and New
York: Manchester University Press.
Marsh, C. and J. W. Warola (2001). “Ethnicity, Ethnoregionalism, and the Political
Geography of Putin's Electoral Support.” Post-Soviet Geography and Economics,
42 (3): 220-33.
Marsh, M. (2002). “Electoral Context.” Electoral Studies, 21: 207-17.
Martinez-Vasquez, J. and J. Boex (2001). Russia's Transition to a New Federalism.
Washington D.C.: The World Bank.
Maslow, A. H. (1968). Toward a Psychology of Being. New York: Van Nostrand
Company.

Bibliography
282
Matsuzato, K. (2000). “Progressive North, Conservative South? - Reading the Regional
Elite as a Key to Russian Electoral Puzzles.” in Regions: A Prism to View the
Slavic-Eurasian World. Towards a Discipline of "Regionology". Edited by K.
Matsuzato, Sapporo, Japan: Slavic Research Center, Hokkaido University.
---- (2001). “From Communist Boss Politics to Post-Communist Caciquismo - the
Meso-Elite and Meso-Governments in Post-Communist Countries.” Communist
and Post-Communist Studies, 34 (2): 175-201.
----, Ed. (2004). Fenomen Vladimira Putina I Rossiiskie Regioni: Pobeda
Neozhidannaya Ili Zakonomernaya? Moskva: Materik.
McAllister, I. and S. White (1998). “To Vote or Not to Vote: Election Turnout in Post-
Communist Russia.” in Elections and Voters in Post-Communist Russia. Edited
by M. Wyman, S. White and S. Oates, Cheltenham, UK; Northampton, MA,
USA: Edward Elgar.
McFaul, M. (1993). “Party Formation after Revolutionary Transitions: The Russian
Case.” in Political Parties in Russia. Edited by A. Dallin, Berkeley: International
and Area Studies, University of California at Berkeley.
---- (1998). “Russia's Choice: The Perils of Revolutionary Democracy.” in Growing
Pains: Russian Democracy and the Election of 1993. Edited by T. J. Colton and J.
F. Hough, Washington D.C.: Brookings Institution Press.
McFaul, M., N. Petrov and A. Ryabov, Eds. (2000). Rossiya V Izbiratelnom Tsikle
1999-2000 Godov. Moscow: Moscow Carnegie Center, "Gendalf".
McKay, D. (2000). Designing Europe: Comparative Lessons from the Federal
Experience. Oxford: Oxford University Press.

Bibliography
283
McMann, K. M. and N. V. Petrov (2000). “A Survey of Democracy in Russia's
Regions.” Post-Soviet Geography and Economics, 41 (3): 155-82.
Melvin, N. (1998). “The Consolidation of a New Regional Elite: The Case of Omsk
(1987-1995).” Europe-Asia Studies, 50 (4): 619-50.
---- (1998a). “Kursk: A Preserve of Communism.” in Growing Pains: Russian
Democracy and the Election of 1993. Edited by T. J. Colton and J. F. Hough,
Washington D.C.: Brookings Institution Press.
Michels, R. (1962 [1915]). Political Parties: A Sociological Study of the Oligarchical
Tendencies of Modern Democrcay. New York: Dover Publications.
Miller, A. H., William M. Reisinger, and Vicki L. Hesli (1998). “Leader Popularity and
Party Development in Post-Soviet Russia.” in Elections and Voters in Post-
Communist Russia. Edited by M. Wyman, S. White and S. Oates, Cheltenham,
UK; Northampton, MA, USA: Edward Elgar.
Miller, A. H., G. Erb, W. M. Reisinger, et al. (2000). “Emerging Party Systems in Post-
Soviet Societies: Fact or Fiction?” Journal of Politics, 62 (2): 455-90.
Miller, A. H. and T. F. Klobucar (2000). “The Development of Party Identification in
Post-Soviet Societies.” American Journal of Political Science, 44 (4): 667-86.
Miller, A. H. and M. P. Wattenberg (1983). “Measuring Party Identification:
Independent or No Partisan Preference?” American Journal of Political Science,
27 (1): 106-21.
Miller, W., S. White and A. Heywood (1996). “Twenty-Five Days to Go: Measuring
and Interpreting the Trends in Public Opinion During the 1993 Russian Election
Campaign.” Public Opinion Quarterly, 60: 106-27.

Bibliography
284
Mitchneck, B. (2001). “Regional Governance Regimes in Russia.” in Regional Russia
in Transition: Studies from Yaroslavl'. Edited by J. W. Hahn, Baltimore and
London: The Johns Hopkins University Press.
Mitrokhin, S. S. (2001). “Predposylki I Osnovnye Etapy Detsentralizatsii
Gosudarstvennoi Vlasti V Rossii.” in Tsentr - Regioni - Mestnoe Samoupravlenie.
Seria "Studia Politica". Edited by G. M. Lyukhterkhandt-Mikhaleva and S. I.
Ryzhenkov, Moskva and Sankt-Peterburg: IGPI, Letnii sad. 4.
Moraski, B. J. and W. M. Reisinger (2003). “Explaining Electoral Competition across
Russia's Regions.” Slavic review, 62 (2): 278-301.
Morgan-Jones, E. and P. Schleiter (2004). “Governmental Change in a President-
Parliamentary Regime: The Case of Russia 1994-2003.” Post Soviet Affairs, 20
(2): 132-63.
Morlino, L. (1995). “Political Parties and Democratic Consolidation in Southern
Europe.” in The Politics of Democratic Consolidation: Southern Europe in
Comparative Perspective. Edited by Richard Gunther, N. Diamandouros and H. J.
Puhle, Baltimore and London: Johns Hopkins University Press.
---- (1998). Democracy between Consolidation and Crisis. Oxford: Oxford University
Press.
Moser, R. G. (1995). “The Impact of the Electoral System on Post-Communist Party
Development: The Case of the 1993 Russian Parliamentary Elections.” Electoral
Studies, 14 (4): 377-98.
---- (1999). “Independents and Party Formation: Elite Partisanship as an Intervening
Variable in Russian Politics.” Comparative Politics, (January): 147-65.

Bibliography
285
---- (1999a). “Electoral Systems and the Number of Parties in Postcommunist States.”
World Politics, 51 (April): 359-84.
---- (2001). “The Consequences of Russia's Mixed-Member Electoral System.” in
Mixed-Member Electoral Systems: The Best of Two Worlds? Edited by M. S.
Shugart and M. P. Wattenberg, Oxford: Oxford University Press.
---- (2001a). Unexpected Outcomes: Electoral Systems, Political Parties and
Representation in Russia. Pittsburgh: University of Pittsburgh Press.
Mukharyamov, N. M. and L. M. Mukharyamova (2004). “Tatarstan V Usloviyakh
Retsentralizatsii Po-Putinski.” in Fenomen Vladimira Putina I Rossiiskie Regioni:
Pobeda Neozhidannaya Ili Zakonomernaya? Edited by K. Matsuzato, Moskva:
Materik.
Munro, N. and R. Rose (2002). Elections without Order: Russia's Challenge to Vladimir
Putin. Cambridge: Cambridge University Press.
Myagkov, M., P. C. Ordeshook and S. A. (1997). “The Russian Electorate 1991-1996.”
Post Soviet Affairs, 13 (2): 134-66.
Nicholson, M. and International Institute for Strategic Studies. (1999). Towards a
Russia of the Regions. Oxford: Oxford University Press for the International
Institute for Strategic Studies.
O'Donnell, G., P. C. Schmitter and L. Whitehead, Eds. (1986). Transitions from
Authoritarian Rule: Tentative Conclusions About Uncertain Democracies.
Baltimore: Johns Hopkins University Press.
Olga, S. (1999). “A Survey of Post-Communist Electoral Institutions: 1990-1998.”
Electoral Studies, 18: 397-409.

Bibliography
286
O'Loughlin, J., M. Shin and P. Talbot (1996). “Political Geographies and Cleavages in
the Russian Parliamentary Elections.” Post-Soviet Geography and Economics, 37
(6): 355-85.
Ordeshook, P. C. and O. V. Shvetsova (1994). “Ethnic Heterogeneity, District
Magnitude, and the Number of Parties.” American Journal of Political Science, 38
(1): 100-23.
Oreshkin, D. B. (2001). “Elektoralnaya Demokratiya I Zelostnost Politicheskogo
Prostranstva Rossii.” Zhurnal o Vyborakh,: 28-33.
Oreshkina, D. (2000). “A Vse-Taki Oni Upravlyaiutsya!” Nezavisimyj Goloc Rossii,
(2): 15-17.
Orttung, R. W. (1995). From Leningrad to St. Petersburg: Democratization in a
Russian City. London: MacMillan Press.
Ostrogorsky, M. Y. (1982 [1902]). Democracy and the Organization of Political
Parties. New Brunswick (USA) and London (UK): Transaction Books.
Ostrow, J. M. (2000). Comparing Post-Soviet Legislatures: A Theory of Institutional
Design and Political Conflict. Columbus, OH: Ohio State University Press.
Pammett, J. H. and J. DeBardeleben (2000). “Citizen Orientations to Political Parties in
Russia.” Party Politics, 6 (3): 373–84.
Panebianco, A. (1988). Political Parties: Organization and Power. Cambridge:
Cambridge University Press.

Bibliography
287
Payin, E. A. (1998). “Ethnic Separatism.” in Conflict and Consensus in Ethno-Political
and Center-Periphery Relations in Russia. Edited by J. R. Azrael and E. Payin,
Santa Monica, CA: Center for Russian and Eurasian Studies (Rand Corporation),
and Center for Ethnopolitical and Regional Research.
Petrov, N. (1999). “Otnosheniya 'Tsentr-Regioni' I Perspektivy Teritorialno-
Gosudarstvennogo Pereustroistva Strany.” in Regioni Rossii V 1998 G.:
Ezhegodnoe Prilozhenie K "Politicheskomy Almanakhy Rossii". Edited by N.
Petrov, Moscow: Moscow Carnegie Center, "Gendalf".
----, Ed. (2001). Regioni Rossii V 1999g.: Ezhegodnoe Prilozhenie K "Politicheskomu
Almanakhu Rossii". Moskva: Tsentr Karnegi.
Petrov, N. and A. Titkov (2000). “Kampaniya V Regionakh. Regionalnoe Izmerenie
Vyborov Rossiya V Izbiratelnom Zikle 1999-2000 Godov.” in Rossiya V
Izbiratelnom Zikle 1999-2000 Godov. Edited by M. McFaul, N. Petrov and A.
Ryabov, Moscow: Moscow Carnegie Center, "Gendalf".
---- (2001). “Rossiiskoe Obschestvo V 1999 G.” in Regioni Rossii V 1999 G.:
Ezhegodnoe Prilozhenie K "Politicheskomy Almanakhy Rossii". Edited by N.
Petrov, Moscow: Moscow Carnegie Center, "Gendalf".
Pharr, S. J. and R. D. Putnam, Eds. (2000). Disaffected Democracies: What's Troubling
the Trilateral Countries? Princeton: Princeton University Press.
Poguntke, T. and S. E. Scarrow (1996). “The Politics of Anti-Party Sentiment:
Introduction.” European Journal of Political Research (special edition), 29 (3):
257-62.
Popov, V. (2002). Ekonomika I Finansy. Mnenie. Asimmetrichnyi Federalizm.
Bibliography
288
Public Examination: Evaluation of Freedom of Speech in Russia (1999-2000):
www.freepress.ru/win/english.html. Accessed June 2003.
Reisinger, W. M. and B. J. Moraski (2003). “Regional Democratic Change in Time and
Space: Tracking Electoral Competition in Russia's Regions.” Slavic review, (2):
278-301.
Remington, T. (1998). “Political Conflict and Institutional Design: Paths of Party
Development in Russia.” in Party Politics in Post-Communist Russia. Edited by J.
Löwenhardt, London: Frank Cass.
---- (2003). “Coalition Politics in the New Duma.” in The 1999-2000 Elections in
Russia: Their Impact and Legacy. Edited by V. L. Hesli and W. M. Reisinger,
Cambridge: Cambridge University Press.
Remington, T. and S. S. Smith (1996). “Political Goals, Institutional Context, and the
Choice of an Electoral System: The Russian Parliamentary Election Law.”
American Journal of Political Science, 40: 1253-79.
---- (2001). The Politics of Institutional Choice: The Formation of the Russian State
Duma. Princeton; Oxford: Princeton University Press.
Remington, T. F. (2001). The Russian Parliament: Institutional Evolution in a
Transitional Regime, 1989-1999. New Haven: Yale University Press.
Riker, W. H. (1964). Federalism: Origins, Operation, Significance. Boston: Little
Brown.
Robinson, W. S. (1950). “Ecological Correlations and the Behavior of Individuals.”
American Sociological Review, 15: 351-67.

Bibliography
289
Rokkan, S. (1970). Citizens Elections Parties: Approaches to the Study of the Processes
of Development. Oslo: Universitetsforlaget.
Rokkan, S. and S. M. Lipset (1967). Party Systems and Voter Alignments: Cross-
National Perspectives. New York and London: Free Press; Collier Macmillan.
Rokkan, S. and D. Urwin (1983). Economy, Territory, Identity: Politics of Western
European Peripheries. London: Sage.
Rose, R. (2000). “A Supply-Side View of Russia's Elections.” East European
Constitutional Review, 9 (1/2): 53-9.
Rustow, D. A. (1970). “Transitions to Democracy: Toward a Dynamic Model.”
Comparative Politics, 2 (2): 337-63.
Sakwa, R. (1993). “Parties and the Multiparty System in Russia.” RFE/RL Research
Report, 2 (31, July): 7-15.
---- (1995). “The Development of the Russian Party System. Did the Elections Change
Anything?” in Elections and Political Order in Russia: The Implications of the
1993 Elections to the Federal Assembly. Edited by P. Lentini, Budapest, London,
New York: Central European University Press.
---- (1995a). “The Russian Elections of 1993.” Europe-Asia Studies, 47 (2): 195-227.
---- (1996). Russian Politics and Society. London; New York: Routledge.
---- (2002). “Federalism, Sovereignty and Democracy.” in Regional Politics in Russia.
Edited by C. Ross, Manchester and New York: Manchester University Press.
Sartori, G. (1976). Parties and Party Systems. Cambridge: Cambridge University Press.
Bibliography
290
Schattschneider, E. E. (1942). Party Government. New York: Rinehart.
---- (1960). The Semisovereign People: A Realist's View of Democracy in America. New
York: Holt, Rinehart and Winston.
Schedler, A. (1997). The End of Politics? Explorations into Modern Antipolitics.
Houndmills, Basingstoke, Hampshire (England), and New York: Macmillan and
St. Martin's Press.
Schmitter, P. C. (1992). “The Consolidation of Democracy and Representation of Social
Groups.” American Behavioral Scientist, 35 (4/5): 422-49.
---- (1997). “Autobiographical Reflections: Or How to Live with a Conceptual
Albatross around One's Neck.” in Comparative European Politics: The Story of
the Profession. Edited by H. Daalder, London and Washington: Pinter.
---- (2001). “Parties Are Not What They Once Were.” in Political Parties and
Democracy. Edited by L. Diamond and R. Gunther, Baltimore and London: Johns
Hopkins University Press.
Shugart, M. S. and J. M. Carey (1992). Presidents and Assemblies: Constitutional
Design and Electoral Dynamics. Cambridge: Cambridge University Press.
Shugart, M. S. and M. P. Wattenberg (2001). “Mixed-Member Electoral Systems: A
Definition and Typology.” in Mixed-Member Electoral Systems: The Best of Two
Worlds? Edited by M. S. Shugart and M. P. Wattenberg, Oxford: Oxford
University Press.
Shvetsova, O. (1999). “A Survey of Post-Communist Electoral Institutions: 1990-
1998.” Electoral Studies, 18 (3): 397-410.
Siegfried, A. (1913). Tableau Politique De La France De L'ouest. Paris: A. Colin.

Bibliography
291
Slider, D. (1994). “Federalism, Discord, and Accommodation: Intergovernmental
Relations in Post-Soviet Russia.” in Local Power and Post-Soviet Politics. Edited
by T. H. Friedgut and J. W. Hahn, Armonk, N.Y.: M.E. Sharpe.
---- (1996). “Elections to Russia's Regional Assemblies.” Post-Soviet Affairs, 12 (3):
243-64.
---- (2001). “Russian Governors and Party Formation.” in Contemporary Russian
Politics. Edited by A. Brown, Oxford: Oxford University Press.
Slider, D., V. Gimpelson and S. Chugrov (1994). “Political Tendencies in Russia's
Regions: Evidence From the 1993 Parliamentary Elections.” Slavic Review, 53
(3): 711-32.
Smith, S. S. and T. F. Remington (2001). The Politics of Institutional Choice: The
Formation of the Russian State Duma. Princeton and Oxford: Princeton
University Press.
Smyrnygin, L. V. (1998). “Typologies of Regional Conflicts in Modern Russia.” in
Conflict and Consensus in Ethno-Political and Center-Periphery Relations in
Russia. Edited by J. R. Azrael and E. Payin, Santa Monica, CA: Center for
Russian and Eurasian Studies (Rand Corporation), and Center for Ethnopolitical
and Regional Research.
Smyth, R. (1998). Building Democracy by Winning Votes? Candidates and Parties in
Transitional Russia. PhD thesis. Ann Arbor, MI: University of Michigan.
---- (1998a). “Political Ambition, Elite Competition, and Electoral Success in Saratov
Oblast.” in Growing Pains: Russian Democracy and the Election of 1993. Edited
by T. J. Colton and J. F. Hough, Washington D.C.: Brookings Institution Press.

Bibliography
292
Snijder, T. A. B. and R. J. Bosker (1999). Multilevel Analysis: An Introduction to Basic
and Advanced Multilevel Modeling. London; Thousand Oaks; New Delhi: Sage.
Solnick, S. (1996). “The Political Economy of Russian Federalism.” Problems of Post-
Communism, (November/December): 13-25.
---- (1998). “The 1996-1997 Gubernatorial Elections in Russia: Outcomes and
Implications.” Post-Soviet Affairs, 14 (1): 48-81.
---- (2000). “Is the Center Too Weak or Too Strong in the Russian Federation?” in
Building the Russian State: Institutional Crisis and the Quest for Democratic
Governance. Edited by V. Sperling, Boulder: Westview Press.
Solzhenitsyn, A. (1991). Rebuilding Russia: Reflections and Tentative Proposals.
London: Harvill.
Stavrakis, P. J., J. DeBardeleben and L. Black, Eds. (1997). Beyond the Monolith: The
Emergence of Regionalism in Post-Soviet Russia. Baltimore and London: Johns
Hopkins University Press.
Steenbergen, M. R. and B. S. Jones (2002). “Modeling Multilevel Data Structures.”
American Journal of Political Science, 46 (1): 218-37.
Stoker, L. and J. Bowers (2002). “Designing Multi-Level Studies: Sampling Voters and
Electoral Contexts.” Electoral Studies, 21: 235-67.
Stolzenberg, R. M. and D. A. Relles (1997). “Tools for Intuition About Sample
Selection Bias and Its Correction.” American Sociological Review, 62 (3): 494-
507.
Stoner-Weiss, K. (1997). Local Heroes: The Political Economy of Russian Regional
Governance. Princeton, N.J.: Princeton University Press.
Bibliography
293
---- (2001). “The Limited Reach of Russia's Party System.” Politics & Society, 29
(September).
---- (2002). The Sources of Resistance to Russian Central State Capacity in the
Periphery. Paper presented at the 34th National Convention of the AAASS,
Pittsburgh, PA (USA).
Strokanov, A. (2003). The Elections to the State Duma in December 1999: Russia's
Choice at the End of the Twentieth Century. Lewinston, Queenston, Lampeter:
The Edwin Mellen Press.
Suny, R. (1994). The Revenge of the Past: Nationalism, Revolution and the Collapse of
the Soviet Union. Stanford: Stanford University Press.
Svinin, V. (2003). “Sibirskie Gubernatory Protiv Tsentralizatsii Nedropolzovaniya.”
Nezavisimaya Gazeta, 16 June, 11.
Taras, R. (1998). “The Politics of Leadership.” in Developments in Central and East
European Politics 2. Edited by S. White, J. Batt and P. G. Lewis, Durham: Duke
University Press.
Taylor, P. J. and R. J. Johnston (1979). Geography of Elections. Harmondsworth
(Middlesex, UK): Penguin.
Teague, E. (1994). “Center-Periphery Relations in the Russian Federation.” in National
Identity and Ethnicity in Russian and the New States of Eurasia. Edited by R.
Szporluk, Armonk (NY) and London: M.E. Sharpe.
Thorlakson, L. J. (2002). Federalism and Party Competition: A Comparative Analysis
of Canada, Australia, Switzerland, Austria, Germany and the United States. PhD
thesis. London: University of London.

Bibliography
294
Tikunov, V. and D. Oreshkina (2000). “'Upravlyaemaya Demokratiya': Rossijskij
Variant.” Ekspert, (11-12): 61-65.
Toka, G. (1997). “Political Parties in East Central Europe.” in Consolidating the Third
Wave Democracies: Themes and Perspectives. Journal of Democracy Book.
Edited by L. Diamond, Baltimore: Johns Hopkins University Press.
Treisman, D. S. (1997). “Russia's 'Ethnic Revival': The Separatist Activism of Regional
Leaders in a Postcommunist Order.” World Politics, 49 (2).
---- (1999). After the Deluge: Regional Crisis and Consolidation in Russia. Michigan:
University of Michigan Press.
TsIK (Tsentralnaya Izbiratelnaya Komissiya) (1994). Rezultaty Golosovaniya Na
Vyborakh V Gosudarstvennuyu Dumu Po Odnomandatnym Izbiratelnym
Okrugam. Moscow: Unpublished report.
---- (1996). Vybory Deputatov Gosudarstvennoi Dumy Federalnogo Sobraniya
Rossiiskoi Federatzii 1995: Elektoralnaya Statistika. Moscow: Ves Mir.
---- (2000). Vybory Deputatov Gosudarstvennoi Dumy Federalnogo Sobraniya
Rossiiskoi Federatzii 1999: Elektoralnaya Statistika. Moscow: Ves Mir.
---- (2003). Elections of Deputies to the State Duma of the Federal Assembly of the
Russian Federation: Electoral Statistics, 1995 and 1999. Moscow: Ves Mir.
TsIK (Tsentralnaya Izbiratelnaya Komissiya) and Merkator (1999). Vybory V Rossiiskoi
Federatsii: 1991-1998. Cd-Rom. Moscow: Merkator.

Bibliography
295
Tsygankov, A. (1998). “Manifestations of Delegative Democracy in Russian Local
Politics: What Does It Mean for the Future of Russia?” Communist and Post-
Communist Studies, 31 (4): 329-44.
Tuschhoff, C. (1999). “The Compounding Effect: The Impact of Federalism on the
Concept of Representation.” in Compounded Representation in Western European
Federations. Edited by J. B. Brzinski, T. D. Lancaster and C. Tuschhoff, London:
Frank Cass Publishers.
Urban, M. and V. Gelman (1997). “The Development of Political Parties in Russia.” in
Democratic Changes and Authoritarian Reactions in Russia, Ukraine, Belarus
and Moldova. Edited by K. Dawisha and B. Parrott, Cambridge: Cambridge
University Press.
Von Beyme, K. (1996). Transition to Democracy in Eastern Europe. London and New
York: Macmillan Press and St. Martin's Press.
VTsIOM (2000). VTsIOM: Monitoring obshestvennogo mneniya, 45 (1).
Wattenberg, M. P. (1996). The Decline of American Political Parties: 1952-1994.
Cambridge (MA) and London: Harvard University Press.
Watts, R. L. (1996). Comparing Federal Systems in the 1990s. Kingston (Ontario):
Queen's University.
White, S. and I. McAllister (1999). “Reforming the Russian Electoral System.” Journal
of Communist Studies and Transition Politics, 15 (4): 17-40.
White, S., R. Rose and I. McAllister (1997). How Russia Votes. Chatham, New Jersey:
Chatham House.
Bibliography
296
Wyman, M., S. White, B. Miller, et al. (1995). “Public Opinion, Parties and Voters in
the December 1993 Russian Elections.” Europe-Asia Studies, 47 (June): 591-614.
Wyman, M., S. White and S. Oates, Eds. (1998). Elections and Voters in Post-
Communist Russia. Cheltenham, UK; Northampton, MA, USA: Edward Elgar.
Zaslavsky, V. (1993). “Success and Collapse: Traditional Soviet Nationality Policy.” in
Nations and Politics of the Soviet Successor States. Edited by I. Bremmer and R.
Taras, Cambridge: Cambridge University Press.
---- (1994). “From Redistribution to Marketization: Social and Attitudinal Change in
Post-Soviet Russia.” in The New Russia: Troubled Transformation. Edited by G.
W. Lapidus, Boulder: Westview Press.
Zubarevich, N. V. and A. Treivish (2001). “Sotsialno-Ekonomicheskoe Polozhenie
Regionov.” in Regioni Rossii V 1999 G.: Ezhegodnoe Prilozhenie K
"Politicheskomy Almanakhy Rossii". Edited by N. Petrov, Moscow: Moscow
Carnegie Center, "Gendalf".