Rural Employment Diversification in India: Trends, Determinants and Implications on Poverty
12
Agricultural Economics Research Review Vol. 24 (Conference Number) 2011 pp 361-372 * Author for correspondence, Email: [email protected] Rural Employment Diversification in India: Trends, Determinants and Implications on Poverty Anjani Kumar a1 , Sant Kumar a , Dhiraj K. Singh b and Shivjee a National Centre for Agricultural Economics and Policy Research (NCAP), Pusa, New Delhi-110 012 b International Livestock Research Institute (ILRI), NASC Complex, Pusa, New Delhi-110 012 Abstract This paper has studied rural employment diversification in India and across major states using NSSO data at household level for the period 1983 and 2009-10. Factors affecting rural employment diversification towards non-farm sector have also been studied. Analysis has shown that the non-farm sector has consistently grown over time and employed nearly one-third of the rural workforce in 2009-10, as compared to merely one-fifth in 1983 at all-India level. The similar trend is seen across major states as well, though the pace and pattern varied widely. In providing employment to rural workforce, increasing dominance of crop production, followed by animal husbandry was observed across major states during 2009-10. The share of fishery and forestry was negligible in providing employment to the rural workforce. The study has revealed that the increasing rural non-farm employment has positive and significant effect on reducing rural poverty at all-India level. A positive link between income and employment has also been observed in diversifying towards horticultural activities. A well designed area-specific programme should be evolved to help improve skill of rural workforce, which in turn would benefit in getting employment in the non-farm sector. Key words: Rural employment, Employment diversification, Crop sector JEL Classification: J21, J23, O15, O18. Introduction One of the major failures of economic development in post-Independent India remained its inability to significantly reduce the dependence of workforce on agriculture. While the share of gross domestic product (GDP) originating from agriculture has gone down from over 50 per cent at the time of Independence to nearly 14 per cent currently, the share of workforce engaged in agriculture, which was about 70 per cent in 1951, still remains at over 50 per cent. This has led to widening of gap between incomes in agricultural and non- agricultural sectors, which is perceived to be one of the major reasons for persistence of poverty in the country. The gap between the number of new rural workers and the number of new job opportunities created in agriculture is enlarging. Therefore, the rural employment diversification towards non-agricultural sector has gained critical importance over time. The Government of India is deeply concerned with the widespread poverty and unemployment in the rural areas and has taken several initiatives including the implementation of Mahatma Gandhi National Rural Employment Guarantee Scheme (MGNREGS). The rural sector in India is undergoing a transformation and the contribution of rural non-farm sector to the rural income and employment is growing. Several studies on rural employment diversification in India (Kumar, 2009; Mukhopadhyay and Rajaraman, 2007; Chadha and Sahu, 2002; Visaria, 1995; Basant and Kumar, 1989) have concluded that the share of non-farm sector in rural employment has significantly grown over time and the capacity of the farm sector to absorb additional labour force has almost reached a plateau. On the other hand, some scholars argue that with the implementation of large-scale employment programmes even the
-
Upload
independent -
Category
Documents
-
view
1 -
download
0
Transcript of Rural Employment Diversification in India: Trends, Determinants and Implications on Poverty
Agricultural Economics Research ReviewVol. 24 (Conference Number) 2011 pp 361-372
* Author for correspondence,Email: [email protected]
Rural Employment Diversification in India: Trends, Determinants andImplications on Poverty
Anjani Kumara1, Sant Kumara, Dhiraj K. Singhb and ShivjeeaNational Centre for Agricultural Economics and Policy Research (NCAP), Pusa, New Delhi-110 012
bInternational Livestock Research Institute (ILRI), NASC Complex, Pusa, New Delhi-110 012
Abstract
This paper has studied rural employment diversification in India and across major states using NSSO dataat household level for the period 1983 and 2009-10. Factors affecting rural employment diversificationtowards non-farm sector have also been studied. Analysis has shown that the non-farm sector hasconsistently grown over time and employed nearly one-third of the rural workforce in 2009-10, as comparedto merely one-fifth in 1983 at all-India level. The similar trend is seen across major states as well, though thepace and pattern varied widely. In providing employment to rural workforce, increasing dominance of cropproduction, followed by animal husbandry was observed across major states during 2009-10. The share offishery and forestry was negligible in providing employment to the rural workforce. The study has revealedthat the increasing rural non-farm employment has positive and significant effect on reducing rural povertyat all-India level. A positive link between income and employment has also been observed in diversifyingtowards horticultural activities. A well designed area-specific programme should be evolved to help improveskill of rural workforce, which in turn would benefit in getting employment in the non-farm sector.
Key words: Rural employment, Employment diversification, Crop sector
JEL Classification: J21, J23, O15, O18.
IntroductionOne of the major failures of economic development
in post-Independent India remained its inability tosignificantly reduce the dependence of workforce onagriculture. While the share of gross domestic product(GDP) originating from agriculture has gone down fromover 50 per cent at the time of Independence to nearly14 per cent currently, the share of workforce engagedin agriculture, which was about 70 per cent in 1951,still remains at over 50 per cent. This has led to wideningof gap between incomes in agricultural and non-agricultural sectors, which is perceived to be one ofthe major reasons for persistence of poverty in thecountry. The gap between the number of new ruralworkers and the number of new job opportunitiescreated in agriculture is enlarging. Therefore, the rural
employment diversification towards non-agriculturalsector has gained critical importance over time. TheGovernment of India is deeply concerned with thewidespread poverty and unemployment in the ruralareas and has taken several initiatives including theimplementation of Mahatma Gandhi National RuralEmployment Guarantee Scheme (MGNREGS). Therural sector in India is undergoing a transformation andthe contribution of rural non-farm sector to the ruralincome and employment is growing. Several studieson rural employment diversification in India (Kumar,2009; Mukhopadhyay and Rajaraman, 2007; Chadhaand Sahu, 2002; Visaria, 1995; Basant and Kumar, 1989)have concluded that the share of non-farm sector inrural employment has significantly grown over time andthe capacity of the farm sector to absorb additionallabour force has almost reached a plateau. On the otherhand, some scholars argue that with the implementationof large-scale employment programmes even the
362 Agricultural Economics Research Review Vol. 24 (Conference Number) 2011
agricultural sector is facing scarcity of farm-labour. Itis with this background that this paper has studied thetrends and patterns of rural employment diversification,alongwith the implications of growing rural non-farmsector on rural poverty. It has also examined the factorsaffecting rural employment diversification towards non-farm sector and the role of high-value horticulturalactivities in it.
Methodology and DataEmployment diversification is the shifting of
workforce from one sector to the other for employment.The proportions of this workforce engaged in differentsectors of the economy constitute the structure ofemployment. The present study has measured the extentof rural employment diversification at different levels.At the first level, it has been measured in terms ofshifting of workforce to the non-farm sector. At thesecond level, proportions of shifting of workforce todifferent sub-sector of agriculture have been measuredand finally, estimation has been made of shifting ofworkforce within the crop sub-sector. The crop sub-sector has been sub-divided into (i) foodgrains (cerealsand pulses), (ii) horticulture, (iii) cash crops, and (iv)agricultural services.
The pace and pattern of rural employmentdiversification has been studied at all-India level andacross major states for the period 1983 to 2009-10. Toanalyze the determinants of employment diversificationtowards non-farm sector and horticultural crops, andto attribute weights to these determinants, a multinomiallogit model was applied. Multinomial logit models havebeen used in the case of a dependent variable withmore than two categories (Jobson, 1992; Lesschen etal., 2005; Kumar et al., 2007). This type of regressionis similar to logistic regression, but is more generalbecause the dependent variable is not restricted to twocategories. Each category is compared to a referencecategory. The household level data from the 66th Round,Employment and Unemployment Survey, conductedby the National Sample Survey Organization (NSSO),Ministry of Statistics and Programme Implementation,Government of India, were used in the estimation ofmultinomial logit model. The factors that were supposedto influence the choice of employment included age,sex, education, household size, operational landholding,caste, etc. The multinomial logistic regression functionscan be expressed as per Equation (1):
…(1)
where, Yi represents the probability that the personsare engaged in the non-farm/ horticultural activities,Xis denote the vector of explanatory variables and βs
are the regression coefficients estimated by themaximum likelihood method. The specification andmeasurement of these explanatory variables have beenexplained in the section on results and discussion.
The interpretation of coefficients is lessstraightforward in the logit than OLS model. Usually, apositive coefficient for an independent variableincreases the probability of a household being upwardlymobile. However, the marginal effects of theexplanatory variables on the probabilities are not equalto the coefficients. Further calculations were requiredto estimate the marginal effects of each explanatoryvariable. The marginal effect of a variable wascomputed by using Equation (2):
δp(y) / δXi = βXi * exp [Z] / [1+exp(z)]2 …(2)
where, Z was the sum of coefficients multiplied by themeans of the respective variables plus the constant-term.
Further, the impact of non-farm sector in ruralpoverty was examined by using the log-linear regressionmodel. The log linear model was chosen based on thesignificance of the regression coefficients and goodnessof fit. The regression model used is given in Equation(3):
ln Rp = α + β ln Xi + εi …(3)
where, Rp is the rural poverty in percentage, Xis arethe explanatory variables which include total factorproductivity, share in non-farm employment (%), shareof non-agricultural sector in national income (%), ruralwages (`/day) and rural literacy (%), α is a constantterm and εi is the error-term.
Data
Different rounds of surveys conducted by theNational Sample Survey Organization (NSSO) onemployment /unemployment constituted the databaseof this study. The data were taken mainly from thefour quinquennial rounds of the NSSO, pertaining tothe years 1983 (38th round), 1993-94 (50th round), 2004-
Anjani Kumar et al. : Rural Employment Diversification in India 363
05 (61st round), and 2009-10 (66th round). However,instead of culling information from the published NSSOreports, the unit level data were extracted from theCD of NSSO. The analysis at the unit level wasparticularly important because the employmentestimates at more than one digit level of the NICclassification of industries were not available in thepublished reports. To estimate employment across thesub-sectors of agriculture and different components ofcrop sub-sector, NIC classification has been used. Formaking a comparison of the proportion of sectoralemployment across different time periods, viz. 1983,1993-94, 2004-05 and 2009-10, the concordance designof the NIC classifications1, as developed by the CentralStatistical Organization (CSO), was followed. However,within the crop sub-sector, some adjustments weremade with the CSO-designed concordance2 to comparethe selected four sub-groups across the selected years.
Results and Discussion
Rural Transformation in India: Accelerating albeitSlow
In India, rural employment has undergonesignificant changes during the past two and halfdecades. The share of agriculture in the labour forceremained stagnant for a long time, but started decliningin mid-1970s and has been declining since then. On theother hand, the share of rural non-farm sector has beenincreasing, and it now employs nearly one-third ofIndia’s rural workforce (Table 1), which amountsengaging of about 110 million rural people in the non-farm activities. Table 1, incorporating National SampleSurvey (NSS) data from the 38th, 50th, 61st and 66th
rounds, provides a snap shot of the growing importanceof non-farm sector in rural employment. At the all-India level, the share of non-farm sector in totalworkforce has increased consistently over time, from19 per cent in 1983 to 22 per cent in 1993-94, to about
27 per cent in 2004-05 and further to 32 per cent in2009-10.
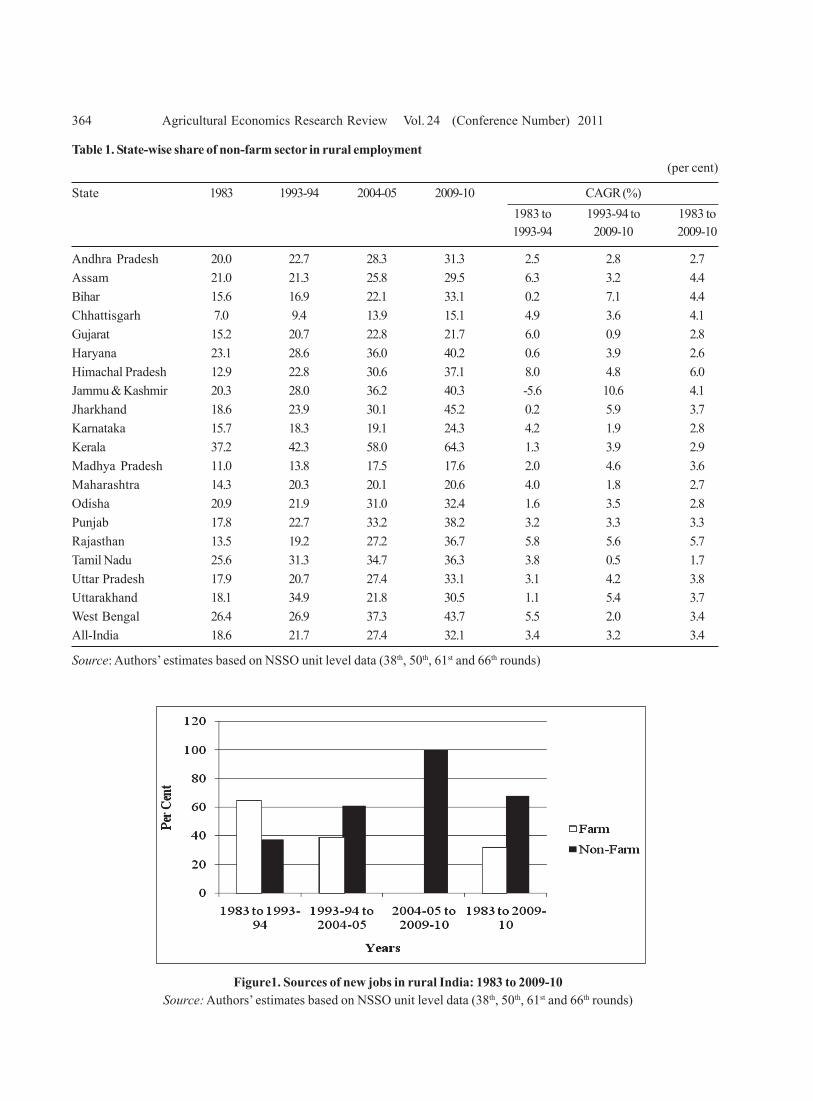
A perusal of Table 1 reveals that the non-farmsector has emerged as the sole source of additionalemployment opportunities in the rural areas. Between1983 and 1993-94, of the nearly 47 million additionalrural jobs created, the majority (6 out of every 10) werein the farm sector. But, this trend was reversedsubsequently. Between 1993-94 and 2004-05, thegrowth in non-farm employment surpassed agriculturewhen about 50 million new job opportunities werecreated in rural areas and 6 out of every 10 new jobswere in the non-farm sector. But in recent years,between 2004-05 and 2009-10, though the total ruralemployment has declined by 5 million, about 13 millionadditional rural jobs were created in the non-farm sector(Figure 1).
In fact during this period, workforce of nearly 20million rural people departed the farm sector. The declinein job opportunities in the farm sector may be attributedto several factors including the implementation ofschemes like MGNREGS. The decline in the farmemployment was likely to be, at least partly, driven bydistress in the agricultural sector which promptedhouseholds to seek employment more actively in thenon-farm sector.
The share of non-farm sector in providingemployment has been growing across all the states.But, the pace and pattern of rural non-farm employmentdid exhibit stark regional variations. In 1983, the shareof non-farm sector in rural employment varied from 7per cent in Chhattisgarh to 37 per cent in Kerala. In1983, the states where more than 20 per cent of therural workforce was employed in the non-farm sectorincluded West Bengal (26.4%), Tamil Nadu (25.6%),Haryana (23.1%), Assam (21%), Odisha (20.9%),Jammu & Kashmir (20.3%) and Andhra Pradesh(20.0%). In remaining of the states, the share of non-farm sector in rural employment was less than 20 percent in 1983. The share of non-farm sector in ruralemployment increased in all the states over time. In2009-10, about 64 per cent of the rural workforce inKerala was engaged in the non-farm sector. Also, inmajority of states, non-farm sector employed more thanone-third of the total rural workforce. It is clear thatthe process of structural transformation of the ruralworkforce that was steadily tilting in favour of non-farm is still continuing. Structural transformation of
1 Concordance Table II of the NIC -1998 suggests the methodfor concordance between 2-digit level of NIC-87 and ap-propriate level of NIC-98 (for converting NIC-98 based datain terms of NIC-87).
2 For comparing the sectoral employment within the cropproduction sector, we required concordance between 4-digit level of NIC-98 and 3-digit level of NIC-87 (for con-verting NIC-87 based data in terms of NIC-98), the meth-ods are outlined in E-1 concordance Table of NIC-1998.
364 Agricultural Economics Research Review Vol. 24 (Conference Number) 2011
Table 1. State-wise share of non-farm sector in rural employment(per cent)
State 1983 1993-94 2004-05 2009-10 CAGR (%)1983 to 1993-94 to 1983 to1993-94 2009-10 2009-10
Andhra Pradesh 20.0 22.7 28.3 31.3 2.5 2.8 2.7Assam 21.0 21.3 25.8 29.5 6.3 3.2 4.4Bihar 15.6 16.9 22.1 33.1 0.2 7.1 4.4Chhattisgarh 7.0 9.4 13.9 15.1 4.9 3.6 4.1Gujarat 15.2 20.7 22.8 21.7 6.0 0.9 2.8Haryana 23.1 28.6 36.0 40.2 0.6 3.9 2.6Himachal Pradesh 12.9 22.8 30.6 37.1 8.0 4.8 6.0Jammu & Kashmir 20.3 28.0 36.2 40.3 -5.6 10.6 4.1Jharkhand 18.6 23.9 30.1 45.2 0.2 5.9 3.7Karnataka 15.7 18.3 19.1 24.3 4.2 1.9 2.8Kerala 37.2 42.3 58.0 64.3 1.3 3.9 2.9Madhya Pradesh 11.0 13.8 17.5 17.6 2.0 4.6 3.6Maharashtra 14.3 20.3 20.1 20.6 4.0 1.8 2.7Odisha 20.9 21.9 31.0 32.4 1.6 3.5 2.8Punjab 17.8 22.7 33.2 38.2 3.2 3.3 3.3Rajasthan 13.5 19.2 27.2 36.7 5.8 5.6 5.7Tamil Nadu 25.6 31.3 34.7 36.3 3.8 0.5 1.7Uttar Pradesh 17.9 20.7 27.4 33.1 3.1 4.2 3.8Uttarakhand 18.1 34.9 21.8 30.5 1.1 5.4 3.7West Bengal 26.4 26.9 37.3 43.7 5.5 2.0 3.4All-India 18.6 21.7 27.4 32.1 3.4 3.2 3.4
Source: Authors’ estimates based on NSSO unit level data (38th, 50th, 61st and 66th rounds)
Figure1. Sources of new jobs in rural India: 1983 to 2009-10Source: Authors’ estimates based on NSSO unit level data (38th, 50th, 61st and 66th rounds)
Anjani Kumar et al. : Rural Employment Diversification in India 365
employment in rural areas was not visible only in a fewstates like Chhattisgarh (15.1%), Gujarat (21.7%),Karnataka (24.3%), Madhya Pradesh (17.6%) andMaharashtra (20.6%). Besides Kerala, the non-farmsector contributed about two-fifths to the ruralemployment in West Bengal (43.7%), Jharkhand(45.2%), Jammu & Kashmir (40.3%), Haryana(40.2%), Punjab (38.2%), Rajasthan (36.2%), TamilNadu (36.3%), and Himachal Pradesh (37.1%).
Employment Diversification within AgricultureSector
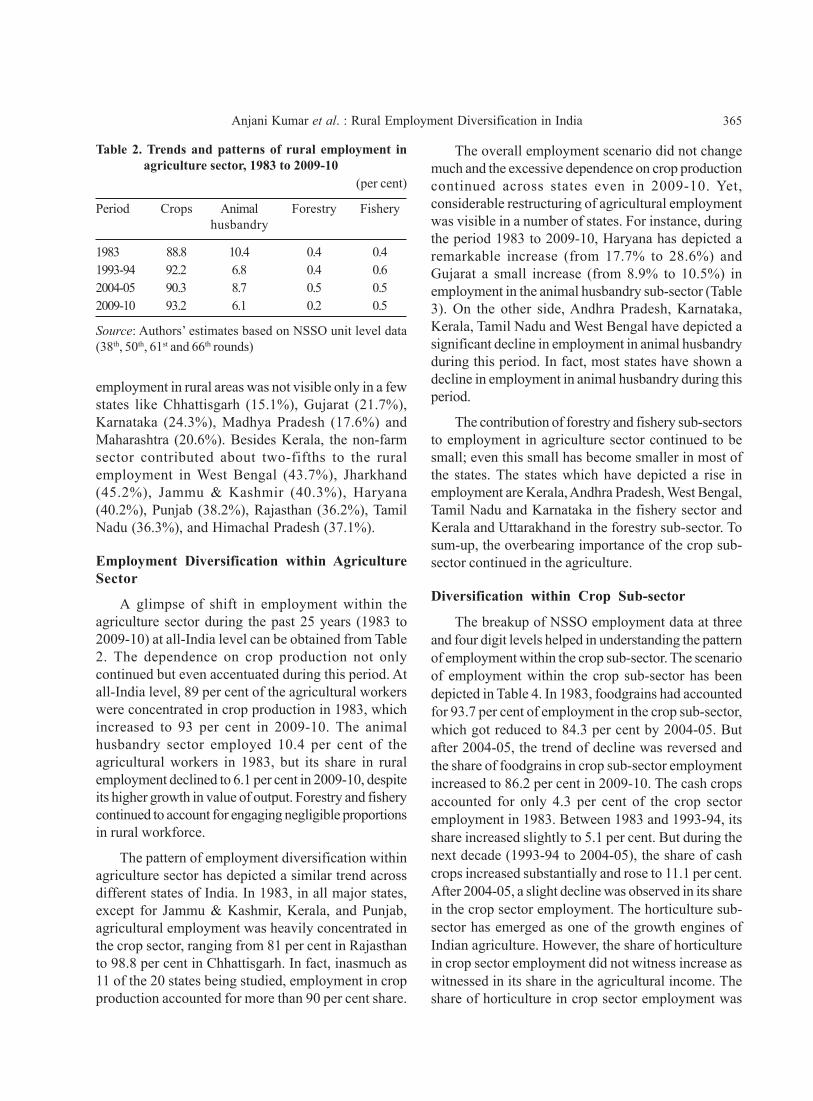
A glimpse of shift in employment within theagriculture sector during the past 25 years (1983 to2009-10) at all-India level can be obtained from Table2. The dependence on crop production not onlycontinued but even accentuated during this period. Atall-India level, 89 per cent of the agricultural workerswere concentrated in crop production in 1983, whichincreased to 93 per cent in 2009-10. The animalhusbandry sector employed 10.4 per cent of theagricultural workers in 1983, but its share in ruralemployment declined to 6.1 per cent in 2009-10, despiteits higher growth in value of output. Forestry and fisherycontinued to account for engaging negligible proportionsin rural workforce.
The pattern of employment diversification withinagriculture sector has depicted a similar trend acrossdifferent states of India. In 1983, in all major states,except for Jammu & Kashmir, Kerala, and Punjab,agricultural employment was heavily concentrated inthe crop sector, ranging from 81 per cent in Rajasthanto 98.8 per cent in Chhattisgarh. In fact, inasmuch as11 of the 20 states being studied, employment in cropproduction accounted for more than 90 per cent share.
The overall employment scenario did not changemuch and the excessive dependence on crop productioncontinued across states even in 2009-10. Yet,considerable restructuring of agricultural employmentwas visible in a number of states. For instance, duringthe period 1983 to 2009-10, Haryana has depicted aremarkable increase (from 17.7% to 28.6%) andGujarat a small increase (from 8.9% to 10.5%) inemployment in the animal husbandry sub-sector (Table3). On the other side, Andhra Pradesh, Karnataka,Kerala, Tamil Nadu and West Bengal have depicted asignificant decline in employment in animal husbandryduring this period. In fact, most states have shown adecline in employment in animal husbandry during thisperiod.
The contribution of forestry and fishery sub-sectorsto employment in agriculture sector continued to besmall; even this small has become smaller in most ofthe states. The states which have depicted a rise inemployment are Kerala, Andhra Pradesh, West Bengal,Tamil Nadu and Karnataka in the fishery sector andKerala and Uttarakhand in the forestry sub-sector. Tosum-up, the overbearing importance of the crop sub-sector continued in the agriculture.
Diversification within Crop Sub-sector
The breakup of NSSO employment data at threeand four digit levels helped in understanding the patternof employment within the crop sub-sector. The scenarioof employment within the crop sub-sector has beendepicted in Table 4. In 1983, foodgrains had accountedfor 93.7 per cent of employment in the crop sub-sector,which got reduced to 84.3 per cent by 2004-05. Butafter 2004-05, the trend of decline was reversed andthe share of foodgrains in crop sub-sector employmentincreased to 86.2 per cent in 2009-10. The cash cropsaccounted for only 4.3 per cent of the crop sectoremployment in 1983. Between 1983 and 1993-94, itsshare increased slightly to 5.1 per cent. But during thenext decade (1993-94 to 2004-05), the share of cashcrops increased substantially and rose to 11.1 per cent.After 2004-05, a slight decline was observed in its sharein the crop sector employment. The horticulture sub-sector has emerged as one of the growth engines ofIndian agriculture. However, the share of horticulturein crop sector employment did not witness increase aswitnessed in its share in the agricultural income. Theshare of horticulture in crop sector employment was
Table 2. Trends and patterns of rural employment inagriculture sector, 1983 to 2009-10
(per cent)
Period Crops Animal Forestry Fisheryhusbandry
1983 88.8 10.4 0.4 0.41993-94 92.2 6.8 0.4 0.62004-05 90.3 8.7 0.5 0.52009-10 93.2 6.1 0.2 0.5
Source: Authors’ estimates based on NSSO unit level data(38th, 50th, 61st and 66th rounds)
366 Agricultural Economics Research Review Vol. 24 (Conference Number) 2011
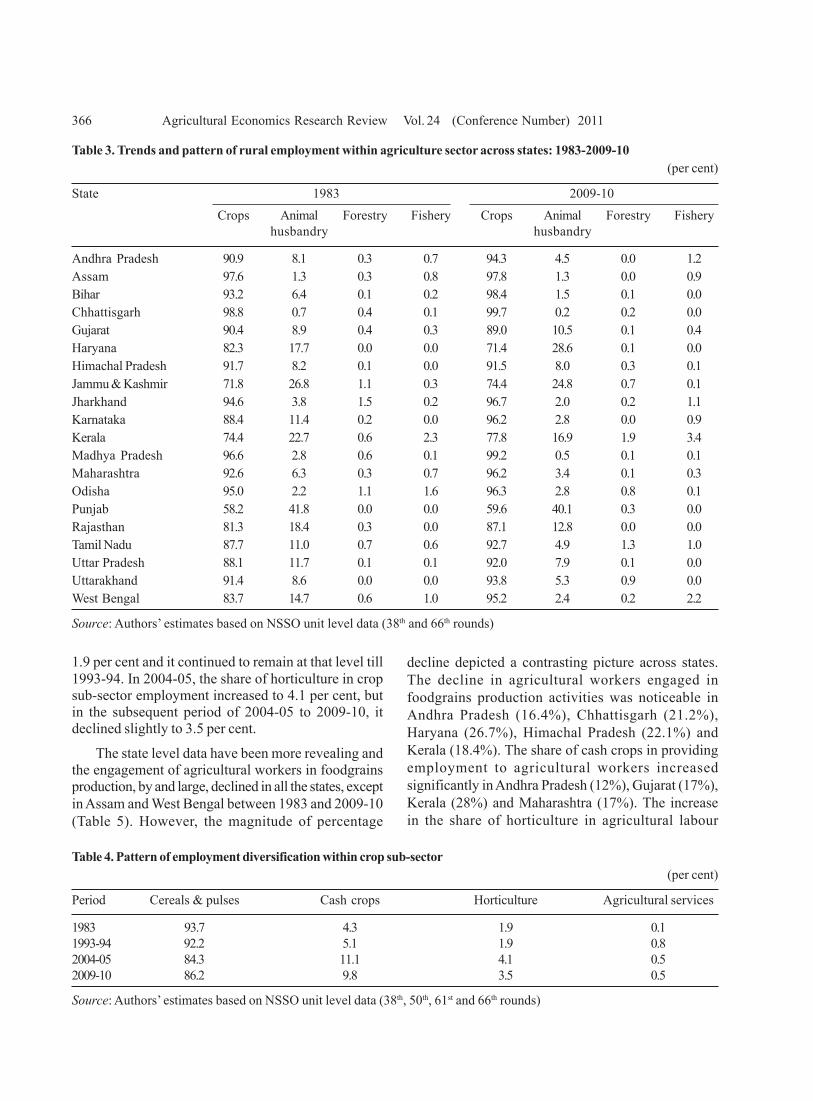
Table 3. Trends and pattern of rural employment within agriculture sector across states: 1983-2009-10(per cent)
State 1983 2009-10
Crops Animal Forestry Fishery Crops Animal Forestry Fisheryhusbandry husbandry
Andhra Pradesh 90.9 8.1 0.3 0.7 94.3 4.5 0.0 1.2Assam 97.6 1.3 0.3 0.8 97.8 1.3 0.0 0.9Bihar 93.2 6.4 0.1 0.2 98.4 1.5 0.1 0.0Chhattisgarh 98.8 0.7 0.4 0.1 99.7 0.2 0.2 0.0Gujarat 90.4 8.9 0.4 0.3 89.0 10.5 0.1 0.4Haryana 82.3 17.7 0.0 0.0 71.4 28.6 0.1 0.0Himachal Pradesh 91.7 8.2 0.1 0.0 91.5 8.0 0.3 0.1Jammu & Kashmir 71.8 26.8 1.1 0.3 74.4 24.8 0.7 0.1Jharkhand 94.6 3.8 1.5 0.2 96.7 2.0 0.2 1.1Karnataka 88.4 11.4 0.2 0.0 96.2 2.8 0.0 0.9Kerala 74.4 22.7 0.6 2.3 77.8 16.9 1.9 3.4Madhya Pradesh 96.6 2.8 0.6 0.1 99.2 0.5 0.1 0.1Maharashtra 92.6 6.3 0.3 0.7 96.2 3.4 0.1 0.3Odisha 95.0 2.2 1.1 1.6 96.3 2.8 0.8 0.1Punjab 58.2 41.8 0.0 0.0 59.6 40.1 0.3 0.0Rajasthan 81.3 18.4 0.3 0.0 87.1 12.8 0.0 0.0Tamil Nadu 87.7 11.0 0.7 0.6 92.7 4.9 1.3 1.0Uttar Pradesh 88.1 11.7 0.1 0.1 92.0 7.9 0.1 0.0Uttarakhand 91.4 8.6 0.0 0.0 93.8 5.3 0.9 0.0West Bengal 83.7 14.7 0.6 1.0 95.2 2.4 0.2 2.2
Source: Authors’ estimates based on NSSO unit level data (38th and 66th rounds)
1.9 per cent and it continued to remain at that level till1993-94. In 2004-05, the share of horticulture in cropsub-sector employment increased to 4.1 per cent, butin the subsequent period of 2004-05 to 2009-10, itdeclined slightly to 3.5 per cent.
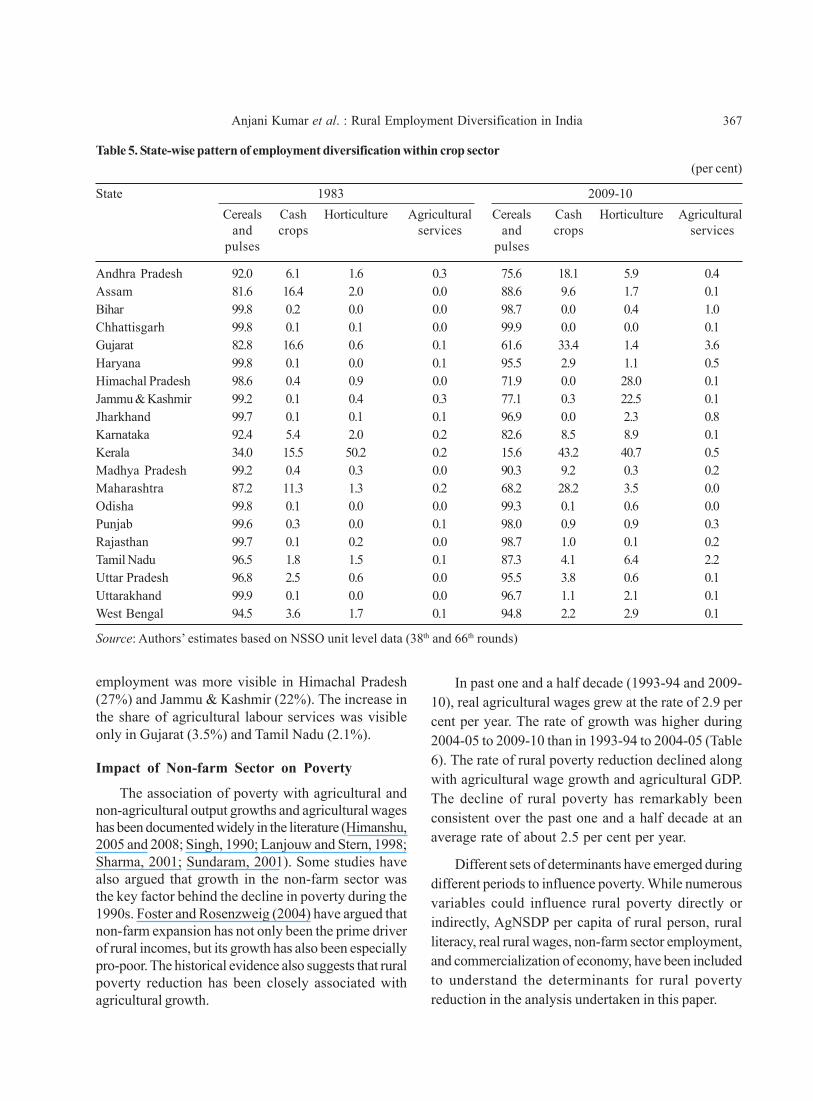
The state level data have been more revealing andthe engagement of agricultural workers in foodgrainsproduction, by and large, declined in all the states, exceptin Assam and West Bengal between 1983 and 2009-10(Table 5). However, the magnitude of percentage
decline depicted a contrasting picture across states.The decline in agricultural workers engaged infoodgrains production activities was noticeable inAndhra Pradesh (16.4%), Chhattisgarh (21.2%),Haryana (26.7%), Himachal Pradesh (22.1%) andKerala (18.4%). The share of cash crops in providingemployment to agricultural workers increasedsignificantly in Andhra Pradesh (12%), Gujarat (17%),Kerala (28%) and Maharashtra (17%). The increasein the share of horticulture in agricultural labour
Table 4. Pattern of employment diversification within crop sub-sector(per cent)
Period Cereals & pulses Cash crops Horticulture Agricultural services
1983 93.7 4.3 1.9 0.11993-94 92.2 5.1 1.9 0.82004-05 84.3 11.1 4.1 0.52009-10 86.2 9.8 3.5 0.5
Source: Authors’ estimates based on NSSO unit level data (38th, 50th, 61st and 66th rounds)
Anjani Kumar et al. : Rural Employment Diversification in India 367
Table 5. State-wise pattern of employment diversification within crop sector(per cent)
State 1983 2009-10Cereals Cash Horticulture Agricultural Cereals Cash Horticulture Agricultural
and crops services and crops servicespulses pulses
Andhra Pradesh 92.0 6.1 1.6 0.3 75.6 18.1 5.9 0.4Assam 81.6 16.4 2.0 0.0 88.6 9.6 1.7 0.1Bihar 99.8 0.2 0.0 0.0 98.7 0.0 0.4 1.0Chhattisgarh 99.8 0.1 0.1 0.0 99.9 0.0 0.0 0.1Gujarat 82.8 16.6 0.6 0.1 61.6 33.4 1.4 3.6Haryana 99.8 0.1 0.0 0.1 95.5 2.9 1.1 0.5Himachal Pradesh 98.6 0.4 0.9 0.0 71.9 0.0 28.0 0.1Jammu & Kashmir 99.2 0.1 0.4 0.3 77.1 0.3 22.5 0.1Jharkhand 99.7 0.1 0.1 0.1 96.9 0.0 2.3 0.8Karnataka 92.4 5.4 2.0 0.2 82.6 8.5 8.9 0.1Kerala 34.0 15.5 50.2 0.2 15.6 43.2 40.7 0.5Madhya Pradesh 99.2 0.4 0.3 0.0 90.3 9.2 0.3 0.2Maharashtra 87.2 11.3 1.3 0.2 68.2 28.2 3.5 0.0Odisha 99.8 0.1 0.0 0.0 99.3 0.1 0.6 0.0Punjab 99.6 0.3 0.0 0.1 98.0 0.9 0.9 0.3Rajasthan 99.7 0.1 0.2 0.0 98.7 1.0 0.1 0.2Tamil Nadu 96.5 1.8 1.5 0.1 87.3 4.1 6.4 2.2Uttar Pradesh 96.8 2.5 0.6 0.0 95.5 3.8 0.6 0.1Uttarakhand 99.9 0.1 0.0 0.0 96.7 1.1 2.1 0.1West Bengal 94.5 3.6 1.7 0.1 94.8 2.2 2.9 0.1
Source: Authors’ estimates based on NSSO unit level data (38th and 66th rounds)
employment was more visible in Himachal Pradesh(27%) and Jammu & Kashmir (22%). The increase inthe share of agricultural labour services was visibleonly in Gujarat (3.5%) and Tamil Nadu (2.1%).
Impact of Non-farm Sector on Poverty
The association of poverty with agricultural andnon-agricultural output growths and agricultural wageshas been documented widely in the literature (Himanshu,2005 and 2008; Singh, 1990; Lanjouw and Stern, 1998;Sharma, 2001; Sundaram, 2001). Some studies havealso argued that growth in the non-farm sector wasthe key factor behind the decline in poverty during the1990s. Foster and Rosenzweig (2004) have argued thatnon-farm expansion has not only been the prime driverof rural incomes, but its growth has also been especiallypro-poor. The historical evidence also suggests that ruralpoverty reduction has been closely associated withagricultural growth.
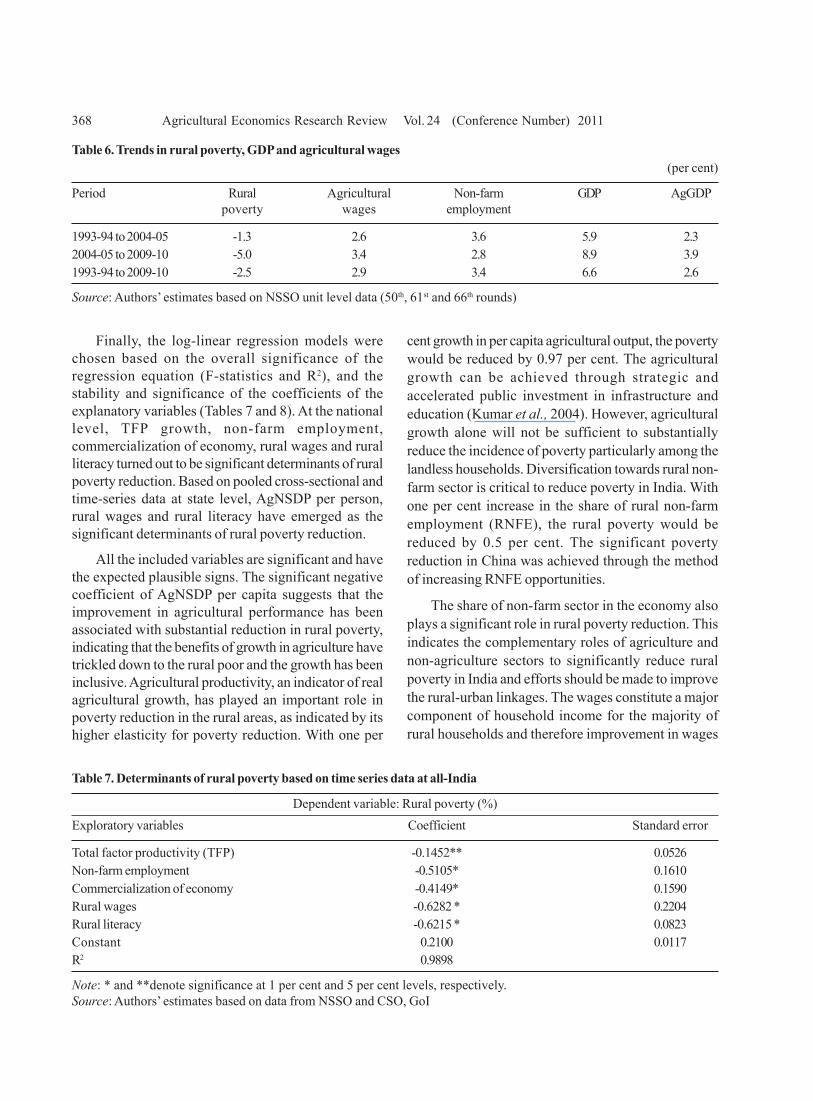
In past one and a half decade (1993-94 and 2009-10), real agricultural wages grew at the rate of 2.9 percent per year. The rate of growth was higher during2004-05 to 2009-10 than in 1993-94 to 2004-05 (Table6). The rate of rural poverty reduction declined alongwith agricultural wage growth and agricultural GDP.The decline of rural poverty has remarkably beenconsistent over the past one and a half decade at anaverage rate of about 2.5 per cent per year.
Different sets of determinants have emerged duringdifferent periods to influence poverty. While numerousvariables could influence rural poverty directly orindirectly, AgNSDP per capita of rural person, ruralliteracy, real rural wages, non-farm sector employment,and commercialization of economy, have been includedto understand the determinants for rural povertyreduction in the analysis undertaken in this paper.
368 Agricultural Economics Research Review Vol. 24 (Conference Number) 2011
Finally, the log-linear regression models werechosen based on the overall significance of theregression equation (F-statistics and R2), and thestability and significance of the coefficients of theexplanatory variables (Tables 7 and 8). At the nationallevel, TFP growth, non-farm employment,commercialization of economy, rural wages and ruralliteracy turned out to be significant determinants of ruralpoverty reduction. Based on pooled cross-sectional andtime-series data at state level, AgNSDP per person,rural wages and rural literacy have emerged as thesignificant determinants of rural poverty reduction.
All the included variables are significant and havethe expected plausible signs. The significant negativecoefficient of AgNSDP per capita suggests that theimprovement in agricultural performance has beenassociated with substantial reduction in rural poverty,indicating that the benefits of growth in agriculture havetrickled down to the rural poor and the growth has beeninclusive. Agricultural productivity, an indicator of realagricultural growth, has played an important role inpoverty reduction in the rural areas, as indicated by itshigher elasticity for poverty reduction. With one per
cent growth in per capita agricultural output, the povertywould be reduced by 0.97 per cent. The agriculturalgrowth can be achieved through strategic andaccelerated public investment in infrastructure andeducation (Kumar et al., 2004). However, agriculturalgrowth alone will not be sufficient to substantiallyreduce the incidence of poverty particularly among thelandless households. Diversification towards rural non-farm sector is critical to reduce poverty in India. Withone per cent increase in the share of rural non-farmemployment (RNFE), the rural poverty would bereduced by 0.5 per cent. The significant povertyreduction in China was achieved through the methodof increasing RNFE opportunities.
The share of non-farm sector in the economy alsoplays a significant role in rural poverty reduction. Thisindicates the complementary roles of agriculture andnon-agriculture sectors to significantly reduce ruralpoverty in India and efforts should be made to improvethe rural-urban linkages. The wages constitute a majorcomponent of household income for the majority ofrural households and therefore improvement in wages
Table 6. Trends in rural poverty, GDP and agricultural wages(per cent)
Period Rural Agricultural Non-farm GDP AgGDPpoverty wages employment
1993-94 to 2004-05 -1.3 2.6 3.6 5.9 2.32004-05 to 2009-10 -5.0 3.4 2.8 8.9 3.91993-94 to 2009-10 -2.5 2.9 3.4 6.6 2.6
Source: Authors’ estimates based on NSSO unit level data (50th, 61st and 66th rounds)
Table 7. Determinants of rural poverty based on time series data at all-India
Dependent variable: Rural poverty (%)Exploratory variables Coefficient Standard error
Total factor productivity (TFP) -0.1452** 0.0526Non-farm employment -0.5105* 0.1610Commercialization of economy -0.4149* 0.1590Rural wages -0.6282 * 0.2204Rural literacy -0.6215 * 0.0823Constant 0.2100 0.0117R2 0.9898
Note: * and **denote significance at 1 per cent and 5 per cent levels, respectively.Source: Authors’ estimates based on data from NSSO and CSO, GoI
Anjani Kumar et al. : Rural Employment Diversification in India 369
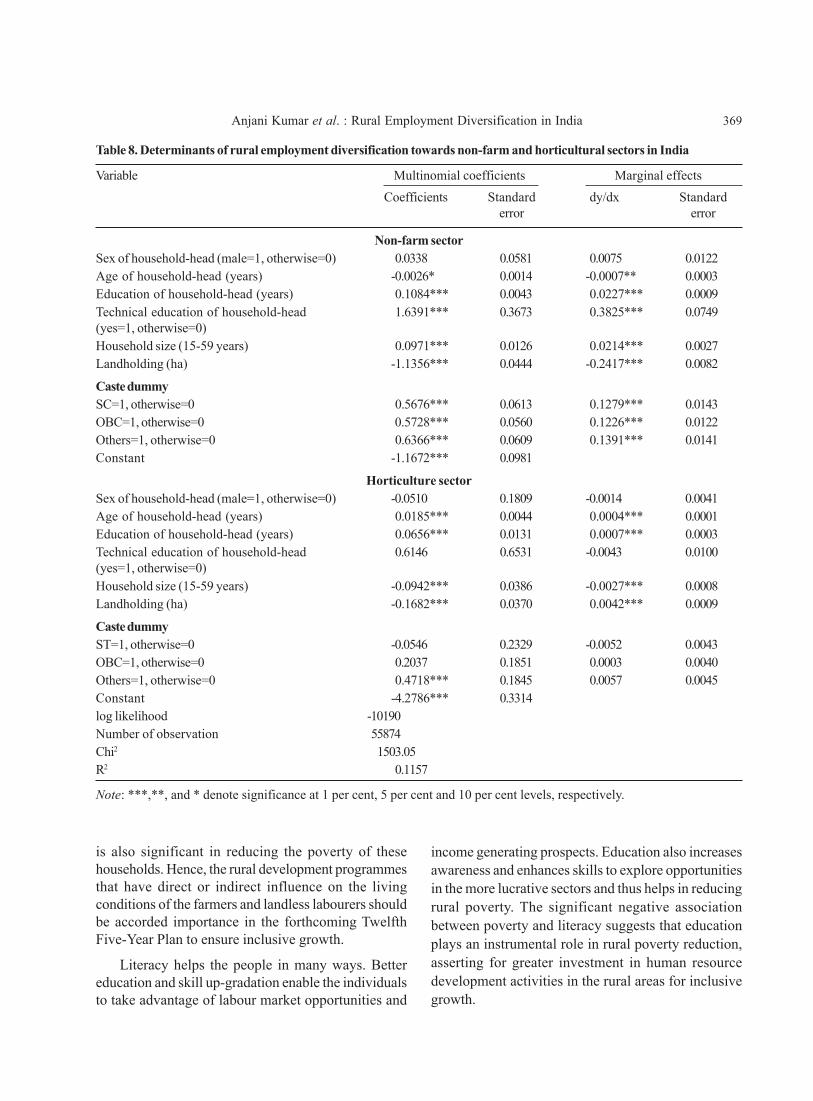
Table 8. Determinants of rural employment diversification towards non-farm and horticultural sectors in India
Variable Multinomial coefficients Marginal effectsCoefficients Standard dy/dx Standard
error error
Non-farm sectorSex of household-head (male=1, otherwise=0) 0.0338 0.0581 0.0075 0.0122Age of household-head (years) -0.0026* 0.0014 -0.0007** 0.0003Education of household-head (years) 0.1084*** 0.0043 0.0227*** 0.0009Technical education of household-head 1.6391*** 0.3673 0.3825*** 0.0749(yes=1, otherwise=0)Household size (15-59 years) 0.0971*** 0.0126 0.0214*** 0.0027Landholding (ha) -1.1356*** 0.0444 -0.2417*** 0.0082
Caste dummySC=1, otherwise=0 0.5676*** 0.0613 0.1279*** 0.0143OBC=1, otherwise=0 0.5728*** 0.0560 0.1226*** 0.0122Others=1, otherwise=0 0.6366*** 0.0609 0.1391*** 0.0141Constant -1.1672*** 0.0981
Horticulture sectorSex of household-head (male=1, otherwise=0) -0.0510 0.1809 -0.0014 0.0041Age of household-head (years) 0.0185*** 0.0044 0.0004*** 0.0001Education of household-head (years) 0.0656*** 0.0131 0.0007*** 0.0003Technical education of household-head 0.6146 0.6531 -0.0043 0.0100(yes=1, otherwise=0)Household size (15-59 years) -0.0942*** 0.0386 -0.0027*** 0.0008Landholding (ha) -0.1682*** 0.0370 0.0042*** 0.0009
Caste dummyST=1, otherwise=0 -0.0546 0.2329 -0.0052 0.0043OBC=1, otherwise=0 0.2037 0.1851 0.0003 0.0040Others=1, otherwise=0 0.4718*** 0.1845 0.0057 0.0045Constant -4.2786*** 0.3314log likelihood -10190Number of observation 55874Chi2 1503.05R2 0.1157
Note: ***,**, and * denote significance at 1 per cent, 5 per cent and 10 per cent levels, respectively.
is also significant in reducing the poverty of thesehouseholds. Hence, the rural development programmesthat have direct or indirect influence on the livingconditions of the farmers and landless labourers shouldbe accorded importance in the forthcoming TwelfthFive-Year Plan to ensure inclusive growth.
Literacy helps the people in many ways. Bettereducation and skill up-gradation enable the individualsto take advantage of labour market opportunities and
income generating prospects. Education also increasesawareness and enhances skills to explore opportunitiesin the more lucrative sectors and thus helps in reducingrural poverty. The significant negative associationbetween poverty and literacy suggests that educationplays an instrumental role in rural poverty reduction,asserting for greater investment in human resourcedevelopment activities in the rural areas for inclusivegrowth.
370 Agricultural Economics Research Review Vol. 24 (Conference Number) 2011
Determinants of Rural EmploymentDiversification
Non-farm Sector
A multinomial logit model was applied to identifythe factors that determine the possibility of employmentin the rural non-farm (RNF) sector. The variablesincluded in the best-fit models and the relatedhypotheses have been discussed below. It washypothesized that the age of decision-maker in ahousehold influences the possibility of being employedin RNF activities negatively. The elder members of afarm household may not be able to shift from farm tonon-farm sector. Female-headed households werehypothesized to have less access to RNF activities.Education improves individuals’ skills and prospects fornon-farm jobs as well as increases ability to workefficiently for income-providing activities. Therefore,education level was hypothesized to influence theparticipation of workers in the RNF activities positively.The household-size also affects participation in the ruralnon-farm employment. The expected relationshipbetween the household-size and possibility of ahousehold being engaged in rural non-farm employment(RNFE) was positive. The households with a largerfarm-size had less probability of participation in RNFE.
Several occupations are linked to caste in the Indiancontext. Therefore, it was considered worthwhile tofind the effect of caste on RNFE. The households’ percapita income may affect its members’ decision onengagement in non-farm activities. The per capitamonthly consumption expenditure was treated as aproxy for the per capita income of a household. A higherincome enables the household-members to acquirenecessary skills and training to participate in the RNFactivities. Further, the surplus money enables thehouseholds to acquire assets and equipments necessaryto be involved in the RNFE. Therefore, a positiverelationship between income and RNFE was perceived.State dummies were included to assess the role of state-specific factors on RNFE.
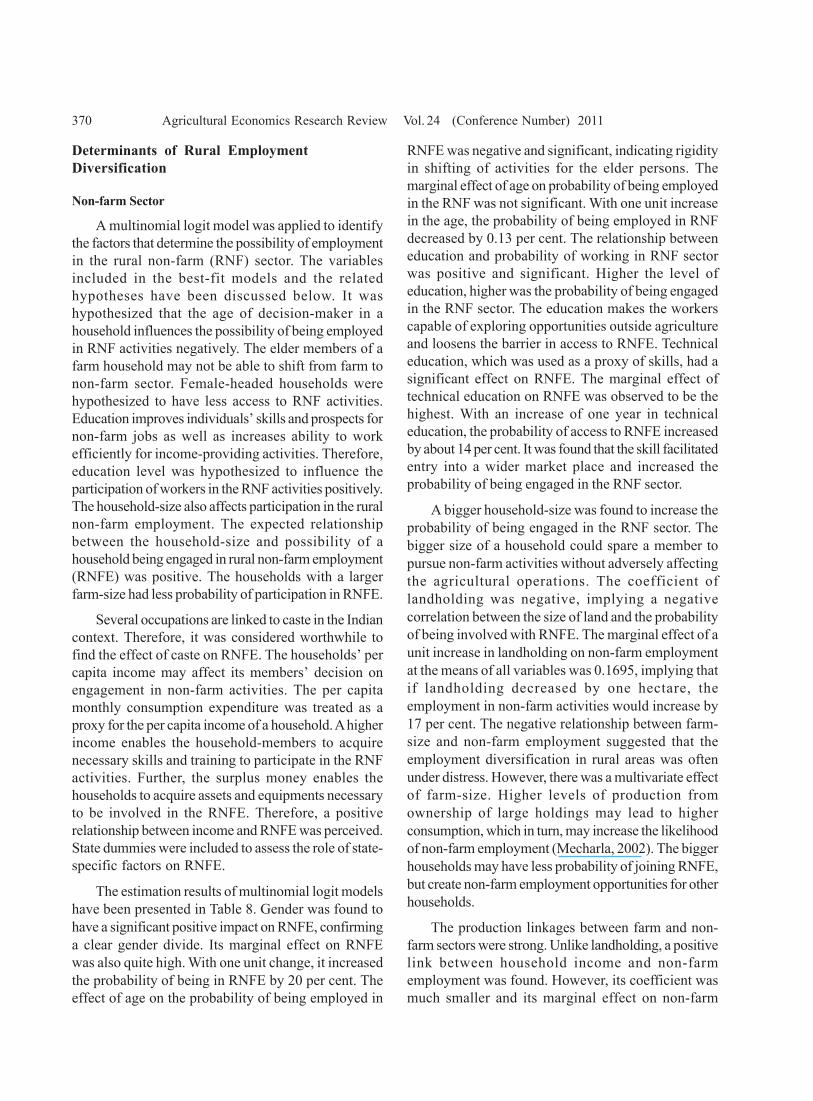
The estimation results of multinomial logit modelshave been presented in Table 8. Gender was found tohave a significant positive impact on RNFE, confirminga clear gender divide. Its marginal effect on RNFEwas also quite high. With one unit change, it increasedthe probability of being in RNFE by 20 per cent. Theeffect of age on the probability of being employed in
RNFE was negative and significant, indicating rigidityin shifting of activities for the elder persons. Themarginal effect of age on probability of being employedin the RNF was not significant. With one unit increasein the age, the probability of being employed in RNFdecreased by 0.13 per cent. The relationship betweeneducation and probability of working in RNF sectorwas positive and significant. Higher the level ofeducation, higher was the probability of being engagedin the RNF sector. The education makes the workerscapable of exploring opportunities outside agricultureand loosens the barrier in access to RNFE. Technicaleducation, which was used as a proxy of skills, had asignificant effect on RNFE. The marginal effect oftechnical education on RNFE was observed to be thehighest. With an increase of one year in technicaleducation, the probability of access to RNFE increasedby about 14 per cent. It was found that the skill facilitatedentry into a wider market place and increased theprobability of being engaged in the RNF sector.
A bigger household-size was found to increase theprobability of being engaged in the RNF sector. Thebigger size of a household could spare a member topursue non-farm activities without adversely affectingthe agricultural operations. The coefficient oflandholding was negative, implying a negativecorrelation between the size of land and the probabilityof being involved with RNFE. The marginal effect of aunit increase in landholding on non-farm employmentat the means of all variables was 0.1695, implying thatif landholding decreased by one hectare, theemployment in non-farm activities would increase by17 per cent. The negative relationship between farm-size and non-farm employment suggested that theemployment diversification in rural areas was oftenunder distress. However, there was a multivariate effectof farm-size. Higher levels of production fromownership of large holdings may lead to higherconsumption, which in turn, may increase the likelihoodof non-farm employment (Mecharla, 2002). The biggerhouseholds may have less probability of joining RNFE,but create non-farm employment opportunities for otherhouseholds.
The production linkages between farm and non-farm sectors were strong. Unlike landholding, a positivelink between household income and non-farmemployment was found. However, its coefficient wasmuch smaller and its marginal effect on non-farm
Anjani Kumar et al. : Rural Employment Diversification in India 371
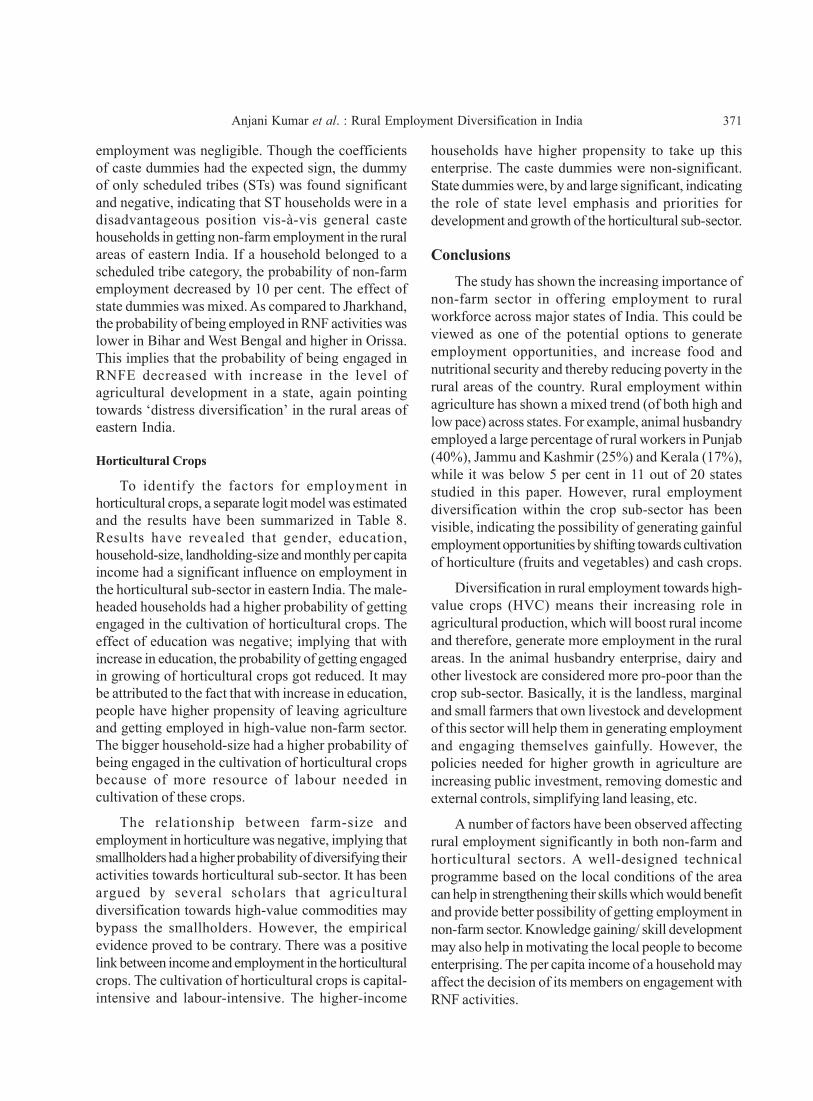
employment was negligible. Though the coefficientsof caste dummies had the expected sign, the dummyof only scheduled tribes (STs) was found significantand negative, indicating that ST households were in adisadvantageous position vis-à-vis general castehouseholds in getting non-farm employment in the ruralareas of eastern India. If a household belonged to ascheduled tribe category, the probability of non-farmemployment decreased by 10 per cent. The effect ofstate dummies was mixed. As compared to Jharkhand,the probability of being employed in RNF activities waslower in Bihar and West Bengal and higher in Orissa.This implies that the probability of being engaged inRNFE decreased with increase in the level ofagricultural development in a state, again pointingtowards ‘distress diversification’ in the rural areas ofeastern India.
Horticultural Crops
To identify the factors for employment inhorticultural crops, a separate logit model was estimatedand the results have been summarized in Table 8.Results have revealed that gender, education,household-size, landholding-size and monthly per capitaincome had a significant influence on employment inthe horticultural sub-sector in eastern India. The male-headed households had a higher probability of gettingengaged in the cultivation of horticultural crops. Theeffect of education was negative; implying that withincrease in education, the probability of getting engagedin growing of horticultural crops got reduced. It maybe attributed to the fact that with increase in education,people have higher propensity of leaving agricultureand getting employed in high-value non-farm sector.The bigger household-size had a higher probability ofbeing engaged in the cultivation of horticultural cropsbecause of more resource of labour needed incultivation of these crops.
The relationship between farm-size andemployment in horticulture was negative, implying thatsmallholders had a higher probability of diversifying theiractivities towards horticultural sub-sector. It has beenargued by several scholars that agriculturaldiversification towards high-value commodities maybypass the smallholders. However, the empiricalevidence proved to be contrary. There was a positivelink between income and employment in the horticulturalcrops. The cultivation of horticultural crops is capital-intensive and labour-intensive. The higher-income
households have higher propensity to take up thisenterprise. The caste dummies were non-significant.State dummies were, by and large significant, indicatingthe role of state level emphasis and priorities fordevelopment and growth of the horticultural sub-sector.
ConclusionsThe study has shown the increasing importance of
non-farm sector in offering employment to ruralworkforce across major states of India. This could beviewed as one of the potential options to generateemployment opportunities, and increase food andnutritional security and thereby reducing poverty in therural areas of the country. Rural employment withinagriculture has shown a mixed trend (of both high andlow pace) across states. For example, animal husbandryemployed a large percentage of rural workers in Punjab(40%), Jammu and Kashmir (25%) and Kerala (17%),while it was below 5 per cent in 11 out of 20 statesstudied in this paper. However, rural employmentdiversification within the crop sub-sector has beenvisible, indicating the possibility of generating gainfulemployment opportunities by shifting towards cultivationof horticulture (fruits and vegetables) and cash crops.
Diversification in rural employment towards high-value crops (HVC) means their increasing role inagricultural production, which will boost rural incomeand therefore, generate more employment in the ruralareas. In the animal husbandry enterprise, dairy andother livestock are considered more pro-poor than thecrop sub-sector. Basically, it is the landless, marginaland small farmers that own livestock and developmentof this sector will help them in generating employmentand engaging themselves gainfully. However, thepolicies needed for higher growth in agriculture areincreasing public investment, removing domestic andexternal controls, simplifying land leasing, etc.
A number of factors have been observed affectingrural employment significantly in both non-farm andhorticultural sectors. A well-designed technicalprogramme based on the local conditions of the areacan help in strengthening their skills which would benefitand provide better possibility of getting employment innon-farm sector. Knowledge gaining/ skill developmentmay also help in motivating the local people to becomeenterprising. The per capita income of a household mayaffect the decision of its members on engagement withRNF activities.
372 Agricultural Economics Research Review Vol. 24 (Conference Number) 2011
ReferencesBasant, R. and Kumar, B.L. (1989) Rural non-agricultural
activities in India: A review of available evidence. SocialScientist, 17 (1-2): 13-17.
Chadha, G.K. (2003) Rural employment: Current situation,challenges and potential for expansion: Issues inemployment and poverty. A Discussion Paper, Recoveryand Reconstruction Department, International LabourOffice, Geneva.
Chadha, G.K. and Sahu, P.P. (2002) Post-reforms setbacks inemployment: Issues and need for further scrutiny.Economic and Political Weekly, 37 (21): 1998-2026.
Foster, A. and M. Rosenzweig (2004) Agricultural productivitygrowth, rural economic diversity, and economic reforms:India, 1970-2000. Economic Development and CulturalChanges, 52: 509-542.
Himanshu (2005) Wages in rural India: Sources, trends andcomparability, Indian Journal of Labour Economics,48 (2).
Himanshu (2008) Agriculture and non-farm employment:Exploring the inter-linkages in rural India. Backgroundpaper prepared for India Poverty Assessment Report.New Delhi, Jawaharlal Nehru University.
Jobson, J. D. (1992) Applied Multivariate Data Analysis,Springer, New York, USA.
Kumar, P., Kumar, Anjani and Mittal, Surabhi (2004) Totalfactor productivity of the crop sector in the Indo-Gangetic Plains of India: Sustainability issues revisited.Indian Economic Review, 39 (1): 169-201.
Kumar, Anjani (2009) Rural employment diversification ineastern India: Trends and determinants. AgriculturalEconomics Research Review, 22 (1): 47-60.
Kumar, Anjani and Elumalai, K. (2007) Agricultural growthand productivity in India: An inter-state variations. In:
Economic Growth and Regional Balance: RecentExperiences and Implications in India. Eds: T.S. Papola,and Alakh N. Sharma, Institute for Human Development,New Delhi.
Lanjouw, Peter and Stern, Nocholas (1998) EconomicDevelopment in Palanpur over Five Decades, Powell’sBookstores, Chicago, USA, 668 p.
Lesschen, J. P., Verburg, P. H. and Steven, J.S. (2005)Statistical methods for analyzing the spatial dimensionof changes in land use and farming systems. LUCCReports Series No. 7. The International LivestockResearch Institute, Nairobi, Kenya and LUCC Focus 3Office Wageningen University, the Netherlands.
Mukhopadhyay, Abhiroop and Rajaraman, Indira (2007)Rural unemployment 1999-2005: Who gained, wholost? Economic and Political Weekly, 37 (21): 3116-3120.
Prasada Rao, Mecharla (2002) The determinants of rural non-farm employment in two villages of Andhra Pradesh(India), PRUS Working Paper No. 12, University ofSussex, Brighton.
Sharma, H.R. (2001) Employment and wage earnings ofagricultural labourers: A state-wise analysis. The IndianJournal of Labour Economics, 44 (1):27-38.
Singh, I. (1990) The Great Ascent: The Rural Poor in SouthAsia. Johns Hopkins University Press, Washington,D.C., USA.
Sundaram, K. (2001) Employment and poverty in 1990s:Further results from NSS 55th Round Employment-Unemployment Survey, 1999-2000. Economic andPolitical Weekly, 36 (32): 3039-3049, August.
Visaria, P. (1995) Rural non-farm employment in India: Trendsand issues for research. Indian Journal of AgriculturalEconomics, 50 (3): 398-409.