
RTR Telekom Monitor Annual Review 2013
102
RTR Telekom Monitor Annual Review 2013
-
Upload
independent -
Category
Documents
-
view
1 -
download
0
Transcript of RTR Telekom Monitor Annual Review 2013

RTR Telekom MonitorAnnual Review 2013

RTR Telekom Monitor
2
Annual Review 2013
Table of ConTenTs
Preface 5
1 | fixed network 7
Fixed lines 8
Fixed-line penetration 9
Development of fixed lines 10
Carrier pre-selection and call-by-call customers 11
Retail revenues from access services 12
Retail revenues from carrier services 1/2 13
Retail revenues from carrier services 2/2 14
Call minutes on the retail market 15
Revenues per call minute 16
The average fixed-network subscriber 17
Wholesale revenues 18
Wholesale market in minutes 19
Total fixed network revenues 20
Geographical numbers in use 21
Service numbers in use: (0)800, (0)810, (0)820, (0)821, (0)828, (0)900, (0)930 22
Ported geographical numbers and service numbers 23
Data tables 24
2 | leased lines 29
Number of retail leased lines in Austria 30
Revenues from retail leased lines in Austria 31
Revenues from terminating segments and trunk segments 32
Number of terminating segments of leased lines in Austria 33
Data tables 34
3 | Mobile communications 37
Mobile penetration 38
Retail revenues from mobile communications 39
Call minutes on the retail market 40
Text messages 41
Data volume (retail market) 42
SIM cards in use 43
Prepaid vs. postpaid SIM cards 44
The average SIM card 45
Total mobile communications revenues 46
Porting of mobile telephone numbers 47
Market shares of mobile service providers in Austria 48
Price index in mobile communications 49
Data tables 50

3
RTR Telekom Monitor Annual Review 2013
Table of ConTenTs
4 | broadband 53
Fixed and mobile broadband connections 54
Broadband penetration 55
Retail broadband connections by type of infrastructure 56
Retail broadband connections by bandwidth category – fixed network 57
Number of retail broadband connections – fixed network 58
Revenues from retail broadband connections – fixed network 59
Unbundled lines of A1 Telekom Austria 60
Number of wholesale broadband connections 61
Revenues from wholesale broadband connections 62
Price index for broadband (hedonic) 63
Data tables 64
5 | Comparisons across sectors 69
Revenues from fixed, mobile, broadband and leased line services 70
Real minutes in fixed and mobile networks 71
6 | business indicators 73
Investments 74
Employees in the telecommunications sector 75
Data tables 76
7 | International comparisons 77
Mobile penetration rate (2011 to 2012) 78
Interconnection charges for termination in mobile networks 79
Average retail roaming rates for calls within EU/EEA 80
Average retail SMS roaming charges within the EU/EEA 81
Average retail data roaming rates within the EU/EEA (per megabyte) 82
Fixed broadband penetration 83
Mobile broadband penetration 84
Incumbent operator’s share of broadband market 85
Broadband connections by bandwidth 86
Data tables 87
8 | Technology indicators 91
Computers, Internet access and broadband in households 92
Networked Readiness Index – Austria 93
Global Competitiveness Index 94
Gross domestic expenditure on R&D in absolute terms and as a proportion of GDP 95
9 | Glossary 97
Publishing information 102

RTR Telekom Monitor
4
Annual Review 2013

5
RTR Telekom Monitor Annual Review 2013
Dear readers,
The RTR Telecom Monitor, which has been published quarterly for several years now, explains the latest data and trends on the Austrian telecommunications markets. The content of the regular quarterly RTR Telecom Monitor editions is contained in this Annual Review in Sections 1 to 6. Section 7 contains international comparisons. The data used in these comparisons were mostly derived from the European Commission’s Digital Agenda Scoreboard. Section 8 deals with a selection of internationally accepted technology indices and highlights Austria’s performance in these international comparisons.
Communications survey ordinance (KeV)
The rationale for the data survey on which the quarterly issues of the RTR Telecom Monitor are based is the Communications Survey Ordinance (KEV), Federal Law Gazette II No. 365/2004, which came into force on 1 October 2004. RTR is obliged by this Ordinance to carry out statistical surveys of communications markets on a quarterly basis, compile the statistics and publish them.
With effect from April 2013 the KEV was last amended; prior to that, in March 2012, there had been a major amendment, replacing the previous KEV dating from 2004. The amendment had become necessary because in such a highly dynamic field as telecommunications a great deal has happened both on the markets and in the technology and this fact has had to be properly reflected. In addition, RTR was keen to standardise the type of questions asked in the operator surveys (BAF) and the KEV. To do this it was necessary to bring terms and definition into line with those from the operator surveys.
Data collection
In order to reduce the burden on the individual operators, RTR specified the sample in line with Art. 4 Par. 1 KEV in such a way that, on the basis of the statistical population of the most recent market analyses, a market share of at least 90% is covered for each cluster (fixed network, leased lines, mobile communica-tions and broadband). From this sample, RTR extrapolates the data for the statistical population.
statistical analyses and data
The charts in the RTR Telecom Monitor contain for the most part rounded values. The exact values can be found in tables at the end of each section. The retail revenues referred to are always net revenues. Due to occasional post-hoc data corrections, the values in the charts presented here may differ slightly from the information provided in earlier issues of the RTR Telecom Monitor. Where major deviations (> 5%) arise in individual data values, a comment to this effect is provided for the figure in question.
We sincerely hope that this publication provides you with interesting and informative reading.
Johannes Gungl
CEO Telecommunications and Postal Services
Austrian Regulatory Authority for Broadcasting and Telecommunications (RTR)
Preface
PRefaCe

RTR Telekom Monitor
6
Annual Review 2013

RTR Telekom Monitor Annual Review 2013
71 | fIxeD neTwoRK
1 Fixed network

RTR Telekom Monitor Annual Review 2013
81 | fIxeD neTwoRK
Fixed linesnUMbeR of fIxeD lInes In ConTInUoUs DeClIne
The chart above shows the total number of fixed telephone lines in households and businesses, regardless of the in frastructure on which those lines are based (e.g. copper-wire pairs, coaxial cable or optical fibre).
■■ At the end of 2013, the total number of fixed lines in Austria was 2.6 million, 2.0 million in households and about 609,000 in businesses. Compared with the end of 2012, this is a decline of about 2.3% (or some 62,600 lines).
■■ At 2.6%, the decline in households was slightly more significant than that in businesses (down 1.8%) in the course of the year.
2,12
3
2,12
5
2,12
2
2,11
4
2,10
8
2,08
5
2,07
5
2,06
8
2,05
1
2,03
7
2,03
0
2,01
5
654
649
648
645
634
626
624
620
619
613
609
609
2,500
2,250
2,000
1,750
1,500
1,250
1,000
750
500
250
0
<4>
Q12011
Q22011
Q32011
Q42011
Q12012
Q22012
Q32012
Q42012
Q12013
Q22013
Q32013
Q42013
Fixed lines / businessesFixed lines / households
Num
ber o
f lin
es (t
hous
ands
)

RTR Telekom Monitor Annual Review 2013
91 | fIxeD neTwoRK
Fixed-line penetrationfIxeD-lIne PeneTRaTIon ConTInUes To DeClIne slIGhTly
Source: RTR, Statistics Austria (number of households and businesses)
The chart shows fixed-line penetration rates among households and businesses. The higher penetration rate for businesses is due to the - in most cases - greater number of fixed lines per business and is therefore not strictly comparable with that of households.
■■ In line with the number of fixed lines, fixed-line penetration also declined. ■■ At the end of 2013, 55.2% of households in Austria had a fixed telephone line, compared with 56.7% at
the end of 2012.■■ Year on year, fixed-line penetration of businesses also declined slightly to 199.4% in Q4 2013.
58.2 58.2 58.1 57.9 57.8 57.1 56.8 56.7 56.2 55.8 55.6 55.2
214.0 212.4 212.1 211.1 207.6 205.0 204.2 203.0 202.8 200.7 199.4 199.4
250
225
200
175
150
125
100
75
50
25
0Q1
2011Q2
2011Q3
2011Q4
2011Q1
2012Q2
2012Q3
2012Q4
2012Q1
2013Q2
2013Q3
2013Q4
2013
Fixed-line penetration / householdsFixed-line penetration / businesses
Pene
tratio
n ra
te (%
)

RTR Telekom Monitor Annual Review 2013
101 | fIxeD neTwoRK
Development of fixed linesfIxeD lInes show ConTInUeD DownwaRD TRenD
A POTS („plain old telephone service“) line is a conventional telephone line as found in many households. An ISDN line provides two channels so that two calls can be made at the same time. In the case of multi-ISDN lines, which are almost exclusively used by businesses, more than two channels are available at the same time.
The chart shows the number of fixed lines in Austria, broken down by type (POTS and ISDN). Multi-ISDN lines can-not be shown in the chart because the figure is too small.
■■ At the end of 2013, 88.3% of a total of 2.6 million fixed lines were conventional POTS lines (2.3 mil-lion). In addition, there were some 296,000 ISDN lines and some 14,000 multi-ISDN lines.
■■ 23.4% of all fixed lines were voice-over-broadband lines, i.e. about 618,000 lines. For only 1.1% of the lines radio transmission or fixed wireless access (FWA) was used.
2,44
7
2,44
8
2,44
7
2,43
9
2,42
4
2,39
7
2,38
7
2,37
9
2,36
6
2,35
0
2,34
2
2,32
8
329
326
323
321
319
314
312
309
305
301
297
296
3,000
2,500
2,000
1,500
1,000
500
0Q1
2011Q2
2011Q3
2011Q4
2011Q1
2012Q2
2012Q3
2012Q4
2012Q1
2013Q2
2013Q3
2013Q4
2013
ISDN linesPOTS lines
Num
ber o
f lin
es (t
hous
ands
)

RTR Telekom Monitor Annual Review 2013
111 | fIxeD neTwoRK
Carrier pre-selection and call-by-call customersCbC anD CPs CUsToMeRs on The DeCRease
The chart shows the number of customers with lines on which carrier pre-selection (CPS) is used and the number of call-by-call (CbC) customers who used CbC at least once in each quarter (see Glossary).
■■ At the end of December 2013, some 352,000 customers used carrier pre-selection and about 85,000 customers used call-by-call. Thus, 13.3% of the fixed-network customers used carrier pre-selection, while 3.2% of the fixed-line customers used call-by-call.
■■ Year on year, the number of call-by-call customers was down by 14.6% in Q4 2013; the number of lines with carrier pre-selection decreased by 8.1%. Hence, the number of CbC and CPS customers declined more significantly than the number of fixed lines over the course of the year.
185
182
125
123
114
107
103
99 96 87 85 85500
494
487
423
411
400
389
383
373
364
358
352
600
500
400
300
200
100
0Q1
2011Q2
2011Q3
2011Q4
2011Q1
2012Q2
2012Q3
2012Q4
2012Q1
2013Q2
2013Q3
2013Q4
2013
CPS customersCbC customers
Num
ber o
f sub
scrib
ers
(thou
sand
s)
RTR Telekom Monitor Annual Review 2013
121 | fIxeD neTwoRK
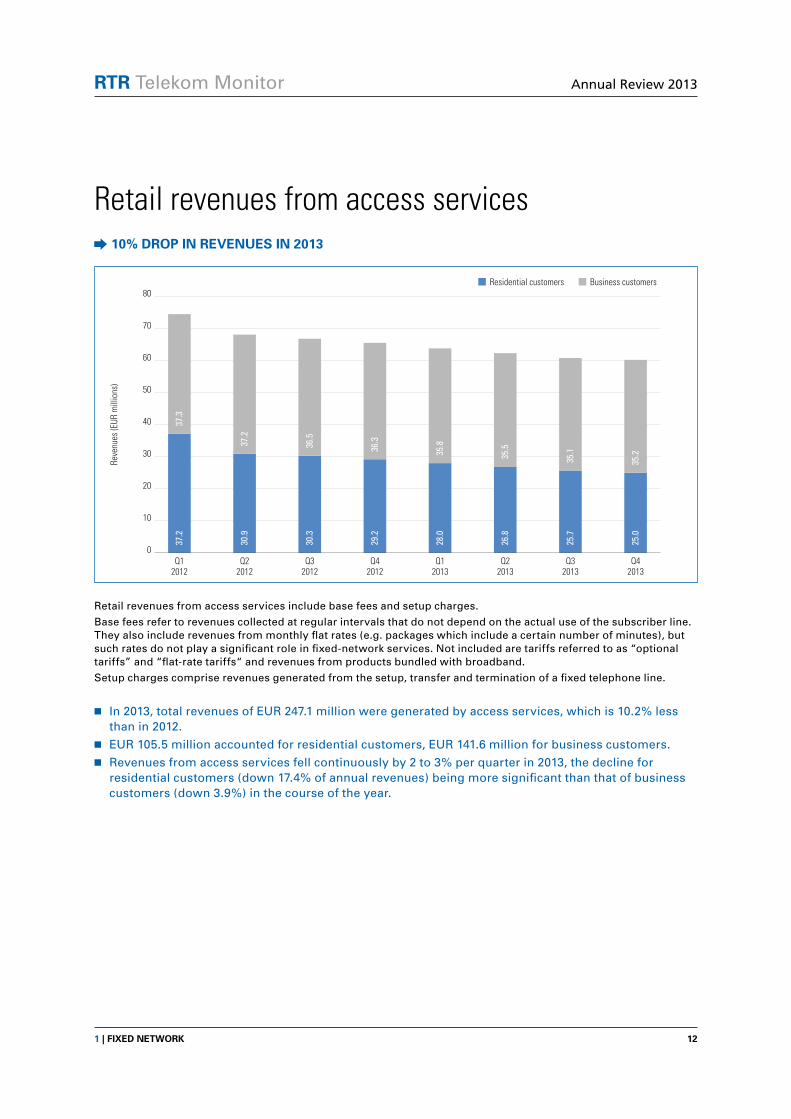
Retail revenues from access services10% DRoP In ReVenUes In 2013
Retail revenues from access services include base fees and setup charges.
Base fees refer to revenues collected at regular intervals that do not depend on the actual use of the subscriber line. They also include revenues from monthly flat rates (e.g. packages which include a certain number of minutes), but such rates do not play a significant role in fixed-network services. Not included are tariffs referred to as “optional tariffs” and “flat-rate tariffs“ and revenues from products bundled with broadband.
Setup charges comprise revenues generated from the setup, transfer and termination of a fixed telephone line.
■■ In 2013, total revenues of EUR 247.1 million were generated by access services, which is 10.2% less than in 2012.
■■ EUR 105.5 million accounted for residential customers, EUR 141.6 million for business customers. ■■ Revenues from access services fell continuously by 2 to 3% per quarter in 2013, the decline for
residential customers (down 17.4% of annual revenues) being more significant than that of business customers (down 3.9%) in the course of the year.
37.3
37.2
36.5
36.3
35.8
35.2
35.2
35.135.5
37.2
30.9
30.3
29.2
28.0
26.8
25.7
25.0
80
70
60
50
40
30
20
10
0Q1
2012Q2
2012Q3
2012Q4
2012Q1
2013Q2
2013Q4
2013Q3
2013
Business customersResidential customers
Reve
nues
(EUR
mill
ions
)

RTR Telekom Monitor Annual Review 2013
131 | fIxeD neTwoRK
Retail revenues from carrier services 1/2ConsTanT DeCRease In ReVenUes fRoM CaRRIeR seRVICes
*From Q1 2012 onwards revenues from online services are no longer included in the survey because they are negligible. Until Q4 2011 they are included in the revenues.
Retail revenues from carrier services depend on the number of call minutes used, i.e. the higher the number of out-going call minutes, the higher the bill.
The revenues shown above include the retail fees charged by operators for calls to the domestic fixed network, domestic mobile networks, international destinations and service numbers. Revenues from fixed monthly flat rates (e.g. packages including a certain number of minutes) are not included in the figures above.*
■■ Revenues from carrier services totalled EUR 258.3 million in 2013, which is 12.8% less than in the previous year and, at 23.7%, down on 2011 by almost one fourth.
■■ EUR 116.8 million accounted for residential customers (down 14.7% compared with 2012), EUR 141.5 million for business customers (down 11.2%).
■■ The share of revenues from residential customers in revenues from carrier services was 46.9% in Q4 2012, dropping to 45.3% in Q4 2013.
42.1
38.5
37.6
38.5
36.6
33.7
32.8
33.9
31.4
28.9
27.8
28.7
48.3
45.9
44.4
43.2
43.2
39.5
38.1
38.5
37.4
35.6
33.9
34.6
60
50
40
30
20
10
0Q1
2011Q2
2011Q3
2011Q4
2011Q1
2012Q2
2012Q3
2012Q4
2012Q1
2013Q2
2013Q3
2013Q4
2013
Business customersResidential customers
Reve
nues
(EUR
mill
ions
)
RTR Telekom Monitor Annual Review 2013
141 | fIxeD neTwoRK
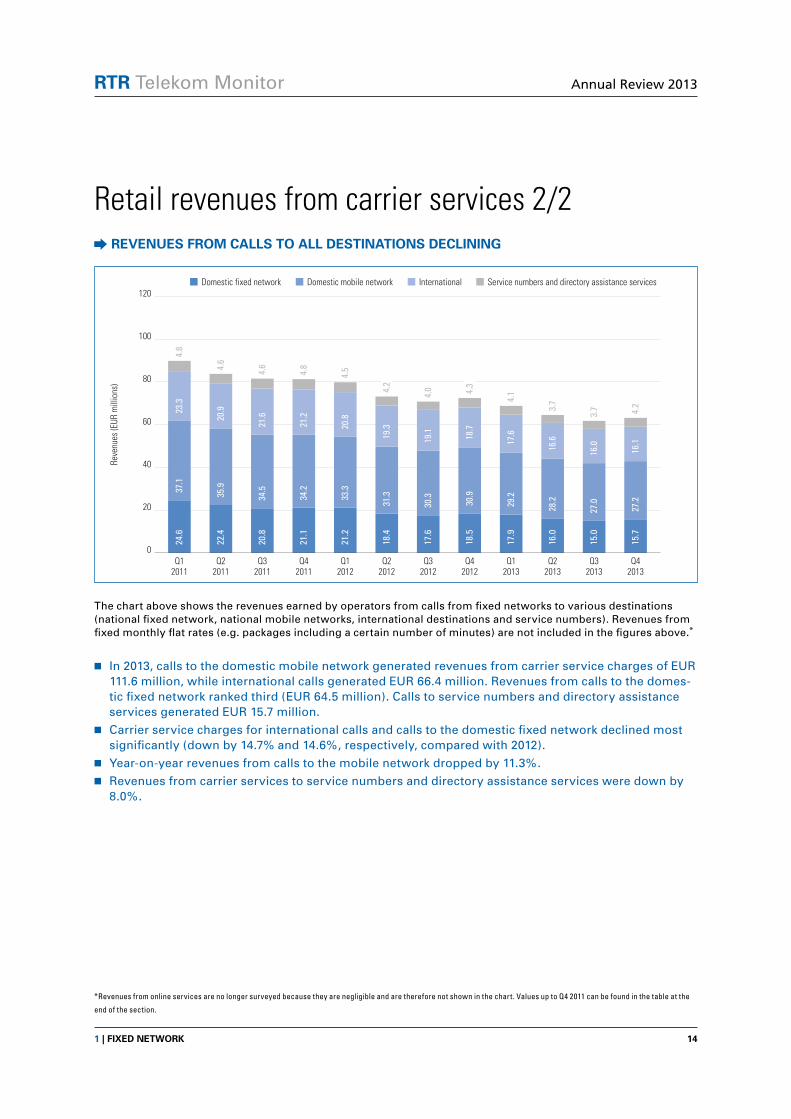
Retail revenues from carrier services 2/2ReVenUes fRoM Calls To all DesTInaTIons DeClInInG
The chart above shows the revenues earned by operators from calls from fixed networks to various destinations (national fixed network, national mobile networks, international destinations and service numbers). Revenues from fixed monthly flat rates (e.g. packages including a certain number of minutes) are not included in the figures above.*
■■ In 2013, calls to the domestic mobile network generated revenues from carrier service charges of EUR 111.6 million, while international calls generated EUR 66.4 million. Revenues from calls to the domes-tic fixed network ranked third (EUR 64.5 million). Calls to service numbers and directory assistance services generated EUR 15.7 million.
■■ Carrier service charges for international calls and calls to the domestic fixed network declined most significantly (down by 14.7% and 14.6%, respectively, compared with 2012).
■■ Year-on-year revenues from calls to the mobile network dropped by 11.3%.■■ Revenues from carrier services to service numbers and directory assistance services were down by
8.0%.
*Revenues from online services are no longer surveyed because they are negligible and are therefore not shown in the chart. Values up to Q4 2011 can be found in the table at the
end of the section.
24.6
22.4
20.8
21.1
21.2
18.4
17.6
18.5
17.9
16.0
15.0
15.7
37.1
35.9
34.5
34.2
33.3
31.3
30.3
30.9
29.2
28.2
27.0
4.6
4.6
4.8
4.5
4.2
4.0 4.3
4.1
3.7
23.3
20.9
21.6
21.2
20.8
19.3
19.1 18.7
17.6
16.6
16.0
3.7
27.2
16.1
4.2
4.8
120
100
80
60
40
20
0Q1
2011Q2
2011Q3
2011Q4
2011Q1
2012Q2
2012Q3
2012Q4
2012Q1
2013Q2
2013Q3
2013Q4
2013
Service numbers and directory assistance servicesDomestic mobile network InternationalDomestic fixed network
Reve
nues
(EUR
mill
ions
)

RTR Telekom Monitor Annual Review 2013
151 | fIxeD neTwoRK
Call minutes on the retail marketInCRease In InTeRnaTIonal MInUTes, DRoP In ToTal Call MInUTes
The figure above shows the number of real minutes (see Glossary) in the fixed network, broken down by destination.*
■■ In 2013, total call minutes in the fixed network numbered 3.868 billion, i.e. 8.7% down on 2012 and 21.7% down on 2011.
■■ Calls to the domestic fixed network accounted for the largest proportion: in the course of the year calls from the fixed network to other fixed-network customers totalled 2.315 billion minutes.
■■ Calls from the fixed network to the domestic mobile network totalled 788.6 million minutes, interna-tional calls amounted to 674.9 million minutes. Calls to service numbers and directory assistances services totalled 89.5 million minutes in 2013.
■■ An increase can be seen only in international calls: in 2013, there were 5.0% more international min-utes than in the previous year. Year on year, the minutes to all other destinations declined.
*From Q1 2012 onwards revenues from online services are no longer included in the survey and are therefore not shown in the chart. Values up to Q4 2011 can be found in the table
at the end of the section.
838.
6
755.
9
712.
5
734.
7
722.
7
642.
1
614.
1
649.
8
632.
2
576.
0
538.
1
568.
6
25.3 24
.8
24.5
21.6
21.1
37.9
38.6 36
.9
34.4
29.1
40.2
245.
5
236.
0
230.
5
233.
0
225.
2
210.
5
203.
8
211.
7
204.
3
197.
7
191.
4
198.
8
186.
3
176.
8
181.
4
170.
7
158.
5
151.
0
162.
3
160.
2
176.
4
17
8.4
22.4
195.
216
0.0
1,600
1,400
1,200
1,000
800
600
400
200
0Q1
2011Q2
2011Q3
2011Q4
2011Q1
2012Q2
2012Q3
2012Q4
2012Q1
2013Q2
2013Q3
2013Q4
2013
Service numbers and directory assistance servicesDomestic mobile network InternationalDomestic fixed network
Min
utes
(mill
ions
)

RTR Telekom Monitor Annual Review 2013
161 | fIxeD neTwoRK
Revenues per call minuteReVenUes fRoM ResIDenTIal CUsToMeRs PeR MInUTe baCK aT sTaRTInG leVel
The chart above shows the revenues per call minute for telephone calls from the fixed network to various desti-nations, broken down into residential and business customers. Revenue per call minute is calculated from retail revenues from carrier services (charts “Retail revenues from carrier services 1/1 and 1/2”), divided by the number of real minutes (chart “Call minutes on the retail market”). The data underlying this chart can be found in the table at the end of the section.
■■ Revenues per minute changed only slightly in the course of the year 2013, however, the kink in reve-nues from residential customers per minute to international destinations is remarkable. This can be explained by the fact that due to a special offer one operator recorded substantially more international call minutes than usual, with revenues remaining constant.
■■ Calls of business customers to the domestic fixed network continued to generate the lowest revenues per minute. Slightly higher revenues per minute came from calls of residential customers to the fixed network. The highest revenues per minute were generated from calls of residential customers to the mobile network.
25
20
15
10
5
0Q1
2011Q2
2011Q3
2011Q4
2011Q1
2012Q2
2012Q3
2012Q4
2012Q1
2013Q2
2013Q3
2013Q4
2013
International (business customers)International (residential customers)
Domestic mobile network (business customers)Domestic mobile network (residential customers)
Domestic fixed network (business customers)Domestic fixed network (residential customers)
Reve
nues
per
cal
l min
ute
(EUR
cen
ts)

RTR Telekom Monitor Annual Review 2013
171 | fIxeD neTwoRK
The average fixed-network subscriberReVenUes fRoM CaRRIeR seRVICes anD MInUTes PeR CUsToMeR Down on 2012
The chart shows the average number of active call minutes (real minutes) on the fixed network for business and resi-dential customers per month in the respective quarter as well as the average revenues from carrier service charges generated per month in the quarter. The monthly values are calculated from a third of revenues from carrier service charges and a third of the call minutes, divided in each case by the total number of fixed-network lines in the respec-tive quarter. Since the KEV amendment revenues from access services have no longer been exactly attributable to fixed network voice telephony (bundled products with broadband), for this reason they are not shown in the chart.
■■ In Q4 2013, average revenues from carrier service charges in the fixed network amounted to EUR 4.7 per month for residential customers (down 13.4% compared with Q4 2012) and EUR 18.9 per month for business customers (down 8.4% compared with Q4 2012). In total, all quarterly values of 2013 were below those of 2012.
■■ A similar trend is seen in the number of real minutes. In Q4 2013, business customers, on average, each made 284.0 minutes of calls per month (down 7.8% compared with Q4 2012), residential custom-ers each made 69.0 minutes of calls per month (down 10.1% compared with the end of 2012).
5.5
5.1
4.7
4.6
4.7
20.7
20.1
19.3
18.6
18.9
76.7
73.7
71.2
68.0
69.0
307.
8
299.
1
285.
8
276.
3
284.
0
25
20
15
10
5
0Q4
2012Q1
2013Q2
2013Q3
2013
400
300
200
100
0Q4
2012Q1
2013Q2
2013Q3
2013Q4
2013Q4
2013
Business customersResidential customers Business customersResidential customers
Reve
nues
(EUR
)
Call
min
utes

RTR Telekom Monitor Annual Review 2013
181 | fIxeD neTwoRK
Wholesale revenuesshaRP DeClIne In wholesale ReVenUes
The fixed wholesale market for voice telephony includes three sub-services: origination, termination and transit services (see Glossary).
■■ In 2013, the fixed wholesale market was characterised by a downward trend in revenues. Total reve-nues for 2013 were EUR 53.3 million. In Q4 2013, total wholesale revenues reached a new low of EUR 11.1 million. This sharp decline was due to Decision M 1.8/12 of 30 September 2012, where termina-tion charges were considerably lowered with effect from 1 November 2013. Wholesale revenues can therefore be expected to decline further.
■■ In Q4 2013, termination revenues, at 60.9%, accounted for the largest proportion of total wholesale revenues. The substantial decline in termination charges of 31.6% to EUR 6.8 million was caused by the above-mentioned reduction despite an increase in termination minutes (see next page).
■■ The unusual rise in origination revenues can be explained by Decision M 1.9/12 of 30 September 2013 with effect from 1 November 2013, by which A1 Telekom Austria AG was allowed to raise fixed net-work origination charges. Even though origination revenues increased by one third to EUR 2.6 million in Q4 2013, they could not offset the sharp decline in termination revenues because of their smaller share (23.7%) in wholesale revenues.
■■ At EUR 1.7 million, transit revenues remained almost unchanged (up 0.9%).
2.9
2.6
2.4
2.5
2.2
2.0
1.9
2.6
13.0
11.6
11.0
12.3
10.8
10.2 6.
8
9.9
1.6
1.6
1.6
1.6
1.7
1.7
1.7
1.7
20
18
16
14
12
10
8
6
4
2
0Q1
2012Q2
2012Q3
2012Q4
2012Q1
2013Q2
2013Q4
2013Q3
2013
TransitOrigination Termination
Reve
nues
(EUR
mill
ions
)

RTR Telekom Monitor Annual Review 2013
191 | fIxeD neTwoRK
Wholesale market in minutesDeClIne In ToTal MInUTes yeaR on yeaR
In line with wholesale revenues, the wholesale market includes origination, termination and transit minutes (see Glossary).
■■ Wholesale minutes totalled 10.043 billion in 2013, which is 6.4% less than in the previous year. At 41.1%, termination minutes accounted for the largest proportion of all wholesale minutes.
■■ After a drop in Q2 and Q3 2013, total wholesale minutes increased again slightly (up 2.7% compared with the previous quarter) to 2.5 billion minutes.
■■ If Q4 2013 is compared with Q4 2012, a marked decline can bee seen mainly in origination minutes (down 15.4%), which also corresponds to the decrease in CbC and CPS customers. Termination min-utes dropped by 9.4%, whereas transit minutes increased by 3.5% against the last quarter of 2012.
886
807
832
879
815
757
720
744
1,12
6
1,22
6
1,07
4
1,14
5
1,09
6
1,02
2
1,03
7
971
672
686
710 68
8
705
727
712
736
3,000
2,500
2,000
1,500
1,000
500
0Q1
2012Q2
2012Q3
2012Q4
2012Q1
2013Q2
2013Q4
2013Q3
2013
TransitOrigination Termination
Min
utes
(mill
ions
)

RTR Telekom Monitor Annual Review 2013
201 | fIxeD neTwoRK
Total fixed network revenuesToTal ReVenUes foR 2013 aGaIn fallInG
Total fixed network revenue is calculated from the total of all base fees and setup charges including other charges (revenues from optional tariffs, calling cards, charges stipulated by the Telecommunications Fee Subsidies Act and other charges such as invoicing, additional services etc.), connection charges (including public pay phones) and revenues from origination, termination and transit charges. Not included are revenues from fixed network voice telephony that were earned from products bundled with broadband.
■■ Total fixed network revenues in 2013 were some EUR 613.0 million, down by 12.1% from 2012.■■ Compared with Q4 2012, fixed network revenues fell to EUR 147.8 million in Q4 2013, which means a
fall of 12.6%. ■■ In Q4 2013, total fixed network revenues were made up in almost equal proportions of connection
charges (47.0%) and base fees and setup charges (45.5%).■■ Wholesale revenues accounted for 7.5% of total fixed network revenues (EUR 11.1 million) in Q4 2013.
83.3
76.1
74.6
73.2
71.2
69.6
67.9
67.2
80.487
.6
77.8
79.5
75.6
70.9
69.5
67.9
17.6
15.8
15.1
16.4
14.7
14.0
11.1
13.5
220
200
180
160
140
120
100
80
60
40
20
0Q1
2012Q2
2012Q3
2012Q4
2012Q1
2013Q2
2013Q4
2013Q3
2013
Wholesale revenueBase fees and setup charges Connection charges (incl. public pay phones)
Reve
nues
(EUR
mill
ions
)

RTR Telekom Monitor Annual Review 2013
211 | fIxeD neTwoRK
Geographical numbers in useslIGhT yeaR-on-yeaR DeClIne
Geographical numbers are domestic telephone numbers prefixed by a local area code (e.g. 01 for Vienna).
As more than one number may be assigned to a single line, the number of geographical numbers is not identical to the number of fixed subscriber lines.
■■ At the end of 2013 the total of geographical call numbers used was 2.98 million. This is a decline of 2.9% compared with the end of 2012.
3,03
7
3,03
6
3,01
7
3,04
9
3,04
8
3,02
2
3,05
6
3,07
1
3,03
8
3,02
1
3,00
6
2,98
3
3,500
3,000
2,500
2,000
1,500
1,000
500
0Q1
2011Q2
2011Q3
2011Q4
2011Q1
2012Q2
2012Q3
2012Q4
2012Q1
2013Q2
2013Q3
2013Q4
2013
Geographical numbers in use
Num
bers
in u
se (t
hous
ands
)
RTR Telekom Monitor Annual Review 2013
221 | fIxeD neTwoRK
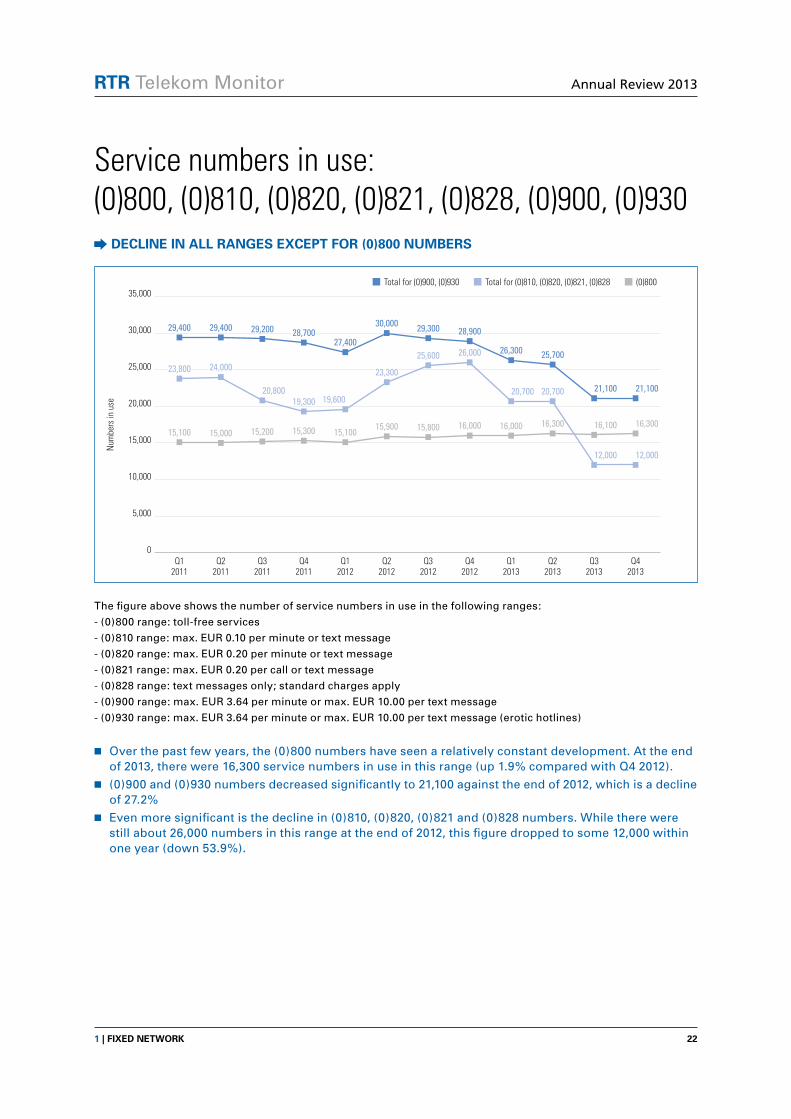
Service numbers in use: (0)800, (0)810, (0)820, (0)821, (0)828, (0)900, (0)930
DeClIne In all RanGes exCePT foR (0)800 nUMbeRs
The figure above shows the number of service numbers in use in the following ranges:
- (0)800 range: toll-free services
- (0)810 range: max. EUR 0.10 per minute or text message
- (0)820 range: max. EUR 0.20 per minute or text message
- (0)821 range: max. EUR 0.20 per call or text message
- (0)828 range: text messages only; standard charges apply
- (0)900 range: max. EUR 3.64 per minute or max. EUR 10.00 per text message
- (0)930 range: max. EUR 3.64 per minute or max. EUR 10.00 per text message (erotic hotlines)
■■ Over the past few years, the (0)800 numbers have seen a relatively constant development. At the end of 2013, there were 16,300 service numbers in use in this range (up 1.9% compared with Q4 2012).
■■ (0)900 and (0)930 numbers decreased significantly to 21,100 against the end of 2012, which is a decline of 27.2%
■■ Even more significant is the decline in (0)810, (0)820, (0)821 and (0)828 numbers. While there were still about 26,000 numbers in this range at the end of 2012, this figure dropped to some 12,000 within one year (down 53.9%).
23,800 24,000
20,80019,300 19,600
23,300
25,600 26,000
20,700 20,700
12,000 12,000
15,100 15,000 15,200 15,300 15,10015,900 15,800 16,000 16,000 16,300 16,100 16,300
29,400 29,400 29,200 28,70027,400
30,000 29,300 28,900
26,300 25,700
21,100 21,100
35,000
30,000
25,000
20,000
15,000
10,000
5,000
0Q1
2011Q2
2011Q3
2011Q4
2011Q1
2012Q2
2012Q3
2012Q4
2012Q1
2013Q2
2013Q3
2013Q4
2013
(0)800Total for (0)810, (0)820, (0)821, (0)828Total for (0)900, (0)930
Num
bers
in u
se

RTR Telekom Monitor Annual Review 2013
231 | fIxeD neTwoRK
Ported geographical numbers and service numbersConTInUoUs RIse In PoRTeD GeoGRaPhICal nUMbeRs
Number porting allows customers to retain their telephone numbers when they switch service providers. This means that customers can keep their original geographical telephone numbers (within the same local area code) when they switch to a new provider.
The figure above shows the total number of geographical telephone numbers and service numbers ported (which is not equal to the total number of porting procedures, as a single number may be ported several times).
■■ The number of ported geographical telephone numbers rose by 5.7% since the end of 2012 to 311,500 at the end of 2013. This corresponds to 10.4% of all geographical numbers.
■■ In contrast, the number of ported service numbers fell to some 11,600 (down 10.7%) over the same period.
237,
400
238,
800
245,
700
246,
300
250,
900
249,
900
256,
800
294,
700
295,
700
304,
000
310,
600
311,
500
16,6
00
15,0
00
14,3
00
13,6
00
15,3
00
14,1
00
13,9
00
13,0
00
11,8
00
12,3
00
11,6
00
11,6
00
350,000
300,000
250,000
200,000
150,000
100,000
50,000
0Q1
2011Q2
2011Q3
2011Q4
2011Q1
2012Q2
2012Q3
2012Q4
2012Q1
2013Q2
2013Q3
2013Q4
2013
Geographical numbers ported Service numbers ported
Num
bers
por
ted

RTR Telekom Monitor Annual Review 2013
241 | fIxeD neTwoRK
Data tables
Q1
Q2
Q3
Q4
Q1
Q2
Q3
Q4
Q1
Q2
Q3
Q4
2011
2012
2013
2,122,930 653,734
2,125,334 648,962
2,121,860 647,826
2,114,406 644,708
2,108,193 634,072
2,085,057 626,161
2,074,915 623,860
2,068,175 620,165
2,051,193 619,374
2,037,457 613,169
2,030,149 609,047
2,015,177 608,984
Fixed lines / households Fixed lines / businesses
Number of lines
Fixed lines (Page 8)
Q1
Q2
Q3
Q4
Q1
Q2
Q3
Q4
Q1
Q2
Q3
Q4
2011
2012
2013
58.2% 214.0%
58.2% 212.4%
58.1% 212.1%
57.9% 211.1%
57.8% 207.6%
57.1% 205.0%
56.8% 204.2%
56.7% 203.0%
56.2% 202.8%
55.8% 200.7%
55.6% 199.4%
55.2% 199.4%
Fixed-line penetration / households Fixed-line penetration / businesses
in %
Fixed-line Penetration (Page 9)
Q1
Q2
Q3
Q4
Q1
Q2
Q3
Q4
Q1
Q2
Q3
Q4
2011
2012
2013
EndkundEnbrEitbandanschlüssE nach infrastuktur - GEschäftskundEn
2,447,333 329,330 10,204
2,448,479 325,817 10,203
2,446,550 323,136 10,224
2,438,500 320,613 10,261
2,423,628 318,637 11,875 573,868 26,191
2,397,015 314,203 11,843 584,546 26,790
2,386,842 311,934 12,092 593,224 27,437
2,379,281 309,059 12,237 605,099 27,985
2,365,655 304,912 12,230 612,542 28,452
2,349,915 300,711 12,224 619,293 28,667
2,341,821 297,375 12,299 627,340 28,891
2,328,338 295,822 13,804 617,575 29,266
POTS ISDN Multi-ISDN VoB Wireless
Number of lines
develoPment oF Fixed lines (Page 10)

RTR Telekom Monitor Annual Review 2013
251 | fIxeD neTwoRK
Q1
Q2
Q3
Q4
Q1
Q2
Q3
Q4
Q1
Q2
Q3
Q4
2011
2012
2013
184,785 500,435
181,653 494,475
125,233 487,370
123,082 422,913
113,531 411,346
106,640 399,908
103,044 389,495
99,417 383,023
95,664 372,749
86,702 364,403
84,582 357,506
84,884 351,921
CbC customers CPS customers
Number of customers
Carrier Pre-seleCtion and Call-by-Call Customers (Page 11)
Q1
Q2
Q3
Q4
Q1
Q2
Q3
Q4
Q1
Q2
Q3
Q4
Q1
Q2
Q3
Q4
2012
2013
2013
2013
37,203,503 37,349,043
30,938,310 37,184,153
30,308,089 36,467,970
29,249,487 36,306,140
27,991,237 35,801,827
26,824,815 35,480,002
25,727,224 35,075,707
24,975,139 35,177,753
Residential customers Business customers
EUR
retail revenues From aCCess serviCes (Page 12)
Q1
Q2
Q3
Q4
Q1
Q2
Q3
Q4
Q1
Q2
Q3
Q4
2011
2012
2013
42,073,786 48,301,904
38,456,589 45,869,329
37,580,959 44,398,313
38,521,721 43,219,087
36,584,136 43,201,386
33,727,694 39,454,362
32,772,377 38,125,583
33,944,355 38,469,540
31,399,059 37,379,784
28,934,293 35,569,607
27,841,400 33,911,930
28,646,740 34,592,695
Residential customers Business customers
EUR
retail revenues From Carrier serviCes 1/2 (Page 13)

RTR Telekom Monitor Annual Review 2013
261 | fIxeD neTwoRK
Q1
Q2
Q3
Q4
Q1
Q2
Q3
Q4
Q1
Q2
Q3
Q4
2011
2012
2013
* Data collection for online services was discontinued in Q1 2012.
EndkundEnbrEitbandanschlüssE nach infrastuktur - GEschäftskundEn
24,639,100 37,058,865 23,282,662 4,801,359 593,703
22,383,250 35,894,814 20,902,942 4,616,362 528,550
20,839,127 34,463,665 21,563,576 4,611,219 501,685
21,108,182 34,176,725 21,226,518 4,770,243 459,140
21,149,980 33,298,529 20,835,524 4,501,490 *
18,357,378 31,285,129 19,295,465 4,244,084 *
17,575,584 30,253,190 19,058,148 4,011,038 *
18,463,474 30,909,390 18,728,302 4,312,730 *
17,856,886 29,178,704 17,643,270 4,099,983 *
15,972,375 28,221,965 16,641,745 3,667,815 *
15,043,013 26,950,314 16,022,136 3,737,867 *
15,673,907 27,241,695 16,118,900 4,204,934 *
EUR
retail revenues From Carrier serviCes 2/2 (Page 14)
Domestic fixed network
Domestic mobile network International
Service numbers and directory
assistance servicesOnline services
Q1
Q2
Q3
Q4
Q1
Q2
Q3
Q4
Q1
Q2
Q3
Q4
2011
2012
2013
EndkundEnbrEitbandanschlüssE nach infrastuktur - GEschäftskundEn
838,639,288 245,512,387 198,782,414 40,188,294 18,915,069
755,918,422 236,025,717 186,255,968 37,926,502 15,104,526
712,520,921 230,529,494 176,768,125 38,557,478 13,020,055
734,658,271 232,954,768 181,362,903 36,881,102 11,224,498
722,744,948 225,153,860 170,739,356 34,387,931 *
642,076,547 210,516,466 158,518,833 29,089,673 *
614,099,343 203,786,530 151,002,436 25,260,776 *
649,815,794 211,656,246 162,310,224 24,763,122 *
632,223,826 204,322,299 160,164,692 24,479,136 *
575,980,175 197,701,995 176,390,118 21,547,434 *
538,088,534 191,404,423 178,401,260 21,116,417 *
568,570,960 195,173,175 159,958,012 22,357,901 *
Minutes
Call minutes on the retail market (Page 15)
*Data collection for online services was discontinued in Q1 2012.
Domestic fixed network
Domestic mobile network International
Service numbers and directory
assistance servicesOnline services

RTR Telekom Monitor Annual Review 2013
271 | fIxeD neTwoRK
Q1
Q2
Q3
Q4
Q1
Q2
Q3
Q4
Q1
Q2
Q3
Q4
2011
2012
2013
3.06 18.74 12.10 2.82 13.12 11.37
3.00 19.08 11.10 2.93 13.12 11.33
2.97 18.63 13.08 2.89 12.97 11.45
2.90 18.26 12.04 2.85 12.69 11.36
3.03 18.76 12.81 2.83 12.73 11.65
2.92 19.04 12.71 2.81 12.63 11.68
2.97 19.05 13.13 2.77 12.58 12.16
2.94 18.79 12.11 2.75 12.33 10.99
2.95 18.61 11.30 2.71 12.08 10.74
2.85 18.72 8.33 2.71 12.06 10.83
2.93 18.81 7.73 2.69 11.75 10.69
2.86 18.52 9.75 2.68 11.64 10.44
revenues Per Call minute (Page 16)
EUR cents
Domestic fixed network / residential customers
Domestic mobile network / residential customers
International destinations /
residential customers
Domestic fixed network / business
customers
Domestic mobile network / business
customers
International destinations /
business customers
Q1
Q2
Q3
Q4
Q1
Q2
Q3
Q4
Q1
Q2
Q3
Q4
Q1
Q2
Q3
Q4
2012
2013
2013
2013
2,899,434 13,016,183 1,644,444
2,614,763 11,598,870 1,583,710
2,421,544 11,038,184 1,598,952
2,489,294 12,280,073 1,645,385
2,160,969 10,831,004 1,737,653
2,031,861 10,208,449 1,721,776
1,919,133 9,893,241 1,683,684
2,635,735 6,763,560 1,699,304
Wholesale revenues (Page 18)
Origination Termination Transit
EUR
Q1
Q2
Q3
Q4
Q1
Q2
Q3
Q4
Q1
Q2
Q3
Q4
Q1
Q2
Q3
Q4
2012
2013
2013
2013
885,692,507 1,226,058,214 672,175,766
806,961,841 1,125,662,028 685,781,022
832,139,219 1,074,118,565 709,712,872
878,892,059 1,145,086,868 688,330,138
814,847,707 1,096,471,412 705,273,673
757,273,908 1,021,745,115 727,228,003
720,182,209 970,651,891 735,807,223
743,517,192 1,037,494,035 712,272,641
Wholesale market in minutes (Page 19)
Origination Termination Transit
Minutes

RTR Telekom Monitor Annual Review 2013
281 | fIxeD neTwoRK
Q1
Q2
Q3
Q4
Q1
Q2
Q3
Q4
Q1
Q2
Q3
Q4
2011
2012
2013
EndkundEnbrEitbandanschlüssE nach infrastuktur - GEschäftskundEn
3,037,378 237,438 16,623
3,035,921 238,810 14,995
3,017,262 245,674 14,283
3,049,404 246,336 13,590
3,047,746 250,909 15,283
3,022,379 249,885 14,072
3,055,918 256,791 13,868
3,071,401 294,705 12,987
3,037,523 295,652 11,752
3,020,653 303,964 12,292
3,006,438 310,636 11,624
2,983,373 311,474 11,603
geograPhiCal number in use and Fixed-line Porting (Pages 21/23)
Geographical numbers in use
Geographical numbers ported
Service numbers ported
Number of telephone numbers
Q1
Q2
Q3
Q4
Q1
Q2
Q3
Q4
Q1
Q2
Q3
Q4
2011
2012
2013
50,385 2,316 15,094 23,825 29,356
52,312 2,316 15,042 24,026 29,374
52,816 2,330 15,208 20,799 29,237
58,513 1,911 15,311 19,255 28,688
64,687 1,917 15,090 19,561 27,422
66,073 1,906 15,939 23,267 30,025
68,037 1,901 15,846 25,635 29,253
68,079 1,900 15,972 25,959 28,934
66,657 1,902 15,969 20,706 26,292
68,451 1,890 16,288 20,651 25,667
71,126 1,078 16,121 12,023 21,079
71,507 551 16,276 11,963 21,064
Numbers in use
serviCe numbers in use – (0)800, (0)810, (0)820, (0)821, (0)900, (0)930 (Page 22)
(0)720 (0)780 (0)800 (0)810. (0)820. (0)821. (0)828 (0)900. (0)930
Q1
Q2
Q3
Q4
Q1
Q2
Q3
Q4
Q1
Q2
Q3
Q4
Q1
Q2
Q3
Q4
2013
2013
2012
2013
83,260,729 87,627,499 17,560,061
76,078,454 80,374,386 15,797,343
74,574,797 77,847,564 15,058,679
73,211,646 79,510,928 16,414,752
71,243,067 75,552,640 14,729,626
69,580,828 70,886,843 13,962,086
67,903,386 67,858,423 13,496,058
67,177,261 69,483,531 11,098,598
total Fixed netWork revenues (Page 20)
Base fees and setup charges Connection charges (incl. public pay phones) Wholesale revenue
EUR

RTR Telekom Monitor Annual Review 2013
292 | leaseD lInes
2 Leased lines

RTR Telekom Monitor Annual Review 2013
302 | leaseD lInes
Number of retail leased lines in Austria nUMbeR of ReTaIl leaseD lInes In sTeaDy DeClIne
The chart above shows the number of retail leased lines (see Glossary). Until Q4 2011 these were broken down into lines with a capacity of 2 Mbit/s or less (<= 2 Mbit/s) and lines with a capacity exceeding 2 Mbit/s (> 2 Mbit/s); from Q1 2012 the categories used were lines with a capacity of less than 2 Mbit/s (< 2 Mbit/s), 2 Mbit/s (= 2 Mbit/s) and exceeding 2 Mbit/s (> 2 Mbit/s). In addition, the table at the end of the section provides a differentiation between the following categories: greater than 2 Mbit/s to 155 Mbit/s (>2 Mbit/s to 155 Mbit/s) and greater than 155 Mbit/s (> 155 Mbit/s).
■■ At the end of 2013, a total of about 20,400 retail leased lines was reported (13.1% down compared with the end of 2012). The decline in retail leased lines extends to all bandwidth categories.
■■ Bandwidths with a capacity of 2 Mbit/s receded most. They were down by 34.8% as against Q4 2012. 13.4% of all leased lines fall into this category.
■■ About two thirds (68.5%) of retail leased lines, i.e. close to 14,000, were accounted for by bandwidths with a capacity of less than 2 Mbit/s, which is 4.9% down compared with the end of 2012.
■■ High bandwidths (> 2 Mbit/s) also declined (down 19.6%); an increase against the reference period can be seen only in the sub-category of bandwidths with a capacity greater than 155 Mbit/s. However, with 324 lines, this category accounts only for 1.6% of the total retail leased lines market and is there-fore almost negligible.
22,1
20
21,6
29
20,6
65
20,3
16
15,5
99
15,1
27
14,9
02
14,7
10
14,6
29
14,2
26
14,1
70
13,9
85
2,44
3
2,30
1
2,25
2
2,28
8
2,96
7
3,02
7 4,46
6
4,59
7
3,56
1
3,57
5
3,72
1
3,69
7
4,23
4
4,09
3
4,21
4
4,18
4
3,79
7
3,59
0
3,33
6
2,72
9
<4>
35,000
30,000
25,000
20,000
15,000
10,000
5,000
0Q1
2011Q2
2011Q3
2011Q4
2011Q1
2012Q2
2012Q3
2012Q4
2012Q1
2013Q2
2013Q3
2013Q4
2013
Num
ber o
f ret
ail l
ease
d lin
es
<= 2 Mbit/s > 2 Mbit/s < 2 Mbit/s = 2 Mbit/s > 2 Mbit/s

RTR Telekom Monitor Annual Review 2013
312 | leaseD lInes
Revenues from retail leased lines in AustriaReVenUes aRe sTeaDIly DeCReasInG
The chart shows the revenues from retail leased lines in Austria (see Glossary). Until Q4 2011 these were broken down into lines with a capacity of 2 Mbit/s or less (<= 2 Mbit/s) and lines with a capacity exceeding 2 Mbit/s (> 2 Mbit/s); from Q1 2012 the categories used were lines with a capacity of less than 2 Mbit/s (< 2 Mbit/s), 2 Mbit/s (= 2 Mbit/s) and exceeding 2 Mbit/s (> 2 Mbit/s). In addition, the table at the end of the section provides a differentiation between the following categories: greater than 2 Mbit/s to 155 Mbit/s (>2 Mbit/s to 155 Mbit/s) and greater than 155 Mbit/s (> 155 Mbit/s).
Changes in revenues are, of course, partly due to the lengths of leased lines, which are not, however, surveyed under the Communications Survey Ordinance (KEV) and therefore are not shown separately in the chart.
■■ Retail leased lines generated total revenues of EUR 53.1 million in 2013, which is a decline of 10% against 2012. Of the annual revenues, close to EUR 12.8 million were earned in Q4 2013, which means a drop of 13.3% against the reference period 2012.
■■ In 2013, revenues from bandwidths of less than 2 Mbit/s remained practically unchanged, declining only by 1.0% on Q4 2012, and were EUR 2.3 million in Q4 2013. This corresponds to 17.7% of total revenues from retail leased lines.
■■ More pronounced was the decline in bandwidths equal to 2 Mbit/s, where revenues slipped by 22.3% from Q4 2012 to Q4 2013, amounting to some EUR 3.7 million.
■■ High bandwidths, too, experienced a drop in revenue. At EUR 6.9 million, revenues were lower by 11.5% from October to December 2013 than in the reference period 2012. Even though high band-widths (> 155 Mbit/s) generated higher revenues by about 20% than at the end of the previous year, the share (7.1%) of these high bandwidths in total revenues is (still) relatively low.
7,84
6
7,71
0
7,59
9
7,40
9
6,84
1
6,74
9
7,62
8
7,74
0
6,78
5
6,99
0
7,08
4
6,84
7
5,09
4
4,84
3
4,85
6
4,70
7
4,49
0
4,17
2
4,08
9
3,66
0
5,26
9
5,15
7
5,05
9
5,93
6
2,87
0
2,82
1
2,52
5
2,28
7
2,30
6
2,23
5
2,13
8
2,26
3
16,000
14,000
12,000
10,000
8,000
6,000
4,000
2,000
0Q1
2011Q2
2011Q3
2011Q4
2011Q1
2012Q2
2012Q3
2012Q4
2012Q1
2013Q2
2013Q3
2013Q4
2013
Reve
nues
(EUR
thou
sand
s)
<= 2 Mbit/s > 2 Mbit/s < 2 Mbit/s = 2 Mbit/s > 2 Mbit/s
RTR Telekom Monitor Annual Review 2013
322 | leaseD lInes
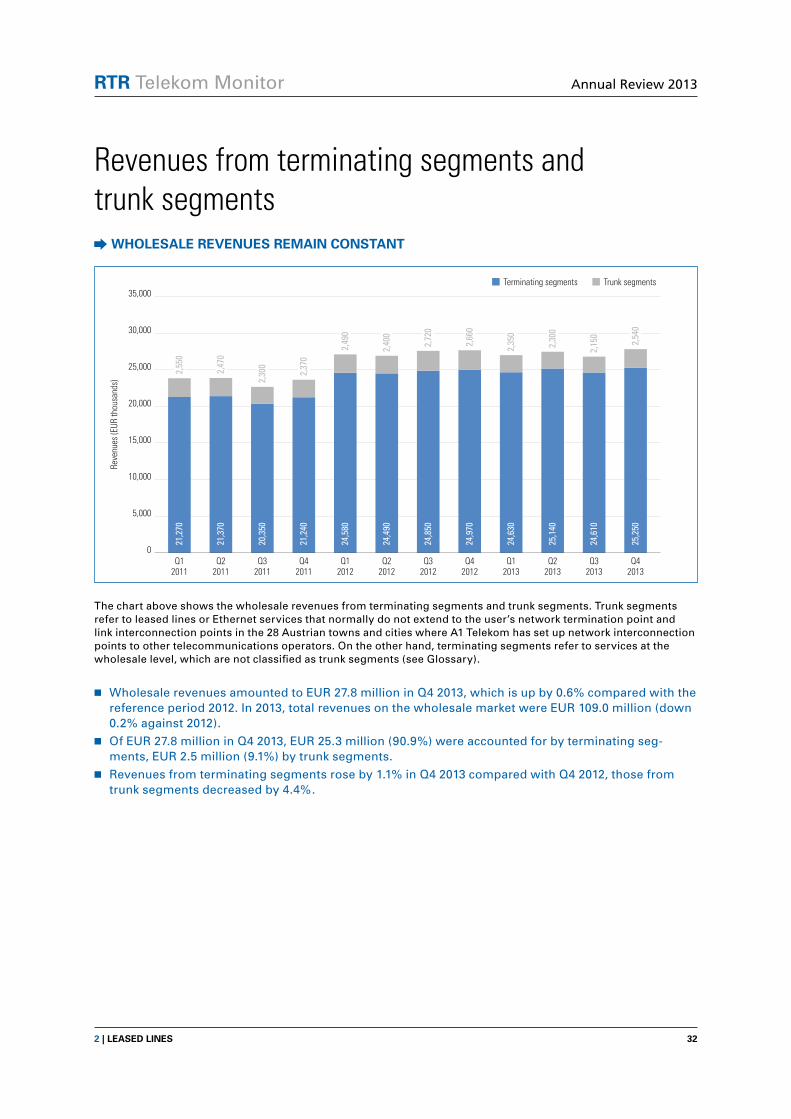
Revenues from terminating segments and trunk segments
wholesale ReVenUes ReMaIn ConsTanT
The chart above shows the wholesale revenues from terminating segments and trunk segments. Trunk segments refer to leased lines or Ethernet services that normally do not extend to the user’s network termination point and link interconnection points in the 28 Austrian towns and cities where A1 Telekom has set up network interconnection points to other telecommunications operators. On the other hand, terminating segments refer to services at the wholesale level, which are not classified as trunk segments (see Glossary).
■■ Wholesale revenues amounted to EUR 27.8 million in Q4 2013, which is up by 0.6% compared with the reference period 2012. In 2013, total revenues on the wholesale market were EUR 109.0 million (down 0.2% against 2012).
■■ Of EUR 27.8 million in Q4 2013, EUR 25.3 million (90.9%) were accounted for by terminating seg-ments, EUR 2.5 million (9.1%) by trunk segments.
■■ Revenues from terminating segments rose by 1.1% in Q4 2013 compared with Q4 2012, those from trunk segments decreased by 4.4%.
21,2
70
21,3
70
20,3
50
21,2
40
24,5
80
24,4
90
24,8
50
24,9
70
24,6
30
25,1
40
24,6
10
25,2
50
2,55
0
2,47
0
2,30
0
2,37
0
2,49
0
2,40
0
2,72
0
2,66
0
2,35
0
2,30
0
2,15
0
2,54
0
35,000
30,000
25,000
20,000
15,000
10,000
5,000
0Q1
2011Q2
2011Q3
2011Q4
2011Q1
2012Q2
2012Q3
2012Q4
2012Q1
2013Q2
2013Q3
2013Q4
2013
Reve
nues
(EUR
thou
sand
s)
Trunk segmentsTerminating segments

RTR Telekom Monitor Annual Review 2013
332 | leaseD lInes
Number of terminating segments of leased lines in Austria
shIfTs TowaRDs hIGheR banDwIDThs
The chart above shows the number of terminating segments of leased lines and Ethernet services broken down into capacities of <= 2 Mbit/s, > 2 Mbit/s to 155 Mbit/s and > 155 Mbit/s. In addition, a breakdown into capacities of < 2 Mbit/s and = 2 Mbit/s as well as > 155 Mbit/s to 1 Gbit/s and > 1 Gbit/s is given in the table at the end of the section.
■■ At the end of 2013, the number of terminating segments was some 20,900, i.e. 3.8% less than at the end of 2012.
■■ In terms of bandwidths, partly significant shifts occurred. Terminating segments with low bandwidths (<= 2 Mbit/s) dropped by 16.4% to 11,910 in 2013. Nevertheless, these low bandwidths still accounted for 57.1% of all terminating segments.
■■ In contrast, bandwidths from > 2 Mbit/s to 155 Mbit/s increased in the course of the year by 19.2% to 8,270, which corresponds to 39.6% of all terminating segments.
■■ An even stronger increase (up 32.7%) can be seen in terminating segments with bandwidths greater than 155 Mbit/s; however, they amounted to only 3.3% of all terminating segments of leased lines.
16,0
80
15,7
90
14,8
90
14,2
40
12,9
90
12,5
60
12,0
10
11,9
10
6,23
0
6,46
0
6,52
0
6,94
0
7,27
0
7,57
0
8,27
0
7,81
0
440
460
480
520
600
630
690
670
25,000
20,000
15,000
10,000
5,000
0Q1
2012Q2
2012Q3
2012Q4
2012Q1
2013Q2
2013Q4
2013Q3
2013
Num
ber o
f ter
min
atin
g se
gmen
ts
<= 2 Mbit/s > 2 Mbit/s to 155 Mbit/s > 155 Mbit/s

RTR Telekom Monitor Annual Review 2013
342 | leaseD lInes
Data tablesQ1
Q2
Q3
Q4
Q1
Q2
Q3
Q4
Q1
Q2
Q3
Q4
2011
2012
2013
22,120 2,443
21,629 2,301
20,665 2,252
20,316 2,288
15,599 4,234 2,770 198
15,127 4,093 2,820 207
14,902 4,214 4,179 286
14,710 4,184 4,296 301
14,629 3,797 3,261 300
14,226 3,590 3,278 298
14,170 3,336 3,387 334
13,985 2,729 3,373 324
number oF retail leased lines in austria (Page 30)
<= 2 Mbit/s > 2 Mbit/s < 2 Mbit/s = 2 Mbit/s > 2 Mbit/s to 155 Mbit/s > 155 Mbit/s
Number of lines
Q1
Q2
Q3
Q4
Q1
Q2
Q3
Q4
Q1
Q2
Q3
Q4
2011
2012
2013
7,845,978 5,268,680
7,710,028 5,156,879
7,599,000 5,059,072
7,409,477 5,936,118
2,869,696 5,093,549 6,199,782 641,187
2,820,639 4,843,302 6,108,664 639,948
2,525,143 4,855,924 6,874,813 752,933
2,286,557 4,707,091 6,983,735 755,888
2,305,750 4,490,309 6,014,509 770,665
2,234,947 4,171,874 6,111,951 878,294
2,137,578 4,088,995 6,100,995 982,760
2,262,614 3,659,568 5,939,312 907,472
revenues From retail leased lines in austria (Page 31)
EUR
<= 2 Mbit/s > 2 Mbit/s < 2 Mbit/s = 2 Mbit/s > 2 Mbit/s to 155 Mbit/s > 155 Mbit/s
Q1
Q2
Q3
Q4
Q1
Q2
Q3
Q4
Q1
Q2
Q3
Q4
2011
2012
2013
21,273,113 2,554,325
21,371,847 2,465,453
20,353,582 2,301,961
21,242,861 2,370,865
16,673,507 7,908,506 2,109,440 377,138
16,348,471 8,139,189 1,988,042 415,404
16,640,722 8,212,867 1,979,038 743,614
16,187,298 8,787,009 1,889,468 768,150
15,684,985 8,949,336 1,830,584 522,385
15,804,281 9,336,129 1,728,829 575,165
15,097,588 9,508,942 1,547,810 598,400
15,526,814 9,727,047 1,610,751 929,981
Wholesale revenues From leased lines and ethernet serviCes (Page 32)
Terminating segments / leased lines
terminating segments / Ethernet services
Trunk segments / leased lines
Trunk segments / Ethernet services
EUR

RTR Telekom Monitor Annual Review 2013
352 | leaseD lInes
Q1
Q2
Q3
Q4
Q1
Q2
Q3
Q4
Q1
Q2
Q3
Q4
Q1
Q2
Q3
Q4
2013
2013
2012
2013
485 13,924 2,662 178 6
494 13,561 2,718 186 7
462 13,355 2,894 195 7
451 12,934 2,820 202 7
387 11,786 2,939 268 8
354 11,370 2,945 281 7
331 10,851 3,053 292 7
323 10,196 3,105 294 8
number oF terminating segments oF leased lines in austria (Page 33)
< 2 Mbit/s = 2 Mbit/s > 2 Mbit/s to 155 Mbit/s
> 155 Mbit/s to 1 Gbit/s > 1 Gbit/s
Number of terminating segments
Q1
Q2
Q3
Q4
Q1
Q2
Q3
Q4
Q1
Q2
Q3
Q4
Q1
Q2
Q3
Q4
2013
2013
2012
2013
585 1,090 3,572 235 22
618 1,120 3,742 244 20
36 1,038 3,625 274 3
59 801 4,122 306 3
26 790 4,329 317 4
17 816 4,625 326 11
14 813 4,762 355 12
14 1,377 5,169 380 12
number oF terminating segments oF ethernet serviCes in austria
< 2 Mbit/s = 2 Mbit/s > 2 Mbit/s to 155 Mbit/s
> 155 Mbit/s to 1 Gbit/s > 1 Gbit/s
Number of terminating segments
Q1
Q2
Q3
Q4
Q1
Q2
Q3
Q4
Q1
Q2
Q3
Q4
Q1
Q2
Q3
Q4
2013
2013
2012
2013
5,734 436,546 1,645,971 1,941,522 889,665
5,543 425,235 1,698,299 2,054,495 978,115
5,175 423,190 1,826,737 2,208,215 978,115
4,876 409,794 1,863,734 2,240,302 978,115
4,372 388,932 1,828,539 3,785,346 1,029,606
4,086 372,369 1,786,833 3,869,980 984,464
3,929 360,595 1,834,631 3,953,993 984,464
3,794 338,751 1,876,182 2,777,224 1,398,881
leased lines - number oF 64 kbit/s equivalents
< 2 Mbit/s = 2 Mbit/s > 2 Mbit/s to 155 Mbit/s
> 155 Mbit/s to 1 Gbit/s > 1 Gbit/s
Number of 64 kbit/s equivalents

RTR Telekom Monitor Annual Review 2013
362 | leaseD lInes
Q1
Q2
Q3
Q4
Q1
Q2
Q3
Q4
Q1
Q2
Q3
Q4
Q1
Q2
Q3
Q4
2013
2013
2012
2013
5,567 35,630 1,453,135 2,596,609 348,348
5,914 36,622 1,489,584 2,559,311 315,172
393 33,936 1,407,741 2,756,576 49,764
603 26,151 1,535,695 3,035,570 49,764
299 25,845 1,638,638 3,098,585 81,403
215 26,691 1,778,196 3,155,678 265,832
184 26,579 1,777,071 3,280,830 299,008
184 44,851 2,023,906 3,598,257 428,096
ethernet serviCes - number oF 64 kbit/s equivalents
< 2 Mbit/s = 2 Mbit/s > 2 Mbit/s to 155 Mbit/s
> 155 Mbit/s to 1 Gbit/s > 1 Gbit/s
Number of 64 kbit/s equivalents

RTR Telekom Monitor Annual Review 2013
373 | MobIle CoMMUnICaTIons
3 Mobile communications

RTR Telekom Monitor Annual Review 2013
383 | MobIle CoMMUnICaTIons
Mobile penetrationPeneTRaTIon RaTe Down DUe To DaTa CleansInG
Source: RTR, Statistics Austria (population figure)
The mobile penetration rate is calculated as the number of activated SIM cards divided by the country‘s population. This figure therefore represents the (notional) average number of SIM cards owned by every inhabitant. However, it also includes both SIM cards used by businesses and machine-to-machine (M2M) SIM cards.
■■ 2011 and 2012 were characterised by a continuously growing penetration rate. In contrast, in 2013, the penetration rate declined due to data cleansing carried out by one operator in respect of the number of subscribers.
■■ The penetration rate peaked in Q1 2013 at 161.7%, falling from then onwards to 156.2% over the next two quarters. This was due to the mergers that took place in 2013 and to associated data cleansing carried out by the operators. After data cleansing in Q2 and Q3 2013, the penetration rate remained constant.
147.4 148.6 150.3154.3 156.4 156.6 158.5 160.2 161.7 158.4 156.2 156.1
<4>
180
160
140
120
100
80
60
40
20
0
Pene
tratio
n ra
te (%
)
Q12011
Q22011
Q32011
Q42011
Q12012
Q22012
Q32012
Q42012
Q12013
Q22013
Q32013
Q42013
Mobile penetration (based on population)

RTR Telekom Monitor Annual Review 2013
393 | MobIle CoMMUnICaTIons
Retail revenues from mobile communicationsConTInUInG DeClIne In ReTaIl ReVenUes In 2013
The chart above includes all revenues (base fees, activation charges, service charges, connection charges etc.), earned from the company‘s (own) retail customers in Austria, including revenues earned from roaming. In line with the amendment to the KEV, mobile services revenues were classified in 2012 as follows:
- Revenues clearly attributable to mobile voice telephony or value-added voice services;
- Revenues clearly attributable to text messaging and value-added text messaging services;
- Revenues clearly attributable to mobile data and value-added data services (including multimedia messages);
- Bundled products and base fees: revenues not clearly attributable to one of the aforementioned categories;
- Revenues from “bundled products and base fees“ accounted for by data services (excluding text messages);**
- Other revenues, e.g. reminder charges
■■ Total retail revenues in 2013 amounted to some EUR 2.240 billion, i.e. 5.1% less than in 2012.■■ The largest proportion of the revenues was earned by bundled products and base fees. These reve-
nues continuously increased in 2012 and 2013, amounting in total EUR 1.253 billion in 2013 (up 6.3% against 2012).
■■ Revenues from voice telephony suffered a sharp decline. While they amounted to EUR 716.2 million in 2012, this figure dropped to EUR 578.3 million in 2013, which is a decline of 19.3%.
■■ The downward trend in revenues from text messaging also continued. In 2012, revenues were at EUR 148.7 million, compared with EUR 114.0 million in 2013. This was a loss in revenue of 33.4%.
■■ However, revenues from data and value-added data services remained almost constant over the years (EUR 270.8 million in 2013 against EUR 276.2 million in 2012 mean a decline of 2.0%).
■■ Other revenues fell from EUR 41.1 million in 2012 to EUR 24.0 million in 2013 (down 41.5 %).
610.
4
626.
6
632.
5
611.
1
183.
4
185.
8
186.
6
160.
5
146.
5
150.
6
147.
7
133.
5
69.9
74.7
66.8
64.9
60.7
64.4
74.6
71.0
36.0
39.4
37.2
36.1
29.7
28.4
29.0
26.8
289.
2
287.
3
297.
1
305.
2
308.
5
308.
6
318.
0
317.
9
10.8 9.9
10.1
10.3
9.6 6.9 3.
7
3.8
700
600
500
400
300
200
100
0
Reve
nues
(EUR
mill
ions
)
Q12011
Q22011
Q32011
Q42011
Q12012
Q22012
Q32012
Q42012
Q12013
Q22013
Q32013*
Q42013
Other revenuesText messaging
Bundled products and base feesVoice telephony
Data services and value-added data servicesTotal retail revenues
*Due to retrospective corrections the figures shown on this page vary by more than 5% from those in the last issue of the RTR Telecom Monitor.
**These are not shown separately in the chart; however, their share can be seen in the table at the end of the section.

RTR Telekom Monitor Annual Review 2013
403 | MobIle CoMMUnICaTIons
Call minutes on the retail market sTeaDy nUMbeR of MInUTes – wITh seasonal effeCTs
The chart above shows the actual call minutes (technical measurement, see Glossary) on mobile networks. This in-cludes minutes from voice telephone calls including value-added voice services, but not (non-voice) services, video telephony etc.
■■ The substantial losses in revenues from voice telephony are not reflected in the call minutes used. In 2013, the total number of mobile call minutes was 22.5 billion minutes, only 1.4% less than in the previous year.
■■ The chart clearly depicts the seasonal development of the call minutes, the third quarter being the weakest of the four quarters due to the holiday season. In this respect, the rise in call minutes in Q4 2013 (up 3.8% on Q3) was in line with a periodic trend.
5,55
8
5,55
7
5,36
5
5,70
6
5,78
8
5,73
5
5,53
8
5,77
1
5,71
2
5,73
3
5,43
2
5,63
7
7,000
6,000
5,000
4,000
3,000
2,000
1,000
0
Call
min
utes
(mill
ions
)
Q12011
Q22011
Q32011
Q42011
Q12012
Q22012
Q32012
Q42012
Q12013
Q22013
Q32013
Q42013
Real minutes (retail market)

RTR Telekom Monitor Annual Review 2013
413 | MobIle CoMMUnICaTIons
Text messagesnUMbeR of TexT MessaGes PlUMMeTInG
The chart above shows the number of text messages (technical measurement) sent in the respective quarters. For text messages, similar to call minutes, the term “technical measurement“ means that the figure also includes text messages that are not charged individually to the retail customer (e. g. text messages included in the base fee or flat rate). Multimedia messages are not included in these figures.
■■ Since text messages sent reached their peak in Q4 2011 with more than 2 billion text messages, the figure has fallen sharply. Comparing Q4 2012 with Q4 2013, the number of text messages dropped by 30.1% to some 1.349 billion text messages sent in Q4 2013. It is somewhat misleading that text mes-sages appear to level off at this figure, as the fourth quarter of a year has always been strong and, in fact, the absence of the usual rise also equals a decline.
■■ This is attributable to the increasing distribution of smartphones equipped for messaging services like WhatsApp or iMessage that are more frequently used by many customers, replacing text messages.
1,72
6
1,78
0
1,75
8
2,01
8
1,98
5
2,00
4
1,83
5
1,93
0
1,67
7
1,54
1
1,34
8
1,34
9
2,500
2,000
1,500
1,000
500
0
Text
mes
sage
s (m
illio
ns)
Q12011
Q22011
Q32011
Q42011
Q12012
Q22012
Q32012
Q42012
Q12013
Q22013
Q32013
Q42013
Text messages sent (technical measurement)

RTR Telekom Monitor Annual Review 2013
423 | MobIle CoMMUnICaTIons
Data volume (retail market)aPPaRenTly no enD In sIGhT To DaTa GRowTh
The chart above shows the data volume used for uplink and downlink transmissions on the retail mobile communi-cations market in terabytes (1 terabyte = 1,024 gigabytes = 1,048,576 megabytes). These figures do not include text messages or multimedia messages.
■■ 32,770 terabytes in the last quarter of 2013 meant a new record, as in all previous quarters. For sea-sonal reasons, growth from Q3 to Q4 is always higher, in 2013 there was an increase of 17.9%.
■■ In 2013, some 110,700 terabytes of data were used; this figure was higher by 57.3% than in the previ-ous year and more than 2.5 times higher than in 2011. Thus, since Q1 2011 the data transfer volume has grown by an average of 13.1% each quarter. There appears to be no end to this trend. On the contrary, due to LTE technology, which is on the increase, and the wide range of data-based applica-tions available for mobile terminal devices the data transfer volume is expected to even multiply in the future.
8,51
0
9,19
0
10,4
60
13,3
10
15,2
00
15,9
60
17,6
60
21,5
70
24,7
00
25,4
60
27,8
00
32,7
70
35,000
30,000
25,000
20,000
15,000
10,000
5,000
0
Data
vol
ume
(tera
byte
s)
Q12011
Q22011
Q32011
Q42011
Q12012
Q22012
Q32012
Q42012
Q12013
Q22013
Q32013
Q42013
Retail upload/download volume
RTR Telekom Monitor Annual Review 2013
433 | MobIle CoMMUnICaTIons
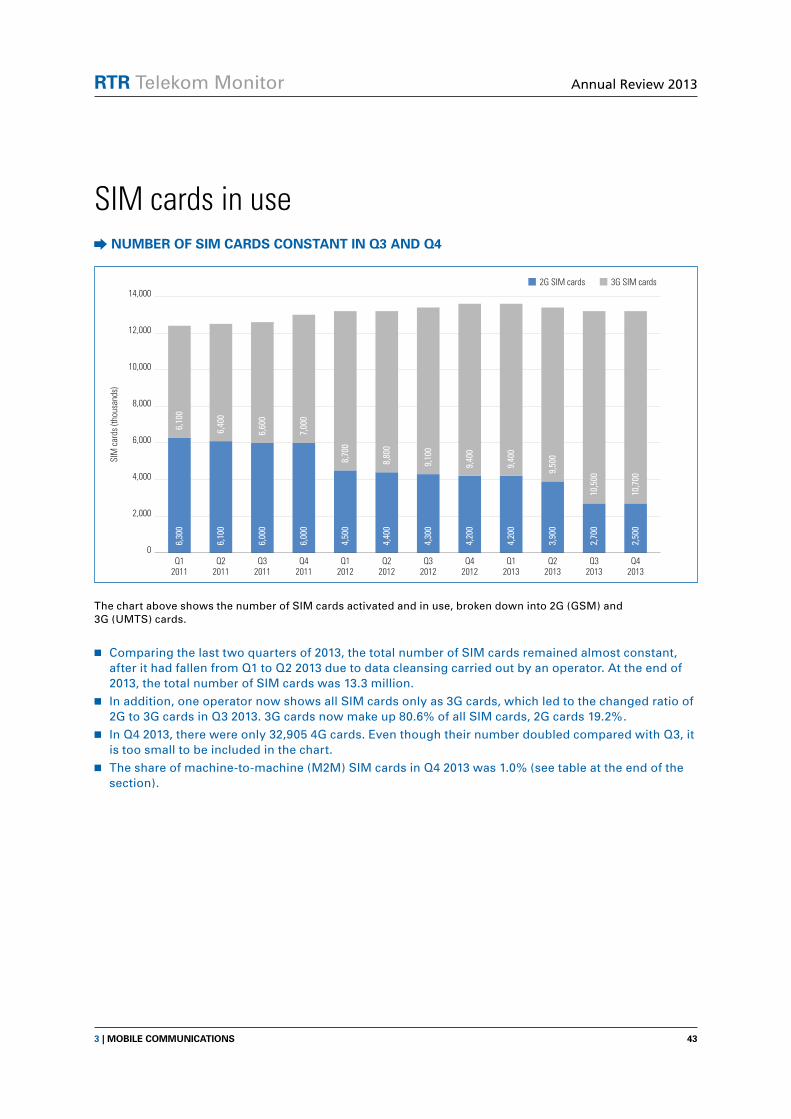
SIM cards in usenUMbeR of sIM CaRDs ConsTanT In Q3 anD Q4
The chart above shows the number of SIM cards activated and in use, broken down into 2G (GSM) and 3G (UMTS) cards.
■■ Comparing the last two quarters of 2013, the total number of SIM cards remained almost constant, after it had fallen from Q1 to Q2 2013 due to data cleansing carried out by an operator. At the end of 2013, the total number of SIM cards was 13.3 million.
■■ In addition, one operator now shows all SIM cards only as 3G cards, which led to the changed ratio of 2G to 3G cards in Q3 2013. 3G cards now make up 80.6% of all SIM cards, 2G cards 19.2%.
■■ In Q4 2013, there were only 32,905 4G cards. Even though their number doubled compared with Q3, it is too small to be included in the chart.
■■ The share of machine-to-machine (M2M) SIM cards in Q4 2013 was 1.0% (see table at the end of the section).
6,10
0
6,40
0
6,60
0
7,00
0
8,70
0
8,80
0
9,10
0
9,40
0
9,40
0
9,50
0
10,5
00
10,7
00
6,30
0
6,10
0
6,00
0
6,00
0
4,50
0
4,40
0
4,30
0
4,20
0
4,20
0
3,90
0
2,70
0
2,50
0
14,000
12,000
10,000
8,000
6,000
4,000
2,000
0
SIM
car
ds (t
hous
ands
)
Q12011
Q22011
Q32011
Q42011
Q12012
Q22012
Q32012
Q42012
Q12013
Q22013
Q32013
Q42013
3G SIM cards2G SIM cards

RTR Telekom Monitor Annual Review 2013
443 | MobIle CoMMUnICaTIons
Prepaid vs. postpaid SIM cardsRaTIo of PosTPaID To PRePaID CUsToMeRs sTallInG
The chart above shows the number of prepaid and postpaid customers in the mobile communications market. Prepaid customers use SIM cards on which a certain amount of credit (in the form of minutes, text messages, data volume etc.) is stored. Thus, the customer pays for the service in advance. In the case of postpaid customers (also referred to as contract customers), a bill for the service is sent after it has been used (usually on a monthly basis).
■■ The ratio of prepaid to postpaid customers has remained almost constant since 2012.■■ In Q4 2013, the distribution of the 13.3 million SIM cards was almost unchanged against the previous
quarter: 69.4% of all mobile customers were postpaid customers and 30.6% were prepaid customers.
8,40
0
8,50
0
8,60
0
8,90
0
9,00
0
9,10
0
9,20
0
9,30
0
9,40
0
9,20
0
9,20
0
9,20
0
4,00
0
4,00
0
4,00
0
4,20
0
4,20
0
4,10
0
4,20
0
4,20
0
4,30
0
4,20
0
4,10
0
4,10
0
14,000
12,000
10,000
8,000
6,000
4,000
2,000
0
Num
ber o
f cus
tom
ers
(thou
sand
s)
Q12011
Q22011
Q32011
Q42011
Q12012
Q22012
Q32012
Q42012
Q12013
Q22013
Q32013
Q42013
Prepaid customers Postpaid customers

RTR Telekom Monitor Annual Review 2013
453 | MobIle CoMMUnICaTIons
The average SIM cardfeweR TexT MessaGes, ConsTanT MInUTes, MoRe DaTa
The charts show the average revenues generated, the average number of real minutes and text messages sent as well as the data volume used in megabytes per SIM card in an average month for each quarter. The values are there-fore based on one-third of retail customer revenues, real minutes, number of text messages sent and data volumes of a quarter, divided by the total number of activated SIM cards (including mobile broadband cards and M2M SIM cards). The revenues per SIM card depicted shall not be interpreted as prices. Information on the price develop-ments can be found in the price index for mobile communications at the end of the section.
■■ The average revenue generated per SIM card in Q4 2013 was EUR 13.9 per month and thus fell by 2.1% against the corresponding quarter 2012. The comparison with Q4 2012, however, has to take into account that the number of SIM cards also decreased because of the data cleansing mentioned before.
■■ The development of call minutes per SIM card and month corresponds to the trend already depicted. Accordingly, the call minutes used are not subject to major changes, apart from seasonal fluctuations. Therefore, it is not surprising that the number of call minutes per subscriber and month at the end of 2013 did not change against the end of 2012.
■■ Compared with the corresponding quarter of 2012, the number of text messages sent on average per SIM card and month dropped sharply (down 28.3%).
■■ Unsurprisingly, the data volume per SIM card and month continued to increase sharply. The average data volume in Q4 2013 was about 863 megabytes, this is a rise of 55.6% compared with Q4 2012.
14.2
13.5
13.9
14.4
13.9
554.
7
631.
9
663.
8
734.
3
863.
1
47.3
40.9
38.3
34.0
33.9
141.
6
139.
3
142.
5
136.
8
141.
6
20
15
10
5
0
150
100
50
0
1,000
800
600
400
200
0
60
40
20
0
Min
utes
/mon
thM
B/m
onth
EUR/
mon
thTe
xt m
essa
ges/
mon
th
Q42012
Q12013
Q22013
Q32013
Q42012
Q12013
Q22013
Q32013
Q42012
Q12013
Q22013
Q32013
Q42012
Q12013
Q22013
Q32013
Q42013
Q42013
Q42013
Q42013
Revenues (EUR) – per SIM card and month Real minutes – per SIM card and month
Data volume (megabytes) – per SIM card and monthText messages (technical measurement) – per SIM card and month

RTR Telekom Monitor Annual Review 2013
463 | MobIle CoMMUnICaTIons
Total mobile communications revenuessIGnIfICanT DeClIne In ReVenUes on boTh MaRKeTs
The chart above shows the revenues on the retail and wholesale markets. Retail revenues include all revenues (base fees, activation charges, service charges, connection charges etc.), earned from the company‘s (own) retail cust-omers in Austria, including revenues earned from roaming. Wholesale revenues are revenues from origination and termination charges, from selling airtime to resellers and revenues from national and international roaming (includ-ing MVNO access).
■■ The chart illustrates the downward trend of total revenues of mobile operators as well as the break-down into revenues from retail and wholesale customers.
■■ Total revenues in 2013 amounted to about EUR 2.607 billion, which is a decline of 8.3% against EUR 2.841 billion in 2012.
■■ 85.9% of total annual revenues were accounted for by retail revenues and 14.1% by wholesale reve-nues. Both retail revenues and wholesale revenues declined against 2012. Retail revenues were down by 5.1%, wholesale revenues by even 23.7%. The decline in wholesale revenues can be seen in nearly all revenue categories; however, it is greatest in the sale of airtime to resellers (down 86.4%) and termination (particularly text messages; down 29.7%).
■■ Total revenues from mobile communications were EUR 623.4 million in Q4 2013. Compared with the corresponding quarter of the previous year, revenues thus dropped by 10.0%.
Wholesale revenuesRetail revenues
131 12
3
117
124
129
118
118
116
109
101 87 70
610
627
633
611
589
597
598
577
555
559
573
553
900
800
700
600
500
400
300
200
100
0
Reve
nues
(EUR
mill
ions
)
Q12011
Q22011
Q32011
Q42011
Q12012
Q22012
Q32012
Q42012
Q12013
Q22013
Q32013
Q42013
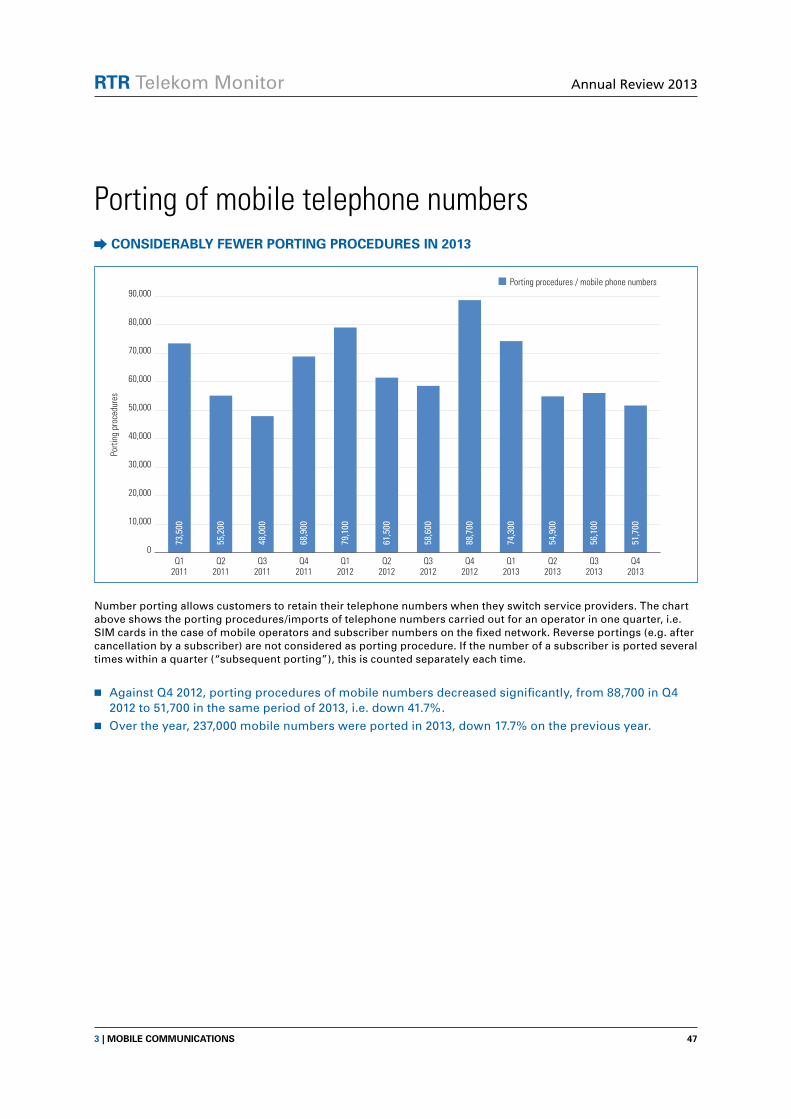
RTR Telekom Monitor Annual Review 2013
473 | MobIle CoMMUnICaTIons
Porting of mobile telephone numbersConsIDeRably feweR PoRTInG PRoCeDURes In 2013
Number porting allows customers to retain their telephone numbers when they switch service providers. The chart above shows the porting procedures/imports of telephone numbers carried out for an operator in one quarter, i.e. SIM cards in the case of mobile operators and subscriber numbers on the fixed network. Reverse portings (e.g. after cancellation by a subscriber) are not considered as porting procedure. If the number of a subscriber is ported several times within a quarter (“subsequent porting”), this is counted separately each time.
■■ Against Q4 2012, porting procedures of mobile numbers decreased significantly, from 88,700 in Q4 2012 to 51,700 in the same period of 2013, i.e. down 41.7%.
■■ Over the year, 237,000 mobile numbers were ported in 2013, down 17.7% on the previous year.
73,5
00
55,2
00
48,0
00
68,9
00
79,1
00
61,5
00
58,6
00
88,7
00
74,3
00
54,9
00
56,1
00
51,7
00
90,000
80,000
70,000
60,000
50,000
40,000
30,000
20,000
10,000
0
Porti
ng p
roce
dure
s
Q12011
Q22011
Q32011
Q42011
Q12012
Q22012
Q32012
Q42012
Q12013
Q22013
Q32013
Q42013
Porting procedures / mobile phone numbers

RTR Telekom Monitor Annual Review 2013
483 | MobIle CoMMUnICaTIons
Market shares of mobile service providers in AustriaResTRUCTURInG of The MobIle MaRKeT In 2013
The chart above shows the market shares of mobile operators in Austria based on their subscriber numbers (number of SIM cards used).
■■ 2013 was characterised by the restructuring of the mobile market. Orange was taken over by Hutchi-son Drei Austria GmbH, its prepaid and discount product Yesss! went to A1 Telekom Austria AG. The chart shows the new distribution of the mobile market on the basis of the subscriber numbers of the mobile service providers in Q4 2013.
■■ Accordingly, A1 Telekom is the market leader with a market share of 43.1% or 5.71 million subscribers. After the takeover of Yesss! its market share increased by 3.5 percentage points compared with Q4 2012.
■■ T-Mobile Austria GmbH ranks second with a market share of 31.1%. In the past two years, its market share remained almost constant. At the end of 2013, T-Mobile had 4.11 million subscribers.
■■ Due to the merger with Orange, Hutchison increased its market share in Q4 2013 by 13.3 percentage points to 25.8% against 2012, which is equivalent to 3.42 million subscribers.
25.8%
31.1%
43.1%
Q4 2013
T-Mobile Austria GmbH
Hutchison Drei Austria GmbH
A1 Telekom Austria AG

RTR Telekom Monitor Annual Review 2013
493 | MobIle CoMMUnICaTIons
Price index in mobile communicationsaGaIn InCRease In oVeRall InDex
For the calculation of the average monthly prices the tariff data published by the Austrian Chamber of Labour on a monthly basis are used and average prices are derived for four different user types: three of these user types are so-called “smartphone users” who use both voice and text messaging services as well as data services. A fourth user type (the low user) exclusively uses voice and text messaging services. Up to five of the respective most economical tariffs per brand are used (see Glossary).
In contrast to the other charts in the RTR Telecom Monitor, this chart does not show the price development on a quarterly but on a monthly basis. As data up to March 2014 are already available, they are also included in the chart.
■■ In 2013, the first year after market consolidation, mobile communications experienced significant price increases. In particular at the end of 2013, a clear upward trend was observed.
■■ Since Q4 2013, tariffs have risen markedly across all user types. This is due to numerous tariff increa-ses (of both monthly charges as well as one-off charges like the activation charge etc.) and reductions in subsidies for terminal devices.
■■ Only the price index for the power user fell again in Q1 2014. This downward trend can be explained by the fact that with effect from February 2014 the data volume included in the youth tariff of A1 Te-lekom was increased to 2 gigabytes per month, while the monthly charge remained the same. As this tariff, with 2 gigabytes, now comprises the data volume used monthly by the power user, it has been attributed to the power user since February.
■■ The further decline from February to March 2014 is due to the introduction of the “Max Pur” tariffs of tele.ring.
140
120
100
80
60
40
20
0
Poin
ts
March2011
June2011
Sept.2011
Dec.2011
March2012
June2012
Sept.2012
Dec.2012
March2013
June2013
Sept.2013
March2014
Dec.2013
Power-UserHigh-UserMedium-UserLow-UserIndex
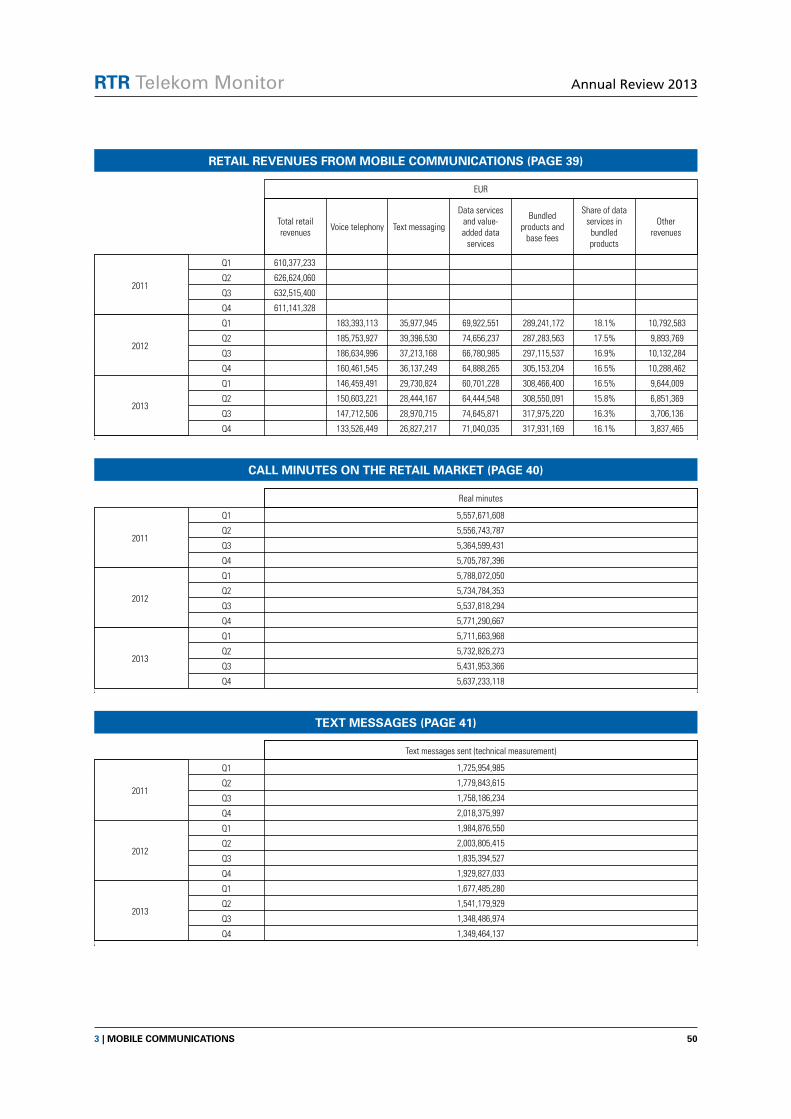
RTR Telekom Monitor Annual Review 2013
503 | MobIle CoMMUnICaTIons
Data tables
Q1
Q2
Q3
Q4
Q1
Q2
Q3
Q4
Q1
Q2
Q3
Q4
2011
2012
2013
610,377,233
626,624,060
632,515,400
611,141,328
183,393,113 35,977,945 69,922,551 289,241,172 18.1% 10,792,583
185,753,927 39,396,530 74,656,237 287,283,563 17.5% 9,893,769
186,634,996 37,213,168 66,780,985 297,115,537 16.9% 10,132,284
160,461,545 36,137,249 64,888,265 305,153,204 16.5% 10,288,462
146,459,491 29,730,824 60,701,228 308,466,400 16.5% 9,644,009
150,603,221 28,444,167 64,444,548 308,550,091 15.8% 6,851,369
147,712,506 28,970,715 74,645,871 317,975,220 16.3% 3,706,136
133,526,449 26,827,217 71,040,035 317,931,169 16.1% 3,837,465
retail revenues From mobile CommuniCations (Page 39)
Total retail revenues Voice telephony Text messaging
Data services and value- added data
services
Bundled products and
base fees
Share of data services in
bundled products
Other revenues
EUR
Q1
Q2
Q3
Q4
Q1
Q2
Q3
Q4
Q1
Q2
Q3
Q4
2011
2012
2013
5,557,671,608
5,556,743,787
5,364,599,431
5,705,787,396
5,788,072,050
5,734,784,353
5,537,818,294
5,771,290,667
5,711,663,968
5,732,826,273
5,431,953,366
5,637,233,118
Call minutes on the retail market (Page 40)
Real minutes
Q1
Q2
Q3
Q4
Q1
Q2
Q3
Q4
Q1
Q2
Q3
Q4
2011
2012
2013
1,725,954,985
1,779,843,615
1,758,186,234
2,018,375,997
1,984,876,550
2,003,805,415
1,835,394,527
1,929,827,033
1,677,485,280
1,541,179,929
1,348,486,974
1,349,464,137
text messages (Page 41)
Text messages sent (technical measurement)

RTR Telekom Monitor Annual Review 2013
513 | MobIle CoMMUnICaTIons
Q1
Q2
Q3
Q4
Q1
Q2
Q3
Q4
Q1
Q2
Q3
Q4
2011
2012
2013
8,921,282,869
9,640,975,664
10,968,507,825
13,961,403,983
15,941,607,958
16,740,230,488
18,512,934,796
22,613,660,102
25,900,761,126
26,700,365,708
29,155,606,101
34,364,913,863
data volume (retail market) (Page 42)
Retail upload/download volume (megabytes)
Q1
Q2
Q3
Q4
Q1
Q2
Q3
Q4
Q1
Q2
Q3
Q4
2011
2012
2013
6,257,189 6,131,590
6,130,538 6,368,301
6,022,979 6,632,571
5,996,070 7,026,508
4,524,684 8,677,898 223 86,351
4,393,808 8,838,573 287 93,497
4,346,491 9,059,562 380 100,652
4,206,611 9,381,291 461 107,621
4,241,772 9,421,539 628 109,343
3,909,645 9,488,201 10,220 113,861
2,680,314 10,538,191 17,281 117,423
2,547,291 10,691,826 32,905 127,797
sim Cards in use (Page 43)
2G SIM cards 3G SIM cards 4G SIM cards thereof M2M SIM cards
Number of SIM cards
Q1
Q2
Q3
Q4
Q1
Q2
Q3
Q4
Q1
Q2
Q3
Q4
2011
2012
2013
8,433,436 3,955,343
8,513,940 3,984,899
8,621,693 4,033,857
8,854,952 4,167,626
9,043,684 4,159,121
9,094,056 4,138,612
9,185,425 4,221,008
9,345,338 4,243,025
9,391,702 4,272,237
9,172,226 4,235,840
9,173,165 4,062,621
9,210,558 4,061,464
Postpaid customers Prepaid customers
Number of customers
PrePaid vs. PostPaid sim Cards (Page 44)

RTR Telekom Monitor Annual Review 2013
523 | MobIle CoMMUnICaTIons
Q1
Q2
Q3
Q4
Q1
Q2
Q3
Q4
Q1
Q2
Q3
Q4
2011
2012
2013
610,377,233 130,587,523
626,624,060 123,311,439
632,515,400 116,450,153
611,141,328 124,371,586
589,327,364 128,953,660
596,984,026 117,581,408
597,876,970 118,034,261
576,928,725 115,801,148
555,001,952 108,528,286
558,893,396 100,664,631
573,010,448 87,314,584
553,162,335 70,247,758
Retail revenues Wholesale revenues
EUR
total mobile CommuniCations revenues (Page 46)
Q1
Q2
Q3
Q4
Q1
Q2
Q3
Q4
Q1
Q2
Q3
Q4
2011
2012
2013
73,542
55,204
48,038
68,873
79,092
61,525
58,576
88,745
74,292
54,855
56,082
51,719
Porting oF mobile telePhone numbers (Page 47)
Number of porting procedures of mobile phone numbers
RTR Telekom Monitor Annual Review 2013
534 | bRoaDbanD
4 Broadband

RTR Telekom Monitor Annual Review 2013
544 | bRoaDbanD
Fixed and mobile broadband connectionsMaRKeD InCReases In sMaRTPhone TaRIffs anD fIxeD bRoaDbanD
The chart above shows the total number of fixed and mobile broadband connections. With mobile broadband, mobile data tariffs and smartphone tariffs are distinguished. For the definitions of fixed broadband connections as well as mobile data tariffs and smartphone tariffs see Glossary.
■■ At the end of last year, total broadband connections numbered 7.7 million. Thus, the number of broad-band connections rose by 9.6% in the year under review.
■■ Smartphone tariffs experienced a veritable boom with an increase of 21.6% as compared to the end of 2012. 3.27 million customers used Internet services on their mobile phones at the end of 2013.
■■ Fixed broadband grew by 4.7% in the period under review, with about 2.23 million connections at the end of 2013.
■■ Contrary to the trend seen in the above-mentioned connections, mobile broadband decreased slightly (down 0.3%). However, this decline is primarily attributable to data cleansing in respect of unused SIM cards carried out by operators. This category comprised some 2.2 million connections at the end of last year.
1,95
2
1,95
1
1,98
3
2,06
6
2,08
6
2,09
9
2,16
0
2,20
6
2,22
2
2,17
6
2,19
4
2,19
9
1,00
9
1,22
9
1,47
7
1,79
3
2,03
5
2,21
6
2,41
5
2,68
6
2,84
0
3,12
5
3,14
3
3,26
7
2,01
3
2,03
1
2,05
5
2,09
1
2,10
0
2,07
7
2,10
3
2,12
6
2,16
0
2,17
3
2,19
2
2,22
8
Smartphone tariffsMobile broadband (data tariffs and prepaid cards)Fixed broadband (retail and wholesale)
Conn
ectio
ns (t
hous
ands
)
8,000
7,000
6,000
5,000
4,000
3,000
2,000
1,000
0
<4>
Q12011
Q22011
Q32011
Q42011
Q12012
Q22012
Q32012
Q42012
Q12013
Q22013
Q32013
Q42013

RTR Telekom Monitor Annual Review 2013
554 | bRoaDbanD
Broadband penetration aRoUnD nIne oUT of Ten hoUseholDs Use a sMaRTPhone TaRIff
Source: RTR, Statistics Austria (number of households)
Broadband penetration refers to the ratio of fixed and mobile broadband connections to the total number of households in Austria. Calculation of the penetration rate also includes broadband connections used in businesses.
■■ Broadband penetration for smartphone tariffs rose from 72% at the end of 2012 to 87% at the end of 2013. Until mid-2013 this increase was particularly dynamic.
■■ The penetration rates of fixed and mobile broadband remained almost unchanged, between 58 and 60% in 2013.
53 53 5456
5657
58 59 60 58
59 59
27
33
4049
55
6065
7276
84 84 87
55 55 56 57 57
5656 57 58 58
6059
Smartphone tariffsMobile broadband (data tariffs and prepaid cards)Fixed broadband (retail and wholesale)
Pene
tratio
n ra
te (%
)
100
90
80
70
60
50
40
30
20
10
0Q1
2011Q2
2011Q3
2011Q4
2011Q1
2012Q2
2012Q3
2012Q4
2012Q1
2013Q2
2013Q3
2013Q4
2013

RTR Telekom Monitor Annual Review 2013
564 | bRoaDbanD
Retail broadband connections by type of infrastructure
lITTle ChanGe In The CoURse of The yeaR
The chart above shows the total number of fixed and mobile broadband connections in Austria by infrastructure used. For the infrastructure of fixed broadband connections see Glossary. The data underlying this chart are contained in the table at the end of the section.
■■ Copper-wire pair connections on the basis of own infrastructure increased by 6.1% over the year, whereas unbundled lines fell by 9.3%.
■■ Between the end of 2012 and the end of 2013, the number of coaxial cable connections rose by 5.9%.■■ The most significant changes were seen in other broadband connections: FWA connections dropped
by 13.3% throughout 2013, optical fibre connections (FTTH) increased by 18.4% over the same period. However, altogether both connection types accounted only for 0.5% of all broadband connections.
Coaxial cable Other infrastructure (FWA, FTTH etc.)Unbundled lines
Mobile broadband Copper-wire pairsSmartphone tariffs
Conn
ectio
ns (t
hous
ands
)
3,500
3,000
2,500
2,000
1,500
1,000
500
0Q1
2011Q2
2011Q3
2011Q4
2011Q1
2012Q2
2012Q3
2012Q4
2012Q1
2013Q2
2013Q3
2013Q4
2013

RTR Telekom Monitor Annual Review 2013
574 | bRoaDbanD
Retail broadband connections by bandwidth category – fixed network
TRenD TowaRDs hIGheR banDwIDThs ConTInUes
The chart above shows the total number of fixed broadband connections in Austria, broken down by bandwidth categories. Because of the small number of cases, categories with low bandwidths (>= 144 kbit/s to < 2 Mbit/s and 2 Mbit/s) and categories with high bandwidths (30 Mbit/s to < 100 Mbit/s and >= 100 Mbit/s) were combined. The cat egories in between (> 2 Mbit/s to < 10 Mbit/s and 10 Mbit/s to < 30 Mbit/s) are unchanged. All categories are shown separately in the table at the end of the section.
■■ The majority of retail broadband connections (45.0%) fell into the > 2 Mbit/s to < 10 Mbit/s category and numbered some 1.0 million connections at the end of 2013. This figure decreased by 2.8% in the course of the year.
■■ In contrast, higher bandwidths grew considerably. About 677,000 connections were reported at the end of 2013 in the >= 10 Mbit/s to < 30 Mbit/s bandwidth category, i.e. 30.4% of all fixed broadband connections. Thus, the connections in this bandwidth category rose by 14.9% against the end of 2012.
■■ Bandwidths greater than 30 Mbit/s increased even more significantly by 39.3% over the year and amounted to some 14.1% of all broadband connections at the end of 2013.
■■ Smaller bandwidths (>= 144kbit/s to <= 2Mbit/s) increasingly lost significance (down 16.7%) and ac-counted only for 10.5% of all broadband connections at the end of 2013.
566,
700
577,
000
582,
800
589,
100
608,
900
622,
300
676,
700
654,
100
192,
300
185,
600
203,
500
224,
800
242,
800
262,
400
313,
300
292,
500
306,
800
296,
000
288,
300
280,
100
271,
500
259,
600
250,
700
233,
300
1,03
4,60
0
1,01
8,50
0
1,02
8,30
0
1,03
2,20
0
1,03
4,40
0
1,02
5,90
0
991,
900
1,00
2,80
0
>= 144kbit/s to <= 2Mbit/s > 2Mibt/s to < 10Mbit/s >= 10Mbit/s to < 30Mbit/s >= 30Mbit/s
Conn
ectio
ns
2,500,000
2,000,000
1,500,000
1,000,000
500,000
0Q1
2012Q2
2012Q3
2012Q4
2012Q1
2013Q2
2013Q4
2013Q3
2013

RTR Telekom Monitor Annual Review 2013
584 | bRoaDbanD
Number of retail broadband connections – fixed network
TV DRIVes PRoDUCTs bUnDleD wITh bRoaDbanD
The chart shows the number of broadband products provided to retail customers. Broadband products may be sold without any other product (stand-alone) or can be a combination of broadband with one or more other products (bundled product), for example, broadband and fixed network and/or TV.
■■ The number of fixed broadband connections rose by 5.3% in the course of 2013 and amounted to some 2.19 million connections at the end of the year. About one fifth of these fixed broadband con-nections are offered as stand-alone products, i.e. not bundled with other telecommunications prod-ucts. Specifically, there were about 447,600 connections, which is an increase of 5.7% throughout the year.
■■ The most popular combination in 2013 was fixed broadband combined with fixed-line voice telepho-ny. Almost every other bundled tariff (48.9%) was composed of these two components at the end of 2013. However, in the course of 2013, a decline of 4.6% was recorded.
■■ A marked increase (up 21.1%) was seen for the combination of fixed broadband, fixed-line telephony and TV. This bundle type was used some 517,100 times mainly by customers of cable providers; this corresponds to 23.6% of all fixed broadband connections. TV as add-on product seems to be accoun-table for this increase because the combination of broadband and TV soared by even 170.9% through-out 2103 and stood at about 111,400 connections at the end of 2013 (5.1% of the retail broadband connections reported here).
■■ Other bundles increasingly lost ground (down 33.8% in the course of 2013) and altogether accounted for only 2% of all bundled products at the end of the year.
455
464
411
424
404
405
419
448
1,10
6
1,10
5
1,11
6
1,12
4
1,06
5
1,06
6
1,07
2
1,07
1
411
413
418
427
496
503 51
7
510
45 4 46 4 44 68 41 65 96 50 101
48
111
43103
45
Other bundles with fixed-line telephony, TV or mobile broadbandBroadband + fixed-line telephony + TVBroadband + fixed-line telephonyBroadband (stand-alone)
Broadband + TV
Conn
ectio
ns (t
hous
ands
)
2,500
2,000
1,500
1,000
500
0Q1
2012Q2
2012Q3
2012Q4
2012Q1
2013Q2
2013Q4
2013Q3
2013

RTR Telekom Monitor Annual Review 2013
594 | bRoaDbanD
Revenues from retail broadband connections – fixed network
2013: ReVenUes of eUR 764 MIllIon fRoM fIxeD bRoaDbanD ConneCTIons
The chart shows the revenues from broadband connections provided to retail customers using own infrastructure or an unbundled line. This includes broadband stand-alone products and bundled products where broadband is offered in combination with another product (voice telephony and/or TV and/or other products).
■■ In Q4 2013, products bundled with fixed broadband generated revenues of EUR 192.1 million, i.e. up 2.8% on Q4 212. Comparing the annual revenues, the difference is even more pronounced: EUR 764.1 million in 2013 against EUR 727.6 million in 2013, this is an increase in revenues of 5.0%.
■■ Stand-alone broadband contributed some EUR 49.3 million (25.7%) to total broadband revenues in Q4 2013, which is 0.8% less than at the end of 2012.
■■ In line with the development of the number of products bundled with broadband, bundles with TV (broadband, fixed-line telephony and/or TV) posted the biggest revenue gains. Revenues from the combination of broadband, fixed-line telephony and TV rose by 19.5% against Q4 2012, those from the combination of broadband and TV more than doubled (up 116.1%). Altogether, these two products accounted for about 31.8% of broadband revenues in the last quarter.
■■ The largest portion of the revenue pie was accounted for by the combination of broadband and fixed-line telephony (41.1%); however, this figure was down by 6.3% on Q4 2012.
4,50
040
0 5,40
030
0 5,10
04,
100
4,70
05,
700
9,30
03,
000
9,80
03,
000
10,3
002,
700
9,80
02,
800
79,5
00
82,3
00
83,5
00
84,3
00
80,2
00
79,8
00
79,0
00
79,4
00
37,1
00
42,4
00
42,6
00
42,5
00
49,2
00
50,0
00
50,8
00
50,6
00
51,4
00
52,0
00
49,9
00
49,7
00
49,2
00
48,1
00
47,9
00
49,3
00
Other bundles with fixed-line telephony, TV or mobile broadbandBroadband + fixed-line telephony + TVBroadband + fixed-line telephonyBroadband (stand-alone)
Broadband + TV
Reve
nues
(EUR
thou
sand
s)
220,000
200,000
180,000
160,000
140,000
120,000
100,000
80,000
60,000
40,000
20,000
0Q1
2012Q2
2012Q3
2012Q4
2012Q1
2013Q2
2013Q4
2013Q3
2013

RTR Telekom Monitor Annual Review 2013
604 | bRoaDbanD
Unbundled lines of A1 Telekom AustrianUMbeR of UnbUnDleD lInes DeClIneD In 2013
The chart above shows the unbundled lines in the network of A1 Telekom Austria AG. It depicts all lines unbundled by A1 Telekom (supply-side) in comparison to the unbundled broadband lines used by other operators (demand-side) according to the KEV.
■■ At the end of 2013, A1 Telekom reported about 250,000 unbundled lines, i.e. down 6.6% on the end of 2012.
■■ According to the data collected under the KEV, some 164,100 of these lines were used as unbundled broadband lines in Q4 2013, which was also a decline (9.2%) compared with Q4 2012.
■■ The difference between unbundled lines and unbundled broadband lines is accounted for by un-bundled lines used exclusively for voice services or for leased lines.
277,
500
275,
100
272,
100
271,
500
270,
900
270,
300
269,
100
267,
600
259,
400
257,
100
253,
500
250,
000
207,
600
203,
200
196,
400
192,
400
187,
800
185,
800
183,
900
180,
800
175,
500
172,
200
168,
800
164,
100
thereof unbundled broadband lines according to KEV dataUnbundles lines according to A1 Telekom Austria AG
Line
s
350,000
300,000
250,000
200,000
150,000
100,000
50,000
0Q1
2011Q2
2011Q3
2011Q4
2011Q1
2012Q2
2012Q3
2012Q4
2012Q1
2013Q2
2013Q3
2013Q4
2013

RTR Telekom Monitor Annual Review 2013
614 | bRoaDbanD
Number of wholesale broadband connectionsslIGhT fall In wholesale bRoaDbanD ConneCTIons
This chart shows the number of broadband connections (bitstream or resale) provided to other communications ser-vice providers on the wholesale market on the supplier’s own infrastructure or on leased infrastructure (unbundled) for connecting to retail customers (or for resale) – classified by the infrastructure used. The data underlying this chart can be found in the table at the end of this section.
■■ Compared with the end of 2012, the number of wholesale broadband connections decreased by 4.6% to nearly 66,300. (This number includes other connections not shown in the above chart such as con-nections by satellite; for details please see the table at the end of the section.)
■■ At the end of 2013, 60.5% of these were copper-wire pairs (about 40,100). This figure declined by 3.0% on that of the previous year.
■■ 10.9% of all wholesale broadband connections (7,200) were wholesale connections based on un-bundled lines, which was a decline of 2.0% compared with 2012.
■■ 15.4% of wholesale broadband connections were realised using cable connections (10,200). This figure fell by 14.1% against the end of 2012. Partly, this was due to the fact that one operator took over its wholesale supplier in the course of 2013, with the effect that this supplier’s former wholesale broadband connections now qualify as the operator’s own connections and therefore the number of connections at the wholesale level declined.
■■ FTTH connections accounted for 9.4% of connections on the wholesale market (6,250), down 4.3% against the end of 2012.
■■ The remaining connections (FWA and other broadband connections) accounted only for some 3.7% of connections (2,450), increasing by 3.7% throughout 2013.
44.6
44.0
42.8
42.4
41.9
41.9
41.9
41.3
41.3
40.7
40.0
40.1
4.5
4.1
3.9
3.7
7.6
7.5
7.4
7.4
7.5
7.2
7.5
7.2
12.4
12.3
12.3
12.6 11
.9
11.9
12.0
11.8
12.1
12.5
10.0
10.2
1.2
1.2
1.2
1.2
1.0
1.0 1.0
1.0 1.0
1.0
1.0
1.02.8
3.0
3.1
3.5
6.1
6.2 6.5
6.5 6.4
6.4
6.4
6.2
FTTH (fibre to the home)Unbundles lines FWA (fixed wireless access)Coaxial cableCopper-wire pairs
Conn
ectio
ns (t
hous
ands
)
80
70
60
50
40
30
20
10
0Q1
2011Q2
2011Q3
2011Q4
2011Q1
2012Q2
2012Q3
2012Q4
2012Q1
2013Q2
2013Q3
2013Q4
2013

RTR Telekom Monitor Annual Review 2013
624 | bRoaDbanD
Revenues from wholesale broadband connectionsloweR ReVenUes DUe To CoMPany MeRGeRs
Revenues from broadband connections supplied on the wholesale market include one-off charges (e.g. installation charges, setup and activation charges) and ongoing charges plus any charges for data transfer etc. A distinction is made between bitstream and resale (see Glossary).
■■ Wholesale revenues from broadband connections fell by 21.6% since Q4 2012 and amounted to roughly EUR 3.5 million in the last quarter of 2013.
■■ This is mainly due to losses in wholesale revenues due to company mergers. ■■ In 2013, total wholesale revenues were about EUR 14.0 million. Compared with EUR 16.8 million in
2012, this was a decline of 16.8%. With nearly three fourths of wholesale revenues, the lion’s share was accounted for by bitstream revenues. In Q4 2013, bitstream revenues amounted to around EUR 2.6 million, these revenues were down 4.0% compared with the last quarter of 2012.
■■ Resale revenues amounted to EUR 887,000 in Q4 2013. Due to the mentioned changes on the whole-sale market, this was only about half the amount of that in the reference quarter of 2012.
4,20
0
4,13
0
4,22
0
4,29
0
2,65
0
2,60
0
2,65
0
2,66
0
2,51
0
2,51
0
2,49
0
2,56
0
1,36
0
1,48
0
1,70
0
1,73
0
1,08
0
1,13
0
840 890
Resale BitstreamBitstream and resale
Reve
nues
(EUR
thou
sand
s)
5,000
4,000
3,000
2,000
1,000
0Q1
2011Q2
2011Q3
2011Q4
2011Q1
2012Q2
2012Q3
2012Q4
2012Q1
2013Q2
2013Q3
2013Q4
2013

RTR Telekom Monitor Annual Review 2013
634 | bRoaDbanD
Price index for broadband (hedonic)fIxeD-lIne InDex ConsTanT, MobIle InDex RIsInG
The broadband index is a hedonic price index for fixed and mobile broadband products. Hedonic means that both price changes and changes in the product characteristics (in particular download rate and download volume) are taken into account. For this purpose, a regression of prices on product characteristics and on time variables is per-formed.
For the calculation, tariffs and product characteristics of the broadband products of the major suppliers (currently A1 Telekom, UPC, Tele2, LIWEST, Salzburg AG, Kabelplus, Russmedia IT, T-Mobile, Hutchison Drei Austria) are collec-ted quarterly (up to 2012 only three times a year). Both stand-alone broadband products and products bundled with fixed-line telephony or TV are captured. In the case of mobile broadband, prepaid tariffs are not included. In addition to monthly charges, also one-off charges and annual charges as well as special offers are taken into account. The most expensive 10% of the tariffs (currently tariffs exceeding EUR 65) are not included in the calculation, as they can be assumed to be in low demand by customers. The remaining tariffs are weighted in proportion to the operators’ market shares in the respective quarter. In the calculation all tariffs of an operator are given the same weights. The reference basis is 2010.
As data up to March 2014 are already available, they are included in the chart.
■■ In 2013, the index values (base year 2010) of the hedonic broadband prices for fixed and mobile broadband were similar in level; however, at the end of 2013, the hedonic prices developed into differ-ent directions. This trend also continued in Q1 2014, even though less pronounced than in Q4 2013.
■■ The rise in hedonic prices for mobile broadband in Q1 2014 was caused by A1 Telekom and T-Mobile raising or charging activation charges.
■■ Prices and products in the fixed network remained largely unchanged from the previous quarter.
Fixed and mobile broadbandMobile broadbandFixed broadband
Poin
ts
140
120
100
80
60
40
20
0Q2
2011Q3
2011Q4
2011Q2
2012Q3
2012Q4
2012Q1
2013Q2
2013Q4
2013Q1
2014Q3
2013

RTR Telekom Monitor Annual Review 2013
644 | bRoaDbanD
Data tables
Q1
Q2
Q3
Q4
Q1
Q2
Q3
Q4
Q1
Q2
Q3
Q4
2011
2012
2013
2,013,330 1,951,706 1,009,251
2,030,921 1,950,907 1,228,897
2,055,113 1,982,638 1,476,573
2,090,596 2,065,641 1,793,289
2,100,354 2,085,851 2,034,629
2,077,089 2,098,970 2,215,933
2,102,865 2,159,574 2,415,128
2,126,193 2,206,340 2,685,591
2,157,625 2,221,628 2,839,581
2,170,133 2,175,993 3,125,017
2,189,265 2,194,068 3,143,122
2,226,056 2,199,081 3,266,973
Fixed and mobile broadband ConneCtions (Page 54)
Fixed broadband (retail and wholesale)
Mobile broadband (data tariffs and prepaid cards) Smartphone tariffs
Number of connections
Q1
Q2
Q3
Q4
Q1
Q2
Q3
Q4
Q1
Q2
Q3
Q4
2011
2012
2013
1,153,748 207,615 620,228 23,731 8,008 1,951,706 1,009,251
1,169,080 203,183 626,967 22,559 9,132 1,950,907 1,228,897
1,198,529 196,412 629,075 21,651 9,447 1,982,638 1,476,573
1,223,952 192,400 642,537 20,853 10,854 2,065,641 1,793,289
1,224,491 187,837 650,923 20,573 16,530 2,085,851 2,034,629
1,221,632 185,824 632,817 19,565 17,252 2,098,970 2,215,933
1,238,525 183,929 641,610 18,705 20,095 2,159,574 2,415,128
1,251,657 180,836 654,791 18,190 20,720 2,206,340 2,685,591
1,271,809 175,501 670,673 17,829 21,812 2,221,628 2,839,581
1,283,560 172,223 673,876 17,151 23,323 2,175,993 3,125,017
1,300,033 168,788 679,216 16,849 24,380 2,194,068 3,143,122
1,328,008 164,068 693,680 15,764 24,535 2,199,081 3,266,973
retail broadband ConneCtions by tyPe oF inFrastruCture (Page 56)
Copper-wire pairs
Unbundled lines Coaxial cable FWA (fixed
wireless access)FTTH (fibre to
the home)Mobile
broadbandSmartphone
tariffs
Number of connections
Q1
Q2
Q3
Q4
Q1
Q2
Q3
Q4
2013
2013
Q1
Q2
Q3
Q4
Q1
Q2
Q3
Q4
2012
2013
1,070,447 142,865 641,026 18,784 9,100 1,905,693 1,803,611
1,069,119 141,434 622,758 17,777 9,441 1,869,635 1,981,541
1,085,150 139,752 631,421 16,907 10,079 1,924,943 2,156,420
1,099,744 137,077 644,507 16,397 10,149 1,964,911 2,410,938
1,120,387 132,969 660,041 16,033 11,047 1,974,606 2,554,935
1,132,368 130,412 662,216 15,353 11,644 1,914,988 2,816,408
1,149,703 127,040 666,476 15,042 11,714 1,939,149 2,831,370
1,177,329 123,509 673,184 13,943 11,736 1,939,576 2,943,431
retail broadband ConneCtions by tyPe oF inFrastruCture – residential Customers
Copper-wire pairs
Unbundled lines Coaxial cable FWA (fixed
wireless access)FTTH (fibre to
the home)Mobile
broadbandSmartphone
tariffs
Number of connections (retail customers)

RTR Telekom Monitor Annual Review 2013
654 | bRoaDbanD
Q1
Q2
Q3
Q4
Q1
Q2
Q3
Q4
2013
2013
Q1
Q2
Q3
Q4
Q1
Q2
Q3
Q4
2012
2013
154,044 44,971 9,897 1,790 7,430 180,158 231,018
152,513 44,390 10,059 1,787 7,811 229,335 234,392
153,375 44,177 10,189 1,798 10,016 234,631 258,708
151,913 43,760 10,284 1,793 10,571 241,429 274,653
151,422 42,532 10,632 1,796 10,765 247,022 284,646
151,192 41,810 11,660 1,797 11,679 261,005 308,609
150,330 41,747 12,740 1,807 12,666 254,919 311,752
150,679 40,560 20,496 1,821 12,799 259,505 323,542
retail broadband ConneCtions by tyPe oF inFrastruCture – business Customers
Copper-wire pairs
Unbundled lines Coaxial cable FWA (fixed
wireless access)FTTH (fibre to
the home)Mobile
broadbandSmartphone
tariffs
Number of connections (business customers)
Q1
Q2
Q3
Q4
Q1
Q2
Q3
Q4
Q1
Q2
Q3
Q4
Q1
Q2
Q3
Q4
2013
2013
2012
2013
25,614 281,158 1,034,586 566,717 158,580 33,700
23,422 272,609 1,018,469 576,992 153,369 32,228
21,791 266,500 1,028,281 582,842 169,684 33,768
19,738 260,377 1,032,168 589,068 189,932 34,910
18,140 253,339 1,034,440 608,865 206,698 36,142
15,918 243,715 1,025,871 622,256 225,038 37,335
14,170 236,547 991,926 654,081 252,772 39,769
13,081 220,232 1,002,806 676,655 273,202 40,080
retail broadband ConneCtions by bandWidth Category – Fixed netWork (Page 57)
>= 144 kbit/sto < 2 Mbit/s = 2 Mbit/s > 2 Mibt/s
to < 10 Mbit/s>= 10 Mbit/s
to < 30 Mbit/s>= 30 Mbit/s
to < 100 Mbit/s >= 100 Mbit/s
Number of connections
Q1
Q2
Q3
Q4
Q1
Q2
Q3
Q4
Q1
Q2
Q3
Q4
Q1
Q2
Q3
Q4
2013
2013
2012
2013
455,080 1,105,550 410,722 45,221 3,766
464,341 1,105,020 412,508 45,705 3,767
410,877 1,115,516 417,512 44,389 68,278
423,599 1,123,949 426,958 41,139 64,864
403,711 1,065,348 496,242 96,385 49,773
405,382 1,065,812 503,401 100,762 47,791
418,531 1,071,069 509,564 103,390 45,262
447,589 1,071,823 517,104 111,444 42,964
number oF retail broadband ConneCtions – Fixed netWork (Page 58)
Broadband (stand-alone) Broadband + fixed-line telephony
Broadband + fixed-line telephony + TV Broadband + TV
Other bundles with fixed-line telephony,
TV or mobile broadband
Number of connections

RTR Telekom Monitor Annual Review 2013
664 | bRoaDbanD
Q1
Q2
Q3
Q4
Q1
Q2
Q3
Q4
Q1
Q2
Q3
Q4
Q1
Q2
Q3
Q4
2013
2013
2012
2013
51,395,971 79,534,260 37,086,849 4,542,493 439,926
52,006,198 82,274,891 42,433,558 5,447,344 318,463
49,897,886 83,470,879 42,580,682 5,111,059 4,106,514
49,716,726 84,316,836 42,484,725 4,747,697 5,687,553
49,184,069 80,165,874 49,224,907 9,267,349 3,023,805
48,126,225 79,782,919 49,993,725 9,816,964 3,005,555
47,851,077 79,403,452 50,561,245 9,786,820 2,825,119
49,338,686 79,020,554 50,777,375 10,262,134 2,724,955
revenues From retail broadband ConneCtions – Fixed netWork (Page 59)
Broadband (stand-alone) Broadband + fixed-line telephony
Broadband + fixed-line telephony + TV Broadband + TV
Other bundles with fixed-line telephony,
TV or mobile broadband
EUR
Q1
Q2
Q3
Q4
Q1
Q2
Q3
Q4
Q1
Q2
Q3
Q4
2011
2012
2013
44,629 4,509 12,381 1,182 2,848 51,183
43,965 4,105 12,347 1,182 3,023 50,867
42,805 3,924 12,326 1,182 3,145 166,755
42,416 3,661 12,565 1,182 3,500 13,839
41,911 7,625 11,880 976 6,059 1,487
41,946 7,460 11,927 969 6,187 1,487
41,865 7,405 11,977 970 6,483 1,484
41,326 7,359 11,849 966 6,527 1,482
41,294 7,491 12,051 976 6,372 1,545
40,711 7,194 12,457 977 6,402 1,544
40,008 7,522 9,968 987 6,441 1,535
40,105 7,209 10,177 990 6,248 1,550
number oF Wholesale broadband ConneCtions (Page 61)
Copper-wire pairs Unbundled lines Coaxial cable FWA (fixed wireless access)
FTTH (fibre to the home)
Others (satellite etc.)
Number of connections
Q1
Q2
Q3
Q4
Q1
Q2
Q3
Q4
Q1
Q2
Q3
Q4
Q1
Q2
Q3
Q4
2013
2013
2012
2013
41,882 5,640 8,396 953 6,049
41,917 5,513 8,490 946 6,176
41,836 5,431 8,548 947 6,450
41,297 5,311 8,417 943 6,494
41,265 4,930 8,563 953 6,360
40,682 4,762 11,257 954 6,390
39,979 4,665 8,754 964 6,428
40,076 4,266 8,937 967 6,239
number oF Wholesale broadband ConneCtions – bitstream
Copper-wire pairs Unbundles lines Coaxial cable FWA (fixed wireless access)
FTTH (fibre to the home)
Number of connections

RTR Telekom Monitor Annual Review 2013
674 | bRoaDbanD
Q1
Q2
Q3
Q4
Q1
Q2
Q3
Q4
Q1
Q2
Q3
Q4
Q1
Q2
Q3
Q4
2013
2013
2012
2013
29 1,985 3,484 23 10
29 1,947 3,437 23 11
29 1,974 3,429 23 33
29 2,047 3,432 23 33
29 2,561 3,488 23 12
29 2,432 1,200 23 12
29 2,857 1,214 23 13
29 2,943 1,240 23 9
number oF Wholesale broadband ConneCtions – resale
Copper-wire pairs Unbundles lines Coaxial cable FWA (fixed wireless access)
FTTH (fibre to the home)
Number of connections
Q1
Q2
Q3
Q4
Q1
Q2
Q3
Q4
Q1
Q2
Q3
Q4
Q1
Q2
Q3
Q4
2012
2013
2013
2013
number oF retail Fixed broadband ConneCtions by Customer tyPe
1,821,974 198,365 2,020,339
1,834,553 196,787 2,031,340
1,858,323 198,248 2,056,572
1,883,878 196,631 2,080,509
1,916,513 194,946 2,111,459
1,929,449 193,699 2,123,148
1,953,344 194,473 2,147,817
1,996,810 194,114 2,190,924
Number of connections
Residential customers Business customers Total
Q1
Q2
Q3
Q4
Q1
Q2
Q3
Q4
Q1
Q2
Q3
Q4
2011
2012
2013
4,195,355
4,130,218
4,223,692
4,291,888
2,652,488 1,360,357
2,604,514 1,477,810
2,647,682 1,699,153
2,662,623 1,730,020
2,508,790 1,079,161
2,510,536 1,129,467
2,492,150 839,226
2,555,061 886,678
Bitstream und resale Bitstream Resale
EUR
revenues From Wholesale broadband ConneCtions (Page 62)

RTR Telekom Monitor Annual Review 2013
684 | bRoaDbanD
Q1
Q2
Q3
Q4
Q1
Q2
Q3
Q4
Q1
Q2
Q3
Q4
Q1
Q2
Q3
Q4
2012
2013
2013
2013
138,006,483 34,993,016 172,999,499
146,830,712 35,649,742 182,480,454
148,580,912 36,586,109 185,167,020
150,228,748 36,724,791 186,953,539
154,498,877 36,367,127 190,866,004
154,464,911 36,260,478 190,725,389
154,281,840 36,145,872 190,427,712
156,202,427 35,921,276 192,123,703
revenues From retail Fixed broadband ConneCtions by Customer tyPe
Residential customers Business customers Total
EUR
RTR Telekom Monitor Annual Review 2013
695 | CoMPaRIsons aCRoss seCToRs
5 Comparisons across sectors

RTR Telekom Monitor Annual Review 2013
705 | CoMPaRIsons aCRoss seCToRs
Revenues from fixed, mobile, broadband and leased line services
annUal ReVenUes of TeleKoM Down on 2012 by soMe 7%
The chart includes revenues from the following categories:
fixed network (voice telephony): Retail revenues from residential and business customers (except for bundles with broadband) as well as public pay phones (phone booths), wholesale revenues, revenues from additional services, other fees and remuneration pursuant to the Telecommunications Fee Subsidies Act;
Mobile communications: Retail revenues from periodic base fees, activation charges, connection charges and data services, remuneration pursuant to the Telecommunications Fee Subsidies Act, wholesale revenues from terminati-on, origination, international roaming, national roaming, sale of airtime to resellers (see Glossary);
broadband (fixed network): Retail revenues (including revenues from products bundled with broadband) and whole-sale revenues from setup charges, ongoing charges and volume-based charges;
leased lines: Retail revenues from periodic base fees and setup charges for domestic retail leased lines, wholesale revenues from terminating segments and trunk segments (see Glossary).
■■ In 2013, total revenues in the telecommunications sector amounted to EUR 4.160 billion, which is a decline of 6.5% compared with 2012.
■■ As in previous years, the largest share (62.7%) was again generated from mobile services, with reve-nues of some EUR 2.607 billion.
■■ The second largest proportion of revenues (18.7%) was accounted for by broadband revenues includ-ing, however, periodic base fees for bundled products that comprise, for example, also fixed-network or TV services. Altogether, broadband revenues amounted to EUR 778.1 million in 2013.
■■ Fixed-line voice telephony generated revenues of EUR 613.0 million, i.e. 14.7% of total revenues.■■ Revenues from leased lines amounted to some EUR 162.0 million, about 3.9% of annual revenues in
the telecommunications sector.
718.
3
714.
6
715.
9
692.
7
663.
5
659.
6
623.
4
660.
3
177.
0
186.
6
189.
5
191.
3
194.
5
194.
4
195.
6
193.
8
41.9
41.3
42.6
42.4
40.6
40.8
40.640
.1
188.
4
172.
3
167.
5
169.
1
161.
5
154.
4
149.
3
147.
8
1,400
1,200
1,000
800
600
400
200
0Q1
2012Q2
2012Q3
2012Q4
2012Q1
2013Q2
2013Q4
2013Q3
2013
Reve
nues
(EUR
mill
ions
)
<4>
Leased linesBroadbandMobile communicationsFixed network (voice telephony)

RTR Telekom Monitor Annual Review 2013
715 | CoMPaRIsons aCRoss seCToRs
Real minutes in fixed and mobile networksMobIle MInUTes aCCoUnT foR 85% of all Call MInUTes In 2013
The chart above shows the number of real minutes (in million) in the following segments:
Mobile communications: Call minutes to the domestic fixed network, domestic mobile networks, international num-bers, service numbers and directory assistance services;
fixed network: Call minutes to the domestic fixed network, domestic mobile networks, international numbers, ser-vice numbers and directory assistance services.
■■ In 2013, the total number of call minutes in fixed and mobile networks amounted to 26.382 billion minutes, down 2.5% on 2012.
■■ As in previous years, customers clearly preferred mobile communications: in 2013, mobile calls accounted for 85.3% of all minutes (22.514 billion). Compared to 84.4% in 2012, this tendency is still slightly on the rise.
■■ Total call minutes in the fixed network declined by 8.7% on the previous year. In 2013, calls amounting to 3.868 billion minutes were made from fixed networks, i.e. 14.7% of total call minutes.
1,32
3
1,21
5
1,15
8
1,18
5
1,15
3
1,04
0
994
1,04
9
1,02
1
972
929
946
5,55
8
5,55
7
5,36
5
5,70
6
5,78
8
5,73
5
5,53
8
5,77
1
5,71
2
5,73
3
5,43
2
5,63
7
8,000
7,000
6,000
5,000
4,000
3,000
2,000
1,000
0Q1
2011Q2
2011Q3
2011Q4
2011Q1
2012Q2
2012Q3
2012Q4
2012Q1
2013Q2
2013Q3
2013Q4
2013
Min
utes
(mill
ions
)
Call minutes / mobile communicationsCall minutes / fixed network (excl. online minutes)

RTR Telekom Monitor Annual Review 2013
725 | CoMPaRIsons aCRoss seCToRs

RTR Telekom Monitor Annual Review 2013
736 | bUsIness InDICaToRs
6 Business indicators

RTR Telekom Monitor Annual Review 2013
746 | bUsIness InDICaToRs
InvestmentsTwo-bIllIon InVesTMenT In fReQUenCIes foR The nexT 20 yeaRs
The chart above shows the development of investments in frequencies, technical infrastructure as well as sales and customer service on an annual basis. In this context, it is important to note that the values reported here are partly based on estimates and extrapolations from individual quarters for entire years. As a result, the exact figure for total investments cannot be calculated reliably.
The investment volumes shown above only include those investments made directly by telecommunications enter-prises. They do not include investments by upstream or downstream industry sectors.
■■ The year 2013 was characterised by the multiband auction in which frequencies from the 800 MHz (digital dividend), 900 MHZ and 1800 MHz frequency ranges were allocated. The objective of this auction was above all to pave the way for new technologies such as LTE. Frequency allocation took the form of a combinatorial clock auction, a procedure already used in the allocation of 2.6 GHz frequencies. The procedure was completed with final effect in November 2013 when the decisions were executed and generated auction proceeds of about EUR 2.014 billion for the Republic of Austria. Two enterprises filed complaints to the Austrian Constitutional Court (VfGH) and the Austrian Admi-nistrative Court (VwGH) against the TKK frequency decision. The VfGH assigned the complaint to the VwGH, the decision by the VwGH was still pending when the RTR Telecom Monitor was prepared.
■■ This auction is expected to prompt further investments in sales and technical infrastructure in the next few years. In the field of sales and customer service, investments already increased in 2013 by 91.5% to EUR 14.6 million. Even though investments in technical infrastructure experienced a decline of 8.5% to EUR 497.0 million compared with 2012, a major investment boost is expected to occur in the years to come.
2.6
13.0
5.8 6.3 48
.5
6.4 2,01
6.8
6.4
15.7 19
.5
13.7
8.7
7.9
11.4
14.6
7.6
743.
8 859.
7
686.
4
510.
1 640.
4
494.
2
542.
9
497.
0
Inve
stm
ents
(EUR
mill
ions
)
3,000
2,500
2,000
1,500
1,000
500
02006 2007 2008 2009 2010 2011 20132012
Frequencies Technical infrastructure Sales and customer service

RTR Telekom Monitor Annual Review 2013
756 | bUsIness InDICaToRs
Employees in the telecommunications sectorConTInUInG DeClIne In The nUMbeR of eMPloyees
The chart above shows the number of employees in the telecommunications sector, broken down into internal em-ployees, leased employees and freelancers, and expressed in terms of full-time equivalents.
When interpreting these figures, please note that they only include staff employed directly by telecommunications enterprises. The figures do not include employees in supplier industries, external call-centre employees or out-sourced positions.
■■ The number of employees in the telecommunications sector is continuously declining over time. At the end of 2013, the total number of employees was about 14,650, down 3.4% on the previous year.
■■ Of all persons employed in this sector, permanent employees accounted for 91.0%; the share of leased employees was 9.0%.
14,4
60
14,1
40
14,0
60
13,9
80
14,1
70
14,1
10
14,0
80
13,8
70
13,9
40
13,8
70
13,6
50
13,3
30
1,57
0
1,55
0
1,61
0
1,60
0
1,66
0
1,37
0
1,28
0
1,30
0
1,32
0
1,30
0
1,38
0
1,32
0
Num
ber o
f em
ploy
ees
18,000
16,000
14,000
12,000
10,000
8,000
6,000
4,000
2,000
0Q1
2011Q2
2011Q3
2011Q4
2011Q1
2012Q2
2012Q3
2012Q4
2012Q1
2013Q2
2013Q3
2013Q4
2013
Leased employees and freelancersInternal employees
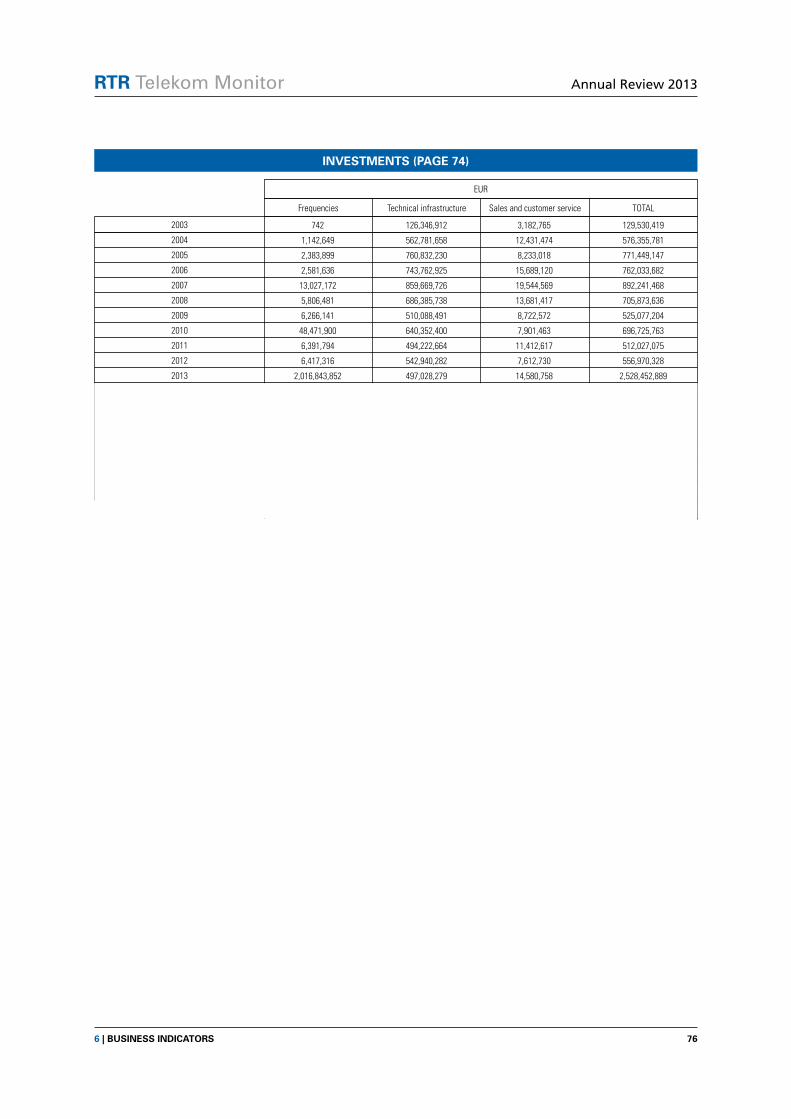
RTR Telekom Monitor Annual Review 2013
766 | bUsIness InDICaToRs
Data tables
2003
2004
2005
2006
2007
2008
2009
2010
2011
2012
2013
742 126,346,912 3,182,765 129,530,419
1,142,649 562,781,658 12,431,474 576,355,781
2,383,899 760,832,230 8,233,018 771,449,147
2,581,636 743,762,925 15,689,120 762,033,682
13,027,172 859,669,726 19,544,569 892,241,468
5,806,481 686,385,738 13,681,417 705,873,636
6,266,141 510,088,491 8,722,572 525,077,204
48,471,900 640,352,400 7,901,463 696,725,763
6,391,794 494,222,664 11,412,617 512,027,075
6,417,316 542,940,282 7,612,730 556,970,328
2,016,843,852 497,028,279 14,580,758 2,528,452,889
investments (Page 74)
Frequencies Technical infrastructure Sales and customer service TOTAL
EUR

RTR Telekom Monitor Annual Review 2013
777 | InTeRnaTIonal CoMPaRIsons
7 International comparisons
This section contains several comparisons of European mobile and broadband services data. The statistics given here are an extended and more in-depth analysis of the data on the Austrian market discussed in Sections 1 to 6. The data presented in this section are taken mainly from the Digital Agenda Scoreboard of the European Commission. It contains a series of indicators charting the progress made in achieving the goals of the Digital Agenda of the European Commission.
All other graphics in this section show the latest available figures. Regularly updated data and the option to create interactive charts can be found on the website of the Digi-tal Agenda (http://ec.europa.eu/digital-agenda/en/scoreboard).

RTR Telekom Monitor Annual Review 2013
787 | InTeRnaTIonal CoMPaRIsons
Mobile penetration rate (2011 to 2012)MoRe sIM CaRDs Than InhabITanTs In all eU CoUnTRIes
Source: RTR, European Commission – Digital Agenda Scoreboard
The chart above provides an international comparison of mobile penetration rates (as of January 2011 and January 2012). The penetration rate shown here is based on the number of SIM cards per 100 inhabitants.
The data underlying this chart can be found at the end of the section.
■■ At 156%, the mobile penetration rate in Austria in January 2012 was well above the EU average.■■ In 2012, for the first time there were more SIM cards than inhabitants in all European countries, which
is an average penetration rate of 130%.■■ In 2012, Latvia was top of the league with a penetration rate of 190%, thus outperforming the long-
time leader Finland. The lowest penetration rate (106%) in 2012 was found in France.
Mobile penetration 2012 (based on population)Mobile penetration 2011 (based on population)
Latv
ia
Finl
and
Lith
uani
a
Italy
Bulg
aria
Portu
gal
Aust
ria
Denm
ark
Esto
nia
Luxe
mbo
urg
Swed
en
Unite
d King
dom
Mal
ta
Cypr
us
Pola
nd EU
Czec
h Rep
ublic
Germ
any
Spai
n
Net
herla
nds
Irela
nd
Belg
ium
Gree
ce
Slov
akia
Hung
ary
Slov
enia
Rom
ania
Fran
ce
Pene
tratio
n ra
te (%
)
200
180
160
140
120
100
80
60
40
20
0

RTR Telekom Monitor Annual Review 2013
797 | InTeRnaTIonal CoMPaRIsons
Interconnection charges for termination in mobile networks
aUsTRIa below eU aVeRaGe
Source: European Commission – Digital Agenda Scoreboard; BEREC – Integrated Report on Mobile Termination Rates & SMS Termination Rates
The chart above provides an international comparison of mobile termination charges. Telecommunications service providers charge each other (at the wholesale level) for termination services, that is, the routing of incoming calls to their mobile networks.
The data underlying this chart can be found at the end of the section.
■■ In mid-2013, interconnection charges for termination in mobile networks in Austria were 2.01 euro cents, as in the previous year. The unweighted EU average was 2.22 euro cents (as compared to 3.57 euro cents in the previous year), the weighted value was 1.46 euro cents per minute. Thus, termina-tion charges were slightly below the EU average.
■■ In 2013, as in previous years, Luxemburg was the country with the highest termination charges, this time followed by Slovenia and Slovakia.
■■ In general, between July 2012 and July 2013, in many EU countries termination charges were again reduced, in some cases sharply, due to the implementation of the Recommendation on Termination Rates.
EU average in July 2013 (= 2.22 EUR cents)July 2012 July 2013
Luxe
mbo
urg
Slov
enia
Slov
akia
Rom
ania
Finl
and
Net
herla
nds
Hung
ary
Mal
ta
Aust
ria
Germ
any
Cypr
us
Latv
ia
Esto
nia
Portu
gal
Gree
ce
Belg
ium
Bulg
aria
Spai
n
Denm
ark
Swed
en
Czec
h Rep
ublic
Lith
uani
a
Irela
nd
Pola
nd
Unite
d King
dom
Italy
Fran
ce
Inte
rcon
nect
ion
char
ges
(EUR
cen
ts)
9
8
7
6
5
4
3
2
1
0
<4>

RTR Telekom Monitor Annual Review 2013
807 | InTeRnaTIonal CoMPaRIsons
Average retail roaming rates for calls within EU/EEACalls In The eU/eea aRea GeTTInG sTeaDIly CheaPeR
Source: RTR
The chart above shows the average retail roaming rates (excluding VAT) charged to Austrian subscribers for incom-ing and outgoing calls while roaming within the EU/EEA and the price caps prescribed by the Roaming Regulation.
■■ Roaming charges continue to decline in Austria. At the end of Q3 2013, the average cost was EUR 0.20 for outgoing calls and EUR 0.09 for incoming calls.
■■ This means average retail roaming rates for outgoing calls within the EU/EEA were well below the maximum permitted under the Roaming Regulation (EUR 0.24 since Q3 2013); for incoming calls they were EUR 0.02 above the prescribed cap of EUR 0.07.
■■ The price cap for incoming calls is exceeded because subscribers may choose a roaming tariff that, in contrast to the Eurotariff to be provided by each mobile network operator, is not subject to any price regulation. However, the prescribed limits are complied with, according to the statutory regulations.
0.27
0.28
0.29
0.28
0.27
0.26
0.26
0.26
0.23
0.23
0.22
0.20
0.13
0.12
0.13
0.12
0.10
0.10
0.10
0.09
0.08
0.07
0.09
0.09
0.39
0.15 0.15 0.15
0.11 0.11 0.11 0.11
0.08 0.08 0.08
0.39 0.39
0.35 0.35 0.35 0.35
0.29 0.29 0.29 0.29
0.24
0,08 0.07
Incoming callsOutgoing calls Price cap for incoming callsPrice cap for outgoing calls
Roam
ing
char
ges
(EUR
)
0.45
0.40
0.35
0.30
0.25
0.20
0.15
0.10
0.05
0.00Q4
2010Q1
2011Q2
2011Q3
2011Q4
2011Q1
2012Q2
2012Q3
2012Q4
2012Q1
2013Q2
2013Q3
2013

RTR Telekom Monitor Annual Review 2013
817 | InTeRnaTIonal CoMPaRIsons
Average retail SMS roaming charges within the EU/EEA
eURoTaRIff sMs well below PRICe CaP
Source: RTR, ERG/BEREC International Roaming Benchmark Data Reports
The chart above shows the average amount (excluding VAT) charged to Austrian and EU/EEA subscribers for sending a text message (SMS) within the EU/EEA, as well as the price cap applicable to roaming text messages since the Roaming Regulation was expanded in the summer of 2009.
■■ In the summer of 2009, price caps were imposed also on roaming text messages by regulation; in the summer of 2013, they were last reduced to EUR 0.08.
■■ In Q3 2013, Austrian subscribers paid EUR 0.07 on average for one roaming text message according to the Eurotariff (scope of application of the Roaming Regulation).
■■ If a subscriber chose a tariff other than the Eurotariff, the average costs for a roaming text message were almost double (EUR 0.13).
0.14
0.19
0.18
0.18
0.18
0.15
0.16
0.11
0.10
0.10
0.14
0.13
0.11
0.10
0.10
0.10
0.10
0.09
0.09
0.07
0.07
0.07
0.07
0.07
EurotariffNon-Eurotariff Price cap
Roam
ing
char
ges
(EUR
)
0.20
0.18
0.16
0.14
0.12
0.10
0.08
0.06
0.04
0.02
0.00Q4
2010Q1
2011Q2
2011Q3
2011Q4
2011Q1
2012Q2
2012Q3
2012Q4
2012Q1
2013Q2
2013Q3
2013

RTR Telekom Monitor Annual Review 2013
827 | InTeRnaTIonal CoMPaRIsons
Average retail data roaming rates within the EU/EEA (per megabyte)
DaTa RoaMInG: fallInG ChaRGes, InCReasInG VolUMe
Source: RTR
The chart above shows the average charges per megabyte (excluding VAT) for data roaming within the EU/EEA. A statutory price cap for data roaming came into force on 1 July 2012 (EUR 0.70 maximum excluding VAT per mega-byte transmitted). On 1 July 2013 the price cap was lowered to EUR 0.45 (excluding VAT).
■■ The charges for data roaming have fallen continuously in recent years. In Q3 2013, Austrian sub-scribers paid EUR 0.06 per megabyte for data roaming.
■■ The calculation of the average roaming charge per megabyte also captures tariffs not subject to price regulation; therefore, the stipulated price cap is exceeded for the average price. However, the pre-scribed limits are complied with, according to the statutory regulations.
■■ In recent years, the data volume used abroad has increased considerably. Since the beginning of the time period depicted above, the data volume has increased almost ninefold.
0.25
0.22
0.26
0.25
0.15
0.13
0.15
0.10
0.06
0.05
0.06
0.06
160,000
140,000
120,000
100,000
80,000
60,000
40,000
20,000
0
Price per megabyte (EUR) Data volume (gigabytes)
Ang
aben
in E
uro
0.30
0.25
0.20
0.15
0.10
0.05
0.00Q4
2010Q1
2011Q2
2011Q3
2011Q4
2011Q1
2012Q2
2012Q3
2012Q4
2012Q1
2013Q2
2013Q3
2013

RTR Telekom Monitor Annual Review 2013
837 | InTeRnaTIonal CoMPaRIsons
Fixed broadband penetrationeVeRy foURTh aUsTRIan has fIxeD bRoaDbanD aCCess
Source: European Commission – Digital Agenda Scoreboard, Broadband
The chart above provides an international comparison of broadband penetration rates based on fixed infrastructure such as DSL, coaxial cable, unbundled line (see Glossary), wireless etc. (as of January 2013). The penetration rate is calculated from the number of broadband connections per 100 inhabitants. Mobile broadband connections are not included in these figures.
■■ In January 2013, Austria showed a fixed broadband penetration (in percent of the population) of 24.7%, which means that almost every fourth Austrian had fixed broadband access.
■■ The EU average at the beginning of 2013 was 28.8%; this put Austria just below the average for fixed broadband.
■■ In 2013, the highest density of fixed broadband connections was reported in the Netherlands (40.2%), closely followed by Denmark (39.8%).
■■ Relatively few fixed broadband connections in relation to the number of inhabitants were found in Romania (16.6%) and Poland (18.8%).
<4>
40.2
39.8
36.7
34.2
33.6
33.4
32.7
32.6
32.6
30.6
28.8
27.2
25.8
25.7
25.6
25.3
24.8
24.7
24.6
23.8
23.1
22.9
22.9
22.5
19.3
19.0
18.8
16.6
Fixed broadband penetration 2013 (based on population)
Net
herla
nds
Denm
ark
Fran
ce
Germ
any
Unite
d King
dom
Belg
ium
Swed
en
Mal
ta
Luxe
mbo
urg
Finl
and
EU
Esto
nia
Slov
enia
Lith
uani
a
Cypr
us
Czec
h Rep
ublic
Spai
n
Aust
ria
Irela
nd
Gree
ce
Latv
ia
Hung
ary
Portu
gal
Italy
Slov
akia
Bulg
aria
Pola
nd
Rom
ania
Pene
tratio
n ra
te (%
)
45
40
35
30
25
20
15
10
5
0

RTR Telekom Monitor Annual Review 2013
847 | InTeRnaTIonal CoMPaRIsons
Mobile broadband penetration aUsTRIa sTIll aMonG The fRonTRUnneRs
Source: European Commission – Digital Agenda Scoreboard, Broadband
The chart provides an international comparison of mobile broadband penetration rates (as of January 2013). The penetration rate is calculated from the number of mobile broadband connections (pure data tariffs) per 100 inhab-itants. Broadband connections on fixed infrastructure (such as DSL, coaxial cable etc.) are not included in these figures.
■■ While Austria is just below the EU average with regard to the density of fixed broadband connections, the penetration rate for mobile broadband is well above the EU average of 9.0%.
■■ 17.1% of Austrians had mobile broadband access in 2013. Only Finland, Sweden and Denmark had a higher density of mobile broadband connections.
■■ Mobile broadband penetration rates were lowest in Slovenia and Greece with only about three mobile broadband connections per 100 inhabitants.
<4>
5.4
5.4
5.2
5.0
4.3
4.3
3.6
2.7
12.4
17.1
70.9
22.3
18.4
15.5
14.3
11.1
10.1
9.2
9.0
8.6
8.0
7.7
7.4
7.2
7.1
6.7
6.3
6.1
Mobile broadband penetration 2013 (based on population)
Finl
and
Swed
en
Denm
ark
Aust
ria
Esto
nia
Italy
Irela
nd
Bulg
aria
Pola
nd
Portu
gal
EU
Lith
uani
a
Unite
d King
dom
Slov
akia
Latv
ia
Luxe
mbo
urg
Net
herla
nds
Germ
any
Rom
ania
Czec
h Rep
ublic
Spai
n
Hung
ary
Fran
ce
Mal
ta
Belg
ium
Cypr
us
Gree
ce
Slov
enia
Pene
tratio
n ra
te (%
)
80
70
60
50
40
30
20
10
0

RTR Telekom Monitor Annual Review 2013
857 | InTeRnaTIonal CoMPaRIsons
Incumbent operator’s share of broadband market aUsTRIan InCUMbenT has a MaRKeT shaRe of 59%
Source: European Commission – Digital Agenda Scoreboard, Electronic Communications Market Indicators
The chart above shows the market shares of the retail broadband market held by national incumbent operators (for-mer monopoly operators) (as of January 2013). It only includes broadband connections based on fixed infrastructure (e.g. DSL, coaxial cable etc.). Mobile broadband connections are not included.
■■ Not including mobile broadband connections, the market leader and incumbent operator A1 Telekom Austria AG had a market share of 59% in Austria in January 2013.
■■ In four EU countries, the incumbent’s market share was greater: in Estonia, Denmark, Cyprus and Luxemburg.
■■ The lowest market shares of the incumbent were reported in Bulgaria, Poland and Romania (below 30%) at the beginning of 2013.
<4>
71 68 61 60 59 55 51 51 50 50 49 45 44 43 43 42 42 42 41 39 38 38 33 31 29 28 23
Market share January 2013
Luxe
mbo
urg
Cypr
us
Denm
ark
Esto
nia
Aust
ria
Latv
ia
Italy
Portu
gal
Lith
uani
a
Mal
ta
Spai
n
Germ
any
Belg
ium
Gree
ce
Hung
ary
EU
Net
herla
nds
Irela
nd
Fran
ce
Slov
enia
Slov
akia
Swed
en
Czec
h Rep
ublic
Unite
d King
dom
Rom
ania
Pola
nd
Bulg
aria
Mar
ket s
hare
(%)
80
70
60
50
40
30
20
10
0

RTR Telekom Monitor Annual Review 2013
867 | InTeRnaTIonal CoMPaRIsons
Broadband connections by bandwidth banDwIDTh DIsTRIbUTIon In eU CoUnTRIes VaRIes wIDely
Source: RTR, European Commission – Digital Agenda Scoreboard, Electronic Communications Market Indicators
The chart above gives an international comparison of the different bandwidths of broadband connections (as of January 2013).
The data underlying this chart can be found at the end of the section.
■■ At the beginning of 2013, only 3.9% of fixed broadband connections still fell into the bandwidth cate-gory of less than 2 Mbit/s in the EU on average. At the same time, in Austria fixed broadband connec-tions stood at only 1.4%.
■■ Across the EU, 37.1% of connections were attributable to the medium bandwidth category (2 Mbit/s to less than 10 Mbit/s), in Austria this figure was at 54.7%, i.e. more than half of the connections fell into this category. Thus, in January 2013, the number of broadband connections with a capacity of less than 10 Mbit/s was above average in Austria.
■■ On average across all EU countries, 59.0% of fixed broadband connections fell into the category of 10 Mbit/s and greater. In this category, Austria is still below average, only 43.9% of connections were attributable to the highest bandwidth category.
<4>
71 68 61 60 59 55 51 51 50 50 49 45 44 43 43 42 42 42 41 39 38 38 33 31 29 28
10 Mbit/s and above2 Mbit/s and above and below 10 Mbit/sAbove 144 Kbit/s and below 2 Mbit/s
Bulg
aria
Fran
ce
Portu
gal
Belg
ium
Unite
d King
dom
Denm
ark
Mal
ta
Rom
ania
Net
herla
nds
Swed
en
Latv
ia
Hung
ary
Finl
and
EU
Gree
ce
Lith
uani
a
Spai
n
Czec
h Rep
ublic
Aust
ria
Luxe
mbo
urg
Germ
any
Slov
akia
Slov
enia
Pola
nd
Irela
nd
Esto
nia
Italy
Cypr
us
Shar
e (%
)
100
90
80
70
60
50
40
30
20
10
0

RTR Telekom Monitor Annual Review 2013
877 | InTeRnaTIonal CoMPaRIsons
Data tablesPenetration rate 2012Penetration rate 2011
in %
mobile Penetration 2011 to 2012 (Page 78)
Country
Latvia
Finland
Lithuania
Italy
Bulgaria
Portugal
Austria
Denmark
Estonia
Luxembourg
Sweden
United Kingdom
Malta
Cyprus
Poland
EU
Czech Republic
Germany
Spain
Netherlands
Ireland
Belgium
Greece
Slovakia
Hungary
Slovenia
Romania
France
190%
169%
165%
160%
160%
158%
156%
152%
148%
146%
144%
138%
132%
131%
131%
130%
125%
124%
124%
123%
120%
119%
118%
115%
110%
107%
106%
106%
170%
163%
161%
158%
147%
157%
151%
147%
134%
143%
138%
136%
126%
130%
119%
127%
129%
121%
126%
125%
114%
114%
110%
112%
110%
106%
110%
100%

RTR Telekom Monitor Annual Review 2013
887 | InTeRnaTIonal CoMPaRIsons
Country
8.55
3.24
3.18
3.07
2.80
2.40
2.39
2.07
2.01
1.85
1.73
1.57
1.29
1.27
1.27
1.18
1.18
1.09
1.07
1.05
1.05
1.04
1.04
1.02
1.00
0.98
0.80
8.53
3.57
3.18
4.05
3.82
2.70
3.22
4.18
2.01
3.37
1.76
3.70
6.32
2.27
4.95
2.80
6.36
3.46
3.09
1.70
4.27
1.82
4.15
3.09
1.85
2.60
1.00
Luxembourg
Slovenia
Slovakia
Romania
Finland
Netherlands
Hungary
Malta
Austria
Germany
Cyprus
Latvia
Estonia
Portugal
Greece
Belgium
Bulgaria
Spain
Denmark
Sweden
Czech Republic
Lithuania
Ireland
Poland
United Kingdom
Italy
France
July 2013July 2012
EUR cents
interConneCtion Charges For termination in mobile netWorks (Page 79)

RTR Telekom Monitor Annual Review 2013
897 | InTeRnaTIonal CoMPaRIsons
in %
broadband ConneCtions by bandWidth (Page 86)
≥ 2 Mbit/s to < 10 Mbit/s ≥ 10 Mbit/s> 144 Kbit/s to < 2 Mbit/sCountry
0.4%
2.3%
2.1%
1.1%
0.0%
2.7%
0.2%
2.0%
1.9%
2.6%
3.1%
8.8%
7.3%
3.9%
0.0%
8.5%
2.8%
2.9%
1.4%
0.3%
7.4%
6.4%
16.5%
19.2%
8.0%
27.3%
2.1%
0.3%
Bulgaria
France
Portugal
Belgium
United Kingdom
Denmark
Malta
Romania
Netherlands
Sweden
Latvia
Hungary
Finland
EU
Greece
Lithuania
Spain
Czech Republic
Austria
Luxembourg
Germany
Slovakia
Slovenia
Poland
Ireland
Estonia
Italy
Cyprus
7.4%
8.6%
14.8%
20.3%
21.7%
22.6%
25.3%
24.8%
31.8%
31.1%
33.2%
30.2%
33.0%
37.1%
42.3%
34.4%
43.0%
53.3%
54.7%
57.5%
53.3%
55.7%
47.4%
45.9%
60.6%
50.7%
83.7%
87.7%
92.2%
89.1%
83.1%
78.7%
78.3%
74.7%
74.5%
73.3%
66.3%
66.3%
63.7%
61.0%
59.6%
59.0%
57.7%
57.1%
54.2%
46.6%
43.9%
42.1%
39.3%
37.9%
36.1%
34.9%
31.4%
22.0%
14.2%
12.0%

RTR Telekom Monitor Annual Review 2013
907 | InTeRnaTIonal CoMPaRIsons

RTR Telekom Monitor Annual Review 2013
918 | TeChnoloGy InDICaToRs
8 Technology indicators
Information and communications systems are the pillars of the knowledge society and form the basis for the interaction of industry, politics and society. Technologies driving and underpinning information and communications are therefore increasingly impor-tant. Coupled with this is the need to quantify the developmental levels of societies with respect to the use of information and communications technologies (ICT). The in-tention is to make comparisons between countries, chart developments over time and create the basis for economic and political decision-makers. One method of responding to all these requirements is to map the relevant technology and communications par-ameters in the form of indices.
There are various technology indices used internationally with differing methodologi-cal approaches and emphasis. This section will discuss the main indices and Austria’s performance by international standards.

RTR Telekom Monitor Annual Review 2013
928 | TeChnoloGy InDICaToRs
Computers, Internet access and broadband in households
flaTTenInG of GRowTh
Source: Statistics Austria
This chart shows the percentages of Austrian households with computers, Internet access and a fixed or mobile broadband connection over the years.
■■ While the penetration of households with computers, Internet access and broadband connections showed widely diverging rates a few years ago, they were almost at the same levels at the end of 2013.
■■ In statistical terms, by now every computer used in households (80.9%) is also connected to the Inter-net and virtually all of them (98.6%) are connected via broadband.
■■ With 20% of the population, the proportion of those who seem to persistently refuse computers and the Internet appears to be quite high. At least in the medium term, a certain limit of saturation seems to have been reached, which can be pushed up further only slowly. It remains to be seen if and to what extent new technologies (such as smart TV, i.e. Internet via TV set) will find their way into these household segments, thus giving fresh impetus to Internet penetration.
50.8
58.6
63.1
66.8
70.7
75.9
74.5
76.2
78.1
81.3
80.9
37.4
44.6
46.7
52.3
59.6
68.9
69.8
72.9
75.4
79.3
80.9
10.3
15.9
23.1
33.1
46.1
54.5
57.8
63.7
72.0
77.4
79.8
100
90
80
70
60
50
40
30
20
10
0
Internet accessComputer Broadband connection
Pene
tratio
n ra
tes
(%)
2003 2004 2005 2006 2007 2008 2009 2010 2011 2012 2013

RTR Telekom Monitor Annual Review 2013
938 | TeChnoloGy InDICaToRs
Networked Readiness Index – AustriaaUsTRIa Down by ThRee PlaCes
Source: World Economic Forum, The Global Information Technology Report 2013
The Networked Readiness Index (NRI) of the World Economic Forum is one of the most important indices that mea-sures the extent to which a country is equipped with and uses information and communications technologies. The NRI 2014 depicts the ICT data of 148 countries based on a total of 54 variables.
The coding in the above chart relates the pillars to the superordinate sub-indices. As an example, the code B3 stands for the 3rd pillar (Infrastructure and digital contents) in sub-index B (Readiness).
■■ In the current NRI ranking Austria reaches 22nd position worldwide, slipping three places compared with 2013. However, Austria’s value, on which the ranking is based, increased minimally to 5.26 (out of a maximum of 7). Therefore, Austria’s drop is due to other nations overtaking Austria in the ran-kings.
■■ Another reason why Austria fell in the rankings is that it lost ground in 12 out of 14 indicators. Im-provements were recorded only in the “Affordability” (rank 34) and “Skills” (rank 22) pillars. Austria’s drop is particularly pronounced in the “Business and innovation environment” pillar. Here, Austria only ranks 39th worldwide.
■■ The rankings of the first six nations remain unchanged compared with the previous year. As in the year before, Finland leads the rankings, followed by Singapore and Sweden. In 2014, Hong Kong is the shooting star, climbing from 14th to 8th place. Denmark, which used to head the rankings in the past, lost ground against the top nations again and is now in 13th position, down by five places.
10
11
11
18
20
20
22
22
23
24
24
39
36
34
31
1
2
2
1
1
3
3
1
2
0
1
2
8
-2
-3
B3: Infrastructure and digital content
C7: Business usage
Subindex B: Readiness
A1: Political and regulatory environment
C6: Individual usage
Subindex C: Usage
B5: Skills
Overall ranking
Subindex A: Environment
D9: Economic impacts
Subindex D: Impact
D10: Social impacts
B4: Affordability
C8: Government usage
A2: Business and innovation environment
Austria's 2014 rankings 2013–2014 comparisons for Austria
1 11 21 31 5141 -4 -2 0 2 4 106 8

RTR Telekom Monitor Annual Review 2013
948 | TeChnoloGy InDICaToRs
Global Competitiveness IndexaUsTRIa UnChanGeD aT PlaCe 16
Source: World Economic Forum, Global Competitiveness Report 2013–2014
The World Economic Forum defines competitiveness as the set of institutions, policies and production factors that determine the level of productivity of a country. The level of productivity, in turn, sets the level of prosperity that can be earned by an economy. In other words, the greater a country‘s competitiveness, the more likely it is that it can produce high incomes. Productivity is by definition an input-output ratio, i.e. it is a measure of the best possible output that can be achieved with the existing production factors.
The twelve parameters are measured either by questioning or by observation. The index also takes into account a country‘s level of development. Accordingly, it distinguishes between factor-driven, efficiency-driven and inno-vation-driven economies. Developing countries are among the factor-driven economies, while western industrial nations represent innovation-driven economies.
■■ In the overall ranking for 2013, Austria retains its place in 16th position. In the “Business sophistica-tion” category Austria achieves its best ranking (place 8) even if it dropped two positions compared to 2012. Austria improved by five positions to 13th rank in the “Higher education and training” catego-ry. In the “Innovation” category, Austria is still at 16th place despite falling five places.
■■ There is urgent catching-up demand on individual markets in Austria. In the “Financial market de-velopment”, “Market size” and, in particular, “Labour market efficiency” categories, Austria lost ground significantly, ranking only at around place 40. In the “Labour market efficiency” category, Austria moved down by even ten positions within one year and now takes only 42nd place.
■■ The ranking is headed – as in the previous two years – by Switzerland, followed by Singapore, Finland and Sweden.
-5
-1
-4
2
5
1
0
3
1
4
3
1
10
8
13
15
16
16
19
20
21
23
37
37
37
42
Business sophistication
Higher education and training
Innovation
Infrastructure
Overall ranking
Health and primary education
Technological readiness
Institutions
Goods market efficiency
Macroeconomic environment
Financial market development
Market size
Labour market efficiency
Roa
min
gent
gelte
in E
uro
Austria's 2013 rankings 2012–2013 comparisons for Austria
1 11 21 31 41 51 -6 -4 -2 0 2 4 106 8 12
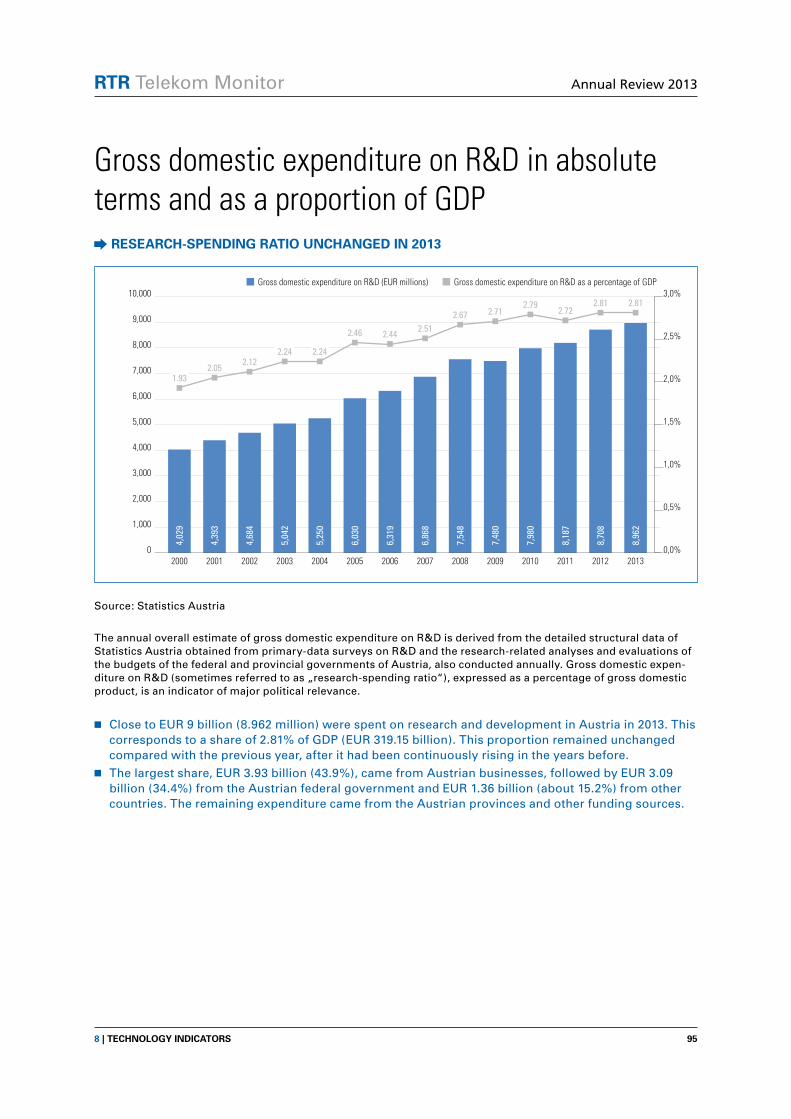
RTR Telekom Monitor Annual Review 2013
958 | TeChnoloGy InDICaToRs
Gross domestic expenditure on R&D in absolute terms and as a proportion of GDP
ReseaRCh-sPenDInG RaTIo UnChanGeD In 2013
Source: Statistics Austria
The annual overall estimate of gross domestic expenditure on R&D is derived from the detailed structural data of Statistics Austria obtained from primary-data surveys on R&D and the research-related analyses and evaluations of the budgets of the federal and provincial governments of Austria, also conducted annually. Gross domestic expen-diture on R&D (sometimes referred to as „research-spending ratio“), expressed as a percentage of gross domestic product, is an indicator of major political relevance.
■■ Close to EUR 9 billion (8.962 million) were spent on research and development in Austria in 2013. This corresponds to a share of 2.81% of GDP (EUR 319.15 billion). This proportion remained unchanged compared with the previous year, after it had been continuously rising in the years before.
■■ The largest share, EUR 3.93 billion (43.9%), came from Austrian businesses, followed by EUR 3.09 billion (34.4%) from the Austrian federal government and EUR 1.36 billion (about 15.2%) from other countries. The remaining expenditure came from the Austrian provinces and other funding sources.
1.932.05
2.122.24 2.24
2.46 2.44 2.512.67 2.71
2.792.72
2.81 2.81
4,02
9
4,39
3
4,68
4
5,04
2
5,25
0
6,03
0
6,31
9
6,86
8
7,54
8
7,48
0
7,98
0
8,18
7
8,70
8
8,96
2
Gross domestic expenditure on R&D (EUR millions) Gross domestic expenditure on R&D as a percentage of GDP3,0%
2,5%
2,0%
1,5%
1,0%
0,5%
0,0%
10,000
9,000
8,000
7,000
6,000
5,000
4,000
3,000
2,000
1,000
02000 20022001 2003 2004 2005 2006 2007 2008 2009 2010 2011 2012 2013

RTR Telekom Monitor Annual Review 2013
968 | TeChnoloGy InDICaToRs
RTR Telekom Monitor Annual Review 2013
979 | GlossaRy
9 Glossary
RTR Telekom Monitor Annual Review 2013
989 | GlossaRy
airtime (mobile communications)
Airtime refers to a service which mobile network operators provide for domestic resellers. A reseller is a communications service provider that offers public mobile services to retail customers but does not pro-vide those services using its own network. This includes all mobile service providers (such as resellers or [enhanced] service providers) that do not operate their own communications network – neither a radio network nor a core network – in providing mobile communications services.
bitstream and resale
Bitstream and resale are wholesale products at different levels of the value chain, on the basis of which Internet connections can be provided to the end user. Bitstream access is provided at predefined (regional or national) handover points, the wholesale customer provides Internet connectivity to the end user. In contrast, in the case of resale, Internet connectivity is provided by the wholesale supplier, the wholesale customer acting merely as reseller.
broadband
Broadband Internet access or broadband Internet connections are Internet connections (technology neut-ral) with a download speed of > 144 kbit/s. The Internet connection can also be offered as part of a bundle with other services. The connection can be made in the following ways:
– as a dedicated line (copper-wire pairs in the A1 Telekom Austria network),
– on an unbundled line (see unbundling),
– as virtual unbundling (see virtual unbundling),
– via coaxial cable (cable modem),
– as fixed wireless access, e.g. W-LAN, WiFi, WLL (“fixed“ access, not via hot spots) or
– on another infrastructure. This includes e.g. powerline carrier broadband (PWL) and broadband access via satellite (SAT).
Carrier Pre-selection and Call-by-Call
Carrier pre-selection (CPS) refers to a pre-set carrier network code (10xx) which routes all of a subscriber’s traffic (except for calls to value-added services and public service numbers) via the pre-selected carrier network.
In contrast, call-by-call carrier selection makes it possible to route individual telephone calls via a service provider other than the network which provides the subscriber line. In this case, the subscriber is required to enter the carrier network code (10xx) before each call.
ethernet services
Ethernet services with guaranteed bandwidth are lines that provide guaranteed bandwidth between two network termination points, excluding leased lines with Ethernet user interfaces at the user’s end (be-cause, for example, on-demand switching functionality is provided).
fixed wholesale market for voice telephony
The fixed wholesale market includes three sub-services: origination, termination and transit services.
Origination refers to calls that originate from a fixed network termination point in a carrier’s own network. Termination refers to the routing of calls to a fixed network termination point in a carrier’s own network. Transit refers to calls between two networks or between two interconnectable exchanges in a network. These services can be provided internally (e.g. as self-provided services, e.g. in an intra-network call) or externally between network operators (e.g. origination to services and carrier network operators or ter-mination from an external network. Origination, termination and transit services are not charged to the customer directly but are settled between network operators (at the wholesale level). The RTR Telecom Monitor reports both revenues and corresponding origination, termination and transit minutes.
RTR Telekom Monitor Annual Review 2013
999 | GlossaRy
International roaming
In connection with mobile communications, the term “roaming“ refers to the use of a mobile telephone outside the coverage area of one‘s own network operator (the home network), in which case the mobile phone uses the service of another network (the visited network). In international roaming, the home and visited networks are located in different countries and their coverage areas generally do not overlap.
leased lines
Leased lines provide symmetrical transmission capacity with a guaranteed bandwidth between two points without switching functions. Leased lines may also be referred to as “dedicated lines“ or “point-to-point connections“.
A distinction is made between retail and wholesale leased lines. Retail leased lines refer to leased lines which are not provided for operators or providers of communications networks or services (i.e. holders of general approvals) but for companies outside the telecommunications sector (e.g. banks, insurance companies, retail stores etc.).
Wholesale leased lines are leased lines provided for other operators or providers of communications net-works or services. A distinction is made between trunk segments and terminating segments (see trunk segments and terminating segments).
Where leased lines are concerned, it must be borne in mind that there are often time lags in leased lines markets between revenues and demand, frequently resulting in strong fluctuations between months and, indeed, quarters, caused by the billing of project business, billbacks and credits.
Mobile broadband
Mobile broadband comprises pure data tariffs, data products not based on a fixed monthly charge and smartphone tariffs.
Pure data tariffs (no voice services or text messaging) are mobile services including at least 250 mega-bytes in the monthly charges.
Products not based on a fixed monthly charge (e.g. prepaid data products or data/voice products) are products that are used by customers to access the Internet at least one time each quarter. Smartphone tariffs are all contracts for voice and text messaging services that include at least 250 megabytes of data services in the monthly charges and that are used by customers to access the Internet at least one time each quarter.
number porting
Number porting allows customers to retain their telephone numbers when they switch service providers. The RTR Telecom Monitor only includes the porting procedures/imports of telephone numbers carried out for an operator in one quarter, i.e. SIM cards in the case of mobile operators and subscriber numbers on the fixed network. Reverse portings (e.g. after cancellation by a subscriber) are not considered porting procedures. If the number of a subscriber is ported several times within a quarter (subsequent porting), this is counted separately each time.
Price index in mobile communications
For the calculation of the monthly prices for different user types RTR uses the tariff data published by the Austrian Chamber of Labour on a monthly basis. Only new tariffs available in the respective month are considered because this allows immediate detection of changes in tariffs (price increases and reductions).
The details about minutes, text messages (SMS) and data services used monthly by the respective user types and about handset subsidies per tariff are supplied by the mobile operators; with regard to infor-mation not provided, RTR makes every effort to estimate such information on the basis of available data. Average prices per month are calculated for four different user types. The medium user, high user and power user types also use data services; therefore, for these user types only so-called smartphone tariffs (with included data volume) are applied. A fourth user type, the so-called low user, exclusively relies on voice and text messaging services.

RTR Telekom Monitor Annual Review 2013
1009 | GlossaRy
The user types were classified as follows: for each service (voice, SMS, data) the users were ranked ac-cording to the frequency of use and divided into four groups of equal size (quartiles). One quartile each represents one user type and the median of the respective quartile is used for the underlying number of used minutes, SMS and megabytes. The user type data are fed into the tariff data by means of the following procedure: the usage values of the previous year are used for the respective tariffs of the current year (e.g. usage 2012 for calculation of the prices per tariff for 2013). It is determined which new tariffs available are the most inexpensive ones for the respective user type per brand. Apart from the monthly base fees and the minutes, SMS and data volume included, the following tariff components are reflected in the calculation: ac-tivation charge, SIM/service charge, minimum revenue, where appropriate, as well as the price per minute, SMS and megabyte beyond the included quantities and the handset subsidies (written off over 24 months).
An average price from the respective up to five most inexpensive tariffs per brand is calculated. The fol-lowing brands are reflected: A1, T-Mobile, Drei, Orange, tele.ring, Yesss!, Bob, Ge.org, Red Bull Mobile, S-Budget. Subsequently, the price per brand is weighted with the brand’s market share.
The calculated price index is a linked index, where usage is adjusted regularly, in this case annually, similarly to the Consumer Price Index.
Residential customers – business customers
“Business customers“ are all legal persons and corporations under public or private law, partnerships, registered companies and partnerships under the Civil Code [eingetragene Erwerbsgesellschaften, Ge-sellschaften bürgerlichen Rechts], as well as natural and legal persons who are entrepreneurs within the meaning of Art. 1 of the Austrian Consumer Protection Act (Federal Law Gazette 140/1979 as amended), including start-up activities within the meaning of Art. 1 Par. 3 leg. cit). In this context, business shall mean any organisation that is intended to be permanent for the purposes of independent commercial activity, even though it may be a non-profit enterprise.
“Residential customers” are all customers not captured by the above definition.
For the distinction between residential customers and business customers all relevant information avail-able shall be used.
Technical measurement (real minutes)
Real minutes refer to the actual duration of calls made by customers. In contrast, billed call minutes in-dicate the number of minutes actually charged to those customers. The main factors accounting for the difference between these two figures are the number of free minutes included in the base fee, which carry considerably more weight in mobile networks than in the fixed network, and the billing increment.
Trunk segments and terminating segments (leased lines and ethernet services)
At the wholesale level a distinction is made between trunk segments and terminating segments. Trunk segments refer to leased lines or Ethernet services that normally do not extend to the user’s network ter-mination point and link interconnection points in the 28 Austrian towns and cities where A1 Telekom has set up network interconnection points to other telecommunications operators. In contrast, terminating segments refer to leased lines or Ethernet services at the wholesale level, which are not to be classified as trunk segments.
Unbundling
In telecommunications, unbundling refers to the separate provision of specific services which were previ-ously available only in conjunction with other services. For example, the unbundling of sub- scriber lines from fixed network access offered by the incumbent operator gives alternative service providers direct access to the customer without requiring the latter to install the „last mile“ them- selves, as they can lease the (naked) subscriber line from the incumbent at a regulated price. Unbundled network elements are made available if the regulatory authority has identified in a market analysis procedure that one company has significant market power and has imposed on it the obligation of granting access to its telecommuni-cations network and unbundled elements thereof.

RTR Telekom Monitor Annual Review 2013
1019 | GlossaRy
Virtual unbundling
According to an official TKK decision, A1 Telekom Austria AG is obliged to offer virtual unbundling in areas where it expands the fibre optic cable network (Next Generation Access - NGA). Virtual unbundling is a wholesale service that enables alternative providers (as in the case of physical unbundling) to offer their own (broadband) products to end users.
Voice-over-broadband (Vob)
VoB are voice telephony services based on a broadband connection (stand-alone or bundled). VoB does not include voice-over-Internet, where services are provided on the basis of the (public) Internet, but the Internet connection is provided by an independent third party (e.g. Skype).

RTR Telekom Monitor Jahresbericht 2013
102 9 | GlossaRy
Publishing informationowner and publisher:
Austrian Regulatory Authority for Broadcasting and Telecommunications (Rundfunk und Telekom Regulierungs-GmbH), Mariahilfer Strasse 77-79, A-1060 Vienna Tel.: +43 1 58058-0, Fax: +43 1 58058-9191, e-mail: [email protected], Internet: www.rtr.at
Responsible for content:
Johannes Gungl (CEO Telecommunications and Postal Services), Austrian Regulatory Authority for Broadcasting and Telecommunications.
Conceptual design and text:
Austrian Regulatory Authority for Broadcasting and Telecommunications
All parts of this publication are protected by copyright. All rights reserved under copyright, especially rights to distribution, reprinting, translations, presentations, the use of illustrations and tables, broad-casting, microfilms or reproduction of this document in photocopies or any other form, as well as stor-age in computer systems, even in cases where excerpts are used.
Although the contributions to the RTR Telecom Monitor Annual Review 2013 were reviewed with the utmost care, it is not possible to rule out errors. Therefore, no guarantee of accuracy can be provided for this information.
The text in this report was prepared with due attention to gender neutrality. Any and all deviations from this policy are exclusively for the sake of improving the text‘s readability.
Copyright Rundfunk und Telekom Regulierungs-GmbH 2014