![Tolerance of Maize (Zea mays L.) and Soybean [Glycine max (L.) Merr.] to Late Applications of Postemergence Herbicides](https://static.fdokumen.com/doc/165x107/63438e5b1a2cfc44fc019bae/tolerance-of-maize-zea-mays-l-and-soybean-glycine-max-l-merr-to-late-applications.jpg)
Routine determination of sulfonylurea, imidazolinone, and sulfonamide herbicides at...
14
Routine Determination of Sulfonylurea, Imidazolinone, and Sulfonamide Herbicides at Nanogram-Per-Liter Concentrations by Solid-Phase Extraction and Liquid Chromatography/Mass Spectrometry By Edward T. Furlong, Mark R. Burkhardt, Paul M. Gates, Stephen L.Werner, and William A. Battaglin ABSTRACT Sulfonylurea (SU), imidazolinone (IMI), and sulfonamide (SA) herbicides are new classes of low- application-rate herbicides increasingly used by farmers. Some of these herbicides affect both weed and crop species at low dosages and must be carefully used. Less is known about the effect of these compounds on noncrop plant species, but a concentration of 100 ng/L (nanograms per liter) in water has been proposed as the threshold for possible plant toxicity for most of these herbicides. Hence, analytical methods must be capable of detecting SUs, IMSs, and SAs at concentrations less than 100 ng/L in ambient water samples. The authors developed a two-cartridge, solid-phase extraction method for isolating 12 SU, 3 IMI, and 1 SA herbicides by using high-performance liquid chromatography/ electrospray ionization–mass spectrometry (HPLC/ESI–MS) to identify and quantify these herbicides to 10 ng/L. This method was used to analyze 196 surface- and ground-water samples collected from May to August 1998 throughout the Midwestern United States, and more than 100 quality-assurance and quality-control samples. During the 16 weeks of the study, the HPLC/ESI-MS maintained excellent calibration linearity across the calibration range of 5 to 500 ng/L, with correlation coefficients of 0.9975 or greater. Continuing calibration verification standards at 100-ng/L concentration were analyzed throughout the study, and the mean measured concentrations for individual herbicides ranged from 93 to 101 ng/L. Mean recovery of herbicides from 27 reagent water samples spiked at 50 and 100 ng/L ranged from 39 to 92 percent and averaged 73 percent. The standard deviation of recoveries ranged from 14 to 26 percent and averaged 20 percent. This variability reflects multiple instruments, operators, and the use of automated and manual sample preparation. Spiked environmental water samples had similar recoveries, although for some herbicides, the sample matrix enhanced recoveries by as much as 200 percent above the spiked concentration. This matrix enhancement was sample and compound dependent. Concentrations of herbicides in unspiked duplicate environmental samples were typically within 25 percent of each other. The results demonstrate the usefulness of HPLC/ESI-MS for determining low- application-rate herbicides at ambient concentrations.
-
Upload
independent -
Category
Documents
-
view
1 -
download
0
Transcript of Routine determination of sulfonylurea, imidazolinone, and sulfonamide herbicides at...

Routine Determination of Sulfonylurea, Imidazolinone, and Sulfonamide Herbicides at Nanogram-Per-Liter Concentrations by Solid-Phase Extraction and Liquid Chromatography/Mass Spectrometry By Edward T. Furlong, Mark R. Burkhardt, Paul M. Gates, Stephen L.Werner, and William A. Battaglin
ABSTRACT
Sulfonylurea (SU), imidazolinone (IMI), and sulfonamide (SA) herbicides are new classes of low-application-rate herbicides increasingly used by farmers. Some of these herbicides affect both weed and crop species at low dosages and must be carefully used. Less is known about the effect of these compounds on noncrop plant species, but a concentration of 100 ng/L (nanograms per liter) in water has been proposed as the threshold for possible plant toxicity for most of these herbicides. Hence, analytical methods must be capable of detecting SUs, IMSs, and SAs at concentrations less than 100 ng/L in ambient water samples. The authors developed a two-cartridge, solid-phase extraction method for isolating 12 SU, 3 IMI, and 1 SA herbicides by using high-performance liquid chromatography/ electrospray ionization–mass spectrometry (HPLC/ESI–MS) to identify and quantify these herbicides to 10 ng/L. This method was used to analyze 196 surface- and ground-water samples collected from May to August 1998 throughout the Midwestern United States, and more than 100 quality-assurance and quality-control samples.
During the 16 weeks of the study, the HPLC/ESI-MS maintained excellent calibration linearity across the calibration range of 5 to 500 ng/L, with correlation coefficients of 0.9975 or greater. Continuing calibration verification standards at 100-ng/L concentration were analyzed throughout the study, and the mean measured concentrations for individual herbicides ranged from 93 to 101 ng/L. Mean recovery of herbicides from 27 reagent water samples spiked at 50 and 100 ng/L ranged from 39 to 92 percent and averaged 73 percent. The standard deviation of recoveries ranged from 14 to 26 percent and averaged 20 percent. This variability reflects multiple instruments, operators, and the use of automated and manual sample preparation. Spiked environmental water samples had similar recoveries, although for some herbicides, the sample matrix enhanced recoveries by as much as 200 percent above the spiked concentration. This matrix enhancement was sample and compound dependent. Concentrations of herbicides in unspiked duplicate environmental samples were typically within 25 percent of each other. The results demonstrate the usefulness of HPLC/ESI-MS for determining low-application-rate herbicides at ambient concentrations.

INTRODUCTION
Sulfonylurea (SU), imidazolinone (IMI), and sulfonamide (SA) herbicides are new classes of herbicides that function by inhibiting the action of acetolactate synthase or acetohydroxyacid synthase, key enzymes in the biosynthesis of amino acids in plants. These herbicide classes are applied at rates that are typically much lower than those used for the triazine or acetanilide herbicides that are most commonly used in agriculture. In addition, SUs, IMIs, and SAs are much less toxic to mammals and other animals (Beyer and others, 1987; Meister, 1997). As a result, these herbicides are gaining in popularity among farmers. Crops that are treated with SUs, IMIs, and SAs include barley, corn, cotton, durum wheat, peanuts, rice, soybeans, spring wheat, and winter wheat.
The range in observed toxicity of SUs, IMIs, and SAs to crop and noncrop plants varies by a factor of greater than 1,000. Some of these herbicides are active on crop species at low dosages. Field studies indicate that some yield is lost in the most sensitive crop species when these herbicides are applied or present at between 1/100th and 1/500th of the typical application rate of 0.5 to 0.1 g (gram) active ingredient per ha (hectare)(Fletcher and others, 1993; Obrigawitch and others, 1998). Little is known about the effect of these compounds on noncrop plant species, but a concentration of 100 ng/L in water has been proposed as the concentration below which possible plant toxicity is minimized (Michael Barrett, U.S. Environmental Protection Agency, oral commun., 1997).
It may be difficult to detect SUs, IMIs, and SAs in many hydrologic settings because of their low application rates and low overall use amounts. Detections of SUs, IMIs, and SAs in samples collected from surface and ground water have been reported at nanogram-per-liter concentrations (Bergstrom, 1990; Michael and Neary, 1993). Commonly used analytical techniques might not have adequate sensitivity or selectivity to unambiguously detect and quantify SU, IMI, and SA herbicides, particularly in the presence of coextracted matrix interferences. Most of the SU, IMI, and SA herbicides are highly polar, water soluble, and labile, limiting
their analysis by gas chromatography or gas chromatography/mass spectrometry. High-performance liquid chromatography (HPLC) has been successfully used to separate SU, IMI, and SA herbicide mixtures, but standard optical detection methods have lacked sensitivity, particularly in the presence of the ultraviolet-absorbing dissolved organic carbon present in natural-water samples.
Several investigators have used coupled HPLC/electrospray ionization-mass spectrometry (HPLC/ESI-MS) to separate, detect, and quantify SU, IMI, and SA herbicides in soils (D’Ascenzo and others, 1998a; Marek and Koskinen, 1996; Powley and de Bernard, 1998; Stout and others, 1998; Stout and others, 1997), plant materials (Chivanov and others, 1997; Stout and others, 1996a; Stout and others, 1996b), and water (Bossi and others, 1996; D’Ascenzo and others, 1998b; Di Corcia and others, 1997; Koppen and Spliid, 1998; Krynitsky, 1997; Rodriguez and Orescan, 1998). These studies have demonstrated that HPLC/ESI-MS is well suited to the determination of SU, IMI, and SA herbicides because these compounds are efficiently ionized under electrospray conditions. However, these studies were limited in the number of compounds or the types of water samples analyzed. To date (1999), routine application of HPLC/ESI-MS has not been demonstrated, particularly for surface- and ground-water samples collected from a range of hydrologic conditions and water chemistries.
In this paper the authors present an improved two-cartridge, solid-phase extraction (SPE) method for isolation of 12 SU, 3 IMI, and 1 SA herbicides (table 1), using HPLC/ESI-MS for detection, identification, and quantitation. This method was used to determine the concentrations of the 16 SU, IMI, and SA herbicides in about 200 surface-and ground-water samples collected throughout the Midwestern United States. More than 100 quality-assurance and quality-control (QA/QC) samples were concurrently analyzed. By using this data set, the authors demonstrate that SPE and HPLC/ESI-MS can be used to routinely identify and quantify SU, IMI, and SA herbicides at concentrations less than 10 ng/L in water samples of varying chemical composition.

Table 1. Common names, herbicide classes, CAS numbers, and trade names of the sixteen herbicides measured in this study (data from Meister, 1997) [CAS, Chemical Abstracts Service]
Common name Herbicide class CAS number Trade name1 Bensulfuron methyl sulfonylurea 83055-99-6 Londax Chlorimuron ethyl sulfonylurea 90982-32-4 Classic Chlorsulfuron sulfonylurea 64902-72-3 Glean, Telar Flumetsulam sulfonamide 98967-40-9 Broadstrike, Preside, Scorpion Halosulfuron methyl sulfonylurea 100784-20-1 Battalion, Manage, Permit,
Sempra Imazapyr imidazolinone 81334-34-1 Arsenal, Chopper Imazaquin imidazolinone 81335-37-7 Scepter, Detail Imazethapyr imidazolinone 81335-77-5 Pursuit Metsulfuron methyl sulfonylurea 74223-64-6 Allie, Ally, Escort, Quit, Reform Nicosulfuron sulfonylurea 111991-09-4 Accent Primisulfuron methyl sulfonylurea 86209-51-0 Beacon, Tell Prosulfuron sulfonylurea 94125-34-5 Peak Sulfometuron methyl sulfonylurea 74222-97-2 Oust Thifensulfuron methyl sulfonylurea 79277-27-3 Pinnacle Triasulfuron sulfonylurea 82097-50-5 Amber Triflusulfuron methyl sulfonylurea 126535-15-7 Upbeet 1Use of brand, firm, and trade names in this article is for identification purposes only and does not constitute
endorsement by the U.S. Geological Survey .
EXPERIMENTAL
More than 212 surface- and ground-water samples were collected from a range of surface- and ground-water sites throughout the Midwestern United States. Most surface-water sites were sampled twice and ground-water sites were sampled once. The sampling design and trends in SU, IMI, and SA herbicide concentrations, as well as trends for triazine and acetanilide herbicides, are described in a separate paper in this volume (Battaglin and others, 1999).
All samples were filtered through a 0.7-um (micrometer) nominal pore size glass fiber filter and collected in Teflon-lined, screw capped 1-L amber glass bottles. Two 1-L bottles were collected for each sample. The bottles were baked at 425ºC (degrees Celsius) for 8 hours prior to use to minimize the potential for organic contamination. After filtration and collection, the samples were shipped on ice by overnight express and kept at 2 to 4ºC in the dark until extraction.
Solid-Phase Extraction Preparation
Ultrapure (distilled-in-glass or equivalent) reagent water and solvents were used in the
development of the method and in the determination of SU, IMI, and SA herbicides. For each sample extraction, two SPE cartridges were stacked in series. The first cartridge was a 6-mL (milliliter) barrel, 500-mg (milligram) bed strong anion exchange resin cartridge (Jones Chromatography, Inc., Lakewood, Colorado). This cartridge removed much of the dissolved organic carbon (DOC) from the sample; for most environmental samples, the strong anion exchange resin bed was colored with DOC. The IMIs were retained on the strong anion exchange cartridge, while the SUs and SAs were not retained. The second cartridge was a 6-mL barrel, 1-g bed, RP-102 (Applied Separations, Allentown, Pennsylvania) styrene-divinyl benzene polymeric SPE cartridge. The RP-102 cartridge retained the SUs, IMIs, and any SAs that were not retained on the strong anion

exchange cartridge. Prior to analysis, the combined cartridge stack was conditioned by passing 60 mL of 1 percent acetic acid in acetone and 40 mL of 1 percent acetic acid in water through the cartridges. The stack was not allowed to dry after conditioning.
Sample Extraction
The pH of the samples was measured prior to sample extraction, and the pH was adjusted to 3 or less by addition of acetic acid. The volume of acetic acid used ranged from 10 to 18 mL. The samples were then extracted using a Zymark AutoTrace SPE Workstation (Zymark Corporation, Hopkinton, Massachusetts). The sample extraction flowrate through the stacked SPE cartridges was 10 mL/min (milliliters per minute). The stack was then dried in-line with nitrogen for 1 minute to remove excess water. A 1.2-mL aliquot of methanol was then passed through each stack to remove interstitial water trapped in the SPE material. The stack was then dried in-line with nitrogen for 45 minutes to remove as much residual water as possible. Three 4-mL aliquots of 1 percent acetic acid in acetone were used to elute the compounds from the stacked SPE cartridges. The flowrate for elution was 3 mL/min. The 12-mL final volume was collected in graduated polyethylene test tubes.
Sample Concentration
The eluted sample extracts were placed in a Zymark TurboEvap (Zymark Corporation, Hopkinton, Massachusetts) solvent reduction workstation for solvent removal. The nitrogen gas pressure was kept at 10 pounds per square inch and the water bath temperature maintained at 38ºC. Sample reduction to just dryness took about 60 minutes because all residual water was not removed in the previous drying steps. A 1-mL aliquot of acetonitrile was then added to each sample extract. The sample extract was dried again. An additional 1-mL aliquot of acetonitrile was again added and the sample dried for a third time. These two drying steps were used to ensure the removal of acetic acid. The sample extracts were then reconstituted with 100 •L (microliters) acetonitrile, followed by 900 •L of water in the
polyethylene test tubes. The sample extracts were then filtered through a 0.2-•m Teflon membrane syringe filter to remove any particulate material prior to analysis. The filtered extracts were put into amber, graduated 2-mL sample vials (Hewlett Packard, Palo Alto, California). The sample vials were capped and kept at 2 to 4ºC until analysis.
Sample Analysis
The sample extracts were placed in the autosampler of a Hewlett Packard Series 1100 HPLC/MS system (Hewlett Packard, Palo Alto, California). The HPLC and MS operational characteristics are listed in table 2. A Metasil Basic 3-•m pore size 2x150 mm (millimeter) analytical HPLC column and a Metasil Basic 3-•m pore size 2x10 mm (Metachem Technologies, Inc, Torrance, California) guard column were used for HPLC separation. Acetonitrile and a 10-mM (millimolar) ammonium formate/formic acid buffer, pH 3.7 in water, were used as the two components to the HPLC gradient. The solvent compositions used for the HPLC gradient in this analysis are listed in table 3.
Full-scan electrospray ionization mass spectra were collected for each compound using a Hewlett Packard Series 1100 LC/MSD. The instrument was tuned for positive ions using horse skeletal muscle myoglobin. Ionization conditions were optimized so that at least three ions were formed for each herbicide. The relative abundances of the three ions were used to confirm identification, and the sum of the three ion signals was used for maximum detectability and quantitation. The selected ions monitored for each compound and the fragmentor voltages required to generate those ions are listed in table 4.
SU, IMI, and SA detections were verified in two ways. First, the chromatographic retention time observed for a peak in a sample chromatogram was compared to the retention of the compound observed in a standard chromatogram (fig.1). The qualitative identification was then confirmed by comparing the relative abundances of the three ions measured in the sample peak to known relative abundances of a library reference spectrum

Table 2. High-performance liquid chromatography (HPLC) and mass spectrometry (MS) operating conditions for the combined analysis of sulfonylurea, imidizolinone, and sulfonamide herbicides
HPLC Operating Conditions Flowrate 0.2 milliliter per minute Autosampler temperature 8 degrees Celsius Analysis time 45 minutes Column temperature 30 degrees Celsius Injection volume 50 microliters MS Operating Conditions Ionization mode electrospray Polarity positive Electron multiplier voltage 2,748 Sheath (drying) gas volume 10 liters per minute Nebulizer pressure 55 pounds per square inch Gas temperature 325 degrees Celsius Spray chamber capillary voltage 4,000 volts
Table 3. High-performance liquid chromatography binary gradient program for the combined analysis of sulfonylurea, imidizolinone, and sulfonamide herbicides
Time,
in minutes Acetonitrile,
in percent Aqueous buffer,
in percent 0.50 20 80 1.75 35 65
10.0 40 60 13.0 50 50 20.0 55 45 23.0 90 10 27.0 90 10 30.0 20 80 45.0 20 80

Table 4. Selected-ion monitoring (SIM) program for the combined analysis of sulfonylurea, imidizolinone, and sulfonamide herbicides
Compound Ions monitored Fragmentor voltage
for SIM analysis Imazapyr 217, 234, 262 95 Imazethapyr 177, 245, 290 115 Flumetsulam 129, 262, 326 95 Nicosulfuron 182, 213, 411 95 Imazaquin 199, 267, 312 95 Thifensulfuron methyl 167, 270, 388 80 Metsulfuron methyl 167, 264, 382 80 Chlorsulfuron 141, 167, 358 85 Sulfometuron methyl 150, 199, 365 85 Triasulfuron methyl 141, 167, 402 85 Bensulfuron methyl 149, 182, 411 90 Halosulfuron methyl 182, 403, 435 85 Prosulfuron 141, 167, 420 85 Chlorimuron ethyl 186, 213, 415 85 Triflusulfuron methyl 264, 461, 493 90 Primisulfuron methyl 199, 254, 469 90
Figure 1. Chromatogram of a 100-ng/L (nanogram-per-liter; equivalent to 5 ng on-column) 16 component sulfonylurea-imidazolinone-sulfonamide standard using high-performance liquid chromatography/electrospray ionization–mass spectrometry with selected-ion monitoring.

produced from a pure standard. This comparison, however, might not be conclusive if unknown compounds interfere with the sample peak, either partially or completely. If comparison of the unknown peak spectrum with the library reference spectra yields dissimilar spectral curves, then the presence of the compound was notconfirmed, and so it was not identified. If a chromatographically resolvable peak was identified, with all three ions present, but one ion’s relative abundance varied by more than 20 percent from the standard, then the compound concentration was qualified as an estimate. All detections less than 10 ng/L were qualified as estimates.
Concentrations were quantified by comparing the sum of the three integrated peak areas from an environmental sample to the sum of integrated peak areas from a calibration line. A five-point external calibration curve for a concentration range of 5 to 500 ng/L was produced for each compound. Calibration lines were linear and had correlation coefficients of 0.9975 or greater.
Samples were extracted and isolated in sets of twelve: ten environmental samples, a method blank, and a method spike in which a blank water sample was amended with all 16 compounds to make a concentration of 50 or 100 ng/L per compound. In addition, duplicate environmental samples were analyzed for quality-control purposes. Thirty-four duplicate samples were amended with a solution of all 16 compounds to 50 or 100 ng/L. These matrix spikes were analyzed in the same set as the unspiked environmental sample. Thirty-two samples were analyzed in duplicate without amendment. These replicates were analyzed within and between sets to estimate method variability over time.
A set of five different ca produced from a pure standard. This comparison, however, might not be conclusive if libration standards was analyzed with each set of processed samples. In addition, continuing calibration verification samples and instrumental blank samples were interspersed between the environmental samples and after the calibration standards to verify that
the instrument remained within calibration limits, and that cross- contamination between injections did not occur.
RESULTS AND DISCUSSION
Recoveries for this method are shown in figure 2. Reagent water and South Platte surface-water samples were spiked at 100 ng/L and analyzed in quadruplicate. Recoveries ranged from 56 to 86 percent in reagent water, averaging 76 percent. The variation in recovery for all 16 compounds averaged 6 percent. Recoveries are more variable in surface water, ranging from 46 to 163 percent and averaging 93 percent. The variation in recovery for all 16 compounds averages 7 percent. Enhanced recoveries were consistently observed for South Platte surface water (and also observed in ground water), particularly for thifensulfuron methyl, metsulfuron methyl, triasulfuron methyl, and bensulfuron methyl. The observed matrix-enhanced recoveries ranged as high as 300 percent for a of water-soluble salts and DOC.sample fortified at 100 •/L. After minor modification of the method by introduction of a solvent-exchange step, the mean matrix enhancement was less than 200 percent, likely the result of improved removal of water-soluble salts and DOC.
The samples were analyzed in 27 separate sets, and instrumental and method QA/QC samples were analyzed as part of each set. Table 5 lists data for long-term calibration stability, as indicated by the performance of 75 continuing calibration verification samples analyzed over the course of the study. The continuing calibration verification sample-equivalent concentration for each compound was set at 100 ng/L. The mean measured concentration for individual SU, IMI, and SA herbicides ranged from 93 to 101 ng/L. The mean standard deviation for all SU, IMI, and SA herbicides measured in continuing calibration verification samples throughout the study was 6 ng/L. These data, along with linear calibration

--
Imazapyr
Imazethapyr
Flumetsulam
Nicosulfuron
Imazaquin
hifensulfuron methyl
Metsulfuron meth
yl
Chlorsulfuron
Sulfometuron meth
yl
Triasulfuron meth
yl
Bensulfuron methyl
Halosulfuron meth
yl
Prosulfuron
Chlorimuron eth
yl
Triflusulfuron meth
yl
Primisu
lfuron methyl
20
40
60
80
100
120
140
160
180
RW1 SW1
RE
CO
VE
RY
, IN
PE
RC
EN
T
Figure 2. Recoveries of 16 herbicides from reagent water (RW1) and South Platte River water (SW1) fortified at 100ng/L (nanograms per liter).
coefficients of 0.9975 or greater, indicate that instrument performance was highly stable throughout the course of the study.
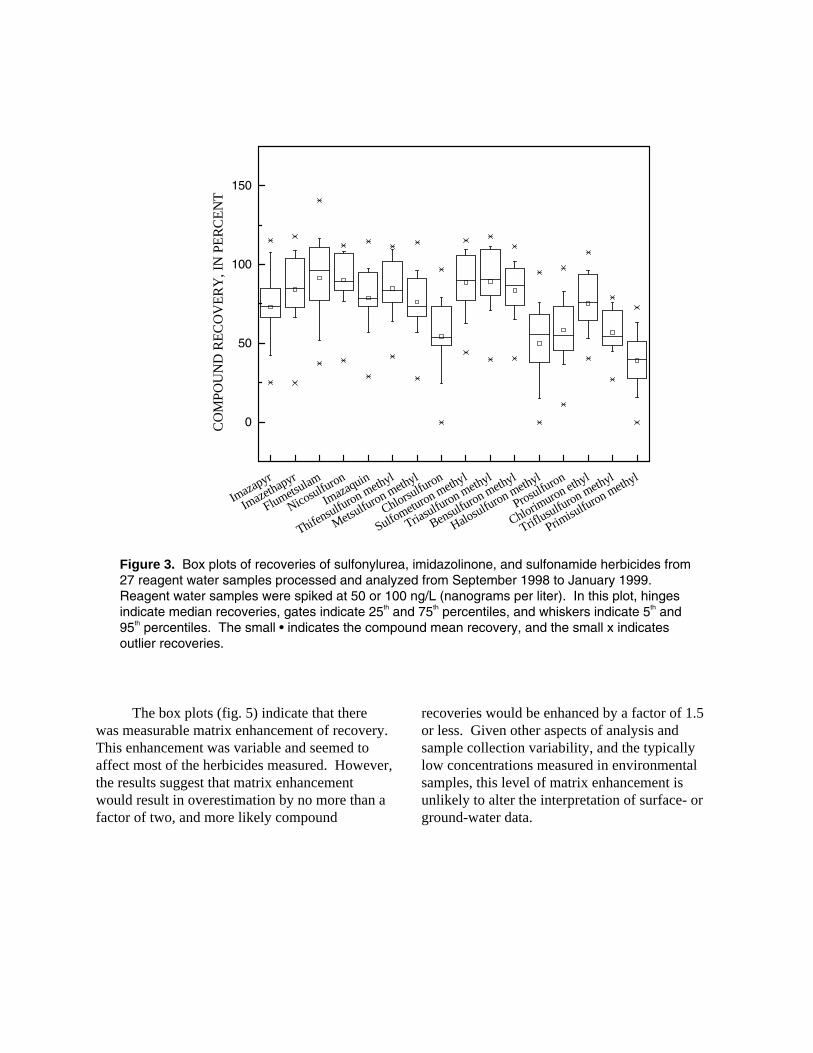
Long-term method performance is indicated by the recovery calculated from the results of 27 set spikes, one analyzed with each set during the study. The recoveries for all individual SU, IMI, and SA herbicides are shown in figure 3. Mean recoveries for all 16 herbicides from 27 reagent water set spike samples, fortified at 50 and
100 ng/L, ranged from 39 to 92 percent and averaged 73 percent. The standard deviation of recoveries ranged from 14 to 26 percent and averaged 20 percent. This variability reflects multiple instruments, operators, and the use of automated and manual sample preparation. Chlorsulfuron, halosulfuron methyl, prosulfuron, triflusulfuron methyl, and primisulfuron methyl had the lowest and most variable recoveries.

Table 5. Continuing calibration performance during the course of the study. The concentration statistics were calculated from determinations of 75 continuing calibration verification samples
[All concentrations in nanograms per liter]
Compound Compound
mean Compound
median
Compound standard deviation
Minimum concentration
Maximum concentration
Imazapyr 100 100 6.6 85 128 Imazethapyr 100 101 6.4 84 117 Flumetsulam 96 96 5.2 84 114 Nicosulfuron 95 96 4.3 83 111 Imazaquin 101 101 6.6 85 126 Thifensulfuron methyl 93 93 7.0 60 120 Metsulfuron methyl 94 94 5.8 81 117 Chlorsulfuron 95 95 6.3 80 122 Sulfometuron methyl 96 96 5.9 80 113 Triasulfuron methyl 93 93 5.1 79 108 Bensulfuron methyl 93 94 5.3 78 106 Halosulfuron methyl 94 94 6.9 81 122 Prosulfuron 94 95 6.6 71 121 Chlorimuron ethyl 94 94 5.4 79 110 Triflusulfuron methyl 93 94 6.2 76 114 Primisulfuron methyl 96 96 6.6 81 118 Set mean concentration 95 96 6.0 79 117 Set median concentration 95 95 6.3 80 117 Set standard deviation 2.7 2.7 .8 6.2 6.3 Minimum concentration 93 93 4.3 60 106 Maximum concentration 101 101 7.0 85 128
Thirty-one unspiked duplicate samples were analyzed to estimate method precision at ambient herbicide concentrations and in the presence of interferences. These duplicates were analyzed within a single sample set (intraset replicates) or in two separate sets (interset) replicates. Intra- and interset replicates were combined for data analysis. Box plots of the distributions of relative percentage differences calculated for the five herbicides detected in unspiked replicates more than three times are shown in figure 4. Except for
chlorimuron ethyl, concentrations of herbicides in unspiked duplicate environmental samples were typically within 25 percent of each other.
In addition to unspiked replicates, 28 randomly selected sample duplicates were spiked at 100 ng/L and analyzed. This spike determined the magnitude of possible matrix enhancement during the study. These results are shown in figure 5.
Imazapyr
Imazethapyr
Flumetsulam
Nicosulfuron
Imazaquin
Thifensulfuron meth
yl
Metsulfuron meth
yl
Chlorsulfuron
Sulfometuron meth
yl
Triasulfuron methyl
Bensulfuron methyl
Halosulfuron meth
yl
Prosulfuron
Chlorimuron ethyl
Triflusulfuron meth
yl
Primisu
lfuron methyl
0
50
100
150
CO
MPO
UN
D R
EC
OV
ER
Y, I
N P
ER
CE
NT
Figure 3. Box plots of recoveries of sulfonylurea, imidazolinone, and sulfonamide herbicides from 27 reagent water samples processed and analyzed from September 1998 to January 1999. Reagent water samples were spiked at 50 or 100 ng/L (nanograms per liter). In this plot, hinges indicate median recoveries, gates indicate 25th and 75th percentiles, and whiskers indicate 5th and 95th percentiles. The small • indicates the compound mean recovery, and the small x indicates outlier recoveries.
The box plots (fig. 5) indicate that there was measurable matrix enhancement of recovery. This enhancement was variable and seemed to affect most of the herbicides measured. However, the results suggest that matrix enhancement would result in overestimation by no more than a factor of two, and more likely compound
recoveries would be enhanced by a factor of 1.5 or less. Given other aspects of analysis and sample collection variability, and the typically low concentrations measured in environmental samples, this level of matrix enhancement is unlikely to alter the interpretation of surface- or ground-water data.

Imazethapyr
Flumetsulam
Nicosulfuron
Imazaquin
Chlorimuron eth
yl
0
50
100
150
200
n=4n=11n=12n=17n=21
*100 C1-C2[(C1+C2)/2]RPD=
RE
LA
TIV
E P
ER
CE
NT
DIF
FER
EN
CE
Figure 4. Relative percent differences (RPD) between unspiked duplicate natural-water samples. In this plot, hinges indicate median recoveries, gates indicate 25th and 75th percentiles, and whiskers indicate 5th and 95th percentiles. The small • indicates the compound mean recovery, and the small x indicates outlier recoveries. Thirty-one total samples were analyzed (n=number of samples with detections in both duplicates; C1 and C2 refer to the concentrations of the first and second duplicate, respectively).
A summary of field results from the analysis of 196 surface- and ground-water samples is presented in Battaglin and others (1999). The selected herbicides were detected at concentrations greater than the reporting limit in 83 percent of stream samples. In surface-water samples, the three most frequently detected herbicides were imazethapyr (71 percent), flumetsulam (63 percent), and nicosulfuron (52 percent). Average concentrations of these five
herbicides ranged from 11 to 92 ng/L. Six other herbicides were measured in 2 to 24 percent of samples. The data suggest that several of the sixteen selected compounds are commonly detected in surface-water samples of the Midwestern United States, and that the average concentrations are less than the 100-ng/L level of concern. Battaglin and others (1999) provide a detailed statistical analysis of the field results.

Imazapyr
Imazethapyr
Flumetsulam
Nicosulfuron
Imazaquin
Thifensulfuron meth
yl
Metsulfuron meth
yl
Chlorsulfuron
Sulfometuron meth
yl
Triasulfuron
Bensulfuron methyl
Halosulfuron meth
yl
Prosulfuron
Chlorimuron ethyl
Triflusulfuron meth
yl
Primisu
lfuron methyl-50
0
50
100
150
200
250
300
RE
CO
VE
RY
, IN
PE
RC
EN
T
Figure 5. Recovery of herbicides added to duplicate surface- and ground-water samples at a concentration of 100 ng/L (nanograms per liter). Recoveries corrected for ambient water herbicide concentrations. In this plot, hinges indicate median recoveries, gates indicate 25th and 75th percentiles, and whiskers indicate 5th and 95th percentiles. The small • indicates the compound mean recovery, and the small x indicates outlier recoveries.
In this study, the authors have demonstrated the usefulness of HPLC/MS for the routine determination of SU, IMI, and SA herbicides by using a tandem SPE isolation coupled to HPLC/ESI–MS. The analytical technologies used in this method are critical to adequate assessment of the presence and distribution of low-application-rate herbicide residues in surface and ground water. The long-term QA/QC data
developed as part of this study show that HPLC/ESI–MS is a robust technique that can be used for the routine determination of herbicides at concentrations at or less than 10 ng/L. Extensive QA/QC data collection and interpretation are required to verify the performance of this method and to assess the magnitude of sample matrix enhancement of concentrations.

REFERENCES CITED
Battaglin, W.A., Furlong, E.T., Burkhardt, M.R., and Peter, C.J., 1999, Occurrence of sulfonylurea, imidazolinone, sulfonamide, and other herbicides in Midwestern Rivers, reservoirs and groundwater, 1998, in Morganwalp, D.W., and Buxton, H.T., eds., U.S. Geological Survey Toxic Substances Hydrology Program--Proceedings of the Technical Meeting, Charleston, South Carolina, March 8-12, 1999-- Volume 2--Contamination of Hydrologic Systems and Related Ecosystems: U.S. Geological Survey Water-Resources Investigations Report 99-4018B, this volume.
Bergstrom, L., 1990, Leaching of chlorsulfuron and metsulfuron methyl in three Swedish soils measured in field lysimeters: Journal of Environmental Quality, v. 16, no. 3, p. 263-266.
Beyer, E.M., Duffy, M.F., Hay, J.V., and Schlueter, D.D., 1987, Sulfonylurea herbicides, in Kearny, P.C., and Kaufman, D.D., eds., Herbicides--chemistry, degradation, and mode of action: New York, Marcel Dekker, p. 117-189.
Bossi, R., Spliid, N.H., and Streibig, J.C., 1996, Analysis of sulfonylurea herbicides at PPT levels by liquid chromatography mass spectrometry, in DelRe, A.A.M., Capri, E., Evans, S.P., and Trevisan, M., eds., Environmental fate of xenobiotics: 27100 Pavia, La Goliardica Pavese, p. 483-490.
Chivanov, V.D., Kravchenko, N.S., Mishnev, A.K., Tatarinova, V.I., Grebenik, L.I., Aksenov, S.A., Kuraev, V.V., Knysh, A.N., and Belovol, A.V., 1997, Determination of herbicides of the sulfonylurea series in biological matrices using time-of-flight plasma-desorption mass spectrometry: Journal of Analytical Chemistry, v. 52, no. 5, p. 488-491.
D’Ascenzo, G., Gentili, A., Marchese, S., Marino, A., and Perret, D., 1998a, Optimization of high performance liquid chromatography mass spectrometry apparatus for
determination of imidazolinone herbicides in soil at levels of a few PPB: Rapid Communications in Mass Spectrometry, v. 12, no. 19, p. 1359-1365.
D’Ascenzo, G., Gentili, A., Marchese, S., and Perret, D., 1998b, Development of a method based on liquid chromatography electrospray mass spectrometry for analyzing imidazolinone herbicides in environmental water at part-per-trillion levels: Journal of Chromatography A, v. 800, no. 1, p. 109-119.
Di Corcia, A., Crescenzi, C., Samperi, R., and Scappaticcio, L., 1997, Trace analysis of sulfonylurea herbicides in water: Extraction and purification by a Carbograph 4 cartridge, followed by liquid chromatography with UV detection, and confirmatory analysis by an electrospray mass detector: Analytical Chemistry, v. 69, no. 14, p. 2819-2826.
Fletcher, J.S., Pfleeger, T.G., and Ratsch, H.C., 1993, Potential environmental risks associated with the new sulfonylurea herbicides: Environmental Science and Technology, v. 27, no. 10, p. 2250-2252.
Koppen, B., and Spliid, N.H., 1998, Determination of acidic herbicides using liquid chromatography with pneumatically assisted electrospray ionization mass spectrometric and tandem mass spectrometric detection: Journal of Chromatography A, v. 803, nos. 1-2, p. 157-168.
Krynitsky, A.J., 1997, Determination of sulfonylurea herbicides in water by capillary electrophoresis and by liquid chromatography mass spectrometry: Journal of AOAC International, v. 80, no. 2, p. 392-400.
Marek, L.J., and Koskinen, W.C., 1996, LC/MS analysis of 4-methoxy-6-methyl-1,3,5-triazin-2-yl-containing sulfonylurea herbicides in soil: Journal of Agricultural and Food Chemistry, v. 44, no. 12, p. 3878-3881.
Meister, R.T., 1997, Farm chemicals handbook: Willoughby, Ohio, Meister Publishing Company, 940 p.
Michael, J.L., and Neary, D.G., 1993, Herbicide dissipation studies in southern forest ecosystems: Environmental Toxicology and Chemistry, v. 12, no. 3, p. 405-410.

Obrigawitch, T.T., Cook, G., and Wetherington, J., 1998, Assessment of effects on nontarget plants from sulfonylurea herbicides using field approaches: Pesticide Science, v. 52, no. 3, p. 199-217.
Powley, C.R., and de Bernard, P.A., 1998, Screening method for nine sulfonylurea herbicides in soil and water by liquid chromatography with ultraviolet detection: Journal of Agricultural and Food Chemistry, v. 46, no. 2, p. 514-519.
Rodriguez, M., and Orescan, D.B., 1998, Confirmation and quantitation of selected sulfonylurea, imidazolinone, and sulfonamide herbicides in surface water using electrospray LC/MS: Analytical Chemistry, v. 70, no. 13, p. 2710-2717.
Stout, S., daCunha, A., Fletcher, J., and Picard, G., 1996a, Rapid determination of imazapyr in corn by gas chromatography mass spectrometry with electron capture negative ion chemical ionization: Journal of AOAC International, v. 79, no. 5, p. 1220-1225.
Stout, S.J., daCunha, A.R., Picard, G.L., and Safarpour, M.M., 1996b, Microwave-assisted extraction coupled with liquid chromatography electrospray ionization mass spectrometry for the simplified determination of imidazolinone herbicides and their metabolites in plant tissue: Journal of Agricultural and Food Chemistry, v. 44, no. 11, p. 3548-3553.
Stout, S.J., daCunha, A.R., Picard, G.L., and Safarpour, M.M., 1998, Simplification of analytical methods in pesticide residue analysis by liquid chromatography electrospray ionization mass spectrometry and tandem mass spectrometry: Journal of AOAC International, v. 81, no. 4, p. 685-690.
Stout, S.J., daCunha, A.R., and Safarpour, M.M., 1997, Simplified determination of imidazolinone herbicides in soil at parts- per-billion level by liquid chromatography electrospray ionization tandem mass spectrometry: Journal of AOAC International, v. 80, no. 2, p. 426-432.
AUTHOR INFORMATION
Edward T. Furlong, Mark R. Burkhardt, Paul M. Gates, and Stephen L. Werner, U.S. Geological Survey, National Water Quality Laboratory, Box 25046, Mail Stop 407, Federal Center, Denver, CO 80225-0046
Willaim A. Battaglin, U.S. Geological Survey, Office of the Regional Hydrologist, Box 25046, Mail Stop 406, Federal Center, Denver, CO 80225-0046