Combination effects of herbicides on plants and algae: do species and test systems matter?
14
Pest Management Science Pest Manag Sci 63:282–295 (2007) Combination effects of herbicides on plants and algae: do species and test systems matter? Nina Cedergreen, 1∗ Per Kudsk, 2 Solvejg K Mathiassen 2 and Jens C Streibig 1 1 Royal Veterinary and Agricultural University (KVL), Institute of Agricultural Sciences, Højbakkeg ˚ ard All ´ e 13, 2630 Taastrup, Denmark 2 Danish Institute of Agricultural Sciences, Department of Integrated Pest Management, Forsøgsvej 1, 4200 Slagelse, Denmark Abstract: Risk assessment of herbicides towards non-target plants in Europe is currently based solely on tests on algae and floating aquatic plants of Lemna sp. Effects on terrestrial non-target species is not systematically addressed. The purpose of the present study was to compare combination effects of herbicide mixtures across aquatic and terrestrial test systems, and to test whether results obtained in the traditional aquatic test systems can be extrapolated to the terrestrial environment. This was done by evaluating ten binary mixtures of nine herbicides representing the seven most commonly used molecular target sites for controlling broadleaved weeds. Data were evaluated statistically in relation to the concentration addition model, and for selected concentrations to the independent action model. The mixtures were tested on the terrestrial species Tripleurospermum inodorum (L.) Schultz-Bip. (Scentless Mayweed) and Stellaria media (L.) Vill. (Common Chickweed), and on the aquatic species Lemna minor L. (Lesser duckweed) and the alga Pseudokirchneriella subcapitata (Korschikov) Hindak. For the two mixtures of herbicides with the same molecular site of action, the joint effect was additive. For the eight mixtures of herbicides with different sites of action, two of the mixtures were consistently antagonistic across species, while for the remaining six mixtures the joint effect depended on the species tested. This dependence was, however, not systematic, in the sense that none of the species or test systems (terrestrial versus aquatic) had a significantly higher probability of showing synergistic or antagonistic joint effects than others. Synergistic interactions were not observed, but approximately 70% of the mixtures of herbicides with different sites of action showed significant antagonism. Hence, the concentration addition model can be used to estimate worst-case effects of mixtures of herbicides on both terrestrial and aquatic species. Comparing the sensitivity of the species to a 10% spray drift event showed that the terrestrial species were more vulnerable to all herbicides compared with the aquatic species, emphasising the importance of including terrestrial non-target plants in herbicide risk assessment. 2007 Society of Chemical Industry Keywords: mixture toxicity; herbicides; risk assessment; terrestrial non-target plants 1 INTRODUCTION Risk assessment of herbicides towards non-target plants in Europe is currently based solely on tests on algae and floating aquatic plants of Lemna sp. Although it is suggested that data on terrestrial non- target plants be included in the risk assessment of plant protection compounds according to the Coun- cil Directive 91/414/EEC, they are not yet requested (http://europa.eu.int/comm/food/plant/protection/ resources/publications en.htm [October 2005], Ter- restrial Ecotoxicology, 32 pp.). This implies that the protection limits of terrestrial non-target flora depend on the efficacy of herbicides in water. Previous studies have shown that doses as low as 1% of field rates of sulfonylurea herbicides can affect growth and repro- duction of terrestrial plants, 1 a sensitivity towards sulfonylureas that was not repeatable for Lemna growth and certainly not for algae growth, where even a 100% field rate of various sulfonylurea herbicides sprayed on a 30 cm water column would not reduce growth. 2 It therefore appears that terrestrial non-target plants may be considerably more sensitive to unintentional herbi- cide exposure compared to the aquatic species tested in risk assessment schemes. Not only might terrestrial plants be more sensitive to unintentional herbicide exposure, but synergistic interactions between herbi- cides and between herbicides and other compounds are also well documented for terrestrial plants. 3,4 In contrast, well-documented synergistic effects of herbicide mixtures on aquatic plants have, to the present authors’ knowledge, not been reported. 5,6 Even mixtures of herbicides with pesticides inhibit- ing cytochrome P450 dependent monooxygenase, for example, the fungicide prochloraz, which showed syn- ergistic interactions on terrestrial plants, 3,4 did not interact synergistically with herbicides when tested on the aquatic species Lemna minor L. and the alga Pseudokirchneriella subcapitata (Korshikov) Hindak. 7 ∗ Correspondence to: Nina Cedergreen, Royal Veterinary and Agricultural University (KVL), Institute of Agricultural Sciences, Højbakkeg˚ ard All ´ e 13, 2630 Taastrup, Denmark E-mail: [email protected] (Received 12 April 2006; revised version received 12 April 2006; accepted 5 July 2006) DOI: 10.1002/ps.1353 2007 Society of Chemical Industry. Pest Manag Sci 1526–498X/2007/$30.00
Transcript of Combination effects of herbicides on plants and algae: do species and test systems matter?

Pest Management Science Pest Manag Sci 63:282–295 (2007)
Combination effects of herbicideson plants and algae: do species and testsystems matter?Nina Cedergreen,1∗ Per Kudsk,2 Solvejg K Mathiassen2 and Jens C Streibig1
1Royal Veterinary and Agricultural University (KVL), Institute of Agricultural Sciences, Højbakkegard Alle 13, 2630 Taastrup, Denmark2Danish Institute of Agricultural Sciences, Department of Integrated Pest Management, Forsøgsvej 1, 4200 Slagelse, Denmark
Abstract: Risk assessment of herbicides towards non-target plants in Europe is currently based solely on testson algae and floating aquatic plants of Lemna sp. Effects on terrestrial non-target species is not systematicallyaddressed. The purpose of the present study was to compare combination effects of herbicide mixtures acrossaquatic and terrestrial test systems, and to test whether results obtained in the traditional aquatic test systemscan be extrapolated to the terrestrial environment. This was done by evaluating ten binary mixtures of nineherbicides representing the seven most commonly used molecular target sites for controlling broadleaved weeds.Data were evaluated statistically in relation to the concentration addition model, and for selected concentrationsto the independent action model. The mixtures were tested on the terrestrial species Tripleurospermum inodorum(L.) Schultz-Bip. (Scentless Mayweed) and Stellaria media (L.) Vill. (Common Chickweed), and on the aquaticspecies Lemna minor L. (Lesser duckweed) and the alga Pseudokirchneriella subcapitata (Korschikov) Hindak.For the two mixtures of herbicides with the same molecular site of action, the joint effect was additive. For theeight mixtures of herbicides with different sites of action, two of the mixtures were consistently antagonistic acrossspecies, while for the remaining six mixtures the joint effect depended on the species tested. This dependencewas, however, not systematic, in the sense that none of the species or test systems (terrestrial versus aquatic)had a significantly higher probability of showing synergistic or antagonistic joint effects than others. Synergisticinteractions were not observed, but approximately 70% of the mixtures of herbicides with different sites of actionshowed significant antagonism. Hence, the concentration addition model can be used to estimate worst-caseeffects of mixtures of herbicides on both terrestrial and aquatic species. Comparing the sensitivity of the speciesto a 10% spray drift event showed that the terrestrial species were more vulnerable to all herbicides comparedwith the aquatic species, emphasising the importance of including terrestrial non-target plants in herbicide riskassessment. 2007 Society of Chemical Industry
Keywords: mixture toxicity; herbicides; risk assessment; terrestrial non-target plants
1 INTRODUCTIONRisk assessment of herbicides towards non-targetplants in Europe is currently based solely on testson algae and floating aquatic plants of Lemna sp.Although it is suggested that data on terrestrial non-target plants be included in the risk assessment ofplant protection compounds according to the Coun-cil Directive 91/414/EEC, they are not yet requested(http://europa.eu.int/comm/food/plant/protection/resources/publications en.htm [October 2005], Ter-restrial Ecotoxicology, 32 pp.). This implies that theprotection limits of terrestrial non-target flora dependon the efficacy of herbicides in water. Previous studieshave shown that doses as low as 1% of field rates ofsulfonylurea herbicides can affect growth and repro-duction of terrestrial plants,1 a sensitivity towardssulfonylureas that was not repeatable for Lemna growthand certainly not for algae growth, where even a 100%field rate of various sulfonylurea herbicides sprayed on
a 30 cm water column would not reduce growth.2 Ittherefore appears that terrestrial non-target plants maybe considerably more sensitive to unintentional herbi-cide exposure compared to the aquatic species testedin risk assessment schemes. Not only might terrestrialplants be more sensitive to unintentional herbicideexposure, but synergistic interactions between herbi-cides and between herbicides and other compoundsare also well documented for terrestrial plants.3,4
In contrast, well-documented synergistic effects ofherbicide mixtures on aquatic plants have, to thepresent authors’ knowledge, not been reported.5,6
Even mixtures of herbicides with pesticides inhibit-ing cytochrome P450 dependent monooxygenase, forexample, the fungicide prochloraz, which showed syn-ergistic interactions on terrestrial plants,3,4 did notinteract synergistically with herbicides when testedon the aquatic species Lemna minor L. and the algaPseudokirchneriella subcapitata (Korshikov) Hindak.7
∗ Correspondence to: Nina Cedergreen, Royal Veterinary and Agricultural University (KVL), Institute of Agricultural Sciences, Højbakkegard Alle 13, 2630Taastrup, DenmarkE-mail: [email protected](Received 12 April 2006; revised version received 12 April 2006; accepted 5 July 2006)DOI: 10.1002/ps.1353
2007 Society of Chemical Industry. Pest Manag Sci 1526–498X/2007/$30.00

Risk assessment of herbicide mixtures
Indications of synergy between some fungicides andinsecticides and herbicides have, however, been docu-mented for another alga species, Chlorella fusca (Shik.& Kraus).8
Terrestrial plants are exposed to pesticide mixturesboth through commercially produced ready-to-usemixtures and through tank mixtures made by farmerswith the aim of increasing efficacy, widening theweed spectrum controlled or reducing the numberof spray applications.9 A large part of the synergisticinteractions of pesticides on terrestrial plants have beenattributed to the formulation of the compounds.10
Formulated herbicides consist of the active herbicidemixed with formulation constituents that, for example,increase the adhesion of spray drops to plant leaves,promote uptake or prevent rapid biodegradation of theactive compound.11 If herbicides are not formulated,many prove to be biologically inactive againstterrestrial plants.12 Previous studies have shown thatherbicide formulations that increase herbicide efficacyon terrestrial plants generally do not increase efficacyagainst aquatic plants and algae.13 It has beensuggested that the lack of influence of formulations onherbicide performance is due to the large dilution ofthe formulated herbicide, preventing the interactionsof the compounds that would normally occur inthe high-concentration spray droplets.13 Hence, ifthe majority of the synergistic interactions betweenpesticides are dependent on interactions in high-concentration spray droplets, basing risk assessmentof mixtures for non-target terrestrial plants on resultsmade on aquatic plants may underestimate the realjoint effect in the terrestrial environment.
To assess whether an effect is synergistic, meaningthat the joint effect of two or more chemicals ishigher than expected, it is first of all necessary tostate what is expected. Expectations of joint effects ofchemicals are usually based on one of two fundamentalconcepts, which can be summarised in two models:the concentration addition (CA) model (additivedose model) and the independent action (IA) model(response multiplication).14 The CA model assumesthat the chemicals have the same molecular site ofaction and therefore can be regarded as dilutionsof one another. The joint effect of two chemicalsis therefore expected to be equal to the effect ofthe sum of the chemicals, when the potency ofthe chemicals (the degree of ‘dilution’) has beenaccounted for.14 Although the theory assumes similarmolecular target sites, CA has also been proposedto apply to mixtures of chemicals that are able tocause a common toxicological response.15 This couldbe a more broadly defined physiological mode ofaction, as, for example, photosynthesis or respiration,or, if considering more integral endpoints such asdeath or growth, CA could apply to almost allchemicals.16 The IA model is based on test systemswith binominal endpoints such as dead/alive measuredon populations of independent organisms, and itassumes that the chemicals act independently. There
is a debate concerning its practical relevance when itcomes to assessing joint effects on gradual integralendpoints such as growth measured on individualorganisms, where two chemicals by definition cannotact independently.14,17 Although both models havebeen proved to be valid in predicting joint effectsof chemicals on algae and bacteria,16,18–20 whichare populations of independent organisms, for riskassessment purposes CA is often the preferred model,as it is the most conservative of the two models inthe majority of exposure scenarios.6 In the presentstudy the authors therefore choose to focus on CA asthe reference model, although comparisons with IApredictions will be made.
The aim of the present study was to test the hypoth-esis that terrestrial plants have a higher probabilityof synergistic interactions of herbicide mixtures thanaquatic plants and algae. Also, an evaluation was madeof the sensitivity of two terrestrial plant species to unin-tentional herbicide exposure relative to the sensitivityof aquatic test plants and a widely used alga species.This was done by testing ten binary mixtures of nineherbicides representing the most widely used molec-ular sites of action for the control of broadleaved weeds(http://www.eppo.org/PPPRODUCTS/products.htm[September 2005]). The tests were made on two ter-restrial plants Tripleurospermum inodorum (L.) Schultz-Bip. (Scentless mayweed) and Stellaria media (L.) Vill.(Common chickweed), the aquatic test plant L. minor(Lesser duckweed) and the widely used freshwater algatest species P. subcapitata.
2 MATERIALS AND METHODS2.1 General test designThe dose–response surfaces of the binary pesticidemixtures were obtained using a classical ray design.14
The ray design consists of dose–response curves of thetwo individual herbicides tested alone and a numberof dose–response curves of the pesticides mixed atpredefined mixture ratios. The mixture ratios werechosen with the aim of obtaining a contribution tothe overall effect of the two pesticides of 100:0%,75:25%, 50:50%, 25:75% and 0:100% for five-mixture ratio experiments, and of 100:0%, 83:17%,67:33%, 50:50%, 33:67%, 83:17% and 0:100% forseven-mixture ratio experiments. The concentrationsof each pesticide needed to obtain these effect-basedmixture ratios were determined on the basis of the50% effect doses (ED50) or 50% effect concentrations(EC50) of previous experiments (unpublished data).The number of doses and replications within the samedose varied among test systems.
2.2 Terrestrial plantsPlants of T. inodorum and S. media were grown in 2L pots in a potting mixture of sandy loam soil, sandand peat (2 + 1 + 1 by weight) containing all necessarymacro- and micronutrients. The seeds originated froma seed stock maintained at the Danish Institute of
Pest Manag Sci 63:282–295 (2007) 283DOI: 10.1002/ps

N Cedergreen et al.
Agricultural Sciences, Department of Integrated PestManagement (Flakkebjerg, Demark). The pots wereplaced either in a greenhouse or outdoors, dependingon the time of the year, and were subirrigated up to 5times daily with deionised water. After emergence,the number of plants was reduced to four plantsper pot. Plants were sprayed at the 4–8-leaf stagein a laboratory pot sprayer equipped with a boomfitted with two Hardi ISO F-110-015 flat fan nozzles(Hardi International, Taastrup, Denmark) at a sprayvolume of 150 L ha−1. Plants were sprayed withsix or seven doses of two herbicides applied eitheralone or in binary fixed-ratio mixtures. Five mixtureratios were used, including the single compounds.The experimental design was a complete randomiseddesign with three replicates of each dose, except forthe controls which were replicated six times. Theexperiments were conducted over two years fromMay to September under ambient climatic conditions.Mean average daily temperature varied from 11.1to 17.3 ◦C, the length of the photoperiod variedfrom 12.8 to 17.5 h and maximum light intensityvaried from 385 to 560 W m−2 (400–1100 nm). Freshweights of the above-ground plant parts were recorded3–4 weeks after treatment, as recommended by theOECD guideline for terrestrial plant tests.21
The following herbicide combinations were tested:metsulfuron-methyl/triasulfuron, MCPA/mecoprop,glyphosate/terbuthylazine, glyphosate/mecoprop,mecoprop/terbuthylazine, mecoprop/mesotrione,mesotrione/metsulfuron-methyl, metsulfuron-methyl/terbuthylazine, terbuthylazine/diquat, and diquat/acifluorfen. The mixture MCPA/mecoprop was onlytested on S. media owing to the very low naturalsusceptibility of T. inodorum to MCPA. Only com-mercially available formulated products were used toensure maximal biological activity on the terrestrialplants. The molecular site of action, physiologicalmode of action, compound purity and field rate arelisted in Table 1, together with the specifications ofthe formulated products.
2.3 Lemna testThe Lemna minor test closely followed the guide-lines given by the International Organisation forStandardisation,22 with few modifications: instead of100 mL glass beakers and starting densities of fourfronds per beaker, 10 mL six-well TC-test plates (CM.Lab. Aps, Vordingborg, Denmark) and starting den-sities of one frond per well were used. Control plantsgrew exponentially throughout the experiment time,23
and, since surface area and not frond number wasused as an endpoint, the coefficient of variance ofthe control treatment was kept below 10%.24 As onlyherbicides with a log Kow below 0.4 were used,25 adhe-sion to the multiwell plate material was not consideredto be substantial. The only exception, terbuthylazine(log Kow: 3.2)25 showed EC50 values comparable withthose obtained on the basis of measured terbuthy-lazine concentrations.26 The L. minor plants were
collected in Copenhagen in 1999, surface sterilisedwith hypochlorite and the resulting sterile clone waskept in Ehrlenmeyer flasks in ‘K’-medium,27 pH 5,at 24 ◦C and a continuous photon flux density of85–120 µmol m−2 s−1 photosynthetic active radiation(PAR). The flasks and medium were sealed with cot-ton wool and autoclaved before the weekly transfer ofplants to new media. Regular tests on K2Cr2O4 andon 3,5-dichlorophenol (CAS-Nr: 591-35-5), as partof the ISO ring test, have proved the CopenhagenLemna minor clone to be equally sensitive to plantsfrom standard clones. The K-medium was used, as ithas proved to give the highest growth rates in the givenexperimental set-up.
For the Lemna tests, 5–7 mixture ratios were used,including the single compounds. Each dose–responsecurve consisted of 6–8 dilutions, each in threereplicates. There were 6–12 common controls. Theherbicide combinations tested were the same as forthe terrestrial plants, but only technical compoundswere used (Table 1). The exception was diquat, whereReglone, an aqueous solution of diquat dibromide,was used (Table 1). The experiments were initiatedby transferring one Lemna minor frond to 10 mLK-medium containing a selected concentration ofherbicide. The plants were photographed with a digitalcamera alongside a 1 × 1 cm white plastic square, andthe total frond surface area was determined by pixelcounts using the computer program Photoshop 5.0(Adobe). The plants were then placed in a growthcabinet at 24 ◦C and a continuous photon flux densityof 85–120 µmol m−2 s−1 PAR. After seven days theplants were photographed and the frond surface areawas determined. Relative growth rates were calculatedaccording to (ln AT − ln A0)/T , where AT is thesurface area at time T and A0 is the surface area at thestart of the experiment.
2.4 Algae testThe algae test was described by Mayer et al.28
and closely follows the recommendations of theInternational Organisation of Standardisation (ISO).29
The alga species used was a clone (NIVA-CHL1) ofPseudokirchneriella subcapitata originating from NorskInstitut for Vannforskning (NIVA).
For the algae tests, seven mixture ratios were usedincluding the pure compounds. Each dose–responsecurve consisted of eight dilutions, each replicatedtwice. There were ten untreated controls. Theherbicide combinations tested were the same as forterrestrial plants, except for the mixtures includingmecoprop, which has no effect on algal growthat concentrations below 1 g L−1.13 Only technicalcompounds were used. To initiate the experiment,algae were incubated in 4 mL growth medium29
in 20 mL glass vials at a density of approximately10 000 algae mL−1. The algae vials were closed with alid with a 2 mm hole to ensure gas exchange, andplaced on a shaking device (300 rpm) in holdersensuring continuous illumination from below with
284 Pest Manag Sci 63:282–295 (2007)DOI: 10.1002/ps

Risk assessment of herbicide mixtures
Tab
le1.
The
prim
ary
and
inte
nded
mol
ecul
arsi
teof
actio
nof
the
herb
icid
es,t
heir
pro
pos
edp
hysi
olog
ical
mod
eof
actio
n,th
ep
urity
ofth
ete
chni
calc
omp
ound
s,th
ere
com
men
ded
aver
age
field
rate
and
the
spec
ifica
tions
ofth
efo
rmul
ated
com
pou
nds.
Fiel
dra
tes
are
give
nfo
rb
road
leaf
spec
ies.
Dat
aar
efr
omTo
mlin
25
Nam
eC
hem
ical
grou
pS
iteof
actio
nM
ode
ofac
tion
Pur
ity(%
)Fi
eld
rate
(gha
−1)
Form
ulat
edpr
oduc
tS
ourc
e
Aci
fluor
fen
Dip
heny
leth
erP
roto
porp
hyrin
ogen
oxid
ase
inhi
bito
rP
hoto
synt
hesi
s40
400
Bla
zer(2
40g
L−1)
BA
SF
Cor
pora
tion
Diq
uat
Bip
yrid
yliu
mP
hoto
syst
emIi
nhib
itor
Pho
tosy
nthe
sis
700
Reg
lone
(200
gL−1
)S
ynge
nta
Cro
pP
rote
ctio
nG
lyph
osat
eG
lyci
nedi
rivat
ive
EP
SP
Sa
inhi
bito
rA
min
oac
idsy
nthe
sis
9517
50R
ound
upB
io(3
60g
L−1)
Mon
sant
oM
CP
AA
rylo
xyal
kano
icac
idS
ynth
etic
auxi
nP
lant
horm
one
syst
em93
1260
M-7
50(7
50g
L−1)
Kla
rsoe
&C
o.M
ecop
rop
Ary
loxy
alka
noic
acid
Syn
thet
icau
xin
Pla
ntho
rmon
esy
stem
8913
50D
uplo
san
MP
(600
gL−1
)B
AS
FM
esot
rion
Trik
eton
eIn
hibi
tsca
rote
noid
synt
hesi
sP
hoto
synt
hesi
s79
150
Cal
isto
(100
gL−1
)S
ynge
nta
Cor
p.P
rote
ctio
nM
etsu
lfuro
n-m
ethy
lS
ulfo
nylu
rea
ALS
bin
hibi
tor
Am
ino
acid
synt
hesi
s98
.56
Ally
(200
gkg
−1)
DuP
ont
Terb
uthy
la-z
ine
1,3,
5-Tr
iazi
neP
hoto
syst
emII
inhi
bito
rP
hoto
synt
hesi
s>
9618
00Te
rbut
hyla
zine
(500
gL−1
)In
terT
rade
Tria
sulfu
ron
Sul
fony
lure
aA
LSin
hibi
tor
Am
ino
acid
synt
hesi
s97
7.5
Logr
an(2
00g
kg−1
)S
ynge
nta
Cro
pP
rote
ctio
n
a5-
Eno
lpyr
uvyl
shik
imat
e-3-
pho
spha
tesy
ntha
se.I
nhib
ition
blo
cks
the
synt
hesi
sof
arom
atic
amin
oac
ids.
bA
ceto
lact
ate
synt
hase
.Inh
ibiti
onb
lock
sth
esy
nthe
sis
ofb
ranc
hed
-cha
inam
ino
acid
s.
80 µmol m−2 s−1 PAR. At experiment initiation andafter 24 and 48 h, 400 µL of the algae suspensionwas removed from each vial and mixed in test tubeswith 1.6 mL acetone saturated with MgSO4 (12 g L−1).The test tubes were sealed with a tight lid andplaced in the dark for chlorophyll extraction. After72 h, chlorophyll fluorescence was measured on allalgae samples on a Turner Quantec digital filterfluorometer (Model FM109515) (Turner, USA) usingan excitation wavelength of 420 nm and measuring theemission at 670 nm. The relative growth rate of thealgae culture was calculated as the slope of the linearregression of the ln-transformed fluorescence data asa function of time.
2.5 StatisticsThe joint action of the pesticides was evaluated inrelation to the CA model. Isobolographic methodswere used to present the data. Isobolograms show thechemical combinations needed to produce a certaineffect in a test system. In the present study, the 50%effect level was used. Data were statistically analysedagainst CA using the method described by Sørensenet al.,30 programmed in the software program R.31
In short, each dataset is described by four differentresponse surface models that are compared pairwiseby an F-test based on the residual sum of squares ofthe surface models. The models are:
1. A model that describes the 5–7 dose–responsecurves of one mixture study with a commoncontrol.
2. A model that describes the 5–7 dose–responsecurves of one mixture experiment with a commoncontrol and common slopes of the individualdose–response curves.
3. Either model 1 or model 2 with the ED50/EC50 ofthe 5–7 dose–response curves being replaced witha flexible isobole model.
4. Either model 1 or model 2 with the ED50/EC50
of the 5–7 dose–response curves being replacedwith a CA isobole model (see Sørensen et al.30 forfurther details).
The basis of the response surface model is thesigmoid log-logistic dose–response model.12 In model1 it is as follows:
yi = d1 + exp{bi[ln(xi) − ln(ei)]} (1)
where yi denotes the response for mixture ratio i, d isthe common upper limit of the response of all mixtureratios when the chemical concentration (xi) is zero,ei is the concentration giving a response of 50% of dfor mixture ratio i and bi is proportional to the slopearound ei. In model 2, bi is replaced with b, reducingthe degrees of freedom with i − 1. In model 3, ei ofmodel 1 or model 2 is substituted with an isobolemodel. The Hewlett isobole model32 was chosen asthe default isobole model because of its simplicity,
Pest Manag Sci 63:282–295 (2007) 285DOI: 10.1002/ps

N Cedergreen et al.
with only one parameter (λ) describing the curvatureof the isobole:
(x1
EC1
)1/λ
+(
x2
EC2
)1/λ
= 1 (2)
In this model, x is the concentration of a pesticide ina mixture at a predefined effect level, and EC is theconcentration of the same pesticide giving that effectwhen tested alone. The subscripts 1 and 2 denote thetwo pesticides in the mixture. A λ value larger than 1indicates synergy in relation to the CA model, whileλ values smaller than 1 indicate antagonism. Someisoboles were poorly described by the Hewlett andPlackett model, which is restricted in terms of thedegree of antagonism it can describe. In these cases,ei was replaced with an isobole model proposed byVølund and including two parameters (η1 and η2) todescribe the isobole curvature:33
(x1
EC1
)η1 (x1
EC1+ x2
EC2
)1−η1
+(
x2
EC2
)η2 (x1
EC1+ x2
EC2
)1−η2
= 1 (3)
In this model, η values larger than 1 indicateantagonism, while η values smaller than 1 indicatesynergy. Very different η values describe asymmetricisoboles. Model 4, which replaces ei with a CA isobolemodel, was equal to model 3 with λ or η1 and η2 fixedat the value 1.
This study focuses on two model comparisons.Firstly, if model 2 describes the data equally as well asmodel 1 (F-test: P > 0.05), the slopes of the individualdose–response curves are not significantly differentfrom each other. Hence, the shape of the isobole willbe the same at all response levels. Model 2 will thenform the basis for models 3 and 4. Secondly, if model4, with the CA isobole model, describes data equallyas well as model 3, with the flexible isobole model (F-test: P > 0.05), the isobole is not significantly differentfrom CA.
If it is preferred to evaluate isobolograms by adding a95% confidence belt to the expected additivity isobole,as suggested by, for example, Altenburger et al.,34
it can be done by multiplying the standard errors
of the pure herbicides on the figures by 1.9635 andconnecting these with a straight line.
The sum of toxic units (∑
TU) signifies the relativeamount of chemical in a mixture that will give acertain effect. This study works with a 50% effectlevel. If the
∑TU is 1, the mixture effect follows CA.
If it is 0.8, only 80% of the chemicals are neededto reduce the response to 50% compared with thatexpected from CA. If
∑TU is 1.25, 125% of the
chemicals are needed to reduce the response to 50%compared with that expected from CA. The
∑TU
can be calculated for all mixture ratios. The∑
TUof the 50:50% effect ratio
(∑TU50:50
)is used as
a measure of the size of synergism or antagonismacross the two isobole models, as it is this mixtureratio at which the deviation from CA is largest forsymmetric isoboles. For the Hewlett isobole modelthe
∑TU50:50 is calculated as 21−λ, while for the
Vølund isobole model the∑
TU50:50 is calculated as1/(2−η1 + 2−η2).30
A comparison of the results with the IA model is onlydone pointwise for the herbicide concentrations givinga 50:50% effect ratio at ED/EC50. The predicted jointeffect of IA (PIA) is calculated as
PIA = 1 − R1R2 (4)
where R1 and R2 are the responses of chemicals 1 and2 calculated from the dose–response parameters givenin Table 1 using the 50:50% effect concentrationsof the fitted isobole (ED/EC50 × 1/2
∑TU50:50). If
the predicted effect is higher than 50%, which is theobserved effect at the concentrations used, there arealso indications of antagonism in relation to IA.
2.6 Comparison of sensitivityThe sensitivity of the two terrestrial versus the twoaquatic test species to a 10% spray drift event wastested by calculating the effect of a 10% average fielddose from the dose–response parameters of the curvesobtained on the nine herbicides tested (Table 2). Forthe aquatic species, the herbicide concentration wascalculated as a 10% field dose sprayed on 30 cm ofwater. The average field rates of the herbicides aregiven in Table 1.
Table 2. Dose–response parameters of the log-logistic dose–response model of all single herbicide dose–response curves presented in the
figures. As all curves deriving from the same experiment are fitted together, the upper limit d of the curve is common for curves belonging to the
same experiment [Eqn (1)]. The slope parameter is denoted by b, and e is the dose or concentration reducing the maximal response by 50%
(ED/EC50). The units for d are g fresh weight at harvest for the terrestrial plants and relative growth rates (day−1) for the aquatic species. For e the
unit is g AI ha−1 for the terrestrial species and µg L−1 for the aquatic species. All parameters are given ± SE
Combination Species Herbicide d b e
Metsulfuron-methyl/triasulfuron T. inodorum Metsulfuron 49 ± 128 1.79 ± 0.41 0.12 ± 0.02Triasulfuron 49 ± 128 2.17 ± 0.66 0.11 ± 0.01
S. media Metsulfuron 100 ± 4 1.80 ± 0.28 0.024 ± 0.004Triasulfuron 100 ± 4 2.57 ± 0.59 0.023 ± 0.003
L. minor Metsulfuron 0.27 ± 0.01 2.76 ± 0.47 0.40 ± 0.03Triasulfuron 0.27 ± 0.01 3.03 ± 0.59 0.24 ± 0.02
286 Pest Manag Sci 63:282–295 (2007)DOI: 10.1002/ps

Risk assessment of herbicide mixtures
Table 2. Continued
Combination Species Herbicide d b e
P. subcapitata Metsulfuron 1.91 ± 0.27 1.18 ± 0.12 848 ± 86Triasulfuron 1.91 ± 0.27 1.86 ± 0.24 603 ± 46
MCPA/mecoprop S. media MCPA 196 ± 6 0.90 ± 0.18 196 ± 31Mecoprop 196 ± 6 0.69 ± 0.16 60 ± 14
L. minor MCPA 0.34 ± 0.01 0.85 ± 0.10 5765 ± 904Mecoprop 0.34 ± 0.01 1.97 ± 0.26 12200 ± 936
Terbuthylazine/diquat T. inodorum Terbuthylazine 77 ± 2 2.60 ± 1.12 218 ± 30Diquat 77 ± 2 0.91 ± 0.19 88 ± 20
S. media Terbuthylazine 122 ± 8 1.36 ± 0.49 80 ± 21Diquat 122 ± 8 0.61 ± 0.10 10 ± 4
L. minor Terbuthylazine 0.33 ± 0.00 1.38 ± 0.15 200 ± 18Diquat 0.33 ± 0.00 1.48 ± 0.15 14 ± 1
P. subcapitata Terbuthylazine 1.88 ± 0.03 1.32 ± 0.09 61 ± 4Diquat 1.88 ± 0.03 1.93 ± 0.31 365 ± 24
Acifluorfen/diquat T. inodorum Acifluorfen 55 ± 4 2.28 ± 0.85 108 ± 23Diquat 55 ± 4 1.61 ± 0.82 1024 ± 280
L. minor Acifluorfen 0.30 ± 0.00 1.59 ± 0.19 506 ± 46Diquat 0.30 ± 0.00 1.08 ± 1.09 60 ± 8
P. subcapitata Acifluorfen 1.68 ± 0.03 1.20 ± 0.18 542.92Diquat 1.68 ± 0.03 2.3 ± 0.73 234 ± 24
Glyphosate/terbuthyl-azine T. inodorum Glyphosate 69 ± 18 1.45 ± 0.42 33 ± 9Terbuthylazine 69 ± 18 3.19 ± 3.07 247 ± 38
S. media Glyphosate 147 ± 3 1.02 ± 0.20 17 ± 4Terbuthylazine 147 ± 3 4.12 ± 2.06 124 ± 26
L. minor Glyphosate 0.31 ± 0.01 1.99 ± 0.53 19651 ± 3063Terbuthylazine 0.31 ± 0.01 3.30 ± 1.05 291 ± 36
P. subcapitata Glyphosate 1.74 ± 0.01 2.37 ± 0.21 55064 ± 2533Terbuthylazine 1.74 ± 0.01 3.84 ± 0.43 111 ± 4
Mesotrione/metsulfuron-methyl T. inodorum Mesotrione 42 ± 2 2.35 ± 0.81 1.49 ± 0.27Metsulfuron 42 ± 2 0.95 ± 0.38 0.26 ± 0.09
S. media Mesotrione 108 ± 2 1.64 ± 0.22 0.36 ± 0.04Metsulfuron 108 ± 2 2.23 ± 0.56 0.081 ± 0.008
L. minor Mesotrione 0.32 ± 0.01 2.81 ± 0.50 12 ± 1Metsulfuron 0.32 ± 0.01 4.54 ± 0.71 0.34 ± 0.01
P. subcapitata Mesotrione 1.40 ± 0.03 1.39 ± 0.24 8199 ± 1079Metsulfuron 1.40 ± 0.03 2.47 ± 0.53 949 ± 99
Metsulfuron-methyl/terbuthyl-azine T. inodorum Metsulfuron 82 ± 3 1.27 ± 0.50 0.15 ± 0.04Terbuthylazine 82 ± 3 2.24 ± 0.48 520 ± 100
S. media Metsulfuron 46 ± 2 6.61 ± 5.27 0.15 ± 0.03Terbuthylazine 46 ± 2 4.67 ± 2.06 170 ± 32
L. minor Metsulfuron 0.31 ± 0.01 2.96 ± 0.54 0.45 ± 0.03Terbuthylazine 0.31 ± 0.01 1.25 ± 0.25 183 ± 37
P. subcapitata Metsulfuron 2.22 ± 0.06 3.41 ± 1.08 826 ± 91Terbuthylazine 2.22 ± 0.05 2.76 ± 0.86 186 ± 23
Glyphosate/mecoprop T. inodorum Glyphosate 62 ± 2 0.78 ± 0.22 18 ± 1Mecoprop 62 ± 2 6.14 ± 30.7 50 ± 16
S. media Glyphosate 138 ± 3 1.34 ± 0.27 16 ± 3Mecoprop 138 ± 3 2.98 ± 0.16 27 ± 5
L. minor Glyphosate 0.28 ± 0.01 3.28 ± 0.54 17172 ± 1118Mecoprop 0.28 ± 0.01 1.35 ± 0.17 9646 ± 1041
Mecoprop/terbuthyl-azine T. inodorum Mecoprop 108 ± 6 0.58 ± 0.11 94 ± 31Terbuthylazine 108 ± 6 0.57 ± 0.12 88 ± 35
S. media Mecoprop 130 ± 6 0.89 ± 0.18 130 ± 33Terbuthylazine 130 ± 6 0.61 ± 0.11 16 ± 5
L. minor Mecoprop 0.28 ± 0.01 2.05 ± 0.62 6067 ± 1067Terbuthylazine 0.28 ± 0.01 2.20 ± 0.28 115 ± 8
Mecoprop/mesotrione T. inodorum Mecoprop 130 ± 12 0.97 ± 0.32 123 ± 51Mesotrione 130 ± 12 0.68 ± 0.28 4.0 ± 2.8
S. media Mecoprop 63 ± 2 2.26 ± 1.06 26 ± 5Mesotrione 63 ± 2 1.95 ± 0.65 0.49 ± 0.10
L. minor Mecoprop 0.33 ± 0.01 1.33 ± 0.16 21790 ± 2200Mesotrione 0.33 ± 0.01 3.20 ± 0.57 14 ± 1
Pest Manag Sci 63:282–295 (2007) 287DOI: 10.1002/ps
N Cedergreen et al.
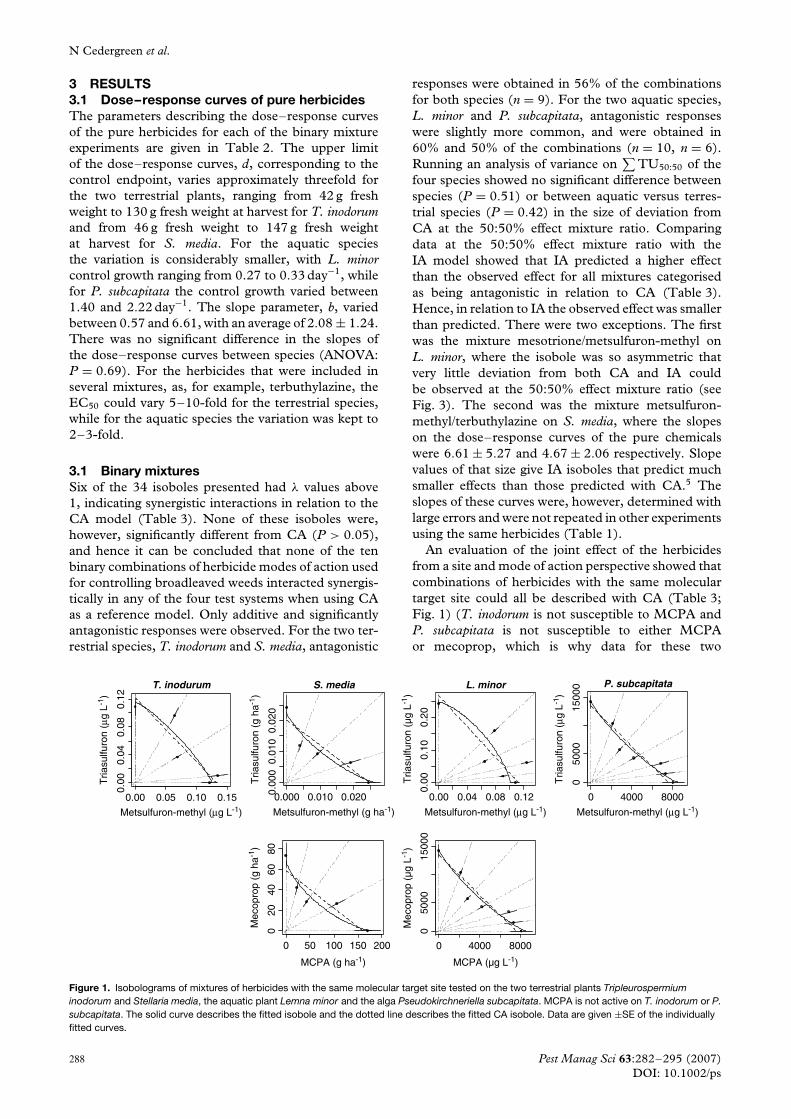
3 RESULTS3.1 Dose–response curves of pure herbicidesThe parameters describing the dose–response curvesof the pure herbicides for each of the binary mixtureexperiments are given in Table 2. The upper limitof the dose–response curves, d, corresponding to thecontrol endpoint, varies approximately threefold forthe two terrestrial plants, ranging from 42 g freshweight to 130 g fresh weight at harvest for T. inodorumand from 46 g fresh weight to 147 g fresh weightat harvest for S. media. For the aquatic speciesthe variation is considerably smaller, with L. minorcontrol growth ranging from 0.27 to 0.33 day−1, whilefor P. subcapitata the control growth varied between1.40 and 2.22 day−1. The slope parameter, b, variedbetween 0.57 and 6.61, with an average of 2.08 ± 1.24.There was no significant difference in the slopes ofthe dose–response curves between species (ANOVA:P = 0.69). For the herbicides that were included inseveral mixtures, as, for example, terbuthylazine, theEC50 could vary 5–10-fold for the terrestrial species,while for the aquatic species the variation was kept to2–3-fold.
3.1 Binary mixturesSix of the 34 isoboles presented had λ values above1, indicating synergistic interactions in relation to theCA model (Table 3). None of these isoboles were,however, significantly different from CA (P > 0.05),and hence it can be concluded that none of the tenbinary combinations of herbicide modes of action usedfor controlling broadleaved weeds interacted synergis-tically in any of the four test systems when using CAas a reference model. Only additive and significantlyantagonistic responses were observed. For the two ter-restrial species, T. inodorum and S. media, antagonistic
responses were obtained in 56% of the combinationsfor both species (n = 9). For the two aquatic species,L. minor and P. subcapitata, antagonistic responseswere slightly more common, and were obtained in60% and 50% of the combinations (n = 10, n = 6).Running an analysis of variance on
∑TU50:50 of the
four species showed no significant difference betweenspecies (P = 0.51) or between aquatic versus terres-trial species (P = 0.42) in the size of deviation fromCA at the 50:50% effect mixture ratio. Comparingdata at the 50:50% effect mixture ratio with theIA model showed that IA predicted a higher effectthan the observed effect for all mixtures categorisedas being antagonistic in relation to CA (Table 3).Hence, in relation to IA the observed effect was smallerthan predicted. There were two exceptions. The firstwas the mixture mesotrione/metsulfuron-methyl onL. minor, where the isobole was so asymmetric thatvery little deviation from both CA and IA couldbe observed at the 50:50% effect mixture ratio (seeFig. 3). The second was the mixture metsulfuron-methyl/terbuthylazine on S. media, where the slopeson the dose–response curves of the pure chemicalswere 6.61 ± 5.27 and 4.67 ± 2.06 respectively. Slopevalues of that size give IA isoboles that predict muchsmaller effects than those predicted with CA.5 Theslopes of these curves were, however, determined withlarge errors and were not repeated in other experimentsusing the same herbicides (Table 1).
An evaluation of the joint effect of the herbicidesfrom a site and mode of action perspective showed thatcombinations of herbicides with the same moleculartarget site could all be described with CA (Table 3;Fig. 1) (T. inodorum is not susceptible to MCPA andP. subcapitata is not susceptible to either MCPAor mecoprop, which is why data for these two
T. inodurum S. media L. minor P. subcapitata
0.00 0.05 0.10 0.15
0.00
0.04
0.08
0.12
Metsulfuron-methyl (µg L-1)
Tria
sulfu
ron
(µg
L-1)
0.000 0.010 0.0200.00
00.
010
0.02
0
Metsulfuron-methyl (g ha-1)
Tria
sulfu
ron
(g h
a-1)
0.00 0.04 0.08 0.12
0.00
0.10
0.20
Metsulfuron-methyl (µg L-1)
Tria
sulfu
ron
(µg
L-1)
0 4000 8000
050
0015
000
Metsulfuron-methyl (µg L-1)
Tria
sulfu
ron
(µg
L-1)
0 4000 80000 50 100 150 200
020
4060
80
MCPA (g ha-1)
Mec
opro
p (g
ha-1
)
050
0015
000
MCPA (µg L-1)
Mec
opro
p (µ
g L-1
)
Figure 1. Isobolograms of mixtures of herbicides with the same molecular target site tested on the two terrestrial plants Tripleurospermiuminodorum and Stellaria media, the aquatic plant Lemna minor and the alga Pseudokirchneriella subcapitata. MCPA is not active on T. inodorum or P.subcapitata. The solid curve describes the fitted isobole and the dotted line describes the fitted CA isobole. Data are given ±SE of the individuallyfitted curves.
288 Pest Manag Sci 63:282–295 (2007)DOI: 10.1002/ps

Risk assessment of herbicide mixtures
Table 3. Statistical parameters and P values for the ten binary herbicide combinations tested on four plant and alga species. The probability of the
slopes of the 5–7 dose–response curves included in each mixture being significantly different is given under ‘slope’. The test for additivity gives the
probability of the isobole being significantly different from the CA model. The notation ‘No CA’ signifies that the data could not be described by CA.
The lambda value of the Hewlett and Plackett isobole model or the eta values of the Vølund isobole model are given with their associated standard
errors. The sum of toxic units (∑
TU) of the 50:50% effect ratio is given, together with the predicted joint effect (%) of the two herbicides at the
mixture ratio giving a 50:50% effect at ED/EC50, assuming the mixture response followed the IA model
Combination Species Slope CA Lambda/eta �TU50:50 IA joint effect
Metsulfuron-methyl/triasulfuron T. inodorum 0.45 0.33 λ = 0.83 ± 0.17 1.13 0.43S. media 0.05 0.16 λ = 1.29 ± 0.20 0.82 0.24L. minor <0.001 0.08 λ = 0.71 ± 0.11 1.22 0.35P. subcapitata <0.001 0.13 λ = 1.19 ± 0.13 0.88 0.40
MCPA/mecoprop S. media 0.27 0.06 λ = 1.40 ± 0.21 0.76 0.53L. minor <0.001 0.13 λ = 1.20 ± 0.13 0.87 0.44
Terbuthylazine/diquat T. inodorum 0.001 0.04 λ = 0.53 ± 0.24 1.39 0.58S. media 0.08 0.002 η1 = 32 ± 18 1.64 0.70
η2 = 0.50 ± 0.14L. minor 0.95 0.42 λ = 1.15 ± 0.19 0.90 0.43P. subcapitata <0.001 0.75 λ = 0.97 ± 0.11 1.02 0.44
Acifluorfen/diquat T. inodorum 0.14 <0.001 η1 = 1.58 ± 0.63 2.93 0.90η2 = 7.29 ± 4.21
L. minor <0.001 <0.001 λ = 0.30 ± 0.10 1.62 0.68P. subcapitata <0.001 <0.001 η1 = 0.77 ± 0.50 1.55 0.63
η2 = 4.11 ± 3.2Glyphosate/terbuthylazine T. inodorum 0.52 <0.001 η1 = 3.31 ± 2.39 2.25 0.81
η2 = 1.54 ± 1.03S. media 0.005 <0.001 η1 = 0.71 ± 0.20 1.64 0.62
η2 = 12.12 ± 5.95L. minor <0.001 0.004 η1 = 0.82 ± 0.59 1.62 0.60
η2 = 4.34 ± 3.86P. subcapitata 0.99 No η1 = 0.69 ± 0.67 1.61 0.56
CA η2 = 23.1 ± 5.1Mesotrione/metsulfuron-methyl T. inodorum <0.001 0.85 λ = 0.93 ± 0.39 1.05 0.47
S. media 0.13 <0.001 η1 = 0.60 ± 0.21 1.49 0.59η2 = 6.46 ± 3.09
L. minor 0.002 <0.001 η1 = 0.47 ± 0.05 1.39 0.38η2 = 16.3 ± 2.9
P. subcapitata 0.005 <0.001 η1 = 0.75 ± 0.23 1.66 0.65η2 = 6.95 ± 2.87
Metsulfuron-methyl/terbuthylazine T. inodorum 0.47 0.05 λ = 0.24 ± 0.53 1.69 0.67S. media 0.98 0.02 λ = 0.35 ± 0.30 1.57 0.37L. minor <0.001 <0.001 η1 = 5.15 ± 2.35 1.74 0.67
η2 = 0.87 ± 0.24P. subcapitata <0.001 0.31 λ = 0.80 ± 0.21 1.15 0.29
Glyphosate/mecoprop T. inodorum 0.001 0.006 η1 = 27 ± 20 1.43 0.50η2 = 0.52 ± 0.20
S. media 0.003 0.14 λ = 0.56 ± 0.33 1.36 0.52L. minor 0.05 0.11 λ = 0.82 ± 0.11 1.13 0.41
Mecoprop/terbuthylazine T. inodorum 0.48 0.88 λ = 0.93 ± 0.45 1.05 0.65S. media 0.31 0.92 λ = 1.03 ± 0.40 0.98 0.60L. minor 0.31 <0.001 λ = 0.60 ± 0.11 1.32 0.50
Mecoprop/mesotrione T. inodorum 0.68 0.39 λ = 0.50 ± 0.63 1.41 0.67S. media 0.09 <0.001 η1 = 0.84 ± 28 1.78 0.69
η2 = 9.20 ± 4.20L. minor <0.001 <0.001 η1 = 4.57 ± 1.45 1.75 0.67
η2 = 0.92 ± 0.23
species are missing). Turning to mixtures affectingdifferent molecular target sites of action but eventuallyaffecting the same biological process, in this casephotosynthesis, the joint effect was less consistent.For the mixture of acifluorfen and diquat, antagonisticeffects were observed for all species, while for themixture of terbuthylazine and diquat a significant
antagonistic effect was found for the two terrestrialspecies while the other two species followed CA(Table 3; Fig. 2). The data for acifluorfen and diquattested on S. media could not be described with thestatistical model. For the remaining six combinationsof herbicides with different molecular sites and modesof action, no significant trend in terms of CA or
Pest Manag Sci 63:282–295 (2007) 289DOI: 10.1002/ps

N Cedergreen et al.
T. inodurum S. media L. minor P. subcapitata
0 2 8 12
050
150
050
150
Diquat (g ha-1)
Ter
buth
ylaz
ine
(g h
a-1)
0 10 15
Diquat (g ha-1)
Ter
buth
ylaz
ine
(g h
a-1)
0 10 20 30
Diquat (µg L-1)
Ter
buth
ylaz
ine
(µg
L-1)
0 100 200 300
020
4060
Diquat (µg L-1)
Ter
buth
ylaz
ine
(µg
L-1)
0 150
010
0030
00
Acifluorfen (g ha-1)
Diq
uat (
g ha
-1)
0 100 300 500
010
3050
Acifluorfen (µg L-1)
Diq
uat (
µg L
-1)
0 200 400 600
050
100
200
Acifluorfen (µg L-1)
Diq
uat (
µg L
-1)
4 6 5
040
8012
0
5
50
Figure 2. Isobolograms of mixtures of herbicides with dissimilar molecular target sites but all affecting photosynthesis tested on the two terrestrialplants Tripleurospermium inodorum and Stellaria media, the aquatic plant Lemna minor and the alga Pseudokirchneriella subcapitata. The solidcurve describes the fitted isobole and the dotted line describes the fitted CA isobole. Data are given ±SE of the individually fitted curves.
antagonistic responses was found. The mixture ofglyphosate and terbuthylazine showed antagonism inall test systems, but for the other five mixtures at leastone of the test systems showed a response significantly
different from the remaining two or three test systems(Table 3; Figs 3 and 4).
For 16 out of the 34 mixture toxicity studies pre-sented, the slopes of the dose–response curves forming
T. inodurum S. media L. minor P. subcapitata
0 150 250
020
4060
Terbuthylazine (g ha-1)
Gly
phos
ate
(g h
a-1)
0 50 150
010
2030
40
Terbuthylazine (g ha-1)
Gly
phos
ate
(g h
a-1)
0 100 300
010
000
2000
0
Terbuthylazine (µg L-1)
Gly
phos
ate
(µg
L-1)
200
050
0015
000
Terbuthylazine (µg L-1)
Gly
phos
ate
(µg
L-1)
0.0 1.0 2.0 3.0
0.00
0.10
Mesotrione (g ha-1)
Met
sulfu
ron-
met
hyl
(g h
a-1)
0.00
0.02
0.04
Mesotrione (g ha-1)
Met
sulfu
ron-
met
hyl
(g h
a-1)
0 2 4 6
Mesotrione (µg L-1)
Met
sulfu
ron-
met
hyl
(µg
L-1)
0 5000 15000
040
080
0
Mesotrione (µg L-1)
Met
sulfu
ron-
met
hyl
(µg
L-1)
0 50 150 250
0.00
0.10
0.20
0.30
Terbuthylazine (g ha-1)
Met
sulfu
ron-
met
hyl
(g h
a-1)
0 50 100 200
0.00
0.04
0.08
Terbuthylazine (g ha-1)
Met
sulfu
ron-
met
hyl
(g h
a-1)
0 50 150 250
0.0
0.2
0.4
0.6
Terbuthylazine (µg L-1)
Met
sulfu
ron-
met
hyl
(µg
L-1)
0
010
0020
00
Terbuthylazine (µg L-1)
Met
sulfu
ron-
met
hyl
(µg
L-1)
50 0 50 100
0.0 0.2 0.4 0.6 0.8
0.0
0.5
1.0
1.5
1 3 5
20 40 60 80
Figure 3. Isobolograms of mixtures of herbicides with dissimilar molecular target sites and different overall modes of action tested on the twoterrestrial plants Tripleurospermium inodorum and Stellaria media, the aquatic plant Lemna minor and the alga Pseudokirchneriella subcapitata. Thesolid curve describes the fitted isobole and the dotted line describes the fitted CA isobole. Data are given ±SE of the individually fitted curves.
290 Pest Manag Sci 63:282–295 (2007)DOI: 10.1002/ps

Risk assessment of herbicide mixtures
T. inodurum S. media L. minor
0 10 30 50 0 10 30 50
0
Mecoprop (g ha-1)
Gly
phos
ate
(g h
a-1)
010
1520
Mecoprop (g ha-1)
Gly
phos
ate
(g h
a-1)
0 4000 8000
010
000
2500
0
Mecoprop (µg L-1)
Gly
phos
ate
(µg
L-1)
015
25
Terbuthylazine (g ha-1)
Mec
opro
p (g
ha-1
)
150
01
23
4
Terbuthylazine (g ha-1)
Mec
opro
p (g
ha-1
)
020
0060
00
Terbuthylazine (µg L-1)
Mec
opro
p (µ
g L-1
)
0 10 15
050
100
150
Mesotrione (g ha-1)
Mec
opro
p (g
ha-1
)
0.0 0.5 1.0 1.5
010
1520
Mesotrione (g ha-1)
Mec
opro
p (g
ha-1
)
0 10 15 20 25
010
000
2000
0
Mesotrione (µg L-1)
Mec
opro
p (µ
g L-1
)
2040
60
5
5
0 20 60 100 0 50 100 1500 50 100
5
5
5
Figure 4. Isobolograms of mixtures of herbicides with dissimilar molecular target sites and different overall modes of action tested on the twoterrestrial plants Tripleurospermium inodorum and Stellaria media and the aquatic plant Lemna minor. The alga Pseudokirchneriella subcapitata isnot susceptible to mecoprop. The solid curve describes the fitted isobole and the dotted line describes the fitted CA isobole. Data are given ±SE ofthe individually fitted curves.
the dose–response surface were not significantly dif-ferent. This means that the joint effect of the herbicidesfor these mixtures will be the same at any other effectlevel, such as ED/EC10 or ED/EC90.
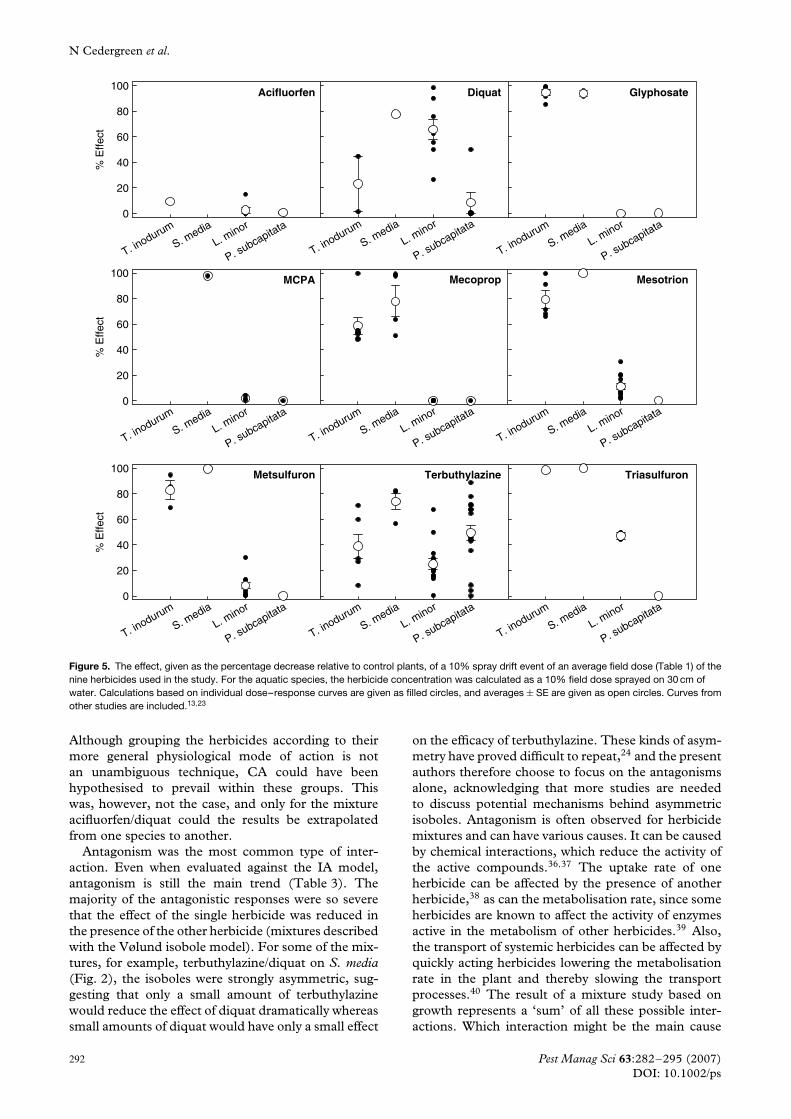
3.2 Comparison of sensitivityFor the herbicides glyphosate, MCPA, mecoprop,mesotrione, metsulfuron-methyl and triasulfuron, a10% spray drift event would have a more than 80%effect on the terrestrial species while practically leavingthe aquatic species unharmed. The exceptions aremecoprop, which has an effect on T. inodorum ofapproximately 60%, and triasulfuron, which wouldaffect L. minor with approximately 50% (Fig. 5).MCPA and mecoprop were not tested on algae in thisstudy, as previous experiments had shown that theseherbicides do not affect algal growth at concentrationsup to 100 mg L−1.13 The effect was therefore set tozero. A spray drift event of acifluorfen would have aless than 20% effect on all the tested species, whilediquat and terbuthylazine would affect all species withmore than 20%, the average effect of diquat on algaebeing a little less.
4 DISCUSSION4.1 Binary mixturesThe study showed that the effects of herbicide mixturesdo depend on the species tested. The dependence was,however, not systematic, in the sense that none ofthe species or test systems (terrestrial versus aquatic)had a significantly higher probability of showingsynergistic or antagonistic responses than another.This is contrary to what was expected, especially sincethe herbicides tested in the aquatic test systems weretechnical products and therefore were devoid of thepotential of enhancing the effect of each other viathe formulation constituents, e.g. adjuvants added tothe commercial products.10,11 The results support thefindings of lack of influence of herbicide formulationin the aquatic environment that were observed inprevious studies on single herbicides.13 The lack ofconsistency in response to herbicide mixtures betweenspecies and test systems also implies that only insome cases can mixture toxicity results be extrapolatedfrom one species to the other. It can be donefor mixtures of herbicides with the same moleculartarget site, which all followed CA as predicted.14
Pest Manag Sci 63:282–295 (2007) 291DOI: 10.1002/ps
N Cedergreen et al.
T. inodurum
S. media
L. minor
P. subcapitata
T. inodurum
S. media
L. minor
P. subcapitata
T. inodurum
S. media
L. minor
P. subcapitata
% E
ffect
0
20
40
60
80
100
T. inodurum
S. media
L. minor
P. subcapitata
T. inodurum
S. media
L. minor
P. subcapitata
T. inodurum
S. media
L. minor
P. subcapitata
T. inodurum
S. media
L. minor
P. subcapitata
T. inodurum
S. media
L. minor
P. subcapitata
T. inodurum
S. media
L. minor
P. subcapitata
Acifluorfen Diquat Glyphosate%
Effe
ct
0
20
40
60
80
100MCPA Mecoprop Mesotrion
% E
ffect
0
20
40
60
80
100 Metsulfuron Terbuthylazine Triasulfuron
Figure 5. The effect, given as the percentage decrease relative to control plants, of a 10% spray drift event of an average field dose (Table 1) of thenine herbicides used in the study. For the aquatic species, the herbicide concentration was calculated as a 10% field dose sprayed on 30 cm ofwater. Calculations based on individual dose–response curves are given as filled circles, and averages ± SE are given as open circles. Curves fromother studies are included.13,23
Although grouping the herbicides according to theirmore general physiological mode of action is notan unambiguous technique, CA could have beenhypothesised to prevail within these groups. Thiswas, however, not the case, and only for the mixtureacifluorfen/diquat could the results be extrapolatedfrom one species to another.
Antagonism was the most common type of inter-action. Even when evaluated against the IA model,antagonism is still the main trend (Table 3). Themajority of the antagonistic responses were so severethat the effect of the single herbicide was reduced inthe presence of the other herbicide (mixtures describedwith the Vølund isobole model). For some of the mix-tures, for example, terbuthylazine/diquat on S. media(Fig. 2), the isoboles were strongly asymmetric, sug-gesting that only a small amount of terbuthylazinewould reduce the effect of diquat dramatically whereassmall amounts of diquat would have only a small effect
on the efficacy of terbuthylazine. These kinds of asym-metry have proved difficult to repeat,24 and the presentauthors therefore choose to focus on the antagonismsalone, acknowledging that more studies are neededto discuss potential mechanisms behind asymmetricisoboles. Antagonism is often observed for herbicidemixtures and can have various causes. It can be causedby chemical interactions, which reduce the activity ofthe active compounds.36,37 The uptake rate of oneherbicide can be affected by the presence of anotherherbicide,38 as can the metabolisation rate, since someherbicides are known to affect the activity of enzymesactive in the metabolism of other herbicides.39 Also,the transport of systemic herbicides can be affected byquickly acting herbicides lowering the metabolisationrate in the plant and thereby slowing the transportprocesses.40 The result of a mixture study based ongrowth represents a ‘sum’ of all these possible inter-actions. Which interaction might be the main cause
292 Pest Manag Sci 63:282–295 (2007)DOI: 10.1002/ps

Risk assessment of herbicide mixtures
of an antagonistic response can only be revealed byfurther study. In this study, we do not find it likelythat the majority of the antagonism stems from chem-ical interactions, as it then would be expected tobe consistent across species. Antagonism was consis-tent across species for the mixtures acifluorfen/diquatand glyphosate/terbuthylazine, and the uptake of bothglyphosate and the diquat analogue paraquat hasbeen observed to decrease owing to chemical inter-actions outside the plants.36,41 For these mixtures,chemical interactions might therefore be a possibility.On the other hand, for the glyphosate/terbuthylazinemixture it is also likely that the PSII inhibitor ter-buthylazine has rapidly damaged the photosyntheticprocesses, thereby impairing the transport of themore slowly acting systemic herbicide glyphosate.This type of action could also be expected for thecombinations terbuthylazine/metsulfuron-methyl andterbuthylazine/mecoprop, the latter herbicides beingslowly acting systemic herbicides like glyphosate. Justas the mixtures mesotrione/metsulfuron-methyl andmesotrione/mecoprop could be expected to showantagonistic joint effects, since mesotrione is a quicklyacting herbicide that could decrease the efficacy of theslowly working ones. Antagonism was indeed observedin three out of the four terbuthylazine/metsulfuron-methyl mixtures and in five out of the seven mesotrionemixtures, which supports the hypothesis of quicklyacting herbicides impairing the effect of more slowlyacting systemic herbicides. The mixture of terbuthy-lazine and mecoprop in the terrestrial species didnot deviate from CA. This could, however, just aswell be due to lack of data, as the mixture ratioswere not properly distributed over the dose–responsesurface, as it could be caused by a true additiveresponse.
4.2 Risk assessment of mixturesWith regard to the consequences for risk assess-ment of herbicide mixtures, the lack of significantsynergy between any of the combinations of herbi-cides representing the most widely used sites andmodes of action for the control of broadleaved weeds(http://www.eppo.org/PPPRODUCTS/products.htm[September 2005]) is the most significant result. Thismeans that, even though not all mixture effects werewell predicted by CA, a worst-case hazard assessmentfor mixtures of herbicides on plants can be madeusing the model of CA both for the terrestrial andthe aquatic environment, knowing that overestimatingrisk is the most likely scenario. The validity of themodel of CA as a conservative estimate for assess-ing mixtures on algae has been established in otherstudies.6 Less work has been done on higher aquaticplants, but also here CA appears to provide a con-servative estimate of mixture effects of pesticides andother organic compounds.42,43 In a review on herbi-cide interactions with other pesticides on terrestrialplants, Hatzios and Penner44 reported that additive,antagonistic as well as synergistic interactions have
been found for binary mixtures of herbicides. In onlya few of these studies, CA was used as the referencemodel. In the majority of the studies, IA was appliedin the form of Colby’s method,45 a simplified versionthat does not require the estimation of dose–responsecurves. Hence, it is difficult to compare the resultsof the present studies with the majority of previousstudies on terrestrial plants. However, CA was usedby the present authors to assess the combined effectsof various combinations of pesticides.9,46–48 With oneexception, additivity or antagonism was reported in allof these studies. The findings of previous studies onterrestrial plants, applying CA as the reference model,are therefore in agreement with the findings of thepresent study.
4.3 Comparison of sensitivityIt was demonstrated that, for all nine herbicidestested, terrestrial plants were far more vulnerableto a 10% spray drift event than L. minor and thetested alga species. Only for diquat and terbuthylazinewere the toxic effects approximately equal between thetwo groups of species. This result is consistent withprevious database studies relating aquatic toxicity tothe mean recommended field dose.13 Large species-specific differences in sensitivity towards herbicidesare of course present for terrestrial plants, where theyform the basis of using selective herbicides, for thevarious different alga species49 and to a smaller degreefor aquatic macrophytes.26,50 Using other speciescould therefore turn the pattern. Nonetheless, thepattern is considered very convincing, and, combinedwith the fact that terrestrial plants are often ‘in thefront line’ when it comes to spray drift, it must beconcluded that terrestrial plants are very vulnerableto unintended herbicide exposure. Terrestrial plantsshould therefore be given a higher priority in therisk assessment procedure than is presently the case,where data on terrestrial non-target species are onlysuggested. It must be added that aquatic speciesare exposed to pesticides not only via spray driftevents but also through leaching and surface runoffof pesticides. The magnitude of the leaching andrunoff depends on climatic, topographic and soilconditions, but both modelled and measured datashow that these concentrations do not exceed theconcentrations obtained by a 10% spray drift eventon a 30 cm water column for the used herbicides.51–53
We therefore consider a spray drift event a realisticworst case for aquatic plants also. On the other hand,although aquatic plants are not likely to encountersuch high concentrations of a few chemicals asterrestrial non-target plants, they are more likely tobe exposed to a larger number of pesticides owingto combinations of drift, leaching and runoff from alarge area.52 This is a problem that is not yet dealtwith on a regulatory basis when it comes to hazardassessment, but which this and earlier studies confirmcan be tackled using the concept of concentrationaddition.
Pest Manag Sci 63:282–295 (2007) 293DOI: 10.1002/ps

N Cedergreen et al.
ACKNOWLEDGEMENTSThe authors are grateful to BASF, Ciba A/S,DuPont, Intertrade A/S, Klarsoe & Co, Monsantoand Syngenta for providing technical as well asformulated herbicides. Also, Helle Sørensen should beacknowledged for her great help through all work withthe statistical program R. The work was supported bythe Danish Environmental Protection Agency (GrantNo. M 7041-0468).
REFERENCES1 Boutin C, Lee HB, Peart ET, Batchelor PS and Maguire RJ,
Effects of the sulfonylurea herbicide metsulfuron-methyl ongrowth and reproduction of five wetland and terrestrial plantspecies. Environ Toxicol Chem 19:2532–2541 (2000).
2 Cedergreen N, Streibig JC and Spliid NH, Sensitivity of aquaticplants to the herbicide metsulfuron-methyl. Ecotox EnvironSaf 57:153–161 (2004).
3 Mougin C, Polge N, Scalla R and Cabanne F, Interactions ofvarious agrochemicals with cytochrome P-450-dependentmonooxygenases of wheat cells. Pestic Biochem Physiol40:1–11 (1991).
4 Varsano R, Rabinowitch HD and Ruben B, Mode of actionof piperonyl butoxide as herbicide synergist of atrazine andterbutryn in maize. Pestic Biochem Physiol 44:174–182 (1992).
5 Cedergreen N and Streibig JC, Can the choice of endpointlead to contradicting results of mixture toxicity experiments?Environ Toxicol Chem 24:1676–1683 (2005).
6 Faust M and Scholze M, Competing concepts for the predictionof mixture toxicity: do the differences matter for regulatorypurposes? EVKI-CT1999-00012, EU project BEAM. Finalreport. European Commission, Brussels, Belgium, pp. 2–62(2004).
7 Cedergreen N, Kamper A and Streibig JC, Is prochloraz apotent synergist across species? A study on bacteria, daphnia,algae and higher plants. Aquat Toxicol 78:243–252 (2006).
8 Faust M, Altenburger R, Boedeker W and Grimme LH, Algaltoxicity of binary combinations of pesticides. Bull EnvironContam Toxicol 53:134–141 (1994).
9 Streibig JC and Jensen JE, Action of herbicides in mixtures, inHerbicides and their Mechanisms of Action, ed. by Cobb AHand Kirkwood RC. Sheffield Academic Press, Sheffield,pp. 153–180 (2000).
10 Kudsk P and Mathiassen SK, Effects of broadleaf herbicides onimazamethabenz-methyl performance on Avena fatua. WeedRes 34:251–263 (1994).
11 Van Valkenburg W, Pesticide Formulations. Marcel Dekker, NewYork, pp. 1–481 (1973).
12 Streibig JC, Rudemo M and Jensen JE, Dose–response curvesand statistical models, in Herbicide Bioassay, ed. by Streibig JCand Kudsk P. CRC Press, Boca Raton, FL, pp. 29–55(1993).
13 Cedergreen N and Streibig JC, The toxicity of herbicides tonon-target aquatic plants and algae: assessment of predictivefactors and hazard. Pest Manag Sci 61:1152–1160 (2005).
14 Greco WR, Bravo G and Parsons JC, The search for synergy: acritical review from a response surface perspective. PharmacolRev 47:332–385 (1995).
15 Berenbaum MC, What is synergy? Pharmacol Rev 41:93–141(1989).
16 Faust M, Altenburger R, Backhaus T, Blanck H, Boedeker W,Gramatica P, et al, Joint algal toxicity of 16 dissimilarly actingchemicals is predictable by the concept of independent action.Aquat Toxicol 63:43–63 (2003).
17 Berenbaum MC, The expected effect of a combination of agents:the general solution. J Theoret Biol 114:413–431 (1985).
18 Altenburger R, Backhaus T, Boedeker W, Faust M, Scholze Mand Grimme LH, Predictability of the toxicity of multi-ple chemical mixtures to Vibrio fischeri: mixtures composed
of similarly acting chemicals. Environ Toxicol Chem19:2341–2347 (2000).
19 Backhaus T, Altenburger R, Boedeker W, Faust M, Scholze Mand Grimme LH, Predictability of the toxicity of multiplemixtures of dissimilarly acting chemicals to Vibrio fischeri.Environ Toxicol Chem 19:2348–2356 (2000).
20 Faust M, Altenburger R, Backhaus T, Blanck H, Boedeker W,Gramatica P, et al, Predicting the joint algal toxicity of multi-component s-triazine mixtures at low-effect concentrations ofindividual toxicants. Aquat Toxicol 56:13–32 (2001).
21 OECD guideline for testing of chemicals. Terrestrial plant test:vegetative vigour test. OECD, pp. 1–16 (2003).
22 Water quality – duckweed growth inhibition. ISO/WD 20079.International Organisation for Standardisation, Geneva,pp. 1–18 (2004).
23 Cedergreen N, Andersen L, Olesen CF, Spliid NH and StreibigJC, Does the effect of herbicide pulse exposure on aquaticplants depend on Kow or mode of action? Aquat Toxicol71:261–271 (2004).
24 Cedergreen N, Kudsk P, Mathiassen SK, Sørensen H andStreibig JC, The reproducibility of binary mixture toxicitystudies. Environ Toxicol Chem 26(1):149–156.
25 Tomlin CDS, The e-Pesticide Manual. [2.2]. British CropProtection Council, Surrey, UK (2002).
26 Cedergreen N, Streibig JC and Spliid NH, Species specificsensitivity of aquatic macrophytes towards herbicides.Ecotoxicol Environ Saf 58:314–323 (2004).
27 Maeng J and Khudairi AK, Studies on the flowering mechanismof Lemna I. Amino acid changes during flower induction.Physiol Plant 28:264–270 (1973).
28 Mayer P, Cuhel R and Nyholm N, A simple in vitro fluorescencemethod for biomass measurements in algal growth inhibitiontests. Water Res 31:2525–2561 (1997).
29 Water quality – fresh water algal growth inhibition test withScenedesmus subspicatus and Selenastrum capricornutum. Inter-national Organisation for standardisation 28692, Geneva,pp. 1–5 (1989).
30 Sørensen H, Cedergreen N, Skovgaard I and Streibig JC,An isobole-based statistical model and test for syner-gism/antagonism in binary mixture toxicity experiments.Environ Ecol Stat 14:(in press).
31 R: A Language and Environment for Statistical Computing. RDevelopment Core Team, R Foundation for StatisticalComputing, Vienna, Austria (2004).
32 Hewlett PS, Measurement of the potency of drug mixtures.Biometrics 5:478–487 (1969).
33 Vølund A, Dose–response surface bioassay, in XVIth Interna-tional Biometric Conference, Hamilton, New Zealand, pp. 249(1992).
34 Altenburger R, Bodeker W, Faust M and Grimme LH, Evalua-tion of the isobologram method for the assessment of mixturesof chemicals. Ecotoxicol Environ Saf 20:98–114 (1990).
35 Sokal RR and Rohlf FJ, Biometry. WH Freeman and Company,New York, pp. 1–849 (1995).
36 Wehtje GR, Wilcut JW, Dylewski DP, McGuire JA andHicks TV, Antagonism of paraquat phytotoxicity in peanuts(Arachis-Hypogaea) and selected weed species by naptalam.Weed Sci 39:634–639 (1991).
37 Richter M and Escher BI, Mixture toxicity of reactive chemicalsby using two bacterial growth assays as indicators of proteinand DNA damage. Environ Sci Technol 39:8753–8761 (2005).
38 Wehtje G, Wilcut JW and McGuire JA, Paraquat phytotoxicity,absorption and translocation in peanut and selected weeds asinfluenced by cloramben. Weed Sci 40:471–476 (1992).
39 Ottis BV, Mattice JD and Talbert RE, Determination ofantagonism between cyhalofop-butyl and other rice (Oryzasativa) herbicides in barnyardgrass (Echinochloa crus-galli). JAgric Food Chem 53:4064–4068 (2005).
40 Scherder EE, Talbert RE and Lovelace ML, Antagonism ofcyhalofop grass activity by halosulfuron, triclopyr, andpropanil. Weed Technol 19:934–941 (2005).
294 Pest Manag Sci 63:282–295 (2007)DOI: 10.1002/ps

Risk assessment of herbicide mixtures
41 Thelen KD, Jackson EP and Penner D, The basis for hardwater antagonism of glyphosate activity. Weed Sci 43:541–548(1995).
42 Drost W, Backhaus T, Vassilakaki M and Grimme LH, Mixturetoxicity of s-triazines to Lemna minor under conditions ofsimultaneous and sequential exposure. Fresenius Environ Bull12:601–607 (2003).
43 Frankart C, Eullaffroy P and Vernet G, Photosynthetic responsesof Lemna minor exposed to xenobiotics, copper, and theircombinations. Ecotoxicol Environ Saf 53:439–445 (2002).
44 Hatzios KK and Penner D, Interactions of herbicides with otheragrochemicals in higher plants. Rev Weed Sci 1:1–63 (1985).
45 Colby SR, Calculating synergistic and antagonistic responses ofherbicide concentrations. Weeds 15:20–22 (1967).
46 Mathiassen SK and Kudsk P, Joint action of sulfonylureaherbicides and MCPA. Weed Res 33:441–447 (1993).
47 Kudsk P and Mathiassen SK, Joint action of tribenuron andother broadleaf herbicides, in Understanding Crop ProtectionMixtures, ed. by Baylis AD and Chapman PF. The Associationof Applied Biologists, Warwick, UK, pp. 95–102 (1995).
48 Kudsk P and Mathiassen SK, Joint action of amino acidbiosynthesis-inhibiting herbicides. Weed Res 44:313–322(2004).
49 Nystrom B, Bjornsater B and Blanck H, Effects of sulfunylureaherbicides on non-target aquatic micro-organisms. Growthinhibition of microalgae and short-term inhibition of adenineand thymine incorporation in periphyton communities. AquatToxicol 47:9–22 (1999).
50 Brock TCM, Crum SJH, Deneer JW, Heimbach F, Roijack-ers RMM and Sineldam JA, Comparing aquatic risk assess-ment methods for the photosynthesis-inhibiting herbicidesmetributin and matamitron. Environ Pollut 130:403–426(2004).
51 Bøgestrand J, Vandløb. National Environmental Research Insti-tute, Silkeborg, Denmark, pp. 1–52 (2003).
52 Martin JD, Crawford CG and Larson SJ. Pesticides in Streams.National Water Assessment Program (NAWQA), USA,pp. 1–5 (2003).
53 Huber A, Bach M and Frede HG, Modeling pesticide losseswith surface runoff in Germany. Sci Total Environ223:177–191 (1998).
Pest Manag Sci 63:282–295 (2007) 295DOI: 10.1002/ps