ROMANIAN ACCOMMODATION ESTABLISHMENTS – AN INVESTIGATION REGARDING THE REASONS FOR THEIR...
128
NEGOTIA 1/2011
Transcript of ROMANIAN ACCOMMODATION ESTABLISHMENTS – AN INVESTIGATION REGARDING THE REASONS FOR THEIR...
NEGOTIA1/2011
The current issue of Studia Negotia is dedicated to the papers presented at
THE INTERNATIONAL CONFERENCE
ENTREPRENEURSHIP IN THE
HOSPITALITY
INDUSTRY
First Edition
2010, October 14 - 15 Cluj-Napoca, România
Organized by the Faculty of Business
ANUL LVI 2011
S T U D I A
UNIVERSITATIS BABE Ş–BOLYAI
NEGOTIA 1
Desktop Editing Office: 51ST B.P. Hasdeu, Cluj-Napoca, Romania, Phone + 40 264-40.53.52
CUPRINS – CONTENT – SOMMAIRE – INHALT
CORNELIA POP, MARIA MONICA COROS, Romanian Accommodation Establishments – An Investigation Regarding the Reasons for their Development ................................................................................................... 5
RUXANDRA-MĂLINA PETRESCU-MAG, DACINIA CRINA PETRESCU, Consumer Protection Using the Legal Instrument of Infringement, in Order to Sanction Member States Failure to Fulfill Obligations of Directive 93/13 EEC on Unfair Terms in Consumer Contracts .......................................... 29
JANETTA SÎRBU, NICOLAE MĂRGINEAN, FLORIN RADU PINTEA, OANA ELEONORA GLOGOVEŢAN, The Quality of the Services Offered by the Rural Touristic Pensions from Gârda de Sus (The Apuseni Mountains) ...........................................................................................................41
VALENTIN TOADER, The Economic Effects of Tourism: The Case of Romanian Economy ....................................................................................................... 53
IOAN ALIN NISTOR, Tourism and Transportation Market Trends in Japan. Behavioral Aspects........................................................................................ 67
MIHAELA TUTUNEA, VERONICA RUS, Mobile-Tourism in Romania ........... 77 RÁDULY ISTVÁN, PARTENIE DUMBRAVĂ, Changes in Tourism Consumer
Behavior ........................................................................................................ 89 CRISTINA FLEŞERIU, The Comparative Analysis Regarding the Services
Offered by the International Hotel Chains from Romania .......................... 105
STUDIA UNIVERSITATIS BABEŞ-BOLYAI, NEGOTIA, LVI, 1, 2011
ROMANIAN ACCOMMODATION ESTABLISHMENTS – AN INVESTIGATION REGARDING THE REASONS
FOR THEIR DEVELOPMENT
CORNELIA POP1, MARIA MONICA COROS2
ABSTRACT. The number of Romanian hotels and other types of accommodation establishments has increased steadily over the past 10 years. However, the number of tourists, either domestic or foreign, has not increased at the same pace. Romania’s position in available rankings, regarding the number of incoming tourist, their spending or referring to tourism competitiveness, is constantly overtaken by any of the neighboring countries. At the same time, the occupancy rate for Romanian accommodation establishments was constantly under 50 % (as reported by the Romanian National Institute of Statistics), and the average length of stay is also decreasing. Taking into account only these directly observable factors, one naturally asks: Which are the motives that support the numeric growth of hotels and other types of accommodation facilities, while their overall performances remain low?. The present paper will try to identify several of the motives behind the development of the Romanian hotel sector using indirect observations and data available in Romanian media. A special focus regards the behaviors and attitudes of the main investors in this field. Keywords: hospitality, industry, investment, behavior, development, Romania. JEL Classification: L83 1. Introduction
The process of developing and operating a hotel/ accommodation establishment is a complex one and can be driven by a number of factors. The owner’s objectives are among these factors and might be very important in the long run for the property management style and future strategy.
McDonough (2001) considers the following as being some of the major reasons for undertaking a hotel/ accommodation establishment project: 1 Professor PhD, Universitatea Babeş-Bolyai din Cluj-Napoca, Faculty of Business,
[email protected]. 2 Teaching Assistant, PhD Candidate, Universitatea Babeş-Bolyai din Cluj-Napoca, Faculty of
Business, [email protected].

CORNELIA POP, MARIA MONICA COROS
6
- to realize a return on the investment, such as that one which might be derived from a real estate investment trust (or REIT);
- to establish a new hotel brand in a new location; - to rebrand an existing location from one operator to another by outright
acquisition or merger; - to create a destination hotel in a new area; - to build as part of a large development deal (such as a hotel attached to a
sports complex or a convention center); or - to have a trophy or a vanity property.
While the Romanian hospitality industry is not so complex to involve the presence of REITs, the aspects of hotels or other accommodation establishments being real estate investments did not escape to Romanian business people. As follows, all the motives listed by McDonough were considered in the present research.
Romania’s Position as a Tourist Destination Using the UNWTO data for international tourist arrivals and for travel
expenditures, among its neighboring countries Romania ranks on the last place (except for 1995), as the following table shows:
Table No 1.
Table No 1. Romania as an International Tourist Destination
International Arrivals (thousands) Country 1995 2000 2005 2007 2008
Bulgaria 3466 2785 4837 5151 5780 Croatia 1485 5831 8467 9307 9415 Czech Rep 3381 4773 6336 6680 6649 Hungary 2878 2992 9979 8638 8814 Poland 19215 17400 15200 14975 12960 Romania 762 866 1430 1551 1466 Slovakia 903 1053 1515 1685 1767 Slovenia 732 1090 1555 1751 1771 Travel Expenditure in the Country (million USD) Country 1995 2000 2005 2007 2008 Bulgaria 473 1074 2412 3130 3804 Croatia 1349 2758 7370 9233 11267 Czech Rep 2880 2973 4676 6637 7719 Hungary 2928 3733 4120 4739 6033 Poland 6614 5677 6274 10599 11771 Romania 590 335 1052 10606 1192 Slovakia 623 433 1210 2026 2584 Slovenia 1084 961 1795 2218 3074
Source: http://data.un.org/DocumentData.aspx?q=tourism&id=168.
ROMANIAN ACCOMMODATION ESTABLISHMENTS – AN INVESTIGATION REGARDING THE REASONS …
7
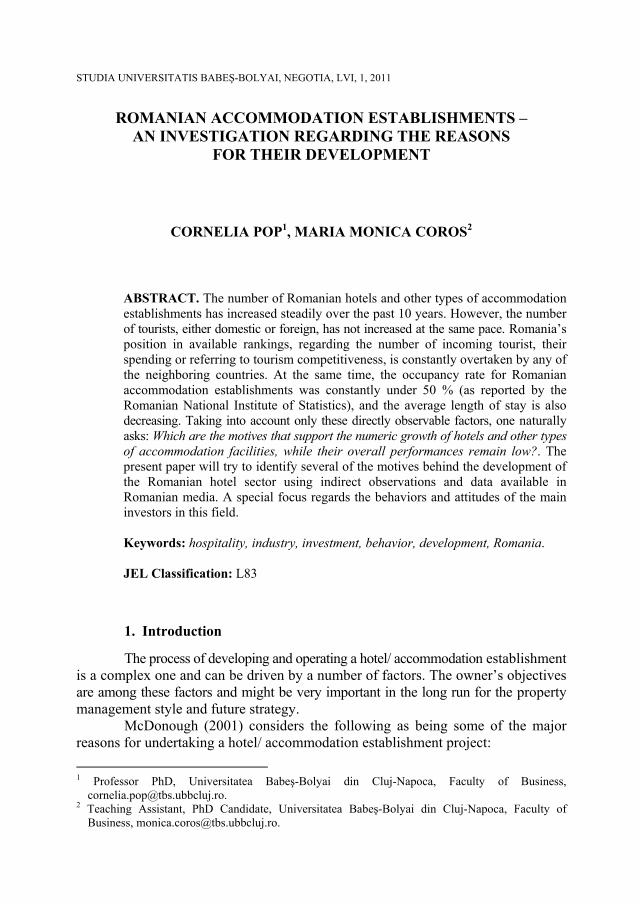
Another source of data that indicates a poor position for Romania is the World Economic Forum through its “Travel and Tourism Competitiveness Index”. According to these calculations, Romania ranks again on the last position among the neighboring countries which (also) are its direct competitors in attracting tourists:
Table No 2.
Romania’s Competitiveness as a Tourist Destination
Country 2007
Rank out of 124 countries
2008 Rank out of 130 countries
2009 Rank out of 133
countries Bulgaria 54 43 50 Croatia 38 34 34 Czech Rep. 35 30 26 Hungary 40 33 38 Poland 63 56 58 Romania 76 69 66 Slovakia 37 38 46 Slovenia 44 36 35
Source: World Economic Forum.
General Presentation of the Accommodation Establishments’ Evolution in Romania
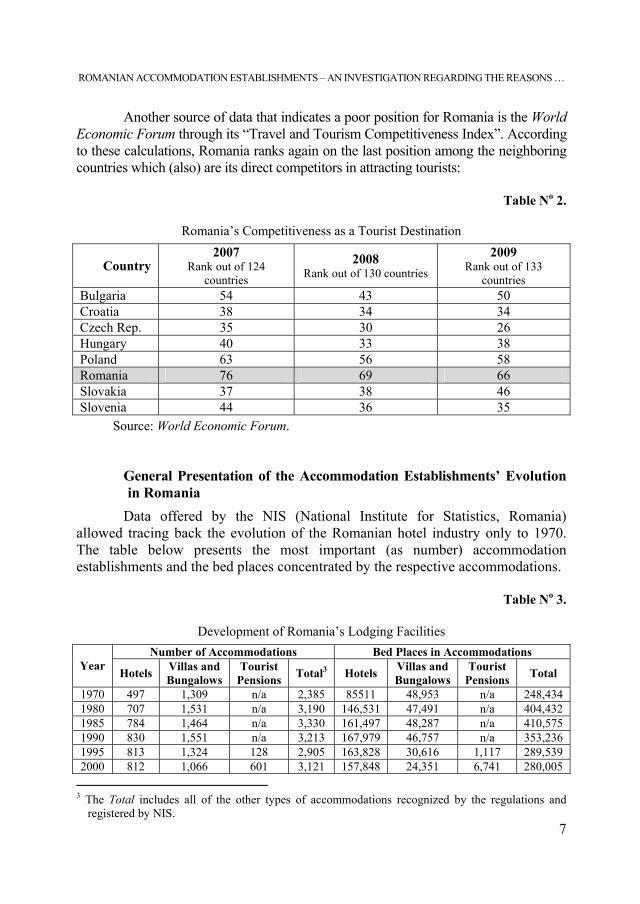
Data offered by the NIS (National Institute for Statistics, Romania) allowed tracing back the evolution of the Romanian hotel industry only to 1970. The table below presents the most important (as number) accommodation establishments and the bed places concentrated by the respective accommodations.
Table No 3.
Development of Romania’s Lodging Facilities
Number of Accommodations Bed Places in Accommodations Year Hotels Villas and
Bungalows Tourist
Pensions Total3 Hotels Villas and Bungalows
Tourist Pensions Total
1970 497 1,309 n/a 2,385 85511 48,953 n/a 248,434 1980 707 1,531 n/a 3,190 146,531 47,491 n/a 404,432 1985 784 1,464 n/a 3,330 161,497 48,287 n/a 410,575 1990 830 1,551 n/a 3,213 167,979 46,757 n/a 353,236 1995 813 1,324 128 2,905 163,828 30,616 1,117 289,539 2000 812 1,066 601 3,121 157,848 24,351 6,741 280,005 3 The Total includes all of the other types of accommodations recognized by the regulations and
registered by NIS.
CORNELIA POP, MARIA MONICA COROS
8
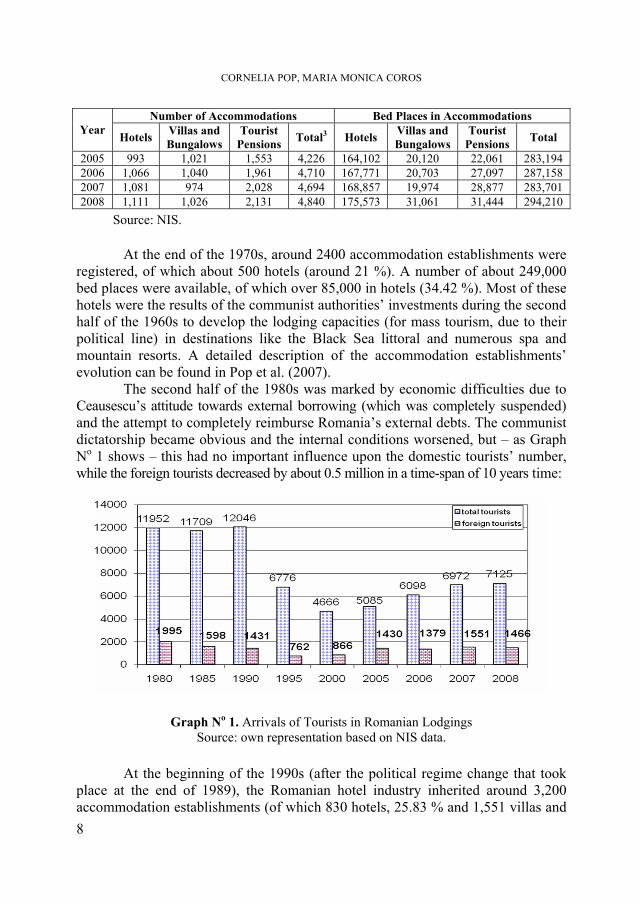
Number of Accommodations Bed Places in Accommodations Year Hotels Villas and
Bungalows Tourist
Pensions Total3 Hotels Villas and Bungalows
Tourist Pensions Total
2005 993 1,021 1,553 4,226 164,102 20,120 22,061 283,194 2006 1,066 1,040 1,961 4,710 167,771 20,703 27,097 287,158 2007 1,081 974 2,028 4,694 168,857 19,974 28,877 283,701 2008 1,111 1,026 2,131 4,840 175,573 31,061 31,444 294,210
Source: NIS.
At the end of the 1970s, around 2400 accommodation establishments were registered, of which about 500 hotels (around 21 %). A number of about 249,000 bed places were available, of which over 85,000 in hotels (34.42 %). Most of these hotels were the results of the communist authorities’ investments during the second half of the 1960s to develop the lodging capacities (for mass tourism, due to their political line) in destinations like the Black Sea littoral and numerous spa and mountain resorts. A detailed description of the accommodation establishments’ evolution can be found in Pop et al. (2007).
The second half of the 1980s was marked by economic difficulties due to Ceausescu’s attitude towards external borrowing (which was completely suspended) and the attempt to completely reimburse Romania’s external debts. The communist dictatorship became obvious and the internal conditions worsened, but – as Graph No 1 shows – this had no important influence upon the domestic tourists’ number, while the foreign tourists decreased by about 0.5 million in a time-span of 10 years time:
Graph No 1. Arrivals of Tourists in Romanian Lodgings Source: own representation based on NIS data.
At the beginning of the 1990s (after the political regime change that took
place at the end of 1989), the Romanian hotel industry inherited around 3,200 accommodation establishments (of which 830 hotels, 25.83 % and 1,551 villas and

ROMANIAN ACCOMMODATION ESTABLISHMENTS – AN INVESTIGATION REGARDING THE REASONS …
9
bungalows, 49.66 %) concentrating about 353.000 bed places (of which 47.55% in hotels). The main problem was that the majority of these accommodations were in (desperate) need of extensive renovation and modernization works, while they had not benefited of this kind of investments (except for regular maintenance) for more than 10 to 15 or even 20 years.
However, nothing was done due to the very poor economic situation of the country and to the wrong attitude of the politicians, who did not proceed to any privatizations until very late. The people in charge with accommodation operations were not motivated to increase their value through proper management; thus, the establishments were only kept afloat with minimum investments for most urgent renovations needed in order to receive the authorization for functioning (reevaluated every 3 years). There must be added the fact that the access to long term bank loans was next to none due to the high inflation rate and the gloomy mood that existed in connection with the Romanian economy. To this situation, the communist way of perceiving tourists must be added – the people in charge with the accommodations and their teams rather behaved as if they offered a favor to tourists and not a service that would have been expected to offer comfort and hospitality.
As it can be concluded from Graph No 1, the number of tourists diminished dramatically between 1990 and 2000 (by 61.27 %); the main causes of this decrease were:
- the opening of the borders and the obvious choice of Romanian tourists to travel abroad after about 30 years of confinement inside national borders or, at the best, within the communist block;
- the dark image Romania managed to build abroad between 1990 and 1995 due to abandoned children in neglected orphanages, illegal adoptions, beggars, and corruption;
- the association with Bram Stocker’s Dracula, which created a lot of confusion – mainly among Romanians who did not understand how this situation could be exploited for enhancing the increase in the number of incoming tourists;
- the wrong impression of Romanian authorities, who still believed that the country was a popular tourist destination and expected foreign tourists to revisit Romania and bring more tourists along; the lack of modern accommodation and entertainment facilities seemed of no importance, and the fact that Romania’s road & railway infrastructure was (and still is) in a very poor state seemed not to be taken into account;
- the moderate to low quality of the lodging facilities was only another factor that could be added to the previous mentioned causes.
Starting with 2000, at least, the following factors influenced the increase in the number of accommodation types:
CORNELIA POP, MARIA MONICA COROS
10
- the introduction (since 1995) of tourist pensions, easier to be developed in urban and (mainly) in rural areas, which encouraged the inception for the development of rural tourism;
- the privatization process which took place inside the hotel industry between 2000 and 2004;
- the improved access to long-term bank loans; - the boom of the real estate sector which started in 2003-2004; - the introduction (starting with 1993) of a new official classification system,
using stars, which is easy to understand by all types of tourists.
As it can be seen, the number of accommodation establishments grew rapidly between 2000 and 2008, overrunning the 1990’s level. Though, the lodging capacity is still 50,000 places lower than that one registered at the level of 1990, indicating that the new accommodations that entered the market are of small capacity. This situation is confirmed by the following evolution: the number of bed places per establishment was of 104 (approximately 52 rooms) in 1970, increased to 127 (approximately 63 rooms) in 1980, decreased to 90 in 2000 (approximately 45 rooms) and reached 60 in 2008 (approximately 30 rooms). Due to the fact that Romania did not become a mass-tourism destination, the small accommodations are appropriate to its tourist offer.
Between 1990 and 2008, hotels continued to dominate the accommodation establishments in Romania; they concentrated, in average for the time-span 1990-2008, 25.22 % in the total number of establishments and 56.54% in the total bed places. While the number of pensions is higher than that of hotels, they are not important from the point of view of the lodging capacity – concentrating, in average for the period 1995-2008, only 4.63% of the total bed places.
The tourist arrivals give preference to hotels (& motels) in a quota of 81.60 % (even higher in what foreign tourists are concerned, who prefer hotels in a proportion of 92.69 %) [average data for 1994-2008].
The concentration of accommodation establishments in Romania is under the influence of the development trends launched during the communist period, when the Black Seaside was considered a very popular destination. The concentration of accommodations and bed places by tourist destinations as identified by NIS (data available only since 1993) is presented in the following table4. From a numeric point of view and due to the development of tourist pensions since 1995, the situation seems to be balanced between the Romanian littoral, mountain resorts and other destinations. From the lodging capacity’s point of view, the Black Seaside has a dominant position, being followed by the county residences (where an important weight is added by Bucharest – the Romanian capital).
4 In order to balance the number of accommodations, in the case of the Danube Delta (which from the
administrative point of view is included in Tulcea county), the county residence Tulcea was included. For the same reasons, in the case of the Romanian littoral (which is included in Constanta county), the county residence Constanta was excluded.
ROMANIAN ACCOMMODATION ESTABLISHMENTS – AN INVESTIGATION REGARDING THE REASONS …
11
Table No 4.
Romania's Tourist Destinations as Reported by NIS
Destination Accommodations
by Main Destinations
Bed Places by Main
Destinations
Total Tourist Arrivals
Foreign Tourist Arrivals
County residences5 (city of Tulcea excluded) 14.98 % 16.54 % 46.75 % 71.67 %
Littoral (Constanta county – Constanta city excluded) 22.98 % 41.69 % 12.85 % 6.35 %
Spa resorts 11.98 % 15.48 % 11.59 % 3.69 % Mountain resorts 21.44 % 12.14 % 14.38 % 8.63 % Danube Delta (city of Tulcea included) 2.45 % 1.01 % 0.97 % 1.02 %
Other destinations 26.92 % 13.39 % 13.46 % 8.63 % Source: authors’ calculation based on NIS data, average values for 1993 to 2008.
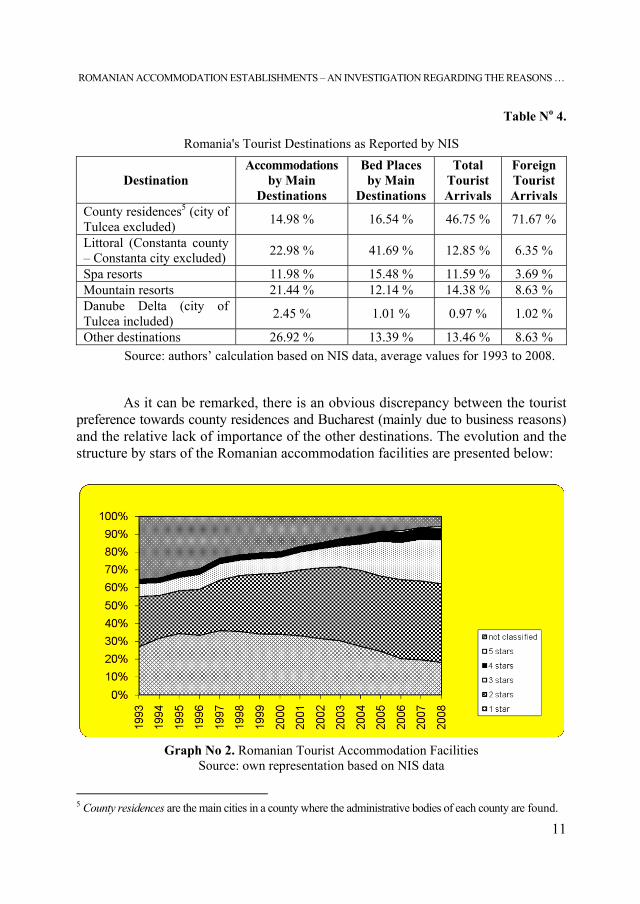
As it can be remarked, there is an obvious discrepancy between the tourist
preference towards county residences and Bucharest (mainly due to business reasons) and the relative lack of importance of the other destinations. The evolution and the structure by stars of the Romanian accommodation facilities are presented below:
Graph No 2. Romanian Tourist Accommodation Facilities
Source: own representation based on NIS data
5 County residences are the main cities in a county where the administrative bodies of each county are found.

CORNELIA POP, MARIA MONICA COROS
12
The 5 star lodgings are not visible due to their very low number (they grew from 0, in 1993, to 1 in 1998 and to 16 in 2008). As it can be seen, 1 star lodgings decreased, in favor of 3 star accommodations. The 2 star accommodations are dominant mainly due to the old hotels at the seaside, and in the spa resorts.
Table No 5.
Tourist Activity by Classified Lodgings (average for 2000 to 2008)
Category Bed
Places by Stars
Bed Places
in Hotels
by Stars
Total Tourist Arrivals
Total Tourist Arrivals in Hotels
Foreign Tourist Arrivals
Foreign Tourist Arrivals in Hotels
1 star 24.87 % 20.48 % 13.88 % 12.33 % 5.62 % 4.52 % 2 stars 39.80 % 56.34 % 42.84 % 44.77 % 24.84 % 24.22 % 3 stars 10.65 % 14.47 % 26.53 % 27.94 % 38.83 % 39.20 % 4 stars 2.79 % 3.81 % 8.65 % 9.81 % 18.93 % 18.80 % 5 stars 0.57 % 0.94 % 3.27 % 4.15 % 11.97 % 13.13 %
Not classified 21.33 % 3.96 % 4.83 % 1.00 % 0.35 % 0.13 %
Source: authors’ calculations based on NIS data.
The preference for accommodation by classification categories is presented in the above table. As it can be seen, Romanian tourists prefer 2 and 3 star accommodations, while foreign tourists tend to have a more balanced spread between 2, 3, 4 and 5 star accommodations.
The occupancy rates for all of the accommodations and the lengths of stay, split by destinations, are presented in the table below (average figures for the period 1994-2008):
Table No 6.
Average Occupancy Rates by Destinations
Destination Average Occupancy Rate
Average Length of Stay (Days)
County residences (city of Tulcea excluded) 34.4 % 1.9
Littoral (Constanta county – Constanta city excluded) 46.5 % 6.2
Spa resorts 47.9 % 8.0 Mountain resorts 27.7 % 2.8 Danube Delta (city of Tulcea included) 24.0 % 2.1 Other destinations 23.1 % 2.3 Romania’s level (entire country) 36.6 % 3.4
Source: authors’ calculation based on NIS data, average values for 1994 to 2008.
ROMANIAN ACCOMMODATION ESTABLISHMENTS – AN INVESTIGATION REGARDING THE REASONS …
13
At national level, the occupancy rate decreased almost constantly from 43.7 % in 1994 to 35 % in 2008 (with the lowest point of 34 % in 2002). The same constant decrease was registered at the Black Seaside, from 52.3 % in 1994 to 46.7 % in 2008 (with the lowest point of 39.9 % in 2003). It must be mentioned that the sharpest decrease in occupancy rate was registered by the mountain resorts: from 43.2 % in 1995 to 22.0 % in 2005; a slight improvement occurred until 2008, but the occupancy rate remained under 30 %.
The occupancy rate for hotels is slightly better, showing an average figure (for the same period) of 41.3 % but it was constantly under the level of 45 %.
The average length of stay did not show important oscillations at national level nor inside the county residences; but it registered an important decrease from 7.1 days in 1994 to 4.8 days in 2008 for Black Seaside resorts and from 3.5 days in 1994 to 2.2 days in 2008 for mountain destinations.
From this general presentation several facts can be highlighted: - while the number of accommodations has grown compared to the year of
1990, the lodging capacity has remained under the level of that year indicating an increase in the number of accommodations with a small lodging capacity;
- the accommodation sector is dominated by hotels, which concentrate over 50 % of the lodging capacity; however, only a small number of hotels are branded (operated under an international brand; using the official database for Romanian accommodations6 at June 15th, 2010, and considering the way the hotels were registered in it, only a number of 37 out of 1307 hotels could be found in this category, concentrating 5,687 rooms and 11,211 bed places, or 6.34 % of the total rooms, respectively 6.33 % of the bed places; these percentages can be considered “the penetration rate of branded hotels” [see Pop et al. (2007)]; the most popular brands are Best Western (6), Ramada (6) and Golden Tulip & Tulip Inn(7)7);
- the concentration by destinations is under the influence of the communist developments, which gave preference to the Romanian littoral, while the trend of tourist arrivals indicates a clear preference toward county residences (including Bucharest), mainly for business reasons;
- the decrease in the length of stay indicates the poor state or the complete absence of entertaining or relaxation facilities in various destinations;
- the previous observation is backed by the very low occupancy rates which only reflect the incapacity of the Romanian accommodation operators to attract more tourists or to persuade the existing ones to stay longer.
6 Source: http://www.mdrt.ro/index.php?p=4401. 7 Unfortunately, when crossing various pieces of information with the official database for Romanian
authorized accommodations we discovered several missing entries that could not be explained; the number of branded hotels in Romania is in reality slightly larger than the above reported one, but we chose not to correct the database with our findings. Please regard the above figures only as indicative ones and not completely accurate ones.
CORNELIA POP, MARIA MONICA COROS
14
With this situation in mind, the present research tries to deduce what can motivate an entrepreneur to develop and/ or buy and own a hotel, due to the fact that the general conditions (even in a period of booming) did not provide outstanding results for the Romanian hotel industry.
2. Material and Method
In order to investigate the reasons that motivate Romanian business people to develop or buy accommodation establishments, the indirect method of observation was chosen. The information reported in the media (in this case Top Capital 300 ranking the richest Romanian people for the years 2009, 2008 and 2007) was crossed with the information available in the official database for Romanian accommodation establishments. It was considered that the attitude of the richest people in Romania is mimicked/ replicated/ copied by other persons that consider themselves interested in owning and/ or developing various businesses.
The identification of the position (one position could include two business partners that chose to be presented together or members of the same family: brothers, husband & wife or cousins) owning hotels and other establishments was made based on the rank published in October 2009 and the ranks from the previous two editions were used to check and complete the information.
In what the official database was concerned, some alterations were made: - the individual rooms and apartments (not gathered in an accommodation
establishment structure) authorized to be rented to tourists were not taken into consideration and eliminated from the database;
- a search for double entries was made and the identified situations were also eliminated from the database;
- all the entries that existed but had zero at their lodging capacity were also excluded.
Unfortunately, as mentioned above, it was discovered that the official database missed entries. The reasons might be:
- the long process between the moment when an authorization is granted for an establishment to function in the capacity of lodging tourists and the moment when the entry is made in the database (mainly in the case of new establishments and/ or in the case of re-authorized ones);
- the absence of a proper authorization for the missed entries or the fact that the authorization makes the object of an arbitrage case or its refusal is contested and the answer is pending;
- the missing establishments might undergo a renovation or a modernization process and for that period their managers are not required to have any functioning authorization as lodging capacities;
- mistakes made by the people in charge to update the database.

ROMANIAN ACCOMMODATION ESTABLISHMENTS – AN INVESTIGATION REGARDING THE REASONS …
15
It was chosen not to correct the database – not even with the entries that could be properly identified, but to use it as it is. It was considered that even though information is not 100 % correct, it is still possible to identify the pattern of the motives behind the ownership or the development of accommodation establishments in Romania.
3. Results and Discussions
The first part of the results focuses on the correlation with the general situation presented above.
Based on the official database, with the alterations presented above, the following situation was extracted – as for June 15th, 2010:
- there were identified 6,389 accommodation establishments, having a lodging capacity of 141,035 rooms or 289,821 bed places;
- available data show a further decrease in the average lodging capacity of Romanian accommodation establishments to 22 rooms (or about 45 bed places);
- hotels represent 20.46 % of the total accommodations, 63.60 % of the rooms and 61.07 % of the bed places;
- tourist pensions represent 58.66 % of total accommodations, but only 19.11 % of the rooms and 18.60 % of the bed places;
- the percentage for villas and bungalow is under 10 % from all points of view; - the situation of the branded hotels is as follows: 37 hotels (2.83 %),
concentrating 5,687 rooms (6.34 %), respectively 11,211 bed places (6.33 %); - the structure by stars is presented in the following table (using only
information concerning bed places in order to match it with the data presented above):
Table No 7.
Bed Places by Stars
Category Bed Places by Stars Bed Places in Hotels by Stars 1 star 8.37 % 4.61 % 2 stars 38.68 % 41.44 % 3 stars 38.26 % 35.46 % 4 stars 12.35 % 15.12 % 5 stars 2.34 % 3.37 %
Not classified Do not appear in the database Do not appear in the database
Source: authors’ calculations based on the official database. The situation, as of June 15th, 2010, shows a higher percentage for 3 and 4
stars hotels and a very important decrease in the case of 1 star accommodations. This is consistent with the trend identified in the paragraph above.
CORNELIA POP, MARIA MONICA COROS
16
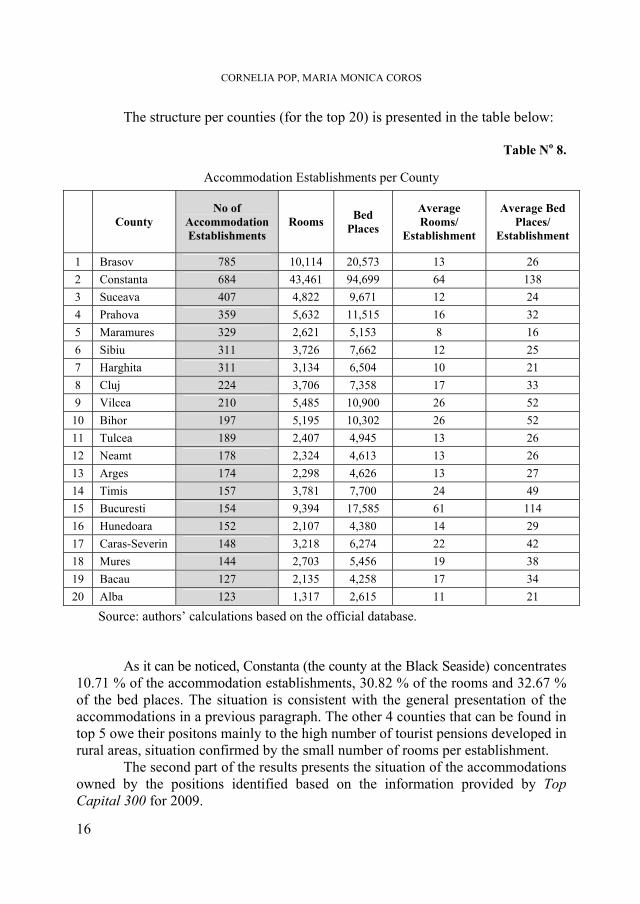
The structure per counties (for the top 20) is presented in the table below:
Table No 8.
Accommodation Establishments per County
County No of
Accommodation Establishments
Rooms Bed Places
Average Rooms/
Establishment
Average Bed Places/
Establishment
1 Brasov 785 10,114 20,573 13 26 2 Constanta 684 43,461 94,699 64 138 3 Suceava 407 4,822 9,671 12 24 4 Prahova 359 5,632 11,515 16 32 5 Maramures 329 2,621 5,153 8 16 6 Sibiu 311 3,726 7,662 12 25 7 Harghita 311 3,134 6,504 10 21 8 Cluj 224 3,706 7,358 17 33 9 Vilcea 210 5,485 10,900 26 52 10 Bihor 197 5,195 10,302 26 52 11 Tulcea 189 2,407 4,945 13 26 12 Neamt 178 2,324 4,613 13 26 13 Arges 174 2,298 4,626 13 27 14 Timis 157 3,781 7,700 24 49 15 Bucuresti 154 9,394 17,585 61 114 16 Hunedoara 152 2,107 4,380 14 29 17 Caras-Severin 148 3,218 6,274 22 42 18 Mures 144 2,703 5,456 19 38 19 Bacau 127 2,135 4,258 17 34 20 Alba 123 1,317 2,615 11 21
Source: authors’ calculations based on the official database. As it can be noticed, Constanta (the county at the Black Seaside) concentrates
10.71 % of the accommodation establishments, 30.82 % of the rooms and 32.67 % of the bed places. The situation is consistent with the general presentation of the accommodations in a previous paragraph. The other 4 counties that can be found in top 5 owe their positons mainly to the high number of tourist pensions developed in rural areas, situation confirmed by the small number of rooms per establishment.
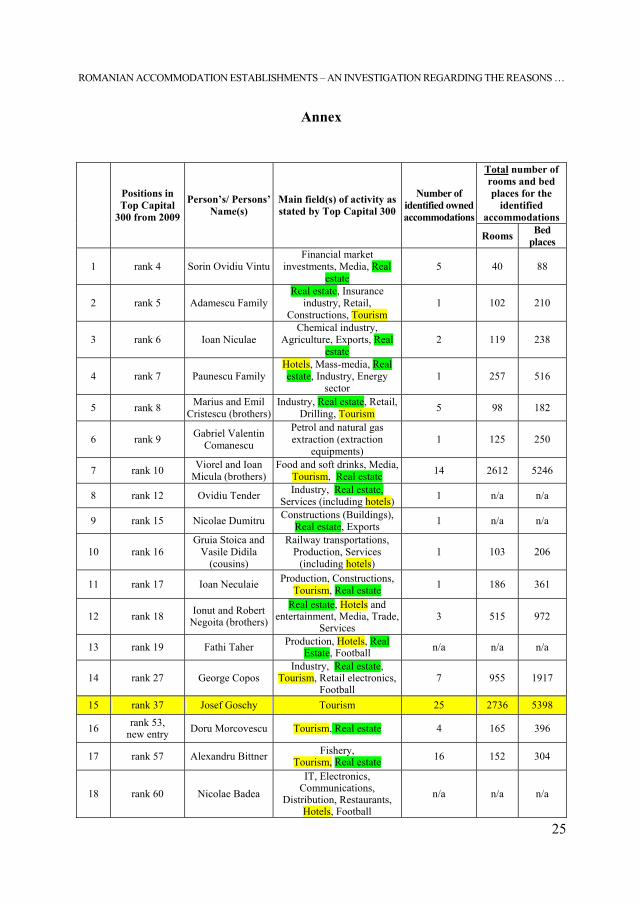
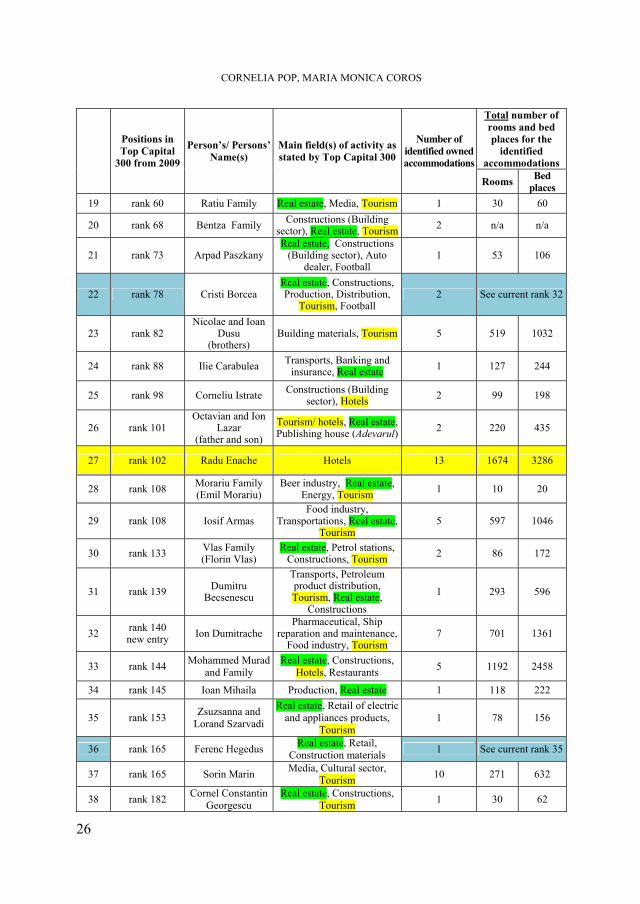
The second part of the results presents the situation of the accommodations owned by the positions identified based on the information provided by Top Capital 300 for 2009.
ROMANIAN ACCOMMODATION ESTABLISHMENTS – AN INVESTIGATION REGARDING THE REASONS …
17
Based on the above mentioned source, 58 positions8 were identified to own hotels and/ or other types of accommodation establishments in their business portfolios. Further 18 positions were identified as expressing the intention to develop/ build hotels inside real estate projects they are currently developing9. These positions were not included in the current research.
The 58 positions represent 19.33 % of the total rank of 300. These 58 positions are structured (spread) inside the top 300 as follow:
- in Top 50, 14 positions own hotels/ accommodation establishments and/ or minority position in companies owning hotels (28 %);
- inside the positions 51 to 300 other 44 positions own hotels/ accommodation establishments and/ or minority position in companies owning hotels (17.6 %).
General observations regarding the identified positions ought to be highlighted:
- in 6 cases (current ranks: 8, 9, 20, 47, 48, and 49) the information available was not sufficient to allow the identification of their hotels and/ or type of accommodation establishments (mainly their lodging capacity) and their location (in some cases);
- in other 14 cases it was not possible to identify all the establishments declared to be part of their business portfolios when the information was crossed with the official database provided by the Ministry of Tourism on its website (http://www.mdrt.ro/index.php?p=4401); this situation occurred either due to the lack of sufficient information available in order to allow the identification of the establishment or due to the fact that the respective establishment was not included (for various reasons presented in Material & Method) in the official database;
- in 2 other cases (current ranks: 13 and 18) only minority participations (less than 20 %) could be identified in companies that own and operate hotels; while taken into consideration at the level of the total number of positions, for the hotels in which these participations exist, the hotel rooms and the bed places were eliminated from the analysis;
- in one case (current rank 2) there was identified a combined situation: owning a hotel and having minority participations in two others; for the analysis only the owned hotel was taken into consideration;
- in 2 cases (current rank: 22 and 36) business partnerships with other positions were identified and the establishments were counted only one time.
8 For the present study the positions were considered and not people, because some of these positions
are held by business partners or families (as it can be seen in the Annex). 9 The majority of those 18 positions announce their intention to develop mainly hotels inside
residential areas and not commercial areas. These statements show how lighthearted the ownership and operation of a hotel is considered, indicating that hotels are viewed rather as trophy properties than practical problems part of a business development.
CORNELIA POP, MARIA MONICA COROS
18
Observations regarding the type of business, type of establishments, their lodging capacity and their location can be summarized as follows:
- only 2 positions (current ranks: 15 and 27), representing 3.45 % of the identified 58, are dedicated exclusively to hotel/ accommodation establishment ownership combined with their operation; it is the case of Mr. Goshy who controls Unita Turism Holding SA and Mr. Enache who controls Continental Hotels SA; a detailed analysis of these positions is not the purpose of the present paper, thus it must be mentioned that only Continental Hotels has a brand policy (launching the Continental Forum brand for the group of four 4 star hotels and the Grand Continental for the one 5 star hotel, having initiated the Hello Hotels brand for its 2 star hotels and having the exclusive right to operate hotels under the Ibis brand for the 3 star hotels); Continental Hotels is the only Romanian company that is really dedicated to develop following the model of well known hotel companies; in the case of Unita Turism Holding, the only thing that can be seen is a gathering of various hotels under the same ownership; there is no proper brand strategy or a strategy to target and keep the most important client niche; in most cases hotels undergo some renovation and modernization in order to be classified at a higher level than they currently are but there is nothing more than that; inside any of the Unita Turism hotels there is no clear indication that they are functioning under the same umbrella and have a coherent policy for presenting themselves;
- the remaining 56 positions (96.55 %) own hotels inside a portfolio of other businesses; of these 56, several developed (inside the group of companies) either a dedicated company for their hotels, or a dedicated division; these positions are:
current rank 5 – Cristescu Brothers who included in their group of companies a dedicated company, Bega Turism, through which they own and operate four of their five accommodation establishments;
current rank 14 – George Copos who also created a dedicated company (inside Ana Holding: www.ana.ro) named Ana Hotels which owns and operates the majority of its hotels; the 7th hotel (Romanian Ministry of Tourism having majority ownership in the respective hotel) is operated through a company controlled by Ana Holding;
current rank 33 – Mohammad Murad who previously tried to create the Perla-Majestic brands for the hotels owned at the seaside (by gathering them under Perla-Majestic Grup) and after that included this small hotel group in the new company (and probably intended to be a brand) Phoenicia Hotels;
at the other end of this “spectrum”, at least two cases can be mentioned: Micula brothers (current rank 7) who own hotels under the name of various companies inside their business group; most of the owned hotels are located at the Seaside and various media sources constantly
ROMANIAN ACCOMMODATION ESTABLISHMENTS – AN INVESTIGATION REGARDING THE REASONS …
19
report the poor quality of the accommodation, the lack of proper renovation and modernization works; in the same league seems to fall also Mr. Armas (current rank: 29) who owns hotels located in the oldest Romanian spa resort, Baile Herculane; he is accused of the same neglect towards some of the owned hotels; Mr. Armas announced during 2009 that most of his hotels are now for sale; in both of these extreme cases it can be affirmed – due numerous media short announcements – that the investment in the owned hotels occurred at the moment of their privatization – between 2000 and 2004 – at a relative low price (due to the poor state of the hotel buildings) and that it was made having in mind rather the real estate value of those properties than their commercial value and their potential of becoming – in time and after proper modernization – important profit centers;
- for 45 positions (77.59 %) the real estate business was mentioned among the other businesses in their portfolio; (situation that enhances the idea that hotels/ accommodation establishments became opportunistic investments rather than dedicate ones);
- in 11 cases (current ranks: 3, 13, 21, 25, 28, 30, 43, 46, 53, 54, and 55) there was expressed the intention to build further or acquire new hotels/ other accommodation establishments; these 11 positions do not include the strategic intention of the two positions dedicated two hotels/ other accommodations for further development of their current activity.
Taking into consideration only the establishments that could be identified in the official database, the following results emerged:
- only 48 positions could be further included in the analysis (there were eliminated the 6 ones for which the hotels could not be identified, the 2 with minority participations, and the 2 ones which represented crossed partnerships);
- 23 positions own just one accommodation establishment (21 own one hotel, one position owns a villa and one position owns one tourist pension);
- 12 positions own 2, 3 or 4 accommodation establishments; - 8 positions own between 5 and 10 accommodation establishments; - 5 positions own more than 10 accommodation establishments (current ranks:
7, 15, 17, 27, and 44); among them being, as expected, the only two positions dedicated to hotel industry (ranks: 15 and 27);
- the 48 remaining positions are cumulating a number of 192 accommodation establishments, with a lodging capacity of 17,042 rooms and 33,821 bed places (representing 3 % of the accommodation establishments, 12.00 % of the rooms, and 11.63 % of the bed places at national level);
- of the 192 identified establishments, 121 (63.02 %) were hotels, while another 52 (27.08 %) were villas; the 121 hotels concentrate a number of 15,791 rooms (92.66 % of the lodging capacities of the 192 establishments)
CORNELIA POP, MARIA MONICA COROS
20
and 31,151 bed places (92.11 %), while the villas cumulate only 584 rooms (3.43 %) and 1,222 bed places (3.61 %); at national level they represent: 9.26 % of the total hotels, 17.60 % of the hotel rooms and bed places;
- of the 121 hotels owned by the 48 positions, 13 (10.74 %) are branded hotels, concentrating 2,195 rooms (13.90 % of the owned hotels) and 4,327 bed places (13.89 % of the owned bed places); the brands with the highest representations are: Golden Tulip and Ibis (Accor);
- for the 48 positions, the structure by the number of owned rooms is the following one:
• less than 50 rooms – 8 positions; • between 51 and 200 rooms – 20 positions; • between 201 and 500 rooms – 11 positions; • between 501 and 1,000 rooms – 5 positions; • between 1,001 and 3,000 rooms – 4 positions (including the position
15, Mr. Goshy, concentrating through Unita Turism Holding 16.05 % of the total rooms owned by the 48 positions taken into consideration and position 27, Mr. Enache, who concentrates through Continental Hotels 9.82 % of the rooms; on the other two positions there are the Micula brothers with 15.33 % of the rooms and Mr. Murad with 6.99 % of the rooms). These 4 positions concentrate 48.19 % of the rooms identified for the 48 positions under analysis;
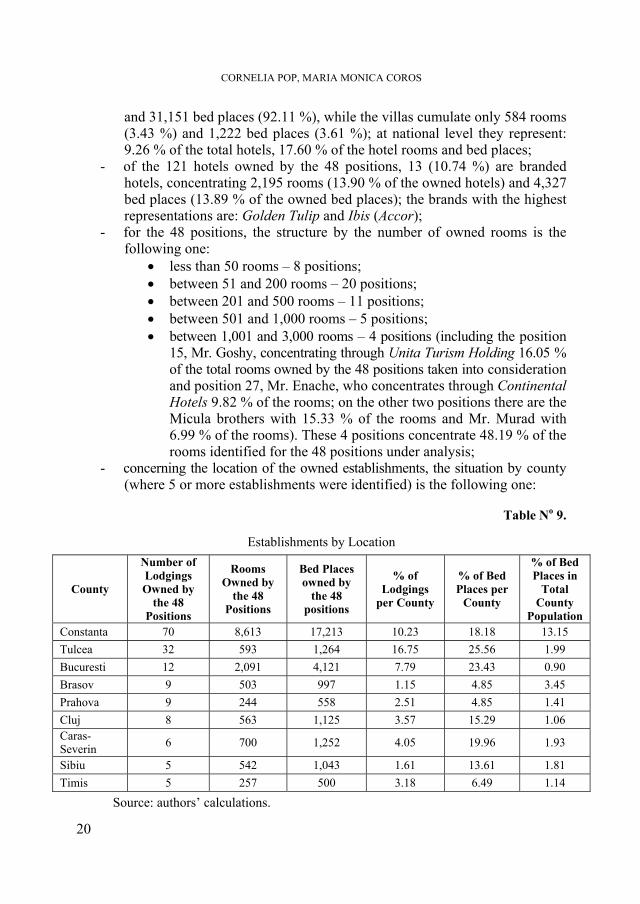
- concerning the location of the owned establishments, the situation by county (where 5 or more establishments were identified) is the following one:
Table No 9.
Establishments by Location
County
Number of Lodgings Owned by
the 48 Positions
Rooms Owned by
the 48 Positions
Bed Places owned by
the 48 positions
% of Lodgings
per County
% of Bed Places per
County
% of Bed Places in
Total County
Population Constanta 70 8,613 17,213 10.23 18.18 13.15 Tulcea 32 593 1,264 16.75 25.56 1.99 Bucuresti 12 2,091 4,121 7.79 23.43 0.90 Brasov 9 503 997 1.15 4.85 3.45 Prahova 9 244 558 2.51 4.85 1.41 Cluj 8 563 1,125 3.57 15.29 1.06 Caras-Severin 6 700 1,252 4.05 19.96 1.93
Sibiu 5 542 1,043 1.61 13.61 1.81 Timis 5 257 500 3.18 6.49 1.14
Source: authors’ calculations.
ROMANIAN ACCOMMODATION ESTABLISHMENTS – AN INVESTIGATION REGARDING THE REASONS …
21
Also, it must be added that 54 (28.12 %) establishments are located in county residences (Bucharest included), concentrating 5,772 rooms (33.87 %), and respectively 11,367 bed places (33.61 %).
As expected, the highest concentration, from the location’s point of view, is Constanta county (Black Seaside – considered a very popular tourist destination for domestic tourists mainly). However, as the situation at national level indicates, the Romanian littoral is loosing attractiveness (the occupancy rate and the length of stay are decreasing constantly) due to the lack of proper entertainment facilities and to the low quality of the beaches. This important “gathering” of accommodation ownership at the Black Seaside is tributary to the past (communist period) and to the difficulty to change deeply rooted misconceptions.
It is followed (as number of accommodations) by Tulcea County (which includes the Danube Delta – considered to be an exclusive location due to the relative difficulty to arrive and due to the fact that the Danube Delta is also a natural reservation for birds and flora). From the rooms’ number point of view, on the second position there is Bucharest, the Romanian capital, which registers every year an important number of tourists (both foreign and domestic), mainly for business/ professional purposes. While the number of rooms indicates on the 3rd place an almost unknown county (Caras-Severin), this situation occurred due to the fact that several hotels of relatively high lodging capacity were identified there; it is not clear if all those hotels are currently open for tourists or not.
Another important concentration occurs in Brasov County where several popular mountain resorts can be found (Poiana Brasov, Predeal and Bran). At the same level as Brasov county there are Sibiu and Cluj counties; Sibiu witnessed an increase in its lodging capacity since 2005-2006 when it was announced that the city would be the Cultural Capital of Europe (along with Luxembourg) in 2007; Cluj County’s position is enhanced by the city of Cluj-Napoca considered to be the unofficial capital of Transylvania; the current situation exists because of the fact that Unita Tourism Holding owns 7 accommodation establishments in this county (after the absorption, at the end of the 1990s, of Transilvania Turism).
Of the 35 positions owning 2 or more accommodation establishments, 13 located them in the same county, frequently in the same city or town and 2 located them in neighboring counties. Usually, the location of the hotel properties is selected to correspond with the headquarters of the most important companies owned by the person/ persons in the respective position. This situation reveals the lack of diversification on what the location is concerned, the occupancy rate being under the influence of the respective region’s seasonality.
The structure per stars of the owned accommodations by the 48 positions is presented in the following table:

CORNELIA POP, MARIA MONICA COROS
22
Table No 10.
Establishments by Stars Category Bed Places by Stars Bed Places in Hotels by Stars
1 star 1.78 % 0.00 % 2 stars 38.22 % 41.16 % 3 stars 25.78 % 25.48 % 4 stars 27.36 % 26.11 % 5 stars 6.86 % 7.25 %
Not classified Do not appear in the database Do not appear in the database Source: authors’ calculations based on the official database.
The structure of the owned accommodations by the 48 positions is presented
in the following table according to the average occupancy rates for 2000-2008:
Table No 11.
Establishments by Occupancy Rates
Category Average Occupancy Rates for
Total Accommodation Facilities
Average Occupancy Rates for Hotels
1 star 32.3 % 42.2 % 2 stars 39.5 % 45.6 % 3 stars 33.4 % 37.0 % 4 stars 31.2 % 32.2 % 5 stars 37.1 % 37.6 %
Not classified 20.4 % 33.6 % Source: authors’ calculations based on NIS data.
Conclusions
From the results presented above, the following first conclusions surface: - the positions from Top Capital 300 prefer to own hotels; these represent a
percentage (63.02 %) well above the one registered at national level for the period 1990-2008 (25.22 %) from the number of hotels’ point of view;
- the location of the owned properties shows a higher level of concentration in county residences (28.12 %) compared to 14.98 % at national level, from the number of accommodation facilities’ point of view; this situation can be explained by the fact that county residences – due to the business opportunities they offer – attracted in the last 15 years an increased flow of business tourists; however, another aspect must be mentioned: it is more visible to own an accommodation establishment in a county residence than in some out-of-date resort;

ROMANIAN ACCOMMODATION ESTABLISHMENTS – AN INVESTIGATION REGARDING THE REASONS …
23
- in respect to the location, as it was highlighted above, in most cases (35 out of 48) the establishments were located in the same place as the headquarters of the companies owned by the respective positions;
- the important concentration of accommodations at the Black Seaside (Constanta county) is triggered by the old misconception regarding the high popularity of these destination, while the decreasing occupancy rate and length of stay are currently contradicting the “preferred” status given to the Romania littoral;
- the branded hotels owned by the 48 positions indicate almost a higher percentage compared to the branded hotels at national level, 10.74 % compared to 2.83 % from the numeric point of view; the brands with the best representation are Golden Tulip and Ibis (Accor); this situation shows the increased awareness of these 48 position towards the advantages of using a brand affiliation; but it also shows the fact that owning a hotel operated under a well known brand name increases the “visibility” of the property among the persons in similar positions;
- the 48 positions under scrutiny give preference to 3, 4 and 5 star accommodations (mainly in the case of hotels), owning these types of hotels above the average country level; the 2 star accommodations/ hotels have an important percentage due to the fact they were bought (mainly by Mr. Goshy through Unita Turism Holding and by the Micula brothers through their various companies) as opportunistic real estate acquisitions at the end of the 1990s and during the first half of the 2000s, investments that until today have undergone the minimum amount of renovation in order to be kept open for the economy segment of tourists, but with no strategy of building a brand for those 2 star hotels;
- in over 90 % of the cases, accommodations are owned as part of an existing group of companies and in over 70 % of the cases, inside the group a real estate business is mentioned.
The general profile that could be identified for the position owning hotels/ accommodation establishments is:
- he/ she owns 1 to 4 establishments (in average), most probably hotels of 3 stars or more;
- the owned property/ properties is/ are registered under the name of an existing company or is/ are part of a group of businesses, seen as an opportunity to diversify the activity of the group; it is often correlated with a real estate business;
- the establishment is located in a county residence or in a location near the headquarter of the company or group of companies; it can be used to accommodate the business partners;
- the intention to create a brand is slim and there exists no proper strategy of development of the hotel business;
- while they want to be directly involved in the daily decisions regarding the operation and management of the establishments, seldom the person/ persons have the required knowledge and, moreover, they interfere with the qualified employees’ decisions, often changing the situation for the worse.
CORNELIA POP, MARIA MONICA COROS
24
Taking into consideration the motives mentioned at the beginning of the present paper, the following can be extracted as the main reason for the majority of the identified positions: to have a trophy or a vanity property. All the conclusions presented above (from owning mostly hotels, of over 3 stars, sometimes branded, located in county residences or in popular tourist destinations, enhancing the visibility of those properties) support this idea. The main exception can be considered Mr. Enache with Continental Hotels.
Mainly in the cases of the Micula brothers, Mr. Armas and several others, the return on the real estate investment represented by the hotel/ establishment building must be added. For most of the identified positions this reason (the return on the real estate investment) is a secondary reason for investment.
Few tried to establish a new hotel and/ or a new hotel brand in a new location (positions: 14, 17, 24, 27, 33, 36, 42, 43 and 51). They realized this often trough rebranding or by rising a new building.
None of the identified positions created a destination hotel in a new area and neither built it as part of a large development deal (thus, some of the mentioned positions might argue against this statement, but at a closer look, none of the identified establishments are included in a proper commercial real estate development project).
Further investigations are needed in order to establish the profitability of these establishments (where possible) and to determine their true occupancy rates and lengths of stay. These investigations will be difficult to carry out due to the fact that the owners are not very open regarding this set of information.
However, the above mentioned conclusions reveal several aspects which explain why the Romanian tourist accommodation sector fails to attract and maintain its customers through a good balance between quality and reasonable prices. For the owners of these establishments (often part of group of companies) it is more important to show the trophy property, rather than to see it as a profit center.
REFERENCES
McDonough, B., 2001, “Perspective”, chapter 1 inside the volume Building Type Basics for
Hospitality Facilities, editor Stephen A. Kliment, John Wiley & Sons, New York. Pop, C., Cosma, S., Negrusa, A., Ionescu, C., Marinescu, N., 2007, Romania as a Tourist
Destination and the Romanian Hotel Industry, Cambridge Scholars Publishing, UK.
“Capital 300 cei mai bogati romani”, 2007, Capital. “Capital 300 cei mai bogati romani”, 2008, Capital. “Capital 300 cei mai bogati romani”, 2009, Capital. National Institute for Statistics (NIS), Annual Yearbooks 2000, 2001, 2002, 2003, 2004,
2005, 2006, 2007, 2008 and 2009, Bucuresti. *** http://data.un.org/DocumentData.aspx?q=tourism&id=168. *** http://www.mdrt.ro/index.php?p=4401
ROMANIAN ACCOMMODATION ESTABLISHMENTS – AN INVESTIGATION REGARDING THE REASONS …
25
Annex
Total number of rooms and bed places for the
identified accommodations
Positions in Top Capital
300 from 2009
Person’s/ Persons’ Name(s)
Main field(s) of activity as stated by Top Capital 300
Number of identified owned accommodations
Rooms Bed places
1 rank 4 Sorin Ovidiu VintuFinancial market
investments, Media, Real estate
5 40 88
2 rank 5 Adamescu FamilyReal estate, Insurance
industry, Retail, Constructions, Tourism
1 102 210
3 rank 6 Ioan Niculae Chemical industry,
Agriculture, Exports, Real estate
2 119 238
4 rank 7 Paunescu Family Hotels, Mass-media, Real estate, Industry, Energy
sector 1 257 516
5 rank 8 Marius and Emil Cristescu (brothers)
Industry, Real estate, Retail, Drilling, Tourism 5 98 182
6 rank 9 Gabriel Valentin Comanescu
Petrol and natural gas extraction (extraction
equipments) 1 125 250
7 rank 10 Viorel and Ioan Micula (brothers)
Food and soft drinks, Media, Tourism, Real estate 14 2612 5246
8 rank 12 Ovidiu Tender Industry, Real estate, Services (including hotels) 1 n/a n/a
9 rank 15 Nicolae Dumitru Constructions (Buildings), Real estate, Exports 1 n/a n/a
10 rank 16 Gruia Stoica and
Vasile Didila (cousins)
Railway transportations, Production, Services
(including hotels) 1 103 206
11 rank 17 Ioan Neculaie Production, Constructions, Tourism, Real estate 1 186 361
12 rank 18 Ionut and Robert Negoita (brothers)
Real estate, Hotels and entertainment, Media, Trade,
Services 3 515 972
13 rank 19 Fathi Taher Production, Hotels, Real Estate, Football n/a n/a n/a
14 rank 27 George Copos Industry, Real estate,
Tourism, Retail electronics, Football
7 955 1917
15 rank 37 Josef Goschy Tourism 25 2736 5398
16 rank 53, new entry Doru Morcovescu Tourism, Real estate 4 165 396
17 rank 57 Alexandru Bittner Fishery, Tourism, Real estate 16 152 304
18 rank 60 Nicolae Badea
IT, Electronics, Communications,
Distribution, Restaurants, Hotels, Football
n/a n/a n/a
CORNELIA POP, MARIA MONICA COROS
26
Total number of rooms and bed places for the
identified accommodations
Positions in Top Capital
300 from 2009
Person’s/ Persons’ Name(s)
Main field(s) of activity as stated by Top Capital 300
Number of identified owned accommodations
Rooms Bed places
19 rank 60 Ratiu Family Real estate, Media, Tourism 1 30 60
20 rank 68 Bentza Family Constructions (Building sector), Real estate, Tourism 2 n/a n/a
21 rank 73 Arpad Paszkany Real estate, Constructions
(Building sector), Auto dealer, Football
1 53 106
22 rank 78 Cristi Borcea Real estate, Constructions, Production, Distribution,
Tourism, Football 2 See current rank 32
23 rank 82 Nicolae and Ioan
Dusu (brothers)
Building materials, Tourism 5 519 1032
24 rank 88 Ilie Carabulea Transports, Banking and insurance, Real estate 1 127 244
25 rank 98 Corneliu Istrate Constructions (Building sector), Hotels 2 99 198
26 rank 101 Octavian and Ion
Lazar (father and son)
Tourism/ hotels, Real estate,Publishing house (Adevarul) 2 220 435
27 rank 102 Radu Enache Hotels 13 1674 3286
28 rank 108 Morariu Family (Emil Morariu)
Beer industry, Real estate, Energy, Tourism 1 10 20
29 rank 108 Iosif Armas Food industry,
Transportations, Real estate, Tourism
5 597 1046
30 rank 133 Vlas Family (Florin Vlas)
Real estate, Petrol stations, Constructions, Tourism 2 86 172
31 rank 139 Dumitru Becsenescu
Transports, Petroleum product distribution, Tourism, Real estate,
Constructions
1 293 596
32 rank 140 new entry Ion Dumitrache
Pharmaceutical, Ship reparation and maintenance,
Food industry, Tourism 7 701 1361
33 rank 144 Mohammed Murad and Family
Real estate, Constructions, Hotels, Restaurants 5 1192 2458
34 rank 145 Ioan Mihaila Production, Real estate 1 118 222
35 rank 153 Zsuzsanna and Lorand Szarvadi
Real estate, Retail of electric and appliances products,
Tourism 1 78 156
36 rank 165 Ferenc Hegedus Real estate, Retail, Construction materials 1 See current rank 35
37 rank 165 Sorin Marin Media, Cultural sector, Tourism 10 271 632
38 rank 182 Cornel Constantin Georgescu
Real estate, Constructions, Tourism 1 30 62
ROMANIAN ACCOMMODATION ESTABLISHMENTS – AN INVESTIGATION REGARDING THE REASONS …
27
Total number of rooms and bed places for the
identified accommodations
Positions in Top Capital
300 from 2009
Person’s/ Persons’ Name(s)
Main field(s) of activity as stated by Top Capital 300
Number of identified owned accommodations
Rooms Bed places
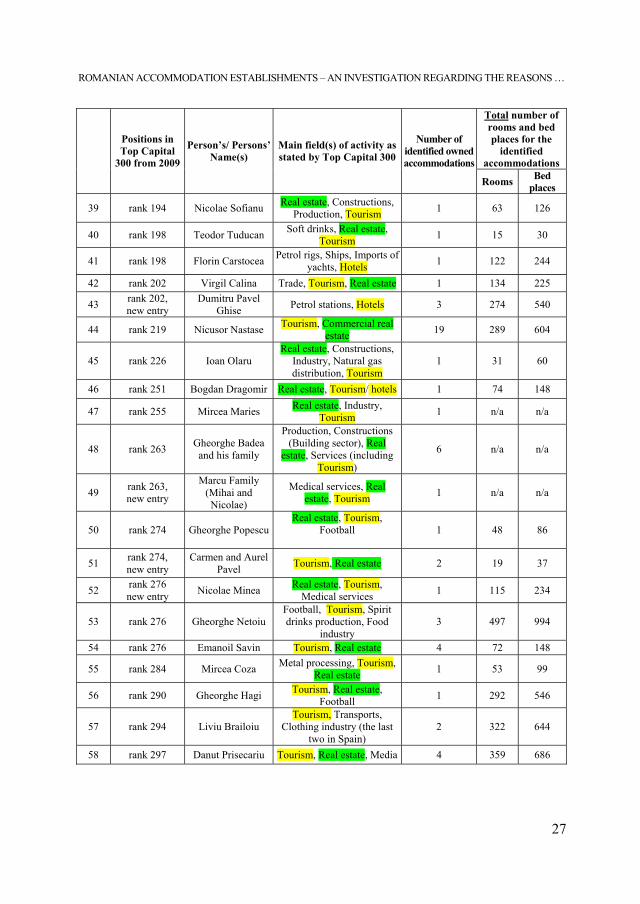
39 rank 194 Nicolae Sofianu Real estate, Constructions, Production, Tourism 1 63 126
40 rank 198 Teodor Tuducan Soft drinks, Real estate, Tourism 1 15 30
41 rank 198 Florin Carstocea Petrol rigs, Ships, Imports of yachts, Hotels 1 122 244
42 rank 202 Virgil Calina Trade, Tourism, Real estate 1 134 225
43 rank 202, new entry
Dumitru Pavel Ghise Petrol stations, Hotels 3 274 540
44 rank 219 Nicusor Nastase Tourism, Commercial real estate 19 289 604
45 rank 226 Ioan Olaru Real estate, Constructions,
Industry, Natural gas distribution, Tourism
1 31 60
46 rank 251 Bogdan Dragomir Real estate, Tourism/ hotels 1 74 148
47 rank 255 Mircea Maries Real estate, Industry, Tourism 1 n/a n/a
48 rank 263 Gheorghe Badea and his family
Production, Constructions (Building sector), Real
estate, Services (including Tourism)
6 n/a n/a
49 rank 263, new entry
Marcu Family (Mihai and Nicolae)
Medical services, Real estate, Tourism 1 n/a n/a
50 rank 274 Gheorghe PopescuReal estate, Tourism,
Football
1 48 86
51 rank 274, new entry
Carmen and Aurel Pavel Tourism, Real estate 2 19 37
52 rank 276 new entry Nicolae Minea Real estate, Tourism,
Medical services 1 115 234
53 rank 276 Gheorghe Netoiu Football, Tourism, Spirit drinks production, Food
industry 3 497 994
54 rank 276 Emanoil Savin Tourism, Real estate 4 72 148
55 rank 284 Mircea Coza Metal processing, Tourism, Real estate 1 53 99
56 rank 290 Gheorghe Hagi Tourism, Real estate, Football 1 292 546
57 rank 294 Liviu Brailoiu Tourism, Transports,
Clothing industry (the last two in Spain)
2 322 644
58 rank 297 Danut Prisecariu Tourism, Real estate, Media 4 359 686
STUDIA UNIVERSITATIS BABEŞ-BOLYAI, NEGOTIA, LVI, 1, 2011
CONSUMER PROTECTION USING THE LEGAL INSTRUMENT OF INFRINGEMENT, IN ORDER TO SANCTION MEMBER
STATES FAILURE TO FULFILL OBLIGATIONS OF DIRECTIVE 93/13 EEC ON UNFAIR TERMS IN CONSUMER CONTRACTS
RUXANDRA-MĂLINA PETRESCU-MAG1, DACINIA CRINA PETRESCU2 ABSTRACT. The paper comments on the importance of legal instruments in consumer protection field. We focused on the role of the European Commission, as guardian of European Union (EU) law and policies, which may initiate legal procedures to guarantee compliance with EU legislation. Thus, we analysed the provisions of articles 226-228 of the European Community Treaty, presenting the „infringement procedure”. Furthermore, a law case ended with the penalization of Kingdom of the Netherlands which failed to fulfill its obligations stated in Directive 93/13 EEC on unfair terms in consumer contracts, strengthens the imagine on the efficiency of legal instruments for consumers interests protection. Keywords: consumer, unfair clause, contract, infringement, directive 93/13 EEC. JEL classification: D1, D18, K42 Introduction
The decision to write about the consumer protection was motivated by three facts: the complexity of people’s life as consumers is higher (their activities, interactions, processes etc are more complex and with higher importance, consequences, the peace of change is more alert and so on), the interest and efforts of authorities in improving consumer protection (in European Union in particular) is raising, the awareness of consumers on their need of protection and right to it is also better that decades ago.
The consumers and the producers have their specific interests, that need to be protected, but, at some point, each of them is a consumer, so everybody needs to have his/her interests as consumers protected (Mihuţ, Pop, 1996). The level of this protection has always been a subject of debate, that has the roots into a basic question about consumer protection policies: Why do consumers need protection?
1 Lecturer, Ph.D., Babeş-Bolyai University, Faculty of Environmental Sciences, Cluj-Napoca,
România, email: [email protected] 2 Associate Professor, Ph.D., Babeş-Bolyai University, Faculty of Business, Cluj-Napoca, România,
email: [email protected]
RUXANDRA-MĂLINA PETRESCU-MAG, DACINIA CRINA PETRESCU
30
or Why should we believe that private markets fail to provide adequate levels of protection? (Ash, 1988). On one side, we find those who believe that too much safety regulation infringes on personal freedom. The producer must respond to the needs and expectations of the consumer in the marketplace in order to remain in business. If he fails to do that, if cheats the consumers by fraud and deception, the consumers will go to the competition and, eventually, put him out of business. On the other side, there are those claiming for a higher protection, on the base of the “right to safety” and on the principle that private market, left to its own devices, will impose unacceptable risks on the public. The individual buyer is besieged by advertising, deceived by packages, confronted with an expanding range of highly complex goods, has limited time and so is simply not qualified to buy discriminately and wisely (Ash, 1988). In many cases, managers tend to be doers, competitors, goal-oriented, practical, good with facts and numbers and very busy (Manley, Shrode, 1990), which often doesn’t leave space for consumer protection concerns. Briefly, the market is the battlefield of an unfair confrontation between the consumer and the producers and needs support from a higher level in order to balance the power of the two parts.
Key points of the consumer protection policy at European Union level
The consumer protection takes shape into a whole of provisions aiming to assure the abidance of consumers’ rights and interests. European Union consumer policy has come a long way since the first programme for consumer information and protection was adopted in 1975. Since then, a large number of measures have been taken to safeguard consumers' wider interests. The European Commission has as a constant task to update the regulatory framework in order to keep pace with the rapid changes in the market and to guarantee that proper implementation mechanisms are in place, and they all are serving the best interest of the consumer. In December 2006, the European Union (EU) adopted a new consumer protection programme for the period 2007-2013 with a total budget of 157 million Euro and on March 2007 the Commission adopted a “Consumer Policy Strategy” for the years 2007-2013. The strategy has two main objectives: to ensure a high level of consumer protection and to ensure the effective application of consumer protection rules. The priorities of the strategy mentioned above are: 1) Better monitoring of consumer; 2) Better consumer protection regulation; 3) Better enforcement and redress; 4) Better informed and educated consumers; 5) Putting consumers at the heart of other EU policies and regulation markets and national consumer policies (Commission of the European Communities, 2007). On this way, European Commission focuses essentially on ways to improve current legislation and aims to have, by 2013, a single, simple set of rules for the benefit of both of consumers and retailers. In fact, European Community Treaty (EC Treaty) has never included an elaborate recognition of how

CONSUMER PROTECTION USING THE LEGAL INSTRUMENT OF INFRINGEMENT, IN ORDER TO …
31
the EU serves the consumer interest (Weatherill, 2005). Legal provisions regarding other policies included references to consumers: for examples, art. 39 (e): The objectives of the common agricultural policy shall be (…) to ensure that supplies reach consumers at reasonable prices, art.40, art.86, art.92 and so on. The European Union consumer policy was officially stated by Single European Act (1987).
Consumers count over 490 million persons in Europe and their expenditure represents over half of the EU’s gross domestic product (GDP). Consumers are essential to economic growth and job creation and thus, the protection of their rights is an issue of economical, social and ethical importance. On July 2009, the European Commission adopted a “consumer enforcement package” to strengthen the EU-wide enforcement of consumer rules. The package had two components: a Communication on the enforcement of consumer rights and a Report on the first two years of application of the Consumer Protection Cooperation (CPC) Regulation. The Communication sets out five priority areas where work needs to be done to strengthen the enforcement in the EU as well as specific actions in each area. These are: 1) Develop stronger and more effective cross-border enforcement cooperation mechanisms; 2) Strengthening the transparency and visibility of market surveillance and enforcement activities; 3) Improved knowledge sharing and developing a common understanding of the rules; 4) Better market monitoring – developing a stronger evidence based approach; 5) Stepping up international cooperation (Commission of the European Communities, 2009). The CPC Regulation established an EU wide network of public authorities enforcing consumer rules in the Member States, which coordinats enforcement action against cross border breaches to consumer rules. The Network sets up a mechanism of mutual assistance, mainly through requests for information and requests to take enforcement action.
Infringement procedure and the role of the European Commission
We are conscious the freedom of trade implies rules that should be respected by all, producers, sellers or suppliers and consumers, in order to assure the mentioned freedom cannot be confounded with the abuse, illegalities and with an immoral conduct (Mazilu, 2008). Commission is working to help national enforcers make best use of their existing tools, especially when they have to apply national legislation to deal with infringements in a cross-border market.
As “guardian” of European Union (EU) policies and legislation, the European Commission can initiate legal procedures to guarantee compliance with EU policy and legislation (Petrescu-Mag 2008 (a), p.29). In accordance with EC Treaty, the European Commission has to ensure that the provisions of the community treaties and the measures taken by the European institutions are applied. If the Commission considers that a Member State (MS) has failed to fulfill an obligation under the treaty (Community law in general), it shall deliver a reasoned opinion to the MS. This stage, during which the interchange of letters between European Commission
RUXANDRA-MĂLINA PETRESCU-MAG, DACINIA CRINA PETRESCU
32
and the Member State took place, is called the preliminary phase. So, the Commission is obliged to first issue a Letter of Formal Notice against a Member State which infringes the Community law. Where the infringement is not repaired, the Commission may issue a Reasoned Opinion against the Member State, and if also this does not lead to the compliance with European Community law, it may appeal to the Court of Justice. If the Court of Justice finds that a Member State has failed to fulfill the obligation, the State shall be required to take the necessary measures to comply with the judgment of the Court of Justice. If the Commission considers that the MS concerned has not taken such measures it shall, after giving that State the opportunity to submit its observations, will issue a reasoned opinion specifying the points on which the MS concerned has not complied with the judgment of the Court of Justice. If the MS concerned fails to take the necessary measures to comply with the Court's judgment within the time-limit laid down by the Commission, the latter may bring the case before the Court of Justice. In so doing it, shall specify the amount of the lump sum or penalty payment to be paid by the Member State concerned which it considers appropriate in the circumstances. If the Court of Justice finds that the Member State concerned has not complied with its judgment it may impose a lump sum or penalty payment on it (art.226-228 Treaty of Rome). The European Commission made public the directions that should be taken into consideration when establishing the payments: the seriousness of the effects of the infringement, the timing of infringement, the economic capacity of the MS that refers to GNP and to the number of votes in the Council.
These provisions apply to all three forms of national infringements, i.e. cases, where a Member State did not transpose (or transpose with delay) EC secondary legislation into its national legal order (non-transposition), where the Member State transposed secondary EC legislation in an incomplete or incorrect way (incorrect transposition), or where a Member State did not correctly apply primary or secondary Community law in concrete cases (incorrect application) (Moreno Molina, 2006, p.161; Petrescu-Mag, 2008a, p.205; Krämer, 2008, p.2).
Short overview on Directive 93/13 of the European Economic Community regarding unfair terms in consumer contracts
The necessity to adopt Directive 93/13 EEC (European Economic Community, after Treaty of Maastricht called European Community -EC ) comes out of the need to have uniform rules of law in the matter of unfair terms. The directive requires contract terms to be drafted in plain and intelligible language and it states that ambiguities will be interpreted in favour of consumers. As it comes stated in art.1 of Directive 93/13 EEC on unfair terms in consumer contracts, its purpose is to approximate the laws, regulations and administrative provisions of the Member States relating to unfair terms in contracts concluded between a seller or supplier

CONSUMER PROTECTION USING THE LEGAL INSTRUMENT OF INFRINGEMENT, IN ORDER TO …
33
and a consumer. We have to mention that the directive provisions apply to all contractual clauses that were not individually negotiated. Art. 3 of the directive gives the definition of the “unfair term”: it is the contractual term which has not been individually negotiated shall be regarded as unfair if, contrary to the requirement of good faith, it causes a significant imbalance in the parties' rights and obligations arising under the contract, to the detriment of the consumer. Directive 93/13 EEC therefore introduces a notion of “good faith” in order to prevent significant imbalances in the rights and obligations of consumers on the one hand and sellers and suppliers on the other hand. Thus, it provides two criteria for defining the terms of clause: the requirements of good faith and significant imbalance. Defining criteria are unstable. We can even consider them redundant: such can be considered bona fide the professional who asks the consumer to enforce a contractual clause that substantially benefit him, him, the professional at the expense of consumers? The concept of contractual imbalance implies an appreciation of the advantages and disadvantages for each contracting party to the clause in question. This definition leaves in any case the judge a wide discretion to decide whether the clause could issue or not abuse (Udrescu & Cocor, 2009). This general requirement of “good faith” is supplemented by a list of examples of terms that may be regarded as unfair. The directive’s annex presents some of them. It could be consider such term that which have the object or effect of: excluding or limiting the legal liability of a seller or supplier in the event of the death of a consumer or personal injury to the latter resulting from an act or omission of that seller or supplier; requiring any consumer who fails to fulfil his obligation to pay a disproportionately high sum in compensation; obliging the consumer to fulfil all his obligations where the seller or supplier does not perform his; irrevocably binding the consumer to terms with which he had no real opportunity of becoming acquainted before the conclusion of the contract (see more in the annex of directive). The abusive character of a contractual clause should be appreciated in a relative and concrete manner. The unfairness of a contractual term shall be assessed, taking into account the nature of the goods or services for which the contract was concluded and by referring, at the time of conclusion of the contract, to all the circumstances attending the conclusion of the contract and to all the other terms of the contract or of another contract on which it is dependent.
This indication appears to be in contradiction with the definition of unfair terms. If, indeed, the clause is one that creates an imbalance in the contract, the result can be assessed only when the professional requires the contract performance. It must be admitted so that they could assess the unfairness of a clause also at this time. Finally, the abuse may be a combination of terms of the same contract or possibly of the terms of another contract, last one related to the litigious contract. It is therefore natural to lie national court to assess the unfairness of a clause, examining the circumstances of the contractual relationship issue, with advantages and disadvantages of such clause (Udrescu & Cocor, 2009).
Ending, Directive 93/13 EEC has four main characteristics:
RUXANDRA-MĂLINA PETRESCU-MAG, DACINIA CRINA PETRESCU
34
1. It does not refer specifically to a particular category of consumer contracts or to any particular field, but it regards all consumer contracts.
2. It refers only to the contractual arrangements between professionals, on the one hand and consumers on the other side. Therefore, in order to invoke the provisions of his/her benefit, the person must have the quality of the consumer, in the sense that it is defines the in directive.
3. Thirdly, the Directive strictly relates to unfair terms. It contains provisions regarding the presentation and interpretation of consumer contract terms.
4. According to article 8, it is a minimum directive, leaving MS the freedom to adopt in their national legislation, provisions that are more favorable.
Legislative gaps existing in present directives regulating different aspects on consumers’ rights have European Commission to presented, in 2008, a proposal for a directive on consumer rights. The proposal aims at revising Directive 85/577/EEC on contracts negotiated away from business premises, Directive 93/13/EEC on unfair terms in consumer contracts, Directive 97/7/EC on distance contracts, Directive 1999/44/EC on consumer sales and guarantees. These four Directives provide for consumer contractual rights. The proposal merges these four Directives into a single horizontal instrument regulating the common aspects in a systematic fashion, simplifying and updating the existing rules, removing inconsistencies and closing gaps (Com, 2008, p.3). The need to have a more unitary legal framework emerged from the necessity to update and modernize the existing consumer rights, bringing them in line with technological change and strengthening provisions in the key areas where consumers have experienced problems in recent years – particularly in sales negotiated away from business premises. The Proposal is part of the Review of the Consumer Acquis. The proposal has been subject to an impact assessment and extensive public consultations. In the course of the impact assessment process, the Commission consulted business and consumer stakeholders (http://ec.europa.eu/consumers/rights/cons_acquis_en.htm).
Case C-144/99, Commission of the European Communities vs Kingdom of the Netherlands
Briefly, directive is a legislative act of the European Union which requires MS to achieve a particular result without dictating the means of achieving that result. Treaty of Rome, in art.288 states that a directive shall be binding, as to the result to be achieved, upon each Member State to which it is addressed, but shall leave to the national authorities the choice of form and methods. Each of the Member States to which a directive is addressed is obliged to adopt, within its national legal system, all the measures necessary to ensure that the directive is fully effective, in accordance with the objective it pursues. Article 1 of the Directive 93/13EEC states that its aim is to approximate the laws, regulations and administrative provisions of
CONSUMER PROTECTION USING THE LEGAL INSTRUMENT OF INFRINGEMENT, IN ORDER TO …
35
the Member States relating to unfair terms in contracts concluded between a seller or supplier and a consumer. Member States must therefore, in order to achieve the result sought by the Directive, choose a form and method of implementation that offer a sufficient guarantee that the public can obtain knowledge of it (about transposition process of directive see more in Petrescu-Mag, 2008 (b)). National law has to guarantee that the national authorities will effectively apply the directive in full, that the legal position under national law should be sufficiently precise and clear and that individuals are made fully aware of their rights and, where appropriate, may rely on them before the national courts. This is what we call the principle of “direct effect”, not so often present in case of directives; nevertheless, we always may talk about a direct effect of directives after the expiration of transposition date that was fixed in the directive. The jurisprudence of the European Union stated that the absence of directive transposition into the national legislation, after the exiration of the term, allows individuals to allegate directive provisions against MS. It is essential that the legal situation resulting from national implementing measures be sufficiently precise and clear and that individuals be made fully aware of their rights so that, where appropriate, they may rely on them before the national courts. This principle was settled in Becker sentence, in January 1982 (Moreno Molina, 2006). The latter condition is of particular importance where the directive in question is intended to confer rights on nationals of other Member States, as is the case for Directive 93/13 EEC on unfair terms in consumer contracts. So, directives give MS a timetable for the implementation of the intended outcome (for detailes see Petrescu-Mag 2008 (a), p.241), in our case, Directive 93/13EEC, art. 10 has as deadline 31 December 1994. MS should always achieve the required result they are binding to, but they can go beyond it, meaning they can introduce or maintain stricter national rules. As a consequence, differences exist in the level of protection afforded to EU consumers and the modalities for exercising the rights granted by the directives. Regulatory fragmentation is one of the main obstacles to cross-border trade identified by the traders. The additional cost of complying with different national laws regulating consumer transactions – which is in the scope of the current review of the EU Consumer Acquis – is considered as an important barrier for traders.
In case C-144/99, Commission of the European Communities vs Kingdom of the Netherlands (European Court, 2001) we deal with a specific case of infringement of EU legislation. As we said before, an infringement proceeding is an action against a Member State, which fails to fulfil an obligation under the EC Treaty or under secondary EU legislation, in our case directive 93/13EEC. By failing to adopt the laws, regulations and administrative provisions necessary for the full transposition into Netherlands law of articles 4(2) and 5 of Council Directive 93/13/EEC of 5 April 1993 on unfair terms in consumer contracts, Kingdom of the Netherlands did not fulfil its obligations under Article 189 of the EC Treaty (now Article 249 EC Treaty). In reality, The Commission has considered that the transposition of the Directive into Netherlands law was insufficient in terms of the form and method
RUXANDRA-MĂLINA PETRESCU-MAG, DACINIA CRINA PETRESCU
36
chosen, and incomplete in terms of its effects. Here are the Duch legal acts that are considered incomplete taking into consideration art. 1, 3, 4, 5 and 10 of the Directive, as they are presented in case C-144/99:
- in Book III of the Netherlands Civil Code (hereinafter NCC) sets out the general rules of property law and Book VI the rules governing obligations and contracts in general. Article 35 of Book III of the NCC establishes: The fact that a statement made by a person or conduct on his part does not faithfully reflect his intentions is no defence against another person who has understood that statement or conduct as addressing to him a statement to particular effect where, in the light of the circumstances, that is a reasonable inference;
- Article 231 of Book VI of the NCC defines standard terms as one or more terms, expressed in writing with a view to their inclusion in a number of contracts, other than terms which describe the material contractual obligations;
- Article 233 of Book VI of the NCC says: A clause constituting one of the standard terms of a contract may be declared void: (a) if it is abnormally onerous for the other party, having regard to the nature and content of the contract, the manner in which the terms came to be formulated and the interests of each party, as evident to the other, and the other circumstances of the case; (b) if the other party has not been given sufficient opportunity to acquaint himself with the standard terms;
- Article 248 of Book VI of the NCC provides: 1. A contract produces not only the legal effects agreed by the parties, but also those which, according to the nature of the contract, are entailed by law or custom, or which are necessary in the interests of reasonableness and fairness. 2. Any rule to which the relationship between the parties is subject by virtue of the contract shall be inapplicable in so far as it would be irreconcilable with the standards of reasonableness and fairness appropriate to the circumstances of the case.
The aim of the directive is to protect consumers by conferring specific rights, the implementing measures adopted must be clear and unambiguous. The provisions of the NCC relied upon by the Netherlands Government do not meet those requirements. The Commission has also allegated that those provisions fail to ensure that Articles 4(2) and 5 of the Directive will be given proper effect in practice. We may come to the European Commission' opinion if we have a look also n the mentioned articles of directive:
- Art.1: “The purpose of this Directive is to approximate the laws, regulations and administrative provisions of the Member States relating to unfair terms in contracts concluded between a seller or supplier and a consumer”. Art. 3 of the Directive defines unfair terms. Pursuant to Article 6, such terms shall not be binding on the consumer. Art.4, pargraph 1 and 2: “Without prejudice to art.7, the unfairness of a contractual term shall be assessed, taking into account the nature of
CONSUMER PROTECTION USING THE LEGAL INSTRUMENT OF INFRINGEMENT, IN ORDER TO …
37
the goods or services for which the contract was concluded and by referring, at the time of conclusion of the contract, to all the circumstances attending the conclusion of the contract and to all the other terms of the contract or of another contract on which it is dependent” and “Assessment of the unfair nature of the terms shall relate neither to the definition of the main subject matter of the contract nor to the adequacy of the price and remuneration, on the one hand, as against the services or goods supplies in exchange, on the other, in so far as these terms are in plain intelligible language”. Furthermore art.5 says: In the case of contracts where all or certain terms offered to the consumer are in writing, these terms must always be drafted in plain, intelligible language. Where there is doubt about the meaning of a term, the interpretation most favourable to the consumer shall prevail. This rule oninterpretation shall not apply in the context of the procedures laid down in article 7 (2).
In this situation, the Commission initiated the infringement procedure. This procedure followed the preliminary stage, in accordance with art. 226. Treaty of Rome (before art.169). Commission gave Kingdom of the Netherlands formal notice to submit its comments on this ground, delivering a reasoned opinion on 6 April 1998 calling upon the Netherlands to take the measures necessary to comply with the Directive within two months of receipt of the opinion. Since the Kingdom of the Netherlands failed to comply with the terms of the reasoned opinion, the Commission brought the present action, in front of the European Court of Justice.
To the European Commission allegations, the Netherlands Government response was that art. 189 of the Treaty leaves the Member States entirely free to choose the form and methods necessary to transpose a directive into national law, adding that specific implementing measures are not indispensable if the national legal system already secures the aims pursued by the directive. As we have mentioned in the beginning of this section, we underline once again that it is essential for national law to guarantee that the national authorities will effectively apply the directive in full, that the legal position under national law should be sufficiently precise and clear and that individuals are made fully aware of their rights and, where appropriate, may rely on them before the national courts. The last-mentioned condition is of particular importance where the directive in question is intended to accord rights to nationals of other Member States, this is also the case of our directive. The Court made clear that one of the aims of the directive is to safeguard the citizen in his role as consumer when acquiring goods and services under contracts which are governed by the laws of Member States other than his own. Next, the Court considered that the Kingdom of the Netherlands has been unable to show that its legal system contains provisions equivalent to Articles 4(2) and 5 of the Directive and results intended by the Directive cannot be attained by applying Netherlands law as it stands at present.
RUXANDRA-MĂLINA PETRESCU-MAG, DACINIA CRINA PETRESCU
38
Taking into account all these reasons, the European Court of Justice considered the Kingdom of the Netherlands failed to adopt the laws, regulations and administrative provisions necessary for the full transposition into national law of Articles 4(2) and 5 of the Directive, and therefor failed to fulfil its obligations under that Directive.
Under Article 69(2) of the Rules of Procedure, the unsuccessful party, in our case the Kingdom of the Netherlands was ordered support the costs.
Conclusions
European Union consumer policy considers effective enforcement of consumer law as a high priority with two parts: one refers to ensuring that consumers benefit completely from their consumer rights in their daily lives, and the other aims to establish a level playing field for firms in a competitive single market. Consumer policy is also a key component of the Commission single market policy because the benefits of the single market can be felt by the citizens only by implementation and enforcement of the rules.
Articles 226-228 EC treaty remain the principal legal basis for the Court decisions, which underlines the important role of the European Commission in ensuring the application of EC consumer laws. The European Commission has a quasi-monopoly in bringing cases before the Court of Justice (individuals do not have the possibility to force the Commission to start an infringement proceeding.and the MS before bringing the case in front of the European Court of Justice have to bring it first, in front of European Commission). The best remedies against monopolistic situations are well known from economic policy (Krämer, 2008, p.13): for example: (1) Transparency. This means that the Commission should publish the rules and provisions which govern the EC infringement procedures. (2) Openness. This means that the Commission should publish the Letters of Formal Notice and Reasoned Opinions which it decides against Member States. At present, these decisions are kept confidential, with no convincing arguments. (3) Competition. This means that the Commission should present legislative proposals which allow organisations and individual persons to have legal standing before the Court of Justice And the European Parliament and the Council should speedily adopt such proposals, in order to at last comply with the requirements of the Aarhus Convention in this regard.
Case C-144/99 – Commission of the European Communities vs Kingdom of the Netherlands – represents a proofe that every time national law does not guarantee that the national authorities effectively applied a directive in full, and the legal position under national law are not sufficiently precise and clear, the „guardian of the community law” should intervene and the MS has to support the consequences of its infringement.
CONSUMER PROTECTION USING THE LEGAL INSTRUMENT OF INFRINGEMENT, IN ORDER TO …
39
BIBLIOGRAPHY
Asch, P., 1988. Consumer Safety Regulations: Puting a Price on Life or Limb. New York: Oxford Univesrsity Press.
Krämer L., 2008. Environmental judgments by the Court of Justice and their duration. European Legal Studies/Etudes Européennes Juridiques, [Online].4, pp.2-17. Available at: http://www.coleurop.be/file/content/studyprogrammes/law/studyprog/pdf/rese archpaper 4_2008.pdf [Accessed 12 January 2010].
Manley, W. W., Shrode, W. A., 1990. Critical Issues in Business Conduct: Legal, Ethical, and Social Challenges for the 1990s. New York: Quorum Books.
Mazilu D., 2008. Environmental community law (in Romanian). 3rd edition. Bucureşti: Lumina Lex.
Mihuţ, I., Pop, M., 1996. Consumatorul şi managemnetul ofertei. Cluj-Napoca, Ed. Dacia. Moreno Molina A.M., 2006. Environmental community law. Institutional framework,
reglementation and aplication in Spain (in Spanish). Madrid: Marcial Pons, Ediciones Juridicas y sociales.
Petrescu-Mag R.M., 2008 (a). Policies, institutions and environmental legislation. [in Romanian]. Cluj-Napoca: AcademicPres.
Petrescu-Mag R.M., 2008 (b). Water legal provisions with special focus on the quality of fresh waters needing protection or improvement in order to support fish life. Consideration on Romania’s progress. Aquaculture, Aquarium, Conservation & Legislation International Journal of the Bioflux Society, 4 (1), pp.11-20.
Udrescu D., Cocor M., 2009. Theoretically and practical considerations un on unfair terms in contracts. Identification. Elimination. [in Romanian].[Online], pp.1-10. Available at: http://ecr.valahia.ro/Simpozion_ECR_2009/Materiale_simpozion/17.15_17.30 _udrescu_doina+cocor_monica.pdf [Accessed 16 January2010]
Weatherill S., 2005. EU consumer law and policy. 2nd edition. Cheltenham [u.a.] : Elgar. Series: Elgar European law. Legal official publications
Commission of the European Communities (COM), 2008. Proposal for a Directive of the European Parliament and of the Council on consumer rights, COM(2008) 614 final, 2008/0196 (COD), {SEC(2008) 2544}{SEC(2008) 2545}{SEC(2008) 2547}. [Online] Available at: http://ec.europa.eu/consumers/rights/docs/COMM_PDF_COM_2008_0614_F_EN_PROPOSITION_DE_DIRECTIVE.pdf [Accessed 4 June 2005]
COUNCIL DIRECTIVE 93/13/EEC on unfair terms in consumer contracts, 1993. Official Journal L 095 , 21/04/1993, pp.0029 – 0034.
RUXANDRA-MĂLINA PETRESCU-MAG, DACINIA CRINA PETRESCU
40
European Court, 2001. Commission of the European Communities vs Kingdom of the Netherlands Failure by a Member State to fulfil its obligations - Directive 93/13/EEC - Unfair terms in consumer contracts - Incomplete transposition of the directive into national law. European Court Reports 2001, pp. I-03541.
*** The Treaty of Rome, 1957. Available at: http://www.eurotreaties.com/rometreaty.pdf http://ec.europa.eu/consumers/rights/cons_acquis_en.htm [Accessed 12 January 2010]
European Commission, 2007. EU Consumer Policy Strategy 2007-2013. Empowering Consumers, Enhancing their Welfare, Effectively Protecting Them. [pdf] Luxembourg: European Communities. Available at: http://ec.europa.eu/consumers/overview/cons_policy/doc/cps_0713_en.pdf [Accessed 12 January 2010]
Commission of the European Communities, 2009. Communication from the Commission to the European Parliament, the Council, the European Economic and Social Committee and the Committee of the Regions on the Enforcement of the Consumer Acquis. [pdf] Bruxelles: Commission of the European Communities. Available at: http://ec.europa.eu/consumers/enforcement/docs/Communication_en.pdf [Accessed 12 January 2010]
STUDIA UNIVERSITATIS BABEŞ-BOLYAI, NEGOTIA, LVI, 1, 2011
THE QUALITY OF THE SERVICES OFFERED BY THE RURAL TOURISTIC PENSIONS FROM GÂRDA DE SUS
(THE APUSENI MOUNTAINS)
JANETTA SÎRBU1, NICOLAE MĂRGINEAN2, FLORIN RADU PINTEA3, OANA ELEONORA GLOGOVEŢAN4
ABSTRACT. The article presents the quality of the services offered by the rural touristic pensions in Gârda de Sus (the Apuseni Mountains). The importance of the theme is also given by the fact that each year the number of tourists that turned towards this kind of rural touristic services has increased by 158% in 2008 compared to 2004.
In order to estimate the quality of the services offered by the rural touristic pensions a questionnaire for two groups of subjects has been used : the owners of the pensions and their customers – the tourists. The test sample used for the owners of rural touristic pensions from the studied area was formed by 27 people, the questionnaire’s scope being that of testing the extent to which the owners are aware of the current Legislation as well as other aspects indirectly influenced by this: the quality of services – hospitality, the degree of receptivity to new, willingness to change, the importance of a close and friendly relationship with the customers etc. There have been 135 test sample tourists that have visited the studied pensions that have been asked questions regarding the quality of the services offered, the hospitality aspects, the pensions peculiarities and authenticity etc. Keywords: rural touristic pensions, tourists, services, quality. JEL classification: R11, Q13, Q26, Q01 1. INTRODUCTION5
The quality of services is an essential condition in order for rural touristic pensions to exist. According to the current Legislation, there is a series of minimum
1 Associate Professor, „Bogdan Voda” University of Cluj-Napoca, Faculty of Economic Sciences,
Romania, [email protected] 2 Associate Professor, „Bogdan Voda” University of Cluj-Napoca, Faculty of Economic Sciences,
Romania, [email protected] 3 Lecturer, „Bogdan Voda” University of Cluj-Napoca, Faculty of Economic Sciences, Romania,
[email protected] 4 Lecturer, „Bogdan Voda” University of Cluj-Napoca, Faculty of Economic Sciences, Romania,
[email protected] 5 www.antrec.ro, Minimum criteria regarding the classification of touristic pensions
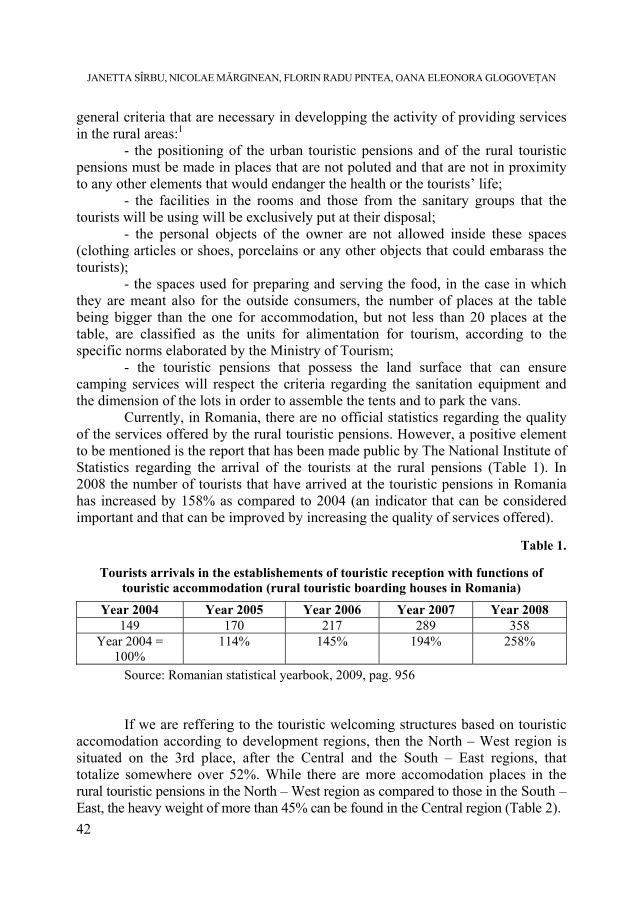
JANETTA SÎRBU, NICOLAE MĂRGINEAN, FLORIN RADU PINTEA, OANA ELEONORA GLOGOVEŢAN
42
general criteria that are necessary in developping the activity of providing services in the rural areas:1
- the positioning of the urban touristic pensions and of the rural touristic pensions must be made in places that are not poluted and that are not in proximity to any other elements that would endanger the health or the tourists’ life;
- the facilities in the rooms and those from the sanitary groups that the tourists will be using will be exclusively put at their disposal;
- the personal objects of the owner are not allowed inside these spaces (clothing articles or shoes, porcelains or any other objects that could embarass the tourists);
- the spaces used for preparing and serving the food, in the case in which they are meant also for the outside consumers, the number of places at the table being bigger than the one for accommodation, but not less than 20 places at the table, are classified as the units for alimentation for tourism, according to the specific norms elaborated by the Ministry of Tourism;
- the touristic pensions that possess the land surface that can ensure camping services will respect the criteria regarding the sanitation equipment and the dimension of the lots in order to assemble the tents and to park the vans.
Currently, in Romania, there are no official statistics regarding the quality of the services offered by the rural touristic pensions. However, a positive element to be mentioned is the report that has been made public by The National Institute of Statistics regarding the arrival of the tourists at the rural pensions (Table 1). In 2008 the number of tourists that have arrived at the touristic pensions in Romania has increased by 158% as compared to 2004 (an indicator that can be considered important and that can be improved by increasing the quality of services offered).
Table 1.
Tourists arrivals in the establishements of touristic reception with functions of
touristic accommodation (rural touristic boarding houses in Romania)
Year 2004 Year 2005 Year 2006 Year 2007 Year 2008 149 170 217 289 358
Year 2004 = 100%
114% 145% 194% 258%
Source: Romanian statistical yearbook, 2009, pag. 956 If we are reffering to the touristic welcoming structures based on touristic
accomodation according to development regions, then the North – West region is situated on the 3rd place, after the Central and the South – East regions, that totalize somewhere over 52%. While there are more accomodation places in the rural touristic pensions in the North – West region as compared to those in the South – East, the heavy weight of more than 45% can be found in the Central region (Table 2).
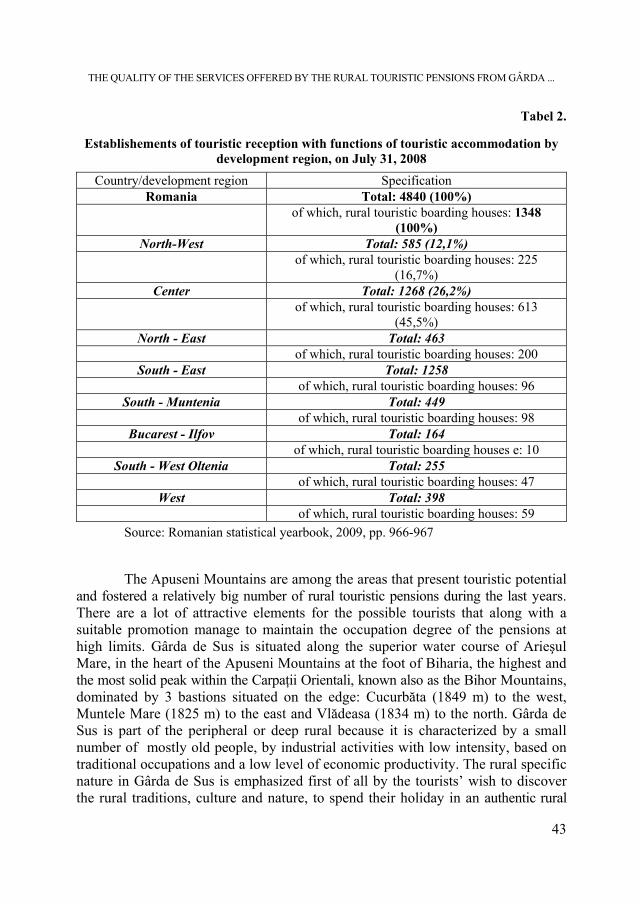
THE QUALITY OF THE SERVICES OFFERED BY THE RURAL TOURISTIC PENSIONS FROM GÂRDA ...
43
Tabel 2.
Establishements of touristic reception with functions of touristic accommodation by development region, on July 31, 2008
Country/development region Specification Romania Total: 4840 (100%)
of which, rural touristic boarding houses: 1348 (100%)
North-West Total: 585 (12,1%) of which, rural touristic boarding houses: 225
(16,7%) Center Total: 1268 (26,2%)
of which, rural touristic boarding houses: 613 (45,5%)
North - East Total: 463 of which, rural touristic boarding houses: 200
South - East Total: 1258 of which, rural touristic boarding houses: 96
South - Muntenia Total: 449 of which, rural touristic boarding houses: 98
Bucarest - Ilfov Total: 164 of which, rural touristic boarding houses e: 10
South - West Oltenia Total: 255 of which, rural touristic boarding houses: 47
West Total: 398 of which, rural touristic boarding houses: 59
Source: Romanian statistical yearbook, 2009, pp. 966-967 The Apuseni Mountains are among the areas that present touristic potential
and fostered a relatively big number of rural touristic pensions during the last years. There are a lot of attractive elements for the possible tourists that along with a suitable promotion manage to maintain the occupation degree of the pensions at high limits. Gârda de Sus is situated along the superior water course of Arieşul Mare, in the heart of the Apuseni Mountains at the foot of Biharia, the highest and the most solid peak within the Carpaţii Orientali, known also as the Bihor Mountains, dominated by 3 bastions situated on the edge: Cucurbăta (1849 m) to the west, Muntele Mare (1825 m) to the east and Vlădeasa (1834 m) to the north. Gârda de Sus is part of the peripheral or deep rural because it is characterized by a small number of mostly old people, by industrial activities with low intensity, based on traditional occupations and a low level of economic productivity. The rural specific nature in Gârda de Sus is emphasized first of all by the tourists’ wish to discover the rural traditions, culture and nature, to spend their holiday in an authentic rural

JANETTA SÎRBU, NICOLAE MĂRGINEAN, FLORIN RADU PINTEA, OANA ELEONORA GLOGOVEŢAN
44
environment where they seek peace, fresh air, want to practice sports, long walks or other activities. In this area one of the biggest attractions is represented by the pedestrian walks (in non-polluted areas) in order to visit some natural monuments, for fishing or hiking.
2. MATERIAL AND METHOD
In order to analyze the degree to which the quality standards in the case of rural touristic pensions in the Apuseni Mountains (Gârda de Sus), the working method used has been that of the questionnaires, alloted as two types: for the ones that conduct rural touristic activities and for the consumers of rural touristic services (the tourists).
The ones that conduct rural touristic activities, namely the owners of rural touristic pensions, answered a questionnaire with 10 questions, totalizing 27 persons, with the purpose of verifying the degree to which they know the current Legislation as well as other aspects that indirectly result from it (the quality of the services – hospitality, degree of receptivity to new, willingness to change etc.)
The questionnaire that has been applied to the tourist-customers is also formed by 10 questions, 135 persons being interviewed, with the purpose of finding out the degree of satisfaction regarding the quality of the services offered by the rural touristic pensions in Gârda de Sus from the Apuseni Mountains.
3. RESULTS AND DISCUSSIONS
The degree to which the owners of touristic pensions from Gârda de Sus know the quality standards of services
In order to verify the degree to which the quality standards of the services in the rural tourism are respected, a survey, based on a questionnaire with 10 questions addressed to 27 owners of rural touristic pensions from the studied area, with the purpose of verifying the extent to which they know the current Legislation as well as other aspects that indirectly result from here, has been conducted (the quality of the services – hospitality, degree of receptivity to new, willingness to change etc.)
Regarding the performance of the pension as a touristic accomodation unit, 60% of the rural touristic units have come to life more than 5 years ago (Fig. 1).
The owners of touristic pensions from Gârda de Sus have been asked about the registration of the pensions within some organizations (for example ANTREC or Operation Villages Roumains etc.); 40% of them were part of such associations while 60% of them have not subscribed to this type of specialized organisations. Most owners of the pensions are informed regarding the existence of such organizations, in a percentage of about 70%. The same result of 70% has been obtained also regarding the information about the current legislation about the classification standards of the rural touristic pensions: 10% of the owners knew the legislation in a small percentage and 20% of them did not know about those specific standards.
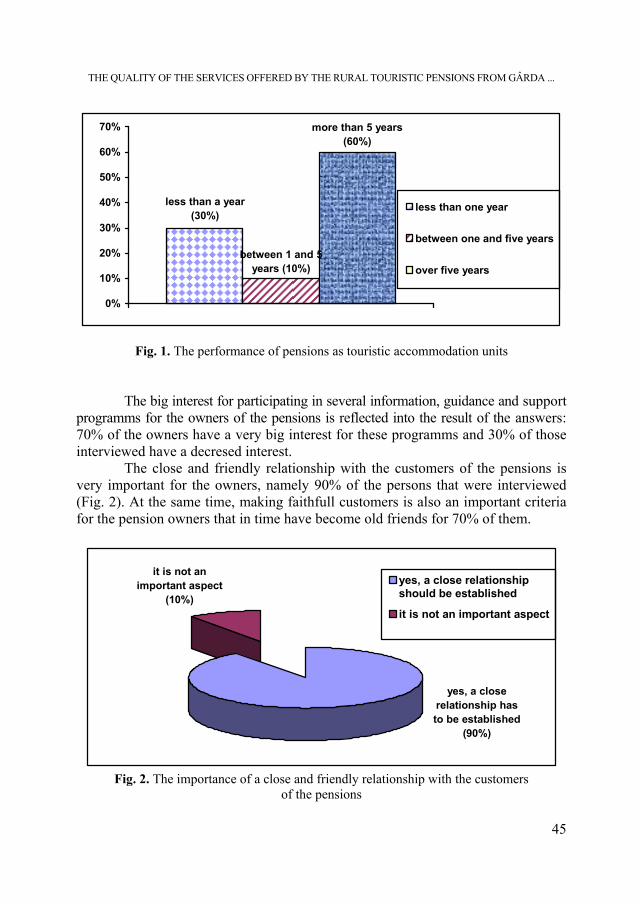
THE QUALITY OF THE SERVICES OFFERED BY THE RURAL TOURISTIC PENSIONS FROM GÂRDA ...
45
less than a year (30%)
between 1 and 5 years (10%)
more than 5 years (60%)
0%
10%
20%
30%
40%
50%
60%
70%
less than one year
between one and five years
over five years
Fig. 1. The performance of pensions as touristic accommodation units The big interest for participating in several information, guidance and support
programms for the owners of the pensions is reflected into the result of the answers: 70% of the owners have a very big interest for these programms and 30% of those interviewed have a decresed interest.
The close and friendly relationship with the customers of the pensions is very important for the owners, namely 90% of the persons that were interviewed (Fig. 2). At the same time, making faithfull customers is also an important criteria for the pension owners that in time have become old friends for 70% of them.
yes, a close relationship has to be established
(90%)
it is not an important aspect
(10%)
yes, a close relationshipshould be established
it is not an important aspect
Fig. 2. The importance of a close and friendly relationship with the customers
of the pensions
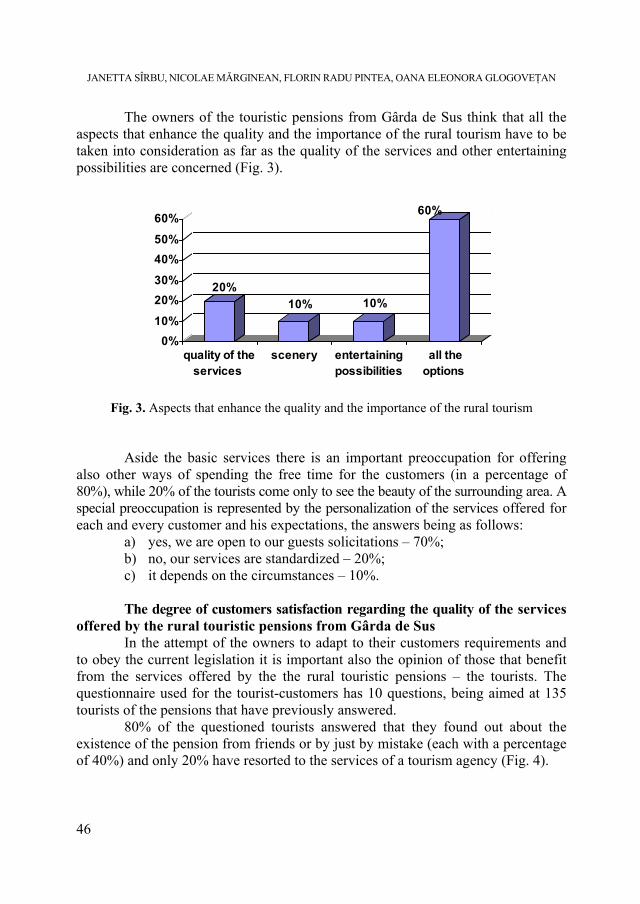
JANETTA SÎRBU, NICOLAE MĂRGINEAN, FLORIN RADU PINTEA, OANA ELEONORA GLOGOVEŢAN
46
The owners of the touristic pensions from Gârda de Sus think that all the aspects that enhance the quality and the importance of the rural tourism have to be taken into consideration as far as the quality of the services and other entertaining possibilities are concerned (Fig. 3).
20%10% 10%
60%
0%10%
20%30%
40%50%
60%
quality of theservices
scenery entertainingpossibilities
all theoptions
Fig. 3. Aspects that enhance the quality and the importance of the rural tourism
Aside the basic services there is an important preoccupation for offering
also other ways of spending the free time for the customers (in a percentage of 80%), while 20% of the tourists come only to see the beauty of the surrounding area. A special preoccupation is represented by the personalization of the services offered for each and every customer and his expectations, the answers being as follows:
a) yes, we are open to our guests solicitations – 70%; b) no, our services are standardized – 20%; c) it depends on the circumstances – 10%. The degree of customers satisfaction regarding the quality of the services
offered by the rural touristic pensions from Gârda de Sus In the attempt of the owners to adapt to their customers requirements and
to obey the current legislation it is important also the opinion of those that benefit from the services offered by the the rural touristic pensions – the tourists. The questionnaire used for the tourist-customers has 10 questions, being aimed at 135 tourists of the pensions that have previously answered.
80% of the questioned tourists answered that they found out about the existence of the pension from friends or by just by mistake (each with a percentage of 40%) and only 20% have resorted to the services of a tourism agency (Fig. 4).

THE QUALITY OF THE SERVICES OFFERED BY THE RURAL TOURISTIC PENSIONS FROM GÂRDA ...
47
from tourism agencies; 20%
by mistake; 40%
from friends; 40%
Fig. 4. „The sources” that revealed the existence of the pension Regarding the frequency to which this rural touristic pensions are visited,
the percentage of those that come a few times a year is 60%, while others come approximately once a month (30%) and once every few months – 10%. Regarding the access paths towards a certain pension, the degree of dissatisfaction is very high, namely 60% - totally dissatisfied and those that are pretty satissfied have answered in a percentage of 30% and only 10% of those that have been interviewd have been very satissfied.
The quality of the services offered by one or the other of the pensions has been appreciated in a percentage of 60% as being high and only 10% awarded the „weak” epithet (Table 3). The beauty factor and the beauty of the scenery are the most appreciated aspects by the tourists, the percentage being of 90%.
Table 3.
Aspects regarding the quality of the services
The quality of the services offered at the pensions High - 60% Acceptable - 30% Weak -10%
The most important aspect for tourists The quality of the
services - 50% The beauty of the scenery -
40% The access road -10%
Regarding the prices used, the customers think these are acceptable in a
percentage of 50% and very good for 40% of the respondents and for 10% of them the prices are high. The holidays spent at the same host (pension) are applicable only for 40% of the respondents, as they are satisfied by the conditions offered by the owners of the pensions. At the same time, for 60 % of the respondents the location changes each time as they like new experiences and sceneries.
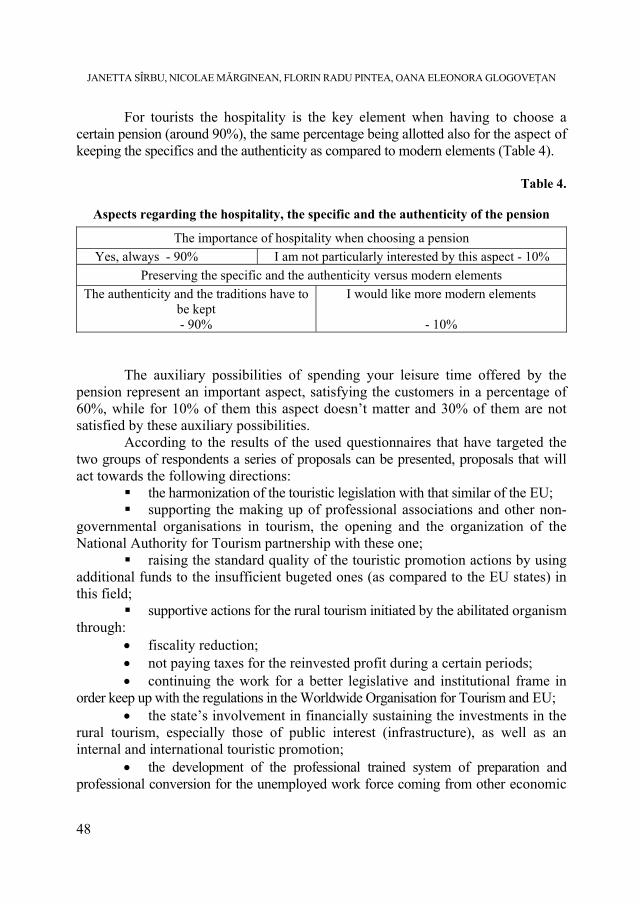
JANETTA SÎRBU, NICOLAE MĂRGINEAN, FLORIN RADU PINTEA, OANA ELEONORA GLOGOVEŢAN
48
For tourists the hospitality is the key element when having to choose a certain pension (around 90%), the same percentage being allotted also for the aspect of keeping the specifics and the authenticity as compared to modern elements (Table 4).
Table 4.
Aspects regarding the hospitality, the specific and the authenticity of the pension
The importance of hospitality when choosing a pension Yes, always - 90% I am not particularly interested by this aspect - 10%
Preserving the specific and the authenticity versus modern elements The authenticity and the traditions have to
be kept - 90%
I would like more modern elements
- 10% The auxiliary possibilities of spending your leisure time offered by the
pension represent an important aspect, satisfying the customers in a percentage of 60%, while for 10% of them this aspect doesn’t matter and 30% of them are not satisfied by these auxiliary possibilities.
According to the results of the used questionnaires that have targeted the two groups of respondents a series of proposals can be presented, proposals that will act towards the following directions:
the harmonization of the touristic legislation with that similar of the EU; supporting the making up of professional associations and other non-
governmental organisations in tourism, the opening and the organization of the National Authority for Tourism partnership with these one;
raising the standard quality of the touristic promotion actions by using additional funds to the insufficient bugeted ones (as compared to the EU states) in this field;
supportive actions for the rural tourism initiated by the abilitated organism through:
• fiscality reduction; • not paying taxes for the reinvested profit during a certain periods; • continuing the work for a better legislative and institutional frame in
order keep up with the regulations in the Worldwide Organisation for Tourism and EU; • the state’s involvement in financially sustaining the investments in the
rural tourism, especially those of public interest (infrastructure), as well as an internal and international touristic promotion;
• the development of the professional trained system of preparation and professional conversion for the unemployed work force coming from other economic
THE QUALITY OF THE SERVICES OFFERED BY THE RURAL TOURISTIC PENSIONS FROM GÂRDA ...
49
sectors; the creation of a learning institution network for tourism integrated in the European network of the accomodation-touristic learning;
• the correlation of the programs and of the touristic development projects with the regional development programms (transportation, telecommunications, the arrangement of the territoryetc.);
• promoting the quality brands in order to raise the competitivity standards on the rural touristic market and for acknowledging the quality of the services in tourism.
4. CONCLUSIONS
The Apuseni Mountains represent a real potential for practicing rural tourism, being considered one of the major opportunities Romania has as far as the development of this form of tourism is concerned. In this paper I have tried to illustrate the way in which this potential, doubled by a high quality of services can appear as a factor of development and progress, both for this area but also for the entire country by attracting big numbers of foreign or local tourists.
In the last few years the number of rural touristic pensions has increased significantly, but unfortunately, an efficient management for quality in general and for services in particular has not been adopted yet at the level of these units. As far as the quality of the touristic services is concerned and after the field work and analysis made in Gârda de Sus in the district of Alba, several conclusions can be drawn:
- the natural quality characteristics can make the touristic product more or less attractive, by increasing or decreasing the customer’s degree of satisfaction;
- the insurance of the technical characteristics of quality also implies some investing, maintenance and repair expenses that can be very big;
- the rural touristic pensions register major failures especially because they are not yet prepared to ensure a corresponding level for the characteristics that are linked to the trained personnel in providing such services (they do not have qualified personnel that can meet the foreign or local customers expectations);
- the tangible elements find their applicability in the travel and tourism industry, where the decision of accepting a service or a touristic product that is made by a package of services, could be sensitevely influenced by the image that the potential buyer forms about it regarding the quality, the diversity and the attractiviness of the intangible elements that are part in the offer of the sellers;
- the improvement in the quality of the touristic services, as in any other product as well, implies an enhanced consumption of resources, fact that leads to an increase in the costs and taxes they are subject to (through which the units ensure they can retrieve the costs and obtain a profit). Consequently, between the quality level of the product and the cost and taxes level they imply a directly proportional report can be accepted.
- the multiple tasks that are assigned to the rural touristic pensions owners have to correlate with the essential preoccupation regarding a rigurous coordination
JANETTA SÎRBU, NICOLAE MĂRGINEAN, FLORIN RADU PINTEA, OANA ELEONORA GLOGOVEŢAN
50
of the way in which the basic elements of the strategic plans fit into the adopted objectives, taking into account the fact that the final result has to be that of developping a profitable touristic activity. Hence, the manager has to follow, verify and harmonize the way in which these strategic plans can be reflected in reality. During all this time he has to revise the way in which his initiatives and strategic plans can be put into practice taking into account the demand for a diversified touristic services market.
- the rural touristic pensions have to adapt in order to face the competitivity, by exerting its competitiviness mainly in the field of quality (the notion of qualitative transfer, meaning keeping the market through quality).
As a conclusion, the necessity for managing quality is restricted by the degree of dependance of the customer. He is raised, especially when the seller has the knowledge or the know-how that are specific or when the customer is in a position of dependence on these services. In the tourism field most of the customers are not in a position of dependance and the force report is always on their side. This force report depends among other things on the presence of some alternative offers. The importance of quality increases alongside the enforcement of the customers requests, that implies the increasing need to tactfully manage quality.
REFERENCES
Argeşel, I.P., Valea Arieşului,Editura Sport-Turism, Bucureşti, 1984 Gherasim, T., Gherasim, D., Marketing turistic, Editura Economică, Bucureşti, 1999 Minciu, R., Economia turismului, Editura Uranus, Bucureşti, 2000 Mitrache, Şt., Manole, V., Stoian, M., Bran, Fl., Istrate, I., Agroturism şi turism rural,
Editura Fax Press, Bucureşti, 1996 Mortan, Maria, Agroturismul - o alternativă posibilă, Editura Dacia, Cluj-Napoca 2005 Naghi, M., Stegerean R., Managementul unitatilor din turism si comert, Editura Ecoexpert
Cluj-Napoca, 2001 Olteanu, V., Marketingul serviciilor, Editura Ecomar, Bucureşti, 2003 Patriche, D., Ispas, A., Stremţan, Patriche, I., Elemente de marketing turistic, Editura
Global Media Image, Deva, 2000 Petrean, R., Petrean, D., Turismul rural, Editura Presa Universitară Clujeană, Cluj-
Napoca, 2000 Stremţan, F., Marketing. Arealul turistic apusean al României, Editura ETA, Cluj Napoca,
1998 Tufescu, V., şi colectiv, Geografia României, Editura Didactică şi Pedagogică, Bucureşti,
1990 *** Anuarul Statistic al României, 2009
THE QUALITY OF THE SERVICES OFFERED BY THE RURAL TOURISTIC PENSIONS FROM GÂRDA ...
51
*** Studiu de amenajare turistică a Văii Arieşului, I.C.T., Bucureşti, 1991 *** www.ecoambient.ro *** www.finantare.ro *** www.harti.ro *** www.insse.ro *** www.padis.info.ro *** www.turismrural.com *** www.antrec.ro
STUDIA UNIVERSITATIS BABEŞ-BOLYAI, NEGOTIA, LVI, 1, 2011
THE ECONOMIC EFFECTS OF TOURISM: THE CASE OF ROMANIAN ECONOMY
VALENTIN TOADER1 ABSTRACT. The purpose of this paper is to evaluate the economic impact of tourism in the case of Romania. To fulfill its goal, the author will focus on three macroeconomic indices (GDP, employment and exports) and using statistical data will analyze the relationship between tourism and these three macroeconomic variables. The results demonstrate that, in the case of Romania, the tourism has a low economic influence. In the end, using the models developed during the analysis, it will be forecasted the value of GDP for 2010. Keywords: tourism, GDP, GAV, employment, exports. JEL classification: L83, E01, E17, E24 Introduction
Tourism is one of the fastest growing industries in the world, an industry that is seen as a source for the economic recovery nowadays. According to World Tourism Organization (UNWTO, 2010), even if the tourism has proven its role in stimulating the global economy and development, this sector is still not sufficiently accounted for in global decision-making. As a result UNWTO is holding a campaign – Tourism enriches – where the benefits of tourism are promoted through a simple and clear message: “Tourism enriches individuals, families, communities and all the world” (logo is in the previous picture).
The main economic benefits of tourism are synthesized on the UNWTO web page (2010):
• Export earnings – in the balance of payments of many countries the export of touristic services represent an important factor. International tourism receipts reached US$ 852 billion (€ 611 billion) in 2009, lower with 5.7% in real terms than in 2008 (US$ 942 billion (€ 641 billion) as a result of economic downturn2;
1 Lecturer, PhD, Faculty of Business, Babes-Bolyai University, Cluj-Napoca, Romania,
[email protected] 2 UNWTO, 2010

VALENTIN TOADER
54
Figure 1. – International Tourism Receipts • Employment – the most direct benefit of tourism development is the
job creation. It is not possible to develop tourism facilities without employing more people. A higher number of employees means more wages (incomes) and more expenditures (indirect effects);
• Rural opportunities – tourism activities facilitate the development of rural areas also, reducing de economic gaps between the rural an urban areas;
• Infrastructure investment – in order to attract tourists it is necessary to have an appropriate infrastructure (airports, roads, marinas, sewage systems, water treatment plants). Their creation and their maintenance creates jobs and incomes;
• Tax revenues – the government receives incomes from the touristic activity (accommodation and restaurant taxes, airport users’ fees, sales taxes, park entrance fees, employee income tax).
To measure the economic effects of tourism, World Tourism Organization (UNWTO), World Travel & Tourism Council (WTTC) and Organization for Economic Co-Operation and development (OECD) developed a methodological framework – Tourism Satellite Account (TSA) – an economic tool used to evaluate properly the impact of tourism on economy. In this paper we will not use the TSA methodology, the author have opted to analyze the statistical correlations between variables.
Literature review
As we saw previously, there are some international organizations that observe and evaluate the tourism evolution, trying to find an appropriate way to enhance the economic benefits of tourism. The economic literature has also numerous papers on this subject. We will present the findings and contributions of some representative papers.
THE ECONOMIC EFFECTS OF TOURISM: THE CASE OF ROMANIAN ECONOMY
55
Cortes-Jimenez I., Pulina M., Riera i Prunera C., Artis M. (2009) and Cortes-Jimenez I., Pulina M. (2010) sustain that tourism can play a fundamental role for developing countries to achieve economic growth3, stimulating the growth of economic sectors via multiplier and spill-over effects (F.M.M. Kreishan (2010) sustain the same idea). The authors present the main theories on how tourism can facilitate the economic growth: tourism capital imports to growth (TKIG) and tourism-led growth (TLG). TKIG sustains that economic growth can be achieved by increasing the volume of inputs, while TLG shows that economic growth can be realized by expanding international tourism as a non-traditional export. International tourism can be a source of long-run economic growth through the following channels: small open economies benefit from tourism specialization, an increase of tourism receipts will ameliorate the deficits of current account, better management techniques, higher level of investments and human capital accumulation will be available. The economic model they built was based on the classical Cobb-Douglas production function. Applying the model in the case of Spain and Italy, they deduced that the expansion of tourism helped the economy development, while the economic growth facilitated the development of tourism4.
Aref F., Redzuan M., Gill S. (2009) investigate the population perceptions regarding the economic and environmental impacts of tourism on local communities. They find out that the strongest and the most favorable impacts are related to the environmental aspects, but the economic effects should not be neglected. They sustain the fact that tourism can have both positive and negative effects. The main positive economic effects identified by population are: benefits for local people and small business, jobs creation and increase of standard of living. But, in the same time, negative environmental effects are present: pollution of water and soil, traffic congestion, overcrowding.
Fayaissa B., Nsiah Ch., Tadasse B. (2007) concluded that receipts from the tourism industry significantly contribute both to the current level of GDP of Sub-Saharan African countries as do investments in physical and human capital5. To demonstrate this hypothesis, the authors used a simple double log-linear Cobb-Douglas production function, where GDP evolution was determined as a result of tourism receipts, gross fixed capital formation (as a percent of GDP), economic freedom index, secondary and tertiary school enrollment, foreign direct investment and level of trade. The result was that a 10% increase in the tourism receipts will determine a 0.3% increase in the average per capita income6.
Ivanov S. and Webster C. (2006) measure the contribution of tourism to economy’s growth for Cyprus, Greece and Spain. They argue that current methodologies analyze only the link between tourism and economic growth, but do not enhance 3 Cortes-Jimenez I., Pulina M., Riera i Prunera C., Artis M. (2009), p. 2 4 Cortes-Jimenez I., Pulina M., Riera i Prunera C., Artis M. (2009), p. 17 5 Fayaissa B., Nsiah Ch., Tadasse B. (2007), p. 4 6 Fayaissa B., Nsiah Ch., Tadasse B. (2007), p. 11
VALENTIN TOADER
56
how much of the economic growth is the effect of tourism development. They agree that tourism generates employment, additional incomes, ameliorates the balance of current account, stimulates the supplying sector of tourism and increase in general the level of activity in a country. But, they present some opinions who state that the increase in the number of tourists’ arrivals has economic benefits on the economic growth only in the developing countries or in the countries less developed. Their conclusion is that the hospitality industry is much stronger contributor to economic growth in Greece than in Spain and Cyprus.
One of the most comprehensive approaches of economic impacts of tourism is realized by D. Stynes (2001). The author starts with a presentation of the economic analysis types (economic impact analysis, fiscal impact analysis, financial analysis, demand analysis, benefit cost analysis, feasibility study and environmental impact assessment), clarifying the differences between them and enhancing the role of each analysis in the evaluation of tourism economic impacts. Then, he identifies the situations where the economic impact analysis can be applied: changes in the supply of recreation and tourism opportunities, changes in tourists’ demand, evaluation of policies and actions which affect tourism activity, understanding the interdependencies between the different sectors of the economy or allocation of resources. The economic impact of tourism is the sum of direct, indirect and induced effects7. Direct effects are production changes related to the changes in tourism expenditures; indirect effects represent production changes determined by the re-spending of the hotel industry’s receipts, while the induces effects are changes resulting from the spending of households incomes obtained directly or indirectly from tourism activities. The author explains also how tourism’s economic impacts are measured adequately and what are the steps for conducting a tourism impact study.
The Romanian economic literature has also valuable papers on this topic. Surugiu C. (2009) using an input-output analysis identify the economic impact of the tourism in the case of Romania. The author sustains the idea that tourism may have more powerful effects in the developing countries. Also it identifies the direct (tourist buy accommodation, food and beverage, recreational activities and so on) and indirect effects (expenses made by tourism business as a result of increase in the number of tourists). The input-output analysis allowed the author to measure the spread effects of changes in the final demand of tourism services. The method is based on the idea that production processes in an economy are interdependent – the products from one process are used in many other production processes. Besides the economic impact of tourism, the method has allowed to explain the connections between the tourism sector and the other sectors of the Romanian economy and to determine the size of tourism sector in our economy. Using the data for year 2005, the author obtained that a 10% increase in demand for hotels and restaurants leads to 9.4% increase in tourism sector, while the effects on other
7 Stynes D. (2001), p. 5

THE ECONOMIC EFFECTS OF TOURISM: THE CASE OF ROMANIAN ECONOMY
57
sectors are very weak: only a 0.756% increase in the trade sector, 0.644% in the manufacturing sector, 0.531% in agriculture, hunting, forestry and fishing, 0.357% in transport, storage and communications, 0.314% in construction or 0.228 in financial intermediations8. In conclusion, in Romania we have a weak connection between hotels and restaurant sector and the other economic sectors.
Overview on the Romanian tourism
The importance of tourism in Romania is recognized by law – government emergency ordinance no. 58/1998 declared tourism as “priority field of the national economy”. However, the economic evolutions (economic instability and high inflation during the 90’s), the depreciation of tourism infrastructure, slow privatization
and the lack of investments had very destructive effects on the Romanian tourism.
Even if Romania has a high touristic potential, the gross added value (GAV) created in the hotels and restaurants industry is low – since 1990, its contribution to GDP did not pass 2.5% from GDP (except year 1996). Looking on the Figure 2, we can see the evolution of gross added value from hotels and restaurants (GAVHR).
According to Hapeniuc (2008), the regress of Romanian tourism was determined by: the decrease of the population’s standard of living, the decrease of services’ quality, the employees’ low motivation, the lack of involvement of local authorities, the lack of coherent programs and actions to promote the Romanian tourism or by the inappropriate infrastructure (especially roads). The regress of Romanian tourism can be easily seen analyzing the touristic demand. To evaluate the
8 Surugiu C. (2009), p. 16
0,0%
0,5%
1,0%
1,5%
2,0%
2,5%
3,0%
1990
1991
1992
1993
1994
1995
1996
1997
1998
1999
2000
2001
2002
2003
2004
2005
2006
2007
2008
Figure 2. GAV in Hotels and restaurants,
as a percent from GDP Source: Statistical Yearbook 2009, author’s calculations
010203040506070
1990
1991
1992
1993
1994
1995
1996
1997
1998
1999
2000
2001
2002
2003
2004
2005
2006
2007
2008
2009
Mill
ions
nig
hts
Supply Demand - ForeignersDemand - Romanians Demand Figure 3. Touristic demand and supply
Source: Statistical Yearbook 2009
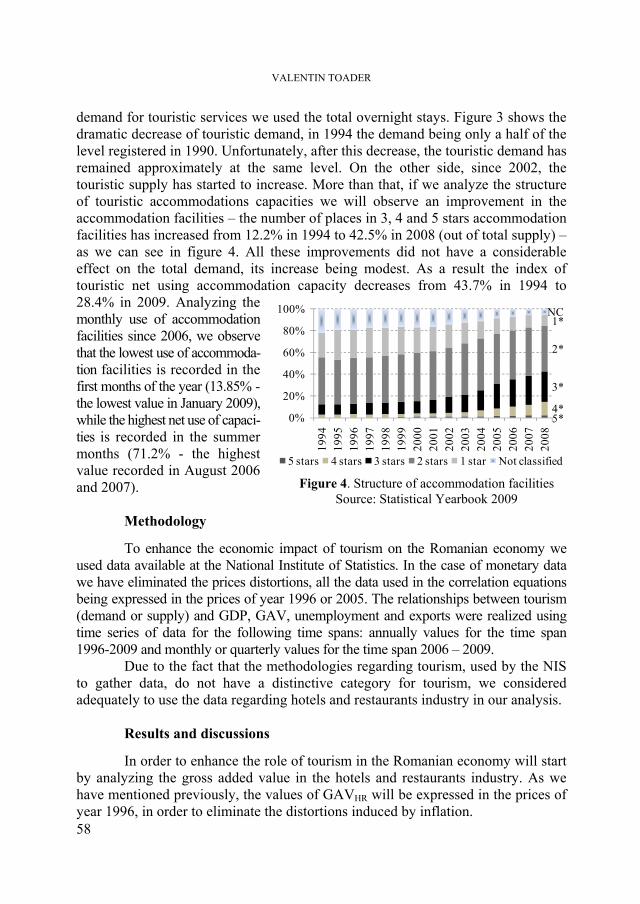
VALENTIN TOADER
58
demand for touristic services we used the total overnight stays. Figure 3 shows the dramatic decrease of touristic demand, in 1994 the demand being only a half of the level registered in 1990. Unfortunately, after this decrease, the touristic demand has remained approximately at the same level. On the other side, since 2002, the touristic supply has started to increase. More than that, if we analyze the structure of touristic accommodations capacities we will observe an improvement in the accommodation facilities – the number of places in 3, 4 and 5 stars accommodation facilities has increased from 12.2% in 1994 to 42.5% in 2008 (out of total supply) – as we can see in figure 4. All these improvements did not have a considerable effect on the total demand, its increase being modest. As a result the index of touristic net using accommodation capacity decreases from 43.7% in 1994 to 28.4% in 2009. Analyzing the monthly use of accommodation facilities since 2006, we observe that the lowest use of accommoda-tion facilities is recorded in the first months of the year (13.85% - the lowest value in January 2009), while the highest net use of capaci-ties is recorded in the summer months (71.2% - the highest value recorded in August 2006 and 2007).
Methodology
To enhance the economic impact of tourism on the Romanian economy we used data available at the National Institute of Statistics. In the case of monetary data we have eliminated the prices distortions, all the data used in the correlation equations being expressed in the prices of year 1996 or 2005. The relationships between tourism (demand or supply) and GDP, GAV, unemployment and exports were realized using time series of data for the following time spans: annually values for the time span 1996-2009 and monthly or quarterly values for the time span 2006 – 2009.
Due to the fact that the methodologies regarding tourism, used by the NIS to gather data, do not have a distinctive category for tourism, we considered adequately to use the data regarding hotels and restaurants industry in our analysis.
Results and discussions
In order to enhance the role of tourism in the Romanian economy will start by analyzing the gross added value in the hotels and restaurants industry. As we have mentioned previously, the values of GAVHR will be expressed in the prices of year 1996, in order to eliminate the distortions induced by inflation.
5*4*
3*
2*
1*NC
0%
20%
40%
60%
80%
100%19
9419
9519
9619
9719
9819
9920
0020
0120
0220
0320
0420
0520
0620
0720
08
5 stars 4 stars 3 stars 2 stars 1 star Not classified
Figure 4. Structure of accommodation facilities Source: Statistical Yearbook 2009
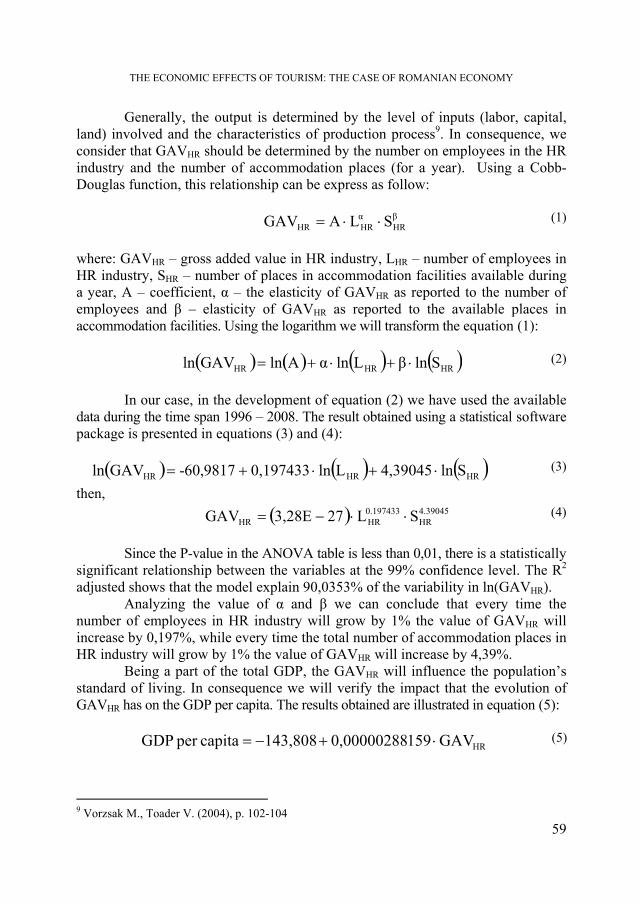
THE ECONOMIC EFFECTS OF TOURISM: THE CASE OF ROMANIAN ECONOMY
59
Generally, the output is determined by the level of inputs (labor, capital, land) involved and the characteristics of production process9. In consequence, we consider that GAVHR should be determined by the number on employees in the HR industry and the number of accommodation places (for a year). Using a Cobb-Douglas function, this relationship can be express as follow:
β
HRαHRHR SLAGAV ⋅⋅= (1)
where: GAVHR – gross added value in HR industry, LHR – number of employees in HR industry, SHR – number of places in accommodation facilities available during a year, A – coefficient, α – the elasticity of GAVHR as reported to the number of employees and β – elasticity of GAVHR as reported to the available places in accommodation facilities. Using the logarithm we will transform the equation (1):
( ) ( ) ( ) ( )HRHRHR Slnβ Llnα AlnGAVln ⋅+⋅+= (2)
In our case, in the development of equation (2) we have used the available
data during the time span 1996 – 2008. The result obtained using a statistical software package is presented in equations (3) and (4):
( ) ( ) ( )HRHRHR Sln4,39045 Lln0,197433 9817,60-GAVln ⋅+⋅+= (3)
then, ( ) 4.39045
HR0.197433HRHR SL273,28EGAV ⋅⋅−= (4)
Since the P-value in the ANOVA table is less than 0,01, there is a statistically
significant relationship between the variables at the 99% confidence level. The R2 adjusted shows that the model explain 90,0353% of the variability in ln(GAVHR).
Analyzing the value of α and β we can conclude that every time the number of employees in HR industry will grow by 1% the value of GAVHR will increase by 0,197%, while every time the total number of accommodation places in HR industry will grow by 1% the value of GAVHR will increase by 4,39%.
Being a part of the total GDP, the GAVHR will influence the population’s standard of living. In consequence we will verify the impact that the evolution of GAVHR has on the GDP per capita. The results obtained are illustrated in equation (5):
HRGAV1590,00000288143,808capitaper GDP ⋅+−= (5)
9 Vorzsak M., Toader V. (2004), p. 102-104
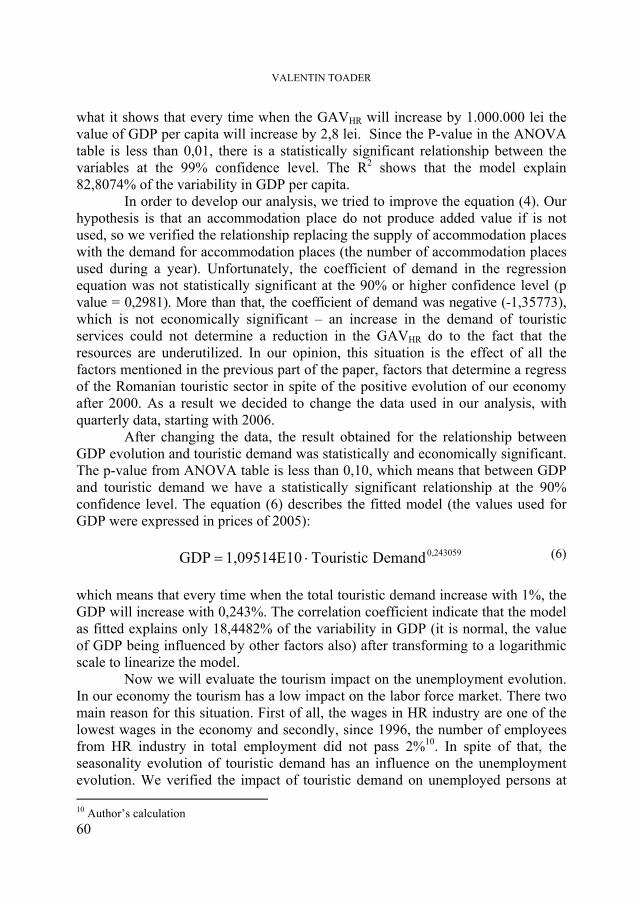
VALENTIN TOADER
60
what it shows that every time when the GAVHR will increase by 1.000.000 lei the value of GDP per capita will increase by 2,8 lei. Since the P-value in the ANOVA table is less than 0,01, there is a statistically significant relationship between the variables at the 99% confidence level. The R2 shows that the model explain 82,8074% of the variability in GDP per capita.
In order to develop our analysis, we tried to improve the equation (4). Our hypothesis is that an accommodation place do not produce added value if is not used, so we verified the relationship replacing the supply of accommodation places with the demand for accommodation places (the number of accommodation places used during a year). Unfortunately, the coefficient of demand in the regression equation was not statistically significant at the 90% or higher confidence level (p value = 0,2981). More than that, the coefficient of demand was negative (-1,35773), which is not economically significant – an increase in the demand of touristic services could not determine a reduction in the GAVHR do to the fact that the resources are underutilized. In our opinion, this situation is the effect of all the factors mentioned in the previous part of the paper, factors that determine a regress of the Romanian touristic sector in spite of the positive evolution of our economy after 2000. As a result we decided to change the data used in our analysis, with quarterly data, starting with 2006.
After changing the data, the result obtained for the relationship between GDP evolution and touristic demand was statistically and economically significant. The p-value from ANOVA table is less than 0,10, which means that between GDP and touristic demand we have a statistically significant relationship at the 90% confidence level. The equation (6) describes the fitted model (the values used for GDP were expressed in prices of 2005):
0,243059Demand Touristic 1,09514E10 GDP ⋅= (6)
which means that every time when the total touristic demand increase with 1%, the GDP will increase with 0,243%. The correlation coefficient indicate that the model as fitted explains only 18,4482% of the variability in GDP (it is normal, the value of GDP being influenced by other factors also) after transforming to a logarithmic scale to linearize the model.
Now we will evaluate the tourism impact on the unemployment evolution. In our economy the tourism has a low impact on the labor force market. There two main reason for this situation. First of all, the wages in HR industry are one of the lowest wages in the economy and secondly, since 1996, the number of employees from HR industry in total employment did not pass 2%10. In spite of that, the seasonality evolution of touristic demand has an influence on the unemployment evolution. We verified the impact of touristic demand on unemployed persons at 10 Author’s calculation
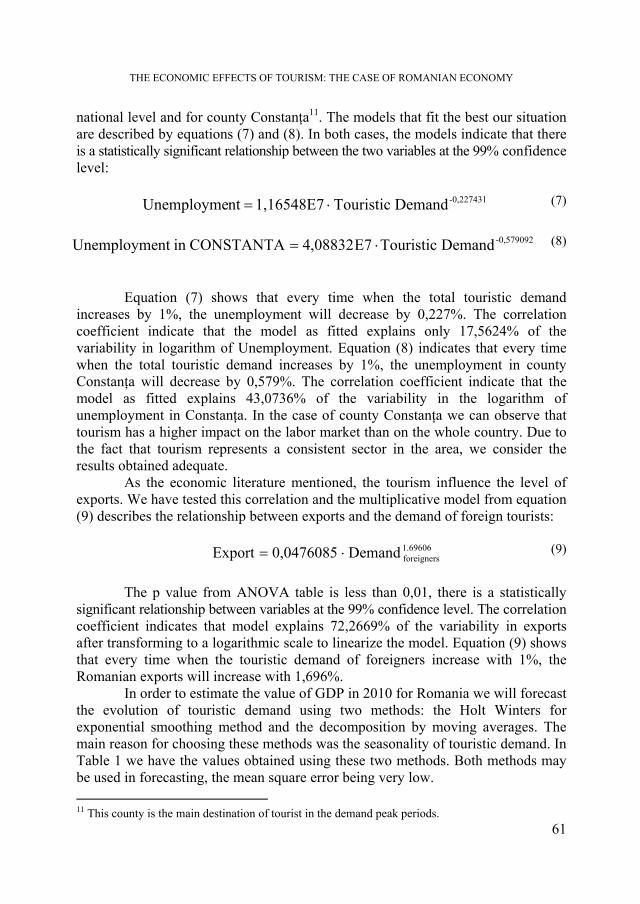
THE ECONOMIC EFFECTS OF TOURISM: THE CASE OF ROMANIAN ECONOMY
61
national level and for county Constanţa11. The models that fit the best our situation are described by equations (7) and (8). In both cases, the models indicate that there is a statistically significant relationship between the two variables at the 99% confidence level:
-0,227431Demand Touristic 1,16548E7nt Unemployme ⋅= (7)
-0,579092Demand Touristic E708832,4CONSTANTA in nt Unemployme ⋅=
(8)
Equation (7) shows that every time when the total touristic demand
increases by 1%, the unemployment will decrease by 0,227%. The correlation coefficient indicate that the model as fitted explains only 17,5624% of the variability in logarithm of Unemployment. Equation (8) indicates that every time when the total touristic demand increases by 1%, the unemployment in county Constanţa will decrease by 0,579%. The correlation coefficient indicate that the model as fitted explains 43,0736% of the variability in the logarithm of unemployment in Constanţa. In the case of county Constanţa we can observe that tourism has a higher impact on the labor market than on the whole country. Due to the fact that tourism represents a consistent sector in the area, we consider the results obtained adequate.
As the economic literature mentioned, the tourism influence the level of exports. We have tested this correlation and the multiplicative model from equation (9) describes the relationship between exports and the demand of foreign tourists:
1.69606
foreignersDemand0,0476085Export ⋅= (9)
The p value from ANOVA table is less than 0,01, there is a statistically
significant relationship between variables at the 99% confidence level. The correlation coefficient indicates that model explains 72,2669% of the variability in exports after transforming to a logarithmic scale to linearize the model. Equation (9) shows that every time when the touristic demand of foreigners increase with 1%, the Romanian exports will increase with 1,696%.
In order to estimate the value of GDP in 2010 for Romania we will forecast the evolution of touristic demand using two methods: the Holt Winters for exponential smoothing method and the decomposition by moving averages. The main reason for choosing these methods was the seasonality of touristic demand. In Table 1 we have the values obtained using these two methods. Both methods may be used in forecasting, the mean square error being very low. 11 This county is the main destination of tourist in the demand peak periods.
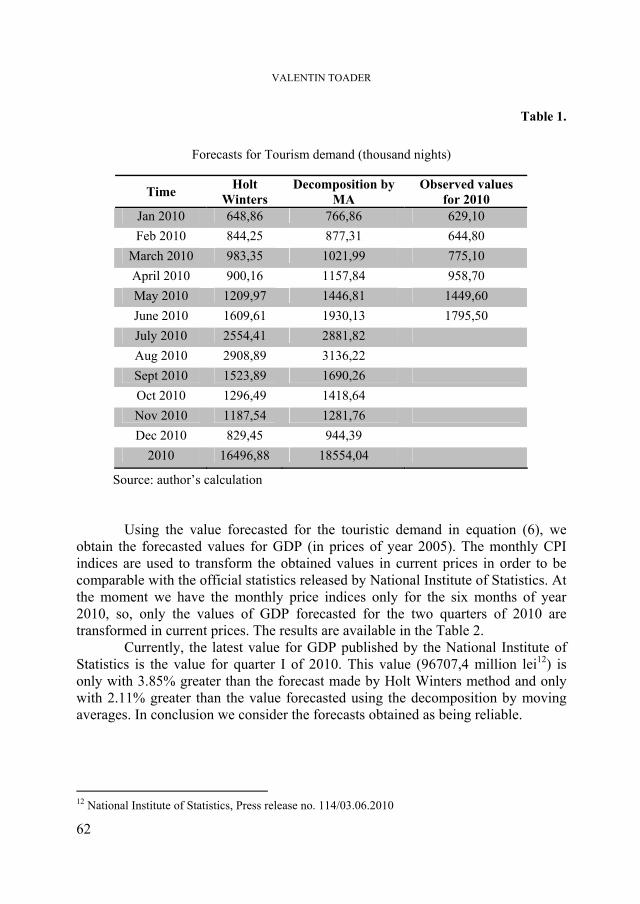
VALENTIN TOADER
62
Table 1.
Forecasts for Tourism demand (thousand nights)
Time Holt Winters
Decomposition by MA
Observed values for 2010
Jan 2010 648,86 766,86 629,10 Feb 2010 844,25 877,31 644,80
March 2010 983,35 1021,99 775,10 April 2010 900,16 1157,84 958,70 May 2010 1209,97 1446,81 1449,60 June 2010 1609,61 1930,13 1795,50 July 2010 2554,41 2881,82 Aug 2010 2908,89 3136,22 Sept 2010 1523,89 1690,26 Oct 2010 1296,49 1418,64 Nov 2010 1187,54 1281,76 Dec 2010 829,45 944,39
2010 16496,88 18554,04
Source: author’s calculation Using the value forecasted for the touristic demand in equation (6), we
obtain the forecasted values for GDP (in prices of year 2005). The monthly CPI indices are used to transform the obtained values in current prices in order to be comparable with the official statistics released by National Institute of Statistics. At the moment we have the monthly price indices only for the six months of year 2010, so, only the values of GDP forecasted for the two quarters of 2010 are transformed in current prices. The results are available in the Table 2.
Currently, the latest value for GDP published by the National Institute of Statistics is the value for quarter I of 2010. This value (96707,4 million lei12) is only with 3.85% greater than the forecast made by Holt Winters method and only with 2.11% greater than the value forecasted using the decomposition by moving averages. In conclusion we consider the forecasts obtained as being reliable.
12 National Institute of Statistics, Press release no. 114/03.06.2010
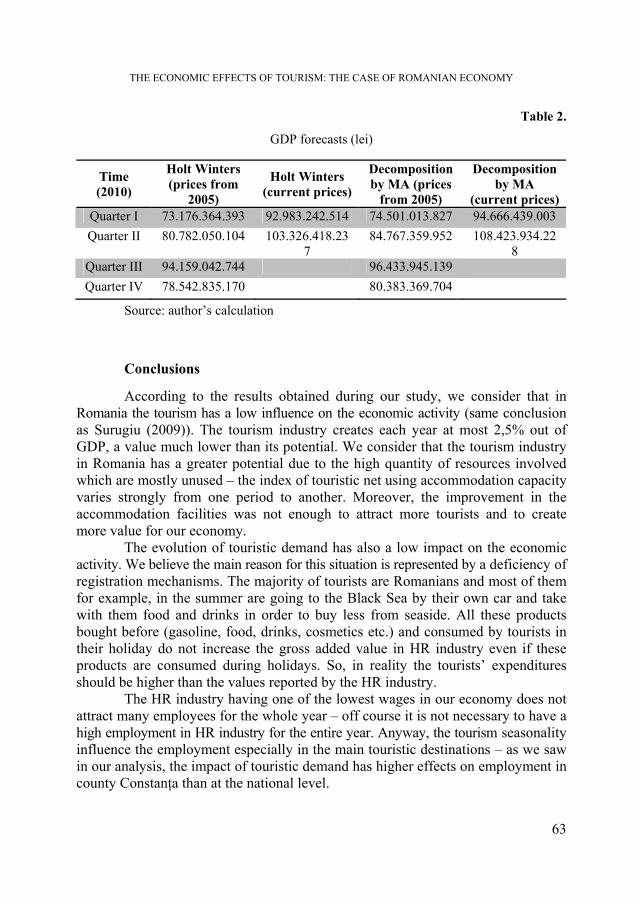
THE ECONOMIC EFFECTS OF TOURISM: THE CASE OF ROMANIAN ECONOMY
63
Table 2.
GDP forecasts (lei)
Time (2010)
Holt Winters (prices from
2005)
Holt Winters (current prices)
Decomposition by MA (prices
from 2005)
Decomposition by MA
(current prices) Quarter I 73.176.364.393 92.983.242.514 74.501.013.827 94.666.439.003 Quarter II 80.782.050.104 103.326.418.23
7 84.767.359.952 108.423.934.22
8 Quarter III 94.159.042.744 96.433.945.139 Quarter IV 78.542.835.170 80.383.369.704
Source: author’s calculation
Conclusions
According to the results obtained during our study, we consider that in Romania the tourism has a low influence on the economic activity (same conclusion as Surugiu (2009)). The tourism industry creates each year at most 2,5% out of GDP, a value much lower than its potential. We consider that the tourism industry in Romania has a greater potential due to the high quantity of resources involved which are mostly unused – the index of touristic net using accommodation capacity varies strongly from one period to another. Moreover, the improvement in the accommodation facilities was not enough to attract more tourists and to create more value for our economy.
The evolution of touristic demand has also a low impact on the economic activity. We believe the main reason for this situation is represented by a deficiency of registration mechanisms. The majority of tourists are Romanians and most of them for example, in the summer are going to the Black Sea by their own car and take with them food and drinks in order to buy less from seaside. All these products bought before (gasoline, food, drinks, cosmetics etc.) and consumed by tourists in their holiday do not increase the gross added value in HR industry even if these products are consumed during holidays. So, in reality the tourists’ expenditures should be higher than the values reported by the HR industry.
The HR industry having one of the lowest wages in our economy does not attract many employees for the whole year – off course it is not necessary to have a high employment in HR industry for the entire year. Anyway, the tourism seasonality influence the employment especially in the main touristic destinations – as we saw in our analysis, the impact of touristic demand has higher effects on employment in county Constanţa than at the national level.
VALENTIN TOADER
64
The TLG theory seems to have effects in our economy, the touristic demand of foreigners having ascending scale efficiency. Exports are increased by the foreign tourists’ expenditures (unlike Romanian tourists, the foreigners buy all the goods they need from the seaside), but unfortunately their number is still low. We believe that we have to concentrate on some actions to attract more foreign tourists (for example the introduction of all-inclusive packages could be a promising action).
REFERENCES
Aref F., Redzuan M., Gill S., Community perceptions toward economic and environmental impacts of tourism on local communities, Asian Social Science, vol. 5, no. 7, July 2009, Available: http://ccsenet.org/journal/index.php/ass/article/viewFile/2980/2746 (10.07.2010)
Cortes-Jimenez I., Pulina M., Inbound tourism and long-run economic growth, Current Issues in Tourism, Vol. 13, No. 1, Routledge Taylor and Francis Group, 2010, Available: http://www.informaworld.com/smpp/content~db=all~content=a918003334~frm=titlelink (10.07.2010)
Cortes-Jimenez I., Pulina M., Riera i Prunera C., Artis M., Tourism and exports as a means of growth, Research Institute of Applied Economics, Working papers 2009/10, Available: http://www.ub.edu/irea/working_papers/2009/200910.pdf (10.07.2010)
Hapeniuc C.V., Priorities in Romanian Tourism development, Amfiteatrul Economic – Economic Interferences, no. 23, 2008, Available: http://www.amfiteatrueconomic.ro/ArticolEN.aspx?CodArticol=351 (11.07.2010)
Ivanov S., Webster C., Measuring the impact of tourism on economic growth, GEOTOUR 2006, Kosice, Available: http://www.kgptour.tuke.sk/conferences_soubory/pdf 7 2 07/2_2_Ivanov,Webster 4.pdf (11.07.2010)
Kreishan F.M.M., Tourism and economic growth: the case of Jordan, European jurnal of Social Sciences, vol. 15, no. 2, 2010, Available: http://www.eurojournals.com/ejss_15_2_08.pdf (12.07.2010)
National Agency for Employment, Evolution of unemployment rate, Available: http://www.anofm.ro/evolutia-ratei-somajului-in-perioada-1991-2010 (12.07.2010)
National Institute of Statistics, Press release – CPI, Available: http://www.insse.ro/cms/rw/pages/comunicate/indicelepreturilor de consum.ro.do (10.07.2010)
National Institute of Statistics, Press release – quarterly GDP, Available: http://www.insse.ro/cms/rw/pages/comunicate/pib.ro.do (10.07.2010)
National Institute of Statistics, Press release – Tourism, Available: http://www.insse.ro/cms/rw/pages/comunicate/arhivaTurism.ro.do (10.07.2010)
National Institute of Statistics, Statistical Yearbook for 2009
THE ECONOMIC EFFECTS OF TOURISM: THE CASE OF ROMANIAN ECONOMY
65
Stynes, D., Economic impacts of tourism, 2001, Available: https://www.msu.edu/course/prr/840/econimpact/pdf/ecimpvol1.pdf (12.07.2010)
Surugiu C., The economic impact of tourism. An input-output analysis, Revista Romana de Economie, no. 2, 2009, Available: http://www.revecon.ro/articles/2009-2/2009-2-8.pdf (11.07.2010)
Vorzsak M., Toader V., Macroeconomie, Presa Universitară Clujeană, Cluj – Napoca, 2004
World Tourism Organization, Tourism Enriches, Available: http://www.unwto.org/media/key/en/pdf/benefits.pdf (12.07.2010)
World Tourism Organization, UNWTO News, no. 2/2010, Available: http://www.unwto.org/media/mag/en/pdf/UNWTONews_2010_2.pdf (11.07.2010)
World Tourism Organization, UNWTO World Tourism Barometer, vol. 8, no. 2, June 2010, Available: http://unwto.org/facts/eng/pdf/barometer/UNWTO_Barom10_2_en_excerpt.pdf (12.07.2010)
STUDIA UNIVERSITATIS BABEŞ-BOLYAI, NEGOTIA, LVI, 1, 2011
TOURISM AND TRANSPORTATION MARKET TRENDS IN JAPAN BEHAVIORAL ASPECTS
IOAN ALIN NISTOR1 ABSTRACT. Japan, a country with approximately 127 million inhabitants is a net exporter of tourists despite the high economic development of the country and state of the art transportation means and infrastructure. The paper looks at the domestic tourism as well as the behavioral aspects of the Japanese overseas travelers trying to determine the trends in these fields. The paper tries also to determine preferences and some tendencies of the Japanese travelers. Keywords: tourism, transportation, market trends, Japan. JEL classification: L83, L92, L93 Introduction
According to the “Tourism Highlights 2009 Edition” edited by World Tourism Organization, globally International tourism receipts rose by 1.7% in real terms to 642 billion Euros. International tourist arrivals reached 922 million, up 18 million over the past year, a growth of 2%.
World Tourism Organization in the Tourism Highlights 2009, also states that 51% of the tourism has the purpose of “Leisure, recreation and holidays”, followed by the “Business and Professional”. In this view, tourists should spend as less time as possible on the move, among destinations, and that time itself, should be a recreation and leisure.
In Japan, Ministry of Land, Infrastructure and Transport (MLIT), the entity the supervise the tourism aspects and strategies in Japan, presents the figures for 2009 stating that tourism generated 2.4% of the GDP. As a comparison, agriculture generated 1.77% and automobile industry 2.57% of GDP. Although the figures do look promising, if compared to other countries they still have place for improvement. For example Australia’s tourism sector generated 4.71% of the GDP and 2.5% for the USA.
1 Lecturer, PhD, Faculty of Business, Babes-Bolyai University, Cluj-Napoca, Romania, e-mail:
IOAN ALIN NISTOR
68
Some theoretical aspects
Umashankar Venkatesh in the “Leisure – Meaning and Impact on Leisure Travel Behavior” talks about the motives that drives us to travel and states that “the human nature to see the unseen and know the unknown drives it to new places and destinations with motives varying from wanting to understand different cultures; experiencing cooler or warmer climates; indulge in pure adventure” McIntosh, R.W in the “Tourism-Principles, Practices, Philosophies” categorized motivation for travel into the following four categories of:
1. Physical motivators consisting of rest and relaxation, sports participation, beach recreation etc
2. Cultural motivators indicating to the desire for knowledge of other countries and cultures, including music, art, religion etc.
3. Interpersonal motivators consisting of the need to meet new people, friends and relatives, to escape from the routine, family or neighbors etc
4. Status and prestige motivators indicating the desire for recognition and attention.
The main assumption is that tourists travel as they believe that they will find valuable experience by doing so.
Dr. Tetsuhiko Takai in his work “Tourism Approaches and the Japanese Experience” cites Pigram and Jenkins and says that improvements in technology are a significant factor in travel decision making. Faster travel time and lower costs, accessibility and the use of information technology also has contributed to the supply and consumption of the tourist product. Therefore, if leisure time is limited, the use of quality higher technology to purchase and consume the product has contributed to the growth in tourism. The tourist has more options and opportunities to reach a destination as well have more tools to help in the decision making process.
Market structure for incoming tourists.
According to the WTO World Tourism Barometer (Volume 6, No 2, June 2008) Japan was visited by 8,3 million people in 2008. There is a popular belief that at all major international tourist sites one can find a Japanese tourist. And it’s true. Japan is a net exporter of tourists.
With the opening of the Olympic Games in 1964 and the liberalization of overseas travel, the number of tourists has risen constantly. But arriving tourists to Japan switched from passengers from Western countries to those from Asian countries. This switch can be attributed to the rapid economic development of Korea, Hong Kong, Taiwan, Australia, Singapore now being in top 10 Foreign visitors to Japan. In 2008, 65% of the visitors to Japan were from Asian Countries.
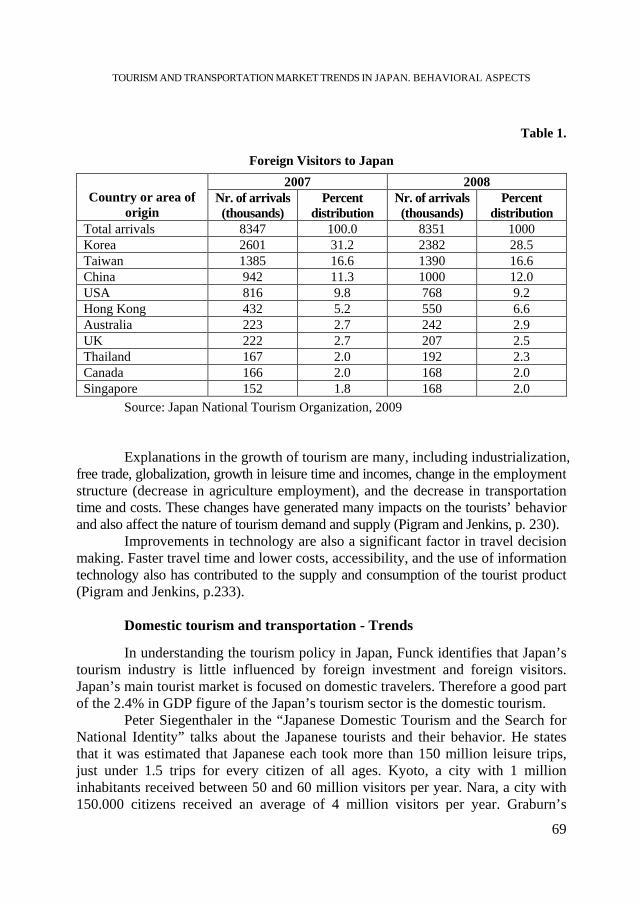
TOURISM AND TRANSPORTATION MARKET TRENDS IN JAPAN. BEHAVIORAL ASPECTS
69
Table 1.
Foreign Visitors to Japan
2007 2008 Country or area of
origin Nr. of arrivals (thousands)
Percent distribution
Nr. of arrivals (thousands)
Percent distribution
Total arrivals 8347 100.0 8351 1000 Korea 2601 31.2 2382 28.5 Taiwan 1385 16.6 1390 16.6 China 942 11.3 1000 12.0 USA 816 9.8 768 9.2 Hong Kong 432 5.2 550 6.6 Australia 223 2.7 242 2.9 UK 222 2.7 207 2.5 Thailand 167 2.0 192 2.3 Canada 166 2.0 168 2.0 Singapore 152 1.8 168 2.0
Source: Japan National Tourism Organization, 2009 Explanations in the growth of tourism are many, including industrialization,
free trade, globalization, growth in leisure time and incomes, change in the employment structure (decrease in agriculture employment), and the decrease in transportation time and costs. These changes have generated many impacts on the tourists’ behavior and also affect the nature of tourism demand and supply (Pigram and Jenkins, p. 230).
Improvements in technology are also a significant factor in travel decision making. Faster travel time and lower costs, accessibility, and the use of information technology also has contributed to the supply and consumption of the tourist product (Pigram and Jenkins, p.233).
Domestic tourism and transportation - Trends
In understanding the tourism policy in Japan, Funck identifies that Japan’s tourism industry is little influenced by foreign investment and foreign visitors. Japan’s main tourist market is focused on domestic travelers. Therefore a good part of the 2.4% in GDP figure of the Japan’s tourism sector is the domestic tourism.
Peter Siegenthaler in the “Japanese Domestic Tourism and the Search for National Identity” talks about the Japanese tourists and their behavior. He states that it was estimated that Japanese each took more than 150 million leisure trips, just under 1.5 trips for every citizen of all ages. Kyoto, a city with 1 million inhabitants received between 50 and 60 million visitors per year. Nara, a city with 150.000 citizens received an average of 4 million visitors per year. Graburn’s
IOAN ALIN NISTOR
70
analysis of tourism observs that Japanese domestic tourists are primarily engaged in a search for “nostalgic confirmation of their cultural landscape” (To Pray, Pay and Play p.63)
Tourism implies transportation, and moving among destination points is the choice of the traveler. A good part of the time spend during a holiday is travel time. As tourists we want to spend less time between two destinations in order to be able to make the best use of our time, unless the travel itself is the holiday.
How do 127 million people living in Japan move from point A to point B? For example, between Tokyo and Osaka, the largest cities in Japan, there is in average a high-speed train running every 10 minutes. Each train has in average 16 cars caring about 1300 people. According to the Japan Railways (Central Japan) website the high speed line (Shinkansen) carried 151 million passengers a year as to March 2008. The distance of approximately 520 km is covered in 2 hours and 40 minutes with speeds reaching 280 km/h.
According to the Japan Railways, there are 27,268 km of rail crossing the country. JR (a group of companies formed after privatization of JNR) controlled 20,135 km of these lines, with the remaining 7,133 km in the hands of private enterprized local railway companies. Japan's railways carried 22.24 billion passengers (395.9 billion passenger-kilometres) in fiscal 2006. In comparison, Germany has over 40,000 km of railways, but travels only 2.2 billion passengers per year
Japan is a country where distance is measured in time and not distance. Whether is car, bus, train or simply by foot, one’s answer to the distance question will have a response in time. Even announcements made on the highways’ displays show besides the distance, the time required until next designated point. This can be explained by the Japanese culture for punctuality. It is well known that Japanese railways are among the most punctual in the world. The average delay on the Tokaido Shinkansen (high speed train) in fiscal 2006 was only 0.3 minutes.
What can one observe from the above chart is that total domestic transport increased approximately 10% during 2000-2008 years. But if we look at the share of each mean of transportation we can notice an increase of railway transportation while the motor vehicles record a decrease of approximately 5%. Within motor vehicles transportation group there is even a shift towards buses as a mean of transportation. Although the number of passenger cars remained at a constant value during these years (57.550 thousands) travelers have the tendency of using public transportation more and more. One of the reasons could be the fuel prices but also the concern for environment.
As a result Japan has one of the lowest rates of casualties derived from traffic accidents. According to the National Police Agency of Japan, Traffic Bureau, in the “Statistics 2007 Road Accidents Japan” fatalities per 10 thousand vehicles was 0.63 and casualties per 100 thousand population was 4.50.
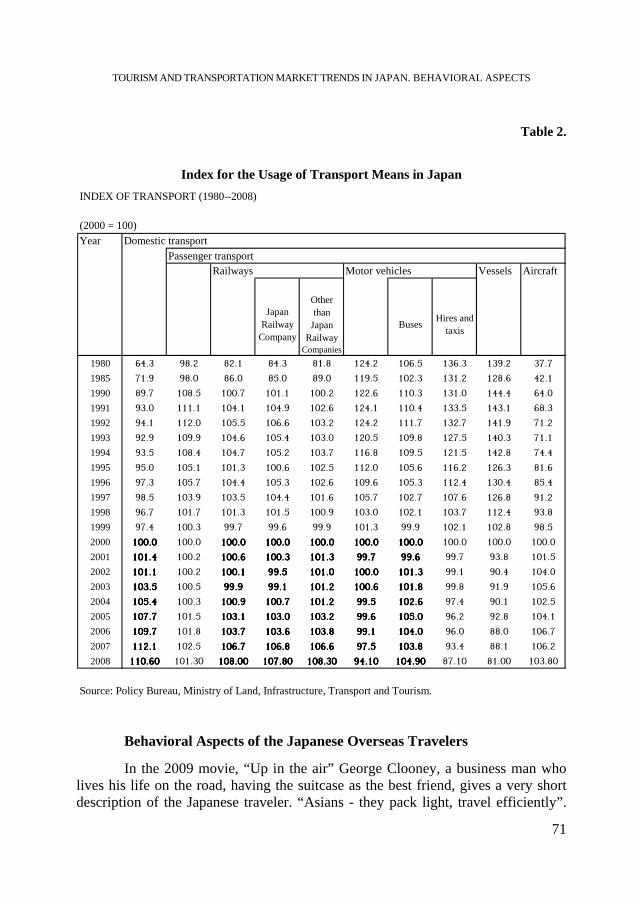
TOURISM AND TRANSPORTATION MARKET TRENDS IN JAPAN. BEHAVIORAL ASPECTS
71
Table 2.
Index for the Usage of Transport Means in Japan
INDEX OF TRANSPORT (1980--2008)
(2000 = 100)Year Domestic transport
Passenger transportRailways Motor vehicles Vessels Aircraft
Japan Railway
Company
Other than
Japan Railway
Companies
BusesHires and
taxis
1980 64.3 98.2 82.1 84.3 81.8 124.2 106.5 136.3 139.2 37.71985 71.9 98.0 86.0 85.0 89.0 119.5 102.3 131.2 128.6 42.11990 89.7 108.5 100.7 101.1 100.2 122.6 110.3 131.0 144.4 64.01991 93.0 111.1 104.1 104.9 102.6 124.1 110.4 133.5 143.1 68.31992 94.1 112.0 105.5 106.6 103.2 124.2 111.7 132.7 141.9 71.21993 92.9 109.9 104.6 105.4 103.0 120.5 109.8 127.5 140.3 71.11994 93.5 108.4 104.7 105.2 103.7 116.8 109.5 121.5 142.8 74.41995 95.0 105.1 101.3 100.6 102.5 112.0 105.6 116.2 126.3 81.61996 97.3 105.7 104.4 105.3 102.6 109.6 105.3 112.4 130.4 85.41997 98.5 103.9 103.5 104.4 101.6 105.7 102.7 107.6 126.8 91.21998 96.7 101.7 101.3 101.5 100.9 103.0 102.1 103.7 112.4 93.81999 97.4 100.3 99.7 99.6 99.9 101.3 99.9 102.1 102.8 98.52000 100.0100.0100.0100.0 100.0 100.0100.0100.0100.0 100.0100.0100.0100.0 100.0100.0100.0100.0 100.0100.0100.0100.0 100.0100.0100.0100.0 100.0 100.0 100.02001 101.4101.4101.4101.4 100.2 100.6100.6100.6100.6 100.3100.3100.3100.3 101.3101.3101.3101.3 99.799.799.799.7 99.699.699.699.6 99.7 93.8 101.52002 101.1101.1101.1101.1 100.2 100.1100.1100.1100.1 99.599.599.599.5 101.0101.0101.0101.0 100.0100.0100.0100.0 101.3101.3101.3101.3 99.1 90.4 104.02003 103.5103.5103.5103.5 100.5 99.999.999.999.9 99.199.199.199.1 101.2101.2101.2101.2 100.6100.6100.6100.6 101.8101.8101.8101.8 99.8 91.9 105.62004 105.4105.4105.4105.4 100.3 100.9100.9100.9100.9 100.7100.7100.7100.7 101.2101.2101.2101.2 99.599.599.599.5 102.6102.6102.6102.6 97.4 90.1 102.52005 107.7107.7107.7107.7 101.5 103.1103.1103.1103.1 103.0103.0103.0103.0 103.2103.2103.2103.2 99.699.699.699.6 105.0105.0105.0105.0 96.2 92.8 104.12006 109.7109.7109.7109.7 101.8 103.7103.7103.7103.7 103.6103.6103.6103.6 103.8103.8103.8103.8 99.199.199.199.1 104.0104.0104.0104.0 96.0 88.0 106.72007 112.1112.1112.1112.1 102.5 106.7106.7106.7106.7 106.8106.8106.8106.8 106.6106.6106.6106.6 97.597.597.597.5 103.8103.8103.8103.8 93.4 88.1 106.22008 110.60110.60110.60110.60 101.30 108.00108.00108.00108.00 107.80107.80107.80107.80 108.30108.30108.30108.30 94.1094.1094.1094.10 104.90104.90104.90104.90 87.10 81.00 103.80
Source: Policy Bureau, Ministry of Land, Infrastructure, Transport and Tourism. Behavioral Aspects of the Japanese Overseas Travelers
In the 2009 movie, “Up in the air” George Clooney, a business man who lives his life on the road, having the suitcase as the best friend, gives a very short description of the Japanese traveler. “Asians - they pack light, travel efficiently”.
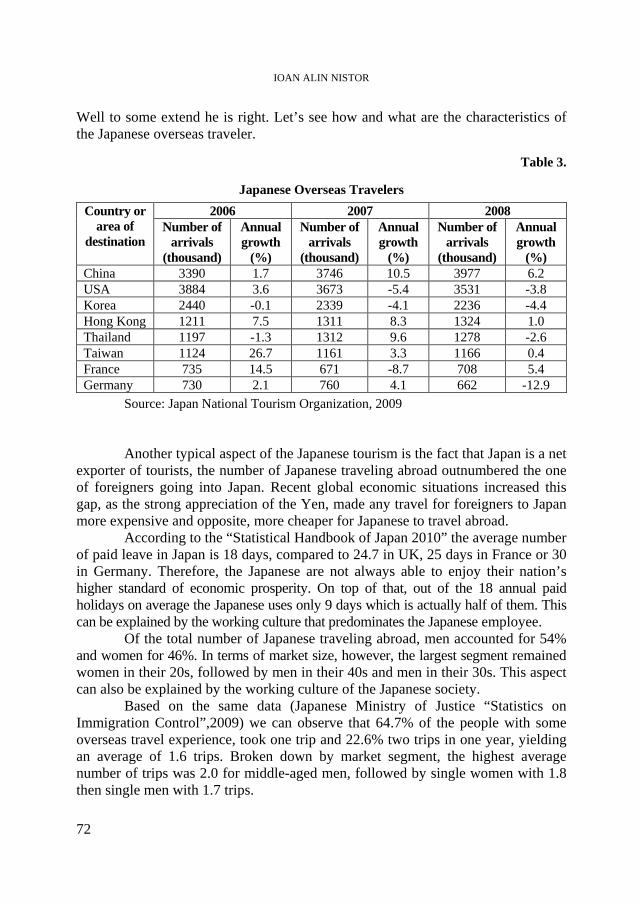
IOAN ALIN NISTOR
72
Well to some extend he is right. Let’s see how and what are the characteristics of the Japanese overseas traveler.
Table 3.
Japanese Overseas Travelers
2006 2007 2008 Country or area of
destination Number of
arrivals (thousand)
Annual growth
(%)
Number of arrivals
(thousand)
Annual growth
(%)
Number of arrivals
(thousand)
Annual growth
(%) China 3390 1.7 3746 10.5 3977 6.2 USA 3884 3.6 3673 -5.4 3531 -3.8 Korea 2440 -0.1 2339 -4.1 2236 -4.4 Hong Kong 1211 7.5 1311 8.3 1324 1.0 Thailand 1197 -1.3 1312 9.6 1278 -2.6 Taiwan 1124 26.7 1161 3.3 1166 0.4 France 735 14.5 671 -8.7 708 5.4 Germany 730 2.1 760 4.1 662 -12.9
Source: Japan National Tourism Organization, 2009 Another typical aspect of the Japanese tourism is the fact that Japan is a net
exporter of tourists, the number of Japanese traveling abroad outnumbered the one of foreigners going into Japan. Recent global economic situations increased this gap, as the strong appreciation of the Yen, made any travel for foreigners to Japan more expensive and opposite, more cheaper for Japanese to travel abroad.
According to the “Statistical Handbook of Japan 2010” the average number of paid leave in Japan is 18 days, compared to 24.7 in UK, 25 days in France or 30 in Germany. Therefore, the Japanese are not always able to enjoy their nation’s higher standard of economic prosperity. On top of that, out of the 18 annual paid holidays on average the Japanese uses only 9 days which is actually half of them. This can be explained by the working culture that predominates the Japanese employee.
Of the total number of Japanese traveling abroad, men accounted for 54% and women for 46%. In terms of market size, however, the largest segment remained women in their 20s, followed by men in their 40s and men in their 30s. This aspect can also be explained by the working culture of the Japanese society.
Based on the same data (Japanese Ministry of Justice “Statistics on Immigration Control”,2009) we can observe that 64.7% of the people with some overseas travel experience, took one trip and 22.6% two trips in one year, yielding an average of 1.6 trips. Broken down by market segment, the highest average number of trips was 2.0 for middle-aged men, followed by single women with 1.8 then single men with 1.7 trips.
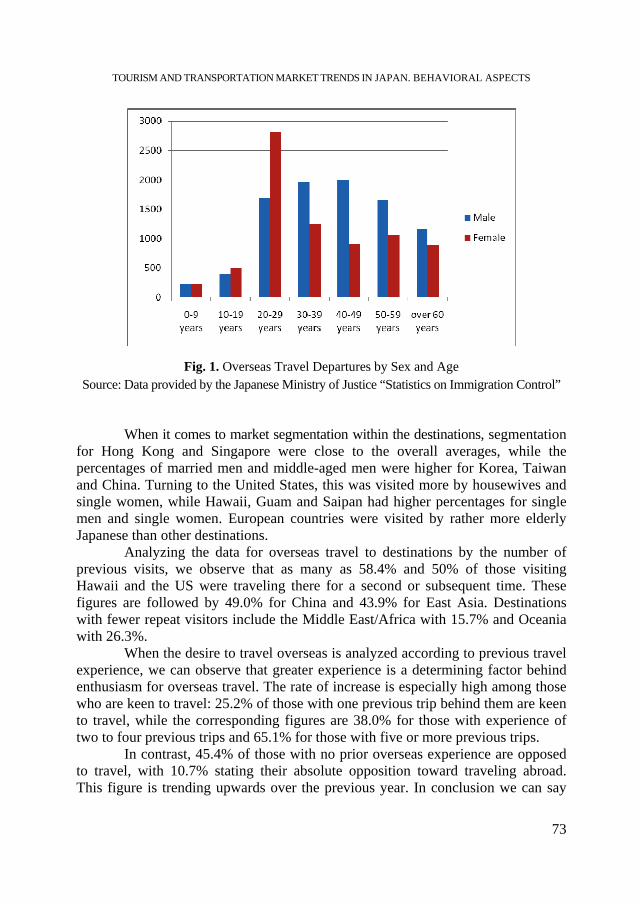
TOURISM AND TRANSPORTATION MARKET TRENDS IN JAPAN. BEHAVIORAL ASPECTS
73
Fig. 1. Overseas Travel Departures by Sex and Age Source: Data provided by the Japanese Ministry of Justice “Statistics on Immigration Control”
When it comes to market segmentation within the destinations, segmentation
for Hong Kong and Singapore were close to the overall averages, while the percentages of married men and middle-aged men were higher for Korea, Taiwan and China. Turning to the United States, this was visited more by housewives and single women, while Hawaii, Guam and Saipan had higher percentages for single men and single women. European countries were visited by rather more elderly Japanese than other destinations.
Analyzing the data for overseas travel to destinations by the number of previous visits, we observe that as many as 58.4% and 50% of those visiting Hawaii and the US were traveling there for a second or subsequent time. These figures are followed by 49.0% for China and 43.9% for East Asia. Destinations with fewer repeat visitors include the Middle East/Africa with 15.7% and Oceania with 26.3%.
When the desire to travel overseas is analyzed according to previous travel experience, we can observe that greater experience is a determining factor behind enthusiasm for overseas travel. The rate of increase is especially high among those who are keen to travel: 25.2% of those with one previous trip behind them are keen to travel, while the corresponding figures are 38.0% for those with experience of two to four previous trips and 65.1% for those with five or more previous trips.
In contrast, 45.4% of those with no prior overseas experience are opposed to travel, with 10.7% stating their absolute opposition toward traveling abroad. This figure is trending upwards over the previous year. In conclusion we can say
IOAN ALIN NISTOR
74
that the desire to travel overseas rises in proportion to the number of previous trips taken. More with no prior experience reject foreign travel.
Looking at the purpose of the travel, most overseas trips (70.4%) are taken for tourism. This figure climbs to 73.0% when honeymoons are included. Business trips accounted for 8.7% and visits to family and friends 4.9%. Analysis of changes in purpose of travel from the past years shows that the proportion of trips taken for tourism has increased, while the percentage of trips taken for commercial purposes, business trips or training has declined. One explanation for this trend would be the development of information technology and communication thus meetings and exchange of information being done online.
Analysis of the duration of overseas trips by destination shows that more than half of the journeys to closer locations such as East Asia were for four days or less, with a figure of 72.7%. Trips lasting five to seven days accounted for more than half of all trips to Southeast Asia, while over 70% of all trips to more distant locations (Middle East, Europe) lasted eight days or longer. This demonstrates a strong correlation between distance from Japan and duration of travel.
Future travel trends - Conclusion
Assuming the present economic situation the number of Japanese traveling abroad is likely to increase. Despite the diminishing size of the largest market for overseas travel, those in their 20’s, and the ongoing tendency toward an aging society with fewer young people, those who have already experienced overseas travel are continuing to travel as they move into the succeeding age bracket. It can thus be concluded that departure ratios will gradually be higher in the age groups above those at present. Furthermore, with the expansion in airline routes and trend toward cheaper travel costs stimulated by airfare competition, the emergence of new destinations, new demand will appear. As a result, there is no doubt that the outlook for overseas travelers in the medium to long term will be one of growth.
As for future market trends we could nominate the following: - Preference for individual travel: as the number of repeat overseas travelers
increase, the preference for travel formats that place priority on individual freedom is strengthening, as opposed to travel in a group. There is a tendency toward separation in participating in package tours with a free-plan component and those where arrangements are individually made my means such as the purchase of cheap airplane tickets.
- Preference for lower prices: costs for overseas travel per person per trip will continue to have a trend toward lower prices.
- Safety and reliability required in travel: guaranteeing safety is a fundamental precondition of travel and should be given priority as it will be a condition that will influence demand for overseas travel.
TOURISM AND TRANSPORTATION MARKET TRENDS IN JAPAN. BEHAVIORAL ASPECTS
75
BIBLIOGRAPHY
Funck Carolyn, “When the Bubble Burst:Planning and Reality in Japan’s Resort Industry. Current Issus in Tourism”, 2005
Graburn, Nelson “To Pray, Pay and Play: The Cultural Structure of Japanese Domestic Tourism. Aix-en-Provence: Centre des Hautes Etudes Touristiques, 2003
Hendry, Joy. “Understanding Japanese Society” 2nd edition London, Routledge, 2005 McIntosh, R.W in the “Tourism-Principles, Practices, Philosophies” New York, Wiley Pigram John and Jenkins John, “Outdoor Recreation Management”, London: Routledge,
2003, Siegenthaler,Peter “Japanese Domestic Tourism and the Search for National Identity” Tetsuhiko Takai “Tourism Approaches and the Japanese Experience”, Graduate
School of Economics, Hokkaido University, 2005 Umashankar Venkatesh in the “Leisure – Meaning and Impact on Leisure Travel
Behavior, Journal of Services Research, Volume 6, Special Issue, July 2006 Japanese Ministry of Justice “Statistics on Immigration Control” 2009 Japan National Tourism Organization website Japan Railways (Central Japan) website Ministry of Land, Infrastructure and Transport (MLIT), various reports cited on text Ministry of Internal Affairs and Communications Japan, “Statistical Handbook of
Japan 2010” National Police Agency of Japan, Traffic Bureau, “Statistics 2007 Road Accidents Japan” World Tourism Organization “Tourism Highlights 2009 Edition” World Tourism Organization, “World Tourism Barometer” -Volume 6, No 2, June 2008
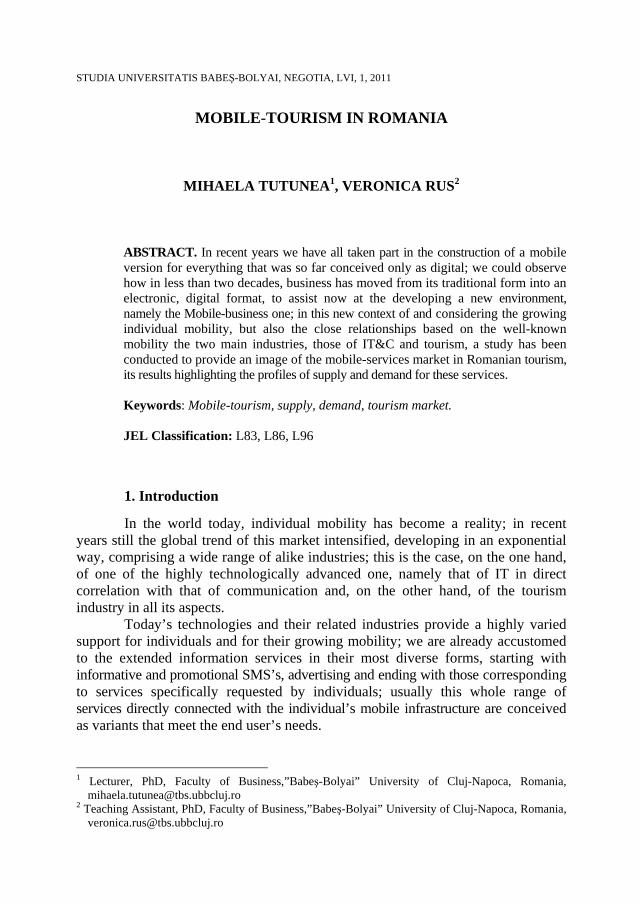
STUDIA UNIVERSITATIS BABEŞ-BOLYAI, NEGOTIA, LVI, 1, 2011
MOBILE-TOURISM IN ROMANIA
MIHAELA TUTUNEA1, VERONICA RUS2 ABSTRACT. In recent years we have all taken part in the construction of a mobile version for everything that was so far conceived only as digital; we could observe how in less than two decades, business has moved from its traditional form into an electronic, digital format, to assist now at the developing a new environment, namely the Mobile-business one; in this new context of and considering the growing individual mobility, but also the close relationships based on the well-known mobility the two main industries, those of IT&C and tourism, a study has been conducted to provide an image of the mobile-services market in Romanian tourism, its results highlighting the profiles of supply and demand for these services. Keywords: Mobile-tourism, supply, demand, tourism market. JEL Classification: L83, L86, L96 1. Introduction
In the world today, individual mobility has become a reality; in recent years still the global trend of this market intensified, developing in an exponential way, comprising a wide range of alike industries; this is the case, on the one hand, of one of the highly technologically advanced one, namely that of IT in direct correlation with that of communication and, on the other hand, of the tourism industry in all its aspects.
Today’s technologies and their related industries provide a highly varied support for individuals and for their growing mobility; we are already accustomed to the extended information services in their most diverse forms, starting with informative and promotional SMS’s, advertising and ending with those corresponding to services specifically requested by individuals; usually this whole range of services directly connected with the individual’s mobile infrastructure are conceived as variants that meet the end user’s needs.
1 Lecturer, PhD, Faculty of Business,”Babeş-Bolyai” University of Cluj-Napoca, Romania,
[email protected] 2 Teaching Assistant, PhD, Faculty of Business,”Babeş-Bolyai” University of Cluj-Napoca, Romania,
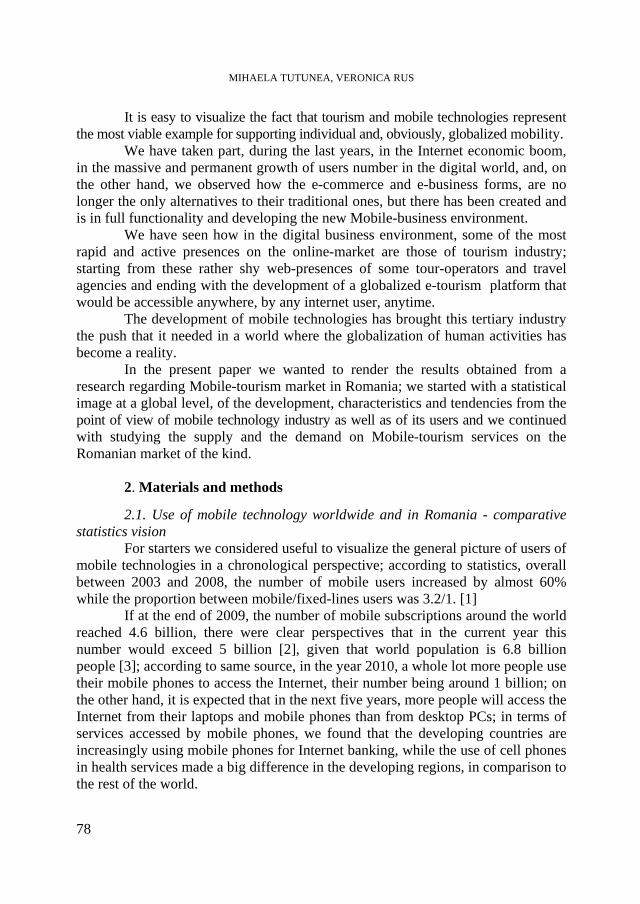
MIHAELA TUTUNEA, VERONICA RUS
78
It is easy to visualize the fact that tourism and mobile technologies represent the most viable example for supporting individual and, obviously, globalized mobility.
We have taken part, during the last years, in the Internet economic boom, in the massive and permanent growth of users number in the digital world, and, on the other hand, we observed how the e-commerce and e-business forms, are no longer the only alternatives to their traditional ones, but there has been created and is in full functionality and developing the new Mobile-business environment.
We have seen how in the digital business environment, some of the most rapid and active presences on the online-market are those of tourism industry; starting from these rather shy web-presences of some tour-operators and travel agencies and ending with the development of a globalized e-tourism platform that would be accessible anywhere, by any internet user, anytime.
The development of mobile technologies has brought this tertiary industry the push that it needed in a world where the globalization of human activities has become a reality.
In the present paper we wanted to render the results obtained from a research regarding Mobile-tourism market in Romania; we started with a statistical image at a global level, of the development, characteristics and tendencies from the point of view of mobile technology industry as well as of its users and we continued with studying the supply and the demand on Mobile-tourism services on the Romanian market of the kind.
2. Materials and methods
2.1. Use of mobile technology worldwide and in Romania - comparative statistics vision
For starters we considered useful to visualize the general picture of users of mobile technologies in a chronological perspective; according to statistics, overall between 2003 and 2008, the number of mobile users increased by almost 60% while the proportion between mobile/fixed-lines users was 3.2/1. [1]
If at the end of 2009, the number of mobile subscriptions around the world reached 4.6 billion, there were clear perspectives that in the current year this number would exceed 5 billion [2], given that world population is 6.8 billion people [3]; according to same source, in the year 2010, a whole lot more people use their mobile phones to access the Internet, their number being around 1 billion; on the other hand, it is expected that in the next five years, more people will access the Internet from their laptops and mobile phones than from desktop PCs; in terms of services accessed by mobile phones, we found that the developing countries are increasingly using mobile phones for Internet banking, while the use of cell phones in health services made a big difference in the developing regions, in comparison to the rest of the world.
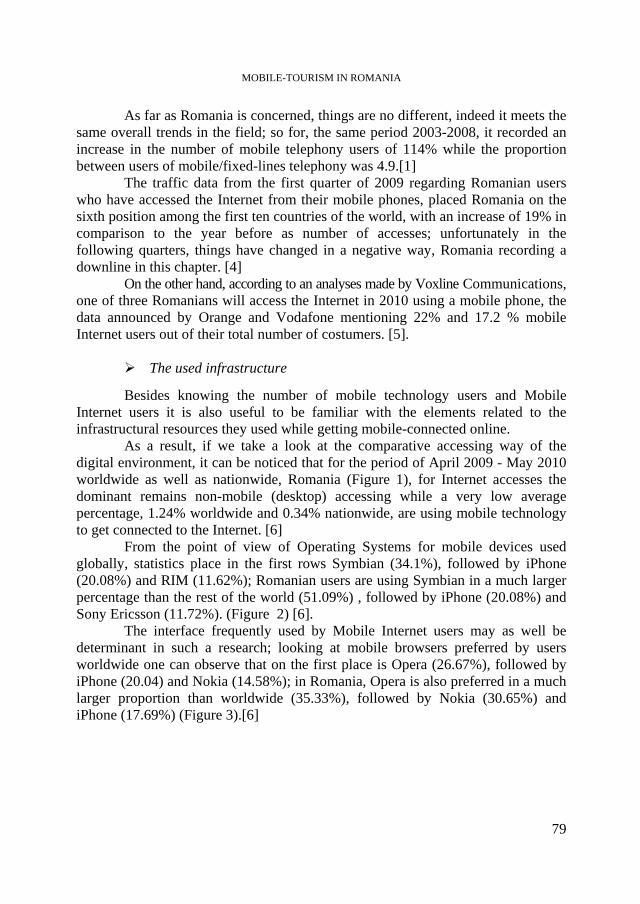
MOBILE-TOURISM IN ROMANIA
79
As far as Romania is concerned, things are no different, indeed it meets the same overall trends in the field; so for, the same period 2003-2008, it recorded an increase in the number of mobile telephony users of 114% while the proportion between users of mobile/fixed-lines telephony was 4.9.[1]
The traffic data from the first quarter of 2009 regarding Romanian users who have accessed the Internet from their mobile phones, placed Romania on the sixth position among the first ten countries of the world, with an increase of 19% in comparison to the year before as number of accesses; unfortunately in the following quarters, things have changed in a negative way, Romania recording a downline in this chapter. [4]
On the other hand, according to an analyses made by Voxline Communications, one of three Romanians will access the Internet in 2010 using a mobile phone, the data announced by Orange and Vodafone mentioning 22% and 17.2 % mobile Internet users out of their total number of costumers. [5].
� The used infrastructure
Besides knowing the number of mobile technology users and Mobile Internet users it is also useful to be familiar with the elements related to the infrastructural resources they used while getting mobile-connected online.
As a result, if we take a look at the comparative accessing way of the digital environment, it can be noticed that for the period of April 2009 - May 2010 worldwide as well as nationwide, Romania (Figure 1), for Internet accesses the dominant remains non-mobile (desktop) accessing while a very low average percentage, 1.24% worldwide and 0.34% nationwide, are using mobile technology to get connected to the Internet. [6]
From the point of view of Operating Systems for mobile devices used globally, statistics place in the first rows Symbian (34.1%), followed by iPhone (20.08%) and RIM (11.62%); Romanian users are using Symbian in a much larger percentage than the rest of the world (51.09%) , followed by iPhone (20.08%) and Sony Ericsson (11.72%). (Figure 2) [6].
The interface frequently used by Mobile Internet users may as well be determinant in such a research; looking at mobile browsers preferred by users worldwide one can observe that on the first place is Opera (26.67%), followed by iPhone (20.04) and Nokia (14.58%); in Romania, Opera is also preferred in a much larger proportion than worldwide (35.33%), followed by Nokia (30.65%) and iPhone (17.69%) (Figure 3).[6]
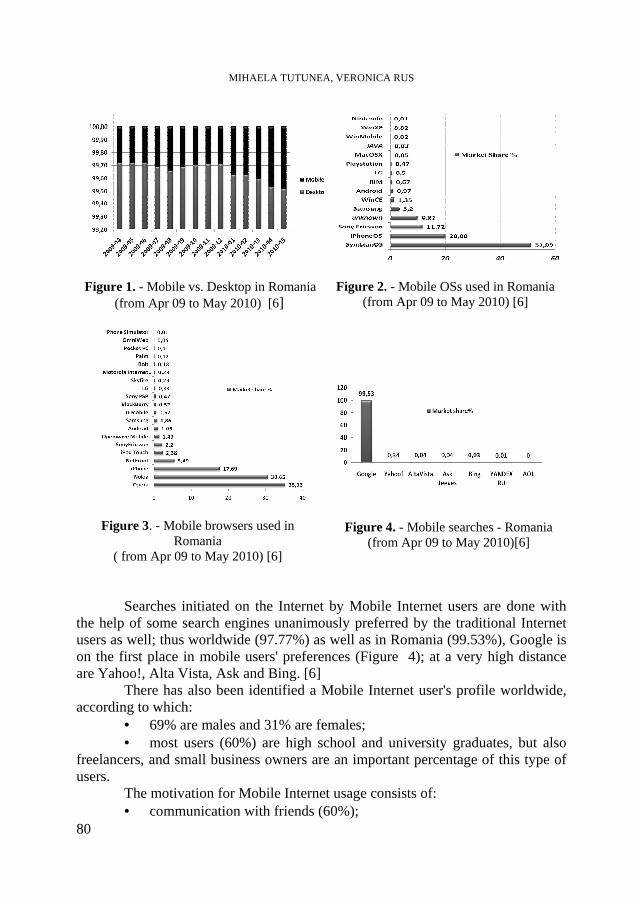
MIHAELA TUTUNEA, VERONICA RUS
80
Figure 1. - Mobile vs. Desktop in Romania
(from Apr 09 to May 2010) [6]
Figure 2. - Mobile OSs used in Romania
(from Apr 09 to May 2010) [6]
Figure 3. - Mobile browsers used in Romania
( from Apr 09 to May 2010) [6]
Figure 4. - Mobile searches - Romania (from Apr 09 to May 2010)[6]
Searches initiated on the Internet by Mobile Internet users are done with
the help of some search engines unanimously preferred by the traditional Internet users as well; thus worldwide (97.77%) as well as in Romania (99.53%), Google is on the first place in mobile users' preferences (Figure 4); at a very high distance are Yahoo!, Alta Vista, Ask and Bing. [6]
There has also been identified a Mobile Internet user's profile worldwide, according to which:
• 69% are males and 31% are females; • most users (60%) are high school and university graduates, but also
freelancers, and small business owners are an important percentage of this type of users.
The motivation for Mobile Internet usage consists of: • communication with friends (60%);

MOBILE-TOURISM IN ROMANIA
81
• usual and frequent access to Mobile Internet – more than 50%; • Mobile Internet access from home, starting early in the evening and
continuing after midnight - over 70% of users.
2.2. Researching the Mobile-tourism services market in Romania
2.2.1. Problem formulation Having an image of mobile telephony users and of online environment
users using mobile terminals, we have made a research regarding the Romanian Mobile-tourism market. In order to obtain a complete image of this market, we thought it was useful and necessary to analyze the perception of the two main forces - the supply and the demand of such services.
2.2.2. Methodology for researching the supply and the demand of Mobile-tourism services
In our research regarding the online environment the use of the Internet and its specific tools is obvious in the elaboration of our study; but we should not leave out mentioning the issues specific to the online research; such an issue of an online study is to collect the answers from individual online users; it is very difficult to contact all the Internet users or even a certain part designated on certain criteria, even limited by a real geographic border like a country, which is the case of Romania; thus, to make our online research we have selected a subset of users attracted in our study; as a result for establishing the set of users we used the well-known method of the web-survey which is done by choosing the most representative sample from the online population that is under study.
a. Purpose of the research The purpose of our research is to create an image regarding the manifestations
and the characteristics of supply and demand as far as the Mobile-tourism services are concerned, as a digital alternative to E-tourism, by analyzing the peculiarities of the Romanian digital market of the kind.
b. Choosing the sources of information The sources of information we used were both primary and secondary: the
primary ones are those resulted from the administered questionnaires, and the secondary ones were those collected from the Internet, research papers, statistics, newsgroups, etc.
c. Defining the Sampling Frame This study was conceived on two distinct components, namely: • for the specific supply and demand, both identified and localized in the
Romanian digital environment.
MIHAELA TUTUNEA, VERONICA RUS
82
d. Data Collecting To collect data we used questionnaires specific to the type under study -
the online supply and demand, and as data collection techniques we used direct observation, configured differently depending on the subject.
In the case of online demand the direct observation was done in newsgroups, forums and chat-rooms on dedicate subjects, oriented and supervised during the study in order to capture the tendencies and preferences directly expressed in a more accurate and easy manner.
In the case of the online suppliers the observation was more laboriously adding to our demand observation instruments the visitation of a large number of websites and links in order to obtain a coherent and manageable database.
e. Elaborating the questionnaire Starting from the fact that the questionnaire is the instrument of gathering
data upon which the success of the research depends, in making the questionnaire we have taken into consideration the purpose of our study, the kind of the investigated population in both cases and we used closed questions.
The demand questionnaire was made up of 16 questions and it was structured in three sections, namely:
• the first section regarded respondents' data - age, sex, education, background, income, marital status, number of children;
• the second section - regarding the availability of a mobile phone, Internet connection, Mobile Internet connection, the type of such accessed services and travels information (travel habits, durations and their motivations);
• the last section was dedicated to finding the perception related to accessing some Mobile-tourism services, their need, the phase of the travel in which they would like information, the type of this information and, obviously, the need to receive this information on the mobile phone.
The supply questionnaire for Mobile-tourism services was more succinct having only 9 questions, related to:
• identifying the types of touristic services provided; • the existing extensions of Mobile-tourism services; • the type of Mobile-tourism services provided, in accordance with the
phases of a travel; • the number of permanent and seasonal costumers of Mobile-tourism
services; • the perception of the way in which the Mobile-tourism services have
improved company's activity; • the intention to invest in developing a platform for providing Mobile-
tourism services.
MOBILE-TOURISM IN ROMANIA
83
f. The Sample As mentioned above, the sample for our research was selected by simple
random sampling
g. Methods used The participants in this study who were part of our sample had to answer
the questionnaire posted on the website of the study or at the e-mails of invitation to our research. The chosen participants were contacted initially by:
• announcements on the Internet via newsgroups; • random banners placed on free hosting websites with huge traffic; • announcements made on the mailing list of the supervising and
researched websites.
h. Establishing the size and the structure of the sample The whole population under study was made up differently for online
demand and online supply. For the demand we had 3875 subjects out of which we obtained a final sample of 2584 subjects, representing a rate of useful satisfactory online answers of 49.96%.
The providers population was identifies with the number of web-presences from the tourism web-category recorded in Romania - 2692 subjects. [7], [8]; but their response rate was smaller than in the case of the demand, 39.19 %, which can suggest the fact that a big part of the web-presences recorded in the E-tourism category are not actually active online.
3. Results and discussion
3.1. Analyze of the Romanian demand for Mobile-tourism services The answers for the questions of the section regarding the availability of a
mobile phone, of an Internet connection and of using Internet services on the mobile phone have highlighted the following aspects:
• 98.78% of the respondents own a mobile phone, and 89.82% have an Internet connection on their mobile phone;
• by the support used for connecting to the Internet, 59.56% of the respondents identified only their desktop or laptop connection, 28.54% - connection combined with mobile telephony support, while only a very small percentage, 11.9%, uses only mobile telephony for getting connected online;
• from the most accessed online services, the first ones are online communication and social networks (26.07%), followed by Internet banking (24.15%) and by miscellaneous announcements (13.55%); the information specific to the touristic domain have been designated as being searched online by a small percentage of respondents (10.45%).
In the category of questions relating to the final end of the research there were also comprised the ones about the habit, periodicity, duration and the motivation

MIHAELA TUTUNEA, VERONICA RUS
84
of traveling; thus the more respondents indicated their habitual annual travel of maximum 10 days (54.87%) , followed by those making biannual travels of up to 7 days (22.34%) (Figure 5); as motivation of the holiday - vacation and leisure were mentioned primarily (78.23), followed by business interest (11.3%) (Figure 6).
Figure 5. - Travel habits
Figure 6. - Travel motivation The answers to the questions regarding the identification of respondents'
perception towards the need of the touristic information and its type according to the stage of the travel have highlighted the fact that most of the respondents (66.12%) indicated their need for information regarding the stage of preparation for a trip, regardless of its purpose while only 33.88% want information during their travel; for the preparation and planning stage of a travel, the information related to the offer of touristic packages interest them first (34.56%), followed by those related to touristic destinations (24.12%) (Figure 7); during travel, they mentioned the information related to the location/destination of the travel (23.45%), followed by online maps and guides (22.67%) and touristic places of the area (22.11%) (Figure 8).
Figure 7. - Preparation and planning
travel information
Figure 8. - During travel information
MOBILE-TOURISM IN ROMANIA
85
Obviously all the question made way for the final one related to the need of obtaining this information on the mobile phone by the respondents; the result was highly surprising because over 97% of the respondents (97.12%) indicated this way of communication as a must for them.
� Profile of the Romanian consumer of Mobile-tourism services, highlighted
on individual:
• aged between 30 and 39, male (52.21%), living in the city (87.63%), university graduate (51.88%), with a monthly income of 500-1000 Euros (40.67%), married (35.2%) or single (30.91%), possibly without children (63.78%), owning a mobile phone (97.78%), and with Internet connection only on the mobile phone (11.9%); of all the information accessed online, only 10.45% regard tourism; he annually makes a travel of maximum 10 days (54.87%), in order to leisure/holiday; he is interested to receive information on his mobile phone (97.12%); in the phase of preparing his travel he wants information related to touristic packages and promotions as well as to touristic destinations and online reservations; during the travel he wants information about the location where he is at, about points of touristic interest and about touristic maps and guides on his mobile.
3.2. Analyze of the Romanian offer of Mobile-tourism services Considering the types of services provided by each of our respondents we
obtained the following structure: travel agencies/tour operators (51.18%), hospitality services oferrers (31.33%), transportation services suppliers (9.67%), related touristic services oferrers (rent of transportation vehicles, insurances, reservations etc.) (7.22%).
At the level of this general structure, identifying the offer of Mobile-tourism services has highlighted a reduced percentage (28.88%) of respondents, the rest of the segment of oferrers not satisfying this range of services.
Out of the small area of Mobile-tourism service suppliers and in accordance with the phases of the travel making the object of tourism packages, we have identified a few service categories for communication via mobile telephony; thus for the phase before preparing a travel, the most often supplied services are those related to information regarding the existing touristic packages and promotions (87.64%), followed at a great distance by online reservations (12.36%); during the travel, the category of information provided mostly is the one related to the final destination (48.42%), followed by the offer of maps and touristic guides on the mobile phone (18.1%) and by rent of transportation vehicle (14.34%).
In order to obtain an image of the effective demand for this type of Mobile-tourism services we have identified the number of permanent costumers in comparison with the period designated as touristic season; as a result there are high percentages only in the category comprising under 100 costumers for these services - 97.23% permanently and during the touristic season; slight modifications appear
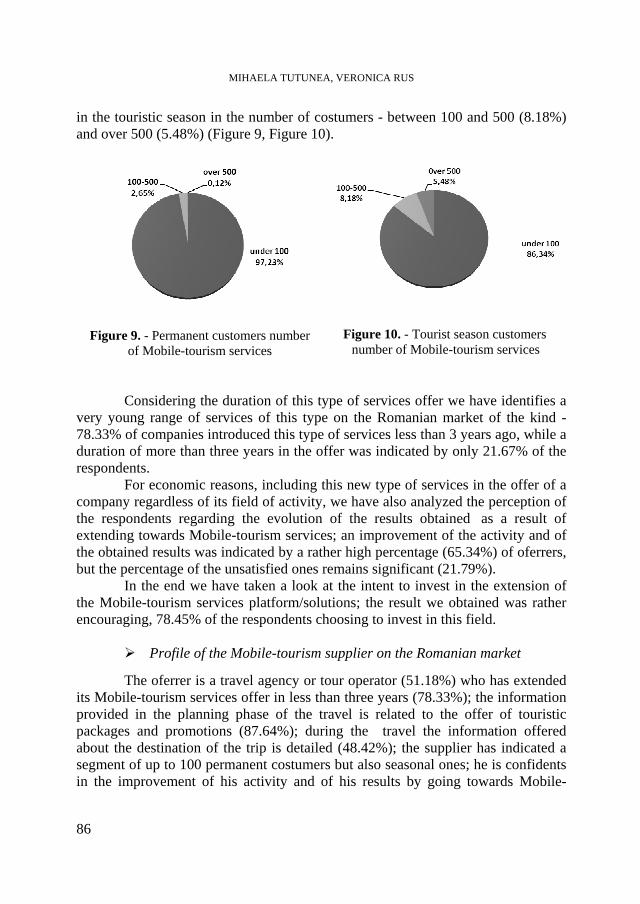
MIHAELA TUTUNEA, VERONICA RUS
86
in the touristic season in the number of costumers - between 100 and 500 (8.18%) and over 500 (5.48%) (Figure 9, Figure 10).
Figure 9. - Permanent customers number of Mobile-tourism services
Figure 10. - Tourist season customers number of Mobile-tourism services
Considering the duration of this type of services offer we have identifies a
very young range of services of this type on the Romanian market of the kind - 78.33% of companies introduced this type of services less than 3 years ago, while a duration of more than three years in the offer was indicated by only 21.67% of the respondents.
For economic reasons, including this new type of services in the offer of a company regardless of its field of activity, we have also analyzed the perception of the respondents regarding the evolution of the results obtained as a result of extending towards Mobile-tourism services; an improvement of the activity and of the obtained results was indicated by a rather high percentage (65.34%) of oferrers, but the percentage of the unsatisfied ones remains significant (21.79%).
In the end we have taken a look at the intent to invest in the extension of the Mobile-tourism services platform/solutions; the result we obtained was rather encouraging, 78.45% of the respondents choosing to invest in this field.
� Profile of the Mobile-tourism supplier on the Romanian market
The oferrer is a travel agency or tour operator (51.18%) who has extended its Mobile-tourism services offer in less than three years (78.33%); the information provided in the planning phase of the travel is related to the offer of touristic packages and promotions (87.64%); during the travel the information offered about the destination of the trip is detailed (48.42%); the supplier has indicated a segment of up to 100 permanent costumers but also seasonal ones; he is confidents in the improvement of his activity and of his results by going towards Mobile-
MOBILE-TOURISM IN ROMANIA
87
tourism services (65.34%) and continues to invest in the development of such services (78.45%).
4. Conclusions
The statistical analysis allows us to sketch a profile of the mobile technology user worldwide and nationwide according to which:
o the number of users is continuously growing; o the frequent user is male, but the feminine segment is also well-
represented and in a continuous growth; o he uses as mobile operating system Symbian and iPhone; as browsers
- Opera, iPhone and Nokia and searches for the online information with Google and Yahoo! search engines;
o he prefers activities related to communication and online socializing networks.
Besides the general statistical image of the mobile technology user, also having sketched profiles of the Romanian Mobile-tourism services user, e-marketers can focus their specific actions on much more powerful segment of supply and demand, aiming at the same time the development of some weakly represented segments and identifying some niches that have not been explored yet.
Our research is also revealing aspects related to the Romanian oferrer of Mobile-tourism services, namely:
o a relatively low level of development as far as the Mobile-tourism services oferrers are concerned, even if they activate in one of the most dynamic industries;
o there are a lot of segments of users that have not been explored by the Romanian offer regarding these services;
o the existing providers are unclearly and incompletely defined, unrelated and unadapted to the type of touristic product and to the phases of a travel.
The Romanian market of Mobile-tourism services offer may be considered poor as far as viable presences are concerned; for the e-marketing specialist, this aspect may get consolidated in an important starting point for creating policies and strategies to attract developers of online Mobile-tourism solutions in order to increase the coverage degree of the offer’s market in this field that is so dynamic.
We believe that this research can be useful for both the marketers of a mobile field as well as for those of tourism, who must be able to see the rapid tendencies of the market and of the consumer and for the industry of IT &C which must develop permanently and adopt software solutions for the most diverse fields of activity, using the communication infrastructure of latest generation; our result can also be useful for the companies of the two main industries abroad who can get oriented on a new and very diverse market like the Romanian one whose rapid extension towards the business digital environment first and then towards the mobile one is acknowledged.
MIHAELA TUTUNEA, VERONICA RUS
88
Having identified the profile of the Mobile-tourism services consumer and supplier, they can concentrate their actions in an adaptive manner towards consolidating the segment of consumers that has already been shaped, but also towards identifying some segments on emerging markets with a high potential; we must also take into consideration the possibilities of extending our research on other regional segments and developing some comparative studies for this highly mobile field.
REFERENCES
[1] http://www.itu.int/ITU-D/icteye/Indicators/Indicators.aspx# [2] http://reviews.cnet.com/8301-13970_7-10454065-78.html [3] http://www.internetworldstats.com/stats.htm [4] http://www.buzzcity.com/f/mygamma [5] http://www.voxline.ro/ [6] http://www.statcounter.com/ [7] http://www.trafic.ro [8] http://ww.top-ro.ro
STUDIA UNIVERSITATIS BABEŞ-BOLYAI, NEGOTIA, LVI, 1, 2011
CHANGES IN TOURISM CONSUMER BEHAVIOR
RÁDULY ISTVÁN 1, PARTENIE DUMBRAV Ă2 ABSTRACT . Globalization has increased interdependence among countries, economies and people. It does not involve only giant corporations but also small and medium sized businesses, together with family-run firms. This process has led to the creation and operation of the global tourism market where destinations, which are expected to compete on equal basis regardless of the country of origin, function interactively. Globalization has opened a whole new world of development opportunities. 922 million people travelled abroad in the year 2008, by the year 2020 this number is expected to increase to 1.6 billion. The tourism turnover is US$ 3,500 billion and accounts for 10 percent of the global trade. Tourism has become huge business and is run by great trusts. Keywords: tourism, tourist arrivals, tourism receipts, globalization. JEL classificaction: L83, D91 1. Introduction
Globalization has turned into the most important mega trend of a century's development at the end of the 20th and the beginning of the 21st Century. The market's rapid expansion means the development of worldwide competition. Transnational companies conquer increasingly larger spaces, thus, the small and middle enterprises' market position is deteriorating.
With the engaging of newer and newer host regions, the importance of the traditional host regions will be changed: in the long run their competitive advance can rely exclusively on “quality”. Although the consumer expectations are equalized, this does not require a full uniformity in the tourism supply however, since hereby the claim for the essence of tourism, the variety, the specialty would suffer mistake. On the contrary the effect is: as a consequence of the globalization process, various destinations are forced to conserve their traditions, thus their cultural identity
1 Lecturer PhD, Universitatea Babeş-Bolyai din Cluj-Napoca, Faculty of Economics and Business
Administration, Sfântu Gheorghe, [email protected]. 2 Professor PhD, Universitatea Babeş-Bolyai din Cluj-Napoca, Faculty of Business,
RÁDULY ISTVÁN, PARTENIE DUMBRAVĂ
90
getting stronger. Limitations related to traveling and the immovableness of the human resource may hinder globalization at the same time.
The globalization of demand is also an enormous source of danger. Only a fraction of the population of the Earth travels. The world is not yet prepared for the case when people living in the most populous countries of the Earth “set off”.
2. Tendencies of Tourism Trends
Tourism has become one of the major international trade categories. The overall export income generated by international tourism including passengers transport reached US$ 1.1 trillion in 2008, or US$ 3 billion a day (UNWTO, 2009). Tourism exports account for as much as 30% of the world’s exports of commercial services and 6% of overall exports of goods and services. Globally, as an export category, tourism ranks fourth after fuels, chemicals and automotive products. For many developing countries it is one of the main income sources and the number one export category, creating the much needed employment and opportunities for development.
The peculiarity of tourism is that tourists travel exclusively to one place in the rarest case. It is rather right, that the role of tourist regions is an important one, tourist products are also attached to the regions and marketing lays an emphasis on these, too. A settlement of its own – except for capitals, cities, health resorts – does not induce interest, but they may be competitive on the world market which is becoming more and more global if settlements develop a tourist product by the unification or association of the regions.
In 2008, international tourist arrivals reached 922 million, up from 904 million in 2007, representing a growth by 2%. This overall growth builds on the strong results of the first part of the year, before the collapse of the financial markets and the subsequent recession. The second half of the year showed an abrupt shift in trend, with international arrivals flattening or showing negative growth in each of the last six months of 2008. Overall, the 5% growth between January and June gave way to a 1% decline in the second half of the year. Though not immune to the economic woes, tourism has so far resisted the economic downturn better than other sectors, such as construction, real estate and car manufacturing.
All regions had positive growth except for Europe, which suffered stagnation in arrivals (+0.3%). The best performance was seen in the Middle East, where international arrivals reached 55 million, a rise by 18% compared to the previous year. Africa grew at half the rate of the previous year, but still registered an above-average growth of 4%. The Americas grew by 3%, boosted by the strong performance of Central and South American destinations and the strength of traffic to the USA in the first half of the year. Asia and the Pacific saw a significant slowdown in arrivals as compared to its previous bumper years, growing just over 1% in 2008.
International tourism receipts rose by 1.7% in real terms in 2008 to US$ 944 billion (642 billion Euro). Receipts from international passenger transport are
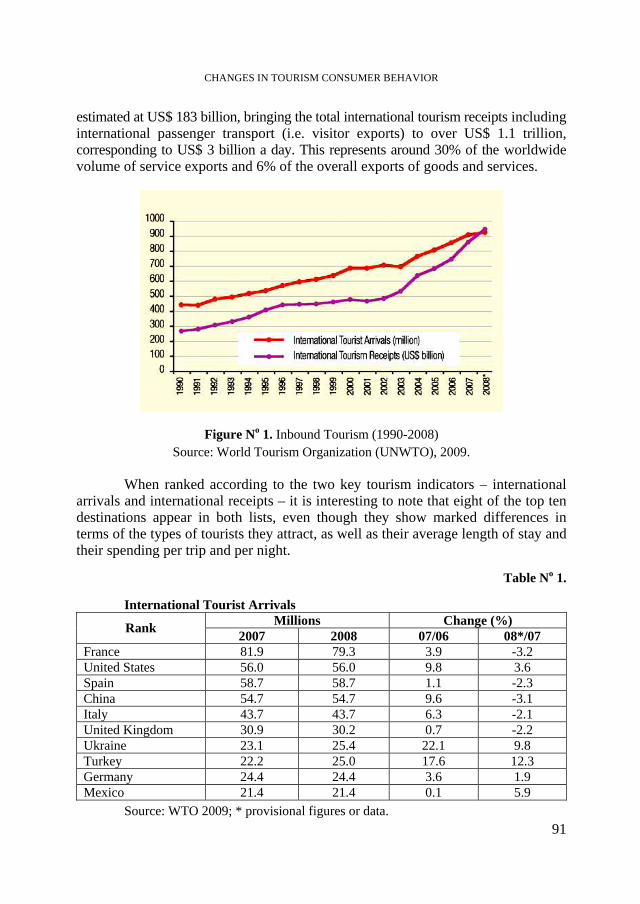
CHANGES IN TOURISM CONSUMER BEHAVIOR
91
estimated at US$ 183 billion, bringing the total international tourism receipts including international passenger transport (i.e. visitor exports) to over US$ 1.1 trillion, corresponding to US$ 3 billion a day. This represents around 30% of the worldwide volume of service exports and 6% of the overall exports of goods and services.
Figure No 1. Inbound Tourism (1990-2008) Source: World Tourism Organization (UNWTO), 2009.
When ranked according to the two key tourism indicators – international
arrivals and international receipts – it is interesting to note that eight of the top ten destinations appear in both lists, even though they show marked differences in terms of the types of tourists they attract, as well as their average length of stay and their spending per trip and per night.
Table No 1.
International Tourist Arrivals
Millions Change (%) Rank 2007 2008 07/06 08*/07
France 81.9 79.3 3.9 -3.2 United States 56.0 56.0 9.8 3.6 Spain 58.7 58.7 1.1 -2.3 China 54.7 54.7 9.6 -3.1 Italy 43.7 43.7 6.3 -2.1 United Kingdom 30.9 30.2 0.7 -2.2 Ukraine 23.1 25.4 22.1 9.8 Turkey 22.2 25.0 17.6 12.3 Germany 24.4 24.4 3.6 1.9 Mexico 21.4 21.4 0.1 5.9
Source: WTO 2009; * provisional figures or data.
RÁDULY ISTVÁN, PARTENIE DUMBRAVĂ
92
There were only slight changes in the ranking of the “World’s Top Tourism Destinations” in 2008. The top three places – both for international tourist arrivals and international tourism receipts – were still occupied by the USA, Spain and France, albeit in a different order. France continued to lead the ranking of the world’s major tourist destinations in terms of arrivals, but ranked third in receipts. The USA ranked first in receipts, earning US$ 110 billion and regained its second position in arrivals, which it had lost to Spain after the 11th of September 2001. Spain dropped to the third place in terms of arrivals but maintained its position as the second biggest earner worldwide, and the first in Europe.
China and Italy both held on to their 2007 positions in terms of arrivals and receipts, with China ranking fourth in arrivals and fifth in receipts, while the reverse was true for Italy. The UK ranked sixth in arrivals and dropped to seventh place in receipts, after being overtaken by Germany (which ranked ninth in arrivals). Turkey moved up one rank in both categories, occupying the eighth position in arrivals and ninth in receipts. Completing the top ten ranking in arrivals were Ukraine (7) and Mexico (10) and in receipts, Australia (8) and Austria (10).
The top ten tourism earners of the previous year accounted for 49% of the total estimated US$ 944 billion in international tourism receipts. Their respective share of international tourist arrivals was slightly lower, of 45%.
Table No 2.
International Tourist Receipts
US $ Local currencies Billions Change (%) Change (%)
Rank
2007 2008* 07/06 08*/07 07/06 08*/07 United States 96.7 110.1 12.8 13.8 12.8 13.8 Spain 57.6 61.6 12.8 6.9 3.3 -0.4 France 54.3 55.6 17.1 2.4 7.3 -4.6 Italy 42.7 45.7 11.9 7.2 2.5 -0.1 China 37.2 10.8 9.7 9.7 9.7 9.7 Germany 36.0 40.0 9.9 11.0 0.7 3.5 United Kingdom 38.6 36.0 11.6 -6.7 2.6 1.6 Australia 22.3 24.7 25.0 10.6 12.5 10.3 Turkey 18.5 22.0 9.7 18.7 9.7 18.7 Austria 18.9 21.8 13.5 15.4 4.0 7.5
Source: WTO 2009; * provisional figures or data. According to the WTO data, international traffic of the world tourism
disperses among the world's tourist regions as follows:
CHANGES IN TOURISM CONSUMER BEHAVIOR
93
Table No 3.
International Tourist Arrivals by Regions (Millions )
1995 2000 2010 2020 Region (%) (%) (%) (%)
Europe 335 59.4 390 56.4 527 50.3 717 44.7 Asia - Pacific 84 14.9 122 17.7 242 23.2 457 28.5 America 111 19.7 134 19.4 195 18.6 285 17.8 Africa 20 3.5 27 3.9 46 4.4 75 4.7 Middle East 12 2.5 19 2.6 37 3.5 69 4.3
Source: WTO 2009. According to the WTO data from the above table, the number of tourist
arrivals is growing in all of the regions, although to a different degree, consequently the importance of the different tourist regions is changing.
On the basis of the regional distribution of the international tourism we can conclude, that Europe is loosing its importance despite its leading role until 2020. There will be registered hardly 45% of the international arrivals to our continent. Taking into consideration the almost 60% registered in 1995, the decrease is considerable. Like Europe, America also suffers losses – although to a significantly lesser degree. As a result of the 2% decrease, America falls to the third place among the regions (this fact ensued in 2004 already). Asia-Pacific has shown the increase with the largest proportion. Its quota doubles almost, and after Europe, with its more than 28% share achieves the second place among the tourist regions of the world. Africa and the Middle East report the almost identical 4-5% proportion.
Table No 4.
International Tourist Arrivals by (Sub)region
International Tourist Arrivals (million)
Market Share (%)
Change (%)
1990 1995 2000 2005 2006 2007 2008* 2008* 07/06 08*/07
World 438 534 684 804 853 904 922 100 6.1 2.0
Europe 265.0 309.5 392.6 441.8 468.4 487.9 489.4 53.1 4.1 0.3 Northern EU 28.6 35.8 43.7 52.8 56.5 58.1 57.0 6.2 2.8 -1.9 Western EU 108.6 112.2 139.7 142.6 149.6 154.9 153.3 16.6 3.6 -1.1 Central/ Eastern EU
33.9 58.1 69.3 87.5 91.4 96.6 99.6 10.8 5.6 3.1
Southern/ Medit. EU
93.9 103.4 139.9 158.9 170.9 178.2 179.6 19.5 4.3 0.8
RÁDULY ISTVÁN, PARTENIE DUMBRAVĂ
94
International Tourist Arrivals (million)
Market Share (%)
Change (%)
1990 1995 2000 2005 2006 2007 2008* 2008* 07/06 08*/07
Asia & Pacific 55.8 82.0 110.1 153.6 166.0 182.0 184.1 20.0 9.6 1.2
North-East Asia 26.4 41.3 58.3 86.0 92.0 101.0 101.0 10.9 9.8 -0.1 South-East Asia 21.2 28.4 36.1 48.5 53.1 59.7 61.7 6.7 12.3 3.5 Oceania 5.2 8.1 9.6 11.0 11.0 11.2 11.1 1.2 1.7 -0.9 South Asia 3.2 4.2 6.1 8.1 9.8 10.1 10.3 1.1 2.6 2.1
Americas 92.8 109.0 128.2 133.3 135.8 142.9 147.0 15.9 5.2 2.9 North America 71.7 80.7 91.5 89.9 90.6 95.3 97.8 10.6 5.2 2.6 Caribbeans 11.4 14.0 17.1 18.8 19.4 19.8 20.2 2.2 1.6 2.0 Central America 1.9 2.6 4.3 6.3 6.9 7.8 8.3 0.9 12.0 7.0 South America 7.7 11.7 15.3 18.3 18.8 20.1 20.8 2.3 6.5 3.6
Africa 15.1 20.0 27.9 37.3 41.5 45.0 46.7 5.1 8.4 3.7 North Africa 8.4 7.3 10.2 13.9 15.1 16.3 17.2 1.9 8.5 4.9 Sub-Saharan Africa
6.7 12.7 17.6 23.4 26.5 28.7 29.5 3.2 8.3 3.1
Middle East 9.6 13.7 24.9 37.9 40.9 46.6 55.1 6.0 14.0 18.1
Source: WTO 2009; * provisional figures or data. International Tourist Receipts by (Sub)region
UNWTO estimated that worldwide receipts from international tourism would reach US$ 944 billion (642 billion Euro) in 2008. In absolute terms, international tourism receipts increased by US$ 87 billion, but only by 16 billion Euro due to the depreciation of the US dollar against several world currencies and, in particular, the Euro (in 2008 the US Dollar lost 7% against the Euro).
All regions shared in the increase in tourism receipts in absolute values. In real terms growth was in all regions much weaker in 2008 than the year before with the exception of the Middle East, which registered a double-digit growth of 17%. Asia and the Pacific grew by 2.7% (compared to +9.8% in 2007) and the Americas increased by 5.0%, slightly less than 2007s 6.3%. Both Europe and Africa (-1% each), however, suffered negative growth in receipts in real terms.
By sub-region, the strongest increases came from North America (+7%) and South Asia (+6%). In Northern, Western and Southern/ Mediterranean Europe, North Africa, the Caribbean and Central America, receipts declined in real terms in 2008. In the case of North Africa and Central America, the decline followed two years of very strong growth.
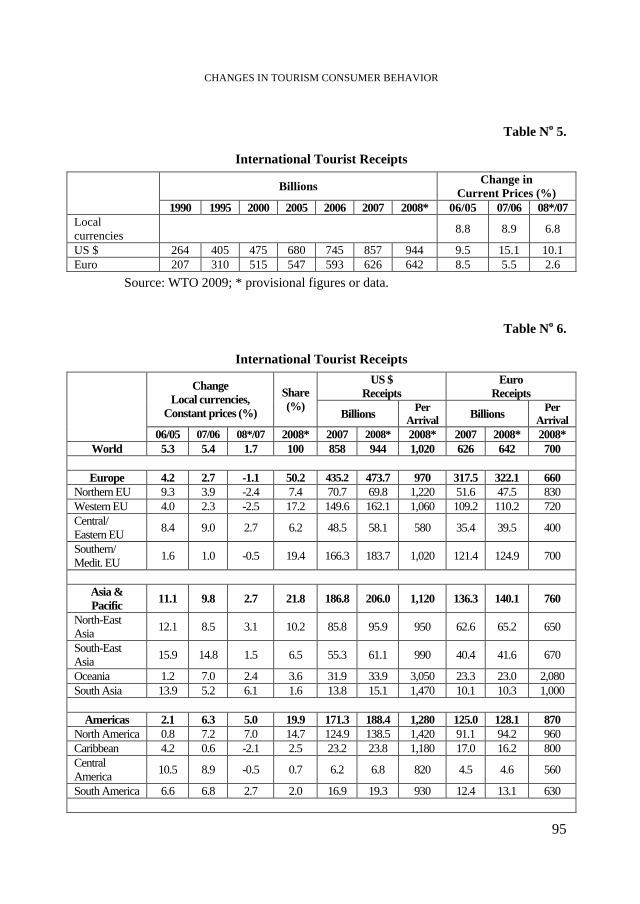
CHANGES IN TOURISM CONSUMER BEHAVIOR
95
Table No 5.
International Tourist Receipts
Billions Change in Current Prices (%)
1990 1995 2000 2005 2006 2007 2008* 06/05 07/06 08*/07 Local currencies
8.8 8.9 6.8
US $ 264 405 475 680 745 857 944 9.5 15.1 10.1 Euro 207 310 515 547 593 626 642 8.5 5.5 2.6
Source: WTO 2009; * provisional figures or data.
Table No 6.
International Tourist Receipts
US $ Receipts
Euro Receipts
Change Local currencies,
Constant prices (%)
Share (%)
Billions Per Arrival Billions Per
Arrival
06/05 07/06 08*/07 2008* 2007 2008* 2008* 2007 2008* 2008* World 5.3 5.4 1.7 100 858 944 1,020 626 642 700
Europe 4.2 2.7 -1.1 50.2 435.2 473.7 970 317.5 322.1 660
Northern EU 9.3 3.9 -2.4 7.4 70.7 69.8 1,220 51.6 47.5 830 Western EU 4.0 2.3 -2.5 17.2 149.6 162.1 1,060 109.2 110.2 720 Central/ Eastern EU
8.4 9.0 2.7 6.2 48.5 58.1 580 35.4 39.5 400
Southern/ Medit. EU
1.6 1.0 -0.5 19.4 166.3 183.7 1,020 121.4 124.9 700
Asia & Pacific
11.1 9.8 2.7 21.8 186.8 206.0 1,120 136.3 140.1 760
North-East Asia
12.1 8.5 3.1 10.2 85.8 95.9 950 62.6 65.2 650
South-East Asia
15.9 14.8 1.5 6.5 55.3 61.1 990 40.4 41.6 670
Oceania 1.2 7.0 2.4 3.6 31.9 33.9 3,050 23.3 23.0 2,080 South Asia 13.9 5.2 6.1 1.6 13.8 15.1 1,470 10.1 10.3 1,000
Americas 2.1 6.3 5.0 19.9 171.3 188.4 1,280 125.0 128.1 870
North America 0.8 7.2 7.0 14.7 124.9 138.5 1,420 91.1 94.2 960 Caribbean 4.2 0.6 -2.1 2.5 23.2 23.8 1,180 17.0 16.2 800 Central America
10.5 8.9 -0.5 0.7 6.2 6.8 820 4.5 4.6 560
South America 6.6 6.8 2.7 2.0 16.9 19.3 930 12.4 13.1 630
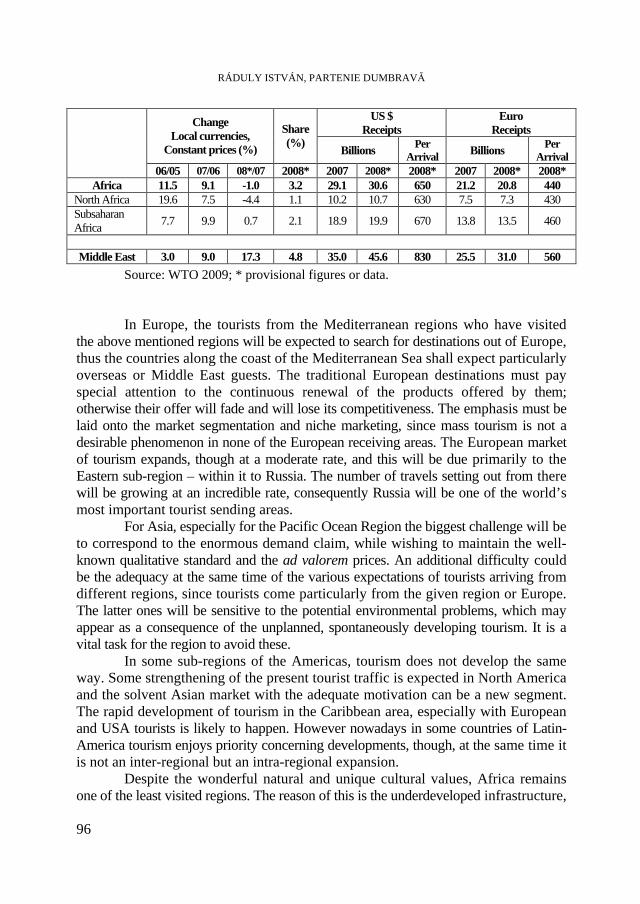
RÁDULY ISTVÁN, PARTENIE DUMBRAVĂ
96
US $ Receipts
Euro Receipts
Change Local currencies,
Constant prices (%)
Share (%)
Billions Per Arrival Billions Per
Arrival
06/05 07/06 08*/07 2008* 2007 2008* 2008* 2007 2008* 2008* Africa 11.5 9.1 -1.0 3.2 29.1 30.6 650 21.2 20.8 440
North Africa 19.6 7.5 -4.4 1.1 10.2 10.7 630 7.5 7.3 430 Subsaharan Africa
7.7 9.9 0.7 2.1 18.9 19.9 670 13.8 13.5 460
Middle East 3.0 9.0 17.3 4.8 35.0 45.6 830 25.5 31.0 560
Source: WTO 2009; * provisional figures or data. In Europe, the tourists from the Mediterranean regions who have visited
the above mentioned regions will be expected to search for destinations out of Europe, thus the countries along the coast of the Mediterranean Sea shall expect particularly overseas or Middle East guests. The traditional European destinations must pay special attention to the continuous renewal of the products offered by them; otherwise their offer will fade and will lose its competitiveness. The emphasis must be laid onto the market segmentation and niche marketing, since mass tourism is not a desirable phenomenon in none of the European receiving areas. The European market of tourism expands, though at a moderate rate, and this will be due primarily to the Eastern sub-region – within it to Russia. The number of travels setting out from there will be growing at an incredible rate, consequently Russia will be one of the world’s most important tourist sending areas.
For Asia, especially for the Pacific Ocean Region the biggest challenge will be to correspond to the enormous demand claim, while wishing to maintain the well-known qualitative standard and the ad valorem prices. An additional difficulty could be the adequacy at the same time of the various expectations of tourists arriving from different regions, since tourists come particularly from the given region or Europe. The latter ones will be sensitive to the potential environmental problems, which may appear as a consequence of the unplanned, spontaneously developing tourism. It is a vital task for the region to avoid these.
In some sub-regions of the Americas, tourism does not develop the same way. Some strengthening of the present tourist traffic is expected in North America and the solvent Asian market with the adequate motivation can be a new segment. The rapid development of tourism in the Caribbean area, especially with European and USA tourists is likely to happen. However nowadays in some countries of Latin-America tourism enjoys priority concerning developments, though, at the same time it is not an inter-regional but an intra-regional expansion.
Despite the wonderful natural and unique cultural values, Africa remains one of the least visited regions. The reason of this is the underdeveloped infrastructure,
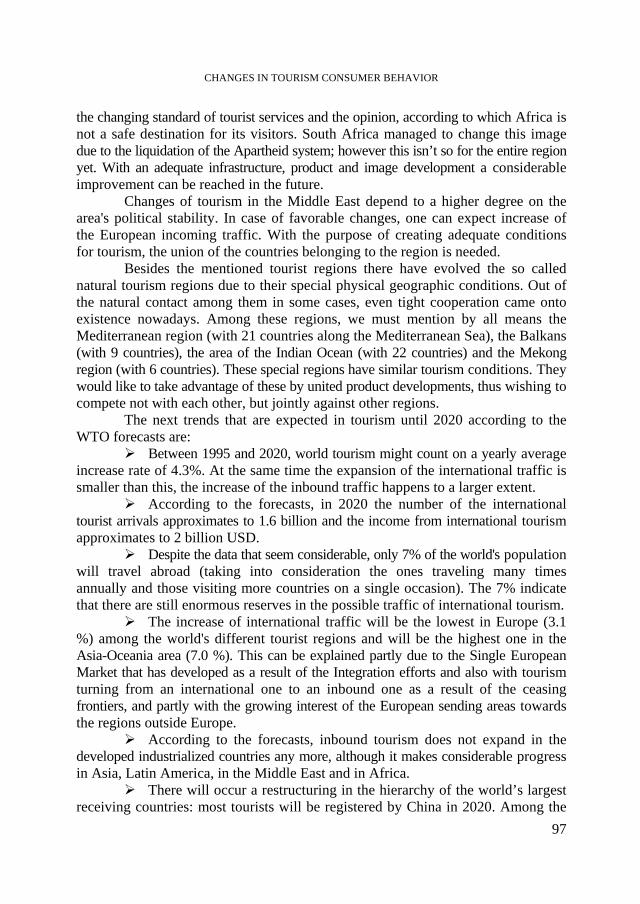
CHANGES IN TOURISM CONSUMER BEHAVIOR
97
the changing standard of tourist services and the opinion, according to which Africa is not a safe destination for its visitors. South Africa managed to change this image due to the liquidation of the Apartheid system; however this isn’t so for the entire region yet. With an adequate infrastructure, product and image development a considerable improvement can be reached in the future.
Changes of tourism in the Middle East depend to a higher degree on the area's political stability. In case of favorable changes, one can expect increase of the European incoming traffic. With the purpose of creating adequate conditions for tourism, the union of the countries belonging to the region is needed.
Besides the mentioned tourist regions there have evolved the so called natural tourism regions due to their special physical geographic conditions. Out of the natural contact among them in some cases, even tight cooperation came onto existence nowadays. Among these regions, we must mention by all means the Mediterranean region (with 21 countries along the Mediterranean Sea), the Balkans (with 9 countries), the area of the Indian Ocean (with 22 countries) and the Mekong region (with 6 countries). These special regions have similar tourism conditions. They would like to take advantage of these by united product developments, thus wishing to compete not with each other, but jointly against other regions.
The next trends that are expected in tourism until 2020 according to the WTO forecasts are:
� Between 1995 and 2020, world tourism might count on a yearly average increase rate of 4.3%. At the same time the expansion of the international traffic is smaller than this, the increase of the inbound traffic happens to a larger extent.
� According to the forecasts, in 2020 the number of the international tourist arrivals approximates to 1.6 billion and the income from international tourism approximates to 2 billion USD.
� Despite the data that seem considerable, only 7% of the world's population will travel abroad (taking into consideration the ones traveling many times annually and those visiting more countries on a single occasion). The 7% indicate that there are still enormous reserves in the possible traffic of international tourism.
� The increase of international traffic will be the lowest in Europe (3.1 %) among the world's different tourist regions and will be the highest one in the Asia-Oceania area (7.0 %). This can be explained partly due to the Single European Market that has developed as a result of the Integration efforts and also with tourism turning from an international one to an inbound one as a result of the ceasing frontiers, and partly with the growing interest of the European sending areas towards the regions outside Europe.
� According to the forecasts, inbound tourism does not expand in the developed industrialized countries any more, although it makes considerable progress in Asia, Latin America, in the Middle East and in Africa.
� There will occur a restructuring in the hierarchy of the world’s largest receiving countries: most tourists will be registered by China in 2020. Among the
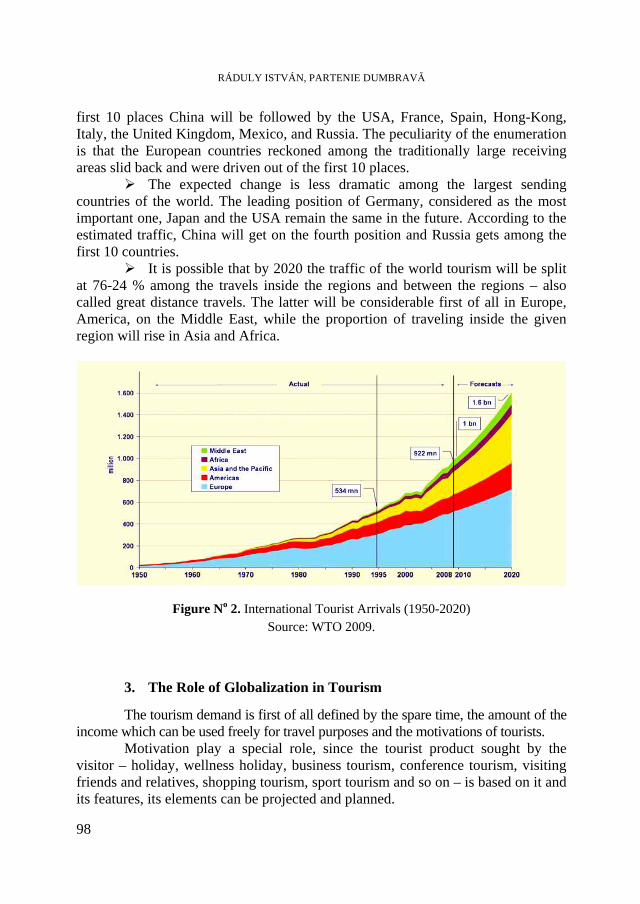
RÁDULY ISTVÁN, PARTENIE DUMBRAVĂ
98
first 10 places China will be followed by the USA, France, Spain, Hong-Kong, Italy, the United Kingdom, Mexico, and Russia. The peculiarity of the enumeration is that the European countries reckoned among the traditionally large receiving areas slid back and were driven out of the first 10 places.
� The expected change is less dramatic among the largest sending countries of the world. The leading position of Germany, considered as the most important one, Japan and the USA remain the same in the future. According to the estimated traffic, China will get on the fourth position and Russia gets among the first 10 countries.
� It is possible that by 2020 the traffic of the world tourism will be split at 76-24 % among the travels inside the regions and between the regions – also called great distance travels. The latter will be considerable first of all in Europe, America, on the Middle East, while the proportion of traveling inside the given region will rise in Asia and Africa.
Figure No 2. International Tourist Arrivals (1950-2020) Source: WTO 2009.
3. The Role of Globalization in Tourism
The tourism demand is first of all defined by the spare time, the amount of the income which can be used freely for travel purposes and the motivations of tourists.
Motivation play a special role, since the tourist product sought by the visitor – holiday, wellness holiday, business tourism, conference tourism, visiting friends and relatives, shopping tourism, sport tourism and so on – is based on it and its features, its elements can be projected and planned.
CHANGES IN TOURISM CONSUMER BEHAVIOR
99
Resorted accommodation, dining in restaurants, traffic devices depend on the nature of the tourist product; there can also be estimated the length of the residence time. The organization of the travel – individual or group travel – also influences consumption: in the case of a group travel significantly more services will be purchased and the total costs of the travel are higher, hereby the specific expenses for a single day are also higher.
Subjective factors influence tourism consumption beside the mentioned objective factors: above all the guests' tastes, their personal desires, the traditions and, last but not least, the fashion.
According to the trends of the global processes taking place in the external environment, the following changes are expected to occur in tourism:
� The gradual „ageing” of the population of the developed countries continues. It is possible to count on increasingly more tourists with an elder age, for whom special offers can be developed.
� The proportion of the working women is growing, hereby the families' per capita income as well and the part of it which can be freely spent able for tourism purposes.
� Marriages postponed in time, the proportion of single or childless pairs between the age of 20-40 years is growing. During their travels they are looking for active pastimes and they like those tours that are considered physical trials, and their holiday is not adjusted to the school holidays.
� Due to the technological development the world can be “ranged over”, since there are no more unattainable regions. The expansion and accessibility of the reservation systems make it possible for the passengers themselves to organize their travels, even from their own homes.
� The role of information shall get even stronger in the future; this means that the claim of up-to-date, multilingual, accurate information in the tourism shall increase, too.
� Due to the more spare time (paid holidays), the yearly repeated, short travel will be a determining one. Travels will no longer consist only of traditional seaside holidays, but will be organized according to the special interests of tourists.
� The environment protection movements are getting stronger. Among traveling motivations, the proportion of reasons concerning the environment raise, too.
� The natural and cultural environment is increasing. During their everyday life, especially in their spare time, people turn to nature. Thus nature and its protection get a special significance in tourism: the value of the attractiveness of the original natural environment not yet ruined by the mass tourism is growing at an unbelievable rate. Hereby the adventure tours, the exploring tours and the tourism products related to the conservation and the recovering of health are getting more requested and besides the demand concerning natural environment, the claim for cultural values, traditions and “roots” are getting higher.

RÁDULY ISTVÁN, PARTENIE DUMBRAVĂ
100
� Supply is modified by the change of motivations. From the supply inducing mass tourism, the emphasis is being laid on the supply of unique, special products. This has to be reflected in the physical appearance of the supply: for example, the hotel's size, its uniformization, the congestion of the environment, its special values, etc.
� People travel more often, they speak foreign languages, and there is no need for group travels (except for special cases). Consequently the proportion of individual traffic is growing. All these can’t spare professional leadership and the accurate informing concerning the different locations.
� In the future, the tourists will not be the passive observers of tourist attractions, but they will aim for active participation. All this will create new demands on the ones working in tourism, since it increases the claim for a thorough expertise in a special field.
4. New European Traveling Tendencies
Europe still occupies the leading position in the world's entire tourism traffic according to WTO data, although it is well known, that since the 1970’s its proportion - even if we take into consideration the number of the incoming tourists or the incomes – has been gradually decreasing.
Table No 7.
International Tourism Top Spenders
International Tourism
Expenditures (US $ Billion)
Local currencies Change (%)
Market Share (%)
Rank 2007 2008
* 2007/200
6 2008*/200
7 2008*
Population 2008
(Million)
Expenditure Per capita
(US $)
World 857 943 100 6,724 140
Germany 83.1 91.0 2.9 2.0 9.7 82 1,108 United States 76.4 79.7 5.9 4.4 8.5 304 262 United Kingdom
71.4 68.5 4.1 4.4 7.3 61 1,121
France 36.7 43.1 7.9 9.6 4.6 62 693 China 29.8 36.2 22.5 21.4 3.8 1,328 27 Italy 27.3 30.8 8.4 4.9 3.3 59 519 Japan 26.5 27.9 -0.2 -7.6 3.0 128 218 Canada 24.7 26.9 13.3 8.4 2.9 33 810 Russian Federation
22.3 24.9 22.1 11.8 2.6 142 175
Netherlands 19.1 21.7 2.6 6.2 2.3 17 1,301
Source: WTO 2009; * provisional figures or data.
CHANGES IN TOURISM CONSUMER BEHAVIOR
101
In spite of an overall cooling of tourism growth during the second half of
2008, emerging source markets again turned into some of the best performing once, with many registering growth rates of over 15% – Brazil, Hungary, South Africa, India, Bulgaria, Ukraine, China, Saudi Arabia, United Arab Emirates, Egypt, Malaysia and Argentina. The reasons are well known. Newer and newer destinations are being engaged in the reception of tourism, airlines have got a worldwide network, and traveling is becoming simpler and easier. Tourists claim novelty, and the unknown, thus destinations on other continents suitable for the fashion tendency of certain years appeared besides classic destinations.
Despite the listed negative phenomena, Europe’s leading role in tourism is beyond dispute nowadays as well. Besides France, which is on the first places, among the top five countries of the world, receiving the most foreign country tourists are other two European countries, namely Spain and Italy. Considering the incomes originating from international tourism there are four European countries among the world's five countries, which have the highest incomes: Spain, France, Italy and the United Kingdom. Indeed, among the world’s most often traveling and spending nations three are also European ones: Germany, the United Kingdom and France.
The most important target regions on the occasion of holidays are still remaining Spain (16%), France (13%) and Italy (10%) (the so called “Sunshine Destinations”). On the whole a large proportion of the Europeans' travel is trending towards the Mediterranean area, so despite the appearance of supply of newer and newer receiving areas, the traditional offers remain the most beloved ones. The fourth most important holiday destination is the overseas region (10%), especially the USA and South America.
Compared to the previous year the number of trips lasting 2-4 nights was mostly growing (+23%) among the short foreign country travels. The motivations were: short holiday with 68%, business with 20% and visiting friends and relatives with 12%.
Demand for nature-oriented, health-oriented travels and for travels combined with active pastime has grown. During their foreign country holidays, Europeans are characterized by the motivations mentioned below (based on the research of the European Travel Monitor):
� seacoast, sunlight 32% � city visit 19% � round trip 14% � rural recreational holiday 10% � sports, games 9% � summer highland holiday 6%.
RÁDULY ISTVÁN, PARTENIE DUMBRAVĂ
102
The next trends characterize the Europeans' travels: � The full traveling expense – particularly its traffic item – in the case of
traveling from Europe or to Europe it is increasing faster, than in case of other items, since people have shorter travels more often.
� The overseas travels to Europe/from Europe are increasing more powerfully, than the intra-regional travels within Europe.
� The demand for city visits is increasing in Europe more quickly, than the claim for the seaside holidays. The reason of this is that people begin to prefer shorter travels with a cultural character, as well as the increased claim for conferences, incentive travels, vocational exhibitions, and fairs. At the same time the specific expenses of business travels are decreasing in favor of the more efficient management of costs. The proportion of the individual business travels is diminishing.
� Traveling to sunny countries (seacoast), cultural travels, cruises are getting more and more popular in the winter season. The increase rate of these is higher, than the degree of the change experienced in the case of the winter sport travels.
� Seasonality is becoming an important marketing means rather than a problem. This requires however a tighter cooperation between the private sector and the state.
� Travels from the South to the North, from the East to the West, from the West to the East are increasing more powerfully than the traditional travels from the North to the South.
� Demand for travels between countries is increasing more in Europe, than the inbound tourism of the different countries.
� The role of air transportation – also for short and long distance travels – is getting more important compared to other traffic means. Beside this, the train services still play an important role.
� In terms of individualization the proportion of the individually organized travels is increasing, the demand for group travels is moderating.
� Due to the CRS (Computer Reservation System), the late reservations are increasing, although the business travelers take advantage of this opportunity particularly.
� Senior tourism and youth tourism show a bigger increase than any other segments defined by age.
� On the whole, short visits with cultural character, cultural holidays and the claim for active summer/ winter holidays are growing at the quickest rate.
� The size of groups traveling together – among them that of families – is decreasing. This increases flexibility at the same time.
� The comparison of the price-quality ratio turns into a first-rate point of view when choosing accommodations and destinations. The quality of the environment will be determining especially for the seaside and rural regions.
CHANGES IN TOURISM CONSUMER BEHAVIOR
103
� The interest for special travels (hobby, culture, sport, etc.) – although they represent a smaller proportion on the market at the moment – is possible to achieve a fast increase in the future.
� The market segmentation is being more accurate: it is necessary to specify the claims of the various segments so that their products shall be determined. The knowledge of marketing – particularly, the marketing concerning destination – is an essential condition for market stimulation.
Nowadays in Europe – as well as in Romania – there are other tendencies
beside the above mentioned ones as it follows: � During the last few years, the appearance of low-fare airlines and the
expansion of their networks brought a huge change. Demand arouse with the low rates, attractive discounts, as a result of which the tourists – in the majority of the cases, foreign tourists – who haven’t traveled to far-away destinations until then, also may join international tourism.
� The appearance of the low-cost airlines repeatedly increased online reservations as well: passengers can manage not only air-ticket shopping, but the insurance of other services connected to it, especially the accommodation, too.
� Reservation from home, from their own computer. The mentioned phenomena increased significantly the demand for city visits on weekends or for 2-3 nights.
� One can observe a new motivation in the case of weekend short travels, especially for European inbound tourism, and that of the claim for wellness tourism, too. The appearance of this new product and its enormous success prove that the supply is expedient, cautious and with the development which takes into consideration the demand tendencies and by means of an efficient marketing, the branch of tourism is capable to influence consumer habits.
5. The Effects of Globalization upon Tourism
The globalization processes expanded the market of tourism in an extensive form in the 1990s. Beside the traditional destinations new ones appeared, which were easier to visit due to the cheaper airline tickets.
In the branch of tourism, international strategic associations came into being beside the unions as the new form of cooperation.
The new paradigm of tourism is also a consequence of globalization. According to this, the tourist policies of a country must always influence the race condition of a given country – destination – advantageously, while it is necessary to compete with the entire world. Furthermore, due to globalization the attractiveness, which is the basis from among the elements of tourism supply, is getting turns more and more important: accommodation, traffic, restaurant services all play an additional role only. The emphasis is laid on the observations and experiences which are gained by the offer.

RÁDULY ISTVÁN, PARTENIE DUMBRAVĂ
104
BIBLIOGRAPHY
Hudman L.E., (1979), Origin Regions of International Tourism, Weiner Geographische Schriften, 53/54.
Raduly I., (2009), Politica de mediu în Uniunea Europeană / Environmental Policies in the European Union, “Natura – Econ 2009”, Cluj University Press.
Smeral, E., (1998), “The Impact of Globalization on Small and Medium Enterprises: New Challenges for Tourism Policies in European Countries”. Tourism Management 19 (4): 371-380.
Zbigniew M., (1990), Word Trends in Tourism and Recreation, Peter Lang Press, New York. *** “The Research Results of the European Travel Monitor 1995-2004”, IPK
München. *** World Tourism Organization, (1997), “Tourism 2020 Vision”. *** World Tourism Organization, (2009). *** World Travel and Tourism Council Report, 2006, Romania: The Impact of Travel
and Tourism on Jobs and the Economy. *** Reports of the UNWTO 2005-2009: www.world-tourism.org/facts&figures.
STUDIA UNIVERSITATIS BABEŞ-BOLYAI, NEGOTIA, LVI, 1, 2011
THE COMPARATIVE ANALYSIS REGARDING THE SERVICES OFFERED BY THE INTERNATIONAL
HOTEL CHAINS FROM ROMANIA
CRISTINA FLEŞERIU1 ABSTRACT. The hotel services are a part from the tourism services, or can be defined as an independent offer. In the second place, the most important thing is the need of accommodation (probably also food and other additional services – conference room, recreational facilities, etc.) from those that are traveling for business or with some other personal problems. As follow, in Romania, all the hospitality business units must offer a range of additional services, with or without pay. Due to the fact that some hotels belong to an international hotel chain, mostly, this hotels offer about the same hotel services in addition to the basic service (the accommodation service). In order to attract more clients, many times the hotels offer to their clients more services then those established by the law. These services ensure the creation of a faithful clientele and attract more customers. Keywords: international hotel chains, additional services, hotel services, standard of
comfort. JEL classification: M31, L83 Introduction
The hotel chains are a superior form of intergation and are selling products that are relatively homogeneous in terms of quality. (M. Balfet, 1981:149) They exert direct control over their hotel unist that a full ownership of the chain, or indirectly through various strategies of penetration. Each hotel included in such a network is required, in addition to his own company to bear the name of the hotel chain that he belongs. (Gheorghe Postelnicu, 1998:75)
The decisions taken by a hotel company, to conduct the business into another country can be motivated by many objectives: sales extension; geographic diversification; new supply and human resources; reputation, brand or image recovery; etc. (Elisa Tse & Joseph J. West, 1992:118-134)
The purpose to the geographic diversification helps the hotel network to reduce the risk that is associated with investment activities.
1 PhD. Student, Babes-Bolyai University Cluj-Napoca, The Faculty of Economic Sciences and Business
Administration
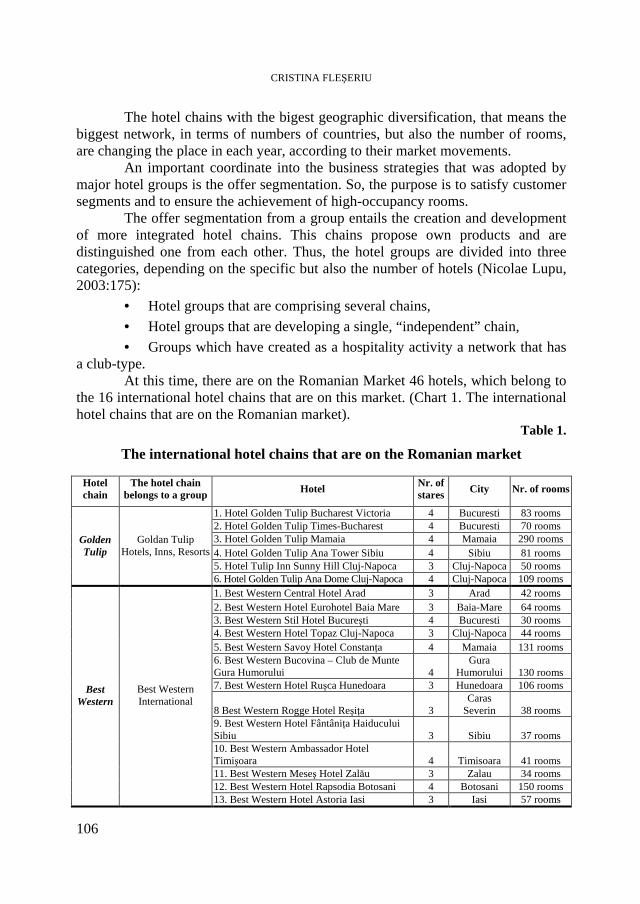
CRISTINA FLEŞERIU
106
The hotel chains with the bigest geographic diversification, that means the biggest network, in terms of numbers of countries, but also the number of rooms, are changing the place in each year, according to their market movements.
An important coordinate into the business strategies that was adopted by major hotel groups is the offer segmentation. So, the purpose is to satisfy customer segments and to ensure the achievement of high-occupancy rooms.
The offer segmentation from a group entails the creation and development of more integrated hotel chains. This chains propose own products and are distinguished one from each other. Thus, the hotel groups are divided into three categories, depending on the specific but also the number of hotels (Nicolae Lupu, 2003:175):
• Hotel groups that are comprising several chains,
• Hotel groups that are developing a single, “independent” chain,
• Groups which have created as a hospitality activity a network that has a club-type.
At this time, there are on the Romanian Market 46 hotels, which belong to the 16 international hotel chains that are on this market. (Chart 1. The international hotel chains that are on the Romanian market).
Table 1.
The international hotel chains that are on the Romanian market
Hotel chain
The hotel chain belongs to a group Hotel Nr. of
stares City Nr. of rooms
1. Hotel Golden Tulip Bucharest Victoria 4 Bucuresti 83 rooms 2. Hotel Golden Tulip Times-Bucharest 4 Bucuresti 70 rooms 3. Hotel Golden Tulip Mamaia 4 Mamaia 290 rooms 4. Hotel Golden Tulip Ana Tower Sibiu 4 Sibiu 81 rooms 5. Hotel Tulip Inn Sunny Hill Cluj-Napoca 3 Cluj-Napoca 50 rooms
Golden Tulip
Goldan Tulip Hotels, Inns, Resorts
6. Hotel Golden Tulip Ana Dome Cluj-Napoca 4 Cluj-Napoca 109 rooms 1. Best Western Central Hotel Arad 3 Arad 42 rooms 2. Best Western Hotel Eurohotel Baia Mare 3 Baia-Mare 64 rooms 3. Best Western Stil Hotel Bucureşti 4 Bucuresti 30 rooms 4. Best Western Hotel Topaz Cluj-Napoca 3 Cluj-Napoca 44 rooms 5. Best Western Savoy Hotel Constanţa 4 Mamaia 131 rooms 6. Best Western Bucovina – Club de Munte Gura Humorului 4
Gura Humorului 130 rooms
7. Best Western Hotel Ruşca Hunedoara 3 Hunedoara 106 rooms
8 Best Western Rogge Hotel Reşiţa 3 Caras
Severin 38 rooms 9. Best Western Hotel Fântâniţa Haiducului Sibiu 3 Sibiu 37 rooms 10. Best Western Ambassador Hotel Timişoara 4 Timisoara 41 rooms 11. Best Western Meseş Hotel Zalău 3 Zalau 34 rooms 12. Best Western Hotel Rapsodia Botosani 4 Botosani 150 rooms
Best Western
Best Western International
13. Best Western Hotel Astoria Iasi 3 Iasi 57 rooms
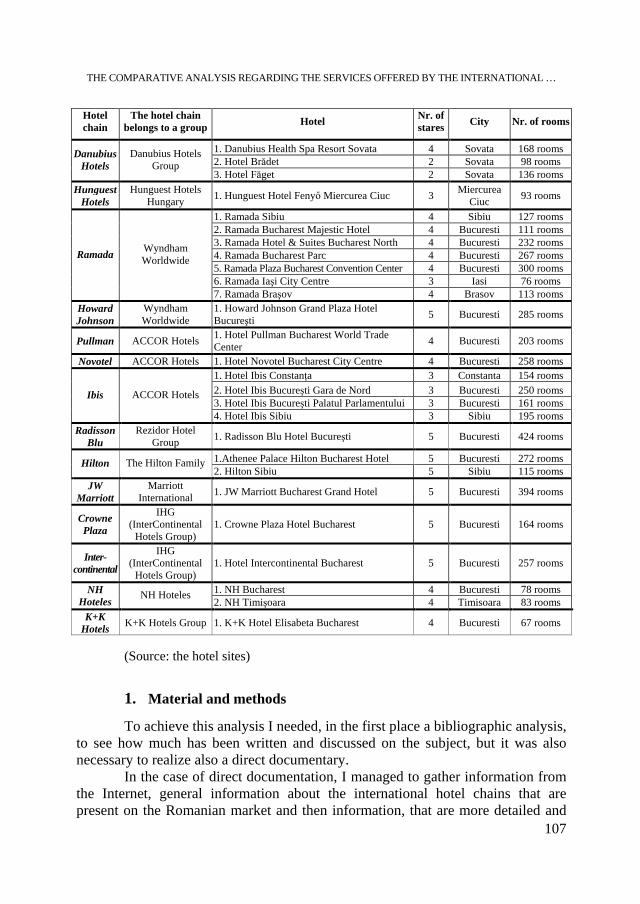
THE COMPARATIVE ANALYSIS REGARDING THE SERVICES OFFERED BY THE INTERNATIONAL …
107
Hotel chain
The hotel chain belongs to a group
Hotel Nr. of stares
City Nr. of rooms
1. Danubius Health Spa Resort Sovata 4 Sovata 168 rooms 2. Hotel Brădet 2 Sovata 98 rooms
Danubius Hotels
Danubius Hotels Group
3. Hotel Făget 2 Sovata 136 rooms
Hunguest Hotels
Hunguest Hotels Hungary
1. Hunguest Hotel Fenyő Miercurea Ciuc 3 Miercurea
Ciuc 93 rooms
1. Ramada Sibiu 4 Sibiu 127 rooms 2. Ramada Bucharest Majestic Hotel 4 Bucuresti 111 rooms 3. Ramada Hotel & Suites Bucharest North 4 Bucuresti 232 rooms 4. Ramada Bucharest Parc 4 Bucuresti 267 rooms 5. Ramada Plaza Bucharest Convention Center 4 Bucuresti 300 rooms 6. Ramada Iaşi City Centre 3 Iasi 76 rooms
Ramada Wyndham Worldwide
7. Ramada Braşov 4 Brasov 113 rooms Howard Johnson
Wyndham Worldwide
1. Howard Johnson Grand Plaza Hotel Bucureşti
5 Bucuresti 285 rooms
Pullman ACCOR Hotels 1. Hotel Pullman Bucharest World Trade Center
4 Bucuresti 203 rooms
Novotel ACCOR Hotels 1. Hotel Novotel Bucharest City Centre 4 Bucuresti 258 rooms 1. Hotel Ibis Constanţa 3 Constanta 154 rooms 2. Hotel Ibis Bucureşti Gara de Nord 3 Bucuresti 250 rooms 3. Hotel Ibis Bucureşti Palatul Parlamentului 3 Bucuresti 161 rooms
Ibis ACCOR Hotels
4. Hotel Ibis Sibiu 3 Sibiu 195 rooms Radisson
Blu Rezidor Hotel
Group 1. Radisson Blu Hotel Bucureşti 5 Bucuresti 424 rooms
1.Athenee Palace Hilton Bucharest Hotel 5 Bucuresti 272 rooms Hilton The Hilton Family 2. Hilton Sibiu 5 Sibiu 115 rooms
JW Marriott
Marriott International
1. JW Marriott Bucharest Grand Hotel 5 Bucuresti 394 rooms
Crowne Plaza
IHG (InterContinental
Hotels Group) 1. Crowne Plaza Hotel Bucharest 5 Bucuresti 164 rooms
Inter-continental
IHG (InterContinental
Hotels Group) 1. Hotel Intercontinental Bucharest 5 Bucuresti 257 rooms
1. NH Bucharest 4 Bucuresti 78 rooms NH Hoteles
NH Hoteles 2. NH Timişoara 4 Timisoara 83 rooms
K+K Hotels
K+K Hotels Group 1. K+K Hotel Elisabeta Bucharest 4 Bucuresti 67 rooms
(Source: the hotel sites)
1. Material and methods
To achieve this analysis I needed, in the first place a bibliographic analysis, to see how much has been written and discussed on the subject, but it was also necessary to realize also a direct documentary.
In the case of direct documentation, I managed to gather information from the Internet, general information about the international hotel chains that are present on the Romanian market and then information, that are more detailed and
CRISTINA FLEŞERIU
108
specific, about the additional services used by these hotels for their clients. Trough this analysis I was able to gather necessary information, about some international hotel chains that are present on the Romanian market and which are the services that this offer on the markets, were they are present.
The analysis is based on three international hotel chains, the biggest chains that are present on the Romanian market. The chains that I chose are Golden Tulip, Best Western and Ramada. I did choose his hotel chains because these are the one with the biggest number of hotels.
As hypothesis for this analysis I started with this idea: H1: The hotels in generally and especially the hotels that belong to an
international hotel chain and are present on the Romanian market offer a lot of additional services, more than those that are written into the law.
Starting with this hypothesis and form the data that I managed to gather and then to analyze them I reached several conclusions.
2. Results and discussions
The hotel services are a part from the tourism services, or can be defined as an independent offer. In the second place, the most important thing is the need of accommodation (probably also food and other additional services – conference room, recreational facilities, etc.) from those that are traveling for business or with some other personal problems. (Adriana Zaiţ, 2004:184)
The hotels can be differentiated trough the services and the facilities that this one offer. Thus, the hotels can be: hotels with full services, economic hotels and self-catering hotels. The hotels with full services have a large range of services for the clients, in addition to accommodation, like food and beverage, room-service, laundry services, facilities for business, etc. The economic hotels tend to offer to the clients cheap and modest rooms, with limited food and beverage services. The self-catering hotels don’t offer other services, just the accommodation services. (Sue Baker, Pam Bradley, Jeremy Huyton, 2007:9)
Also, the variety of hotel services, influence and determine the way a hotel will be classified. Thus, in many countries, the law is limited to impose a minimum range of services. The luxury hotels are the only one, which provide a relatively large variety of binding services. Often, it’s about “services-manpower”, that make the difference between luxury hotels plus the “equipment-services”, that are generally in almost every hotel.
In Romania, all the units with hotel activity must offer additional services, with or without pay, as followed (Nicolae Lupu, 2003:111)2:
2 Annex to the Order of the Minister for SMEs, Trade, Tourism and Liberal Professions no. 636/2008
THE COMPARATIVE ANALYSIS REGARDING THE SERVICES OFFERED BY THE INTERNATIONAL …
109
• Units with 4*-5* - at least 18 services;
• Units with 3* - at least 15 services;
• Units with 2* - at least 10 services;
• Units with 1* - at least 5 services.
But to attract more clients, often the hotels offer more services than those established by law. These services ensure the creation of a faithful clientele and attract more new customers.
2.1. The hotel services offered by international hotel chains on the
Romanian market
From the 16 hotel chains that are present on the Romanian market I chose three (those that have the most hotels in our country): Golden Tulip (6 hotels), Best Western (13 hotels) and Ramada (7 hotels); with which I will try to show, if they use more additional hotel services than those established by law, to have a faithful clientele and to attract more new customers.
Because those hotels belong to an international hotel chain, will offer about the same hotel services in addition to basic service (the accommodation).
Anyway, the 4* and 3* hotels must offer from the beginning at least a number of well established services (for 3* minimum 15 services and 4* minimum 18 services). But in addition, the hotels are offering also other additional services, to create more value to the hotel, more comfort and a bigger offers variety, which aim to attract more customers and to retain those already existing.
2.1.1. Golden Tulip Golden Tulip offers a unique franchise concept, that implements the international
standards by keeping the local specific, under the brand „Golden Tulip” for the 4* hotels business and resort and the brand „Tulip Inn” for the 3* category.
In Romania, at this moment, are 6 hotels that belong to the international hotel chain Golden Tulip. From those, 5 belong to the brand Golden Tulip, and one hotel is Tulip Inn. If we are talking about the geographic place, there are 2 hotels in Bucharest (Hotel Golden Tulip Bucharest- Victoria, Hotel Golden Tulip Times-Bucharest), one hotel in Mamaia (Hotel Golden Tulip Mamaia), one hotel in Sibiu (Hotel Golden Tulip Ana Tower Sibiu) and 2 in Cluj-Napoca (Hotel Tulip Inn Sunny Hill Cluj-Napoca and Hotel Golden Tulip Ana Dome Cluj-Napoca). In terms of number of stars, from this six Golden Tulip hotels, five are 4* and just one is a 3* hotel (Hotel Tulip Inn Sunny Hill Cluj-Napoca).
So, it’ easy to observ, that belonging to the same hotel chain, the hotel are offering, on a side the same hotel services, but on the other side there are points which distinguish them. (Annex 1. Hotel services offerd by international hotel chain Golden Tulip in Romania)
CRISTINA FLEŞERIU
110
The 4* hotels that belong to the international hotel chain Golden Tulip are offering almost the same services.
At the beginning from the Annex 1 are listed some of the mandatory criteria that 4* hotels must meet, to have a certain standard of comfort. But, next to these services, the hotels offer also additional services (around 1-3 additional services; for example: parking place with guard, rent-a-car, etc.). Into the second part from Annex 1 are presented additional criteria, which the hotels can use to improve their comfort standard.
So, it can be observed, that the Hotel Golden Tulip Bucharest Victoria offers as additional services: the parking place with guard, facilities for organizing business meetings, rent-a-car. The Hotel Golden Tulip Times offers as additional services: the parking place with guard and facilities for organizing business meetings. In the case of the hotels Hotel Golden Tulip Mamaia, Hotel Golden Tulip Ana Tower Sibiu and Hotel Tulip Inn Sunny Hill Cluj-Napoca, those offer as additional service facilities for organizing business meetings. The Hotel Golden Tulip Ana Dome Cluj-Napoca offers also additional services as: parking place with guard and facilities for organizing business meetings.
Also, there is another aspect that differentiates the hotels between them. Even all of them have the own restaurant and bar, but also conference rooms, the number of those are different from one hotel to another. So, the hotels that belong to the hotel chain Golden Tulip have between 1-2 restaurants, 1-3 bars and 2-5 conference rooms. In the case of conference rooms, these are different regarding the hotel, but also the room capacity.
2.1.2. Best Western In Romania, Best Western is a real presence, powerful and dynamic, with a
prestige that was confirmed by the success that the affiliation hotels have. These hotels are operating independent or there are private properties.
With elegance and memorable personality, the hotels subscribe to the same values and have an impeccable team, which brings performance, is dedicated to this work and assumes quality.
The Best Western hotel chain implementation and development in Romania is coordinated only by the company CONCEPT Consult & Prospect SRL.
The hotel group Best Western is operating in Romania trough 13 hotels: Central Hotel Arad, Stil Hotel Bucureşti, Hotel Eurohotel Baia Mare, Hotel Topaz Cluj-Napoca, Savoy Hotel Constanţa, Bucovina-Club de Munte Gura Humorului, Hotel Ruşca Hunedoara, Rogge Hotel Reşiţa, Hotel Fântâniţa Haiducului Sibiu, Ambassodor Hotel Timişoara, Meseş Hotel Zalău, Hotel Rapsodia Botoşani and Hotel Astoria Iaşi; from those eight hotels have 3* and the rest are 4* hotels (five hotels).
THE COMPARATIVE ANALYSIS REGARDING THE SERVICES OFFERED BY THE INTERNATIONAL …
111
The hotels that belong to the international hotel chain Best Western meet the comfort conditions, being included some mandatory services. Next to these, the Best Western hotels are also using other services to have more value.
If we are talking about the hotels that belong to the international hotel chain Best Western, we can not takl about unitary hotels, because this hotel chain was for a long time a voluntary one. So, the hotels have retained some personal ways of dealing with the market. (Annex 2. Hotel services offerd by international hotel chain Best Western in Romania)
Even so, the 4* Best Western hotels have also around 2-4 additional services, offered next to the binding services (for example: parking place with guard and facilities for organizing business meetings, rent-a-car, etc.).
It’s easy to observe that some hotels offer more additional services compared with others, but the services are about the same:
• Best Western Stil Hotel Bucureşti – parking place with guard, safe to the reception, facilities for organizing business meetings;
• Best Western Savoy Hotel Constanţa – parking place with guard, facilities for organizing business meetings;
• Best Western Bucovina – Club de Munte Gura Humorului - parking place with guard, facilities for organizing business meetings, safe to the reception;
• Best Western Ambassador Hotel Timişoara – parking place with guard, facilities for organizing business meetings, safe to the reception;
• Best Western Hotel Rapsodia Botoşani – parking place with guard, facilities for organizing business meetings, safe to the reception, rent-a-car.
The 4* hotels are offering a different number of own restaurants but also a different number of conference rooms. So, the number of restaurant is between 1 and 2 and the number for conference rooms is between 1 and 5.
In the case of Best Western 3* hotels, we can observe that next to the binding services, there are also additional services offered by these hotels. There are round 5-10 additional services offered by these hotels:
• Best Western Central Hotel Arad – parking place with guard, safe in the room, own restaurant, bar, facilities for organizing business meetings, leisure services, etc.;
• Best Western Hotel Eurohotel Baia Mare – restaurant propriu, bar, facilities for organizing business meetings, leisure services, room-service, etc;
• Best Western Hotel Topaz Cluj-Napoca – parking place with guard, own restaurant, bar, facilities for organizing business meetings, room-service, etc.;
• Best Western Hotel Ruşca Hunedoara – parking place with guard, own restaurant, facilities for organizing business meetings, etc.;
CRISTINA FLEŞERIU
112
• Best Western Rogge Hotel Reşiţa – parking place with guard, safe in the room, own restaurant, bar, facilities for organizing business meetings, leisure services, room-service, etc;
• Best Western Hotel Fântâniţa Haiducului Sibiu – safe in the room, own restaurant, bar, facilities for organizing business meetings, leisure services, etc.;
• Best Western Meseş Hotel Zalău – safe in the room, own restaurant, bar, facilities for organizing business meetings, room-service, etc.;
• Best Western Hotel Astoria Iaşi - parking place with guard, own restaurant, bar, facilities for organizing business meetings, rent-a-car, room-service, etc.
The additional services are different as number and depend according to the city where hotel is located. So, if the city is a big one or with more tourists, the additional services are more compared with the smaller cities, were the requirement are not so big.
The Best Western 3* hotels have between 1 and 2 own restaurants and the number of conference rooms id between 1 and 4.
2.1.3. Ramada In Romania, the brand Ramada is represented by Trend Hospitality,
company that is acting as a strategic developer in Romania, Bulgaria and Moldova. This company has the exclusivity to give, on the Romanian market, the franchise the following brands from the Wyndham portfolio: Ramada, Super 8 Motel and Days Inn.
Ramada has at this moment seven operational units: Ramada Bucharest Majestic Hotel, Ramada Hotel & Suites Bucharest North, Ramada Bucharest Parc and Ramada Plaza Bucharest Convention Center, in Bucharest, Ramada Sibiu, Ramada Iaşi City Centre and Ramada Braşov. Each unit has his own management and the penetration strategy used to entre on the Romanian market is the franchise. From this seven hotels, six are 4* hotels and 1 is a 3* hotel. (Annex 3. Hotel services offered by international hotel chain Ramada in Romania)
The 4* hotels that belong to the international hotel chain Ramada are offering next to the binding services other additional services, around 2-4 (for example: rent-a-car, facilities for organizing business meetings, etc.).
The Ramada 4* hotels are offering the following additional services:
• parking place with guard - Ramada Bucharest Majestic Hotel, Ramada Hotel & Suites Bucharest North, Ramada Bucharest Parc, Ramada Plaza Bucharest Convention Center, Ramada Sibiu, Ramada Braşov;
• safe to the reception – Ramada Sibiu;
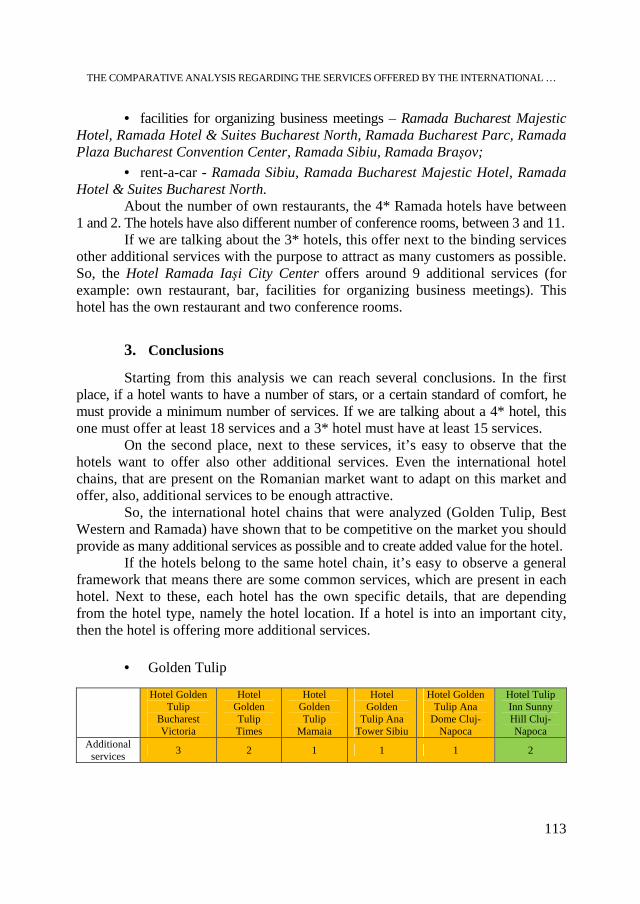
THE COMPARATIVE ANALYSIS REGARDING THE SERVICES OFFERED BY THE INTERNATIONAL …
113
• facilities for organizing business meetings – Ramada Bucharest Majestic Hotel, Ramada Hotel & Suites Bucharest North, Ramada Bucharest Parc, Ramada Plaza Bucharest Convention Center, Ramada Sibiu, Ramada Braşov;
• rent-a-car - Ramada Sibiu, Ramada Bucharest Majestic Hotel, Ramada Hotel & Suites Bucharest North.
About the number of own restaurants, the 4* Ramada hotels have between 1 and 2. The hotels have also different number of conference rooms, between 3 and 11.
If we are talking about the 3* hotels, this offer next to the binding services other additional services with the purpose to attract as many customers as possible. So, the Hotel Ramada Iaşi City Center offers around 9 additional services (for example: own restaurant, bar, facilities for organizing business meetings). This hotel has the own restaurant and two conference rooms.
3. Conclusions
Starting from this analysis we can reach several conclusions. In the first place, if a hotel wants to have a number of stars, or a certain standard of comfort, he must provide a minimum number of services. If we are talking about a 4* hotel, this one must offer at least 18 services and a 3* hotel must have at least 15 services.
On the second place, next to these services, it’s easy to observe that the hotels want to offer also other additional services. Even the international hotel chains, that are present on the Romanian market want to adapt on this market and offer, also, additional services to be enough attractive.
So, the international hotel chains that were analyzed (Golden Tulip, Best Western and Ramada) have shown that to be competitive on the market you should provide as many additional services as possible and to create added value for the hotel.
If the hotels belong to the same hotel chain, it’s easy to observe a general framework that means there are some common services, which are present in each hotel. Next to these, each hotel has the own specific details, that are depending from the hotel type, namely the hotel location. If a hotel is into an important city, then the hotel is offering more additional services.
• Golden Tulip
Hotel Golden Tulip
Bucharest Victoria
Hotel Golden Tulip Times
Hotel Golden Tulip
Mamaia
Hotel Golden
Tulip Ana Tower Sibiu
Hotel Golden Tulip Ana
Dome Cluj-Napoca
Hotel Tulip Inn Sunny Hill Cluj-Napoca
Additional services
3 2 1 1 1 2

CRISTINA FLEŞERIU
114
The 4* hotels, but also the 3* hotels are offering additional services, but the 3* hotels are offering more services compared with the 4* hotels that have already included more binding services.
• Best Western � 4* hotels
Best Western
Stil Hotel Bucureşti
Best Western Savoy Hotel Constanţa
Best Western Bucovina – Club de Munte Gura
Humorului
Best Western Ambassador
Hotel Timişoara
Best Western Hotel
Rapsodia Botoşani
Additional services
3 2 3 3 4
� 3* hotels
Best W Central Hotel Arad
Best W Hotel
Eurohotel Baia Mare
Best W Hotel Topaz Cluj-N
Best W Hotel Ruşca Hune doara
Best W Rogge Hotel Reşiţa
Best W Hotel
Fântâniţa Haiduculu
i Sibiu
Best W Meseş Hotel Zalău
Best W Astoria
Iaşi
Additional services 9 7 10 5 11 7 8 8
The hotels that belong to the international hotel chain Best Western are
offering next to the binding services also other additional services. Also, it’s easy to observe that the 3* hotels are offering more services then the 4* hotels.
• Ramada
Ramada
Sibiu
Ramada Bucharest Majestic
Hotel
Ramada Hotel & Suites
Bucharest North
Ramada Bucharest
Parc
Ramada Plaza
Bucharest Convention
Center
Ramada Braşov
Ramada Iaşi City Center
Additional services
4 3 3 2 2 2 9
The hotels belonging to the international hotel chain Ramada are following
the same rule; in addition to the mandatory services these are offering other additional services additional services for their customers. Also, in this case, it’s easy to observe that the 4* hotels are offering less additional services compared with 3* hotels.
If we want to compare the hotels that offer the same comfort standard, we can see that there are little differences between the chains. So, the 4* hotels that belong to the hotel chain Golden Tulip are offering less additional services compared with the other two hotel chains: Best Western and Ramada. But if we are
THE COMPARATIVE ANALYSIS REGARDING THE SERVICES OFFERED BY THE INTERNATIONAL …
115
talking about the hotel that have 3*, in this case the hotel that belongs to the hotel chain is offering the most services and Best Western is offering the fewest.
We can see, that all the hotels, regardless of the number of stares, the hotel's location or other factors, are offering additional services to get more opportunities for the clients.
REFERENCES
Baker, S.; Bradley, P.; Huyton, J. (2007), Principiile operaţiunilor de la recepţia hotelului, Ediţia a II-a, Editura C.H. Beck, Bucureşti
Balfet, M. (1981), Gestion et performance d’exploitation. Le cas des chaines hotelieres integrees, Universite des Sciences Sociales, Toulouse
Lupu, N. (2003), Strategia de concentrare a întreprinderilor de turism, Editura Economică, Bucureşti
Lupu, N. (2003), Hotelul – Economie şi management; Ediţia a IV-a, Editura All Beck, Bucureşti
Postelnicu, G. (1998), Turism internaţional, Realităţi şi perspective, Editura Casa cărţii de ştiinţă, Cluj-Napoca
Tse, E. & West, Joseph J. (1992), Development Strategies for International Hospitality Markets, New York, John Wiley and Sons
*** Anexa la normele metodologice prvind clasificarea strcturilor de primire turistice care este anexa la Ordinul ministrului pentru înreprinderi mici şi mijlocii, comerţ, turism şi profesii liberale nr. 636/2008
http://www.hotelsmag.com/file/7392-Top_50_Hotel_Companies_By_Number_Of_Hotels.pdf http://www.goldentuliptimes.com/ http://www.tulipinnsunnyhill.com/ http://www.tulipinnbucharestcity.com/ http://www.goldentulipmamaia.com/ http://www.goldentulipanatowersibiu.com/ http://www.goldentulipanadome.com/ http://www.goldentulipbucharest.com/ http://www.bestwesternhotels.ro/rom-findahotel.html http://www.bestwesterneurohotel.ro/ http://www.bestwesternrapsodia.ro/ http://www.hotelstil.ro/ http://www.bestwesterntopaz.ro/ http://www.bestwesternbucovina.ro/ http://www.bestwesternrusca.ro/
CRISTINA FLEŞERIU
116
http://www.hotelrogge.ro/ http://www.fantanitahaiducului.ro/ http://www.bestwesternmeses.ro/ http://www.ramadasibiu.ro/ http://www.majestic.ro/ http://www.parch.ro/ http://www.ramadanorth.ro/ http://www.ramadaplazabucharest.ro/ http://www.ramadaiasi.ro/ http://www.ramadabrasov.ro/
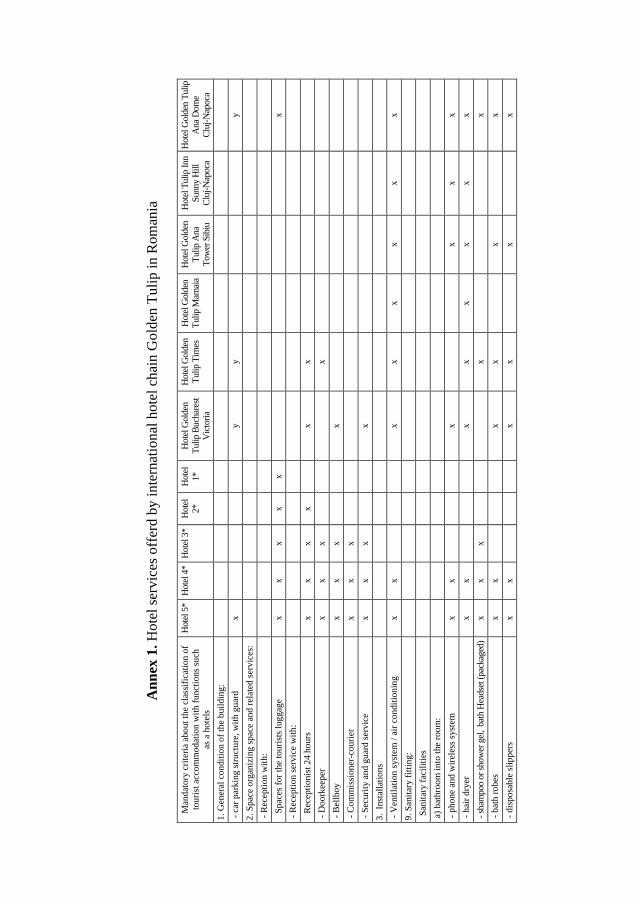
Ann
ex 1
. Ho
tel s
ervi
ces
offe
rd b
y in
tern
atio
nal
ho
tel c
hai
n
Go
lden
Tu
lip in
Rom
ania
Man
dat
ory
crit
eria
abo
ut th
e cl
assi
ficat
ion
of
tou
rist a
cco
mm
od
atio
n w
ith fu
nctio
ns s
uch
as
a h
otel
s
Hot
el 5
* H
otel
4*
Hot
el 3
* H
otel
2*
H
otel
1*
H
otel
Gol
den
Tul
ip B
ucha
rest
V
icto
ria
Hot
el G
olde
n T
ulip
Tim
es
Hot
el G
olde
n T
ulip
Mam
aia
Hot
el G
olde
n T
ulip
Ana
T
ower
Sib
iu
Hot
el T
ulip
Inn
Sun
ny H
ill
Clu
j-Nap
oca
Hot
el G
olde
n T
ulip
A
na D
ome
C
luj-N
apoc
a
1. G
ener
al c
ondi
tion
of t
he
bui
ldin
g:
- c
ar p
arki
ng s
tru
ctu
re, w
ith g
uar
d
x
y
y
y
2. S
pac
e o
rgan
izin
g s
pac
e an
d r
elat
ed s
ervi
ces:
- R
ecep
tion
with
:
S
pac
es fo
r th
e to
uris
ts lu
gg
age
x x
x x
x
x
- R
ecep
tion
ser
vice
with
:
R
ecep
tion
ist 2
4 h
our
s x
x x
x
x x
- D
oo
rkee
per
x
x x
x
- B
ellb
oy
x x
x
x
- C
om
mis
sion
er-c
ouri
er
x x
x
- S
ecu
rity
and
gu
ard
ser
vice
x
x x
x
3. In
stal
latio
ns
- V
entil
atio
n s
yste
m /
air
con
ditio
nin
g
x x
x
x x
x x
x
9. S
anita
ry fi
ttin
g:
San
itary
faci
litie
s
a)
bat
hro
om
into
the
roo
m:
- p
hone
and
wire
less
sys
tem
x
x
x
x
x x
- h
air
dry
er
x x
x
x x
x x
x
- sh
ampo
o or
sho
wer
gel
, bath
Hea
dset
(pac
kage
d) x
x x
x
x
- b
ath
ro
bes
x x
x
x
x
x
- d
ispo
sab
le s
lipp
ers
x x
x
x
x
x
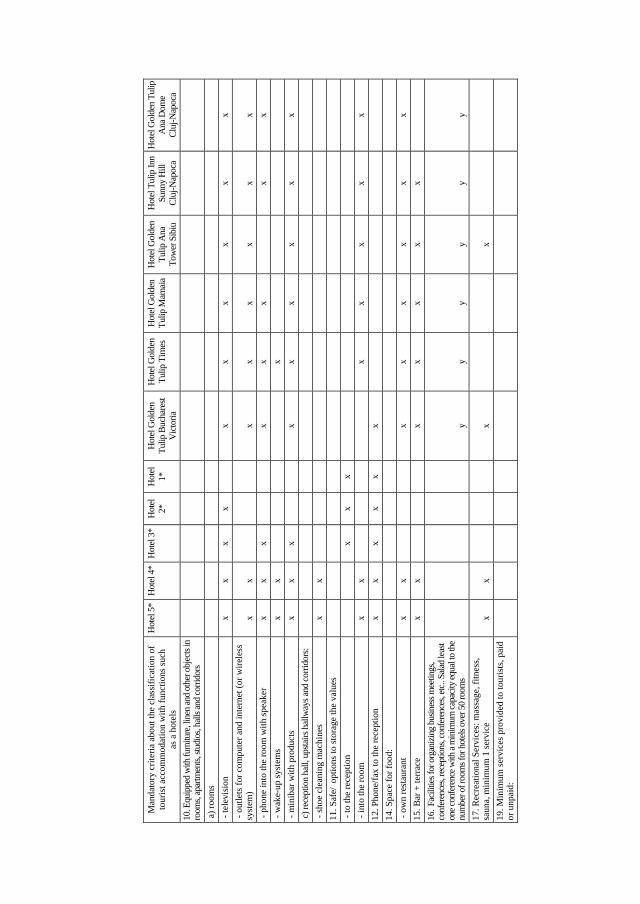
Man
dat
ory
crit
eria
abo
ut th
e cl
assi
ficat
ion
of
tou
rist a
cco
mm
od
atio
n w
ith fu
nctio
ns s
uch
as
a h
otel
s
Hot
el 5
* H
otel
4*
Hot
el 3
* H
otel
2*
H
otel
1*
H
otel
Gol
den
Tul
ip B
ucha
rest
V
icto
ria
Hot
el G
olde
n T
ulip
Tim
es
Hot
el G
olde
n T
ulip
Mam
aia
Hot
el G
olde
n T
ulip
Ana
T
ower
Sib
iu
Hot
el T
ulip
Inn
Sun
ny H
ill
Clu
j-Nap
oca
Hot
el G
olde
n T
ulip
A
na D
ome
C
luj-N
apoc
a
10. E
quip
ped
with
furn
iture
, lin
en a
nd o
ther
obj
ect
s in
ro
oms,
apa
rtmen
ts, s
tudi
os, h
alls
and
cor
ridor
s
a)
roo
ms
- te
levi
sio
n
x x
x x
x
x x
x x
x
- o
utle
ts fo
r co
mp
ute
r an
d in
tern
et (
or
wire
less
sy
stem
) x
x
x x
x x
x x
- p
hone
into
the
room
with
sp
eake
r x
x x
x x
x
x x
- w
ake-
up s
yste
ms
x x
x
- m
inib
ar w
ith p
rodu
cts
x x
x
x
x x
x x
x
c) r
ecep
tion
hall,
ups
tairs
hal
lway
s an
d co
rrid
ors
:
- s
hoe
clea
nin
g m
ach
ines
x
x
11
. Saf
e/ op
tions
to s
tora
ge th
e va
lues
- to
the
rece
ptio
n
x x
x
- in
to th
e ro
om
x
x
x
x x
x x
12
. Ph
one/
fax
to th
e re
cept
ion
x
x x
x x
x
14
. Sp
ace
for
foo
d:
- o
wn
res
tau
rant
x
x
x x
x x
x x
15
. Bar
+ te
rrac
e x
x
x x
x x
x
16. F
acilit
ies
for o
rgan
izin
g bu
sine
ss m
eetin
gs,
conf
eren
ces,
rece
ptio
ns, c
onfe
renc
es, e
tc..
Sal
ad l
east
on
e co
nfer
ence
with
a m
inim
um c
apac
ity e
qual
to th
e
num
ber o
f roo
ms
for h
otel
s ov
er 5
0 ro
oms
y y
y y
y y
17
. Rec
reat
ion
al S
ervi
ces:
mas
sag
e, fi
tnes
s,
saun
a, m
inim
um
1 s
ervi
ce
x x
x
x
19
. Min
imu
m s
ervi
ces
pro
vid
ed to
tou
rists
, pai
d
or
unp
aid:
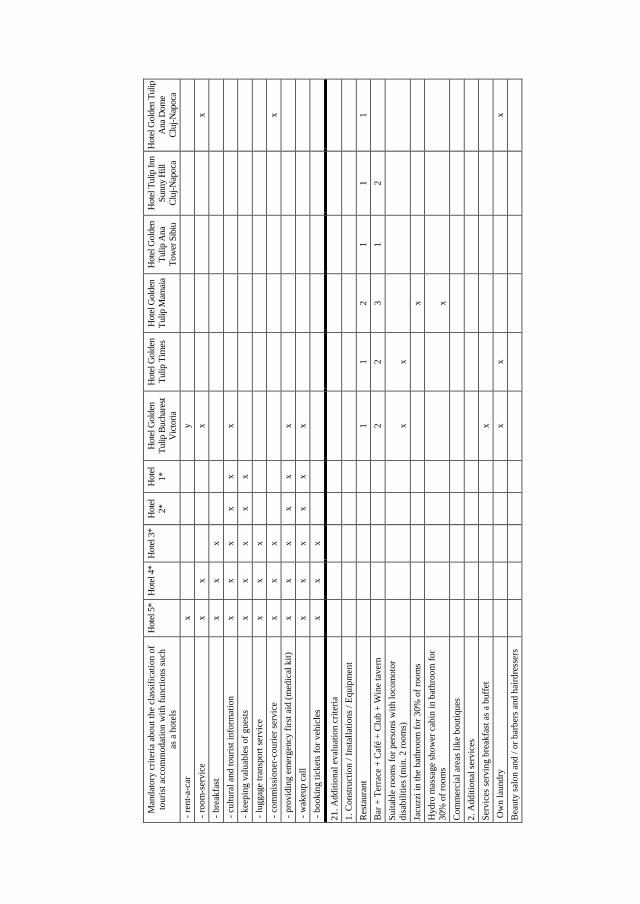
Man
dat
ory
crit
eria
abo
ut th
e cl
assi
ficat
ion
of
tou
rist a
cco
mm
od
atio
n w
ith fu
nctio
ns s
uch
as
a h
otel
s
Hot
el 5
* H
otel
4*
Hot
el 3
* H
otel
2*
H
otel
1*
H
otel
Gol
den
Tul
ip B
ucha
rest
V
icto
ria
Hot
el G
olde
n T
ulip
Tim
es
Hot
el G
olde
n T
ulip
Mam
aia
Hot
el G
olde
n T
ulip
Ana
T
ower
Sib
iu
Hot
el T
ulip
Inn
Sun
ny H
ill
Clu
j-Nap
oca
Hot
el G
olde
n T
ulip
A
na D
ome
C
luj-N
apoc
a
- r
ent-
a-ca
r x
y
- r
oo
m-s
ervi
ce
x x
x
x
- b
reak
fast
x
x x
- c
ultu
ral a
nd to
uris
t in
form
atio
n
x x
x x
x x
- k
eep
ing
val
uab
les
of g
ues
ts
x x
x x
x
- lu
gga
ge tr
ansp
ort
ser
vice
x
x x
- c
om
mis
sion
er-c
ourie
r se
rvic
e x
x x
x
- p
rovi
ding
em
erg
ency
firs
t aid
(m
edic
al k
it)
x x
x x
x x
- w
akeu
p c
all
x x
x x
x x
- b
ooki
ng
tick
ets
for
veh
icle
s x
x x
21
. Add
itio
nal
eva
luat
ion
crit
eria
1. C
onst
ruct
ion
/ In
stal
latio
ns /
Equ
ipm
ent
Res
taur
ant
1
1
2
1
1
1
Bar
+ T
erra
ce +
Caf
é +
Clu
b +
Win
e ta
vern
2
2
3
1
2
Su
itab
le r
oom
s fo
r p
erso
ns w
ith lo
com
oto
r d
isab
ilitie
s (m
in. 2
roo
ms)
x x
Jacu
zzi i
n th
e b
ath
room
for
30
% o
f roo
ms
x
Hyd
ro m
assa
ge s
ho
wer
cab
in in
bat
hro
om
fo
r 3
0%
of r
oom
s
x
Co
mm
erci
al a
reas
like
bou
tiqu
es
2. A
ddi
tion
al s
ervi
ces
Ser
vice
s se
rvin
g b
reak
fast
as
a bu
ffet
x
Ow
n la
und
ry
x
x
x
Bea
uty
salo
n a
nd /
or b
arb
ers
and
hai
rdre
sser
s
Man
dat
ory
crit
eria
abo
ut th
e cl
assi
ficat
ion
of
tou
rist a
cco
mm
od
atio
n w
ith fu
nctio
ns s
uch
as
a h
otel
s
Hot
el 5
* H
otel
4*
Hot
el 3
* H
otel
2*
H
otel
1*
H
otel
Gol
den
Tul
ip B
ucha
rest
V
icto
ria
Hot
el G
olde
n T
ulip
Tim
es
Hot
el G
olde
n T
ulip
Mam
aia
Hot
el G
olde
n T
ulip
Ana
T
ower
Sib
iu
Hot
el T
ulip
Inn
Sun
ny H
ill
Clu
j-Nap
oca
Hot
el G
olde
n T
ulip
A
na D
ome
C
luj-N
apoc
a
To
wel
war
mer
, m
akeu
p m
irro
r, p
eopl
e sc
ale,
ir
onin
g m
ach
ine,
bat
hro
be (
if th
ey m
eet t
hre
e cr
iteria
, are
gra
nte
d)
x
x x
Ren
t-a-
car
– a
gen
cy s
ervi
ces
x
Mag
azin
es a
nd n
ewsp
aper
s, fr
ee, o
f th
e h
all f
or
all t
ouris
ts
x
x
Sal
e or
sup
ply
of h
ygie
ne it
ems:
toot
hbru
sh,
toot
hpas
te, d
ispo
sabl
e ra
zor,
shav
ing
crea
m, n
ail
file,
bat
h sl
ippe
rs (i
f fou
r crit
eria
are
met
, is
giv
en)
Cof
fee,
inst
ant c
offe
e, te
a, s
ugar
sac
hets
in a
ll r
oom
s
x
x
Tic
kets
that
can
be
book
at t
he
rece
ptio
n
(sho
w, t
hea
ter,
mo
vie)
x
Car
for
tran
sfer
s
3. L
eisu
re a
nd fi
tnes
s fa
cilit
ies
Indo
or
poo
l
x
Sw
imm
ing
Po
ol
Ste
am b
ath
Sau
na
x
Rel
axat
ion
loun
ge
(with
dec
k ch
airs
)
So
lar
x
Bo
wlin
g
Ten
nis
cou
rt
Sp
orts
Tea
cher
Mas
sag
e S
ervi
ces
x
Gym
(fitn
ess,
bod
y bu
ildin
g, le
ss th
an 4
dev
ices
)
x
Bab
y si
tter
Man
dat
ory
crit
eria
abo
ut th
e cl
assi
ficat
ion
of
tou
rist a
cco
mm
od
atio
n w
ith fu
nctio
ns s
uch
as
a h
otel
s
Hot
el 5
* H
otel
4*
Hot
el 3
* H
otel
2*
H
otel
1*
H
otel
Gol
den
Tul
ip B
ucha
rest
V
icto
ria
Hot
el G
olde
n T
ulip
Tim
es
Hot
el G
olde
n T
ulip
Mam
aia
Hot
el G
olde
n T
ulip
Ana
T
ower
Sib
iu
Hot
el T
ulip
Inn
Sun
ny H
ill
Clu
j-Nap
oca
Hot
el G
olde
n T
ulip
A
na D
ome
C
luj-N
apoc
a
Ch
ildre
n's
pla
y ar
eas
(ind
oor
or
out
doo
r)
x
Tab
le T
enn
is
Bill
iard
4. P
ossi
bili
ties
of o
rgan
izin
g r
ecep
tions
, co
nfe
ren
ces,
ban
quet
s, b
usi
ness
cen
ters
Sal
on fo
r rec
eptio
ns, b
anqu
ets,
for a
t lea
st 1
00 p
eop
le
x
x
Roo
ms
for c
onfe
renc
es, b
usin
ess
cent
ers,
by
size
mo
re
3
3
2
5
2
- u
ntil
100
sq
m
x x
x x
x
- u
ntil
250
sq
m
x
x
- u
ntil
500
sq
m
Lap
top
hir
e
So
und
Inst
alla
tion
s
x x
Pro
ject
ion
scr
een
x
x x
Wal
l Dis
pla
y
Ove
rhea
d
Mul
timed
ia P
roje
cto
r
x x
TV
un
its, a
t lea
st 6
6 c
m d
iago
nal
LC
D’s
x
Co
mp
lete
sys
tem
(e
mitt
ers,
rec
eive
rs, c
abin
s)
for
sim
ulta
neo
us
tran
slat
ion
Ph
one/
fax
x
x
Ph
oto
cop
ying
use
d in
to th
e m
eetin
g s
pace
s
x
Wir
ed o
r w
irele
ss In
tern
et c
onn
ectio
n in
the
con
fere
nce
roo
ms
x
x x
x
(Sou
rce:
the
hot
el s
ites)
Ann
ex 2
. Ho
tel s
ervi
ces
offe
rd b
y in
tern
atio
nal
ho
tel c
hai
n B
est W
este
rn in
Ro
man
ia
Man
dat
ory
crit
eria
abo
ut th
e cl
assi
ficat
ion
of t
ouris
t ac
com
mo
dat
ion
with
fu
nctio
ns s
uch
as
a ho
tels
Hotel 5*
Hotel 4*
Hotel 3*
Hotel 2*
Hotel 1*
Best Western Central Hotel Arad
Best Western Hotel Eurohotel Baia Mare
Best Western Stil Hotel Bucureşti
Best Western Hotel Topaz Cluj-Napoca
Best Western Savoy Hotel Constanţa
Best Western Bucovina – Club de
Munte Gura Humorului
Best Western Hotel Ruşca Hunedoara
Best Western Rogge Hotel Reşiţa
Best Western Hotel Fântâniţa Haiducului
Sibiu
Best Western Ambassador Hotel
Timişoara
Best Western Meseş Hotel Zalău
Best Western Hotel Rapsodia Botosani
Best Western Hotel Astoria Iasi
1. G
ener
al c
ondi
tion
of th
e bu
ildin
g:
- c
ar p
arki
ng s
tru
ctu
re, w
ith g
uar
d
x
y
y y
y y
y y
y
y
y
2. S
pac
e o
rgan
izin
g s
pac
e an
d
rela
ted
ser
vice
s:
- R
ecep
tion
with
:
S
pac
es fo
r th
e to
uris
ts lu
gg
age
x x
x x
x x
x
x x
- R
ecep
tion
ser
vice
with
:
R
ecep
tion
ist 2
4 h
our
s x
x x
x
x
x
x
- D
oo
rkee
per
x
x x
x
x
- B
ellb
oy
x x
x
- C
om
mis
sion
er-c
ouri
er
x x
x
- S
ecu
rity
and
gu
ard
ser
vice
x
x x
x
3. I
nsta
llatio
ns
- V
entil
atio
n sy
stem
/ ai
r con
ditio
ning
x
x
y y
x
y x
y
y
x y
9. S
anita
ry fi
ttin
g:
San
itary
faci
litie
s
a)
bat
hro
om
into
the
roo
m:
Man
dat
ory
crit
eria
abo
ut th
e cl
assi
ficat
ion
of t
ouris
t ac
com
mo
dat
ion
with
fu
nctio
ns s
uch
as
a ho
tels
Hotel 5*
Hotel 4*
Hotel 3*
Hotel 2*
Hotel 1*
Best Western Central Hotel Arad
Best Western Hotel Eurohotel Baia Mare
Best Western Stil Hotel Bucureşti
Best Western Hotel Topaz Cluj-Napoca
Best Western Savoy Hotel Constanţa
Best Western Bucovina – Club de
Munte Gura Humorului
Best Western Hotel Ruşca Hunedoara
Best Western Rogge Hotel Reşiţa
Best Western Hotel Fântâniţa Haiducului
Sibiu
Best Western Ambassador Hotel
Timişoara
Best Western Meseş Hotel Zalău
Best Western Hotel Rapsodia Botosani
Best Western Hotel Astoria Iasi
- p
hone
and
wire
less
sys
tem
x
x
x
- h
air
dry
er
x x
y
x
y x
x
y
x y
y
- sh
ampo
o or
sho
wer
gel
, bat
h H
eads
et
(pac
kage
d)
x x
x
x
- b
ath
ro
bes
x x
- d
ispo
sab
le s
lipp
ers
x x
10. E
quip
ped
with
furn
iture
, lin
en a
nd
othe
r obj
ects
in ro
oms,
apa
rtmen
ts,
stud
ios,
hal
ls a
nd c
orrid
ors
a)
roo
ms
- te
levi
sio
n
x x
x x
x
x x
x x
x x
x x
x x
x x
- o
utle
ts fo
r co
mp
ute
r an
d in
tern
et
(or
wire
less
sys
tem
) x
x
y y
x y
x x
y y
y x
y x
y
- p
hone
into
the
room
with
sp
eake
r
x x
x
x
x x
x x
x
x x
x x
x x
- w
ake-
up s
yste
ms
x x
y
y
y y
x
x
- m
inib
ar w
ith p
rodu
cts
x x
x
x
x x
x x
x x
x x
x x
x x
c)
rece
ptio
n h
all,
upst
airs
hal
lway
s an
d c
orr
ido
rs:
- s
hoe
clea
nin
g m
ach
ines
x
x
11. S
afe/
opt
ions
to s
tora
ge th
e va
lues
- to
the
rece
ptio
n
x x
x x
y
y
y
y x
Man
dat
ory
crit
eria
abo
ut th
e cl
assi
ficat
ion
of t
ouris
t ac
com
mo
dat
ion
with
fu
nctio
ns s
uch
as
a ho
tels
Hotel 5*
Hotel 4*
Hotel 3*
Hotel 2*
Hotel 1*
Best Western Central Hotel Arad
Best Western Hotel Eurohotel Baia Mare
Best Western Stil Hotel Bucureşti
Best Western Hotel Topaz Cluj-Napoca
Best Western Savoy Hotel Constanţa
Best Western Bucovina – Club de
Munte Gura Humorului
Best Western Hotel Ruşca Hunedoara
Best Western Rogge Hotel Reşiţa
Best Western Hotel Fântâniţa Haiducului
Sibiu
Best Western Ambassador Hotel
Timişoara
Best Western Meseş Hotel Zalău
Best Western Hotel Rapsodia Botosani
Best Western Hotel Astoria Iasi
- in
to th
e ro
om
x
x
y
y
y x
y x
12
. Ph
one/
fax
to th
e re
cept
ion
x
x x
x x
x x
x
x
x
14
. Sp
ace
for
foo
d:
- o
wn
res
tau
rant
x
x
y y
x y
x x
y y
y x
y x
y
15
. Bar
+ te
rrac
e x
x
y y
y
x x
y
y
y x
y
16. F
acili
ties
for o
rgan
izin
g bu
sine
ss
mee
tings
, con
fere
nces
, rec
eptio
ns,
con
fere
nce
s, e
tc..
Sal
ad le
ast o
ne
conf
eren
ce w
ith a
min
imum
cap
acity
eq
ual
to th
e nu
mb
er o
f ro
om
s fo
r h
otel
s ov
er 5
0 r
oo
ms
y y
y y
y y
y y
y y
y y
y
17
. Rec
reat
ion
al S
ervi
ces:
mas
sag
e,
fitn
ess,
sau
na,
min
imu
m 1
ser
vice
x
x
y y
x x
y y
x
19
. Min
imu
m s
ervi
ces
pro
vid
ed to
to
uris
ts, p
aid
or
unp
aid
:
- r
ent-
a-ca
r x
y
y
- r
oo
m-s
ervi
ce
x x
y
y
y
x y
x y
- b
reak
fast
x
x x
- c
ultu
ral a
nd to
uris
t in
form
atio
n
x x
x x
x x
x
x
- k
eep
ing
val
uab
les
of g
ues
ts
x x
x x
x
- lu
gga
ge tr
ansp
ort
ser
vice
x
x x
Man
dat
ory
crit
eria
abo
ut th
e cl
assi
ficat
ion
of t
ouris
t ac
com
mo
dat
ion
with
fu
nctio
ns s
uch
as
a ho
tels
Hotel 5*
Hotel 4*
Hotel 3*
Hotel 2*
Hotel 1*
Best Western Central Hotel Arad
Best Western Hotel Eurohotel Baia Mare
Best Western Stil Hotel Bucureşti
Best Western Hotel Topaz Cluj-Napoca
Best Western Savoy Hotel Constanţa
Best Western Bucovina – Club de
Munte Gura Humorului
Best Western Hotel Ruşca Hunedoara
Best Western Rogge Hotel Reşiţa
Best Western Hotel Fântâniţa Haiducului
Sibiu
Best Western Ambassador Hotel
Timişoara
Best Western Meseş Hotel Zalău
Best Western Hotel Rapsodia Botosani
Best Western Hotel Astoria Iasi
- c
om
mis
sion
er-c
ourie
r se
rvic
e x
x x
x
- p
rovi
ding
em
erg
ency
firs
t aid
(m
edic
al k
it)
x x
x x
x
x
x
- w
akeu
p c
all
x x
x x
x
x x
- b
ooki
ng
tick
ets
for
veh
icle
s x
x x
x
21
. Add
itio
nal
eva
luat
ion
crit
eria
1. C
onst
ruct
ion
/ In
stal
latio
ns /
Eq
uip
men
t
Res
taur
ant
1
1
1
4
1
2
1
1
2
1
1
1
1
Bar
+ T
erra
ce +
Caf
é +
Clu
b +
W
ine
tave
rn
1
1
1
3
1
2
5
1
1
1
Sui
tabl
e ro
oms
for p
erso
ns w
ith
loco
mot
or d
isab
ilitie
s (m
in. 2
room
s)
x
x
Jacu
zzi i
n th
e b
ath
room
for
30
% o
f ro
om
s
x
x
x x
x
Hyd
ro m
assa
ge s
ho
wer
cab
in in
b
ath
roo
m fo
r 3
0%
of r
oo
ms
x x
x
Co
mm
erci
al a
reas
like
bou
tiqu
es
2. A
ddi
tion
al s
ervi
ces
Ser
vice
s se
rvin
g br
eakf
ast a
s a
buffe
t
x
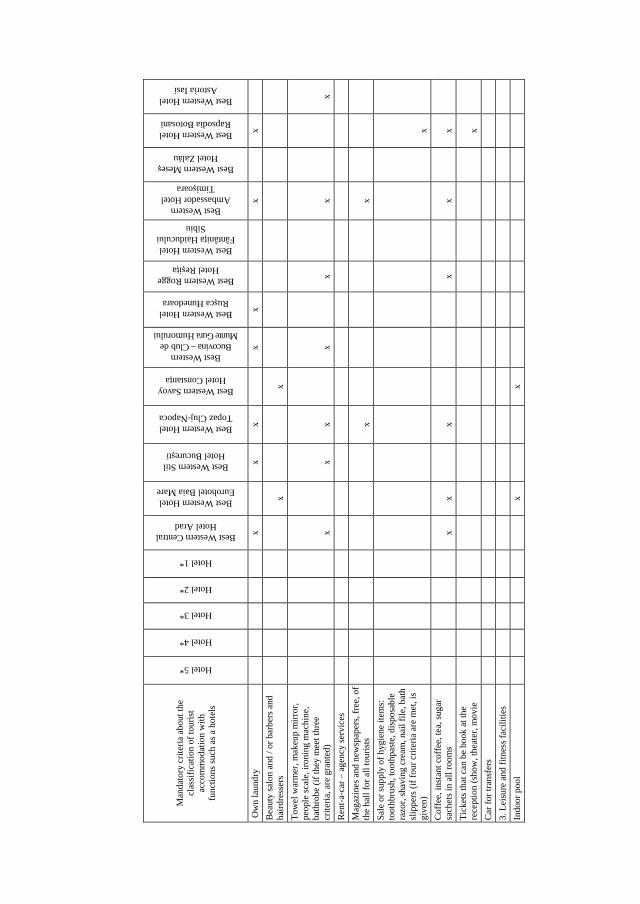
Man
dat
ory
crit
eria
abo
ut th
e cl
assi
ficat
ion
of t
ouris
t ac
com
mo
dat
ion
with
fu
nctio
ns s
uch
as
a ho
tels
Hotel 5*
Hotel 4*
Hotel 3*
Hotel 2*
Hotel 1*
Best Western Central Hotel Arad
Best Western Hotel Eurohotel Baia Mare
Best Western Stil Hotel Bucureşti
Best Western Hotel Topaz Cluj-Napoca
Best Western Savoy Hotel Constanţa
Best Western Bucovina – Club de
Munte Gura Humorului
Best Western Hotel Ruşca Hunedoara
Best Western Rogge Hotel Reşiţa
Best Western Hotel Fântâniţa Haiducului
Sibiu
Best Western Ambassador Hotel
Timişoara
Best Western Meseş Hotel Zalău
Best Western Hotel Rapsodia Botosani
Best Western Hotel Astoria Iasi
Ow
n la
und
ry
x
x
x
x x
x
x
Bea
uty
salo
n a
nd /
or b
arb
ers
and
h
aird
ress
ers
x
x
To
wel
war
mer
, m
akeu
p m
irro
r,
peo
ple
scal
e, ir
oni
ng
mac
hin
e,
bat
hro
be
(if th
ey m
eet t
hre
e cr
iteria
, are
gra
nte
d)
x
x
x
x
x
x
x
Ren
t-a-
car
– a
gen
cy s
ervi
ces
Mag
azin
es a
nd n
ewsp
aper
s, fr
ee, o
f th
e h
all f
or
all t
ouris
ts
x
x
Sal
e o
r su
ppl
y o
f hyg
iene
item
s:
toot
hbru
sh, t
ooth
past
e, d
ispo
sab
le
razo
r, s
havi
ng c
ream
, n
ail f
ile, b
ath
sl
ipp
ers
(if fo
ur
crite
ria a
re m
et, i
s g
iven
)
x
Co
ffee,
inst
ant c
offe
e, te
a, s
uga
r sa
chet
s in
all
roo
ms
x
x
x
x
x
x
Tic
kets
that
can
be
book
at t
he
rece
ptio
n (
sho
w, t
hea
ter,
mo
vie
x
Car
for
tran
sfer
s
3. L
eisu
re a
nd fi
tnes
s fa
cilit
ies
Indo
or
poo
l
x
x
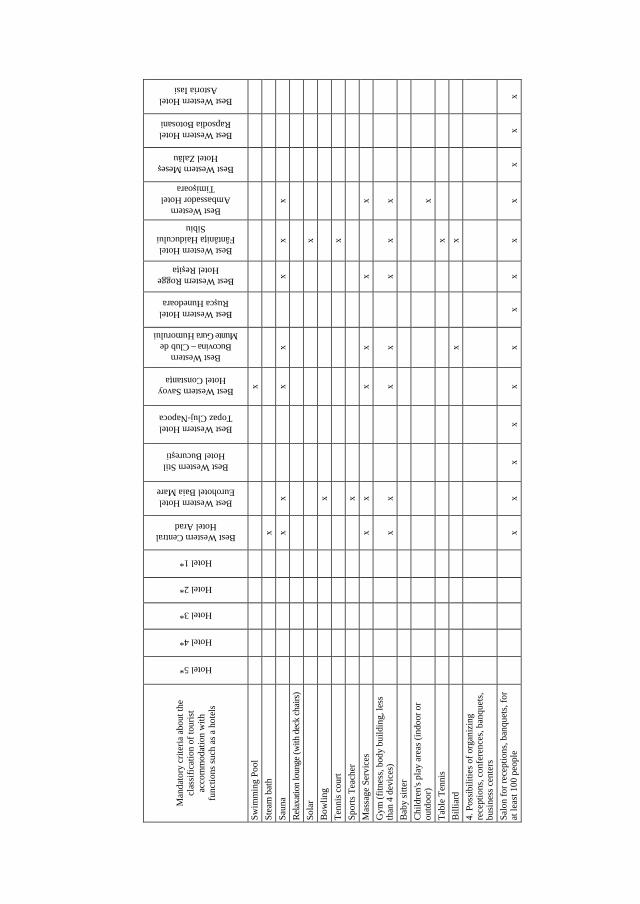
Man
dat
ory
crit
eria
abo
ut th
e cl
assi
ficat
ion
of t
ouris
t ac
com
mo
dat
ion
with
fu
nctio
ns s
uch
as
a ho
tels
Hotel 5*
Hotel 4*
Hotel 3*
Hotel 2*
Hotel 1*
Best Western Central Hotel Arad
Best Western Hotel Eurohotel Baia Mare
Best Western Stil Hotel Bucureşti
Best Western Hotel Topaz Cluj-Napoca
Best Western Savoy Hotel Constanţa
Best Western Bucovina – Club de
Munte Gura Humorului
Best Western Hotel Ruşca Hunedoara
Best Western Rogge Hotel Reşiţa
Best Western Hotel Fântâniţa Haiducului
Sibiu
Best Western Ambassador Hotel
Timişoara
Best Western Meseş Hotel Zalău
Best Western Hotel Rapsodia Botosani
Best Western Hotel Astoria Iasi
Sw
imm
ing
Po
ol
x
Ste
am b
ath
x
Sau
na
x
x
x
x
x x
x
Rel
axat
ion
loun
ge (w
ith d
eck
chai
rs)
So
lar
x
Bo
wlin
g
x
Ten
nis
cou
rt
x
Sp
orts
Tea
cher
x
Mas
sag
e S
ervi
ces
x
x
x
x
x
x
Gym
(fit
nes
s, b
ody
bu
ildin
g, l
ess
than
4 d
evic
es)
x
x
x
x
x x
x
Bab
y si
tter
Ch
ildre
n's
pla
y ar
eas
(ind
oor
or
out
doo
r)
x
Tab
le T
enn
is
x
Bill
iard
x
x
4. P
ossi
bili
ties
of o
rgan
izin
g
rece
ptio
ns, c
onfe
ren
ces,
ban
que
ts,
bus
ines
s ce
nte
rs
Sal
on
for
rece
ptio
ns,
ban
quet
s, fo
r at
leas
t 100
peo
ple
x x
x x
x x
x x
x x
x x
x

Man
dat
ory
crit
eria
abo
ut th
e cl
assi
ficat
ion
of t
ouris
t ac
com
mo
dat
ion
with
fu
nctio
ns s
uch
as
a ho
tels
Hotel 5*
Hotel 4*
Hotel 3*
Hotel 2*
Hotel 1*
Best Western Central Hotel Arad
Best Western Hotel Eurohotel Baia Mare
Best Western Stil Hotel Bucureşti
Best Western Hotel Topaz Cluj-Napoca
Best Western Savoy Hotel Constanţa
Best Western Bucovina – Club de
Munte Gura Humorului
Best Western Hotel Ruşca Hunedoara
Best Western Rogge Hotel Reşiţa
Best Western Hotel Fântâniţa Haiducului
Sibiu
Best Western Ambassador Hotel
Timişoara
Best Western Meseş Hotel Zalău
Best Western Hotel Rapsodia Botosani
Best Western Hotel Astoria Iasi
Roo
ms
for
con
fere
nce
s, b
usi
nes
s ce
nter
s, b
y si
ze
2
2
1
4
3
5
1
1
3
2
1
2
2
- u
ntil
100
sq
m
x
x x
x x
x x
x x
x
x x
- u
ntil
250
sq
m
x
x x
- u
ntil
500
sq
m
x
Lap
top
hir
e
So
und
Inst
alla
tion
s
x
x
x x
x x
Pro
ject
ion
scr
een
x
x
x
x
Wal
l Dis
pla
y
Ove
rhea
d
x
x
Mul
timed
ia P
roje
cto
r
x
x
x
x x
x x
TV u
nits
, at l
east
66
cm d
iago
nal L
CD
’s
Com
plet
e sy
stem
(em
itter
s, re
ceiv
ers,
ca
bins
) for
sim
ulta
neou
s tra
nsla
tion
x
Ph
one/
fax
x x
x
Pho
toco
pyin
g u
sed
into
the
mee
ting
spac
es
x x
x
Wir
ed o
r w
irele
ss In
tern
et
con
nec
tion
in th
e co
nfer
ence
ro
om
s
x x
x x
x
(Sou
rce:
the
hote
l site
s)
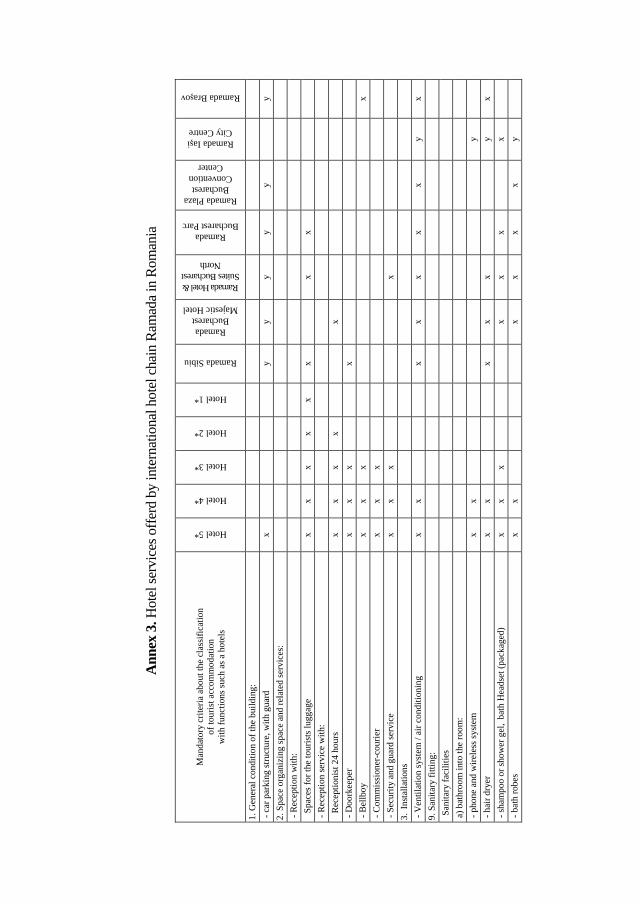
Ann
ex 3
. Hot
el s
ervi
ces
offe
rd b
y in
tern
atio
nal h
otel
cha
in R
amad
a in
Rom
ania
Man
dat
ory
crit
eria
abo
ut th
e cl
assi
ficat
ion
o
f tou
rist a
cco
mm
od
atio
n
with
fun
ctio
ns
such
as
a ho
tels
Hotel 5*
Hotel 4*
Hotel 3*
Hotel 2*
Hotel 1*
Ramada Sibiu
Ramada Bucharest
Majestic Hotel
Ramada Hotel & Suites Bucharest
North
Ramada Bucharest Parc
Ramada Plaza Bucharest
Convention Center
Ramada Iaşi City Centre
Ramada Braşov
1. G
ener
al c
ondi
tion
of t
he
bui
ldin
g:
- c
ar p
arki
ng s
tru
ctu
re, w
ith g
uar
d
x
y
y y
y
y
y
2. S
pac
e o
rgan
izin
g s
pac
e an
d r
elat
ed s
ervi
ces:
- R
ecep
tion
with
:
S
pac
es fo
r th
e to
uris
ts lu
gg
age
x x
x x
x x
x
x
- R
ecep
tion
ser
vice
with
:
R
ecep
tion
ist 2
4 h
our
s x
x x
x
x
- D
oo
rkee
per
x
x x
x
- B
ellb
oy
x x
x
x
- C
om
mis
sion
er-c
ouri
er
x x
x
- S
ecu
rity
and
gu
ard
ser
vice
x
x x
x
3. In
stal
latio
ns
- V
entil
atio
n s
yste
m /
air
con
ditio
nin
g
x x
x
x x
x x
y x
9. S
anita
ry fi
ttin
g:
San
itary
faci
litie
s
a)
bat
hro
om
into
the
roo
m:
- p
hone
and
wire
less
sys
tem
x
x
y
- h
air
dry
er
x x
x
x x
y x
- s
ham
poo
or
sho
wer
gel
, bat
h H
eads
et (
pack
aged
) x
x x
x
x x
x
- b
ath
ro
bes
x x
x x
x x
y
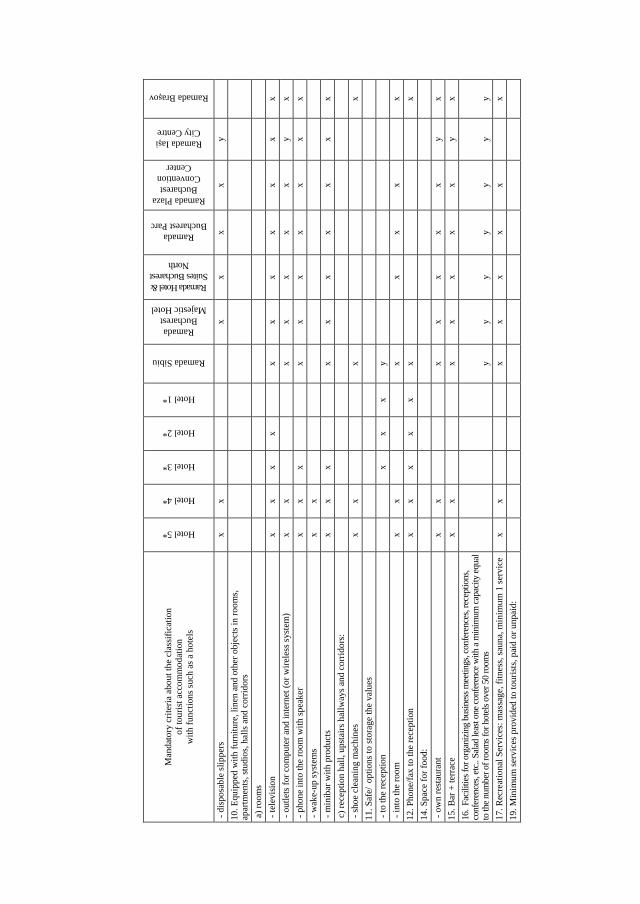
Man
dat
ory
crit
eria
abo
ut th
e cl
assi
ficat
ion
o
f tou
rist a
cco
mm
od
atio
n
with
fun
ctio
ns
such
as
a ho
tels
Hotel 5*
Hotel 4*
Hotel 3*
Hotel 2*
Hotel 1*
Ramada Sibiu
Ramada Bucharest
Majestic Hotel
Ramada Hotel & Suites Bucharest
North
Ramada Bucharest Parc
Ramada Plaza Bucharest
Convention Center
Ramada Iaşi City Centre
Ramada Braşov
- d
ispo
sab
le s
lipp
ers
x x
x x
x x
y
10
. Equ
ipp
ed w
ith fu
rnitu
re, l
inen
and
oth
er o
bje
cts
in r
oo
ms,
ap
artm
ents
, stu
dio
s, h
alls
an
d c
orr
ido
rs
a)
roo
ms
- te
levi
sio
n
x x
x x
x
x x
x x
x x
- o
utle
ts fo
r co
mp
ute
r an
d in
tern
et (
or
wire
less
sys
tem
) x
x
x x
x x
x y
x
- p
hone
into
the
room
with
sp
eake
r x
x x
x x
x x
x
x x
- w
ake-
up s
yste
ms
x x
- m
inib
ar w
ith p
rodu
cts
x x
x
x
x x
x x
x x
c)
rece
ptio
n h
all,
upst
airs
hal
lway
s an
d c
orri
dors
:
- s
hoe
clea
nin
g m
ach
ines
x
x
x
x
11
. Saf
e/ op
tions
to s
tora
ge th
e va
lues
- to
the
rece
ptio
n
x x
x y
- in
to th
e ro
om
x
x
x
x x
x
x
12
. Ph
one/
fax
to th
e re
cept
ion
x
x x
x x
x
x
14
. Sp
ace
for
foo
d:
- o
wn
res
tau
rant
x
x
x x
x x
x y
x
15
. Bar
+ te
rrac
e x
x
x x
x x
x y
x
16. F
acili
ties
for o
rgan
izin
g bu
sine
ss m
eetin
gs, c
onfe
ren
ces,
rece
ptio
ns,
conf
eren
ces,
etc
.. S
alad
leas
t one
con
fere
nce
with
a
min
imum
cap
acity
equ
al
to th
e nu
mbe
r of r
oom
s fo
r hot
els
over
50
room
s
y
y y
y y
y y
17
. Rec
reat
ion
al S
ervi
ces:
mas
sag
e, fi
tnes
s, s
aun
a, m
inim
um
1 s
ervi
ce
x x
x
x x
x x
x
19
. Min
imu
m s
ervi
ces
pro
vid
ed to
tou
rists
, pai
d o
r un
paid
:
Man
dat
ory
crit
eria
abo
ut th
e cl
assi
ficat
ion
o
f tou
rist a
cco
mm
od
atio
n
with
fun
ctio
ns
such
as
a ho
tels
Hotel 5*
Hotel 4*
Hotel 3*
Hotel 2*
Hotel 1*
Ramada Sibiu
Ramada Bucharest
Majestic Hotel
Ramada Hotel & Suites Bucharest
North
Ramada Bucharest Parc
Ramada Plaza Bucharest
Convention Center
Ramada Iaşi City Centre
Ramada Braşov
- r
ent-
a-ca
r x
y y
y
- r
oo
m-s
ervi
ce
x x
x
x x
x x
x
- b
reak
fast
x
x x
- c
ultu
ral a
nd to
uris
t in
form
atio
n
x x
x x
x
x
- k
eep
ing
val
uab
les
of g
ues
ts
x x
x x
x
- lu
gga
ge tr
ansp
ort
ser
vice
x
x x
x
- c
om
mis
sion
er-c
ourie
r se
rvic
e x
x x
x
x
- p
rovi
ding
em
erg
ency
firs
t aid
(m
edic
al k
it)
x x
x x
x
x
- w
akeu
p c
all
x x
x x
x x
- b
ooki
ng
tick
ets
for
veh
icle
s x
x x
x
21
. Add
itio
nal
eva
luat
ion
crit
eria
1. C
onst
ruct
ion
/ In
stal
latio
ns /
Equ
ipm
ent
Res
taur
ant
1
1
1
2
2
1
1
Bar
+ T
erra
ce +
Caf
é +
Clu
b +
Win
e ta
vern
2
1
2
1
1
3
1
Su
itab
le r
oom
s fo
r p
erso
ns w
ith lo
com
oto
r d
isab
ilit
ies
(min
. 2 r
oom
s)
x
x
x x
Jacu
zzi i
n th
e b
ath
room
for
30
% o
f roo
ms
x
x
Hyd
ro m
assa
ge s
ho
wer
cab
in in
bat
hro
om
fo
r 30
% o
f roo
ms
Co
mm
erci
al a
reas
like
bou
tiqu
es
2. A
ddi
tion
al s
ervi
ces
Ser
vice
s se
rvin
g b
reak
fast
as
a bu
ffet
Ow
n la
und
ry
x
x x
x x
x x
Bea
uty
salo
n a
nd /
or b
arb
ers
and
hai
rdre
sser
s
x x
Man
dat
ory
crit
eria
abo
ut th
e cl
assi
ficat
ion
o
f tou
rist a
cco
mm
od
atio
n
with
fun
ctio
ns
such
as
a ho
tels
Hotel 5*
Hotel 4*
Hotel 3*
Hotel 2*
Hotel 1*
Ramada Sibiu
Ramada Bucharest
Majestic Hotel
Ramada Hotel & Suites Bucharest
North
Ramada Bucharest Parc
Ramada Plaza Bucharest
Convention Center
Ramada Iaşi City Centre
Ramada Braşov
To
wel
war
mer
, m
akeu
p m
irro
r, p
eopl
e sc
ale,
iron
ing
m
ach
ine,
b
ath
rob
e (if
they
mee
t th
ree
crite
ria, a
re g
ran
ted)
x
x x
x x
x
Ren
t-a-
car
– a
gen
cy s
ervi
ces
x
Mag
azin
es a
nd n
ewsp
aper
s, fr
ee, o
f th
e h
all f
or
all
tou
rists
Sal
e or
sup
ply
of h
ygie
ne it
ems:
toot
hbru
sh, t
ooth
pas
te, d
ispo
sabl
e ra
zor,
shav
ing
crea
m, n
ail f
ile, b
ath
slip
pers
(if f
our c
rite
ria a
re m
et, i
s gi
ven)
Co
ffee,
inst
ant c
offe
e, te
a, s
uga
r sa
chet
s in
all
roo
ms
x x
x x
x
Tic
kets
that
can
be
book
at t
he
rece
ptio
n (
sho
w, t
hea
ter,
mo
vie
Car
for
tran
sfer
s
x
x
x
x
3. L
eisu
re a
nd fi
tnes
s fa
cilit
ies
Indo
or
poo
l
x
x
Sw
imm
ing
Po
ol
Ste
am b
ath
x
Sau
na
x
x x
x x
x
Rel
axat
ion
loun
ge
(with
dec
k ch
airs
)
x
So
lar
x
Bo
wlin
g
Ten
nis
cou
rt
x x
Sp
orts
Tea
cher
x
Mas
sag
e S
ervi
ces
x
x
x x
Gym
(fit
nes
s, b
ody
bu
ildin
g, l
ess
than
4 d
evic
es)
x
x x
x x
x
Bab
y si
tter
x
Ch
ildre
n's
pla
y ar
eas
(ind
oor
or
out
doo
r)
x
Man
dat
ory
crit
eria
abo
ut th
e cl
assi
ficat
ion
o
f tou
rist a
cco
mm
od
atio
n
with
fun
ctio
ns
such
as
a ho
tels
Hotel 5*
Hotel 4*
Hotel 3*
Hotel 2*
Hotel 1*
Ramada Sibiu
Ramada Bucharest
Majestic Hotel
Ramada Hotel & Suites Bucharest
North
Ramada Bucharest Parc
Ramada Plaza Bucharest
Convention Center
Ramada Iaşi City Centre
Ramada Braşov
Tab
le T
enn
is
Bill
iard
4. P
ossi
bili
ties
of o
rgan
izin
g r
ecep
tions
, con
fere
nce
s, b
anqu
ets,
b
usin
ess
cen
ters
Sal
on
for
rece
ptio
ns,
ban
quet
s, fo
r at
leas
t 100
pe
ople
x x
x x
x x
x
Roo
ms
for
con
fere
nce
s, b
usi
nes
s ce
nter
s, b
y si
ze
3
6
1
1
7
2
5
3
- u
ntil
100
sq
m
x
x
x x
x x
- u
ntil
250
sq
m
x
x
x
x x
- u
ntil
500
sq
m
x
x
x
Lap
top
hir
e
x x
x
x
So
und
Inst
alla
tion
s
x x
x
x
x
Pro
ject
ion
scr
een
x
x
Wal
l Dis
pla
y
Ove
rhea
d
x
Mul
timed
ia P
roje
cto
r
x x
x
x
TV
un
its, a
t lea
st 6
6 c
m d
iago
nal
LC
D’s
x x
x x
Com
plet
e sy
stem
(em
itter
s, re
ceiv
ers,
cab
ins)
for s
imul
tane
ous
trans
latio
n
x x
x
x
Ph
one/
fax
x
x
Ph
oto
cop
ying
use
d in
to th
e m
eetin
g s
pace
s
x
x
Wir
ed o
r w
irele
ss In
tern
et c
onn
ectio
n in
the
con
fer
ence
roo
ms
x
x x
x x
x x
(S
ourc
e: th
e ho
tel s
ites)