role overload, leader facilitation, workgroup support ...
122
The copyright © of this thesis belongs to its rightful author and/or other copyright owner. Copies can be accessed and downloaded for non-commercial or learning purposes without any charge and permission. The thesis cannot be reproduced or quoted as a whole without the permission from its rightful owner. No alteration or changes in format is allowed without permission from its rightful owner.
-
Upload
khangminh22 -
Category
Documents
-
view
0 -
download
0
Transcript of role overload, leader facilitation, workgroup support ...

The copyright © of this thesis belongs to its rightful author and/or other copyright
owner. Copies can be accessed and downloaded for non-commercial or learning
purposes without any charge and permission. The thesis cannot be reproduced or
quoted as a whole without the permission from its rightful owner. No alteration or
changes in format is allowed without permission from its rightful owner.

ROLE OVERLOAD, LEADER FACILITATION, WORKGROUP SUPPORT, EMPLOYEE RECOGNITION AND TURNOVER
INTENTION AMONG LECTURERS IN PRIVATE UNIVERSITY COLLEGES IN NEGERI SEMBILAN.
DARISHINEE D/O BALASINGAM
MASTER OF HUMAN RESOURCE MANAGEMENT UNIVERSITI UTARA MALAYSIA
MARCH 2017

ROLE OVERLOAD, LEADER FACILITATION, WORKGROUP SUPPORT, EMPLOYEE RECOGNITION AND TURNOVER INTENTION AMONG
LECTURERS IN PRIVATE UNIVERSITY COLLEGES IN NEGERI SEMBILAN.
BY DARISHINEE D/O BALASINGAM
Thesis submitted to Othman Yeop Abdullah Graduate School of Business,
Universiti Utara Malaysia, In Partial Fulfillment of the Requirements for the Master of Human Resource
Management.
.


i
PERMISSION TO USE
In presenting this thesis in fulfillment of the requirements for a Post Graduate Degree from the Universiti Utara Malaysia (UUM), I agree that the Library of this university may make it freely available for inspection. I further agree that permission for copying this thesis in any manner, in whole or in part, for scholarly purposes may be granted by my supervisor(s) or in their absence, by the Dean of Othman Yeop Abdullah Graduate School of Business where I did my thesis. It is understood that any copying or publication or use of this thesis or parts of it for financial gain shall not be allowed without my written permission. It is also understood that due recognition shall be given to me and to the UUM in any scholarly use which may be made of any material in my thesis. Request for permission to copy or to make other use of materials in this thesis in whole or in part should be addressed to:
Dean of Othman Yeop Abdullah Graduate School of Business Universiti Utara Malaysia
06010 UUM Sintok Kedah Darul Aman

ii
ABSTRACT
Retaining talented lectures in Private Higher Education Institutions (PHEI) become an alarming issue for the PHEI’s managements. Lectures face many difficulties in private higher education institutions compare to public higher education institutions. Some scholars have come up with several factors that could provide the impact on turnover intention. However, studies on the impact of role overload, leader facilitation, workgroup support and employee recognition towards turnover intention specifically among PHEIs’ lectures were very limited. The objective of this study is to identify the role overload, leader facilitation, workgroup support and employee recognition that affect turnover intention among PHEIs lectures in Negeri Sembilan. Research data were obtained from two PHEIs in Negeri Sembilan; Inti International University Nilai and KTG Education Group in Mantin. Total five hypotheses were developed in this study. The quantitative research design used to collect the data. Information was collected through questionnaires and was analyzed by using Statistical Package for Social Science (SPSS) version 16.0. Total 152 respondents were involved in this study. Cross sectional research method has been used to synthesis less biased and more accurate result. This research applied descriptive statistics, reliability analysis and inferential analysis to determine the relationship among the variables. Based on the correlation analysis, it has found that role overload and turnover intention shows a positive relationship (r = .725**, p ≤ 0.01). Meanwhile, leader facilitation (r = -.669**, p ≤ 0.01), workgroup support (r = -.750**, p ≤ 0.01) and employee recognition (r = -.801**, p ≤ 0.01) shows negative relationship. The coefficient of determination value (R2 = 0.709) and indicated that role overload, leader facilitation, workgroup support and employee recognition have contributed 70% to the lecturers’ turnover intention in PHEI in Negeri Sembilan. Based on multiple regression analysis result, it has found that employee recognition (β -.420, p ≤0.00) has the most significant relationship and reported as high contributor for employee turnover intention. Meanwhile, the second highest contributing factor is role overload (β .232, p ≤0.04 ) and following by workgroup support (β -. 195, p ≤0.17). The factor that least contributed for employee turnover intention among (PHEI) in Negeri Sembilan is leader facilitation (β -.086, p ≤0.246). This research study has come up with appropriate suggestions for the (PHEI) management and insights for future researchers and for better researches. This research had fulfilled the objectives set earlier by the researcher. Keywords: Turnover intention, role overload, leader facilitation, workgroup support, employee recognition, lecturer and Private Higher Education Institution (PHEI).

iii
ABSTRAK
Mengekalkan pesyarah berbakat di Institut Pengajian Tinggi Swasta (IPTS) menjadi isu yang membimbangkan kepada pihak pengurusan IPTS. Pesyarah menghadapi banyak kesukaran di Institusi Pengajian Tinggi Swasta (IPTS) berbanding dengan Institusi Pengajian Tinggi Awam (IPTA). Sebahagian ahli falsafah telah membincangkan beberapa factor yang boleh memberi kesan ke atas kadar pusing ganti pekerja. Namun, kajian ini mengkaji mengenai bebanan kerja, fasilitasi pemimpin, sokongan kumpulan pekerja dan pengiktirafan pekerja terhadap kadar pusingan ganti pekerja khususnya di kalangan pensyarah swasta adalah terhad. Objektif kajian ini adalah untuk mengenal pasti bebanan pekerja, fasilitasi pemimpin, sokongan kumpulan perkerja, dan pengiktirafan pekerja yang memberi kesan kepada kadar pusing ganti pekerja di kalangan pesyarah Institusi Pengajian Tinggi Swasta (IPTS) di Negeri Sembilan. Kajian ini telah menperolehi data daripada dua (IPTS) di Negeri Sembilan ; Inti International University Nilai dan KTG Education Group in Mantin. Jumlah lima hipotesis telah digunakan dalam kajian ini. Kajian ini mengunakan cara kuantitatif untuk mengumpul data. Maklumat dikumpul melalui soal selidik dan dianalisis dengan menggunakan SPSS versi 16.0. Jumlah 152 responden terlibat dalam kajian ini. Kaedah penyelidikan keratan rentas telah digunakan untuk sintesis maklumat yang sahih dan tepat. Kajian ini telah menggunakan statistic deskriptif, analysis kebolehpercayaan, analisis inferensi untuk menentukan hubungan antara pembolehubah. Berdasarkan analisis korelasi, bebanan pekerja (r =.725**,p ≤ 0.01) dan kadar pusing ganti pekerja menunjukkan hubungan positif. Manakala, fasilitasi pemimpin (r = -.669**, p ≤ 0.01), sokongan kumpulan pekerja (r = -.750**, p ≤ 0.01) dan pengiktirafan pekerja (r = -.801**, p ≤ 0.01) menunjukan hubungan negative dengan kadar pusing ganti pekerja. Nilai (R2 = 0.709) menunjukan bebanan pekerja, fasilitasi pemimpin, sokongan kumpulan pekerja dan pengiktirafan pekerja telah menyumbang 70% kepada pusingan ganti pekerja di kalangan pesyarah IPTS di Negeri Sembilan. Hasil daripada analisis berganda yang digunakan mendapati faktor pengiktirafan pekerja (β -.420, p ≤0.00) menunjukan hubungan tertinggi daripada factor-factor lain. Manakala, yang kedua tertinggi adalah bebana kerja (β .232, p ≤0.04 ) dan seterusnya adalah sokongan kumpulan kerja (β -. 195, p ≤0.17).Factor yang kurang menyumbang kepada kadar pusingan ganti pekerja di kalangan pesyarah (IPTS) di Negeri Sembilan adalah fasilitasi pemimpin iaitu (β -.086, p ≤0.246).Kajian ini turut dimuatkan juga dengan cadangan-cadangan yang bersesuai dengan pihak pengurusan (IPTS) dan juga pengkaji yang akan datang supaya hasil kajian yang diperolehi lebih baik. Kajian ini telah menepati objective yang ditetapkan iaitu mengenal pasti faktor-faktor psikologi yang mempengaruhi kadar pusingan ganti kerja di kalangan pesyarah (IPTS) di Negeri Sembilan. Kata kunci: Kadar pusingan ganti kerja, bebanan peranan, bantuan pemimpin, sokongan kumpulan kerja, pengiktirafan pekerja, pensyarah dan Institut Pengajian Tinggi Swasta (IPTS).

iv
ACKNOWLEDGEMENT
First and foremost, I am expressing my thankfulness and praise to God for his
guidance and blessings in realizing my dream to successfully completing this
dissertation. This learning experience has been a very inspiring, yet fulfilling one
indeed. There were time I feared that I may not be able to succeed but with the
unconditional support of many special people, I have managed to pull through and
accomplish my goals. Hence, I would like to take this opportunity to express my
heartfelt appreciation to those who has sincerely helped through to accomplish a part
of Master in Human Resource Management. I am grateful and would like to express
my sincere gratitude to my supervisor Dr. Jasmani Binti Mohd Yunus for the endless
support and guidance. Secondly, I deeply appreciate my father Mr. Balasingam
Govindan and my mother Madam Sarjit Kaur Kishen Singh, and my siblings, for their
endless love and support. I would like to extend my gratitude to Mr. Thirunavakarasu
Manickam, who had given me endless moral support and motivation to accomplish
this study. I also like to express my thanks to the PHEIs’ lectures for participating in
the data collection process. A great appreciation to my best friend Ms Kavitha
Venugopal, who gives me an unconditional support, guidance and ideas to complete
my study in Master Human Resource Management. Heartfelt thanks to my working
colleagues. Lastly, my deepest appreciation to those directly and indirectly who had
given me assistance throughout my study.

v
TABLE OF CONTENT
Permission to Use………………………………………………………………... i Abstract…………………………………………………………………………... ii Abstrak…………………………………………………………………………… iii Acknowledgement……………………………………………………………….. iv Table of content………………………………………………………………….. v List of tables……………………………………………………………………... vii List of figures…………………………………………………………………….. viii List of abbreviations………………………………………………………...…… ix CHAPTER1: INTRODUCTION……………………………………………… 1
1.1 Background of the Research……………………………………………... 1 1.2 Problem Statement……………………………………………………….. 5 1.3 Research Questions………………………………………………………. 8 1.4 Research Objectives……………………………………………………... 8 1.5 Significance of the Study………………………………………………… 9 1.6 Scope of the Study……………………………………………………… 10 1.7 Organization of the Thesis……………………………………………… 11
CHAPTER 2: LITERATURE REVIEW……………………………………. 12 2.1 Introduction……………………………………………………………… 12 2.2 Turnover Intention………………………………………………………. 12 2.2.1 Variables Related to Turnover Intention………………………………. 15 2.3 Role Overload……………………………………………………………. 17
2.3.1 The relationship between Role Overload and Turnover Intention… 18 2.4 Leader Facilitation……………………………………………………….. 19 2.4.1 Relationship between Leader Facilitation and Turnover Intention…… 21 2.5 Workgroup Support……………………………………………………… 23
2.5.1 Relationship between Workgroup Support and Turnover Intention. 24 2.6 Employee Recognition…………………………………………………... 25
2.6.1 Relationship between Employee Recognition and Turnover Intention…………………………………………………………………. 27
2.7 Underpinning Theory……………………………………………………. 28 2.8 Summary…………………………………………………………………. 29 CHAPTER 3: METHODOLOGY…………………………………………….. 30
3.1 Introduction……………………………………………………………… 30 3.2 Research Framework…………………………………………………….. 30 3.3 Hypotheses Development………………………………………………... 31
Hypotheses 1……………………………………………………………... 31 Hypotheses 2……………………………………………………………... 32
Hypotheses 3……………………………………………………………... 32 Hypotheses 4……………………………………………………………... 33 Hypotheses 5……………………………………………………………... 34
3.4 Research Design…………………………………………………………. 34 3.5 Operational Definition…………………………………………………… 36 3.6 Unit of Analysis…………………………………………………………. 36 3.7 Research Instrument……………………………………………………... 37

vi
3.8 Validity Test……………………………………………………………... 38 3.9 Dependent Variable……………………………………………………… 39 3.9.1 Turnover Intention….……………………………………………… 39 3.10 Independent Variables………………………………………………….. 40
3.10.1 Role Overload…………………………………………………….. 40 3.10.2 Leader Facilitation………………………………………………... 41 3.10.3 Workgroup Support………………………………………………. 41 3.10.4 Employee Recognition…………………………………………… 42
3.11 Population and Sampling……………………………………………….. 43 3.12 Pretest…………………………………………………………………... 44 3.13 Data Collection Procedures…………………………………………….. 45 3.14 Techniques of Data Analysis…………………………………………… 45 3.15 Summary………………………………………………………………... 46
CHAPTER 4: FINDINGS……………………………………………………… 47 4.1 Introduction ……………………………………………………………... 47 4.2 Reliability Analysis ……………………………………………………... 47 4.3 Normality Test …………………………………………………………... 49 4.4 Factor Analysis…………………………………………………………... 50
4.4.1 Factor Analysis for Dependent Variables………………………….. 50 4.4.2 Factor Analysis for Independent Variables………………………... 51
4.5 Descriptive Analysis……………………………………………………... 53 4.5.1 Response Rate……………………………………………………… 53 4.5.2 Respondent’s Demographic Characteristic………………………... 53 4.5.3 Mean and Standard Deviations…………………………………….. 55
4.6 Correlation Analysis …………………………………………………….. 56 4.7 Multiple Regression Analysis of the Variables………………………….. 58
4.8 Summary of Hypotheses Testing………………………………………… 61 4.9 Summary ………………………………………………………………… 62
CHAPTER 5: DISCUSSION, RECOMMENDATIONS, AND CONCLUSIONS …………………….................................................................. 63
5.1 Introduction ……………………………………………………………... 63 5.2 Discussion ……………………………………………………………….. 63
5.2.1 Objective 1……………………………………………….. 65 5.2.2 Objective 2……….………………………………………. 67 5.2.3 Objective 3 ………………………………………………. 69 5.2.4 Objective 4……………………………………………….. 70 5.2.5 Objective 5 ………………………………………………. 71
5.3 Implications of Research Findings………………………………………. 72 5.4 Limitation of the Study………………………………………………….. 75 5.5 Recommendations for Future Study……………………………………... 76 5.6 Conclusion……………………………………………………………….. 77
References……………………………………………………………………….. 79 Appendixes A – Survey Questionnaire………………………………………….. 91 Appendixes B –SPSS Outputs…………………………………………………… 100

vii
LIST OF TABLES
Table 3.1 Definition of Variables………………………………………………... 36 Table 3.2 Questionnaire Section and Description……………………………….. 38 Table 3.3 Turnover Intention Variable ……………. …………………................ 39 Table 3.4 Items for Role Overload Variable…………………………………….. 40 Table 3.5 Items for Leader Facilitation Variable……………………………… 41 Table 3.6 Items for Workgroup Support Variable ………………………………. 42 Table 3.7 Items for Employee Recognition Variable……………………………. 43 Table 4.1 Summary of Reliability Analysis……………………………………... 48 Table 4.2 Result of Skewness and Kurtosis for every Variable…………………. 49 Table 4.3 KMO and Bartlett’s test for Dependent Variable Turnover Intention... 50 Table 4.4 KMO and Bartlett’s test for Role Overload………………………… 51 Table 4.5 KMO and Bartlett’s test for Leader Facilitation……………………..... 52 Table 4.6 KMO and Bartlett’s test for Workgroup Support……………………. 52 Table 4.7 KMO and Bartlett’s test for Employee Recognition………………….. 53 Table 4.8 Profile of Respondents……………………………………………… 54 Table 4.9 Descriptive Statistics of the Dependent and Independent Variables….. 55 Table 4.10 Correlation Results between Contributing Factors and Turnover Intention……………………………………………………………………….... 56 Table 4.11 Multiple Linear Regression (Model Summary)……………………... 59 Table 4.12 Multiple Linear Regression Analysis (ANOVA)……………………. 59 Table 4.13 Multiple Linear Regression Analysis (Coefficients)………………… 60 Table 4.14 Summary of Hypotheses Testing…………………………………….. 61

viii
LIST OF FIGURES
Figure 3.1 Theoretical Framework…………...…………………………………. 31

ix
LIST OF ABBREVIATIONS
Description of Abbreviation Abbreviation Public Institution of Higher Education Private Higher Education institution Higher Institution Centre of Excellence Higher Education Institution United Nations Educational, Scientific and Cultural Organization University Council for Educational Administration Key Performance Indicator Malaysian Qualification Registry Agency Human Resource Leader Member Exchange Standard Deviation Kaiser Meyer Olkin
PIHE PHEI HICoE HEI UNESCO UCEA KPI MQA HR LMX SD KMO

1
CHAPTER 1
INTRODUCTION
1.1 Background of the Research
Employee turnover rate keeps increasing rapidly and grow into, full of forces in this
highly globalize and the internationalized market environment. Most of the
organizations are strengthening their human capital management in order to face
massive talent war. Retaining talented professionals become the biggest challenge in a
competitive job market. Many scholars has discussed about employee turnover
intention. According to Calisir (2011), an organization that encounters high employee
turnover may impact the excellence and capacity of the production outcome. In spite of
that, each organization is competing to provide better offers and working environment
to keep their talented professionals. Advance job market offering keep influencing
professionals to obtain a better platform to invest their endowments.
Based on Wright and Bonett (2007) workers intention to quit can be segregated into
voluntary and involuntary turnover. Generally, voluntary or intentional turnover
happen because employee want to leave the organization due to several factors. While,
involuntary turnover occurs because of the situations and it is beyond the employee’s
control. Employees were requested to leave the organization for several reasons such
as; retrenchment, layoff, termination and dismissal. Employee voluntary turnover
considered as a key problem of many organization either profit or non- profit (Chan,
2010). Recently Fortune magazine had released an article linked to employee turnover
intention and stated that, hiring a rainbow of employees is an important goal, but
attaining it doesn’t actually matter if most of those end up leaving because of their new

2
found employer is welcoming once they’re in spite of appearance (Kokalitcheva, 2015).
Choice to quit from organization inclined by two factors; perceived ease of motion and
perceived desirability of movement (Trevor, 2001; Morrell et al. 2004; Abdullah et al.
2012). Perceived ease of motion means the available alternative job opportunity in job
market. While, perceived desirability of movement means factors that impact employee
motivation and job satisfaction.
According to statistics of Labor Force, Department of Statistic Malaysia (2015), staff
retention become a key concern for Malaysian employees as 44% of professionals
expected to leave their current role in the next 12 months. Another 40% of professionals
stated that will remain in current role for next 1 to 3 years. Based on staffs’ intentional
report, only 3% of employees remain in their current role for more than 10 years.
Almost 44% of employees remain in their current role for less than 1 year and 40% of
them remain 1 to 3 years (Michael, 2015). Most of the professionals look for new job
because of various reasons such as future career progression, increase in salary,
workplace flexibility, to attain promotion and seniority purpose and company brand and
reputation. In facts, academicians and industrial professionals try to analyze and find
out a way to retain employee in an organization. (Ferrell et al. 2008).
Malaysian higher education philosophy plays a central role in economic growth and
national development. Highly educated nation enjoy the economic prosperity and hold
a good status in society. Higher education system in Malaysia has varied and stretched
its reach and coverage over the year quite significantly. Generally, academic sector is
considered as one of the crucial key regions which may help in changing Malaysia from
developing country to developed country by the year of 2020. According to Ministry of

3
Higher Education (MOHE), Malaysian higher education can be classified into five main
categories such as; Public Institution of Higher Nation, Private Higher Education
Institution (PHEI), Polytechnics, Community College and Higher Institution Centre of
Excellence (HICoE).
PHEIs become more famous than Public Institution of Higher Nation. The creation of
privatized university and colleges comes under the Private Higher Education Act 1996
which was accredited the PHEIs to confer their own academic qualification such as;
Certification, Foundation, Diploma Higher National (HND), Diploma, Degree
programs, Master, Doctor of Business Administration (DBA) and Doctor of Philosophy
(PHD). PHEIs are encompasses with local students and foreign students. As per factual
information gathered by Chong and Amli (2003) the amount of foreign student
expended from 27,872 in 2002 to 86,919 in 2010. Recently Malaysia was ranked 12th
place in the global for having high volume of international students of total 63,625
(UNESCO, 2014). Most of the students enrolled in Malaysia are from Nigeria,
Indonesia, Africa, Afghanistan, Bangladesh, China, India and Saudi Arabia. According
to Sarjit (2008), the establishment of PHEI has prepared Malaysian higher education
system more varied in supplying the methods of learning to the students.
Granting to the report prepared by the University and College Employers Association
(UCEA) on workers employment in United Kingdom exposed that majority of private
education institution have come across staffing and withholding employee problems.
According to Zakaria, Jidi, Zani, Mislan and Eshak (2014) the academic staffs turnover
rate in PHEIs is at an alarming rate, in line with the research made, where the job
mobility of private higher education academicians has becoming an issue for the

4
institution. According to Ongori (2007), mentioned that, employing talented and
excellent lecturer is stimulating and it is not simple to recruit them.
Independent variables have been testified that management and professional level of
employees’ turnover keep growing globally (Birdir, 2002; Alan, Radzi & Hemdi,
2008). According to Malaysian Insider (2014), nearly seventy percent (70%) of
employees are waiting to depart their jobs for better careers. Meanwhile, most of
employee felt that the Malaysian economy would remain static despite the uncertain
global economic system. Therefore, most of lecturers and academic staff do not afraid
to resign their job and find the new one.
Besides that, PHEIs’ management faces complications to retain lecturers due to demand
and opportunity factors, which become a reason for lecturers to leave the institutions.
The rapid process of transformation in the education system, create more challenging
roles for PHEIs academician such as teaching, research writing, participating in
conferences, mentoring, invigilation and other administrative work. This point
supported by Altbach (2005), who argues that academic challenges are very complex.
The challenges include changes in the environment, manpower and expertise need, new
policy development, technology creation, and research and development emphasis,
establishment of new higher education institutions including the private ones.
Therefore, those changes and challenges have certainly compressed the academic
turnover intention in the PHEIs. According to Narimawati (2007), working as a lecturer
in private higher education institutions becomes less popular work. Moreover, PHEI’s
lectures do not have the chance to show their maximum capability and expertise due to

5
varied reasons such as; super pack time table, financial insufficiency, limited time
frame, low salary, insecure employability and customer centric management.
Based on previous researchers in Malaysia, much attention has been given for impact
of turnover intention in PHEIs (Awang et al. 2013). Factors that could predict to
lecturer turnover intention are combine effects of social factors, economic factors, and
psychological factors. Lectures intent to quit their current job due to poor workplace
wellbeing, lack in career development and lower employee empowerment (Van, 2010),
job satisfaction and organizational culture (Medina, 2012), democratic antecedes;
gender, education level, marital status, age (Choong et al.2013) and expectation of
young academicians towards the workplace in order to cross sectional and longitudinal
study recommended having better result and understanding on employee turnover
intention (Hongvichit, 2015).
1.2 Problem Statement
Talent retention becomes a challenging issue for PHEIs in Malaysia. Lecturers are the
backbone of the PHEIs’ success and students’ development. According to pay scale of
human capital national average pay for lectures per annum is RM51, 000. In current
economic condition even though most of PHEIs’ lecturers are obtaining reasonable
salary scale, they are still having the intention to quit from their current job. According
to Malaysia Higher Education Blueprint (2015-2025), rigid career development
pathways control the degree to which higher learning institutions are able to attract,
recruit, and retain the best talents. The PHEIs facing insufficient of specialized
academicians on focus areas.

6
Lectures find difficult to work with private higher education institutions compare with
public higher education institution. There are several reasons affecting PHEIs lectures’
job satisfaction. In privatized institutions’ management more focused on generating and
disseminating knowledge in order to generate profit rather than on enlightening society.
PHEIs sometime exceed their capacity and resources by accepting more students to
maximize profit. They more focus on customer and pleasing their stakeholders. PHEIs
practice adopt policy to serve the customer the best and strive for the excellence. In
PHEIs power shifted from faculty to the centralized management.
There are some alteration in the role of lecturers from a scholar to an entrepreneur who
brings research grants and contracts. The cult of efficiency has led to increasing
financial pressure to ‘do more with less’ and can classify as minimize resource and
maximize profit. Most of academic staffs no longer hold a permanent position in PHEIs.
The PHEIs management prefers to hire independent lectures under contract basis for
increase their autonomy. Lectures contract renewed based on their performance and key
performance indicator (KPI) achievement. At first PHEIs lectures agree for contact
basis employment. After few years of employment lecturers feel insecure work with
PHEIs due to job security. Lecturers’ feel insecure, loss trust and hope. PHEIs lecturers’
psychological contract is not abide with their job and cause detachment.

7
Disengaged employees will cost organization more with lower productivity, high
absenteeism and intention to leave the organization. (Makhbul, Rahid & Hasun, 2011;
Andrew & Sofian, 2012; Karatepe, 2013). Employee engagement among academic
staffs are declining due to the tendency of both institutions and lecturers being more
materialistic (Saks, 2006; Bhattacharya et al. 2012). Most of Malaysian literatures has
been identified that turnover intention among lecturers occurs due of disengaged
employment (Moy, 2015), demanding environment (Noor, 2011), new policy by new
management and high commitment (Awang & Ahmad, 2010) in PHEIs.
Turnover intention negatively impacted the PHEIs because all the knowledge and skills
being freeze and ready to leave the institutions together with the lecturers. Many
researches have done to investigate private institutions lectures’ turnover intention.
However there are lacking in examining the relationship among role overload, leader
facilitation, workgroup support, and employee recognition and turnover intention
among PHEIs lectures in Malaysia. This study was conducted towards explore
association among role overload, leader facilitation, workgroup support, employee
recognition and turnover intention among PHEI’s lectures. This research grants
explanation, knowledge and analysis on the independent variables and the effect to
lecturers’ turnover intention. Optimistically, appropriate solutions together with
suggestions were provided to improve and reduce the effects of psychological factors
and turnover intention among lectures.

8
1.3 Research Questions
This research has developed five research questions to achieve the objectives of this
study.
1. Is there a relationship between role overload and turnover intention among the
PHEIs lecturers in Negeri Sembilan?
2. Is there a relationship between leader facilitations and turnover intention among
the PHEIs lecturers in Negeri Sembilan?
3. Is there a relationship between workgroup support and turnover intention among
the PHEIs lecturers in Negeri Sembilan?
4. Is there a relationship between employee recognition and turnover intention
among the PHEIs lecturers in Negeri Sembilan?
5. What are the effects of role overload, leader facilitation, and workgroup support
and employee recognition to turnover intention among PHEIs lecturers in
Negeri Sembilan?
1.4 Research Objectives
The crucial objectives of this research are to identify the relationship and effects of role
overload, leader facilitation, workgroup support and employee recognition on turnover
intention among PHEIs lectures in Negeri Sembilan. The specific objectives of this
study are as follows;
1. To identify the relationship between role overload and turnover intention among
PHEIs lecturers in Negeri Sembilan .
2. To identify the relationship between leader facilitations and turnover intention
among PHEIs lectures in Negeri Sembilan.

9
3. To identify the relationship between workgroup support and turnover intention
among PHEIs lectures in Negeri Sembilan.
4. To identify the relationship between employee recognition and turnover
intention among PHEIs lectures in Negeri Sembilan.
5. To identify the effects of role overload, leader facilitation, workgroup support
and employee recognition on turnover intention among PHEIs in Negeri
Sembilan.
1.5 Significant of Study.
This study investigated some input related to turnover intention among PHEIs’ lectures.
Firstly this study aimed to analyze the; role overload, leader facilitation, workgroup
support and employee recognition that leads to lectures turnover intention. This
research helps to identify the effects of role overload, leader facilitation, and workgroup
support and employee recognition in PHEIs lecturers. The research outcomes has
provided additional insights regarding role overload, leader facilitation, workgroup
support and employee recognition which effect the motivation and job satisfaction level
of lecturers. By integrating these four variables, outcomes of this study would cultivate
the existing knowledge in the area of turnover intention studies.
This research provides some practical input for the private higher education institutes
and organizations. This research finding has identified solutions for turnover intention
issue which rapidly occurs in PHEIs. Meanwhile this research may come up with proper
retention strategy and efforts. Moreover, through the chosen questionnaires, PHEIs able
to identify the gap in current human resource management practices and evolve new
strategy for talent retention. It will a provide information’s which may help and support

10
the PHEIs and other organizations. This research had come up with some innovative
and potential solution for retaining the talented lecturers.
In term of scholar, this research helps other researcher to understand the causes and
trends of turnover intention among PHEIs lectures. Though various studies have been
done to test the association but less study conducted in private higher education
institutions’ lectures. This study expected to be as reference for future researches. In
addition, this study also has provided some important insight of role overload, leader
facilitation, and workgroup support and employee recognition for future researchers.
1.6 Scope of the Study.
This research intended to identify and gain better understanding of the connection
between role overload, leader facilitation, workgroup support, employee recognition
and their influence on turnover intention among lectures who working in PHEIs at
Negeri Sembilan. The sample populations for this research are lecturers who work at
PHEIs in Negeri Sembilan. The main reason for choose this location because recently,
more new PHEIs growing like a mushroom in Negeri Sembilan. There are many PHEIs
in Negeri Sembilan; KTG education group formally known as Legenda group of
colleges, Inti University Nilai, University Sais Islam Malaysia (USIM), Kolej Tafe
Seremban, Cosmopoint, Nilai University and International Manipal University. Most
of these private university colleges had registered under the Malaysian Qualification
Registry Agency (MQA). The researcher had approach KTG Education Group, Inti
University Nilai, University Sains Islam Malaysia (USIM), Kolej Tafe and Nilai
University. Many talented academic staffs are engaged with selected private higher
education institutions in Negeri Sembilan. The four variables; role overload, leader

11
facilitations and support, workgroup support and employee recognition linked
appropriately to the chosen PHEIs in Negeri Sembilan.
1.7 Organization of Thesis
Mainly, five (5) chapters cover on this study. First chapter presented the overview of
the topic clearly. Then continue with the background of research, outline the problem
statement, research objectives, research questions, significant of the study and the scope
of study have been identified and explained. Furthermore, chapter 2, discussed about
the literature review on dependent variable (turnover intention) and the four
independent variables (role overload, leader facilitations and support, workgroup
support and employee recognition) of past studies. Meanwhile, chapter 3 explained the
method apply in the study; theoretical framework, hypothesis development, instrument,
measurements, and statistical tools to analyze the result. Chapter 4 discussed the data
analysis and findings of the study. Finally, chapter 5 covered the discussion,
implications, recommendation for future study, limitation and conclusion. An overall
summary for each of the research questions and research objectives will also be made.

12
CHAPTER 2
LITERATURE REVIEW
2.1 Introduction
The second chapter discuss about the literature review regarding the research project in
detail. This chapter discusses about the past researches related to turnover intention
(dependable variables) and role overload, leader facilitations, workgroup support and
employee recognition (independent variables).
2.2 Turnover Intention
Employee turnover intention describes as the plan of worker to leave the organization.
(Kaur, Mohindru & Pankaj, 2013). According to Elizabeth (2012), turnover intention
is label as anticipation of a worker to find a better profession as soon as possible. Plenty
of scholars has identified the term of turnover intention into several element. Turnover
intention had articulated by many scholars and many terms had used such as intent to
quit, intention to leave, and intent to turnover (Takase, 2010). All those terms are related
with the same issue which representing to an employee’s plan for quit the current job
and finds another job in the near future based on employee’s own assessment to quit a
corporation voluntarily. Based on pass researches, (Meeusen et al. 2011) defined
turnover intention as an insolence of employee that change earlier to the decision of
turnover.
Turnover intention can be branded to seven types; external turnover, internal turnover,
voluntary turnover, involuntary turnover, functional turnover, dysfunctional turnover
and lastly actual turnover. According to International Council of Nurses (2010), exterior
turnover discuss about the quantity of individuals who leave an organization for variety

13
of reasons. In the meantime, interior turnover which include work changes inside an
organization. Expectation to leave is emphatically identified with real turnover (Noor
& Maad, 2008). Many researches have discussed about voluntary and involuntary
turnover. Involuntary turnover refer to employee who departed and it is included those
who force resigns, layoffs, terminates, retrenchment and retires (Marcia, 2011).
According to Thomas (2009), involuntary refer to an employee’s who discharge by the
organization. In other word involuntary turnover replicates correcting the bad hiring
decision earlier made by the management. While voluntary turnover happen when
employee feel frustrated on their job because of the poor management, poor leader
facilitation, work environment, workload and poor recognition. Individuals ponder
individual turnover to be pretentious by attractiveness of current position and the
availability of opportunity. Turnover intention also can be describe as afford of workers
to find betterment in their career life (Spereitzer & Mishra, 2002). According to
Qureshi et al. (2013) most believed that majority of employees that involve in voluntary
turnover intention are the employees with high competencies from executive positions
and above. Turnover can be classified as functional turnover and dysfunctional
turnover.
According to Morrell (2001), it is important for a manager to identify whether an
employee turnover provide a chance to attain more productive employee in future
(functional turnover) or push them to rearrange the current work setting (dysfunctional
turnover). Dysfunctional turnover refer to employee who wish to quit the organization
even the management not willing to lose them. Functional turnover refer to employee
who want to leave the organization, and the management is not worried of it.

14
Organization tends to have a negative judgment of an individual. In the other way,
actual turnover classified as sensible and cautious desire to leave the organization in
future and its can be classify as the end of logical decision making process (Fah et al.
2010).
Turnover intention is unclear like actual turnover. Turnover intention is said to be the
forecaster of real turnover, as it is detected, there is an association exists between
turnover intention and actual turnover (Rilovick, 2005). Employees may have turnover
intention before actual resignation. Employee intentionally will lower the process and
performance in their workplace. According to the Theory of Planned Behavior (Ajzen,
1991), the turnover intention developed is said to be a precise indicator of the
consequent behavior, in which, referring to turnover. It can also be articulated that
turnover intention is the antecedent for actual turnover behavior as intention is said to
be the most immediate determinants of actual behavior (Alam & Mohammad, 2010;
Makhbul, Rahid & Hasun, 2011).
According to Sousa-Poza (2004), turnover intention means forcing the employee
themselves to leave from the existing job within a specific time frame, whereby it shows
guide sign to real turnover. Turnover intention are positively related with actual leaving.
This statement supported by (Brunetto et al. 2012) turnover intention was reported to
be highly correlated with actual turnover.Turnover intention can be clarified as
employee’s methodology towards making their own decision to depart from the job and
organization (Awang et al. 2013). Employee turnover is customarily defined as the
collective number of employees that leave an organization in a certain time period and
the turnover rate is the total number of employees that leave the organization to the total

15
number of employees within the organization, often measured over one year
(Hausknecht & Trevor, 2011). All types of turnover at the end contribute to actual
turnover in an organization.
2.2.1 Variables Related to Turnover Intention.
Nowadays, Human Resource Department gives importance on employee turnover
intention. Many researches has been done associate with employee turnover intention.
According to Hei, Addullah and Abdul Rahman (2011) the expecting factors for
intention to quit is miscellaneous for every period of advancement. Most likely to leaves
the organizations are those most talented and smartest employees within the group
(Abbasi & Hollman, 2000).
Research has identified employee perception regarding their work and their awareness
of world labor market condition as factor that impact their intention to leave their
organization (Ren & Harper, 2012; Lucas & Deery, 2004) argue that literally leaving
within the context of the psychological contract of employees and the possible
violations of the contract (Hancer, George, & Thomas, 2003). One of the remarkable
indicators of workers’ turnover intention is organizational issues. Mobile employees
articulated to the organization, because organizational factors are an important
contemplation in understanding employee attitude and behavior at work because they
are able to shape the way employees think, feel, and behave.
Impact of perceive human resource functions, organizational trust and organizational
politics also predictors of intention to leave among employees (Abubakar et al. 2014).
Many scholars has study about turnover intention with different factors such as; Lew

16
(2009), discussed about hierarchical support, organization commitment, and felt
obligation, Joarder (2012), reviewed about role of HR practices and turnover intention
and (Long et al. 2012), analyze about leadership style and turnover intention. Choong,
Keh and Tan (2013) discussed about impacts of demographic antecedents toward
turnover intention. According to Takase (2010), turnover intention categorize as multi-
stage process which contains the following modules; (1) psychological, (2) cognitive,
and (3) behavioral. In first stage psychological reactions such as displeasure towards
undesirable aspects of organization are believed to prompt employees’ emotional and
attitudinal withdrawal reactions. Stage 2, represent as the core turnover intention as
many researchers edge turnover intention as a reasoning manifestation of the decision
to turnover. The cognitive turn into behavior where employee start to express their
intentions to leave jobs by reducing productivity, frequently absent from work and have
lower commitment to the organization. Turnover intention is a dependent variable for
this study.

17
2.3 Role Overload
Role overload become a major problem among employees in organization. According
to Cooper (2001), role overload defined as the litter measure of work and the time frame
in which work must be finished. Role overload classify as a degree to which a person
is overstrain psychologically due to limited time frame to accomplish too much of
requirements and accountabilities (Jones et al. 2007). Role overload happens when
there are too many roles employees need to perform at specific time, in order to attain
organizational internal efficiency.
Role overload generally is found to be one of the most severe and quickly growing
phenomena is organization (Murphy, 2003). It exists when role expectations are greater
than the individual’s capacities and motivation to perform a task (Conley, 2000). Too
many instructions and job demands may increase an individual workload which cause
burnout or job dissatisfaction. Likewise, in past two studies the authors revealed that
role moderating the effects of role overload is the core factor responsible for job
dissatisfaction (Malik, 2010) and job dissatisfaction heartens the employees to left their
jobs (Malik, 2011). Role overload cause stress and lead to mental and physical
problems. Besides effecting employee health overloaded stress also affects the standard
procedure of job to be performed and demotivates the employee to perform well (Malik,
2013).
Additionally, research in organization setting has discovered that role overload is a
factor that also has important consequences for productivity, quality of task
performance and anxiety (Idris, 2011). Work in long hours or role overload contribute
to occupational stress. Employees’ strain will be increased with high job demands and

18
low control. Usually role overload happen when an employee’s job requirement and
expectation are greater than the allocation of resources, facilities and time. Role
overload closely related with job demand control model. The research study of Beehr
(2014), indicated about the positive and significant relationship between role overload
and occupational stress. Excessive role overload and stress may lead towards turnover
intention among the job holders.
2.3.1 The Relationship of Role Overload and Turnover Intention.
Role overload has impulsive connection with many factors such as; turnover intentions,
performance measures and job attitudes. Role overload in organizations comprise both
physiological and psychological stress. In meantime, excessive level of job demand will
encourage individual to endeavor the challenging task and end up with stress. Role
overload at workstation ultimately upsurge intention to quit among the employees.
Management need to responsible for the cost of recruitment and selection to substitute
the workers who already leave the company. Role overload directly affect the quality
of job and decrease the management efficiency and effectiveness. Whenever, workers
undergo role overload in workplace it may affect the job fulfillment and lead to high
employee turnover (Cordero &Baerga, 2009).
According to Pienaar (2007), role overload has connectivity in clarifying the occurrence
of turnover intention. Whenever, role overload rises, workers who receive low
workgroup support in workplace may leave the job compare to the workers who
receiving high workgroup support. Spending time on excessive amount of task may
lead to work exhaustions and burnout. Moore (2000), pointed that work overload has
strong control on work exhaustion which lead to employee turnover intention.

19
Imbalance work schedules lead to non-pay overtime and anticipating workers to have
inclusion in numerous work and face challenges because of role overload which leads
to turnover intention (Hang-yue, 2005).
It’s clear that there is a connection among role overload and turnover intention. Past
literatures have indicated that there are positive associations between role overload and
turnover intention in different area of management. Expanded research needed to
identify the connection between role overload and turnover intention among the PHEI’s
lecturers.
2.4 Leader Facilitation.
According to DeYoung (2010), leaders don’t act the same way. Some build consensus,
while other command. Some are charismatic, while others are functional. Leaders
inspire and encourage their follower. There are many leadership styles applicable in
management area such as transactional leadership, transformational leadership,
situational leadership and servant leadership. Leadership style may differ according to
organizational environment and management intelligence.
A transformational leader persuades followers to accomplish more than one would
formally hope to do by providing individualized support, fostering the acceptance of
group goals, articulating a vision, providing an appropriate role model and stimulating
intellectually. Transformational leadership mainly based on the leader’s inspiration.
Transactional leadership style is approachable and its foundation for handling with
present issues. Situational leadership is the key concept of task behavior. The
relationship based on agreement between both parties. According to Russell (2002),

20
servant leadership is a famous idea in the overall leadership style, while an instinctively
useful idea; it is deliberately characterized and not yet encouraged by observational
research. Based on previous literature review by Smith (2005), servant leader should
have ten qualities; building community, commitment to growth of people, stewardship,
foresight, conceptualization, persuasion, awareness, healing, empathy, and listening.
Good leader communicate their expectations and vision to their subordinates. Leaders
must provide a platform for the subordinates and nurture them with needed skills and
guidelines. The quality of relationship between supervisors and subordinates is often
studied via ‘Leader Member Exchange’ (LMX) theory. Elicker, Levy and Hall (2006)
discussed that the advantages of high quality LMX connection are various, including
special treatment, expended employment related correspondence, differential
allotments of formal and casual prizes, abundant access to directors, and expended
performance related to feedback.
Leader facilitation helps subordinates connect their personal work to the goals of the
team and the vision of the organization. According to Thompson (2005), the manager
is most likely in a higher level than subordinates to responsible for dealing with the
subordinates’ poor performance. Generally when employee believing on their
supervisor they feel powerless because supervisor have the authority over job allocation
and have the power to make a beneficial or non-beneficial decision towards
subordinates. As an example workers must depend on their leader for work
assignments, reward and recognition and performance management.

21
According to Knoll and Gill (2011), employees worried with regardless of whether their
boss is caring, helpful and friendly and in this manner high in generosity and steady
tenable and consistent with their oath and high in trustworthiness. Past researches has
discussed many variables affected by leader facilitations such as; job satisfaction
(Saleem, 2015), organization performance and employee engagement (Zhang & Bartol,
2010) organization culture and organization teaching (Vera & Crossan, 2004) and
employee turnover intention (Klopper, 2012).
2.4.1 Relationship of Leader Facilitations and Turnover Intention.
Leader facilitation is the procedure of affecting others to encourage the achievement of
organizational applicable objectives. According to Barney (2007), leadership factors
persuasive inspiration negatively affected workers turnover aim and laissez-faire had a
positive impact of workers’ turnover intention. Leaders are playing significant roles for
organizational success. Employee needs capable leaders who can able to direct,
motivate coordinate and reward them. Leader facilitations may impact employee’s
behaviors such as, job satisfaction, employee engagement, job commitment and
turnover. Work fulfillment has been appeared to be a vital direct indicator of people’s
expectation to leave the association. Unsatisfied workers will leave their jobs more than
their satisfied colleagues. Expectation might be hardened when the individual sees that
they are encouraged by the administered. (Brough & Frame, 2004) and (Eisenberger et
al. 2002) and leader facilitation are viewed as an important predictor then plays a central
role influence employee behavior (Alkahtani, 2011).
Encouragement from the superior has been revealed to be more grounded positive result
than encouragement from workgroup people. Positive attributes and behavior of a

22
leader influence their subordinates to stay longer in an organization. Latest studies
recommended ethical leadership is essential and inferable to show that managers are
moral leaders (Collins, 2006). According to Fogel (2007), prominence of management
is to validate the superiority of directing and demonstrating ethical behavior in
workplace. Thus, high level of employee turnover intention connected with the strong
ethical practice by non-academician and academician staffs. Eventually leader
facilitation depends on management intelligence.
Turner (2000), recommended workers should practice ‘intentional encouragement’ at
workplace. Leaders must provide encouragement and support for their subordinates and
monitor their performance time to time. An effective leader must equiped with power
and affiliation to motivate their subordinates to perform well. The employees feel
motivated when their leaders reinforce and feedback on their performance. The
likelihood of employee turnover intention can be minimized by effective leader
facilitation.

23
2.5 Workgroup Support.
Workgroup support also known as social support, peer support and co-worker support.
Workgroup encouragement is obliging network or exchange of resource between
formal and informal interaction. The communication effect of workgroup support with
strain is likewise labeled as the ‘buffering effect’ since workgroup support seems to be
structure people against aggressive results of work related strain.
Workgroup support may originate from numerous bases, for example supervisors and
work colleagues. The bolster perceived from work colleagues is the most vital for
moderating work related strain. Workgroup support in organization emphasizes on
collective critical thinking and sharing data, reappraising circumstances and getting
guidance from a bunch of work communities such as superior, colleagues and top
management. Workgroup support is a strong or accommodating social collaboration or
trades of asset between individuals in both formal and casual connection. Workgroup
support consist of three distinctive structures in the work environment, which include
‘emotional support’ (respect, love, regard and liking), ‘affirmation’ (rightness of
activities and articulation) and ‘direct help’ (help in work, providing information or
financial support) and other supports. (Mc Dougall, 2010).
Workgroup support organizes imperative sources of encouragement particular when
undertaking achievement that permits representatives to connect with their colleagues.
Workgroup support generates a bonding and trust among the employees. According to
Ferres, Connel, Travaglione (2004) work colleagues expect concerns inevitability that
one’s partners are equipped and will act in a simply trustworthy and moral way. It
anticipates that colleagues will encourage their co-workers and do not reveal their
24
confidential data. Moreover, colleagues expect senior workers to follow up on the idea
that they believe in the word and activities of their peers. Past studies have discussed
that understanding workgroup support may ensure satisfactory result for the
organization. As an example lower the turnover intention, lower the depression,
increase production outcome, improve performance and follow the obligations.
(Bakker, Demerouti & Schaufeli, 2003); (Valentine, Greller & Richtermeyer, 2006)
2.5.1 Relationship of Workgroup Support and Turnover Intention.
Ng and Sorensen (2008), defined that a coworker support always provide job related
trust and emotional assistance to complete the job successfully. People who appreciate
and practice social interaction with work colleagues would perceive high job
satisfaction. Supporting workgroup provides positive reinforcement for employees
towards their job and organization. Those employees that obtain extraordinary
workgroup encouragement are retainable and stay longer with an organization. Watson
(2002), added that perceiving social support will comfort the employees and help them
to manage their emotional intelligence in workplace. Thus, employees may forget their
personal and work related stress and feel happy working with friendly and supportive
work environment.
Workgroup support believed to impact the ‘stress-strain relationship’. On the other
hand, it can be explain as workgroup support influences an individual job satisfaction
level and motivation. Balogun (2012), added that workers who receive frequent
workgroup support in their workplace estimated to be devoted, dedicated and loyal to
their organization. The cost of an employee’s incapability to balance their work and
family life can include leaving from an organization or as a proxy for turnover intention.

25
Sources of workgroup support in one area do not only provide relief for their own area
but also for the other area. Workgroup support plays an important role to minimize
problems in workplace. Workgroup support believed to improve the teamwork, reduce
the work stress and workload which leads to turnover intention. Past literature reviews
recommends that workgroup support in the work environment diminishes the
probability of specialist burnout and turnover intention (Houkes et al. 2003 & Barak et
al. 2001); (Nissy, Mor Barak, & Levin, 2005). Workgroup support can provide
emotional and instrumental support to an employee that would make them hesitance to
leave the organization.
2.6 Employee Recognition
Employee recognition is also known as meaningful acknowledgement, meaningful
gratitude and meaningful appreciation. Employee recognition includes insightful
concern what workers doing matter to the organization in imperative ways (Cameron,
Dutton, & Quinn, 2003). According to Petrescu and Simon (2008) employee
recognition discuss the general affirmation or acknowledgement of a given event or
achievement.
Meanwhile, Ventrice (2003), says there are four basic elements of meaningful
recognition: praise that is sincere and timely, heartfelt thanks for something specific,
new opportunities to contribute to the organization in an important way, and respect for
the individual and the work they do. Employee recognition can be divided into two
types which is formal recognition and informal recognition. Formal recognition can be
described as the systematic planning and process for recognizing or rewarding specific
achievements of both individual and as a team. Bowen (2000), says that formal

26
recognition is more about organizational achievements, exceeding performance goals,
or solving organizational problems. In addition formal recognition comes along with
specific goals and recognition.
Generally, informal recognitions come without any planning and classify as
spontaneous forms of rewards or recognition. Informal recognition refer as unplanned
or unpredicted demonstration of appreciation for the workers’ endeavors and
achievement as he or she get to be mindful of them. Effective recognition occurs in
organization with strong supportive culture (Sounderson, 2004). Employee Recognition
Program would be part of a larger long term plan to improve the overall corporate
culture. Actually, people have the potential, abilities and the obliged mastery to give
the best performance. However, the management should recognize the top talent and
acknowledge their achievement. (Ferguson & Reio, 2010). Moreover, the project would
also require the support and cooperation of the corporate leadership team and the
Human Resources Department, as they would provide the means to obtain staff
employment details, such as years of service and promotions (Kralovensky, 2006).
Rewards and incentives systems should comprise a comprehensive assessment method
to ensure that the rewards are effective for lecturers who work harder when they know
they will be positively reinforced for it. In 1938, U.S Psychologist B.F.Skiner, claimed
that an individual’s behavior was controlled by positive reinforcement, the likelihood
of the repetitive behavior may decline. The winning attitudes of employees ignited by
successful recognition programs that help to sustain a competitive advantage by
promote improvements in quality and reductions in cost. Appropriate employee
recognition program ensure job motivation and talent retention.

27
In past researches many variables has affected by employee recognition. Some
variables positively affected by employee recognition such as; job satisfaction and
motivation (Danish, 2010), work performance (Bosibori, 2012), organizational
development (Piderit, 2000), and employee engagement (Saks, 2006).
2.6.1 Relationship of Employee Recognition and Turnover Intention.
As we continue into the new millennium, not only are we faced with the baby boomers
exiting the workplace, but we are also confronted with the task of attracting, training,
and retaining a young workforce entering the workplace who may differ significantly
from previous generations (Wey Smola & Sutton, 2002). The greatest challenge of
recruitment and retention is begins to increase. Most of organization faces problems in
replacing Baby boomers with new generation employees. Most of the Baby boomers
begin to retired and most of the young knowledge workers demanding effective
employee recognition programs. Young generation expect employees come with a
tagline as ‘Strawberry’ generation. Young generation expect good employee
recognition programs and attractive reward in order to engage with an organization.
In 1964, Vroom discovers that reward or recognition is a basic requirement to affect
individual behavior. Tropman (2002), proposed the total rewards concept from the
business practices and personal study. He believes that the traditional pay system has
been unable to attract, retain and motivate the modern employees. Meanwhile, if the
organization does not meet their expectation, these young people ready to fly away from
the organization. Good remuneration system can motivate employees, and reduce the
turnover intention of looking for other jobs and turnover intention. As an incentive for

28
companies, employee recognition plays a unique role in attracting and retaining talents.
Employee recognition treats as an important element of organizational justice.
Organization justice pointed out when the employees concerned with the relative justice
of allocation results. Whenever employees feel unfair, they may choose to depart from
the situation. Organizational justice reflect an environment of fair competition, it is a
very important variables of organizational effectiveness affecting employees'
behaviors. The employees’ sense of unfairness will reduce job satisfaction and
employee commitment and lead to turnover intention. Numerous studies showed that
organizational justice was negatively correlated with turnover intention. For example,
Chaoping and Kan (2003) confirmed the internal justice pertaining employee
recognition influenced on turnover of managers (Fischer, Ferreira & Jiang, 2011).
According to Cui,Cao, Chen, and Song (2013) the effect of total rewards are to reduce
the turnover intention, and the results highlight the importance of organization
development, career opportunity and performance appraisal which could retain the core
employees. Past researchers such as (Henryhand, 2009 & Cambell, 2012); (Dale &
Burrell, 2014) have found a negative relationship between receipt of recognition and
the variable turnover. Finally, Deal (2007), reported that recognition as one thing their
organization can offer employees in exchange for their retention and commitment.
2.7 Underpinning Theory
In 1959, Frederic Herzberg has developed motivation-hygiene theory or known as Two
Factor Theory which examine factor causing job satisfaction in workplace. Herzberg’s
Two Factor Theory closely related to the intrinsic variables includes growth,

29
advancement, responsibility, achievement and work itself. Herzberg claimed that
employees are motivated by internal values rather than values that are external to the
work. In other words, motivation is internally generated and is propelled by variables
that are intrinsic to the work which Herzberg calls as “motivators”. Conversely, certain
factors cause dissatisfying experiences to employees; these factors largely results from
non-job related variables (extrinsic) such as; co-workers relationship, salary, company
policy and leadership style.
The theoretical framework underpinned by the Two Factor Theory. The researcher has
discussed two factors in this research. According to Herzberg there are some job factors
that result in satisfaction while there are other job factors that prevent dissatisfaction.
Basically, this theory explains about the two factors; hygiene (extrinsic) and motivation
(intrinsic). The researcher classified leader facilitation and workgroup support into
hygiene factors. While role overload and employee recognition classified into
motivation factors. Hygiene factors may lead to employee dissatisfaction if the PHEIs’
management fails to manage well. While, motivation factors may lead to job
satisfaction if the management managed it well. The theory used in the study to gain a
better understanding on the relationship between role overload, leader facilitation and
support, workgroup support and employee recognition.
2.8 Summary.
This chapter focuses on relevant reviews of literature that focused on the relationship
between role overload, leader facilitations, workgroup support and employee
recognition on turnover intention. Research methodology of his study will be discussed
in detail in chapter 3.

30
CHAPTER 3
METHODOLOGY
3.1 Introduction
This part the research design and method used to obtain the required data for answering
the research question. The methodology of research which comprise of research
framework, hypothesis development, research design, measurement of variables,
population and sampling pretest, data collection methods, and techniques of data
analysis.
3.2 Research Framework
Figure 3.1 illustrate the theoretical framework for this study which adapted from
(Parker et al. 2003). There are four independent variables for this study which are; role
overload, leader facilitation, workgroup support, employee recognition and one
dependent variable which is, turnover intention. The theoretical framework
underpinned by Frederic Herzberg’s Two Factor Theory. The underpinning theory
explains about two different classifications of factors which lead to lecturers’ turnover
intention in PHEIs in Negeri Sembilan. The first classification is the hygiene factors
which are leader facilitation and workgroup support. The second classification is the
motivation factors which are role overload and employee recognition. The both
classifications of factors may lead to job dissatisfaction among lectures if mismanaged
by the management of PHEIs in Negeri Sembilan.

31
Figure 3.1
Theoretical Framework.
Theoretical Framework Adapted From C.P.Parker et al. (2003).
3.3 Hypotheses Development
There are five hypotheses proposed for this study. Based on research done by Pienaar,
Sieberhagen, and Mostert (2007) role overload made a significant contribution to
explaining the variance in turnover intention. Similarly, according to Jones et al.
(2007), role overload will be positively correlated to turnover intention. Managing with
greater job demand will lead to time pressure due to high responsibility. The increasing
work demand will create a situation, whereby an individual is unable to fulfill their
additional work requirement which will directly contribute to high turnover intention.
Therefore, based on the evidence of previous studies there is a relationship between
role overload and lecturers’ turnover intention.
Hypothesis 1: There is a relationship between role overload and turnover intention.

32
According to Wolf and Yadav (2015) leader facilitation shared a negative correlation
with turnover intention. Transformational leadership directly decreases turnover
intention. According to Dupre and Day (2007) supportive management of employees
was negatively associated to turnover over the mediating effect of job satisfaction.
According to Alexandrov, Babakus and Yavas (2007) claim that employee’s perception
of management concern for both employees and customers have a significant influence
on turnover intention. High leader facilitation such as, direct, coordinates and motivates
employees likely to reduce turnover intention in organization. Hence, according to the
above literature reviews researchers come out with a hypothesis that there is a
relationship between leader facilitation and lecturers’ turnover intention.
Hypotheses 2: There is a relationship between leader facilitation and turnover
intention.
According to Hobfoll and Freedy (1993) Theory of Conversation of Resources (COR)
whenever an employee not receives workgroup support from co-worker exhaustion
may occur. Whenever workgroup support lost stress may occur and individual cannot
deal with their stress which leads to turnover intention among employees. According
Lee (2004), workgroup supports are negatively related to turnover intention. An
individual with high workgroup support feel happy and motivated to work with their
organization and they are less likely to leave the organization. Based on past researches
evidence, researcher has develop a hypothesis that there is a relationship between
workgroup support and lecturers’ turnover intention.
Hypotheses 3: There is a relationship between workgroup support and turnover
intention.
33
According to Wen (2013), there is a significant relationship between dependent variable
turnover intention and independent variable employee recognition. The failure to be
rewarded as expected may lead to frustration and make them no motivated and
eventually will quite the job (Maicibi, 2008). Employee will stay engaged with the
organization as long as the rewards offered by the organization are at least equal to or
greater than the contribution required by the organization (March & Simon, 1958).The
past researches show that reward influence employees to retain with the organization
and switch employees to join with other organization that provide more attractive
reward to them. When the level of reward is high, turnover intention is low. Pass studies
(Motley, 2005 & Saunderson, 2004) suggested that there is a valid relationship between
rewards and recognition and lecturers intent to stay with their organization. Researcher
has come out with a hypothesis that there is a relationship between employee
recognition and lecturers’ turnover intention.
Hypotheses 4: There is a relationship between employee recognition and turnover
intention.
According to Memon et al. (2010), numerous research studies have been conducted on
the role of human resource policies in mitigating voluntary turnover, and majority of
the studies, mainly focus on employee recognition as a contributing factor for turnover
intention. Usually, employees who receive lower reward and recognition will slow
down their job performance and tend to leave their job. In this scenario, most of the
private higher education institutions’ lecturers feel demotivated with the private
institutions’ reward and recognition programs and begins to slow down their
contributions to the institution. Pass researches have indicates strong and weak effects
on employee turnover intention. According to Oluwafemi (2013), contextual variables
34
(distributive, procedural, and interactional justice in group) have influence 98% to
employee turnover intention. Research done by Hayes (2015), demographic
characteristic indicates 78% on employee turnover intention. Some researches has
indicates weak effects of employee turnover intention. Long et al.(2012), had indicated
weak 13% influence between leadership styles and turnover, Medina (2012), specify
that job satisfaction influence almost 17% to the employee turnover intention and
Gbadamosi and Chinaka (2011) stipulated 21% of job efficiency has influence
employee turnover intention. Hence based on the pass researches there are some factors
influencing on the employee turnover intention. Researcher has come out with a
hypothesis that there is effect on role overload, leader facilitation, and workgroup
support and employee recognition.
Hypotheses 5: There are effects on the role overload, leader facilitation, and
workgroup support and employee recognition.
3.4 Research Design
There are two types of research design, which are qualitative and quantitative research
design. In this study, a quantitative research design was used to collect data. According
to Saunders, Lewis and Thormhill (2012) quantitative research is often used as a
synonym for any data collection techniques such as questionnaires or data analysis
procedure such as graphs or statistic that generate or uses numerical data. Quantitative
research has answered questions about relationship among the measured variables with
the purpose of predicting, controlling phenomena, and explaining. The reason of using
this research design is to save cost and time in analyzing data.

35
Cross sectional research method was used for this study. The data were collected,
analyzed, summarized statistically and the conclusion was drawn at one specific point
in time. This research used cross sectional method for the data collection process
because of less biased and more accurate Sekaran and Bougie (2010), Cross sectional
study is more applicable to be used compared to longitudinal study because of time
constrain to collect data from all he responded. Though longitudinal study delivers the
cause effect results, however its take length of time to get the result. Thus, longitudinal
study not appropriate for this study.

36
3.5 Operational Definition.
Table 3.1 Definition of Variables Terms Definitions Turnover Intention Turnover intention is a demand to attain high task
demands in the logic that worker have thought about revolution but have not yet acted to seek change (Gosselin, 2001).
Role Overload
Role overload clarified as having excessive work burden and having too much amount work to do (Conley & Woosely, 2000).
Leader facilitation Leader facilitations and support reflects the perception of leaders ‘ behaviors such as the extent to which the leaders was seen as helping to accomplish work goals by mean of scheduling activities planning and providing personal support (Kocolowski, 2010)
Workgroup support Workgroup is classify as cognitively closer entity, employees tend to attribute a perceived sense of control and the resulting positive emotions to their workgroup rather than to the organization as a whole (Pienaar, 2007).
Employee recognition Employee recognition emphasizes care as a structure of values and organizing principles centered on fulfilling employees’ needs, promoting employees’ best interests, and valuing employees’ contributions (McAllister and Bigley, 2002).
3.6 Unit of Analysis
The unit of analysis for this research is lectures from PHEIs in Negeri Sembilan. The
demand for higher education increase day-by-day. According to Malaysia Higher
Education Blueprint 2015-2025 total 608,378 students enrolling in 513 PHEIs in
Malaysia. This number is greater than Public Institutions of higher nation with total
566,266 students enrolled in 20 Public Universities in Malaysia. In current business
environment demand for higher education institutions keep increasing. Public
University in Malaysia only extends their education services for selected course and
selected qualified students. The rest of students seek for privatized higher education
institutions for their further studies. PHEI become more famous than Public Institutions
of higher nation. Massive development in Malaysian higher education requires more

37
talented academician to serve the PHEIs. PHEIs’ management faces problem with
demand and supply of qualified lecturers for their institutions. The demands for
lecturers are high and at the same time the turnover rate for PHEIs’ lecturers are high
as well. Researcher had chosen PHEIs’ lecturers in Negeri Sembilan to identify the
intrinsic and extrinsic factors of turnover intention. Total five PHEIs in negeri Sembilan
were chosen for this research. However, researcher finalized only two out of five PHEIs
for further study due to the number of response. Overall 152 lecturers were selected as
a sample of this research.
3.7 Research Instrument.
Section A contains demographic profile such as; gender, age group, highest education
qualification, current position, length of employment, type of employment, monthly
income and faculty of working. Section B, C, D, E comprises measures of role overload,
leader facilitation, workgroup support and employee recognition. Lastly Section F
covers questionnaires related to turnover intention (dependent variable). The
questionnaires were distributed in English which comprise 58 questionnaires and
divided into 5 sections as stated below;

38
Table 3.2 Questionnaire Section and Description. Questionnaires Section Description Section A This section comprise of 8 items respondent’s
demographic profile such as gender, age group, highest education, current position, length of employment, type of employment, monthly income and faculty of working.
Section B This section contains of 10 items measuring role overload.
Section C This section comprise of 10 items measuring leader facilitation.
Section D This section comprise of 10 items measuring workgroup support.
Section E
This section comprise of 10 items measuring employee recognition.
Section F This section comprise of 10 items measuring turnover intention.
3.8 Validity Test
Validity test can be classified into content validity and construct validity. All the
instrument adopted from five established instrument and used by many researcher
before. The instruments for independent variables were adopted from Harris and Bladen
(1994) for role overload, Scandura & Graen (1984) for Leader facilitation, Vragenlijst
et al. (1986) for workgroup support and Noviello, (2000), for employee recognition.
Meanwhile, the dependent variable (turnover intention) was obtained from Cammani,
Fichman, Jenkins & Klesh, (1983). The construct validity of the instrument, factor
analysis was conducted in this study. The result of factor analysis is discussed in chapter
4.

39
3.9 Dependent Variable
The following section exposes the instrument for dependent variable for his study.
3.9.1 Turnover Intention.
The measurement for turnover intention adapted from the Michigan Organizational
Assessment Questionnaire (Camman, Fichman, Jenkins & Klesh, 1983). The
instrument was obtained from a research done by (Chen et al.1998). These measures
contain 10 items with internal consistency Coefficient Alpha 0.78. Similar instrument
has been used by Rahman et al. (2014), also found, Cronbach Alpha value 0.75 and
Chaztzoglou et al.(2011), indicate results of 0.80 which makes this instrument more
reliable The five-point Likert scale (1= strongly disagree to 5= strongly agree) is used.
The items for the turnover intention variable are listed in Table 3.3.
Table 3.3 Items for Turnover Intention Variable. Variables Items Turnover Intention 1. It is very possible that I will look for new job next year.
2. I often think about quitting my job at this organization. 3. I intend to remain with this organization indefinitely. 4. I feel that I could leave this job. 5. I intend to look for a job outside of this organization
within next year. 6. I am actively searching for an alternative to the
organization. 7. I think a lot about leaving this organization. 8. I intend to leave this organization this year 9. As soon as possible, I will leave the organization 10. If I may choose again, I will choose to work for the
current organization.
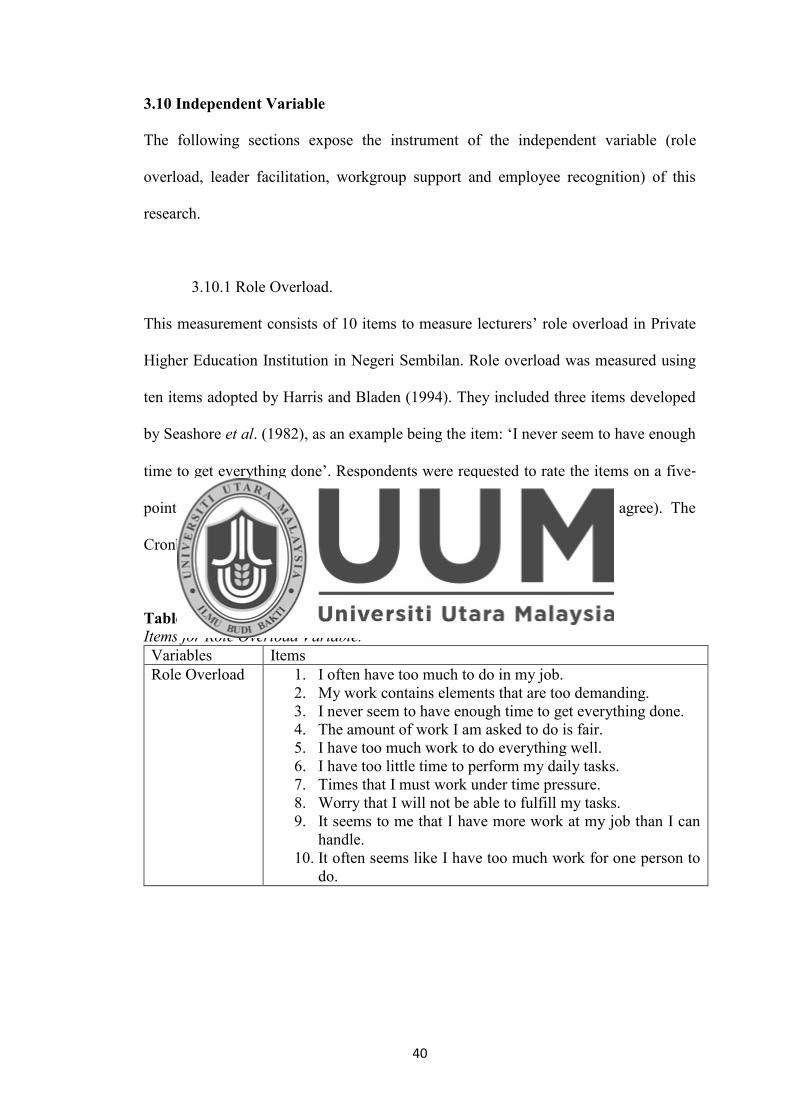
40
3.10 Independent Variable
The following sections expose the instrument of the independent variable (role
overload, leader facilitation, workgroup support and employee recognition) of this
research.
3.10.1 Role Overload.
This measurement consists of 10 items to measure lecturers’ role overload in Private
Higher Education Institution in Negeri Sembilan. Role overload was measured using
ten items adopted by Harris and Bladen (1994). They included three items developed
by Seashore et al. (1982), as an example being the item: ‘I never seem to have enough
time to get everything done’. Respondents were requested to rate the items on a five‐
point Likert scale ranging from 1 (strongly disagree) to 5 (strongly agree). The
Cronbach's alpha coefficient of the role overload items is 0.77.
Table 3.4 Items for Role Overload Variable. Variables Items Role Overload 1. I often have too much to do in my job.
2. My work contains elements that are too demanding. 3. I never seem to have enough time to get everything done. 4. The amount of work I am asked to do is fair. 5. I have too much work to do everything well. 6. I have too little time to perform my daily tasks. 7. Times that I must work under time pressure. 8. Worry that I will not be able to fulfill my tasks. 9. It seems to me that I have more work at my job than I can
handle. 10. It often seems like I have too much work for one person to
do.

41
3.10.2 Leader Facilitation.
Measurement used for leader facilitation items were developed by The Leader-Member
Exchange (LMX) scale (Graen & Cashman, 1975 Liden & Graen,1980). The
instrument was obtain and adapted from Scandura and Graen (1984) and the cronbach
alpha was 0.84. Leader facilitation was measured using ten items to measure leaders
support as an example ‘my boss is flexible about how I accomplish my job objectives’.
The five-point Likert scale (1= strongly disagree to 5= strongly agree) is used in this
questionnaires. The items for the leader facilitation variable are listed in Table 3.5
Table 3.5 Items for Leader Facilitation Variable Variables Items Leader Facilitation.
1. My boss is flexible about how I accomplish my job objectives.
2. My manager is supportive of my ideas and ways of getting things done.
3. My boss gives me the authority to do my job as I see fit. 4. I can trust my boss to back me up on decisions I make in
the field. 5. My supervisor understands my job problems and needs
very well. 6. My supervisor is willing to listen to my problems. 7. My supervisor asks employees for their suggestions on
what assignments should be made. 8. My supervisor treats all the employees she/he supervises
as his/her equal. 9. My supervisor is friendly and approachable. 10. My supervisor asks employees for their suggestions
concerning how to carry out assignments.
3.10.3 Workgroup Support.
The measurement used for workgroup support adapted from a Dutch questionnaire on
organizational stress Vragenlijst et al.(1986). The instrument was attained from
(Houkes, Janssen, Jonge & Bakker, 2003). This measurement contains 10 items to
measure workgroup support for instance ‘If problems exist at my work, I can discuss

42
them with my colleagues’. Coefficient Alpha values for this 10-item was 0.85. The five-
point Likert scale (1= strongly disagree to 5= strongly agree) is used. The items for the
workgroup support variable are listed in Table 3.6.
Table 3.6 Items for Workgroup Support Variable. Variables Items Workgroup Support
1. When I encounter problems at work, there is always a co-worker to turn to.
2. My co-worker supports me. 3. If problems exist at my work, I can discuss them with my
colleagues. 4. There is someone at work who encourages my
development. 5. I have a best friend at work. 6. Our department’s committees, councils, and teams are
robust and active. 7. Employees in my department regularly recognize each
other and participate enthusiastically in any department recognition events.
8. There is a strong sense of connection, of community, among people in the department.
9. When an employee is having problems, other people in the department rally around and helps in constructive ways.
10. A strong, consistent network of coaching is available to employees in this department.
3.10.4 Employee Recognition.
Employee recognition was measured using a survey instrument previously validated
during a pretest pilot study at Aerospace Manufacturing the instrument was obtained
from a research done by (Noviello, 2000). This measurement contains 10 items to
measure perceived employee recognition and the cronbach alpha was 0.83. The five-
point Likert scale (1= strongly disagree to 5= strongly agree) is used. The items for the
employee recognition variable are listed in Table 3.7.

43
Table 3.7 Items for Employee Recognition Variable. Variables Items Employee Recognition.
1. How satisfied are you with the amount of communication regarding employee recognition?
2. How satisfied are you with the number of times you have been recognized in the past year?
3. How satisfied are you that the achievements are worthy of recognition?
4. How satisfied are you with the type and value of the rewards presented?
5. How satisfied are you that receiving recognition motivates you to improve your performance?
6. How satisfied are you that the employee recognition process is a valuable tool for showing gratitude and recognizing performance?
7. How satisfied are you with the type of audience present at your recognition?
8. How satisfied are you with management's participation and role in your recognition?
9. How satisfied are you that the employee recognition process be continued?
10. Overall, how satisfied are you with employee recognition?
3.11 Population and Sampling.
The target populations in this study are lecturers who working in Private Higher
Education Institution (PHEIs) in Negeri Sembilan, Malaysia. Initially, the researcher
has approach five (5) PHEIs lecturers in Negeri Sembilan which are; KTG Education
Group, Inti University Nilai, University Sains Islam Malaysia (USIM), Kolej Tafe and
Nilai University. However, very few responds returned from University Sains Islam
Malaysia (USIM), Kolej Tafe and Nilai University. The researcher has selected (2) two
PHEIs for sample population. The first one is KTG Education Group formally known
as (Legenda Education Group). Second one is INTI International University College.
The primary reason for choosing this sample populations are because, both institutions
have higher number of lecturers and international students in Negeri Sembilan.
Therefore, targeting this group of lecturers would be the most suitable to determine the

44
rationale behind turnover in PHEIs in Negeri Sembilan. According to the sampling
frame, there are total 250 lecturers working in the chosen PHEIs in Negeri Sembilan.
Overall 100 lecturers works in KTG Education Group and 150 works in Inti University
Nilai. The sample size decided based on a given population size table from Krejie and
Morgan (1970). Therefore the appropriate sample size for given population of 250 is
precisely 152(n). In this regards, the researches has use Google survey and direct
approach to distribute the questionnaires to lecturers from (2) two different PHEIs in
Negeri Sembilan.
There are several methods of selecting sample and it can be classified into two
probability and non-probability (Sekaran, 2003). In this regards the researcher has
decided to choose non-probability, which is purposive sampling for this study.
Purposive sampling means a kind of judgmental, selective, or subjective sampling
which focus on particular characteristic among the population who willing to participate
in this research.
3.12 Pretest.
Researcher tests the questionnaires on 10 March 2016. All the adapted questionnaires
by the researchers were counter checked by the supervisor. Researcher had distributed
30 questionnaires to selected PHEIs’ lecturers for pilot testing. Respondents are
requested to give feedback on adapted questionnaires. Moreover, researcher had made
sure there are no uncertainties arise out of the questions asked in the surveys.
Furthermore, researcher had carried out pilot testing to determine the reliability of each
variable. Based on this pilot testing researcher would able to know whether the items
used understandable by the respondents. The result presented in Chapter 4 Table 4.1

45
3.13 Data Collection Procedures.
Questionnaires are used as the primary tools to collect data from respondents.
Generally, questionnaires can save cost and can get fast response from large group of
respondents. The anonymity data collected among respondents will be preserved and
can lead to more reliable response Schermerhorm et al. (2000). Researcher had
contacted few Faculty Deans and Deputy Deans with cover letter and sample of
questionnaires for asking permission to distribute the survey. In regards with this the
both PHEIs in Negeri Sembilan agree to participate in this study. Therefore, the
researcher distributes 100 questionnaires to KTG Education Group, 70 questionnaires
to INTI International University College on 17tth March 2016. The respondents in KTG
Education group given (2) two consecutive days to complete the questionnaires. After
(2) two days, the researcher had only collected (85) eighty five questionnaires out of
(100) one hundred from KTG Education Group. Meanwhile, researcher had collected
in return (67) sixty seven questionnaires out of (70) from INTI International University
College.
3.14 Techniques of Data Analysis.
All the data collected from respondents analyzed by Statistical Package for Social
Science (SPSS) version 16.0 software. All the items were coded before entered in
computer. Results are precise using descriptive analysis (frequency, percentage and
mean), and inferential statistics (Cronbach’s Alpha, Pearson Correlation and Multi-
Regression). Researcher use descriptive analysis to analyze demographic
characteristics such as; gender, age group, highest education qualification, current
position, length of employment, employment status, monthly income and faculty of

46
working. Besides, Cronbach’s Alpha coefficients were computed to examine the
consistency and reliability of the instrument (Cavana et al. 2001). Pearson correlation
analysis was used in this study to test degree of direct relationship between dependent
variable and independent variable of this research. Finally, Multiple Regression
Analysis was used to test the hypotheses developed for the study.
3.15 Summary.
This chapter gives an insight about the research methodology that is applied in this
study. In the next chapter, pattern and analysis of the result from actual responses has
been interpreted and discussed in detail.

47
CHAPTER 4
FINDINGS
4.1 Introduction
This chapter covered the outcome of the study using descriptive statistic, inferential analysis,
correlation and regression. The study begins with reliability analysis, descriptive statistics where
this analysis obtainable the respondent’s demographic characteristic such as gender, age, current
position, length of employment, type of employment, monthly income and faculty of working.
The analyses continue to factor analysis and correlation analysis. Finally, multiple regression
analysis was used to study the relationship between independent variables such as role overload,
leader facilitation, workgroup support, employee recognition, and turnover intention as a
dependent variable.
4.2 Reliability Analysis
Generally, Cronbach’s Alpha refers to coefficient of reliability. Sekaran (2010), claimed that
reliability coefficient will specify how well the items in the set are positively correlated each other.
The closer and better reliability coefficient gets to 1 and those values more 0.80 are measured as
well. Thus, 0.70 is considered adequate and reliability value less than .60 represents to be poor
(Sekaran, 2003). In this study, a reliability analysis was carried out for each independents variables
and dependent variable for (2) two times. Initially, Cronbach Alpha examined based on pilot
testing. The second Cronbach Alpha determined after drop of certain items as presented in Table
4.1.

48
Table 4.1 Summary of Reliability Analysis. Variables Cronbach Alpha
By original researcher
Pilot Test Cronbach Alpha
Actual Cronbach Alpha
Dependent Variable Turnover Intention
0.78
0.888
0.955
Independent Variable Role Overload Leader Facilitation Workgroup Support Employee Recognition
0.77 0.84 0.85 0.83
0.828 0.959 0.877 0.925
0.952 0.933 0.955 0.952
Table 4.1 illustrates the results of Cronbach’s Alpha for reliability test of the variables. In pilot
testing, leader facilitation has the greatest Cronbach’s Alpha value of 0.959 followed by employee
recognition encompassing Cronbach’s Alpha value of 0.925, workgroup support comprising of
0.8777, role overload 0.828 and the dependent variable turnover intention indicates Cronbach’s
Alpha value 0.888. In actual Cronbach Alpha workgroup support indicates the high value which
is 0.955. Additionally, both role overload and employee recognition shows 0.952, followed by
leader facilitation 0.933 and turnover intention the dependent variable indicates 0.955. Moreover,
in pilot testing both dependent variable and independent variable shows Cronbach’s Alpha value
above than 0.80 (see Table 4.1), which considered as reliable and suitable for further analysis.
Eventually, both dependent and independent variables are higher than 0.80 which is considered
good.

49
4.3 Normality Test
Normality test use for the investigation of the questionnaires whether the sample is normally
distributed or not. Factor analysis is robust to assumptions of normality. However, if variables are
normally distributed, then the solution is improved. Normality test is performed by determining
skewness and kurtosis for all variables. This allows with simple rule need to be applied whereby,
the Z value need to be divide either score by its standard error and the result is greater than ±1.96,
it suggests that the data are not normal distributed with respect to that statistic. As may be seen in
Table 4.2, two independent variables and the dependent variable are normally distributed as the
skewness and kurtosis values are within the range of ± 1.96.
Table 4.2 Result of Skewness and Kurtosis for Every Variable
However, one independent variable (role overload) skewness value is greater than the range of ±
1.96 which is not normally distributed. Role overload was not normally distributed because of the
degree of data. Most of the responses for this variable are same and this can be classified
acceptance sampling. According to Steland and Zahle (2000), acceptance sampling is concerned
with the (optimal) construction of sampling plans to accept or reject a possibly large portion based
on a small sample. It is not actually necessary for sample data to follow a normal distribution in
order to subject the data to parametric statistical analysis and it is usually happen with the smaller
Variable Range Conclusion Skewness Kurtosis
Psychological Factors (IV) Role Overload Leader Facilitation Workgroup Support Employee Recognition Turnover Intention (DV)
-2.482 -0.681 -1.074 -1.714 -0.660
-0.020 -1.178 1.296 0.430 -0.617
Not Normal distribution Normal distribution Normal distribution Normal distribution Normal distribution

50
sample sizes. Apart from that, there are other methods to implement normality test, among others
stem and leaf plot, box plot and normal Q-Q plot. Histogram and Q-Q Plot for the variables tested
are shown in Appendix.
4.4 Factor Analysis.
Generally factor analysis piloted to reduce the complexity in a set of data. In this research factor
analysis conducted to removes redundancy or duplication from a set of correlated variables. Factor
analysis has screen out the unwanted items. In the present study comprises of 152 respondents but,
it was necessary to conduct the factor analysis to ensure the construct validity. The result of factor
analysis was done separately according to each variable.
4.4.1 Factor Analysis for Dependent Variable.
Table 4.3 KMO and Bartlett’s test for Dependent Variable Turnover Intention
In this research, turnover intention classified as dependent variables for the four variables; role
overload, leader facilitation, workgroup support and employee recognition. The dependent
variable identified Kaiser-Meyer-Olkin (KMO) Measure of Sampling Adequacy value of 0.848.
In spotting the total variance described, four items have been removed because of the eigenvalues

51
greater than 1. The few factors would explain 78% of the variance. In affecting the distribution of
items according to factors, it is attained by using varimax rotation.
4.4.2 Factor Analysis for Independent Variables.
In this research, role overload, leader facilitation, workgroup support and employee recognition
are classified as independent variables. Namely, there were four psychological factors as a
predictor of turnover intention. The first independent variable role overload indicated Kaiser-
Meyer-Olkin (KMO) Measure of Sampling Adequacy value is 0.748 exceeding the recommended
value of 0.6 (Kaiser, 1970) and the Bartlett’s Test of Sphericity reached statistical significance
0.000. In examining the anti-image correlation matrix, it reveals the presence of coefficients of 0.5
and above.
Table 4.4 KMO and Bartlett’s Test for Role Overload
In investigating the total variance explained, few factors were extracted because they have
eigenvalues greater than 1. The few factors would explain 67% of the variance. In identifying the
distribution of items according to factors, it is achieved by using varimax rotation. The rotated
factor matrix indicates that two solutions are evident in the data.

52
Table 4.5 KMO and Bartlett’s Test for Leader Facilitation.
The second independent variable is leader facilitation and the Kaiser-Meyer-Olkin (KMO)
Measure of Sampling Adequacy value is 0.838 which exceed 0.60 the standard value for factor
analysis. In examining the total variance explained, no any factor has been removed because they
have eigenvalues greater than 1.
Table 4.6 KMO and Bartlett’s Test for Workgroup Support.
The third independent variable for this research is workgroup support. Third variable indicate
0.711 which exceeds 0.60 of the recommended KMO value. In investigating the total variance
explained, only one factor has extracted because they have eigenvalues greater than 1. The one
factor would explain 78% of the variance. In determining the distribution of items according to
factors, it is achieved by using varimax rotation.

53
Table 4.7 KMO and Bartlett’s Test for Employee Recognition
The last independent variable is employee recognition and the Kaiser-Meyer-Olkin (KMO)
Measure of Sampling Adequacy value is 0.725 which exceed 0.60 of the ordinary value for KMO.
In observing the total variance explained, one factor has been removed because they have
eigenvalues greater than 1. The one factor would explain 68% of the variance. In shaping the
distribution of items according to factors, it is achieved by using varimax rotation.
4.5 Descriptive Analysis.
4.5.1 Response Rate.
Overall 250 lectures were works in the chosen institutions which are KTG Education Group (100)
and Inti International University (150). Total 100 questionnaires distributed to lecturers working
in KTG and 70 questionnaires distributed to lectures working in Inti International University. Out
of 170 questionnaires, 156 were returned, which is 91.76 % response rate. In overall 156
questionnaires, 4 (2.56%) were incomplete. Therefore, only 152 questionnaires which found
89.20% were used for further analysis. According to Hair et al. (2010), a response rate above 50%
are usually considered acceptable, however it is more desirable if the response rate is 80% and
above. Eventually, 89.20% response rate is appropriate and suitable for this study.
4.5.2 Respondents’ Demographic Characteristic.

54
The respondents’ demographic characteristic clearly illustrated in table 4.8. Based on the
frequency analysis, 92 (60.5%) respondents were female and 60 (39.5%) were male. The majority
of respondents were between the ages of 24 to 34 years old (53.9%). Most of them were
categorized as young lecturers. Majority of the Lectures (69.7%) obtained Master Degree as their
highest education qualification. Meanwhile, In terms of current position, the job title of ‘Lecturer’
made up the highest respondents which comprise 116 or 76.3%. In terms of length of employment
59 or 38.8% respondents had below than 2 years of length of employment in this lecturing field.
Moreover, majority of respondents’ employment status are in contract basis which consist 86
(56.6%). In terms of monthly income, most of the lecturers in Private Higher Education Institutions
in Negeri Sembilan earning between RM 3001 to RM 4000. Majority of lectures works in the
Faculty of Business Management.
Table 4.8 Profile of Respondents.
Demographic Characteristics Frequency Percentage (%) Gender Male
Female 60 92
39.5 60.5
Age 24-34 35-45 46-56 > 56
83 36 18 15
54.6 23.7 11.8 9.9
Highest Education Qualification PHD DBA Master Degree Bachelor Degree Diploma Professional
17 5 101 21 1 7
11.2 3.3 66.4 13.8 0.7 4.6
Current Position
Dean Professor Associate Professor Senior Lecturer Lecturer
3 8 4 21 116
2.0 5.3 2.6 13.8 73.6

55
Table 4.8(Continued)
Demographic Characteristics Frequency Percentage (%) Length of Employment Below than 2 years
2 years to 5 years 5 years to 10 years More than 10 years
59 44 39 10
38.8 28.9 25.7 6.6
Type of Employment Permanent Contract Outsource Expatriate
54 86 2 9
35.5 56.6 2.0 5.9
Monthly Income (RM) < 3000 3001 – 4000 4001 – 5000 5001 – 6000 6001
29 50 41 12 20
19.1 32.9 27.0 7.9 13.2
Faculty
Business Management Information Technology Engineering Hospitality Medical Arts Linguistic
99 17 15 6 4 7 4
65.1 11.2 9.9 3.9 2.6 4.6 2.6
4.5.3 Mean and Standard Deviations.
Table 4.9 Descriptive Statistics of the Dependent and Independent Variables. Variable Mean Standard Deviation Turnover Intention 3.875 5.960 Role Overload 3.906 5.720 Leader facilitation 2.222 7.699 Workgroup Support 2.338 8.552 Employee Recognition 2.276 7.834

56
All the variables are evaluated based on a 5-point scale. The Table 4.9 shows the mean value for
turnover intention (M= 3.875), role overload (M=3.906), leader facilitation (M=2.222), workgroup
support (M=2.338) and employee recognition (M=2.276). The standard deviation which was used
to measure the dispersion of interval and ratio scale, offers an index of the spread of distribution
of the variability I the data. The Table 4.3 above show that the standard deviation for turnover
intention (SD=5.960), role overload (SD=5.720), leader facilitation (SD =7.699), Workgroup
support (SD =8.552) and employee recognition (SD =7.834).
4.6 Correlation Analysis
Table 4.10 Correlation Results between Independent Variables and Turnover Intention
Variables
TI
RO
LF
WS
ER
Turnover Intention (TI)
Pearson Correlation Sig. (2-tailed) N
1
152
.725**
.000
152
-.669**
.000
152
-.750**
.000
152
.801**
.000
152
Role Overload (RO)
Pearson Correlation Sig. (2-tailed) N
.725**
.000
152
1
152
.783**
.000
152
.663**
.000
152
.703**
.000
152
Leader Facilitation (LF)
Pearson Correlation Sig. (2-tailed) N
-.669**
.002
152
.783**
.015
152
1
152
.633**
.000
152
.660**
.000
152

57
Table 4.10(Continued)
**Correlation is significant at the 0.01 level (2-tailed)
This part will illuminate the result of Pearson Correlation Statistical analysis to identify the
association between independent variables (role overload, leader facilitation, and workgroup
support and employee recognition) and dependent variables (turnover intention). According to
Sheridan (2011), a Pearson product-moment correlation coefficient describes the relationship
between two continuous variables, and is available through the analysis and correlate menus. Table
below developed table 4.10 display the correlation result between turnover intention, role overload,
leader facilitation, workgroup support, and employee recognition. The result obtained show that
there was a strongly significant and positive relationship between role overload and turnover
intention ( r = .725**, p ≤ 0.01).This indicated that high level of role overload increase the turnover
intention among Private Higher Institutions’ lecturers in Negeri Sembilan.
Variables
TI
RO
LF
WS
ER
Workgroup Support (WS)
Pearson Correlation Sig. (2-tailed) N
.750**
.040
152
.663**
.000
152
.633**
.000
152
1
152
.824**
.000
152 Employee Recognition (ER)
Pearson Correlation Sig. (2-tailed) N
.801**
.024
152
.703**
.002
152
.660**
.000
152
.824**
.000
152
1
152

58
Additionally, leader facilitation and turnover intention shows significantly negative relationship (r
= -.669**, p ≤ 0.01) . Whereby, greater level of leader facilitation decreases the intention to quit
among lectures in PHEIs Negeri Sembilan. Meanwhile, workgroup support and turnover intention
shows strongly significant and negative relationship (r = -.750**, p ≤ 0.01). Hence greater
workgroup support lower the turnover intention among lecturers in Private Higher Education
Institution. Moreover, the findings revealed there was strongly significant and negative
relationship between employee recognition and turnover intention (r = -.801**, p ≤ 0.01).
Therefore, the greater level of employee recognition has reduced the turnover intention among
PHEI’s lecturers.
4.7 Multiple Regression Analysis of the Variables.
Multiple regression analysis is used when there are more than one independent variable is used to
explain variance in a dependent variable. In this study, researcher would like to examine whether
these four independent variables (psychological factors) are significant in explaining the variance
in dependent variable (turnover intention).The Multiple Regression Analysis was completed to test
the hypotheses developed in this study. Multiple Regressions is an extension of bivariate
correlation. R square delivers a measure of how well the data points are simulated by model, as
the proportion of total variation of outcomes explained by the model.

59
Table 4.11 Multiple Linear Regression (Model Summary).
Table 4.11 shows the coefficient of determination value (R²) is equal to 0.709. It means that 70%
variations of turnover intention have explained by the four independent variables (role overload,
leader facilitation, and workgroup support and employee recognition). On the other hand, it
specifies that 30% variation of the turnover intention remained unexplained under this model and
can be explained by other variables. Therefore, psychological factors (independent variables) have
contributed 70% to lectures turnover intention (dependent variable) in PHEIs in Negeri Sembilan.
Table 4.12 Multiple Linear Regression Analysis (ANOVA).

60
F-test is used to examine whether the two populations of variances are identical. The aim of F-test
is to determine the model which finest suits the population from which the data were tested and
collected. Denoting to Table 4.12, the F-value is 89.747 with a p-value of 0.000. As the p-value of
ANOVA is less than the significance level 0.05, it means that the four independent variables have
a significant relationship with turnover intention.
Table 4.13 Multiple Linear Regression Analysis (Coefficients). Model
Unstandardized Coefficients Standardized Coefficients
t Sig
B Std.Error B Constant 28.479 3.203 8.893 .000 Role Overload .242 .082 .232 2.960 .004 Leader Facilitation -.067 .057 -.086 -1.164 .246
Workgroup Support -.136 .056 -.195 -2.419 .017
Employee Recognition -.320 .065 -.420 -4.946 .000
The beta values of (see Table 4.13) role overload respectively indicate there is a strong significant
relationship with turnover intention. Workgroup support and employee recognition shows the beta
value of -.195, p ≤0.17 and -.420, p ≤0.00. Therefore workgroup support and employee recognition
correspondently indicate there is a significant relationship with turnover intention. However leader
facilitation has a low significant relationship with turnover intention by indicating the beta value
of -.086, p ≤0.246. Leader facilitation significant value has exceeded standard P value 0.05. In
other word, role overload, workgroup support and employee recognition is more useful to predict
the turnover intention of the lecturers as compare to leader facilitation.

61
4.8 Summary of Hypotheses Testing.
Table 4.14 Summary of Hypotheses Testing.
Hypothesis Result HI There is a significant relationship between role overload
and turnover intention (β .232, p ≤0.04 ).
Accepted
H2 There is a significant relationship between leader facilitation and turnover intention (β -.086, p ≤0.246).
Accepted
H3 There is a significant relationship between workgroup support and turnover intention (β -. 195, p ≤0.17).
Accepted
H4 There is a significant relationship between employee recognition and turnover intention (β -.420 , p ≤0.00).
Accepted
H5 There are effects on the role overload, leader facilitation, and workgroup support and employee recognition (R² = 0.709).
Accepted
As a summary the result of study show that employee recognition affects more on PHEIs lecturers’
turnover intention. Employee recognition and workgroup support has negative relationship with
turnover intention. Hence regular employee recognition and high level of workgroup support
reduce the turnover intention among PHEIs lectures in Negeri Sebilan. Role overload has a strong
positive relationship with turnover intention. Hence excessive role overload lead to greater
turnover intention among lectures in private university colleges. However, leader facilitation has
low significant relationship with turnover intention among lecturers in PHEIs’ lecturers in Negeri
Sembilan. Therefore, leadership supports in PHEIs not much affect the turnover intention of
lecturers. Based on the result all hypotheses accepted for this study. Therefore, employee
recognition classified as most prompting factor of turnover intention among lectures in PHEIs in
Negeri Sembilan. This research finding indicated R2 (.709). This shows that, the independent
variables have significant effect on lectures’ turnover intention in PHEIs.

62
4.9 Summary
All of the hypotheses testing had performed in this chapter. The results obtained from this chapter
are further discussed in the final chapter followed by the implications and limitations of the study
with a few recommendations that are relevant to this study.

63
CHAPTER 5
DISCUSSION, RECOMMENDATIONS AND CONCLUSION.
5.1 Introduction
This chapter will be summarized with further discussion based on the research objective
developed. Moreover, implications, recommendations, for future studies and limitations of the
study will be discussed and will be ended with a conclusion.
5.2 Discussion.
In principle, this study is to determine the relationship between the independent variables; role
overload, leader facilitation, workgroup support, employee recognition and dependent variable
turnover intention. Relatively, this study focuses about the prevalence of turnover intention
among lecturers in Private Higher Education institutions (PHEIs) in Negeri Sembilan.
Additionally, this study identified which among the variables are the most significant factors
that clarify turnover intention. In order to realize this, conceptual framework has been
developed which to gain a better understanding on the relationship between role overload,
leader facilitation, workgroup support and employee recognition.
The assessment process followed the sequence steps such as selection of study location, and
preparation of questionnaire plus data collection. Questionnaire method was used to obtain the
necessary information. Indeed, such method was used because of place and time constrains.
The nature of working hours of lectures was challenging, because during data collection most
of the lectures were busy and not available for answer the survey. Most of the lectures busy
with their schedule and it were time constrained for both the respondents and researcher.

64
This research uses cross sectional study. Generally cross sectional study are usually conducted
to estimate the prevalence of the outcome of interest for a given population. Respondents
comprised of 152 lectures from Private Higher Education institutions (PHEIs) in Negeri
Sembilan. Pretest was carried out before the actual data collection. Questionnaires consist of
item that presents role overload, leader facilitation, workgroup support, and employee
recognition and turnover intention. A five point Likert scale was used in the study to measure
the variables. Furthermore, the demographic information consist of gender, age group, highest
education qualifications, current position, length of employment, type of employment, monthly
income, and faculty of working.
In this chapter, the result of descriptive analysis, reliability analysis, normality test, factor
analysis and inferential analysis such as Pearson Correlation and Multiple Regressions were
used. This result is beneficial for the PHEIs to determine the proper forecasting before or after
a lecturer decided to move from the company. Moreover, the following section will argue the
objective and comparison with the researches done previously. Eventually, five objectives have
been fixed in this research study.

65
5.2.1 Objective 1: To identify the relationship between role overload and turnover
intention among Private Higher Education institutions (PHEIs) lecturers in Negeri
Sembilan.
Based on the data in Table 4.10 (Correlation) shows that there is a strongly significant and
positive relationship between role overload and turnover intention which is (r = .725**, p ≤
0.00). Therefore role overload does significantly related on turnover intention. Seriously,
Private Higher Education institutions (PHEIs) in Negeri Sembilan need to consider about role
overload of their lecturers in workplace. Based on the Table 4.8 demographic profile of
respondents, majority of lecturers are female. According to Miller and Wheeler (1992) initiate
that women have higher turnover intention as compared to men. This result is in lined with the
studies of (Kim ,2005); (Huang, Chuang & Lin, 2003) which has shown that female employees
have higher intention to leave their jobs as compared to male employees. Female Lecturers
face role conflict in their work life and family life. In work lives they need to carry out various
tasks such as being invigilator, mentor, some as program coordinators and module leaders. In
spite of that, in family life female academicians need to focus on their family responsibilities
and conflicting role themselves. Therefore, it’s difficult for female lecturers to manage family
and work related responsibility. Hence it leads to role overload and intention to quit from
Private Higher Education institutions (PHEIs) in Negeri Sembilan.
Age group of lecturers also may contribute to role overload. According to Table 4.8, majority
of lecturers fall under age group of 24-34 which is 54.6%. Basically, the lecturers in this age
group are young, ambitious and energetic. Lecturers willing to accept more task to gain new
experiences in workplace. Therefore, almost most of the young lecturers face role overload and
at one point of time they could not able to cope up the role overload with very limited

66
timeframe. This may lead to intention to quit and find a better job with good remuneration
package.
Length of employment may contribute to role overload. Based on Table 4.8, majority of Private
Higher Education institutions (PHEIs) lecturers’ categorized below 2 years of working
experience. In earlier stage of employment academicians are more ambitious and they wish to
obtain very instant appreciation and career growth by easier way. Therefore, lecturers willing
to be accept additional responsibilities. On the other side management also provides additional
work for new lecturers for the purpose of baseline assessment. However, after 2 years of
pedagogical experience lecturers start to benchmark the working requirement, and career
opportunity with other intuition. Hence, if lecturers find any better offer with fewer role
overloads they eventually will be having the intention to quit from current Institution and go
for a best offer.
Finding of this study similar with (Pienaar, Sieberhagen, & Mostert, 2007); (Jones et al. 2007).
Role overload significantly influence turnover intention. This similar studies has indicate,
higher level of work requirement may lead to job stress and work exhaustion and will end up
with turnover intention. Normally lecturers from Private Higher Education institutions (PHEIs)
have greater work commitment such as; mentoring, invigilation, review and update coursework
file, setting coursework assessment, lecturing, tutorial, marking, marketing about program
offered in institution and preparing module analysis report for every semester. The given
timeframe for all this work requirements are very short. Therefore, lecturers feel stress and
exhausted with unachievable work which might lead to turnover intention. In simple term,
lecturers who experience higher role overload are more likely to look for other job opportunity

67
and not prefer to work with the same higher intuition. Hence, role overload has significant and
positive relationship with turnover intention.
5.2.2 Objective 2: To identify the relationship between leader facilitations and turnover
intention among Private Higher Education institutions (PHEIs) lecturers in Negeri
Sembilan.
The second research objective is to identify the relationship between leader facilitations and
turnover intention among Private Higher Education institutions (PHEIs) lecturers. Correlation
result shown Table 4.10 presented that there is a negative relationship between leader
facilitation and turnover intention (r = -.669**, p ≤ 0.00). Lecturers who obtain higher leader
facilitations are less likely to find other better job opportunity. Hence, high leadership support
may motivate, encourage, inspire and nurture lecturers with needed skills and knowledge.
Lecturers feel comfortable and happy working with superior who understand them better.
Based on Table 4.8 respondent’s profile, 38.8 percentages of Private Higher Education
institutions (PHEIs) lecturers in Negeri Sembilan having below than 2 years of working
experience. Based on this data, lecturers working in Private Higher Education institutions in
Negeri Sembilan are fresh to academic field. Therefore, it is important for the management to
ensure proper guidance and direction for the fresh academicians. The School or Faculty Head,
Deans and Deputy Deans of Private Higher Education institutions need to emphasis on the
pedagogical training for new lecturers for first 6 months. In simple term, close leader
observation and support important for retain the talented lecturers in Private Higher Education
Institutions. In this research leader facilitation does not much affect the lecturers’ turnover
intention. This is because most of the top management leaders and Deans are from generation

68
Y. Therefore, young generation leaders understand well how to facilitate their followers. Based
on previous study done by Wolf and Yadav (2015) poor leader facilitations classify as a
predictor of turnover intention. In this study leader facilitation slightly contribute to lecturers’
turnover intention. Eventually, negative relationship was found between leader facilitation and
turnover intention. Therefore, leader facilitation and turnover intention has an inverse relation.

69
5.2.3 Objective 3: To identify the relationship between workgroup support and turnover
intention among lecturers in Private Higher Education institutions (PHEIs) lecturers in
Negeri Sembilan.
The third research objective is to identify the relationship between workgroup support and
turnover intention among Private Higher Education institutions lecturers. Table 4.4 show the
Correlation result which reveals that there is a strong negative relationship between workgroup
support and turnover intention (r = -.750**, p ≤ 0.00). The results show that workgroup support
and turnover intention is contradict. Whereby, when workgroup support among lecturers in
Private Higher Education institutions (PHEIs) is high, the turnover intention will be lower.
Majority of academician from lecturer level consider staying in Private Higher Education
institutions (PHEIs) because of workgroup support. Generally workgroup support essential for
lecturers to fulfill their daily work requirements. Peer support help to solve critical problems
in work and help to reduce the job stress in workplace. Lecturers feel fulfilled, trust and loyal
whenever they reciprocate a favor from their fellow working colleagues. Workgroup support
ensure healthy and harmony work environment for the lecturers. Hence, the job satisfaction
among lecturers may increase. The finding of this study was in line with Lee (2004). Whereby,
it shows there is significant and negative relationship between workgroup supports and
turnover intention.

70
5.2.4 Objective 4: To identify the relationship between employee recognition and
turnover intention among lecturers in Private Higher Education institutions (PHEIs) in
Negeri Sembilan.
The fourth objective of this study is to identify the relationship between employee recognition
and turnover intention among Private Higher Education institutions (PHEIs). Based on Table
4.10 there is a strong significant and negative relationship among employee recognition and
turnover intention (r = -. 801, p ≤ 0.00). The finding shows employee recognition and lecturers
turnover intention are inversely related. Whenever lecturers receive more reward and
recognition in their working institution, they are less likely to leave the Private Higher
Education institutions (PHEIs). Appreciation is a fundamental need for academicians to
perform well. In simple term, lecturers in Private Higher Education institutions (PHEIs) wanted
to be respected and value for their academics contributions such as; publishing research papers
and journals, lecturing, mentoring, and representing conference and setting coursework
requirements. Employee recognition provided by management should equivalent to lecturers’
contribution.
Whenever a lecturer encounters inequity in workplace, they will take some sort of action.
Lecturers restore equality by either decreasing inputs or by increasing outcome. However,
lecturers ultimately resolve the imbalance by reducing their efforts or by leaving the
organization (Stajkovic & Luthans, 2003). Therefore, once lecturers feel the sense of
recognition they will never leave their working institution. Hence, greater reward and
recognition will motivate lecturers to stay longer in their workplace. The findings of this study
result similar with previous research studies done by Wen, Huey, Li, Ying and Kee (2013) and

71
Maicibi, 2008. Therefore, it proven that there is a significant and negative relationship between
employee recognition and turnover intention.
Objective 5.2.5: To identify the effects of role overload, leader facilitation, workgroup
support and employee recognition on turnover intention among PHEIs in Negeri
Sembilan.
Eventually, the researcher have used Multiple Regression in associating the involvement of
each independent variable in order to illuminate the most significant factor prompting the
turnover intention among lecturers works in Private Higher Education Institutions (PHEIs) in
Negeri Sembilan. From the Table 4.13, it could be seen the regression value for the combined
independent variable effect is R2 (.709) and the adjusted R2 (.702). This implies that the
independent variables had affected 70% to the lecturers’ turnover intention. It could also see
by the F – value of 89.747 is highly significant at less than 0.00 alpha levels. Therefore, it show
that the predictors variable (role overload, workgroup support and employee recognition) have
significant effect on criterion variable (lectures’ turnover intention).
Based on the research, employee recognition carries greatest factor which indicate higher
influencing beta value of (β-.420, p ≤0.00). The study concluded that among the four
independent variables such as; role overload, leader facilitation, workgroup support and
employee recognition, employee recognition is the most significant factor on turnover
intention. Employee recognition classified as an important predictor of turnover intention in
PHEIs in Negeri Sembilan. However, the beta value of (β-.082, p ≤ .246) indicates leader
facilitation does not much effect on the turnover intention. Though initially leader facilitation
selected as a predictor of lecturers’ turnover intention at the end of research result indicates

72
that, leader facilitation does not much effect lecturers’ turnover intention in PHEIs in Negeri
Sembilan. Role overload and workgroup support indicates beta value of (β -.195, p ≤0.17) and
(β.232, p ≤0.04). Overall, only three independent variables (role overload, workgroup support
and employee recognition) affect lecturers’ turnover intention in PHEIs in Negeri Sembilan.
5.3 Implication of Research Findings.
Based on this result, some practical implication can be drawn and suggestions can be made in
order to reduce the turnover intention among lecturers in Private Higher Education institutions
(PHEIs) in Negeri Sembilan. From the result generated it show that, employee recognition is
the predictor of turnover intention among lecturers in Private Higher Education (PHEIs) in
Negeri Sembilan. Therefore, management of Private Higher Education institutions should
aware of this issue to reduce the likelihood of turnover intention among lecturers.
According to earlier studies, employee recognition is the main key that contributes towards
turnover intention among the lecturers. Therefore, Private Higher Education institutions
(PHEIs) in Negeri Sembilan need to accept the reality and seek for the way to improve
employee recognition programs in order to make sure their private institution stay competitive.
The main problem faced by PHEIs in Negeri Sembilan is set unrealistic KPI to measure the
performance of a lecturer. The goals set by the institutions are super ambiguous and
counterproductive. The PHEIs uses performance based KPI system to evaluate the performance
of academic staffs and reward them accordingly. However, PHEIs still unable to recognize and
reward the academic staffs for the contributions they have done for the institution because of
unrealistic KPI. Most of academic staff being frustrated and leave the institutions because of
mismanagement of employee recognition program. Therefore, even though the PHEIs have

73
employee recognition programs, they still unable to implement the employee recognition due
to over stretched goal.
Therefore, PHEIs may include SMART evaluation criteria for the performance management
of lecturers. The SMART stands for Specific, Measurable, Achievable, Realistic, and Time-
bound. This evaluation criterion will clearly articulate what is expected to achieve within the
specified time frame. The employee recognition program committee can easily measure the
success of completion of a task. This method may include objective; concrete result based
performance and also subjective measurement methods. The employee recognition program
created by the team will be clear and consistent with the KPI or departmental goals to avoid
unrealistic evaluation criteria.
Besides that, favoritism based employee recognition always describe as a debated issue in
many Private Higher Education Institutions. Employee recognition always comes along with a
statement of ‘bias’ favoritism, and organization politic. According to Higgot (2016), reward
and recognition for lecturers remains one of the controversial areas of quality management.
Probably, employee recognition program in PHEIs lead to departmental politics. Biasness and
favoritism in employee recognition program may lead to turnover intention among lecturers.
Politics happens among academic staffs to grasp personal award, promotions and rewards for
oneself or one particular group interest. Thus, employee recognition program with favoritism
do not support the broad production oriented goals of the institutions. According to Vigoda-
Gadot and Talmud (2010) lecturers who engage in organizational politics has high possibility
to get reward and recognition compared to lecturers who politically inept. Therefore, when
politics, influences a point of rewarding lecturers for reasons other than previously agreed on
performance based system, the message is sent to the institutions that politicking is more

74
important than performance of lecturers. Eventually, recognition programs with favoritism may
lead the lecturers to leave the PHEI.
Therefore, PHEIs in Negeri Sembilan need to ensure bias-free employee recognition programs
in their institutions. Therefore, PHEIs in Negeri Sembilan need to establish an Employee
Recognition Team (ERT). The Employee Recognition Team (ERT) may in charge to promote
the formal recognition program with minimum favoritism. This team will be responsible to
ensure outcome oriented higher education institution and must reinforce teamwork to soften
the negative impact of organizational politics in the Private Higher Education Institution (Valle
& Witt, 2001). Eventually, ERT may decrease the impact of favoritism in recognizing good
lecturers and motivate the lecturers to stay longer in the institution.
Besides that, academic staffs in PHEIs in Negeri Sembilan expect their young lecturers to
‘service above self’. It means management expecting their young lecturers to contribute their
best without expecting anything in terms of recognition, appreciation and rewards. According
to Table 4.8, most of the lecturers are fall under the age range of 24-34. Hence, most of the
lecturers of KTG Education Group and Inti International University are considering Gen Y.
Generally, Gen Y expected to have more encouragement, appreciation, guidelines and
motivation from senior academic staffs. According to Raman, Ramendran, Beleya, Nadeson,
and Arokiasamy (2011) stated that young generation is predictable to be dominant force in the
industry in near future as the demand of young academicians in Malaysia is increased with the
rapid growth of the higher education industry.

75
Thus, academic leaders expected to provide instant recognition for the young lecturers.
Sometimes simple compliments such as ‘splendid work’ and ‘thank you’ help to boost up the
motivation level of a lecturer. According to Grote (2006), that recognition of a lecturer’s
performance can come is such simple forms as “Good work, Well done, or I really appreciate
it. Hence, PHEI’s management must understand the psychology of praising lecturers in order
to value their academic contributions for the institution. Instant recognition increases
performance and job satisfaction when they feel that their work is being valued. Therefore,
instant recognition and positive reinforcement may increase the motivation level of lecturers
and reduce the intention to quit from the institution.
5.4 Limitation of the study.
Throughout the research, two limitations have been identified. Firstly, the respond from the
selected PHEIs were low. Initially, five private university colleges had been approached in
Seremban, Negeri Sembilan. Though, due the respond was very slow and low only two Private
Higher Institutions have been finalized for this study. Thus this study only conducted in KTG
Education Group and Inti International University. The study conducted based on 152
respondents’ response received during the data collection period. Although, this number of
responses are sufficient for conduct this study. However, bigger sample size expected to have
better generalizability for the population at large.

76
Secondly, cross sectional research was applied in this study. Therefore, this study was not able
to produce useful evidences to determine the causal relationship between the variables. As a
result, the observed significant relationships between the variables should be interpreted with
caution and no causal interferences should be made. Although several limitations has been
shown, this study does provide insights for the existing body of the knowledge of
psychological factors (independent variable) and turnover intention dependent variable. Based
on this research finding, private higher education institution in Negeri Sembilan expected to
focus more on managing young lecturers effectively and recognize their contribution to
decrease the number of turnover intention in future.
5.5 Recommendation for Future Studies.
Based on the research findings, the researcher found several aspects that need for further
research. In order to prepare a better research in future, future researchers should take a more
generalized number of respondents. The larger number of responses expected to generate more
accurate results. Therefore research must be expended to other private institution in negeri
Sembilan.
Apart from that, this study only focused on private higher education institution in Negeri
Sembilan. Therefore future study needed from respective sample from different private
institution and from different states in Malaysia. Moreover, this study expected to test in other
academic area such as government higher education institutions, polytechnics, vocational
colleges and matriculations in overall Malaysia. Eventually, explore other academic areas may
help researchers to obtain for better generalizability.

77
Besides, this research based on cross sectional study which only focuses on one specific of
time. Therefore, for forthcoming study, researcher should ponder the longitudinal study.
Longitudinal study is more appropriate to be use because it will be competent to discover the
changes in the characteristic of the target population. Besides that, the result from a longitudinal
study will be more reliable and can add more information to the research.
5.6 Conclusion.
This study conducted to examine whether psychological factor as predictor of turnover
intention among Private Higher Education Institution in Negeri Sembilan. The study was
conducted in two private higher education institutions in Negeri Sembilan. This study request
university and colleges faculty to express their opinions about the psychological factors (role
overload, leader facilitations, workgroup support and employee recognition) affecting their
intention to quite from the current institution. Total 152 respondents have participated in this
dissertation and majority of them are women lectures below than 2 years of experience. Most
of the respondents are young and fall in the age group of 24-34. The multiple regression value
for combined psychological effect reported as R2 (.709). Therefore, this research had revealed
that psychological factors (independent variable) have affected 70% of turnover intention
(dependent variable) among the lecturers in PHEI in Negeri Sembilan. Overall five hypotheses
were developed for this research and only four hypotheses were accepted. Based on the findings
role overload has a significant and positive relationship with turnover intention. Meanwhile,
workgroup support and employee recognition show negative relationship with lecturers’
turnover intention. However, leader facilitations do not affect turnover intention among
lectures in PHEIs in Negeri Sembilan. This is because PHEIs lectures are generally are
independent and work according to module specification and MQA requirement. Therefore,
the role of supervisor or leader is very limited. Therefore, in future researchers should use other

78
psychological variables such as organization politics, emotional intelligence, job satisfaction
and psychological contract. Furthermore, several implications are highlighted and limitations
of the study to organization were also addressed. Suggestion for future research was
highlighted in order to improve the future situation.

79
Reference Abbasi, S. M., & Hollman, K. W. (2000). Turnover: The real bottom line. Public Personnel Management , 2(3), 333-342. Abdullah, A., Bilau, A. A., Enegbuma, W. I., Ajagbe, A. M., Ali, K. N., & Bustani, S. A. (2012). Small and Medium Sized Construction Firms Job Satisfaction and Performance Evaluation in Nigeria. International Journal of Social Science and Humanity, 2 (1), 35. Abubakar, R. A., Chauhan, A., & Kura, K. M. (2014). Relationship between perceived organizational politics, organizational trust, human resource management practices and turnover intention among Nigerian nurses. Adams, J. S. (1965). Inequity in social exchange. Advances in experimental social psychology,Vol .2, 267-299. Ajzen, I. (1991). The theory of planned behavior. Organizational behavior and human decision processes, 50(2), 179-211. Alan, S. Z. R., Radzi, S. M., Hemdi, M. A., & Othman, Z. (2008). An empirical assessment of Hotel Managers’turnover intentions: The impact of organisational justice. In AFBE 2008 Conference Papers (p. 598). Alam, M. M., & Mohammad, J. F. (2010). Level of job satisfaction and intent to leave among Malaysian nurses. Business Intelligence Journal, 3(1), 123-137. Alexandrov, A., Babakus, E., & Yavas, U. (2007). The effects of perceived management concern for frontline employees and customers on turnover intentions: moderating role of employment status. Journal of service research, 9(4), 356-371. Alkahtani, A. H., Abu-Jarad, I., Sulaiman, M., & Nikbin, D. (2011). The impact of personality and leadership styles on leading change capability of Malaysian managers. Australian Journal of Business and Management Research, 1(2), 70. Altbach, P. G., & Levy, D. C. (2005). Private higher education: A global revolution (Vol. 2). Sense publishers. Andrew, O. C., & Sofian, S. (2012). Individual factors and work outcomes of employee engagement. Procedia-Social and behavioral sciences, 40, 498-508. Awang, A., Amir, A. R., & Osman, W. (2013). Job behavioral factors and turnover intention: A case study at Sime Darby Property Limited. International Journal of Advances in Management and Economics, 2(6), 103-115. Awang, M. M., Ahmad, A. R., Ghani, S. A., Yunus, A. N. M., Ibrahim, M. A. H., Ramalu, J. C., & Rahman, M. J. A. (2013). Students' attitudes and their academic performance in nationhood education. International Education Studies, 6(11), 21.
Awang, Z., Ahmad, J. H., & Zin, N. M. (2010). Modelling job satisfaction and work commitment among lecturers: a case of UiTM Kelantan. Journal of Statistical Modeling and Analytics, 1(2), 45-59.

80
Baerga Cordero, J. A. (2009). The relationship between organizational role stress of project managers and voluntary turnover, job satisfaction and intention to leave. Nova Southeastern University. Bakker, A. B., & Demerouti, E. (2007). The job demands-resources model: State of the art. Journal of managerial psychology, 22(3), 309-328. Balogun, A. G., & Olowodunoye, S. A. (2012). Psychological factors aspredictors of turnover intention among employees of post-consolidation banks in Nigeria. European Scientific Journal, 8(20). Barak, M. E., Nissly, J. A., & Levin, A. (2001). Antecedents to retention and turnover among child welfare, social work, and other human service employees: What can we learn from past research? A review and metanalysis. Social service review, 75(4), 625-661. Barney, R. K., & Barney, D. E. (2007). " Get those niggers off the field!": racial integration and the real curse in the history of the Boston Red Sox. NINE: A Journal of Baseball History and Culture, 16(1), 1-9. Bashir, U., & Ismail Ramay, M. (2010). Impact of stress on employees job performance: A Study on Banking Sector of Pakistan. Beehr, T. A. (2014). Psychological stress in the workplace (psychology revivals). Routledge. Bergers, G., Marcelissen, F., & De Wolff, C. (1986). Vragenlijst organisatie stress-doetinchem: Handleiding. Organizational Stress Questionnaire, University of Nijmegen.
Bhattacharya, D., Dey, S., & Saha, D. (2012). Linking Commitment and Job Satisfaction of Health Care Management Employees: Insights from the Job Characteristics Model. Birdir, K. (2002). General manager turnover and root causes. International Journal of Contemporary Hospitality Management, 14(1), 43-47. Bosibori, F. (2012). Operations strategies in Kenyan airlines. Doctoral Dissertation, University of Nairobi.
Bowen, R. B. (2000). Recognizing and rewarding employees.
Brough, P., & Frame, R. (2004). Predicting police job satisfaction and turnover intentions: The role of social support and police organizational variables. New Zealand Journal of Psychology, 33(1), 8-18.
Brunetto, Y., Teo, S. T., Shacklock, K., & Farr‐Wharton, R. (2012). Emotional intelligence, job satisfaction, well‐being and engagement: explaining organizational commitment and turnover intentions in policing. Human Resource Management Journal, 22(4), 428-441.
Calisir, F., Gumussoy, C. A., & Iskin, I. (2011). Factors affecting intention to quit among IT professionals in Turkey. Personnel Review, 40(4), 514-533. Cameron, K., & Dutton, J. (Eds.). (2003). Positive organizational scholarship: Foundations of a new discipline. Berrett-Koehler Publishers.

81
Cammann, C., Fichman, M., Jenkins, D., & Klesh, J. R. (1983). Assessing the attitudes and perceptions of organizational members. Assessing Organizational Change: A Guide to Methods, Measures, and Practices, 71, 138. Campbell, C. D., Chong, J. X., Malig, M., Ko, A., Dumont, B. L., Han, L. & Abney, M. (2012). Estimating the human mutation rate using autozygosity in a founder population. Nature Genetics, 44(11), 1277-1281. Cavana, R. Y., Delahaye, B. L., & Sekaran, U. (2001). Applied business research: Qualitative and quantitative methods. John Wiley & Sons Australia. Chan, B., Yeoh, Lim S., & Osman, (2010). An exploratory study on turnover intention among private sector employees. International Journal of Business and Management, 5(8), 57-64. Chaoping, Li, and Shi Kan. "The Influence Of Distributive Justice And Procedural Justi Ce On Job Burnout [J]." Acta Psychologica Sinica 5 (2003): 015. Chatzoglou, P. D., Vraimaki, E., Komsiou, E., Polychrou, E., & Diamantidis, A. D. (2011, July). Factors affecting accountants’ job satisfaction and turnover intentions: A structural equation model. In 8th International Conference on Enterprise Systems, Accounting and Logistics (pp. 130-147). Collins, P., & Kakabadse, N. K. (2006). Perils of religion: need for spirituality in the public sphere. Public Administration and Development, 26(2), 109-121. Conley, S., & Woosley, S. A. (2000). Teacher role stress, higher order needs and work outcomes. Journal of Educational Administration, 38(2), 179-201. Cooper, C. L., Dewe, P. J., & O'Driscoll, M. P. (2001). Organizational stress: A review and critique of theory, Research, And Applications. Sage.
Cui, Z. M., Chen, Z., Cao, C. Y., Jiang, L., & Song, W. G. (2013). A yolk–shell structured mesoporous Sio nanoreactor for enhanced activity as a Fenton catalyst in total oxidation of dyes. Chemical Communications, 49(23), 2332-2334.
Dale, K., & Burrell, G. (2014). Being occupied: An embodied re-reading of organizational ‘wellness’. Organization, 21(2), 159-177.
Danish, R. Q., & Usman, A. (2010). Impact of reward and recognition on job satisfaction and motivation: An empirical study from Pakistan. International journal of business and management, 5(2), 159.
Deal, J. J. (2007). Retiring the generation gap: How Employees Young and Old Can Find Common Ground ,Vol. 35. John Wiley & Sons.
DeYoung, C. G., Hirsh, J. B., Shane, M. S., Papademetris, X., Rajeevan, N., & Gray, J. R. (2010). Testing predictions from personality neuroscience brain structure and the big five. Psychological Science.

82
Dupre, K. E., & Day, A. L. (2007). The effects of supportive management and job quality on the turnover intentions and health of military personnel. Human Resource Management, 46(2), 185. Eisenberger, R., Stinglhamber, F., Vandenberghe, C., & SucharskiandL, I. L. Rhoades, 2002,“. Perceived Supervisor Support: Contributionsto Perceived Organizational Support and Employee Retention,” Journal o fApplied Psychology, 87(3), 565-573. Elicker, J. D., Levy, P. E., & Hall, R. J. (2006). The role of leader-member exchange in the performance appraisal process. Journal of Management, 32(4), 531-551.
Emerson, R. M. (1976). Social exchange theory. Annual Review of Sociology, 335-362.
Fah, B. C., Foon, Y. S., Leong, L. C., & Osman, S. (2010). An exploratory study on turnover intention among private sector employees. International Journal of Business and Management, 57-64
Ferguson, K. L., & Reio Jr, T. G. (2010). Human resource management systems and firm performance. Journal of Management Development, 29(5), 471-494.
Ferres, N., Connell, J., & Travaglione, A. (2004). Co-worker trust as a social catalyst for constructive employee attitudes. Journal of Managerial Psychology, 19(6), 608-622.
Fischer, R., Ferreira, M. C., Jiang, D. Y., Cheng, B. S., Achoui, M. M., Wong, C. C.,& Hassan, A. (2011). Are perceptions of organizational justice universal? An exploration of measurement invariance across thirteen cultures. Social Justice Research, 24(4), 297-313. Fogel, R. W. (2007). Capitalism and democracy in 2040: forecasts and speculations. Gbadamosi, L., & Chinaka, N. J. (2011). Organizational politics, turnover intention and organizational commitment as predictors of employees’ efficiency and effectiveness in academia. In Proceedings of Informing Science & IT Education Conference.
Gosselin, F., & Schyns, P. G. (2001). Bubbles: a technique to reveal the use of information in recognition tasks. Vision Research, 41(17), 2261-2271.
Graen, G., & Cashman, J. F. (1975). A role-making model of leadership in formal organizations: A developmental approach. Leadership Frontiers, Vol.143, 165.
Grote, R. C. (2006). Discipline without punishment: The proven strategy that turns problem employees into superior performers. AMACOM Div American Mgmt Assn.
Hair, J. F., Anderson, R. E., Babin, B. J., & Black, W. C. (2010). Multivariate data analysis: A global perspective, Vol. 7. Upper Saddle River, NJ: Pearson.
Hancer, M., & George, R. T. (2003). Psychological empowerment of non-supervisory employees working in full-service restaurants. International Journal of Hospitality Management, 22(1), 3-16.
Hang-Yue, N., Foley, S., & Loi, R. (2005). Work role stressors and turnover intentions: a study of professional clergy in Hong Kong. The International Journal of Human Resource Management, 16(11), 2133-2146.

83
Harris, M. M., & Bladen, A. (1994). Wording effects in the measurement of role conflict and role ambiguity: A multitrait-multimethod analysis. Journal of Management, 20(4), 887-901.
Hausknecht, J. P., & Trevor, C. O. (2011). Collective turnover at the group, unit, and organizational levels: Evidence, issues, and implications. Journal of Management, 37(1), 352-388.
Hayes, R., Warr, G. G., & Atkin, R. (2015). Structure and nanostructure in ionic liquids. Chemical Reviews, 115(13), 6357-6426.
Hei, M. A., & Rahim, A. R. A. (2011). The effect of psychological contract and affective commitment on turnover intentions of hotel managers. International Journal of Business and Social Science, 2(23).
Hobfoll, S. E., & Freedy, J. (1993). Conservation of resources: A general stress theory applied to burnout.
Henryhand, C. J. (2009). The effect of employee recognition and employee engagement on job satisfaction and intent to leave in the public sector. Doctoral Dissertation, Capella University.
Herzberg, F., Mausner, B., & Snyderman, B. B. (1959). The Motivation to Work, John Wiley & Sons. Inc., New York, 195.
Higgott, A. (2016). Eric de Maré: between the functional and the beautiful. The Journal of Architecture, 21(6), 873-889.
Hongvichit, S. (2015), the research progress and prospect of employee turnover intention. International Business Research, 8(6), 218-223.
Houkes, I., Janssen, P. P., Jonge, J., & Bakker, A. B. (2003). Specific determinants of intrinsic work motivation, emotional exhaustion and turnover intention: A multisample longitudinal study. Journal of Occupational and Organizational Psychology, 76(4), 427-450.
Huang, C., Chuang, C. H. J., & Lin, H. C. (2003). The role of burnout in the relationship between perceptions of organizational politics and turnover intentions. Public Personnel Management, 32(4), 519-531.
Idris, M. K., O'Driscoll, M. P., & Anderson, M. H. (2011). Longitudinal mediation effects of strain on the relationships between role stressors and employees' withdrawal responses. Stress and Health, 27(5), 403-412
Ileana Petrescu, A., & Simmons, R. (2008). Human resource management practices and workers' job satisfaction. International Journal of Manpower, 29(7), 651-667. International Council of Nurses and person-centered care. (2010). E-journal of Applied Psychology, Retrieved from https://www.ncbi.nlm.nih.gov/pmc/articles/PMC2834901/
Joarder, M. H., Sharif, M. Y., & Ahmmed, K. (2011). Mediating role of affective commitment in HRM practices and turnover intention relationship: A study in a developing context. Business and Economics Research Journal, 2(4), 135.
Johnson, S., Cooper, C., Cartwright, S., Donald, I., Taylor, P., & Millet, C. (2005). The experience of work-related stress across occupations. Journal of Managerial Psychology, 20(2), 178-187.

84
Jones, E., Chonko, L., Rangarajan, D., & Roberts, J. (2007). The role of overload on job attitudes, turnover intentions, and salesperson performance. Journal of Business Research, 60(7), 663-671.
Kaiser, H.F., 1970. A second generation little jiffy. Psychometrika, 35(4), 401-415.
Karatepe, O. M. (2013). High-performance work practices and hotel employee performance: The mediation of work engagement. International Journal of Hospitality Management, 32, 132-140.
Kaur, B., Mohindru, & Pankaj. (2013). Antecedents of Turnover Intentions: A Literature Review. Global Journal of Management and Business Studies, 3 (10), 1219-1230.
Kim, H., & Stoner, M. (2008). Burnout and turnover intention among social workers: Effects of role stress, job autonomy and social support. Administration in Social Work, 32(3), 5-25.
Klopper, H. C., Coetzee, S. K., Pretorius, R., & Bester, P. (2012). Practice environment, job satisfaction and burnout of critical care nurses in South Africa. Journal of Nursing Management, 20(5), 685-695.
Knoll, D. L., & Gill, H. (2011). Antecedents of trust in supervisors, subordinates, and peers. Journal of Managerial Psychology, 26(4), 313-330
Kocolowski, M. D. (2010). Shared leadership: Is it time for a change. Emerging Leadership Journeys, 3(1), 22-32.
Kokalitcheva, K. (2015). This Airline job listing has an unusual title, but good intentions. Fortune. Retrieved from http://fortune.com/2015/08/26/airbnb-diversity-belonging-job/
Kralovensky, T. E. (2006). Employee recognition. Unpublished Master Dissertation, Royal Roads
Krejcie, R. V., & Daryle, W. (1960). Morgan (1970),“. Determining sample size for research.
Lee, P. C. B. (2004). Social support and leaving intention among computer professionals. Information & Management, 41(3), 323-334.
Lew, T. Y. (2009). The relationships between perceived organizational support, felt obligation, affective organizational commitment and turnover intention of academics working with private higher educational institutions in Malaysia. European Journal of Social Sciences, 9(1), 72-87.
Liden, R. C., & Graen, G. (1980). Generalizability of the vertical dyad linkage model of leadership. Academy Of Management Journal, 23(3), 451-465.
Liu, J. X., Srivastava, R., Che, P., & Howell, S. H. (2007). An endoplasmic reticulum stress response in Arabidopsis is mediated by proteolytic processing and nuclear relocation of a membrane-associated transcription factor, bZIP28. The Plant Cell, 19(12), 4111-4119.
Long, C. S., Thean, L. Y., Ismail, W. K. W., & Jusoh, A. (2012). Leadership styles and employees’ turnover intention: Exploratory study of academic staff in a Malaysian College. World Applied Sciences Journal, 19(4), 575-581.
Lucas, R., & Deery, M. (2004). Significant developments and emerging issues in human resource management. International Journal of Hospitality Management, 23(5), 459-472.

85
Maicibi, A. N. (2008). Management of workforce diversity: issues and lessons for organizations.
Makhbul, Z. M., Rahid, M. R., & Hasun, F. M. (2011). What Made They Go? Journal of Global Management, 1(1), 13-22.
Malaysia Education Blueprint 2015-2025. (2016). Ministry Of Education Malaysia. Retrieved from https://www.um.edu.my/docs/default-source/about-um_document/media-centre/um-magazine/.
Malaysian Trades Union Congress. (2016). 70% of employees plan to leave their jobs, says survey. Retrieve February 2, 2016, from http://www.mtuc.org.my/70-of-employees-plan-to-leave-their-jobs-says-survey/.
Malik, M. E., & Naeem, B. (2013). Towards understanding controversy on Herzberg theory of motivation. World Applied Sciences Journal, 24(8), 1031-1036.
Malik, M. I., Zaheer, A., Khan, M. A., & Ahmed, M. (2010). Developing and testing a model of burnout at work and turnover intensions among doctors in Pakistan. International Journal of Business and Management, 5(10), 234.
Malik, O. F., Abbas, Q., Kiyani, T. M., & Waheed, A. (2011). Perceived investment in employee development and turnover intention: A social exchange perspective. African Journal of Business Management, 5(5), 1904.
March, J. G., & Simon, H. A. (1958). Organizations.
Marcia Zidle, (2011) ‘Employee Turnover: Why People Quit Their Job?’ Retrieved from http: managementhelp.org/blogs/ supervision/2011/08/09/employee- turnover-why-people-quit-their-jobs/
McAllister, D. J., & Bigley, G. A. (2002). Work context and the definition of self: How organizational care influences organization-base self-esteem. Academy of Management Journal, 45(5), 894-904.
McDougall, L., & Drummond, P. D. (2010). Personal resources moderate the relationship between work stress and psychological strain of submariners. Military Psychology, 22(4), 385.
Medina, E. (2012). Job satisfaction and employee turnover intention: what does organizational culture have to do with it?. Master's Theses, Department of Quantitative Methods in the Social Sciences, Columbia University, New York.
Meeusen, V. C., Van Dam, K., Brown-Mahoney, C., Van Zundert, A. A., & Knape, H. T. (2011). Understanding nurse anesthetists' intention to leave their job: how burnout and job satisfaction mediate the impact of personality and workplace characteristics. Health Care Management Review, 36(2), 155-163.
Memon, A., Meissner, C. A., & Fraser, J. (2010). The Cognitive Interview: A meta-analytic review and study space analysis of the past 25 years. Psychology, Public Policy, and Law, 16(4), 340.
Miller, J. G., & Wheeler, K. G. (1992). Unraveling the mysteries of gender differences in intentions to leave the organization. Journal of Organizational Behavior, 13(5), 465-478.

86
Ministry of Higher Education. (n.d), Retrieved October 4, 2016, from Ministry of Higher Education website, https://www.mohe.gov.my/en/
Mobley, W. H., Horner, S. O., & Hollingsworth, A. T. (1978). An evaluation of precursors of hospital employee turnover. Journal of Applied Psychology, 63(4), 408.
Moore, J. E. (2000). One road to turnover: An examination of work exhaustion in technology professionals. Mis Quarterly, 141-168.
Morrell, K., Loan‐Clarke, J., & Wilkinson, A. (2001). Unweaving leaving: the use of models in the management of employee turnover. International Journal of Management Reviews, 3(3), 219-244.
Morrell, K., Loan-Clarke, J., & Wilkinson, A. (2004), ‘The Role of Shocks in Employee Turnover,’ British Journal of Management, 15, 335– 349.
Motley, T. J. (2005). Tetraplasandra lydgatei (Araliaceae): Taxonomic Recognition of a Rare, Endemic Species from O ‘ahu, Hawaiian Islands 1. Pacific science, 59(1), 105-110.
Min, M. X. (2015). Turnover intention among Malaysia private higher education institutions Generation Y academicians: the mediating effect of employee engagement (Doctoral dissertation, Universiti Tunku Abdul Rahman).
Murphy, L. R., & Sauter, S. L. (2003). The USA perspective: Current issues and trends in the management of work stress. Australian Psychologist, 38(2), 151-157.
Narimawati, S. U. (2007). The Influence of Work Satisfaction, Organizational Commitment and Turnover Intention Towards the Performance of Lecturers at West Java's Private Higher Education Institution. Journal of Applied Sciences Research, 3(7), 549-557.
Ng, T. W., & Sorensen, K. L. (2008). Toward a further understanding of the relationships between perceptions of support and work attitudes: A meta-analysis. Group & Organization Management.
Nissly, J. A., Barak, M. E. M., & Levin, A. (2005). Stress, social support, and workers' intentions to leave their jobs in public child welfare. Administration in Social Work, 29(1), 79-100. Noor, K. M. (2011). Work-life balance and intention to leave among academics in Malaysian public higher education institutions. International Journal of Business and Social Science, 2(11). Noor, S., & Maad, N. (2009). Examining the relationship between work life conflict, stress and turnover intentions among marketing executives in Pakistan. International Journal of Business and Management, 3(11), 93. Noviello, R. J. (2000). Productivity and employee recognition programs: A program evaluation in the aerospace manufacturing sector (Doctoral dissertation, University of La Verne). Oluwafemi, O. J. (2013). Predictors of turnover intention among employees in Nigeria’s oil industry. Organizations and Markets in Emerging Economies, (2), 42-63.

87
Ongori, H. (2007). A review of the literature on employee turnover. Parker, C. P., Baltes, B. B., Young, S. A., Huff, J. W., Altmann, R. A., Lacost, H. A., & Roberts, J. E. (2003). Relationships between psychological climate perceptions and work outcomes: a meta‐analytic review. Journal of Organizational Behavior, 24(4), 389-416. Parween, S., Nawaz, K., Roy, R., Pole, A. K., Suresh, B. V., Misra, G., & Bhatia, S. (2015). An advanced draft genome assembly of a desi type chickpea (Cicer arietinum L.). Scientific Reports, 5, 12806. Piderit, S. K. (2000). Rethinking resistance and recognizing ambivalence: A multidimensional view of attitudes toward an organizational change. Academy of Management Review, 25(4), 783-794. Pienaar, J., Sieberhagen, C. F., & Mostert, K. (2007). Investigating turnover intentions by role overload, job satisfaction and social support moderation. SA Journal of Industrial Psychology, 33(2), 62-67. Podsakoff, P. M., MacKenzie, S. B., Moorman, R. H., & Fetter, R. (1990). Transformational leader behaviors and their effects on followers' trust in leader, satisfaction, and organizational citizenship behaviors. The leadership quarterly, 1(2), 107-142. Portal Rasmi MQA. (2016). Mqa.gov.my. Retrieved 4 October 2016, from http://www.mqa.gov.my/portalmqa/red/bm/directoryprofile.cfm.
Qureshi, M. A., Shahzad, H., Imran, Z., Mushtaq, M., Akhtar, N., Ali, M. A., & Mujeeb, F. (2013). Potential of Rhizobium species to enhance growth and fodder yield of maize in the presence and absence of L-Tryptophan. J Anim Plant Sci, 23(5), 1448-1454. Raman, G., Ramendran, C., Beleya, P., Nodeson, S., & Arokiasamy, L. (2011). Generation Y in institution of higher learning. International Journal of Economics and Business Modeling, 2(2), 142. Recruitment and retention of staff in Higher Education. (2016). Universitiesuk.ac.uk. Retrieved 4 October2016,fromhttp://www.universitiesuk.ac.uk/policy-and analysis/reports/Pages/recruitment-and-retention-of-staff-in-he.aspx
Ren, Y., Harper, F. M., Drenner, S., Terveen, L. G., Kiesler, S. B., Riedl, J., & Kraut, R. E. (2012). Building member attachment in online communities: Applying theories of group identity and interpersonal bonds. Mis Quarterly, 36(3), 841-864.
Rilovick, C. Y. (2005). Effects of Career Plateauing on Turnover: A Test of a Model (No. AFIT/GEM/ENV/05J-01). Air Force Inst of Tech Wright-Patterson Afb Oh School of Engineering And Management.
Russell, R. F., & Gregory Stone, A. (2002). A review of servant leadership attributes: Developing a practical model. Leadership & Organization Development Journal, 23(3), 145-157.

88
Saks, A. M. (2006). Antecedents and consequences of employee engagement. Journal of managerial psychology, 21(7), 600-619.
Saleem, H. (2015). The impact of leadership styles on job satisfaction and mediating role of perceived organizational politics. Procedia-Social and Behavioral Sciences, 172, 563-569.
Sarjit, K., Morshidi, S., & Noraini, A. (Eds). (2008). Globalization and internationalization of higher education in Malaysia. Penang, Malaysia: Universiti Sains Malaysia Press.Satisfaction”, International Journal of Manpower, Vol. 29 Iss: 7 pp. 651-667.
Saunders, M., & Lewis, P. och Thornhill, A.(2012). Research methods for business students, 6. Saunderson, R. (2004). Survey findings of the effectiveness of employee recognition in the public sector. Public Personnel Management, 33(3), 255-275 Scandura, T. A., & Graen, G. B. (1984). Moderating effects of initial leader–member exchange status on the effects of a leadership intervention. Journal of applied psychology, 69(3), 428. Schermerhorn, M. L., Birkmeyer, J. D., Gould, D. A., & Cronenwett, J. L. (2000). Cost-effectiveness of surgery for small abdominal aortic aneurysms on the basis of data from the United Kingdom small aneurysm trial. Journal of vascular surgery, 31(2), 217-226. Seashore, S. E., Lawler, E. E., Mirvis, P., & Cammann, C. (1982). Observing and measuring organizational change: A guide to field practice. Sekaran, C. B., & Rani, A. P. (2010). Development and validation of spectrophotometric method for the determination of DPP-4 inhibitor, sitagliptin, in its pharmaceutical preparations. Eclética Química, 35(3), 45-53. Sheridan, J. C., & Ong, C. (2011). SPSS version 18.0 for Windows-Analysis without anguish. Smith, C. (2005). Servant leadership: The leadership theory of Robert K. Greenleaf. Management Information Organization. Sousa-Poza, A., & Henneberger, F. (2004). Analyzing job mobility with job turnover intentions: An international comparative study. Journal of Economic Issues, 38(1), 113-137. Spreitzer, G. M., & Mishra, A. K. (2002). To stay or to go: Voluntary survivor turnover following an organizational downsizing. Journal of Organizational Behavior, 23(6), 707-729. Stajkovic, A. D., & Luthans, F. (2003). Social cognitive theory and self-efficacy: Implications for motivation theory and practice. Motivation and Work Behavior, 126, 140. Takase, M. (2010). A concept analysis of turnover intention: Implications for nursing management. Collegian, 17(1), 3-12. The Malaysian Insider. (2014). “Voluntary Turnover: Why It Exists and What It Costs”. Retrieved from: http: www.thomasconcept.com/.../Voluntary%20Turnover-

89
Thompson, P. A., Navarra, M. B., & Antonson, N. (2005). Patient safety: the four domains of nursing leadership. Nursing Economics, 23(6), 331. Trevor, C. O. (2001). Interactions among actual ease-of-movement determinants and job satisfaction in the prediction of voluntary turnover. Academy of Management Journal, 44(4), 621-638. Tropman, J. E. (2002). The compensation solution: How to develop an employee-driven rewards system (Vol. 17). John Wiley & Sons. Turner, W. B. (2000). The learning of love: A journey toward servant leadership. Smyth & Helwys Publishing. UNESCO report advises Asia on higher-education investment strategy. (2014). Elsevier Connect. Retrieved August 11, 2016, from https://www.elsevier.com/connect/unesco-report-advises-asia-on-higher-education-investment-strategy.
Valentine, S., Greller, M. M., & Richtermeyer, S. B. (2006). Employee job response as a function of ethical context and perceived organization support. Journal of Business Research, 59(5), 582-588. Valle, M., & Witt, L. A. (2001). The moderating effect of teamwork perceptions on the organizational politics-job satisfaction relationship. The Journal of Social Psychology, 141(3), 379-388. Van Schalkwyk, S., Du Toit, D. H., Bothma, A. S., & Rothmann, S. (2010). Job insecurity, leadership empowerment behaviour, employee engagement and intention to leave in a petrochemical laboratory. South African Journal of Human Resource Management, 8(1), 1-7. Ventrice, C. (2003). Make Their Day!: Employee Recognition that Works. Berrett-Koehler Publishers. Vera, D., & Crossan, M. (2004). Strategic leadership and organizational learning. Academy of Management Review, 29(2), 222-240. Vigoda‐Gadot, E., & Talmud, I. (2010). Organizational politics and job outcomes: The moderating effect of trust and social support. Journal of Applied Social Psychology, 40(11), 2829-2861. Watson-Manheim, M. B., & Bélanger, F. (2002). Support for communication-based work processes in virtual work. E-service Journal, 1(3), 61-82. WEN, C. P. (2013). The impact of HRM practices on employee turnover intention in UTAR (Doctoral dissertation, UNIVERSITI TUNKU ABDUL RAHMAN). Wey Smola, K., & Sutton, C. D. (2002). Generational differences: Revisiting generational work values for the new millennium. Journal of Organizational Behavior, 23(4), 363-382. Wright, T. A., & Bonett, D. G. (2007). Job satisfaction and psychological well-being as nonadditive predictors of workplace turnover. Journal of Management, 33(2), 141-160.

90
Wolf, L., Yadav, A., Good, J., Margaritis, M., & Berges, M. (2015, March). Computer Science (CS) and Computational Thinking (CT)-International Perspectives on Developing Student and Teacher Competencies. In Society for Information Technology & Teacher Education International Conference (Vol. 2015, No. 1, pp. 123-126). Yee, C. P., & Mokhtar, A. H. A. (2013). International students’ learning experiences at private higher education institutions in Malaysia. 092 Proceeding of the Global Summit on Education (GSE 2013). Yin-Fah, B. C., Foon, Y. S., Chee-Leong, L., & Osman, S. (2010). An exploratory study on turnover intention among private sector employees. International Journal of Business and Management, 5(8), 57-64. Young, J., Ferrell, J., & Hayward, K. (2008). Cultural criminology: An invitation Zakaria, N. Z., Jidi, M. M., Zani, A. M., Mislan, A., & Eshak, E. S. (2014). Job Mobility among Malaysian Academician: an Analysis of Predictors. Proceeding of the Social Sciences Research ICSSR, 488-497.
Zhang, X., & Bartol, K. M. (2010). Linking empowering leadership and employee creativity: The influence of psychological empowerment, intrinsic motivation, and creative process engagement. Academy of Management Journal, 53(1), 107-128.

91
APPENDIX A – Survey Questionnaire
RESEARCH TITLE:
PSYCHOLOGICAL FACTORS ARE PREDICTOR OF TURNOVER INTENTION AMONG LECTURERS IN PRIVATE UNIVERSITY COLLEGES IN NEGERI
SEMBILAN. Dear Respondent My name is Darishinee Balasingam. I’m a Master’s Degree student of Human Resource Management (HRM) from Graduate School of Othman Yeop Abdullah, Universiti Utara Malaysia (OYAGSB UUM). I’m currently conducting a research in the area of turnover intention among the lecturers in private University Colleges in Negeri Sembilan. Therefore, I would appreciate if you could answer all of the questions in the survey as the information you provide will influence success of this research. It will take less than 15 minutes to complete the questionnaire. Please note that responses collected will be treated with the strictest confidentiality and will be used for academic purposes only. Your honest completion of this questionnaire will assist in generating information that will help private university colleges to improve on their turnover management, enhance quality of service and improved productivity.
Thank you very much for your time and cooperation in answering this questionnaire.
Prepared By: Darishinee Balasingam
Master of Human Resource Management, Othman Yeop Abdullah Graduate School of Business (OYAGSB),
Universiti Utara Malaysia
If you have any queries about this survey, please contact me, Darishinee Balasingam or my Supervisor, Dr Jasmin at Othman Yeop Abdullah Graduate School of Business, University Utara Malaysia(UUMKL).
HP Phone: 014-9046591 Email – [email protected]

92
SECTION A: DEMOGRAPHIC INFORMATION
Gender: 1. Male 2. Female
Age group:
1. 24-34 2. 35-45 3. 46-56 4. > 56
Highest education qualification:
1. PHD 2. DBA 3. Master Degree 4. Bachelor Degree 5. Others, please specify: ……………………
Current position:
1. Dean 2. Professor 3. Associate Professor 4. Senior Lecturer 5. Lecturer
Length of employment in this company (years):
1. Below than 2 years 2. 2 years to 5 years 3. 5 years to 10 years 4. More than 10 years
Type of employment:
1. Permanent 2. Contract 3. Outsource (Agency) 4. Expatriate
Monthly income (RM):
1. < 3000 2. 2. < 3001 - 4000 3. < 4001 - 5000 4. < 5001 - 6000 5. > 6001
Faculty: 1. Faculty of Business Management 2. Faculty of Information Technology 3. Faculty of Engineering
This section contains questions that will ask your personal information. For each question,
please tick (/) in the most appropriate box or write your response in the space provided.

93
4. Faculty of Hospitality 5. Faculty of Tourism 6. Faculty of Medical 7. Faculty of Arts 8. Others, please specify: ……………………
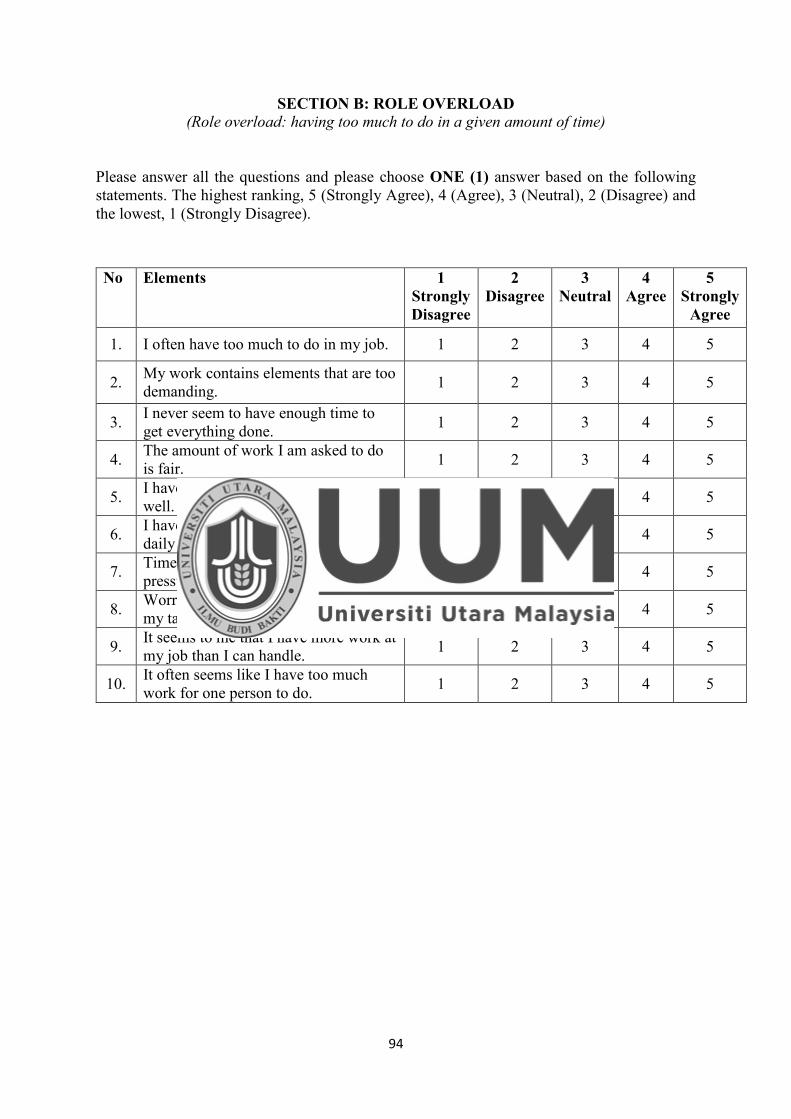
94
SECTION B: ROLE OVERLOAD (Role overload: having too much to do in a given amount of time)
Please answer all the questions and please choose ONE (1) answer based on the following statements. The highest ranking, 5 (Strongly Agree), 4 (Agree), 3 (Neutral), 2 (Disagree) and the lowest, 1 (Strongly Disagree).
No Elements 1 Strongly Disagree
2 Disagree
3 Neutral
4 Agree
5 Strongly
Agree
1. I often have too much to do in my job. 1 2 3 4 5
2. My work contains elements that are too demanding. 1 2 3 4 5
3. I never seem to have enough time to get everything done. 1 2 3 4 5
4. The amount of work I am asked to do is fair. 1 2 3 4 5
5. I have too much work to do everything well. 1 2 3 4 5
6. I have too little time to perform my daily tasks. 1 2 3 4 5
7. Times that I must work under time pressure. 1 2 3 4 5
8. Worry that I will not be able to fulfill my tasks. 1 2 3 4 5
9. It seems to me that I have more work at my job than I can handle. 1 2 3 4 5
10. It often seems like I have too much work for one person to do. 1 2 3 4 5

95
SECTION C: LEADER FACILITATION AND SUPPORT (Leader facilitations and support: reflects the perception of leaders ‘behaviors the extent to
which leaders helping to accomplish work goals)
Please answer all the questions and please choose ONE (1) answer based on the following statements. The highest ranking, 5 (Strongly Agree), 4 (Agree), 3 (Neutral), 2 (Disagree) and the lowest, 1 (Strongly Disagree).
No Elements 1 Strongly Disagree
2 Disagree
3 Neutral
4 Agree
5 Strongly
Agree
1. My boss is flexible about how I accomplish my job objectives. 1 2 3 4 5
2. My manager is supportive of my ideas and ways of getting things done. 1 2 3 4 5
3. My boss gives me the authority to do my job as I see fit. 1 2 3 4 5
4. I can trust my boss to back me up on decisions I make in the field. 1 2 3 4 5
5. My supervisor understands my job problems and needs very well. 1 2 3 4 5
6. My supervisor is willing to listen to my problems. 1 2 3 4 5
7. My supervisor asks employees for their suggestions on what assignments should be made.
1 2 3 4 5
8. My supervisor treats all the employees she/he supervises as his/her equal. 1 2 3 4 5
9. My supervisor is friendly and approachable. 1 2 3 4 5
10. My supervisor asks employees for their suggestions concerning how to carry out assignments.
1 2 3 4 5

96
SECTION D: WORKGROUP SUPPORT (Workgroup support: cognitively closer entity, tend to attribute a perceived sense of control
and the resulting positive emotions to their workgroup)
Please answer all the questions and please choose ONE (1) answer based on the following statements. The highest ranking, 5 (Strongly Agree), 4 (Agree), 3 (Neutral), 2 (Disagree) and the lowest, 1 (Strongly Disagree).
No Elements 1 Strongly Disagree
2 Disagree
3 Neutral
4 Agree
5 Strongly
Agree
1. When I encounter problems at work, there is always a co-worker to turn to. 1 2 3 4 5
2. My co-worker supports me. 1 2 3 4 5
3. If problems exist at my work, I can discuss them with my colleagues. 1 2 3 4 5
4. There is someone at work who encourages my development. 1 2 3 4 5
5. I have a best friend at work. 1 2 3 4 5
6. Our department’s committees, councils, and teams are robust and active.
1 2 3 4 5
7.
Employees in my department regularly recognize each other and participate enthusiastically in any department recognition events.
1 2 3 4 5
8. There is a strong sense of connection, of community, among People in the department.
1 2 3 4 5
9. When an employee is having problems, other people in the department rally around and helps in constructive ways.
1 2 3 4 5
10. A strong, consistent network of coaching is available to employees in this department.
1 2 3 4 5

97
SECTION E: EMPLOYEE RECOGNITION
(Employee recognition: structure of “values and organizing principles centered on fulfilling employees’ needs, promoting employees’ best interests, and valuing employees’
contributions”) Please answer all the questions and please choose ONE (1) answer based on the following statements. The highest ranking, 5 (Very Satisfied), 4 (Satisfied), 3 (Somewhat satisfied), 2 (Somewhat dissatisfied) and the lowest, 1 (Not at all satisfied).
No Elements 1 Not at
all satisfied
2 Somewhat Dissatisfied
3 Somewhat satisfied
4 Satisfied
5 Very
Satisfied
1.
How satisfied are you with the amount of communication regarding employee recognition?
1 2 3 4 5
2.
How satisfied are you with the number of times you have been recognized in the past year?
1 2 3 4 5
3.
How satisfied are you that the achievements are worthy of recognition?
1 2 3 4 5
4.
How satisfied are you with the type and value of the rewards presented?
1 2 3 4 5
5.
How satisfied are you that receiving recognition motivates you to improve your performance?
1 2 3 4 5
6.
How satisfied are you that the employee recognition process is a valuable tool for showing gratitude and recognizing performance?
1 2 3 4 5
7.
How satisfied are you with the type of audience present at your recognition (e.g., peers, management)?
1 2 3 4 5

98
8.
How satisfied are you with management's participation and role in your recognition?
1 2 3 4 5
9.
How satisfied are you that the employee recognition process be continued?
1 2 3 4 5
10. Overall, how satisfied are you with employee recognition?
1 2 3 4 5

99
SECTION F: TURNOVER INTENTION (Turnover intention is a wish to acquire higher task demands in the sense that employees
have thought about change but have not yet acted to seek change)
Please answer all the questions and please choose ONE (1) answer based on the following statements. The highest ranking, 5 (Strongly Agree), 4 (Agree), 3 (Neutral), 2 (Disagree) and the lowest, 1 (Strongly Disagree).
No Elements 1 Strongly Disagree
2 Disagree
3 Neutral
4 Agree
5 Strongly
Agree
1. It is very possible that I will look for new job next year. 1 2 3 4 5
2. I often think about quitting my job at this organization. 1 2 3 4 5
3. I intend to remain with this organization indefinitely. 1 2 3 4 5
4. I feel that I could leave this job 1 2 3 4 5
5. I intend to look for a job outside of this organization within next year.
1 2 3 4 5
6. I am actively searching for an alternative to the organization.
1 2 3 4 5
7. I think a lot about leaving this organization.
1 2 3 4 5
8. I intend to leave this organization this year
1 2 3 4 5
9. As soon as possible, I will leave the organization
1 2 3 4 5
10. If I may choose again, I will choose to work for the current organization.
1 2 3 4 5
****************************** THANK YOU********************************

100
APPENDIX B - SPSS Outputs 1. Reliability Analysis for Turnover Intention.
2. Reliability Analysis for Role Overload.

101
3. Reliability Analysis for Leader Facilitation.
4. Reliability Analysis for Workgroup Support.

102
5. Reliability Analysis for Employee Recognition.

103
Descriptive Analysis 1. Descriptive Statistic.
1. Normality Test.
1. Factor Analysis – Role Overload (Independent).

104
2. Factor Analysis – Leader Facilitation (Independent).

105
3. Factor Analysis – Workgroup Support (Independent).
4. Factor Analysis – Employee Recognition (Independent).

106
5. Factor Analysis – Turnover Intention (Dependent).

107
Correlations Analysis
1. Correlations Analysis for Role Overload, Leader Facilitation, Workgroup Support, Employee Recognition and Turnover Intention

108
Multiple Regression Analysis 1. Multiple Regressions for Role Overload, Leader Facilitation, Workgroup Support, Employee Recognition and Turnover Intention.

109