Masterclass in Investment Promotion and Facilitation
99
www . wa vteq.com | www .incentivesmonitor .com | www . f dipr of essionals.com | www . f diaccounting.com company/wavteq @wavteq 1 TPSA program is ex ecuted by In partnership with: Data ¦ Technology ¦ Consulting Masterclass in Investment Promotion and Facilitation “How to Attract FDI from Canada and Similar Countries” Sultan Hotel Jakarta, 9 & 10 November 2016 Workshop facilitated by:
-
Upload
khangminh22 -
Category
Documents
-
view
2 -
download
0
Transcript of Masterclass in Investment Promotion and Facilitation

www.wavteq.com | www.incentivesmonitor.com | www.fdiprofessionals.com | www.fdiaccounting.com
company/wavteq @wavteq
1
TPSA program is executed by
In partnership with:
Data ¦ Technology ¦ Consulting
Masterclass inInvestment Promotion and Facilitation
“How to Attract FDI from Canada and Similar Countries”
Sultan Hotel Jakarta, 9 & 10 November 2016
Workshop facilitated by:

DAY 1: Best Practices inInvestment Promotion
08:45 – 09:00 Opening StatementsModule 1: Global FDI Trends09:00 – 09:3009:30 – 10:00Module 2:
Global and regional FDI trends (with FDI quiz) Canadian FDI trends and opportunities for Indonesia Key success factors in attracting FDI
10:00 – 10:3010:30 – 11:0011:00 – 11:30
What is investment promotion and why does it workMost effective techniques to attract FDI: review of evidenceCoffee break
Module 3: Best practices in Lead Generation11:30 – 12:4512:45 - 14:0014:00 - 14:4514:45 - 15:1515:15 - 15:45Module 4:
Group exercises (based on real FDI prospects for Indonesia)LunchBest practices in lead generationResults of our campaign to target Canadian FDI in IndonesiaCoffee breakFDI value propositions & Indonesia’s competitiveness
15:45 – 16:1516:15 – 16:3016:30 – 17:00
Indonesia’s value proposition for FDI (group quiz) Best practices in proposition developmentPresentation of materials to attract FDI to Indonesia
2

About WAVTEQ
1W A V T E Q

About WAVTEQ
4
WAVTEQ is a specialist consulting firm working with economic development agencies to attract FDI and providing corporatelocation services to companies. The WAVTEQ Group is the largest FDI team worldwide with the most extensive global presence
Over 75 FDI consultants, with leadgeneration teams in Austria, Canada,China, Germany, Hong Kong, India, Ireland, Japan, Korea, Spain, UK and US
We have helped over 1,000 companies establish over $50 billion of greenfield investments covering all industries and types ofproject, including manufacturing, logistics, HQs, and R&D
WAVTEQ develops the world’s leading FDI tracking and
corporate location databases
WAVTEQ is the technology and consulting partner offDi Intelligence, Financial Times, with the Canada, Asia and
Middle East Franchise

WAVTEQ thought leadership in FDI
5
WAVTEQ's team is at the forefront of knowledge on FDI, with over 100 FDI publications. WAVTEQprovides a free publication portal for FDI studies (www.wavteq.com/publications) subscribed to byover 500 EDOs and IPAs. Our most recent publications are shown on this slide.
These studies used extensively by EDOs, IPAs and international organizations to inform their investment promotion strategies.
W A V T E Q
Module 1: FDI Trends and Opportunities
Time: 9:00-10:00

Why we are here? The importanceof MNEs in the world economy
9/20/2017Source: WAVTEQ based on official data sources
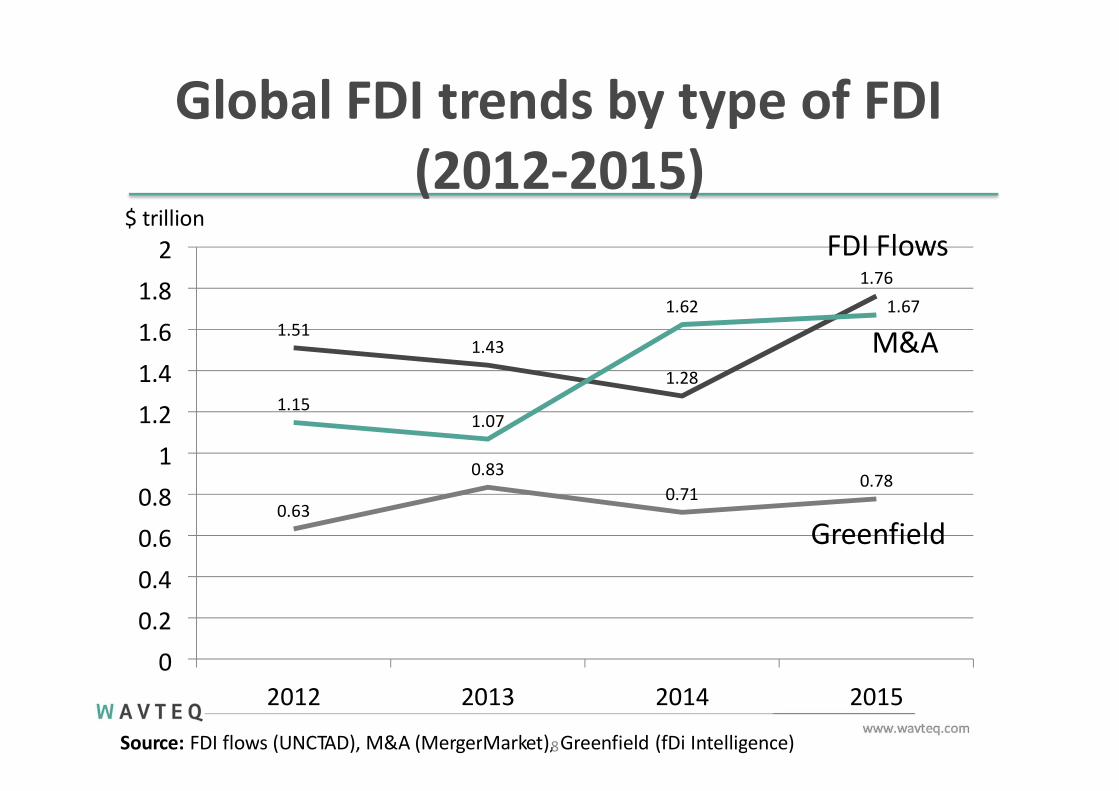
Global FDI trends by type of FDI (2012-2015)
2012 2013 2014
Source: FDI flows (UNCTAD), M&A (MergerMarket),8Greenfield (fDi Intelligence)
1.511.43
1.28
1.76
1.151.07
1.62 1.67
M&A
0.63
0.830.71
0.78
2
1.8
1.6
1.4
1.2
1
0.8
0.6
0.4
0.2
02015
$ trillion
Greenfield
FDI Flows

Country ranking – location ofgreenfield capex
2016 (Jan-Sept)1. India2. US3. China4. Indonesia5. UK6. Vietnam7. Egypt8. Mexico9. Australia10. France
Source: www.fdimarkets.com
20151. US2. India3. UK4. China5. Indonesia6. Mexico7. Vietnam8. Pakistan9. Brazil10. Australia9
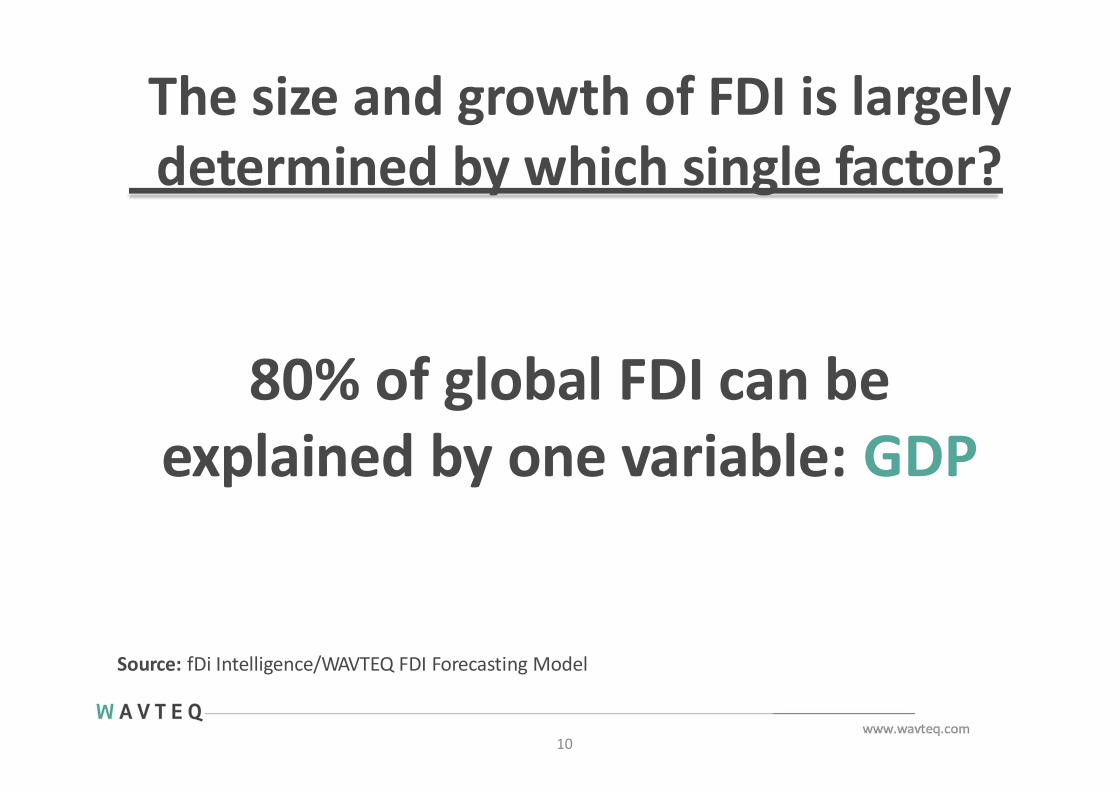
The size and growth of FDI is largelydetermined by which single factor?
10
80% of global FDI can beexplained by one variable: GDP
Source: fDi Intelligence/WAVTEQ FDI Forecasting Model

GDP also explains the source of FDI:The 6 largest countries by GDP account for over half of global FDI
20%
18%
16%
14%
12%
10%
8%
6%
4%
2%
0%
11
2012 2013 2014 2015
Source: WAVTEQ based on www.fdimarkets.com
2016 (Jan-July)
USChina
JapanGermanyUKFrance
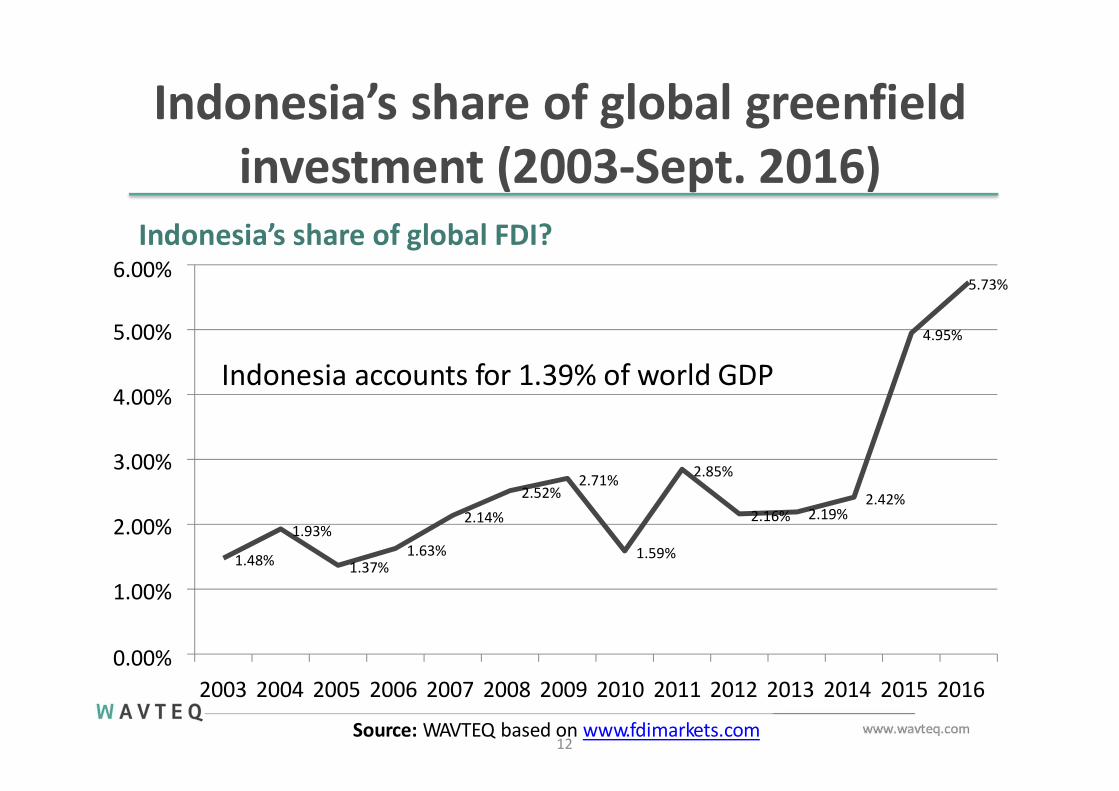
Indonesia’s share of global greenfieldinvestment (2003-Sept. 2016)
1.48%
12
1.93%
1.37%1.63%
2.14%
2.52%2.71%
1.59%
2.85%
2.16% 2.19%2.42%
4.95%
5.73%
1.00%
0.00%2003 2004 2005 2006 2007 2008 2009 2010 2011 2012 2013 2014 2015 2016
Source: WAVTEQ based on www.fdimarkets.com
2.00%
3.00%
4.00%
5.00%
Indonesia’s share of global FDI?6.00%
Indonesia accounts for 1.39% of world GDP
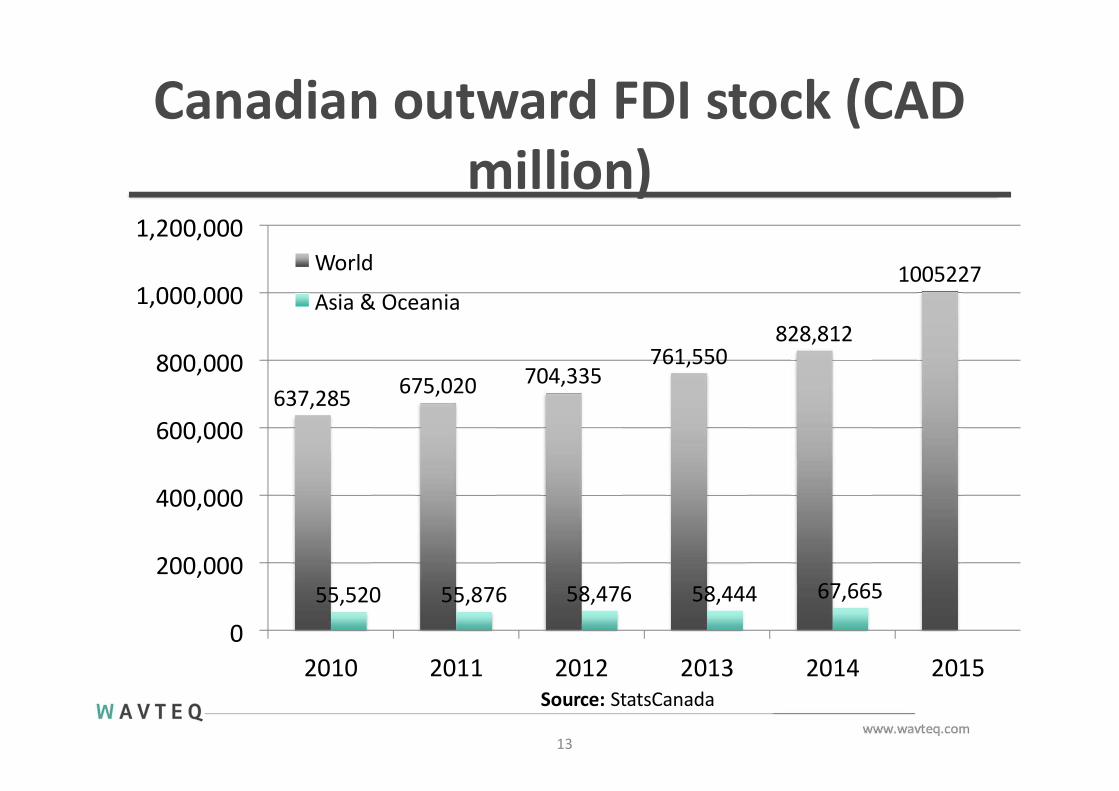
Canadian outward FDI stock (CADmillion)
637,285 675,020 704,335761,550
828,812
1005227
55,520 55,876 58,476 58,444 67,665
0
200,000
400,000
600,000
800,000
1,000,000
1,200,000
2010 2011 2014 20152012 2013Source: StatsCanada
13
World
Asia & Oceania

Canada’s share of global greenfieldinvestment (2003-Sept. 2016)
6.90%
14
4.41%
1.81%1.65%
3.31%3.13%
2.46%3.12%
3.38%
2.58%
3.81%
2.48%
2.18%
0.00%2003 2004 2005 2006 2007 2008 2009 2010 2011 2012 2013 2014 2015 2016
Source: WAVTEQ based on www.fdimarkets.com
1.00%
2.00%
3.00%
4.00%
5.00%
6.00%
7.00%
Canada’s share of global FDI
Canada accounts for 2.5% of world GDP and a similar share of world greenfield FDI
Canada’s decline in market sharerelated to decline in commoditiesprices where Canadian firms are majorforeign investors

W A V T E Q
Module 2: Key success factors in attracting FDI
Time: 10:00-11:00

The corporateperspective
W A V T E Q

Why do companies investoverseas?
17
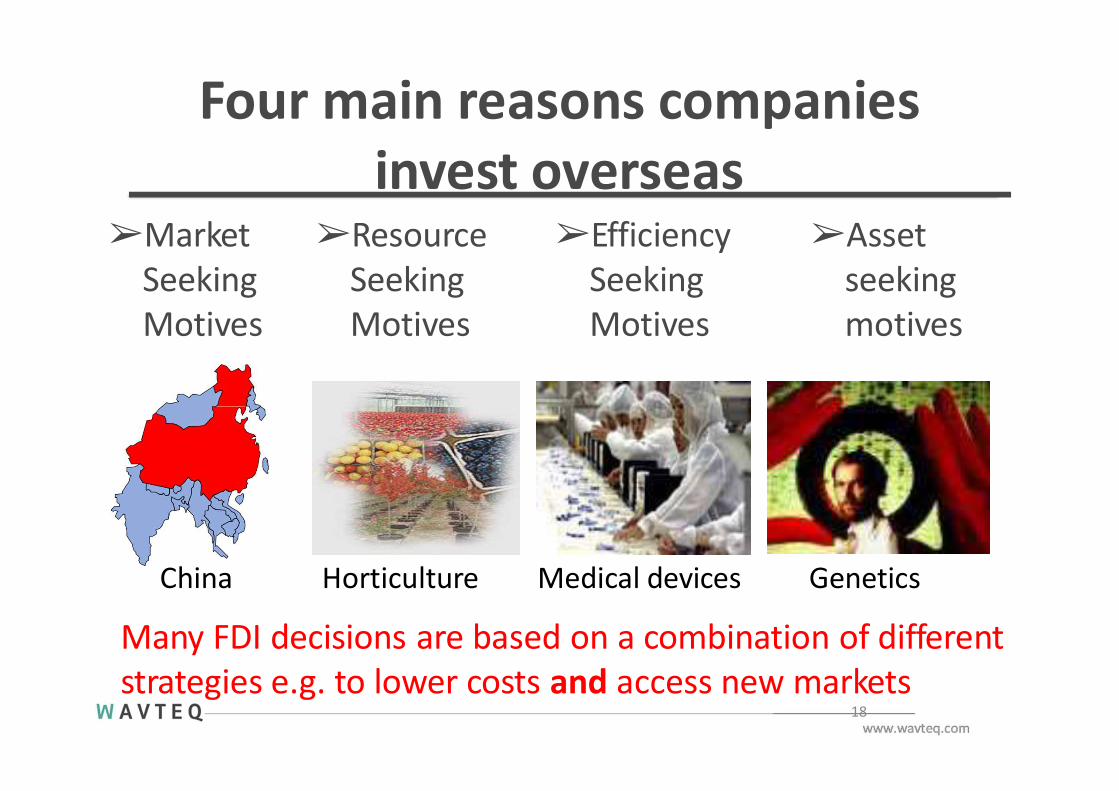
➢Assetseeking motives
➢MarketSeekingMotives
➢ResourceSeeking Motives
➢EfficiencySeeking Motives
China Horticulture Medical devices Genetics
Many FDI decisions are based on a combination of different strategies e.g. to lower costs and access new markets
18
Four main reasons companiesinvest overseas

The governmentperspective
W A V T E Q
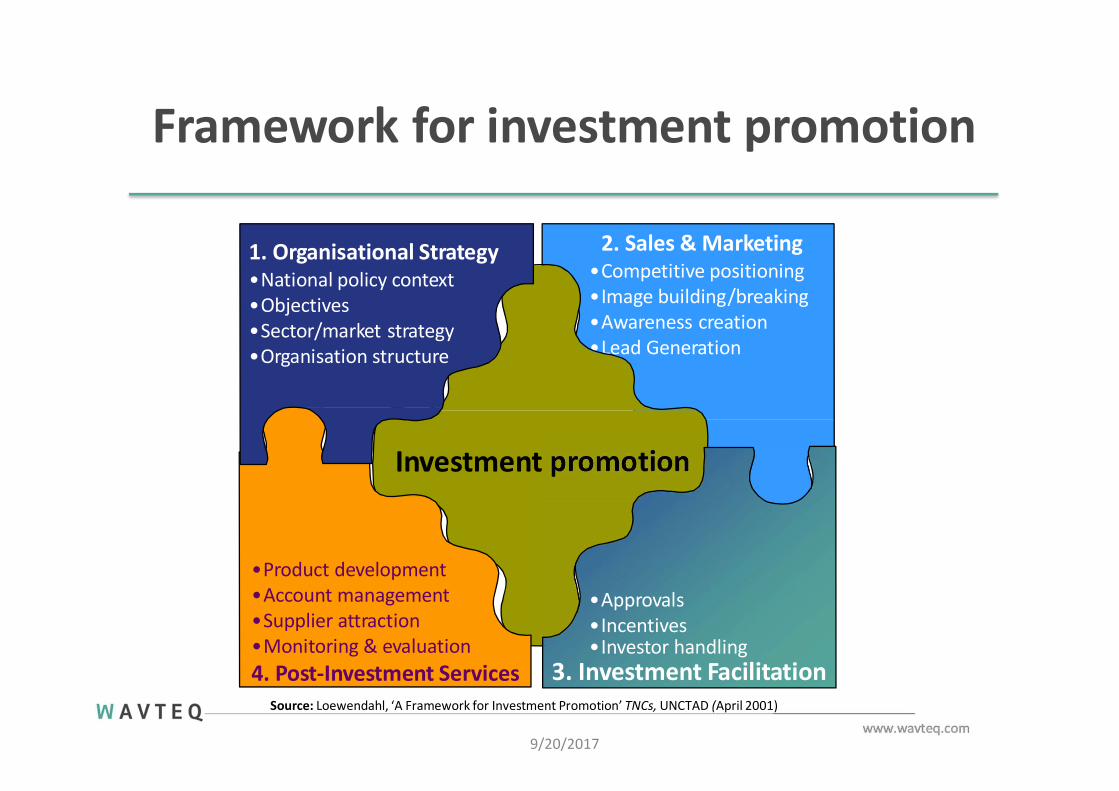
2. Sales & Marketing•Competitive positioning•Image building/breaking•Awareness creation•Lead Generation
Investment promotion
•Approvals•Incentives•Investor handling
3. Investment Facilitation
•Product development•Account management•Supplier attraction•Monitoring & evaluation4. Post-Investment Services
Source: Loewendahl, ‘A Framework for Investment Promotion’ TNCs, UNCTAD (April 2001)
1. Organisational Strategy•National policy context•Objectives•Sector/market strategy•Organisation structure
9/20/2017
Framework for investment promotion
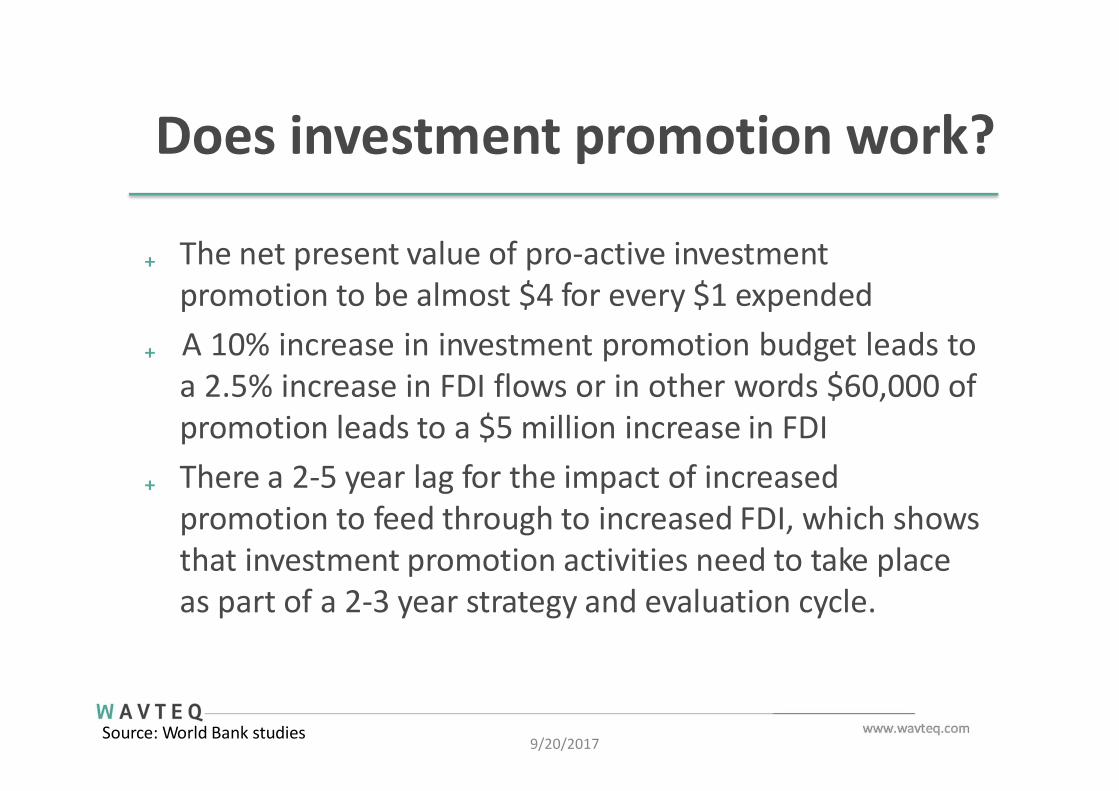
Does investment promotion work?
9/20/2017
₊ The net present value of pro-active investment promotion to be almost $4 for every $1 expended
₊ A 10% increase in investment promotion budget leads toa 2.5% increase in FDI flows or in other words $60,000 ofpromotion leads to a $5 million increase in FDI
₊ There a 2-5 year lag for the impact of increased promotion to feed through to increased FDI, which shows that investment promotion activities need to take place as part of a 2-3 year strategy and evaluation cycle.
Source: World Bank studies

Why does it work?Correcting for imperfect information
22
₊ Image, brand awareness, and perceptions are major factors influencing the location of FDI. Companies make investment location decisions on the basis of their information pool and understanding of an area’s location “offer”.
₊ When making a decision on where to locate the information base of MNEs is far from perfect, and the decision-making process can be subjective and biased. It is often a bureaucratic process, which may be affected by imperfect competition, distorted risk perceptions and political rivalry between affiliates of MNEs.
₊ The implication, as the International Finance Corporation (IFC) argues, is that: “Most companies consider only a small range of potential investment locations. Many other countries are not even on their map.”

Why does it work?Promotion & facilitation of FDI
23
₊ Investment promotion is most effective when it:1. Overcomes information asymmetries2. Compensated for the imperfect functioning of international markets, which makes parent
companies (and their corporate location advisors) reluctant to consider new production sites; and
3. Led to product differentiation of the host country as a location for targeted activities.
₊ A DCI survey of 356 corporate location decision makers found that articles in newspapers & magazines and meetings with EDOs were 3 of the 4 most important factors influencing executivesperceptions of an area’s business climate for inward investment
₊ The EIU survey of 155 MNEs concluded that: “Governmental support for corporate overseas expansion plays a crucial role across all key areas”
What is the economic impact?
24
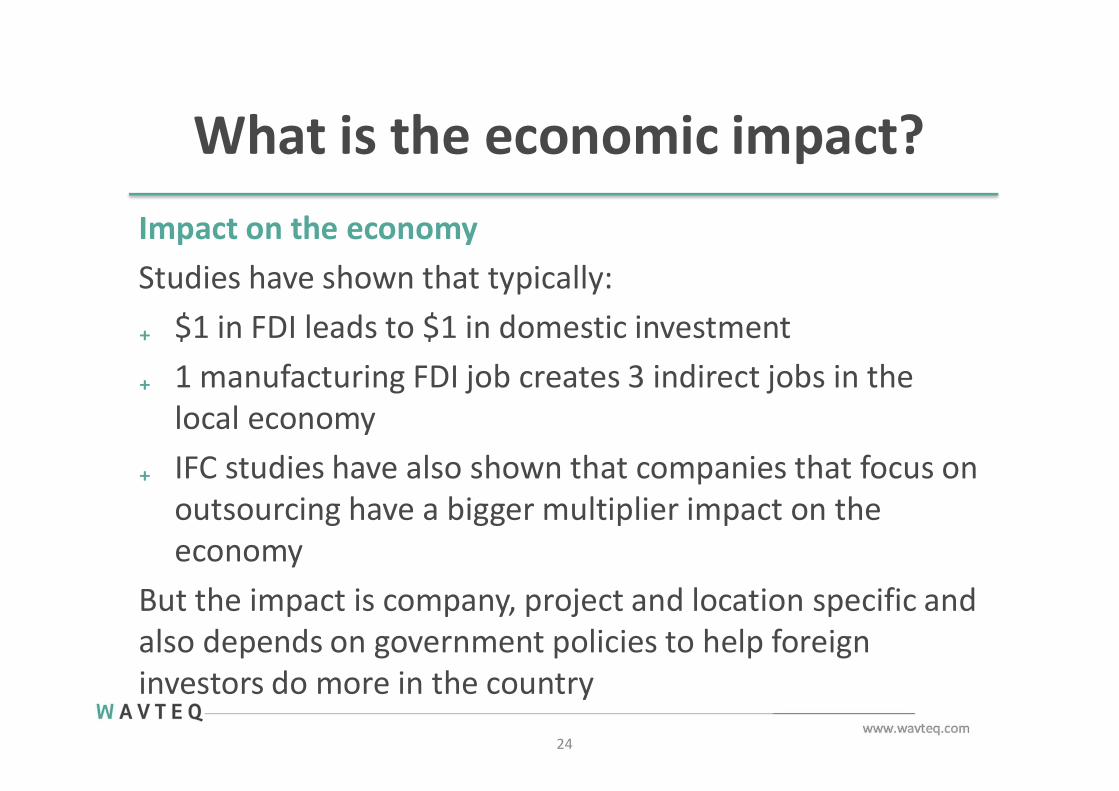
Impact on the economyStudies have shown that typically:₊ $1 in FDI leads to $1 in domestic investment₊ 1 manufacturing FDI job creates 3 indirect jobs in the
local economy₊ IFC studies have also shown that companies that focus on
outsourcing have a bigger multiplier impact on the economy
But the impact is company, project and location specific and also depends on government policies to help foreign investors do more in the country

Most effective techniques toattract FDI:review ofevidence
W A V T E Q

IPA perspective: most effectivetechniques – FT survey
Source: fDi Intelligence
9/20/2017
Technique – most effective % Agencies using
Average score of effectiveness (5=most)
After-care services for existing firms 100% 4.1Sales representatives overseas 75% 4.0Outsourcing LG to consultancy firms 50% 3.5Diaspora inward investment targeting 13% 3.5Conferences, seminars 100% 3.4Inward investment website 100% 3.3Inward FDI missions 63% 3.3Outward FDI missions 63% 3.3Referrals from the national IPA 38% 3.3Conventions, exhibitions 100% 3.1Direct mail to targeted companies 63% 3.0Outward trade missions 38% 3.0
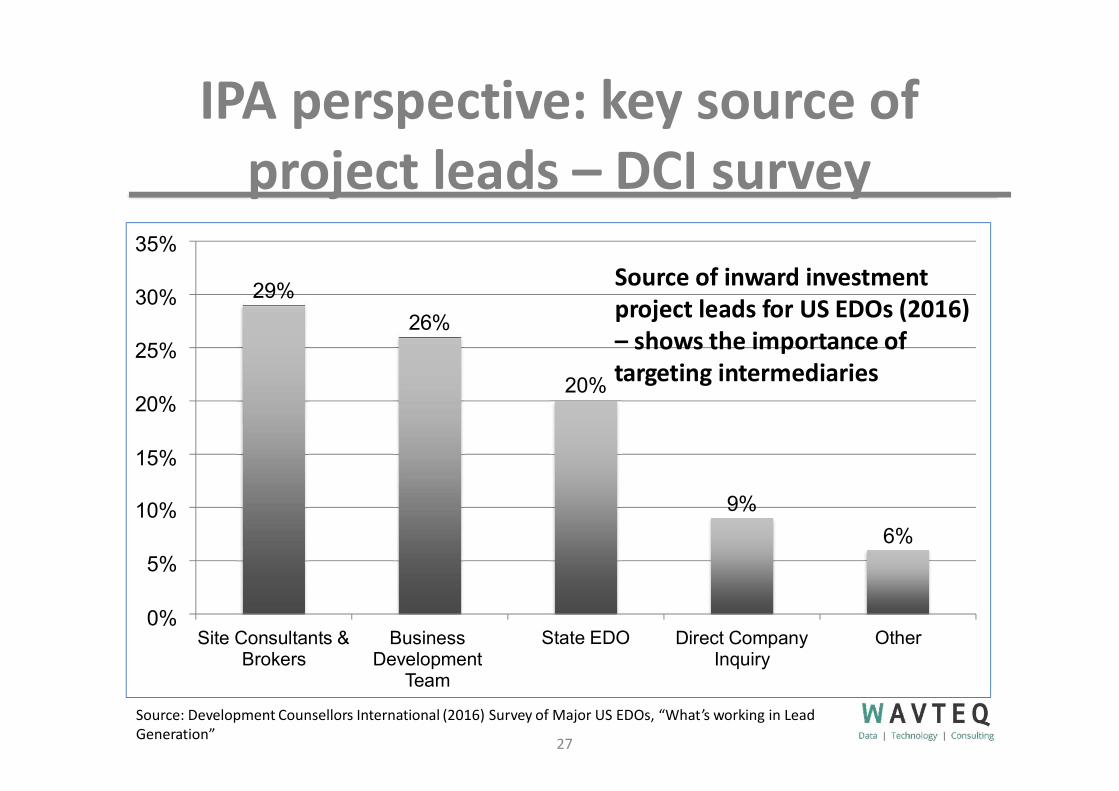
IPA perspective: key source ofproject leads – DCI survey
29%
26%
Source of inward investmentproject leads for US EDOs (2016)– shows the importance of
20% targeting intermediaries
9%
6%5%
0%
10%
20%
15%
25%
30%
35%
Site Consultants & Brokers
Business Development
Team
State EDO Direct Company Inquiry
Other
Source: Development Counsellors International (2016) Survey of Major US EDOs, “What’s working in LeadGeneration”
27
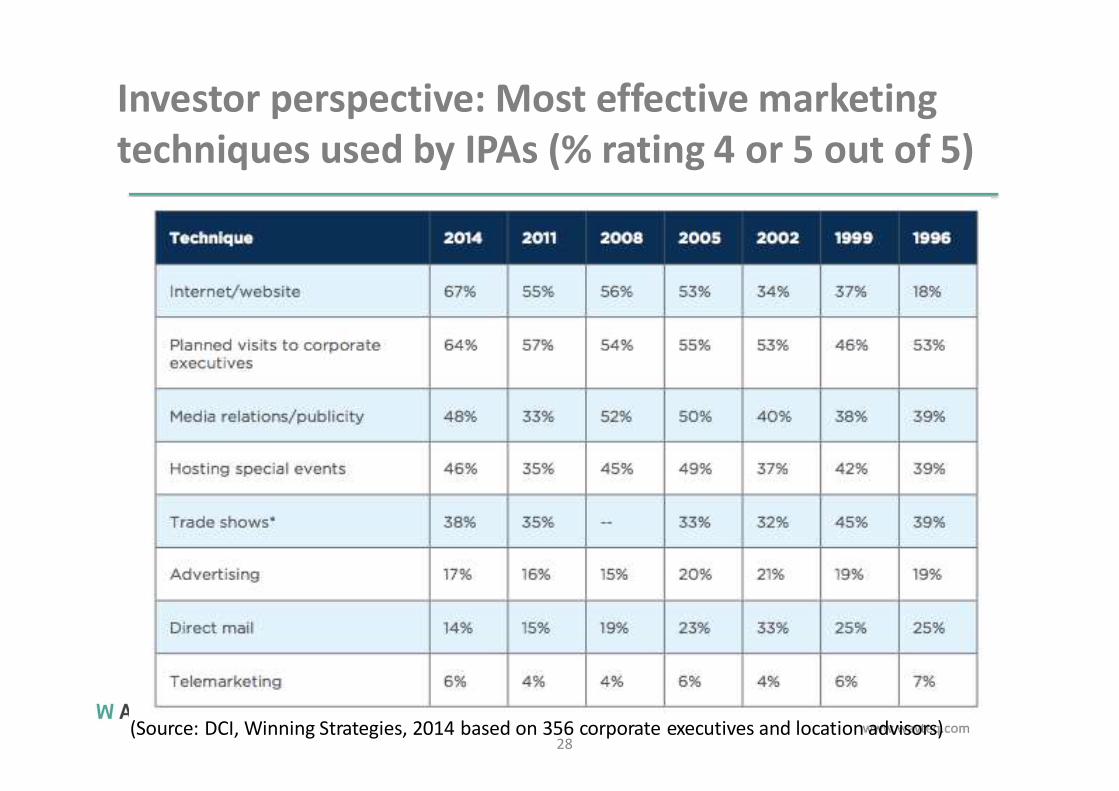
Investor perspective: Most effective marketingtechniques used by IPAs (% rating 4 or 5 out of 5)
(Source: DCI, Winning Strategies, 2014 based on 356 corporate executives and location advisors)28

Investor perspective: Leading sources ofinformation influencing executives perceptions of
an area’s business climate
2%2%
29
4%9%
12%13%
22%21%
24%31%
37%44%
55%
0% 10% 20% 30% 40% 50% 60%
Dialogue with industry peersArticles in newspapers & magazines
Business travel Meetings with EDOs/IPAs
Rankings/SurveysOnline sourcesWord of mouthPersonal travel
Other TV & Radio Advertising
Social media Direct mail
Source: Development Counsellors International “Winning Strategies” (2014) based on a survey of 356 corporate executives
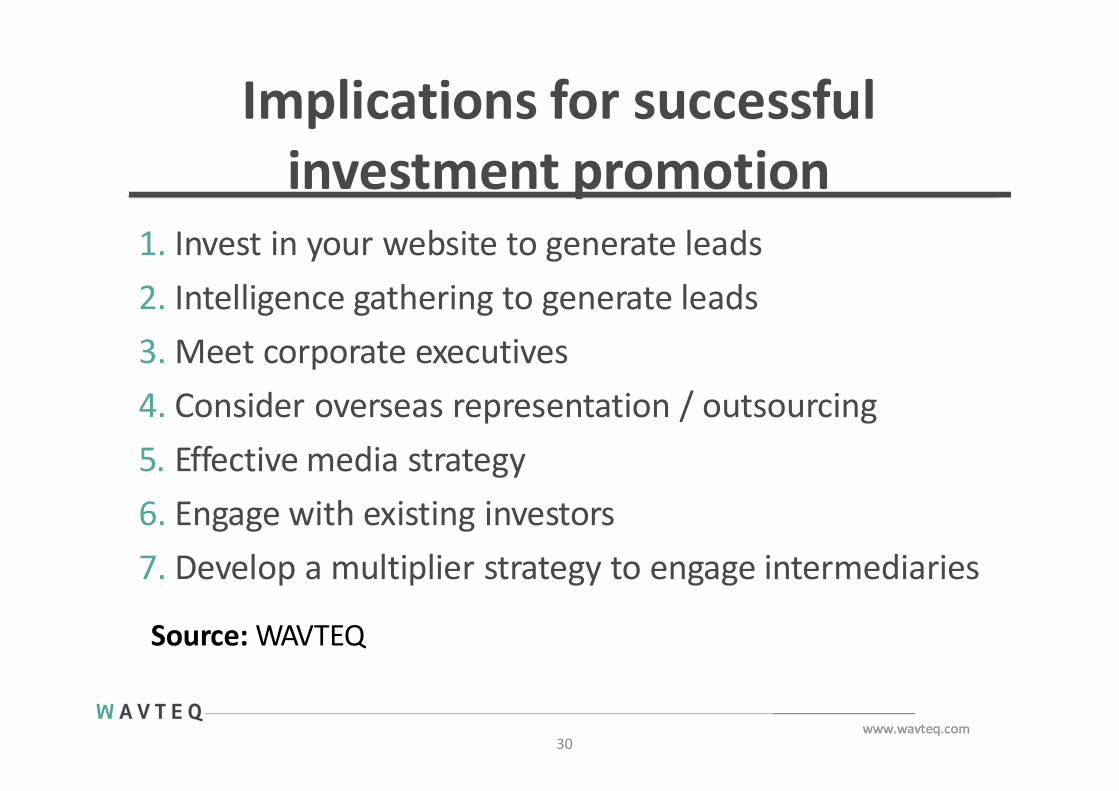
Implications for successfulinvestment promotion
30
1. Invest in your website to generate leads2. Intelligence gathering to generate leads3. Meet corporate executives4. Consider overseas representation / outsourcing5. Effective media strategy6. Engage with existing investors7. Develop a multiplier strategy to engage intermediaries
Source: WAVTEQ
W A V T E Q
Module 3: Best practices in LeadGeneration
Time: 11:30-15:15
Where we arecoming from?
W A V T E Q
Our experience in Lead Generation
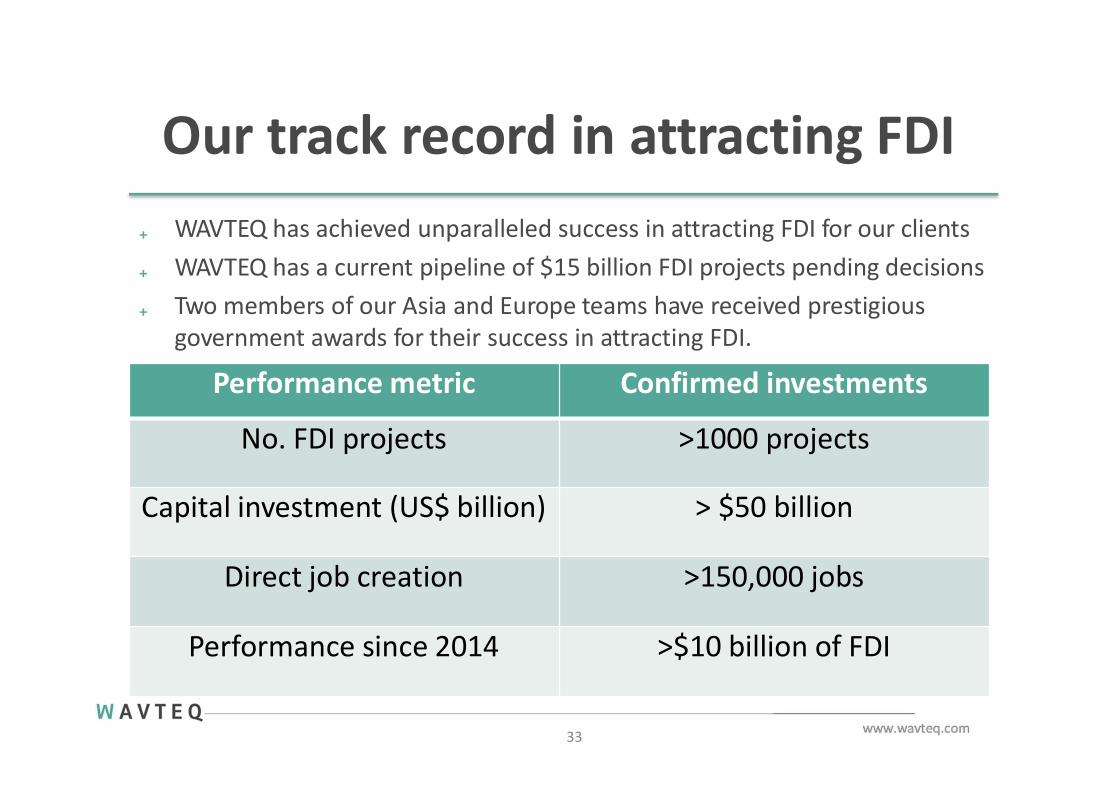
Our track record in attracting FDI₊ WAVTEQ has achieved unparalleled success in attracting FDI for our clients₊ WAVTEQ has a current pipeline of $15 billion FDI projects pending decisions₊ Two members of our Asia and Europe teams have received prestigious
government awards for their success in attracting FDI.
33
Performance metric Confirmed investments
No. FDI projects >1000 projects
Capital investment (US$ billion) > $50 billion
Direct job creation >150,000 jobs
Performance since 2014 >$10 billion of FDI
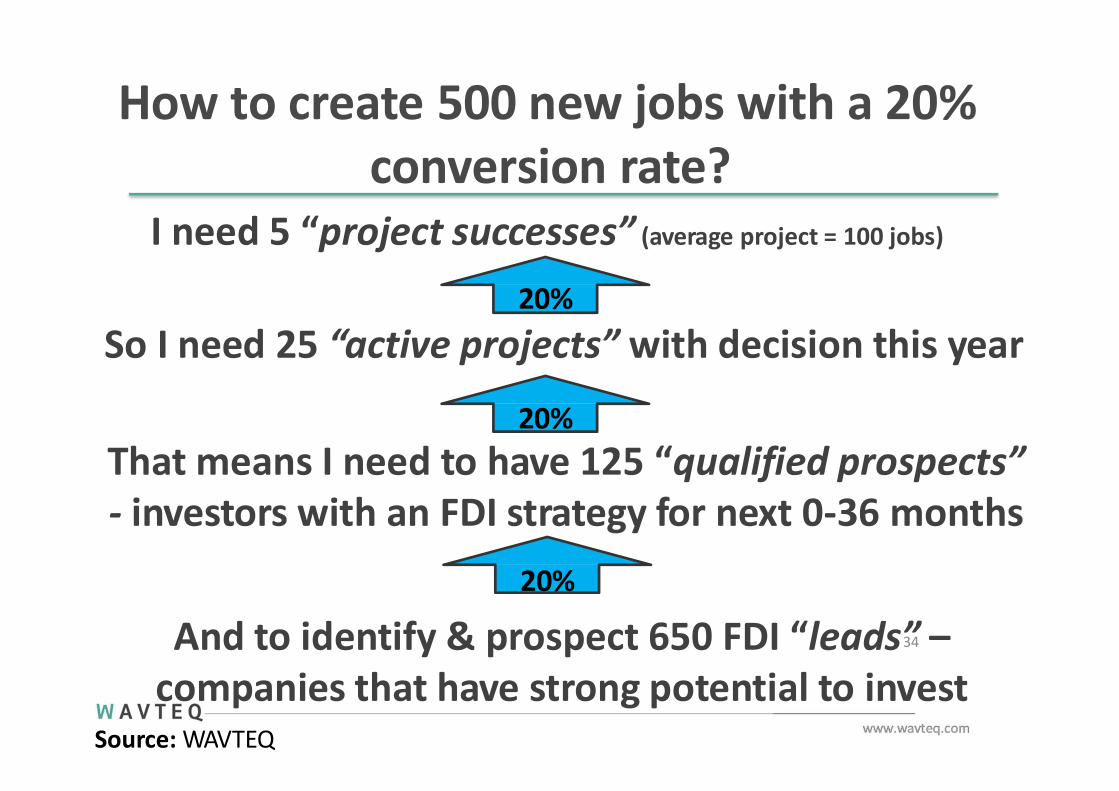
How to create 500 new jobs with a 20%conversion rate?
I need 5 “project successes” (average project = 100 jobs)
20%
So I need 25 “active projects” with decision this year
20%That means I need to have 125 “qualified prospects”- investors with an FDI strategy for next 0-36 months
20%
And to identify & prospect 650 FDI “leads”34 –companies that have strong potential to invest
Source: WAVTEQ
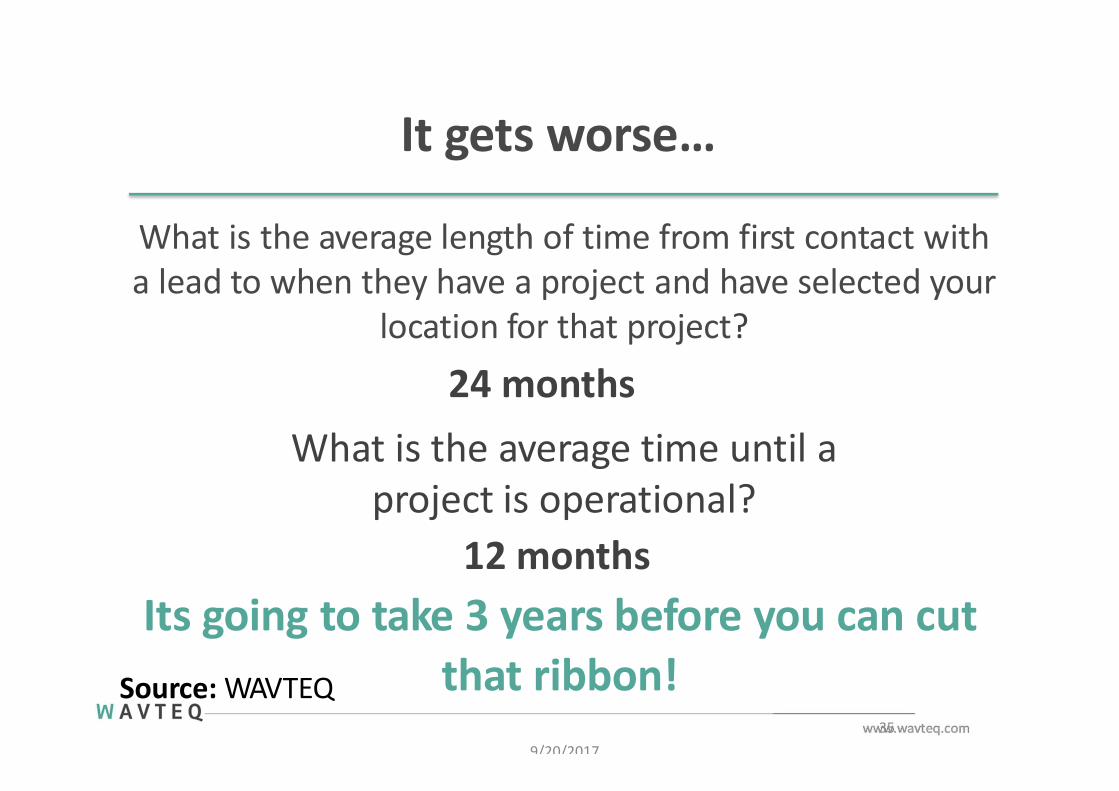
It gets worse…
that ribbon!9/20/2017
35
What is the average length of time from first contact witha lead to when they have a project and have selected your
location for that project?
24 monthsWhat is the average time until a
project is operational?12 months
Its going to take 3 years before you can cutSource: WAVTEQ
Business vs Political reality
Attracting FDI is long term
But politics is short-term
How can we bridge this?
36
Most FDI is market-seeking so cannot be directly influenced by
IPAs
37

Motives for FDI in 2015
Finding capital
Acquiring foreign brands
Moving to business-friendly location
Access raw materials/energy
Other motivesSource: EIU, “Corporate overseas expansion:Opportunities and barriers” (2015) based on a survey of155 senior corporate executives
7
23
31
30
39
42
44
47
57
59
0 10 20 30 40 50 60
Improving R&D/technology
Producing more cost effectively
Seeking foreign markets due to competition…
Opening new markets for products/services
Gaining market share
38
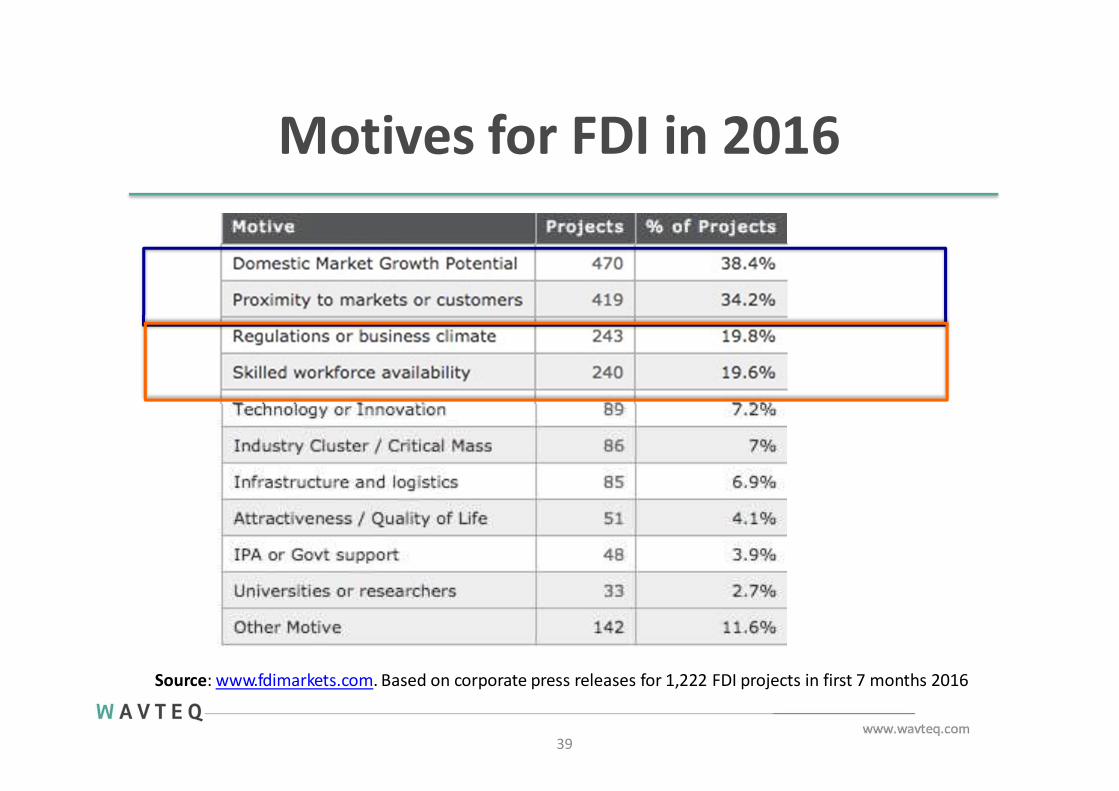
Motives for FDI in 2016
Source: www.fdimarkets.com. Based on corporate press releases for 1,222 FDI projects in first 7 months 2016
39
W A V T E Q
Improving the regulatory & businessclimate, skills, and infrastructure are long
term policy advocacy goals of IPAs
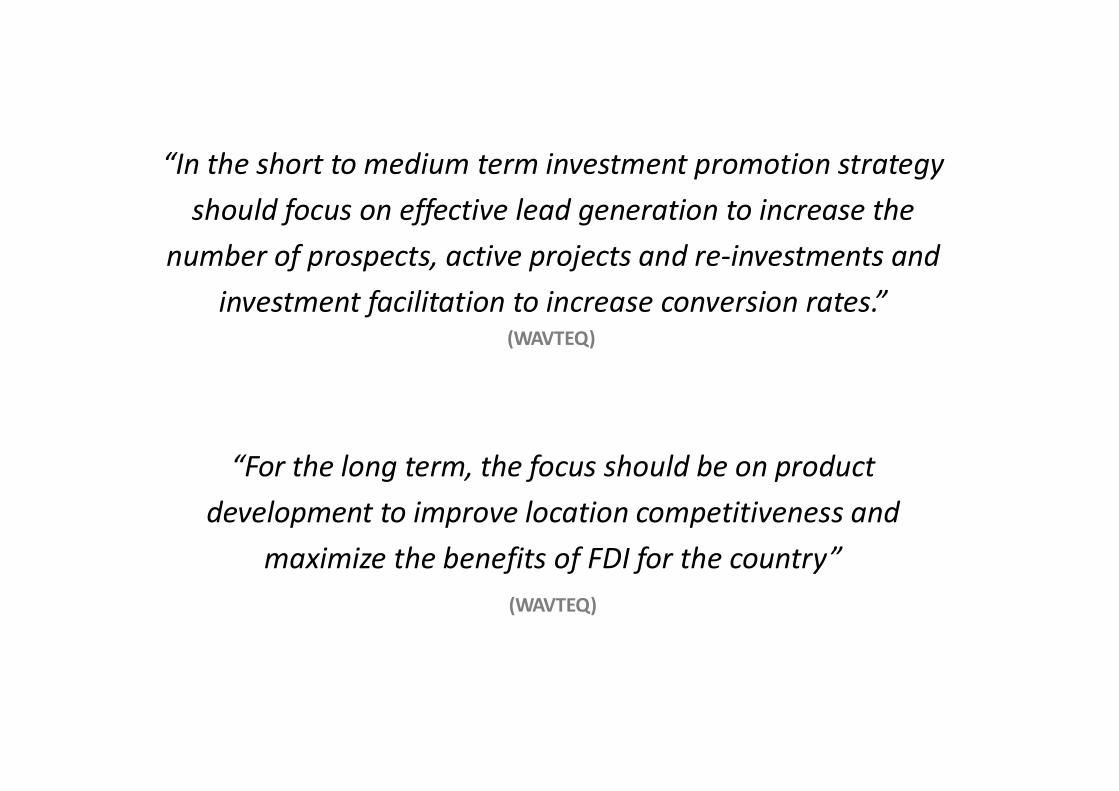
“For the long term, the focus should be on product development to improve location competitiveness and
maximize the benefits of FDI for the country”(WAVTEQ)
“In the short to medium term investment promotion strategy should focus on effective lead generation to increase the
number of prospects, active projects and re-investments and investment facilitation to increase conversion rates.”
(WAVTEQ)

How to grow yoursales pipeline?Intelligence gathering
Quick wins

Intelligence gathering
43
Over 30 companies are about to make their first investmentoverseas or are considering a new investment EVERY DAY₊ There is a lot of “low hanging fruit” out there in the FDI market!
₊ The challenge is to find it and act on it
fDi Intelligence “investor signals” service₊ Screening over 20,000 FT and other sources daily
₊ Tracked over 15,000 companies which our analysts in the FT believe will invest overseas – many have now investe
₊ Over 5,000 companies are considering FDI into Asia Pacific
₊ We are tracking many FDI signals, with the most important signals being:
₊ Company X has a new FDI project or expansion strategy but has not decided where to locate (yet).
₊ Company X is receiving new financing for international expansion, but has not decided on the site (yet)
Intermediaries targeting
44
Low cost lead generation
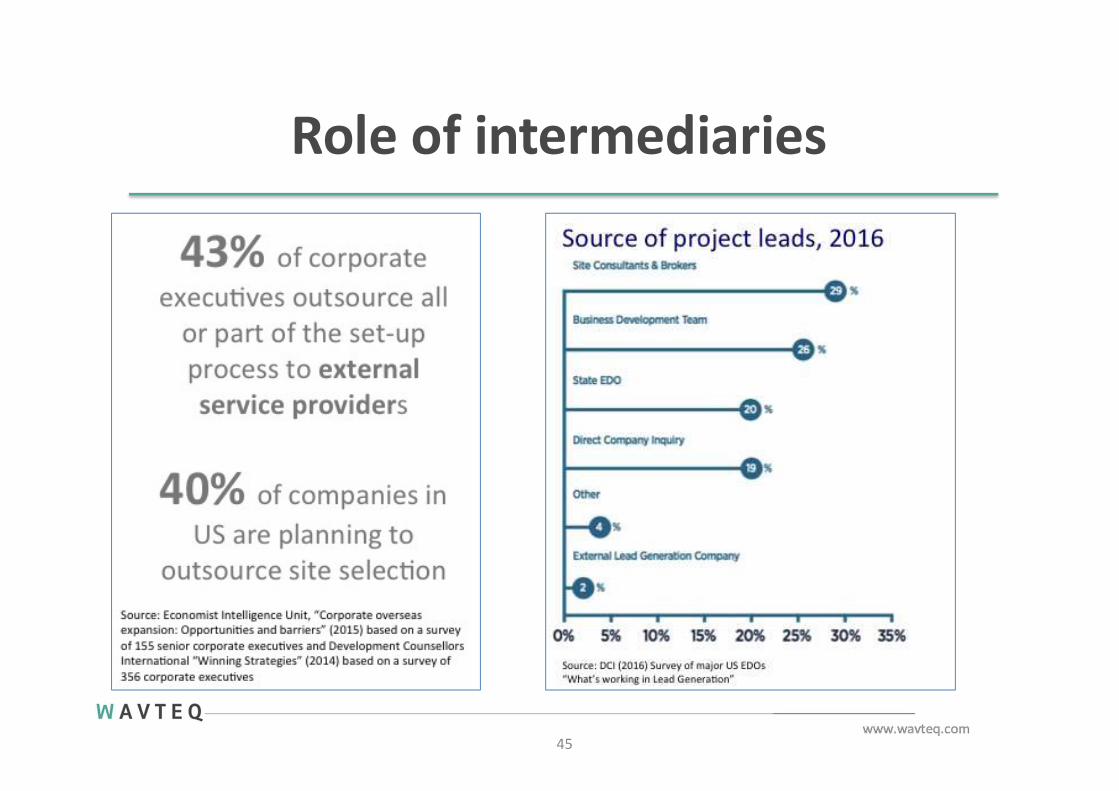
Role of intermediaries
45
Importance of developing amultiplier strategy
46
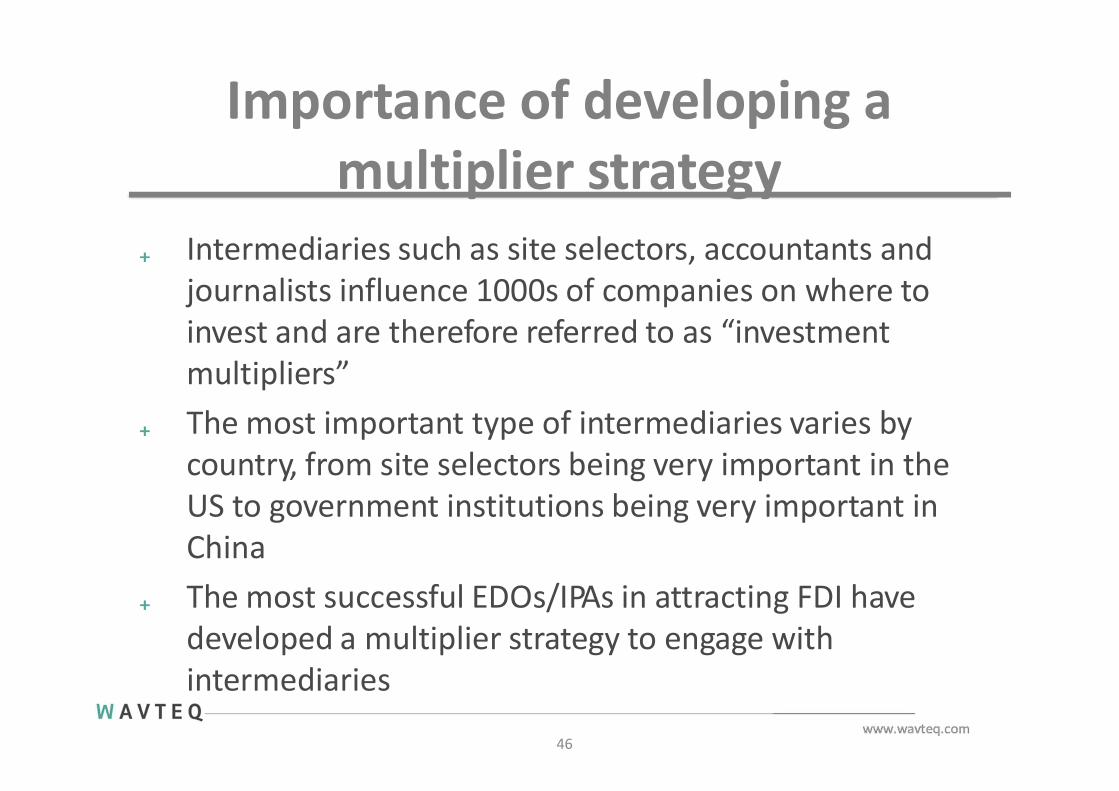
₊ Intermediaries such as site selectors, accountants and journalists influence 1000s of companies on where to invest and are therefore referred to as “investment multipliers”
₊ The most important type of intermediaries varies by country, from site selectors being very important in the US to government institutions being very important in China
₊ The most successful EDOs/IPAs in attracting FDI have developed a multiplier strategy to engage with intermediaries

Key objective of a multiplierstrategy?
47
The key objectives of a multiplier strategy are:
1. Influence the perception of intermediaries about theirlocation and get their location on the investor’s map
2. By demonstrating the professional and value addedservices the EDO/IPA offers, become a trusted businesspartner of the intermediary and gain FDI referrals
3. Provide better facilitation services to investors by knowing the key organisations and individuals who can assist them with the FDI location and setup process

Developing a multiplier strategy: Keytarget markets and intermediary types
Source: www.fdiprofessionals.com
48
Role of intermediaries in FDI
49
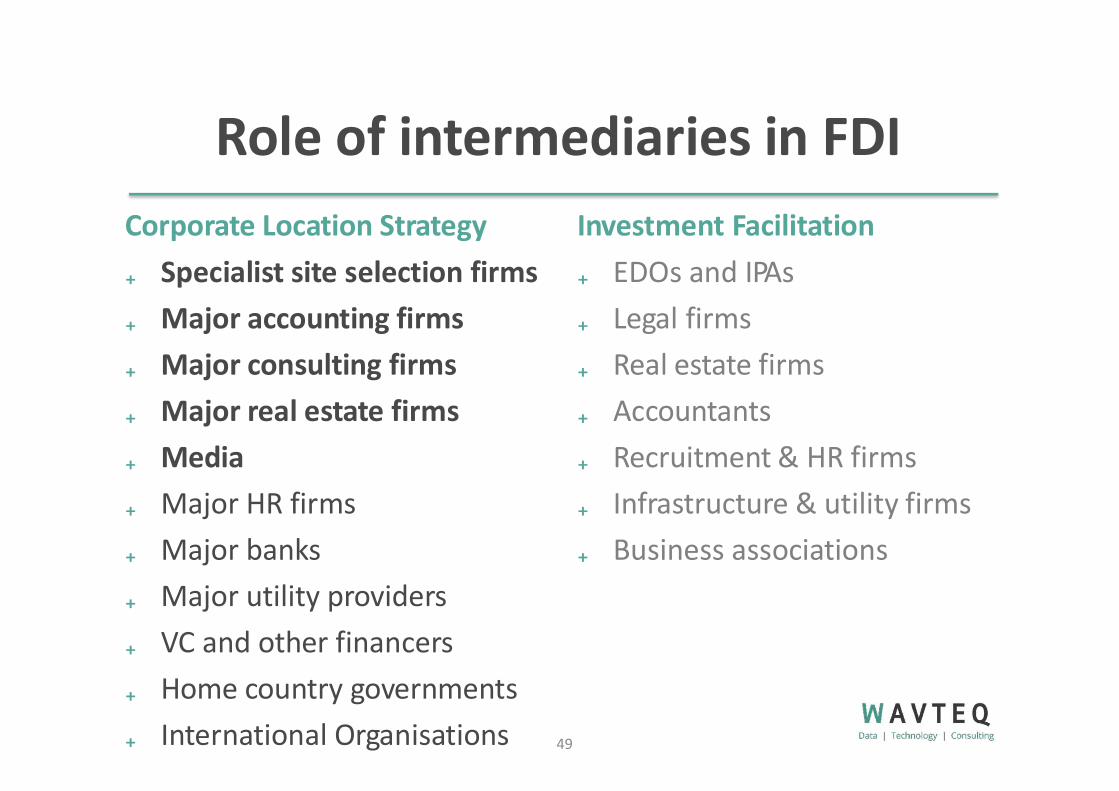
Corporate Location Strategy Investment Facilitation₊ Specialist site selection firms₊ Major accounting firms₊ Major consulting firms₊ Major real estate firms₊ Media₊ Major HR firms₊ Major banks₊ Major utility providers₊ VC and other financers₊ Home country governments₊ International Organisations
₊ EDOs and IPAs₊ Legal firms₊ Real estate firms₊ Accountants₊ Recruitment & HR firms₊ Infrastructure & utility firms₊ Business associations
www.wavteq.comwww.fdiprofessionals.com
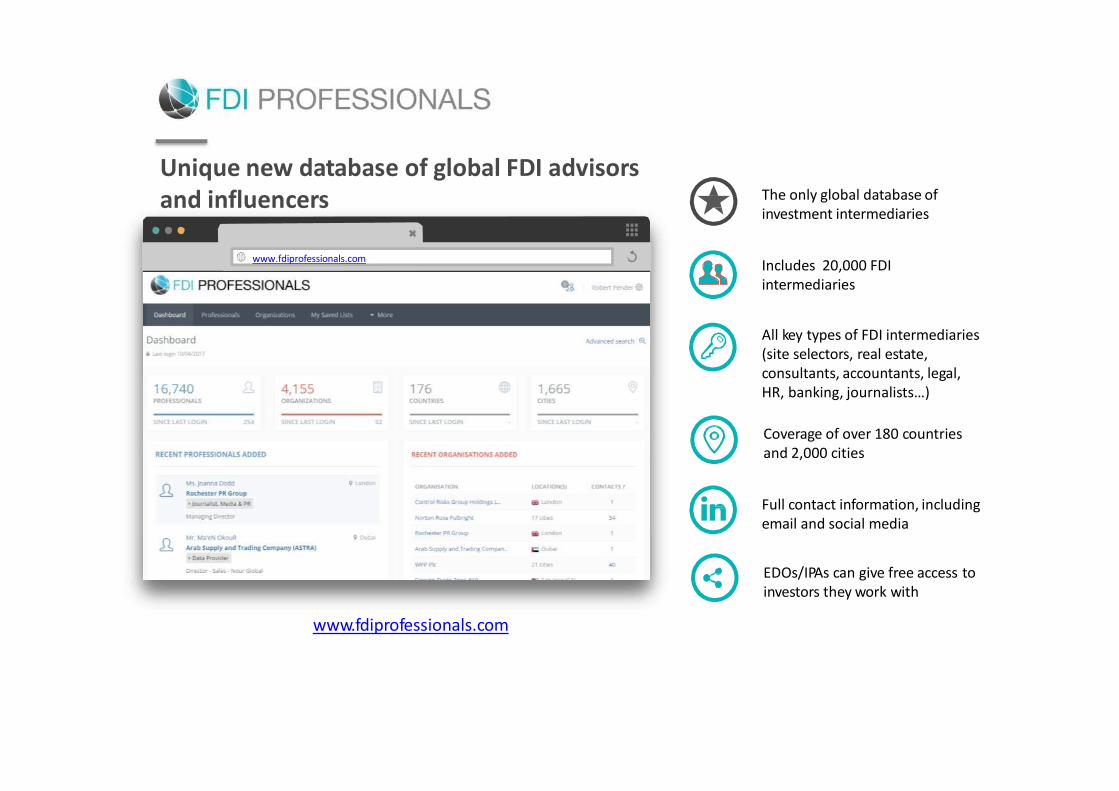
FDI Professionals
The only global database of investment intermediaries
Includes 20,000 FDI intermediaries
All key types of FDI intermediaries (site selectors, real estate, consultants, accountants, legal, HR, banking, journalists…)
Coverage of over 180 countries and 2,000 cities
Full contact information, including email and social media
EDOs/IPAs can give free access to investors they work with
www.fdiprofessionals.com
Unique new database of global FDI advisors and influencers

W A V T E Q
Results of our campaign to target CanadianFDI in Indonesia

Background
52
• TPSA is a 5-year development assistance project funded by the Government of Canada through Global Affairs Canada, executed by The Conference Board of Canada (CBoC). The partner of the TPSA project is the Government of Indonesia, specifically the Ministry of Trade and theInvestment Coordinating Board BKPM. The ultimate goal of the TPSA project is to expandIndonesian exports to Canada and encourage Canadian investment in Indonesia.
• WAVTEQ was awarded the contact to assist in attracting Canadian investment into Indonesia.• The first phase of the project was to identify target sectors which aligned the FDI opportunities
in Indonesia to the sectors where Canadian firms invest overseas.• The second phase was to distill Indonesia’s strengths for FDI in each of the sectors and develop
PDF flyers and value propositions for 9 subsectors.• 500 target Canadian companies were identified in the 9 subsectors and were researched and
contacts.• Webinars were conducted with Canadian potential investors to provide more information.• A BKPM road show to Canada is taking place in first week of December to meet with qualified
potential investors.

Identification of target companies
53
• Investor intelligence based on companies the lead generationin Canada team are already in contact with
• Real time intelligence from fDi Markets and IncentivesMonitor• Databases tracking real time IPO, VC and PE funding
companies are receiving
• Upcoming or recent change in chief executive position• Expiring lease or future move for a significant amount of space• Known workforce expansion• Compatibility with Indonesia’s business or consumer markets• Executive leadership with links to one or more businesses or
institutions of higher education in Indonesia.
Segmentation of target companiesby sector and subsector
54
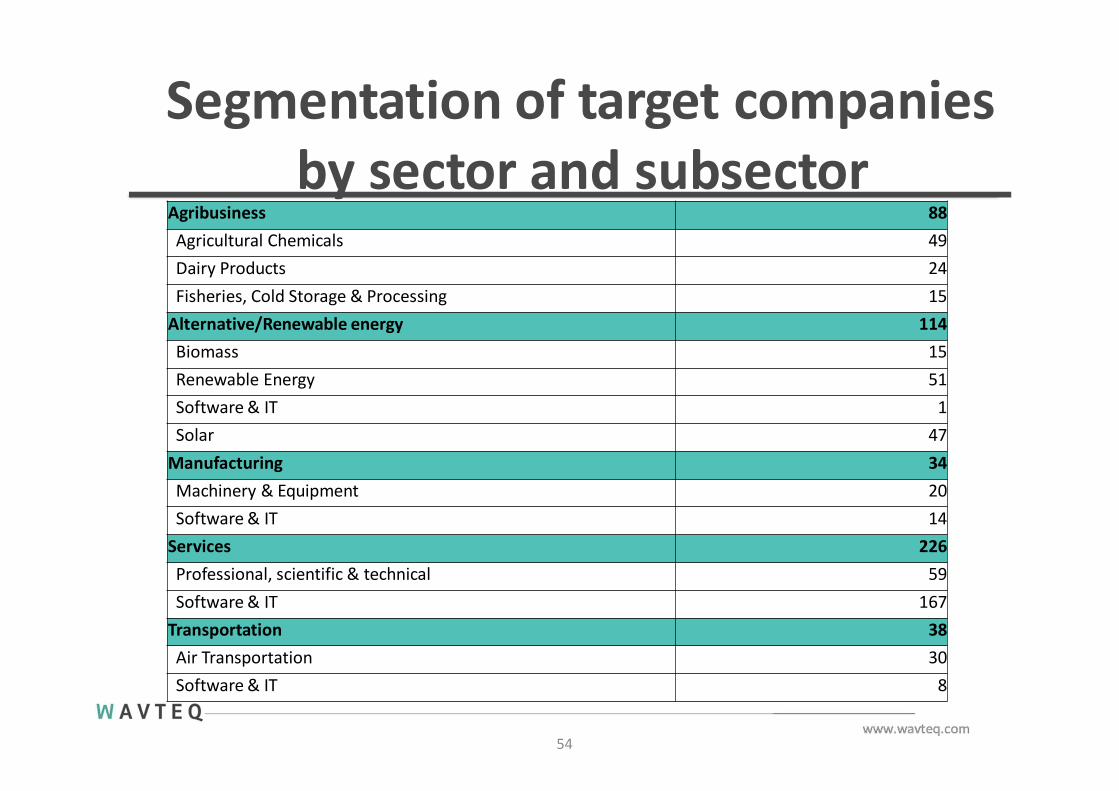
Agribusiness 88Agricultural Chemicals 49Dairy Products 24Fisheries, Cold Storage & Processing 15
Alternative/Renewable energy 114Biomass 15Renewable Energy 51Software & IT 1Solar 47
Manufacturing 34Machinery & Equipment 20Software & IT 14
Services 226Professional, scientific & technical 59Software & IT 167
Transportation 38Air Transportation 30Software & IT 8
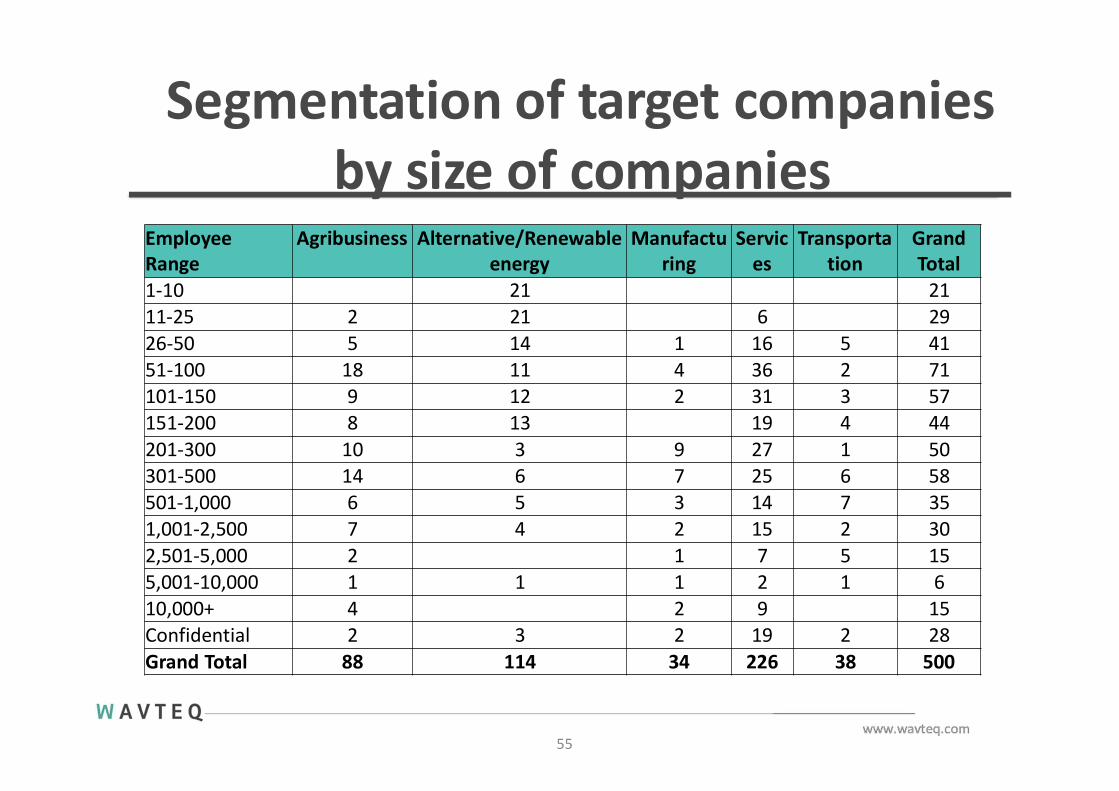
Segmentation of target companiesby size of companies
55
Employee Range
Agribusiness Alternative/Renewable energy
Manufactu ring
Servic es
Transporta tion
Grand Total
1-10 21 2111-25 2 21 6 2926-50 5 14 1 16 5 4151-100 18 11 4 36 2 71101-150 9 12 2 31 3 57151-200 8 13 19 4 44201-300 10 3 9 27 1 50301-500 14 6 7 25 6 58501-1,000 6 5 3 14 7 351,001-2,500 7 4 2 15 2 302,501-5,000 2 1 7 5 155,001-10,000 1 1 1 2 1 610,000+ 4 2 9 15Confidential 2 3 2 19 2 28Grand Total 88 114 34 226 38 500
What research did we do oncompanies before contacting them?
56
₊ Research was done on finding right contacts in thecompany
₊ Finding contact info – leveraging Data.com, companywebsites etc.
₊ Further research on the company such as any recent press releases, announcement of financing, newproduct launches, etc.
What briefing materials and trainingdid we provide?
57
₊ We developed 9 PDF 2-page flyers to send tocompanies to get their interest
₊ Several training sessions were provided to the leadgeneration team prior to launch and during outreachincluding overview of the market, UVP per sector, alignment opportunities between Canada and Indonesia, rationale for company selection, samplecalling techniques etc.
How did we contact companies?
58
₊ Email extremely important, once permission wasobtained, to gather further details around interest or projects, and to secure time slots etc.
₊ Pre-call research leveraging Google, Data.com,company’s website and LinkedIn was used to identify senior decisions makers and/or those responsible forgrowth in ASEAN.
₊ We reached out to 371 companies with a team of 6business developers, through calls, emails and socialmedia, over a period of 7 weeks
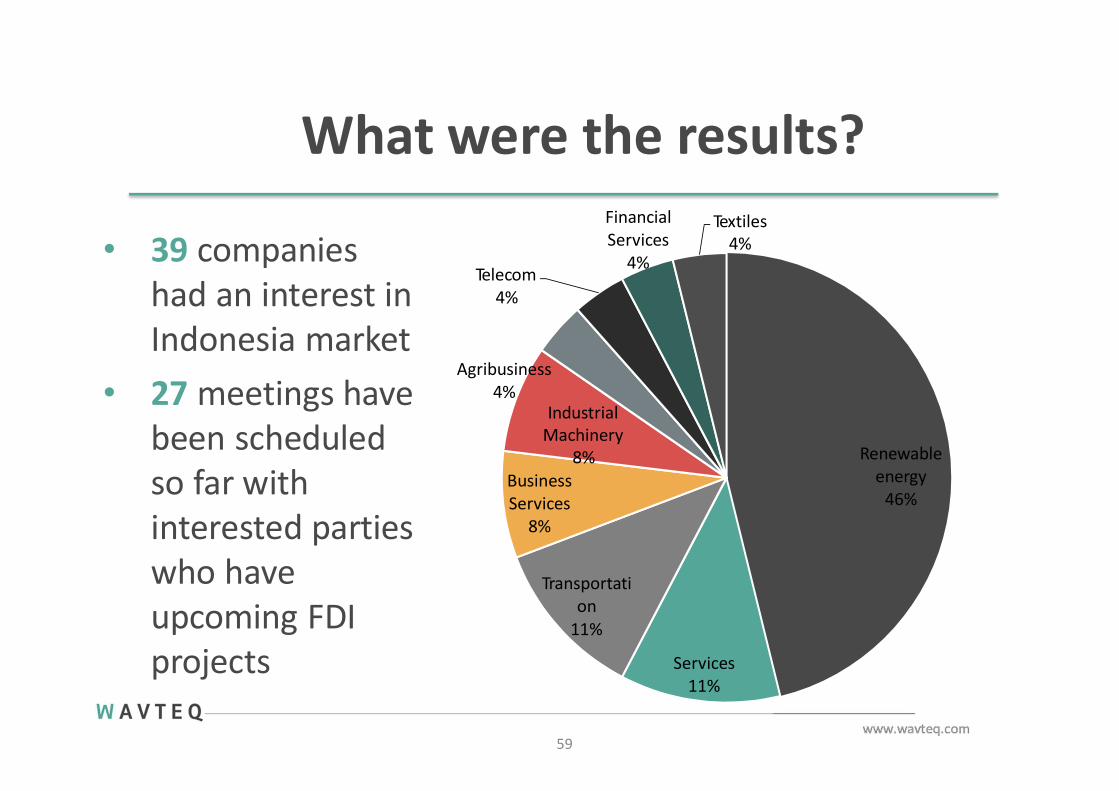
What were the results?
• 39 companieshad an interest in Indonesia market
• 27 meetings havebeen scheduledso far withinterested partieswho haveupcoming FDI projects
Renewable energy
46%
59
Services 11%
Transportati on
11%
Agribusiness 4%
IndustrialMachinery
8%Business Services
8%
Telecom 4%
Financial Services
4%
Textiles4%

What were the results? Conversion from #investor targets to # qualified prospects
11%
60
9%8%
3%
1%
0%
2%
4%
6%
8%
10%
12%
RenewableEnergy
Manufacturing Transportation Services Agribusiness

Investor feedback from the outreachcampaign
61
₊ Several investors were surprisingly quite aware ofthe opportunities in Indonesia
₊ A few potential investors had actually lived inIndonesia
₊ Generally, most investors were impressed by thelevel of growth e.g. GDP, population etc. as well as the plans for future development in the market e.g.in Infrastructure, mix of Renewable Energy and GWtargets etc.

W A V T E Q
Module 4: FDI value propositions &Indonesia’s competitiveness
Time: 15:45-17:00
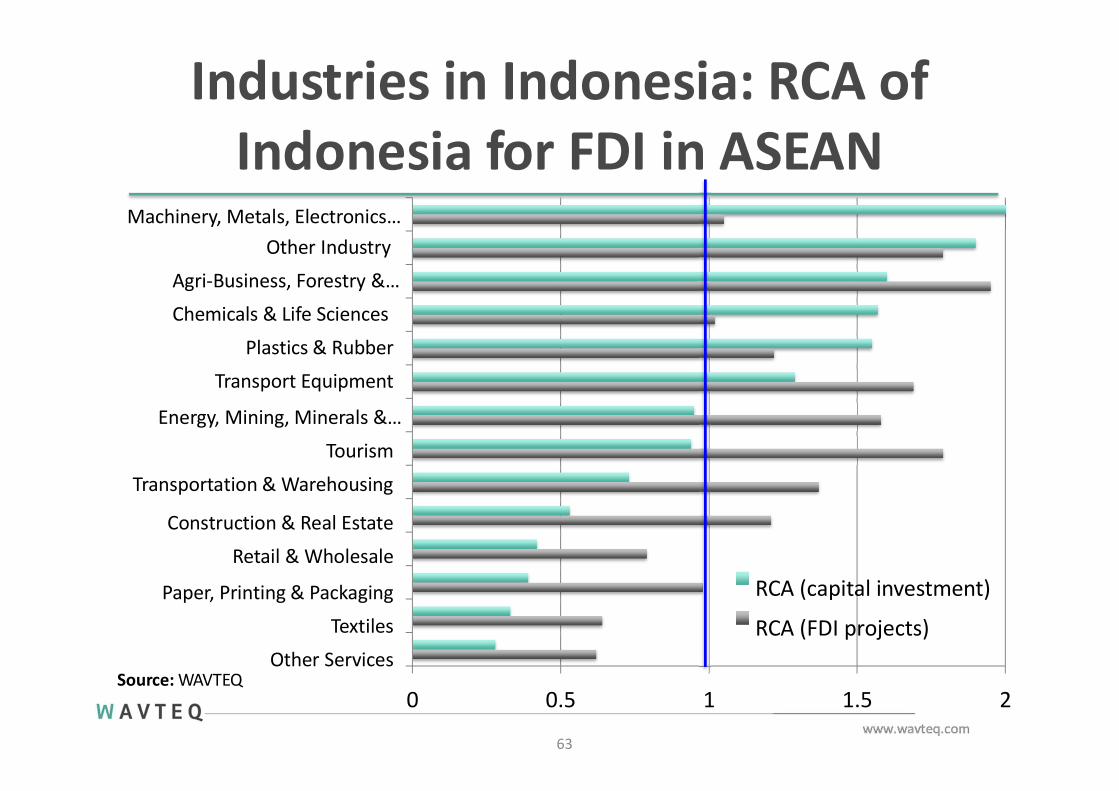
Industries in Indonesia: RCA ofIndonesia for FDI in ASEAN
0 0.5 1 1.5 2
Construction & Real Estate
Retail & Wholesale
Paper, Printing & Packaging
Textiles
Other Services
Machinery, Metals, Electronics…Other Industry
Agri-Business, Forestry &…
Chemicals & Life Sciences
Plastics & Rubber
Transport Equipment
Energy, Mining, Minerals &…
Tourism
Transportation & Warehousing
RCA (capital investment)
RCA (FDI projects)
Source: WAVTEQ
63
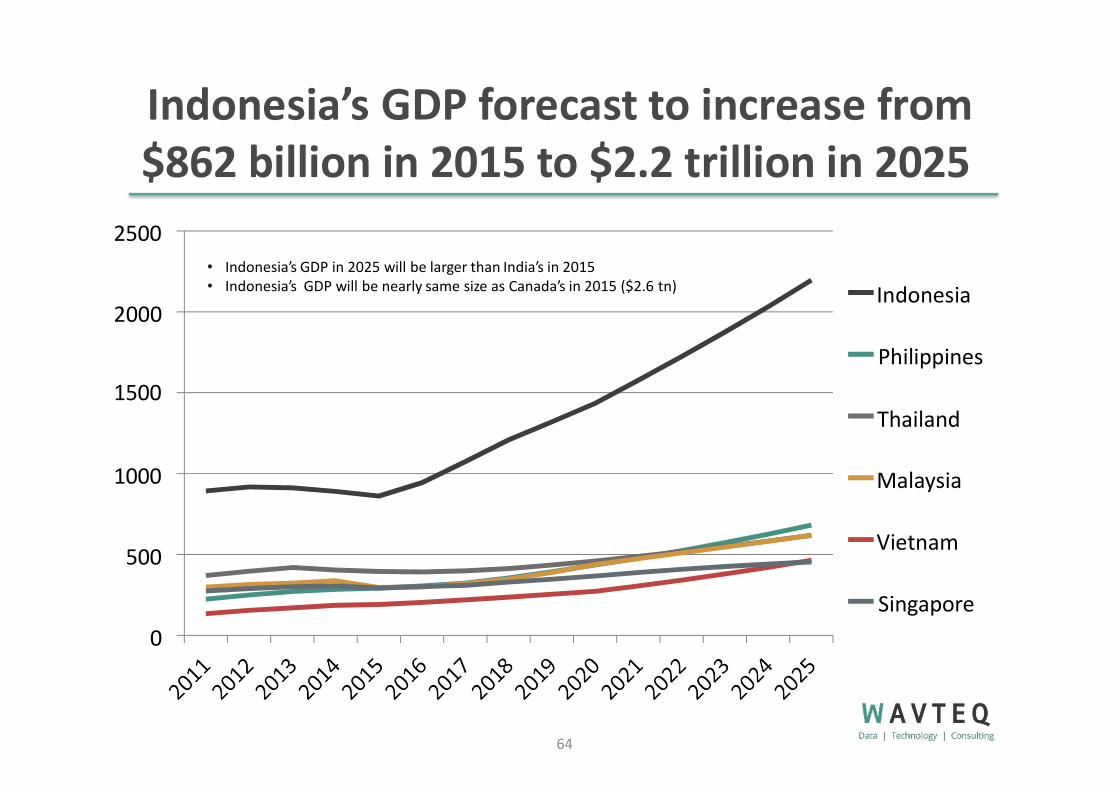
Indonesia’s GDP forecast to increase from$862 billion in 2015 to $2.2 trillion in 2025
Singapore0
500
1000
Philippines1500
Thailand
2000
2500
Indonesia
Malaysia
Vietnam
• Indonesia’s GDP in 2025 will be larger than India’s in 2015• Indonesia’s GDP will be nearly same size as Canada’s in 2015 ($2.6 tn)
64
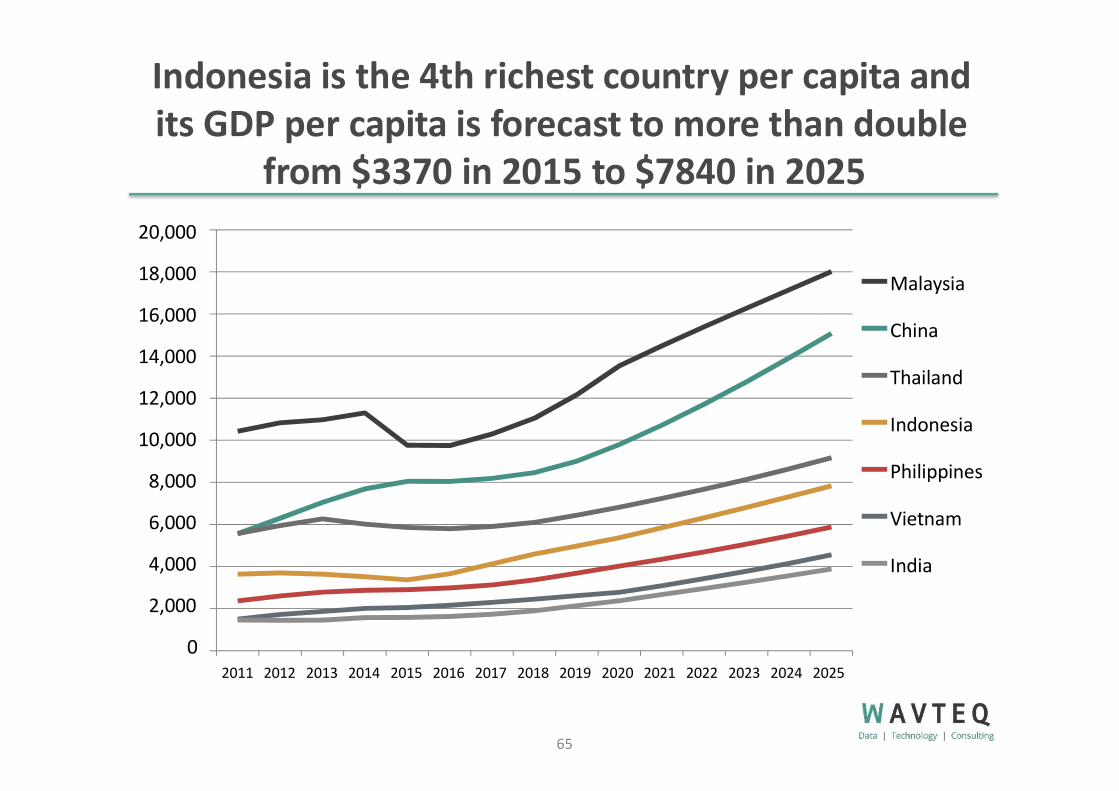
Indonesia is the 4th richest country per capita andits GDP per capita is forecast to more than double
from $3370 in 2015 to $7840 in 202520,000
18,000
16,000
14,000
12,000
10,000
8,000
6,000
4,000
2,000
02011 2012 2013 2014 2015 2016 2017 2018 2019 2020 2021 2022 2023 2024 2025
Malaysia
China
Thailand
Indonesia
Philippines
Vietnam
India
65
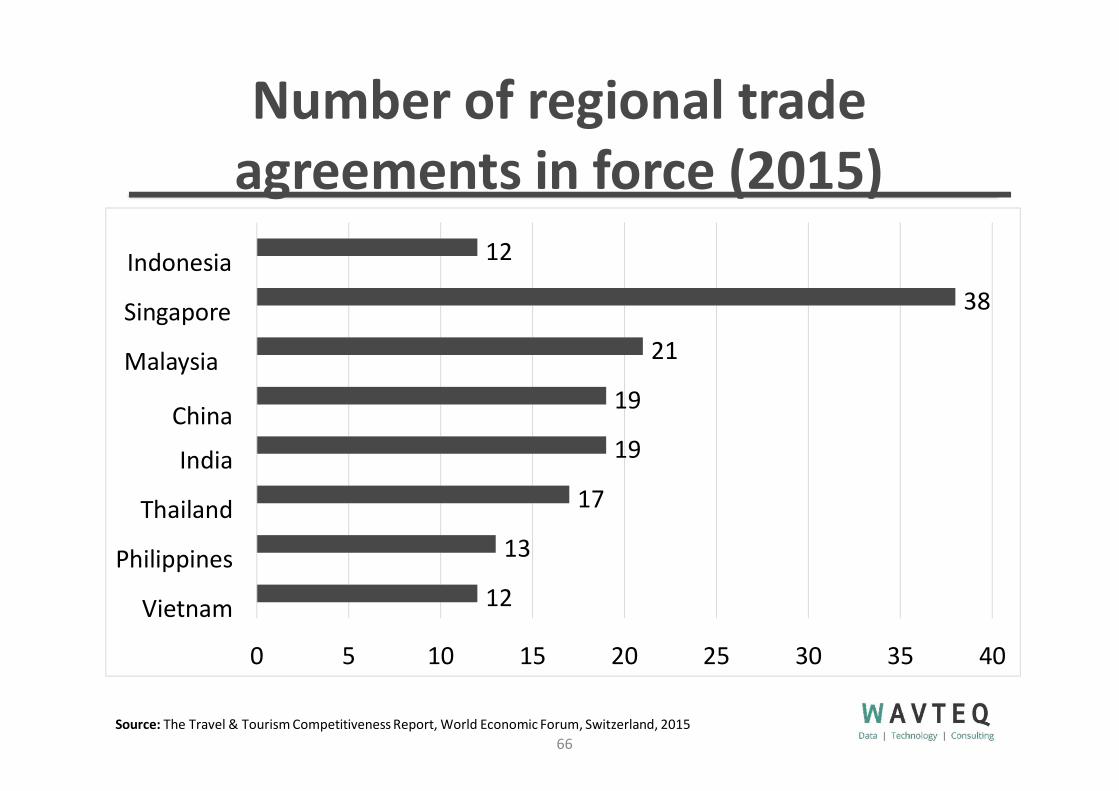
Number of regional tradeagreements in force (2015)
12
13
17
19
19
21
38
12
0 5 10 15 20 25 30 35 40
Indonesia
Singapore
Malaysia
China
India
Thailand
Philippines
Vietnam
Source: The Travel & Tourism Competitiveness Report, World Economic Forum, Switzerland, 201566
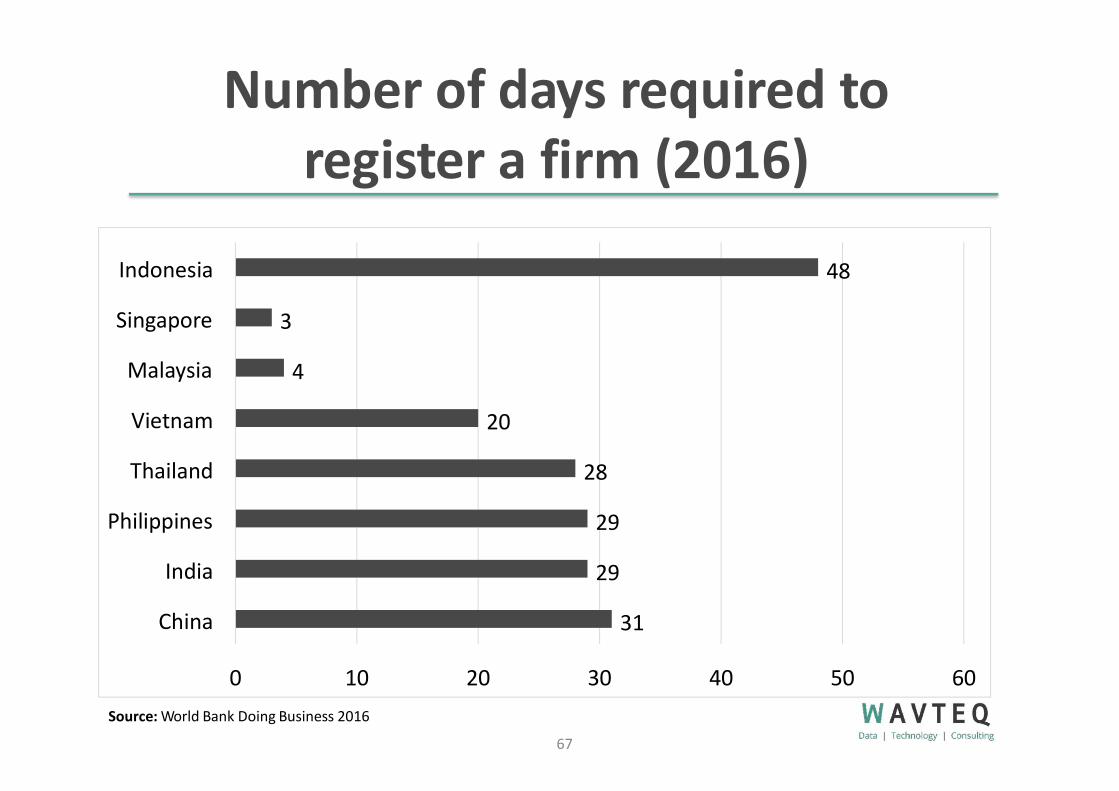
Number of days required toregister a firm (2016)
31
29
29
28
20
4
3
48
0 10Source: World Bank Doing Business 2016
20 30 40 50 60
China
India
Philippines
Thailand
Vietnam
Malaysia
Singapore
Indonesia
67

Population by country withforecasts (2015-2030)
6
31
69
92
101
255
7
36
70
103
128
308
0 50 100 150
Population projection (mid-2030, Millions)
200 250 300
Population (2015, Millions)
350
Singapore
Malaysia
Thailand
Vietnam
Philippines
Indonesia
Source: International Monetary Fund (country); national statistics (sub-national) (fDi Benchmark 2016) &mark 2016)Population Reference Bureau World Population Data Sheet (fDi Bench
68
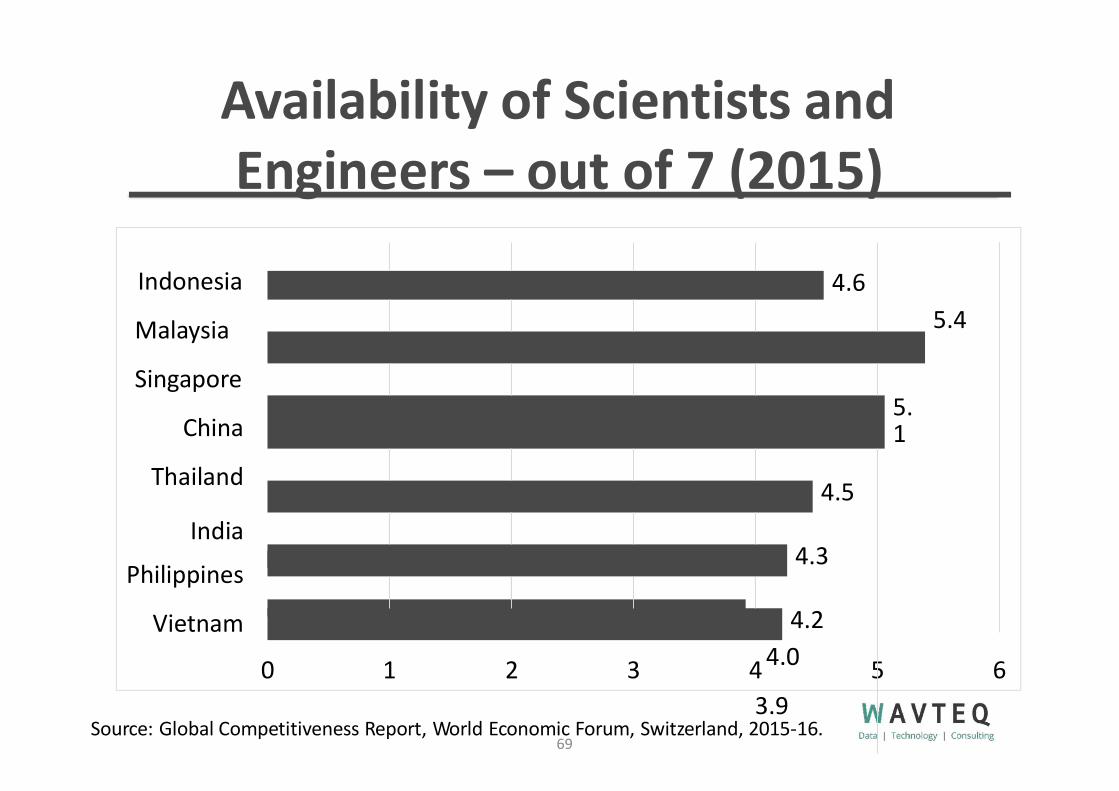
Availability of Scientists andEngineers – out of 7 (2015)
5.4
0 1 2 3 4
Source: Global Competitiveness Report, World Economic Forum, Switzerland, 2015-16.69
5 6
Indonesia
Malaysia
Singapore
China
Thailand
India
Philippines
Vietnam
4.6
5.1
4.5
4.3
4.24.0
3.9
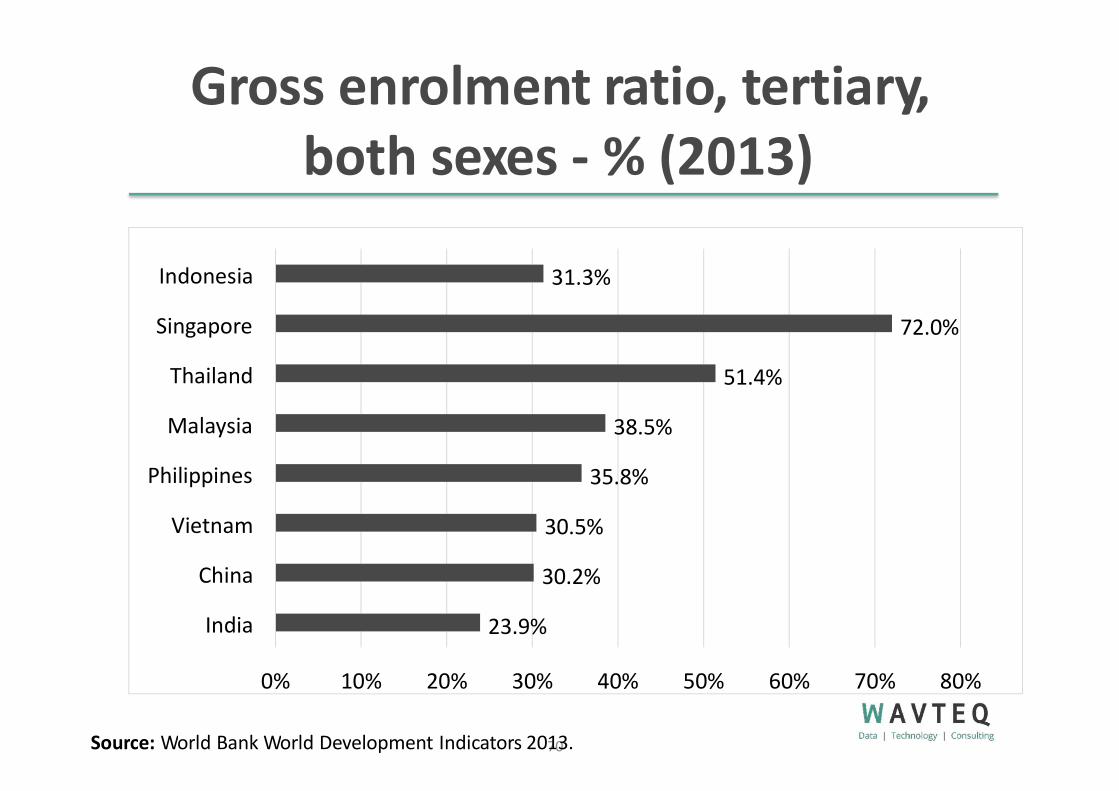
Gross enrolment ratio, tertiary, both sexes - % (2013)
0% 10% 20% 30%
Source: World Bank World Development Indicators 207103.
23.9%
30.2%
30.5%
35.8%
38.5%
51.4%
72.0%
31.3%
40% 50% 60% 70% 80%
India
China
Vietnam
Philippines
Malaysia
Thailand
Singapore
Indonesia

Corporate taxes by country (2016)
35%
25%
30%
24%
20%
20%
61%
68%
43%
40%
39%
8%
30%
0% 20%
Total Tax Rate (% profit)
40% 60%
Top Corporate Tax Rate (%)
80%
Indone…
Singap…
Thailand
Vietnam
Malaysia
Philipp…
China
India
Source: World Bank Doing Business 2016 & Deloitte 2016.71
Total tax rate as a % of profit provides acomprehensive measure of the cost of all thetaxes a business bears. It measures the amount of taxes and mandatorycontributions payable by businesses after accounting for allowable deductions and exemptions as a share of commercial profits. Taxes withheld (such as personal income tax) or collected and remitted to tax authorities (such as value added taxes, sales taxes orgoods and service taxes) are excluded.
25%1
178%%
2

Logistics Performance Index - outof 5 (2016)
0 0.5 1 1.5 2
Source: The World Bank: Logistics Performance Index 201672
4.1
3.7
3.4
3.4
3.3
3.0
2.9
3.0
2.5 3 3.5 4 4.5
Singapore
China
Malaysia
India
Thailand
Vietnam
Philippines
Indonesia

Electric power transmission & Distribution losses - % of output (2013)
18.5%
10.3%
9.0%
6.2%
5.8%
4.0%
0.5%
9.6%
0% 5%Source: World Bank World Development Indicators 2013.
10% 15% 20%
Indonesia
Singapore
Malaysia
China
Thailand
Vietnam
Philippines
India
73
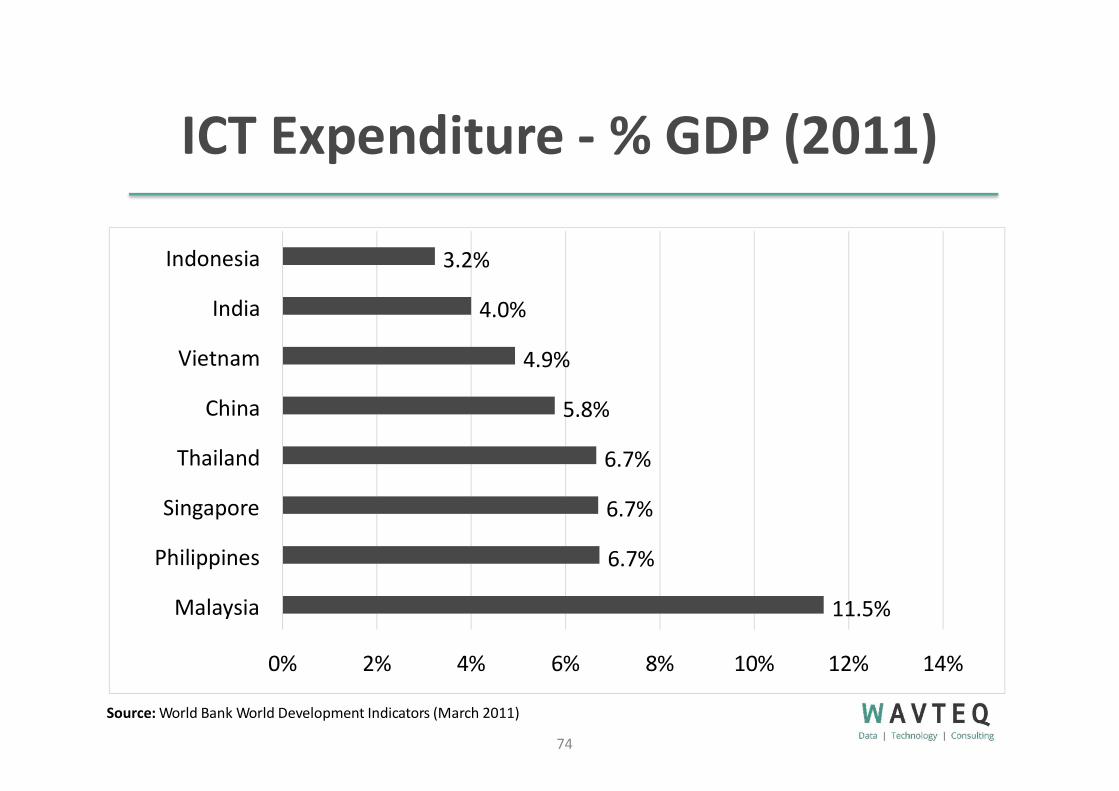
ICT Expenditure - % GDP (2011)
11.5%
6.7%
6.7%
6.7%
5.8%
4.9%
4.0%
3.2%
0% 2% 4%
Source: World Bank World Development Indicators (March 2011)
6% 8% 10% 12% 14%
Malaysia
Philippines
Singapore
Thailand
China
Vietnam
India
Indonesia
74

Research & Development Intensity- % GDP
0 0.005Source: World Bank World Development Indicators
75
2.01%
2.00%
1.13%
0.01 0.015 0.02 0.025
Singapore
China
India
Malaysia
Indonesia
Philippines
Vietnam
Thailand
0.08%
0.11%
0.19%
0.39
%
0.82%
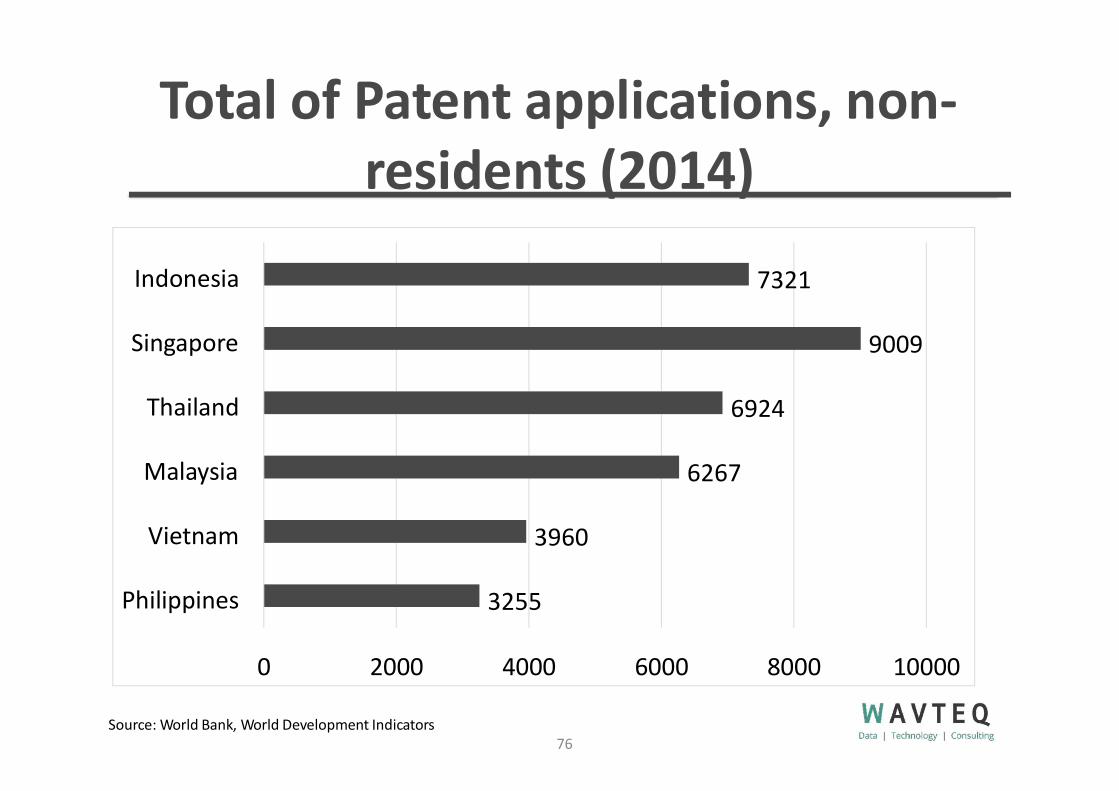
Total of Patent applications, non-residents (2014)
3255
3960
6267
6924
9009
7321
0 2000 4000 6000 8000 10000
Philippines
Vietnam
Malaysia
Thailand
Singapore
Indonesia
Source: World Bank, World Development Indicators76
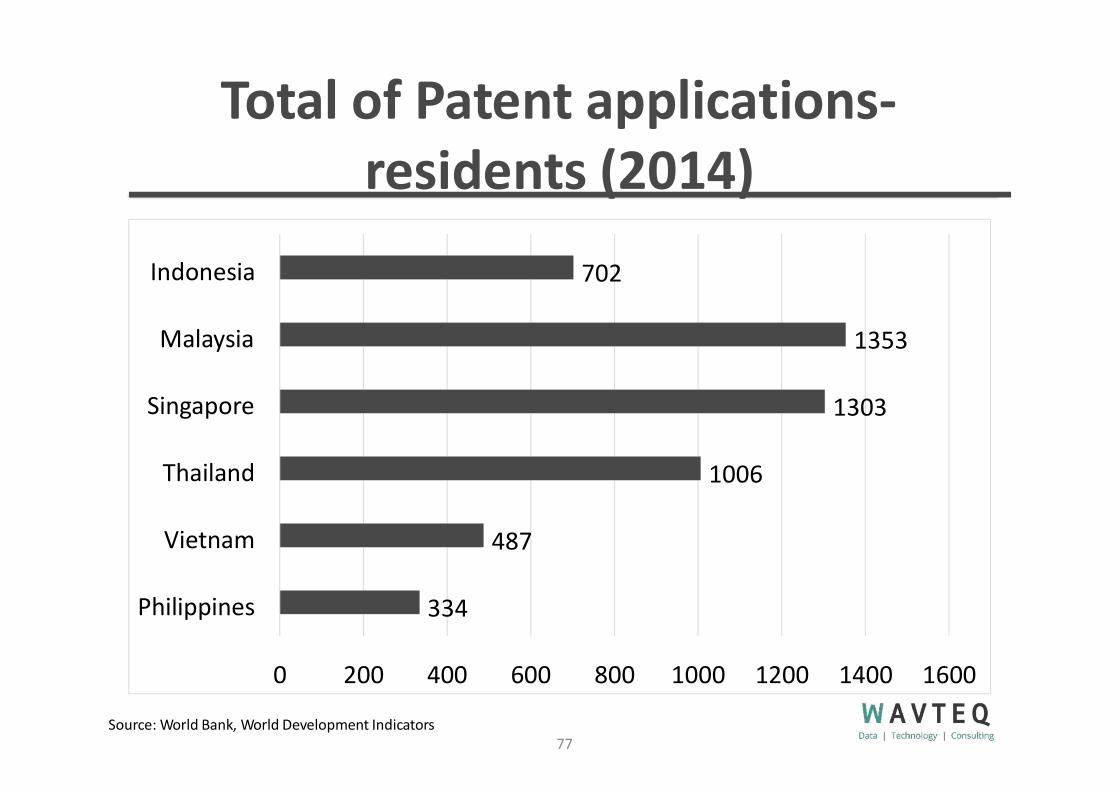
Total of Patent applications-residents (2014)
334
487
1006
1303
1353
702
0 200 400 600 800 1000 1200 1400 1600
Philippines
Vietnam
Thailand
Singapore
Malaysia
Indonesia
Source: World Bank, World Development Indicators77
fDi Benchmark: tool to makeinvestment propositions
₊ Location database and benchmarking tool designed for siteselection and value proposition development
₊ Coverage:₊ 878 countries, regions & cities and growing!₊ 906 cost and quality data points on every country₊ 776 cost and quality data points on every region/city
₊ Tools to benchmark locations for over 65 sectors and subsectors with built-in value proposition report builder
₊ Other key data sources are EIU and World Bank and nationalstatistical agencies in each countrySource: http://www.fdibenchmark.com
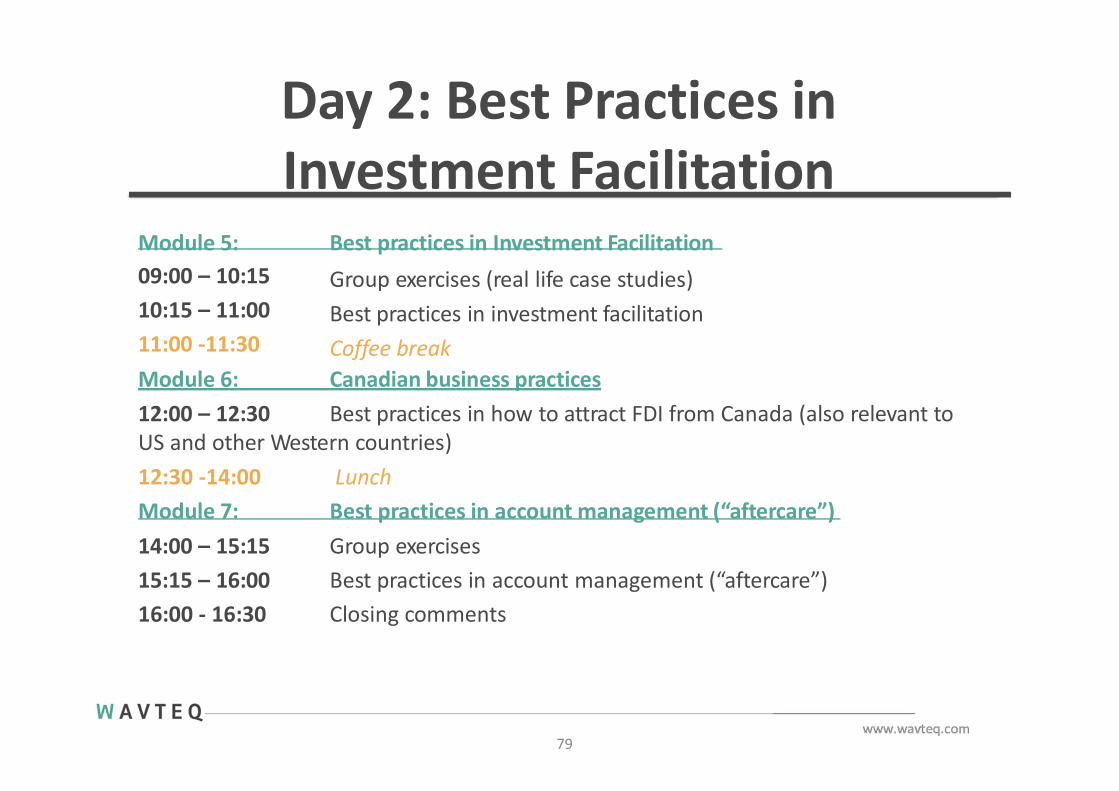
Day 2: Best Practices inInvestment Facilitation
Module 5: Best practices in Investment Facilitation09:00 – 10:1510:15 – 11:0011:00 -11:30
Group exercises (real life case studies) Best practices in investment facilitation Coffee break
Module 6: Canadian business practices12:00 – 12:30 Best practices in how to attract FDI from Canada (also relevant toUS and other Western countries)12:30 -14:00Module 7:
79
LunchBest practices in account management (“aftercare”)
14:00 – 15:1515:15 – 16:0016:00 - 16:30
Group exercisesBest practices in account management (“aftercare”)Closing comments
W A V T E Q
Module 5: Best Practices in Investmentfacilitation
Time: 9:00-11:30

Effective investment facilitation is the most important activity to increase FDI performance. IPAs should focus on making the conversion rate of active projects to announced and operational
projects as high as possible”(Dr Henry Loewendahl, Group CEO, WAVTEQ)

Government as a partner to MNEs
82
51% of corporate executives rely on resources provided by local
government/chamber of commerce
Source: Economist Intelligence Unit, “Corporate overseas expansion: Opportunities and barriers” (2015)based on a survey of 155 senior corporate executives

Investment facilitationCompliance: % firms with significant issues in FDI
83
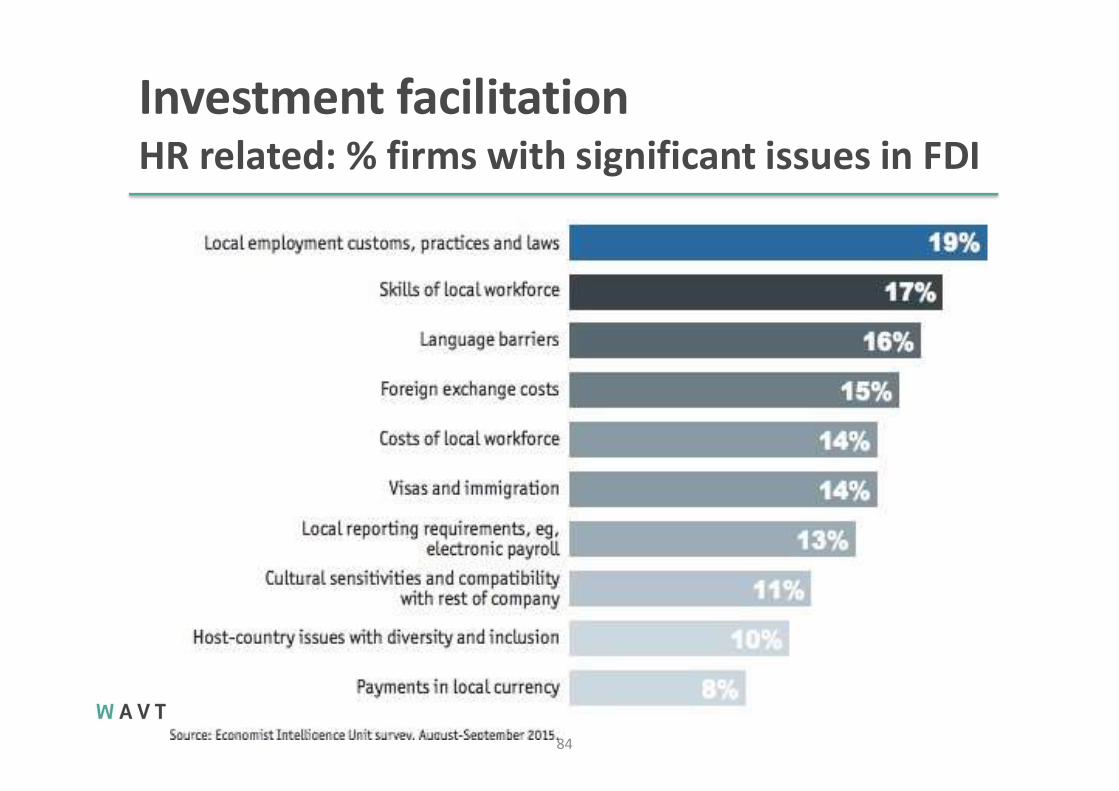
Investment facilitationHR related: % firms with significant issues in FDI
84
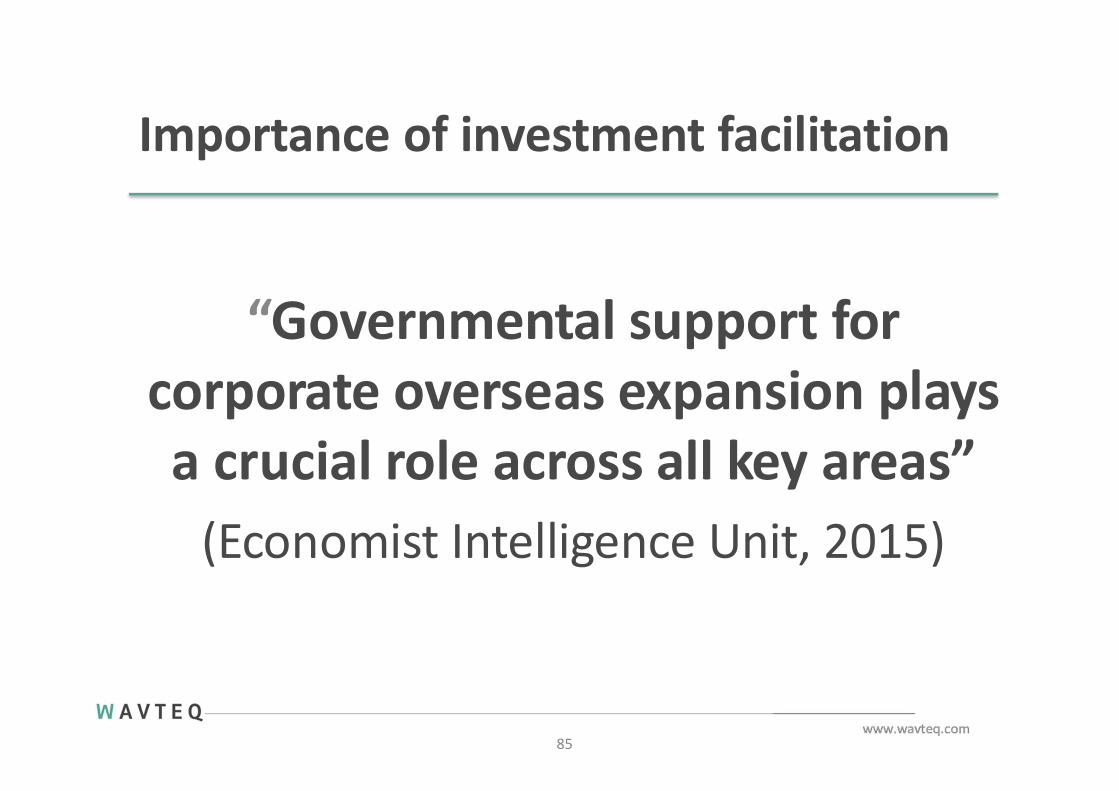
Importance of investment facilitation
85
“Governmental support for corporate overseas expansion plays a crucial role across all key areas”
(Economist Intelligence Unit, 2015)
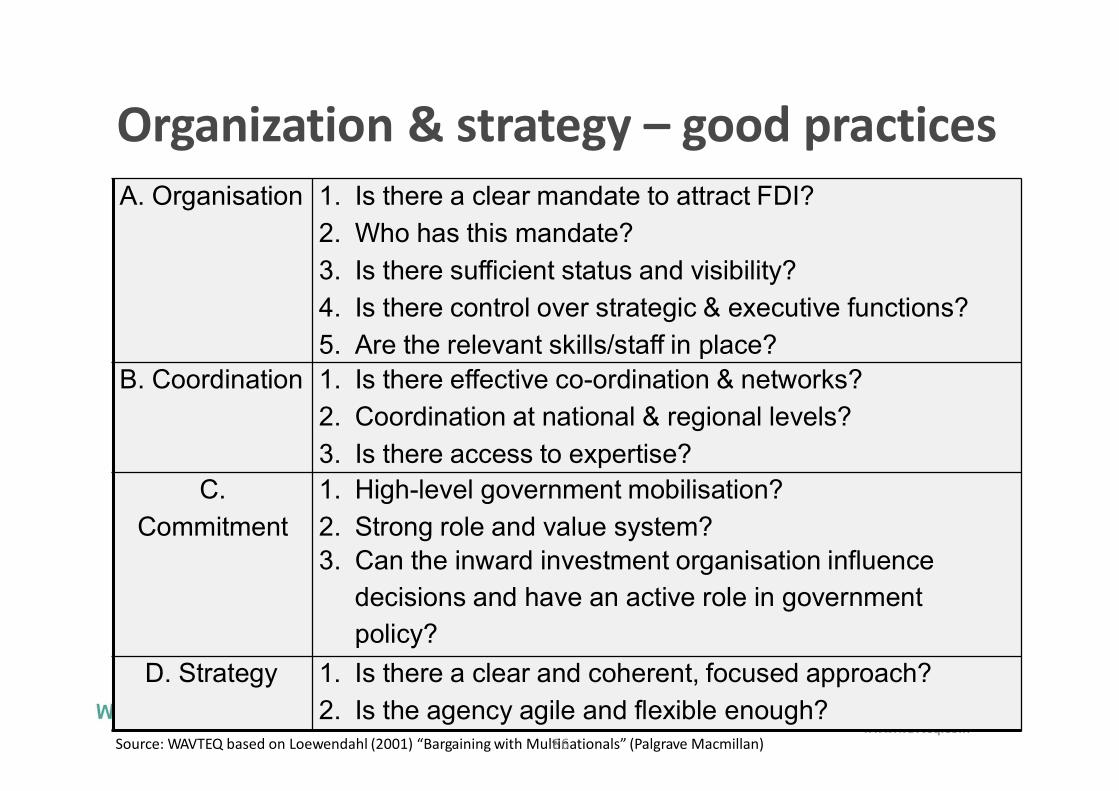
Organization & strategy – good practices
Source: WAVTEQ based on Loewendahl (2001) “Bargaining with Mult8in6ationals” (Palgrave Macmillan)
A. Organisation 1. Is there a clear mandate to attract FDI?
2. Who has this mandate?
3. Is there sufficient status and visibility?
4. Is there control over strategic & executive functions?
5. Are the relevant skills/staff in place?B. Coordination 1. Is there effective co-ordination & networks?
2. Coordination at national & regional levels?
3. Is there access to expertise?C.
Commitment
1. High-level government mobilisation?
2. Strong role and value system?3. Can the inward investment organisation influence
decisions and have an active role in government policy?
D. Strategy 1. Is there a clear and coherent, focused approach?
2. Is the agency agile and flexible enough?
Source: WAVTEQ based on Loewendahl (2001) “Bargaining with Multinationals” (Palgrave Macmillan)
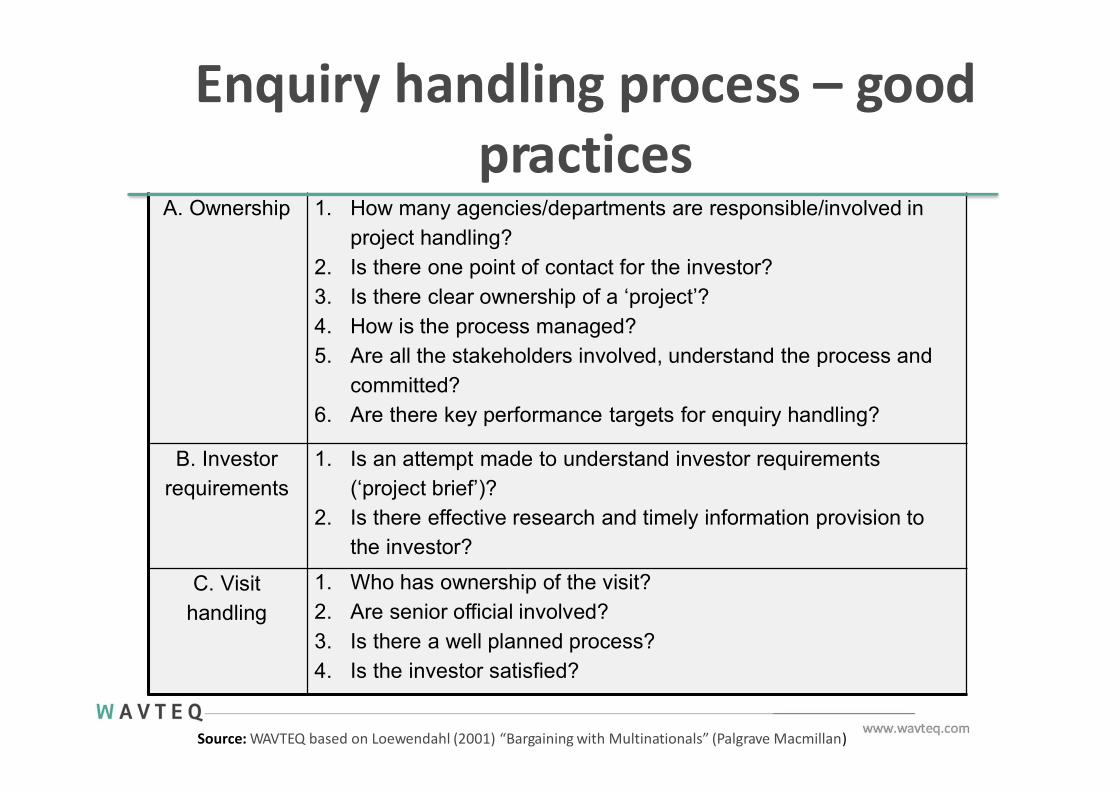
Enquiry handling process – goodpractices
A. Ownership 1. How many agencies/departments are responsible/involved inproject handling?
2. Is there one point of contact for the investor?3. Is there clear ownership of a ‘project’?4. How is the process managed?5. Are all the stakeholders involved, understand the process and
committed?6. Are there key performance targets for enquiry handling?
B. Investor requirements
1. Is an attempt made to understand investor requirements (‘project brief’)?
2. Is there effective research and timely information provision to the investor?
C. Visit handling
1. Who has ownership of the visit?2. Are senior official involved?3. Is there a well planned process?4. Is the investor satisfied?

Investment facilitation support –good practices
Source: WAVTEQ based on Loewendahl (2001) “Bargaining with Multinationals” (Palgrave Macmillan)
88
A. Permits and licenses
1. What permits and licenses do investors need to apply for?
2. What do investors think about these?3. How do they compare to competing locations?
B. Application 1. Is there a clear roadmap for navigating the proceduresand making the application?
2. Is technology used to make the process efficient?
C. Process 1. Is the process predictable and transparent?2. Is the process politicised?3. Who has responsibility for the process?
D. Approval 1. Is there a clear evaluation framework for authorisations?2. Is there a target timeframe for approvals?3. Is there a key point of contact for the investor?

89Source: WAVTEQ based on Loewendahl (2001) “Bargaining with Multinationals” (Palgrave Macmillan)
Incentives policy & negotiation –good practices
A. Type of incentives?
1. What are the objectives of incentives?
2. What type of incentives are on offer?
3. Are incentives aligned to the need of different sectors?
4. Are they linked to performance targets?
5. Do these meet the objectives?
6. Are the incentives clear to investors?B. Negotiation 1. Who can get the incentives?
2. Who allocates/awards the incentives?
3. Is the negotiation process predictable and transparent?
4. Are the incentives needed to win the project?
5. What will be the return on investment & impact?C. Approval 1. What is the process for awarding incentives?
2. Is it politicised?
3. How speedy and fair is the process?D. Post approval 1. What happens after approval?
2. Is there monitoring of performance targets?
3. Do investors receive the incentives?
4. Are their effective claw-back mechanisms if investors do not meet targets?

W A V T E Q
Module 6: Canadian business practices
Time: 12:00-12:30

Best practices lead generation inCanada
91
₊ Response times to info requests – 1-2 business days for urgent , 2-3 business days for general correspondence. However, best practice it to generally respond within 1 business day.
₊ Provision of bios for setting up road show meetings – when and why this is important – this should be done prior to commencing outreach. It’s important as it helps to provide further legitimacy of who we’re calling for and that the meeting will take place; also provides the investors with the opportunity to do pre-research on the people they will meet with and invite counterparts to the meetings
₊ Critical to have confirmation at a minimum 6-8 weeks in advanceof the final travel dates
Best practices in doing meetingswith Canadian investors
92
₊ Send any presentation that will be covered during the meeting 2-3 days in advance of the meeting₊ Presentations should be dynamic, do not simply read of the slides but
provide additional context and details not contained in the deck₊ Presentation can have general overviews but at slides need to be
customized to the investor’s company and industry₊ Ensure the investors/prospects are aware of the names, titles and contact info
of all the people they are meeting with when the meeting is being booked. If this is not possible, then it should be provided 1-2 weeks in advance of the meeting
₊ Arrive on time if not a few mins early₊ During the meeting, ensure the investor does at least half if not most of the
talking; understand their business and where and why they see opportunities –always probe
Best practices in how to follow upand convert Canadian FDI prospects
93
₊ Following up in a timely fashion is key e.g. 1-2 hours after aconversation, send an email; after attempting to reach a contact and leaving a voicemail, send an email the same day or next day;when following up always reference the email or voicemail to jog memory and provide a reference point
₊ Some of the keys to conversion include: understanding where theinvestor is now (locations or in terms of growth) and why it couldmake sense to enter your market/region, looking for growth signalsvia press releases or their website etc. and relaying this back to theprospect so that they understand 1) that you’ve done your researchand understand their business and 2) you’re presenting anopportunity that they can then validate for current use or futurereference
Other tips for the Canadianmarket
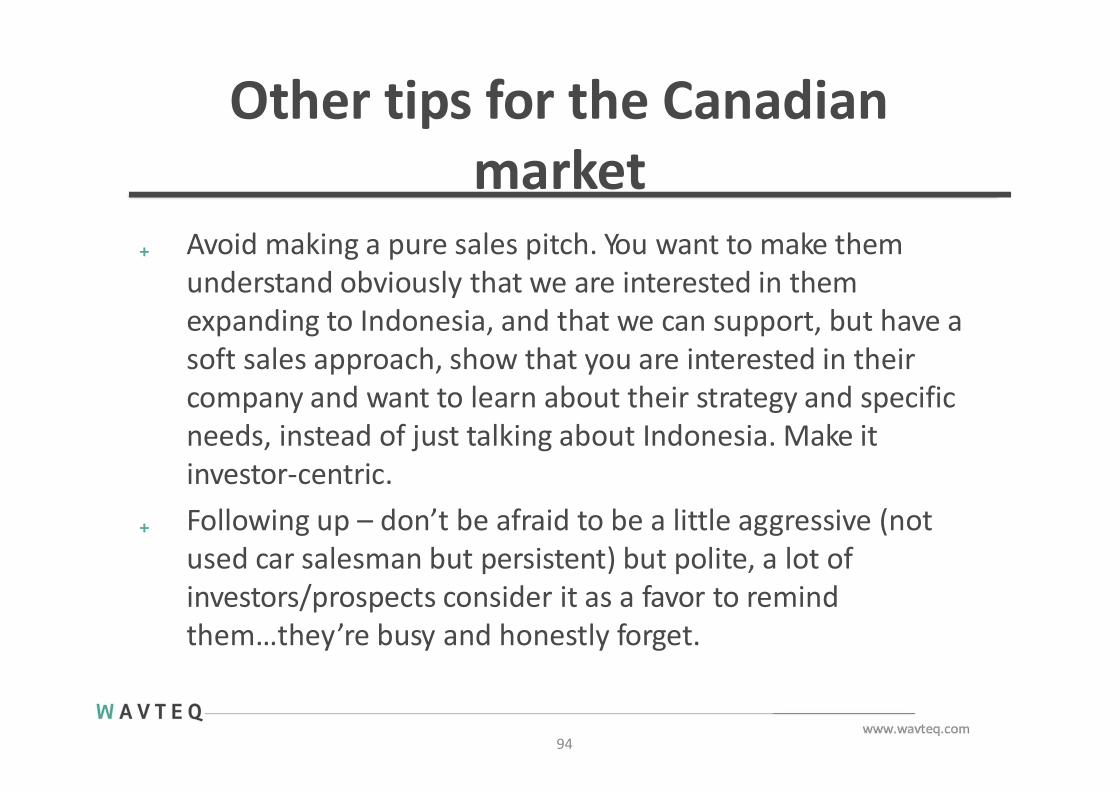
94
₊ Avoid making a pure sales pitch. You want to make themunderstand obviously that we are interested in themexpanding to Indonesia, and that we can support, but have a soft sales approach, show that you are interested in their company and want to learn about their strategy and specific needs, instead of just talking about Indonesia. Make it investor-centric.
₊ Following up – don’t be afraid to be a little aggressive (not used car salesman but persistent) but polite, a lot of investors/prospects consider it as a favor to remind them…they’re busy and honestly forget.
W A V T E Q
Module 7: Best practices in accountmanagement (“aftercare”)
Time: 14:00-16:30

Role of expansions in FDI into Indonesiaby activity (2003-Sept. 2016)
Source: WAVTEQ based on fDi Markets
56%70%
82% 85% 89% 90% 93% 98%
44%30%
18% 15% 11% 10% 7% 2%100%
90%
80%
70%
60%
50%
40%
30%
20%
10%
0%
Headquarters Manufacturing Design, Development
& Testing
Extraction Electricity ICT & Internet Logistics, Infrastructure Distribution &
Transportation
Business Services
Expansion New
96
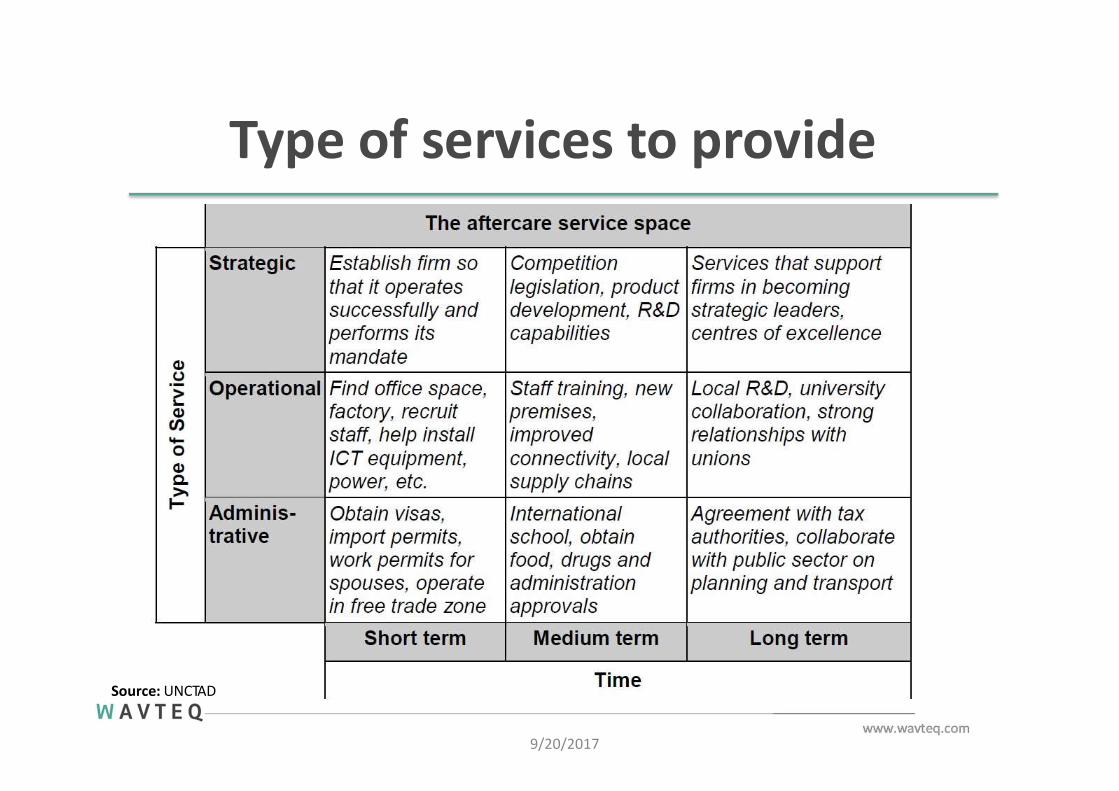
Type of services to provide
9/20/2017
Source: UNCTAD
98
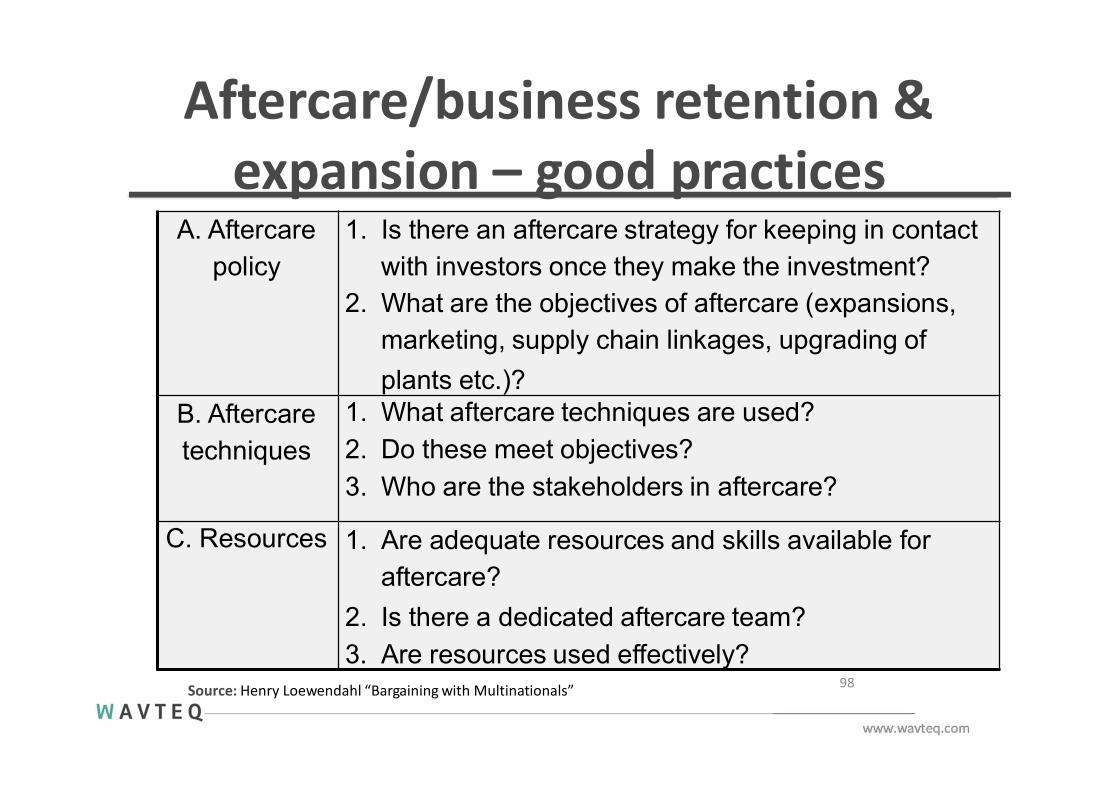
Aftercare/business retention &expansion – good practices
Source: Henry Loewendahl “Bargaining with Multinationals”
A. Aftercare policy
1. Is there an aftercare strategy for keeping in contact with investors once they make the investment?
2. What are the objectives of aftercare (expansions, marketing, supply chain linkages, upgrading of
plants etc.)?B. Aftercare techniques
1. What aftercare techniques are used?
2. Do these meet objectives?
3. Who are the stakeholders in aftercare?
C. Resources 1. Are adequate resources and skills available for aftercare?
2. Is there a dedicated aftercare team?
3. Are resources used effectively?

+44 7557 [email protected]@wavteq/company/wavteq
Contact WAVTEQKeep in touch
London
Cork
Ottawa
Vienna
BeijingSeoul
Tokyo
Shanghai
Hong KongPhoenix
Montreal
San Francisco
Madrid
Mumbai
Bangalore
Dr Henry Loewendahl, Group CEO, WAVTEQLtdE-mail: [email protected]: hloewendahl | Linkedin: HenryLoewendahlCell: +447557965393