Role of petrography in durability of limestone used in ...
27
HAL Id: hal-03266017 https://hal.archives-ouvertes.fr/hal-03266017 Submitted on 30 Dec 2021 HAL is a multi-disciplinary open access archive for the deposit and dissemination of sci- entific research documents, whether they are pub- lished or not. The documents may come from teaching and research institutions in France or abroad, or from public or private research centers. L’archive ouverte pluridisciplinaire HAL, est destinée au dépôt et à la diffusion de documents scientifiques de niveau recherche, publiés ou non, émanant des établissements d’enseignement et de recherche français ou étrangers, des laboratoires publics ou privés. Role of petrography in durability of limestone used in construction of Persepolis complex subjected to artificial accelerated ageing tests Mehdi Torabi-Kaveh, Mojtaba Heidari, Hassan Mohseni, Beatriz Menendez To cite this version: Mehdi Torabi-Kaveh, Mojtaba Heidari, Hassan Mohseni, Beatriz Menendez. Role of petrography in durability of limestone used in construction of Persepolis complex subjected to artificial accelerated ageing tests. Environmental Earth Sciences, Springer, 2019, 78 (10), 10.1007/s12665-019-8308-y. hal-03266017
-
Upload
khangminh22 -
Category
Documents
-
view
3 -
download
0
Transcript of Role of petrography in durability of limestone used in ...

HAL Id: hal-03266017https://hal.archives-ouvertes.fr/hal-03266017
Submitted on 30 Dec 2021
HAL is a multi-disciplinary open accessarchive for the deposit and dissemination of sci-entific research documents, whether they are pub-lished or not. The documents may come fromteaching and research institutions in France orabroad, or from public or private research centers.
L’archive ouverte pluridisciplinaire HAL, estdestinée au dépôt et à la diffusion de documentsscientifiques de niveau recherche, publiés ou non,émanant des établissements d’enseignement et derecherche français ou étrangers, des laboratoirespublics ou privés.
Role of petrography in durability of limestone used inconstruction of Persepolis complex subjected to artificial
accelerated ageing testsMehdi Torabi-Kaveh, Mojtaba Heidari, Hassan Mohseni, Beatriz Menendez
To cite this version:Mehdi Torabi-Kaveh, Mojtaba Heidari, Hassan Mohseni, Beatriz Menendez. Role of petrography indurability of limestone used in construction of Persepolis complex subjected to artificial acceleratedageing tests. Environmental Earth Sciences, Springer, 2019, 78 (10), �10.1007/s12665-019-8308-y�.�hal-03266017�

Role of petrography in durability of limestone used in construction of Persepolis complex subjected
to artificial accelerated ageing tests
Mehdi Torabi-Kaveh, Mojtaba Heidari, Hassan Mohseni & Béatriz Ménendez
Environmental Earth Sciences volume 78, Article number: 297 (2019) Cite this article
Abstract
Persepolis historical complex hosts palaces and tombs which are constructed by stone blocks. These
stones suffer from various weathering. Hence, in this study, physico-mechanical properties of
Persepolis stone are investigated in relation to some important weathering factors including
freezing–thawing, thermal shock and salt crystallization. This study focused on role of the stone
petrography on its durability against the weathering factors. Petrography studies showed that the
stone is a nonporous-impermeable bioclastic-packstone which suffered significant diagenesis
pressures and contain fractures filled by clay. Based on the obtained results, most of the observed
deterioration for the stone is related to freezing–thawing cycles. The freezing–thawing cycles
induced significant losses in the stone mechanical properties. Similar variations were recorded after
the salt crystallization and thermal shock cycles, although the changes in the stone properties were
not to the extent of freezing–thawing. Assessing values of decay constant (λ) and half-time (N1/2)
obtained for the stone in relation to the ageing test cycles showed that freeze–thaw and thermal
shock have more deteriorative effects on the stone durability than salt crystallization. It is suggested
that porosity is the main factor that controls the Persepolis stone durability. Low permeability of the
stone inhibits water percolation throughout the specimens, so their deterioration against salt
crystallization is negligible. But in case of the freeze–thaw cycles, water uptake by clay minerals,
which filled diagenesis fractures in the limestone, could be considered as the main factor for the
observed deterioration during freezing–thawing. Also, effect of micro-cracks, caused by the thermal
shock cycles, is the best explanation for reducing the mechanical properties of the stone.
Introduction
Stones are used as construction materials in various buildings and monuments. Hence, evaluation of
stone durability is one of the most important subjects in relation to buildings and monuments.
Durability of a stone is controlled by its inherent properties and its location. Depends on climatic
conditions, various types of weathering factors are threats to monument stones. For example,
freezing–thawing, salt crystallization, and thermal shock are considered as the most important
factors in deterioration of monument stone (Cárdenes et al. 2014). Freezing the water in the pore
spaces of stone leads to overcoming the stresses resulting from ice crystallization on tensile strength
and cracking occurs (Fener and Ince 2015). Assessing durability of various rocks in relation to freeze–
thaw has been the subject of study by many researchers (e.g.; Karaca et al. 2010; Bayram 2012;
Martínez-Martínez et al. 2013; Cárdenes et al. 2014; Ghobadi and Torabi-Kaveh 2014; Fener and Ince
2015; Ghobadi and Babazadeh 2015; Eslami et al. 2018; Benavente et al. 2018; Hashemi et al. 2018;
Noor-E-Khuda et al. 2017; Wang et al. 2018). The second deteriorative factor is crystallization of
soluble salts inside pore spaces of building and monument stones (Cardell et al. 2003). Several
sources can be considered as factors of salt accumulating in stones. For example, ground and surface
water which can penetrate into a stone via capillary uptake, absorbing atmospheric moisture,
formation of salts in result of interaction of aerosol pollutants with certain minerals (e.g., gypsum)
(Marzal and Scherer 2008; Halsey et al. 1995), and salts with internal origin (McKinley et al. 2001).
Crystallization and hydration pressures along with hygroscopic water retention are consequences of
soluble salt penetration which can deteriorate a stone (Winkler, 1987; Fookes et al. 1988). Salt
crystallization destructive effects on building and monument stones have been studied by various

researchers (e.g., Halsey et al. 1995; Cardell et al. 2003; Yavuz and Topal 2007; Zedef et al. 2007;
Ludovico-Marques and Chastre 2012; Cárdenes et al. 2014; Modestou et al. 2015; Benavente et al.
2018; Germinario et al. 2017; Jamshidi et al. 2017; Lopez-Arce et al. 2016; Yavuz et al. 2015; Zalooli et
al. 2018).
Heating and cooling weathering is considered as another major factor controlling degradation of
building materials. Rapid temperature changes throughout the day lead to the creation of thermal
shock cycles in rocks (Yavuz 2011). Even if the occurrence of the temperature changes be low, the
repeated heating and cooling of the stone can be lead to its deterioration over. Stone characteristics
such as grain size, grain shape, grain-to-grain misorientation, thermal expansion, and texture are the
main factors determinative rate of thermal degradation (Weiss et al. 2003). Effect of thermal shock
on physical and mechanical properties of various types of rocks were studied by many researchers
(e.g., Sousa et al. 2005; Yavuz et al. 2006; Takarli et al. 2008; Yavuz 2011; Demirdag 2013; Ugur et al.
2014; Ghobadi and Babazadeh 2015; Lezzerini et al. 2017; Pápay and Török 2018; Wang et al. 2017).
Most of Iran’s stony historic monuments including Persepolis were built using limestone. Despite its
durability, limestone is susceptible to the deteriorative weathering factors and in some cases it
suffers serious damage (Marzal and Scherer 2008). Hence, assessing the parameters controlling
limestone weathering is critical. In this regard some researchers studied the behavior of limestone in
relation to freeze–thaw, salt crystallization and thermal shock processes (Ghobadi and Torabi-Kaveh
2014; Ugur et al. 2014; Eren and Bahali 2005; Cardell et al. 2008; Walbert et al. 2015; Vázquez et al.
2016; Menéndez and Petráňová 2016; Heidari et al. 2017b). Persepolis is one of the most important
monuments in Iran in global scale. Therefore, study of deterioration mechanism of Persepolis stone
due to the common weathering factors regarding its petrography is an attractive issue for
researchers. Although in some studies various aspects of Persepolis stone have been considered by
different researchers. For example, Taghipour et al. (2016) studied durability of limestones used in
Persepolis complex against acid solutions, Gallello et al. (2016) applied non-destructive analytical
methods to study the conservation state of Apadana Hall of Persepolis and Heidari et al. (2017a)
used fuzzy inference system to determine weathering degree of the Persepolis stone. Hence, the
present study will investigate the effects of some common weathering factors including freezing–
thawing, thermal shock and salt crystallization on durability and strength of Persepolis stone with
emphasis on role of petrography parameters.
General information
Persepolis was the ceremonial capital of the Achaemenid Empire (550–330 BC) that in contemporary
Persian language is known as Takht-e Jamshid and Parseh, while ancient Persians called it Parsa,
meaning the city of Persians. Persepolis is situated 60 km northeast of Shiraz (in the vicinity of the
Marvdasht city) in the Fars Province, Iran (Fig. 1). UNESCO (Center 1979) has declared this complex as
a World Heritage Site.

figure1 Remnants of the glorious capital of Persia, Persepolis historical complex (Marvdasht, Fars
Province) (photo after http://www.wondermondo.com); and a view of the Majd Abad and Kuh-e
Rahmat quarries as the main and minor quarries supplying stone to Persepolis construction
(existence of hammer blow traces is a reason to introduce Majd Abad as the main quarry)
The Marvdasht city is located 50 km north of Shiraz at 1620 m above sea level. Weather is cold in the
city’s hilly areas, where Persepolis complex was constructed at there, and moderate climate is
dominant in other regions. Marvdasht region has a typical continental climate which is characterized
by cold-snowy winters and hot-dry summers. During winter, many days with temperature below − 4
°C have been recorded in the region (see Table 1). It shows that freeze–thaw cycles could be
expected especially between December and February (Table 1). Also, thermal weathering is expected
according to weather data from the region, where daily variation of temperature (temperature
differences between day and night) is about 25.5 °C (Table 1). It should be said that high relative
humidity especially during wet seasons and high evaporation rate in the region suggest occurrence of
salt crystallization cycles (see Table 1).
Table 1 Meteorological data of Marvdasht for the period 1998–2017

Field observations reveal a wide range of weathering forms such as independent fissures on the
stone structure (individual fissures or systems of fissures independent of structural features such as
bedding, foliation, banding, etc., Fig. 2a), multiple flakes to multiple scales (transitional form
between flaking and contour scaling, Fig. 2b) and break out (Fig. 2c). Probably freeze–thaw and
thermal effect processes (Fig. 2a, b) are the main factors in weathering of Persepolis stone. Also,
efflorescences are observable on the stones, particularly at the foot of walls and columns where
soluble salts in air humidity or ground water (raised from foundations) formed salt crystals near the
stone surface (Fig. 2d). Recently, Heidari et al. (2017a) used three quantitative damage indices, which
include two indices proposed by Fitzner et al. (2002) (Linear Damage Index, DIlin and the Progressive
Damage Index, DIprog) and a new index (Cubic Root Damage Index, DIcube-root), to predict the
weathering degrees of the bas-relief of Persian royal guards situated at the entrance of the Throne
Hall in Persepolis. They reported slightly weathered degree for the Persepolis stone according to
values of DIlin and DIprog which were calculated equal to 1.61 and 2.00, respectively, although they
believe that DIcube-root with value of 2.41 is more reliable for description of Persepolis stone
weathering which is described as slightly to moderately weathered.

figure2 a Formation of independent fissures on the stone structure; b scaling of Persepolis stone in
form of multiple; c break out of a part of Achaemenid griffin due to probably natural weathering; d
traces of salt crystallization on a wall in Persepolis complex; e pollutant effects on the Persepolis
stone, and f growing lichens on the Persepolis stone
In recent years, various factories were developed near the Marvdasht city such as Shiraz
Petrochemical Complex and small units for the production of PVC pipes which considerably created
concerns about the future of Persepolis complex. In this regard, it should be said that a significant
increase in the weathering rate of the surface of the Persepolis stone has been observed in recent
decades due to high increase in air pollution. The contaminating particles cause dirt and stain on the
stone surfaces, and since particles containing metal oxides have a catalyzer role and form a hard shell
consists of soot and dust, which is the first step in the degradation and gradual destruction of the
stone (Fig. 2e). By analyzing the acidity values of rain in different seasons, Ghanbari et al. (2010)
reported that the pollutants generated from various industries of the region, as well as pollutants
from the city, including vehicles, have been transferred by the winds of the region to the Persepolis
location, and after dissolving within the rain water decompose the monument stones. Based on their
report, the pollutant sources of Marvdasht are located in the southeast of Persepolis, and the winds
of the region blow from east to west. As a result of this issue, obvious changes in the acidity of the
rain were observed by the authors. In case of role of pollutants in deterioration of the Persepolis
monuments, a comprehensive study was carried out by Sadeghiyeh et al. (2015). The results showed
that the rate of corrosion from the surface of the Persepolis stone due to pollution is 29 g per square
meter for 1 year, which is a warning condition. Furthermore, the irregular growth of lichens with
different species on surface of the Persepolis stone is another serious concern (Fig. 2f). The main
causes of this subject are atmospheric pollutants and high humidity (average relative humidity of
66.8%) in the area. In this regard, Mohammadi and Krumbein (2008) did a comprehensive research
study on biodeterioration of ancient stone materials from the Persepolis monuments in.
It is believed that two major quarry were used to supply stone for Persepolis construction. In 25 km
south of Persepolis there is a quarry entitled Majd Abad consisting of a black limestone which was
used as major site for exploiting the Persepolis complex stones (Fig. 1). The black limestone belongs
to the Ilam Formation (Santonian–Campanian, late Cretaceous) (Darvishzadeh 2009). Another quarry
is Kuh-e Rahmat quarry, at the proximity of the Persepolis site, consisting of a grey limestone with
Aptian age (early Cretaceous) (Darvishzadeh 2009). The existence of a large number of semi-finished
and abandoned blocks that have traces of hammer blows (Fig. 1) is one of the most important
reasons for introducing this quarry as the main source of Persepolis stones. Considering that most
parts of the Persepolis complex were built from materials derived the first quarry, the last type was
excluded in our experiments. After coordination with the Cultural Heritage Organization of Fars
Province, during a comprehensive fieldwork some blocks with approximate dimensions of
30 × 30 × 40 cm were collected. A large number of specimens (cylindrical shape) were obtained by
drilling the obtained blocks and the samples were prepared to do the accelerated ageing tests.
Experimental procedures
As the aim of this study is assessment of physico-mechanical changes of the Persepolis stone in
relation to the artificial accelerated ageing factors, the specimens were tested in two different states.
In the first state, sound and fresh specimens were used to examine some properties such as porosity
(n), P wave velocity (Vp), Brazilian tensile strength (BTS), point load strength index (Is), and uniaxial
compressive strength (UCS). Then, those properties were measured for the specimens subjected to
the artificial ageing tests. Standard methods used in measuring the properties are explained below.
Determination of mineralogical, physical and mechanical properties
To examine petrographical parameters of the stone, thin sections from fresh samples were studied
by a polarizing microscope (Zeiss Axioskop 40). Also XRD by Philips PW 1140 diffractometer with a
Huber Model 631 photographic chamber (Cu kα radiation) was used to identify minerals of the stone.
Moreover, scanning electron microscope (SEM) (JEOL-JSM-840A model) and energy-dispersive
spectrometry (EDS) were applied on the samples, coated by gold, with aim of characterizing type of
clay minerals in the stone. Routine petrography studies were done also on thin sections from the
specimens subjected to the artificial accelerated ageing tests. ASTM standard calcimetry test (D4373-
14 2014) was performed to determine carbonate percentages of the samples. ISRM standard (Ulusay
2014) was applied to measure physical properties [porosity (n) and weight loss]. Saturation
technique was applied to measure porosity (effective porosity) of the specimens. So that after
calculating the bulk volume (V) of the specimen, it was submerged in water for a period of 48 h, and
subsequently, the specimen was removed and a moist cloth was applied to dry its surface. Then its

saturated-surface-dry mass (Msat) was determined. In the next stage, measuring grain mass (Ms) of
the specimen was done after drying that at a temperature of 105 °C and cooling for 30 min in a
desiccator. Pore volume (Vv) was calculated by dividing the value of Msat minus Ms to water density
(γw). Finally effective porosity (ne) was defined as ratio of V to Vv. Dried and saturated densities
were also measured by dividing Ms and Msat values to V, respectively. Also, an E48 Pulse Generator
Unit, made by controls and two transducers (a transmitter and a receiver) with a frequency of 54 kHz
was applied to measure sound velocity of the specimens. The average values for three times
repeating each test on a cylindrical specimen were reported as the P wave velocity. It should be
noted that a comprehensive particle analysis was done on the thin sections to evaluate number and
average size of particles. ImageJ plugin was applied to automatic determination of particle size
distributions.
Strength parameters of the stone specimens in the both states were investigated by three common
mechanical parameters including point load strength index (Is50), Brazilian tensile strength (BTS) and
uniaxial compressive strength (UCS). The parameters were measured by the tests carried out based
on ISRM standards (Franklin 1985; Ulusay 2014).
In order to perform the above tests, cylindrical samples were used to determine physical and
mechanical properties including five cylindrical samples (with a length to diameter ratio of 2.5–3) for
the physical (porosity and P wave velocity) tests and uniaxial compressive strength test, five disk
samples (with a thickness to diameter ratio of 0.3–1) for the point load test and five disk samples
(with a thickness ratio of 0.5–0.75) for the Brazilian tensile strength test. It should be noted that five
samples were used for every ten cycles. It means that 25 samples were used for the cycles of 0, 10
20, 30 and 40 in total. Since the tests are mostly destructive, it was not possible to assess the
changes caused by the ageing tests on a single sample up to 40 cycles.
Freeze–thaw test
Freezing–thawing cycles were done according to ASTM standard (D5312 M-12 2013). The specimens
after submerging in a container filled with water were frozen under freezing temperature of − 18 °C
for 18 h inside a freezer. After that, a water bath at 32 °C was used to thaw the frozen specimens for
6 h. Totally 40 cycles of freezing–thawing were done and the physical and mechanical properties of
the specimens were investigated at the end of every ten cycles.
Salt crystallization test
Forty cycles of immersion/drying of salt crystallization test were carried out according to the BS EN
standard (British Standards Institution 1999). In each cycle the specimens were submerged in a
solution of sodium sulfate or magnesium sulfate (14 w %) for 2 h at 20 °C, and dried at 105 °C for 20 h
in the oven. Finally, the specimens were cooled at 20 °C for 2 h before the next immersion. The
physical and mechanical properties of the specimens were investigated at the end of every 10 cycles.
Thermal shock test
Thermal shock tests consist of 40 cycles of heating and cooling were done on the stone specimens
according to the standard of BS EN (EN, UNI 2013). Each cycle consists of a stage heating the
specimen within an oven (18 h) at 105 °C and cooling the specimens with submerging in water for 6
h. The physical and mechanical properties of the specimens were investigated at the end of every 10
cycles.
Results and discussion

Petrography of the stone
According to Dunham classification (1962), the Persepolis stone is a bioclastic-packstone (Fig. 3a).
Subordinate microfossil fragments such as pelagic foraminifera, calcispher, and sponge spicule
scattered throughout the stone (Fig. 3a). Content of the fragments is 40–45%. Also, autogenic pyrite
crystals are visible in the thin sections (Fig. 3a). For distinction of pore space from pyrite under the
microscope, both PPL and XPL photos were studied. It revealed that the dark spots are pyrites which
show mostly crystal forms. The stone is almost nonporous and impermeable due to its texture which
is homogenous. Analyzing by ImageJ plugin on a thin section image from the stone characterized that
the average size of the fragments is about 6 μm, where 3793 fragments were counted (Fig. 4).
figure3 Photomicrograph of a pyrite (Py) particles and microfossil fragments such as pelagic
foraminifera (P.F), calcispher (C.S), and sponge spicule (S.S) scattered throughout the stone; b
development of micro-cracks in the stone after 40 cycles of freeze–thaw; c the stone after sodium
sulfate salt crystallization test without any visible change; d the stone after magnesium sulfate salt
crystallization test without any visible change; and e development of micro-cracks in the stone after
40 cycles of thermal shock
figure4 Particle analyzing on a thin section image from the Persepolis stone

The XRD results show that calcite and clay minerals are main constituents of the limestone, where
quartz is also observed as minor constituent (Fig. 5a). The calcimetry also confirmed an average of
80% calcite content in the stone. SEM analyses on the specimens revealed that calcite is the major
mineral of the specimens (Fig. 5b), although some clay minerals are visible (Fig. 5c). Furthermore,
energy-dispersive X-ray spectroscopy (EDX) performed on the specimens confirmed that the bright
spots in the SEM images (Fig. 5c) are illite as they contain Al, Si and K. Also, the observed EDX
spectrum is in accordance with the standard EDX spectrum reported by Severin (2004) (Fig. 5c). It
should be noted that calcium contents in the EDX spectrum are too high. It may be related to that
the sample is unpolished, the analyzed grain is too small in relation to the electron beam size and
collected data of characteristic X-ray are partly from the surrounding grains of calcite.

figure5a X-ray diffraction pattern for a sample of Persepolis stone; b dark parts represent calcite; c
bright spots represent clay mineral composition. Both are SEM image

Physical and mechanical properties of the limestone
Table 2 presents the results of physical and mechanical measurements on the specimens in fresh
state (before any treatment). As can be seen from the table, the limestone has relatively high
density. It is because of lack of significant pore space inside the rock, where average porosity is less
than 0.12% for the specimens. Also, the stone has low water absorption (less than 0.38%, Table 2)
which suggests high durability against water penetration. High average value of the measured P wave
velocity for the specimens is another reason to confirm the obtained density. High density and low
porosity affected mechanical properties the limestone. So that, all the three mechanical parameters
(UCS, BTS and Is50) have high average values for the limestone (Table 2). In case of UCS, the average
value is relatively high (115.6 MPa) which is probably due to existence of high content of quartz in
the specimens.
Table 2 Physical and mechanical properties of the stone in fresh state (before any treatment)
Effects of the weathering factors on apparent shape of the specimens
In general, the weathering effects of freeze–thaw process on the specimens enhanced with
increasing cycles of freeze–thaw (Fig. 6a). This is probably due to the formation of new micro-
fractures, as the specimens lose their original texture due to freeze–thaw. Although water
penetrating through fractures accelerates the weathering of the specimens, multiple fissure
networks formed when fissures expand and penetrate deeper into the stone. Due to the existence of
clay, it can be concluded that the stone suffered high diagenesis pressure (Bausch 1968), which
created veins and fractures. These veins and fractures were secondary filled with clay. This subject
controls the development of the fissures (cycles of 30 and 40 in Fig. 6a), where the fissures
predominantly developed along the pre-existing fractures of the samples rich in clay minerals (Fig. 7).
Regarding the shape and pattern of the fracture propagation in relation to the upper and lower of
layering (top and down the core) (Fig. 6a), these weakness surfaces do not relate to sedimentary
environments and therefore they are interpreted as a diagenetic structure rather than a sedimentary
structure. The formation of these fractures can occur in the late stages of diagenesis (late diagenesis)
and during uplifting the sedimentary rocks. It should be noted that although anisotropy could affect
deterioration process of a stone, there is no meaningful relationship between degree of
deterioration and degree of anisotropy (Fort et al. 2008). Fort et al. (2008) studied effect of
anisotropy on the durability of some dolostones from Madrid region (Spain) exposed to salt
crystallization process. They reported that anisotropy does not necessarily govern the deterioration
process induced by salt crystallization ageing.

figure6 Visual changes of degradation patterns during a freeze–thaw, b sodium sulfate salt
crystallization and c magnesium sulfate salt crystallization and d thermal shock ageing tests

figure7 Breaking the Persepolis stone specimen (treated by freezing–thawing cycles) along the pre-
existing fractures filled by clay minerals during uniaxial compressive strength test
Observations showed that the salt crystallization ageing tests have no significant effect on apparent
shape of the specimens (Fig. 6b, c). It should be mentioned that some cracks in the specimens were
filled by crystallized salts, notably when sodium sulfate solution was applied (Fig. 6b).
Significant visual changes in the specimens were not observed during 40 cycles of thermal shock test,
as only slight cracking have been occurred after the cycle of 30 (Fig. 6d) and some parts of the
specimen break out (see the cycle of 40 in Fig. 6d) due to the thermal shocking.
Due to the observation of efflorescence on surface of the Persepolis stone, two core specimens were
subjected to solutions of sodium sulfate and magnesium sulfate. The specimen’s shape changes were
monitored every 7 days until 2 months. During drying and evaporation at the specimens, capillary
rise leads to crystallization of face salts from solution and producing the white crust known as
efflorescence (Fig. 8). The main result is that the sodium sulfate solution rose more than the
magnesium sulfate due to capillary after 2 two months (Fig. 8). Higher water absorption capacity of

the sodium sulfate solution in comparison to the magnesium sulfate is a reason for that. Also, it
should be noted that the durability of Persepolis stone face to both the salt solutions is high as the
specimens exposed to the salt solutions were completely sound after 60 days.
figure8 Photographs were taken from Persepolis stone specimen exposed to the sodium sulfate and
magnesium sulfate solutions after 7, 14, 30 and 60 days (diameter of the core specimens is 54 mm)
The stone petrography and changes of the specimen’s texture due to the weathering factors
It has been observed that the freeze–thaw and the thermal shock tests have relatively significant
effects on the stone, as visible micro-cracks were developed in the specimens with width of 2 µm
(Fig. 3b, e). While effects of the salt crystallization tests on the stone were negligible (Fig. 3c, d). It
should be noted that the micro-crack path crossed through spaces between the fragments, mostly
within the clay matrix in both the tests. Considering high purity of the Persepolis stone and
difference in linear expansion coefficient value for calcite (in two different directions), the observed
damages during thermal shock is expectable. Because calcite is the only mineral that expands due to
increasing temperature in one direction, but it contracts in another direction when it cools down
(Haynes 2014). Also, it is worth noting that relatively low mobility of salty water in compare to fresh
water leads to low penetration of that into rock. In fact, when salt dissolves, positive and negative
ions become surrounded by polar water molecules, effectively increasing their size, and producing
quite high inter-particle, electric forces. This decreases the mobility of the ions and of the water
molecules. Hence, it can be concluded that lack of observable changes in texture of the specimens
after the salt crystallization tests is due to that subject.
Freezing–thawing cycles and physico-mechanical changes of the specimens
Table 2 shows the change in porosity of the specimens subjected to freeze–thaw cycles. Normalized
porosity values of the specimens illustrate the porosity variations during the freeze–thaw tests (Fig.
9a). The normalized value is the ratio of the obtained value after testing to that at normal condition
(not exposed to freeze–thaw). From cycle 0 to cycle 10 significant changes are observed in the
normalized porosity values (Fig. 9a), where lesser variation is visible from cycle 10 to cycle 40. P wave
velocities show descending trend with increase in numbers of freeze–thaw cycles (R2 = 0.95) (Fig.
9b), so the velocity stepped down to 4820 m/s, while it was recorded up to 5730 m/s in normal

condition (Table 3). Decrease of the Vp values is probably due to increase in porosity after freeze–
thaw.
figure9 Changes of physical and mechanical properties of the specimens vs. the numbers of freeze–
thaw cycles: a porosity (n), b P wave velocity (Vp), c uniaxial compressive strength (UCS), d Brazilian
tensile strength (BTS), and e point load strength index (Is50)
Table 3 Average values of physical and mechanical properties of the specimens before and after the
freeze–thaw cycles

Table 3 presents the measured mechanical parameters for the specimens. Evidently reduction in UCS
values was observed with the progress of the freezing–thawing cycles. Significant loss (75.6%) was
observed in the average strength from cycle 0 to cycle 40. An exponential relationship with a high
determination coefficient (R2 = 0.98) exists between freeze–thaw cycles and UCS values (Fig. 9c).
There are similar relationships between freeze–thaw cycles and Is50 and BTS values with R2 of 0.99
and 0.94, respectively (Fig. 9d, e). In the specimens, all the values of strengths decrease as the
freeze–thaw cycles increase. The Is50 value decreased from 3.96 MPa for fresh samples to 2.77 MPa
for weathered samples at the end of freezing–thawing cycles (about 30% decrease) (Table 3). Also,
the average value of BTS at normal condition is about twice as large as that at cycle 40 (Table 3).
These weaknesses of the strength parameters of the specimens could be explained by the developing
micro-cracks and fractures. It should be noted that concentration of clay minerals along pre-existing
fractures, have also significant role in the observed damages (Fig. 6a). The clay minerals may adsorb
water during 40 cycles of freezing and thawing and promoted the development of fractures due to
increase in swelling pressure within the specimens.
Salt crystallization cycles and physico-mechanical changes of the specimens
Two types of salts were used for the salt crystallization ageing experiments including sodium sulfate
(Na2SO4, 10H2O) and magnesium sulfate (MgSO4, 7H2O). The dry weight of the specimens was not
significantly affected by both the sodium sulfate and magnesium sulfate solutions. The weight losses
of the specimens after 10, 20, 30, and 40 cycles of the salt crystallization tests are shown in Tables 4
and 5. As could be seen from Figs. 10a and 11a, negligible weight losses were observed in both the
sulfate crystallization tests.
Table 4 Average values of physical and mechanical properties of the specimens before and after the
sodium sulfate salt crystallization cycles
Table 5 Average values of physical and mechanical properties of the specimens before and after the
magnesium sulfate salt crystallization cycles

figure10 Changes of physical and mechanical properties of the specimens vs. the numbers of sodium
sulfate salt crystallization cycles: a weight loss, b porosity (n), c P wave velocity (Vp), d uniaxial
compressive strength (UCS), e Brazilian tensile strength (BTS), and f point load strength index (Is50)

figure11 Changes of physical and mechanical properties of the specimens vs. the numbers of
magnesium sulfate salt crystallization cycles: a weight loss, b porosity (n), c P wave velocity (Vp), d
uniaxial compressive strength (UCS), e Brazilian tensile strength (BTS), and f point load strength index
(Is50)
Tables 4 and 5 show the change in porosity of the specimens after testing. The normalized porosity
values of the specimens have direct relationship with the salt crystallization cycles (Figs. 10b, 11b),
whereas no significant change was observed in the normalized porosity values from cycle 0 to cycle
40 in both the salts (Figs. 10b, 11b). Although the normalized porosity value shows ascending trend
with increasing salt crystallization cycles, its changes are less than that observed in the freezing–
thawing process. With developing micro-fractures originating from salt crystal creation within the
stone, Vp of the specimens decreased (Figs. 10c, 11c). Relationship between the Vp values and the
cycle numbers is strong in both the salt crystallization tests and it supports this conclusion (Figs. 10c,
11c).
No significant change in the UCS values of the specimens was observed for all the test cycles (Tables
4 and 5). However, it decreases as the number of the salt crystallization tests increases. There are
meaningful relationships between the UCS values and number of the salt crystallization cycles with
R2 of 0.96 and 0.98 for sodium sulfate and magnesium sulfate solutions, respectively (Figs. 11d, 12d).
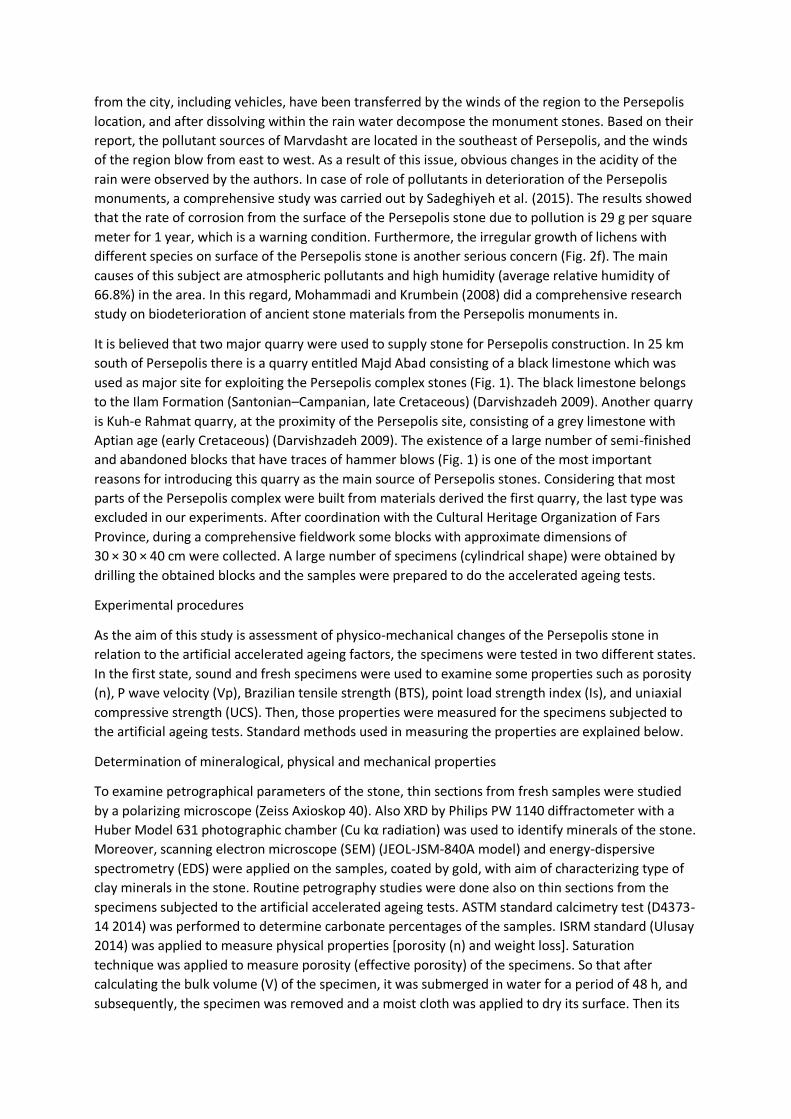
As the number of test cycles increase, the BTS values also decrease (Figs. 11e, 12e). Sodium sulfate
and magnesium sulfate salt crystallization tests caused relatively low reduction in the Is50 values
(Figs. 11f, 12f). There are negative correlations between the BTS values and the salt crystallization
cycles, as well as between the Is50 values and the salt crystallization tests (Figs. 11e, f; 12e, f).
figure12 Changes of physical and mechanical properties of the specimens vs. the numbers of thermal
shock cycles: a porosity (n), b P wave velocity (Vp), c uniaxial compressive strength (UCS), d Brazilian
tensile strength (BTS), and e point load strength index (Is50)
Slight weathering occurred after the salt crystallization test, as shown in Fig. 6b, c. It seems that the
negligible effect of the saline solutions on the properties of the specimens is due to low porosity of
the specimens which prohibited further salt solutions percolation throughout specimens. Evans
(1969) [cited in Ludovico-Marques and Chastre (2012)] reported that salt degradation is more
expectable for high porous rocks. As it was revealed by petrographic examinations on thin sections,
the porosity of the specimens is very low, which support our interpretations about the poor
degradation effect of the salt crystallization, although lower mobility of saline water in comparison to
fresh water is another reason for the poor observed degradation.
Thermal shock cycles and physico-mechanical changes of the specimens

Physico-mechanical changes of the specimens under the influence of 40 cycles of thermal shock test
are presented in Table 6. As can be seen from Table 6, slight changes in the physical properties
(porosity and P wave velocity values) were created due to the 40 cycles of thermal shock test. As the
normalized porosity values were increased with a gradual trend from cycle 0 to cycle 40 (Fig. 12a).
The values of Vp decrease with increase in numbers of thermal shock cycles (R2 = 0.95) (Fig. 12b), so
the velocity stepped down to 6350 m/s, while it was recorded up to 6445 m/s in normal condition
(Table 6). This slight decrease in the Vp values is probably related to the development of micro-cracks
and subsequent increase in porosity due to the thermal shock cycles.
Table 6 Average values of physical and mechanical properties of the specimens before and after the
thermal shock cycles
For presenting the mechanical test results, UCS, BTS, and Is50 values vs. thermal shock cycles were
plotted for 40 cycles (Fig. 12c–e). There are exponential relationships with high determination
coefficient between UCS, BTS, and Is50 values with thermal shock cycles (see Fig. 12c–e). Increase in
porosity due to the development of micro-cracks is the main reason for observed loss in the
mechanical properties.
Decay function models for the physical and mechanical properties
Mutlutürk et al. (2004) by performing some ageing tests (freezing–thawing and heating–cooling
tests) on different types of rocks proposed a decay function model. They defined two parameters
including decay constant (λ) and half-life (N1/2) to measure and describe disintegration rate of rock
against the weathering factors. Both these parameters could provide a rapid durability assessment;
however, the half-life is a more significant indicator of stone durability (Jamshidi et al. 2016).
Equations 1 and 2 express decay factor and half-life (N1/2), respectively:
VN=V0e−λN, (1)
N1/2≈0.693/λ, (2)
where VN is value of physical or mechanical property of a rock after N cycles of an ageing test, V0 is
the initial value physical or mechanical property, λ is a decay constant which indicates the average
integrity loss of each property by the action of any single cycle of ageing test, and N1/2 is number of
cycles necessary to reduce the integrity to half its value. The minus sign in Eqs. (1) and (2) indicates
the integrity loss of a physical or mechanical property.

To determine the decay constant (λ) for the physical and mechanical properties (in this study, Vp,
UCS, BTS, and Is50), simple regression analysis with exponential form was applied to express
relationship between the values of the properties and number of the ageing cycles (Figs. 9, 10, 11,
12). Considering the high values of determination coefficients, all the relationships are reliable to
estimate changes in the limestone’s properties after the ageing tests. Values of decay constants of
the properties measured for freezing–thawing, thermal shock and salt crystallization ageing tests are
presented in Table 7. Also half-life (N1/2) values were calculated via Eq. 2 (Table 7). As can be seen
from the table, Vp as a physical property is not much affected by the weathering cycles, so that
values of λ and N1/2 are lesser and longer than that for the mechanical parameters, respectively
(Table 7). In comparison to the salt crystallization test, freeze–thaw and thermal shock have more
impact on the mechanical properties, as they have higher and shorter λ and N1/2, respectively. For
example, average loss of 101 MPa was observed in UCS value after 40 cycles of freeze–thaw in the
stone (Table 3); whereas, this value is 21.6 MPa in sodium sulfate salt crystallization test (Table 4).
Therefore, the integrity loss rate of UCS after 40 cycles of freeze–thaw is about 4.6 times more than
that for sodium sulfate salt crystallization test. As a result, it was revealed that integrity loss rate of
the mechanical properties during freeze–thaw and thermal shock cycles is higher than that of salt
crystallization cycles.
Table 7 The decay constant (λ) and half-life (N1/2) of the specimens under the ageing tests
Conclusions
Effects of weathering are visible on Persepolis stone. Hence, this study planned some artificial ageing
tests (freeze–thaw, thermal shock and salt crystallization tests) to evaluate the durability of
Persepolis stone subjected to weathering factors. Limestone specimens obtained from Majd Abad
quarry (adjacent to the site of Persepolis) were tested by applying different numbers of freeze–thaw,
thermal shock and salt crystallization cycles. At the end of 40 cycles of freezing–thawing, the
specimens showed obvious changes in their micro-structure, whereas the salt crystallization tests did
not have same effect on the specimens. The UCS, BTS, Is50 and Vp values decreased due to increase
in the porosity of the specimens as a result of the freezing–thawing cycles. During the salt
crystallization cycles, physical and mechanical changes were not significant enough to indicate a clear
change in the stone properties. However, values of the UCS, BTS, Is50 and Vp until the 40th salt
crystallization cycle slightly decreased as the result of salt crystallization in the initial cracks. In case
of the thermal shock test, the recorded changes in the values of the UCS, BTS, Is50 and Vp are similar
to the freeze–thaw test. But intensity of the physical and mechanical changes is significantly less than
the freeze–thaw test.

In another part of the study decay function models, based on relationships between physico-
mechanical properties and number of the ageing test cycles, were developed with aim of obtaining
decay constant (λ) and half-life (N1/2) to evaluate the integrity loss rate of the properties against the
ageing tests. Lower N1/2 values were obtained for freeze–thaw and thermal shock tests than that for
salt crystallization test. It reveals that those weathering factors are more damaging than salt
crystallization for the stone. In justification, it should be said that porosity is the important factor that
mainly controls the durability of Persepolis stone. Persepolis stone is not susceptible to salt
crystallization due to lack of internal macro-pore structure which prevents further salt solution
percolation throughout the stone. Also it revealed that existence of veins and fractures filled with
clay is the main weakness factor for Persepolis stone, as the major damage (fractures) after most of
the ageing tests predominantly occurred parallel to these weakness surfaces.
References
Bausch W (1968) Clay content and calcite crystal size of limestones. Sedimentology 10:71–75
Bayram F (2012) Predicting mechanical strength loss of natural stones after freeze–thaw in cold
regions. Cold Reg Sci Technol 83:98–102
Benavente D, Martinez-Martinez J, Cueto N, Ordoñez S, Garcia-del-Cura M (2018) Impact of salt
and frost weathering on the physical and durability properties of travertines and carbonate tufas
used as building material. Environ Earth Sci 77:147
British Standards Institution (1999) Natural stone test methods: determination of resistance to salt
crystallization. British Standards Institution
Cardell C, Delalieux F, Roumpopoulos K, Moropoulou A, Auger F, Van Grieken R (2003) Salt-induced
decay in calcareous stone monuments and buildings in a marine environment in SW France. Constr
Build Mater 17:165–179
Cardell C, Benavente D, Rodríguez-Gordillo J (2008) Weathering of limestone building material by
mixed sulfate solutions. Characterization of stone microstructure, reaction products and decay
forms. Mater Charact 59:1371–1385
Cárdenes V, Mateos F, Fernández-Lorenzo S (2014) Analysis of the correlations between freeze–
thaw and salt crystallization tests. Environ Earth Sci 71:1123–1134
Center UWH (1979) World heritage list, Persepolis. [Online] available from:
http://whc.unesco.org/en/list/114. Accessed 20 Mar 2018
D4373-14 A (2014) Standard test method for rapid determination of carbonate content of soils.
ASTM International, West Conshohocken
D5312 M-12 AD (2013) Standard Test Method for Evaluation of Durability of Rock for Erosion
Control Under Freezing and Thawing Conditions. ASTM International, West Conshohocken
Darvishzadeh A (2009) Geology of Iran: stratigraphy, tectonic, metamorphism, and magmatism.
Amir kabir, Tehran
Demirdag S (2013) Effects of freezing–thawing and thermal shock cycles on physical and
mechanical properties of filled and unfilled travertines. Constr Build Mater 47:1395–1401

Dunham RJ (1962) Classification of carbonate rocks according to depositional textures. Am Assoc
Pet Geol 1:108–121
EN, UNI (2013) Natural stone test methods. Determination of resistance to ageing by thermal
shock
Eren Ö, Bahali M (2005) Some engineering properties of natural building cut stones of Cyprus.
Constr Build Mater 19:213–222
Eslami J, Walbert C, Beaucour A-L, Bourges A, Noumowe A (2018) Influence of physical and
mechanical properties on the durability of limestone subjected to freeze–thaw cycles. Constru Build
Mater 162:420–429
Evans IS (1969) Salt crystallization and rock weathering: a review
Fener M, Ince I (2015) Effects of the freeze–thaw (F–T) cycle on the andesitic rocks (Sille-
Konya/Turkey) used in construction building. J Afr Earth Sci 109:96–106
Fitzner B, Heinrichs K, La Bouchardiere D (2002) Damage index for stone monuments, pp 315–326.
na
Fookes P, Gourley C, Ohikere C (1988) Rock weathering in engineering time. Q J Eng Geol
Hydrogeol 21:33–57
Fort R, Fernández-Revuelta B, Varas MJ, De Buergo MÁ, Taborda-Duarte M (2008) Influence of
anisotropy on the durability of Madrid-region Cretaceous dolostone exposed to salt crystallization
processes. Mater Constr 58:161–178
Franklin J (1985) Suggested method for determining point load strength. Int J Rock Mech Min Sci
Geomech Abstr. 22:51–60
Gallello G, Ghorbani S, Ghorbani S, Pastor A, De la Guardia M (2016) Non-destructive analytical
methods to study the conservation state of Apadana Hall of Persepolis. Sci Total Environ 544:291–
298
Germinario L, Siegesmund S, Maritan L, Mazzoli C (2017) Petrophysical and mechanical properties
of Euganean trachyte and implications for dimension stone decay and durability performance.
Ghanbari MM, Bourghaee SM, Hassani AH, Farjadfard S (2010) Effect of acid rain on environment
and Persepolis archaeological zone. J Hum Environ 8:59–66
Ghobadi M, Babazadeh R (2015) Experimental studies on the effects of cyclic freezing–thawing, salt
crystallization, and thermal shock on the physical and mechanical characteristics of selected
Ghobadi M, Torabi-Kaveh M (2014) Assessing the potential for deterioration of limestones forming
Taq-e Bostan monuments under freeze–thaw weathering and karst development. Environ Earth Sci
72:5035–5047
Halsey D, Dews S, Mitchell D, Harris F (1995) Real time measurements of sandstone deterioration:
a microcatchment study. Build Environ 30:411–417
Hashemi M, Goudarzi MB, Jamshidi A (2018) Experimental investigation on the performance of
Schmidt hammer test in durability assessment of carbonate building stones against freeze–thaw
weathering. Environ Earth Sci 77:684
Haynes WM (2014) CRC handbook of chemistry and physics. CRC Press, Boca Raton

Heidari M, Torabi-Kaveh M, Chastre C, Ludovico-Marques M, Mohseni H, Akefi H (2017a)
Determination of weathering degree of the Persepolis stone under laboratory and natural conditions
using fuzzy inference system. Constr Build Mater 145:28–41
Heidari M, Torabi-Kaveh M, Mohseni H (2017b) Assessment of the effects of freeze–thaw and salt
crystallization ageing tests on Anahita Temple Stone, Kangavar, West of Iran. Geotech Geol Eng
Jamshidi A, Nikudel MR, Khamehchiyan M (2016) Evaluation of the durability of Gerdoee travertine
after freeze–thaw cycles in fresh water and sodium sulfate solution by decay function models. Eng
Geol 202:36–43
Jamshidi A, Nikudel M, Khamehchiyan M, Zalooli A, Yeganehfar H (2017) Estimating the mechanical
properties of travertine building stones due to salt crystallization using multivariate regression
Karaca Z, Deliormanli AH, Elci H, Pamukcu C (2010) Effect of freeze–thaw process on the abrasion
loss value of stones. Int J Rock Mech Min Sci 47:1207–1211
Lezzerini M, Raneri S, Nutarelli M, Luti L (2017) Conservation of cultural stones: relationship among
texture, thermal ageing and consolidation strategies in white apuan marbles. J Miner Metal Mater
Lopez-Arce P, Tagnit-Hammou M, Menendez B, Mertz J, Kaci A (2016) Durability of stone-repair
Ludovico-Marques M, Chastre C (2012) Effect of salt crystallization ageing on the compressive
behavior of sandstone blocks in historical buildings. Eng Fail Anal 26:247–257
Martínez-Martínez J, Benavente D, Gomez-Heras M, Marco-Castaño L, García-del-Cura MÁ (2013)
Non-linear decay of building stones during freeze–thaw weathering processes. Constr Build Mater
38:443–454
Marzal RME, Scherer GW (2008) Crystallization of sodium sulfate salts in limestone. Environ Geol
McKinley J, Curran J, Turkington A (2001) Gypsum formation in non-calcareous building sandstone:
a case study of Scrabo sandstone. Earth Surf Processes landf 26:869–875
Menéndez B, Petráňová V (2016) Effect of mixed vs single brine composition on salt weathering in
porous carbonate building stones for different environmental conditions. Eng Geol 210:124–139
Modestou S, Theodoridou M, Ioannou I (2015) Micro-destructive mapping of the salt crystallization
Mohammadi P, Krumbein WE (2008) Biodeterioration of ancient stone materials from the
Persepolis monuments (Iran). Aerobiologia 24:27–33
Mutlutürk M, Altindag R, Türk G (2004) A decay function model for the integrity loss of rock when
subjected to recurrent cycles of freezing–thawing and heating–cooling. Int J Rock Mech Min Sci
Noor-E-Khuda S, Albermani F, Veidt M (2017) Flexural strength of weathered granites: influence of
freeze and thaw cycles. Constr Build Mater 156:891–901
Pápay Z, Török Á (2018) Effect of Thermal and Freeze–thaw stress on the mechanical properties of
porous limestone. Period Polytech Civil Eng 62:423–428
Sadeghiyeh A, Mirrokmi M, Mostafayi-pour A, Hedayattolah R (2015) Role of contamination of
Shiraz Petrochemical Complex in abrasion of surface of Persepolis monuments using output of
MERCURE–SATURNE model. In: The international conference on new horizons in science
management and accounting, economics and entrepreneurship, COI: BCONF01_087 (In Persian)

Severin KP (2004) Energy dispersive spectrometry of common rock forming minerals. Springer,
Shekofteh A, Molina E, Arizzi A, Cultrone G, Ahmadi H, Yazdi M (2018) Characterization and
damage assessment of stones used in the Pasargadae World Heritage Site, Achaemenian period. Int J
Arch Herit 13:1–16
Sousa LM, del Río LMS, Calleja L, de Argandona VGR, Rey AR (2005) Influence of microfractures and
porosity on the physico-mechanical properties and weathering of ornamental granites. Eng Geol
Taghipour M, Nikudel MR, Farhadian MB (2016) Engineering properties and durability of
Takarli M, Prince W, Siddique R (2008) Damage in granite under heating/cooling cycles and water
freeze–thaw condition. Int J Rock Mech Min Sci 45:1164–1175
Ugur I, Sengun N, Demirdag S, Altindag R (2014) Analysis of the alterations in porosity features of
some natural stones due to thermal effect. Ultrasonics 54:1332–1336
Ulusay R (ed) (2014) The ISRM suggested methods for rock characterization, testing and
monitoring: 2007–2014. Springer
Vázquez P, Menéndez B, Denecker MF, Thomachot-Schneider C (2016) Comparison between
petrophysical properties, durability and use of two limestones of the Paris region. Geol Soc Lond Spec
Publ 416:203–216
Walbert C, Eslami J, Beaucour A-L, Bourges A, Noumowe A (2015) Evolution of the mechanical
behaviour of limestone subjected to freeze–thaw cycles. Environ Earth Sci 74:6339–6351
Wang P, Xu J, Fang X, Wen M, Zheng G, Wang P (2017) Dynamic splitting tensile behaviors of red-
sandstone subjected to repeated thermal shocks: deterioration and micro-mechanism. Eng Geol
223:1–10
Wang L, Li N, Qi J, Tian Y, Xu S (2018) Study on changes in integrity decay of sandstone subjected to
freeze–thaw cycling. In: proceedings of China–Europe conference on geotechnical engineering.
Springer. Berlin, pp 1420–1423
Weiss T, Siegesmund S, Fuller ER (2003) Thermal degradation of marble: indications from finite-
element modelling. Build Environ 38:1251–1260
Winkler EM (1987) Weathering and weathering rates of natural stone. Environ Geol 9:85–92
Yavuz H (2011) Effect of freeze–thaw and thermal shock weathering on the physical and
mechanical properties of an andesite stone. Bull Eng Geol Environ 70:187–192
Yavuz A, Topal T (2007) Thermal and salt crystallization effects on marble deterioration: examples
from Western Anatolia, Turkey. Eng Geol 90:30–40
Yavuz H, Altindag R, Sarac S, Ugur I, Sengun N (2006) Estimating the index properties of
deteriorated carbonate rocks due to freeze–thaw and thermal shock weathering. Int J Rock Mech
Min Sci 43:767–775
Yavuz AB, Akal C, Türk N, Çolak M, Tanyu BF (2015) Investigation of discrepancy between tuff used
as building stones in historical and modern buildings in western Turkey. Constr Build Mater 93:439–
448

Zalooli A, Freire-Lista DM, Khamehchiyan M, Nikudel MR, Fort R, Ghasemi S (2018) Ghaleh-
khargushi rhyodacite and Gorid andesite from Iran: characterization, uses, and durability. Environ
Earth Sci 77:315
Zedef V, Kocak K, Doyen A, Ozsen H, Kekec B (2007) Effect of salt crystallization on stones of
historical buildings and monuments, Konya, Central Turkey. Build Environ 42:1453–1457
Acknowledgements
The authors convey their sincere thankfulness to Dr. Mohammad Ali Moosavizadeh from Yazd
University for advice on sedimentology subjects.