A mouse model of ATR-Seckel shows embryonic replicative stress and accelerated aging
Upload
khangminh22Category
view
1download
0
HAL Id: tel-03611325https://tel.archives-ouvertes.fr/tel-03611325
Submitted on 17 Mar 2022
HAL is a multi-disciplinary open accessarchive for the deposit and dissemination of sci-entific research documents, whether they are pub-lished or not. The documents may come fromteaching and research institutions in France orabroad, or from public or private research centers.
L’archive ouverte pluridisciplinaire HAL, estdestinée au dépôt et à la diffusion de documentsscientifiques de niveau recherche, publiés ou non,émanant des établissements d’enseignement et derecherche français ou étrangers, des laboratoirespublics ou privés.
Accelerated aging and durability of selective materialsfor concentrating solar power plant receivers
Alexandro Carling Plaza
To cite this version:Alexandro Carling Plaza. Accelerated aging and durability of selective materials for concentratingsolar power plant receivers. Thermics [physics.class-ph]. Université de Perpignan, 2021. English.�NNT : 2021PERP0047�. �tel-03611325�

Délivré par
UNIVERSITE DE PERPIGNAN VIA DOMITIA
Préparée au sein de l’école doctorale 305:
Energie et Environnement
Et de l’unité de recherche
PROMES - CNRS UPR 8521
Spécialité: Sciences pour l’ingénieur
Présentée par Alexandro Joseph Carling Plaza
Soutenue le 14 décembre 2021 devant le jury composé de :
Y. Jourlin Professeur, IUT Saint-Étienne Rapporteur
Y. Le Maoult Professeur, IMT Mines Albi Rapporteur
E. Tomasella Professeur, U. Clermont-Auvergne Président
L. Maillé Maître de conférences, U. Bordeaux I Examinatrice
B. Claudet Professeur, Université Perpignan Via Domitia Examinateur
L. Thomas Professeur, Université Perpignan Via Domitia Directeur de thèse
A. Soum-Glaude Ingénieure de recherche, PROMES-CNRS Co-directrice
Vieillissement accéléré et durabilité de matériaux sélectifs pour récepteurs de centrales solaires
à concentration

2

3
Acknowledgements
I would like to start this manuscript by thanking all the people who have made it possible for me and
have been part of this work. First of all, I would like to thank the members of the jury, the reviewers,
Yves Jourlin and Yannick Le Maoult, for their time in correcting my manuscript and for the comments
received, in addition to their presence at the defense. Eric Tomasella for agreeing to preside over the
jury and for his follow-up during my thesis, as well as Laurence Maillé and Bernard Claudet, for all the
support and advice received. I appreciate all the organization and preparation carried out that has
made this process more agreeable and enjoyable. I feel honored to have had this jury supporting my
work, valuing and enriching the research.
This work arose from European funding from the Occitanie region (FEDER Vadum-CSP), in which I was
part of several national projects (ANR ASTORIX, CARAPASS, NANOPLAST), international collaborations
(CEFIPRA) and international conferences (SolarPACES). Of course, this work would not have been
possible without the supervisory work of Laurent Thomas and Audrey Soum-Glaude. I have always felt
very fortunate to have had this opportunity, thanks for the trust they placed in me from the very
beginning. Laurent for his forward vision and for giving me motivation and confidence with his good
advice, despite the distance that sometimes hampered communication. Audrey, despite the problems
encountered, has always been able to see the solution, supporting me and guiding me in the best
direction. I am very grateful for having shared long talks and having had your understanding during
this process. And to teach me to be patient and trust in the process of research work, something which
I have not always found easy. In addition to having given me the strength to make decisions and use
the best criteria to guide my work.
Within the small team, Selecteam, I would like to thank Danielle Ngoue, for her good advice and her
good communication from a distance, always with her nicest smile. Thanks as well to Aissatou Diop for
her availability and her help with the characterization. Also, to Jose Osorio for his help during his stay,
for his technical vision and fellowship inside and outside of work, I feel very grateful for everything
shared. In addition, within our international collaboration, to our interns, Theo Grifo and Martin
Bordas, for their work and dedication, and also to K. Niranjan, for all the information and shared work.
I want to add my thanks to the PROMES-Perpignan Raiselife team, to Reine Reoyo-Prats for her
availability at all times, it has been a blessing to have shared the experiment and have had her advice
and vision. Also, to Bernard Claudet and Olivier Faugeroux for the recommendations when applying
aging protocols. And to Harold Thibault for the help in the technical part at the beginning of my work,
which was of great help for the continuation of the experiments. Also, to Roger Garcia for having been
able to count on his work in the elaboration of the final support for our experiment.
Within the work carried out in my research, I would like to thank the materials team, especially the
active participation of Christophe Escape for the optical characterization of my samples, in addition to
his availability at all times to help me and prioritize my tasks. As well as Yonko Gorand for his work on
SEM/EDS analysis of samples. Also, to the entire department of solar installations of Odeillo that made
possible the proper functioning of solar experiments, a fundamental part of this research. Starting with
Emmanuel Guillot, thanks to him for the great knowledge he provided in every detail of the facilities
and his availability at all times. And for his help to be part of the SFERA-III program, through
collaboration and training. Nicolas Boullet for his help in improving the experimental facility and for
the advice about its proper functioning. Régis Rodríguez and Michaël Tessonneaud for the
maintenance of the facilities and their quick response when there was a problem. To Marc Garrabos
for his training and availability. Jean Louis-Sans for his ideas on future app configurations and for

4
sharing his work. I would also like to thank Quentin Falcoz for his work, he was the first person I met
in the laboratory and he also gave me the opportunity to give practical classes to students. To Laurent
Lestrade and Georges Pichelin for their IT support and to Christelle Ferriere, Aurore Thiery and Samia
Atmani for organization and help in Odeillo, as well as to Romie Lopez and Naoual Autones in
Perpignan.
I would also like to say thanks for everything I shared with the doctoral students, for the camaraderie
and the good times during my stay. To Inma and Hadrien in my beginnings, with the first rando ski
climbs, and the good dinners that made me feel at home. Also, to Anita for always being there from
the beginning, helping me in everything and supporting me when necessary, in addition to all the good
climbing trips and moments on the rock. Thanks for the infinite smile of my great friend Srirat, always
there for a good time of laughter. Also, to the girls, Segolène, Charlène and Dounia, for the good
holidays and their pleasant presence. Thanks to Timothée for his good support and consistent
availability. I would like to thank Gabi for his companionship, one of the best people I have met inside
and outside the laboratory. Also thank my office colleagues, Joya, Paul, Zu and Freddy.
How not to thank the care received from the laboratory cooks, both Didier and Jean-Pascal, thank you
for your work that makes our day in the laboratory so much more enjoyable and special with your
delicious food. I would like to give a special dedication inside the laboratory to Sylvie, for her presence,
kindness, sympathy and interest, for being there with your best smile and taking care of Kelly. We will
both miss you.
I want to thank all my friends who have supported me during this process, thanks for being there,
through your messages, calls and those of you who have been able to come to the high mountains to
visit me and get to know the center, you have been the best of this time and you will always have a
friend to count on. Especially Guille, Olga, Arrate, Adrian, Hector, Manu, Alex, Triana, Cristina, Anton,
Tiesto, Nuria, Andy, Deme, Ruben, Emily, Michael, Maitane...
Well, and this is when I open my arms and my heart to thank my family for their unconditional support,
from the first day I decided to start this adventure until the last. There are no words to say thanks for
everything I have received, you have made me feel your love at all times despite the more than a
thousand kilometers that separated us. Thank you, mother, for always seeing the light of everything,
thank you Sara for being the sun that never stops shining and thank you Eli for your love and everything
you teach me. To my dear uncles, Sue, John, Paqui and Antonio. And I would like to dedicate this work
to my father, Brian, for having followed my work from the beginning, giving me the best advice and
helping me with proofreading in English. And especially for being the person who instilled in me the
scientific vision and infinite curiosity, since I was little, you taught me to put things into practice and
be rigorous at work, without forgetting to enjoy every moment. And I end by thanking our dear Uncle
Derek for having filled our lives with happiness and joy with his optimism and good music.

5
Table of contents
ACKNOWLEDGEMENTS ................................................................................................................... 3
TABLE OF CONTENTS ...................................................................................................................... 5
GENERAL INTRODUCTION ............................................................................................................. 9
CHAPTER 1 – SOLAR ABSORBERS FOR CSP ........................................................................... 13
1. INTRODUCTION AND CONTEXT .............................................................................................................................. 15 1.1. Climate change ...................................................................................................................................... 15 1.2. Potential of solar energy ........................................................................................................................ 16
2. CONCENTRATED SOLAR POWER (CSP) .................................................................................................................... 17 2.1. Main advantage of CSP: thermal storage .............................................................................................. 17 2.2. Current situation in CSP deployment ..................................................................................................... 18 2.3. CSP technologies .................................................................................................................................... 19
Parabolic trough collectors .............................................................................................................................. 21 Central receiver ................................................................................................................................................ 22 Linear Fresnel reflectors .................................................................................................................................. 23 Parabolic dish ................................................................................................................................................... 24
2.4. Solar thermal receiver ............................................................................................................................ 25 Central receiver ................................................................................................................................................ 25 Parabolic trough linear receiver ....................................................................................................................... 26 Linear Fresnel receiver ..................................................................................................................................... 27
3. OPTICAL AND THERMAL BEHAVIOR OF SOLAR ABSORBERS ........................................................................................... 28 3.1. Optical behavior of a surface towards incident radiation ..................................................................... 28 3.2. Absorption of solar radiation ................................................................................................................. 29
Solar radiation incident on the absorber ......................................................................................................... 29 Solar absorptance ............................................................................................................................................ 30
3.3. Emission of thermal radiation ................................................................................................................ 31 Blackbody emission .......................................................................................................................................... 31 Thermal emittance ........................................................................................................................................... 32
3.4. Optical performance of solar absorbers ................................................................................................ 33 Principle of solar spectral selectivity ................................................................................................................ 33 Heliothermal efficiency .................................................................................................................................... 34
4. SOLAR SELECTIVE ABSORBERS ............................................................................................................................... 35 4.1. Types of solar selective absorbers ......................................................................................................... 35
Intrinsic absorber ............................................................................................................................................. 36 Textured surface .............................................................................................................................................. 37 Metal-dielectric composite (cermet) ............................................................................................................... 38 Multilayer absorber ......................................................................................................................................... 39 Tandem absorber ............................................................................................................................................. 41
4.2. Main commercial absorber configurations for medium-temperature CSP plants ................................. 42 5. CONCLUSION ..................................................................................................................................................... 44
CHAPTER 2 - AGING AND DURABILITY OF SOLAR ABSORBERS: A CRITICAL ANALYSIS
.............................................................................................................................................................. 45
1. EXPECTED IMPROVEMENTS IN NEXT GENERATION CSP TECHNOLOGIES .......................................................................... 47 1.1. Increasing working temperatures .......................................................................................................... 47 1.2. Working under atmospheric conditions ................................................................................................. 48
2. CORRELATED SOURCES OF DEGRADATION FOR CSP RECEIVERS..................................................................................... 49 2.1. Concentrated solar radiation ................................................................................................................. 49
Spectral range and UV flux density .................................................................................................................. 49 Weather fluctuations ....................................................................................................................................... 50

6
2.2. Temperature .......................................................................................................................................... 51 2.3. Atmospheric conditions ......................................................................................................................... 52 2.4. Heat transfer fluids ................................................................................................................................ 53 2.5. Conclusion on the sources of degradation ............................................................................................. 53
3. SUBSEQUENT AGING MECHANISMS FOR CSP RECEIVERS ............................................................................................. 54 3.1. Aging vs. degradation ............................................................................................................................ 54 3.2. Thermally-induced aging phenomena ................................................................................................... 54
Chemical phenomena ...................................................................................................................................... 54 3.2.1.1. Atomic diffusion ....................................................................................................................................... 54 3.2.1.2. Oxidation/corrosion ................................................................................................................................. 57
Physical phenomena: densification, recrystallization etc. ............................................................................... 60 3.3. (Thermo)mechanical aging phenomena ................................................................................................ 62
Mechanical behavior of materials .................................................................................................................... 62 3.3.1.1. Mechanical stress and strain .................................................................................................................... 62 3.3.1.2. Elastic and plastic behavior ...................................................................................................................... 62 3.3.1.3. Influence of temperature on the mechanical behavior of a material ...................................................... 64
(Thermo)mechanical degradations .................................................................................................................. 64 3.3.2.1. Cracks formation ...................................................................................................................................... 64 3.3.2.2. Cracks propagation and fracture .............................................................................................................. 65 3.3.2.3. Fatigue failure .......................................................................................................................................... 66 3.3.2.4. Creep damage and fracture ..................................................................................................................... 67 3.3.2.5. Thermomechanical phenomena in CSP receivers .................................................................................... 68
3.4. Summary and conclusions on aging mechanisms .................................................................................. 69 4. AGING PROCEDURES AND FAILURE ANALYSIS OF SOLAR ABSORBER COATINGS .................................................................. 72
4.1. Aging methodologies ............................................................................................................................. 72 Representative aging ....................................................................................................................................... 75 Accelerated aging............................................................................................................................................. 75
4.1.2.1. Thermal stability and lifetime prediction with Arrhenius method ........................................................... 76 4.1.2.2. Influence of thermal load: effective mean service temperature method ................................................ 79 4.1.2.3. Towards more suitable accelerated aging methods?............................................................................... 80
4.1.2.3.1. Considering thermal fatigue ............................................................................................................. 80 4.1.2.3.2. Considering thermomechanical fatigue-creep phenomena ............................................................. 81 4.1.2.3.3. Considering atmospheric conditions ................................................................................................ 82 4.1.2.3.4. Considering concentrated solar irradiance ...................................................................................... 83
4.2. Aging facilities ....................................................................................................................................... 84 Thermal aging/cycling in electric furnaces ....................................................................................................... 84 Thermal cycling under concentrated solar radiation ....................................................................................... 85
4.2.2.1. Solar furnaces........................................................................................................................................... 85 4.2.2.2. High-flux solar simulators ........................................................................................................................ 86
Atmospheric conditions: controlled atmosphere chambers ............................................................................ 87 Thermomechanical aging (fatigue-creep) ........................................................................................................ 88
5. CONCLUSIONS ON AGING STUDIES AND JUSTIFICATION OF THE PRESENT WORK ................................................................ 89
CHAPTER 3 - MATERIALS AND METHODS ............................................................................. 93
1. ABSORBER COATINGS USED FOR AGING STUDIES ....................................................................................................... 95 1.1. TiAlNx/TiAlNy tandem absorber ............................................................................................................. 95
Materials and structure ................................................................................................................................... 95 Manufacturing process .................................................................................................................................... 96
1.2. WAlSiN tandem absorber ...................................................................................................................... 97 Materials and structure ................................................................................................................................... 97 Manufacturing process .................................................................................................................................... 98
1.3. W/SiCH absorber coating....................................................................................................................... 98 Materials and structure ................................................................................................................................... 98 Manufacturing process .................................................................................................................................... 99
2. CHARACTERIZATION OF MATERIALS ........................................................................................................................ 99 2.1. Optical properties .................................................................................................................................. 99

7
UV-Vis-NIR spectrophotometer ....................................................................................................................... 99 IR spectrophotometer .................................................................................................................................... 100
2.2. Material microstructure ....................................................................................................................... 101 3. AGING ........................................................................................................................................................... 102
3.1. Aging methodology.............................................................................................................................. 102 3.2. Aging tools ........................................................................................................................................... 103
Thermal aging: ALTHAIA................................................................................................................................. 103 3.2.1.1. Experimental set-up ............................................................................................................................... 103 3.2.1.2. Control of temperature .......................................................................................................................... 104 3.2.1.3. Heating and cooling rates ...................................................................................................................... 105 3.2.1.4. Typical temperature profile ................................................................................................................... 106 3.2.1.5. Development of ALTHAIA experimental set-up ..................................................................................... 106 3.2.1.6. Additional thermal aging tools ............................................................................................................... 107
Concentrated solar + thermal aging: SAAF – Solar Accelerated Aging Facility ............................................... 107 3.2.2.1. Experimental set-up ............................................................................................................................... 107
3.2.2.1.1. Adjustable shutter - EGSésame ...................................................................................................... 109 3.2.2.1.2. Parabolic dish concentrator ........................................................................................................... 109 3.2.2.1.3. Kaleidoscope .................................................................................................................................. 109 3.2.2.1.4. Sample support .............................................................................................................................. 111 3.2.2.1.5. Pyrometer ...................................................................................................................................... 112
3.2.2.2. Heating and cooling rates ...................................................................................................................... 112 3.2.2.3. Available aging parameters .................................................................................................................... 113
3.3. Conclusion on aging ............................................................................................................................. 114 4. CONCLUSION ................................................................................................................................................... 115
CHAPTER 4 - IMPLEMENTATION AND CRITICAL ANALYSIS OF PURELY THERMAL
AGING PROTOCOLS ..................................................................................................................... 117
1. VERIFICATION OF SAMPLES EQUIVALENCE FOR COMPARABLE AGING STUDIES ................................................................ 119 1.1. Definition of sample equivalence ......................................................................................................... 119 1.2. Samples of TiAlNx/TiAlNy tandem absorber coatings ......................................................................... 120
Optical properties .......................................................................................................................................... 120 Surface topography, atomic composition ...................................................................................................... 123 Conclusions .................................................................................................................................................... 125
1.3. Samples of WAlSiN absorber coatings ................................................................................................. 125 Optical properties .......................................................................................................................................... 126 Surface topography, atomic composition ...................................................................................................... 127 Conclusions .................................................................................................................................................... 129
1.4. Samples of W/SiCH multilayer absorber coatings ............................................................................... 130 Optical properties .......................................................................................................................................... 130 Surface topography, atomic composition ...................................................................................................... 131 Conclusions .................................................................................................................................................... 132
1.5. Conclusions on sample equivalence ..................................................................................................... 132 2. THERMAL AGING FOR SHORT DURATIONS IN AIR ..................................................................................................... 133
2.1. Optical properties ................................................................................................................................ 133 2.2. Conclusions on thermal aging for short durations ............................................................................... 137
3. THERMAL AGING FOR LONG DURATIONS AT WORKING TEMPERATURE IN AIR ................................................................. 138 3.1. Optical properties ................................................................................................................................ 139 3.2. Surface topography ............................................................................................................................. 143 3.3. Atomic composition ............................................................................................................................. 144 3.4. Conclusions on thermal aging for long durations at working temperature ......................................... 146
4. THERMAL AGING FOR LONG DURATIONS AT ACCELERATED TEMPERATURES IN AIR .......................................................... 147 4.1. Optical properties ................................................................................................................................ 147 4.2. Surface topography, atomic composition ............................................................................................ 150 4.3. Lifetime prediction ............................................................................................................................... 156 4.4. Conclusions on long durations at accelerated temperatures in air ..................................................... 157

8
5. INFLUENCE OF OTHER AGING PARAMETERS ............................................................................................................ 157 5.1. Influence of thermal cycling ................................................................................................................. 157
Optical properties .......................................................................................................................................... 158 Discussion and preliminary conclusions on thermal cycling .......................................................................... 159
5.2. Influence of atmosphere during thermal aging ................................................................................... 159 6. CONCLUSIONS ON PURELY THERMAL AGING PROTOCOLS .......................................................................................... 162
CHAPTER 5 - IMPLEMENTATION AND CRITICAL ANALYSIS OF SOLAR AGING
PROTOCOLS ................................................................................................................................... 165
1. ADAPTATION OF THE SOLAR AGING FACILITY (SAAF) ............................................................................................... 167 1.1. Constraints due to the dimensions of available samples ..................................................................... 167
Compatibility between samples and supports ............................................................................................... 167 Reflectance measurements on aged samples ................................................................................................ 168
1.2. Temperature measurements on the sample during solar aging .......................................................... 170 2. COMPARISONS BETWEEN PURELY THERMAL AGING AND SOLAR AGING ........................................................................ 171
2.1. Main differences between purely thermal aging and solar aging ....................................................... 172 Temperature profiles ..................................................................................................................................... 172
2.1.1.1. Heating and cooling rates ...................................................................................................................... 172 2.1.1.2. Heating duration .................................................................................................................................... 172 2.1.1.3. Temperature fluctuations, effective temperature ................................................................................. 172 2.1.1.4. Temperature gradient in the sample ..................................................................................................... 173
Irradiance profiles .......................................................................................................................................... 174 2.1.2.1. Spectral range and irradiance levels ...................................................................................................... 174
2.1.2.1.1. Solar aging ...................................................................................................................................... 174 2.1.2.1.2. Thermal aging ................................................................................................................................. 177 2.1.2.1.3. Comparison .................................................................................................................................... 177
2.1.2.2. Effective irradiance and irradiance dose ................................................................................................ 178 2.2. Influence of concentrated solar irradiation ......................................................................................... 179
3. INFLUENCE OF THE SOURCES OF DEGRADATION DURING SOLAR AGING......................................................................... 181 3.1. Influence of solar irradiance level in constant solar aging .................................................................. 182 3.2. Influence of cyclic solar aging vs. constant solar aging ....................................................................... 186 3.3. Influence of irradiance/temperature amplitudes in cyclic solar aging ................................................ 191
Low-medium irradiance/temperature amplitudes ........................................................................................ 191 High amplitudes, impact of high temperature ............................................................................................... 196
3.4. Influence of high temperature vs. high solar irradiance ...................................................................... 201 4. DISCUSSION AND CONCLUSIONS ON THERMAL AND SOLAR AGING............................................................................... 203
GENERAL CONCLUSIONS ............................................................................................................ 207
REFERENCES .................................................................................................................................. 213
ANNEXES ......................................................................................................................................... 233
1. SAAF SET-UP: ESTIMATION OF THE HOMOGENIZED SOLAR FLUX RECEIVED BY THE SAMPLE .............................................. 235 2. SAAF SET-UP: PYROMETRY MEASUREMENTS ......................................................................................................... 235
2.1. Temperature estimation ...................................................................................................................... 235 2.2. Pyrometer calibration .......................................................................................................................... 237
ABSTRACT ...................................................................................................................................... 239
RÉSUMÉ ........................................................................................................................................... 239

9
General introduction
High carbon emissions in the atmosphere, causing climate change, are notably caused by the
combustion of fossil fuels, to produce energy for a growing world population. An increase of renewable
energy sources into the energy mix is one of the envisaged responses to this climate and energy crisis.
Among renewable technologies, solar energy technologies have a significant role to play to reduce the
consumption of fossil fuels while meeting the worldwide energy demand. Indeed, the incoming solar
energy on Earth amounts to 437,850 TWh annually, four times the annual global energy consumption
of 111,756 TWh. Moreover, increased investment in renewable technologies has led to a fall in the
levelized cost of electricity (LCOE) from these technologies, making them economically competitive
with fossil fuels. For instance, electricity produced from solar energy is now often cheaper than
electricity produced from fossil fuels.
Solar energy technologies comprise Photovoltaics (PV) technologies for direct electricity production,
and Solar Thermal (ST) technologies which convert solar energy into heat. This heat can be used to
produce domestic hot water and heating, and in many industrial processes where heat is required, in
place of consuming electricity to produce heat. When concentrating the incoming solar energy using
highly reflective materials as mirrors, the increased amount of heat extracted can be further converted
into electricity. This is the principle used in Concentrated Solar Power (CSP) plants, where the incoming
solar irradiance can be multiplied up to the level of several hundreds of suns. This concentrated solar
energy is sent to a solar receiver that converts it into heat and transfers the latter to a heat transfer
fluid (HTF), to be used in a thermodynamic cycle and produce electricity. One of the main advantages
of CSP compared to PV is the possibility to easily store the extracted heat before its conversion into
electricity, thus allowing for an adjustment of the electricity production to the demands of the
electricity market, without suffering from the solar intermittence.
In most cases, solar receivers are made of pipes or flat panels of metallic alloys (e.g. stainless steels or
nickel-based high temperature alloys) below which the HTF flows to extract the produced heat. Such
materials have desirably high mechanical properties and thermal conductivity. However, their partly
reflective intrinsic properties are not suitable for solar absorption. Therefore, their surface can be
covered with coatings presenting high solar absorptance in the solar region (0.28 – 2.5 µm), such as
black paints. Ideally, these coatings should also have a low thermal emittance in the infrared region
(typically above 2 µm), to limit radiative thermal losses and increase their solar-to-heat conversion
efficiency. Such functional coatings are called solar selective absorber coatings (SSACs), as they present
a spectral selectivity.
In CSP technologies, solar absorber components suffer harsh working conditions for long durations,
typically 25 years: high concentrated solar irradiation (30 to 1000 suns), significant temperature levels
and temperature variations (several hundreds of °C in seconds/minutes), air, water vapor, pollutants,
aerosols, depending on the location and proximity to the sea. Moreover, to make these technologies
more economically viable implies the further increase of the working temperature of CSP plants. These
working conditions are very demanding for solar absorber materials, especially for coatings. They
represent potentially damaging sources of degradation, that may cause their premature aging and
degrade the overall efficiency of the plant. The maintenance of the receiver represents a high cost that
can be significantly reduced using a highly stable absorber surface, able to maintain its optical
performance for long durations.

10
Therefore, before they can be used in CSP plants, the behavior of solar selective absorber coatings
under these harsh working conditions needs to be studied thoroughly to validate their performance
and durability. Aging protocols and facilities can be found in the literature for the study of the aging
behavior of SSACs. However, these aging procedures need to be further analyzed, adapted and
standardized, to offer more reliable and more comparable aging and durability assessment, with the
objective that standardized aging procedures can eventually be used as a tool for coating developers
to compare the performance of their materials, and for the overall improvement of SSAC technologies.
In this context, this work proposes a critical and extensive literature review of existing aging protocols,
aging facilities and aging phenomena used for the study of SSACs, further supported by the
experimental application of classical aging protocols (purely thermal aging) and original aging protocols
under solar concentration (solar aging), on three different types of SSACs, using two original
experimental set-ups that enable to partly decorrelate the effect of the different sources of
degradation representative of CSP applications.
To present the work, this manuscript is divided into five chapters. The first chapter demonstrates the
principles of concentrated solar energy and its current deployment in the electricity production
market. The different technologies of CSP plants and solar receivers are explained. The optical and
thermal behavior of solar absorbers are described, considering solar absorptance, thermal emittance
and the principle of solar spectral selectivity. The chapter continues with a description of the different
types of solar selective absorber coatings and the current research state on each type of absorber,
ending with current commercial absorbers used for medium-temperature CSP plants.
The second chapter starts by describing the expected improvements in the next generation of CSP
technologies, considering the two most relevant improvements related to the receiver, the increase of
the working temperature and the capability of working in atmospheric conditions for long durations.
The rest of this chapter is based on an analysis of the scientific literature. From this analysis, the main
sources of degradation are identified and described considering the potential impact on CSP receivers,
and subsequent aging mechanisms are explained in details. Existing aging procedures, methodologies
and tools for failure analysis, that can be applied to SSACs, are then presented and commented. A
global scheme linking these different aspects is finally proposed in the conclusions of this chapter.
The following chapters are centered on the experimental application of some of these existing aging
protocols, as well as more original ones, on three typical SSACs, with the purpose of evaluating the
pertinence of said aging protocols and draw general tendencies regarding the aging behavior of SSACs.
The third chapter presents the materials, facilities and methodologies used for this complementary
experimental study. The chapter starts by presenting the three types of SSACs that were tested, looking
at their constitutive materials, absorber architecture and manufacturing process in each case. Then
are presented the characterization techniques and equipment used to assess the coatings properties,
in terms of their optical behavior and microstructure, before and after aging tests. Finally, the global
aging methodology and the aging tools used in this study are presented, with detailed descriptions of
the experimental set-ups.
The fourth chapter first exposes an analysis of the equivalence of the different samples of each type
of absorber in their as-deposited state. Indeed, the equivalence between samples of the same type is
essential for a suitable comparability of aging results when applying different protocols. Then a study
on purely thermal aging protocols in an electrical furnace begins with the application of aging tests at
a typical CSP working temperature, first for short duration tests, as the first step applied to each

11
absorber, followed by long duration tests as a way of checking the thermal stability under more
representative CSP working conditions. Accelerated aging at higher temperatures is then applied to
the absorbers with good thermal stability at working temperature. The influence of other aging
parameters such as thermal cycling and aging atmosphere are also studied. Correlations between tests
in representative aging and accelerated aging are established in an attempt to understand the
degradation behavior and the more suitable way of applying purely thermal aging.
The fifth and last chapter deals with the application of solar aging using a unique solar aging facility.
First, adaptations of the existing solar aging facility are proposed to allow for a more generalized
application of solar aging procedures on SSACs samples. The chapter continues with a comparison of
the effects of purely thermal aging and solar thermal aging, in an attempt to decorrelate the impact of
the presence of concentrated solar irradiance at similar levels of temperature. The main differences
between the two types of aging, particularly in terms of temperature and irradiation profiles, are also
discussed. Then the influence of other sources of degradation in solar aging, such as solar irradiance
levels and cycling amplitude, are studied with the aim of observing which of these sources have a more
significant impact on the aging behavior of SSACs. Finally, a discussion on the pertinence of applying
solar aging in addition to purely thermal aging for more representative aging studies, as well as
recommendations for applying solar aging procedures, are provided.
Overall, this work confronts the existing state of the art on the aging behavior assessment of solar
selective absorber coatings with the experimental application of classical (purely thermal) and original
(solar) aging procedures, using original aging facilities and typical R&D solar absorber coating
configurations, in view of helping in the development of a more broadly applicable test standard for
the prediction of thermal stability, reliability and service life of solar selective absorber coatings
operating at high temperatures under atmospheric conditions.

12

13
Chapter 1 – Solar absorbers for CSP

14

15
1. Introduction and context
1.1. Climate change
The evidence of climate change in our daily life is ever clearer, with devastating events around the
world. Extreme weather conditions are observed when and where they are not expected, as in 2018,
with remarkable icy storms in Europe and the north-eastern US and an increase of 20°C of average
temperatures in the Arctic [1]. This situation creates dry areas and also some even more humid areas.
One of the main reasons of this problem is the increase of greenhouse gases (GHG) emissions toward
the atmosphere, caused mainly by human activities.
According to the International Energy Agency (IEA), there has been an increase of almost 20% in the
concentration of carbon dioxide (CO₂) emissions from 1980 to 2017, with current values of 404.98 ppm
(parts per million) of CO₂ and an average growth of 2 ppm/year in the last ten years [2]. In addition,
there has been a significant increase in the levels of methane (CH₄) and nitrous oxide (N₂O). These
increases can be linked to the ever-intensifying anthropogenic activities following the Industrial
Revolution.
One of the clearest evidence of these CO2 emissions being produced by human activity has been shown
recently with the COVID-19 pandemic that drastically altered the energy demand due to the
confinement of most of the world population. The daily global CO2 emissions then decreased by 17%
by early April 2020, compared to the previous year [3].
Looking at the figures by sectors, the energy sector (electricity and heat generation, and
transportation) accounts for approximately two-thirds (68%) of total green-house gas emissions
through the combustion of fossil fuels, and around 80% of CO₂ total emissions [4]. Indeed, the
generation of electricity and heat worldwide still relies heavily on coal, the most carbon-intensive fossil
fuel. This therefore makes the energy sector one of the major sectors contributing to such a global
situation. Meanwhile, there is an increasing demand for energy coming from worldwide economic
growth and development, with a growth of 150% between 1971 and 2015 [4].
This state of affairs has attracted considerable attention from major players. The engagement of the
industrialized and developing countries is very important for national and global GHG mitigation. This
was formalized by the United Nations Framework Convention on Climate Change (UNFCCC)
Conference of the Parties (COP), to support countries through the provision of energy and emissions
statistics, and the training of countries officials in policy, modelling and energy statistics, with the final
objective of stabilizing GHG concentrations in the atmosphere. In 2015, China contributed 28% of the
total CO₂ emissions (9,084 MtCO₂), the United States 17% (4,998 MtCO₂), Europe 16% (5,080 MtCO₂)
and India 6.5% (2,066 MtCO₂) [4].
A state of transition has started towards a clean, sustainable, affordable and accessible global energy
system. To this day, non-fossil energy (without GHG emissions) accounts for 26.3% of the global energy
production share (not including hydroelectricity), with 1.01 terawatts of installed renewable capacity
[5]. In the wake of COP 21, most nations across the world agreed to accelerate their reductions in
carbon emissions, namely through renewable electricity production and lower carbon-emitting
transportation. Renewable energy is indeed at the center of the transition to a less carbon-intensive
and more sustainable energy system, and represented almost two-thirds of new net electricity capacity
additions in 2016 with almost 165 GWe [6]. Renewable energy has indeed grown rapidly in recent
years, accompanied by sharp cost reductions for solar PV and wind power in particular. The IEA expects
renewable electricity generation to increase by more than one-third by 2022 to over 8000 TWh.

16
In this global context, solar energy is a most valuable candidate. It is predicted that solar energy can
produce up to 27% of global electricity by 2050 (16% from solar photovoltaic systems and 11% from
solar thermal electricity), and become the top source of electricity as early as 2040 [7].
1.2. Potential of solar energy
Solar energy is the most abundant energy resource on Earth, with about 885 millions of TWh reaching
the surface of the planet every year, which means 8,100 times the primary energy consumed by
humankind in 2015 [8] (the world final energy consumption was 109,135 TWh in 2015). It is abundant
in many parts of the world [9]. Figure 1 shows the direct normal irradiance (DNI) levels around the
globe. This irradiance is the relevant irradiance for the concentration of solar energy, and is measured
on surfaces normal to the direct sunbeams.
Figure 1. Global map showing the DNI levels for each location [9]
It can play a major role as an alternative energy resource, producing heat or electricity by capturing
the radiation of the Sun. Indeed, solar radiation can be captured by photovoltaic devices using
semiconductor materials that convert sunlight directly into electricity, or using solar thermal devices
that convert the solar radiation into heat. These solar thermal devices can work at large and small
scale. The small scale is used to heat water or air at low temperatures (T < 300°C) for buildings
(domestic hot water, heating and cooling) and industries (mining, food, textile, etc.). The large scale is
used to produce steam for electricity generation at higher temperature in solar power plants. This
configuration is obtained by using mirrors to concentrate sunlight, transfer heat at high temperature
to a fluid to produce steam then electricity via a steam turbine. These types of systems using solar
concentration are called Concentrated Solar Power (CSP) technologies.
In the following section, the principles of CSP technologies, the current commercial technologies
available and the needed improvements of these technologies to increase the efficiency are discussed.

17
2. Concentrated solar power (CSP)
2.1. Main advantage of CSP: thermal storage
The main disadvantage of solar energy is its intermittent nature, with fluctuations due to cloud cover
during the day, and total absence during the night, especially after sundown and in the early morning
when power demand steps up. To compete with other sources of energy, this intermittence must be
overcome. Therefore, the question of energy storage is crucial for the development of solar
technologies, both photovoltaic and thermal.
For photovoltaics (and wind energy), electricity is directly produced and must be stored. The currently
available energy storage systems for electricity are pumped hydro, compressed air energy storage
(CAES), a large family of batteries, flywheels and hydrogen storage. Each technology has its own
performance characteristics that make it optimally suitable for certain grid services.
Pumped hydro and CAES can be considered high scale storage adapted to the geographic location,
making them site-dependent. Both are capable of discharge times in tens of hours and with high
module sizes that reach 1,000 MW. Pumped hydroelectric energy storage is a large, mature, and
commercial utility-scale technology currently used at many locations around the world. CAES systems
are similar, but less mature, in their use as they store energy in the form of pressurized air, usually in
underground caverns.
In contrast to the capabilities of these two technologies, various electrochemical batteries and
flywheels are positioned around lower power and shorter discharge times, ranging from a few seconds
to six hours. Several different electrochemical battery technologies are currently available for
commercial applications. The more robust technologies include lithium-ion (Li-ion), sodium sulfur
(NaS), and lead acid batteries. Li-ion batteries tend to be best suited for relatively short discharges
(under two hours) but do not handle deep-discharges well. The main disadvantage is the cost of battery
storage with capital costs from near 300 $/kWh [10]. Flywheels are currently commercially deployed
primarily for frequency regulation, ensuring a steady power supplied to the grid. Hydrogen systems
are another type of storage, still at the early stage. It requires careful analysis to fully capture the value
stream. While energy efficiencies might be at a level of 40%, this is balanced by energy storage
potential that may last days, weeks, or longer.
In contrast, in concentrated solar power technologies for electricity production, the solar radiation is
harnessed first to produce heat then electricity. This first conversion step allows for much easier and
cheaper large-scale heat storage. Thermal storage used in CSP plants has a medium-long discharge
time with five to ten hours of storage, optimally run for about 4,000 hours per year, depending on the
solar conditions of the site. Thermal storage is used to increase the capacity factor of the CSP plant,
and it reduces the average cost of solar thermal electricity. Thermal storage also has remarkable
efficiency, especially when the storage medium is also used as the heat transfer fluid, such as with
molten salts, with limited energy losses of 2%. It is expected to be able to improve such technology,
with a decrease of the system capital cost. It is estimated that costs can be reduced to under 15 $/kWh,
from the current cost of 20-25 $/kWh, with a high system efficiency of up to 95% and being able to
have a lifetime of 10,000 cycles [11]. Thus direct thermal storage is the main advantage of CSP over PV
(and wind), and allows for continuous electricity generation, which solves the problem of the
intermittent nature of solar energy. This advantage gains importance with respect to renewable energy
sources such as PV and wind power. Electric Thermal Energy Storage (ETES) is even considered by some
as an alternative to store and spread at a reasonable cost the power generated by PV or wind, using
the produced electricity to heat a fluid, then generate electricity again via a steam turbine [12].
18
2.2. Current situation in CSP deployment
Concentrated solar power or CSP technologies are one of the most mature renewable energy
technologies to produce electricity, together with photovoltaic and wind energy. Research activities
on CSP started in the 1970s with several pilot plants, such as THEMIS tower in Targasonne, France,
with 2 MW of output power built in 1979. This brought CSP technology to the industrial and
commercial level, with the first CSP plant, called Solar One, installed in 1982 in the United States. The
first commercial CSP plants were built without storage in California, in the context of tax incentives for
renewable energy. After that, there was a period of stagnation due to the drop in price of fossil fuels.
The development of CSP projects resumed in the 2000s, mainly in Spain and the United States, as a
consequence of energy policies and incentives to mitigate CO2 emissions and diversify the energy
supply. It strongly increased from 2010, emerging in new markets such as the Americas, North and
South Africa, the Middle East, Australia, China and India. It was not until 2006 that large-scale CSP
plants were built, particularly in the aforementioned countries. The world’s largest CSP plant, in the
Mojave Desert in the USA, with 392 MW, was connected to the grid in 2013.
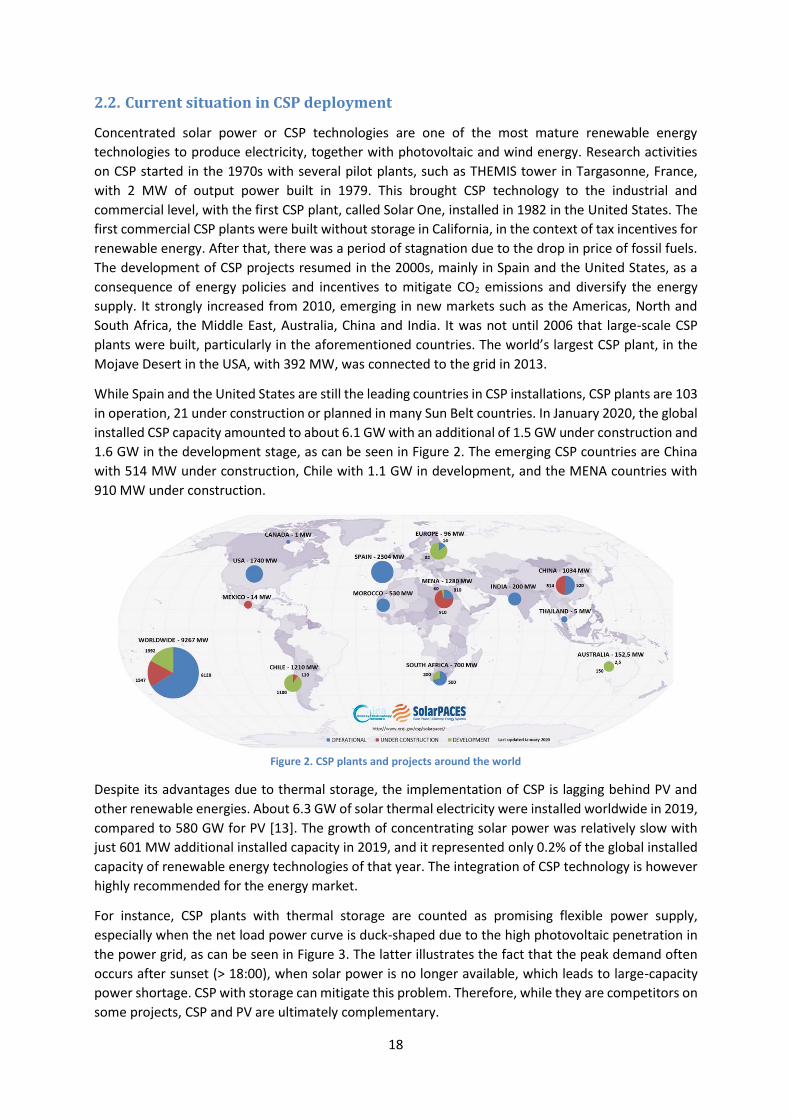
While Spain and the United States are still the leading countries in CSP installations, CSP plants are 103
in operation, 21 under construction or planned in many Sun Belt countries. In January 2020, the global
installed CSP capacity amounted to about 6.1 GW with an additional of 1.5 GW under construction and
1.6 GW in the development stage, as can be seen in Figure 2. The emerging CSP countries are China
with 514 MW under construction, Chile with 1.1 GW in development, and the MENA countries with
910 MW under construction.
Figure 2. CSP plants and projects around the world
Despite its advantages due to thermal storage, the implementation of CSP is lagging behind PV and
other renewable energies. About 6.3 GW of solar thermal electricity were installed worldwide in 2019,
compared to 580 GW for PV [13]. The growth of concentrating solar power was relatively slow with
just 601 MW additional installed capacity in 2019, and it represented only 0.2% of the global installed
capacity of renewable energy technologies of that year. The integration of CSP technology is however
highly recommended for the energy market.
For instance, CSP plants with thermal storage are counted as promising flexible power supply,
especially when the net load power curve is duck-shaped due to the high photovoltaic penetration in
the power grid, as can be seen in Figure 3. The latter illustrates the fact that the peak demand often
occurs after sunset (> 18:00), when solar power is no longer available, which leads to large-capacity
power shortage. CSP with storage can mitigate this problem. Therefore, while they are competitors on
some projects, CSP and PV are ultimately complementary.

19
Figure 3. The predicted duck curve (total load power curve minus renewable energy generation curve) reported by
California Independent System Operator in 2015. (Source:
http://www.caiso.com/Documents/FlexibleResourcesHelpRenewables_FastFacts.pdf.)
Overall, the implementation of CSP technologies is expected to reach a global share of 11% by 2050,
equivalent to 1,000 GW of total installed capacity, avoiding the emissions of up to 2.1 gigatons of
carbon dioxide annually. CSP technology has the capacity to provide for about 7% of the total electricity
needs projected for the world by 2030, and 25% by 2050 (considering a high-energy-saving, high-
energy-efficiency scenario) [14].
2.3. CSP technologies
The main principle of CSP plants is illustrated in Figure 4. It consists in concentrating the incoming solar
irradiation onto a solar absorber (receiver), to be able to convert this concentrated solar energy into
useful heat. The concentration is done with highly reflective mirrors. The level of concentration and
absorber temperature depend on the area and optical efficiency of the mirrors. The former is the
concentration ratio given by Eq.(1), where Am is the total area of the mirrors and Ar is the area of the
receiver.
𝐶 =𝐴𝑚
𝐴𝑟 (1)
The absorbed useful heat is transferred to a heat transfer fluid (HTF), which transfers the heat to a
steam generator to finally run a steam turbine and produce electricity. The three main subsystems are
the solar collector field, or mirror field, the solar receiver and the power conversion system.
Figure 4. Principle of a Concentrated Solar Power (CSP) plant
In hybrid plants, a storage or back-up system is added to improve performance and therefore increase
the capacity factor. The storage is usually done with liquid molten salt, used as the heat transfer fluid
20
which has already been proven effective for 7 to 15 hours [15]. Steam can be also used for storage,
but it is considered a short term storage, viable for just 0.5 to 4 hours [16–18]. The power conversion
systems are Rankine cycles, Brayton cycles, combined cycles and Stirling cycles, depending on the CSP
technology. The back-up is usually done with natural gas, enabling the plant to function continuously,
even during cloudy days.
The differences between CSP technologies are in the optical design, the solar field layout, the tracking
system, the type of receiver, the type of heat transfer fluid, the heat storage capability and the
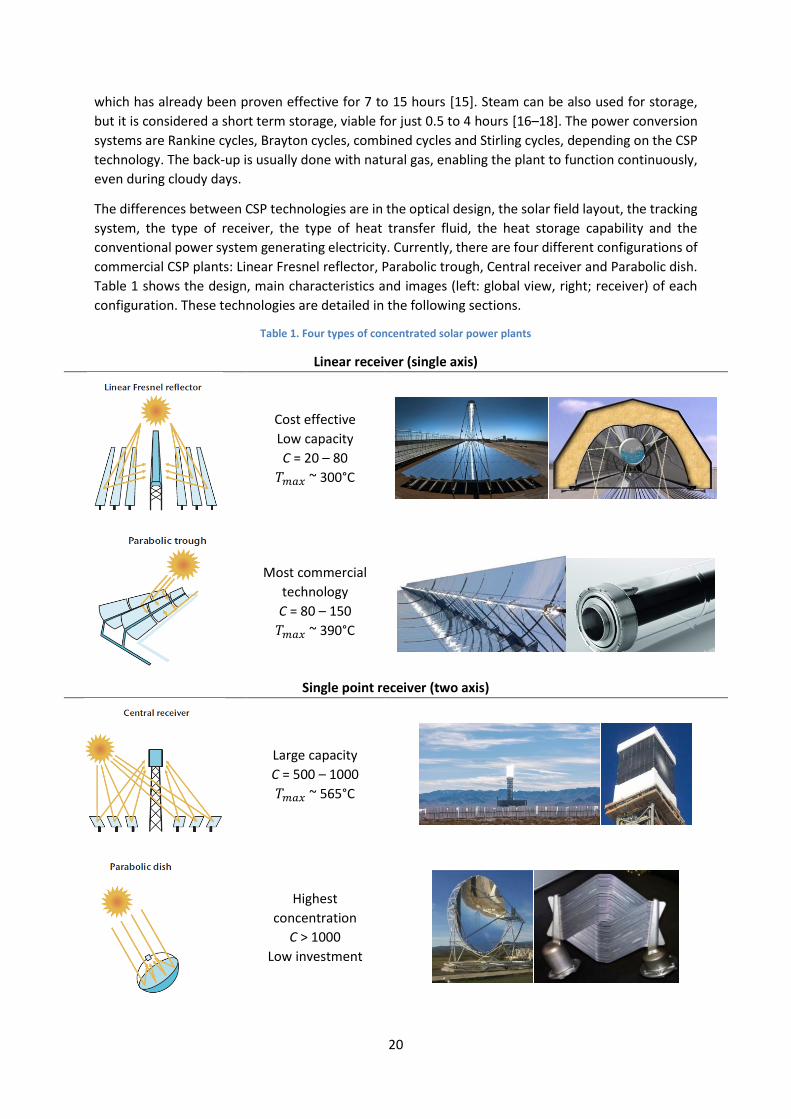
conventional power system generating electricity. Currently, there are four different configurations of
commercial CSP plants: Linear Fresnel reflector, Parabolic trough, Central receiver and Parabolic dish.
Table 1 shows the design, main characteristics and images (left: global view, right; receiver) of each
configuration. These technologies are detailed in the following sections.
Table 1. Four types of concentrated solar power plants
Linear receiver (single axis)
Cost effective
Low capacity
C = 20 – 80
𝑇𝑚𝑎𝑥 ~ 300°C
Most commercial
technology
C = 80 – 150
𝑇𝑚𝑎𝑥 ~ 390°C
Single point receiver (two axis)
Large capacity
C = 500 – 1000
𝑇𝑚𝑎𝑥 ~ 565°C
Highest
concentration
C > 1000
Low investment
21
Parabolic trough collectors
Parabolic trough (PT) is one of the most commercial, advanced and mature CSP technology, with 2,000
hours of performance, and a history of commercial plants operation dating from the early 1980s.
Currently, there are over 4,000 MW in operation with 80 plants operating worldwide commercially
and 11 plants under construction. The power of PT plants is between 5 and up to 280 MW. It can be
said that this technology has the lowest operational risk compared to other CSP technologies, making
PT the most competitive in the field. This system provides the best land-use factor of any solar
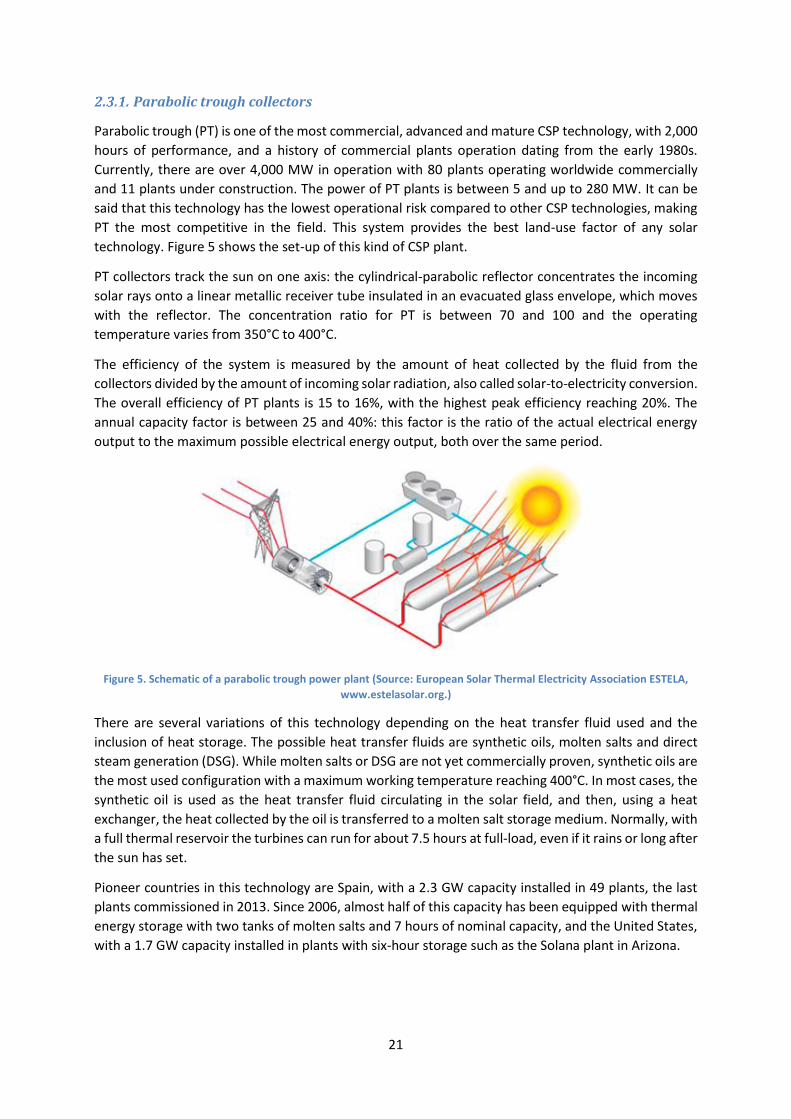
technology. Figure 5 shows the set-up of this kind of CSP plant.
PT collectors track the sun on one axis: the cylindrical-parabolic reflector concentrates the incoming
solar rays onto a linear metallic receiver tube insulated in an evacuated glass envelope, which moves
with the reflector. The concentration ratio for PT is between 70 and 100 and the operating
temperature varies from 350°C to 400°C.
The efficiency of the system is measured by the amount of heat collected by the fluid from the
collectors divided by the amount of incoming solar radiation, also called solar-to-electricity conversion.
The overall efficiency of PT plants is 15 to 16%, with the highest peak efficiency reaching 20%. The
annual capacity factor is between 25 and 40%: this factor is the ratio of the actual electrical energy
output to the maximum possible electrical energy output, both over the same period.
Figure 5. Schematic of a parabolic trough power plant (Source: European Solar Thermal Electricity Association ESTELA,
www.estelasolar.org.)
There are several variations of this technology depending on the heat transfer fluid used and the
inclusion of heat storage. The possible heat transfer fluids are synthetic oils, molten salts and direct
steam generation (DSG). While molten salts or DSG are not yet commercially proven, synthetic oils are
the most used configuration with a maximum working temperature reaching 400°C. In most cases, the
synthetic oil is used as the heat transfer fluid circulating in the solar field, and then, using a heat
exchanger, the heat collected by the oil is transferred to a molten salt storage medium. Normally, with
a full thermal reservoir the turbines can run for about 7.5 hours at full-load, even if it rains or long after
the sun has set.
Pioneer countries in this technology are Spain, with a 2.3 GW capacity installed in 49 plants, the last
plants commissioned in 2013. Since 2006, almost half of this capacity has been equipped with thermal
energy storage with two tanks of molten salts and 7 hours of nominal capacity, and the United States,
with a 1.7 GW capacity installed in plants with six-hour storage such as the Solana plant in Arizona.

22
Here are some of the currently operating PT plants:
• Andasol-1 (and Andasol-2 & 3) (50 MW, Spain)
• Arcosol 50 (50 MW, Spain)
• Ashlim (Negev) (121 MW, Israel)
• Chabei Molten Salt PT Project (64 MW, China)
• Solnova 1 (50 MW, Spain)
Central receiver
The central receiver plant, or solar tower plant, is one of the emerging solutions for high capacity CSP
plants. The first commercial central receiver plant, called PS10, was commissioned in June 2007 in
Spain. Currently, the capacity of these types of plants can reach up to 100 MW for a single receiver. By
concentrating sunlight 600 up to 1,000 times, the operating temperature can reach levels from 300°C
to over 565°C, with a high potential to increase the operating temperature up to 800°C. This technology
has proven to be technically feasible in projects with 15 years of experience worldwide. It can be said
that this is one of the most promising technologies in the CSP field: thanks to the possibility of achieving
such high temperatures, plants can also drive gas turbines or combined cycle systems, reaching peak
efficiencies of 35%.
The main components of solar tower plants are a heliostat (mirror) field, a tower and an electricity
generation system. The tower has a height from around 100 meters to up 150 meters. The multitude
of movable heliostats track the Sun and concentrate the sunrays upon the receiver at the top of the
tower, where the fluid is circulating (Figure 6). As a usual CSP configuration, the working fluid absorbs
the solar energy and is then used to generate steam to power a conventional turbine.
Figure 6. Solar tower plant configuration (Source: European Solar Thermal Electricity Association ESTELA,
www.estelasolar.org)
There are different configurations depending on the heat transfer fluid (steam, air, molten salts), the
storage system and the heliostat design. One option is to use molten salts both as heat transfer fluid
and heat storage medium, such as for the Crescent Dunes Solar Energy Project, located in Nevada with
a capacity of 110 MW and 10-hour thermal storage, and Gemasolar in Spain, with a capacity of 20 MW
and 15 hours of thermal storage. Plants such as PS10 and PS20, near Seville, Spain, use direct steam
generation (DSG) with steam as the heat transfer fluid. The largest CSP capacity so far at a single place
is the one built at Ivanpah in California, totaling 377 MW (net). This plant includes three distinct towers
– each with its own turbine – based on DSG technology and no storage.

23
It is important to note a different configuration for solar tower plants, called the beam-down [19],
where the tower receiver is substituted by a down-facing convex mirror. In this way a second reflection
stage is added and the receiver can be located on the ground. This emerging configuration avoids
having to send the heat transfer fluid up to the top of the tower with pumps.
There are several central receiver plants around the world, with a capacity ranging between 10 and
100 MW per tower. In 2020, there are around 18 plants operating and 7 plants are on the way to
become operational in the next few years, most of them located in China and Chile.
Some of the currently operating solar tower plants are:
• NOOR III (150 MW, Morocco)
• ACME Solar Tower (2.5 MW, India)
• Planta Solar 10 (11 MW, Spain)
• Planta Solar 20 (20 MW, Spain)
Linear Fresnel reflectors
This type of technology is one of the least mature technologies in the CSP field together with the
parabolic dish configuration, which will be described in the following section. It is also the technology
with the lowest concentration ratio, thus the operational temperature stays low and so does the
system efficiency. Currently, long-term performance and cost data are still lacking for further
improving this technology. The main components of LFRs are the reflective mirrors, the receiver tube
and the tubing system.
This technology is similar to parabolic troughs, but uses a line of mirrors instead of one single curved
mirror. Indeed, this system concentrates sunlight with a series of long, narrow, shallow-curvature (or
flat) mirrors, each oriented differently, so as to approximate the concentration profile of a parabolic
trough, as can be seen in Figure 7. Each line of single-axis mirror tracks the movement of the Sun. It is
structurally simpler and cheaper than a parabolic trough concentrator. Also, the loads caused by wind
are lower and it has higher land-use efficiency, suitable for rooftop or limited industrial areas. Sunlight
is concentrated onto a receiver mounted at the focal line of the Fresnel mirrors, placing it parallel to
and above them. The design of the receiver is a thermally-insulated inverted cavity with a secondary
mirror, covered by a glass enclosing the absorber tubes in static atmospheric conditions.
Figure 7. Schematic of a Linear Fresnel reflector (Source: European Solar Thermal Electricity Association ESTELA,
www.estelasolar.org)
As mentioned before, this technology has greater optical losses than troughs, especially when the Sun
is low in the sky. As a result, there is lower production in the early morning and late afternoons, and
also in winter, but this can be overcome in part by the use of higher operating temperatures than
trough plants. Thus, LFR technology uses direct steam generation, with direct storage of the steam.

24
Current research is underway to use molten salts as the heat transfer fluid, to be able to use it as the
direct storage media in both parabolic trough and linear Fresnel systems. The greatest challenges to
commercializing this change in the technology are to use materials compatible with rotary joints and
concerns over salt freezing in the solar field.
The first prototypes of LFR technology were built in 2010, and after that, two commercial plants were
operating, in 2012, with a 30 MW plant in Spain and in 2014, with a 125 MW plant in India, both of
them without storage. Nowadays, only 5 plants (166.4 MW) are operating and 3 are under construction
(65 MW):
• Dhursar (125 MW, India)
• Puerto Errado 1 (1.4 MW, Spain)
• Puerto Errado 2 (30 MW, Spain)
• Lanzhou Dancheng Dunhuang (50 MW, China)
• eLlo Solar Thermal Project (Llo) (9 MW, France)
Parabolic dish
Parabolic dish is the least commercialized CSP technology, with just 3 MW of installed capacity
worldwide. Despite having the highest optical efficiency within CSP technologies, there is very little
research to further improve this technology. The main reason why this technology has low commercial
investment while it has a good overall performance is the lack of storage, making it difficult to reduce
the higher costs and risks of the technology. Therefore, it is not able to compete with other CSP
technologies or photovoltaic.
It comprises a main parabolic dish and a Stirling engine or a micro-turbine, which are heat-to-electricity
engines, located at the focal point. It is based on a two-axis solar tracking system, which concentrates
the solar energy onto a receiver positioned at the focal point of the dish (Figure 8). Having most of the
system moving, due to the tracking system, and a direct production of electricity with the Stirling
engine, it is not possible to integrate thermal storage into the system, making the overall investment
price too high to compete directly with a photovoltaic system.
Figure 8. Parabolic dish plant (Source: European Solar Thermal Electricity Association ESTELA, www.estelasolar.org)
There are only two plants built worldwide with just 3 MW of capacity but they are currently in a non-
operational state:
• Maricopa Solar Project (Non-Operational, 1.5 MW, US)
• Tooele Army Depot (Non-Operational, 1.5 MW, US)
A possible use of this technology is at small scale, as a source of heat in community kitchens and other
service or small industry facilities in countries such as India.
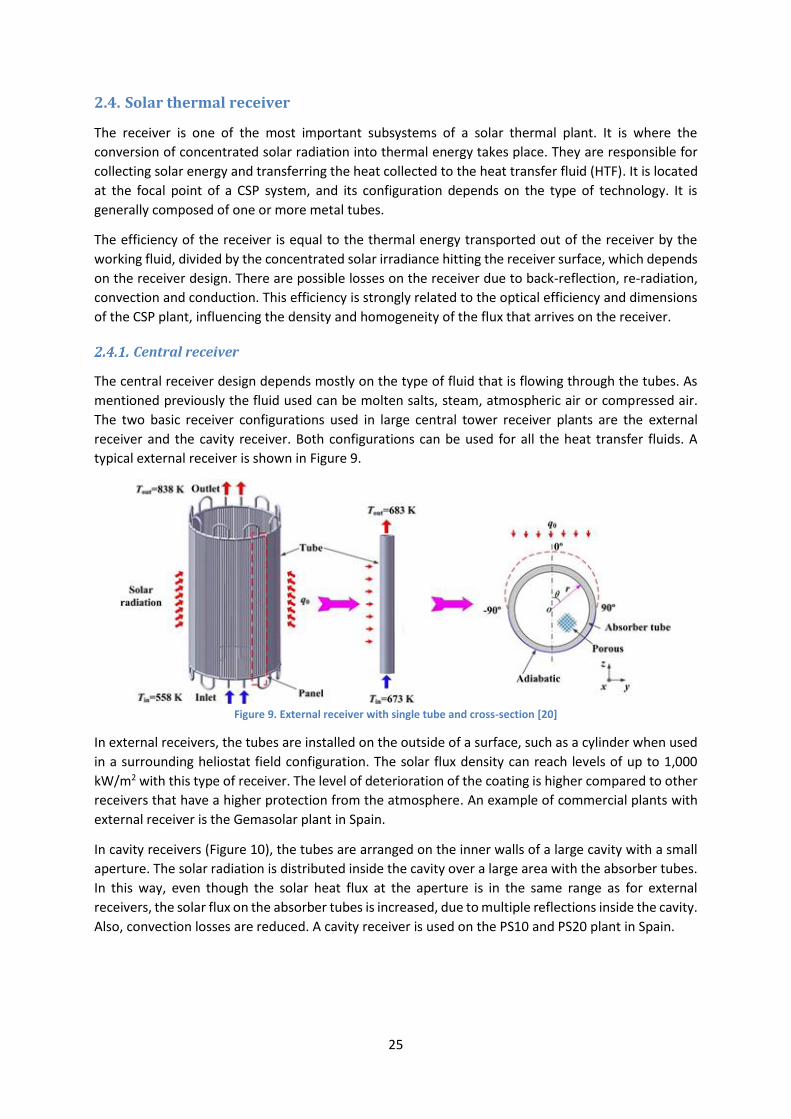
25
2.4. Solar thermal receiver
The receiver is one of the most important subsystems of a solar thermal plant. It is where the
conversion of concentrated solar radiation into thermal energy takes place. They are responsible for
collecting solar energy and transferring the heat collected to the heat transfer fluid (HTF). It is located
at the focal point of a CSP system, and its configuration depends on the type of technology. It is
generally composed of one or more metal tubes.
The efficiency of the receiver is equal to the thermal energy transported out of the receiver by the
working fluid, divided by the concentrated solar irradiance hitting the receiver surface, which depends
on the receiver design. There are possible losses on the receiver due to back-reflection, re-radiation,
convection and conduction. This efficiency is strongly related to the optical efficiency and dimensions
of the CSP plant, influencing the density and homogeneity of the flux that arrives on the receiver.
Central receiver
The central receiver design depends mostly on the type of fluid that is flowing through the tubes. As
mentioned previously the fluid used can be molten salts, steam, atmospheric air or compressed air.
The two basic receiver configurations used in large central tower receiver plants are the external
receiver and the cavity receiver. Both configurations can be used for all the heat transfer fluids. A
typical external receiver is shown in Figure 9.
Figure 9. External receiver with single tube and cross-section [20]
In external receivers, the tubes are installed on the outside of a surface, such as a cylinder when used
in a surrounding heliostat field configuration. The solar flux density can reach levels of up to 1,000
kW/m2 with this type of receiver. The level of deterioration of the coating is higher compared to other
receivers that have a higher protection from the atmosphere. An example of commercial plants with
external receiver is the Gemasolar plant in Spain.
In cavity receivers (Figure 10), the tubes are arranged on the inner walls of a large cavity with a small
aperture. The solar radiation is distributed inside the cavity over a large area with the absorber tubes.
In this way, even though the solar heat flux at the aperture is in the same range as for external
receivers, the solar flux on the absorber tubes is increased, due to multiple reflections inside the cavity.
Also, convection losses are reduced. A cavity receiver is used on the PS10 and PS20 plant in Spain.

26
Figure 10. Cavity receiver for solar tower plant [21]
For air receivers, volumetric absorbers are a possible option, which is still under research and
development. These absorbers are structures with high open porosity, mostly made of ceramic
materials (Figure 11). The solar radiation penetrates into the volume of the absorber, and is then
transferred to an airflow passing through the open structure. The receivers can be operated at both
ambient pressure or in pressurized mode, by closing the receiver aperture with a quartz window. Small
systems may use this type of receiver.
Figure 11. An example of porous media used for volumetric absorbers [22]
Central receivers are large compared to other CSP receivers, which produces significant heat losses,
especially with the external and open-air types. These losses impose restrictions on the working
temperature of this type of plant, in addition to the optical concentration limitations.
Parabolic trough linear receiver
In parabolic trough systems, the receiver tube works under vacuum conditions. The key components
in this type of heat collector element are the metallic tube material, the selective absorber and the
outer glass tube, to maintain the tube under vacuum conditions. The selective absorber is the main
element responsible for the optical and thermal efficiency of a receiver tube. The thermal losses of the
receiver tube are: partly conductive and convective, the latter being reduced in a vacuum
environment; mostly radiative, the latter being minimized by the low thermal emittance of the
selective absorber.
The use of evacuated tubes on this type of CSP plant is mandatory, considering the large surface of
absorbers (several tens of kilometers), the relatively high operating temperature (350-390°C) and the
low concentration ratio (typically 80 suns). Not having the receiver under vacuum conditions would
have a significant negative impact on the performance of the receiver (due to high thermal losses not
being compensated by sufficient concentrated solar input) and therefore of the plant compared to
other types of CSP plants.
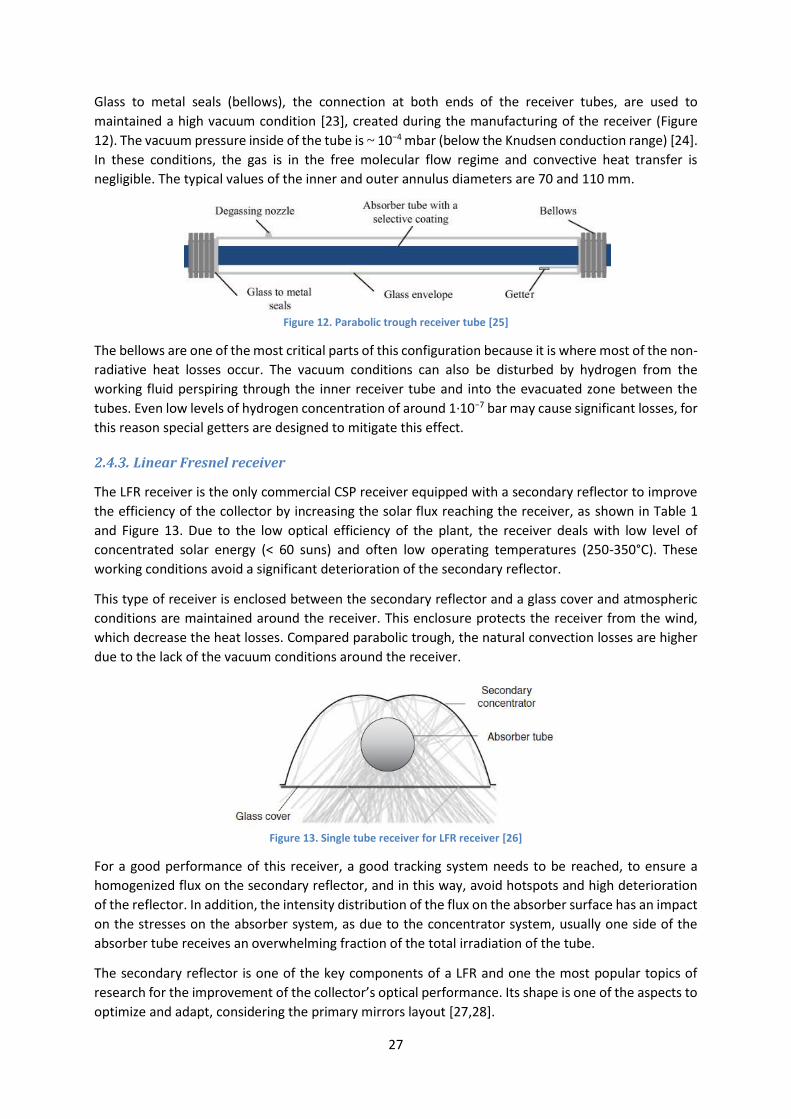
27
Glass to metal seals (bellows), the connection at both ends of the receiver tubes, are used to
maintained a high vacuum condition [23], created during the manufacturing of the receiver (Figure
12). The vacuum pressure inside of the tube is ~ 10−4 mbar (below the Knudsen conduction range) [24].
In these conditions, the gas is in the free molecular flow regime and convective heat transfer is
negligible. The typical values of the inner and outer annulus diameters are 70 and 110 mm.
Figure 12. Parabolic trough receiver tube [25]
The bellows are one of the most critical parts of this configuration because it is where most of the non-
radiative heat losses occur. The vacuum conditions can also be disturbed by hydrogen from the
working fluid perspiring through the inner receiver tube and into the evacuated zone between the
tubes. Even low levels of hydrogen concentration of around 1·10−7 bar may cause significant losses, for
this reason special getters are designed to mitigate this effect.
Linear Fresnel receiver
The LFR receiver is the only commercial CSP receiver equipped with a secondary reflector to improve
the efficiency of the collector by increasing the solar flux reaching the receiver, as shown in Table 1
and Figure 13. Due to the low optical efficiency of the plant, the receiver deals with low level of
concentrated solar energy (< 60 suns) and often low operating temperatures (250-350°C). These
working conditions avoid a significant deterioration of the secondary reflector.
This type of receiver is enclosed between the secondary reflector and a glass cover and atmospheric
conditions are maintained around the receiver. This enclosure protects the receiver from the wind,
which decrease the heat losses. Compared parabolic trough, the natural convection losses are higher
due to the lack of the vacuum conditions around the receiver.
Figure 13. Single tube receiver for LFR receiver [26]
For a good performance of this receiver, a good tracking system needs to be reached, to ensure a
homogenized flux on the secondary reflector, and in this way, avoid hotspots and high deterioration
of the reflector. In addition, the intensity distribution of the flux on the absorber surface has an impact
on the stresses on the absorber system, as due to the concentrator system, usually one side of the
absorber tube receives an overwhelming fraction of the total irradiation of the tube.
The secondary reflector is one of the key components of a LFR and one the most popular topics of
research for the improvement of the collector’s optical performance. Its shape is one of the aspects to
optimize and adapt, considering the primary mirrors layout [27,28].
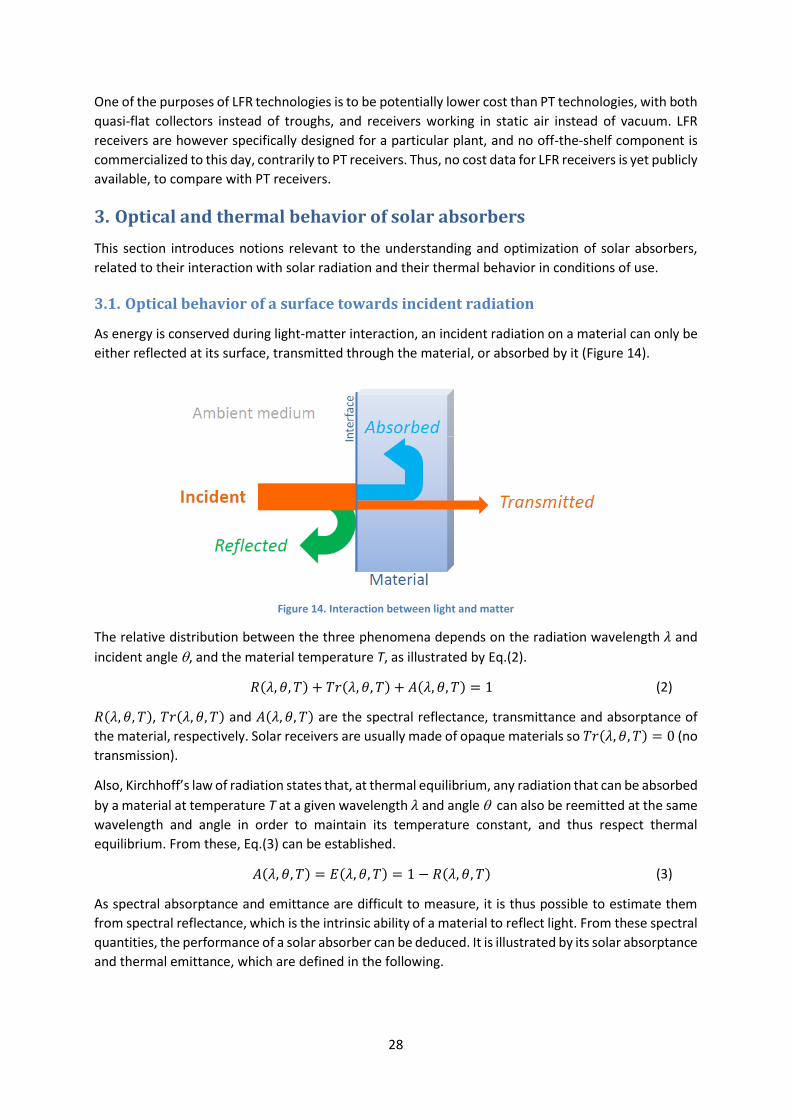
28
One of the purposes of LFR technologies is to be potentially lower cost than PT technologies, with both
quasi-flat collectors instead of troughs, and receivers working in static air instead of vacuum. LFR
receivers are however specifically designed for a particular plant, and no off-the-shelf component is
commercialized to this day, contrarily to PT receivers. Thus, no cost data for LFR receivers is yet publicly
available, to compare with PT receivers.
3. Optical and thermal behavior of solar absorbers
This section introduces notions relevant to the understanding and optimization of solar absorbers,
related to their interaction with solar radiation and their thermal behavior in conditions of use.
3.1. Optical behavior of a surface towards incident radiation
As energy is conserved during light-matter interaction, an incident radiation on a material can only be
either reflected at its surface, transmitted through the material, or absorbed by it (Figure 14).
Figure 14. Interaction between light and matter
The relative distribution between the three phenomena depends on the radiation wavelength 𝜆 and
incident angle , and the material temperature T, as illustrated by Eq.(2).
𝑅(𝜆, 𝜃, 𝑇) + 𝑇𝑟(𝜆, 𝜃, 𝑇) + 𝐴(𝜆, 𝜃, 𝑇) = 1 (2)
𝑅(𝜆, 𝜃, 𝑇), 𝑇𝑟(𝜆, 𝜃, 𝑇) and 𝐴(𝜆, 𝜃, 𝑇) are the spectral reflectance, transmittance and absorptance of
the material, respectively. Solar receivers are usually made of opaque materials so 𝑇𝑟(𝜆, 𝜃, 𝑇) = 0 (no
transmission).
Also, Kirchhoff’s law of radiation states that, at thermal equilibrium, any radiation that can be absorbed
by a material at temperature T at a given wavelength 𝜆 and angle can also be reemitted at the same
wavelength and angle in order to maintain its temperature constant, and thus respect thermal
equilibrium. From these, Eq.(3) can be established.
𝐴(𝜆, 𝜃, 𝑇) = 𝐸(𝜆, 𝜃, 𝑇) = 1 − 𝑅(𝜆, 𝜃, 𝑇) (3)
As spectral absorptance and emittance are difficult to measure, it is thus possible to estimate them
from spectral reflectance, which is the intrinsic ability of a material to reflect light. From these spectral
quantities, the performance of a solar absorber can be deduced. It is illustrated by its solar absorptance
and thermal emittance, which are defined in the following.

29
3.2. Absorption of solar radiation
Solar radiation incident on the absorber
The solar radiation or sunlight is a fraction of the electromagnetic spectrum, which is emitted by the
Sun. Most of the incoming radiation from the Sun reaching the top of the Earth’s atmosphere is
absorbed or scattered far up in the ionosphere, the ozone layer or the troposphere. The solar
irradiation that reaches the surface of the Earth varies due to atmospheric scattering and absorbing
components (cloud cover, aerosol content, ozone layer conditions, time of day, Earth/Sun distance,
etc.) which influence the path of the rays that traverse the atmosphere.
Depending on their latitude, a different air mass (AM) value is attributed to each site (Figure 15). The
AM illustrates the direct optical path length through the atmosphere, expressed as a relative ratio to
the path length at the zenith.
Figure 15. Air Mass (AM) changing with the zenith angle [29]
The amount of solar spectral irradiance that reaches the surface of the Earth is commonly defined for
specific atmospheric standard conditions of an absolute air mass of 1.5 and a sun-facing surface tilted
at 37°, as calculated by the American Society for Testing and Materials using SMARTS-2 software [30].
This is known as the ASTM G173-03 AM1.5 standard solar spectrum [31]. Figure 16 shows the
corresponding extraterrestrial spectral irradiance (AM0) and the Global Tilt (GT) and Direct +
Circumsolar (DC) spectral irradiance on the 37° sun-facing tilted surface, at AM1.5, for each wavelength
in nanometers (nm) [32].
The extraterrestrial spectral irradiance shows the solar radiation received at the top of the Earth’s
atmosphere. As it passes through no atmosphere, it is at Air Mass 0 (AM0). The global tilt spectral
irradiance is a measure of the density of the available solar resource per unit area considering both
the direct (+ circumsolar) and diffuse solar radiations. The direct + circumsolar irradiance is the
radiation that comes from the Sun disc and its corona through the atmosphere without getting
scattered. The diffuse irradiance is the solar radiation scattered by the particles and molecules in the
atmosphere, but still makes it down to the Earth’s surface. The Direct + Circumsolar (DC) is the relevant
irradiance to consider for the concentration of solar energy, as only these parallel sun rays can be
reflected by the mirrors towards the receiver.

30
Figure 16. ASTM G173-03 Solar Reference Spectra [31]
The DC solar spectrum ranges from the ultraviolet to the infrared, mostly between 0.28 and 2.5 μm
(Figure 16). The radiation coming from the Sun has a small amount of ultraviolet radiation (3% of the
total solar radiation occurs between 0.28 and 0.4 μm); a higher amount of visible light (42% of the solar
radiation is emitted between 0.4 and 0.7 μm); a large amount of infrared radiation (55% is emitted
between 0.7 and 4 μm).
The total amount of solar radiation I (W/m²) in a given location is obtained by integrating the solar
spectral irradiance G() (W/m²/nm) in this region over its wavelength range (1 , 2), as shown in Eq.(4).
𝐼 = ∫ 𝐺(𝜆) ∙ 𝑑𝜆𝜆1
𝜆2
(4)
As an example, integrating between 0.25 μm and 4 μm (with a step of 5 nm) and considering the solar
spectrum ASTM G173-03 AM1.5 DC, the total amount of solar radiation is 901.26 W/m².
Solar absorptance
The solar absorptance αS is the fraction of incident solar radiation that is actually absorbed by a
material. The incident solar flux density (in W/m²) can be obtained by integrating the solar spectrum
𝐺(𝜆) (in W/m²/nm) over wavelength (Eq.(5)). The flux density that is actually absorbed by the material
is obtained by weighting the spectral solar irradiance 𝐺(𝜆) with the hemispherical spectral
absorptance 𝐴(𝜆,∩, 𝑇) of the material at each wavelength 𝜆, and then integrate it over wavelength in
the solar range as well. The following expression is obtained for solar absorptance, which is a total
value (i.e., independent of wavelength) comprised between zero (no absorption) and one (maximum
absorption) and has no unit.
𝛼𝑆 =∫ [1 − 𝑅(𝜆)]
λ2
λ1 ∙ 𝐺(𝜆) ∙ 𝑑𝜆
∫ 𝐺(𝜆) ∙ 𝑑𝜆λ2
λ1
(5)
Eq.(3) (p.28) implies that hemispherical spectral absorptance 𝐴(𝜆,∩, 𝑇) is considered to be equal to
[1 − 𝑅(𝜆,∩, 𝑇)], which is the near-normal (𝜃𝑖 = 8°) hemispherical spectral reflectance of the sample
measured at room temperature 𝑇𝑎 (see Chapter 3 for more details). Therefore, a good solar
absorptance is associated with a low reflectance in the range of the solar spectrum. 𝐺(𝜆) is taken as
the standard solar irradiance spectrum for CSP (ASTM-G173 AM1.5 direct + circumsolar) [31]. The
boundary wavelengths are 1 = 0.25 µm and 2 = 2.5 µm in this study.
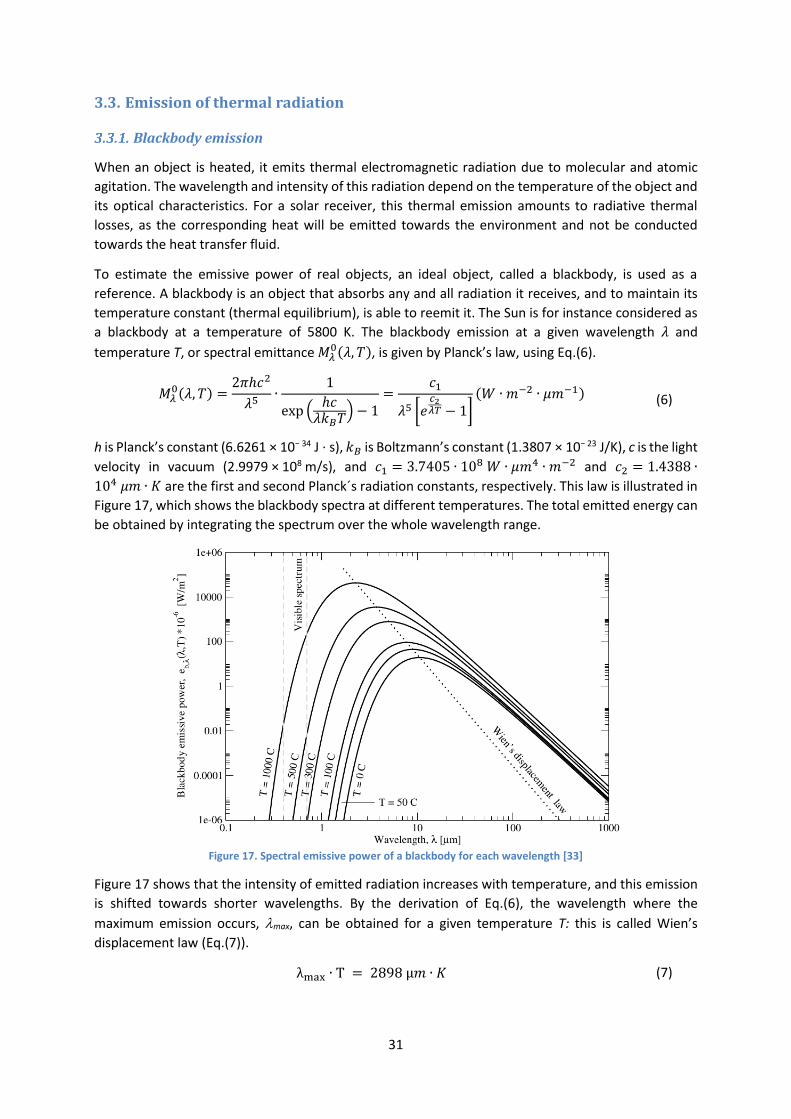
31
3.3. Emission of thermal radiation
Blackbody emission
When an object is heated, it emits thermal electromagnetic radiation due to molecular and atomic
agitation. The wavelength and intensity of this radiation depend on the temperature of the object and
its optical characteristics. For a solar receiver, this thermal emission amounts to radiative thermal
losses, as the corresponding heat will be emitted towards the environment and not be conducted
towards the heat transfer fluid.
To estimate the emissive power of real objects, an ideal object, called a blackbody, is used as a
reference. A blackbody is an object that absorbs any and all radiation it receives, and to maintain its
temperature constant (thermal equilibrium), is able to reemit it. The Sun is for instance considered as
a blackbody at a temperature of 5800 K. The blackbody emission at a given wavelength 𝜆 and
temperature T, or spectral emittance 𝑀𝜆0(𝜆, 𝑇), is given by Planck’s law, using Eq.(6).
𝑀𝜆0(𝜆, 𝑇) =
2𝜋ℎ𝑐2
𝜆5∙
1
exp (ℎ𝑐
𝜆𝑘𝐵𝑇) − 1
=𝑐1
𝜆5 [𝑒𝑐2𝜆𝑇 − 1]
(𝑊 ∙ 𝑚−2 ∙ 𝜇𝑚−1) (6)
h is Planck’s constant (6.6261 × 10− 34 J · s), 𝑘𝐵 is Boltzmann’s constant (1.3807 × 10− 23 J/K), c is the light
velocity in vacuum (2.9979 × 10⁸ m/s), and 𝑐1 = 3.7405 ∙ 108 𝑊 ∙ 𝜇𝑚4 ∙ 𝑚−2 and 𝑐2 = 1.4388 ∙
104 𝜇𝑚 ∙ 𝐾 are the first and second Planck´s radiation constants, respectively. This law is illustrated in
Figure 17, which shows the blackbody spectra at different temperatures. The total emitted energy can
be obtained by integrating the spectrum over the whole wavelength range.
Figure 17. Spectral emissive power of a blackbody for each wavelength [33]
Figure 17 shows that the intensity of emitted radiation increases with temperature, and this emission
is shifted towards shorter wavelengths. By the derivation of Eq.(6), the wavelength where the
maximum emission occurs, max, can be obtained for a given temperature T: this is called Wien’s
displacement law (Eq.(7)).
λmax ∙ T = 2898 µ𝑚 ∙ 𝐾 (7)

32
The solar radiation (5800 K) is for instance centered in the visible region (hashed in Figure 17). For
ambient temperatures (around 300 K), the radiation is centered in the infrared region. For the case of
800 K of temperature, the radiation is centered between the infrared and visible region. The higher
the temperature the closest is the center to the visible region.
Eq.(6) can be integrated over wavelength to obtain the total emissive power of a blackbody, resulting
in the Stefan-Boltzmann law (Eq.(8)) that gives the hemispherical total emitted energy for a blackbody
at temperature T per unit area in all directions and all wavelengths.
𝑀(𝑇) = ∫ 𝑀𝜆0(𝜆, 𝑇)
∞
0
= 𝜎𝑇4 (8)
𝜎 = 5.6696 ∙ 10−8 𝑊 ∙ 𝑚2 ∙ 𝐾−4 is the Stefan-Boltzmann constant.
Thermal emittance
Thermal emittance is used to characterize the optical properties of a real body in the infrared
wavelength range as compared with an ideal blackbody. Thermal emittance can be defined as the
fraction of radiant flux density (in W/m²) actually emitted by a material at temperature T, compared
with the radiant flux density that would be emitted by a blackbody at the same temperature. The latter
part is given by Stefan-Boltzmann law, i.e., the integration of Planck’s law (blackbody spectral
emittance 𝑀𝜆0(𝜆, 𝑇) in W/m²/μm) over wavelength. The former part is obtained by weighting the
blackbody spectral emittance 𝑀𝜆0(𝜆, 𝑇) with the spectral emittance of the material 𝐸(𝜆, 𝜃, 𝑇) = 1 −
𝑅(𝜆, 𝜃, 𝑇) (Kirchhoff's law) and integrate it over wavelength, as shown in Eq.(9).
𝜀𝜃(𝑇) =∫ [1 − 𝑅(𝜆, 𝜃, 𝑇)]
𝜆2
𝜆1 ∙ 𝑀𝜆
0(𝜆, 𝑇) ∙ 𝑑𝜆
∫ 𝑀𝜆0(𝜆, 𝑇) ∙ 𝑑𝜆
𝜆2
𝜆1
(9)
Spectral emittance 𝐸(𝜆, 𝜃, 𝑇) and reflectance 𝑅(𝜆, 𝜃, 𝑇) depend on the emission/reflection angle 𝜃,
therefore 𝜀𝜃(𝑇) is the total directional thermal emittance of a material at temperature T and angle 𝜃.
Since radiation can be emitted in all directions, another quantity of interest is the hemispherical
thermal emittance 𝜀𝐻(𝑇). It is calculated by angularly integrating directional thermal emittance
𝜀𝜃(𝜃, 𝑇) at different angles, as shown in Eq.(10).
𝜀𝐻(𝑇) = 2 ∙ ∫ 𝜀𝜃(𝜃, 𝑇) ∙ sin 𝜃 ∙ cos 𝜃 ∙ 𝑑𝜃𝜋/2
0
(10)
This value represents the propensity of a surface illuminated from all directions of the hemisphere
surrounding it to emit radiation in the same hemisphere.
In our case, it was previously measured and as found rather close to the near-normal (𝜃 = 10°)
emittance value, with a relative deviation of 2–3% [34].
Eq.(10) shows the dependence with temperature. One assumes that 𝐸(𝜆, 𝜃, 𝑇) = 1 − 𝑅(𝜆, 𝜃, 𝑇), so
ideally reflectance should be measured at temperature T to estimate 𝜀𝜃(𝜃, 𝑇). For practical reasons
however, reflectance is more often measured at ambient temperature Ta. This requires the assumption
that 𝑅(𝜆, 𝜃, 𝑇) = 𝑅(𝜆, 𝑇𝑎 , 𝜃). This assumption is not always met, but in our case leads to a good
approximation of the real emittance at high temperature, at least up to 500°C [34,35].

33
3.4. Optical performance of solar absorbers
Principle of solar spectral selectivity
On one hand, a good solar receiver should be able to efficiently capture the solar radiation, in order to
transmit the highest amount of energy possible to the heat transfer fluid. In other words, its absorption
should be high for wavelengths in the solar range (0.28 - 4 μm).
On the other hand, when reaching a high temperature, due to its absorption of the solar irradiance
and subsequent heating, the solar receiver should emit as little thermal radiation as possible, in order
to limit radiative losses towards the ambient environment. Thus, its emission should be low for
wavelengths in the infrared (thermal) range.
Therefore, at a given wavelength, high spectral absorptance and low spectral emittance are
incompatible, and one must be preferred over the other. Therefore, a good solar receiver must ideally
be spectrally selective, i.e., present a different optical behavior depending on the wavelength range:
high absorption in the solar range, low emission (low absorption) in the infrared range.
Figure 18 shows the solar irradiance spectrum (ASTM G173-03 AM1.5 Direct + Circumsolar [31]) and
blackbody radiation spectra at 100°C, 300°C, 500°C and 800°C (given by Planck´s law, Eq.(6)), all
normalized to 1, and the ideal solar selective reflectance spectrum for a temperature of 500°C.
Figure 18. Solar spectrum (yellow), blackbody at 100°C, 300°C, 500°C and 800°C spectra and reflectance spectrum for an
ideal selective coating working at 500°C (green)
As in the near infrared range, the solar and blackbody irradiance spectra tend to overlap, the optical
behavior of an ideal receiver must switch as drastically as possible from high absorption (low
reflectance) to low emission (high reflectance) in that spectral range. The position of this switch, or
cut-off wavelength, depends on the receiver temperature. For low operating temperatures T ˂ 100°C,
the ideal absorption cut-off may be placed anywhere in the 2 to 4 μm region, since thermal emission
is low and happens mainly beyond the solar range, so that there is very little or any overlap. Therefore,
it is easier to create a surface that absorbs the maximum possible of the incident solar radiation, but
does not re-emit the absorbed energy for such temperatures. For higher temperatures, this
overlapping occurs at lower wavelength, depending on the temperature (Figure 18). The transition in
the ideal case must therefore be placed at a lower position, typically between 1.5 and 2 μm.

34
Heliothermal efficiency
The efficiency of a solar absorber is illustrated by its solar-to-heat conversion efficiency, or
heliothermal efficiency, 𝜂(𝑇). The heliothermal efficiency of an absorbing surface is equal to the ratio
of the net radiative energy absorbed by the surface (i.e., absorbed − emitted) to the radiative energy
received from the concentrating mirrors (Eq.(11)).
𝜂 (𝑇) =absorbed − emitted
incident=
𝛼𝑆 ∙ C ∙ I ∙ 𝜂𝑜𝑝𝑡 − 𝜀(𝑇) ∙ 𝜎 ∙ (𝑇4 − 𝑇04)
C ∙ I ∙ 𝜂𝑜𝑝𝑡
= 𝛼𝑆 −𝜀(𝑇) ∙ 𝜎 ∙ (𝑇4 − 𝑇0
4)
C ∙ I ∙ 𝜂𝑜𝑝𝑡
(11)
S is the solar absorptance, (T) is the thermal emittance at temperature T (measured at 8°). C is the
concentration ratio, I is the incident solar flux density, is Stefan-Boltzmann’s constant, T is the surface
temperature (K) and T0 (K) is the ambient temperature. opt is the optical efficiency of the concentrating
mirrors. The values used to calculate the heliothermal efficiency were the same for the different types
of samples studied in this work. These values are shown in Table 2.
Table 2. Value of the parameters used for the heliothermal efficiency
Parameter Value
I 1000 W/m²
C 100
opt 1
T 500°C
T0 25°C
5.67·10-8 W/m²/K4
The absorbed energy depends on solar absorptance and incident concentrated solar flux (W/m2) (𝛼𝑆 ∙
C ∙ I ∙ 𝜂𝑜𝑝𝑡). Thermal losses are considered to be only radiative and are given by Stefan-Boltzmann law,
which takes into account the temperature of the absorber (T) and its thermal emittance ε(T).
Convective and conductive losses are neglected, radiative losses being much higher.
By deriving Eq.(11), the sensitivity of heliothermal efficiency to the solar absorptance and thermal
emittance of the absorber can be quantified for given incident flux and absorber temperature. For
example, using parabolic trough conditions, with an incident flux Qsol of 100 kWꞏm−2 (Qsol = CꞏIꞏ opt
with C = 100, I = 1000 W/m², opt = 1) and a coating temperature of 400°C (Eq.(12)):
𝜕𝜂(𝑇)𝑐𝑜𝑎𝑡𝑖𝑛𝑔
𝜕𝛼𝑆= 1 ;
𝜕𝜂(𝑇)𝑐𝑜𝑎𝑡𝑖𝑛𝑔
𝜕𝜀(𝑇)=
−𝜎𝑇4
𝑄𝑠𝑜𝑙= −0.116 (12)
It can be seen that the heliothermal efficiency of the coating is much more sensitive to the variation
of its solar absorptance than to the variation of emittance. Indeed, when solar absorptance increases
by 1%, heliothermal efficiency also increases by 1%, whatever the operating conditions (𝜕𝛼𝑆 =
𝜕𝜂(𝑇)). Meanwhile, a decrease of 8.6% in thermal emittance is necessary to obtain the same increase
of 1% in heliothermal efficiency (𝜕𝜀(𝑇) = − 𝜕𝜂(𝑇) 0.116⁄ = −0.01/0.116). For a solar flux of 500
kW/m2 and a surface temperature of 650°C (e.g. solar towers), the sensitivity to emittance is -0.082.
Therefore, for these conditions, increasing solar absorptance by 1% has the same impact on
heliothermal efficiency as reducing thermal emittance by 12.2%. At this higher temperature, even
though radiative losses are higher, the absorbed solar flux is much higher due to high concentration,
and losses have a lesser impact on efficiency.

35
Heliothermal efficiency is the most relevant parameter to design and evaluate solar absorbers, as it
not only takes into account their intrinsic optical properties, i.e., solar absorptance and thermal
emittance, but also the CSP operating conditions in which they will be used. Therefore, in this
manuscript, solar absorptance, thermal emittance and heliothermal efficiency will systematically be
followed as performance parameters.
The existing structures of solar selective absorbers are explained in the following section, where their
principle and behavior are discussed.
4. Solar selective absorbers
4.1. Types of solar selective absorbers
Solar absorbers are usually based on a metal or alloy structure. These materials are chosen for their
durability at high temperatures in contact with potentially corrosive heat transfer fluids. Another
advantage of these materials is that they conduct heat very easily, because they have electrons free
to move through their crystalline structure, and the electrical field of the incoming solar radiation
drives these electrons to oscillate and dissipate (transfer) heat. The most common materials used for
high temperature receivers are stainless steels and Inconel (nickel-based alloy). For low temperature
receivers, copper can also be used.
In the case of a shiny metal surface, little of the incoming radiant energy is absorbed as heat however,
as it is mostly reflected. This reflection can be minimized by treating the surface of the metal. One of
the simplest ways is to paint the metal surface black, so both light and heat are absorbed, and the
surface gets warmer than a white or shiny surface. This is called a solar absorber, where a metallic
surface is coated with a high-temperature paint that increases the solar absorption levels up to 95%.
This type of configuration is very mature and it has been improved over recent years, creating a durable
coating that can be used in solar receivers working under atmospheric conditions and at temperatures
higher than 500°C. Another important aspect of these solar absorbers is their high emittance reaching
levels similar to that of absorptance. The emittance is an important factor when considering the overall
performance of the absorber, following Eq.(11)). Indeed, high emittance will cause high radiative
thermal losses and a reduced heliothermal efficiency.
To obtain metal surfaces with a low emittance while maintaining a high absorptance level, a material
with spectrally selective properties can be added, creating what is called a solar selective absorber.
This type of absorber has the property of absorbing as much as possible of the incident sunlight in the
solar spectrum range and emitting as little thermal radiation as possible in the infrared region.
There are no natural materials with intrinsic selective properties that can be used as efficient selective
absorbers. To create such absorbers, transition metal compounds and semiconductors have been
found to act as selective materials. In most cases, absorbers with selective properties are obtained by
adding several thin layers of different materials to the metallic surface, normally layers of different
materials and compositions, to vary the complex refractive index between the layers, and in this way
increase the solar absorption of the surface. To be able to decrease the emittance value of the surface,
an infrared reflective layer is added between the stack and the substrate, which is in most cases also a
metal. The design of solar absorber coatings is optimized taking into account two important
parameters, intrinsic to each type of material used, called its optical constants, the extinction
coefficient, k, and the refractive index, n.

36
A general structure of a solar selective absorber is normally based on three principal layers (Figure 19).
The main layer is the absorptive layer, which aims at absorbing the highest amount of the incoming
radiation. An infrared reflective sublayer is often added between the absorber layer and the receiver
(substrate), to block and collect backwards the radiation emitted by the hot receiver. In some cases, it
is also used to avoid having interdiffusion between the absorptive layer and the receiver. The topmost
layer is an antireflective layer. The main purpose of this layer is to improve the absorptance of the
absorptive layer by decreasing its reflection of the incoming solar radiation. In many cases, it also
protects the coating from oxidation, acting as a diffusion barrier against oxygen, especially when
working at atmospheric conditions. Each of these principal layers can in fact consist in an arrangement
of several thin layers.
Figure 19. General structure of a solar selective absorber
There are several possible mechanisms to trap the incoming solar radiation: intrinsic absorbers;
semiconductor-metallic layers; light trapping or textured absorbing surfaces; metal-dielectric
composite coatings; interference stacks (multilayer absorbers); and tandem absorbers.
The first step to take when designing a solar selective coating is to decide on the materials to be used,
normally alternating metals with dielectrics, metal-dielectric composites or metals with
semiconductors. Selective properties can also be obtained by texturing the surface. In the following
sections, the different types of selective coatings are explained in more details.
Intrinsic absorber
This is the simplest absorber configuration. It is not always considered to be a selective coating, due to
the lack of efficient selective properties in most cases but is classified as a solar absorber. One of the
simplest absorbers used since ancient times is achieved by covering the support surface (receiver) with
a black paint, as can be seen in Figure 20.
Figure 20. Structure of intrinsic absorber (left) and cross-section image of an as deposited intrinsic coating (SOLPHYCO)
(right) [36]
This type of absorber is ideally obtained by adding to the metal substrate a specific material, which has
intrinsic solar selective properties. It is not easy to find materials with natural intrinsic selective
absorption properties. Materials with these properties are transition metals and semiconductors, such
as W, TaC, TiC, MoO3-doped Mo, Si doped with B, CaF2, HfC, ZrB2, V2O5 and LaB6, as shown in most

37
selective coating reviews [37]. These types of materials were studied for the first time in the late 70s
and early 80s [38]. Thanks to the energy level gaps of semiconductor materials, they are appropriate
to absorb the photons of visible light. They absorb photons having energies greater than the band gap
as a result of raising the material’s valence electrons into the conduction band.
This type of coating has a low cost, especially due to the application method. It can be found in the
form of paints, making it easy to be applied on a surface. Solar selective paints are inspired by the well-
known highly absorptive, highly emissive, non-selective paint coating used in high temperature
receivers, called Pyromark® 2500. It is a silicone-based solar paint that can survive thousands of heating
and cooling cycles at temperatures between 600 and 1000°C. It has non-selective properties with high
solar absorptance of 0.96 and high thermal emittance of 0.8 at 800°C. This high emittance is
compensated by the high absorptance value when working under highly concentrated radiation, e.g.,
in solar towers. This type of coating is in fact the most used for solar tower plants and other receivers
working under atmospheric conditions. There are also paint coatings with spectral selectivity, which
combine the advantages of paints and maintains a moderate thermal emittance value around 0.55 at
77°C, called thickness insensitive spectrally selective (TISS) paint coatings [39], suitable for glazed and
unglazed solar absorbers working at low temperatures (< 100°C).
Textured surface
Textured surfaces have been investigated for micro- and nanotechnologies. It has been widely used in
photovoltaic technologies, mainly to improve the light absorption of solar cells. Various structures can
be used, such as nanometric pyramidal textures (Figure 21). Compared to flat surfaces, these
structures enhance light reflection and diffraction inside an intricate geometric shape created on the
surface, increasing its mean free path in the material and generating light trapping phenomena. The
solar absorptance of materials with high intrinsic absorption, i.e., bulk materials and substrates, or
absorber coatings, can thus be further increased by carving a texture at its surface. This allows very
high solar absorption [40], even in very thin materials, leading for instance to a price reduction of PV
panels [41–43]. Some examples of these structures are gratings [44–46], cavity arrays [47,48],
metamaterials [49,50] and nanoparticle arrays [51–53].
Figure 21. Textured coating structure (left) and microscopic image of a multilayered textured coating (right) [44]
The dimensions of the texturing can be microscopic or macroscopic, and light scattering can be
isotropic or anisotropic. The resulting absorption and emission are defined by the geometrical
parameters of the structure, such as the dimensions of the patterns (height/depth, distance), its
orientation and the layer thicknesses.
With this type of configuration, the absorptance can reach up to 0.99 for wavelengths below 1.0 μm
[54]. For instance, Barshilia et al. [55] show a nanometric multi-functional zinc oxide (ZnO) super-
hydrophobic layer, fabricated on a surface to improve the absorptance (αS = 0.97), also with good
water repellence and anti-reflection properties in the visible range. This coating was stable up to 450°C
in air and vacuum. In a paper by Sai et al. [56] a 2D surface grating with submicron holes is shown,

38
fabricated by fast atom beam etching with highly ordered porous alumina masks, demonstrating good
thermal stability at high temperatures (800°C) under vacuum conditions, with an absorptance value
over 0.85 and thermal emittance of 0.075 at 527°C. In [54], reactive sputter etching was used to texture
a silicon wafer. The texturing was made of pillars with diameters and spacing smaller than the visible
and near-infrared wavelengths and height comparable to these wavelengths. It showed an overall solar
absorptance of 0.85 and thermal emittance of about 0.25, due to multiphoton absorption processes
normally observed in thick Si crystals.
Bichotte et al. [44] (Figure 21, Figure 22) show a good example of diffractive periodic gratings, where
a TiAlN multilayer structure deposited on a textured substrate has been optimized and tested. This
work shows the improvement of the optical performance of the coating with the use of microtexturing,
with solar absorptance changing from 0.91 to 0.95 while thermal emittance at 550°C increases from
0.32 to 0.38, compared to the same flat absorber. Surface texturing leads to an absolute improvement
of the heliothermal efficiency from 1% to 3% depending on the solar power plant working conditions
(concentration ratio and temperature).
Figure 22. TiAlN multilayer coating structure with texturing: schematics (left) and efficiency gain (right) [44]
Overall, compared to more conventional solar absorber coatings, this type of textured surface is
however usually more fragile and easily oxidized, with a catastrophic influence on its lifetime [57].
Metal-dielectric composite (cermet)
Metal-dielectric composites for solar applications, also called cermets, are composite materials made
of nanosized metal particles embedded in a dielectric matrix, usually a porous oxide or other ceramics.
This type of material is designed to take advantage of the properties of ceramics, such as high
thermomechanical stability and good resistance to corrosion. The metal particles influence the optical
response of the ceramic host, creating an effective medium with strong absorption properties. This is
caused by Surface Plasmon Resonance (SPR) phenomena: the metal conduction electrons are excited
by incident solar radiation, generating an electric field at the surface of the metal nanoparticles, which
resonates with the electromagnetic field of the incident light. In cermets, these plasmons are localized
at the surface of the metallic nanoparticles in contact with the dielectric phase, due to their differences
in refractive index. These plasmons are thus called Localized Surface Plasmons (LSP) [58].
Good solar absorption can be obtained by finely adjusting the nature of constituents (e.g. for high
temperature applications, transition metals and refractory ceramics), the composite thickness, and its
metal particle concentration, size, shape and orientation. The metal volume fraction is usually below
the percolation threshold (typically < 20%) and the size of the metal particles is lower than 100 nm.

39
Cermets are thus considered to have great possibilities for solar thermal applications and are widely
used commercially on parabolic trough collectors, with strong absorption of the VIS and NIR radiation
and a good thermal stability at medium temperatures (~ 400°C) under vacuum conditions.
One of the ways to improve this type of absorber is to create a double cermet coating, with High and
Low Metal Volume Fraction cermet solar absorption layers, known as HMVF and LMVF, respectively.
It is often associated with a metal infrared-reflective bottom layer, whose function is to reflect the
thermal emission from the heated substrate, as the absorber layer is not always intrinsically selective.
Also a top antireflective (AR) layer with low refractive index can reduce the surface reflection
effectively [59] and is often added to the configuration to further improve the absorption performance.
In this configuration, shown in Figure 23, the refractive index and subsequent transmission towards
lower layers increase from surface to substrate, to better capture the incident solar light and favor its
absorption. Commonly, an optimization is done for layer thicknesses, number of layers and
composition of each layer.
Figure 23. Double cermet structure (1) and cross-section of an as-deposited double cermet coating (2) [60]
Granqvist and Niklasson [61] first proposed the use of cermet materials in solar selective absorbing
coatings in 1978. Many cermet absorbing coatings have been studied since, such as black Cr [62], Co-
Al2O3 [63], Ni–Al2O3 [64], Pt-Al2O3 [65–67], black Co [68], Mo-Al2O3 [69–72], etc. Zhang and Mills [73]
first proposed the double cermet absorption layer structure with a solar absorptance of 0.92 and a
thermal emittance of 0.05 at 300°C. Afterwards, such kinds of coatings were extensively reported, for
example Metal-AlN [74–76], Mo-SiO2 [77,78], Mo-Si3N4 [79], W-Al2O3 [80,81], W–SiC(N)H [82], Zr-ZrO2
[83], AlNi-Al2O3 [84], Ag-Al2O3 [85], NbTiON/SiON [60], Nb–NbN [86], black Ni [87], Nb–TiO2 [88] and a-
Si:C:H/Ti [89]. All these cermet examples have good solar absorptance ranging from 0.91 to 0.96 and
significantly low thermal emittance around 0.10 at temperatures from 350°C to 500°C.
There are also other interesting options, such as multi-scaled Si–Ge coating layers (Si0.8Ge0.2) in SiO2
[90], black oxide materials such as cobalt oxide (Co3O4) nanoparticles inserted in a SiO2 matrix [91] or
in a forest of copper oxide (CuO) nanowires [92].
One of the main disadvantages of this type of coating is the lack of high temperature durability in air
and its potential high emittance, which limits its development. It is nevertheless easier to fabricate
double cermet solar selective absorbing coatings than textured surfaces.
Multilayer absorber
Multilayer absorbers, also called multilayer interference stacks, or Dielectric-Metal-Dielectric (DMD)
absorbers [58] consist in alternating thin layers of transparent dielectric and semitransparent metallic
materials (Figure 24). This configuration uses multiple reflections between the layers to absorb light.
As for cermets, Surface Plasmon Resonance (SPR) phenomena can occur when the metal layer is
extremely thin. In DMD absorbers however, the metal particles are not separated by the dielectric
matrix as they constitute a continuous layer. Consequently, their conductive electrons are free to

40
oscillate collectively when excited by incident light, creating Surface Plasmon Polaritons (SPP) that
propagate as a wave along the interface between the metal and dielectric layers. SPPs are attenuated
and scattered, causing destructive interference with incident light. As a result, reflection is strongly
decreased and absorption is increased in the solar range, while the DMD is transparent in the thermal
infrared range. If an IR-reflective (metallic) bottom layer and/or substrate is used, providing low
emittance, a solar selective absorber coating is obtained.
Figure 24. Dielectric–metal-dielectric stack structure (left) and example of SiC:H/W/SiC:H DMD (right) [93]
By applying optical theory for multilayer systems [94] using computer modelling [95,96], the optical
properties of the multilayer design can be simulated and optimized, considering the candidate
materials and their optical constants. For instance, in the case of a W/SiC/W/SiC multilayer absorber
[93], the influence on simulated reflectance when adding each consecutive layer of the absorber is
shown in Figure 25. The best absorptance (lowest reflectance in the visible range) was clearly obtained
after adding the complete SiC/W/SiC multilayer absorber on top of the infrared reflective layer of
tungsten (brown line).
Figure 25. Spectral reflectance variation when adding consecutive layers to a W/SiC multilayer absorber [93]
Common dielectric materials used for multilayer absorbers are Al2O3, SiO2, AlN, CeO2, ZnS, MgF2, MgO,
HfO2, CrO2, TiO2, etc. and the metals used are classically Al, Mo, Ag, Cu, Cr, Ti, Ni, Au, Pt, Zr, etc. Other
multilayer absorber configurations using refractory metal silicides (TiSi, TiAlSi, etc.) in combination
with TiO2 or SiO2 were also proposed by Kennedy et al. for parabolic trough applications [97].
Many such absorbers have been developed for high temperature solar thermal conversion applications
[101–109] and cited in the literature for high temperature applications [99], as they are stable at
medium-high temperatures (≥ 400°C). Overall, these coatings have a better stability after annealing in
air compared to double cermet coatings [78]. A classic example is the AMA coating (Al2O3-Mo-Al2O3)
with αS = 0.92–0.95, ε(20°C) = 0.06–0.10 that shows a good thermal stability at 550°C in air [109].
Barshilia et al. [110] studied a multilayer absorber of AlxOy/Al/AlxOy deposited on copper showing
W infrared
reflective layer
SiC:H/W/SiC:H
DMD layer
Substrate

41
thermal stability up to 400°C with a significant drop of absorptance at 450°C, and better durability at
higher temperatures with a Mo substrate, especially in vacuum. Another interesting work from the
same research group was shown in [108] by Selvakumar et al. Their DMD stack of HfOx/Mo/HfO2 was
also tested with a copper substrate and maintained its high selectivity after 2 hours at 500°C in air. At
higher temperatures, there was a decrease in solar selectivity due to the formation of oxides. This
illustrates the difficulty of finding good thermal stability while maintaining satisfactory spectral
selectivity.
Also, multilayer absorbers are often fabricated by vacuum deposition techniques such as Physical
Vapor Deposition, and fabrication costs can be high. Some researchers instead adopt wet chemical
methods to reduce fabrication costs [111–113]. Chemical methods however lead to many structural
defects, for example, their purity and density are not controlled well enough. Chemical interactions
including oxidation and diffusion can consequently occur when high temperature is applied.
Overall, these disadvantages restrict the development of this kind of coating [114,115]. So far, to our
knowledge no successful long-term high temperature (≥ 400°C) durability trials for multilayer
absorbers have been recorded in the literature.
Tandem absorber
A tandem absorber is composed of two layers of materials with different optical behaviors: one
behaves like a metal and the other like a semiconductor. Semiconductors with band gaps of about 0.5–
1.5 eV and corresponding absorption edges from 0.8 to 2.5 μm will absorb the visible and near infrared
spectrum of solar radiation. Metals are highly reflective in the thermal infrared range.
The simplest configuration is the absorber-reflector or metal-semiconductor tandem, combining a
highly absorbing surface in the solar region (the semiconductor) and a highly reflecting surface in the
infrared (the metal). A dark mirror can be made by covering a base metal of high infrared reflectance
with a highly solar absorbing thin coating, or a heat mirror by covering an absorbing surface with a
solar transparent infrared reflective coating. Semiconductors of interest include Si (1.1 eV), Ge (0.7 eV)
and PbS (0.4 eV) [116–118].
More recently, transition metal oxides, nitrides and oxynitrides have successfully been used in tandem
absorbers. A gradient of refractive index is created in the tandem by varying the composition of the
two layers to obtain a metallic-like (higher N and/or O concentration and higher n) and semiconductor-
like (higher N and/or O concentration and lower n) optical behaviors. Thanks to the metallic-like nature
of the underlying component of the tandem (closest to the support metal), the use of an infrared
reflective underlayer is not always necessary. An antireflective top layer is often added on top of the
semiconductor-like upper layer of the tandem, to minimize optical losses. This way, the complete
tandem absorber coating (Figure 26) presents a decreasing gradient of refractive index from the
metallic substrate with high n towards air with n = 1.
Figure 26. Tandem absorber structure (left) and microscopic image of a tandem absorber coating (right) [119]
42
Due to their excellent oxidation resistance and thermal stability, these materials have high potential
as medium/high temperature solar selective absorber coatings. They are also known for their diffusion
barrier properties that can prevent the diffusion of elements of the support material inside the
absorber coating, a common source of degradation of optical performance, especially emittance. They
can also act as diffusion barriers for oxygen, preventing or limiting oxidation. They are therefore
suitable for high-temperature solar receivers operated in air [120].
Many such tandem configurations were reported in the literature, including TiAlN/TiAlN [119,121],
TiAlN/TiAlON [120,122–125], TiAlN/TiAlSiN [126], TiAlSiN/TiAlSiON [127], TiAlN/AlON [128],
TiAlC/TiAlCN/TiAlSiCN [129], HfMoN/HfON [130], NbTiON/NbTiON [60], AlSiN/AlSiON [80],
NbAlN/NbAlON [131] and CrMoN/CrON [132]. The most proven thermally stable tandem absorber
coatings are made by combining titanium and aluminum. TiAlNx/TiAlNy has demonstrated long-term
thermal stability at 500°C after 1,000 hours of isothermal treatment under static air conditions with a
αS equal to 0.91 and a ε(500°C) equal to 0.31 [121]. TiAlN/TiAlON has been shown to be stable up to
1,000 hours in air after cyclic heating from room temperature to 347°C (αS = 0.93, ε(500°C) = 0.07)
[125]. A coating comprised of TiAlCrN/TiAlN tandem absorber was also found with good optical
properties (αS = 0.91, ε = 0.07) and thermal stability up to 600°C in air after 4 hours [133]. In [60] a
NbTiON/SiON tandem absorber exhibited high absorptance of 0.95 and low emittance of 0.07 with
good thermal stability for 40 hours at 500°C under vacuum conditions.
Despite their diffusion barrier properties, metal diffusion from the substrate is one of the major
sources of degradation of optical performance for this type of absorber, since it can strongly modify
the composition/structure and refractive index gradients. A diffusion barrier layer can prevent metal
diffusion inside the coating [120].
4.2. Main commercial absorber configurations for medium-temperature CSP
plants
Most commercial CSP plants operate at medium temperatures, ranging from 250°C up to 400°C. This
temperature range correspond to both Parabolic Trough and Linear Fresnel collectors working with oil
as heat transfer fluid. The operating temperature limit is predicted to increase to levels of around
500°C with the development of Direct Steam Generation. Also, in the case of parabolic troughs, most
of the commercial receivers work under vacuum conditions inside a glass tube, as explained in section
2.4.2 p.26.
For these technologies at 250-400°C, cermet absorbers (Mo-Al2O3, W-Al2O3, etc.) are the most widely
used solar selective absorber coatings. The most common commercial cermets are: for mid-
temperatures, SS–C, SS–AlN, CrN–Cr2O3, TiNOx, a-C:H/Cr, Ni–NiO, etc.; for high-temperature
applications, Mo–SiO2, W–Al2O3, Mo–Al2O3, SS–AlN, W–AlN, Mo–AlN, etc. Nitto Kohki, Turbosun,
GRINM, Alanod Solar, Almeco-TiNOX, Ikarus Coatings, S-Solar, Archimede and Rioglass companies are
some examples of commercial coating manufacturers. The configuration, optical properties and
thermal stability limit of each commercial coating of the aforementioned companies is shown in Table
3.
Cermet coatings based on titanium oxynitrides as the absorbing layer are produced by a German
company named Almeco-TiNOX. They are deposited on aluminum, copper or stainless steel sheets by
PVD (electron beam vapor deposition and sputtering) [134]. A TiC diffusion barrier is deposited at the
bottom, to prevent metal atoms from entering the absorber layer at high temperatures. The top layer
is a protective and antireflective layer made of fused quartz, extremely hard and scratch-resistant. The
coatings are thermally stable in vacuum up to 400°C [135–137].

43
Table 3. Main commercial solar absorber coatings [135]
Application Company Country Products Absorber
materials
Solar
absorptance Emittance
Thermal stability
in vacuum Ref.
Low
temperature
solar thermal
Almeco-TiNOX Germany TiNOX® Ti oxynitrides 0.95±0.02 0.04±0.02 @ 100°C 400°C [134]
Alanod Solar Germany Mirosol® TS Metal oxide 0.95 0.05 @ 100°C - [138]
Asoluna
(ex S-Solar) Sweden
SunStrip
Lazerplate Graded Ni-NiO 0.95 0.05-0.08 @ 100°C 300°C [139,140]
TurboSun China _ SS-AlN 0.92-0.96 0.08-0.10 330-500°C -
GRINM China GRIST 70/90/42 _ 0.96 0.09 @ 400°C 400°C -
Medium/high
temperature
CSP
Rioglass Solar
Ex-Siemens Solel
Ex-SCHOTT
Spain
Israel
Germany
UVAC 70-7G
PTR 70-4G
W-Al2O3,
Mo-Al2O3
0.96
0.94 0.095 @ 400°C 350-500°C [141,142]
Angelantoni-ENEA
Archimede Italy
HCEOI-12 Oil
HCEMS-11 MS
HCESH-12 DSG
Mo-SiO2,
WN-AlN,
W-Al2O3
≥ 0.95 0.103 @ 600°C 580-600°C [143]
Another cermet composite coating based on SS-AlN is manufactured by TurboSun in China [74], this
type of configuration is widely used in low temperature solar collector tubes in China [144]. China is a
leader in the solar water collector market (87.5 GW installations) [145] with companies such as
TurboSun that had already produced 3.5 million U-shaped vacuum solar collectors by the end of 2011.
The SS–AlN coatings are deposited by magnetron sputtering [73,144,146]. The top layer of this cermet
coating is made from aluminum nitride that works as an antireflective layer. Their solar absorptance is
within the range of 0.94–0.95, emittance is within 0.12–0.14 at 350°C, and the coatings are thermally
stable in vacuum up to 500°C.
Another example is a multilayer coating with a nickel diffusion barrier layer, an absorbing layer of
graded Ni–NiO and an antireflective layer on aluminum sheets, manufactured for Sunstrip fins in
Sweden. It has been also developed for low temperature solar thermal applications. These commercial
solar absorber coatings have a high solar absorptance of 0.95 and a low thermal emittance of 0.05-
0.10 at 100°C [147,148].
The most standard commercial receiver tubes for Parabolic Trough collectors are manufactured by
Rioglass Solar, funded in 2007. It is nowadays the world leader in the development and production of
receiver tubes and mirrors, with the latest receiver tubes “UVAC 70-7G” (ex. Siemens-Solel) and “PTR
70-4G” (ex. Schott Solar) that guarantee solar absorptance higher than 0.95 and thermal emittance
lower than 0.10 at 400°C, for oil-based parabolic trough technology [141]. Rioglass acquired the
technology from Siemens/Solel, based on W-Al2O3 and Mo-Al2O3 with good thermal stability in the
range of 350/500°C under vacuum conditions [69,149]. Afterwards, Rioglass also signed an agreement
with Schott Solar in 2015 for the acquisition of its receiver business. Currently, Rioglass Solar has signed
a contract for the largest Parabolic Trough CSP project in the world.
Most of the previous commercial coatings have a thermal stability up to maximum level of 500°C under
vacuum conditions. It is difficult to find thermally stable coatings at higher temperature. One exception
is also a double cermet configuration, manufactured by Archimede in Italy for products “HCEMS-11
Molten Salts” and “HCESHS-12 Direct Steam Generation”, with an absorptance of 0.95 and an
emittance of 0.10-0.13 at 600°C [77,81,143,150–152]. This coating has been proven to withstand a
temperature of 600°C under vacuum conditions. As these commercial coatings are developed for and
tested under vacuum conditions in view of their application on PT receivers [153], there is a lack of
information on their thermal stability under atmospheric conditions. Thus they cannot be directly
envisaged for receivers intended to work in air, such as LFR and central tower technologies.

44
5. Conclusion
Global climate problems are principally caused by the increase of CO2 emissions due to human activity,
closely related to the combustion of fossil fuels. The high potential of concentrated solar power (CSP)
has been identified as an alternative to conventional electricity production, with more than 6 GWe
already installed worldwide. Four main CSP technologies exist, but parabolic trough and solar towers
represent the almost entirety of the installed capacity. Different types of solar receivers are used
depending on the technology, but their ideal optical and thermal behavior is similar: high solar
absorptance, low thermal emittance in the infrared, resulting in high solar-to-heat conversion
(heliothermal) efficiency are the main performance parameters for solar absorbers. To achieve this,
they must present a spectral selectivity, with high spectral reflectance in the solar range and low
reflectance in the infrared range. These characteristics can be obtained using different types of solar
selective absorbers, in the form of surface treatments or coatings on metallic pipes, from the simplest
configuration to more complex and optimized configurations: multilayer, cermet and tandem
absorbers. Solar selective absorbers have been intensively studied in the past ten years. Great
improvements have been attained on the optimization of coatings, reaching very high solar
absorptance, between 0.95 and 0.96, and low emittance levels of 0.10 at 400°C. Some of these
configurations are found in commercial CSP plants.
Nonetheless, the durability of such coatings during the lifetime of the plant, around 25 years, has not
yet been demonstrated, although it is of vital importance for the deployment of CSP technologies. This
thesis thus investigates the thermal stability and durability of typical solar absorbers. It can be seen
that: i) absorbers are mainly developed for receiver tubes protected under vacuum (parabolic troughs);
ii) high temperature stability tests are specific to each supplier; iii) very few aging tests are carried out
in air, whereas this is imperative for LFR and central tower technologies; iv) in most aging studies, only
solar absorptance and thermal emittance are considered when following the evolution of the
absorbers optical performance with aging, while said performance is better represented by the solar-
to-heat conversion (heliothermal) efficiency, also taking into account the absorber working conditions
(concentration, temperature). Representative aging studies are therefore necessary to correctly
predict the absorbers operating life.
In the next chapter, the problematic of selective absorber aging will thus be discussed at length.
Possible sources of degradation and subsequent aging phenomena will be explained, as well as a
critical literature review of existing aging facilities and protocols.

45
Chapter 2 - Aging and durability of solar
absorbers: a critical analysis

46

47
To encourage CSP deployment, there is a crucial need to improve current technologies to achieve both
lower costs and higher efficiencies. For example, the SolarPACES program [154], a collaborative
research program of the International Energy Agency, has identified several tasks for the improvement
of CSP plants and other relevant applications in this field. The task for “Solar technology and advanced
applications” deals with the advancement of the technical and economic viability of emerging solar
thermal technologies and their validation. The main objective of this task is to achieve a further
significant cost reduction for new plants while guaranteeing a high performance over the lifetime of
the plant.
For this purpose, two main levers are available, i.e., working at higher temperatures and under
atmospheric conditions. These enhanced requirements can evidently become very demanding for CSP
receiver materials, causing potentially harsher sources of degradation and subsequent aging
phenomena. The latter need to be studied thoroughly so as to validate the performance and durability
of new and improved CSP components. Aging protocols and facilities already exist for this purpose, as
can be found by reviewing the literature, but they need to be adapted and standardized to offer more
reliable aging and durability analyses. This chapter will develop these different topics at length.
1. Expected improvements in next generation CSP technologies
1.1. Increasing working temperatures
As mentioned before, the role of a solar receiver/absorber is to convert solar radiation into heat. The
efficiency of this conversion is the heliothermal efficiency, defined in Chapter 1 (Eq.(11) p.34). This
heat can be used directly or injected in a thermodynamic cycle to produce electricity (heat-to-
mechanical work conversion).
The ideal case of a thermodynamic cycle is called the Carnot cycle, the efficiency of which is given by
Eq.(13), for a solar absorber at temperature Tabs and ambient temperature T0.
𝜂𝑐𝑎𝑟𝑛𝑜𝑡 = 1 −𝑇0
𝑇𝑎𝑏𝑠 (13)
A good approximation of a semi-ideal case is represented by the Chambadal-Novikov (C-N) efficiency,
which is the efficiency of a semi-ideal heat engine operating at maximum power output, where the
heat transfer is irreversible (Eq.(14)).
𝜂𝐶−𝑁 = 1 − √𝑇0
𝑇𝑎𝑏𝑠 (14)
Figure 27 illustrates the Carnot and Chambadal-Novikov efficiencies as a function of temperature. As
can be expected from Eq.(13) and (14), these efficiencies increase with temperature. Figure 27 also
shows an estimated range of the net annual average thermal-to-electric conversion efficiencies of
common heat engines that can be integrated in solar thermal systems. They all follow the Chambadal-
Novikov efficiency trend.
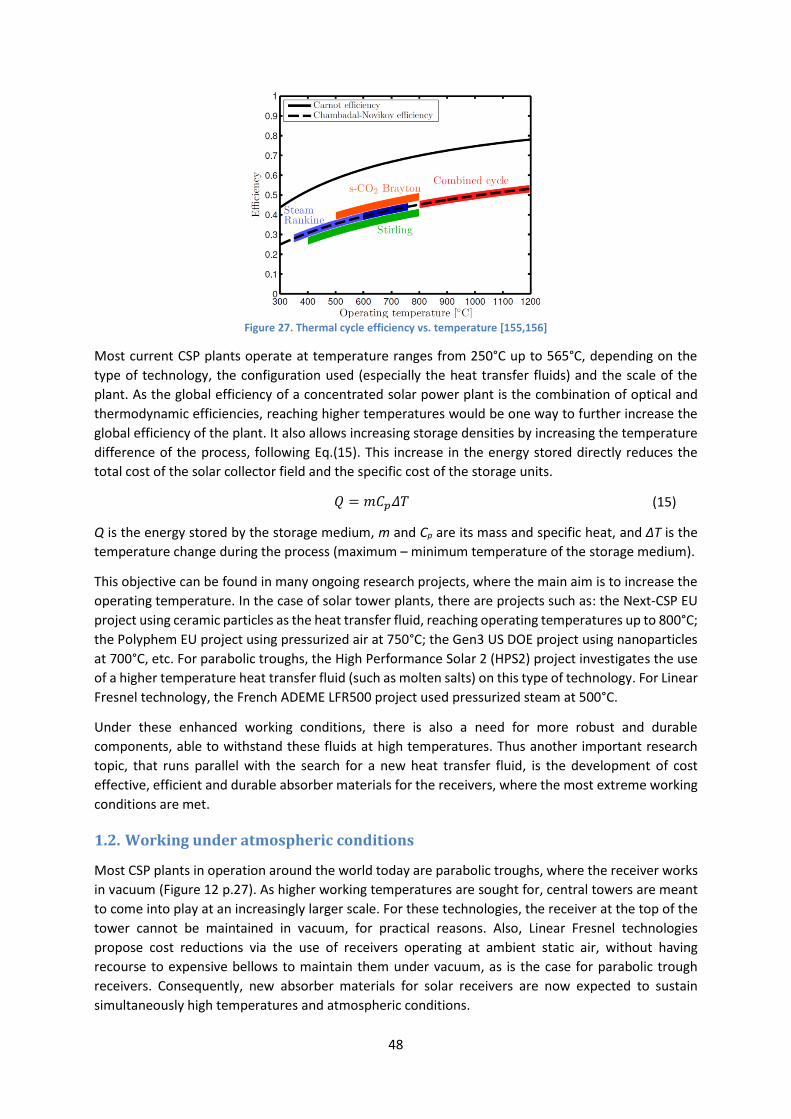
48
Figure 27. Thermal cycle efficiency vs. temperature [155,156]
Most current CSP plants operate at temperature ranges from 250°C up to 565°C, depending on the
type of technology, the configuration used (especially the heat transfer fluids) and the scale of the
plant. As the global efficiency of a concentrated solar power plant is the combination of optical and
thermodynamic efficiencies, reaching higher temperatures would be one way to further increase the
global efficiency of the plant. It also allows increasing storage densities by increasing the temperature
difference of the process, following Eq.(15). This increase in the energy stored directly reduces the
total cost of the solar collector field and the specific cost of the storage units.
𝑄 = 𝑚𝐶𝑝𝛥𝑇 (15)
Q is the energy stored by the storage medium, m and Cp are its mass and specific heat, and ΔT is the
temperature change during the process (maximum – minimum temperature of the storage medium).
This objective can be found in many ongoing research projects, where the main aim is to increase the
operating temperature. In the case of solar tower plants, there are projects such as: the Next-CSP EU
project using ceramic particles as the heat transfer fluid, reaching operating temperatures up to 800°C;
the Polyphem EU project using pressurized air at 750°C; the Gen3 US DOE project using nanoparticles
at 700°C, etc. For parabolic troughs, the High Performance Solar 2 (HPS2) project investigates the use
of a higher temperature heat transfer fluid (such as molten salts) on this type of technology. For Linear
Fresnel technology, the French ADEME LFR500 project used pressurized steam at 500°C.
Under these enhanced working conditions, there is also a need for more robust and durable
components, able to withstand these fluids at high temperatures. Thus another important research
topic, that runs parallel with the search for a new heat transfer fluid, is the development of cost
effective, efficient and durable absorber materials for the receivers, where the most extreme working
conditions are met.
1.2. Working under atmospheric conditions
Most CSP plants in operation around the world today are parabolic troughs, where the receiver works
in vacuum (Figure 12 p.27). As higher working temperatures are sought for, central towers are meant
to come into play at an increasingly larger scale. For these technologies, the receiver at the top of the
tower cannot be maintained in vacuum, for practical reasons. Also, Linear Fresnel technologies
propose cost reductions via the use of receivers operating at ambient static air, without having
recourse to expensive bellows to maintain them under vacuum, as is the case for parabolic trough
receivers. Consequently, new absorber materials for solar receivers are now expected to sustain
simultaneously high temperatures and atmospheric conditions.
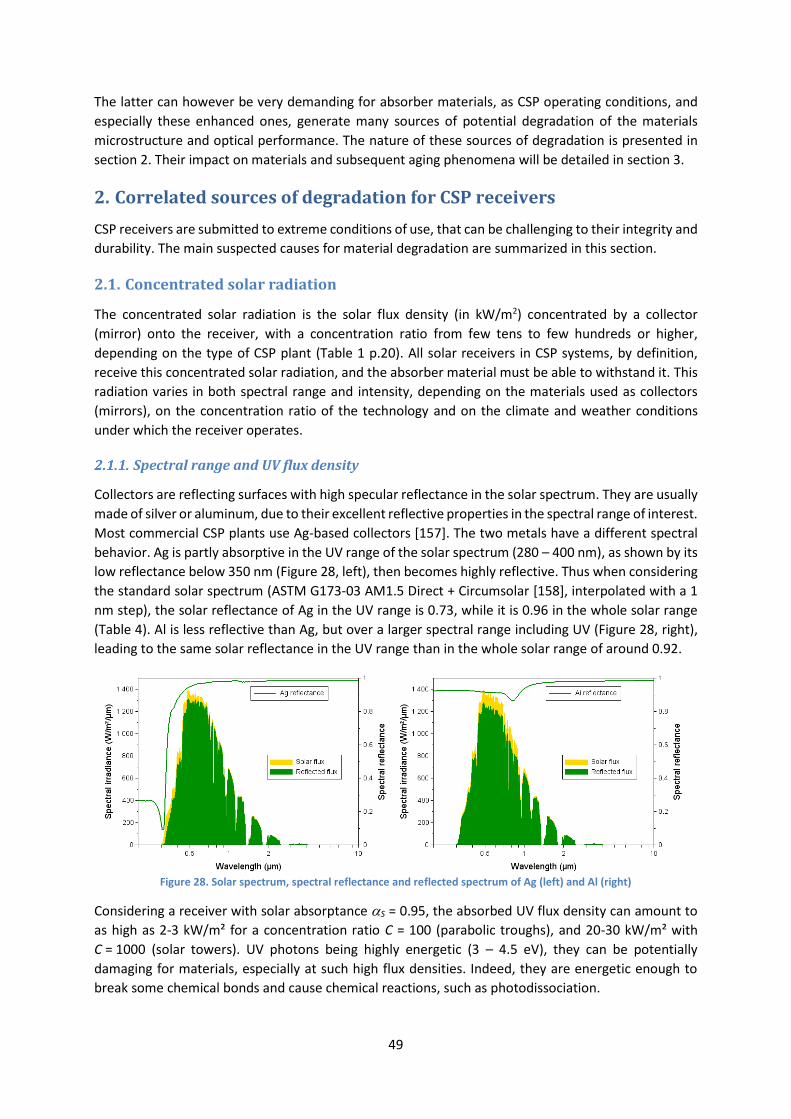
49
The latter can however be very demanding for absorber materials, as CSP operating conditions, and
especially these enhanced ones, generate many sources of potential degradation of the materials
microstructure and optical performance. The nature of these sources of degradation is presented in
section 2. Their impact on materials and subsequent aging phenomena will be detailed in section 3.
2. Correlated sources of degradation for CSP receivers
CSP receivers are submitted to extreme conditions of use, that can be challenging to their integrity and
durability. The main suspected causes for material degradation are summarized in this section.
2.1. Concentrated solar radiation
The concentrated solar radiation is the solar flux density (in kW/m2) concentrated by a collector
(mirror) onto the receiver, with a concentration ratio from few tens to few hundreds or higher,
depending on the type of CSP plant (Table 1 p.20). All solar receivers in CSP systems, by definition,
receive this concentrated solar radiation, and the absorber material must be able to withstand it. This
radiation varies in both spectral range and intensity, depending on the materials used as collectors
(mirrors), on the concentration ratio of the technology and on the climate and weather conditions
under which the receiver operates.
Spectral range and UV flux density
Collectors are reflecting surfaces with high specular reflectance in the solar spectrum. They are usually
made of silver or aluminum, due to their excellent reflective properties in the spectral range of interest.
Most commercial CSP plants use Ag-based collectors [157]. The two metals have a different spectral
behavior. Ag is partly absorptive in the UV range of the solar spectrum (280 – 400 nm), as shown by its
low reflectance below 350 nm (Figure 28, left), then becomes highly reflective. Thus when considering
the standard solar spectrum (ASTM G173-03 AM1.5 Direct + Circumsolar [158], interpolated with a 1
nm step), the solar reflectance of Ag in the UV range is 0.73, while it is 0.96 in the whole solar range
(Table 4). Al is less reflective than Ag, but over a larger spectral range including UV (Figure 28, right),
leading to the same solar reflectance in the UV range than in the whole solar range of around 0.92.
Figure 28. Solar spectrum, spectral reflectance and reflected spectrum of Ag (left) and Al (right)
Considering a receiver with solar absorptance S = 0.95, the absorbed UV flux density can amount to
as high as 2-3 kW/m² for a concentration ratio C = 100 (parabolic troughs), and 20-30 kW/m² with
C = 1000 (solar towers). UV photons being highly energetic (3 – 4.5 eV), they can be potentially
damaging for materials, especially at such high flux densities. Indeed, they are energetic enough to
break some chemical bonds and cause chemical reactions, such as photodissociation.

50
Table 4. Solar flux densities incident, reflected (collector) and absorbed (receiver) in UV and complete solar ranges (based
on standard ASTM G173-03 AM1.5 Direct + Circumsolar solar spectrum [158], interpolated with a step of 1 nm)
Spectral range
Sun Collector Receiver (S = 0.95)
Solar
flux density
(kW/m²)
Material
Reflected
flux density
(kW/m²)
Solar reflectance
(integrated over
spectral range)
Absorbed concentrated
flux density (kW/m²)
C = 100 C = 1000
UV
(0.28 – 0.4 µm) 0.031
Ag 0.022 0.732 2.1 21
Al 0.028 0.926 2.7 27
Complete solar
(0.28 – 4 µm) 0.900
Ag 0.864 0.960 82.1 821
Al 0.830 0.922 78.9 789
Moreover, CSP plants are installed in regions with high DNI, often in dry and high elevation regions.
For instance, the highest DNI resource in the world (3536 kWh/m²/year) is found in the Atacama Desert
in Chile (mean elevation ~ 2500 m). At high elevation and in dry weather, both the atmosphere
thickness and water vapor content, that solar radiation encounters before reaching the ground, are
smaller, so that the relative amount of incident UV radiation (280 – 400 nm) is even higher: e.g. 4.8%
of the complete solar spectrum of the Atacama desert, vs. 3.9% for the standard solar spectrum [159].
Therefore, the concentrated UV flux density actually seen by CSP receivers can be even higher than
already mentioned in Table 4.
Weather fluctuations
Weather fluctuations have a direct impact on the solar radiation incident on the collector, and
consequently on the concentrated solar radiation seen by the receiver. Two typical configurations can
be considered: sunny days and cloudy days. Figure 29 shows examples of such configurations, where
Direct Normal Irradiance (DNI) levels were recorded during a statistical study conducted by Boubault
et al. [36] at the Odeillo solar furnace (France).
Figure 29. DNI level for a sunny day (left) and a cloudy day (right) for the site of Odeillo [36]
During the cloudy day (Figure 29, right) there were 427 DNI peaks, equivalent to 214 cloudy spells. The
average amplitude of the DNI peaks (raise or drop) was 316 W/m², with an average DNI variation
velocity of 23 W/m²/s. What is more, in a concentrating system, these DNI variations are multiplied by
the concentration ratio C. With C between 40 and 1000 in CSP systems, the variation of the
concentrated solar radiation seen by the receiver is typically between 0.9 and 23 kW/m²/s. This causes
very fast variations of high amplitude of flux density received by the absorber materials, and
consequently, intense thermal cycling and thermal shocks. Moreover, the flux density is not perfectly
homogeneous throughout the receiver due to the imperfections of the collector, causing local
gradients of concentrated solar flux and temperature.
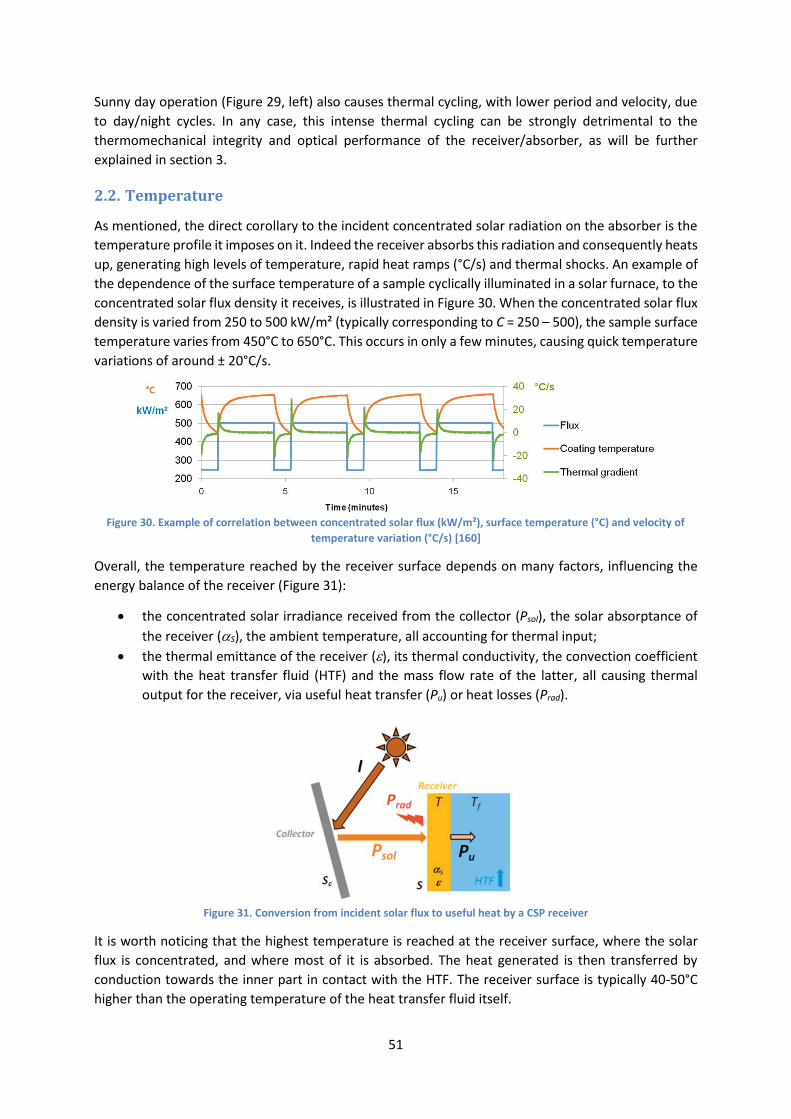
51
Sunny day operation (Figure 29, left) also causes thermal cycling, with lower period and velocity, due
to day/night cycles. In any case, this intense thermal cycling can be strongly detrimental to the
thermomechanical integrity and optical performance of the receiver/absorber, as will be further
explained in section 3.
2.2. Temperature
As mentioned, the direct corollary to the incident concentrated solar radiation on the absorber is the
temperature profile it imposes on it. Indeed the receiver absorbs this radiation and consequently heats
up, generating high levels of temperature, rapid heat ramps (°C/s) and thermal shocks. An example of
the dependence of the surface temperature of a sample cyclically illuminated in a solar furnace, to the
concentrated solar flux density it receives, is illustrated in Figure 30. When the concentrated solar flux
density is varied from 250 to 500 kW/m² (typically corresponding to C = 250 – 500), the sample surface
temperature varies from 450°C to 650°C. This occurs in only a few minutes, causing quick temperature
variations of around ± 20°C/s.
Figure 30. Example of correlation between concentrated solar flux (kW/m²), surface temperature (°C) and velocity of
temperature variation (°C/s) [160]
Overall, the temperature reached by the receiver surface depends on many factors, influencing the
energy balance of the receiver (Figure 31):
• the concentrated solar irradiance received from the collector (Psol), the solar absorptance of
the receiver (S), the ambient temperature, all accounting for thermal input;
• the thermal emittance of the receiver (), its thermal conductivity, the convection coefficient
with the heat transfer fluid (HTF) and the mass flow rate of the latter, all causing thermal
output for the receiver, via useful heat transfer (Pu) or heat losses (Prad).
Figure 31. Conversion from incident solar flux to useful heat by a CSP receiver
It is worth noticing that the highest temperature is reached at the receiver surface, where the solar
flux is concentrated, and where most of it is absorbed. The heat generated is then transferred by
conduction towards the inner part in contact with the HTF. The receiver surface is typically 40-50°C
higher than the operating temperature of the heat transfer fluid itself.

52
Moreover, when considering the receiver temperature, it is also paramount to take into account:
• its rapid and frequent fluctuations by several hundreds of degrees, directly linked to that of
the concentrated solar flux density incident on the receiver (section 2.1 and Figure 30), causing
thermal cycling and thermal shocks;
• the duration for which high temperature is maintained, i.e., several hours each day, up to 24-
hour operation if large enough thermal storage is installed (e.g. 15-hour storage at Gemasolar
central tower), and this cumulatively up to the 25 years of operation corresponding to the
typical lifetime of a CSP plant;
• the fact that receivers usually associate several materials, especially in the case of solar
selective absorber coatings, that do not physically react in the same way to temperature. For
instance, ceramics and metals have very different thermal expansion coefficients, which can
generate mechanical stress in the architecture of the absorber (Figure 32). Tensile or
compressive stress can appear under temperature increase, taking into account that coating-
to-substrate stress is classically compressive before heating and that differential dilatation can
induce in this case tensile stress. Such fact can lead to degradations of the whole coated system
(cracking, delamination of the coatings).
Figure 32. Illustration of thermal expansion on a tubular solar receiver covered with an absorber coating associating
materials of different thermal expansion coefficients () [161]
High temperatures (> 400°C) for long durations, and especially associated with thermal shocks, can
cause irreversible physicochemical changes in the absorber, and subsequent degradations of their
optical performance, as will be further explained in section 3.
2.3. Atmospheric conditions
In parabolic trough systems, the receiver is protected with an evacuated glass tube, so the receiver
works under vacuum conditions. Contrarily, central tower and LFR receivers are exposed to
atmospheric conditions by design. Consequently, all the environmental factors can have an impact on
the absorber surface. Atmospheric conditions can have damaging chemical effects on the absorbers,
especially at high temperature, when compared to vacuum conditions for PT receivers.
Ambient air is usually composed of 78.09% N2, 20.95% O2, 0.93% Ar, 0.04% CO2, and small amounts of
other gases. It also contains a variable amount of H2O vapor, with an average of around 1% at sea level,
and 0.4% over the entire atmosphere. Other compounds such as pollutants can also be present, for
instance NOx and SO2. If N2 and Ar are inert gases, all these other species contain O and can chemically
interact with absorber materials, sometimes dramatically, as will be further explained in section 3.
Atmospheric conditions strongly depend on the location and elevation, which influence ambient
temperature, cloudiness, dryness, wind, rain, etc. CSP plants often operate in deserts with high DNI
levels, in order to maximize the heat production of the plant. Such environments are often found in
dry regions, some at high elevations (e.g. Atacama region in Chile). In some sunny regions, deserts are
however close to sea coasts (e.g. United Arab Emirates, Saudi Arabia, etc.), and the presence of rain,

53
high humidity, dew and salt sprays are also to be considered. Sand and dust particles can also be found
in the atmosphere, with potentially high kinetic energy able to also cause physical damage.
2.4. Heat transfer fluids
The use of most heat transfer fluids, such as air, steam or molten salts, especially at high temperature,
can be chemically damaging for the inner wall of the receiver [162–164]. New generations of high
thermal conductivity HTFs now include liquid sodium and chloride salts, posing even bigger challenges
in terms of receiver materials durability [165]. These issues will however not be considered at length,
since this thesis focuses on the outer surface of CSP receivers covered with solar selective absorber
coatings and the durability of their optical performance.
More to our point are the high mechanical stresses induced for long durations on the receiver and its
coatings, by pressurized HTF (steam, air) at levels around 100 bars (Figure 33). Also in some cases, the
HTF distribution inside the receiver, due to gravity, does not match the concentrated flux distribution,
generating temperature inhomogeneities and thermal gradients on the receiver (Figure 34).
Figure 33. Illustration of mechanical stress generated by pressurized heat transfer fluid [161]
Figure 34. Steam HTF (left) and subsequent temperature (right) distribution on a PT receiver with Direct Steam
Generation (on the left, the PT reflector in symbolized in orange) [courtesy E. Zarza, CIEMAT/PSA]
2.5. Conclusion on the sources of degradation
As a summary, Table 5 gathers the different sources of degradation listed above, depending on the
type of CSP technology, and the potentially damageable impact they can have on the receiver (ranging
from strong = + + + to null = - - -). It becomes evident that receivers in central towers are the most at
risk, cumulating high concentrations, temperatures and exposure to ambient atmosphere. LFR
receivers are also at risk as they operate in air, especially since the next generation of LFR is meant to
work at higher temperatures (e.g. Dacheng Dunhuang 50 MW LFR/molten salts plant in China).
Overall, these many sources of degradation create harsh working conditions with potentially dire
consequences on the absorber materials integrity and performance. The physicochemical phenomena
occurring in the materials under the influence of these combined sources of degradation, amounting
to material aging, are detailed in the next section.
hliqu

54
Table 5. Sources of degradation vs. CSP technologies
Sources of degradation Central tower PT LFR
Concentrated solar radiation
+ + +
High
(C = 1000)
+
Medium - Low
(C = 80 - 120)
+
Low
(C < 50)
Temperature (HTF)
+ + +
Up to 565°C so far
(molten salts, DSG)
Towards higher T (air)
+ +
350 – 400°C (oil)
565°C (molten salts)
+ +
250 – 350°C (steam, oil)
535°C (molten salts)
Atmospheric conditions
+ + +
Ambient atmosphere
- - -
Vacuum
+ +
Static air
(receiver behind glass window)
3. Subsequent aging mechanisms for CSP receivers
3.1. Aging vs. degradation
In the previous section, several sources of degradation for CSP absorber materials were identified. As
a response to the application of these sources of degradation, the microstructure and functional
properties of the exposed materials will evolve as a consequence of physicochemical phenomena that
will be described in this section. However not all these phenomena are necessarily damaging to the
materials or their performance. Therefore in this section the notion of aging will be preferred. As a
matter of fact, in metallurgy, aging even refers to the extended heat treatment processes for
strengthening alloys, with positive impact in that case.
Here aging will designate the exposure of materials to real or artificially reproduced working conditions
related to their use in CSP applications, using aging protocols and facilities that will be presented in
section 4. Aging phenomena are considered as the consequence of this exposure on the materials
microstructure, investigated by material characterization, after aging tests are applied.
Performance requirements for CSP absorber materials can be formulated on the basis of many criteria,
but none is as paramount for the global efficiency of the CSP system as the absorber optical
performance. Therefore, it is the evolution of their optical properties (spectral reflectance, solar
absorptance S, thermal emittance , heliothermal efficiency, selectivity ratio S/) with time and
temperature that is used to characterize the stability and durability of their performance, evaluate
their aging behavior and determine if this aging gives rise to a degradation in performance.
3.2. Thermally-induced aging phenomena
The application of high temperatures to a material can cause well-known thermally-induced
phenomena, following temperature-dependent laws. They are discussed in the following.
Chemical phenomena
3.2.1.1. Atomic diffusion
Atomic diffusion is a process of mass transfer inside a single material (“intradiffusion”, self-diffusion)
or between adjacent materials (interdiffusion), by movement of atoms from regions of high atomic
concentrations to regions of low atomic concentrations. These concentration gradients act as a driving

55
force for atomic diffusion. Fick’s first diffusion law at steady-state (Eq.(16)) illustrates how the diffusion
flux J (atoms/m²/s or kg/m²/s) along direction x is related to the concentration gradient 𝜕𝐶/𝜕𝑥
(atoms/m3/m or kg/m3/m) through the diffusion coefficient D (m²/s).
𝐽 = −𝐷 ∙𝑑𝐶
𝑑𝑥 (16)
To be able to move in the material lattice, atoms need to break their bonds with surrounding atoms
and locally distort the lattice. They need to acquire the activation energy of diffusion Ea to do so. The
thermal energy of an atom is related to temperature, and increases with it, as lattice vibrations
increase: E = kBT. The diffusion coefficient D is thus highly temperature-dependent, following an
Arrhenius law, as indicated by Eq.(17), where D0 is the temperature-independent preexponential term
(m²/s), Ea is the activation energy for diffusion (J/mol or eV/atom), R the gas constant (8.314 J/mol/K)
and T is the temperature (K).
𝐷 = 𝐷0 ∙ 𝑒𝑥𝑝(−𝐸𝑎 𝑅𝑇⁄ ) ⇔ ln 𝐷 = ln 𝐷0 −𝐸𝑎
𝑅∙
1
𝑇 (17)
The formulation on the right of Eq.(17) gives rise to an Arrhenius plot of D vs. 1/T, with a linear
expression, the slope of which (-Ea/R) is proportional to the diffusion activation energy Ea: the higher
Ea, the harder it is for atoms to diffuse in the material, the steeper the linear Arrhenius plot.
As an example, Figure 35 illustrates such temperature dependence for diffusion coefficients of several
elements in titanium [166]. It can be seen that it is easier for transition metals such as Al to diffuse in
Ti (left) than for O (right, Ea = 200 kJ/mol) although usually light elements such as O, C or N diffuse
much more easily than larger metallic atoms (e.g. through interstitial diffusion in the crystalline lattice).
It is suggested that strong covalent-like bonds form between the host titanium atoms and the
“impurity” metal atoms. This example emphasizes the need to investigate diffusion behaviors in
materials of interest when developing materials and coatings for high temperature applications. It also
highlights that the diffusion behavior of an element strongly depends on the surrounding elements
and their chemical bonds it has to progress in.
Figure 35. Temperature dependence of diffusion coefficients in -Ti (left) for Co, Fe, Ni, Mn, Cr and P in single crystals,
and Si, Al and Ti (self-diffusion) in polycrystals; for O in -Ti and -Ti (right) [166]

56
The diffusion behavior is also closely related to the materials microstructure. For instance, columnar
structures (e.g. Figure 36, bottom left) are often obtained in coatings deposited by sputtering vacuum
techniques, with various grain sizes, densities, grain boundary widths, etc. In crystalline solids, grain
boundaries typically account for 50% of the total volume of the material, and the atomic concentration
at grain boundaries is 10–30% lower than in the rest of the material. Grain boundary diffusion is
therefore much faster than volume diffusion, and is a classical diffusion path. Diffusion in amorphous
materials is thus supposedly slower as there are no grain boundaries, but can also occur.
Multilayer architectures such as receivers covered by solar selective absorber coatings associate
materials with various chemical compositions. Thus strong atomic concentration gradients exist in
these structures, and interdiffusion or interlayer diffusion often take place between the receiver
support material (metallic substrate) and the coating, or within the individual layers of said coating.
Diffusion phenomena are thus frequently observed in solar absorbers as one of the main degradation
phenomena, as reported in many publications.
An example of such diffusion is shown in Figure 36 for a low temperature CrON/SnO2 solar selective
absorber coating deposited on Cu [167]. After aging in air for 600 h at 278°C, the inward interdiffusion
of O into the absorber layer and the substrate, and the outward diffusion of Cr and Cu into the upper
layers, are clearly visible. While solar absorptance is barely affected by this aging (it only decreases
from 0.932 to 0.930), said diffusion phenomena cause an increase in emittance from 0.069 to 0.123,
due to the loss of metallic-like behavior of the absorber close and into the Cu substrate, with the
inward diffusion of O.
Figure 36. Atomic depth profiles (TOF-ERDA) for a chromium oxynitride selective coating on copper, as-deposited and
aged at 278°C for 600 h in air [167]
Liu et al. [60] established that for NbTiON/SiON absorber coatings on Cu substrates, Cu diffusion into
the absorber was the main reason for its aging, i.e., decrease of S from 0.95 to 0.84 and increase of
from 0.07 to 0.14, after 40 h at 600°C in vacuum. The same coating on SS substrate had lower optical
performance as-deposited (0.91/0.13) but exhibited better thermal stability (0.90/0.13 at 600°C), as
Cu is known for its tendency to diffuse. This study underlines the impact of the substrate material on
the degradation of the absorber coating, which otherwise would be thermally stable in itself.

57
Xinkang et al. [71] found that Mo diffused in Mo-Al2O3 cermets through inner self-congregation inside
the cermet, and infiltration through the Al2O3 layer in Mo/Al2O3 tandems (after 5 h at 800°C in vacuum).
They also surmised that defects appearing in Al2O3 at temperatures above 650°C, such as widened
boundaries, cracks and holes, create pathways for Mo diffusion. Finally, when using Mo IR-reflective
layer above SS substrates, they underlined the necessity to “produce an Fe2O3 layer on SS substrate by
a way of oxidation of the substrate surface to avoid mutual diffusion across the interface between SS
and base metal Mo layer”. Even with the Fe2O3 layer, the coating optical properties were degraded
when annealed for 2 h above 500°C, especially emittance (S = -0.01, = +0.01-0.08).
Liu et al. [168] also observed that after 10 h at 800°C in vacuum, the interdiffusion between the SS
substrate and the Mo IR-reflective layer caused the coating degradation (S = -0.01, = +0.05). Mn
outward diffusion from SS substrate in TiAlCrN/TiAlN/AlSiN tandem absorber coatings was also
observed by Valleti et al. [133] after 4 h at 600°C with a critical effect on their emittance ( = +0.08).
Overall, it is often found that the diffusion of elements from the metallic substrate causes the
degradation (increase) in the emittance of solar selective absorber coatings at high temperature
[133,169]. Indeed, this type of diffusion tends to degrade the low-emissive metallic nature of the
substrate and IR-reflective layer.
It is thus critical to knowledgeably select the constitutive materials with regard to their diffusion
behavior at high temperatures. The design of SSACs aims at reducing diffusion rates or avoid diffusion
altogether: known diffusion barrier materials with high thermal stability are used as additional barrier
layers between substrate and IR reflector, or even as one or all of the optically active layers. For
instance Al2O3 [169,170], W [171–174] or titanium aluminum nitrides [133] have been successfully
used to reduce diffusion within SSACs.
3.2.1.2. Oxidation/corrosion
The presence of oxygen-containing species in the surroundings of a material, coming from the
atmosphere (O2, H2O vapor, CO2, NOx, etc.) or even from adjacent materials (oxides), can cause its
oxidation and/or corrosion (chemical erosion), i.e., the incorporation of oxygen atoms in its
microstructure, and their diffusion, to locally or globally form a compound containing (more) oxygen,
such as an oxide. CSP absorbers can be subject to dry corrosion in air (O2, H2O vapor), especially at high
temperature, and wet/aqueous corrosion in water (dew, rain).
Dry corrosion, i.e., oxidation in air at high temperature, is a common phenomenon for solar absorbers.
Its principle is illustrated in Figure 37 (left) for a metallic surface. First, ambient O2 molecules are
adsorbed and dissociate on the material surface (1). This leads to the nucleation and growth of an
oxide film (2): the adsorbed oxygen atoms react with the material to form oxide clusters, which
laterally grow until they connect to form a continuous film. Then the oxide film grows in thickness (3),
due either to the diffusion of O2 towards the material/oxide interface (inward growth), adding
interstitial oxygen in the lattice; and/or to the diffusion of one or more elements of the material
towards the oxide/ambient interface (outward growth), creating vacancies in the material. Both
phenomena induce stress and defects can appear in the oxide layer as its thickness grows: cavities,
pores, microcracks, grain boundaries, etc. (4). This can lead in some cases to the cracking, unsticking
and eventually failure of the oxide film, giving rise to further oxidation paths (5).

58
Figure 37. Typical oxidation steps of a metallic surface (left) and typical oxidation profiles of materials illustrated by the
evolution of oxide thickness vs. time (right [175])
Different materials have different oxidation behaviors, as can be observed when following the
mass/weight gain m or thickness of a material exposed to an oxidizing atmosphere vs. time (Figure
37, right [175]). The linear profile indicates an ever ongoing oxidation of the material with formation
of a volatile oxide, eventually leading to the failure of the material (steps 1 to 5). At low, medium and
high temperatures, oxidation typically follows cubic, logarithmic and parabolic laws, respectively [175].
A material resistant to oxidation will form an adhesive, dense and stable oxide layer at its surface (steps
1 to 3). This oxide layer will act as a diffusion barrier for oxygen, and its thickness will stabilize with
time following a parabolic profile. This is the case for instance of Al and Cr, that respectively form thin
Al2O3 and Cr2O3 protective layers. Both metals are thus often included in oxidation-resistant materials
and alloys (e.g. Ni-Cr stainless steels).
The parabolic law, or Wagner’s law, was first derived by Wagner et al. [176] for metal oxidation and
concerns thick oxide films (> 600 nm). The rate of oxidation is expressed with Eq.(18), where x is the
oxide thickness (cm), KP is the parabolic rate constant (cm²/s) and t is time (s).
𝑑𝑥
𝑑𝑡=
𝐾𝑃
𝑥 ⇔ 𝑥2 = 2𝐾𝑃 ∙ 𝑡 + 𝐶𝑡𝑒 (18)
This law is applicable to uniform, continuous and protective oxide scale layers. In many cases, more
complex or mixed growth rules can be observed. Cabrera and Mott further developed Wagner’s theory
for thinner films (< 3 nm), proposing an inverse logarithmic law [177] (Figure 37, right). The parabolic
rate constant KP is nevertheless very often used for the description and comparison of the oxidation
behavior of materials.
Oxidation, as a particular case of diffusion, is also a temperature-dependent phenomenon, following
an Arrhenius law. The activation energy Ea and temperature dependence of oxidation are thus
expressed by Eq.(19) and can be deduced from an Arrhenius plot, as explained for diffusion.
𝐾𝑃 = 𝐴 ∙ 𝑒𝑥𝑝(−𝐸𝑎 𝑅𝑇⁄ ) ⟺ ln 𝐾 = ln 𝐴 −𝐸𝑎
𝑅∙
1
𝑇 (19)

59
Apart from temperature, many other parameters influence the oxidation behavior and resistance of a
material, either intrinsic to the material itself (chemical composition, thermodynamic properties) or
linked to its fabrication technique (microstructure, diffusion resistance).
The presence of water vapor in the oxidizing atmosphere is also a known factor affecting material
oxidation kinetics, through the adsorption of water molecules and the formation of hydroxides at the
surface, that can accelerate the formation of oxides. If these are stable oxides (parabolic law), the
material can be more quickly protected from further oxidation and water vapor then has a beneficial
effect on oxidation resistance [178]. In some cases [179], after this initial protective oxidation,
breakaway oxidation is observed in the presence of water vapor, i.e., a rapid acceleration of the
oxidation rate (linear law), leading to the degradation of the material.
Oxidation is a frequently encountered aging mechanism in solar selective absorber coatings working
in air or degraded vacuum at high temperature, even though highly oxidation-resistant materials at
high temperatures are often used, such as Al2O3 [20, 21, 23, 31–41] and Si3N4 [79,123,131,188–190].
The top antireflective (AR) layer can be oxidized, as evidenced by Rebouta et al. [80] with SS/W/W-
Al2O3/SiOx architectures, where SiOx is further oxidized towards SiO2 and emittance slightly decreases
as a consequence. A stable surface oxide can form, protecting the rest of the coating from further
oxidation by slowing down the diffusion of oxygen and other elements (parabolic law with √𝑡).
In other cases, oxygen diffuses from/through the top antireflective layer, often a porous stable oxide,
then reaching and oxidizing the underlying absorber layers, and degrading their optical properties.
Such scenario was observed by Gao et al. [191] with SS/TiN/Al2O3 architectures: after 2 h in air above
250°C, TiN was oxidized into TiO2, degrading solar absorptance (S = -0.05-0.12, = -0.01). Liu et al.
[168] observed that Mo/LOCL/MOCL/HOCL (Low/Middle/High Oxygen Content CrAlO) heat-treated at
600°C for 200 h in air suffered from mild optical degradation (S = -0.02, = -0.02) due to the further
oxidation of the underlying LOCL, as well as the formation of a thin layer of surface oxide. Barshilia et
al. [192] surmised the oxidation of Al layer in Cu/AlxOy/Al/AlxOy above 400°C, and observed the
diffusion of Cu atoms from the substrate and their oxidation to form CuO, strongly degrading solar
absorptance (S = -0.06-0.18, = -0.01). This study highlights the possible synergy between diffusion
and oxidation.
Finally, after oxidizing the AR and absorber layers, oxygen can continue to diffuse downwards and
reach the IR-reflective layer and substrate, also forming oxides with the metals they contain. This was
evidenced for instance by Khamlich et al. [193] with Cr/α-Cr2O3 nanoparticles grown on Ta substrates,
where fast oxygen diffusion at the α-Cr2O3/Ta interface generated Ta2O3, after heat-treatments in H2
at 600°C, leading to a dramatic degradation in optical performance (S = -0.05, = +0.17, vs. sample
annealed at 500°C). It is worth noticing that for the same architecture, annealing at 500°C produced a
contrary effect (S = +0.18, = -0.14, vs. sample annealed at 300°C), again highlighting that aging
phenomena do not necessarily induce degradations of optical performance.
Overall, oxidation phenomena seem to mostly affect, and degrade, the solar absorptance of selective
absorber coatings. Indeed, the efficiency of the latter is based on the intricate optical interference
phenomena generated by the association of thin layers of different materials. Such interference
phenomena strongly depend on the materials optical indices, chemical nature and layer thicknesses,
all of which notably vary with the formation and growth of oxides within and/or at the surface of the
coating. In some cases, an accommodation in refractive index between the layers can arise and
absorbing performance can even improve. In most cases however, it is degraded, as the structure is

60
no longer optically optimized. As a consequence, their spectral reflectance varies both in intensity and
spectral distribution, causing optical performance to evolve undesirably.
Figure 38 presents an illustration of this fact. The simulated spectral reflectance and optical
performance of a simple stack composed of Fe substrate, SiC absorber and SiO2 antireflective layer are
shown: initially (a), the SiC absorber layer is 20 nm-thick and the SiO2 antireflective is 70 nm-thick;
then, the SiC absorber is oxidized into SiO2, (b) half (SiC 10 nm / SiO2 10 nm / SiO2 70 nm) then (c)
entirely (SiO2 20 nm / SiO2 70 nm), without any change in total thickness (90 nm); finally (d) the
thickness of the entirely oxidized SiC is increased (SiO2 130 nm / SiO2 70 nm). At a wavelength of 600
nm, the refractive indices are (n = 3.41, k = 0.31) for SiC and (n = 1.46, k = 0) for SiO2, thus the oxidation
of SiC into SiO2 causes drastic changes in optical behavior. The increase in O content, and subsequent
decrease in refractive index, tend to modify the intensity of the reflectance maxima and minima that
are due to optical interferences, but not their position (wavelength) which is linked to thickness. The
increase in oxide thickness tends to increase the number of these interferences (reflectance
oscillations) and causes their spectral shifting towards the infrared range. Both evolutions cause a
degradation in solar absorptance, as the coating structure diverts from its optimal parameters, initially
giving rise to low reflectance in the solar range. Meanwhile, emittance is barely affected by the changes
in the absorber, as it mostly depends on the substrate material itself. However as thickness further
increases, eventually the reflectance spectral shift towards the infrared range and the increase in the
number of oscillations also affect emittance. Some previous and recent results have shown the relation
between the increase in thickness and variations of the optical properties [194]. In any case, further
analysis from experimental results need to be considered after each aging test to better understand
the changes on the absorber and confirm this relation.
Stack S (500°C)
(a) Fe / SiC (20 nm) / SiO2 (70 nm) 0.80 0.08
(b) Fe / SiC (10 nm) / SiO2 (80 nm) 0.71 0.08
(c) Fe / SiO2 (90 nm) 0.56 0.08
(d) Fe / SiO2 (200 nm) 0.49 0.09
Figure 38. Simulated spectral reflectance and optical performance of model solar selective absorber coating at different
stages of oxidation for the absorber layer
To summarize, the oxidation behavior of selective coatings is difficult to anticipate due to their complex
architecture associating different materials, and its impact on optical performance is very strong and
hard to predict.
Physical phenomena: densification, recrystallization etc.
As a consequence of temperature increase, as well as of diffusion and oxidation phenomena, materials
may undergo other physicochemical phenomena such as phase changes, crosslinking, recrystallization,
densification of porous materials, that can also modify their microstructure and related optical
properties. Usually materials are preselected for their known thermal stability in the temperature
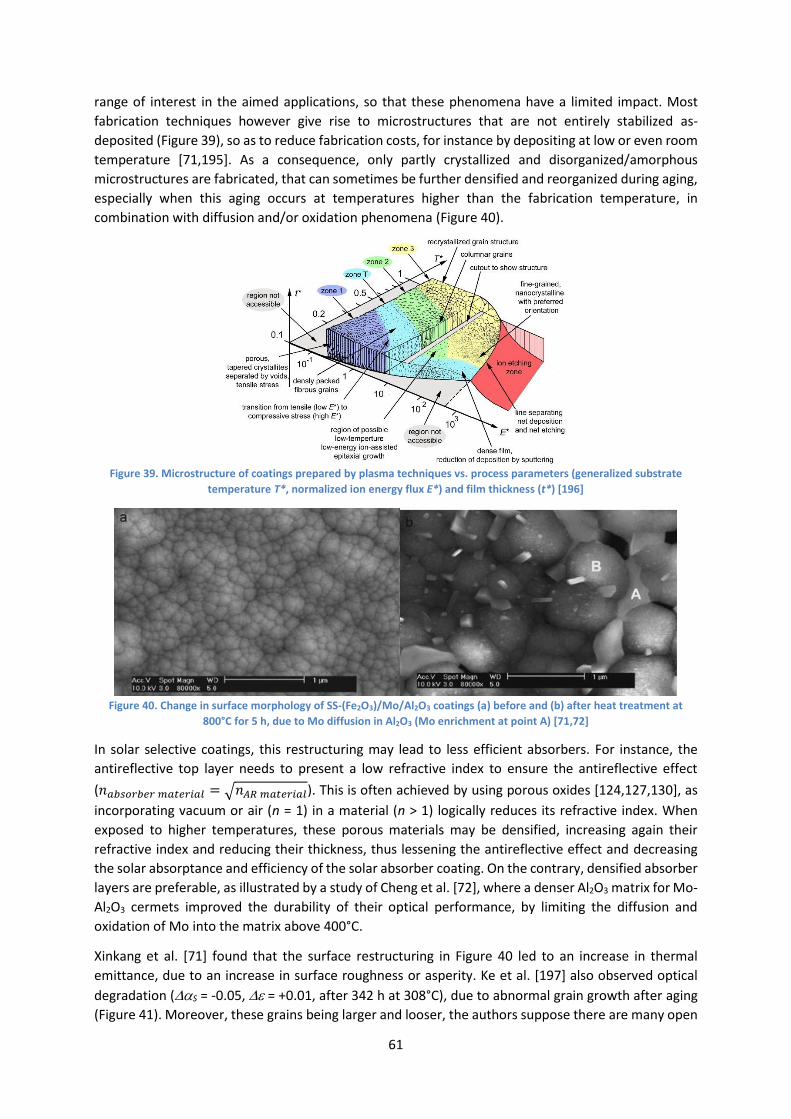
61
range of interest in the aimed applications, so that these phenomena have a limited impact. Most
fabrication techniques however give rise to microstructures that are not entirely stabilized as-
deposited (Figure 39), so as to reduce fabrication costs, for instance by depositing at low or even room
temperature [71,195]. As a consequence, only partly crystallized and disorganized/amorphous
microstructures are fabricated, that can sometimes be further densified and reorganized during aging,
especially when this aging occurs at temperatures higher than the fabrication temperature, in
combination with diffusion and/or oxidation phenomena (Figure 40).
Figure 39. Microstructure of coatings prepared by plasma techniques vs. process parameters (generalized substrate
temperature T*, normalized ion energy flux E*) and film thickness (t*) [196]
Figure 40. Change in surface morphology of SS-(Fe2O3)/Mo/Al2O3 coatings (a) before and (b) after heat treatment at
800°C for 5 h, due to Mo diffusion in Al2O3 (Mo enrichment at point A) [71,72]
In solar selective coatings, this restructuring may lead to less efficient absorbers. For instance, the
antireflective top layer needs to present a low refractive index to ensure the antireflective effect
(𝑛𝑎𝑏𝑠𝑜𝑟𝑏𝑒𝑟 𝑚𝑎𝑡𝑒𝑟𝑖𝑎𝑙 = √𝑛𝐴𝑅 𝑚𝑎𝑡𝑒𝑟𝑖𝑎𝑙). This is often achieved by using porous oxides [124,127,130], as
incorporating vacuum or air (n = 1) in a material (n > 1) logically reduces its refractive index. When
exposed to higher temperatures, these porous materials may be densified, increasing again their
refractive index and reducing their thickness, thus lessening the antireflective effect and decreasing
the solar absorptance and efficiency of the solar absorber coating. On the contrary, densified absorber
layers are preferable, as illustrated by a study of Cheng et al. [72], where a denser Al2O3 matrix for Mo-
Al2O3 cermets improved the durability of their optical performance, by limiting the diffusion and
oxidation of Mo into the matrix above 400°C.
Xinkang et al. [71] found that the surface restructuring in Figure 40 led to an increase in thermal
emittance, due to an increase in surface roughness or asperity. Ke et al. [197] also observed optical
degradation (S = -0.05, = +0.01, after 342 h at 308°C), due to abnormal grain growth after aging
(Figure 41). Moreover, these grains being larger and looser, the authors suppose there are many open

62
pores among the grain boundaries, which would act as fast diffusion paths for atoms, further degrading
the material and its performance.
Figure 41. Change in morphology of Al/Cr-O/Cr-N/SiO2 coating (b) before and (f) after 200 h heat treatment at 400°C
[197]
3.3. (Thermo)mechanical aging phenomena
Mechanical behavior of materials
3.3.1.1. Mechanical stress and strain
Materials in conditions of use are subjected to mechanical stress (N/m² or Pa), i.e., the application
of a force F (N) on an area A (m²) of the material, due to its surroundings (ambient pressure,
temperature, adjacent materials), offering resistance or imposing changes. As such forces can be
normal or parallel to the surface, the resulting stress can be tensile (“pulling”), compressive (“pushing”)
and/or shear (lateral) stress, uniaxial or biaxial, etc. For instance, Figure 42 illustrates the growth of an
oxide layer at the surface of a material, in the case of a linear oxidation behavior (see section 3.2.1.2
p.57): the mismatch of their lattice parameters causes the thin oxide to break under tensile (upper
case) or compressive stress (lower case), forbidding the formation of a stable protective oxide layer
and allowing for endless oxidation.
Figure 42. Possible mechanical stress causing the breakdown of oxide films [57]
As a response to stress, materials strain, i.e., deform. Tensile, compressive and shear stress
respectively result in tensile, compressive and shear strain . Strain can also be in volume (dilatation).
Since strains are ratios of two lengths or volumes, they are dimensionless.
3.3.1.2. Elastic and plastic behavior
According to Hooke’s law, for small strains, strain is proportional to stress, via the elastic (Young)
modulus E: 𝜎 = 𝐸 ∙ 𝜀, for simple tension. The material presents a linear elastic behavior: strain is
reversible and the material returns to its initial shape when stress is released. E can be measured via
tensile testing (Figure 43), where tensile stress is applied to a sample and its resulting strain is
measured, E being the slope of the linear part.

63
Figure 43. Tensile test of a ductile material and main mechanical properties [57]
For most materials, this elastic behavior only occurs at very low strain, typically ≤ 0.001, e.g., 1 mm
deformation for an initial length of 1 m. Beyond this point, some materials start to deform plastically,
i.e., their shape irreversibly changes. Materials with such ability are called ductile, and include metals.
The transition between elastic and plastic domains occurs when applying a stress equal to the yield
strength y of the material, also called its elasticity limit Re. Plastic deformation is a way for the
material to accommodate mechanical stress without breaking. Contrarily to ductile materials, brittle
materials such as ceramics cannot deform plastically and simply break beyond the elastic behavior
zone. Yet they are stronger than ductile materials, meaning they have a greater ability to withstand
stress without failure.
As stress is further increased, plastic deformation can only be sustained until the tensile strength (TS
or Rm) of the material is reached. Beyond that, plastic instability leads to the material weakening and
final fracture. The tougher the material, the later fracture will occur. Indeed toughness is the ability of
a material to plastically deform without fracturing, represented by the area under the stress-strain
curve. In order to be tough, a material must be both strong and ductile.
Plastic deformation is rendered possible by the formation and propagation of dislocations in the
material crystalline lattice: atomic planes locally slide past one another and move by gradual
rearrangement of chemical bonds breaking and reforming (Figure 44).
Figure 44. Propagation of a dislocation in a crystal lattice [57]
This is possible in materials with weak atomic bonds, such as metals (metallic bonds). Ceramics having
strong covalent bonds, the energy required to allow dislocations to propagate is very high, so that their
plastic deformation is only possible at very high temperatures close to their melting point.
To limit plastic deformation and delay fracture in ductile materials, polycrystalline structures such as
metal alloys can be used. The presence of atomic inclusions and grain boundaries in such materials act
as obstacles and oppose a resistance to the propagation of dislocations, strengthening the material
but reversely, non-continuous (micro or polycrystalline) materials are more sensitive to
oxidation/corrosion phenomena. Finally, alternating metals (ductile) and ceramic coatings (fragile) in
multilayers is a way to limit cracks propagations under stress and increase lifetime when in solar use
(see section 3.3.2).
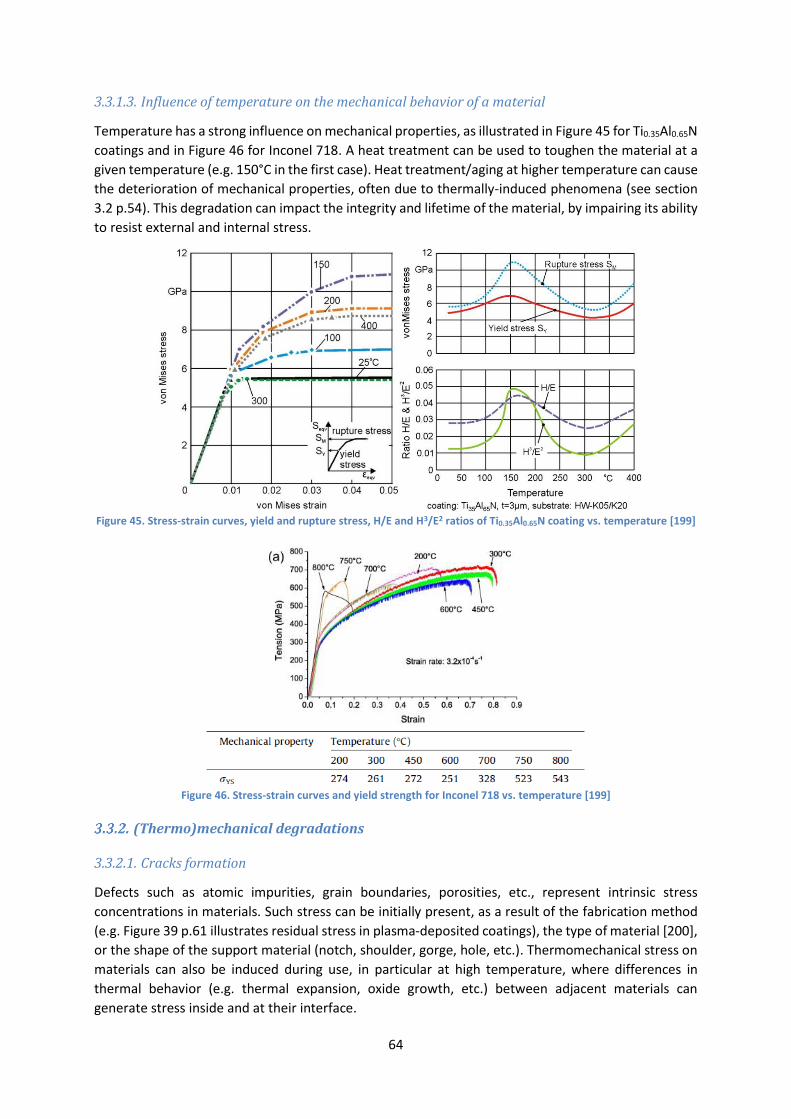
64
3.3.1.3. Influence of temperature on the mechanical behavior of a material
Temperature has a strong influence on mechanical properties, as illustrated in Figure 45 for Ti0.35Al0.65N
coatings and in Figure 46 for Inconel 718. A heat treatment can be used to toughen the material at a
given temperature (e.g. 150°C in the first case). Heat treatment/aging at higher temperature can cause
the deterioration of mechanical properties, often due to thermally-induced phenomena (see section
3.2 p.54). This degradation can impact the integrity and lifetime of the material, by impairing its ability
to resist external and internal stress.
Figure 45. Stress-strain curves, yield and rupture stress, H/E and H3/E2 ratios of Ti0.35Al0.65N coating vs. temperature [199]
Figure 46. Stress-strain curves and yield strength for Inconel 718 vs. temperature [199]
(Thermo)mechanical degradations
3.3.2.1. Cracks formation
Defects such as atomic impurities, grain boundaries, porosities, etc., represent intrinsic stress
concentrations in materials. Such stress can be initially present, as a result of the fabrication method
(e.g. Figure 39 p.61 illustrates residual stress in plasma-deposited coatings), the type of material [200],
or the shape of the support material (notch, shoulder, gorge, hole, etc.). Thermomechanical stress on
materials can also be induced during use, in particular at high temperature, where differences in
thermal behavior (e.g. thermal expansion, oxide growth, etc.) between adjacent materials can
generate stress inside and at their interface.

65
The relaxation of such intrinsic, residual or induced stress leads to the formation and enlargement of
cracks (Figure 47), especially in coatings. Moreover, the stress close to the crack σlocal is greater than
the average stress σ in the material: the crack has the effect of concentrating stress [57].This tends to
favor its propagation in the material.
Figure 47. Example of cracked surface after heat treatment of Al/Cr-O/Cr-N/SiO2 coating at 400 °C for 200 h [197] (right);
release of stored energy as a crack grows [57] (left)
3.3.2.2. Cracks propagation and fracture
Fracture and mechanical failure of materials result from the propagation of cracks, according to several
fracture modes initiated by tensile or shear stress (Figure 48).
Figure 48. Fracture modes allowing cracks propagation in materials
If a material containing a crack is sufficiently stressed, the crack can become unstable and grow in the
material, to cause catastrophically rapid fracture, or fast fracture, at a stress lower than the yield stress
[198]. Fast fracture occurs when, in a material subjected to a stress, a crack reaches some critical size
a, or when a material containing cracks of size a is subjected to some critical stress. Figure 49 illustrates
a case of fast fracture, initiated by intragranular cracking which escalated into transgranular cleavage
and final fracture.
Figure 49. Fast fracture and subsequent failure of a material [57]
One way of delaying crack propagation and subsequent fracture is by disposing obstacles to such
propagation in the component architecture, as in fiber-reinforced polymers (Figure 50). At a smaller
scale, solar absorber coatings also associate materials with high strength (ceramics) and materials with
high toughness (metals), that can lead to similar delays in cracks propagation.

66
Figure 50. Principle of crack stopping in composites [57]
3.3.2.3. Fatigue failure
Cracks can also form and grow slowly in materials even under low mechanical stress, typically below
the yield strength of the material (Figure 43), if this stress is applied cyclically (Figure 51) and for a large
number of cycles. This phenomenon is called fatigue and can also lead to material fracture and failure
over time. Fatigue failure occurs more rapidly and dramatically if cracks or stress concentrations pre-
exist in the material. The applied stress can be mechanical (e.g. tensile or compressive), thermal
(high/low temperature cycles) or thermomechanical, i.e., combining mechanical and thermal cyclic
stresses.
Figure 51. Cyclic stress leading to fatigue failure [57]
Fatigue behavior can be illustrated on a Wöhler or S-N curve (Figure 52), showing the applied stress vs.
the number of cycles that need to be applied to provoke failure at this particular level of stress. It
reveals two main regimes of fatigue:
• high-cycle fatigue (green area in Figure 52) where the material deformation is mostly elastic
due to lower stress (below cyclic yield strength) and the number of cycles needed to reach
failure is high (typically above 104 cycles). In some materials a fatigue limit is reached, where
the material can sustain an infinite number of cycles without fracture, if the applied stress is
lower than the cyclic yield strength of the material. It is the most desirable design. Most steels
present such fatigue limit. Other soft ductile materials such as Al will inevitably fail under cyclic
solicitation, however low the applied stress, as they have no fatigue limit.
• low-cycle fatigue (grey area in Figure 52) where the applied stress is higher, leading to plastic
strain, and the number of cycles to failure is lower (typically below 104 cycles). Figure 52 (left)
also illustrates that the stress level needed to plastically deform a material under cyclic stress
is lower than under constant stress: cyclic solicitation is more damaging than constant load.
Figure 52. Applied stress vs. material strain (S-S curve) and vs. number of cycles to failure (S-N curve) [201]
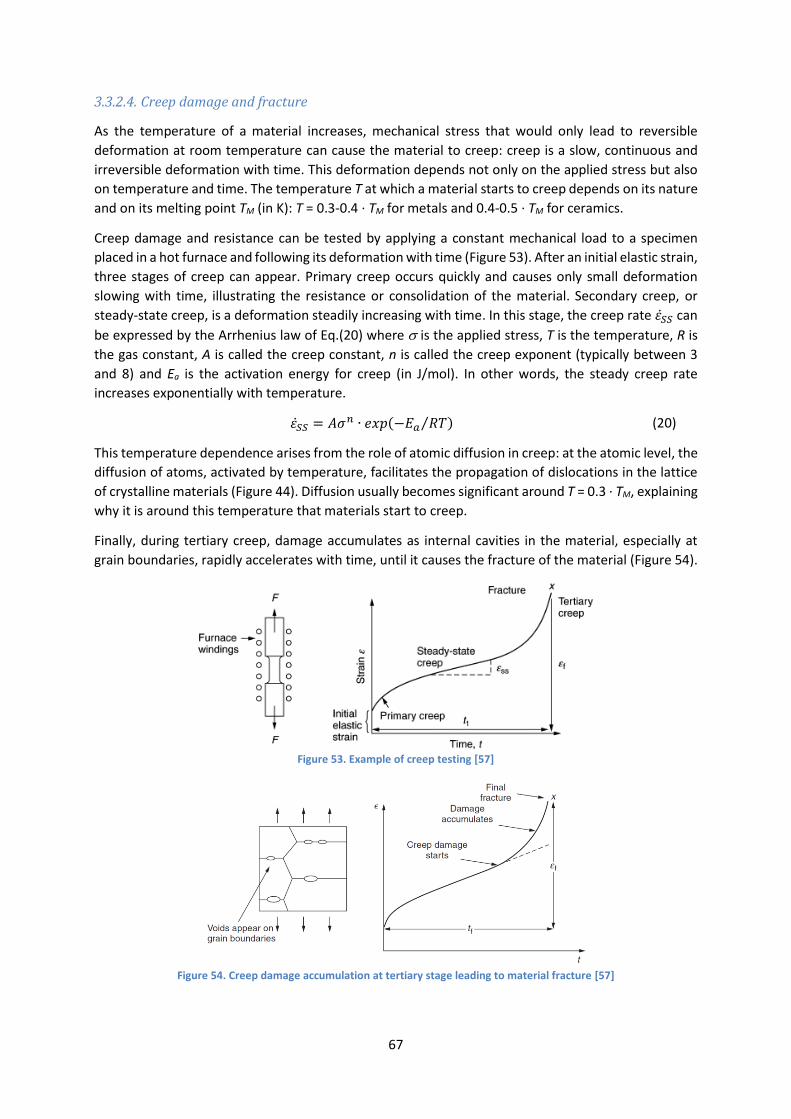
67
3.3.2.4. Creep damage and fracture
As the temperature of a material increases, mechanical stress that would only lead to reversible
deformation at room temperature can cause the material to creep: creep is a slow, continuous and
irreversible deformation with time. This deformation depends not only on the applied stress but also
on temperature and time. The temperature T at which a material starts to creep depends on its nature
and on its melting point TM (in K): T = 0.3-0.4 · TM for metals and 0.4-0.5 · TM for ceramics.
Creep damage and resistance can be tested by applying a constant mechanical load to a specimen
placed in a hot furnace and following its deformation with time (Figure 53). After an initial elastic strain,
three stages of creep can appear. Primary creep occurs quickly and causes only small deformation
slowing with time, illustrating the resistance or consolidation of the material. Secondary creep, or
steady-state creep, is a deformation steadily increasing with time. In this stage, the creep rate 𝜀�̇�𝑆 can
be expressed by the Arrhenius law of Eq.(20) where is the applied stress, T is the temperature, R is
the gas constant, A is called the creep constant, n is called the creep exponent (typically between 3
and 8) and Ea is the activation energy for creep (in J/mol). In other words, the steady creep rate
increases exponentially with temperature.
𝜀�̇�𝑆 = 𝐴𝜎𝑛 ∙ 𝑒𝑥𝑝(−𝐸𝑎 𝑅𝑇⁄ ) (20)
This temperature dependence arises from the role of atomic diffusion in creep: at the atomic level, the
diffusion of atoms, activated by temperature, facilitates the propagation of dislocations in the lattice
of crystalline materials (Figure 44). Diffusion usually becomes significant around T = 0.3 · TM, explaining
why it is around this temperature that materials start to creep.
Finally, during tertiary creep, damage accumulates as internal cavities in the material, especially at
grain boundaries, rapidly accelerates with time, until it causes the fracture of the material (Figure 54).
Figure 53. Example of creep testing [57]
Figure 54. Creep damage accumulation at tertiary stage leading to material fracture [57]

68
3.3.2.5. Thermomechanical phenomena in CSP receivers
In CSP, receivers are often considered to mostly sustain slow cyclic thermal stress due the day/night
variations of the incident concentrated solar irradiance (see sections 2.1.2 and 2.2 of this chapter),
which causes fatigue damage. However CSP receiver materials also have to bear:
• rapid thermal stress due to cloudy spells: when a cloud passes in the sky, the solar input on
the receiver decreases dramatically while the heat transfer fluid flowing inside it still extracts
its heat, leading to a rapid decrease of the receiver wall temperature for a short duration. For
this reason, infra-hour solar resource assessment and forecasting is a developing and critical
area of research in CSP to better adapt operating strategies and limit their impact on materials;
• long-term cyclic mechanical stress (creep-fatigue) at their attachment points with other parts
of the structure (support rods, welding, etc.), especially when they suffer thermal expansion
at high temperature;
• long-term mechanical stress at constant load and in temperature (creep) due to the weight of
the receiver itself, and the weight of the heat transfer fluid inside it, the latter sometimes also
being pressurized (giving rise to additional radial stress, see Figure 33). This is especially true
for linear receivers, which are only supported every few meters to limit shading.
Moreover, oxide phases and/or layers formed by thermally-induced phenomena (see section 3.2) bring
defects in the crystal lattice, and often have different thermal expansion than the initial absorber
materials. This, coupled with mechanical stress mentioned above, can in turn cause crack formation in
the oxide, propagating in the underlying material, leading to later thermomechanical failure.
Thermomechanical and thermally-induced aging phenomena are thus all intricately linked.
CSP receivers are therefore subjected to complex thermomechanical stress leading to complexly
coupled fatigue-creep and thermally-induced physicochemical aging phenomena that are hard to
predict, since they depend on the solar resource.
In the literature, thermomechanical stress and failure analysis mostly concerns receiver bulk materials
for high temperatures and/or high solar concentrations, e.g. metallic alloys, sometimes covered by
Pyromark® absorber paint [202–206] (Figure 55) or ceramics [207,208]. Apart from rare, recent
exceptions [209–211], very little information can be found about the thermomechanical behavior of
receivers covered with more complex selective absorber coatings, and the impact of
thermomechanical stress on such coatings. These elements are rarely taken into account by selective
coating developers, beyond the preselection of materials from other thermomechanical applications
such as aeronautics/automotive, turbines, cutting tools, etc. [212–214], and simple mechanical
characterization, e.g. hardness measurements on as-deposited samples [120]. For instance, Barshilia
et al. [192] just indicate that their AlxOy/Al/AlxOy multilayer absorber coatings suffered from differences
in thermal expansion between metal and ceramic layers, leading to crack formation and delamination,
causing subsequent oxidation.
Figure 55. Calculated temperature and equivalent thermomechanical stress distributions on the cylindrical tubes of an
Inconel 625 central receiver covered with Pyromark® paint [202] (graphical abstract)

69
3.4. Summary and conclusions on aging mechanisms
An overview of the main aging mechanisms concerning solar absorber coatings was presented, to
better understand the aging behavior of solar receivers and their selective absorber coatings. These
mechanisms were found to be intricately correlated and interdependent. They lead to material
deteriorations, through the formation of microstructural defects such as cracks that can propagate and
ultimately fracture the coating, causing the loss of optical performance and reduced lifetime. This is
illustrated by the summary schematic in Figure 57, showing the interconnection between CSP plant
configuration, correlated sources of degradation (section 2, p.49), aging mechanisms and subsequent
material deterioration, for a system consisting in a metallic receiver with a solar selective absorber
coating (SSAC).
Figure 56 more specifically illustrates how microdefects in the coating microstructure, existing as-
deposited and evolving with aging (grain boundaries, cavities, porosity) are preferential oxidation and
diffusion paths. For instance, the long-term cyclic exposure to high temperature in air can
simultaneously cause atomic diffusion and related oxidation, thermal cycling, thermal expansion,
mechanical tensile stress, fatigue, creep, etc. In particular, literature review and optical simulation
both reveal that diffusion phenomena tend to increase thermal emittance, whereas oxidation tends
to decrease solar absorptance, both being detrimental to the optical performance of the solar receiver.
Figure 56. Schematic of microdefects of an aged solar absorber coating [135]
Depending on the type of CSP technology, the relative impact of the sources of degradation may vary.
In the case of parabolic troughs, the receiver is protected with an evacuated glass tube and works
under vacuum conditions, avoiding the degradations linked to atmospheric conditions. However it
should ideally be capable of withstanding high temperatures in degraded vacuum, to anticipate the
loss in performance of the vacuum protection over the years and minimize SSAC damage if vacuum is
lost, especially when considering the high cost of replacing such components. Such coatings could also
serve for Linear Fresnel Reflectors working in static air. Solar tower and linear Fresnel technologies are
corresponding to the worst degradation cases.

Figure 57. Schematic of the interconnections between CSP plant configuration, correlated sources of degradation, aging mechanisms and subsequent material degradations for the
receiver with solar selective absorber coating (SSAC)

71
In central towers, the impact of solar and UV irradiance is higher, as the concentration ratio is much
higher, also leading to higher operating temperatures and their related degradation phenomena, what
is more in ambient/humid/polluted/ dusty air. However in this case thin absorber paints (e.g. silicone-
based Pyromark®) are widely used, with very simple structure (typically one 15 µm-thick SiO2 layer)
and excellent thermal stability, strongly limiting degradations: few changes in solar absorptance levels
were observed after thousands of hours of testing at 650°C [215]. Yet such paints: are not spectrally
selective (high emittance of 0.87) leading to large thermal losses at high working temperatures; must
be reapplied every few years (typically 5 years [216]) leading to high maintenance costs and difficulty
(the receiver being at the top of a high tower). Thus R&D efforts are still put to develop more complex
and efficient SSACs for central towers.
Figure 57 also summarizes possible remedial solutions to prevent or limit aging mechanisms and
subsequent degradation, as previously discussed and found in the literature. They are mostly based on
choosing SSACs constitute materials that are known to be intrinsically resistant to these aging
mechanisms, i.e., the diffusion barrier, oxidation-resistant, high temperature materials discussed in
Chapter 1: transition metal oxynitrides for tandem absorbers [119,121], refractory metals/ceramics
for multilayer absorbers and composites [109], antireflective oxides [127], etc.
Adapting the coating architecture is also paramount. For instance, to prevent the degradation of
thermal emittance via the diffusion of metallic elements from the receiver material, the diffusion
barrier layer/material must be placed between the latter and the coating. Similarly, to prevent the
oxidation of the absorber material(s) in air, the oxygen diffusion barrier layer must be placed at the
top of the coating (e.g. antireflective oxide) in contact with ambient conditions.
As can be expected, the efficiency of such preventive measures may suffer from the large amount of
uncertainty regarding the evolution of the materials and architectures with aging. When considering a
single material, aging mechanisms are easier to anticipate, or even predict and simulate. However with
the complex architecture of solar selective absorber coatings, there is a much larger number of factors
to take into account: materials chemical composition and microstructure (crystallinity,
porosity/density, defects, depending on fabrication methods), layer order, chemical affinity and
thicknesses, interdiffusion behavior, thermal expansion and lattice parameters matching, etc.
This complexity makes the prediction of material degradation and failure very difficult, explaining why
there is no common acceptable model to describe the aging of solar absorber coatings. Each type of
coating requires specific degradation and failure analysis. The only consensus is the definition of failure
for such coatings, based almost entirely on their optical performance. Simple models may have some
significance and serve as reference, e.g. pure metal oxidation models for metallic-containing SSACs.
The oxidation of metal alloys and metallic oxides is however more complicated to predict than the
oxidation of pure metals [217]. Literature in other research areas can also help better understand and
anticipate their behavior at high temperature, for instance regarding oxidation [218–223].
The solar receiver is one of the crucial elements to consider in the overall lifetime of a CSP plant. A
small change in the performance of the receiver can significantly affect the global performance of the
plant [224]. Despite the difficulty, anticipating the evolution in performance of the absorber is thus a
major issue for CSP developers, to predict its lifetime and also plan its technical maintenance [224].
Indeed, it is not desirable for CSP plants to be stopped for components replacement or maintenance,
as they lead to decreased energy production and subsequent loss of income for plant operators. It is
thus intended that each component and its materials should be able to function for the complete
lifetime of the CSP plant, which is around 20 to 25 years. Aging behavior and durability of the selected
solar absorbers thus need to be understood, controlled and anticipated as much as possible.

72
For this purpose, a number of aging procedures for CSP selective absorber coatings have been
developed in the literature, which are discussed in the next section.
4. Aging procedures and failure analysis of solar absorber coatings
4.1. Aging methodologies
The literature on solar selective absorber coatings mentioning aging studies is extensive. As a statistical
illustration, we have considered 79 aging conditions from 59 research articles relating aging tests on
selective absorber coatings [55,56,60,62,71,72,78,79,81,84–86,88,108,110,119–121,123–128,130–
133,144,150,169–174,180,181,183–186,188,189,225–240] (Table 6). Out of these 59 articles, 33 (i.e.,
42%) were published between 2015 and 2020, showing that the study of aging behavior is becoming
an increasingly important step for the development of solar absorbers. Out of the 79 tests, most are
applied on tandem (42/79 = 53%) and cermet (31/79 = 39%) configurations, as they are considered to
be the most promising absorbers for CSP applications at mid-high temperatures.
When looking more closely, it appears that most of these studies focus on three main parameters to
test the aging behavior of a solar selective absorber, with no clear consensus on their respective values.
These parameters are the temperature, atmosphere and duration applied to the materials during their
aging tests. Their values are chosen considering the CSP operating conditions for which the absorber
is intended, and adjusted to apply more or less harsh treatments to the absorber, sometimes
increasing them gradually to find the materials stability limit (failure), usually defined as a significant
loss in optical performance. Temperature and atmosphere are chosen first and the tests are applied
for a certain amount of time, usually until there is a significant deterioration of the absorber.
In some conditions, failure occurs after long aging durations. In this case, the tests are in fact applied
in several aging steps of shorter duration that accumulate on the sample (e.g. in [235], samples were
treated up to 600 hours, using eight different cycles with short duration before 100 hours and then
long duration of 100 hours for the next cycles). In addition to being easier to apply, this method has
the advantage of allowing for the evolution of the coating to be measured at regular intervals, to
understand to some extent the kinetics of aging mechanisms. This procedure however amounts to
thermal cycling (heating-cooling cycles) that can have a different and more deleterious effect than
continuous aging (fatigue), so the former must be distinguished from the latter, especially since there
is no consensus on the intermediate steps durations or number of cycles applied.
The tests were categorized according to their temperature range, atmosphere chosen and number of
hours applied (Table 6). Most of these tests (62/79 = 78%) were applied in the [400-600°C] temperature
range, where most of the absorbers failed. The most used atmosphere for the tests is vacuum (42/79
= 53%) rather than air (35/79 = 44%). Almost half of the tests (36/79 = 46%) did not exceed 100 hours,
mostly due to the low thermal stability shown by the absorber.
Figure 58 shows the correlation between the temperature and duration of the different tests, for the
different atmospheres. To illustrate the relationship between the aging duration and temperature
applied during the considered tests, their correlation coefficient was calculated using the Spearman
correlation 𝑟𝑠 shown in Eq.(21). This coefficient is determined by dividing the covariance of the rank
(rk) variables by the product of the standard deviations 𝜎𝑖 of the rank variables.
𝑟 =𝑐𝑜𝑣(𝑟𝑘𝑥, 𝑟𝑘𝑦)
𝜎𝑟𝑘𝑥∙ 𝜎𝑟𝑘𝑦
(21)
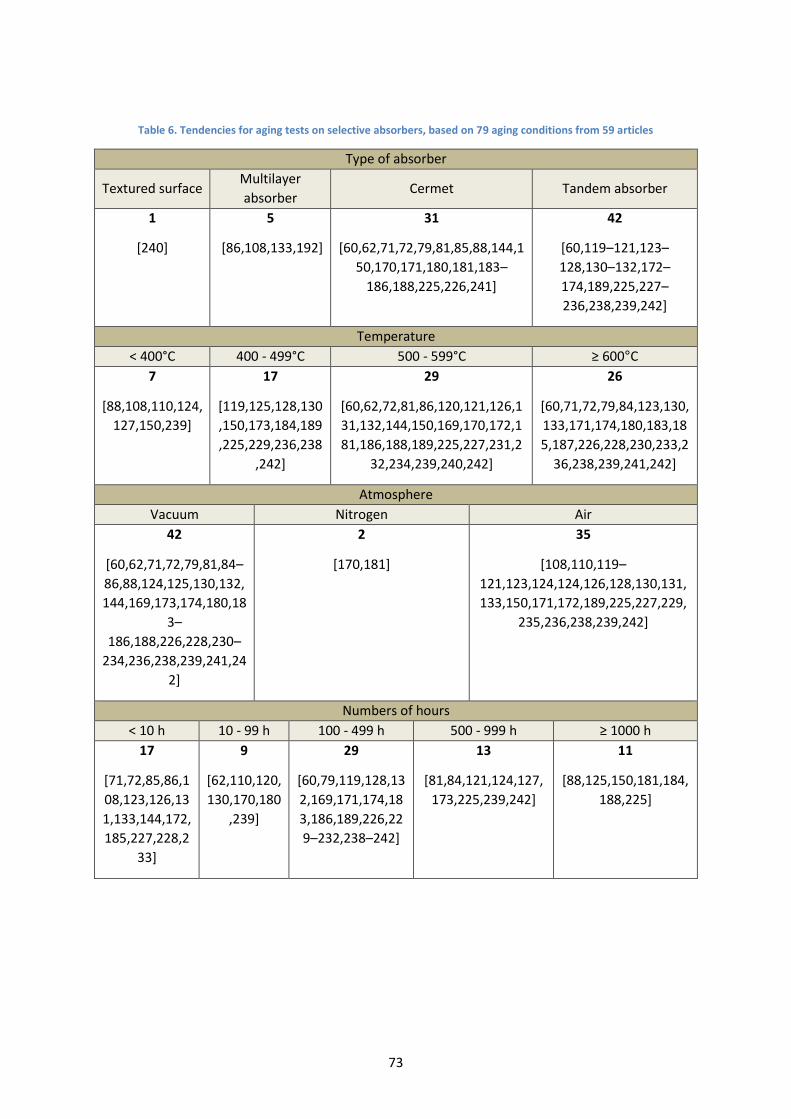
73
Table 6. Tendencies for aging tests on selective absorbers, based on 79 aging conditions from 59 articles
Type of absorber
Textured surface Multilayer
absorber Cermet Tandem absorber
1
[240]
5
[86,108,133,192]
31
[60,62,71,72,79,81,85,88,144,1
50,170,171,180,181,183–
186,188,225,226,241]
42
[60,119–121,123–
128,130–132,172–
174,189,225,227–
236,238,239,242]
Temperature
< 400°C 400 - 499°C 500 - 599°C ≥ 600°C
7
[88,108,110,124,
127,150,239]
17
[119,125,128,130
,150,173,184,189
,225,229,236,238
,242]
29
[60,62,72,81,86,120,121,126,1
31,132,144,150,169,170,172,1
81,186,188,189,225,227,231,2
32,234,239,240,242]
26
[60,71,72,79,84,123,130,
133,171,174,180,183,18
5,187,226,228,230,233,2
36,238,239,241,242]
Atmosphere
Vacuum Nitrogen Air
42
[60,62,71,72,79,81,84–
86,88,124,125,130,132,
144,169,173,174,180,18
3–
186,188,226,228,230–
234,236,238,239,241,24
2]
2
[170,181]
35
[108,110,119–
121,123,124,124,126,128,130,131,
133,150,171,172,189,225,227,229,
235,236,238,239,242]
Numbers of hours
< 10 h 10 - 99 h 100 - 499 h 500 - 999 h ≥ 1000 h
17
[71,72,85,86,1
08,123,126,13
1,133,144,172,
185,227,228,2
33]
9
[62,110,120,
130,170,180
,239]
29
[60,79,119,128,13
2,169,171,174,18
3,186,189,226,22
9–232,238–242]
13
[81,84,121,124,127,
173,225,239,242]
11
[88,125,150,181,184,
188,225]

74
Figure 58. Correlation between aging temperature and duration based on 79 aging conditions from 59 articles
The large disparity in Figure 58 shows that there is no consensus on the aging protocols applied to solar
absorber coatings: each manufacturer applies different aging to their absorber, without following any
standard procedure. Most tests are for temperatures between 400°C to 600°C and durations between
100 and 1000 hours. The applied temperatures are higher in vacuum conditions than in air, underlining
the deleterious effect of oxidation on the coatings durability. Test durations in vacuum and air are
similar, although there seems to be a tendency for longer durations in air, as CSP applications now
demand it. The longest durations (≥ 1,000 hours) are applied at temperatures between 350°C and
600°C, mostly in air. The maximum duration applied to an absorber in this review is 5000 hours in air
for a temperature of 350°C [150], to prove the durability of a commercial absorber. At the highest
temperatures (≥ 700°C), the duration is short (≤ 10 hours), the tests being just intended to rapidly
observe a deterioration of the coating and be able to make conclusions about failure mechanisms
[72,180,228,233]. Overall, the negative values of the temperature-duration correlation coefficients,
equal to -0.24 for vacuum tests and -0.37 for air tests, reflect that the aging duration is reduced as
temperature increases, especially in air, as the time to failure also decreases in harsher conditions.
Their weak values (closer to 0 than -1) further illustrates that no clear relationship exists between
temperature and duration, especially in vacuum.
On the whole, this bibliographic study shows that there is no common standard in aging procedures.
This is in part due to the large variety of coating solutions explored, and their different thermal stability.
However, it is mostly due to differing goals for coating developers. If some authors explore in detail
the aging behavior of their coatings [181,184,225], most developers simply aim at demonstrating the
stability of their coating performance [171,185,188,226]. They do not always push their coatings to
failure, applying only temperatures too low and/or durations too short to reach it. In addition, they
tend to carry out optical measurements only, but no further material characterization. Therefore, the
thermal stability limit and aging mechanisms occurring in their coatings remain unexplored. Aging test
standardization does not seem to be actively pursued in the solar selective absorber coating
community.
To better understand existing aging procedures and aspire to their standardization, we have divided
them into two main categories, depending on the temperature, atmosphere and duration applied to
the absorbers: representative aging and accelerated aging. These two ways of applying aging are
detailed in the following.

75
Representative aging
Representative aging is the first (and often the last) step taken to test a solar selective absorber. The
main objective with this type of aging is to prove the thermal stability of the coating under atmospheric
and/or vacuum conditions close to that of the intended CSP application. An absorber coating is
considered thermally stable when it is capable of maintaining its initial optical properties and integrity
after being exposed to aging conditions. It is observed from the evolution of optical properties, i.e.
solar absorptance and thermal emittance, with temperature and time.
The chosen temperature for this type of test is slightly higher than the real operating temperature
intended for the absorber, usually around 50°C higher. The chosen atmosphere also depends on the
final use of the absorber. The most used options are:
• air, an oxidant atmosphere that can be:
o static (natural convection) or dynamic (forced convection);
o dry (without H2O) or humid;
o filtered (e.g. without H2O and CO2), or with added pollutants (e.g. NOx);
o recreated using an equivalent partial pressure of oxygen [243];
• vacuum, with levels between 5·10-5 and 10 mbar [84];
• inert gases, such as nitrogen or argon [170,181].
The last two are suitable for parabolic trough applications where the receiver is maintained under
vacuum, or simply to compare with aging in air and highlight the specific effects of the oxidant
atmosphere. Testing in air is mandatory for the other CSP technologies.
In practice, representative aging tests can be initiated with short duration tests at increasing
temperatures, to observe the thermal behavior and find the failure temperature of the absorber. These
short duration tests last typically less than 10 hours, 2 hours being a popular choice [119,128,233,237].
Due to their short duration, they are only applied in one cycle, consisting of a controlled heating ramp,
stable plateau at the testing temperature, then natural cooling.
Afterwards, tests at longer durations (> 100 hours) are applied, cumulatively (on the same sample) or
continuously (on different equivalent samples), below or around this failure temperature, to get an
idea of the coating durability (long-term stability) in conditions representative of the CSP application.
Accelerated aging
After applying representative aging to a solar selective absorber coating to find its thermal stability
limit, accelerated aging can be applied, for the main purpose of predicting the lifetime of the absorber
coating, by accelerating its aging over much shorter durations (e.g. several days or weeks) than its
intended operating time (e.g. several years or tens of years).
Methods for accelerated aging tests of solar absorber coatings were first introduced in the work of the
International Energy Agency (IEA) Solar Heating and Cooling (SHC) Programme, under Task 10 “Solar
materials R&D”(1985-1991) [244]. As a continuation of Task 10, the IEA Working Group of Materials in
Solar Thermal Collectors (MSTC) was founded in 1994 [245–249]. These studies concerned low
temperature solar thermal collectors working below 280°C, mostly for Domestic Hot Water (DHW)
systems. Predictions of long-term stability of coatings for such solar collectors by accelerated aging in
Task 10 were confirmed by examples in the field, e.g. in [250] for a selective absorber coating on a
single glazed flat plate collector, assessed by performing constant load tests in the laboratory, where
a temperature-dependent Arrhenius behavior was suggested for the degradation of optical properties.
This type of testing method was submitted to the International Organization for Standardization (ISO)

76
in January 1997 [251] for standardization, later named ISO/CD 12592, 2 “Solar Energy – Materials for
flat plate collectors – Qualification test procedures for solar surface durability”. Based on this standard,
a qualification method of accelerated aging at higher temperature was presented by the European
Committee for Standardization, named ISO standard draft EN 12975-3-1 (2011) [252]. It is now used
for qualification evaluation and service life prediction for commercial products in low temperature
solar collectors.
Yet to this day no such standard was ever proposed for the accelerated aging and lifetime prediction
of solar selective absorbers used in CSP. However similar aging procedures were attempted by SSACs
developers. These procedures are therefore explained in further detail in the next subsections.
4.1.2.1. Thermal stability and lifetime prediction with Arrhenius method
Exposing the coatings to aging temperatures higher than the operating temperature is the most
popular method of applying accelerated aging. It allows to activate and speed up thermally-induced
physicochemical phenomena that can be responsible for the coating deterioration (see section 3.2).
Thus for degradation caused by diffusion, oxidation or other chemical reactions, the temperature
dependence of the process can be described by an Arrhenius relationship. The aging process rate K is
then expressed with Eq.(22).
𝐾 = 𝐴 ∙ 𝑒𝑥𝑝(−𝐸𝑎 𝑅𝑇⁄ ) (22)
Ea is the activation energy in kJ/mol, i.e., the minimum energy required to start the aging process. A is
the characteristic parameter of the process (e.g. for diffusion, A is D0 as in Eq.(17) p.55). T is the
temperature applied during the accelerated aging test. R is the gas constant.
For SSACs, the aging of interest relates to the changes in solar absorptance S (S(t) = (t) – (t=0))
and/or thermal emittance before and after the aging test. The rate in Eq.(22) is thus considered
proportional to the variation of the optical properties with time (𝐾~∆𝛼𝑆
∆𝑡𝑜𝑟
∆𝜀
∆𝑡) and expressed in h-1.
The evolutions S and can also be followed simultaneously through the performance criterion PC
(ISO 22975-3 standard [252], Eq.(23)). If degradations occur (decrease in solar absorptance and
increase in thermal emittance), the value of PC increases: the higher PC, the higher the degradation.
Once PC reaches 0.05, the coating is considered fully degraded. The degradation rate of Eq.(22) can
therefore also be expressed as the evolution of PC with time.
𝑃𝐶 = −∆𝛼𝑆 + 0.5 ∙ ∆𝜀 (23)
It is usually presumed that there is only one mechanism of degradation [246] so that its activation
energy Ea and parameter A can classically be attributed to said mechanism. Nevertheless, since the
process rate is expressed as the change in optical properties with time, the Arrhenius relationship
represents in this case a global degradation of the coating including all thermally-induced mechanisms,
with a global activation energy Ea for optical degradation. If the kinetics of these phenomena differ too
much, the estimation of Ea can become tricky. More to the point, to apply Arrhenius method one must
verify by material characterization (e.g. EDS, XPS, TGA, etc.) that thermally-induced phenomena are
the main cause for optical degradation in the chosen temperature range, so that they can be correctly
represented by an Arrhenius law.
To predict the lifetime of solar selective absorber coatings, this global activation energy must be
estimated. It can be determined using an Arrhenius plot vs. 1/T (Eq.(24) derived from Eq. (22)). Its
linear slope −𝐸𝑎
𝑅 gives direct access to Ea.

77
𝑙𝑛(𝐾) = 𝑙𝑛 (∆𝛼𝑆 𝑜𝑟 ∆𝜀
∆𝑡) = −
𝐸𝑎
𝑅∙
1
𝑇+ 𝑙𝑛 𝐴 (24)
To obtain this plot, several equivalent samples of the same coating are used. Each sample is treated at
a different temperature, called accelerated temperatures Tacc, that must be chosen carefully. Indeed
they must be higher than the aimed operating temperature Top by a meaningful amount, to significantly
accelerate aging, though not too high and not too far from one another, so that the aging mechanisms
at play remain the same than at Top and also the same for all Tacc values. For good accuracy, at least
three temperatures are needed for pertinent linear regression; a step in temperature of less than 50°C
is used; several samples are treated for each temperature Tacc; the variation of optical properties at
each Tacc must be monitored at regular intervals and the test must reach a reasonable total duration,
typically around or longer than 100 hours. As an example, Figure 59 illustrates an accelerated aging
test in air previously carried out at PROMES laboratory on a TiAlN tandem absorber [253] intended for
Top = 350 - 500°C. Accelerated temperatures of 600, 620 and 650°C were applied with durations of 150,
100 and 40 hours respectively. An activation energy around 155 kJ/mol was deduced from the
corresponding Arrhenius plot.
Knowing the activation energy, the yearly decay rate d(Top) in %/year of the optical property of interest
at the operating temperature Top can be estimated using Eq.(25). It takes into account the number of
hours of operation over a year, typically 8 hours/day for 365 days = 2920 hours/year. The absolute
decay at Top can then be deduced by multiplying the yearly decay rate by the number of years of
operation intended for the coating (Eq.(26)), typically 25 years.
Figure 59. Solar absorptance evolution with accelerated aging tests of a TiAlN coating at PROMES and corresponding
Arrhenius plot [253]
Knowing the activation energy, the yearly decay rate d(Top) in %/year of the optical property of interest
at the operating temperature Top can be estimated using Eq.(25). It takes into account the number of
hours of operation over a year, typically 8 hours/day for 365 days = 2920 hours/year. The absolute
decay at Top can then be deduced by multiplying the yearly decay rate by the number of years of
operation intended for the coating (Eq.(26)), typically 25 years.
𝑑(𝑇𝑜𝑝) [%/𝑦𝑒𝑎𝑟] = −𝑒𝑥𝑝 (−𝐸𝑎
𝑅 · 𝑇𝑜𝑝) ∙ 𝑁° ℎ𝑜𝑢𝑟𝑠/𝑦𝑒𝑎𝑟 (25)
𝐴𝑏𝑠𝑜𝑙𝑢𝑡𝑒 𝑑𝑒𝑐𝑎𝑦 (%) = 𝑑(𝑇𝑜𝑝) · 𝑁° 𝑜𝑓 𝑦𝑒𝑎𝑟𝑠 (26)
These values are illustrated in Figure 60 for the previous example. At Top = 500°C a drop in absorptance
of 7 points/year gives rise to an unacceptable decrease in absorptance of 10 points after only 2 years.
At Top = 350°C the estimated lifetime is higher than 25 years with a decrease in absorptance lower than
1 point.

78
Figure 60. Solar absorptance yearly decay rate vs. operation temperature (left) and solar absorptance absolute decay vs.
time in operation (right) of a TiAlN coating at PROMES [253]
An acceleration factor 𝑎𝑇𝑎𝑐𝑐 of the aging at Tacc can be deduced from the activation energy (Eq.(27)
derived from Eq.(22)). It allows estimating the test duration tacc needed to be applied to the coating at
temperature Tacc to reach the same state as after the operation time top at temperature Top. These
values are illustrated in Figure 61 for the previous example: for instance, the accelerated aging duration
needed to represent 25 years of operation for 8 hours/day (73000h) at Top = 500°C is tacc ≈ 6 months
(193 days) at Tacc = 600°C, or 2 months at 650°C. In another work [151], the time to reach PC = 0.05
(Eq.(23)), considered as irreversible optical degradation, was calculated as a function of Top following
a similar procedure. The coating was declared stable at 375°C for 25 years of standard operation.
𝑎𝑇𝑎𝑐𝑐=
𝑡𝑜𝑝@ 𝑇𝑜𝑝
𝑡𝑎𝑐𝑐 @ 𝑇𝑎𝑐𝑐= 𝑒𝑥𝑝 (−
𝐸𝑎
𝑅∙ [
1
𝑇𝑎𝑐𝑐−
1
𝑇𝑜𝑝]) (27)
Figure 61. Acceleration factor and accelerated aging duration calculated for a TiAlN coating at PROMES [253]
The example in Figure 61 shows that the acceleration factor accessible with accelerated aging strongly
depends on the operation temperature: the higher Top, the longer the necessary aging to become
representative of the real time in operation (e.g., 25 years at Top). It is also possible to increase Tacc, but
one must still ensure that aging phenomena remain similar at both temperature levels (Top and Tacc)
for Arrhenius method to stay valid. Higher aging temperatures may induce new phenomena such as
phase changes or densification.
Figure 62 [161] further illustrates this notion and also considers the influence of the activation energy
of optical degradation, based on two examples found in the literature: a mid-temperature selective
coating (SCHOTT PTR70 receiver coating, Ea = 170 kJ/mol, Top = 400°C [254]) and a high temperature
selective coating (TiAlN/AlON tandem absorber, Ea = 100 kJ/mol, Top = 500°C [128,151]). At 700°C, the
acceleration factors are respectively 25 and 11700, giving rise to aging durations of respectively 19h
and 8940h (more than a year). This example highlights that the Arrhenius method, first suggested for
low temperature absorber coatings (solar thermal collectors), may be suitable for accelerating the
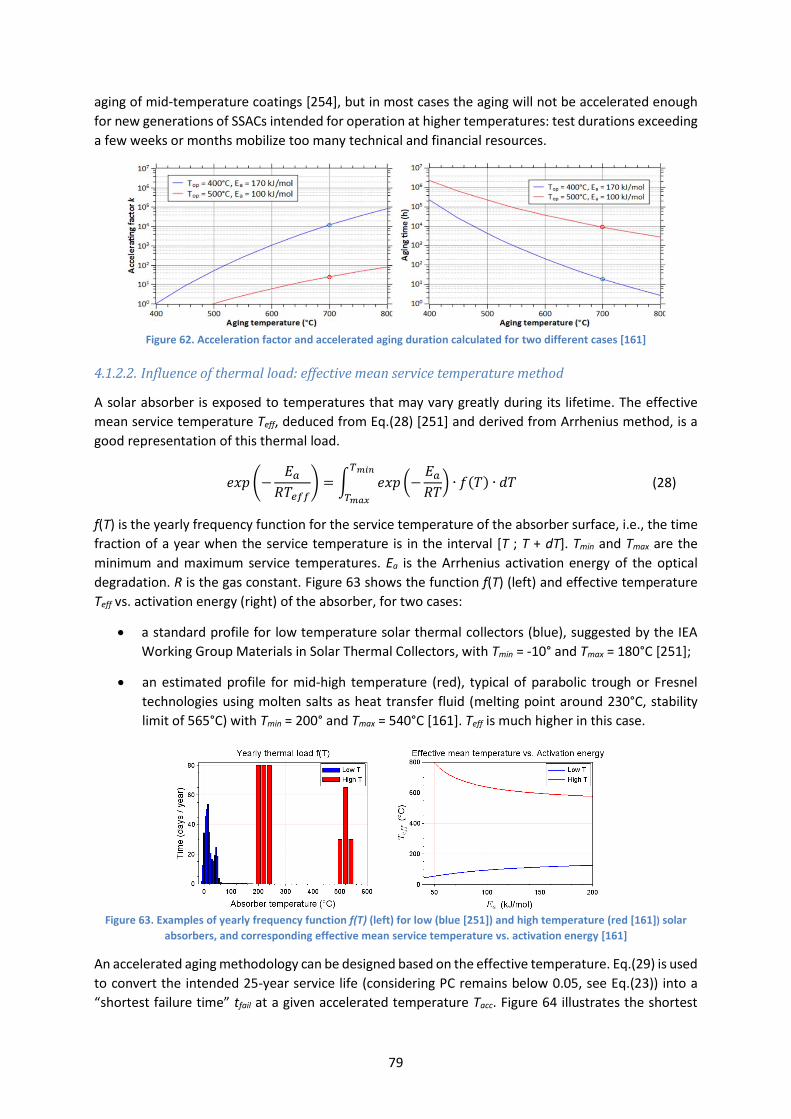
79
aging of mid-temperature coatings [254], but in most cases the aging will not be accelerated enough
for new generations of SSACs intended for operation at higher temperatures: test durations exceeding
a few weeks or months mobilize too many technical and financial resources.
Figure 62. Acceleration factor and accelerated aging duration calculated for two different cases [161]
4.1.2.2. Influence of thermal load: effective mean service temperature method
A solar absorber is exposed to temperatures that may vary greatly during its lifetime. The effective
mean service temperature Teff, deduced from Eq.(28) [251] and derived from Arrhenius method, is a
good representation of this thermal load.
𝑒𝑥𝑝 (−𝐸𝑎
𝑅𝑇𝑒𝑓𝑓) = ∫ 𝑒𝑥𝑝 (−
𝐸𝑎
𝑅𝑇) ∙ 𝑓(𝑇) ∙ 𝑑𝑇
𝑇𝑚𝑖𝑛
𝑇𝑚𝑎𝑥
(28)
f(T) is the yearly frequency function for the service temperature of the absorber surface, i.e., the time
fraction of a year when the service temperature is in the interval [T ; T + dT]. Tmin and Tmax are the
minimum and maximum service temperatures. Ea is the Arrhenius activation energy of the optical
degradation. R is the gas constant. Figure 63 shows the function f(T) (left) and effective temperature
Teff vs. activation energy (right) of the absorber, for two cases:
• a standard profile for low temperature solar thermal collectors (blue), suggested by the IEA
Working Group Materials in Solar Thermal Collectors, with Tmin = -10° and Tmax = 180°C [251];
• an estimated profile for mid-high temperature (red), typical of parabolic trough or Fresnel
technologies using molten salts as heat transfer fluid (melting point around 230°C, stability
limit of 565°C) with Tmin = 200° and Tmax = 540°C [161]. Teff is much higher in this case.
Figure 63. Examples of yearly frequency function f(T) (left) for low (blue [251]) and high temperature (red [161]) solar
absorbers, and corresponding effective mean service temperature vs. activation energy [161]
An accelerated aging methodology can be designed based on the effective temperature. Eq.(29) is used
to convert the intended 25-year service life (considering PC remains below 0.05, see Eq.(23)) into a
“shortest failure time” tfail at a given accelerated temperature Tacc. Figure 64 illustrates the shortest

80
time to failure vs. activation energy at two values of Tacc: 250°C for the low temperature absorber (blue)
and 700°C for the high temperature absorber (red). For low temperature solar absorbers, the time to
failure considering degradation mechanisms with Ea ≥ 50 kJ/mol is tfail = 10 days when aging at 250°C,
which are very acceptable conditions for aging tests. For higher temperature absorbers however, the
time to failure considering degradation mechanisms with Ea ≥ 100 kJ/mol reaches 11 years when aging
at 700°C. In other words, it would take 11 years of aging tests at 700°C to be representative of 25 years
of operation at the effective mean service temperature: this is hardly accelerated aging anymore. Once
again, this aging methodology is not suitable for high temperature absorbers.
𝑡𝑓𝑎𝑖𝑙 [𝑦𝑒𝑎𝑟𝑠] = 25 ∙ 𝑒𝑥𝑝 (−𝐸𝑎
𝑅∙ [
1
𝑇𝑒𝑓𝑓(𝐸𝑎)−
1
𝑇𝑎𝑐𝑐]) (29)
Figure 64. Failure time vs. activation energy for two different accelerated temperatures (low in blue, high in red) [161]
4.1.2.3. Towards more suitable accelerated aging methods?
As discussed, the previous classical accelerated aging methods are not always well suited for testing
high temperature solar absorber coatings, due to the low acceleration factor they provide. Also they
do not take into account parameters other than the temperature levels reached by the absorber. Other
aging methodologies may be of interest in this field, and some of them are proposed in this section.
4.1.2.3.1. Considering thermal fatigue
Thermal cycling is inherent to the life of solar absorbers. This cycling results in thermomechanical
fatigue (see section 3.3.2), that can lead to the failure of the absorber. Therefore, the response of
candidate SSACs to thermal cycling should be tested. The Coffin-Manson relationship (Eq.(30)) is
commonly used to model the low-cycle fatigue failure of materials subjected to thermal cycling [255–
257]. The same formalism can be applied to CSP solar absorbers [258]. It is based on the notion that a
power-law dependence exists between the material optical degradation (e.g. the evolution of solar
absorptance with the number of cycles: 𝑑𝛼 𝑑𝑛⁄ ) and the temperature change T during the cycles
(𝛥𝑇 = 𝑇𝑚𝑎𝑥 − 𝑇𝑚𝑖𝑛). 𝑓(𝛼) represents the time-dependence of the degradation mechanism (e.g. in
[258], the evolution of absorptance with thermal cycling could be fitted with 𝛼(𝑡) = 𝑎 ∙ 𝑡𝛾 + 𝛼0 power
law, which they derived to obtain 𝑓(𝛼) = −(𝛼0 − 𝛼)𝛾−1
𝛾 .
𝑑𝛼
𝑑𝑛= 𝑘(𝛥𝑇) ∙ 𝑓(𝛼) = 𝐴 ∙ (𝛥𝑇)𝛽 ∙ 𝑓(𝛼) (30)
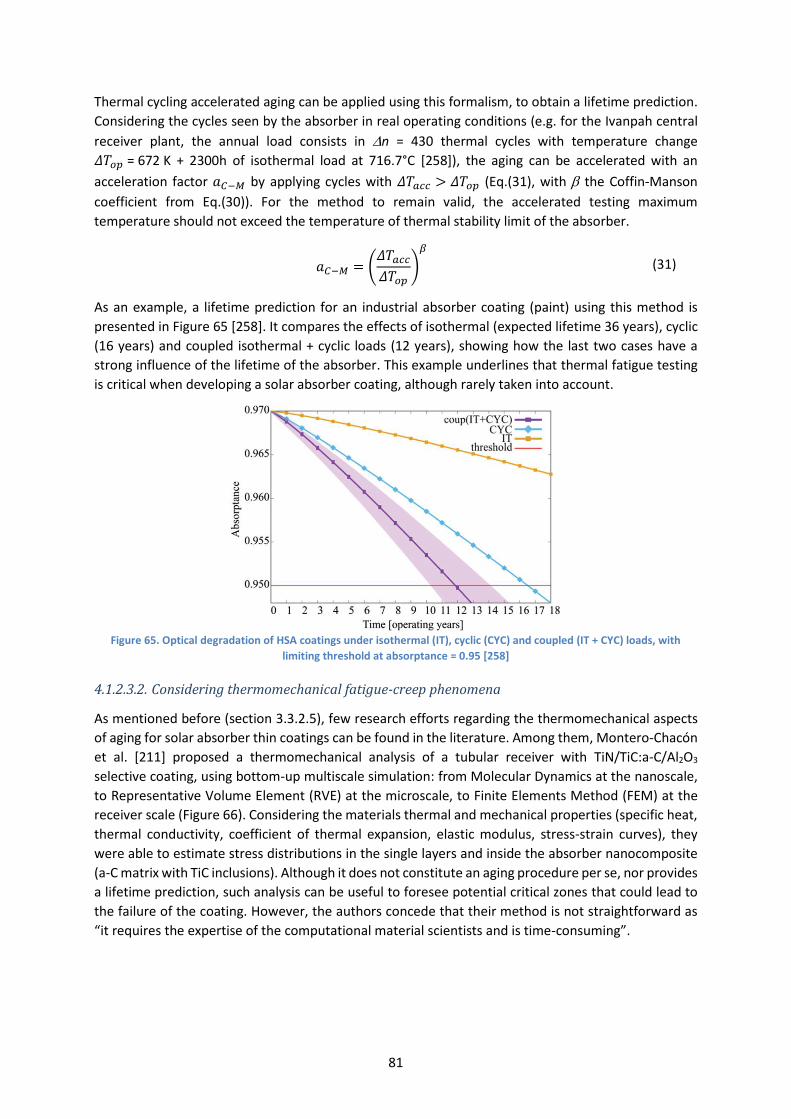
81
Thermal cycling accelerated aging can be applied using this formalism, to obtain a lifetime prediction.
Considering the cycles seen by the absorber in real operating conditions (e.g. for the Ivanpah central
receiver plant, the annual load consists in n = 430 thermal cycles with temperature change
𝛥𝑇𝑜𝑝 = 672 K + 2300h of isothermal load at 716.7°C [258]), the aging can be accelerated with an
acceleration factor 𝑎𝐶−𝑀 by applying cycles with 𝛥𝑇𝑎𝑐𝑐 > 𝛥𝑇𝑜𝑝 (Eq.(31), with the Coffin-Manson
coefficient from Eq.(30)). For the method to remain valid, the accelerated testing maximum
temperature should not exceed the temperature of thermal stability limit of the absorber.
𝑎𝐶−𝑀 = (𝛥𝑇𝑎𝑐𝑐
𝛥𝑇𝑜𝑝)
𝛽
(31)
As an example, a lifetime prediction for an industrial absorber coating (paint) using this method is
presented in Figure 65 [258]. It compares the effects of isothermal (expected lifetime 36 years), cyclic
(16 years) and coupled isothermal + cyclic loads (12 years), showing how the last two cases have a
strong influence of the lifetime of the absorber. This example underlines that thermal fatigue testing
is critical when developing a solar absorber coating, although rarely taken into account.
Figure 65. Optical degradation of HSA coatings under isothermal (IT), cyclic (CYC) and coupled (IT + CYC) loads, with
limiting threshold at absorptance = 0.95 [258]
4.1.2.3.2. Considering thermomechanical fatigue-creep phenomena
As mentioned before (section 3.3.2.5), few research efforts regarding the thermomechanical aspects
of aging for solar absorber thin coatings can be found in the literature. Among them, Montero-Chacón
et al. [211] proposed a thermomechanical analysis of a tubular receiver with TiN/TiC:a-C/Al2O3
selective coating, using bottom-up multiscale simulation: from Molecular Dynamics at the nanoscale,
to Representative Volume Element (RVE) at the microscale, to Finite Elements Method (FEM) at the
receiver scale (Figure 66). Considering the materials thermal and mechanical properties (specific heat,
thermal conductivity, coefficient of thermal expansion, elastic modulus, stress-strain curves), they
were able to estimate stress distributions in the single layers and inside the absorber nanocomposite
(a-C matrix with TiC inclusions). Although it does not constitute an aging procedure per se, nor provides
a lifetime prediction, such analysis can be useful to foresee potential critical zones that could lead to
the failure of the coating. However, the authors concede that their method is not straightforward as
“it requires the expertise of the computational material scientists and is time-consuming”.

82
Figure 66. Multiscale thermomechanical analysis of a tubular receiver coated with TiN/TiC:a-C/Al2O3 [211]
Regarding experimental aging procedures, during the ASTORIX project (ANR 2014-2019, PROMES-
CNRS partner), it was advised that thermomechanical aging tests must be applied to SSACs for more
realistic lifetime prediction, in the same manner as for high temperature thermal power plant
materials. As a first approach in the ASTORIX project, TiAlN absorbers were for instance submitted to
bending tests at 150 MPa inside a furnace, first with constant temperature of 600°C at different
durations up to 192h, then with thermal cycling between 600°C (8 hours) and 250°C (16 hours, natural
cooling), and their microstructure and optical properties were studied to follow the impact of aging
(unpublished work).
High temperature tensile or bending tests were proposed as they can effectively combine cyclic
(fatigue) and long duration (creep) thermomechanical loads, with controlled strain rate (Figure 67).
Tests at different temperatures and strain rates are classically used for bulk materials and provide
accelerated aging and time to failure/lifetime predictions (e.g. [259]), in a similar manner as with the
previously discussed thermal aging and thermal fatigue protocols, except thermomechanical failure is
more often determined by the apparition and fast propagation of microcracks. These methods could
also be adapted to receivers covered with SSACs, as was initiated in the ASTORIX project, considering
failure as loss of optical performance.
Figure 67. Typical stress-strain curves and corresponding strain rates (in relative deformation L/L per second)
4.1.2.3.3. Considering atmospheric conditions
Contrary to solar mirrors [260–262], the influence of water vapor (humidity), salt sprays or sand
particles in the operating atmosphere of the solar absorber are rarely considered factors when testing
their durability. However only some authors have considered it [258,263]. For instance, Noč et al. [258]
found that in similar thermal conditions, the addition of humidity had a notably aggravating effect on
the degradation of solar absorptance (Figure 68). Chen et al. [263] found that salt spraying (NaCl 50
g/L) resulted in the corrosion of some SSACs at temperatures as low as 35°C and durations as short as
24h.

83
Figure 68. Optical degradation under similar cyclic thermal load, in dry (A) and humid (B) air [258]
To apply accelerated aging tests with humidity, a well-accepted model of the humidity stress factor
known as Peck’s model (Eq.(32)) can be used [264–266]. This model includes the effect of relative
humidity (RH), and of temperature using an Arrhenius term with activation energy Ea.
𝑡𝑓 = (𝑅𝐻)𝑛 · 𝑒𝑥𝑝 (𝐸𝑎
𝑅𝑇) (32)
tf is the time to failure, RH is the relative humidity and n is the kinetic parameter, which depends on
the materials. To estimate Ea under humidity, tests at three different temperatures and constant
humidity can be applied. In a similar manner, tests at three levels of humidity and constant
temperature can be applied to determine n.
This is also a type of accelerated aging, with an acceleration factor 𝑎𝑃. The latter is given by Eq.(33)
where 𝑅𝐻𝑜𝑝 and 𝑇𝑜𝑝 represent the real operating conditions depending on the type of CSP technology
and its implantation site, while 𝑅𝐻𝑎𝑐𝑐 and 𝑇𝑎𝑐𝑐 are the relative humidity and temperature applied
during the aging tests.
𝑎𝑃 = (𝑅𝐻𝑜𝑝
𝑅𝐻𝑎𝑐𝑐)
𝑛
· 𝑒𝑥𝑝 (𝐸𝑎
𝑅𝑇∙ [
1
𝑇𝑜𝑝−
1
𝑇𝑎𝑐𝑐]) (33)
4.1.2.3.4. Considering concentrated solar irradiance
As solar absorbers are intended to be exposed to concentrated solar radiation, accelerated thermal
aging protocols can be designed using said radiation, to be more representative of the CSP application,
especially regarding high temperature gradients and high flux densities with energetic UV-visible
photons, that cannot be produced with simple thermal aging in a furnace. Only few attempts were
made using concentrated solar irradiance as aging accelerant, mostly due to the technical complexity
and cost of the required facilities (see section 4.2.2). Previous work in PROMES-CNRS laboratory
proposed such aging procedures [36,160,267,268], using a unique solar facility that will be presented
in details in the next chapters, as it was also implemented and further developed in this thesis. The
facility was calibrated and designed to be as representative as possible of thermal flux profiles seen by
solar receivers in real CSP operation (Figure 69). It allowed for high irradiance levels, high temperature
gradients, rapid thermal cycling and thermal shocks, as a way to apply representative and accelerated
aging. Similar efforts were made in other concentrated solar and solar-simulated facilities [35,224].
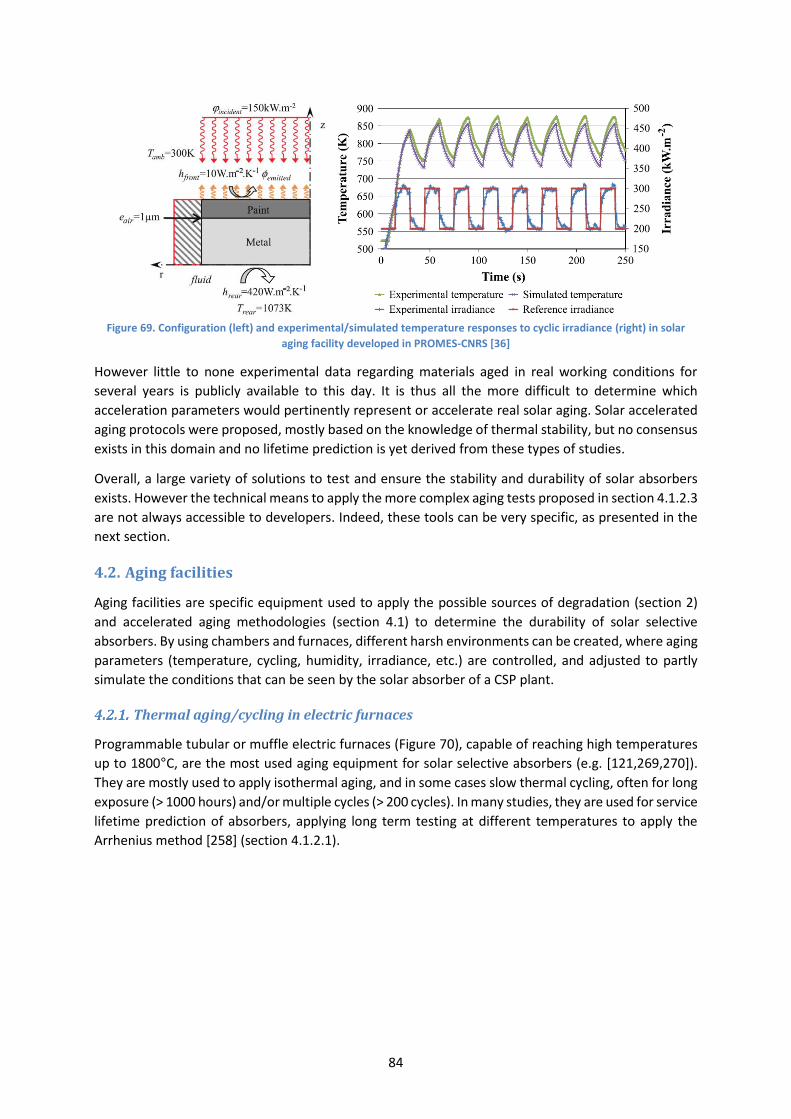
84
Figure 69. Configuration (left) and experimental/simulated temperature responses to cyclic irradiance (right) in solar
aging facility developed in PROMES-CNRS [36]
However little to none experimental data regarding materials aged in real working conditions for
several years is publicly available to this day. It is thus all the more difficult to determine which
acceleration parameters would pertinently represent or accelerate real solar aging. Solar accelerated
aging protocols were proposed, mostly based on the knowledge of thermal stability, but no consensus
exists in this domain and no lifetime prediction is yet derived from these types of studies.
Overall, a large variety of solutions to test and ensure the stability and durability of solar absorbers
exists. However the technical means to apply the more complex aging tests proposed in section 4.1.2.3
are not always accessible to developers. Indeed, these tools can be very specific, as presented in the
next section.
4.2. Aging facilities
Aging facilities are specific equipment used to apply the possible sources of degradation (section 2)
and accelerated aging methodologies (section 4.1) to determine the durability of solar selective
absorbers. By using chambers and furnaces, different harsh environments can be created, where aging
parameters (temperature, cycling, humidity, irradiance, etc.) are controlled, and adjusted to partly
simulate the conditions that can be seen by the solar absorber of a CSP plant.
Thermal aging/cycling in electric furnaces
Programmable tubular or muffle electric furnaces (Figure 70), capable of reaching high temperatures
up to 1800°C, are the most used aging equipment for solar selective absorbers (e.g. [121,269,270]).
They are mostly used to apply isothermal aging, and in some cases slow thermal cycling, often for long
exposure (> 1000 hours) and/or multiple cycles (> 200 cycles). In many studies, they are used for service
lifetime prediction of absorbers, applying long term testing at different temperatures to apply the
Arrhenius method [258] (section 4.1.2.1).

85
Figure 70. An example of muffle furnace (Nabertherm furnace) used for thermal aging
The configuration of these furnaces ensures a good thermal uniformity inside the heating chamber, by
using ceramic heating plates. It also offers a good control of the temperature using a PID (proportional-
integral-derivative) controller and thermocouples installed along the inside of the furnace. This way,
heating can be applied as a linear profile with a fixed heating ramp, though the latter is limited by the
furnace inertia and power. The cooling phase is often not controlled but simple natural cooling with
decreasing exponential profile, also dependent on the furnace inertia.
Most electric furnaces work in atmospheric conditions, however some are also equipped to obtain
vacuum conditions, with vacuum levels down to 10-5 mbar. Both configurations are widely used for
solar absorbers, with tests done under atmospheric conditions for central receiver and LFR absorbers
and under vacuum conditions for PT absorbers.
Overall, this type of aging facility can give access to a good prediction of the thermal stability of solar
absorbers. However the relatively slow heating ramp accessible (e.g. 20°C/min) and the radiation (mid-
infrared) applied to the absorbers create non-realistic conditions compared to real CSP working
conditions, where the rise in temperature can be very quick (e.g. 20°C/s) and the absorbed radiation
is in the solar range (UV-Vis-NIR). Other types of aging facilities offer more realistic conditions, as
explained in the following subsection. The main advantage of electric furnaces is that they allow for a
more precise control and reproducibility of the aging tests over long durations.
Thermal cycling under concentrated solar radiation
4.2.2.1. Solar furnaces
A solar furnace is a facility that uses a concentrating system to produce high irradiance levels and
subsequent high temperatures at the focal point of such system, where materials are placed to test
them. This type of aging device can thus simulate more realistic CSP conditions than electric furnaces.
Representative or accelerated aging conditions can be simulated with adapting the solar flux density,
temperature level and temperature/flux gradients: irradiance levels can be adapted by using shutters,
that can also give a rapid variation of the incoming solar flux. The most used concentrating system for
solar furnaces is the parabolic dish (Figure 71), due to the good optical efficiency that gives high-flux
solar radiation levels and also an easy access to the focal point. This technology enables to reach very
high temperatures, thanks to the high optical efficiency of the parabolic dishes used with a
concentration factor often higher than 10,000 [267].

86
Figure 71. Example of a solar furnace located at the Plataforma Solar de Almeria [271]
There are three well-known solar furnace installations used for aging research purposes: PSA
(Plataforma Solar de Almeria) laboratories in Almeria (Spain) [271] (Figure 71), PROMES-CNRS
laboratory in Odeillo (France) [267] and Sandia National Laboratory NSTT (National Solar Thermal Test
Facility) in Albuquerque, New Mexico (US) [224]. These laboratories have long experience in the field,
which has enabled an optimization of such facilities. One of the reference works done on solar furnaces
for research purposes is presented by Berenguel et al. [271] with the 20 kW solar furnace in Almeria.
It shows several types of PID with gain scheduling and a self-tuning controller, as well as experimental
results for temperature control with a law developed for this type of furnace [272].
In practice, irradiance levels are highly dependent on atmospheric conditions and sky clarity over time,
so there is some uncertainty about the applied aging parameters, due to the dependence on weather
fluctuations during the experiment. Also the aging duration is limited to the number of hours of direct
sunlight during the day, therefore the total aging duration is necessarily shorter than with electric
furnaces, due to the large number of days needed to accumulate hours of aging on the samples (e.g. 6
hours of aging under concentrated solar irradiance correspond to 2 half-days of tests, often spread
over several days, weather pending). Finally, these facilities imply relatively high investment costs and
require specific know-how. These are all disadvantages for this aging technology, which however
remains the closest to real CSP operation.
4.2.2.2. High-flux solar simulators
Solar simulators are based on a light source that duplicates the solar spectrum and beam
characteristics, to recreate an artificial emission spectrum similar to real solar radiation. A high-flux
solar simulator is a type of solar simulator that gives access to high irradiance fluxes with the help of
optical concentrators and high-powered lamps to be used indoors [273].
High-flux solar simulators combine the advantages of the previous aging facilities. As for electric
furnaces, tests can be applied for long durations, and this whatever the climate, weather or DNI
conditions, also providing more stable and reproducible experimental conditions. As for solar furnaces
however, the tested materials can be heated with high heating ramps and irradiated with concentrated
“solar-like” radiation instead of infrared thermal radiation, thus reaching irradiance and temperature
levels more representative of the CSP application.
The light sources used in high flux simulators are xenon arc, metal halide or argon lamps, emitting
near-solar light, and equipped with an ellipsoidal back reflector serving as concentrator (Figure 72).
The first designs were built in the 1960s, to be used in space applications research projects sponsored
by NASA for spacecraft ground-testing by simulating environments at orbital altitudes [274–276]. In
the 1970s, low-flux solar simulators were first used for the development of solar collectors, then in the

87
1990s, high-flux simulators were built, mostly for testing thermochemical and CSP components. The
first design of a high-flux simulator was proposed in 1991 for the study of chemical reactions under
high temperature and flux, at the Lawrence Berkeley Laboratory [277]. With the help of an ellipsoidal
concentrator, it delivered 3 kW on a 7 x 7 cm target and the peak flux reached 16 MW/m2.
Figure 72. MIT CSP solar simulator [278]
Currently, there are several high-flux solar simulators around the world, capable of achieving high
fluxes (1000 - 15000 kW/m²), used mostly for research purposes. The Paul Scherrer Institute (PSI) [277],
the Swiss Federal Institute of Technology in Zurich [279,280], the German Aerospace Center (DLR)
[281], the University of Minnesota [282], the Massachusetts Institute of Technology (MIT) [278], the
Spectrolab (T-HIPSS) in USA and the Universidad Politécnica de Madrid in Spain [283], all have designed
and built such systems for studying thermochemical processes and materials under very high
concentration. One of the references for solar simulators for CSP purposes is the one developed at PSI
[277]: 50 kW or 11000 suns, with 10 independent arrays of xenon arc lamps and their ellipsoidal
concentrators, making it easier to apply various power capacities. Hence the same designs are
successfully used in DLR and University of Minnesota.
The main drawbacks of this technology are the associated costs, in most cases higher than $100k, and
also the difficult assembly and operation due to the large size, customized components, and significant
safety requirements regarding fire hazard, ozone extraction, etc. Xenon arc lamps, the most used in
this type of simulator, are also quite expensive and must be replaced regularly (e.g. every 1000 hours).
To solve the cost problem, a low cost reduced-size solar simulator was built at MIT [278]. It uses seven
1.5 kW metal halide lamps as light source and offers mid flux levels: peak 60 kW/m² and average 45
kW/m². The peak irradiance is therefore lower (due to poorly concentrating reflectors), but the total
cost is maintained below $10k. In any case, a very high level of concentrated irradiance is not necessary
for testing materials intended for much lower concentration CSP systems such as parabolic troughs.
Atmospheric conditions: controlled atmosphere chambers
Controlled atmosphere or climate/weathering chambers are another type of aging technology. Climate
chambers allow testing absorbers with Damp Heat, Humidity Freeze, sand erosion or Neutral Salt
Spray. These types of chambers are more widely used to test solar reflectors and PV modules, due to
the low operating temperatures and exposure to conditions at ground level. However they can also be
relevant for testing solar absorbers [284].
A Damp Heat (DH) tester is a climate test chamber usually set to work at 85°C and 85% relative
humidity (HR). Damp heat tests are relevant when the receiver is not in operation, for example during
the night or in the absence of sun, with a humid atmosphere or dew [285,286]. The standards used for
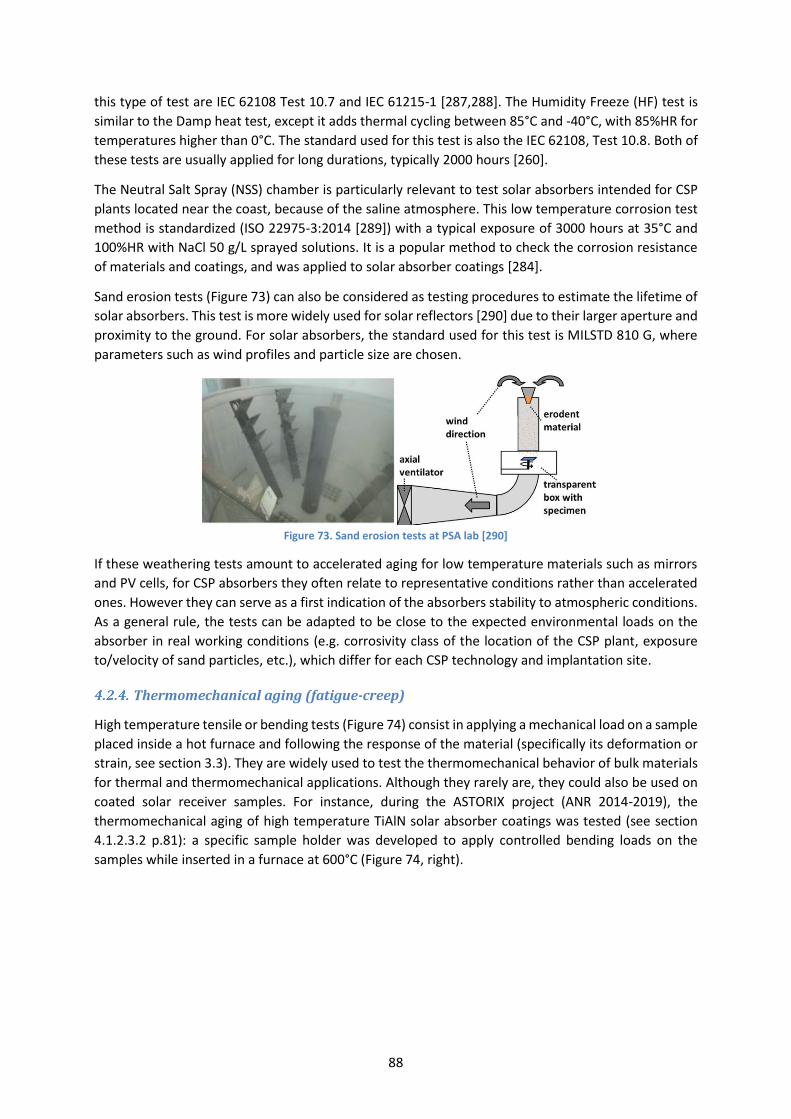
88
this type of test are IEC 62108 Test 10.7 and IEC 61215-1 [287,288]. The Humidity Freeze (HF) test is
similar to the Damp heat test, except it adds thermal cycling between 85°C and -40°C, with 85%HR for
temperatures higher than 0°C. The standard used for this test is also the IEC 62108, Test 10.8. Both of
these tests are usually applied for long durations, typically 2000 hours [260].
The Neutral Salt Spray (NSS) chamber is particularly relevant to test solar absorbers intended for CSP
plants located near the coast, because of the saline atmosphere. This low temperature corrosion test
method is standardized (ISO 22975-3:2014 [289]) with a typical exposure of 3000 hours at 35°C and
100%HR with NaCl 50 g/L sprayed solutions. It is a popular method to check the corrosion resistance
of materials and coatings, and was applied to solar absorber coatings [284].
Sand erosion tests (Figure 73) can also be considered as testing procedures to estimate the lifetime of
solar absorbers. This test is more widely used for solar reflectors [290] due to their larger aperture and
proximity to the ground. For solar absorbers, the standard used for this test is MILSTD 810 G, where
parameters such as wind profiles and particle size are chosen.
Figure 73. Sand erosion tests at PSA lab [290]
If these weathering tests amount to accelerated aging for low temperature materials such as mirrors
and PV cells, for CSP absorbers they often relate to representative conditions rather than accelerated
ones. However they can serve as a first indication of the absorbers stability to atmospheric conditions.
As a general rule, the tests can be adapted to be close to the expected environmental loads on the
absorber in real working conditions (e.g. corrosivity class of the location of the CSP plant, exposure
to/velocity of sand particles, etc.), which differ for each CSP technology and implantation site.
Thermomechanical aging (fatigue-creep)
High temperature tensile or bending tests (Figure 74) consist in applying a mechanical load on a sample
placed inside a hot furnace and following the response of the material (specifically its deformation or
strain, see section 3.3). They are widely used to test the thermomechanical behavior of bulk materials
for thermal and thermomechanical applications. Although they rarely are, they could also be used on
coated solar receiver samples. For instance, during the ASTORIX project (ANR 2014-2019), the
thermomechanical aging of high temperature TiAlN solar absorber coatings was tested (see section
4.1.2.3.2 p.81): a specific sample holder was developed to apply controlled bending loads on the
samples while inserted in a furnace at 600°C (Figure 74, right).

89
Figure 74. High temperature tensile tester (left), custom bending tester applied to TiAlN absorber coatings (right,
courtesy of ANR ASTORIX project and Mines Saint-Etienne)
5. Conclusions on aging studies and justification of the present work
The main goal for current and next generation CSP plants is to increase the plant global efficiency by
increasing the operating temperature, so as to increase the heat-to-electricity conversion efficiency.
This also increases the temperature that solar receivers, the components in charge of absorbing solar
radiation, will have to withstand, typically between 550 and 800°C, ideally in air. Yet the surface of the
receiver still needs to be optically functionalized to guarantee high solar-to-heat conversion efficiency.
This is achieved with spectrally selective absorber coatings (SSACs), combining high solar absorptance
and low infrared emittance. The temperature stability limit of current commercial coatings is however
between 400°C and 580°C in vacuum, so far they exhibit poor thermal stability at high temperatures
under atmospheric conditions. Thus, there is still a need to find solar selective absorber coatings with
satisfying thermal and mechanical stability at high temperatures in atmospheric conditions, and this
for long durations, i.e., durability. As a consequence, research in the field of air-stable high
temperature SSACs is very active.
The harsher working conditions these new SSACs are intended for however calls for a thorough
evaluation of their aging behavior, in order to validate their suitability. Indeed, CSP absorbers are
subjected to many potential and interdependent sources of degradation: high flux solar radiation, high
temperatures, thermal cycling, thermal shocks, oxidant/corrosive/erosive atmospheres, etc. Yet often
such aging analysis remains limited. Current aging tests in the literature focus on conservative tests at
laboratory scale, not representative of CSP applications. In most cases, they are purely thermal
treatments applied in electric furnaces heating with infrared radiation, due to the simplicity and
availability of the technology. Often no thermal cycling is applied (continuous tests) and the materials
are tested at moderate temperatures in air (< 400°C) or higher temperatures but in vacuum, mostly
for short durations (< 100 h).
The most frequently identified aging mechanisms are therefore necessarily thermally-induced, and
directly linked (with an Arrhenius law) to temperature. The main ones are: atomic interdiffusion of the
chemical elements from the support material (usually a metallic alloy) and the different layers
constituting the SSAC (metallic infrared-reflective sublayer, absorber layer, antireflective top layer);
oxidation of any or all materials of the absorber (including the support and all layers of the SSAC), by
surface adsorption, inward diffusion and insertion/bonding of oxygen atoms in the structure. Oxidation
and diffusion often enhance one another as they both create defects and diffusion pathways in the
crystal lattice. Although other phenomena are less studied in SSACs, the extensive know-how from
other applications such as turbines, aeronautics or tools leads one to realize that CSP harsh working
conditions can also cause phase changes, densification, thermal expansion, and related physical
degradations such as the formation and propagation of cracks, which in turn enhance diffusion and
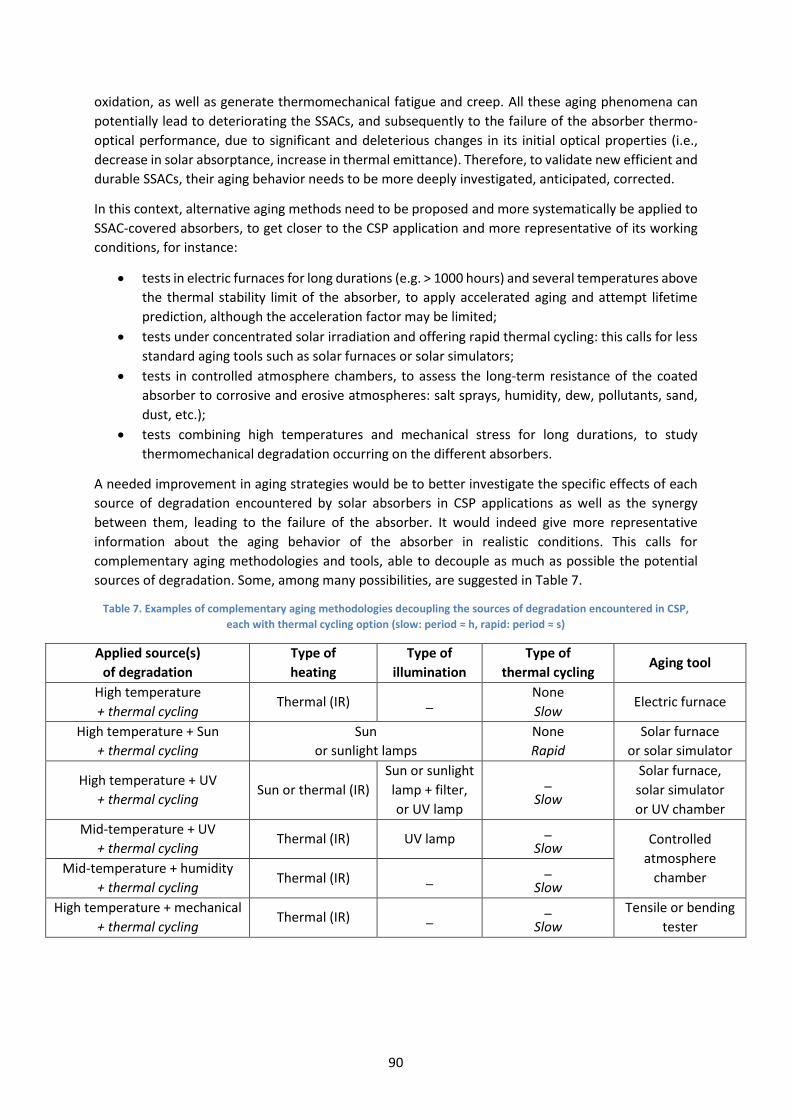
90
oxidation, as well as generate thermomechanical fatigue and creep. All these aging phenomena can
potentially lead to deteriorating the SSACs, and subsequently to the failure of the absorber thermo-
optical performance, due to significant and deleterious changes in its initial optical properties (i.e.,
decrease in solar absorptance, increase in thermal emittance). Therefore, to validate new efficient and
durable SSACs, their aging behavior needs to be more deeply investigated, anticipated, corrected.
In this context, alternative aging methods need to be proposed and more systematically be applied to
SSAC-covered absorbers, to get closer to the CSP application and more representative of its working
conditions, for instance:
• tests in electric furnaces for long durations (e.g. > 1000 hours) and several temperatures above
the thermal stability limit of the absorber, to apply accelerated aging and attempt lifetime
prediction, although the acceleration factor may be limited;
• tests under concentrated solar irradiation and offering rapid thermal cycling: this calls for less
standard aging tools such as solar furnaces or solar simulators;
• tests in controlled atmosphere chambers, to assess the long-term resistance of the coated
absorber to corrosive and erosive atmospheres: salt sprays, humidity, dew, pollutants, sand,
dust, etc.);
• tests combining high temperatures and mechanical stress for long durations, to study
thermomechanical degradation occurring on the different absorbers.
A needed improvement in aging strategies would be to better investigate the specific effects of each
source of degradation encountered by solar absorbers in CSP applications as well as the synergy
between them, leading to the failure of the absorber. It would indeed give more representative
information about the aging behavior of the absorber in realistic conditions. This calls for
complementary aging methodologies and tools, able to decouple as much as possible the potential
sources of degradation. Some, among many possibilities, are suggested in Table 7.
Table 7. Examples of complementary aging methodologies decoupling the sources of degradation encountered in CSP,
each with thermal cycling option (slow: period ≈ h, rapid: period ≈ s)
Applied source(s)
of degradation
Type of
heating
Type of
illumination
Type of
thermal cycling Aging tool
High temperature
+ thermal cycling Thermal (IR) _
None
Slow Electric furnace
High temperature + Sun
+ thermal cycling
Sun
or sunlight lamps
None
Rapid
Solar furnace
or solar simulator
High temperature + UV
+ thermal cycling Sun or thermal (IR)
Sun or sunlight
lamp + filter,
or UV lamp
_
Slow
Solar furnace,
solar simulator
or UV chamber
Mid-temperature + UV
+ thermal cycling Thermal (IR) UV lamp
_
Slow Controlled
atmosphere
chamber Mid-temperature + humidity
+ thermal cycling Thermal (IR) _
_
Slow
High temperature + mechanical
+ thermal cycling Thermal (IR) _
_
Slow
Tensile or bending
tester

91
As a first step towards with ideal aging strategy, following the critical analysis of literature exposed in
this chapter, this thesis will present original experimental studies focused on the following elements:
• for practical reasons, not all the sources of degradation mentioned in Table 7 could be applied,
as they are not all available at PROMES-CNRS, and the extensive corresponding work would go
beyond the scope of a thesis. Therefore, the first two methodologies described in Table 7 were
applied. They were compared with one another, with the objective to observe the synergy and
decorrelate the specific effects of several critical aging parameters: high temperature,
concentrated solar exposure, slow and rapid thermal cycling. For this purpose, a series of
complementary aging tests, including representative and accelerated aging, were derived from
the knowledge of aging factors under real CSP conditions and devised as explained in details
in the following chapters. As a general rule, aging was increased or accelerated using higher
values of aging parameters and/or repeated stress level variation (cycling).
• the tests were applied on sets of equivalent samples, presenting three typical configurations
for next-generation high temperature air-stable SSACs, and following the line of research and
previous work done in our laboratory: two architectures based on tandem absorbers, provided
by project collaborators (HEF-IREIS Saint-Etienne and CSIR-NAL Bangalore), and one with a
dielectric-metal-dielectric multilayer absorber, developed at PROMES-CNRS in Perpignan
[194]. The exact SSACs configurations will be presented in Chapter 3 and the equivalence of
the sets of samples will be discussed in Chapter 4, as a prerequisite to comparable aging tests.
• two PROMES-CNRS dedicated experimental aging facilities were implemented, calibrated,
adapted and further developed during this thesis: an electric furnace that applies long-term
thermal aging and slow thermal cycling, and a solar furnace that applies solar radiation for
shorter durations and allows rapid thermal cycling. These aging tools and their characteristics
will be presented extensively in the next chapters, as the control of their aging parameters is
key to decoupling them and observe their specific effects. Aging tests performed thanks to the
first tool will be presented at length in Chapter 4 on thermal aging. Chapter 5 will focus on
solar aging results and their comparison with thermal aging.
• in all cases, the impact of the different aging methodologies on the materials was mainly
observed via the evolution of their optical properties, surface morphology and atomic
composition, to establish the links between aging parameters, aging mechanisms and optical
failure. On this basis, the pertinence of the different aging methodologies tested in this thesis
will finally be discussed in Chapter 5.
As a general rule, aging strategies for solar selective absorbers have two main goals:
• the first, most popular one is to study the aging behavior occurring in the absorber for the
ultimate purpose of determining if they are suitable for CSP applications, i.e., if they are
thermally stable in air at high temperatures, for long durations, or in other words, durable.
Indeed, there is a need to find durable solar selective absorber coatings, to guarantee the
long-term efficiency of solar receivers and minimize the overall cost of electricity generation
in CSP plants. Although it is not the main objective of this thesis, as a collateral result, our
aging studies provided pertinent information in that regard concerning the three
configurations considered.

92
• the second goal we found almost absent in the literature, although it appears to us to be
decisive for future CSP deployment with technologies operating at high temperatures in air.
It is a more long-term and global objective, and the subject of this thesis: to gather in-depth
knowledge on the synergy and separate effects of the main sources of degradation seen by
solar selective absorber coatings during their CSP operation, in the ultimate view of eventually
drawing up broadly applicable test standards for the prediction of thermal stability, reliability
and service life of solar absorber coatings operating in these demanding conditions, as is
already the case for other solar thermal materials, such as solar mirrors and low temperature
solar thermal collectors.

93
Chapter 3 - Materials and methods

94

95
1. Absorber coatings used for aging studies
In this section, the three different solar absorber coatings that were used for the experimental analysis
of aging procedures are described, looking at the architecture and constituting materials of the
absorber, and techniques and equipment used for the manufacturing of the tested samples. The first
two types of absorbers were designed, optimized and manufactured by project collaborators, where
PROMES-CNRS laboratory is in charge of the thermo-optical and aging characterization of the
absorbers. The last type of absorber was developed at PROMES-CNRS.
1.1. TiAlNx/TiAlNy tandem absorber
This type of absorber was developed within the framework of the ASTORIX project (2014-2019)
[34,44,82,291–295], in collaboration with HEF-IREIS (Institut de Recherches en Ingérierie des Surfaces)
in Saint-Etienne [296], a surface engineering company specializing in tribology and functionalization of
surfaces, thermochemical treatments and physical vapor deposition (PVD). HEF was in charge of the
optimization and fabrication of TiAlNx/TiAlNy tandem absorbers, intended as a new absorptive
selective coating for central tower and linear Fresnel receivers working under atmospheric conditions
at temperatures above 500°C. This project has ended and is continued by the NanoPlaST project (2019-
2024) [297].
Materials and structure
Titanium aluminum nitride (TiAlN) was developed in the late 1980s as an alternative to TiN films for
cutting tool applications such as dry and high-speed cutting [298,299]. TiAlN exhibits superior oxidation
resistance, abrasion resistance, high thermal stability, chemical inertness and low electrical resistivity
at higher temperatures than TiN [300–303]. Although TiAlN films were initially developed for hard
coating applications due to its good performance at high temperatures [298], it has been proven that
it can also be used as a solar selective absorber with an absorptance value for a single layer of 0.8
[304].
The solar selective absorber studied in this thesis is based on a tandem absorber configuration (see
Chapter 1 section 4.1.5), using titanium aluminum nitride TiAlN as the main material for the absorber
layers, deposited on Inconel and stainless steel (SS) substrates (Figure 75). Following the structure of
tandem absorbers, the TiAlNx/TiAlNy absorber has two layers with low and high content in nitrogen,
thus switching from metallic-like to semiconductor-like behavior, with refractive index gradation from
high to low [34,44,120,124,291] (Figure 76).
A TiAl infrared reflector sublayer [293] with intermediate n is added between the metallic substrate
and the tandem absorber. On top of the absorber layers, a SiNCH antireflective layer is added to
enhance solar absorption [292]. These types of materials are high temperature ceramic materials,
suitable for antireflective coatings, with low refractive index, high hardness and good thermal stability
up to 650°C in air [82,294]. A multilayer stack (Inconel/TiAl/TiAlNx/TiAlNy/SiNCH, Figure 75), with
refractive index continuously decreasing from metallic substrate (high n) to ambient air (n = 1) is thus
created, with complementary and optimal selective optical properties for CSP applications. These
configurations were validated for both flat [34,44,291] and textured coatings [44,293].

96
Figure 75. TiAlNx/TiAlNy tandem absorber structure (1) and macroscopic image (2)
Figure 76. Refractive index n (a) and extinction coefficient k (b) variation for low and high nitrogen content, measured by
ellipsometry [293]
In this thesis, the heliothermal efficiency of this absorber was systematically estimated for the
following operating conditions, typical of new generations of Fresnel technologies: temperature of
500°C, concentration ratio of 50, concentrator optical efficiency equal to 0.5 and for an incoming solar
irradiance of 900 W/m².
Manufacturing process
For the deposition of these samples an industrial pilot-scale deposition machine (TSD 2800R) was used
[291] (Figure 77). This machine has been developed over 15 years. This equipment can treat large
surfaces (long tubes of 2.57 meters) in a single batch. Three types of deposition sources can be used:
cathodic arc, magnetron sputtering and distributed microwave plasma-enhanced chemical vapor
deposition (PECVD). This machine has been described and used in previous studies [44,291,293].
Figure 77. Industrial pilot-scale deposition machine at HEF-IREIS (TSD 2800R)
For the manufacturing of this solar selective absorber, the samples were fixed on a tube dual rotation
system and were deposited by two different vacuum plasma deposition methods, physical vapor
deposition (PVD) direct current magnetron sputtering of a TiAl target for the TiAl IR-reflective layer (in
Ar plasma) and TiAlN absorber layers (in Ar / N2 plasma), and microwave PECVD for the SiCNH
antireflective layer (in Ar / tetramethylsilane Si(CH3)4 / N2 reactive plasma).
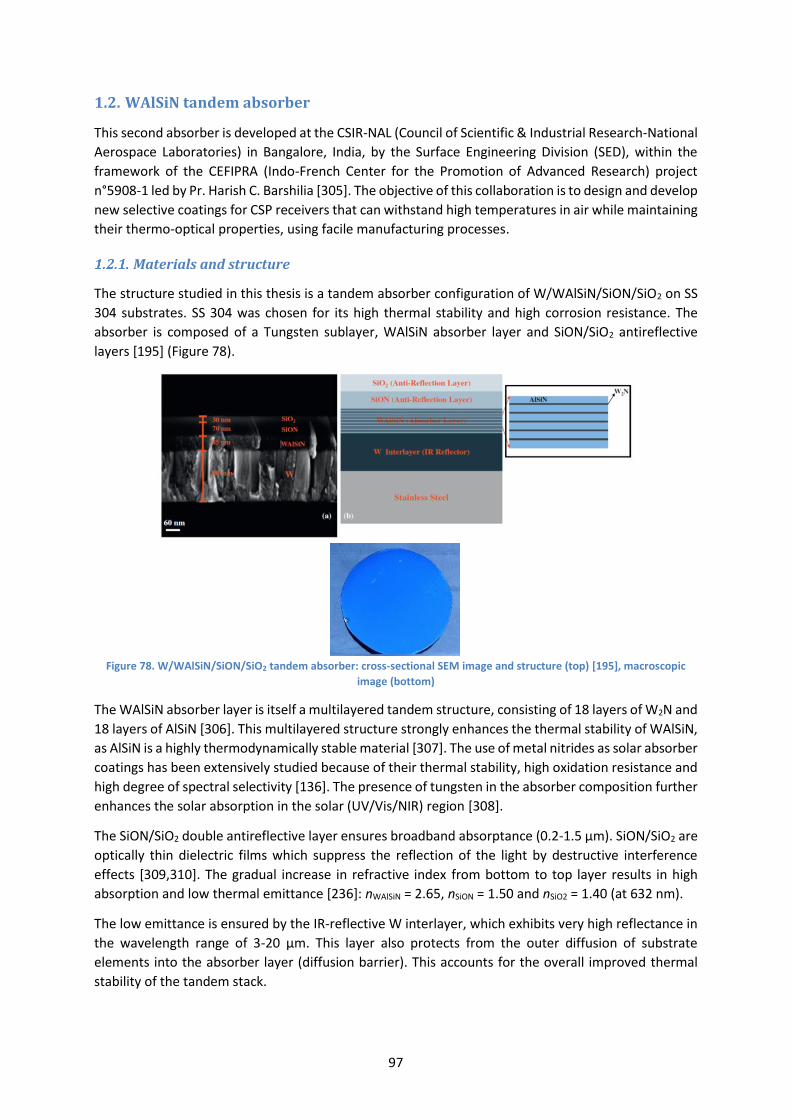
97
1.2. WAlSiN tandem absorber
This second absorber is developed at the CSIR-NAL (Council of Scientific & Industrial Research-National
Aerospace Laboratories) in Bangalore, India, by the Surface Engineering Division (SED), within the
framework of the CEFIPRA (Indo-French Center for the Promotion of Advanced Research) project
n°5908-1 led by Pr. Harish C. Barshilia [305]. The objective of this collaboration is to design and develop
new selective coatings for CSP receivers that can withstand high temperatures in air while maintaining
their thermo-optical properties, using facile manufacturing processes.
Materials and structure
The structure studied in this thesis is a tandem absorber configuration of W/WAlSiN/SiON/SiO2 on SS
304 substrates. SS 304 was chosen for its high thermal stability and high corrosion resistance. The
absorber is composed of a Tungsten sublayer, WAlSiN absorber layer and SiON/SiO2 antireflective
layers [195] (Figure 78).
Figure 78. W/WAlSiN/SiON/SiO2 tandem absorber: cross-sectional SEM image and structure (top) [195], macroscopic
image (bottom)
The WAlSiN absorber layer is itself a multilayered tandem structure, consisting of 18 layers of W2N and
18 layers of AlSiN [306]. This multilayered structure strongly enhances the thermal stability of WAlSiN,
as AlSiN is a highly thermodynamically stable material [307]. The use of metal nitrides as solar absorber
coatings has been extensively studied because of their thermal stability, high oxidation resistance and
high degree of spectral selectivity [136]. The presence of tungsten in the absorber composition further
enhances the solar absorption in the solar (UV/Vis/NIR) region [308].
The SiON/SiO2 double antireflective layer ensures broadband absorptance (0.2-1.5 μm). SiON/SiO2 are
optically thin dielectric films which suppress the reflection of the light by destructive interference
effects [309,310]. The gradual increase in refractive index from bottom to top layer results in high
absorption and low thermal emittance [236]: nWAlSiN = 2.65, nSiON = 1.50 and nSiO2 = 1.40 (at 632 nm).
The low emittance is ensured by the IR-reflective W interlayer, which exhibits very high reflectance in
the wavelength range of 3-20 μm. This layer also protects from the outer diffusion of substrate
elements into the absorber layer (diffusion barrier). This accounts for the overall improved thermal
stability of the tandem stack.

98
To optimize the absorber and achieve optimal optical properties, i.e., high solar absorptance and low
thermal emittance, different combinations of W/WAlSiN/SiON/SiO2 stacks were deposited at various
individual layer thicknesses and compared [195].
Manufacturing process
These coatings were deposited by CSIR-NAL/SED on stainless steel 304 substrates (30 x 30 mm2 x
thickness of 2 or 3 mm) using a four-cathode reactive unbalanced direct current (DC) magnetron
sputtering system (Figure 79):
• W layer was deposited by sputtering a W target in an Ar plasma;
• W2N layers were deposited by reactive sputtering of a W target in Ar/N2 plasma;
• AlSiN layers were deposited by reactive sputtering of Al and Si targets in Ar/N2 plasma;
• SiON and SiO2 layers were deposited by reactive sputtering of a Si target, in Ar/N2/O2 and Ar/O2
plasmas, respectively.
Figure 79. Four-cathode reactive unbalanced direct current magnetron sputtering system [311]
The main deposition parameters are the targets power density and flow rates of the reactive gases (N2
and O2), which control the layers compositions, and the deposition times of the individual layers which
control their thicknesses.
1.3. W/SiCH absorber coating
The development of these absorbers was also carried out in the framework of the ANR ASTORIX (2014-
2019) [34,44,82,291–294] and ANR NanoPlaST projects (2019-2024) [297] (see section 1.1), with the
aim of developing new absorptive selective coatings for solar receivers for working temperatures
above 500°C. This solar absorber was designed, optimized and manufactured at PROMES-CNRS
laboratory during the PhD theses of Laurie Di Giacomo (2014-2017), Danielle Ngoue (2017-2021) and
Aissatou Diop (2019-2022).
Materials and structure
Samples presenting the structure shown in Figure 80 were used for aging tests. This structure consists
in a SiCH/W/SiCH dielectric/metal/dielectric multilayer absorber (see Chapter 1 section 4.1.4) with W
infrared reflective sublayer, deposited on Inconel (2 mm-thick, diameter 2’’). The layer thicknesses
were previously optimized by optical simulation [93]. Structures consisting in W/SiCH periodic bilayers
(2 nm / 60 nm) were also used in specific cases [194].

99
Figure 80. W/SiCH/W/SiCH optimized coating [93]
Manufacturing process
The PROMES-CNRS laboratory has worked on the elaboration of selective solar absorbers since 2014,
for which the IDEFIX deposition reactor was developed (Figure 81).
Figure 81. IDEFIX reactor in PROMES-CNRS [93]
The IDEFIX reactor allows implementing microwave Plasma Enhanced Chemical Vapor Deposition
(PECVD) for the dielectric layers and radiofrequency (RF) magnetron sputtering (a type of Physical
Vapor Deposition or PVD) for the metallic layers. The 4-layer stack presented in Figure 80 was prepared
with substrate temperature of 350°C. W layers were deposited by PVD in Ar plasma, without substrate
bias and W target bias of -300 V. SiCH layers were deposited by PECVD with 50% of tetramethylsilane
precursor (TMS) in the Ar/TMS gas flow (25 sccm) and without substrate bias. The coatings were
deposited on Inconel (diameter 2" and 1"), T91 steel and silicon substrates.
2. Characterization of materials
To follow the aging of solar selective absorbers, the changes in the optical properties, structure and
composition of the coatings were systematically studied, using different techniques.
2.1. Optical properties
The samples spectral reflectance was systematically measured to study the aging behavior of the
coatings. The evolution of their optical performance, i.e., solar absorptance, thermal emittance and
heliothermal efficiency can be estimated from spectral reflectance (see Chapter 1 section 3).
UV-Vis-NIR spectrophotometer
A Perkin Elmer Lambda 950 spectrophotometer (Figure 82) was used to measure the quasi-normal (8°)
hemispherical spectral reflectance in the UV-Vis-NIR range. It is equipped with tungsten halogen and
deuterium lamps that emit light in the 190 - 3300 nm range, a monochromator for wavelength
selection, and beamsplitters to compare the beam reflected by the sample with the reference beam
W
W
SiCH
SiCH
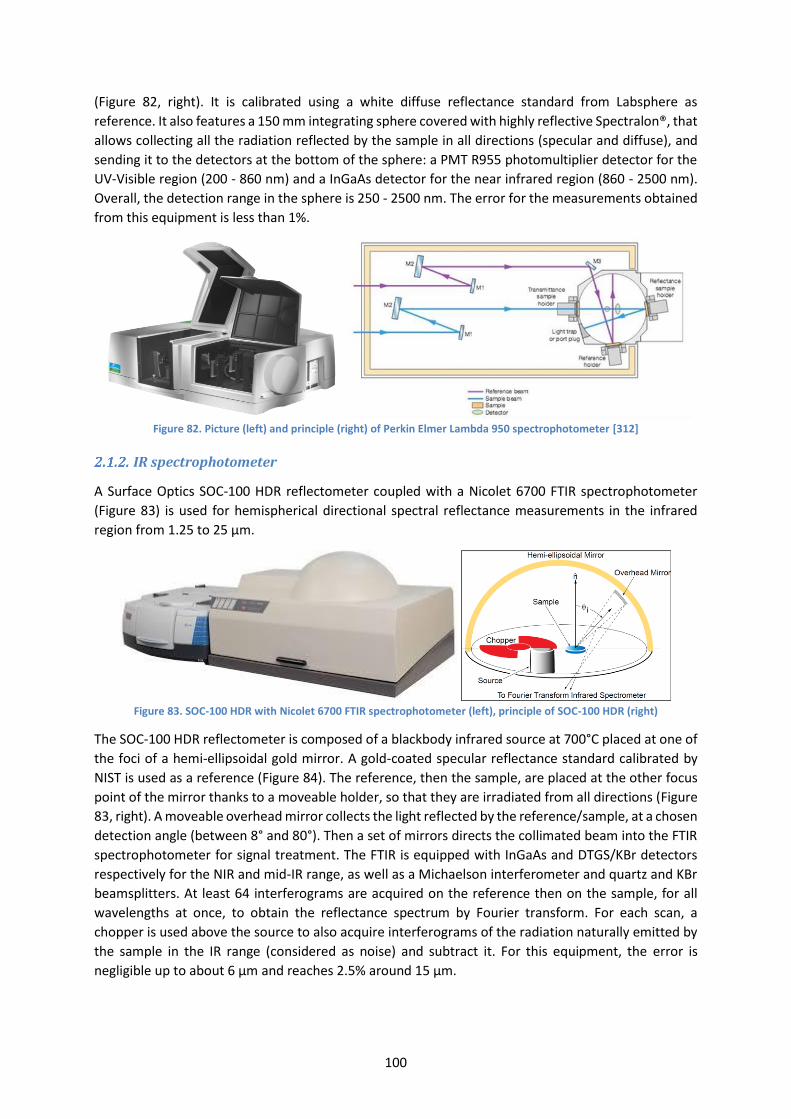
100
(Figure 82, right). It is calibrated using a white diffuse reflectance standard from Labsphere as
reference. It also features a 150 mm integrating sphere covered with highly reflective Spectralon®, that
allows collecting all the radiation reflected by the sample in all directions (specular and diffuse), and
sending it to the detectors at the bottom of the sphere: a PMT R955 photomultiplier detector for the
UV-Visible region (200 - 860 nm) and a InGaAs detector for the near infrared region (860 - 2500 nm).
Overall, the detection range in the sphere is 250 - 2500 nm. The error for the measurements obtained
from this equipment is less than 1%.
Figure 82. Picture (left) and principle (right) of Perkin Elmer Lambda 950 spectrophotometer [312]
IR spectrophotometer
A Surface Optics SOC-100 HDR reflectometer coupled with a Nicolet 6700 FTIR spectrophotometer
(Figure 83) is used for hemispherical directional spectral reflectance measurements in the infrared
region from 1.25 to 25 μm.
Figure 83. SOC-100 HDR with Nicolet 6700 FTIR spectrophotometer (left), principle of SOC-100 HDR (right)
The SOC-100 HDR reflectometer is composed of a blackbody infrared source at 700°C placed at one of
the foci of a hemi-ellipsoidal gold mirror. A gold-coated specular reflectance standard calibrated by
NIST is used as a reference (Figure 84). The reference, then the sample, are placed at the other focus
point of the mirror thanks to a moveable holder, so that they are irradiated from all directions (Figure
83, right). A moveable overhead mirror collects the light reflected by the reference/sample, at a chosen
detection angle (between 8° and 80°). Then a set of mirrors directs the collimated beam into the FTIR
spectrophotometer for signal treatment. The FTIR is equipped with InGaAs and DTGS/KBr detectors
respectively for the NIR and mid-IR range, as well as a Michaelson interferometer and quartz and KBr
beamsplitters. At least 64 interferograms are acquired on the reference then on the sample, for all
wavelengths at once, to obtain the reflectance spectrum by Fourier transform. For each scan, a
chopper is used above the source to also acquire interferograms of the radiation naturally emitted by
the sample in the IR range (considered as noise) and subtract it. For this equipment, the error is
negligible up to about 6 µm and reaches 2.5% around 15 µm.
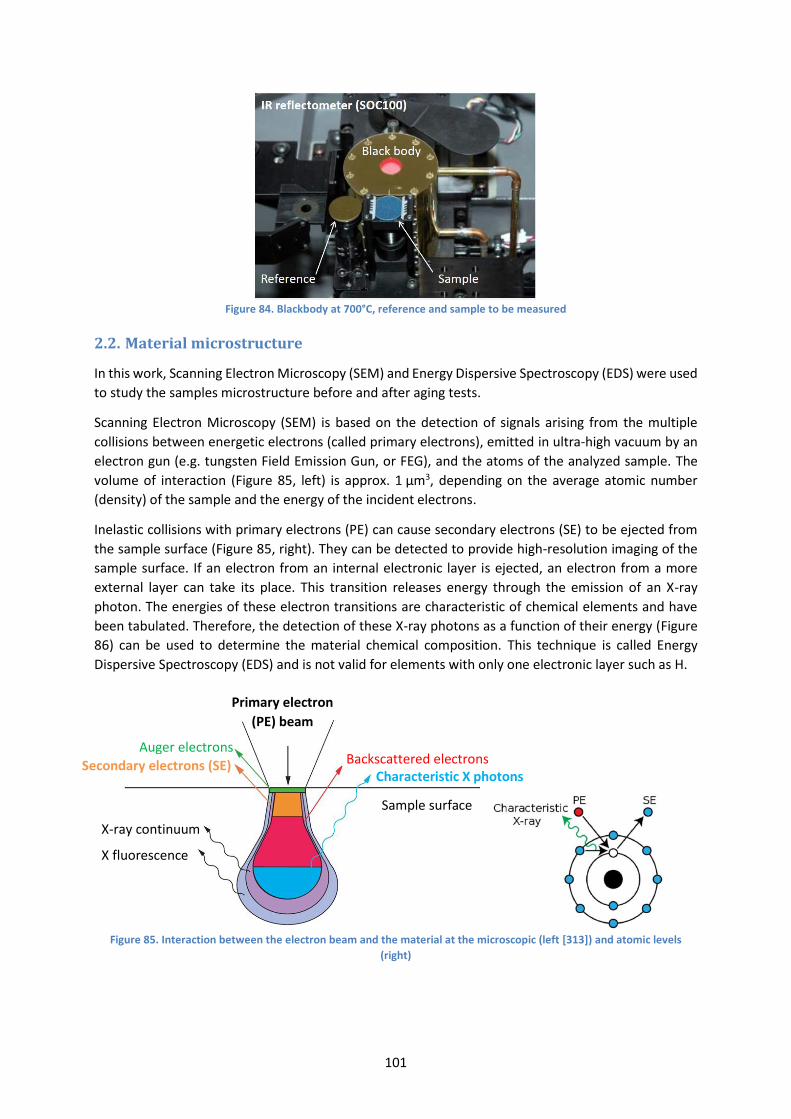
101
Figure 84. Blackbody at 700°C, reference and sample to be measured
2.2. Material microstructure
In this work, Scanning Electron Microscopy (SEM) and Energy Dispersive Spectroscopy (EDS) were used
to study the samples microstructure before and after aging tests.
Scanning Electron Microscopy (SEM) is based on the detection of signals arising from the multiple
collisions between energetic electrons (called primary electrons), emitted in ultra-high vacuum by an
electron gun (e.g. tungsten Field Emission Gun, or FEG), and the atoms of the analyzed sample. The
volume of interaction (Figure 85, left) is approx. 1 µm3, depending on the average atomic number
(density) of the sample and the energy of the incident electrons.
Inelastic collisions with primary electrons (PE) can cause secondary electrons (SE) to be ejected from
the sample surface (Figure 85, right). They can be detected to provide high-resolution imaging of the
sample surface. If an electron from an internal electronic layer is ejected, an electron from a more
external layer can take its place. This transition releases energy through the emission of an X-ray
photon. The energies of these electron transitions are characteristic of chemical elements and have
been tabulated. Therefore, the detection of these X-ray photons as a function of their energy (Figure
86) can be used to determine the material chemical composition. This technique is called Energy
Dispersive Spectroscopy (EDS) and is not valid for elements with only one electronic layer such as H.
Figure 85. Interaction between the electron beam and the material at the microscopic (left [313]) and atomic levels
(right)
Auger electrons
Secondary electrons (SE)
Primary electron
(PE) beam
Backscattered electrons Characteristic X photons
X-ray continuum
X fluorescence
Sample surface

102
Figure 86. Example of EDS spectrum obtained for the TiAlN absorber on Inconel substrate
In this work, a Hitachi S-4500 FEG-SEM (Field Emission Gun) with 1.5 nm resolution at 15 kV was used
to observe the samples surface morphology and its evolution with aging. It is coupled with a Kevex EDS
analysis system (Bruker Nano GmbH, Germany) to follow the samples atomic composition, with an
error of ± 2 at.%. Thus an element with low content in the sample may not be properly detected. Also
the energy resolution of EDS is rather poor, typically around 0.3 keV. This sometimes causes difficulties
in resolving overlapping transitions from two different elements. It is for instance the case for Si-K and
W-M transitions (1.77 – 1.87 keV), and N-K and Ti-L transitions (0.39 – 0.46 keV). Therefore the exact
quantification of such pairs of elements in the same sample can be tricky. This concerns the three
absorber types considered in this thesis (TiAlN, WAlSiN, W/SiCH). However it was used for practical
reasons, as the only non-destructive technique that could systematically be implemented for chemical
analysis at PROMES-CNRS, not requiring sample cutting or preparation and adapted to the small
thickness of the coatings.
3. Aging
In this section, the global aging methodology applied to our absorbers is explained and the different
aging tools available at PROMES-CNRS are described.
3.1. Aging methodology
Inspired by literature review (Chapter 2), the global methodology applied to study the impact of aging
on sample series of the three types of absorbers will be justified in more details in the following
chapters, in light of the obtained results. In summary, it consists in systematically:
1. Assessing the microstructure and optical properties of each series of samples in their as-deposited
state, to serve as reference, by:
• SEM, to observe their surface morphology;
• EDS, to obtain their atomic composition;
• spectrophotometry, to measure their spectral reflectance in the 0.25 – 25 µm range and
deduce their optical performance: solar absorptance, thermal emittance, heliothermal
efficiency;

103
2. Applying different types of aging tests on different samples of the same series, with different
degradation sources, using the aging tools presented in section 3.2:
• starting by “representative” (purely thermal) aging to assess the absorber thermal stability
behavior/limit, i.e., applying thermal aging at a temperature typical of the aimed CSP
applications, here 400 to 500°C in ambient air (depending on the type of absorber),
cumulatively on the same sample, starting with short durations of up to 24h, reaching at
least 100h in total (Figure 87), and up to 1000h (see Chapter 4);
• if the samples show thermal stability after 100h at 400 to 500°C, their series can be
considered for accelerated aging, purely thermal at higher temperatures to attempt
lifetime prediction (see Chapter 4), and/or with additional degradation sources such as
concentrated solar irradiance, rapid thermal cycling and thermal shocks (see Chapter 5).
3. Observing the evolution of the morphology (e.g. apparition of cracks), composition (e.g. oxidation)
and optical properties of the sample by the previous techniques (step 1), systematically after every
aging step by spectrophotometry, and periodically by SEM and EDS.
4. Comparing the results obtained for the different aging protocols, applied on series of similar
samples, and concluding on their suitability and pertinence to estimate the durability of solar
selective absorber coatings.
Figure 87. Aging methodology for the study of the durability of selective absorber coatings
3.2. Aging tools
To apply the different sources of degradation to the solar selective absorber coatings, two aging tools
were used, an electric furnace and a solar furnace.
Thermal aging: ALTHAIA
3.2.1.1. Experimental set-up
An aging facility called ALTHAIA (Aging Long-Term Tests in Humid Air or Inert Atmosphere) is located
at PROMES-CNRS laboratory in Odeillo. It is based on a 3.5 kW electrical tubular furnace from
Thermconcept®, model ROS 105/900/12 (Figure 88), with maximum temperature of 1200°C, mounted

104
on a stainless steel table. The furnace is equipped with a ceramic tube of 1200 mm in length and an
inner diameter of 105 mm. The heated length is 900 mm, with the central 400 mm at T = ± 5°C.
Samples are positioned at the center of the furnace. The ceramic tube is encased in a high-grade
ceramic fiber insulation material with low thermal mass, protected with a metal casing. During heating,
insulating caps are placed at each end of the ceramic tube for better thermal insulation and stability,
limiting forced convection and giving a static air atmosphere.
Figure 88. Thermconcept ROS 105/900/12 with Eurotherm 3508 temperature controller, insulating caps, independent
thermocouples and Graphtec data logger
3.2.1.2. Control of temperature
Heating ramps and temperatures can be adjusted to the desired values using a Eurotherm® 3508
controller. It operates on the principle of a PID regulator allowing a temperature correction to be made
by comparing the setpoint and the measured value. The controller also makes it possible to program
heating cycles of several hours or several days, and therefore easily achieve long-term aging.
Temperature in the furnace is independently measured using three thermocouples (jacketed, diameter
3 mm, length 750 mm), one positioned at the center of the furnace, and two at 5 cm on each side of
the central position. Temperature profiles are recorded by a Graphtec GL220 data logger (Figure 88).
Table 8 shows the difference between the setpoint temperature and the temperature measured inside
the furnace (average and standard deviation of measurements from the three thermocouples).
Therefore, the setpoint temperature was systematically adapted to obtain the desired temperature in
the furnace, as indicated in Table 8.
Table 8. Temperature correspondences
Desired T Setpoint T Measured T Difference between measured & desired T
300°C 320°C 299 ± 9°C 1°C
400°C 425°C 404 ± 11°C 4°C
500°C 525°C 496 ± 7°C 4°C
600°C 630°C 596 ± 7°C 4°C
630°C 665°C 645 ± 2°C 15°C
660°C 705°C 673 ± 4°C 13°C
690°C 740°C 712 ± 2°C 22°C

105
3.2.1.3. Heating and cooling rates
The furnace heating ramp can be adjusted using the Eurotherm® controller. Temperature profiles
recorded using the independent thermocouples were analyzed to verify the agreement between
heating ramp setpoints and real heating rates, for different setpoint values: 5, 10, 15, 20 and
100°C/min (Figure 89). The heating ramp seen by a sample equipped with a welded thermocouple on
its backside, when placing it directly inside the already hot furnace (rapid heating), was also
considered. In all cases, a linear regression on the heating ramp from 150 to 450°C was used to
estimate the heating rate (slope).
Figure 89. Heating ramps and their linear regressions for different heating rate setpoints
Table 9 compares setpoint and measured heating rates from Figure 89. For low heating rates between
5 and 20°C/min, the agreement is good. For a setpoint of 100°C/min, the measured heating rate is
21°C/min, showing the limitation in heating rate due to the furnace thermal inertia: due to its
configuration, the furnace itself cannot provide a heating rate higher than 21°C/min. When introducing
the sample directly into the already hot furnace (rapid heating), the heating rate seen by the sample
reaches approximately 73°C/min (the temperature profile is less linear than the others, since there is
no temperature regulation in this case). Such heating rate is closer to the kind of thermal shock that
materials may encounter in CSP operating conditions.
Table 9. Different heating rates setpoint and calculated heating rates obtained from linear regression
Heating rate setpoint (°C/min) Measured heating rate (°C/min)
5 5.2
10 10.8
15 16.5
20 20.1
100 20.8
Rapid heating 73.4
As a rule, samples were thus systematically introduced in the hot furnace at the desired stabilized
temperature. This allows reaching higher heating rates while preventing temperature overshoots due
to the PID regulation. Samples were then maintained under the desired temperature plateau for the
desired duration thanks to the controller. At the end of the heating plateau, they were allowed to cool
naturally inside the furnace, following its cooling kinetics (decreasing exponential). Temperate profiles
gave access to the natural cooling rate, which was estimated between -3 and -0.2°C/min, depending
on the temperature range (cooling is fast at high temperature but slows down below 200°C).

106
3.2.1.4. Typical temperature profile
The typical temperature profile applied to the samples (Figure 90) is similar for each aging test. It
consists in a rapid heating at the desired heating rate (typically 20°C/min) followed by a temperature
plateau of the desired duration (typically 24h) and finally the sample is left in the furnace during its
natural cooling.
Figure 90. Electrical furnace performance for a setpoint temperature of 400°C during 24h, as measured by the three
thermocouples placed at the center of the furnace (CH3), and 7 cm apart on each side of it (CH2, CH4)
3.2.1.5. Development of ALTHAIA experimental set-up
The ultimate aim of ALTHAIA experimental set-up is to provide a versatile aging tool, able to apply heat
treatments to solar absorber coatings under different atmospheres, i.e., vacuum and air with
controlled humidity, to study, decorrelate and compare the influence of additional sources of
degradation: purely thermal aging (high temperature without air), thermal aging in oxidant (HT with
air) and corrosive atmospheres (HT with humid air), influence of water vapor content.
ALTHAIA set-up was therefore further developed, with additional features to control the inner
atmosphere of the furnace (Figure 91). The extended set-up was designed and fabricated at PROMES-
CNRS by Audrey Soum-Glaude and Emmanuel Hernandez, and further implemented during this thesis.
Figure 91. ALTHAIA extended experimental set-up
It mainly consists in:
• a vacuum chamber system, composed of a quartz tube (O.D. 100 mm) inserted inside the
furnace ceramic tube (I.D. 105 mm), equipped with custom vacuum flanges at its extremities,
connected to a system of pumps providing primary vacuum inside the chamber (≈ 4·10-3 mbar).
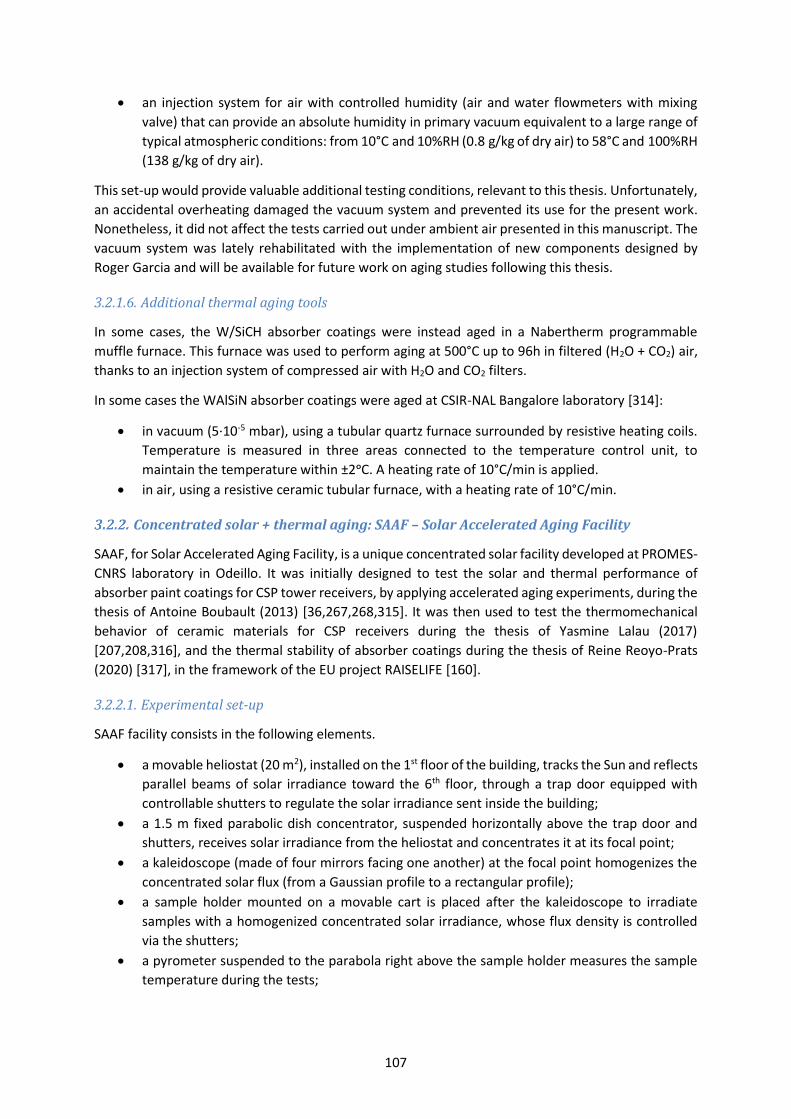
107
• an injection system for air with controlled humidity (air and water flowmeters with mixing
valve) that can provide an absolute humidity in primary vacuum equivalent to a large range of
typical atmospheric conditions: from 10°C and 10%RH (0.8 g/kg of dry air) to 58°C and 100%RH
(138 g/kg of dry air).
This set-up would provide valuable additional testing conditions, relevant to this thesis. Unfortunately,
an accidental overheating damaged the vacuum system and prevented its use for the present work.
Nonetheless, it did not affect the tests carried out under ambient air presented in this manuscript. The
vacuum system was lately rehabilitated with the implementation of new components designed by
Roger Garcia and will be available for future work on aging studies following this thesis.
3.2.1.6. Additional thermal aging tools
In some cases, the W/SiCH absorber coatings were instead aged in a Nabertherm programmable
muffle furnace. This furnace was used to perform aging at 500°C up to 96h in filtered (H2O + CO2) air,
thanks to an injection system of compressed air with H2O and CO2 filters.
In some cases the WAlSiN absorber coatings were aged at CSIR-NAL Bangalore laboratory [314]:
• in vacuum (5·10-5 mbar), using a tubular quartz furnace surrounded by resistive heating coils.
Temperature is measured in three areas connected to the temperature control unit, to
maintain the temperature within ±2ᵒC. A heating rate of 10°C/min is applied.
• in air, using a resistive ceramic tubular furnace, with a heating rate of 10°C/min.
Concentrated solar + thermal aging: SAAF – Solar Accelerated Aging Facility
SAAF, for Solar Accelerated Aging Facility, is a unique concentrated solar facility developed at PROMES-
CNRS laboratory in Odeillo. It was initially designed to test the solar and thermal performance of
absorber paint coatings for CSP tower receivers, by applying accelerated aging experiments, during the
thesis of Antoine Boubault (2013) [36,267,268,315]. It was then used to test the thermomechanical
behavior of ceramic materials for CSP receivers during the thesis of Yasmine Lalau (2017)
[207,208,316], and the thermal stability of absorber coatings during the thesis of Reine Reoyo-Prats
(2020) [317], in the framework of the EU project RAISELIFE [160].
3.2.2.1. Experimental set-up
SAAF facility consists in the following elements.
• a movable heliostat (20 m2), installed on the 1st floor of the building, tracks the Sun and reflects
parallel beams of solar irradiance toward the 6th floor, through a trap door equipped with
controllable shutters to regulate the solar irradiance sent inside the building;
• a 1.5 m fixed parabolic dish concentrator, suspended horizontally above the trap door and
shutters, receives solar irradiance from the heliostat and concentrates it at its focal point;
• a kaleidoscope (made of four mirrors facing one another) at the focal point homogenizes the
concentrated solar flux (from a Gaussian profile to a rectangular profile);
• a sample holder mounted on a movable cart is placed after the kaleidoscope to irradiate
samples with a homogenized concentrated solar irradiance, whose flux density is controlled
via the shutters;
• a pyrometer suspended to the parabola right above the sample holder measures the sample
temperature during the tests;
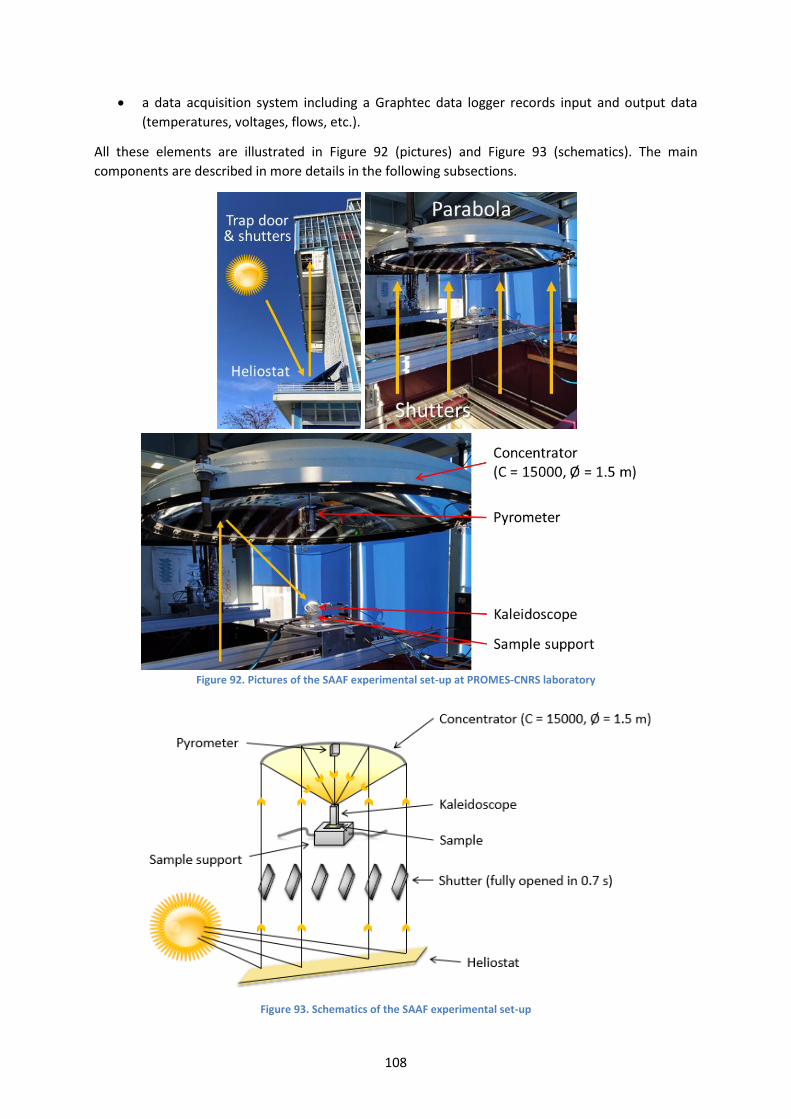
108
• a data acquisition system including a Graphtec data logger records input and output data
(temperatures, voltages, flows, etc.).
All these elements are illustrated in Figure 92 (pictures) and Figure 93 (schematics). The main
components are described in more details in the following subsections.
Figure 92. Pictures of the SAAF experimental set-up at PROMES-CNRS laboratory
Figure 93. Schematics of the SAAF experimental set-up

109
3.2.2.1.1. Adjustable shutter - EGSésame
The amount of concentrated solar flux given to the samples is adjustable thanks to a system of 13
movable flaps (Figure 92) that enable precise control via an irradiance sensor coupled with a PID
regulation loop. This system is called the Sésame shutters and is located above the closing trapdoor,
between the heliostat and the parabolic concentrator.
The shutter opening is controlled automatically by an external voltage with a 0-10 VDC analog signal
and a PC running a specific software called EGSésame. This software written in C++ programming
language was developed by Emmanuel Guillot and adapted for this specific project. It controls the
external voltage given to the Sésame controller trough an InstruNet that acts as a “power buffer”. The
voltage depends on the actual DNI, which is the only feedback given to the software. This voltage is
calculated depending on the needed concentrated solar flux at the focal point and the available
incoming solar radiation. The shutters allow precise control of the amount of incident solar power.
3.2.2.1.2. Parabolic dish concentrator
The parabolic dish concentrator has a thermal power output of 850 W, a concentration ratio of about
15,000 with a diameter of 1.5 m. It can reach a power density of around 16,000 kW/m2 at the focal
point with a focus diameter of around 15 mm. The focal point is located at 639 mm as indicated by the
manufacturer. Figure 94 shows the distance of the pyrometer, kaleidoscope and sample support from
the parabolic dish. The latter is equipped with two crossed lasers allowing visualization of the focal
point and facilitating the adjustments for sample treatment. It is suspended horizontally in a fixed
position with a metallic structure, to face the heliostat and have the focal point close to our accessible
working area, enabling us to locate the samples at the focal point with a movable cart.
Figure 94. Distances of the different equipment to the parabola
3.2.2.1.3. Kaleidoscope
A parabolic dish concentrator has a very high concentrator factor and a small focal point diameter. This
makes it difficult to work at the focal point. To ensure a less damaging area and adapt the incoming
concentrated solar radiation, a device called a kaleidoscope is placed at the focal point of the
concentrator, above the sample (Figure 95, left). The kaleidoscope consists in four metal walls made
of polished aluminum, with reflectance values greater than 66%, and good resistance to concentrated
solar radiation. It is 60 mm high and has a square aperture of 20 mm². It is mounted on a movable arm
to adjust its position between the focal point and the sample (Figure 96).
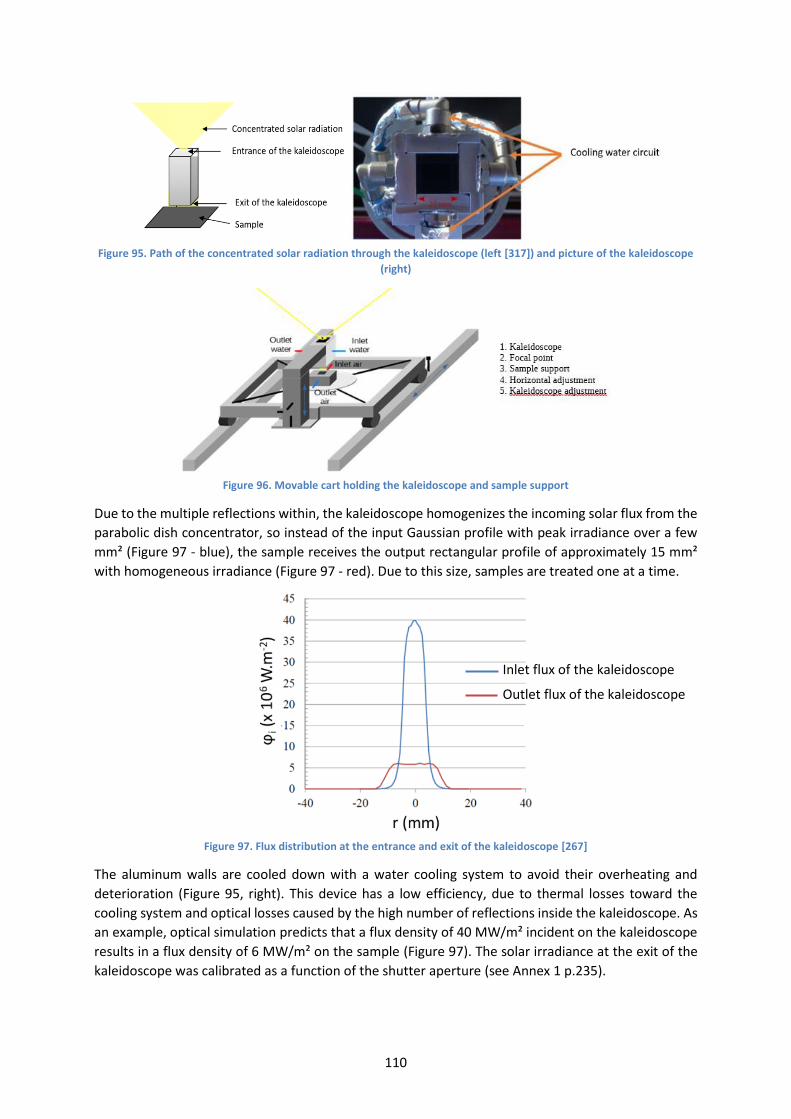
110
Figure 95. Path of the concentrated solar radiation through the kaleidoscope (left [317]) and picture of the kaleidoscope
(right)
Figure 96. Movable cart holding the kaleidoscope and sample support
Due to the multiple reflections within, the kaleidoscope homogenizes the incoming solar flux from the
parabolic dish concentrator, so instead of the input Gaussian profile with peak irradiance over a few
mm² (Figure 97 - blue), the sample receives the output rectangular profile of approximately 15 mm²
with homogeneous irradiance (Figure 97 - red). Due to this size, samples are treated one at a time.
Figure 97. Flux distribution at the entrance and exit of the kaleidoscope [267]
The aluminum walls are cooled down with a water cooling system to avoid their overheating and
deterioration (Figure 95, right). This device has a low efficiency, due to thermal losses toward the
cooling system and optical losses caused by the high number of reflections inside the kaleidoscope. As
an example, optical simulation predicts that a flux density of 40 MW/m² incident on the kaleidoscope
results in a flux density of 6 MW/m² on the sample (Figure 97). The solar irradiance at the exit of the
kaleidoscope was calibrated as a function of the shutter aperture (see Annex 1 p.235).
Inlet flux of the kaleidoscope
Outlet flux of the kaleidoscope

111
3.2.2.1.4. Sample support
For the aging tests, the samples are placed on a specific support. The main purpose of this support is
to have the sample fixed in position at the exit of the kaleidoscope. It is also designed, when possible,
to allow for effectively adjusting the desired temperature of the sample, thanks to air cooling that can
be regulated. The cooling system is integrated into the support with two orifices, one being the inlet
and the other the outlet (Figure 96). A rubber O-ring is placed between the support and the sample,
to seal the sample to the support and ensure an optimum use of the cooling air. In this way, heat can
be extracted from the backside of the sample. The compressed air network used for the cooling has a
regulator installed on the structure of the dish to modify the pressure of the incoming air and thus the
flow rate.
Four different supports were used, depending on the shape and dimensions of the samples. They are
built with different materials and configurations (Table 10).
• Support 1 is an old sample holder in MACOR®, now used without air cooling as the sample
cannot be sealed to the support, but with the main advantage of being adapted for round and
square samples of different sizes.
• Support 2 is an aluminum support usable only for square samples of 30 x 30 mm², as the sample
is sealed to the support using an O-ring and screws, allowing for efficient back cooling and
temperature regulation.
• Support 3 is an alumina support usable only for square samples of 50 x 50 mm², also with an
efficient back cooling system.
• Support 4 was recently developed to accommodate many sample sizes and shapes. It is made
of stainless steel. It includes a cooling system, though not as efficient as for supports 2 and 3
because the outlet air does not flow in a restricted space in this case.
Table 10. Different supports used for SAAF experiments
Support 1 Support 2 Support 3 Support 4
Support
material MACOR Aluminum Alumina Stainless steel
Sample
cooling No cooling Efficient cooling Efficient cooling
Not efficient
cooling
Sample size 30 x 30, 50 x 50 mm²,
O.D. 2” 30 x 30 mm² 50 x 50 mm²
1” to 2”
side/diameter
Sample shape Round
and square Square Square
Round
and square
Max sample
thickness None 3 mm Up to 6 mm Up to 6 mm
Image
Funding
project _ _ RAISELIFE SFERA-III

112
3.2.2.1.5. Pyrometer
An Optris CTlaser G5H infrared pyrometer equipped with CF4 optics is fixed on the parabola, in direct
view of the sample surface (Figure 92), at around 43.5 cm from the sample (Figure 98), close to the
focal point of the pyrometer (45 cm). It allows measuring temperatures between 250°C and 1650°C.
Figure 98. Focal point of the G5H CF4 model pyrometer
By design, the detection of the sample thermal emission, leading to the estimation of its surface
temperature (see Annex 2 p.235) is carried out through the solar radiation reflected by the inner
mirrors of the kaleidoscope during sample exposure (Figure 92). The pyrometer has a spectral response
between 4.8 and 5.2 μm (Figure 99), and is thus considered solar blind, since solar irradiance is located
below 2.5 μm. Therefore, pyrometry measurements are not perturbed by the incident solar radiation.
Figure 99. Spectral transmittance of the OPTRIS G5H CF4 pyrometer
3.2.2.2. Heating and cooling rates
Figure 100 shows an example of heating/cooling profile recorded during SAAF cycling test on the
surface center (pyrometer) and back center (thermocouple) of a 2 mm-thick TiAlN absorber sample on
Inconel. The thermal gradient (in °C/s) gives an image of the heating and cooling rates seen by the
sample. The initial heating rate starting from room temperature is around 5°C/s, then between 15 and
25°C/s during the cycles. In this example, backside air cooling with gas flow around 0.0025 g/s was
applied to the sample to control its temperature: this “regulated” cooling rate was ranging from -12 to
-10°C/s. For the last cooling phase, the air cooling is stopped and the sample is allowed to cool
naturally: its natural cooling rate reached around -20°C/s.
Heating and cooling rates may vary with the sample support used (see section 3.2.2.1.4), the sample
thickness and the air cooling flow rate, if any. However this example gives an order of magnitude of
heating and cooling rate levels available with SAAF. They are much higher than with an electrical
furnace (around 20°C/min, see section 3.2.1.3), allowing for thermal shocks and rapid thermal cycling
that are only accessible with such a set-up.

113
Figure 100. Example of heating/cooling profile with SAAF obtained for TiAlN absorbers
3.2.2.3. Available aging parameters
SAAF allows applying constant solar irradiance for several hours, as well as cycles of high and low solar
flux (Figure 101) with chosen amplitude and period, by regulating the shutters opening and closing.
The link between shutter aperture and concentrated solar flux after the kaleidoscope was previously
calibrated by calorimetry for different values of solar Direct Normal Irradiance (DNI). The sample
maximum temperature can be adjusted manually thanks to the air cooling flow rate, when applicable.
Figure 101. Example of irradiance cycles applied with SAAF, corresponding temperature and thermal gradient (°C/s) [318]
SAAF input parameters are thus:
• the values of concentrated solar flux seen by the sample during the high and low irradiance
phases of the cycles (e.g. 700 and 250 kW/m² in Figure 101);
• the durations of these phases (e.g. 200 s and 60 s in Figure 101);
• the air cooling flow rates to regulate the temperature.
The following SAAF data is recorded by the Graphtec GL220 data logger and the computer interface:
• the surface temperature of the sample, given by the pyrometer and/or thermocouple(s);
• the solar DNI value recorded every second by a pyrheliometer on the roof;
• the air flow rate (g/s) for cooling the sample.

114
3.3. Conclusion on aging
Figure 102 summarizes and compares the available aging parameters for the two aging tools, related
to the sources of degradation identified in Chapter 2 (Figure 57 p.70). The use of these two
experimental set-ups enables us to compare the impact of the different sources of degradation they
are able to provide. Both tools give access to wide temperature ranges, even wider than is pertinent
for SSACs. While ALTHAIA set-up allows applying slow thermal cycling for short and long durations, and
limited thermal shocks, SAAF allows concentrated solar exposure, rapid thermal cycling for short
durations and large thermal shocks. The SAAF UV irradiance level will be discussed in Chapter 5.
Figure 102. Sources of degradation accessible with the two experimental set-ups
Considering the available aging parameters and their accessible ranges with the two experimental set-
ups at our disposal (Figure 102), three main test configurations were retained for this thesis, as
explained in Table 11. They will allow exploring the separate and combined effects of thermal aging
(Configuration 1, used in Chapter 4), solar aging and solar thermal cyclic aging (Configurations 2 and 3
respectively, used in Chapter 5).
Table 11. Main test configurations selected for this thesis
Configuration Configuration 1 Configuration 2 Configuration 3
Aging tool ALTHAIA SAAF SAAF
Temperature range 500 - 800°C 450 - 500°C 350 - 700°C
Concentrated solar
irradiance No
Yes
Constant (250 or 400 kW/m²)
Yes
Cyclic (50-500 kW/m²)
Thermal cycling Slow
(Cumulative 12-24h steps)
No
(Cumulative 3.5h steps)
Rapid
(High/low irradiance cycles)
Thermal shocks Limited and repeated Strong and punctual Strong and repeated
Total duration Short (few h) to long
(up to 1000h)
Short
(up to 15h)
Short
(up to 15h)
Interest of study Effect of thermal aging
in air
Compared with config. 1
● Additional effect of
concentrated solar
exposure?
● Necessity to include constant
solar aging in SSACs aging
procedures?
Compared with config. 2
● Additional effect of rapid
thermal cycling/shocks?
● Necessity to include cyclic solar
aging in SSACs aging procedures?

115
4. Conclusion
To validate the pertinence of aging procedures, the latter must be tested experimentally, using specific
tools and case study solar selective absorber coatings. In this thesis, three different types of SSACs are
tested. These absorbers were described in this chapter, looking at the materials, structure and
manufacturing techniques used to obtain them. To evaluate the impact of aging, the initial properties
of the absorbers and their evolution with aging must be characterized, using techniques and
equipment described in this chapter. Their spectral reflectance is systematically measured by
spectrophotometry in the 0.25 – 25 µm range. As a complement, the evolution of their surface
morphology and chemical composition are periodically followed using SEM and EDS techniques.
A global aging methodology is applied to the SSAC samples. The first step is to ensure the thermal
stability of the absorber at typical operating temperatures, in our case 500°C, for at least 100 hours.
Once the absorber has proven to be thermal stable in these conditions, more demanding tests can be
applied on similar samples to study the effects of different sources of degradation: higher
temperatures, longer durations, solar aging, thermal cycling.
Two dedicated experimental benches designed at PROMES-CNRS have been implemented and further
developed in this thesis, to allow decorrelating the impact of these potential sources of degradation.
Both were presented in this chapter. The first bench (ALTHAIA) allows short and long-term cumulative
periodic thermal tests in air, that will be the focus of Chapter 4. The second (SAAF solar furnace) allows
materials to be exposed to a real continuous or rapid cyclic concentrated solar flux, more
representative of the CSP application, that will be the object of Chapter 5. The applicability and
pertinence of these different aging protocols and sources of degradation, related to the technical limits
sometimes existing in the application of the desired aging protocols, will be discussed at length in the
following chapters.

116
117
Chapter 4 - Implementation and critical
analysis of purely thermal aging
protocols

118

119
In this chapter, the impact of purely thermal aging protocols, i.e., using a programmable electrical
furnace, will be discussed. Protocols at different aging durations, temperature ranges and atmospheres
will be analyzed. For this purpose, the response to these various protocols of the different types of
absorbers (see Chapter 3) will be compared. Their optical properties, surface topography and atomic
composition will be presented.
First, to ensure the protocols comparability, the equivalence of the series of samples for each type of
absorber in their as-deposited state will be studied. Then, the impact of aging for short durations (less
than 25h) and long durations (between 100h and 1000h) near the aimed operating temperature
(around 500°C) will be discussed. The impact of higher temperatures (> 500°C), thermal cycling and
aging atmosphere will also be investigated.
1. Verification of samples equivalence for comparable aging studies
1.1. Definition of sample equivalence
To study the aging of solar selective absorber coatings, different aging protocols must be applied and
compared. Therefore, large series of equivalent samples are necessary for aging studies, i.e., samples
with the same structure, deposited by the same technique, in the same equipment, with the same
experimental parameters, on the same substrates, in the same batch, by the same operator, etc.
In reality, many factors impair the repeatability of the samples manufacturing process, causing small
fluctuations between the samples. This is especially the case at the laboratory scale, which often uses
small deposition machines, providing limited batches (e.g. 1 to 4 samples at a time). Thus several runs
are necessary to obtain the required number of samples, with risks of evolutions in the process
conditions (e.g. wear and pollution of sputtering targets). Also, these processes often include manual
operation steps, sometimes carried out by different operators, increasing risks of low repeatability. As
an example, the W/SiCH samples from PROMES are manufactured in the IDEFIX reactor (Figure 81
p.99) using plasma deposition techniques. Layer thicknesses are controlled by protecting the sample
under a shutter, so that the deposition of a specific layer can be stopped abruptly. This shutter is
operated manually, so that deposition times may vary by a few seconds for different samples, inducing
thickness variations by a few nanometers. Also, plasma generator voltages and powers are not
perfectly stable and slightly vary from one batch to another.
Contrarily, manufacturing processes at the industrial scale are designed, optimized, automated, and
sometimes equipped with in-line control, to provide large batches of samples, with the highest
repeatability possible from one batch to another. As a consequence of the larger size of deposition
machines however (e.g. able to treat 4-meter-long tubes), the samples are not always uniform
depending on the position of the substrate relative to the material source (sputtering target, gaseous
precursor injection, etc.) during manufacturing. This may create differences between samples
manufactured during the same batch. In all cases, there can also be small variations of the substrate
surface state (roughness, pollution) before deposition.
All these unavoidable variations from one sample/batch to another can induce differences in their
microstructure and optical properties. Therefore, their equivalence must be verified before applying
aging protocols. The reproducibility and uniformity of the samples can for instance be estimated from
the comparison of their optical properties, e.g. using spectral reflectance measurements after
manufacturing (as-deposited).

120
In this work, three types of absorber structures are considered, two produced with research reactors
and one with a pilot-scale deposition machine. In all cases, different series of samples were used for
aging studies. To be able to compare the impact of the different aging tests, samples equivalence for
each type of absorber was investigated.
1.2. Samples of TiAlNx/TiAlNy tandem absorber coatings
For the case of the TiAlNx/TiAlNy tandem absorber with TiAlN sublayer and SiNCH antireflective top
layer (see Chapter 3 section 1.1, p.95), four different series of samples were used to study the aging
behavior of this type of absorber coating (Table 12). The series are named by the year and week when
they were manufactured, from 2016 to 2019. Each series corresponds to a single experimental batch
(letter A to E for the day of the week) where several samples were fabricated simultaneously (except
for series 1830, which was produced in 3 consecutive batches).
Table 12. The different series of samples used to test TiAlNx/TiAlNy tandem absorber coating
TiAlNx/TiAlNy absorber Series 1616 Series 1828 Series 1830 Series 1928
Number of samples 10 7 23 20
Number of batches (code) 1 (D) 1 (A) 3 (A, B, C) 1 (E)
Substrate Inconel 625 (thickness 2 mm)
Ø 1”
Ø 2”
10
-
1
2
6
3
-
5
Substrate SS 304L (thickness 1 mm)
25 x 30 mm²
50 x 50 mm²
-
-
2
2
-
14
6
9
All samples have the same coating structure as presented in Chapter 3 (Figure 75 p.96), except that
series 1616 has two additional sublayers. The coatings were all deposited using the same experimental
conditions. A variety of substrates was used: Inconel 625 with diameters 1” and 2” and thickness 2
mm, stainless steel (SS) 304L substrates with dimensions 25 x 30 mm² and 50 x 50 mm² and thickness
1 mm. In the following, the equivalence of the samples is estimated by comparing their optical
properties (spectrophotometry), surface topography (SEM) and composition (EDS) in their as-
deposited state. Results are not shown for series 1830 because the latter was received after a first heat
treatment of 24h at 500°C at HEF. Some results for series 1828 are also not shown for the same reason.
Optical properties
The reflectance spectra of all the samples in their as-deposited state are plotted in Figure 103, showing
notable variations and no overall perfect equivalence of all the samples.

121
Figure 103. Reflectance spectra of as-deposited absorbers for series 1616 (blue), 1828 (green) and 1928 (red)
Looking at each series separately, it can be seen that the uniformity of the samples is high for the 10
samples of series 1616 (Figure 104), the latter being all deposited on the same type of substrate
(Inconel 1”). Uniformity is also good for series 1828 (Figure 105), whatever the type of substrate
(Inconel or SS). Series 1928 shows the lowest uniformity, with higher variations of the spectra,
especially in the visible region (Figure 106). The lack of uniformity is not due to the substrate nature,
as reflectance variations also exist for samples with the same type of substrate.
Figure 104. Reflectance spectra of series 1616 as-deposited samples with Inconel substrate

122
Figure 105. Reflectance spectra of as-deposited series 1828 samples with SS (dark blue) and Inconel (red) substrates
Figure 106. Reflectance spectra of as-deposited series 1928 samples with SS (dark blue) and Inconel (red) substrates
The average optical performances of each series, i.e., their solar absorptance and thermal emittance
calculated from reflectance spectra (Figure 103), and resulting heliothermal efficiency, are shown in
Table 13 along with their standard deviations [319]. These standard deviation values represent the
uniformity (or lack thereof) between samples of each series and the repeatability of the manufacturing
process. The error due to the equipment used for reflectance measurements (see Chapter 3 section
2.1, 2.1p.99) and subsequent calculation of optical performance is not taken into account as previous
work showed that this error is very low [320] compared to the standard deviation between samples.
As expected from reflectance spectra, series 1616 and 1828 have a high uniformity, reflected by the
low standard deviations: up to 0.002 for solar absorptance and 0.004 for thermal emittance, whatever
the type of substrate. Series 1928 has a low uniformity, with a standard deviation of 0.009 for solar
absorptance and up to 0.011 for thermal emittance.

123
Table 13. Optical performance of series of samples for TiAlNx/TiAlNy tandem absorber coatings (as-deposited)
TiAlNx/TiAlNy absorber Series 1616 Series 1828 Series 1928 All series
Solar absorptance
All samples (number)
Inconel substrate
SS substrate
0.915 ± 0.002 (10)
0.915 ± 0.002 (10)
-
0.927 ± 0.002 (3)
0.926 (1)
0.928 ± 0.002 (2)
0.914 ± 0.009 (18)
0.921 ± 0.009 (4)
0.912 ± 0.008 (14)
0.919 ± 0.008 (30)
0.921 ± 0.006 (15)
0.923 ± 0.010 (15)
Thermal emittance @ 500°C
All samples (number)
Inconel substrate
SS substrate
0.348 ± 0.004 (10)
0.348 ± 0.004 (10)
-
0.315 ± 0.004 (3)
0.320 (1)
0.312 ± 0.002 (2)
0.381 ± 0.011 (18)
0.378 ± 0.013 (4)
0.380 ± 0.011 (14)
0.348 ± 0.024 (30)
0.349 ± 0.018 (15)
0.335 ± 0.026 (15)
Heliothermal efficiency @ 500°C
All samples (number)
Inconel substrate
SS substrate
0.846 ± 0.002 (10)
0.846 ± 0.002 (10)
-
0.865 ± 0.002 (3)
0.862 (1)
0.866 ± 0.001 (2)
0.838 ± 0.011 (18)
0.846 ± 0.012 (4)
0.837 ± 0.010 (14)
0.850 ± 0.011 (30)
0.851 ± 0.007 (15)
0.856 ± 0.014 (15)
Comparing between series, the optical performance slightly varies from one series to another. The
average solar absorptance is around 0.915 for series 1616 and 0.914 for series 1928, and 0.927 for
series 1828 (+ 0.012). The average value for all the series of as-deposited samples is 0.919, with overall
standard deviation of 0.008. These values show that there is an acceptably small variation in solar
absorptance between the samples of each series and between the series, of less than 1 point of
absorptance (i.e., 1% when considering solar absorptance in %) in all cases.
The average thermal emittance is 0.348 for series 1616, 0.315 for series 1828 and 0.381 for series 1928.
Emittance is thus the lowest for series 1828 and the highest for series 1928, with a variation of 0.066,
i.e., almost 7 points of emittance. As a result, the average thermal emittance for all the series is 0.348
with a standard deviation of 0.024. These values show that there is a higher variation in thermal
emittance between the series than in solar absorptance, around 2 points of emittance (i.e., 2% when
considering thermal emittance in %).
This larger variation does not appear to be clearly linked to the nature of the substrate, as similar
variations are obtained when comparing the series by type of substrate. It therefore arises from
variations in the coating architecture. For instance, series 1616 samples have additional underlying
layers that do not affect solar absorptance but may affect thermal emittance as they mask the IR-
reflective substrate.
The evolution of heliothermal efficiency between the series is naturally directly linked to that of the
previous parameters. Series 1616 shows a good and repeatable efficiency (0.846 ± 0.002). Due to its
highest solar absorptance and lowest thermal emittance, series 1828 presents the highest efficiency
(0.865), with a low variation between samples (± 0.002). The lowest and less uniform efficiency is
observed for series 1928 with 0.838 and a high variation of 0.011. Overall, this type of absorber shows
a good heliothermal efficiency with an average of 0.850 for all the series, and a small variation of
around 1 point.
Surface topography, atomic composition
Naked eye observation (Figure 107) and SEM images at the microscopic scale (Figure 108) both indicate
that the surface topography of all analyzed as-deposited samples is uniform and smooth, and similar
for all series and substrate types. Figure 108 shows examples for series 1616 (Inconel) and 1928 (SS
304L).

124
Figure 107. Macroscopic image of TiAlN absorber samples (from left to right, series 1616, 1928 and 1828)
Figure 108. SEM images of as-deposited samples on Inconel (series 1616, top) and SS substrates (series 1928, bottom)
Table 14 shows the atomic percentage of the different chemical elements present in the as-deposited
samples of series 1616 and 1928, compared with the uncoated Inconel substrate in the first case.
Table 14. Initial chemical composition in at.% (EDS) of the TiAlN absorber samples on Inconel (series 1616) and stainless
steel (series 1928) substrates, compared with uncoated substrates
Series Substrate O Si Al Ti Fe Cr Ni Mo Nb
_ Inconel - - - 0.4 5 24 63 5 2
1616 Inconel - 4 35 4 3 14 36 3 1
1928 SS 304L 2 5 21 5 48 14 5 - -
Since the coatings are thin (< 500 nm), elements from the substrates (in blue) are detected underneath,
only with smaller amounts than in the uncoated substrates, as can be expected. Indeed, Inconel is a
Ni-based alloy with additional Fe, Cr, Mo and Nb contents, while SS is a Fe-based alloy with typical 18-
10 Cr-Ni content.
The main elements of the TiAl/TiAlNx/TiAlNy/SiNCH absorber structure (in red) are also detected:
silicon (4-5 at.%), titanium (4-5 at.%) and aluminum (20-35 at.%). Nitrogen was difficult to detect
because of the overlap between N and Ti EDS peaks and the greater content in Ti (Chapter 3 section
2.2 p.101). Carbon was not quantified, due to its low amount in the coating, and the difficulty to
distinguish between the carbon present in the coating and the one naturally occurring surface
pollution.
The atomic composition in coating elements is similar for both series, except that for series 1616, the
content in aluminum (35 at.%) is higher than for series 1928 (21 at.%), due to the two additional
sublayers in series 1616. For the same reason, the content in elements detected from the substrate is
higher for series 1928 (67 at.% vs. 57 at.% in total), as its coating is thinner.

125
Conclusions
Four series of samples based on the same TiAl/TiAlNx/TiAlNy/SiNCH absorber configuration were
compared in their as-deposited state, to check their equivalence. Indeed, they were not all fabricated
at the same time (6 batches over 3 years) and not all on the same types of substrates (Inconel or SS).
Meanwhile, large sets of equivalent samples are needed for comparable aging studies. The comparison
relied on the results of spectral reflectance measurements and subsequent optical performance
calculation, surface topography by SEM and chemical composition by EDS.
The reflectance spectra of all samples are not equivalent (Figure 103). Series 1616 and 1828 both have
good optical uniformity, with no notable influence of the type of substrate (Figure 106). Series 1928
has lower uniformity, even when comparing samples with the same type of substrate. Taking into
account all series, the average solar absorptance is 0.919 ± 0.008, the average thermal emittance is
0.348 ± 0.024 and the average heliothermal efficiency is 0.850 ± 0.011 (Table 13). These standard
deviation values show that the solar absorptance and heliothermal efficiency of all samples is very
comparable with a difference of less than 1 point (i.e., 1% if these parameters are considered in %).
Meanwhile, thermal emittance fluctuates slightly more distinctly, by 2 points. This can be attributed in
part to the higher emittance of series 1616 compared to series 1828, due to its sublayers. The
microstructural analysis (surface topography, chemical composition) did not reveal any notable
differences between the samples, whatever the series and substrate types.
Overall, the equivalence between these samples is sufficient to consider them for complex aging
studies. Although their thermal emittance is not exactly equivalent, their solar absorptance is very
similar, and their coating architecture and chemical composition are close enough that their aging
behavior should not differ significantly. In any case, for each sample the variation with aging of its
optical behavior will be considered relatively to its as-deposited state (e.g. S = S (aged) – S (as-
deposited)) for better comparability with other samples.
1.3. Samples of WAlSiN absorber coatings
For the WAlSiN absorber coating with SiON/SiO2 antireflective layer from CSIR-NAL Bangalore (see
Chapter 3 section 1.2, p.97), different series of samples were also used to apply and evaluate different
aging strategies (Table 15). In total, 30 samples were manufactured individually, i.e., in a different
batch, using the same equipment and the same experimental conditions, to obtain the same absorber
architecture (Figure 78 p.97). The substrate nature is also the same (stainless steel 304), only the
substrate dimensions vary. Series SSC-0 was kept and studied at CSIR-NAL with their own equipment
[195,242,305]. The others were studied at PROMES-CNRS.
Table 15. Description of WAlSiN absorber sample series
WAlSiN tandem absorber Number of samples Substrate nature Substrate dimensions
Studied at
CSIR-NAL [242] SSC-0 13 SS304 -
Studied at
PROMES-CNRS
SSC-1 2 SS 304 Ø 1”
SSC-2 2 SS 304 32 x 32 x 2 mm3
SSC-3 4 SS 304 Ø 1’’ + 30 x 30 x 3 mm3
SSC-4 2 SS 304 Ø 1’’
SSC-5 10 SS 304 30 x 30 x 3 mm3
SSC-6 2 SS 304 30 x 30 x 3 mm3

126
Optical properties
The samples received at PROMES were divided into six different series of samples (SSC-1 to 6)
according to their optical similarities. Indeed, although they all present a similar profile, some notable
differences in their reflectance spectra (Figure 109) were observed between these 22 samples. The
samples studied at CSIR-NAL (samples SSC-01 to 08 in Figure 109) show reflectance spectra similar to
that of the samples studied at PROMES-CNRS. These differences are typical of small variations of the
coating layers thicknesses but not of their inherent chemical nature, as illustrated by reflectance shifts
in wavelength but not in intensity. Small variations in the IR range may be caused by slight differences
in substrate surface state (polishing, cleaning) and composition.
Figure 109. Reflectance spectra of 30 equivalent WAlSiN as-deposited samples (6 series)
Table 16 shows the corresponding optical performance parameters. The latter were calculated from
reflectance spectra (see Chapter 1 section 3, p.28), measured at room temperature by
spectrophotometry at CSIR-NAL (SSC-0) or PROMES (SSC-1 to 6), using similar equipment. For series
SSC-0, solar absorptance was also directly measured at CSIR-NAL using a Devices and Services (D&S)
Solar Spectrum Reflectometer (SSR) [242]. The two methods give different values of solar absorptance,
as can be expected. Indeed, the calculation of solar absorptance from the reflectance spectrum is
based on the standard direct + circumsolar solar spectrum G173-03 AM1.5 [31]. Meanwhile, SSR direct
measurement is based on the detection from several photodetectors and weighing of their respective
ranges to approach a global (direct + diffuse) solar spectrum. For the sake of comparing with the other
series, for which absorptance was estimated from spectral reflectance measured at PROMES, values
deduced from spectral reflectance measurements at CSIR-NAL (line 2) will be considered for series SSC-
0.
Overall, the variations in reflectance spectra result in variations of the samples good optical
performance (Table 16). This type of absorber shows a high value of solar absorptance (0.914 in
average, ranging from 0.898 to 0.926) with a low variation between samples (standard deviation of
0.008).

127
Table 16. Optical properties for the different series of samples for the WAlSiN absorber
WAlSiN tandem absorber Solar
absorptance
Thermal emittance
@ 500°C
Heliothermal efficiency
@ 500°C
Series studied at CSIR
SSC-0
Directly measured [242]
Deduced from spectral reflectance
0.952 ± 0.003
0.919 ± 0.004
-
0.143 ± 0.022
-
0.890 ± 0.004
Series studied at PROMES
SSC-1
0.898 ± 0.001
0.133 ± 0.003
0.872 ± 0.001
SSC-2 0.908 ± 0.009 0.121 ± 0.002 0.884 ± 0.008
SSC-3 0.926 ± 0.002 0.152 ± 0.006 0.896 ± 0.002
SSC-4 0.913 ± 0.001 0.194 ± 0.010 0.874 ± 0.001
SSC-5 0.910 ± 0.003 0.154 ± 0.013 0.880 ± 0.005
SSC-6 0.920 ± 0.002 0.230 ± 0.001 0.874 ± 0.003
Average of series 1 to 6 (PROMES) 0.913 ± 0.009 0.159 ± 0.030 0.881 ± 0.009
Average of series 0 to 6 0.914 ± 0.008 0.155 ± 0.029 0.884 ± 0.008
Thermal emittance at 500°C is also good, with a low average value of 0.155 (ranging from 0.121 to
0.230). As for the previous absorber (section 1.2.1), thermal emittance presents a higher fluctuation
between samples, with a similar standard deviation of 0.029 (i.e., 3 points of emittance when the latter
is considered in %). Direct measurements of thermal emittance at 82°C at CSIR-NAL on series SSC-0
using an emissometer (model AE1-RD1) did not show this level of standard deviation [242]. Therefore,
these fluctuations may also be partly due to the high sensitivity of thermal emittance calculated from
reflectance to the chosen concatenation wavelength and the quality of the overlapping between
spectra measured in the UV-Vis-NIR and IR ranges using two different spectrophotometers.
Heliothermal efficiency reflects the variations in solar absorptance (0.884 in average, ranging from
0.872 to 0.896) with the same standard deviation of 0.008. Indeed, by definition, solar absorptance
has a more direct impact on heliothermal efficiency, compared to thermal emittance (see Chapter 1
section 3.4.2, p.34).
Surface topography, atomic composition
Figure 110 and Figure 111 show macroscopic pictures and SEM images of the samples surface after
deposition. No defects are observed in the samples surface morphology, and no differences are
notable between the series.
Figure 110. Pictures of the as-deposited surface for series SSC-1, SSC-2, SSC-3 and SSC-5 (from left to right)

128
Figure 111. SEM images of the as-deposited surface for series SSC-3 (left) and SSC-5 (right)
Table 17 shows EDS measurements of the atomic composition of the WAlSiN absorber coatings. For
each series, average contents and standard deviations were obtained from at least two measurements
on each of the several samples considered. In addition, the error on EDS atomic composition is approx.
2%. EDS results indicate that the samples of the different series have close atomic compositions.
Fe and Cr are elements from the SS substrate, detected in similar amounts, indicating that the coatings
have similar thicknesses and densities, except for SSC-6 which may be thinner than the others, as the
detected content in substrate elements is higher.
Table 17. EDS atomic composition of WAlSiN as-deposited samples (accelerating voltage 15 kV)
Series / Element (at.%) O W Al Si N Ar Fe Cr Ni
SS 304 substrate (4 samples) - - - 1 ± 0 - - 72 ± 0 19 ± 0 8 ± 0
SSC-1 (2 samples) 42 ± 1 28 ± 2 9 ± 1 3 ± 1 13 ± 1 2 ± 0 3 ± 1 1 ± 0 -
SSC-2 (2 samples) 39 ± 3 32 ± 3 7 ± 1 3 ± 2 14 ± 6 1 ± 0 3 ± 1 1 ± 0 -
SSC-3 (4 samples) 36 ± 2 36 ± 2 7 ± 1 1 ± 1 13 ± 1 2 ± 0 4 ± 1 1 ± 0 -
SSC-5 (2 samples) 35 ± 1 32 ± 0 10 ± 1 - 15 ± 1 2 ± 0 4 ± 0 1 ± 0 -
SSC-6 (1 sample) 11 ± 1 6 ± 1 6 ± 1 - 2 ± 1 1 ± 0 54 ± 1 16 ± 1 5 ± 0
A small quantity of Ar is detected, due to the incorporation in the coatings of energetic Ar+ ions during
the Ar plasma assisted sputtering process (see Chapter 3 section 1.2.2, p.98). O, W, Al, Si and N are
elements from the WAlSiN/SiON/SiO2 coatings. Their relative contents slightly vary depending on the
series. However, this is probably related to the EDS technique itself, rather than to notable changes in
the coatings compositions.
For instance, the quantification of Si in the presence of W is tricky, as the two elements have
overlapping peaks at low energy (see Chapter 3 section 2.2, p. 101), that could only be distinguished
using a technique with higher resolution than EDS, such as WDS (Figure 112). W also presents high
energy peaks, due to its much larger atomic number, i.e., 74 vs. 14 for Si. Thus it is systematically
detected and prioritized during the automated EDS quantification. Therefore, it is credible that the
actual amount of Si is significantly higher than estimated by EDS.

129
Figure 112. W and Si peak overlap (source: Bruker)
O and N also have low energy overlapping peaks. As they are both light elements, they however cannot
be distinguished by higher energy peaks, explaining why N is in some cases not quantified (series SSC-
1), virtually increasing the relative content in O.
Conclusions
In this case, the equivalence between samples and series of samples was checked out with a
comparison of five series of samples with WAlSiN/SiON/SiO2 absorber coating. They were fabricated
in different batches with the same type of substrate, SS304. Again this comparison is based on the
results of spectral reflectance measurements, optical properties, surface topography by SEM and
chemical composition by EDS.
Reflectance measurements show similar spectra for all the samples, with slight variations over the
whole spectral range (Figure 109). The highest variation occurs at the beginning of the visible region
(close to 0.25 μm) and the end of near infrared region (close to 2.5 μm). Series SSC-1, SSC-3 and SSC-4
show a good optical uniformity with the smallest variation in reflectance (Figure 109) and optical
properties, especially solar absorptance (Table 16). Series SSC-1 shows the best uniformity considering
the close values of solar absorptance and thermal emittance.
Taking into account all series, the average solar absorptance is 0.914 ± 0.008, the average thermal
emittance is 0.155 ± 0.029 and the average heliothermal efficiency is 0.884 ± 0.008 (Table 16). The
standard deviation of solar absorptance and heliothermal efficiency is thus small, of 1 point.
Meanwhile, thermal emittance fluctuates more distinctly by almost 3 points. Microstructural analysis
did not show any notable differences between the samples of all series. These optical fluctuations may
thus be due to slights variations in layer thicknesses during deposition, especially when considering
the complex architecture of this type of absorber, where very thin layers must be deposited (2-3 nm).
Indeed, the WAlSiN layer is composed of 18 layers of W2N and 18 layers of AlSiN over a total thickness
of 85 nm (see Chapter 3 section 1.2.1, p. 97).
To conclude on these series, the equivalence between these samples is sufficient for the results of
different aging studies to be compared. As shown with the previous absorber, their optical properties
are not the same, the solar absorptance values are very close between series, and their structure and
chemical composition are close enough that their aging behavior should not change significantly.

130
1.4. Samples of W/SiCH multilayer absorber coatings
For the W/SiCH multilayer absorber coating (see Chapter 3 section 1.3, p.98), two different series of
samples were used as part of our study (Table 18).
Table 18. The different series of samples used to test W/SiCH multilayer absorber coating
W/SiCH absorber coating Series I4C Series I9C
Number of samples 3 5
Number of layers in the coating 4 9
Substrate Inconel Silicon
The two series have different architectures with different numbers of layers (4 and 9) and different
substrate types (Inconel, Si). The series are named after the number of layers of the coating. Series I4C
is a W (181 nm) / SiCH (71 nm) / W (8 nm) / SiCH (72 nm) multilayer absorber deposited on an Inconel
substrate (Figure 80 p. 99), with a total coating thickness of 331 nm. Series I9C is a multibilayer of four
W (2 nm) / SiCH (60 nm) periodic bilayers and an infrared reflective W sublayer with a thickness of 180
nm (total coating thickness of 428 nm), deposited on a silicon substrate for easier material
characterization after aging. Because of their very different structures, in this case the two series are
not directly meant to be compared with one another. The equivalence within each series is discussed
in the following.
Optical properties
Figure 113 and Table 19 show the reflectance spectra and corresponding optical performance of the
two series of samples in their as-deposited state.
Figure 113. Reflectance spectra of series I4C (left) and series I9C (right)
Table 19. Optical properties for each series of the W/SiCH absorber coating
W/SiCH absorber coating Series I4C Series I9C
Solar absorptance 0.871 ± 0.004 0.896 ± 0.001
Thermal emittance @ 500°C 0.190 ± 0.007 0.426 ± 0.008
Heliothermal efficiency @ 500°C 0.833 ± 0.005 0.812 ± 0.001
As expected, the optical behavior is very different when comparing the two series. Series I4C has the
best selective behavior with an efficiency equal to 0.833 ± 0.005, as it is an optimized architecture [93].
Contrarily, series I9C is less efficient (0.812 ± 0.001), as its architecture is not optimized. Indeed, it was
initially developed for the purpose of generating W-SiCH composites by thermal annealing [194]. As a

131
result, solar absorptances are close, with a difference of 0.025 (0.896 vs. 0.871). The higher solar
absorptance for I9C is due to the larger number of absorptive layers. As a consequence, thermal
emittance is also much higher for I9C series, by 0.236 (0.426 vs. 0.190), due to the reflectance spectrum
shift towards the infrared range. This shift is in turn due to the nature of the Si substrate, which is not
IR-reflective as is the Inconel one, and to the higher number of layers and interfaces intensifying
multiple reflections and enhancing optical interferences [194]. On the other hand, within each series
the samples are satisfyingly uniform, with standard deviations lower than 1 point of performance
(maximum ± 0.007).
Surface topography, atomic composition
Pictures and SEM images of as-deposited W/SiCH samples for series I4C and I9C show a homogenous
and smooth surface in both cases (Figure 114). There is no visual difference between the surfaces of
each series.
Table 20 shows the atomic content of the different elements present in the as-deposited absorber
samples as measured by EDS. For series I9C, the higher content in silicon compared to series I4C is
partly due to the Si substrate, which is detected underneath the coating. In a similar manner, elements
from the Inconel substrate, Ni and Cr, are detected for series I4C.
Table 20. Initial chemical composition in at.% (measured by EDS)
Series Substrate O Si C W Fe Cr Ni Mo Nb
_ Inconel - - - - 5 24 63 5 2
I4C Inconel 1 3 69 21 - 2 5 - -
I9C Silicon 1 12 70 16 - - - - -
Figure 114. Pictures (top) and SEM images (bottom) of the surface of a sample from series I4C (left) and series I9C (right)
From its architecture, series I9C has a higher content in Si and C, as it comprises four 60 nm-thick SiCH
layers (240 nm in total), whereas series I4C has only two SiCH layers (143 nm in total). Meanwhile, the
content in W should be equivalent (189 nm in total for series I4C vs. 188 nm in total for series I9C). This
is not clearly apparent in Table 20, where the detected content in W is larger by 5 at.% for series I4C.
This again can be due to the overlapping of W and Si EDS peaks, rendering the concomitant
quantification of these two elements difficult, especially at low Si contents. Therefore, the W content
detected for series I9C with more Si (coating + substrate) is probably more realistic. In any case, these
two series having different architectures, they have different atomic compositions, as can be expected.

132
Conclusions
From the as-deposited analysis done on this type of absorber for the different series, due to their
different architectures, a high variation of reflectance spectra was observed from one series to
another, and as a results a high variation between the optical properties of the absorber, with a higher
variation of thermal emittance than solar absorptance. As expected, the equivalence between these
series cannot be considered and the two series will be used for testing separate aging protocols.
1.5. Conclusions on sample equivalence
In this section, large sets of samples were compared to determine their equivalence, for each of the
three types of absorbers considered in this work: TiAlN and WAlSiN tandem absorbers, and W/SiCH
multilayer absorber. The comparison of the samples was based on data obtained with the material
characterization techniques available at PROMES-CNRS laboratory: spectrophotometry, SEM and EDS.
The average optical performance calculated from reflectance measurements for each type of absorber
is recalled in Table 21. For W/SiCH only the 4-layer series I4C is considered, as it is optimized. The other
available series has a different architecture, so each series has been studied separately and their
equivalence is not discussed. For WAlSiN, for the sake of comparison, the reported solar absorptance
is the one calculated from reflectance spectra using the same method as for the others.
Following Eq.(12) (p.34), solar absorptance has a higher impact on the absorber optical performance
than thermal emittance. Therefore, variations in solar absorptance between equivalent samples of the
same type of absorber must be limited, typically around 0.01, while variations in thermal emittance
can be higher due to its lesser impact, typically lower than 0.1. Thus, the series of samples considered
in this study present acceptable variations of their optical properties for a given type of absorber.
Table 21. Average optical performance for each type of absorber
Property / absorber type
(number of samples considered)
TiAlN tandem
(30 samples)
WAlSiN tandem
(30 samples)
W/SiCH multilayer
(3 samples I4C)
Solar absorptance 0.919 ± 0.007 0.914 ± 0.008 0.871 ± 0.004
Thermal emittance @ 500°C 0.348 ± 0.033 0.155 ± 0.029 0.190 ± 0.007
Heliothermal efficiency @ 500°C 0.850 ± 0.011 0.884 ± 0.008 0.833 ± 0.005
These variations of optical properties tend to indicate that the top layers of the coatings, that by design
influence solar absorptance, are very similar, while the underlying layers and substrate surface state,
that influence thermal emittance, may vary more from one sample/series/batch to another.
In addition, for a given absorber the surface morphology and chemical composition are similar. This
study thus suggests that, for a given absorber type, the series of samples can be considered equivalent
enough to be able to compare the results of different aging protocols applied to them. Indeed, their
coating architecture and chemical composition are close enough so that their aging behavior and
thermal stability should not differ significantly from one series to another.
In any case, in the following, for each treated sample, the variation with aging of its optical response
will also be considered relatively to its as-deposited state (e.g. S = S (aged) – S (as-deposited)).
This allows for an enhanced comparability between the aging results obtained on different samples of
a given absorber architecture.
133
2. Thermal aging for short durations in air
When a solar selective absorber coating is designed and developed, even if the thermal stability of its
constitutive materials is sometimes known, the aging behavior of the complete architecture is hard to
predict, due to the complex aging phenomena discussed at length in Chapter 2. Therefore, the first
simple step to test the thermal stability of an absorber is usually to treat samples under thermal
radiation for a short duration, at temperatures close to the aimed operating temperature of the
absorber. Since their duration is short, such tests can be attempted on equivalent samples in a range
of temperatures instead of just one, in order to explore the absorber thermal resistance and find the
critical temperature above which stability is no longer ensured. The atmosphere imposed on the
coating during these tests also depends on the aimed working conditions, i.e., vacuum or air.
In this way, the first response of the absorber coating with temperature can be precisely observed,
using material characterization techniques. In particular, due to the optical nature of CSP applications,
the absorber optical properties (spectral reflectance, solar absorptance, thermal emittance,
heliothermal efficiency) are chosen as the main parameters to follow this evolution with aging.
As a first step to investigate the aging behavior of absorber coatings, thermal aging tests for short
durations of typically up to 24h are applied, usually in air and at various temperatures. The aim of such
tests is to observe the response of the as-deposited coating to thermal exposure, usually at a
temperature higher than its fabrication temperature. Indeed, depending on their fabrication technique
and experimental conditions, coatings are not always stabilized after deposition. They can for instance
present porosity or residual stress that may evolve under thermal post-treatment (see Chapter 2
section 3.2.2, p.60). Such microstructural changes may cause variations in their optical properties that
can be detrimental to their performance.
2.1. Optical properties
As an illustration of the effect of short duration aging protocols, Figure 115 shows the experimental
spectral reflectance of the 3 types of absorbers (TiAlN, WAlSiN, W/SiCH) before and after thermal aging
in air for up to 25h, at different temperatures. The aging conditions are recalled in the graph titles.
For the WAlSiN absorber, samples were treated and measured at CSIR-NAL [242], first for 5h at
different temperatures between 300 and 600°C in air, then up to 25h on the same samples. The other
absorber coatings were treated and measured at PROMES-CNRS for up to 24h at 500°C in air. Some of
them were treated for 24h directly from the as-deposited state, while others were first heat treated
for 12h then treated again to reach 24h in total. Three series are considered for the TiAlN absorber
and two for the W/SiCH absorber (4 and 9 layers). All these samples were treated in ambient air, except
the 9-layer W/SiCH (I9C) absorber that was treated in filtered air, i.e., without CO2 and H2O. Table 22
(p.135) and Figure 116 (p.137) show the corresponding variations in optical performance. Variations
are calculated as the difference between the considered property after aging and before aging (e.g.
S = S (after 24h) – S (as-deposited)). In Figure 116, the first number is the aging temperature in °C
and the second number is the aging duration in hours.

134
Figure 115. Reflectance spectra of samples of the 3 absorber types, as-deposited and heat treated in air for up to 25h

135
Table 22. Comparison of optical properties as-deposited and after 12 and/or 24h at 500°C in air (favorable variations are
in green, unfavorable ones in red)
Absorber State Nb of
samples
Solar
absorptance
Thermal emittance
@ 500°C
Heliothermal efficiency
@ 500°C
TiAlN
Series 1616
As-deposited 10 0.915 ± 0.002 0.348 ± 0.004 0.846 ± 0.002
After 12h 7 0.904 ± 0.001 0.306 ± 0.005 0.844 ± 0.001
After 24h 9 0.912 ± 0.004 0.302 ± 0.004 0.852 ± 0.005
Variation after 12h -0.011 -0.042 -0.002
Variation after 24h
vs. as-deposited -0.003 -0.046 +0.006
vs. 12h +0.008 -0.004 +0.008
TiAlN
Series 1828
As-deposited 3 0.927 ± 0.002 0.315 ± 0.004 0.865 ± 0.002
After 24h 7 0.911 ± 0.004 0.257 ± 0.008 0.861 ± 0.003
Variation after 24h -0.016 -0.058 -0.004
TiAlN
Series 1928
As-deposited 17 0.914 ± 0.009 0.381 ± 0.011 0.839 ± 0.011
After 24h 4 0.924 ± 0.007 0.329 ± 0.012 0.859 ± 0.005
Variation after 24h +0.010 -0.052 +0.020
W/SiCH
Series I4C
As-deposited 1 0.869 0.195 0.831
After 24h 1 0.882 0.194 0.843
Variation after 24h +0.013 -0.001 +0.013
W/SiCH
Series I9C
As-deposited 5 0.896 ± 0.001 0.426 ± 0.008 0.812 ± 0.001
After 12h 1 0.920 0.288 0.863
After 24h 1 0.912 0.280 0.857
Variation after 12h +0.024 -0.138 +0.051
Variation after 24h
vs. as-deposited +0.014 -0.146 +0.045
vs. 12h -0.008 -0.008 -0.006
Overall, the observed evolutions in optical properties, if any, tend to occur after the first hours of
thermal aging (5 to 12h), as little difference is later obtained between 5/12h and 24/25h. Also, there
is also no notable difference between samples treated cumulatively, i.e., first for 12h then again for
12h to reach 24h of aging in total, and samples treated for 24h directly from their as-deposited state.
For TiAlN absorbers (Figure 115(a-c)), compared to their as-deposited state, reflectance after 12 and
24h of aging clearly evolves. It is reduced in the UV-Vis range but increases in the NIR-IR range (typically
above 0.75 µm). As a consequence, solar absorptance varies slightly (max. ± 0.016); thermal emittance
notably decreases by several points (max. -0.058, i.e., -6 points); heliothermal efficiency is only slightly
affected, with either a very slight decrease (-0.004) or a small increase (+0.020, i.e., +2 points),
depending on the concomitant evolutions of solar absorptance and thermal emittance.
The appearance of a very small absorption peak around 9.3 µm (reflectance dip visible in reflectance
spectra), typical of Si-O bonds (1075 cm-1) [321], indicates that the coating could be slightly oxidized
after its exposure to air. In previous work by HEF-IREIS [295], the optical changes were attributed to
variations in layer thicknesses due to aging, especially for the two absorber layers, as measured on
SEM images. Short duration thermal aging (12h) in air at a temperature close to that of the aimed
application (500°C) leads to slight changes in optical performance, due to the coating microstructural
fine tuning: densification and layer thickness variation. Since the absorber was optically optimized
using optical simulation before plasma synthesis, due to these changes the absorber architecture is no

136
longer perfectly optimal. This underlines the critical importance of checking the coating stability after
deposition, to validate its performance.
This idea is illustrated by the case of the non-optimized W/SiCH absorber with 9 layers (series I9C), for
which aging tests were also carried out for 12 and 24h at 500°C in air. The design of this periodic
architecture was not optically optimized in terms of layer thicknesses before synthesis. Aging also
affects its reflectance, with a shift towards lower wavelengths in the IR range and a decrease in
intensity in the UV-Vis-NIR range (Figure 115(g)). Consequently, contrarily to the previous examples,
in this case aging notably improves the absorber performance. As reflectance is slightly higher above
0.5 µm but lower before 0.5 µm, and the spectrum is shifted towards lower wavelengths, there is an
increase in solar absorptance by 2 points (+0.024 to reach 0.920), and more importantly a significant
decrease of thermal emittance by almost 14 points (-0.138), so that heliothermal efficiency increases
by 5 points (+0.051). Complementary studies in PROMES-CNRS during the thesis of D. Ngoue [194]
indicated that this improvement is again due to changes in the chemical nature of the coating
(oxidation of SiCH with partial replacement of H and/or C by O – here also confirmed by the appearance
of an absorption peak near 9.3 µm on reflectance spectra, diffusion of W) and subsequent
densification. A study of the kinetics of such phenomena showed that they are initiated at the early
stages of heating (during the first 3 hours).
This example shows that an initially non-optimal architecture may evolve into a more efficient one
after aging for a short duration. Therefore, the short-term aging behavior of an absorber must
absolutely be studied and its initial design can even be adapted accordingly.
For the WAlSiN absorber, several equivalent samples were treated for 5h in air, at different
temperatures ranging from 300°C to 600°C, with this time the objective to find a critical temperature
beyond which the coatings are no longer stable. Up to 450°C the optical properties remain stable
(Figure 115(d) and Figure 116 (top)). At 500°C and above, thermal emittance decreases by up to 2
points, while solar absorptance is stable and even slightly increases at 600°C. Consequently, not only
heliothermal efficiency is not degraded by aging but it even tends to slightly improve with temperature,
starting at 500°C, reaching an improvement of 0.5 point at 550°C and 600°C. This example again
illustrates that absorber coatings can be improved by short duration aging. Also, it demonstrates that
aging for short durations is not sufficient to conclude on the existence and value of a critical
temperature that would induce optical degradation.
Small changes in the optical properties, mostly thermal emittance, are observed between 5h and 25h
of thermal aging for the WAlSiN absorber (Figure 116 (bottom)). However, the calculation of thermal
emittance considered here is influenced by the fluctuating quality of the overlap between the spectra
acquired in the UV-Vis-NIR and NIR-IR ranges and of the extrapolation in the 16 – 25 µm range (Figure
115(e)). As a matter of fact, direct measurements of thermal emittance at 82°C at CSIR-NAL using an
emissometer (model AE1-RD1) did not show any variations [242]. Therefore, the observed variations
for this absorber may not be significant, and remain small in any case (maximum 1.5 points of
emittance).
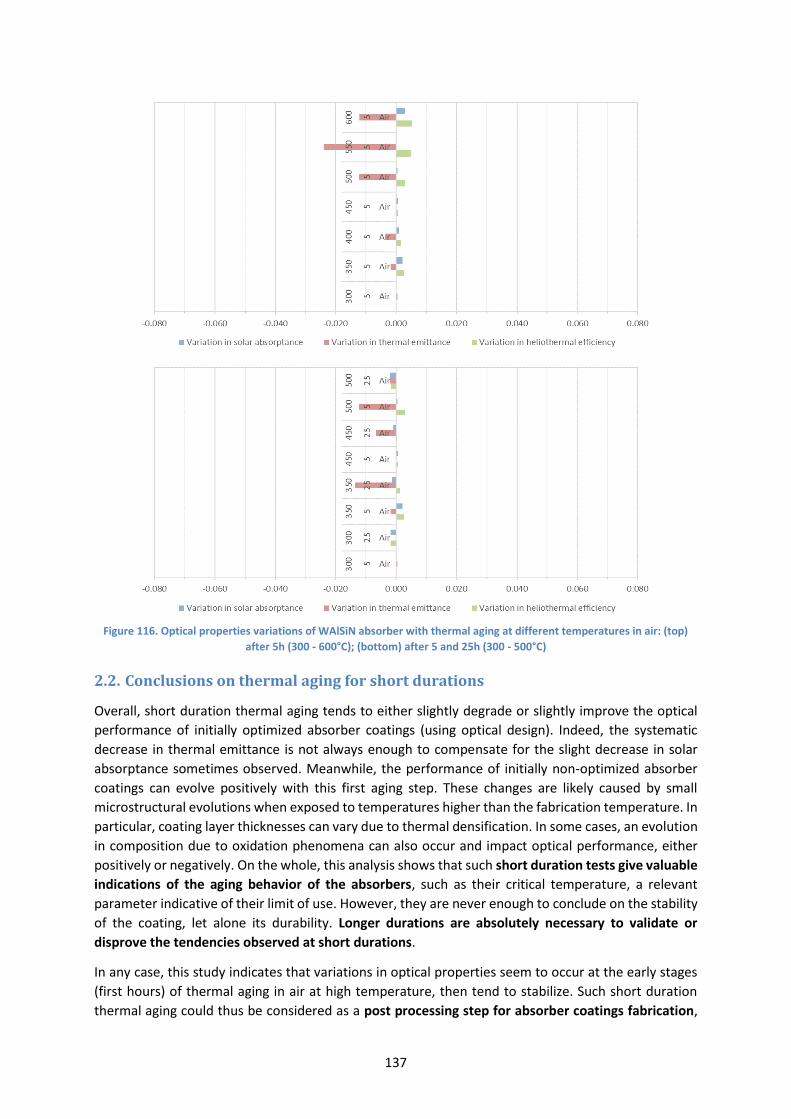
137
Figure 116. Optical properties variations of WAlSiN absorber with thermal aging at different temperatures in air: (top)
after 5h (300 - 600°C); (bottom) after 5 and 25h (300 - 500°C)
2.2. Conclusions on thermal aging for short durations
Overall, short duration thermal aging tends to either slightly degrade or slightly improve the optical
performance of initially optimized absorber coatings (using optical design). Indeed, the systematic
decrease in thermal emittance is not always enough to compensate for the slight decrease in solar
absorptance sometimes observed. Meanwhile, the performance of initially non-optimized absorber
coatings can evolve positively with this first aging step. These changes are likely caused by small
microstructural evolutions when exposed to temperatures higher than the fabrication temperature. In
particular, coating layer thicknesses can vary due to thermal densification. In some cases, an evolution
in composition due to oxidation phenomena can also occur and impact optical performance, either
positively or negatively. On the whole, this analysis shows that such short duration tests give valuable
indications of the aging behavior of the absorbers, such as their critical temperature, a relevant
parameter indicative of their limit of use. However, they are never enough to conclude on the stability
of the coating, let alone its durability. Longer durations are absolutely necessary to validate or
disprove the tendencies observed at short durations.
In any case, this study indicates that variations in optical properties seem to occur at the early stages
(first hours) of thermal aging in air at high temperature, then tend to stabilize. Such short duration
thermal aging could thus be considered as a post processing step for absorber coatings fabrication,

138
with the aim of stabilizing the microstructure and properties of the coatings, or even in some cases
fine tuning and improving them. This kind of procedure is classically called curing in materials
engineering. Since absorbers will inevitably be exposed to high temperatures in the final CSP
application, this curing step, integrated as the final step in the fabrication process, is highly
recommended to avoid any notable changes in the coating performance after its installation. Also, as
optical properties were not perfectly stabilized after up to 12h, it appears recommendable to increase
the duration of the curing step to typically 24h, to better ensure the stabilization of the coating
microstructure. In the following, unless otherwise stated, a curing step of 24h at 500°C in air was thus
systematically applied to the TiAlN and W/SiCH absorbers before any other type of aging.
Finally, even though short duration thermal aging gives access to relevant information of the aging
behavior of the absorber coatings, it is mandatory to check if this behavior remains constant with
time. Aging tests for longer durations than 24h are thus necessary to verify their durability.
3. Thermal aging for long durations at working temperature in air
Compared to short durations, applying thermal aging on solar absorbers for long durations allows
checking whether their optical performance tends to stabilize with time after its first evolution, or if
the latter tend to progress further, to finally reach an unacceptable level of degradation. In this way,
long duration tests allow studying the absorbers behavior in conditions better approaching the real
working conditions in CSP plants, i.e., a high number of hours at high temperature during the lifetime
of a CSP plant.
For our study, the aimed working temperature is considered to be around 500°C in air, representative
of CSP technologies such as Fresnel or central tower with Direct Steam Generation.
As a consequence:
• Three equivalent samples of the TiAlN absorber (series 1616) were aged for up to 1000h at
500°C in air, cumulatively with steps of approx. 24h;
• During the thesis of D. Ngoue [194], several equivalent samples of the optically non-optimized
9-layer W/SiCH absorber (periodic series I9C) deposited on silicon wafers were treated at
500°C in filtered air (without CO2 and H2O) for different durations up to 96h, and some of these
results are reported here to complete our analysis of aging protocols;
• In addition, a sample of the optically optimized 4-layer W/SiCH absorber (a-periodic series I4C
[93]) deposited on Inconel was also treated at 500°C in ambient air during this thesis, this time
cumulatively on the same sample for up to 96h, with steps of 24h;
• During the thesis of K. Niranjan at CSIR-NAL, a sample of the WAlSiN absorber was treated at
450°C in air, cumulatively with steps of 25h until reaching a total duration of 250h, and these
results are further exploited here [242].
Their spectral reflectance was measured as-deposited and after each aging step to follow the evolution
of the optical properties with aging. Their surface morphology and atomic composition were also
measured at intervals by SEM and EDS analyses. The corresponding results are presented in the
following subsections.

139
3.1. Optical properties
Figure 117 shows the reflectance spectra measured before and after each aging step applied to the
different absorbers. For the TiAlN absorber, only some of the collected spectra are shown, for clarity.
The spectra for the as-deposited state and up to 24h of aging are the same as the ones presented in
section 2 on short durations. Table 23, Figure 118 and Figure 119 show the evolutions with aging of
the corresponding optical performance parameters: solar absorptance, thermal emittance and
heliothermal efficiency at 500°C, and performance criterion in some cases. Table 23 gives the absolute
values and variations of these optical properties for TiAlN and W/SiCH absorbers at specific durations,
Figure 119 shows absolute values for all aging durations applied to the TiAlN absorber and Figure 118
shows the absolute variation for WAlSiN absorber compared to the as-deposited state, as previously
shown for shorter durations.
Figure 117. Reflectance spectra of the different absorbers, as-deposited and aged at 450 or 500°C in air for up to 1000h
Overall, the beneficial effect of the curing step (24h aging) discussed in section 2 is again visible here:
for TiAlN and W/SiCH absorbers, the decrease in UV-Vis reflectance, coupled with a decrease in
thermal emittance due to the increase in NIR-IR reflectance and/or the reflectance blueshift (due to
coating densification with aging), leads to an increase in heliothermal efficiency by a few points.
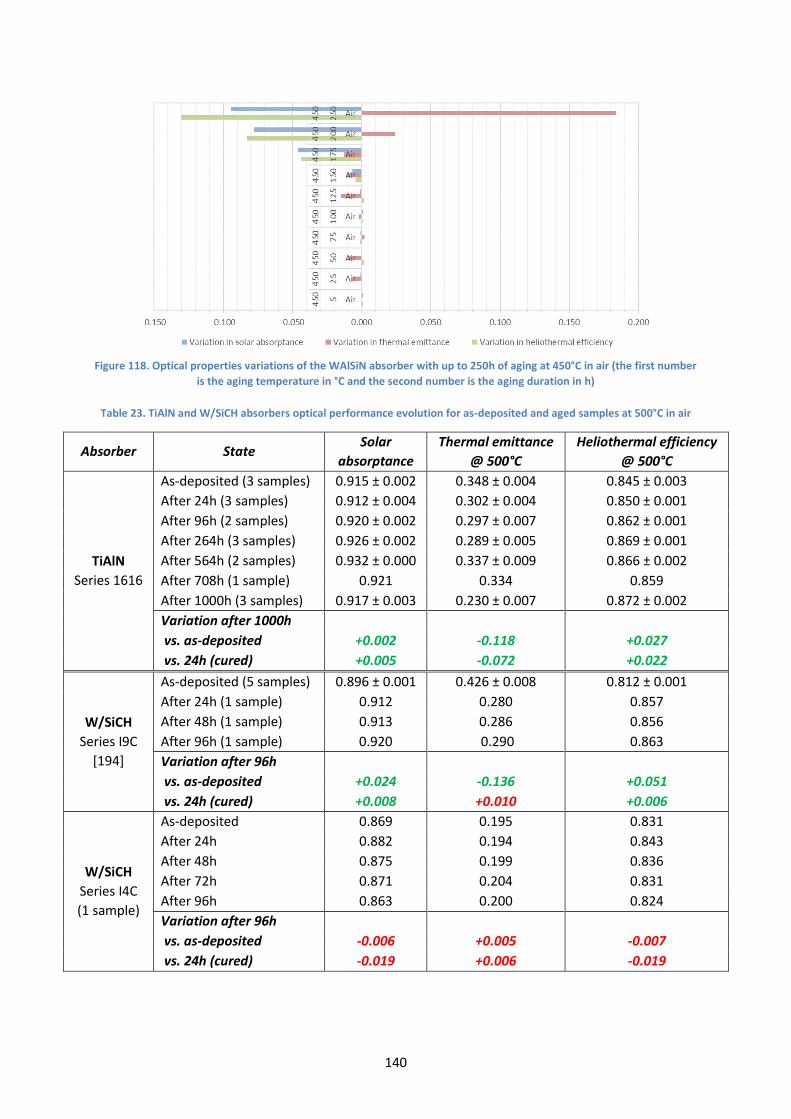
140
Figure 118. Optical properties variations of the WAlSiN absorber with up to 250h of aging at 450°C in air (the first number
is the aging temperature in °C and the second number is the aging duration in h)
Table 23. TiAlN and W/SiCH absorbers optical performance evolution for as-deposited and aged samples at 500°C in air
Absorber State Solar
absorptance
Thermal emittance
@ 500°C
Heliothermal efficiency
@ 500°C
TiAlN
Series 1616
As-deposited (3 samples) 0.915 ± 0.002 0.348 ± 0.004 0.845 ± 0.003
After 24h (3 samples) 0.912 ± 0.004 0.302 ± 0.004 0.850 ± 0.001
After 96h (2 samples) 0.920 ± 0.002 0.297 ± 0.007 0.862 ± 0.001
After 264h (3 samples) 0.926 ± 0.002 0.289 ± 0.005 0.869 ± 0.001
After 564h (2 samples) 0.932 ± 0.000 0.337 ± 0.009 0.866 ± 0.002
After 708h (1 sample) 0.921 0.334 0.859
After 1000h (3 samples) 0.917 ± 0.003 0.230 ± 0.007 0.872 ± 0.002
Variation after 1000h
vs. as-deposited +0.002 -0.118 +0.027
vs. 24h (cured) +0.005 -0.072 +0.022
W/SiCH
Series I9C
[194]
As-deposited (5 samples) 0.896 ± 0.001 0.426 ± 0.008 0.812 ± 0.001
After 24h (1 sample) 0.912 0.280 0.857
After 48h (1 sample) 0.913 0.286 0.856
After 96h (1 sample) 0.920 0.290 0.863
Variation after 96h
vs. as-deposited +0.024 -0.136 +0.051
vs. 24h (cured) +0.008 +0.010 +0.006
W/SiCH
Series I4C
(1 sample)
As-deposited 0.869 0.195 0.831
After 24h 0.882 0.194 0.843
After 48h 0.875 0.199 0.836
After 72h 0.871 0.204 0.831
After 96h 0.863 0.200 0.824
Variation after 96h
vs. as-deposited -0.006 +0.005 -0.007
vs. 24h (cured) -0.019 +0.006 -0.019
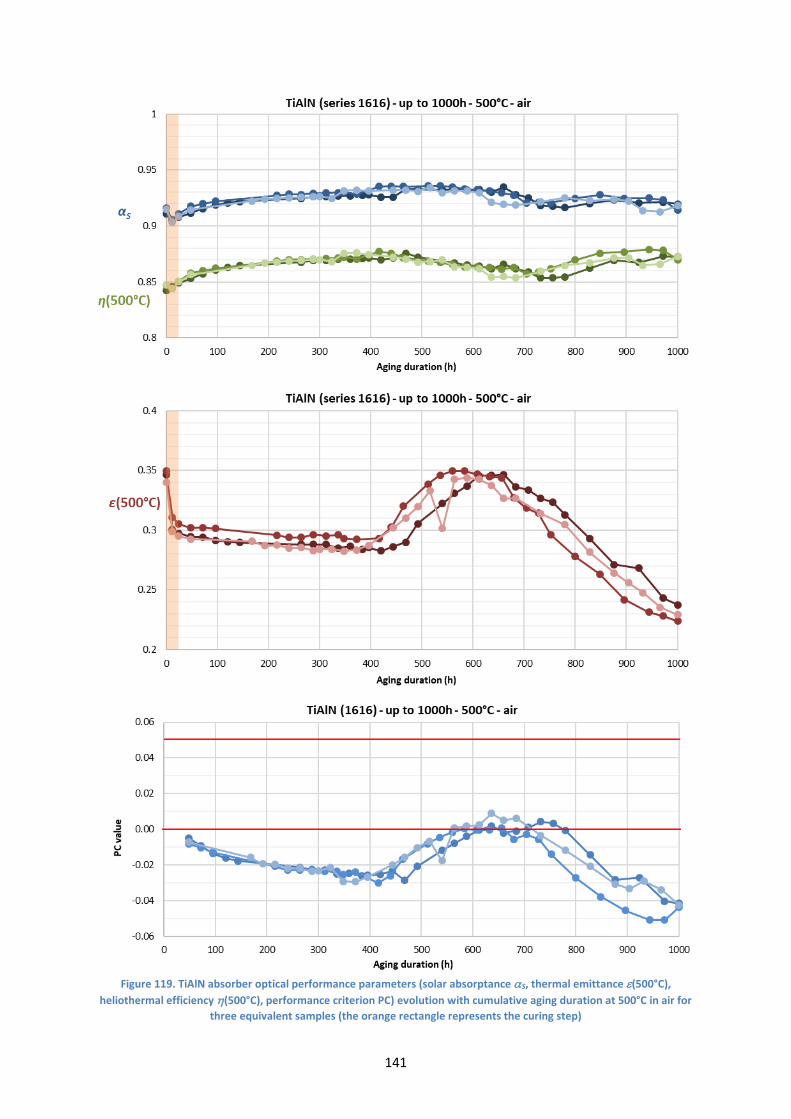
141
Figure 119. TiAlN absorber optical performance parameters (solar absorptance S, thermal emittance (500°C),
heliothermal efficiency (500°C), performance criterion PC) evolution with cumulative aging duration at 500°C in air for
three equivalent samples (the orange rectangle represents the curing step)

142
After this curing step, there is no general tendency for the different absorbers. For the TiAlN absorber,
the performance continues to improve (i.e., solar absorptance increases by up to 3 points and thermal
emittance decreases by 2 points), slightly but steadily, up to approx. 400h of aging (Figure 119). The
cut-off wavelength between low and high reflectance behavior is shifted towards lower wavelengths
(Figure 117), due to the decrease in coating thickness [295]: a slow densification of the material with
cumulative aging may thus be at play. After 400h, thermal emittance suddenly increases again by
approx. 5 points to reach its initial value, before going down again after 600h to finally reach values
significantly lower than the initial one (-0.118 after 1000h vs. as-deposited). Meanwhile, above 500h
solar absorptance decreases again slightly, to practically reach its initial value after 1000h (+0.005 after
1000h, Table 23). These changes derive from the ones in spectral reflectance (Figure 117 (a)), with a
slight increase below 0.7 μm where solar irradiation is high, thus reducing solar absorptance, not
compensated by the slight reflectance decrease in the NIR region. IR reflectance varies the most,
causing the strong variations in thermal emittance. Overall, heliothermal efficiency remains higher
than its initial value at all times, up to 1000h of aging (+0.027 vs. as-deposited, Table 23). Also, the
performance criterion (PC = - + 0.5 ) is very low (below 0.01, Figure 119) and even negative for
most of the aging test, clearly illustrating that not only the optical performance is not degraded by
aging, but it is even improved by it. Aging is thus beneficial for this type of absorber coating, which
demonstrates good thermal stability for long durations at 500°C in air.
For the 9-layer W/SiCH absorber, spectral reflectance varies only slightly after the curing step (Figure
117 (b)), so that the optical properties have not significantly changed after 96h of aging (Table 23).
Solar absorptance and thermal emittance slightly increase compared to the cured state (+0.01),
resulting in a very slight improvement of the heliothermal efficiency. This absorber is thus thermally
stable up to approx. 100h. However, these evolutions are very similar to the ones obtained for the
TiAlN absorber after 100h, so that the 9-layer W/SiCH absorber may also still evolve with time if aging
tests are continued.
For the 4-layer W/SiCH absorber, reflectance tends to gradually decrease in the UV-Vis (0.25-0.5 μm)
and IR regions (> 2.5 µm) whereas it increases in between (0.5-2.5 µm) (Figure 117 (c)). There is also a
blueshift of the reflectance minima, indicating a probable decrease in thickness and densification of
the coating with aging. After the improvement brought by the curing step, the optical properties tend
to degrade slowly with aging, to finally reach a performance after 96h that is slightly lower than the
performance of the as-deposited sample (-0.006 in solar absorptance, +0.005 in thermal emittance, -
0.007 in heliothermal efficiency), and definitely lower the performance of the cured sample (-0.019 in
solar absorptance, +0.006 in thermal emittance, -0.019 in heliothermal efficiency).
For the WAlSiN absorber, the optical properties remain stable up to 150h (Figure 118), despite the
decrease in reflectance in the UV region (Figure 117 (d)) that has little impact on solar absorptance, as
there is very little solar radiation in this range. As previously discussed, the small variations in thermal
emittance below 150h are not significant as they are mostly caused by the poor overlapping of UV-Vis-
NIR and IR spectra. Then after 150h of aging the behavior starts to change in a more significant way,
first in the solar range where reflectance flattens, with a notable increase beyond 0.5 µm, then also in
the infrared region where reflectance strongly decreases. As a consequence, the heliothermal
efficiency starts to decrease at 150h (-0.13 after 250h), first due to a dramatic drop in solar absorptance
(-0.09 after 250h), then to a strong increase in thermal emittance (+0.18 after 250h).
In the following, material characterization sheds some light into the causes of these evolutions. On this
matter, as observed for shorter durations absorption peaks (reflectance dips around 9.3 µm) appear
with aging, foreboding some level of oxidation through the formation of Si-O and/or Al-O bonds [321].

143
3.2. Surface topography
Figure 120 and Figure 121 compare macroscopic and SEM pictures of the surface of the different
absorbers in their as-deposited state and after aging at 450 or 500°C in air for different durations.
Absorber As-deposited After 24h After 48h After 72h After 96h After 1000h
TiAlN
Series
1616
_ _ _ _
W/SiCH
Series
I9C [194]
_ _
_
W/SiCH
Series
I4C
_
_
Figure 120. Macroscopic images of the absorbers, as-deposited and after aging for different durations at 500°C in air
To the naked eye, the samples, particularly the W/SiCH ones, display changes in color with aging. This
change probably reflects a change in thickness due to the densification of the coating [194], as
indicated by the blueshift of the reflectance spectra (Figure 117). Local surface defects and edge
delamination can also be observed on the TiAlN and 4-layer W/SiCH absorbers deposited on Inconel
substrates, while the 9-layer W/SiCH absorber deposited on Si did not suffer from delamination (Figure
120). The phenomena can thus be due to the larger thermal expansion of the metallic alloy substrate
(typically 14 x 10−6 °C-1 at 500°C [322]) compared to the crystalline silicon wafer (4 x 10⁻⁶ °C-1 at 500°C
[323]), creating larger tensile mechanical stress in the coating when heated (tension-compression
cycle). This example emphasizes the strong influence of the substrate on the aging behavior of
absorber coatings. Such macroscopic defects are still visible at larger magnification, provided by SEM
analysis. However, when further increasing magnification, the surface appears smooth (apart from the
initial polishing tracks of the metallic substrate) and without defects. The morphologic changes appear
to only be macroscopic, typical of thermomechanical deterioration and not of dramatic changes of the
coating microstructure. This is why the optical properties of these coatings do not drastically change
with the applied aging.
Contrarily, for the WAlSiN absorbers, the change in surface morphology is more drastic after 250h
(Figure 121), explaining the notable degradation of the optical performance. Indeed, the initially
smooth surface changes to a more irregular surface, with the appearance of asperities that strongly
deteriorate the selectivity of the material. Thermal emittance is the most affected (Figure 118), due to
the size of these asperities, in the micrometer range: they cause light trapping in the IR wavelengths,
increasing spectral absorptance and emittance in this range (decrease in reflectance in Figure 117 (d)).
These morphologic and optical changes are also related to the evolution of the material composition
with aging, as explained in the following.

144
TiAlN
Series
1616
As-deposited
_
After 384h at 500°C
x 150
After 1000h at 500°C
x 150
x 8000
W/SiCH
Series I9C
[194]
As-deposited
x 5000
x 80000
After 96h at 500°C
x 80000
WAlSiN
[242]
As-deposited
_
After 250h at 450°C
Figure 121. SEM images of the surface of the absorbers, after different aging durations at 450°C or 500°C in air
3.3. Atomic composition
The evolutions in the atomic composition of the different absorbers were measured by EDS at
intervals. Both the 9-layer W/SiCH and WAlSiN absorbers show a large increase of the oxygen content
in the coating after aging (approx. +20-25 at.%, Table 24), indicating their oxidation in the presence of
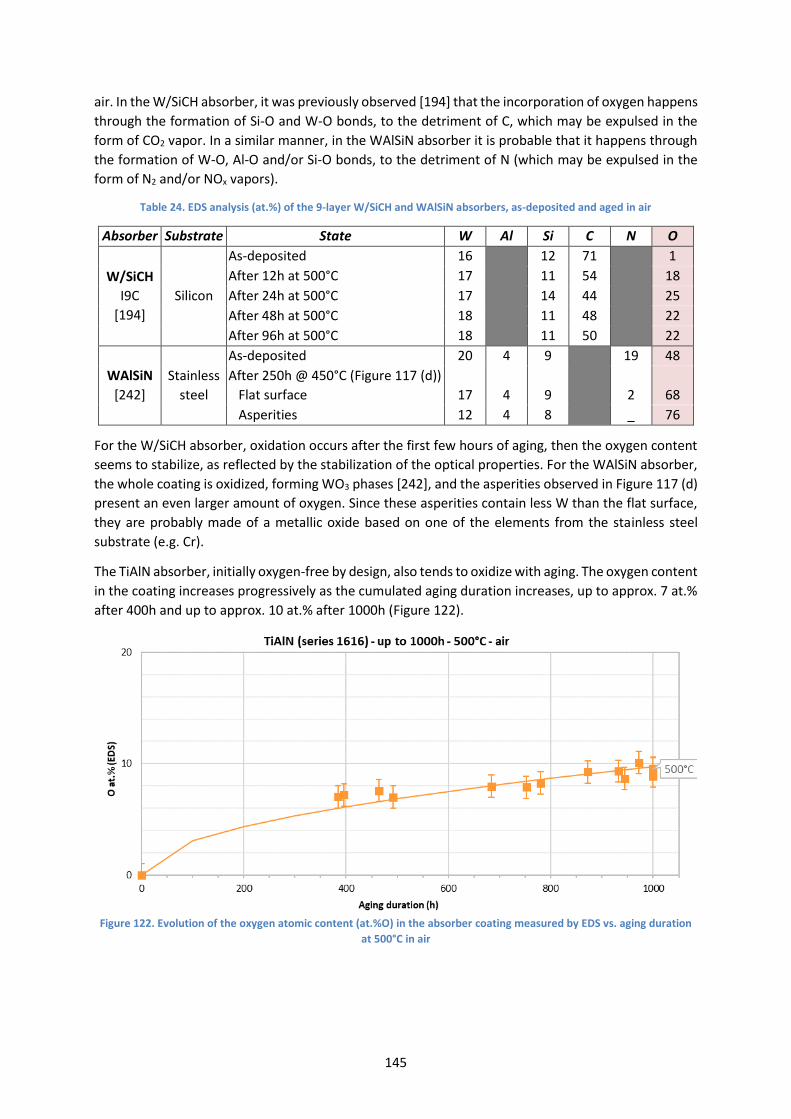
145
air. In the W/SiCH absorber, it was previously observed [194] that the incorporation of oxygen happens
through the formation of Si-O and W-O bonds, to the detriment of C, which may be expulsed in the
form of CO2 vapor. In a similar manner, in the WAlSiN absorber it is probable that it happens through
the formation of W-O, Al-O and/or Si-O bonds, to the detriment of N (which may be expulsed in the
form of N2 and/or NOx vapors).
Table 24. EDS analysis (at.%) of the 9-layer W/SiCH and WAlSiN absorbers, as-deposited and aged in air
Absorber Substrate State W Al Si C N O
W/SiCH
I9C
[194]
Silicon
As-deposited 16
12 71
1
After 12h at 500°C 17 11 54 18
After 24h at 500°C 17 14 44 25
After 48h at 500°C 18 11 48 22
After 96h at 500°C 18 11 50 22
WAlSiN
[242]
Stainless
steel
As-deposited 20 4 9
19 48
After 250h @ 450°C (Figure 117 (d))
Flat surface
17
4
9
2
68
Asperities 12 4 8 _ 76
For the W/SiCH absorber, oxidation occurs after the first few hours of aging, then the oxygen content
seems to stabilize, as reflected by the stabilization of the optical properties. For the WAlSiN absorber,
the whole coating is oxidized, forming WO3 phases [242], and the asperities observed in Figure 117 (d)
present an even larger amount of oxygen. Since these asperities contain less W than the flat surface,
they are probably made of a metallic oxide based on one of the elements from the stainless steel
substrate (e.g. Cr).
The TiAlN absorber, initially oxygen-free by design, also tends to oxidize with aging. The oxygen content
in the coating increases progressively as the cumulated aging duration increases, up to approx. 7 at.%
after 400h and up to approx. 10 at.% after 1000h (Figure 122).
Figure 122. Evolution of the oxygen atomic content (at.%O) in the absorber coating measured by EDS vs. aging duration
at 500°C in air

146
In this case, the evolution of the oxygen content with aging duration was fitted with a parabolic law
known as Wagner’s law of oxidation (see Chapter 2 section 3.2.1.2, p.57). The latter states that during
oxidation a mass gain Δm occurs and is related with the square root of time, according to Eq.(34). Here
we will assume that the mass gain due to the formation of oxides is proportional to the increase in
oxygen content in at.% measured by EDS.
Δ𝑚 ∝ 𝑎𝑡. % 𝑂 ∝ 𝐾 ∙ √𝑡 (34)
This parabolic oxidation profile is typical of the formation of an adhering and stable oxide at the surface
of the coating during aging. As further oxidation must happen via oxygen diffusion through this surface
oxide, oxidation becomes slower and slower as the oxide gets thicker. Overall, the impact of oxidation
is not very strong since the optical properties remain stable even while this oxidation phenomenon
goes on (Figure 119).
It is thus possible that oxidation mostly concerns the top SiCNH antireflective layer of the absorber
structure, and that the optical indices (n, k) of the latter are not drastically changed by the
incorporation of oxygen in its microstructure, which remains a transparent low-n material. These
results seem to indicate that the initial SiCNH top antireflective layer may be oxidized into SiO2, then
this layer acts as a barrier against further oxidation, while keeping the antireflective property also
characteristic of this oxide material. The observed change in optical properties may additionally be
caused by the modification of layer thicknesses and intrinsic chemical nature due to atomic
interdiffusion between the coating layers or between the substrate and the coating, which are
thermally-induced phenomena, as was previously observed for similar HEF-IREIS coatings [295].
In any case, as oxidation is slowly and constantly increasing, it does not seem to be the cause for the
fluctuations in optical properties observed after 400h, especially thermal emittance (Figure 119). Since
the physical aspect of the surface evolves towards local defects at the micrometer scale, the changes
in optical properties at this second stage of aging are probably due to the impact these defects have
on the coating optical response in the IR range, as was observed for the WAlSiN absorber.
3.4. Conclusions on thermal aging for long durations at working temperature
Overall, this analysis shows that changes in coating microstructure, chemical composition and
subsequently in optical properties, if any, mostly occur during the first hours of aging (i.e., the curing
step), then the coating tends to stabilize or evolve slowly up to at least 100-150h. This evolution is
typical of the formation of a protective surface oxide to slow down oxidation, here based on the Si-
derived antireflective top layers (SiCNH, SiCH and SiON layers for the TiAlN, W/SiCH and WAlSiN
absorbers, respectively) forming silicon oxides [194]. Oxygen incorporation at the level of 10-25 at.%
does not necessarily result in a significant change, let alone degradation, in the optical performance of
the aged absorber.
However, given enough time (here above 150 to 400h), cumulative aging seems to provoke another
stage of aging where the optical performance of the coatings, especially thermal emittance, is
degraded by the appearance of defects on their surface. These defects can be purely physical, such as
local cracks or delamination, probably resulting from thermomechanical phenomena induced by
thermal expansion and repeated thermal cycling (e.g. for the TiAlN and W/SiCH absorbers) [242]. They
can also result from chemical changes, e.g. for the WAlSiN absorber highly-oxidized asperities develop
on the surface over time. Due to their size, these defects increase the absorption/emission of radiation
in the IR region.

147
For some absorber coatings, the beneficial effect of the curing step is not retained with further aging,
again demonstrating that tests for longer durations than the first few hours are absolutely necessary
to conclude on the stability of an absorber coating, although many authors claim the thermal stability
for their absorber coatings after short durations, sometimes as short as 2h.
In addition, our suggested aging protocol, exposed in Chapter 3 (section 3.1 p.102), is based on the
trends observed in this chapter so far. First, the thermal stability is studied for a duration of typically
100h, to be able in most cases to observe sufficient changes on the absorber microstructure and
composition – although the examples of the TiAlN and WAlSiN absorbers emphasize that a
deterioration may still eventually appear if tests are continued for longer durations at the same
temperature. Depending on its aging behavior up to 100h, the absorber can reasonably be further
tested or disqualified.
These further tests can be performed for longer durations at the same temperature, close to the aimed
working temperature in the CSP applications; or an accelerated aging protocol can be applied at higher
temperatures (see Chapter 2 section 4.1.2, p.75), also called “accelerated temperatures”. The interest
of such protocols is that it avoids testing for very long durations at the working temperature (e.g.
1000h), as applying higher temperatures supposedly accelerates aging phenomena without changing
their nature. This topic will be discussed in the following section.
4. Thermal aging for long durations at accelerated temperatures in air
The TiAlN absorber has demonstrated its good thermal and optical stability for long durations up to
1000h at 500°C in air with a small variation of the optical properties after the high amount of hours.
Thus, this absorber type was selected to apply and evaluate a classical accelerated aging protocol.
Several equivalent samples of the TiAlN absorber series 1616 were thermally aged for long durations
(200 to 450h) in air at different accelerated temperatures from 600°C to 800°C.
The selected temperatures were 600°C, 630°C, 660°C and 690°C, to obtain a lifetime prediction from
the accelerated aging tests according to an Arrhenius protocol (see Chapter 2 section 4.1.2.1, p.76).
This protocol implies choosing a set of accelerated temperatures in close succession, that are close
enough to the aimed working temperature (here 500°C) so that they will provoke similar aging
phenomena following an Arrhenius law (e.g. oxidation and diffusion), but high enough so that they will
noticeably accelerate them. In addition, tests at even higher temperature of 800°C were also
attempted to further explore the coating thermal resistance in air. In all cases, heat treatments with
steps of 12 or 24h were applied to follow more precisely the evolution of the samples with aging. Their
optical properties were systematically measured after each aging step and material characterization
was carried out at intervals.
4.1. Optical properties
Figure 123 shows reflectance spectra measured after aging at the different accelerated temperatures
from 600 to 800°C. For clarity’s sake, only some of the aging durations were represented in Figure 123.
In all cases, the first step of aging (24h or 40h, in blue) is applied at 500°C, to act as a curing step.
Afterwards the accelerated temperature is applied instead. The total number of aging hours seen by
the coating takes this first curing step into account. Figure 124 shows the subsequent variations of
optical performance (solar absorptance, thermal emittance, heliothermal efficiency and performance
criterion at 500°C) for all applied aging durations.

148
Figure 123. Evolution of the reflectance spectra for the TiAlN absorber aged at different durations and temperatures
from 600°C to 800°C in air. The first step of aging (24h or 40h, in blue) is applied at 500°C in air (curing step).
As can be expected, higher variations of reflectance spectra are observed compared to aging tests at
450-500°C (Figure 117 p.139). Whatever the accelerated temperature, the first exposure (up to approx.
100h, light orange in Figure 123) of the samples to a higher temperature than the curing temperature
of 500°C (blue in Figure 123) causes a reflectance blue-shift in the IR range beneficial for thermal
emittance, as the higher reflectance in the NIR-IR range blocks a larger fraction of the blackbody
emission. Thus (500°C) decreases by 5 to 17 points, depending on temperature (Figure 124 b)).

149
Figure 124. Evolution of optical performance (solar absorptance S, thermal emittance and heliothermal efficiency at
500°C, performance criterion PC) with aging at accelerated temperatures in air for up to 450h
The same first evolutions are however detrimental to solar absorptance and heliothermal efficiency,
which decrease by up to 9 points (Figure 124 a), c)). Indeed, reflectance tends to increase in the solar
range with increasing aging temperature (Figure 123). The observed reflectance oscillations are typical
of changes in the coating chemical nature and its subsequent optical behavior, switching from
absorptive to semitransparent [194]. The presence of an absorption peak around 9.3 µm [321]
indicates that these changes in chemical nature may be due to some level of oxidation.
When increasing the aging duration at a given temperature, the frequency of the UV-Vis oscillations
increases, causing the spectra to shift towards higher wavelengths in the whole spectral range. This
behavior is typical of an increase in coating thickness [194]. As a consequence, after its first drop,
thermal emittance tends to increase again (Figure 124 b)). It reaches its initial value for aging tests up
to 690°C then stabilizes, and even strongly exceeds it (+0.18) when aged at 800°C. Meanwhile, solar
absorptance mostly stabilizes after its first drop, as the oscillations shift beyond the solar range, so
that overall the heliothermal efficiency tends to stabilize or slowly decrease when increasing the aging
duration, whatever the accelerated temperature.
When increasing the aging temperature, the amplitude of the reflectance oscillations increases, as
clearly visible in Figure 123 f) showing the reflectance spectra of the samples aged for similar durations
of approx. 200h at the different temperatures. Figure 125 shows the corresponding optical
performance: from 600°C to 690°C, similar decreases of solar absorptance (-0.08 to -0.05) and thermal
emittance (-0.09 to -0.06) are observed, while at 800°C there is a strong increase in thermal emittance
due to the reflectance red-shift. These results indicate a non-linear relationship between the aging
temperature and the deterioration of the absorber, yet they confirm a tendency to accelerate aging
when applying higher temperatures.
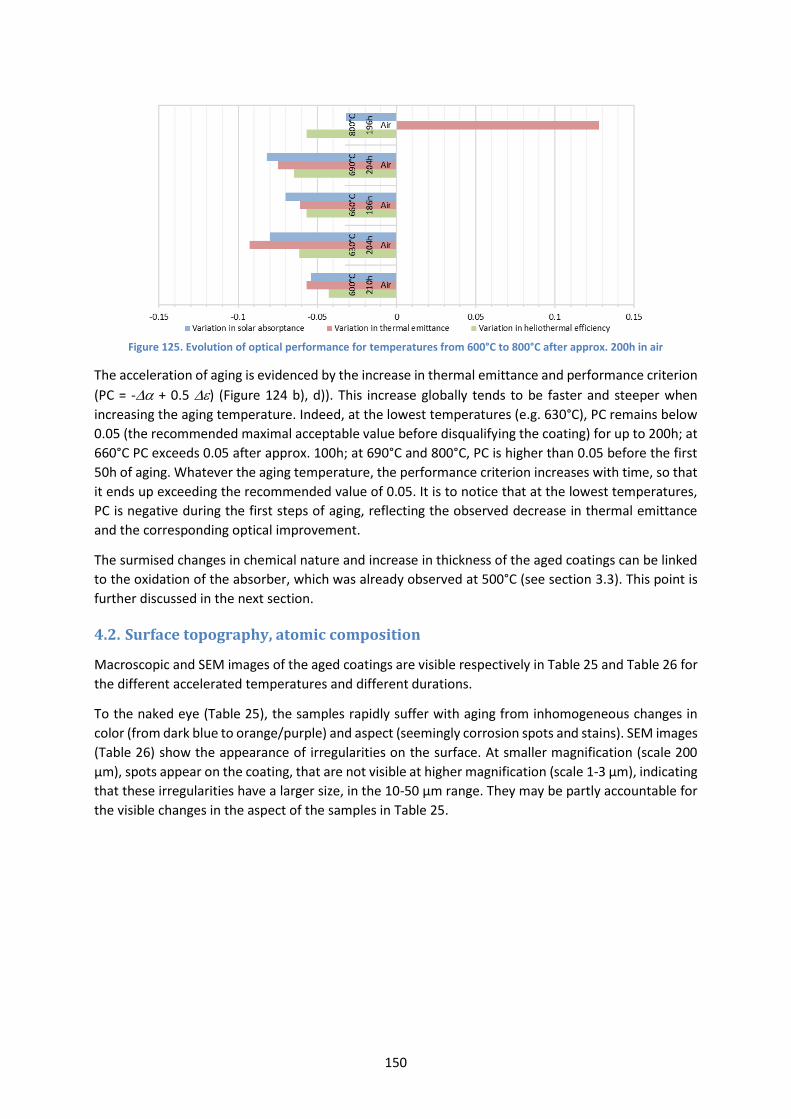
150
Figure 125. Evolution of optical performance for temperatures from 600°C to 800°C after approx. 200h in air
The acceleration of aging is evidenced by the increase in thermal emittance and performance criterion
(PC = - + 0.5 ) (Figure 124 b), d)). This increase globally tends to be faster and steeper when
increasing the aging temperature. Indeed, at the lowest temperatures (e.g. 630°C), PC remains below
0.05 (the recommended maximal acceptable value before disqualifying the coating) for up to 200h; at
660°C PC exceeds 0.05 after approx. 100h; at 690°C and 800°C, PC is higher than 0.05 before the first
50h of aging. Whatever the aging temperature, the performance criterion increases with time, so that
it ends up exceeding the recommended value of 0.05. It is to notice that at the lowest temperatures,
PC is negative during the first steps of aging, reflecting the observed decrease in thermal emittance
and the corresponding optical improvement.
The surmised changes in chemical nature and increase in thickness of the aged coatings can be linked
to the oxidation of the absorber, which was already observed at 500°C (see section 3.3). This point is
further discussed in the next section.
4.2. Surface topography, atomic composition
Macroscopic and SEM images of the aged coatings are visible respectively in Table 25 and Table 26 for
the different accelerated temperatures and different durations.
To the naked eye (Table 25), the samples rapidly suffer with aging from inhomogeneous changes in
color (from dark blue to orange/purple) and aspect (seemingly corrosion spots and stains). SEM images
(Table 26) show the appearance of irregularities on the surface. At smaller magnification (scale 200
µm), spots appear on the coating, that are not visible at higher magnification (scale 1-3 µm), indicating
that these irregularities have a larger size, in the 10-50 µm range. They may be partly accountable for
the visible changes in the aspect of the samples in Table 25.
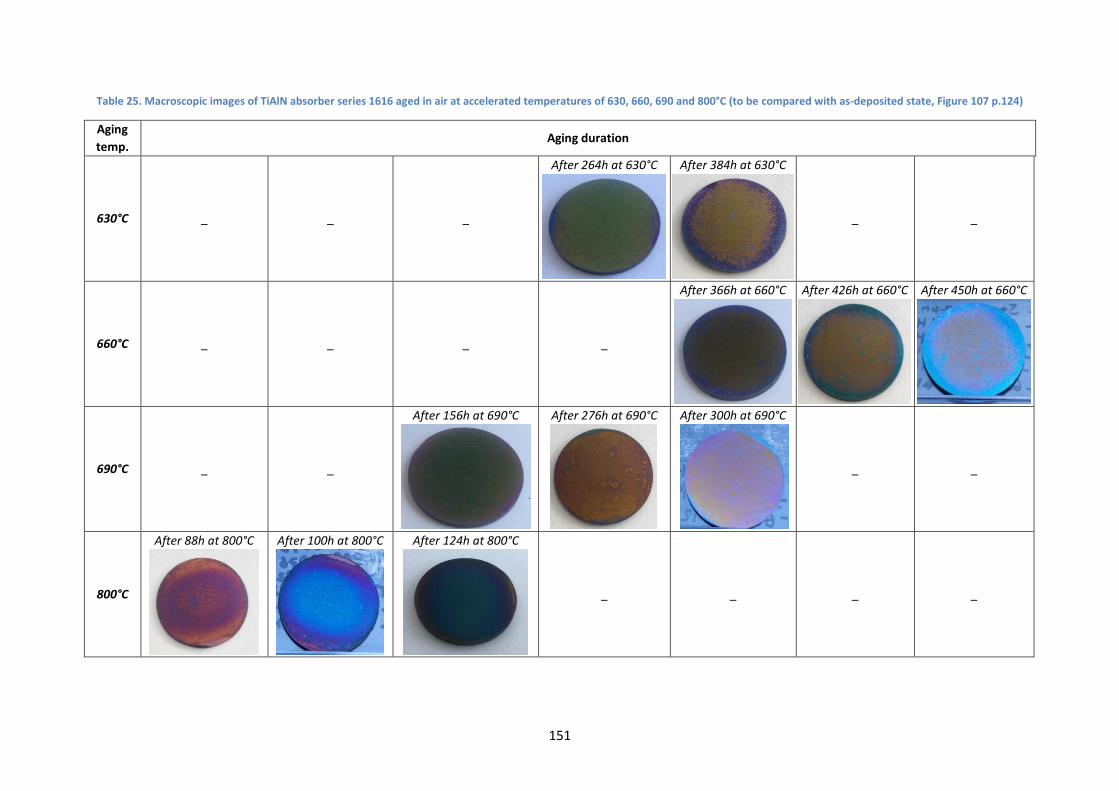
151
Table 25. Macroscopic images of TiAlN absorber series 1616 aged in air at accelerated temperatures of 630, 660, 690 and 800°C (to be compared with as-deposited state, Figure 107 p.124)
Aging
temp. Aging duration
630°C _ _ _
After 264h at 630°C
After 384h at 630°C
_ _
660°C _ _ _ _
After 366h at 660°C
After 426h at 660°C
After 450h at 660°C
690°C _ _
After 156h at 690°C
After 276h at 690°C
After 300h at 690°C
_ _
800°C
After 88h at 800°C
After 100h at 800°C
After 124h at 800°C
_ _ _ _

152
Table 26. SEM images of TiAlN absorber series 1616 aged in air at accelerated temperatures of 630, 660, 690 and 800°C (to be compared with as-deposited state, Figure 108 p.124)
Aging
temp. Aging duration
630°C _ _ _
After 288h at 630°C
After 360h at 630°C
After 400h at 630°C
660°C _ _ _
After 270h at 660°C
After 390h at 660°C
After 450h at 660°C
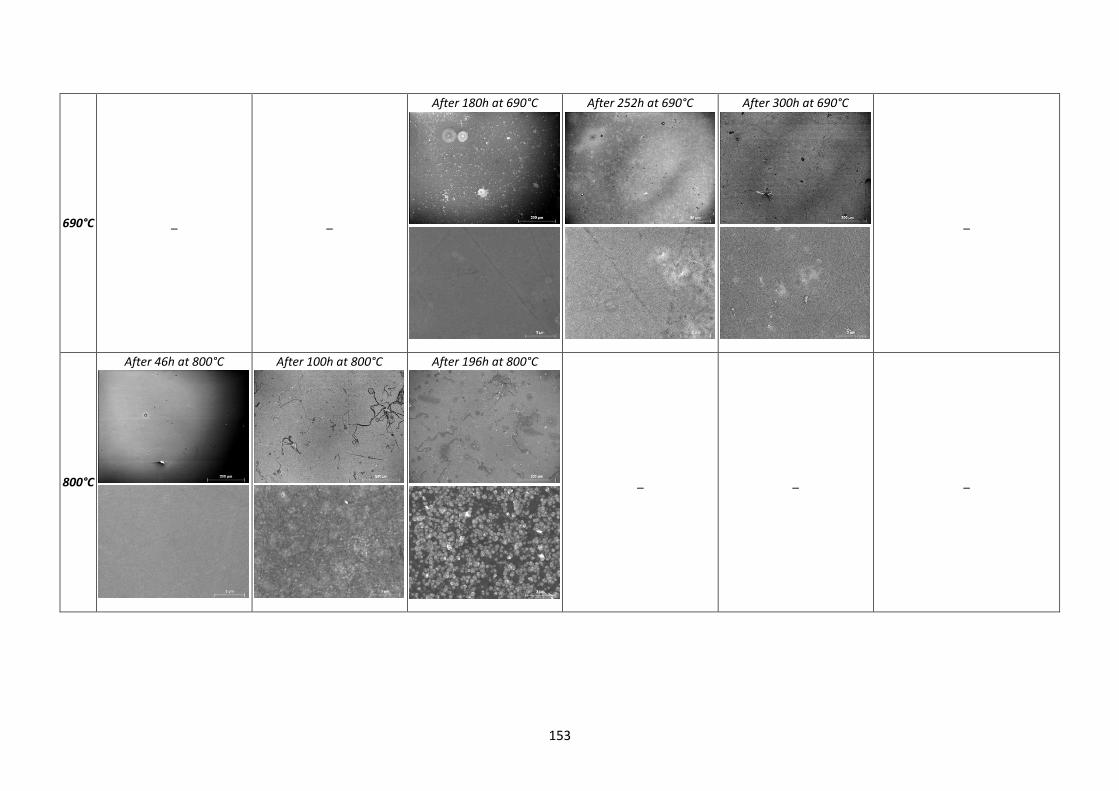
153
690°C _ _
After 180h at 690°C
After 252h at 690°C
After 300h at 690°C
_
800°C
After 46h at 800°C
After 100h at 800°C
After 196h at 800°C
_ _ _
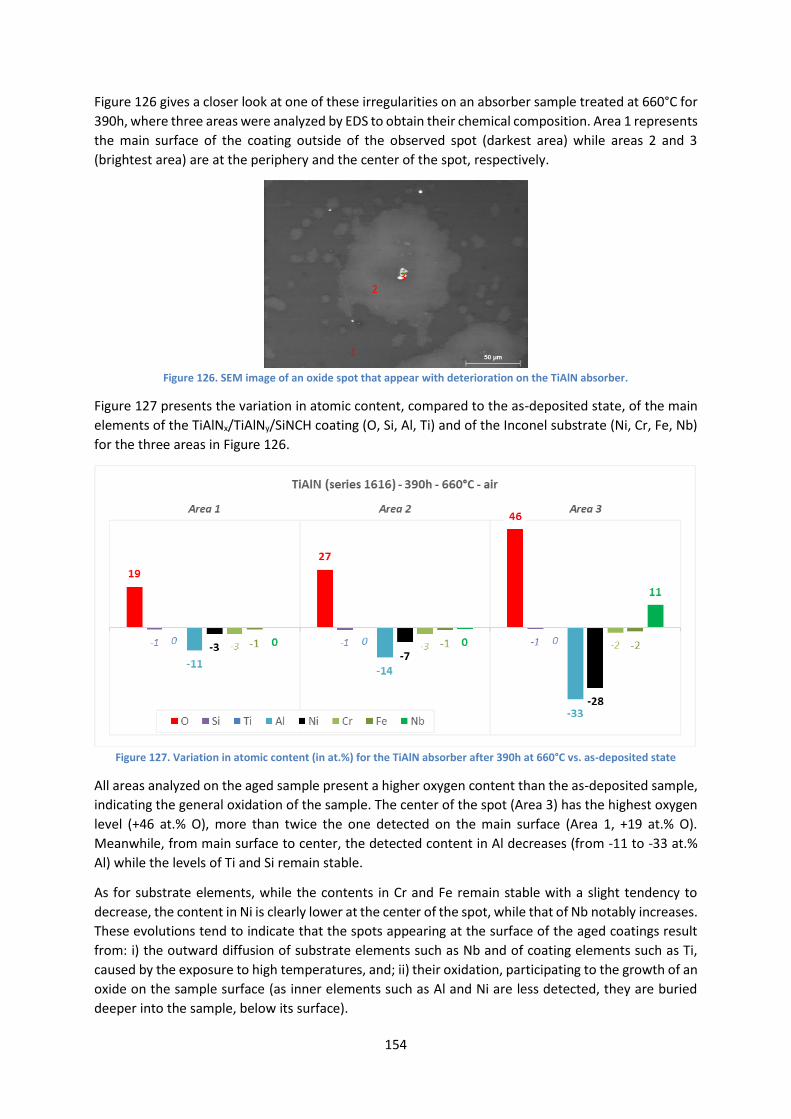
154
Figure 126 gives a closer look at one of these irregularities on an absorber sample treated at 660°C for
390h, where three areas were analyzed by EDS to obtain their chemical composition. Area 1 represents
the main surface of the coating outside of the observed spot (darkest area) while areas 2 and 3
(brightest area) are at the periphery and the center of the spot, respectively.
Figure 126. SEM image of an oxide spot that appear with deterioration on the TiAlN absorber.
Figure 127 presents the variation in atomic content, compared to the as-deposited state, of the main
elements of the TiAlNx/TiAlNy/SiNCH coating (O, Si, Al, Ti) and of the Inconel substrate (Ni, Cr, Fe, Nb)
for the three areas in Figure 126.
Figure 127. Variation in atomic content (in at.%) for the TiAlN absorber after 390h at 660°C vs. as-deposited state
All areas analyzed on the aged sample present a higher oxygen content than the as-deposited sample,
indicating the general oxidation of the sample. The center of the spot (Area 3) has the highest oxygen
level (+46 at.% O), more than twice the one detected on the main surface (Area 1, +19 at.% O).
Meanwhile, from main surface to center, the detected content in Al decreases (from -11 to -33 at.%
Al) while the levels of Ti and Si remain stable.
As for substrate elements, while the contents in Cr and Fe remain stable with a slight tendency to
decrease, the content in Ni is clearly lower at the center of the spot, while that of Nb notably increases.
These evolutions tend to indicate that the spots appearing at the surface of the aged coatings result
from: i) the outward diffusion of substrate elements such as Nb and of coating elements such as Ti,
caused by the exposure to high temperatures, and; ii) their oxidation, participating to the growth of an
oxide on the sample surface (as inner elements such as Al and Ni are less detected, they are buried
deeper into the sample, below its surface).
2 3
1

155
This hypothesis is supported by EDS analyses over larger areas of the samples showing a significant
increase of the oxygen content with increasing temperature and duration (Figure 128), faster than the
changes observed at 500°C (Figure 122 p.145). At these higher temperatures, the evolution of the
content in oxygen still follows a parabolic law (Eq.(34) p.146), typical of slow and steady oxidation.
Figure 128. Evolution of at.%O measured by EDS with aging duration at different temperatures
At 800°C the oxidation rather follows a linear tendency at first (< 100h) but then seems to also follow
a parabolic law after that, showing similar temperature- and time-dependent oxidation mechanisms
at this higher temperature. SEM images of the sample aged at 800°C (Table 26) show that the
morphological changes observed at lower temperatures seem to happen at a lower scale, with the
appearance of surface asperities at the 100-500 nm scale rather than the 10-50 µm scale, although
both seem to be caused by the same oxidation phenomena.
From the EDS results presented in Figure 128, an activation energy for the oxidation phenomena was
estimated. First, the parabolic law of oxidation (Eq.(34) p.146) was used to determine the oxidation
rate constants K(T) for all accelerated temperatures (600 to 800°C). For this purpose a least-squares
method [324] was applied (Eq.(35)): the ² value was minimized using Excel solver, with yi the
experimental at.% O measured by EDS, y the parabolic law (Eq. Eq.(34) p.146) depending on time (aging
duration xi) and K as the parameter to be fitted, 𝜎𝑖2 the normally distributed variance of yi (± 1 at.%)
and N the number of experimental points yi.
𝜒2(𝐾) = ∑[𝑦𝑖 − 𝑦(𝑥𝑖; 𝐾)]2
𝜎𝑖2
𝑁
𝑖=1
(35)
Since oxidation is a temperature-dependent mechanism, the rate constant K depends on temperature
and can be expressed using an Arrhenius law (Eq.(22) p.76). The fitted values of K(T) were thus plotted
in an Arrhenius plot vs. 1/T to determine by linear regression the activation energy Ea of the oxidation
phenomena (Figure 129). Ea is given by the slope of such a plot (-Ea/R with R the gas constant).

156
Figure 129. Arrhenius plot of oxidation rate constant K vs. temperature T
An activation energy of oxidation Ea ≈ 48 kJ/mol was obtained. This value is low compared to the ones
found in the literature for similar TiAlN coatings (e.g. 164 - 376 kJ/mol [325], 136 - 403 kJ/mol [326]).
This may confirm that the observed oxidation phenomena do not directly concern the TiAlN absorber
layers themselves, but the SiNCH top antireflective layer and/or elements diffusing from the substrate,
as previously mentioned. Also, this low activation energy of chemical oxidation is consistent with the
slow degradation and stabilization of the optical performance observed when applying accelerated
aging (Figure 124). This highlights again that physicochemical changes to the absorber coatings do not
necessarily lead to the degradation of their optical properties.
4.3. Lifetime prediction
While such slow and little damaging degradation processes ensure that an absorber coating may be
durable, they prevent the application of classical lifetime prediction methods, which are based on the
estimation of the activation energy of the optical degradation itself [128,151,327,328]. Indeed,
classical lifetime prediction is based on a similar Arrhenius approach as the one presented above,
considering the evolution of the optical properties instead of the oxygen content, and deducing an
activation energy for the overall degradation in optical performance, leading to the estimation of its
yearly decay rate and lifetime (see Chapter 2 section 4.1.2.1) [128,151,327,328]. Contrarily to the
above analysis on the oxidation rate, several phenomena may participate in the degradation of optical
performance. These phenomena may present different kinetics (rate constants), thus come into play
after different aging durations, they may compete or promote one another, etc. They even may not all
be thermally-induced phenomena following Arrhenius laws (e.g. formation of cracks). In such cases, it
is not possible to obtain a reliable lifetime prediction.
Such is the case for the studied TiAlN absorber. Indeed, the evolution of its optical performance (Figure
124) is not linearly decreasing with time: optical properties first go down then back up and/or stabilize,
highlighting that several phenomena occur at different stages of aging. Due to its low activation energy,
oxidation is probably one of the first acting phenomena. While this relative resistance to aging is a
good hint towards the coating durability, the determination of the activation energy for the optical
degradation of this absorber is not possible in this case, thus neither is the prediction of its lifetime.
Moreover, the time scale considered for the estimation of the activation energy influences the
determination of the activation energy for optical degradation. For instance Raccurt et al. [151]
consider several aging steps, reaching long durations up to 4000h at 450°C and up to 800h at 530°C. In
this case however, the time steps between the aging tests are much larger than in our case, 200h to
1000h vs. 24h here. Therefore, it is possible that transitory aging phenomena are detected in our case,
that may not have been visible when larger time steps are applied. The protocol applied here may be
more sensitive in this regard, more susceptible to fluctuations in optical performance, thus preventing
lifetime prediction, but more representative and insightful on the coating aging behavior.
157
4.4. Conclusions on long durations at accelerated temperatures in air
An accelerated aging protocol at temperatures in the 600-800°C range for durations up to 450h in air
was applied to samples of the TiAlN absorber, already stable at 500°C. The degradation of its optical
performance was not linear with time or temperature, indicating that several aging phenomena may
be competing, with different kinetics. The main aging phenomenon was oxidation, following a
parabolic law even at accelerated temperatures. A low activation energy was determined for oxidation.
This study is a perfect example that lifetime prediction is not necessarily attainable, depending on the
architecture and composition of the coating and on its main degradation mechanisms, which may be
complex, competing, present different kinetics, or be too slow to really allow for a notable acceleration
of aging.
Tests at accelerated temperatures may give valuable insight on the thermal stability of absorber
coatings and its limits at high temperature. However, such accelerated aging protocols can be heavy
to implement (requiring several equivalent samples to apply at least 3 aging temperatures for long
durations), and they cannot guarantee that the observed degradations are representative of
phenomena at lower temperatures, or that lifetime prediction will be possible for the tested absorber
coatings. Moreover, the lower the activation energy of the aging phenomena, the lower the
acceleration factor provided by accelerated aging tests [327] (see Chapter 2 section 4.1.2.1). Therefore
if the aging phenomena have low activation energies, the accelerated tests may require too long, or
the testing temperature to apply may be too high to cause similar degradation phenomena, compared
to the actual working conditions aimed for the absorber coating. Overall, a cost/benefit analysis is thus
to consider in the implementation of such accelerated thermal aging protocols.
5. Influence of other aging parameters
5.1. Influence of thermal cycling
Thermal cycling can be a significant source of degradation in real CSP working conditions (see Chapter
2 section 3.3.2.5, p.68). This section attempts to consider the impact of thermal cycling on two types
of absorbers.
In PROMES laboratory, two samples of the TiAlN absorber were treated at 500°C in air to reach similar
aging durations:
• a sample of series 1616 was exposed to slow thermal cycling, i.e., cumulatively aged from its
cured state (after 24h) up to 120h, by steps of 24h, following 4 heating-plateau-cooling cycles
with the temperature profile shown in Figure 90 (p.106).
• a sample of series 1830 was exposed to constant thermal aging, i.e., directly aged from its
cured state to 124h, in a single heating-plateau-cooling cycle, with the same heating and
cooling ramps as the cycled sample.
In a similar manner, two samples of the WAlSiN absorber coating were treated at CSIR-NAL Bangalore
laboratory by K. Niranjan [242], at 400°C in air from their as-deposited state:
• one was exposed to 4 heating-plateau-cooling cycles of 50h, to reach 200h of aging;
• the other was exposed to a single cycle to directly reach 200h of aging.

158
Optical properties
Figure 130 shows the variation of the reflectance spectra measured for both types of absorbers,
applying thermal cycling or constant aging (“no cycling”). Table 27 and Figure 131 show the
corresponding variations in optical performance for the TiAlN and WAlSiN absorbers, respectively.
Figure 130. Comparison of the change in reflectance spectrum between cyclic and constant (“no cycling”) thermal aging
for the two types of absorbers
Table 27. Comparison of optical performance evolution with and without thermal cycling
Absorber State Solar
absorptance
Thermal emittance
@ 500°C
Heliothermal efficiency
@ 500°C PC
TiAlN
Series 1830
No cycling
After 24h (cured) 0.906 0.243 0.857
0.092 After 124h 0.865 0.346 0.797
Variation -0.041 +0.103 -0.060
TiAlN
Series 1616
Cycling
After 24h (cured) 0.922 0.298 0.863
0.058 After 120h 0.844 0.258 0.793
Variation -0.078 -0.040 -0.070
Figure 131. Variation of the optical properties for cycling and non-cycling aging treatments for the WAlSiN absorber
Concerning the TiAlN absorber (Figure 130 left, Table 27), due to a shortage of samples it was not
possible to apply these tests on samples of the same series. Series 1830 was received already cured at
HEF-IREIS, while series 1616 was cured at PROMES laboratory. Therefore, the reflectance of the two
considered samples is different even just after the curing step (24h). It is thus difficult to directly
compare their reflectance spectra. Comparing the cured and aged state for each sample, strong
oscillations appear after aging in both cases, typical of the changes in composition and thickness
159
brought on by the oxidation of the coating, as previously discussed. Consequently, reflectance
increases in the solar range and shifts towards the IR range.
It seems that the sample treated without cycling (in blue) suffers from a higher variation of reflectance
and a larger red-shift, notably increasing its thermal emittance (+0.10), compared to the cycled sample
which contrarily presents a drop in emittance (-0.04). Consequently, the performance criterion PC is
higher for the sample without cycling (0.09 vs. 0.06), indicating a higher degradation. Reflectance in
the solar range is however less affected for the sample without cycling, leading to lower decreases in
solar absorptance (-0.04 without vs. -0.08 with cycling) and heliothermal efficiency (-0.06 without vs.
-0.07 with cycling) than for the cycled sample.
Concerning the WAlSiN absorber (Figure 130 right, Figure 131), only a small variation of the reflectance
spectrum is observed between the cycled and non-cycled samples. Thermal emittance seems to be the
most affected, with a larger drop for the cycled sample (-0.06 vs. 0.04). The same goes for solar
absorptance to a lesser extent, so that there is no notable change in heliothermal efficiency.
Discussion and preliminary conclusions on thermal cycling
Overall, this study does not show a clear evidence of the impact of slow thermal cycling during aging
treatments. On one hand, the considered TiAlN samples may present some initial differences: slightly
different architectures (series 1616 has two additional sublayers), different curing facility; so they were
hard to compare directly. It is possible that the repeated slow cycles allow the coating to accommodate
better to aging, in terms of chemical composition and layer densification, compared to a direct
exposure to longer durations. This would explain why a larger degradation is observed without cycling.
This could however just be due to the fact that series 1616 is more stable than series 1830 due to its
sublayers. On the other hand, the changes observed for the WAlSiN absorber remain very small and
may only be due to the method for calculating the optical properties, as previously discussed. In fact,
direct measurements of solar absorptance and thermal emittance at CSIR-NAL did not evidence any
optical performance changes [242]. Therefore, to conclude on the impact of thermal cycling, a higher
number of cycles would need to be applied on truly equivalent samples.
In any case, the tests proposed here, however inconclusive, amounted to applying thermal cycling with
a period close to 24h, thus approximating day/night cycles in real CSP working conditions. Thus this
type of cyclic test should always be preferred to applying constant thermal loads for long durations.
Although highly relevant to the topic, the question of the impact of slow thermal cycling when applying
long duration thermal aging tests is too rarely considered in the literature on absorber coatings. This
section is thus meant to alert on the importance of conducting thermal cycling tests to predict the
performance of absorber coatings, as it can infer damaging thermal stresses produced by the repeated
temperature gradients through the coatings.
5.2. Influence of atmosphere during thermal aging
At CSIR-NAL laboratory, equivalent samples of the WAlSiN absorber were aged at 500°C, in vacuum for
up to 200h and in air for up to 100h [242]. To study the influence of the atmosphere seen by the
absorber coatings during aging, a “vacuum vs. air” comparison of the variations in reflectance (Figure
132) and optical performance (Figure 133) is attempted here. This comparison may allow us to
decorrelate the influence of high temperature alone from that of the presence of oxygen during
thermal aging. Ambient oxygen is indeed suspected to be the main cause for the absorber thermally-
induced oxidation, and often its subsequent optical degradation.

160
Figure 132. Variation in spectral reflectance of WAlSiN absorber with aging at 500°C in vacuum (left) and air (right) for
different durations (25-100h)
Figure 133. Variation in optical performance of WAlSiN absorber with aging at 500°C in air and vacuum for different
durations (25-100h). N.B. First number is aging temperature in °C and second number is aging duration in h.
When heat-treating the absorber sample in vacuum, only a minor evolution in the IR reflectance can
be observed, causing thermal emittance to slightly decrease (-0.01). Meanwhile, in air the evolution in
reflectance is more visible, with a small decrease in reflectance both in the UV-Vis and IR regions. Solar
absorptance (and consequently heliothermal efficiency) is barely affected by these evolutions in
reflectance as they occur outside of the maximum solar irradiance range (450-700 nm), but they cause
thermal emittance to increase (+0.02-0.03).
In this example, the influence of the presence of air during thermal aging is visible but not remarkable,
indicating that oxygen does not play a major role in the absorber optical evolution in the considered
test conditions. However, since the WAlSiN absorber showed more notable changes when aged at
450°C in air for up to 200h (Figure 117 d) and Figure 118 p.139), it is possible that the differences
between vacuum and air tests would be more visible after a longer aging duration. The experiments
considered here were not initially designed for the specific purpose of directly comparing the influence
of air vs. vacuum, hence tests in air were applied up to a temperature of 500°C and for up to 100h,
while tests in vacuum started at 500°C and reached up to 700°C. To complete this study, it would be
interesting to carry out aging tests in both vacuum and air at several identical temperatures and longer
durations.

161
In addition the spectral reflectance (Figure 134) and optical performance (Figure 135) of WAlSiN
absorber coatings was also compared after aging in air at 400°C and in vacuum at 700°C for up to 200h.
Great similarities are observed for the two cases: reflectance slightly varies in the UV-Vis range,
resulting in a small drop in solar absorptance (-0.01 at 400°C in air vs. -0.02 at 700°C in vacuum);
reflectance is more notably blue-shifted in the IR range, causing a larger drop in thermal emittance (-
0.06 at 400°C in air vs. -0.04/-0.07 at 700°C in vacuum).
Figure 134. Variations in spectral reflectance of WAlSiN absorber aged at 400°C in air (left) and 700°C in vacuum (right)
for up to 200h
Figure 135. Variations in optical performance of WAlSiN absorber aged at 400°C in air and 700°C in vacuum for up to 200h
This equivalent degradation illustrates that thermally-induced phenomena other than oxidation in the
presence of ambient air, e.g. coating densification or atomic diffusion, can result in similar optical
degradations. Since they appear at higher temperature (700°C in vacuum vs. 400°C in air), their
activation energies are lower than that of oxidation. The presence of ambient air during thermal aging,
and the resulting thermally-induced oxidation, thus acts as an acceleration factor for optical
degradation. As a consequence, the thermal stability in vacuum is often far higher than in atmospheric
conditions, and the critical temperature greatly increases in vacuum. This is why in some CSP
technologies such as parabolic troughs, the receiver is evacuated (i.e., the absorber surface works in
vacuum instead of air) in order to protect the absorber from oxidation during its lifetime, especially at
high temperatures.

162
In any case, the comparison of vacuum vs. air thermal aging tests, i.e., with and without ambient
oxygen, gives valuable insight on the materials aging mechanisms and should be studied by coating
developers whenever possible.
Potentially, other elements in the aging (and working) atmosphere can also act as accelerants for the
optical degradation of the coating, e.g. water vapor, pollutants, salt sprays, etc. (see Chapter 2). Such
experimental work went beyond the scope of this thesis. Preliminary studies were only started
regarding the influence of water vapor (thermal aging in ambient air vs. air filtered from H2O and CO2).
6. Conclusions on purely thermal aging protocols
Overall, the experimental studies on purely thermal aging presented in this chapter led to the following
conclusions and recommendations for coating developers.
Firstly, before studying the aging behavior of a type of absorber coating, the necessary first step is to
verify the equivalence between the considered samples that will be used in aging protocols. This serves
not only to provide an enhanced comparability between the different aging studies, but also to check
the repeatability of the coating manufacturing process, especially when working with R&D deposition
machines. In any case, the variation in optical performance with aging should always be considered
relatively to the as-deposited state of a given sample (e.g. S = S (aged) – S (as-deposited)).
The second step is to apply short duration thermal aging (typically up to 24h) after fabrication to
quickly assess the thermal stability of the investigated absorber, at different temperatures around or
above the aimed working temperature, and in a relevant atmosphere (ambient air, vacuum, etc.), both
depending on the intended CSP technology. This type of test gives valuable indications of the aging
behavior of the absorber, such as its critical temperature (highest temperature sustainable by the
coating without notable degradation), that help define further aging tests. As their duration is short,
these tests often have limited impact and can either slightly improve or degrade the absorber. When
an improvement is observed, it can be due to a densification of the constitutive layers of the coating
and/or, if the aging is applied in air, to the formation of oxides. Both may tune the coating optical
properties to provide a better accommodation of the incident solar light. In this case, short duration
tests amount to curing and can be considered as the final step of the manufacturing process, typically
with a duration up to 24h to ensure a stabilization of the coating microstructure.
Valuable as they may be, short duration tests alone are not sufficient to conclude on the durability of
the absorber coating. It is thus important to check if the coating observed behavior remains constant
with time, especially at its working temperature.
The third step is to apply longer duration thermal aging around the aimed working temperature.
• Preferably, short steps of 12 to 24h should be applied cumulatively on the same samples, to
better follow the evolution of the coating optical performance, and because such cumulative
aging amounts to thermal cycling with low period and reduced heating/cooling ramps, close
to the day/night cycles in CSP applications. In fact, constant heat treatments for long durations
may give rise to different aging behaviors, at the risk of not being representative of real
working conditions. It is even possible that slow thermal cycling gives occasion to the materials
accommodate and stabilize their microstructure between cycles (possibly during the natural
cooling phases) and become more resistant to further aging.

163
• Total aging durations should reach at least several hundreds of hours. Indeed, different aging
phenomena with different kinetics may be at play, resulting in different stages of aging. For
instance when aging in air, oxidation may be the first and main aging phenomenon in the first
steps of aging. Then oxygen incorporation slows down due to the formation of a stable oxide
(following a classical parabolic law of oxidation with √𝑡). As a consequence, the optical
performance is most changed during the first hours of aging, sometimes positively, then tends
to stabilize. Later on, typically above 100h of aging, other phenomena may appear, such as
surface defects generated by the slow outward atomic diffusion and surface oxidation of
elements (usually metals) from the substrate or from underlayers of the absorber coating. Due
to their size in the micrometric range, these defects particularly affect thermal emittance,
increasing the absorption/emission of radiation in the IR region and degrading the selectivity.
• Considering the aging phenomena involved, comparing the effect of different aging
atmospheres can be of interest. For instance, vacuum vs. air tests allow comparing the effect
of temperature with or without the presence of ambient oxygen, and thus decorrelate
concomitant aging phenomena such as oxidation and atomic diffusion. Such tests reveal that
ambient oxygen is clearly the strongest degradation source at high temperature, as the coating
critical temperature tends to sharply increase when applying aging under vacuum (e.g. 400°C
in air vs. 700°C in vacuum for the WAlSiN absorber).
In any case, this specific study emphasizes the importance of applying long duration aging tests of at
least several hundreds of hours at working temperature in order to draw more pertinent conclusions
on the long-term thermal stability of absorber coatings.
The expected lifetime of absorber coatings and the solar receivers they cover is typically 25 years (i.e.,
73,000h for 8h/day operation). Therefore, to really evaluate their durability in working conditions,
aging tests of the absorber coatings at working temperature should ideally be continued for thousands
and thousands of hours. To save time and resources, and avoid testing for very long durations, another
possibility is to apply long duration aging at accelerated temperatures higher than the aimed working
temperature. This type of aging protocol allows accelerating the thermally-induced aging phenomena
(following Arrhenius laws) without denaturing them, provided the accelerated temperature is not too
high, typically no more than 200-300°C higher than the working temperature. Our experimental results
validated that higher and faster evolutions of the coatings optical performance and microstructure
can occur at accelerated temperatures, following at least some of the same aging phenomena as
observed at working temperature (e.g. the formation of stable oxide(s)).
Applying aging at several close accelerated temperatures also allows determining the activation
energy of degradation phenomena. Such activation energy can sometimes be used to predict the
lifetime of the coating, based on the estimation of an acceleration factor. The higher the activation
energy, the higher the rate constant for the degradation reactions (e.g. oxidation, atomic diffusion),
the quicker the aging phenomenon and the more it is accelerated by applying higher temperatures.
Therefore it can happen, as observed for the TiAlN absorber, that the activation energy of the
degradation phenomenon is so low (e.g. 48 kJ/mol) that a significant acceleration of aging is not
attainable using accelerated aging protocols. In such case, it is still necessary to apply very long
durations (e.g. > 1000h) to be able to establish the lifetime and durability of the absorber coating,
demonstrating the limitations of such accelerated aging protocols.

164
All these aging protocols are found in the literature, although most authors only apply some of them,
usually short duration thermal aging at different temperatures, during the development stage of their
coatings. Thermal aging tests give access to valuable insight on the behavior of absorber coatings with
time, temperature, atmosphere, etc. However, they are based on purely thermal heating via IR
radiation from an electrical furnace, for practical reasons, as the latter can guarantee long-term,
stable, controlled and repeatable aging tests.
Meanwhile, in real CSP applications, aging conditions are quite different. The energy that can provoke
thermally-induced phenomena is provided by concentrated solar radiation instead of IR radiation, with
more energetic photons including UV, and much steeper heating ramps. The receiver is heated on the
front (coated) side of the solar receivers, and partly extracted on their rear side by the flow of the heat
transfer fluid to be heated, creating large thermal gradients and steeper cooling ramps. Steeper
heating/cooling ramps amount to rapid thermal cycling with high amplitude and short period. In order
to attempt more representative aging tests and draw a comparison with more classical thermal aging,
the next chapter will therefore focus on original aging protocols, closer to the CSP applications, using
a unique concentrated solar aging facility developed at PROMES-CNRS laboratory.
165
Chapter 5 - Implementation and critical
analysis of solar aging protocols

166

167
Applying thermal aging alone is not enough for a complete analysis of the aging behavior of the
absorber related to its application in CSP technologies, especially considering the absence of
concentrated solar radiation during the aging treatment, compared to real CSP conditions. Therefore,
after the study of the thermal behavior of the absorber in Chapter 4, this chapter will study how the
absorbers behave under concentrated solar radiation. Since the latter is also indissociably a heating
source for the materials, this type of aging is considered as “solar + thermal” aging, to be compared to
purely thermal aging discussed in Chapter 4.
For this purpose, the Solar Accelerated Aging Facility (SAAF) described in Chapter 3 will be used to
apply aging on some of the previously considered absorber coatings. First, some limitations and
necessary adaptations of the facility for the present study will be presented. In addition to the
exposure to concentrated solar radiation, the SAAF also allows applying thermal shocks and rapid
thermal cycling, simulating representative CSP receiver conditions. The impact of all these sources of
degradation will be studied in this chapter. Based on the results, the necessity of including solar aging
in the global aging strategies of absorber coatings, in addition to purely thermal aging, will be
discussed.
1. Adaptation of the solar aging facility (SAAF)
The principle of the SAAF facility is detailed in Chapter 3 (section 3.2.2 p.107). This facility was designed
and developed in previous work [36,267,268,317,329]. It was further adapted during this thesis to
provide a better performance when testing new types of solar selective absorber coatings. The main
technical limitations related to our cases of study were identified and solutions were proposed to these
limitations, as presented in the following.
1.1. Constraints due to the dimensions of available samples
The samples provided by the different manufacturers presented various shapes, sizes and thicknesses
(see Chapter 4 section 1 p.119), that were not all adapted to our existing aging and measurement
facilities. These constraints were addressed as explained below.
Compatibility between samples and supports
As mentioned in Chapter 3, different supports to maintain the samples during the solar aging tests
were developed in previous work, depending on the shape and dimensions of the samples to be
treated at the time (see Table 10 p.111).
Supports 2 and 3 were designed to provide backside air cooling of the sample, to better control and
stabilize its temperature during solar exposure. However, for these supports there are specific size
requirements: the tested samples must have a square shape, with dimensions of 30 x 30 mm² for
support 2 and 50 x 50 mm² for support 3. As airtightness must be guaranteed, the performance of the
backside air cooling system is sensitive to small variations in sample shape, especially for support 3
where the sample must be inserted in the holder cavity. Therefore support 3 could only be used in the
case of WAlSiN samples with dimensions 30 x 30 x 2-3 mm3 [330]. In a similar manner, support 2 could
only be used for TiAlN absorber samples with dimensions 50 x 50 x 1 mm3 (stainless steel substrates).
However, the low thickness of these samples was problematic as they suffered bending when exposed
to solar irradiance, due to high thermomechanical stress between the irradiated area and the non-
irradiated area (see section 2.1.1 p.172). From our observations, a minimum thickness of 2 mm is thus
required to avoid sample deformation and ensure a precise study of the aging of absorber coatings.
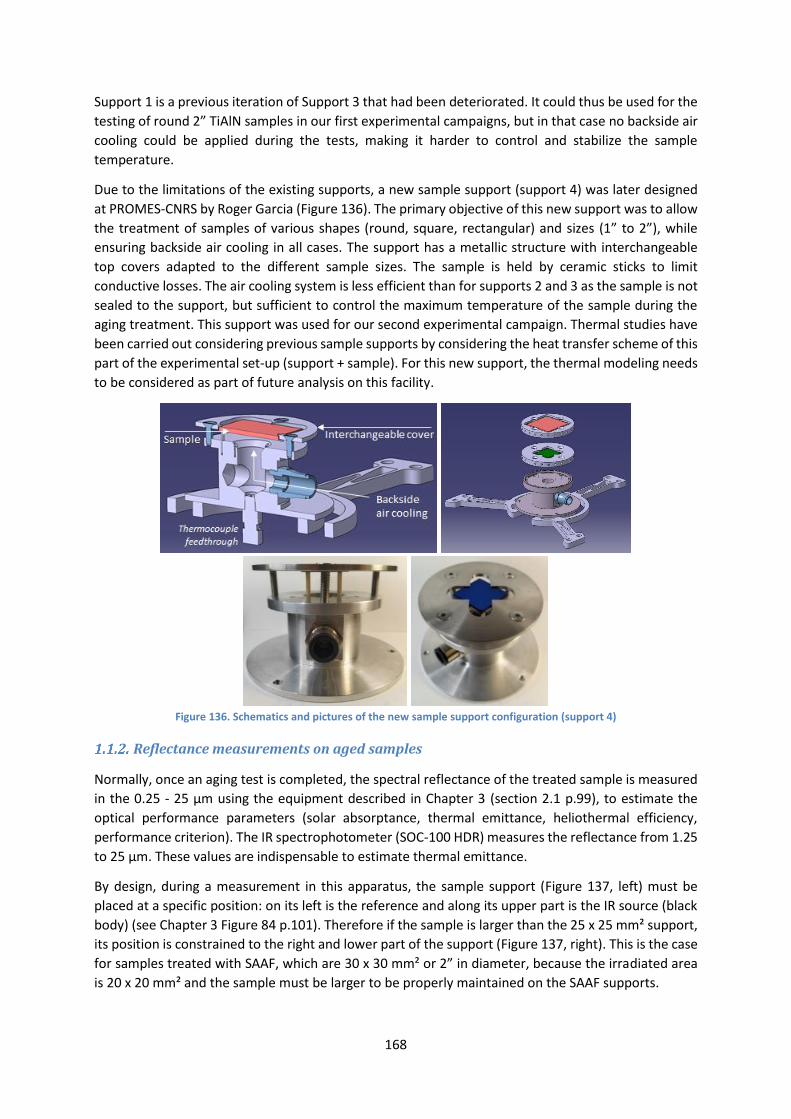
168
Support 1 is a previous iteration of Support 3 that had been deteriorated. It could thus be used for the
testing of round 2” TiAlN samples in our first experimental campaigns, but in that case no backside air
cooling could be applied during the tests, making it harder to control and stabilize the sample
temperature.
Due to the limitations of the existing supports, a new sample support (support 4) was later designed
at PROMES-CNRS by Roger Garcia (Figure 136). The primary objective of this new support was to allow
the treatment of samples of various shapes (round, square, rectangular) and sizes (1” to 2”), while
ensuring backside air cooling in all cases. The support has a metallic structure with interchangeable
top covers adapted to the different sample sizes. The sample is held by ceramic sticks to limit
conductive losses. The air cooling system is less efficient than for supports 2 and 3 as the sample is not
sealed to the support, but sufficient to control the maximum temperature of the sample during the
aging treatment. This support was used for our second experimental campaign. Thermal studies have
been carried out considering previous sample supports by considering the heat transfer scheme of this
part of the experimental set-up (support + sample). For this new support, the thermal modeling needs
to be considered as part of future analysis on this facility.
Figure 136. Schematics and pictures of the new sample support configuration (support 4)
Reflectance measurements on aged samples
Normally, once an aging test is completed, the spectral reflectance of the treated sample is measured
in the 0.25 - 25 µm using the equipment described in Chapter 3 (section 2.1 p.99), to estimate the
optical performance parameters (solar absorptance, thermal emittance, heliothermal efficiency,
performance criterion). The IR spectrophotometer (SOC-100 HDR) measures the reflectance from 1.25
to 25 μm. These values are indispensable to estimate thermal emittance.
By design, during a measurement in this apparatus, the sample support (Figure 137, left) must be
placed at a specific position: on its left is the reference and along its upper part is the IR source (black
body) (see Chapter 3 Figure 84 p.101). Therefore if the sample is larger than the 25 x 25 mm² support,
its position is constrained to the right and lower part of the support (Figure 137, right). This is the case
for samples treated with SAAF, which are 30 x 30 mm² or 2” in diameter, because the irradiated area
is 20 x 20 mm² and the sample must be larger to be properly maintained on the SAAF supports.

169
Contrarily, to be able to measure the IR reflectance in the central area of the sample, the dimensions
of the latter should not exceed 30 mm in diameter (Figure 137, right). Therefore for SAAF-treated
samples, the IR reflectance can only be measured on the side of the sample, which is outside of the
irradiated central area in most cases (yellow square in Figure 137, right).
Figure 137. Left: sample support of the SOC-100 HDR IR spectrophotometer. Right: Measured area (red) depending on the diameter (O.D.) of the sample (blue) and its constrained position of the sample support (black). The yellow square
represents the irradiated area in the SAAF.
As a preliminary test, reflectance measurements were performed on a solar-aged 2” sample (50.8 mm
in diameter), as shown in Figure 138. In area 1 (side), both UV-Vis-NIR and IR reflectance were
measured, whereas in area 2 (SAAF-irradiated area) only the UV-Vis-NIR reflectance could be
measured because of the abovementioned size constraints in the IR spectrophotometer. No changes
in reflectance were observed in area 1 compared to its initial state, whereas in area 2 reflectance was
clearly modified by solar aging.
Figure 138. Picture and schematics of a 2” sample irradiated with SAAF in area 2. The red spot is area 1 is the one
measured with the IR spectrophotometer.
Therefore, due to these constraints, in most cases the spectral reflectance of the SAAF-treated samples
was only measured in the irradiated area using the UV-Vis-NIR spectrophotometer, from 0.25 to 2.5
µm. Solar absorptance can still be calculated in this shortened range, as is often done by coating
developers because only one spectrophotometer is needed, although the solar absorptance value
calculated in such shortened range is less precise than when considering the whole solar range of 0.28
– 4 µm. Moreover, by design, selective absorber coatings present high reflectance (low absorption) in
the NIR-IR range above 1.5 – 2 µm. Thus the value of solar absorptance calculated from reflectance in
the 0.25 – 2.5 µm range tends to be overestimated by up to 2 points compared to the solar absorptance
calculated in the whole solar range. For this reason, values of solar absorptance presented in this
section are not to be directly compared with values presented in the previous chapters, which were
calculated using the whole solar range. These overestimated values of solar absorptance are
nevertheless useful to study the relative evolution of the aged area at the different stages of aging.
Another solution consists in cutting the sample to be able to measure IR reflectance in the aged area,
as shown in Figure 139. However since this is a destructive method, it could only be applied after the
last aging step, thus preventing further testing. Thus this solution was only applied to a few samples.

170
Figure 139. Example of a 2” sample cut for the measurement of reflectance on the aged area
1.2. Temperature measurements on the sample during solar aging
One of the main parameters to follow during the application of aging tests is the temperature of the
sample surface. As mentioned in Chapter 3 (section 3.2.2.1.5 p.112), this measurement is done by a
pyrometer maintained above the sample, aiming at its surface through the kaleidoscope. With this
technique, temperature measurements depend on the surface emittance. Due to the low testing
temperatures (T ≤ 500°C) and low emittance of our samples ((500°C) < 0.3) the luminance emitted by
our samples is low, so that the signal-to-noise ratio received by the pyrometer from our samples during
their irradiation is low. Therefore, pyrometry measurements were not always possible or reliable.
To ensure the measurement of the sample temperature during the aging treatments, the samples or
supports were additionally instrumented using K-type thermocouples (TC). Depending on the sample
support (see Table 10 p.111) and especially the use of backside air cooling, the temperature of the
sample was followed by thermocouples (Figure 140):
• welded on the back center (or back and side) of the sample for support 1 (no backside cooling);
• welded on the front side of the sample for supports 2 and 3 (backside air cooling);
• in contact with the back center of the sample for support 4 (part of the support design).
Figure 140. Schematics of sample temperature measurements with SAAF for sample support 1 (left) and 4 (right)
The thermocouples are connected to a Graphtec data logger to record temperature profiles during the
experiments. This measurement method can lack reproducibility since there can be fluctuations in the
thermocouple positioning, as the thermocouple must be rewelded before every experiment. However,
it was used as a complement to pyrometry measurements, especially since the latter do not provide
temperature measurement below 250°C.
Typical temperature profiles measured by the pyrometer and the thermocouples can be seen in Figure
141 for supports 1 and 4. For both cases, the back center thermocouple measurement (blue) is
consistent with that of the pyrometer on the surface center (red), and is thus considered
representative of the sample surface temperature. Measurements on the side of the sample (back or
surface) only give a qualitative profile of the temperature variations, as they underestimate the sample
temperature by several hundreds of °C. The same goes for the thermocouple touching the center

171
backside of the sample in support 4 (orange), except that in this case its positioning is more repeatable
and a mathematical correlation could be found with the temperature measured by the pyrometer on
the sample center front side (Figure 142). In some cases, this correlation could be used for the
prediction of the real temperature profile when the pyrometry measurements were not available.
Figure 141. Typical SAAF temperature profiles using support 1 (left) and support 4 (right)
Figure 142. Correlation between temperatures measured by the pyrometer (center, front) and by the thermocouple
touching (center, back) of the sample in support 4
2. Comparisons between purely thermal aging and solar aging
A first comparison of the impact of purely thermal aging (Chapter 4) vs. solar aging is attempted in this
section, based on the comparison of aging results obtained with ALTHAIA and SAAF facilities. While
temperature levels reached by the samples can be close in both types of aging, as explained in the next
subsection, their main difference resides in the application of a concentrated solar irradiance on the
surface of the sample.
This concentrated solar irradiation can be:
• constant, i.e., at a fixed irradiance (e.g. fixed position of the shutters in SAAF);
• cyclic, i.e., with cycles of high and low irradiance (e.g. two alternating positions of the shutters
in SAAF). This amounts to rapid thermal cycling with periods ranging from seconds to minutes,
thanks to the high heating/cooling rates.
To isolate as best as possible the additional effect of this irradiation during aging, as a first step the
effects of purely thermal aging (ALTHAIA, configuration 1, see Table 11 p.114) and constant solar aging
(SAAF, configuration 2) are compared, as defined in the following.

172
2.1. Main differences between purely thermal aging and solar aging
Temperature profiles
2.1.1.1. Heating and cooling rates
Electrical furnaces such as ALTHAIA are very convenient to apply long-term aging maintaining a very
stable temperature profile during the aging treatment. The heating ramps and temperatures of the
plateau are easily controlled to the desired values thanks to PID regulation. However, due to their high
thermal inertia (as they are made of ceramics), their maximum heating rates are low (e.g. 21°C/min
with ALTHAIA, Figure 89 p.105) compared to real CSP conditions, where the sudden exposure to
concentrated solar irradiance can lead to high heating ramps for the materials. The only way to obtain
a higher heating rate is by introducing the sample directly into the already hot furnace, so the heating
rate can reach higher levels (e.g. 73°C/min with ALTHAIA, Figure 89 p.105).
The cooling rate is also determined by the furnace inertia, following a decreasing exponential profile
(see Figure 100 p.113). Removing the sample directly from the hot furnace could provide higher cooling
rates but it is highly impractical and unsafe. Such heating and cooling rates may be closer to real CSP
operating conditions, but this mode of operation can be detrimental to the furnace itself and to the
operators. Due to these constraints, the temperature profiles accessible with an electrical furnace can
only amount to slow thermal cycling with periods in the range of several hours.
Conversely, solar furnaces such as the SAAF inherently provide more representative CSP conditions,
with much higher heating and cooling rates (e.g. ±20°C/s with SAAF, Figure 100 p.113), even when a
backside cooling is applied, embodying the heat extraction from the heat transfer fluid in real CSP
conditions.
2.1.1.2. Heating duration
Purely thermal aging in electrical furnaces can easily be applied for the desired duration, including very
long durations, in a single cycle. Contrarily, due to the intermittence of the solar resource, solar aging
tests must be applied cumulatively in different treatments of a few hours at a time, amounting to some
level of slow thermal cycling. For this reason, solar aging procedures in solar furnaces under real solar
irradiance rarely exceed 100h in total (e.g. between 10 and 20h with SAAF). Long-term “real” solar
aging is not possible, which is one of the main drawbacks of this type of aging. This is one of the main
reasons why high flux solar simulators have been developed for aging purposes (see Chapter 2 section
4.2.2.2 p.86) to expose the materials for long durations without depending on weather conditions.
2.1.1.3. Temperature fluctuations, effective temperature
During purely thermal aging in electrical furnaces, temperature is well controlled and maintained to
the desired level thanks to PID regulation. Due to the natural fluctuations in DNI during the day, in
“real” solar aging there can be non-negligible variations in the temperature levels suffered by the solar-
aged sample during one of the short aging treatments and/or between these treatments, in the range
of ±50-150°C. This is particularly the case if no backside cooling can be applied to the sample during its
solar exposure.
Therefore, it is important to monitor the temperature levels suffered by the sample during its
consecutive solar aging treatments. For instance, the maximum temperature reached during a test is
very relevant to the analysis of the aging behavior of the exposed material. The duration for which the
material is subjected to this temperature is also an important factor. Indeed, reaching a high
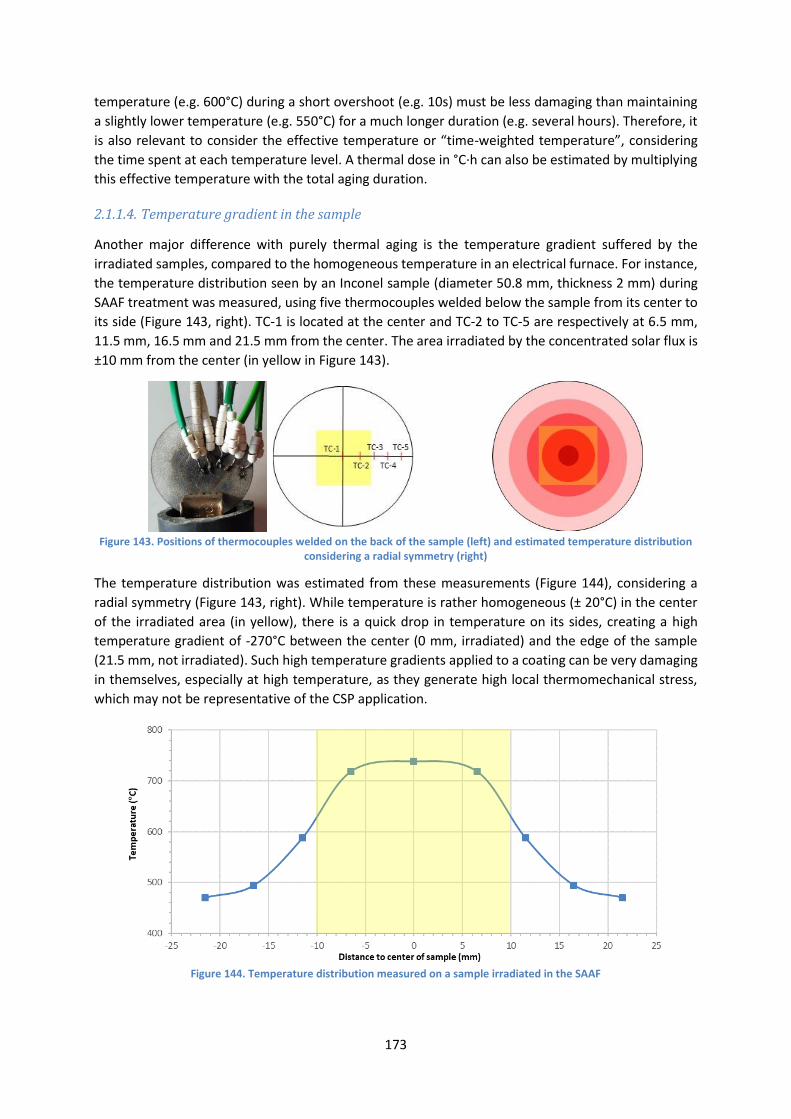
173
temperature (e.g. 600°C) during a short overshoot (e.g. 10s) must be less damaging than maintaining
a slightly lower temperature (e.g. 550°C) for a much longer duration (e.g. several hours). Therefore, it
is also relevant to consider the effective temperature or “time-weighted temperature”, considering
the time spent at each temperature level. A thermal dose in °C·h can also be estimated by multiplying
this effective temperature with the total aging duration.
2.1.1.4. Temperature gradient in the sample
Another major difference with purely thermal aging is the temperature gradient suffered by the
irradiated samples, compared to the homogeneous temperature in an electrical furnace. For instance,
the temperature distribution seen by an Inconel sample (diameter 50.8 mm, thickness 2 mm) during
SAAF treatment was measured, using five thermocouples welded below the sample from its center to
its side (Figure 143, right). TC-1 is located at the center and TC-2 to TC-5 are respectively at 6.5 mm,
11.5 mm, 16.5 mm and 21.5 mm from the center. The area irradiated by the concentrated solar flux is
±10 mm from the center (in yellow in Figure 143).
Figure 143. Positions of thermocouples welded on the back of the sample (left) and estimated temperature distribution
considering a radial symmetry (right)
The temperature distribution was estimated from these measurements (Figure 144), considering a
radial symmetry (Figure 143, right). While temperature is rather homogeneous (± 20°C) in the center
of the irradiated area (in yellow), there is a quick drop in temperature on its sides, creating a high
temperature gradient of -270°C between the center (0 mm, irradiated) and the edge of the sample
(21.5 mm, not irradiated). Such high temperature gradients applied to a coating can be very damaging
in themselves, especially at high temperature, as they generate high local thermomechanical stress,
which may not be representative of the CSP application.
Figure 144. Temperature distribution measured on a sample irradiated in the SAAF

174
Overall, one must keep in mind that these major thermal differences when analyzing and comparing
the results of purely thermal aging and “solar + thermal” aging procedures.
Irradiance profiles
Apart from these thermal considerations, the main difference between purely thermal aging and solar
aging is of course the exposure of the tested materials to solar irradiance in solar furnaces compared
to infrared radiation in electrical furnaces. In particular, solar irradiance typically contains approx. 3%
of ultraviolet radiation (0.28-0.4 μm). UV photons being highly energetic (as energy is inversely
proportional to wavelength), they can be potentially damaging for the absorber.
2.1.2.1. Spectral range and irradiance levels
2.1.2.1.1. Solar aging
In concentrated solar technologies, the incident solar spectrum is modified by the reflection on the
concentrating mirrors before reaching the absorber. In the SAAF solar experimental set-up, three
stages of reflection occur (Figure 145). A heliostat (flat mirror) reflects the incident solar radiation (first
reflection) towards a down-facing parabolic mirror (second reflection). These mirrors mainly consist in
a silver reflector deposited on mm-thick glass. A kaleidoscope made of four polished aluminum walls
is placed at the focal point of the parabola (third reflection), where multiple reflections occur between
the four walls to homogenize the concentrated solar flux (see Chapter 3). The sample is placed at the
exit of the kaleidoscope.
Figure 145. Three main reflection stages in SAAF
Reflectance spectra were measured for the three kinds of reflective surfaces and compared to the solar
spectrum calculated for Odeillo using SMARTS software [30] (Figure 146). The heliostat and parabola
(silvered-glass mirrors) have a high spectral reflectance except in the 0.28-0.32 µm UV region. The
kaleidoscope (polished aluminum) has a lower reflectance below 1 µm, generating optical losses made
all the higher by the multiple reflections between its four walls. This may reduce the quantity of UV
photons after the third reflection in SAAF.
To better quantify this effect, the modification of the Odeillo incident solar irradiance spectrum after
each reflection stage was estimated by multiplying it with spectral reflectance data (Figure 147). A

175
concentration ratio of C = 15000 was assumed for the parabola at all wavelengths. To account for
optical losses due to multiple reflections in the kaleidoscope, an irradiance reduction ratio r = 0.15 was
applied, according to Figure 97 p.110. The integration over wavelength of these incident and modified
solar spectra (Figure 147) allowed for the comparison of the corresponding flux densities in the UV and
solar ranges (Table 28).
Figure 146. Hemispherical reflectance spectra of the mirrors used in the three reflection stages in SAAF
Figure 147. Solar irradiance spectrum in Odeillo before and after each stage of reflection in SAAF (estimated)
Table 28. Estimated flux densities before and after each stage of reflection in SAAF
Flux densities
(kW/m²)
Solar
spectrum
Odeillo
After
heliostat
After
parabola
C = 15000
After
kaleidoscope
r = 0.15
Received
by sample
50
kW/m²
500
kW/m²
UV (0.28-0.4 µm) 0.05 0.03 303 14 0.55 5.5
Solar (0.28-2.5 µm) 1.02 0.94 12490 1270 50 500
Fraction of UV (%) 4.7% 3.4% 2.4% 1.1% 1.1% 1.1%
Notably, the solar spectrum in Odeillo has a fraction of UV radiation (0.28-0.4 µm) in the whole solar
irradiation spectral range (0.28-2.5 µm) higher (4.7%) than standard solar spectra (3%), due to the high
elevation (1650 m) and dry climate in the Pyrenees mountains. This high level of UV radiation is typical
of CSP installation sites with high annual solar irradiance. As can be expected from the reflectance
spectra of the reflective mirrors in Figure 146, the fraction of UV radiation decreases with each stage
of reflection, from 4.7% to 1.1%.

176
At the first stage, after the heliostat (red vs. blue), UV radiation below 0.35 µm is notably reduced. At
the second stage, after the parabola (green) there are some more UV losses, however due to the high
concentration ratio of the parabola, UV flux density is high. At the third stage (purple), it is reduced
again by the multiple reflections inside the kaleidoscope.
In SAAF, the level of incident solar irradiance can be controlled using shutters. If an irradiance between
50 kW/m² and 500 kW/m² is imposed on the sample, the UV flux density could reach 0.55 to 5.5
kW/m², i.e., more than 10 to 100 times the UV level comprised in the Odeillo solar spectrum. This value
is consistent with the one estimated in Chapter 2 (Table 4 p.50) for solar absorbers subjected to a
typical solar concentration C = 100 (2-3 kW/m²). UV exposure in SAAF is therefore representative of
CSP applications. The level of UV radiation seen by samples in solar furnaces is not at all negligible.
The energy E of a photon at a wavelength is 𝐸 [𝐽] = ℎ ∙ 𝑐 𝜆⁄ [𝑚] (Figure 148). When dividing spectral
irradiance (in W/m²/µm) by the energy of the photon (in Joules) corresponding to each wavelength of
the incident solar spectrum, the number of incident photons/m²/s/µm can be estimated (1 W ≡ 1 J/s)
(Figure 148). When integrating this value over wavelength, a photon flux density (photons/m²/s) can
be deduced: only 0.4% of the photon flux density incident on the sample in SAAF concerns photons
with an energy above 3.1 eV (i.e., below 0.4 µm), e.g. at 500 kW/m², 1.1 x 10¹⁹ UV photons/m²/s vs.
2.4 x 10²¹ “solar photons”/m²/s.
Figure 148. Photon energy and photon flux density/µm after the last stage of reflection in SAAF
Considering that solar selective absorber coatings are solar absorptive by design, they will absorb the
majority (i.e., their value of S) of the incident solar irradiance they are exposed to. For instance, Figure
149 shows the solar spectral irradiance incident on the sample in SAAF when irradiance is regulated to
obtain 50 kW/m² (blue), and the one actually absorbed (orange) by a typical SSAC (sample 1830AR01-
07 cured), which depends on its spectral reflectance (green). With a solar absorptance of 0.916, it
absorbs approx. 92% of the solar irradiance it is exposed to (45 kW/m²), and up to 94% of the incident
UV radiation where the SSAC is more absorptive than in the NIR region, due to its selectivity.

177
Figure 149. Estimated solar spectral irradiance received (blue) in SAAF at 50 kW/m², and absorbed (orange) by a typical
SSAC sample (18301R01-07 cured) depending on its spectral reflectance (green)
2.1.2.1.2. Thermal aging
In an electrical furnace, samples are heated by the infrared irradiation of ceramic heating elements. In
ALTHAIA, the sample is placed inside a heated ceramic tube, most likely made mainly of alumina. In
Figure 150 (left) the spectral irradiance of the alumina ceramic tube at 500°C (red) was approximated
as the spectral blackbody emission (given by Planck’s law, brown) multiplied by the spectral emittance
of an alumina ceramic (at 1300 K [331], black). It is to notice that the typical irradiance level attained
in thermal aging with such configuration is approx. 10 kW/m² (obtained by integrating the red
spectrum over wavelength). This is more than 5 times lower than under solar irradiance of 50 kW/m²
(Figure 149).
Figure 150. Left: IR spectral irradiance emitted by an alumina ceramic at 500°C (red) estimated from blackbody spectral irradiance at 500°C (brown) and spectral emittance of alumina ceramic (black [331]). Right: Corresponding IR spectral
irradiance absorbed (pink) by a typical SSAC sample (18301R01-07 cured) depending on its spectral reflectance (green).
Furthermore, SSACs are highly IR-reflective by design, thus they will absorb only a limited fraction (i.e.,
their value of (T)) of the incident IR irradiance they are exposed to. This was estimated for the same
typical SSAC (sample 1830AR01-07 cured) considering its spectral absorptance as 1 minus its spectral
reflectance (Figure 150 right, green). Using the approximated emission for the electrical furnace (red),
the spectral irradiance actually absorbed by the SSAC (pink) is further reduced, so that only approx. 1.8
kW/m² of the incident 10 kW/m² is absorbed by the coating during purely thermal aging.
2.1.2.1.3. Comparison

178
Table 29 compares the irradiance levels received and absorbed by typical SSAC samples during purely
thermal aging in an electrical furnace and during solar aging in SAAF solar furnace, as estimated in the
previous subsections.
Table 29. Estimated irradiance levels received and absorbed by a typical SSAC sample (1830AR01-07 cured) during purely thermal aging in an electrical furnace and during solar aging in SAAF solar furnace for different spectral ranges
Irradiance levels
(kW/m² = kJ/m²/s)
/ spectral range
Purely thermal aging
(ALTHAIA)
Solar aging
(SAAF 50 kW/m²)
Solar/thermal
ratio
Absorbed Received Absorbed Received Absorbed
UV (0.28 – 0.4 µm) _ _ 0.55 0.52 ∞
Solar (0.28 – 2.5 µm) 0.002 1 0.001 50 45.3 33000
IR (1 – 25 µm) 10.3 1.8 17.3 2 13.4 7
This comparison illustrates the fact that the level of irradiance (in kW/m²), i.e., energy flux (in kJ/m²/s)
absorbed by a solar selective absorber coating is much higher under concentrated solar aging in SAAF
than under thermal aging in an electrical furnace. First, solar aging includes energetic UV photons (0.28
– 0.4 µm) that are not at all present during thermal aging. Also, in the solar range (0.28 – 2.5 µm) the
energy flux is almost 33000 times higher under solar aging, due to the high solar concentration in SAAF.
Even in the IR range (1 – 25 µm), the energy flux is seven times higher under solar aging. These more
intense conditions could give rise to larger evolutions of the coatings under concentrated solar aging
than under thermal aging.
Considering that irradiance is also the instant energy density (in kJ/m²/s), there may additionally exist
a different time scale between:
• slow thermally-induced physicochemical phenomena in purely thermal aging, caused by
thermal accumulation on the material, until their activation energy can be reached;
• spontaneous irradiation-induced phenomena in concentrated solar aging (photon-matter
interactions), caused by the more energetic UV-Vis photons that may locally induce chemical
bond breaking and formation in the material lattice, especially in combination with high
temperature.
This difference in time scale could be further enhanced by the much higher heating rates under
concentrated solar aging (tens of °C/s) than thermal aging (tens of °C/min) (see section 2.1.1.1 p.172).
2.1.2.2. Effective irradiance and irradiance dose
In SAAF, similarly to temperature, if irradiance levels incident on the sample are varied during solar
aging tests, an effective irradiance (“time-weighted” irradiance, considering the time spent under each
irradiance level) can be estimated. An irradiance dose in kWh/m² can also be deduced by multiplying
this effective irradiance with the total aging duration. It is to notice that contrary to temperature,
irradiance levels are not measured during SAAF experiments. Irradiance levels are controlled using the
shutter aperture, based on the DNI at the time of the experiment and previous calibrations. Therefore,
experimental fluctuations of irradiance levels due to fluctuations in DNI during the test are not taken
into account. In the following, setup irradiance levels are used to establish the irradiance profiles.
1 Spectral irradiance between 0.28 µm and 1 µm is not taken into account, however there is very little blackbody irradiance below 1 µm at 500°C so this is negligible. 2 Spectral irradiance above 2.5 µm is not taken into account, so this value may be slightly underestimated.

179
2.2. Influence of concentrated solar irradiation
Despite the discussed differences in aging methods, an analysis of the influence of the exposure to
concentrated solar radiation during aging was attempted, by comparing the aging behavior of a sample
aged in the ALTHAIA electric furnace (Chapter 4) and a sample aged in the SAAF solar furnace under
constant solar irradiance, reaching similar aging temperatures and durations (Table 30). This allows for
the comparison of configurations 1 (thermal aging) and 2 (constant solar aging) described in Table 11
p.114. The cured state of the sample (24h at 500°C in air, see Chapter 4) is considered as reference in
both cases.
The TiAlN absorber series 1928 was used for this comparison. Sample 1928ER01-20, previously treated
in ALTHAIA at 500°C in air, is considered based on the additional 24h single aging step applied after the
curing step. Sample 1928ER01-13 was treated in the SAAF at a constant solar irradiance of 400 kW/m²,
in 4 cycles reaching a total duration of 14h28. Although this could be considered as slow thermal
cycling, due to the intermittence of the solar radiation, it is not possible to apply this total duration in
one cycle. The corresponding temperature profiles for each cycle are visible in Table 31. Due to the
shape and size of the sample, the sample was treated with support 1, hence there was no backside
cooling and the temperature tended to fluctuate. It was overall maintained in the 400-580°C range,
with a maximum effective temperature of 536°C (treatment 1) and a global effective temperature
Teff = 485°C for all treatments. Effective temperature is “time-weighted”, i.e., it considers the time
spent at each of the different temperature levels seen by the sample during its solar aging and was
calculated from the recorded temperature profiles (Table 31). Overall, the two samples were thus
subjected to similar temperature levels around 500°C.
Table 30. Number of aging cycles and durations, and resulting macroscopic images of the sample surface
Aging conditions Reference Treatment 1
Thermal aging
500°C
ALTHAIA
Sample 1928ER01-20
Cured
(24h 500°C air)
-
After 1 cycle (24h)
Aging conditions Reference Treatment 1 Treatment 2 Treatment 3 Treatment 4
Constant solar aging
400 kW/m²
SAAF
Support 1 (no cooling)
Sample 1928ER01-13
Cured
(24h 500°C air)
-
After 1 cycle
(3h37)
-
After 2 cycles
(+3h37 = 7h14)
After 3 cycles
(+3h37 = 10h51)
After 4 cycles
(+3h37 = 14h28)
Table 30 shows the macroscopic pictures of the two samples at the different stages of aging. The
sample submitted to thermal aging at 500°C did not show any notable changes in its aspect between
the cured and aged state, while a slight discoloration is visible in the irradiated area of the sample
treated with constant solar irradiance.
Figure 151 and Figure 152 compare the evolutions in spectral reflectance and solar absorptance for
the thermal aging and constant solar aging conditions. Optical variations are small in both cases
(S ≤ 0.01). The reflectance blue-shift could indicate a slight increase in coating thickness in both
cases.

180
Table 31. Temperature profiles obtained with thermal aging at 500°C and constant solar aging at 400 kW/m²
Conditions Treatment 1
1928ER01-20
1 cycle
24h
T = 500°C
ALTHAIA
Conditions Treatment 1 Treatment 2 Treatment 3 Treatment 4
1928ER01-13
400 kW/m²
4 cycles
14h28
Teff = 485°C
Support 4
(cooling)
Teff-pyr = 536°C, Tmax-pyr = 628°C
1 cycle 3h37
Teff-pyr = 498°C, Tmax-pyr = 508°C
1 cycle 3h37
Teff-pyr = 510°C, Tmax-pyr = 574°C
1 cycle 3h37
Teff-pyr = 383°C, Tmax-pyr = 399°C
1cycle 3h37
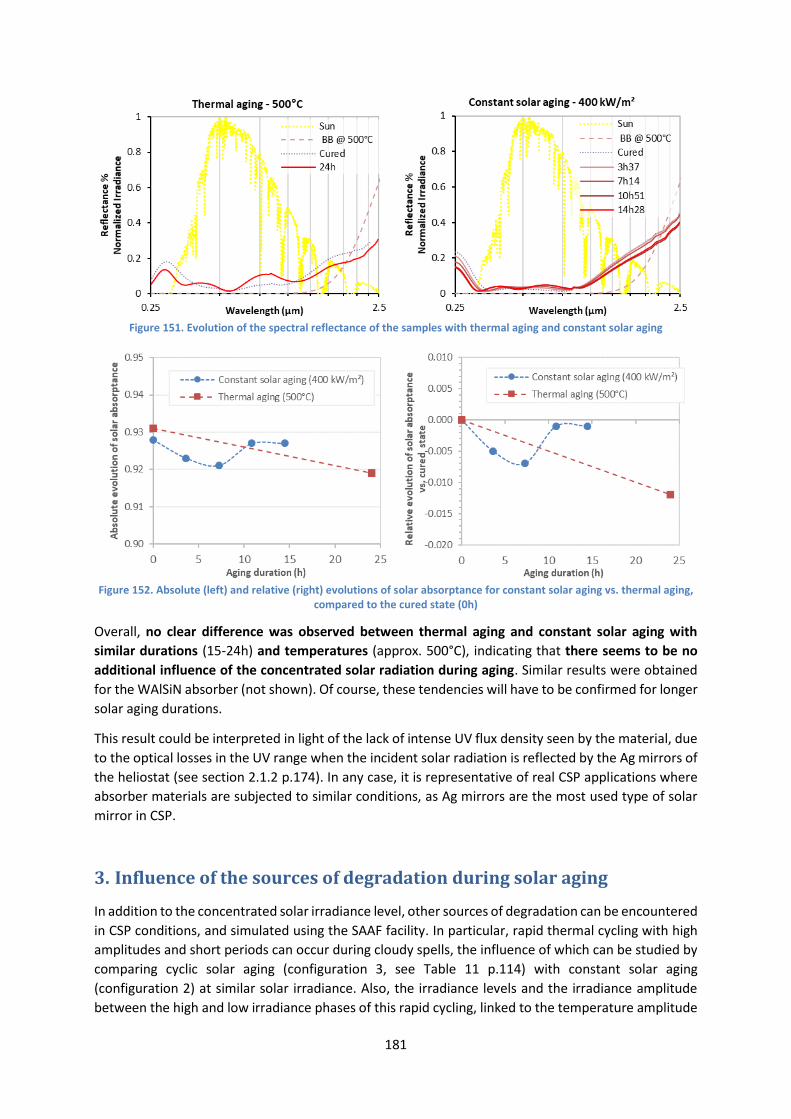
181
Figure 151. Evolution of the spectral reflectance of the samples with thermal aging and constant solar aging
Figure 152. Absolute (left) and relative (right) evolutions of solar absorptance for constant solar aging vs. thermal aging,
compared to the cured state (0h)
Overall, no clear difference was observed between thermal aging and constant solar aging with
similar durations (15-24h) and temperatures (approx. 500°C), indicating that there seems to be no
additional influence of the concentrated solar radiation during aging. Similar results were obtained
for the WAlSiN absorber (not shown). Of course, these tendencies will have to be confirmed for longer
solar aging durations.
This result could be interpreted in light of the lack of intense UV flux density seen by the material, due
to the optical losses in the UV range when the incident solar radiation is reflected by the Ag mirrors of
the heliostat (see section 2.1.2 p.174). In any case, it is representative of real CSP applications where
absorber materials are subjected to similar conditions, as Ag mirrors are the most used type of solar
mirror in CSP.
3. Influence of the sources of degradation during solar aging
In addition to the concentrated solar irradiance level, other sources of degradation can be encountered
in CSP conditions, and simulated using the SAAF facility. In particular, rapid thermal cycling with high
amplitudes and short periods can occur during cloudy spells, the influence of which can be studied by
comparing cyclic solar aging (configuration 3, see Table 11 p.114) with constant solar aging
(configuration 2) at similar solar irradiance. Also, the irradiance levels and the irradiance amplitude
between the high and low irradiance phases of this rapid cycling, linked to the temperature amplitude

182
suffered by the sample, can be controlled in the SAAF, and their influence on the aging behavior of the
absorber coatings is studied. Indeed, these amplitudes can generate large and potentially damaging
thermal shocks in the materials.
For this study, equivalent samples of the TiAlN tandem absorber coating were used. The chosen
samples are deposited on an Inconel substrate of 2 mm in thickness and a round shape of 2’’ (50.8
mm) in diameter. Considering this, supports 1 and 4 were used. The aging behavior is monitored
through the observed changes in macroscopic and SEM images of the samples surface, and the
variations in optical properties and chemical composition, considering the different temperature
profiles applied during each solar treatment. The variation in optical performance is considered
relatively to the cured state (24h at 500°C in air) (S = S (aged) – S (cured)) for better comparability
with other samples.
3.1. Influence of solar irradiance level in constant solar aging
First, the influence of the solar irradiance level during constant solar aging is investigated. To draw a
comparison, a sample of series 1830 was exposed to 250 kW/m² for up to 11h20 (using support 1
without backside cooling), and a sample of series 1928 was exposed to 400 kW/m² for up to 14h28
(using support 4 with backside cooling), in four cumulative treatments (Table 32).
Table 32. Number of aging cycles and durations, and resulting macroscopic images of the sample surface
Aging conditions Reference Treatment 1 Treatment 2 Treatment 3 Treatment 4
Constant solar aging
250 kW/m²
Support 1
(no cooling)
Sample 1830AR01-08
Cured
(24h 500°C air)
After 1 cycle
(6h)
-
After 2 cycles
(+1h15 = 7h15)
-
After 3 cycles
(+2h05 = 9h20)
After 4 cycles
(+2h = 11h20)
Constant solar aging
400 kW/m²
SAAF
Support 4
(cooling)
Sample 1928ER01-13
Cured
(24h 500°C air)
-
After 1 cycle
(3h37)
-
After 2 cycles
(+3h37 = 7h14)
After 3 cycles
(+3h37 = 10h51)
After 4 cycles
(+3h37 = 14h28)
Table 32 shows macroscopic pictures of the samples surface. The sample treated at 250 kW/m² seems
to be the most affected by solar aging, with a change in color from blue to yellow-white in the
irradiated area. A similar tendency is suspected for the sample treated at 400 kW/m², only to a lesser
extent.
These changes cause evolutions in the sample optical properties (Figure 153) particularly visible after
solar aging at 250 kW/m². The oscillations appearing in the reflectance spectrum can be linked to the
oxidation of the coating (see Chapter 4), confirmed by EDS measurements where the content in oxygen
is increased by aging (Figure 154). Elements from the Inconel substrate (Ni to Mo) tend to be detected
in higher quantities after aging, to the detriment of elements from the coating (Al), indicating that the
thickness of the coating has decreased, probably due to its densification. Meanwhile, the increase in
frequency of the reflectance oscillations could conversely indicate an increase in thickness. However,
these oscillations may also appear simply because of a change in the coating chemical and optical
nature, from absorptive (TiAlN) to semitransparent (oxide), due to oxygen incorporation [332]. The

183
fact that the content in Ti does not decrease while that of Al does could indicate that the oxidation of
TiAlN may occur via the oxidation of TiN into TiOx. However, the detected content in Ti is small even in
the reference cured state, so this however credible hypothesis cannot reasonably be sustained by EDS
measurements only. Complementary analyses such as XPS depth profiles of the aged sample would be
necessary to confirm it.
Figure 153. Evolution of the spectral reflectance of the samples with constant solar aging at 250 kW/m² and 400 kW/m²
Figure 154. Variation in atomic content (in at.%, measured by EDS) after 11h20 at 250 kW/m² vs. cured state
Following the increase in spectral reflectance, as can be expected the solar absorptance of the sample
treated at 250 kW/m² notably decreases compared to the cured state (S = -0.04 after 10h), while
that of the sample treated at 400 kW/m² does not significantly change (Figure 155).
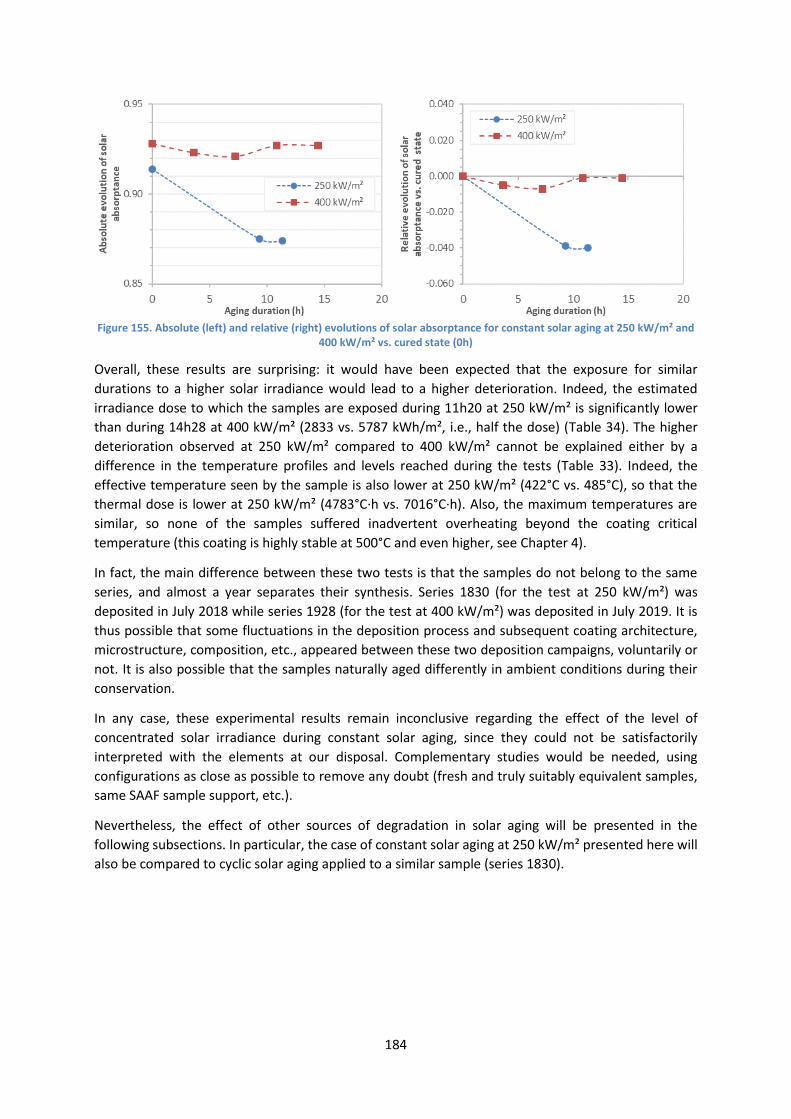
184
Figure 155. Absolute (left) and relative (right) evolutions of solar absorptance for constant solar aging at 250 kW/m² and
400 kW/m² vs. cured state (0h)
Overall, these results are surprising: it would have been expected that the exposure for similar
durations to a higher solar irradiance would lead to a higher deterioration. Indeed, the estimated
irradiance dose to which the samples are exposed during 11h20 at 250 kW/m² is significantly lower
than during 14h28 at 400 kW/m² (2833 vs. 5787 kWh/m², i.e., half the dose) (Table 34). The higher
deterioration observed at 250 kW/m² compared to 400 kW/m² cannot be explained either by a
difference in the temperature profiles and levels reached during the tests (Table 33). Indeed, the
effective temperature seen by the sample is also lower at 250 kW/m² (422°C vs. 485°C), so that the
thermal dose is lower at 250 kW/m² (4783°C·h vs. 7016°C·h). Also, the maximum temperatures are
similar, so none of the samples suffered inadvertent overheating beyond the coating critical
temperature (this coating is highly stable at 500°C and even higher, see Chapter 4).
In fact, the main difference between these two tests is that the samples do not belong to the same
series, and almost a year separates their synthesis. Series 1830 (for the test at 250 kW/m²) was
deposited in July 2018 while series 1928 (for the test at 400 kW/m²) was deposited in July 2019. It is
thus possible that some fluctuations in the deposition process and subsequent coating architecture,
microstructure, composition, etc., appeared between these two deposition campaigns, voluntarily or
not. It is also possible that the samples naturally aged differently in ambient conditions during their
conservation.
In any case, these experimental results remain inconclusive regarding the effect of the level of
concentrated solar irradiance during constant solar aging, since they could not be satisfactorily
interpreted with the elements at our disposal. Complementary studies would be needed, using
configurations as close as possible to remove any doubt (fresh and truly suitably equivalent samples,
same SAAF sample support, etc.).
Nevertheless, the effect of other sources of degradation in solar aging will be presented in the
following subsections. In particular, the case of constant solar aging at 250 kW/m² presented here will
also be compared to cyclic solar aging applied to a similar sample (series 1830).

185
Table 33. Temperature profiles obtained with constant solar irradiance of 250 kW/m² and 400 kW/m²
Conditions Treatment 1 Treatment 2 Treatment 3 Treatment 4
1830AR01-08
250 kW/m²
4 cycles
11h20
Teff = 422°C
Support 1
(no cooling)
Teff-pyr = 359°C, Tmax-pyr = 377°C
1 cycle 6h
Teff-pyr = 529°C, Tmax-pyr = 558°C
1 cycle 1h15
Teff-pyr = 449°C, Tmax-pyr = 502°C
1 cycle 2h05
Teff-TC = 517°C, Tmax-TC = 563°C
1 cycle 2h
1928ER01-13
400 kW/m²
4 cycles
14h28
Teff = 485°C
Support 4
(cooling)
Teff-pyr = 536°C, Tmax-pyr = 628°C
1 cycle 3h37
Teff-pyr = 498°C, Tmax-pyr = 508°C
1 cycle 3h37
Teff-pyr = 510°C, Tmax-pyr = 574°C
1 cycle 3h37
Teff-pyr = 383°C, Tmax-pyr = 399°C
1cycle 3h37
Table 34. Effective irradiance and dose with constant solar irradiance of 250 kW/m² and 400 kW/m²
Sample
Imax
(kW/m²)
Total
duration (h)
Ieff
(kW/m²)
Irradiance
dose
(kWh/m²)
Teff
(°C)
Thermal
dose
(°C·h)
1830AR01-08 250 11.33 250 2833 422 4783
1928ER01-13 400 14.47 400 5787 485 7016

186
3.2. Influence of cyclic solar aging vs. constant solar aging
In CSP applications, the absorber material may be submitted to sudden variations in the concentrated
solar irradiance, for instance during cloudy spells. Here the influence of rapid thermal cycling during
solar aging is studied, by comparing the effect on equivalent samples of TiAlN absorber, of: i) constant
solar irradiance; ii) repeated cycles oscillating from a high irradiance phase to a low irradiance phase.
A constant irradiation of 250 kW/m² was applied to sample 1830AR01-08, in four cumulative cycles
with different durations from 2h to 6h, reaching 11h20 of aging in total (Table 35). Meanwhile, sample
1830AR01-09 was submitted to 225 cycles (16h16) in total, each with a high irradiance phase of 250
kW/m² for a duration of 200s, and a low irradiance phase of 200 kW/m² for a duration of 60s, in four
cumulative treatments (Table 35, Figure 156). The samples were treated using support 1 (no backside
air cooling, thermocouple welded on the back center of the sample). Both samples were previously
cured by the manufacturer (24h at 500°C in ambient air) before solar exposure.
Table 35. Number of aging cycles and durations, and resulting macroscopic and SEM images of the sample surface
Aging conditions Reference Treatment 1 Treatment 2 Treatment 3 Treatment 4
Constant solar aging
250 kW/m²
Support 1 (no cooling)
Sample 1830AR01-08
Cured
(24h 500°C air)
After 1 cycle
(6h)
-
After 2 cycles
(+1h15 = 7h15)
-
After 3 cycles
(+2h05 = 9h20)
-
After 4 cycles
(+2h = 11h20)
Cyclic solar aging
250-200 kW/m²
I = 50 kW/m²
Support 1 (no cooling)
Sample 1830AR01-09
Cured
(24h 500°C air)
After 75 cycles
(5h25)
-
After 125 cycles
(+3h37 = 9h02)
-
After 175 cycles
(+3h37 = 12h39)
After 225 cycles
(+3h37 = 16h16)
Figure 156. Irradiance levels applied in SAAF (constant solar aging 250 kW/m² vs. cyclic solar aging at 250-200 kW/m²)

187
Images at macroscopic scale (Table 35) both show surface discoloring, faster under constant irradiation
(treatments 3 and 4, 9h20 and 11h20) than under cyclic irradiation (treatment 3, 12h39). Similar
changes to the surface are eventually observed. At microscopic scale (SEM images, Table 35), no
physical deterioration is observed for both cases, such as cracks or delamination.
In both cases, the samples optical properties (Figure 157 and Figure 159) evolve with their physical
aspect. Their discoloring is marked by the appearance of reflectance oscillations that can again be
linked to the increase in oxygen content, as measured by EDS (Figure 158), illustrating the coating
partial oxidation. As explained in section 3.1, constant solar aging at 250 kW/m² induces a decrease in
coating thickness concomitant with a change in chemical nature (oxidation) and subsequent optical
behavior from absorptive (TiAlN) to semitransparent (TiAlO). Oxidation also occurs with cyclic solar
aging at 250-200 kW/m², only it does not seem to be accompanied by a coating densification, as the
content in elements from the coating (Si, Ti, Al) barely evolve after aging. A small decrease in Ni content
(main component of the Inconel substrate) could even indicate an increase in coating thickness, maybe
due to the growth of an oxide. This is accompanied by a small enrichment in Fe and Mo (substrate
elements), that may indicate their outward diffusion inside the coating. These elements could also be
oxidized. However, their detected content is low even in the reference cured state (≤ 3 at.%, limit of
EDS detection), and this hypothesis would need to be confirmed by more precise means such as XPS
depth profiles.
Figure 157. Evolution of sample spectral reflectance with constant (250 kW²) and cyclic (250-200 kW/m²) solar aging
Figure 158. Variation in atomic content (in at.%, measured by EDS after the last treatment) with constant (250 kW²) and
cyclic (250-200 kW/m²) solar aging vs. cured state

188
As a consequence of these evolutions, solar absorptance (Figure 159) decreases more rapidly and more
strongly when exposed to constant solar aging at 250 kW/m² (S = -0.04). After the discoloring has
settled (third treatment, 9h20 in total), solar absorptance tends to stabilize, as does spectral
reflectance. Under cyclic solar aging of 250-200 kW/m², solar absorptance first increases slightly
(+0.01), thanks to higher frequency of reflectance oscillations in the solar range, giving rise to a lower
reflectance in the NIR range whilst not increasing it in the visible range (maximum solar irradiance
around 500 nm). After the last cyclic treatment (16h16 in total), in concordance with the appearance
of coating visual discoloring, solar absorptance dropped down to a similar level (S = -0.03) as was
observed for constant solar aging.
Figure 159. Absolute (left) and relative (right) evolutions of solar absorptance with constant (250 kW²) and cyclic (250-
200 kW/m²) solar aging vs. cured state (0h)
This tendency to faster/higher degradation under constant irradiation can be expected, considering
the applied conditions. Indeed, the effective irradiance seen by the sample is higher under constant
irradiance of 250 kW/m² (Ieff = 250 kW/m²) than under cyclic irradiance of 250-200 kW/m² (Ieff = 238
kW/m²) (Table 37). In other words, since 1 W ≡ 1 J/s, the energy flux (in kJ/m²/s) received by the sample
is higher under this constant irradiance (250 kJ/m²/s vs. 238 kJ/m²/s). Similarly, based on the
considerations in section 2.1.2 p.174, a higher irradiance translates into a higher photon flux. The latter
are estimated to be 1.18 x 10²¹ photons/m²/s under constant aging vs. 1.13 x 10²¹ photons/m²/s under
cyclic aging, in the conditions studied here. Therefore during the same duration, the sample receives
(and absorbs) more energy under constant irradiance than under cyclic irradiance, causing faster and
higher degradation.
It must be highlighted that these observations are only true because in the chosen test conditions, the
high irradiance phase level during cyclic aging is the same as the irradiance level during constant aging
(250 kW/m²), thus the low irradiance level and the effective irradiance are lower under cyclic aging
than constant aging. That is to say that here the influence of the effective irradiance is highlighted,
more than the effect of cycling itself. Therefore, to really isolate the effect of cycling over that of
effective irradiance, identical effective irradiance levels would have to be applied (e.g. constant 250
kW/m² vs. cyclic 265-200 kW/m² with 200s/60s cycles).
Another relevant indicator would be the irradiance dose and thermal dose received by the sample.
Due to the higher total aging duration under cyclic aging (16h16 vs. 11h20), it is more adequate to
compare constant and cyclic aging at closer durations, i.e., after 11h20 at 250 kW/m² (treatment 4) vs.
after 12h39 at 250-200 kW/m² (treatment 3). In this case, irradiance doses (approx. 2800-3000
kWh/m²), effective temperatures (approx. 420-430°C), high temperature levels (approx. 540-560°C)
are all similar (Table 36). The thermal dose is even higher for cyclic aging (5409°C·h vs. 4783°C·h).

189
Yet constant solar aging still gives rise to faster and higher degradation than cyclic solar aging (S = -
0.04 at 250 kW/m² vs. +0.01 at 250-200 kW/m², Figure 159). This fact is well illustrated in Figure 160,
where the evolutions of solar absorptance with irradiance dose (left) and thermal dose (right) are
represented. Higher doses in cyclic solar aging are necessary to provoke similar optical degradations.
Figure 160. Relative evolutions of solar absorptance with constant (250 kW²) and cyclic (250-200 kW/m²) solar aging vs.
cured state (0h), vs. irradiance dose (left) and thermal dose (right) received by the samples
To conclude on the impact of cyclic vs. solar aging, or more accurately on the impact of the effective
irradiance applied to the sample during solar aging, it appears that aging under cyclic irradiation with
lower effective irradiance gives slower aging and less damaging than under constant irradiation,
even when applying similar irradiance and thermal doses. This could be due to the fact that a higher
effective irradiance translates into higher instant energy and photon flux densities (in J/m²/s and
photons/m²/s), that could cause fast chemical reactions due to direct energetic photon-matter
interactions (e.g. bond breaking, bond formation). A higher photon flux density under constant aging
could modify the coating surface more quickly during the first stages of aging, accounting for the
faster degradation observed. Given enough time at lower instant photon flux density, the damaging
eventually reaches a similar level under cyclic aging.
Finally, in this example, the irradiance level and the amplitude between high and low irradiance phases
are moderate (max I = 250 kW/m², I = 50 kW/m²) and the series 1830 coating may be less resistant
than others (see section 3.1 p.182). However, it is worth noticing that similar results were obtained
with higher irradiance levels and higher amplitudes (400 kW/m² vs. 400-50 kW/m²) on a coating series
with apparent higher stability (1928).
After comparing constant and cyclic solar aging, the next section will study the influence of the
temperature/irradiance amplitudes during cyclic solar aging at different irradiance levels.

190
Table 36. Temperature profiles obtained with constant solar irradiance of 250 kW/m² and cyclic solar irradiance of 250-200 kW/m²
Conditions Treatment 1 Treatment 2 Treatment 3 Treatment 4
1830AR01-08
250 kW/m²
4 cycles
11h20
Teff = 422°C
Support 1
(no cooling)
Teff-pyr = 359°C, Tmax-pyr = 377°C
1 cycle 6h
Teff-pyr = 529°C, Tmax-pyr = 558°C
1 cycle 1h15
Teff-pyr = 449°C, Tmax-pyr = 502°C
1 cycle 2h05
Teff-TC = 517°C, Tmax-TC = 563°C
1 cycle 2h
1830AR01-09
250-200 kW/m²
200s/60s
225 cycles
16h16
Teff = 456°C
Support 1
(no cooling)
Teff-pyr = 417°C, Tmax-pyr = 481°C
75 cycles 5h25
Teff-TC = 507°C, Tmax-TC = 538°C
50 cycles 3h37
Teff-pyr = 364°C, Tmax-TC = 429°C
50 cycles 3h37
Teff-pyr = 557°C, Tmax-pyr = 606°C
50 cycles 3h37
Table 37. Effective irradiance and dose with with constant solar irradiance of 250 kW/m² and cyclic solar irradiance of 250-200 kW/m²
Sample State Number
of cycles
Imax
(kW/m²)
Imin
(kW/m²)
I
(kW/m²)
Duration of
Imax phase (s)
Duration of
Imin phase (s)
Time at
Imax (h)
Time at
Imin (h)
Total
duration (h)
Ieff
(kW/m²)
Irradiance
dose
(kWh/m²)
Teff
(°C)
Thermal
dose
(°C·h)
1830AR01-08 After treatment 4 _ 250 _ _ _ _ _ _ 11.33 250 2833 422 4783
1830AR01-09 After treatment 3 175 250 200 50 200 60 9.72 2.92 12.64 238 3014 428 5409
1830AR01-09 After treatment 4 225 250 200 50 200 60 12.50 3.75 16.25 238 3875 456 7410
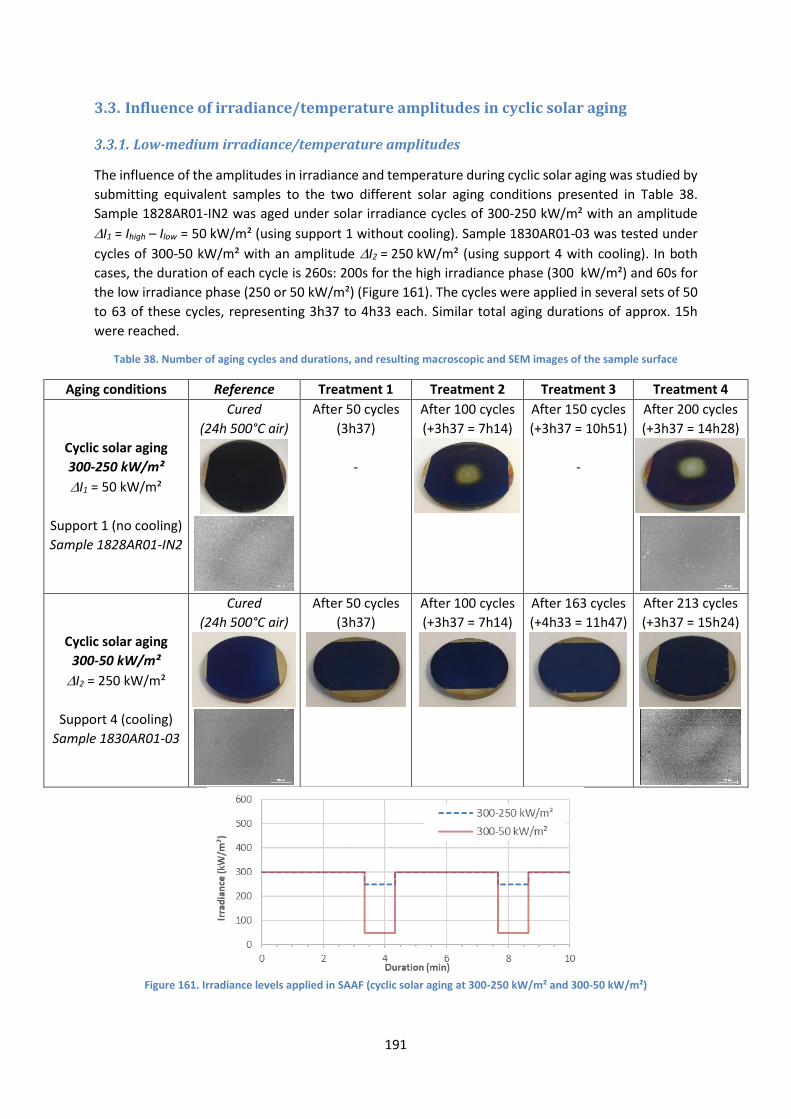
191
3.3. Influence of irradiance/temperature amplitudes in cyclic solar aging
Low-medium irradiance/temperature amplitudes
The influence of the amplitudes in irradiance and temperature during cyclic solar aging was studied by
submitting equivalent samples to the two different solar aging conditions presented in Table 38.
Sample 1828AR01-IN2 was aged under solar irradiance cycles of 300-250 kW/m² with an amplitude
I1 = Ihigh – Ilow = 50 kW/m² (using support 1 without cooling). Sample 1830AR01-03 was tested under
cycles of 300-50 kW/m² with an amplitude I2 = 250 kW/m² (using support 4 with cooling). In both
cases, the duration of each cycle is 260s: 200s for the high irradiance phase (300 kW/m²) and 60s for
the low irradiance phase (250 or 50 kW/m²) (Figure 161). The cycles were applied in several sets of 50
to 63 of these cycles, representing 3h37 to 4h33 each. Similar total aging durations of approx. 15h
were reached.
Table 38. Number of aging cycles and durations, and resulting macroscopic and SEM images of the sample surface
Aging conditions Reference Treatment 1 Treatment 2 Treatment 3 Treatment 4
Cyclic solar aging
300-250 kW/m²
I1 = 50 kW/m²
Support 1 (no cooling)
Sample 1828AR01-IN2
Cured
(24h 500°C air)
After 50 cycles
(3h37)
-
After 100 cycles
(+3h37 = 7h14)
After 150 cycles
(+3h37 = 10h51)
-
After 200 cycles
(+3h37 = 14h28)
Cyclic solar aging
300-50 kW/m²
I2 = 250 kW/m²
Support 4 (cooling)
Sample 1830AR01-03
Cured
(24h 500°C air)
After 50 cycles
(3h37)
After 100 cycles
(+3h37 = 7h14)
After 163 cycles
(+4h33 = 11h47)
After 213 cycles
(+3h37 = 15h24)
Figure 161. Irradiance levels applied in SAAF (cyclic solar aging at 300-250 kW/m² and 300-50 kW/m²)
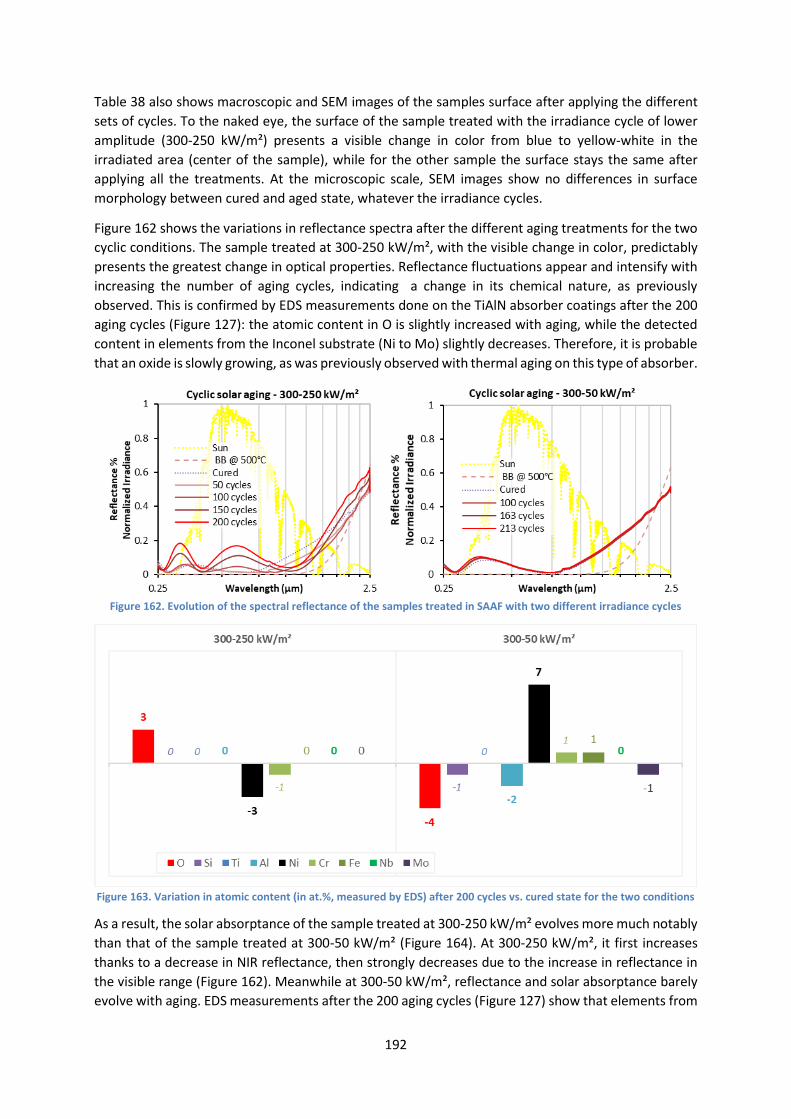
192
Table 38 also shows macroscopic and SEM images of the samples surface after applying the different
sets of cycles. To the naked eye, the surface of the sample treated with the irradiance cycle of lower
amplitude (300-250 kW/m²) presents a visible change in color from blue to yellow-white in the
irradiated area (center of the sample), while for the other sample the surface stays the same after
applying all the treatments. At the microscopic scale, SEM images show no differences in surface
morphology between cured and aged state, whatever the irradiance cycles.
Figure 162 shows the variations in reflectance spectra after the different aging treatments for the two
cyclic conditions. The sample treated at 300-250 kW/m², with the visible change in color, predictably
presents the greatest change in optical properties. Reflectance fluctuations appear and intensify with
increasing the number of aging cycles, indicating a change in its chemical nature, as previously
observed. This is confirmed by EDS measurements done on the TiAlN absorber coatings after the 200
aging cycles (Figure 127): the atomic content in O is slightly increased with aging, while the detected
content in elements from the Inconel substrate (Ni to Mo) slightly decreases. Therefore, it is probable
that an oxide is slowly growing, as was previously observed with thermal aging on this type of absorber.
Figure 162. Evolution of the spectral reflectance of the samples treated in SAAF with two different irradiance cycles
Figure 163. Variation in atomic content (in at.%, measured by EDS) after 200 cycles vs. cured state for the two conditions
As a result, the solar absorptance of the sample treated at 300-250 kW/m² evolves more much notably
than that of the sample treated at 300-50 kW/m² (Figure 164). At 300-250 kW/m², it first increases
thanks to a decrease in NIR reflectance, then strongly decreases due to the increase in reflectance in
the visible range (Figure 162). Meanwhile at 300-50 kW/m², reflectance and solar absorptance barely
evolve with aging. EDS measurements after the 200 aging cycles (Figure 127) show that elements from

193
the substrate are more strongly detected after aging, to the detriment of the elements present in the
TiAlN coating (O 3, Ti, Al). These results indicate that the coating tends to thin with aging, probably due
to its densification, without notably changing its chemical nature and thus its optical performance.
Figure 164. Absolute (left) and relative (right) evolutions of solar absorptance for two cyclic solar irradiations vs. cured
state (0h)
Table 39 reports the temperature profiles corresponding to the aging treatments considered here (N.B.
pyrometer measurements on the irradiated area are the most reliable but were not systematically
possible due to technical problems). The high-low irradiance cycles with irradiance amplitudes I1 = 50
kW/m² (300-250 kW/m² cycles) and I2 = 250 kW/m² (300-50 kW/m² cycles) translate into high-low
temperature cycles, respectively with temperature amplitudes T1 = Thigh – Tlow = 100°C (between 550
and 450°C) and T2 = 250°C (between 500 and 250°C). The highest irradiance amplitude gives rise to
the highest temperature amplitude, creating larger thermal shocks to the absorber sample. Therefore,
it could be expected that the sample treated with the lowest irradiance/temperature amplitude (300-
250 kW/m², I1 = 50 kW/m², T1 = 100°C) would be less degraded, yet it is the most affected by aging.
Several reasons justify this fact.
First, the effective irradiance seen by the sample is lower for the higher irradiance amplitude, as it
takes into account the time spent at both low and high irradiance levels: Ieff, 2 = 242 kW/m² for I2 =
300 – 50 = 250 kW/m² vs. Ieff, 1 = 288 kW/m² for I1 = 300 – 250 = 50 kW/m² (Table 40). The higher
degradation observed at lower irradiance/temperature amplitude (I = 50 kW/m², T = 100°C) could
thus be caused by a higher effective irradiance and irradiance dose, and subsequently higher energy
and photon fluxes, inducing irreversible damage.
Also, with similar high temperature levels Thigh, a higher temperature amplitude T during cyclic solar
aging implies that the effective temperature and thermal dose seen by the sample are necessarily
lower. Indeed, the global effective temperature at 300-50 kW/m² (T2 = 250°C) is lower: Teff = 369°C
vs. 524°C for 300-250 kW/m² 4. This could also explain the lower impact of aging on this sample.
3 Even though oxygen is not initially present in the TiAlN absorber coating, it is detected after the curing step (24h at 500°C in air) which serves as the reference state for the solar aging tests. 4 The real effective temperature of the sample exposed at 300-50 kW/m² is probably higher than 369°C. Indeed, pyrometry measurements were incoherent for the last three treatments. Therefore in some cases the temperature profiles considered for the calculation of Teff are the ones measured with the (back, center) thermocouple. The latter tends to be an underestimation of the surface temperature of the sample, as seen during the first treatment (see Table 39).

194
Additionally, during the 300-250 kW/m² treatments, temperature reached higher levels for longer
durations, up to 600°C, due to the natural fluctuations in solar irradiance (DNI) during the day. Indeed,
this sample was treated during an early campaign and due to its shape (round, 2” in diameter), support
1 was used for these tests. Therefore, backside air cooling could not be applied, making it harder to
control the temperature level during the experiments. Contrarily, the sample treated at 300-50 kW/m²
was air-cooled during aging (as support 4 was then available), thus its temperature was better
controlled, staying below 550°C at all times, except for a very short overshoot around 630°C.
Overall, this study indicates that increasing the amplitudes in irradiance and temperature (thermal
shocks) during cyclic solar aging does not have a notable impact on absorber coatings microstructure
and performance. In fact, significantly larger amplitudes of solar irradiance (I = 250 vs. 50 kW/m²)
and temperature (T = 250°C vs. 100°C) during solar cyclic aging did not affect the materials. Contrarily,
the latter were significantly more affected by aging at low cycling amplitudes, due to the higher
temperature maintained during the tests (550-600°C for I = 50 kW/m² vs. 500-520°C for I = 250
kW/m²), in combination with the inherent higher effective temperature and effective irradiance (524°C
and 288 kW/m² for I = 50 kW/m² vs. 369°C and 250 kW/m² for I = 250 kW/m²). This again underlines
the impact of the time actually spent under high solicitation (see section 3.2).
This example is a good illustration that solar aging is indissociably linked to thermal aging during
concentrated solar exposure. Most likely, concentrated solar irradiance and temperature present
combined or even synergistic effects, that are very hard to decorrelate using solar aging tools. An
attempt at decorrelating these effects was nevertheless conducted in parallel, on samples of the
WAlSiN absorber coating [330,333]. Indeed, the shape of the samples (30 x 30 mm²) allowed the use
of support 2 with efficient backside cooling (Table 10 p.111). Thus in this case, the applied
concentrated solar irradiance and the resulting temperature of the sample could be controlled more
independently: the sample temperature was maintained around or under 400°C whatever the solar
irradiance. Applying similar cyclic solar aging (200 cycles of 200s/60s) at 250-200 kW/m² and 250-50
kW/m² did not result in any significant differences in the coating visual aspect and optical performance
(in both cases, S and ≈ -0.01 vs. as-deposited). This led to the conclusion that solar cycling had
no influence in itself on this absorber coating, as long as the latter was maintained under its critical
temperature (limit of thermal stability). Therefore, temperature remains a critical parameter for the
aging behavior and durability of absorber coatings, probably due to the fact that many of the aging
phenomena involved are thermally-induced (oxidation, diffusion, densification, etc.).
In any case, no impact of rapid thermal shocks was observed in the studied range (Tmax = 550°C or
Tmax = 250°C). Therefore to further study the impact of thermal shocks, larger irradiance/temperature
amplitudes were also applied, as presented in the following subsection.
Anyway, even when considering an underestimation by 100-150°C, the real effective temperature seen by the sample would still be lower than 524°C, so the conclusion of this comparison remains valid in this regard.
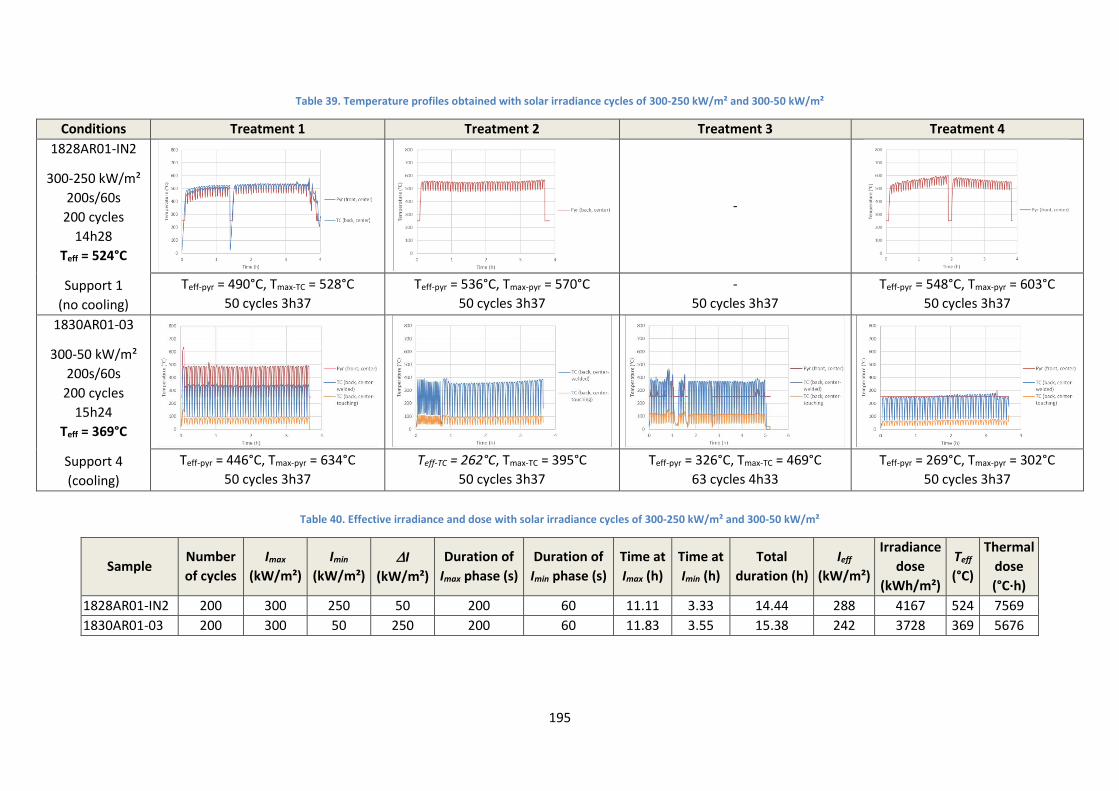
195
Table 39. Temperature profiles obtained with solar irradiance cycles of 300-250 kW/m² and 300-50 kW/m²
Conditions Treatment 1 Treatment 2 Treatment 3 Treatment 4
1828AR01-IN2
300-250 kW/m²
200s/60s
200 cycles
14h28
Teff = 524°C
Support 1
(no cooling)
-
Teff-pyr = 490°C, Tmax-TC = 528°C
50 cycles 3h37
Teff-pyr = 536°C, Tmax-pyr = 570°C
50 cycles 3h37
-
50 cycles 3h37
Teff-pyr = 548°C, Tmax-pyr = 603°C
50 cycles 3h37
1830AR01-03
300-50 kW/m²
200s/60s
200 cycles
15h24
Teff = 369°C
Support 4
(cooling)
Teff-pyr = 446°C, Tmax-pyr = 634°C
50 cycles 3h37
Teff-TC = 262°C, Tmax-TC = 395°C
50 cycles 3h37
Teff-pyr = 326°C, Tmax-TC = 469°C
63 cycles 4h33
Teff-pyr = 269°C, Tmax-pyr = 302°C
50 cycles 3h37
Table 40. Effective irradiance and dose with solar irradiance cycles of 300-250 kW/m² and 300-50 kW/m²
Sample Number
of cycles
Imax
(kW/m²)
Imin
(kW/m²)
I
(kW/m²)
Duration of
Imax phase (s)
Duration of
Imin phase (s)
Time at
Imax (h)
Time at
Imin (h)
Total
duration (h)
Ieff
(kW/m²)
Irradiance
dose
(kWh/m²)
Teff
(°C)
Thermal
dose
(°C·h)
1828AR01-IN2 200 300 250 50 200 60 11.11 3.33 14.44 288 4167 524 7569
1830AR01-03 200 300 50 250 200 60 11.83 3.55 15.38 242 3728 369 5676
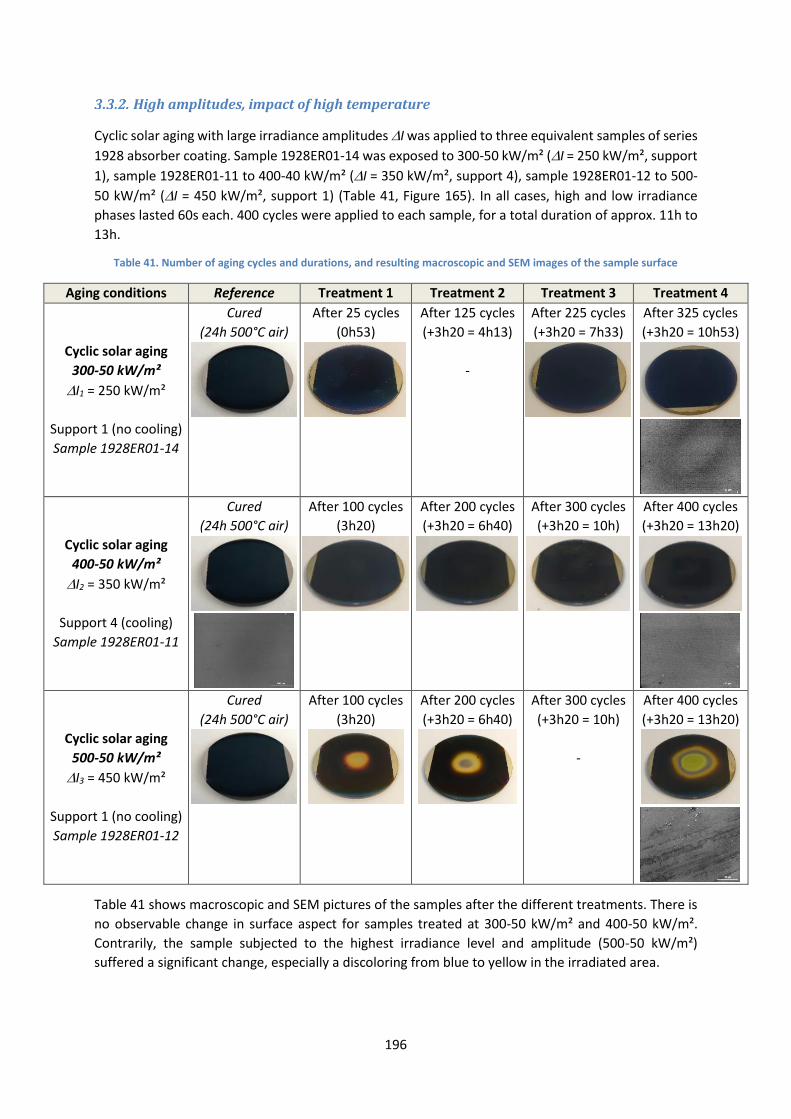
196
High amplitudes, impact of high temperature
Cyclic solar aging with large irradiance amplitudes I was applied to three equivalent samples of series
1928 absorber coating. Sample 1928ER01-14 was exposed to 300-50 kW/m² (I = 250 kW/m², support
1), sample 1928ER01-11 to 400-40 kW/m² (I = 350 kW/m², support 4), sample 1928ER01-12 to 500-
50 kW/m² (I = 450 kW/m², support 1) (Table 41, Figure 165). In all cases, high and low irradiance
phases lasted 60s each. 400 cycles were applied to each sample, for a total duration of approx. 11h to
13h.
Table 41. Number of aging cycles and durations, and resulting macroscopic and SEM images of the sample surface
Aging conditions Reference Treatment 1 Treatment 2 Treatment 3 Treatment 4
Cyclic solar aging
300-50 kW/m²
I1 = 250 kW/m²
Support 1 (no cooling)
Sample 1928ER01-14
Cured
(24h 500°C air)
After 25 cycles
(0h53)
After 125 cycles
(+3h20 = 4h13)
-
After 225 cycles
(+3h20 = 7h33)
After 325 cycles
(+3h20 = 10h53)
Cyclic solar aging
400-50 kW/m²
I2 = 350 kW/m²
Support 4 (cooling)
Sample 1928ER01-11
Cured
(24h 500°C air)
After 100 cycles
(3h20)
After 200 cycles
(+3h20 = 6h40)
After 300 cycles
(+3h20 = 10h)
After 400 cycles
(+3h20 = 13h20)
Cyclic solar aging
500-50 kW/m²
I3 = 450 kW/m²
Support 1 (no cooling)
Sample 1928ER01-12
Cured
(24h 500°C air)
After 100 cycles
(3h20)
After 200 cycles
(+3h20 = 6h40)
After 300 cycles
(+3h20 = 10h)
-
After 400 cycles
(+3h20 = 13h20)
Table 41 shows macroscopic and SEM pictures of the samples after the different treatments. There is
no observable change in surface aspect for samples treated at 300-50 kW/m² and 400-50 kW/m².
Contrarily, the sample subjected to the highest irradiance level and amplitude (500-50 kW/m²)
suffered a significant change, especially a discoloring from blue to yellow in the irradiated area.

197
Figure 165. Irradiance levels applied in SAAF (cyclic solar aging at 300-50 kW/m², 400-50 kW/m² and 500 kW/m²)
Figure 166 shows the corresponding evolutions in atomic compositions (EDS) after the last treatment,
compared to the cured state. After 400 cycles at 300-50 kW/m², elements from the coating (O to Al)
tend to be less detected than in the cured state, while elements from the substrate (Ni to Mo) are
slightly more detected, indicating a small decrease in coating thickness with aging, probably due to its
densification. The optical properties of this coating are only very slightly affected by aging (Figure 167,
Figure 168), consistently with their physical aspect (Table 41). Therefore its thickness must not change
very much, nor does its chemical nature.
Figure 166. Variation in atomic content (in at.%, measured by EDS) after 200 cycles vs. cured state for the two conditions
After 400 cycles at 400-50 kW/m², elements from the coating are more detected and elements from
the substrate are less detected, indicating an increase in the coating thickness. The increase in oxygen
content may indicate that this increase could be linked to the coating oxidation. However, there is no
visible impact on its optical properties so the changes in chemical nature and thickness must be small.
After 400 cycles at 500-50 kW/m², there is a large increase in the oxygen content, accompanied by a
decrease in detected elements from the substrate, indicating a clear oxidation of the coating and an
increase in its thickness. The fact that the detected content in Ti does not evolve while that of Al
decreases could mean that a titanium oxide tends to form and grow. The hypothesis of an oxide growth
is corroborated by the strong evolution of the coating optical properties. Large reflectance oscillations
with increasing frequency and amplitude are indeed typical of the formation and growth of a
semitransparent oxide in place of the original absorbing material [332]. Consequently, the coating solar
absorptance is strongly deteriorated by aging in these harsher conditions (S = -0.25 after 400 cycles).

198
Figure 167. Evolution of spectral reflectance with cyclic solar aging of different amplitudes and high irradiance levels
Figure 168. Absolute (left) and relative (right) evolutions of solar absorptance for three cyclic solar irradiations vs. cured
state (0h)
Additionally, the sample treated at 500-50 kW/m² was cut after the final treatment to allow for the
measurement of its spectral reflectance in the whole spectral range of interest, from 0.25 to 25 µm
(Figure 167 bottom right, section 1.1.2 p.168), giving access to its thermal emittance. The latter also
decreases strongly with aging, dropping by 8 points (from 0.336 to 0.252). This is directly linked to the
evolution in spectral reflectance: as the latter increases in the whole spectral range, it concomitantly
causes the strong decreases in solar absorptance and thermal emittance. However, the drop in thermal
emittance is not enough to compensate for the degradation of solar absorptance, as the corresponding
heliothermal efficiency dramatically drops by almost 25 points (from 0.867 to 0.631).
To better analyze these results, Table 42 shows the temperature profiles recorded during aging tests.
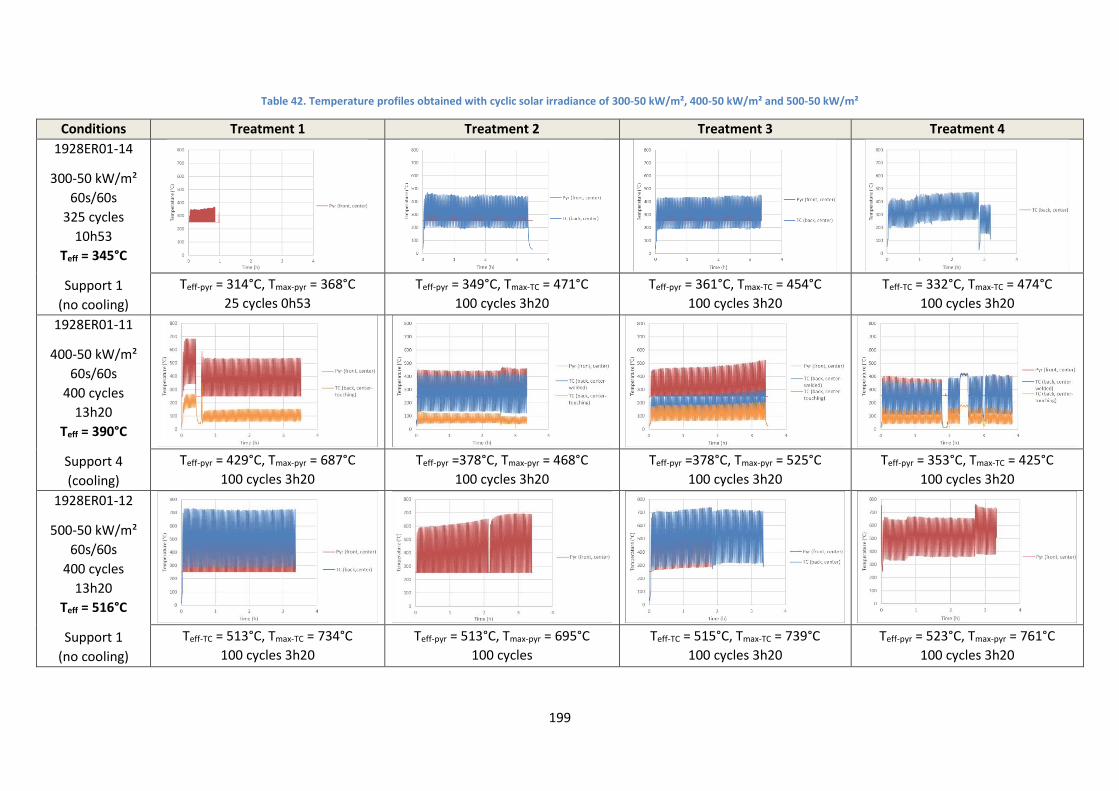
199
Table 42. Temperature profiles obtained with cyclic solar irradiance of 300-50 kW/m², 400-50 kW/m² and 500-50 kW/m²
Conditions Treatment 1 Treatment 2 Treatment 3 Treatment 4
1928ER01-14
300-50 kW/m²
60s/60s
325 cycles
10h53
Teff = 345°C
Support 1
(no cooling)
Teff-pyr = 314°C, Tmax-pyr = 368°C
25 cycles 0h53
Teff-pyr = 349°C, Tmax-TC = 471°C
100 cycles 3h20
Teff-pyr = 361°C, Tmax-TC = 454°C
100 cycles 3h20
Teff-TC = 332°C, Tmax-TC = 474°C
100 cycles 3h20
1928ER01-11
400-50 kW/m²
60s/60s
400 cycles
13h20
Teff = 390°C
Support 4
(cooling)
Teff-pyr = 429°C, Tmax-pyr = 687°C
100 cycles 3h20
Teff-pyr =378°C, Tmax-pyr = 468°C
100 cycles 3h20
Teff-pyr =378°C, Tmax-pyr = 525°C
100 cycles 3h20
Teff-pyr = 353°C, Tmax-TC = 425°C
100 cycles 3h20
1928ER01-12
500-50 kW/m²
60s/60s
400 cycles
13h20
Teff = 516°C
Support 1
(no cooling)
Teff-TC = 513°C, Tmax-TC = 734°C
100 cycles 3h20
Teff-pyr = 513°C, Tmax-pyr = 695°C
100 cycles
Teff-TC = 515°C, Tmax-TC = 739°C
100 cycles 3h20
Teff-pyr = 523°C, Tmax-pyr = 761°C
100 cycles 3h20

200
Table 43. Effective irradiance and dose with cyclic solar irradiance of 300-50 kW/m², 400-50 kW/m² and 500-50 kW/m²
Table 44. Temperature profiles obtained with thermal aging at 690°C and cyclic solar aging at 500-250 kW/m²
Conditions Treatment 1
1616DR01-08
1 cycle
12h
T = 690°C
ALTHAIA
Conditions Treatment 1 Treatment 2 Treatment 3 Treatment 4
1830AR01-07
500-250 kW/m²
200s/60s
200 cycles
14h28
Teff = 708°C
Support 1
(no cooling)
Teff-pyr = 684°C, Tmax-pyr= 775°C
50 cycles 3h37
Teff-TC/pyr = 703/731°C,
Tmax-TC/pyr = 789/848°C, 50 cycles 3h37
Teff-pyr = 657°C, Tmax-pyr = 726°C
50 cycles 3h37
Teff-pyr = 759°C, Tmax-pyr = 875°C
50 cycles 3h37
Sample Number
of cycles
Imax
(kW/m²)
Imin
(kW/m²)
I
(kW/m²)
Duration of
Imax phase (s)
Duration of
Imin phase (s)
Time at
Imax (h)
Time at
Imin (h)
Total
duration (h)
Ieff
(kW/m²)
Irradiance
dose
(kWh/m²)
Teff
(°C)
Thermal
dose
(°C·h)
1928ER01-14 400 300 50 250 60 60 6.67 6.67 13.33 175 2333 345 3738
1928ER01-11 400 400 50 350 60 60 6.67 6.67 13.33 225 3000 390 5200
1928ER01-12 400 500 50 450 60 60 6.67 6.67 13.33 275 3667 516 6880
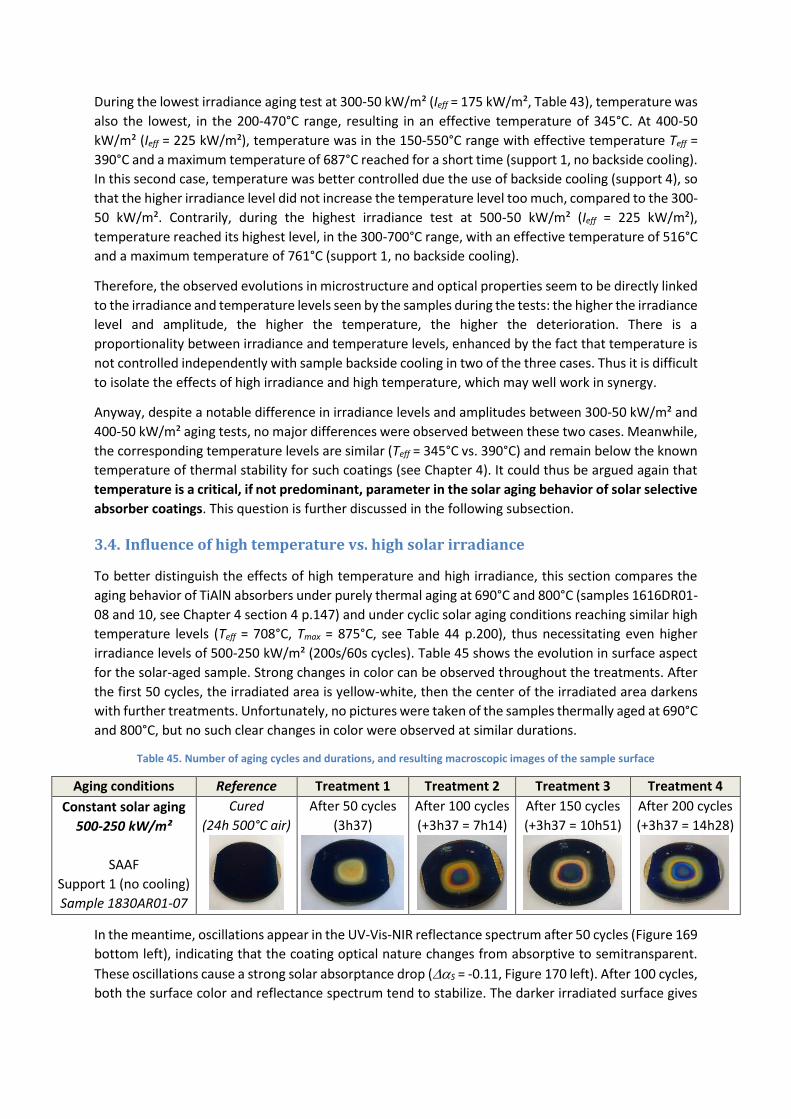
During the lowest irradiance aging test at 300-50 kW/m² (Ieff = 175 kW/m², Table 43), temperature was
also the lowest, in the 200-470°C range, resulting in an effective temperature of 345°C. At 400-50
kW/m² (Ieff = 225 kW/m²), temperature was in the 150-550°C range with effective temperature Teff =
390°C and a maximum temperature of 687°C reached for a short time (support 1, no backside cooling).
In this second case, temperature was better controlled due the use of backside cooling (support 4), so
that the higher irradiance level did not increase the temperature level too much, compared to the 300-
50 kW/m². Contrarily, during the highest irradiance test at 500-50 kW/m² (Ieff = 225 kW/m²),
temperature reached its highest level, in the 300-700°C range, with an effective temperature of 516°C
and a maximum temperature of 761°C (support 1, no backside cooling).
Therefore, the observed evolutions in microstructure and optical properties seem to be directly linked
to the irradiance and temperature levels seen by the samples during the tests: the higher the irradiance
level and amplitude, the higher the temperature, the higher the deterioration. There is a
proportionality between irradiance and temperature levels, enhanced by the fact that temperature is
not controlled independently with sample backside cooling in two of the three cases. Thus it is difficult
to isolate the effects of high irradiance and high temperature, which may well work in synergy.
Anyway, despite a notable difference in irradiance levels and amplitudes between 300-50 kW/m² and
400-50 kW/m² aging tests, no major differences were observed between these two cases. Meanwhile,
the corresponding temperature levels are similar (Teff = 345°C vs. 390°C) and remain below the known
temperature of thermal stability for such coatings (see Chapter 4). It could thus be argued again that
temperature is a critical, if not predominant, parameter in the solar aging behavior of solar selective
absorber coatings. This question is further discussed in the following subsection.
3.4. Influence of high temperature vs. high solar irradiance
To better distinguish the effects of high temperature and high irradiance, this section compares the
aging behavior of TiAlN absorbers under purely thermal aging at 690°C and 800°C (samples 1616DR01-
08 and 10, see Chapter 4 section 4 p.147) and under cyclic solar aging conditions reaching similar high
temperature levels (Teff = 708°C, Tmax = 875°C, see Table 44 p.200), thus necessitating even higher
irradiance levels of 500-250 kW/m² (200s/60s cycles). Table 45 shows the evolution in surface aspect
for the solar-aged sample. Strong changes in color can be observed throughout the treatments. After
the first 50 cycles, the irradiated area is yellow-white, then the center of the irradiated area darkens
with further treatments. Unfortunately, no pictures were taken of the samples thermally aged at 690°C
and 800°C, but no such clear changes in color were observed at similar durations.
Table 45. Number of aging cycles and durations, and resulting macroscopic images of the sample surface
Aging conditions Reference Treatment 1 Treatment 2 Treatment 3 Treatment 4
Constant solar aging
500-250 kW/m²
SAAF
Support 1 (no cooling)
Sample 1830AR01-07
Cured
(24h 500°C air)
After 50 cycles
(3h37)
After 100 cycles
(+3h37 = 7h14)
After 150 cycles
(+3h37 = 10h51)
After 200 cycles
(+3h37 = 14h28)
In the meantime, oscillations appear in the UV-Vis-NIR reflectance spectrum after 50 cycles (Figure 169
bottom left), indicating that the coating optical nature changes from absorptive to semitransparent.
These oscillations cause a strong solar absorptance drop (S = -0.11, Figure 170 left). After 100 cycles,
both the surface color and reflectance spectrum tend to stabilize. The darker irradiated surface gives

202
rise to a red-shift in spectral reflectance, causing an increase in solar absorptance, though not to its
initial level, as well as a large increase in thermal emittance after 200 cycles ( = +0.08, Figure 170).
Figure 169. Evolution of spectral reflectance with thermal aging at 690°C (top) vs. cyclic solar aging at 500-250 kW/m²
(Teff = 708°C) (bottom)
Figure 170. Relative evolutions of solar absorptance (left) and thermal emittance (right) under thermal aging at 690°C
and 800°C, and under cyclic solar aging at 500-250 kW/m² (Teff = 708°C)
These evolutions can be correlated to the changes in the material composition observed by EDS (Figure
171). The changes in color and optical properties are linked to a strong increase in the oxygen content,
that also tends to stabilize after 100 cycles.
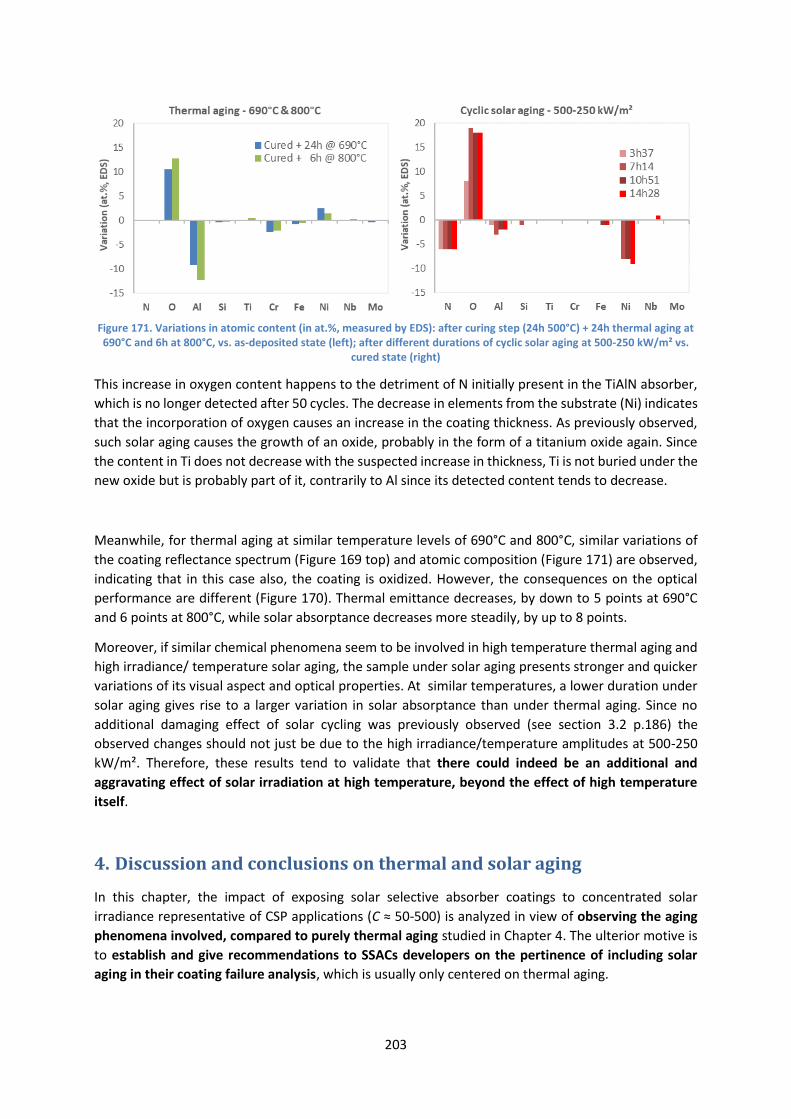
203
Figure 171. Variations in atomic content (in at.%, measured by EDS): after curing step (24h 500°C) + 24h thermal aging at 690°C and 6h at 800°C, vs. as-deposited state (left); after different durations of cyclic solar aging at 500-250 kW/m² vs.
cured state (right)
This increase in oxygen content happens to the detriment of N initially present in the TiAlN absorber,
which is no longer detected after 50 cycles. The decrease in elements from the substrate (Ni) indicates
that the incorporation of oxygen causes an increase in the coating thickness. As previously observed,
such solar aging causes the growth of an oxide, probably in the form of a titanium oxide again. Since
the content in Ti does not decrease with the suspected increase in thickness, Ti is not buried under the
new oxide but is probably part of it, contrarily to Al since its detected content tends to decrease.
Meanwhile, for thermal aging at similar temperature levels of 690°C and 800°C, similar variations of
the coating reflectance spectrum (Figure 169 top) and atomic composition (Figure 171) are observed,
indicating that in this case also, the coating is oxidized. However, the consequences on the optical
performance are different (Figure 170). Thermal emittance decreases, by down to 5 points at 690°C
and 6 points at 800°C, while solar absorptance decreases more steadily, by up to 8 points.
Moreover, if similar chemical phenomena seem to be involved in high temperature thermal aging and
high irradiance/ temperature solar aging, the sample under solar aging presents stronger and quicker
variations of its visual aspect and optical properties. At similar temperatures, a lower duration under
solar aging gives rise to a larger variation in solar absorptance than under thermal aging. Since no
additional damaging effect of solar cycling was previously observed (see section 3.2 p.186) the
observed changes should not just be due to the high irradiance/temperature amplitudes at 500-250
kW/m². Therefore, these results tend to validate that there could indeed be an additional and
aggravating effect of solar irradiation at high temperature, beyond the effect of high temperature
itself.
4. Discussion and conclusions on thermal and solar aging
In this chapter, the impact of exposing solar selective absorber coatings to concentrated solar
irradiance representative of CSP applications (C ≈ 50-500) is analyzed in view of observing the aging
phenomena involved, compared to purely thermal aging studied in Chapter 4. The ulterior motive is
to establish and give recommendations to SSACs developers on the pertinence of including solar
aging in their coating failure analysis, which is usually only centered on thermal aging.

204
As a forewarning, it is worth noticing that the analysis provided in this chapter is preliminary, as
unfavorable technical specificities are to be considered, so that complementary tests will be needed
for further validation. For instance, it was found that some of the sample series used for the different
tests were not all suitably equivalent in terms of their aging behavior, invalidating the comparison of
some of the conditions tested and the decorrelation of some of the sources of degradation, so that
these conditions would need to be tested again with more similar samples (see section 3.1 p.182). This
highlights the importance of ensuring that large series of perfectly equivalent samples are used, for
more comparable aging studies.
Also, in the current SAAF configuration the shutter aperture is the regulated parameter, as a way to
control the solar irradiance seen by the sample. This irradiance is only estimated (based on previous
calibrations) from the DNI measured at the beginning of the test, although DNI may evolve during the
test. Therefore, irradiance is not perfectly regulated, nor is it actually measured. This renders difficult
the control of the sample temperature during aging tests, as seen in the irregular temperature profiles
presented in this chapter. This is particularly true in this study, since in many cases no backside cooling
could be applied due to the shape and size of the samples, that were not adapted to the sample holders
available at the time. This is why a new sample holder easily adaptable to different shapes and sizes of
samples was developed and will be used in further studies, providing the possibility of backside cooling
in all cases, to help with temperature regulation. In parallel, a new SAAF configuration considering the
sample temperature as the main regulated parameter was also designed and is under development. It
would provide a better control of the temperature profiles imposed on the samples. The comparison
of both configurations would help decorrelating the effect of irradiance and temperature.
Moreover, due to incompatible size constraints imposed by the previous sample holders and by the IR
spectrophotometer, the IR spectral reflectance in the irradiated area could not be measured in this
study, and the evolution of thermal emittance during solar aging is not followed. Thus the conclusions
provided here are based solely on the evolution of solar absorptance, which is the main optical
parameter for absorber coatings but does not hold information about their selectivity. With the new
sample support, smaller samples can be tested, so that this limitation will no longer apply.
Finally, the measurement of sample temperature during solar aging also proved tricky. Indeed, SAAF
temperature measurement relies on pyrometry, based on the detection of the irradiance emitted by
the hot sample surface around 5 µm. Therefore, low temperatures below 250°C cannot be measured
because the emission from the sample at this wavelength is too low, especially since by design solar
selective absorber coatings have a low IR emittance. This gives rise to low signal-to-noise ratios that
introduce high uncertainties on the measurement of surface temperature by pyrometry. Also, as
mentioned the IR emittance could not be measured in the irradiated area after the aging tests, so the
emittance implemented in the pyrometer after the first treatment is not the actual emittance of the
sample. In addition, the sample emittance can evolve during the aging test itself, causing a drift in the
value of temperature given by the pyrometer, compared to its actual value. This effect is clearly visible
in Table 44 p.200 (treatment 2) where the maximum temperature read by the pyrometer increases
while the one read by the backside thermocouple remains stable. To estimate the uncertainties
brought on by these approximations, values of temperature directly given by the pyrometer using the
initial emittance as input (e.g. 0(5 µm) = 0.219 for sample 1830AR01-07) were compared to corrected
values (see correction method in Annex 2.1 p.235) considering the emittance measured on the sample
cut after all treatments were applied (4(5 µm) = 0.288): an overestimation of more than 100°C was
thus determined. Additional thermocouples were implemented but for obvious reasons they cannot
measure the actual temperature of the surface in the irradiated area, so they only give access to an
underestimated value of temperature.

205
Therefore, the temperature profiles provided in this chapter remain approximative. In the future, a
solar-blind pyroreflectometry system developed in PROMES-CNRS will be implemented for a more
accurate evaluation of surface temperature during SAAF solar aging tests, as it does not rely on the
knowledge of the material emittance [334]. Preliminary adaptations of this technique to the SAAF
facility have been developed during the SFERA-III EU project, including suitable optics and mechanical
supports.
Keeping in mind these practical limitations when analyzing the experimental results obtained in this
chapter, some preliminary conclusions can be drawn from this first study.
Under concentrated solar aging, high UV-Vis-NIR solar irradiance levels are reached, irradiating the
materials with photons of much higher energy and flux than under IR thermal aging (see section 2.1.2
p.174). Such high irradiance levels could thus give rise to rapid changes in the material microstructure
due to photon-matter interactions, that are not accessible with thermal aging. For instance, based on
bond dissociation energies in diatomic molecules (𝐴 − 𝐵 → 𝐴 + 𝐵) and lattice binding energies in
crystals [335], energies higher than 3.1 eV (i.e., UV wavelengths below 0.4 µm) are necessary to cause
most of these reactions at ambient temperature. In CSP technologies, concentrating optics tend to
reduce the UV photon flux but the latter remains high (typically 0.5 to 5 kW/m², see Table 29 p.178),
thus probably allowing for lattice rearrangements, especially since the absorber coatings are designed
to absorb as much of the incident solar radiation as possible.
Moreover, when absorbing such high solar flux densities, the materials necessarily heat up to reach
high levels of temperature. In CSP technologies, part of this heat is extracted by the heat transfer fluid
flowing below the absorber. In solar aging facilities, it can be partly extracted using backside cooling.
Nevertheless, in both cases the actual temperature profile seen by the absorber coating remains hard
to control and regulate, due to high level of incident energy flux provided by solar concentration,
compared to the slower heat extraction by convective exchange with the HTF or cooling fluid. So in
addition to high irradiance, absorbers are unavoidably subjected to high temperatures as well.
Therefore, when applying concentrated solar aging, it can be difficult to decorrelate the effects of
irradiance and temperature, but their combined effect can be assessed.
Overall, compared to purely thermal aging at similar temperatures, the combination of high irradiance
levels (i.e., high photon and energy fluxes) and high temperature seems to have a stronger and faster
effect on the optical performance of the aged absorbers, especially when applying temperatures
higher than the critical temperature of the materials. Similar aging phenomena were observed in both
cases, such as oxygen incorporation and oxide growth, but there could be a synergistic effect between
the two sources of degradation, facilitating atomic rearrangements in the material lattice and
accelerating such aging phenomena. Indeed, combining the vibrational energy provided by high
temperature with the energy conceded to the lattice via energetic photon-matter interactions, it
becomes easier and faster to overcome the energy barriers related to such material evolutions,
compared to the energy provided by slow thermal transfers in electrical furnaces.
A simple illustration of this synergy hypothesis lies in the fact that, in some conditions under solar
aging, visual changes to the coating surface were observed (strong discoloring in the irradiated area)
after only a few hours of aging, when testing at similar temperatures for longer durations under
thermal aging did not cause similar evolutions.
206
Another validation could also be found in the fact that constant solar aging seems to act faster and
more strongly than cyclic solar aging with similar high irradiance level. Due to the additional lower
irradiance phase, the effective (time-weighted) irradiance seen by the tested materials is higher under
constant aging. Since this parameter (in kW/m²) is directly linked to the incident photon flux (in
photons/m²/s) and energy flux (in J/m²/s, with 1 W ≡ 1 J/s), a higher incident photon flux modifies the
coating surface more quickly during the first stages of aging, causing an overall acceleration of aging.
In this light, it seems that concentrated solar aging representative of CSP applications provide
additional photonic phenomena that may occur at a small physical and time scale (e.g. A°-nm, < s).
Due to the energy fluxes involved, they may not be energetic enough to have a large-scale effect on
their own. Combined to high temperature, these photonic phenomena mostly seem to promote and
accelerate the thermally-induced aging phenomena obtained when applying purely thermal aging,
without changing their nature and effects at a more “macroscopic” physical and time scale (e.g. µm-
mm, hour).
Applying purely thermal aging tests could therefore be sufficient for coating developers in a first
approach, provided they are applied at sufficient (representative or accelerated) temperature levels,
pertinent working atmosphere and representative durations (several hundreds of hours). Indeed, such
aging protocols easily allow investigating the effects of temperature, which is a driving parameter for
aging, controlling thermally-induced aging phenomena typical for SSACs, such as oxidation and atomic
diffusion.
Despite its more complex implementation, solar aging remains nonetheless a recommendable step
in the study of the durability of solar selective absorber coatings, as it provides more representative
aging conditions, close to the aimed CSP applications, that provoke additional and possibly synergistic
effects in combination with high temperature. For the analysis of their impact to be more pertinent
and valuable, these solar conditions must be as controlled and repeatable as possible, and applied for
as long durations as possible, which is more time and resource consuming than simple thermal aging.

207
General conclusions
As exposed in the first chapter of this thesis, to tackle climate change in a context of ever-expanding
energy demand, concentrated solar power (CSP) technologies have been identified as a promising
renewable source for heat and electricity generation. These technologies are based on the
concentration of the incident solar radiation with mirrors on a solar absorber, inside which flows a heat
transfer fluid. This solar absorber must have a high optical performance, achieved through spectral
selectivity, i.e., high solar absorptance S and low infrared thermal emittance (T), to ensure high solar-
to-heat conversion efficiency. Selectivity is obtained with solar selective absorber coatings or SSACs
(e.g. S = 0.95, (400°C) = 0.10) deposited on metallic receivers. To increase the global efficiency of CSP
technologies and guarantee its deployment, high working temperatures (400-800°C) are desirable,
ideally in air to further reduce costs.
Thus as examined in the second chapter, SSACs are subjected to many interconnected sources of
degradation (e.g. solar radiation with high flux including UV, high temperatures, thermal cycling,
thermal shocks, oxidant/corrosive atmospheres) inducing complex aging phenomena (e.g. diffusion,
oxidation, cracking, fatigue-creep) able to degrade their thermo-optical performance. Therefore, their
aging behavior (thermal stability, durability) must be thoroughly investigated before they can be
implemented in CSP applications. However, after analyzing the literature related to SSACs aging
behavior, it was found that the majority of current aging procedures simply consisted in conservative
laboratory tests, applying thermal aging in electrical furnaces at moderate temperatures in air or
higher temperatures but in vacuum, for rather short durations and without thermal cycling, thus not
representative of CSP applications. Also, to this day there is no standardized procedure to evaluate the
aging behavior and durability of high temperature SSACs.
After establishing these first assessments based on an extensive literature review, this thesis work
developed an experimental study that, in an original manner compared to other studies:
1. was not centered on the analysis of a single type of SSAC that would aim at estimating its reliability
and durability. Instead, here three different types of new high temperature air-stable SSACs
developed by collaborators (TiAlN and WAlSiN tandem absorber and W/SiC:H multilayer absorber
coatings) were considered, with the objective of revealing more general trends regarding the aging
behavior of SSACs, and thus draw conclusions on the pertinence of the applied aging procedures
themselves, instead of on the suitability of the coatings;
2. investigated the application of typical aging procedures found in the literature for the study of
SSACs, using an electrical furnace, i.e., only based on purely thermal aging, in order to establish if
these procedures are well-suited in a first approach to assess the aging behavior and durability of
SSACs, and how to improve them, thus providing general recommendations to coating developers
for their more pertinent application;
3. additionally investigated alternative and original aging procedures for SSACs, more representative
of their working conditions in CSP applications, i.e., solar aging tests under concentrated solar
irradiation in a dedicated solar accelerated aging facility (SAAF) installed at the focal point of a solar
furnace, with the objective of understanding the specific impact on SSACs of several solar aging
parameters, e.g. linked incident solar irradiance and sample temperature profiles, or the additional
application of rapid thermal cycling.

208
4. compared the impact of purely thermal aging vs. concentrated solar aging (solar + thermal), to
give insight on the additional impact of the exposure to concentrated solar irradiance at medium-
high temperature, in order to give recommendations to coating developers about the necessity to
include concentrated solar aging protocols in the durability assessment of their coatings;
5. gathered in-depth knowledge on the separate impact and possible synergy between the main
sources of degradation affecting SSACs, by decorrelating and/or confronting the observed effects
of the different aging parameters accessible;
6. had for ultimate view to propose valuable information to help in evaluating the possibility and
potential establishment of a standardized global aging procedure for SSACs.
The main conclusions that can be drawn from this original experimental study are the following, and
can serve as recommendations for coating developers:
1. As a mandatory first step to evaluate the aging behavior of a type of SSAC, large sets of equivalent
samples should be considered, as far as the repeatability of the manufacturing process allows, in
order to apply and compare the effects of several aging conditions on several samples for each
condition, and obtain more reliable conclusions. A good equivalence between samples can typically
be understood as architectures (in terms of nature and thickness of substrate and coating layers)
that are identical or as close as possible, a variation in solar absorptance of 1 point or less (S ≤
0.01), and a variation in thermal emittance of 3 points or less ( ≤ 0.03, as the coatings solar-to-
heat conversion efficiency is less sensitive to thermal emittance); in any case, the variation in optical
performance with aging should be considered relatively to the reference state of a given sample
(e.g. S = S (aged) – S (as-deposited)).
2. Also, adequate characterizations of the SSACs materials before and after aging must be carried
out to observe and draw conclusions on the aging behavior, including at least:
2.1. spectral optical properties, in particular hemispherical spectral reflectance, at least in the
main UV-Vis-NIR solar range (0.28 – 2.5 µm) to estimate solar absorptance, preferably in the
larger and more pertinent UV-MIR “solar selective range” (at least 0.28 – 25 µm), to also
estimate thermal emittance and solar-to-heat conversion efficiency, which is the most
significant criterion for optical performance. This allows following a potential degradation in
performance that would have a direct impact on the global efficiency of the aimed CSP
application.
2.2. macroscopic pictures of the surface after each aging step, to keep track of their visual aspect
and quickly link it to the other observed evolutions. For instance, a darkening visible to the
naked eye can often easily be linked to an increase in solar absorptance. This is a useful and
easily accessible information, helpful in the follow-up of the aging behavior. Ideally, these
pictures should be taken in a specific photographic studio set-up to avoid parasite reflections
on the partially reflective surface.
2.3. material composition, at least to follow the global content in elements (e.g. EDS or WDS),
ideally to follow their spatial distribution in the coating (e.g. RBS or XPS depth profiles), as
well as material surface state, at least to observe major evolutions in microstructure such as
cracks or delamination (e.g. optical microscopy, SEM), preferably also to observe evolutions
in surface roughness (e.g. AFM, profilometry) which directly influences optical properties. This
so as to unveil the aging phenomena at play and understand their consequences on the
evolution of the SSACs optical performance.
209
3. As a mandatory second step, purely thermal aging protocols must be implemented:
3.1. First, short duration thermal aging (typically up to 24h) can be applied at different
temperatures around or above the aimed working temperature, and in the aimed atmosphere
(air or vacuum), depending on the intended CSP technology. This type of test is often applied by
coating developers as it is easy to implement and gives access to valuable information about the
absorber aging behavior (e.g. its critical temperature). It often causes slight coating
densification and/or oxidation, that can equally result in an improvement or a degradation of
the coating optical performance, because spectral optical properties (optical indices and
reflectance) are very sensitive to small variations in thickness and composition. For instance,
the incorporation of oxygen may change the coating optical behavior from absorptive to
semitransparent, causing reflectance minima and maxima to appear due to multiple reflections
at the coating interfaces. These oscillations increase in frequency and amplitude as the coating
thickness increases, so that there is a red-shift of the reflectance spectrum, strongly impacting
both solar absorptance and thermal emittance values. If the optical performance improves with
short duration aging (typically 24h), it can be considered as the final curing step of the
fabrication process, instead of an indication of the coating aging behavior. In any case, short
duration thermal aging does not provide sufficient information in itself and the performance
evolution trend must be validated by longer duration thermal aging.
3.2. As a mandatory next step, long duration thermal aging (typically above 100h and up to several
thousands of hours) at or near the aimed working temperature should be applied to confirm
the trends observed at short durations while giving enough time to the coating to stabilize its
aging behavior. This should preferably be applied in short steps (12-24h) cumulatively on the
same samples to better follow the evolution of the coating optical performance and generate
slow thermal cycling closer to the CSP application, compared to constant thermal aging. If
possible, long aging durations exceeding several hundreds of hours should be reached, as
several stages of aging may appear with time, due to the different kinetics of the aging
phenomena at play (e.g. the slow outward diffusion of metallic elements from the substrate and
their subsequent surface oxidation may cause surface defects to appear late in the aging
process). Optionally, the comparison of aging tests in different atmospheres can help
decorrelate competing or synergistic phenomena (e.g. vacuum tests to prevent oxidation
processes and better observe the effect of atomic diffusion on the optical performance of the
coatings). In any case, this type of aging test gives a first idea of the long-term thermal stability
of SSACs.
3.3. As an optional but advised next step, to evaluate SSACs durability, long duration thermal aging
at several accelerated temperatures above the aimed working temperature (max. 200-300°C
higher) and close to one another may be applied. These tests can usually save time and
resources by avoiding very long duration testing at the aimed working temperature, as they can
accelerate thermally-induced aging phenomena without changing their nature. They may also
give access to the activation energies of aging/degradation phenomena, that can sometimes be
used to predict the lifetime of the coating at working temperature. However, when degradation
is ruled by slow reactions, the attainable acceleration of aging is limited and very long durations
at accelerated temperatures (e.g. > 1000h) must be applied anyway if one is to establish the
SSACs lifetime and durability. Since accelerated aging protocols can be heavy to implement and
cannot guarantee lifetime prediction, a cost/benefit analysis is to be considered in their
implementation.
210
4. As an optional but highly recommended third step, concentrated solar aging can be attempted to
test the SSACs behavior in conditions more representative of CSP applications (high photon and
energy fluxes in the solar range, high heating and cooling rates, etc.), provided suitable facilities are
accessible (e.g. solar furnace or high flux solar simulator). Very long durations are not reasonably
attainable (due to solar intermittence in solar furnaces or high cost of solar-like lamps in
simulators), still such tests provide valuable information on the SSACs aging behavior in more
realistic conditions, for instance:
4.1. In concentrated solar aging, high incident solar irradiance is indissociable from high surface
temperature levels, even when heat is partly extracted on the absorber backside. It is thus not
an adapted method to decorrelate the effects of these two sources of degradation, but instead
it reveals their combined effect. The comparison of purely thermal aging and concentrated solar
aging highlights that temperature remains a driving parameter for aging, as it controls
thermally-induced aging phenomena, but concentrated solar irradiance gives rise to additional
photonic phenomena promoting and accelerating thermally-induced aging phenomena, by
facilitating atomic rearrangements in the material lattice. In a first approach, purely thermal
aging at appropriate temperatures may thus be sufficient to assess SSACs global aging
tendencies, but complementary concentrated solar aging tests are advisable, as they reveal the
synergistic effects between high solar irradiance and high temperature, possibly accelerating
SSACs aging in real CSP conditions.
4.2. Comparing constant solar aging (typical of stable sunny weather) with short period cyclic solar
aging consisting in alternating high and low irradiance phases (typical of cloudy spells), rapid
solar/thermal cycling with the same high irradiance level does not provide additional
deterioration as it in fact reduces the effective temperature/irradiance seen by the materials,
so that they are exposed to lower photon and energy fluxes, hindering the abovementioned
synergistic effects.
5. In all cases, the distinction between aging and degradation must be kept in mind, since an
evolution in surface aspect or chemical composition of the SSACs does not necessary lead to a
deterioration of their optical performance. In fact, the relationship between physicochemical
aging phenomena (e.g. oxidation, atomic diffusion, cracks) and their consequences on SSACs
surface optical properties is quite complex and hard to predict. Indeed, the performance of solar
selective absorber coatings (solar absorptance, thermal emittance, solar-to-heat conversion
efficiency) intrinsically derives from spectral behaviors (optical indices, reflectance) which are
highly sensitive to small changes in the coating chemical/optical nature (e.g. an absorptive nitride
or carbide becoming semitransparent when oxidized) and thickness (e.g. an increase in thickness
causes a reflectance red-shift increasing thermal emittance). Thus for instance, if it is relatively
simple to determine separately the activation energy of an oxidation phenomenon, determining
the activation energy leading to a drop in optical performance is not at all straightforward,
especially since several aging phenomena are often at play, often with different kinetics, possibly
with synergistic or competing effects. For this reason, a reliable lifetime prediction for SSACs is
often hard to obtain.

211
6. Finally, if such general recommendations about desirable aging procedures can be established, due
to the multiplicity of SSACs architectures and materials explored by coating developers, as well as
the variety of CSP technologies, to this day it remains difficult to propose a unique aging scheme
for SSACs with fixed temperature levels and aging durations. As a start, distinct schemes per type
of CSP technology would be better suited, fixing in each case a typical working temperature, to
determine temperature levels for purely thermal aging protocols (point 3), as well as a typical solar
concentration ratio, to determine concentrated irradiance levels for solar aging protocols (point 4).
Beyond these first recommendations, and in order to complete them, the following paths could be
explored, among many possibilities:
1. regarding purely thermal aging:
1.1. since the adsorption of water molecules at the coating surface could enhance and accelerate
oxidation/corrosion phenomena, the specific effect of humid air at high temperature could
be studied, thanks to: i) the comparison of aging behaviors on equivalent samples under
ambient air and air filtered from CO2 and H2O (tests are underway); ii) the implementation of
the full configuration of ALTHAIA facility, which allows controlling the content in water vapor
(absolute humidity) contained in the air flow introduced in the low pressure reactor (Figure
91 p.106), so that in addition to the impact of the presence of humidity (compared to dry air
tests), the specific impact of the humidity level (water vapor content) could be studied.
1.2. additional sources of degradation could be applied in combination with high temperature,
for instance air pollutants typically found in the atmosphere, with known corrosive effects
(e.g. NOx compounds), as may be encountered in real CSP conditions.
2. regarding concentrated solar aging, complementary aging tests in SAAF facility could be applied:
2.1. including: i) a more reliable and accurate measurement of sample surface temperature in the
irradiated area, not relying on the knowledge of its spectral emittance; ii) the direct and
independent regulation of temperature for all tested samples, whatever their dimensions; ii)
the follow-up of the thermal emittance of the aged samples in addition to their solar
absorptance. All this thanks to the implementation of: i) an in-situ solar-blind
pyroreflectometry set-up; ii) another SAAF configuration previously developed for solar
curing; iii) the new adaptable sample support developed during this thesis (support 4).
2.2. in all cases, for longer durations than the typical 10 to 15h applied in this work, to better
validate the aging tendencies observed, at least reaching 24h to compare with typical thermal
aging. One must keep in mind that longer durations (e.g. 100h) would mobilize too much time
and resources to be realistic, except if only one aging condition is pursued.
2.3. to further isolate the specific effect of rapid solar/thermal cycling, that was here masked by
the predominant influence of the effective irradiance and photon/energy fluxes, cyclic vs.
constant solar aging tests with same effective irradiance could be applied on remaining TiAlN
absorber samples (e.g. constant 250 kW/m² vs. cyclic 265-200 kW/m² with 200s/60s cycles).

212
Also, further theoretical and experimental studies would be needed to investigate the apparent
coupling and synergy between thermal and photonic effects in CSP applications, compared with purely
thermal effects. This is particularly relevant since most aging studies for solar absorbers are conducted
in electrical furnaces without the presence of solar photons.
3. regarding other types of aging, for instance:
3.1. thermomechanical aging protocols at similar temperature levels than the ones used in purely
thermal aging could be investigated, such as fatigue-creep tests with realistic or accelerated
mechanical loads compared to the ones encountered in real CSP applications, for instance to
account for the presence of a pressurized heat transfer fluid inside the solar receiver, for
constraints induced by mismatched thermal expansion coefficients between the different
materials of the receiver and coatings, etc. (see Chapter 2);
3.2. depending on the CSP technology, the absorber coatings may not be protected from other
mechanical degradation phenomena such as particle erosion in sandy implantation sites,
thus their resistance to such sources of degradation could also be tested, using existing
facilities usually dedicated to the weathering of concentrating mirrors.
4. Last but not least, the conclusions drawn when applying all the abovementioned aging protocols
would need to be confronted with the real aging behavior of materials that have actually been
used in CSP plants for long durations, in order to validate or reorient them. However, this is
rendered difficult by the fact that: i) most SSACs coatings are currently under development, aiming
at higher temperature and stability in air, thus will not be used in real CSP installations unless they
have first proven their suitability in laboratory aging test conditions; ii) current commercial SSACs
in operation could be considered instead, but their working conditions are less demanding
(typically, they are operated under vacuum up at 400-580°C or in ambient air below 350°C) and in
any case CSP plant operators do not usually share or even collect any information on their aging.
Overall, out of this original thesis work a better understanding and larger view of the general aging
behavior of solar selective absorber coatings for high temperature CSP have been gathered, to provide
recommendations for more pertinent and global aging procedures, in view of including these
recommendations in the potential establishment of a broadly applicable test standard for the
investigation and prediction of the thermal stability and durability of these absorber coatings, thus
guaranteeing their reliability in real CSP operation and helping in the deployment of CSP technologies
for heat and electricity generation.
213
References
[1] J. Abermann, B. Hansen, M. Lund, S. Wacker, M. Karami, J. Cappelen, Hotspots and key periods of Greenland climate change during the past six decades, Ambio. 46 (2017) 3–11. https://doi.org/10.1007/s13280-016-0861-y.
[2] N. US Department of Commerce, Global Monitoring Laboratory - Global Greenhouse Gas Reference Network. https://www.esrl.noaa.gov/gmd/ccgg/trends/global.html (accessed April 20, 2020).
[3] C. Le Quéré, R.B. Jackson, M.W. Jones, A.J.P. Smith, S. Abernethy, R.M. Andrew, A.J. De-Gol, D.R. Willis, Y. Shan, J.G. Canadell, P. Friedlingstein, F. Creutzig, G.P. Peters, Temporary reduction in daily global CO 2 emissions during the COVID-19 forced confinement, Nature Climate Change. 10 (2020) 647–653. https://doi.org/10.1038/s41558-020-0797-x.
[4] CO2 Emissions from Fuel Combustion 2017, IEA Webstore. https://webstore.iea.org/co2-emissions-from-fuel-combustion (accessed April 20, 2020).
[5] Installed electricity capacity globally by source 2017, Statista. https://www.statista.com/statistics/267358/world-installed-power-capacity/ (accessed April 20, 2020).
[6] Market Report Series: Renewables 2017 – Analysis, IEA. https://www.iea.org/reports/renewables-2017 (accessed April 20, 2020).
[7] Technology Roadmap - Solar Thermal Electricity 2014, IEA Webstore. https://webstore.iea.org/technology-roadmap-solar-thermal-electricity-2014 (accessed April 20, 2020).
[8] Key World Energy Statistics 2017. https://www.oecd-ilibrary.org/energy/key-world-energy-statistics-2017_key_energ_stat-2017-en (accessed April 20, 2020).
[9] Global Solar Atlas. https://globalsolaratlas.info/download/world (accessed April 20, 2020). [10] Grid Energy Storage - December 2013, Energy.Gov. https://www.energy.gov/oe/downloads/grid-
energy-storage-december-2013 (accessed April 27, 2020). [11] E. González-Roubaud, D. Pérez-Osorio, C. Prieto, Review of commercial thermal energy storage in
concentrated solar power plants: Steam vs. molten salts, Renewable and Sustainable Energy Reviews. 80 (2017) 133–148. https://doi.org/10.1016/j.rser.2017.05.084.
[12] T. Okazaki, Electric thermal energy storage and advantage of rotating heater having synchronous inertia, Renewable Energy. 151 (2020) 563–574. https://doi.org/10.1016/j.renene.2019.11.051.
[13] Renewable Capacity Statistics 2019, /Publications/2019/Mar/Renewable-Capacity-Statistics-2019. /publications/2019/Mar/Renewable-Capacity-Statistics-2019 (accessed April 20, 2020).
[14] A. Ummadisingu, M.S. Soni, Concentrating solar power – Technology, potential and policy in India, Renewable and Sustainable Energy Reviews. 15 (2011) 5169–5175. https://doi.org/10.1016/j.rser.2011.07.040.
[15] J.I. Burgaleta, S. Arias, D. Ramirez, GEMASOLAR, THE FIRST TOWER THERMOSOLAR COMMERCIAL PLANT WITH MOLTEN SALT STORAGE, 9.
[16] R. Osuna, R. Olavarría, R. Morillo, M. Sánchez, F. Cantero, V. Fernández-Quero, P. Robles, F. Cerón, J. Talegón, M. Romero, F. Téllez, D. Martínez, A. Valverde, R. Monterreal, R. Pitz-Paal, G. Brakmann, V. Ruiz, M. Silva, P. Menna, PS10, CONSTRUCTION OF A 11MW SOLAR THERMAL TOWER PLANT IN SEVILLE, SPAIN, 9.
[17] Review of commercial thermal energy storage in concentrated solar power plants: Steam vs. molten salts | Request PDF, ResearchGate. https://www.researchgate.net/publication/317266822_Review_of_commercial_thermal_energy_storage_in_concentrated_solar_power_plants_Steam_vs_molten_salts (accessed April 20, 2020).
[18] (PDF) Thermodynamic Assessment of Steam-Accumulation Thermal Energy Storage in Concentrating Solar Power Plants, ResearchGate.

214
https://www.researchgate.net/publication/335543160_Thermodynamic_Assessment_of_Steam-Accumulation_Thermal_Energy_Storage_in_Concentrating_Solar_Power_Plants (accessed April 20, 2020).
[19] R. Lahlou, P.R. Armstrong, N. Calvet, A.H. Slocum, T. Shamim, Testing of a secondary concentrator integrated with a beam-down tower system under non-liquid cooling strategies, in: Santiago, Chile, 2018: p. 170007. https://doi.org/10.1063/1.5067171.
[20] Z.-J. Zheng, M.-J. Li, Y.-L. He, Optimization of Porous Insert Configuration in a Central Receiver Tube for Heat Transfer Enhancement, Energy Procedia. 75 (2015) 502–507. https://doi.org/10.1016/j.egypro.2015.07.439.
[21] G. Tiryaki, U. Camdali, ENERGY AND EXERGY ANALYSIS OF A SOLAR POWER TOWER SYSTEM WITH A CAVITY RECEIVER, 2017.
[22] G. Barreto, P. Canhoto, M. Collares-Perreira, Modelling and optimisation of porous volumetric receivers in point-focus solar concentration systems, 2020. https://doi.org/10.13140/RG.2.2.24082.81605.
[23] G.K. Manikandan, S. Iniyan, R. Goic, Enhancing the optical and thermal efficiency of a parabolic trough collector – A review, Applied Energy. 235 (2019) 1524–1540. https://doi.org/10.1016/j.apenergy.2018.11.048.
[24] E. Setien, R. López-Martín, L. Valenzuela, Methodology for partial vacuum pressure and heat losses analysis of parabolic troughs receivers by infrared radiometry, Infrared Physics & Technology. 98 (2019) 341–353. https://doi.org/10.1016/j.infrared.2019.02.011.
[25] G. Espinosa-Rueda, J.L. Navarro Hermoso, N. Martínez-Sanz, M. Gallas-Torreira, Vacuum evaluation of parabolic trough receiver tubes in a 50MW concentrated solar power plant, Solar Energy. 139 (2016) 36–46. https://doi.org/10.1016/j.solener.2016.09.017.
[26] W. Platzer, C. Hildebrandt, 15 - Absorber materials for solar thermal receivers in concentrating solar power (CSP) systems, in: K. Lovegrove, W. Stein (Eds.), Concentrating Solar Power Technology, Woodhead Publishing, 2012: pp. 469–494. https://doi.org/10.1533/9780857096173.3.469.
[27] A. Vouros, E. Mathioulakis, E. Papanicolaou, V. Belessiotis, On the optimal shape of secondary reflectors for linear Fresnel collectors, Renewable Energy. 143 (2019) 1454–1464. https://doi.org/10.1016/j.renene.2019.05.044.
[28] R. Abbas, A. Sebastián, M.J. Montes, M. Valdés, Optical features of linear Fresnel collectors with different secondary reflector technologies, Applied Energy. 232 (2018) 386–397. https://doi.org/10.1016/j.apenergy.2018.09.224.
[29] Introduction to Solar Radiation. https://www.newport.com/t/introduction-to-solar-radiation (accessed May 28, 2020).
[30] C. Gueymard, Simple Model for the Atmospheric Radiative Transfer of Sunshine (SMARTS2) Algorithms and performance assessment, FSEC-PF-270-95, 84.
[31] Solar Spectral Irradiance: Air Mass 1.5. https://rredc.nrel.gov/solar//spectra/am1.5/ (accessed April 22, 2020).
[32] C.A. Gueymard, D. Myers, K. Emery, PROPOSED REFERENCE IRRADIANCE SPECTRA FOR SOLAR ENERGY SYSTEMS TESTING, 25.
[33] C. Cintolesi, Large-eddy simulations of conjugate heat transfer with evaporation-condensation and thermal radiation, 2016. https://doi.org/10.13140/RG.2.2.11113.70246.
[34] Soum-Glaude A, Le Gal A, Bichotte M, Escape C, Dubost L, Optical characterization of TiAlNx/TiAlNy/Al2O3 tandem solar selective absorber coatings, Sol. Energy Mater. Sol. Cells. 170 (2017) 254–262. https://doi.org/10.1016/j.solmat.2017.06.007.
[35] A. Dan, A. Soum-Glaude, A. Carling-Plaza, C.K. Ho, K. Chattopadhyay, H.C. Barshilia, B. Basu, Temperature- and Angle-Dependent Emissivity and Thermal Shock Resistance of the W/WAlN/WAlON/Al2O3-Based Spectrally Selective Absorber, ACS Appl. Energy Mater. 2 (2019) 5557–5567. https://doi.org/10.1021/acsaem.9b00743.

215
[36] A. Boubault, B. Claudet, O. Faugeroux, G. Olalde, J.-J. Serra, A numerical thermal approach to study the accelerated aging of a solar absorber material, Solar Energy. 86 (2012) 3153–3167. https://doi.org/10.1016/j.solener.2012.08.007.
[37] C.E. Kennedy, Review of Mid- to High-Temperature Solar Selective Absorber Materials, 2002. https://doi.org/10.2172/15000706.
[38] R. Winston, Solar Selective Surfaces. By O. P. Agnihotri and B. K. Gupta, Applied Optics. 21 (1982) 292.
[39] Silicone-based thickness insensitive spectrally selective (TISS) paints as selective paint coatings for coloured solar absorbers (Part I) - ScienceDirect. https://www.sciencedirect.com/science/article/abs/pii/S0927024806003485 (accessed March 13, 2022).
[40] I.E. Khodasevych, L. Wang, A. Mitchell, G. Rosengarten, Micro- and Nanostructured Surfaces for Selective Solar Absorption, Advanced Optical Materials. 3 (2015) 852–881. https://doi.org/10.1002/adom.201500063.
[41] C. Heine, R.H. Morf, Submicrometer gratings for solar energy applications, Appl. Opt. 34 (1995) 2476–2482. https://doi.org/10.1364/AO.34.002476.
[42] S.C. Baker‐Finch, K.R. McIntosh, Reflection of normally incident light from silicon solar cells with pyramidal texture, Progress in Photovoltaics: Research and Applications. 19 (2011) 406–416. https://doi.org/10.1002/pip.1050.
[43] V. Magnin, J. Harari, M. Halbwax, S. Bastide, D. Cherfi, J.-P. Vilcot, Angle-dependent ray tracing simulations of reflections on pyramidal textures for silicon solar cells, Solar Energy. 110 (2014) 378–385. https://doi.org/10.1016/j.solener.2014.09.025.
[44] M. Bichotte, T. Kämpfe, W. Iff, F. Celle, S. Reynaud, D. Jamon, T. Pouit, A. Soum-Glaude, A. Keilany, L. Dubost, Y. Jourlin, Diffractive gratings to improve TiAlN based spectrally selective solar absorbers, AIP Conference Proceedings. 2033 (2018) 040007. https://doi.org/10.1063/1.5067043.
[45] N. Nguyen-Huu, Y.-L. Lo, Control of Infrared Spectral Absorptance With One-Dimensional Subwavelength Gratings, J. Lightwave Technol. 31 (2013) 2482–2490.
[46] B.J. Lee, L.P. Wang, Z.M. Zhang, Coherent thermal emission by excitation of magnetic polaritons between periodic strips and a metallic film, Opt. Express, OE. 16 (2008) 11328–11336. https://doi.org/10.1364/OE.16.011328.
[47] Y.X. Yeng, M. Ghebrebrhan, P. Bermel, W.R. Chan, J.D. Joannopoulos, M. Soljačić, I. Celanovic, Enabling high-temperature nanophotonics for energy applications, Proc. Natl. Acad. Sci. U.S.A. 109 (2012) 2280–2285. https://doi.org/10.1073/pnas.1120149109.
[48] V. Rinnerbauer, S. Ndao, Y. Xiang Yeng, J.J. Senkevich, K.F. Jensen, J.D. Joannopoulos, M. Soljačić, I. Celanovic, R.D. Geil, Large-area fabrication of high aspect ratio tantalum photonic crystals for high-temperature selective emitters, Journal of Vacuum Science & Technology B. 31 (2012) 011802. https://doi.org/10.1116/1.4771901.
[49] J. Hao, J. Wang, X. Liu, W.J. Padilla, L. Zhou, M. Qiu, High performance optical absorber based on a plasmonic metamaterial, Appl. Phys. Lett. 96 (2010) 251104. https://doi.org/10.1063/1.3442904.
[50] X. Liu, T. Tyler, T. Starr, A.F. Starr, N.M. Jokerst, W.J. Padilla, Taming the blackbody with infrared metamaterials as selective thermal emitters, Phys. Rev. Lett. 107 (2011) 045901. https://doi.org/10.1103/PhysRevLett.107.045901.
[51] E.B. Rubin, S. Shin, Y. Chen, R. Chen, High-temperature stable refractory nanoneedles with over 99% solar absorptance, APL Materials. 7 (2019) 031101. https://doi.org/10.1063/1.5084086.
[52] A. Moreau, C. Ciracì, J.J. Mock, R.T. Hill, Q. Wang, B.J. Wiley, A. Chilkoti, D.R. Smith, Controlled-reflectance surfaces with film-coupled colloidal nanoantennas, Nature. 492 (2012) 86–89. https://doi.org/10.1038/nature11615.
[53] M. Yan, J. Dai, M. Qiu, Lithography-free broadband visible light absorber based on a mono-layer of gold nanoparticles, J. Opt. 16 (2014) 025002. https://doi.org/10.1088/2040-8978/16/2/025002.
[54] J.I. Gittleman, E.K. Sichel, H.W. Lehmann, R. Widmer, Textured silicon: A selective absorber for solar thermal conversion, Appl. Phys. Lett. 35 (1979) 742–744. https://doi.org/10.1063/1.90953.

216
[55] H.C. Barshilia, S. John, V. Mahajan, Nanometric multi-scale rough, transparent and anti-reflective ZnO superhydrophobic coatings on high temperature solar absorber surfaces, Solar Energy Materials and Solar Cells. 107 (2012) 219–224. https://doi.org/10.1016/j.solmat.2012.06.031.
[56] H. Sai, H. Yugami, Y. Kanamori, K. Hane, Solar selective absorbers based on two-dimensional W surface gratings with submicron periods for high-temperature photothermal conversion, Solar Energy Materials and Solar Cells. 79 (2003) 35–49. https://doi.org/10.1016/S0927-0248(02)00364-1.
[57] N. Selvakumar, H.C. Barshilia, Review of physical vapor deposited (PVD) spectrally selective coatings for mid- and high-temperature solar thermal applications, Solar Energy Materials and Solar Cells. 98 (2012) 1–23. https://doi.org/10.1016/j.solmat.2011.10.028.
[58] A. Dan, H.C. Barshilia, K. Chattopadhyay, B. Basu, Solar energy absorption mediated by surface plasma polaritons in spectrally selective dielectric-metal-dielectric coatings: A critical review, Renewable and Sustainable Energy Reviews. 79 (2017) 1050–1077. https://doi.org/10.1016/j.rser.2017.05.062.
[59] B.O. Seraphin, ed., Solar Energy Conversion: Solid-State Physics Aspects, Springer-Verlag, Berlin Heidelberg, 1979. https://doi.org/10.1007/3-540-09224-2.
[60] Y. Liu, C. Wang, Y. Xue, The spectral properties and thermal stability of NbTiON solar selective absorbing coating, Solar Energy Materials and Solar Cells. 96 (2012) 131–136. https://doi.org/10.1016/j.solmat.2011.09.034.
[61] C.G. Granqvist, G.A. Niklasson, Ultrafine chromium particles for photothermal conversion of solar energy, Journal of Applied Physics. 49 (1978) 3512–3520. https://doi.org/10.1063/1.325263.
[62] G.L. Harding, Evaporated chromium black selective solar absorbers, Thin Solid Films. 38 (1976) 109–115. https://doi.org/10.1016/0040-6090(76)90285-6.
[63] G.A. Niklasson, C.G. Granqvist, Optical properties and solar selectivity of coevaporated Co‐Al2O3 composite films, Journal of Applied Physics. 55 (1984) 3382–3410. https://doi.org/10.1063/1.333386.
[64] T.S. Sathiaraj, R. Thangaraj, H. Al Sharbaty, M. Bhatnagar, O.P. Agnihotri, Ni-Al2O3 selective cermet coatings for photothermal conversion up to 500°C, Thin Solid Films. 190 (1990) 241–254. https://doi.org/10.1016/0040-6090(89)90914-0.
[65] J.A. Thornton, J.L. Lamb, Sputter-deposited Pt-Al2O3 selective absorber coatings, Thin Solid Films. 83 (1981) 377–385. https://doi.org/10.1016/0040-6090(81)90644-1.
[66] J. Lafait, S. Berthier, C. Sella, T. Vien, Pt Al2O3 selective absorber coatings for photothermal conversion up to 600°C, Vacuum. 36 (1986) 125–127. https://doi.org/10.1016/0042-207X(86)90285-X.
[67] Zebib.Y. Nuru, C.J. Arendse, R. Nemutudi, O. Nemraoui, M. Maaza, Pt–Al2O3 nanocoatings for high temperature concentrated solar thermal power applications, Physica B: Condensed Matter. 407 (2012) 1634–1637. https://doi.org/10.1016/j.physb.2011.09.104.
[68] S. John, N. Nagarani, S. Rajendran, Black cobalt solar absorber coatings, Solar Energy Materials. 22 (1991) 293–302. https://doi.org/10.1016/0165-1633(91)90036-K.
[69] Q.-C. Zhang, Y. Yin, D.R. Mills, High efficiency Mo Al2O3 cermet selective surfaces for high-temperature application, Solar Energy Materials and Solar Cells. 40 (1996) 43–53. https://doi.org/10.1016/0927-0248(95)00078-X.
[70] M. Lanxner, Z. Elgat, Solar selective absorber coating for high service temperatures, produced by plasma sputtering, in: Optical Materials Technology for Energy Efficiency and Solar Energy Conversion IX, International Society for Optics and Photonics, 1990: pp. 240–249. https://doi.org/10.1117/12.20448.
[71] D. Xinkang, W. Cong, W. Tianmin, Z. Long, C. Buliang, R. Ning, Microstructure and spectral selectivity of Mo–Al2O3 solar selective absorbing coatings after annealing, Thin Solid Films. 516 (2008) 3971–3977. https://doi.org/10.1016/j.tsf.2007.07.193.
[72] J. Cheng, C. Wang, W. Wang, X. Du, Y. Liu, Y. Xue, T. Wang, B. Chen, Improvement of thermal stability in the solar selective absorbing Mo–Al2O3 coating, Solar Energy Materials and Solar Cells. 109 (2013) 204–208. https://doi.org/10.1016/j.solmat.2012.11.010.

217
[73] Q. Zhang, D.R. Mills, New cermet film structures with much improved selectivity for solar thermal applications, Appl. Phys. Lett. 60 (1992) 545–547. https://doi.org/10.1063/1.106602.
[74] Q.-C. Zhang, Metal-AlN cermet solar selective coatings deposited by direct current magnetron sputtering technology, J. Phys. D: Appl. Phys. 31 (1998) 355–362. https://doi.org/10.1088/0022-3727/31/4/003.
[75] Q.-C. Zhang, Direct current magnetron sputtered W–AlN cermet solar absorber films, Journal of Vacuum Science & Technology A. 15 (1997) 2842–2846. https://doi.org/10.1116/1.580837.
[76] Q.-C. Zhang, Development of SS-Aln Cermet Solar Collector Tubes, in: D.Y. Goswami, Y. Zhao (Eds.), Proceedings of ISES World Congress 2007 (Vol. I – Vol. V), Springer, Berlin, Heidelberg, 2009: pp. 1847–1853. https://doi.org/10.1007/978-3-540-75997-3_377.
[77] S. Esposito, A. Antonaia, M.L. Addonizio, S. Aprea, Fabrication and optimisation of highly efficient cermet-based spectrally selective coatings for high operating temperature, Thin Solid Films. 517 (2009) 6000–6006. https://doi.org/10.1016/j.tsf.2009.03.191.
[78] J. Wang, B. Wei, Q. Wei, D. Li, Optical property and thermal stability of Mo/Mo–SiO2/SiO2 solar-selective coating prepared by magnetron sputtering, Physica Status Solidi (a). 208 (2011) 664–667. https://doi.org/10.1002/pssa.201026301.
[79] E. Céspedes, M. Wirz, J.A. Sánchez-García, L. Alvarez-Fraga, R. Escobar-Galindo, C. Prieto, Novel Mo–Si3N4 based selective coating for high temperature concentrating solar power applications, Solar Energy Materials and Solar Cells. 122 (2014) 217–225. https://doi.org/10.1016/j.solmat.2013.12.005.
[80] L. Rebouta, A. Sousa, P. Capela, M. Andritschky, P. Santilli, A. Matilainen, K. Pischow, N.P. Barradas, E. Alves, Solar selective absorbers based on Al2O3:W cermets and AlSiN/AlSiON layers, Solar Energy Materials and Solar Cells. 137 (2015) 93–100. https://doi.org/10.1016/j.solmat.2015.01.029.
[81] A. Antonaia, A. Castaldo, M.L. Addonizio, S. Esposito, Stability of W-Al2O3 cermet based solar coating for receiver tube operating at high temperature, Solar Energy Materials and Solar Cells. 94 (2010) 1604–1611. https://doi.org/10.1016/j.solmat.2010.04.080.
[82] A. Soum-Glaude, I. Bousquet, L. Thomas, G. Flamant, Optical modeling of multilayered coatings based on SiC(N)H materials for their potential use as high-temperature solar selective absorbers, Solar Energy Materials and Solar Cells. 117 (2013) 315–323. https://doi.org/10.1016/j.solmat.2013.06.030.
[83] Q.-C. Zhang, M.S. Hadavi, K.-D. Lee, Y.G. Shen, Zr ZrO2cermet solar coatings designed by modelling calculations and deposited by dc magnetron sputtering, J. Phys. D: Appl. Phys. 36 (2003) 723–729. https://doi.org/10.1088/0022-3727/36/6/315.
[84] Y. Xue, C. Wang, W. Wang, Y. Liu, Y. Wu, Y. Ning, Y. Sun, Spectral properties and thermal stability of solar selective absorbing AlNi–Al2O3 cermet coating, Solar Energy. 96 (2013) 113–118. https://doi.org/10.1016/j.solener.2013.07.012.
[85] H.C. Barshilia, P. Kumar, K.S. Rajam, A. Biswas, Structure and optical properties of Ag–Al2O3 nanocermet solar selective coatings prepared using unbalanced magnetron sputtering, Solar Energy Materials and Solar Cells. 95 (2011) 1707–1715. https://doi.org/10.1016/j.solmat.2011.01.034.
[86] C. Wang, X. Du, T. Wang, L. Zhou, N. Ru, B. Chen, Preparation and optical properties of Nb-NbN multilayer films as solar selective absorptive coatings, Rare Metals. 25 (2006) 355–359. https://doi.org/10.1016/S1001-0521(07)60105-3.
[87] A.R. Shashikala, A.K. Sharma, D.R. Bhandari, Solar selective black nickel–cobalt coatings on aluminum alloys, Solar Energy Materials and Solar Cells. 91 (2007) 629–635. https://doi.org/10.1016/j.solmat.2006.12.001.
[88] E. Wäckelgård, A. Mattsson, R. Bartali, R. Gerosa, G. Gottardi, F. Gustavsson, N. Laidani, V. Micheli, D. Primetzhofer, B. Rivolta, Development of W–SiO2 and Nb–TiO2 solar absorber coatings for combined heat and power systems at intermediate operation temperatures, Solar Energy Materials and Solar Cells. 133 (2015) 180–193. https://doi.org/10.1016/j.solmat.2014.10.022.

218
[89] A. Schüler, I.R. Videnovic, P. Oelhafen, S. Brunold, Titanium-containing amorphous hydrogenated silicon carbon films (a-Si:C:H/Ti) for durable solar absorber coatings, Solar Energy Materials and Solar Cells. 69 (2001) 271–284. https://doi.org/10.1016/S0927-0248(00)00396-2.
[90] J. Moon, D. Lu, B. VanSaders, T.K. Kim, S.D. Kong, S. Jin, R. Chen, Z. Liu, High performance multi-scaled nanostructured spectrally selective coating for concentrating solar power, Nano Energy. 8 (2014) 238–246. https://doi.org/10.1016/j.nanoen.2014.06.016.
[91] J. Moon, T.K. Kim, B. VanSaders, C. Choi, Z. Liu, S. Jin, R. Chen, Black oxide nanoparticles as durable solar absorbing material for high-temperature concentrating solar power system, Solar Energy Materials and Solar Cells. 134 (2015) 417–424. https://doi.org/10.1016/j.solmat.2014.12.004.
[92] T.K. Kim, B. VanSaders, J. Moon, T. Kim, C.-H. Liu, J. Khamwannah, D. Chun, D. Choi, A. Kargar, R. Chen, Z. Liu, S. Jin, Tandem structured spectrally selective coating layer of copper oxide nanowires combined with cobalt oxide nanoparticles, Nano Energy. 11 (2015) 247–259. https://doi.org/10.1016/j.nanoen.2014.10.018.
[93] L. Di Giacomo, PACVD/PVD de multicouches sélectives pour la conversion thermodynamique de l’énergie solaire, These de doctorat, Perpignan, 2017. http://www.theses.fr/2017PERP0042 (accessed July 15, 2020).
[94] Š.A. Furman, A.V. Tikhonravov, Basics of optics of multilayer systems, Ed. Frontières, Gif-sur-Yvette, 1992.
[95] Å. Andersson, O. Hunderi, C.G. Granqvist, Nickel pigmented anodic aluminum oxide for selective absorption of solar energy, Journal of Applied Physics. 51 (1980) 754–764. https://doi.org/10.1063/1.327337.
[96] M. Born, E. Wolf, Principles of Optics: Electromagnetic Theory of Propagation, Interference and Diffraction of Light, Elsevier, 2013.
[97] C.E. Kennedy, High temperature solar selective coatings, US8893711B2, 2014. https://patents.google.com/patent/US8893711B2/en (accessed May 13, 2020).
[98] L. Rebouta, A. Pitães, M. Andritschky, P. Capela, M.F. Cerqueira, A. Matilainen, K. Pischow, Optical characterization of TiAlN/TiAlON/SiO2 absorber for solar selective applications, Surface and Coatings Technology. 211 (2012) 41–44. https://doi.org/10.1016/j.surfcoat.2011.09.003.
[99] R.N. Schmidt, K.C. Park, R.H. Torberg, J.E. Jensen, High Temperature Solar Coatings, Part I, AST-TDR-63-579, Honeywell Corporation, Hopkins, MN. (1963).
[100] H. Yanbin, Y. Zhiqiang, S. Yueyan, Optical properties of multilayer stack models for solar selective absorbing surfaces, Renewable Energy. 8 (1996) 559–561. https://doi.org/10.1016/0960-1481(96)88918-X.
[101] G.L. Harding, Y. Zhiqiang, S. Craig, S.P. Chow, Sputtered solar selective absorbing surfaces based on aluminum and stainless steel composites, Solar Energy Materials. 10 (1984) 187–207. https://doi.org/10.1016/0165-1633(84)90060-1.
[102] G.A. Niklasson, C.G. Granqvist, Surfaces for selective absorption of solar energy: an annotated bibliography 1955–1981, J Mater Sci. 18 (1983) 3475–3534. https://doi.org/10.1007/BF00540724.
[103] N.P. Sergeant, O. Pincon, M. Agrawal, P. Peumans, Design of wide-angle solar-selective absorbers using aperiodic metal-dielectric stacks, Optics Express. 17 (2009) 22800–22812.
[104] A. Schüler, C. Roecker, J. Boudaden, P. Oelhafen, J.-L. Scartezzini, Potential of quarterwave interference stacks for colored thermal solar collectors, Solar Energy. 79 (2005) 122–130. https://doi.org/10.1016/j.solener.2004.12.008.
[105] M. Farooq, Z.H. Lee, Computations of the optical properties of metal/insulator-composites for solar selective absorbers, Renewable Energy. 28 (2003) 1421–1431. https://doi.org/10.1016/S0960-1481(02)00033-2.
[106] Z.Y. Nuru, C.J. Arendse, T.F.G. Muller, M. Maaza, Structural and optical properties of AlxOy/Pt/AlxOy multilayer absorber, Materials Science and Engineering: B. 177 (2012) 1194–1199. https://doi.org/10.1016/j.mseb.2012.05.028.
[107] R.-C. Juang, Y.-C. Yeh, B.-H. Chang, W.-C. Chen, T.-W. Chung, Preparation of solar selective absorbing coatings by magnetron sputtering from a single stainless steel target, Thin Solid Films. 518 (2010) 5501–5504. https://doi.org/10.1016/j.tsf.2010.04.025.
219
[108] N. Selvakumar, H.C. Barshilia, K.S. Rajam, A. Biswas, Structure, optical properties and thermal stability of pulsed sputter deposited high temperature HfOx/Mo/HfO2 solar selective absorbers, Solar Energy Materials and Solar Cells. 94 (2010) 1412–1420. https://doi.org/10.1016/j.solmat.2010.04.073.
[109] J.A. Thornton, A.S. Penfold, J.L. Lamb, Sputter-deposited Al2O3/Mo/Al2O3 selective absorber coatings, Thin Solid Films. 72 (1980) 101–110. https://doi.org/10.1016/0040-6090(80)90563-5.
[110] H.C. Barshilia, N. Selvakumar, G. Vignesh, K.S. Rajam, A. Biswas, Optical properties and thermal stability of pulsed-sputter-deposited AlxOy/Al/AlxOy multilayer absorber coatings, Solar Energy Materials and Solar Cells. 93 (2009) 315–323. https://doi.org/10.1016/j.solmat.2008.11.005.
[111] M. Joly, Y. Antonetti, M. Python, M. Gonzalez, T. Gascou, A. Hessler, A. Schueler, Energy-Efficient Sol-Gel Process for Production of Nanocomposite Absorber Coatings for Tubular Solar Thermal Collectors, Proceedings of CISBAT 2013 Cleantech for Smart Cities and Buildings. (2013) 11–16. https://infoscience.epfl.ch/record/195688 (accessed May 13, 2020).
[112] M. Joly, Y. Antonetti, M. Python, M. Gonzalez, T. Gascou, J.-L. Scartezzini, A. Schüler, Novel black selective coating for tubular solar absorbers based on a sol–gel method, Solar Energy. 94 (2013) 233–239. https://doi.org/10.1016/j.solener.2013.05.009.
[113] T. Boström, G. Westin, E. Wäckelgård, Optimization of a solution-chemically derived solar absorbing spectrally selective surface, Solar Energy Materials and Solar Cells. 91 (2007) 38–43. https://doi.org/10.1016/j.solmat.2006.07.002.
[114] Q. Fu, T. Wagner, Interaction of nanostructured metal overlayers with oxide surfaces, Surface Science Reports. 62 (2007) 431–498. https://doi.org/10.1016/j.surfrep.2007.07.001.
[115] J.A. Thornton, J.L. Lamb, Thermal stability studies of sputter-deposited multilayer selective absorber coatings, Thin Solid Films. 96 (1982) 175–183. https://doi.org/10.1016/0040-6090(82)90618-6.
[116] M.G. Hutchins, Spectrally selective solar absorber coatings, Applied Energy. 5 (1979) 251–262. https://doi.org/10.1016/0306-2619(79)90016-3.
[117] W. Graf, F. Brucker, M. Köhl, T. Tröscher, V. Wittwer, L. Herlitze, Development of large area sputtered solar absorber coatings, Journal of Non-Crystalline Solids. 218 (1997) 380–387. https://doi.org/10.1016/S0022-3093(97)00283-4.
[118] M.G. Hutchins, Selective thin film coatings for the conversion of solar radiation, Surface Technology. 20 (1983) 301–320. https://doi.org/10.1016/0376-4583(83)90111-5.
[119] M. Du, X. Liu, L. Hao, X. Wang, J. Mi, L. Jiang, Q. Yu, Microstructure and thermal stability of Al/Ti0.5Al0.5N/Ti0.25Al0.75N/AlN solar selective coating, Solar Energy Materials and Solar Cells. 111 (2013) 49–56. https://doi.org/10.1016/j.solmat.2012.12.010.
[120] H.C. Barshilia, N. Selvakumar, K.S. Rajam, D.V. Sridhara Rao, K. Muraleedharan, Deposition and characterization of TiAlN/TiAlON/Si3N4 tandem absorbers prepared using reactive direct current magnetron sputtering, Thin Solid Films. 516 (2008) 6071–6078. https://doi.org/10.1016/j.tsf.2007.10.113.
[121] A. Carling-Plaza, M.A. Keilany, M. Bichotte, A. Soum-Glaude, L. Thomas, L. Dubost, Demonstration of long-term stability in air at high temperature for TiAlN solar selective absorber coatings, AIP Conference Proceedings. 2126 (2019) 020001. https://doi.org/10.1063/1.5117509.
[122] A. Biswas, D. Bhattacharyya, H.C. Barshilia, N. Selvakumar, K.S. Rajam, Spectroscopic ellipsometric characterization of TiAlN/TiAlON/Si3N4 tandem absorber for solar selective applications, Applied Surface Science. 254 (2008) 1694–1699. https://doi.org/10.1016/j.apsusc.2007.07.109.
[123] H.C. Barshilia, N. Selvakumar, K.S. Rajam, D.V. Sridhara Rao, K. Muraleedharan, A. Biswas, TiAlN∕TiAlON∕Si3N4 tandem absorber for high temperature solar selective applications, Appl. Phys. Lett. 89 (2006) 191909. https://doi.org/10.1063/1.2387897.
[124] L. Rebouta, A. Pitães, M. Andritschky, P. Capela, M.F. Cerqueira, A. Matilainen, K. Pischow, Optical characterization of TiAlN/TiAlON/SiO2 absorber for solar selective applications, Surface and Coatings Technology. 211 (2012) 41–44. https://doi.org/10.1016/j.surfcoat.2011.09.003.

220
[125] H.C. Barshilia, Growth, characterization and performance evaluation of Ti/AlTiN/AlTiON/AlTiO high temperature spectrally selective coatings for solar thermal power applications, Solar Energy Materials and Solar Cells. 130 (2014) 322–330. https://doi.org/10.1016/j.solmat.2014.07.037.
[126] J. Feng, S. Zhang, Y. Lu, H. Yu, L. Kang, X. Wang, Z. Liu, H. Ding, Y. Tian, J. Ouyang, The spectral selective absorbing characteristics and thermal stability of SS/TiAlN/TiAlSiN/Si3N4 tandem absorber prepared by magnetron sputtering, Solar Energy. 111 (2015) 350–356. https://doi.org/10.1016/j.solener.2014.11.005.
[127] L. Rebouta, P. Capela, M. Andritschky, A. Matilainen, P. Santilli, K. Pischow, E. Alves, Characterization of TiAlSiN/TiAlSiON/SiO2 optical stack designed by modelling calculations for solar selective applications, Solar Energy Materials and Solar Cells. 105 (2012) 202–207. https://doi.org/10.1016/j.solmat.2012.06.011.
[128] H.C. Barshilia, N. Selvakumar, K.S. Rajam, A. Biswas, Optical properties and thermal stability of TiAlN/AlON tandem absorber prepared by reactive DC/RF magnetron sputtering, Solar Energy Materials and Solar Cells. 92 (2008) 1425–1433. https://doi.org/10.1016/j.solmat.2008.06.004.
[129] J. Jyothi, H. Chaliyawala, G. Srinivas, H.S. Nagaraja, H.C. Barshilia, Design and fabrication of spectrally selective TiAlC/TiAlCN/TiAlSiCN/TiAlSiCO/TiAlSiO tandem absorber for high-temperature solar thermal power applications, Solar Energy Materials and Solar Cells. 140 (2015) 209–216. https://doi.org/10.1016/j.solmat.2015.04.018.
[130] N. Selvakumar, N.T. Manikandanath, A. Biswas, H.C. Barshilia, Design and fabrication of highly thermally stable HfMoN/HfON/Al2O3 tandem absorber for solar thermal power generation applications, Solar Energy Materials and Solar Cells. 102 (2012) 86–92. https://doi.org/10.1016/j.solmat.2012.03.021.
[131] H.C. Barshilia, N. Selvakumar, K.S. Rajam, A. Biswas, Spectrally selective NbAlN/NbAlON/Si3N4 tandem absorber for high-temperature solar applications, Solar Energy Materials and Solar Cells. 92 (2008) 495–504. https://doi.org/10.1016/j.solmat.2007.11.004.
[132] N. Selvakumar, S. Santhoshkumar, S. Basu, A. Biswas, H.C. Barshilia, Spectrally selective CrMoN/CrON tandem absorber for mid-temperature solar thermal applications, Solar Energy Materials and Solar Cells. 109 (2013) 97–103. https://doi.org/10.1016/j.solmat.2012.10.003.
[133] K. Valleti, D. Murali Krishna, S.V. Joshi, Functional multi-layer nitride coatings for high temperature solar selective applications, Solar Energy Materials and Solar Cells. 121 (2014) 14–21. https://doi.org/10.1016/j.solmat.2013.10.024.
[134] Download - Aluminium - ALMECO GROUP. https://www.almecogroup.com/en/pages/631-download (accessed September 7, 2020).
[135] K. Zhang, L. Hao, M. Du, J. Mi, J.-N. Wang, J. Meng, A review on thermal stability and high temperature induced ageing mechanisms of solar absorber coatings, Renewable and Sustainable Energy Reviews. 67 (2017) 1282–1299. https://doi.org/10.1016/j.rser.2016.09.083.
[136] H. Schellinger, M.P. Lazarov, H. Klank, R. Sizmann, Thermal and chemical metallic-dielectric transitions of TiNxOy-Cu absorber tandems, in: Optical Materials Technology for Energy Efficiency and Solar Energy Conversion XII, International Society for Optics and Photonics, 1993: pp. 366–376. https://doi.org/10.1117/12.161977.
[137] H. Schellinger, M.P. Lazarov, W. Assmann, B. Bauer, C. Steinhausen, Improved selective properties of SiO2/TiNxOy-Al tandem absorbers effected by tempering, in: Optical Materials Technology for Energy Efficiency and Solar Energy Conversion XIII, International Society for Optics and Photonics, 1994: pp. 172–181. https://doi.org/10.1117/12.185368.
[138] Products, Home. https://alanod.com/en/products (accessed September 8, 2020). [139] Thermo Dynamics Ltd. - Sunstrip Solar Absorber Fins. http://www.thermo-
dynamics.com/sunstrip.html (accessed September 8, 2020). [140] asoluna.com, english, Asoluna.Com. https://www.asoluna.com/english (accessed September
8, 2020). [141] RIOGLASS PTR® 70-4G - Rioglass. https://www.rioglass.com/rioglass-ptr704g/ (accessed
September 8, 2020).
221
[142] Rioglass, Rioglass introduces its next generation “UVAC 7G” receiver tube and sets a new benchmark for thermal output efficiency, Rioglass. (2014). https://www.rioglass.com/rioglass-introduces-its-next-generation-uvac-7g-receiver-tube-and-sets-a-new-benchmark-for-thermal-output-efficiency/ (accessed September 8, 2020).
[143] Archimede Solar Energy. http://www.archimedesolarenergy.it/download.htm (accessed September 7, 2020).
[144] Q.-C. Zhang, Stainless-steel–AlN cermet selective surfaces deposited by direct current magnetron sputtering technology, Solar Energy Materials and Solar Cells. 52 (1998) 95–106. https://doi.org/10.1016/S0927-0248(97)00274-2.
[145] W. Weiss, F. Mauthner, Markets and Contribution to the Energy Supply 2010, (2010) 63. [146] Q.-C. Zhang, K. Zhao, B.-C. Zhang, L.-F. Wang, Z.-L. Shen, Z.-J. Zhou, D.-Q. Lu, D.-L. Xie, B.-F. Li,
New cermet solar coatings for solar thermal electricity applications, Solar Energy. 64 (1998) 109–114. https://doi.org/10.1016/S0038-092X(98)00064-4.
[147] J. Allan, Z. Dehouche, S. Stankovic, L. Mauricette, Performance testing of thermal and photovoltaic thermal solar collectors, Energy Sci Eng. 3 (2015) 310–326. https://doi.org/10.1002/ese3.75.
[148] N. Selvakumar, H.C. Barshilia, K.S. Rajam, Review of sputter deposited mid- to high- temperature solar selective coatings for flat plate/evacuated tube collectors and solar thermal power generation applications, (2010). http://nal-ir.nal.res.in/9637/ (accessed September 7, 2020).
[149] Q.-C. Zhang, D. Mills, A. Monger, Thin film solar selective surface coating, US5523132A, 1996. https://patents.google.com/patent/US5523132A/en (accessed July 16, 2020).
[150] O. Raccurt, A. Disdier, D. Bourdon, S. Donnola, A. Stollo, A. Gioconia, Study of the Stability of a Selective Solar Absorber Coating under Air and High Temperature Conditions, Energy Procedia. 69 (2015) 1551–1557. https://doi.org/10.1016/j.egypro.2015.03.107.
[151] O. Raccurt, F. Matino, A. Disdier, J. Braillon, A. Stollo, D. Bourdon, A. Maccari, In air durability study of solar selective coating for parabolic trough technology, in: 2017: p. 130010. https://doi.org/10.1063/1.4984504.
[152] E. S, D. A, A. A, C. A, F. M, A. Ml, G. A, Optimization procedure and fabrication of highly efficient and thermally stable solar coating for receiver operating at high temperature, Sol. Energy Mater. Sol. Cells. 157 (2016) 429–437.
[153] K. Xu, M. Du, L. Hao, J. Mi, Q. Yu, S. Li, A review of high-temperature selective absorbing coatings for solar thermal applications, Journal of Materiomics. 6 (2020) 167–182. https://doi.org/10.1016/j.jmat.2019.12.012.
[154] Home - SolarPACES. https://www.solarpaces.org/ (accessed November 16, 2020). [155] J. Karni, Solar-thermal power generation, Annual Review of Heat Transfer. 15 (2012) 37–92.
https://doi.org/10.1615/AnnualRevHeatTransfer.2012004925. [156] L.A. Weinstein, J. Loomis, B. Bhatia, D.M. Bierman, E.N. Wang, G. Chen, Concentrating Solar
Power, Chem. Rev. 115 (2015) 12797–12838. https://doi.org/10.1021/acs.chemrev.5b00397. [157] The Performance of Concentrated Solar Power (CSP) Systems, Elsevier, 2017.
https://doi.org/10.1016/C2014-0-03695-7. [158] G03 Committee, Tables for Reference Solar Spectral Irradiances: Direct Normal and
Hemispherical on 37 Tilted Surface, ASTM International, https://doi.org/10.1520/G0173-03R20. [159] A. Grosjean, Etude, modélisation et optimisation de
surfaces fonctionnelles pour les collecteurs solaires thermiques à concentration, These de doctorat, Perpignan, 2018. http://www.theses.fr/2018PERP0002 (accessed July 15, 2020).
[160] R. Reoyo-Prats, A. Carling Plaza, O. Faugeroux, B. Claudet, A. Soum-Glaude, C. Hildebrandt, Y. Binyamin, A. Agüero, T. Meißner, Accelerated aging of absorber coatings for CSP receivers under real high solar flux – Evolution of their optical properties, Solar Energy Materials and Solar Cells. 193 (2019) 92–100. https://doi.org/10.1016/j.solmat.2018.12.030.

222
[161] A. Soum-Glaude, A. Le Gal, stolarz, On aging protocols for estimating thermal stability and durability of high temperature solar selective coatings, 21th Conference on Concentrating Solar Power and Chemical Energy Systems (SolarPACES 2015). (2015).
[162] I.G. Wright, R.B. Dooley, A review of the oxidation behaviour of structural alloys in steam, International Materials Reviews. 55 (2010) 129–167. https://doi.org/10.1179/095066010X12646898728165.
[163] L.C. Olson, J.W. Ambrosek, K. Sridharan, M.H. Anderson, T.R. Allen, Materials corrosion in molten LiF–NaF–KF salt, Journal of Fluorine Chemistry. 130 (2009) 67–73. https://doi.org/10.1016/j.jfluchem.2008.05.008.
[164] K.L. Summers, D. Chidambaram, Corrosion Behavior of Structural Materials for Potential Use in Nitrate Salts Based Solar Thermal Power Plants, J. Electrochem. Soc. 164 (2017) H5357. https://doi.org/10.1149/2.0501708jes.
[165] J.C. Vidal, N. Klammer, Molten chloride technology pathway to meet the U.S. DOE sunshot initiative with Gen3 CSP, AIP Conference Proceedings. 2126 (2019) 080006. https://doi.org/10.1063/1.5117601.
[166] H. Nakajima, M. Koiwa, Diffusion in Titanium, ISIJ International. 31 (1991) 757–766. https://doi.org/10.2355/isijinternational.31.757.
[167] M. Kotilainen, K. Mizohata, M. Honkanen, P. Vuoristo, Influence of microstructure on temperature-induced ageing mechanisms of different solar absorber coatings, Solar Energy Materials and Solar Cells. 120 (2014) 462–472. https://doi.org/10.1016/j.solmat.2013.09.026.
[168] H.D. Liu, Q. Wan, Y.R. Xu, C. luo, Y.M. Chen, D.J. Fu, F. Ren, G. Luo, X.D. Cheng, X.J. Hu, B. Yang, Long-term thermal stability of CrAlO-based solar selective absorbing coating in elevated temperature air, Solar Energy Materials and Solar Cells. 134 (2015) 261–267. https://doi.org/10.1016/j.solmat.2014.12.009.
[169] F. Cao, D. Kraemer, T. Sun, Y. Lan, G. Chen, Z. Ren, Enhanced Thermal Stability of W-Ni-Al2O3 Cermet-Based Spectrally Selective Solar Absorbers with Tungsten Infrared Reflectors, Advanced Energy Materials. 5 (2015) 1401042. https://doi.org/10.1002/aenm.201401042.
[170] J. Gao, X. Wang, B. Yang, C. Tu, L. Liang, H. Zhang, F. Zhuge, H. Cao, Y. Zou, K. Yu, F. Xia, Y. Han, Plasmonic AgAl Bimetallic Alloy Nanoparticle/Al2O3 Nanocermet Thin Films with Robust Thermal Stability for Solar Thermal Applications, Advanced Materials Interfaces. 3 (2016) 1600248. https://doi.org/10.1002/admi.201600248.
[171] F. Cao, D. Kraemer, L. Tang, Y. Li, A.P. Litvinchuk, J. Bao, G. Chen, Z. Ren, A high-performance spectrally-selective solar absorber based on a yttria-stabilized zirconia cermet with high-temperature stability, Energy Environ. Sci. 8 (2015) 3040–3048. https://doi.org/10.1039/C5EE02066B.
[172] A. Dan, J. Jyothi, K. Chattopadhyay, H.C. Barshilia, B. Basu, Spectrally selective absorber coating of WAlN/WAlON/Al2O3 for solar thermal applications, Solar Energy Materials and Solar Cells. 157 (2016) 716–726. https://doi.org/10.1016/j.solmat.2016.07.018.
[173] A. Antonaia, M.L. Addonizio, S. Esposito, M. Ferrara, A. Castaldo, A. Guglielmo, A. D’Angelo, Adhesion and structural stability enhancement for Ag layers deposited on steel in selective solar coatings technology, Surface and Coatings Technology. 255 (2014) 96–101. https://doi.org/10.1016/j.surfcoat.2014.02.045.
[174] K.P. Sibin, S. John, H.C. Barshilia, Control of thermal emittance of stainless steel using sputtered tungsten thin films for solar thermal power applications, Solar Energy Materials and Solar Cells. 133 (2015) 1–7. https://doi.org/10.1016/j.solmat.2014.11.002.
[175] J. Małecka, Oxidation Activation Energy of Titanium Alloy Based on TiAl(γ) Intermetalic Phase, Advances in Materials Science. 18 (2018) 5–14. https://doi.org/10.1515/adms-2017-0027.
[176] C. Wagner, Beitrag zur Theorie des Anlaufvorgangs, Zeitschrift Für Physikalische Chemie. 21B (1933) 25–41. https://doi.org/10.1515/zpch-1933-2105.
[177] N. Cabrera, N.F. Mott, Theory of the oxidation of metals, Reports on Progress in Physics. 12 (1949) 163–184. https://doi.org/10.1088/0034-4885/12/1/308.
223
[178] S. Chevalier, P. Juzon, K. Przybylski, J.-P. Larpin, Water vapor effect on high-temperature oxidation behavior of Fe3Al intermetallics, Science and Technology of Advanced Materials. 10 (2009) 045006. https://doi.org/10.1088/1468-6996/10/4/045006.
[179] R. Kremer, W. Auer, Influence of Moisture on the oxidation of γ-TiAl, Materials and Corrosion. 48 (1997) 35–39. https://doi.org/10.1002/maco.19970480107.
[180] Z.Y. Nuru, L. Kotsedi, C.J. Arendse, D. Motaung, B. Mwakikunga, K. Roro, M. Maaza, Thermal stability of multilayered Pt-Al2O3 nanocoatings for high temperature CSP systems, Vacuum. 120 (2015) 115–120. https://doi.org/10.1016/j.vacuum.2015.02.001.
[181] X. Wang, J. Gao, H. Hu, H. Zhang, L. Liang, K. Javaid, F. Zhuge, H. Cao, L. Wang, High-temperature tolerance in WTi-Al2O3 cermet-based solar selective absorbing coatings with low thermal emissivity, Nano Energy. 37 (2017) 232–241. https://doi.org/10.1016/j.nanoen.2017.05.036.
[182] Y. Xue, C. Wang, W. Wang, Y. Liu, Y. Wu, Y. Ning, Y. Sun, Spectral properties and thermal stability of solar selective absorbing AlNi–Al2O3 cermet coating, Solar Energy. 96 (2013) 113–118. https://doi.org/10.1016/j.solener.2013.07.012.
[183] Y. Xue, C. Wang, Y. Sun, W. Wang, Y. Wu, Y. Ning, Preparation and spectral properties of solar selective absorbing MoSi2–Al2O3 coating, Physica Status Solidi (a). 211 (2014) 1519–1524. https://doi.org/10.1002/pssa.201330658.
[184] X.-H. Gao, C.-B. Wang, Z.-M. Guo, Q.-F. Geng, W. Theiss, G. Liu, Structure, optical properties and thermal stability of Al2O3-WC nanocomposite ceramic spectrally selective solar absorbers, Optical Materials. 58 (2016) 219–225. https://doi.org/10.1016/j.optmat.2016.05.037.
[185] X. Duan, X. Zhang, C. Ke, S. Jiang, X. Wang, S. Li, W. Guo, X. Cheng, Microstructure and optical properties of Co-WC-Al2O3 duplex ceramic metal-dielectric solar selective absorbing coating prepared by high velocity oxy-fuel spraying and sol-gel method, Vacuum. 145 (2017) 209–216. https://doi.org/10.1016/j.vacuum.2017.09.002.
[186] X.-H. Gao, H.-X. Guo, T.-H. Zhou, G. Liu, Optical properties and failure analysis of ZrC-ZrOx ceramic based spectrally selective solar absorbers deposited at a high substrate temperature, Solar Energy Materials and Solar Cells. 176 (2018) 93–99. https://doi.org/10.1016/j.solmat.2017.11.018.
[187] C. Zou, W. Xie, L. Shao, Functional multi-layer solar spectral selective absorbing coatings of AlCrSiN/AlCrSiON/AlCrO for high temperature applications, Solar Energy Materials and Solar Cells. 153 (2016) 9–17. https://doi.org/10.1016/j.solmat.2016.04.007.
[188] D. Hernández-Pinilla, A. Rodríguez-Palomo, L. Álvarez-Fraga, E. Céspedes, J.E. Prieto, A. Muñoz-Martín, C. Prieto, MoSi2–Si3N4 absorber for high temperature solar selective coating, Solar Energy Materials and Solar Cells. 152 (2016) 141–146. https://doi.org/10.1016/j.solmat.2016.04.001.
[189] C. Zou, L. Huang, J. Wang, S. Xue, Effects of antireflection layers on the optical and thermal stability properties of a spectrally selective CrAlN–CrAlON based tandem absorber, Solar Energy Materials and Solar Cells. 137 (2015) 243–252. https://doi.org/10.1016/j.solmat.2015.02.010.
[190] J. Feng, S. Zhang, Y. Lu, H. Yu, L. Kang, X. Wang, Z. Liu, H. Ding, Y. Tian, J. Ouyang, The spectral selective absorbing characteristics and thermal stability of SS/TiAlN/TiAlSiN/Si3N4 tandem absorber prepared by magnetron sputtering, Solar Energy. 111 (2015) 350–356. https://doi.org/10.1016/j.solener.2014.11.005.
[191] X.-H. Gao, Z.-M. Guo, Q.-F. Geng, P.-J. Ma, A.-Q. Wang, G. Liu, Enhanced optical properties of TiN-based spectrally selective solar absorbers deposited at a high substrate temperature, Solar Energy Materials and Solar Cells. 163 (2017) 91–97. https://doi.org/10.1016/j.solmat.2017.01.023.
[192] H.C. Barshilia, N. Selvakumar, G. Vignesh, K.S. Rajam, A. Biswas, Optical properties and thermal stability of pulsed-sputter-deposited AlxOy/Al/AlxOy multilayer absorber coatings, Solar Energy Materials and Solar Cells. 93 (2009) 315–323. https://doi.org/10.1016/j.solmat.2008.11.005.
[193] S. Khamlich, R. McCrindle, Z.Y. Nuru, N. Cingo, M. Maaza, Annealing effect on the structural and optical properties of Cr/α-Cr2O3 monodispersed particles based solar absorbers, Applied Surface Science. 265 (2013) 745–749. https://doi.org/10.1016/j.apsusc.2012.11.099.

224
[194] D. Ngoue, Nanocomposites en revêtement déposé par technologie plasma pour la conversion de l’énergie solaire, Thesis, Université de Perpignan, 2021. http://www.theses.fr/s237939.
[195] K. Niranjan, P. Kondaiah, G. Srinivas, H.C. Barshilia, Optimization of W/WAlSiN/SiON/SiO2 tandem absorber consisting of double layer anti-reflection coating with broadband absorption in the solar spectrum region, Applied Surface Science. 496 (2019) 143651. https://doi.org/10.1016/j.apsusc.2019.143651.
[196] A. Anders, A structure zone diagram including plasma-based deposition and ion etching, Thin Solid Films. 518 (2010) 4087–4090. https://doi.org/10.1016/j.tsf.2009.10.145.
[197] Z. Ke, D. Miao, H. Lei, M. Jianping, W. Jining, L. Xiaopeng, D. Zhejun, M. Jie, Z. Bo, Thermal stability test and ageing mechanisms study of different solar selective absorbing coatings, Surface and Coatings Technology. 323 (2017) 65–71. https://doi.org/10.1016/j.surfcoat.2016.08.092.
[198] Engineering Materials 1 - 5th Edition. https://www.elsevier.com/books/engineering-materials-1/jones/978-0-08-102051-7 (accessed February 19, 2021).
[199] K.D. Bouzakis, M. Pappa, G. Skordaris, E. Bouzakis, S. Gerardis, Correlation between PVD coating strength properties and impact resistance at ambient and elevated temperatures, Surface and Coatings Technology. 205 (2010) 1481–1485. https://doi.org/10.1016/j.surfcoat.2010.07.055.
[200] M.M.M. Bilek, D.R. McKenzie, A comprehensive model of stress generation and relief processes in thin films deposited with energetic ions, Surface and Coatings Technology. 200 (2006) 4345–4354. https://doi.org/10.1016/j.surfcoat.2005.02.161.
[201] Y. Gorash, D. MacKenzie, On cyclic yield strength in definition of limits for characterisation of fatigue and creep behaviour, Open Engineering. 7 (2017) 126–140. https://doi.org/10.1515/eng-2017-0019.
[202] M. Laporte-Azcué, P.A. González-Gómez, M.R. Rodríguez-Sánchez, D. Santana, Deflection and stresses in solar central receivers, Solar Energy. 195 (2020) 355–368. https://doi.org/10.1016/j.solener.2019.11.066.
[203] T. Conroy, M.N. Collins, R. Grimes, A review of steady-state thermal and mechanical modelling on tubular solar receivers, Renewable and Sustainable Energy Reviews. 119 (2020) 109591. https://doi.org/10.1016/j.rser.2019.109591.
[204] Z. Wan, J. Fang, N. Tu, J. Wei, M.A. Qaisrani, Numerical study on thermal stress and cold startup induced thermal fatigue of a water/steam cavity receiver in concentrated solar power (CSP) plants, Solar Energy. 170 (2018) 430–441. https://doi.org/10.1016/j.solener.2018.05.087.
[205] P.A. González-Gómez, M.R. Rodríguez-Sánchez, M. Laporte-Azcué, D. Santana, Calculating molten-salt central-receiver lifetime under creep-fatigue damage, Solar Energy. 213 (2021) 180–197. https://doi.org/10.1016/j.solener.2020.11.033.
[206] J.F. Torres, I. Ellis, J. Coventry, Degradation mechanisms and non-linear thermal cycling effects in a high-temperature light-absorber coating, Solar Energy Materials and Solar Cells. 218 (2020) 110719. https://doi.org/10.1016/j.solmat.2020.110719.
[207] Y. Lalau, O. Faugeroux, E. Guillot, D. Andre, M. Huger, A. Proust, T. Chotard, B. Claudet, IMPACT: A novel device for in-situ thermo-mechanical investigation of materials under concentrated sunlight, Solar Energy Materials and Solar Cells. 172 (2017) 59–65. https://doi.org/10.1016/j.solmat.2017.07.002.
[208] Y. Lalau, O. Faugeroux, B. Claudet, E. Guillot, D. Andre, M. Huger, A. Proust, T. Chotard, A method for experimental thermo-mechanical aging of materials submitted to concentrated solar irradiation, Solar Energy Materials and Solar Cells. 192 (2019) 161–169. https://doi.org/10.1016/j.solmat.2018.12.017.
[209] D. Chen, A. Crisci, R. Boichot, J. Colas, L. Charpentier, M. Balat-Pichelin, M. Pons, F. Mercier, Modeling multilayer coating systems in solar receivers, Surface and Coatings Technology. 399 (2020) 126102. https://doi.org/10.1016/j.surfcoat.2020.126102.
[210] C.M. Koller, R. Hollerweger, C. Sabitzer, R. Rachbauer, S. Kolozsvári, J. Paulitsch, P.H. Mayrhofer, Thermal stability and oxidation resistance of arc evaporated TiAlN, TaAlN, TiAlTaN, and TiAlN/TaAlN coatings, Surface and Coatings Technology. 259 (2014) 599–607. https://doi.org/10.1016/j.surfcoat.2014.10.024.

225
[211] F. Montero-Chacón, S. Zaghi, R. Rossi, E. García-Pérez, I. Heras-Pérez, X. Martínez, S. Oller, M. Doblaré, Multiscale thermo-mechanical analysis of multi-layered coatings in solar thermal applications, Finite Elements in Analysis and Design. 127 (2017) 31–43. https://doi.org/10.1016/j.finel.2016.12.006.
[212] A.R. Shugurov, M.S. Kazachenok, Mechanical properties and tribological behavior of magnetron sputtered TiAlN/TiAl multilayer coatings, Surface and Coatings Technology. 353 (2018) 254–262. https://doi.org/10.1016/j.surfcoat.2018.09.001.
[213] A. Mège-Revil, P. Steyer, S. Cardinal, G. Thollet, C. Esnouf, P. Jacquot, B. Stauder, Correlation between thermal fatigue and thermomechanical properties during the oxidation of multilayered TiSiN nanocomposite coatings synthesized by a hybrid physical/chemical vapour deposition process, Thin Solid Films. 518 (2010) 5932–5937. https://doi.org/10.1016/j.tsf.2010.05.092.
[214] O.U.O. Mota, R.A. Araujo, H. Wang, T. Çağın, Mechanical Properties of Metal Nitrides for Radiation Resistant Coating Applications: A DFT Study, Physics Procedia. 66 (2015) 576–585. https://doi.org/10.1016/j.phpro.2015.05.077.
[215] C. Ho, A. Mahoney, A. Ambrosini, M. Bencomo, A. Hall, T. Lambert, Characterization of Pyromark 2500 Paint for High-Temperature Solar Receivers, 2012. https://doi.org/10.1115/ES2012-91374.
[216] C.K. Ho, J.E. Pacheco, Levelized Cost of Coating (LCOC) for selective absorber materials, Solar Energy. 108 (2014) 315–321. https://doi.org/10.1016/j.solener.2014.05.017.
[217] N. Birks, G.H. Meier, F.S. Pettit, Introduction to the High Temperature Oxidation of Metals, Cambridge University Press, 2006.
[218] J. Yao, Y. He, D. Wang, J. Lin, High-temperature oxidation resistance of (Al2O3–Y2O3)/(Y2O3-stabilized ZrO2) laminated coating on 8Nb–TiAl alloy prepared by a novel spray pyrolysis, Corrosion Science. 80 (2014) 19–27. https://doi.org/10.1016/j.corsci.2013.08.029.
[219] B. Gorr, L. Wang, S. Burk, M. Azim, S. Majumdar, H.-J. Christ, D. Mukherji, J. Rösler, D. Schliephake, M. Heilmaier, High-temperature oxidation behavior of Mo–Si–B-based and Co–Re–Cr-based alloys, Intermetallics. 48 (2014) 34–43. https://doi.org/10.1016/j.intermet.2013.10.008.
[220] D. Ghosh, S. Mukherjee, S. Das, High temperature oxidation behaviour of yttria ( Y2O3) coated low alloy steel, Surface Engineering. 30 (2014) 524–528. https://doi.org/10.1179/1743294414Y.0000000271.
[221] B.A. Pint, K.A. Unocic, K.A. Terrani, Effect of steam on high temperature oxidation behaviour of alumina-forming alloys, Materials at High Temperatures. 32 (2015) 28–35. https://doi.org/10.1179/0960340914Z.00000000058.
[222] D.S. Aydin, Z. Bayindir, M.O. Pekguleryuz, The high temperature oxidation behavior of Mg–Nd alloys. Part II: The effect of the two-phase microstructure on the on-set of oxidation and on oxide morphology, Journal of Alloys and Compounds. 584 (2014) 558–565. https://doi.org/10.1016/j.jallcom.2013.09.110.
[223] G.W. Meetham, M.H.V. de Voorde, Materials for High Temperature Engineering Applications, Springer-Verlag, Berlin Heidelberg, 2000. https://doi.org/10.1007/978-3-642-56938-8.
[224] A. Boubault, C.K. Ho, A. Hall, T.N. Lambert, A. Ambrosini, Durability of solar absorber coatings and their cost-effectiveness, Solar Energy Materials and Solar Cells. 166 (2017) 176–184. https://doi.org/10.1016/j.solmat.2017.03.010.
[225] L. Rebouta, A. Sousa, P. Capela, M. Andritschky, P. Santilli, A. Matilainen, K. Pischow, N.P. Barradas, E. Alves, Solar selective absorbers based on Al2O3:W cermets and AlSiN/AlSiON layers, Solar Energy Materials and Solar Cells. 137 (2015) 93–100. https://doi.org/10.1016/j.solmat.2015.01.029.
[226] D. Dias, L. Rebouta, P. Costa, A. Al-Rjoub, M. Benelmeki, C.J. Tavares, N.P. Barradas, E. Alves, P. Santilli, K. Pischow, Optical and structural analysis of solar selective absorbing coatings based on AlSiOx:W cermets, Solar Energy. 150 (2017) 335–344. https://doi.org/10.1016/j.solener.2017.04.055.
[227] X. Wang, X. Zhang, Q. Li, J. Min, X. Cheng, Spectral properties of AlCrNO-based multi-layer solar selective absorbing coating during the initial stage of thermal aging upon exposure to air, Solar

226
Energy Materials and Solar Cells. 188 (2018) 81–92. https://doi.org/10.1016/j.solmat.2018.08.008.
[228] M. Bilokur, A.R. Gentle, M.D. Arnold, M.B. Cortie, G.B. Smith, High temperature optically stable spectrally-selective Ti1-xAlxN-based multilayer coating for concentrated solar thermal applications, Solar Energy Materials and Solar Cells. 200 (2019) 109964. https://doi.org/10.1016/j.solmat.2019.109964.
[229] J. Meng, R. Guo, H. Li, L. Zhao, X. Liu, Z. Li, Microstructure and thermal stability of Cu/Zr0.3Al0.7N/Zr0.2Al0.8N/Al34O60N6 cermet-based solar selective absorbing coatings, Applied Surface Science. 440 (2018) 932–938. https://doi.org/10.1016/j.apsusc.2018.01.268.
[230] N. Selvakumar, K. Rajaguru, G.M. Gouda, H.C. Barshilia, AlMoN based spectrally selective coating with improved thermal stability for high temperature solar thermal applications, Solar Energy. 119 (2015) 114–121. https://doi.org/10.1016/j.solener.2015.06.047.
[231] N. Selvakumar, A. Biswas, K. Rajaguru, G.M. Gouda, H.C. Barshilia, Nanometer thick tunable AlHfN coating for solar thermal applications: Transition from absorber to antireflection coating, Solar Energy Materials and Solar Cells. 137 (2015) 219–226. https://doi.org/10.1016/j.solmat.2015.02.008.
[232] Y. Wu, C. Wang, Y. Sun, Y. Ning, Y. Liu, Y. Xue, W. Wang, S. Zhao, E. Tomasella, A. Bousquet, Study on the thermal stability of Al/NbTiSiN/NbTiSiON/SiO2 solar selective absorbing coating, Solar Energy. 119 (2015) 18–28. https://doi.org/10.1016/j.solener.2015.06.021.
[233] J. Feng, S. Zhang, X. Liu, H. Yu, H. Ding, Y. Tian, J. Ouyang, Solar selective absorbing coatings TiN/TiSiN/SiN prepared on stainless steel substrates, Vacuum. 121 (2015) 135–141. https://doi.org/10.1016/j.vacuum.2015.08.013.
[234] Y. Ning, W. Wang, L. Wang, Y. Sun, P. Song, H. Man, Y. Zhang, B. Dai, J. Zhang, C. Wang, Y. Zhang, S. Zhao, E. Tomasella, A. Bousquet, J. Cellier, Optical simulation and preparation of novel Mo/ZrSiN/ZrSiON/SiO2 solar selective absorbing coating, Solar Energy Materials and Solar Cells. 167 (2017) 178–183. https://doi.org/10.1016/j.solmat.2017.04.017.
[235] C. Zou, W. Xie, L. Shao, Functional multi-layer solar spectral selective absorbing coatings of AlCrSiN/AlCrSiON/AlCrO for high temperature applications, Solar Energy Materials and Solar Cells. 153 (2016) 9–17. https://doi.org/10.1016/j.solmat.2016.04.007.
[236] A. AL-Rjoub, L. Rebouta, P. Costa, N.P. Barradas, E. Alves, P.J. Ferreira, K. Abderrafi, A. Matilainen, K. Pischow, A design of selective solar absorber for high temperature applications, Solar Energy. 172 (2018) 177–183. https://doi.org/10.1016/j.solener.2018.04.052.
[237] J. Jyothi, H. Chaliyawala, G. Srinivas, H.S. Nagaraja, H.C. Barshilia, Design and fabrication of spectrally selective TiAlC/TiAlCN/TiAlSiCN/TiAlSiCO/TiAlSiO tandem absorber for high-temperature solar thermal power applications, Solar Energy Materials and Solar Cells. 140 (2015) 209–216. https://doi.org/10.1016/j.solmat.2015.04.018.
[238] Y. Liu, Z. Wang, D. Lei, C. Wang, A new solar spectral selective absorbing coating of SS–(Fe3O4)/Mo/TiZrN/TiZrON/SiON for high temperature application, Solar Energy Materials and Solar Cells. 127 (2014) 143–146. https://doi.org/10.1016/j.solmat.2014.04.014.
[239] P. Song, Y. Wu, L. Wang, Y. Sun, Y. Ning, Y. Zhang, B. Dai, E. Tomasella, A. Bousquet, C. Wang, The investigation of thermal stability of Al/NbMoN/NbMoON/SiO2 solar selective absorbing coating, Solar Energy Materials and Solar Cells. 171 (2017) 253–257. https://doi.org/10.1016/j.solmat.2017.06.056.
[240] M. Bichotte, T. Kämpfe, W. Iff, F. Celle, S. Reynaud, D. Jamon, T. Pouit, A. Soum-Glaude, A. Keilany, L. Dubost, Y. Jourlin, Diffractive gratings to improve TiAlN based spectrally selective solar absorbers, in: Santiago, Chile, 2018: p. 040007. https://doi.org/10.1063/1.5067043.
[241] F. Cao, L. Tang, Y. Li, A.P. Litvinchuk, J. Bao, Z. Ren, A high-temperature stable spectrally-selective solar absorber based on cermet of titanium nitride in SiO2 deposited on lanthanum aluminate, Solar Energy Materials and Solar Cells. 160 (2017) 12–17. https://doi.org/10.1016/j.solmat.2016.10.012.
[242] K. Niranjan, A. Soum-Glaude, A. Carling-Plaza, S. Bysakh, S. John, H.C. Barshilia, Extremely high temperature stable nanometric scale multilayer spectrally selective absorber coating: Emissivity

227
measurements at elevated temperatures and a comprehensive study on ageing mechanism, Solar Energy Materials and Solar Cells. 221 (2021) 110905. https://doi.org/10.1016/j.solmat.2020.110905.
[243] J. Barriga, U. Ruiz-de-Gopegui, J. Goikoetxea, B. Coto, H. Cachafeiro, Selective Coatings for New Concepts of Parabolic Trough Collectors, Energy Procedia. 49 (2014) 30–39. https://doi.org/10.1016/j.egypro.2014.03.004.
[244] B. Carlsson, M. Koehl, U. Frei, K. Moeller, Accelerated life testing of solar energy materials: Case study of some selective solar absorber coating materials for DHW systems. A report of task 10 solar materials research and development, NASA STI/Recon Technical Report N. 95 (1994). http://adsabs.harvard.edu/abs/1994STIN...9522362C (accessed July 23, 2020).
[245] M. Köhl, K. Gindele, U. Frei, T. Häuselmann, Accelerated ageing test procedures for selective absorber coatings including lifetime estimation and comparison with outdoor test results, Solar Energy Materials. 19 (1989) 257–313. https://doi.org/10.1016/0165-1633(89)90011-7.
[246] S. Brunold, U. Frei, B. Carlsson, K. Möller, M. Köhl, Accelerated life testing of solar absorber coatings:: Testing procedure and results, Solar Energy. 68 (2000) 313–323. https://doi.org/10.1016/S0038-092X(00)00034-7.
[247] B. Carlsson, K. Moeller, U. Frei, M. Koehl, Accelerated life testing of solar absorber coatings, in: Optical Materials Technology for Energy Efficiency and Solar Energy Conversion XIII, International Society for Optics and Photonics, 1994: pp. 79–90. https://doi.org/10.1117/12.185359.
[248] R. Gampp, P. Oelhafen, P. Gantenbein, S. Brunold, U. Frei, Accelerated aging tests of chromium containing amorphous hydrogenated carbon coatings for solar collectors, Solar Energy Materials and Solar Cells. 54 (1998) 369–377. https://doi.org/10.1016/S0927-0248(98)00088-9.
[249] M. Koehl, Durability of solar energy materials, Renewable Energy. 24 (2001) 597–607. https://doi.org/10.1016/S0960-1481(01)00046-5.
[250] B. Carlsson, K. Möller, U. Frei, S. Brunold, M. Köhl, Comparison between predicted and actually observed in-service degradation of a nickel pigmented anodized aluminium absorber coating for solar DHW systems, Solar Energy Materials and Solar Cells. 61 (2000) 223–238. https://doi.org/10.1016/S0927-0248(99)00112-9.
[251] B. Carlsson, K. Möller, M. Köhl, U. Frei, S. Brunold, Qualification test procedure for solar absorber surface durability, Solar Energy Materials and Solar Cells. 61 (2000) 255–275. https://doi.org/10.1016/S0927-0248(99)00111-7.
[252] BS EN 12975-1:2006+A1:2010 - Thermal solar systems and components. Solar collectors. General requirements – BSI British Standards. https://shop.bsigroup.com/en/ProductDetail/?pid=000000000030216715 (accessed September 14, 2020).
[253] A. Soum-Glaude, A. Le Gal, M. Bichotte, L. Dubost, Thermal stability and durability studies of tandem TiAlN high temperature solar selective coatings, 22th Conference on Concentrating Solar Power and Chemical Energy Systems (SolarPACES 2016). (2016).
[254] M. Arntzen, S. Dreyer, J. Specht, T. Kuckelkorn, M. Schmidt, A. Sauerborn, Accelerated Ageing Tests on Schott PTR 70 HCE, SolarPACES, 2011.
[255] N.E. Dowling, Mechanical behavior of materials : engineering methods for deformation, fracture, and fatigue, CERN Document Server. (2012). https://cds.cern.ch/record/2064030 (accessed October 28, 2020).
[256] ASM Handbook, Volume 19: Fatigue and Fracture - ASM International. https://www.asminternational.org/search/-/journal_content/56/10192/25656855/PUBLICATION (accessed October 28, 2020).
[257] S.S. Manson, Behavior of Materials Under Conditions of Thermal Stress, National Advisory Committee for Aeronautics, 1953.
[258] L. Noč, E. Šest, G. Kapun, F. Ruiz-Zepeda, Y. Binyamin, F. Merzel, I. Jerman, High-solar-absorptance CSP coating characterization and reliability testing with isothermal and cyclic loads for service-life prediction, Energy Environ. Sci. 12 (2019) 1679–1694. https://doi.org/10.1039/C8EE03536A.

228
[259] P. Hartrott, M. Schlesinger, R. Uhlig, J. Jedamski, Fatigue life prediction on ni-base thermal solar receiver tubes, in: 2010.
[260] F. Sutter, A. Fernández-García, P. Heller, K. Anderson, G. Wilson, M. Schmücker, P. Marvig, Durability Testing of Silvered-Glass Mirrors, Energy Procedia. 69 (2015) 1568–1577. https://doi.org/10.1016/j.egypro.2015.03.110.
[261] F. Sutter, J. Wette, F. Wiesinger, A. Fernández-García, S. Ziegler, R. Dasbach, Lifetime prediction of aluminum solar mirrors by correlating accelerated aging and outdoor exposure experiments, Solar Energy. 174 (2018) 149–163. https://doi.org/10.1016/j.solener.2018.09.006.
[262] A. Grosjean, E. Le Baron, A.-C. Pescheux, A. Disdier, Accelerated aging tests and characterizations of solar mirrors: Comparison of combinations of stress factors on degradation, Solar Energy Materials and Solar Cells. 220 (2021) 110851. https://doi.org/10.1016/j.solmat.2020.110851.
[263] H. Chen, W. Gao, T. Liu, W. Lin, M. Li, An experimental study on the effect of salt spray testing on the optical properties of solar selective absorber coatings produced with different manufacturing technologies, Int J Energy Environ Eng. 10 (2019) 231–242. https://doi.org/10.1007/s40095-019-0299-7.
[264] B. Carlsson, K. Möller, M. Köhl, M. Heck, S. Brunold, U. Frei, J.-C. Marechal, G. Jorgensen, The applicability of accelerated life testing for assessment of service life of solar thermal components, Solar Energy Materials and Solar Cells. 84 (2004) 255–274. https://doi.org/10.1016/j.solmat.2004.01.046.
[265] N.C. Park, W.W. Oh, D.H. Kim, Effect of Temperature and Humidity on the Degradation Rate of Multicrystalline Silicon Photovoltaic Module, International Journal of Photoenergy. 2013 (2013) e925280. https://doi.org/10.1155/2013/925280.
[266] D.S. Peck, Comprehensive Model for Humidity Testing Correlation, in: 24th International Reliability Physics Symposium, 1986: pp. 44–50. https://doi.org/10.1109/IRPS.1986.362110.
[267] A. Boubault, Etude du vieillissement de matériaux sous haut flux solaire concentré − Application aux récepteurs surfaciques des centrales solaires thermodynamiques, These en préparation, Perpignan, 2009. http://www.theses.fr/s83622 (accessed July 15, 2020).
[268] A. Boubault, B. Claudet, O. Faugeroux, G. Olalde, Aging of solar absorber materials under highly concentrated solar fluxes, Solar Energy Materials and Solar Cells. 123 (2014) 211–219. https://doi.org/10.1016/j.solmat.2014.01.010.
[269] N. Djohan, R. Estrada, D. Sari, M. Dahrul, A. Kurniawan, J. Iskandar, H. Hardhienata, Irzaman, The effect of annealing temperature variation on the optical properties test of LiTaO3 thin films based on Tauc Plot method for satellite technology, IOP Conf. Ser.: Earth Environ. Sci. 54 (2017) 012093. https://doi.org/10.1088/1755-1315/54/1/012093.
[270] A. Srinivasa Rao, S. Sakthivel, A highly thermally stable Mn–Cu–Fe composite oxide based solar selective absorber layer with low thermal loss at high temperature, Journal of Alloys and Compounds. 644 (2015) 906–915. https://doi.org/10.1016/j.jallcom.2015.05.038.
[271] M. Berenguel, E.F. Camacho, F.J. Garcia-Martin, F.R. Rubio, Temperature control of a solar furnace, IEEE Control Systems Magazine. 19 (1999) 8–24. https://doi.org/10.1109/37.745762.
[272] B. Andrade da Costa, J.M. Lemos, An adaptive temperature control law for a solar furnace, Control Engineering Practice. 17 (2009) 1157–1173. https://doi.org/10.1016/j.conengprac.2009.05.001.
[273] W. Wang, B. Laumert, Simulate a ‘Sun’ for Solar Research : A Literature Review of Solar Simulator Technology, KTH Royal Institute of Technology, 2014. http://urn.kb.se/resolve?urn=urn:nbn:se:kth:diva-154262 (accessed June 19, 2020).
[274] R.T. Hollingsworth, A SURVEY OF LARGE SPACE CHAMBERS, 15. [275] R.P. Eddy, Design and construction of the 15-ft-beam solar simulator SS15B, 1968.
https://ntrs.nasa.gov/search.jsp?R=19690008610 (accessed July 30, 2020). [276] R. BARNETT, C. THIELE, Jpl advanced solar simulator design type a(Advanced solar simulator-
space environment reproduction), (1963).
229
[277] P. Kuhn, A. Hunt, A new solar simulator to study high temperature solid-state reactions with highly concentrated radiation, Solar Energy Materials. 24 (1991) 742–750. https://doi.org/10.1016/0165-1633(91)90107-V.
[278] D.S. Codd, A. Carlson, J. Rees, A.H. Slocum, A low cost high flux solar simulator, Solar Energy. 84 (2010) 2202–2212. https://doi.org/10.1016/j.solener.2010.08.007.
[279] Hirsch, A. Zedtwitz, T. Osinga, J. Kinamore, A. Steinfeld, A New 75 kW High-Flux Solar Simulator for High-Temperature Thermal and Thermochemical Research, J. Sol. Energy Eng. 125 (2003) 117–120. https://doi.org/10.1115/1.1528922.
[280] J. Petrasch, A. Steinfeld, A Novel High-Flux Solar Simulator Based on an Array of Xenon Arc Lamps: Optimization of the Ellipsoidal Reflector and Optical Configuration, in: American Society of Mechanical Engineers Digital Collection, 2008: pp. 175–180. https://doi.org/10.1115/ISEC2005-76009.
[281] I. Alxneit, G. Dibowski, R12. 5 solar simulator evaluation report, Solar Facilities for the European Research Area Project, European Union, Brussels, Belgium, Deliverable. 12 (2011).
[282] K.R. Krueger, J.H. Davidson, W. Lipiński, Design of a New 45 kWe High-Flux Solar Simulator for High-Temperature Solar Thermal and Thermochemical Research, J. Sol. Energy Eng. 133 (2011). https://doi.org/10.1115/1.4003298.
[283] C. Dominguez, I. Anton, G. Sala, Solar simulator for indoor characterization of large area high-concentration PV modules, in: 2008 33rd IEEE Photovoltaic Specialists Conference, 2008: pp. 1–5. https://doi.org/10.1109/PVSC.2008.4922739.
[284] An experimental study on the effect of salt spray testing on the optical properties of solar selective absorber coatings produced with different manufacturing technologies | SpringerLink. https://link.springer.com/article/10.1007/s40095-019-0299-7 (accessed November 9, 2020).
[285] O. Raccurt, A. Disdier, Accelerated ageing tests for durability study of solar absorber coatings on metallic substrate for solar thermal energy (STE) application, 9.
[286] Durasol, DURASOL, DURASOL. https://www.durasol.fr/https://www.durasol.fr (accessed January 18, 2021).
[287] IEC 62108:2016 | IEC Webstore | rural electrification, solar panel, photovoltaic, PV, solar power, electricity, LVDC. https://webstore.iec.ch/publication/25938 (accessed January 18, 2021).
[288] IEC 61215-1:2016 | IEC Webstore | rural electrification, solar power, solar panel, photovoltaic, PV, smart city, LVDC. https://webstore.iec.ch/publication/24312 (accessed January 18, 2021).
[289] ISO 22975-3:2014(en), Solar energy — Collector components and materials — Part 3: Absorber surface durability. https://www.iso.org/obp/ui/#iso:std:iso:22975:-3:ed-1:v1:en (accessed November 9, 2020).
[290] F. Wiesinger, F. Sutter, F. Wolfertstetter, N. Hanrieder, A. Fernández-García, R. Pitz-Paal, M. Schmücker, Assessment of the erosion risk of sandstorms on solar energy technology at two sites in Morocco, Solar Energy. 162 (2018) 217–228. https://doi.org/10.1016/j.solener.2018.01.004.
[291] M. Bichotte, L. Dubost, T. Pouit, A. Soum-Glaude, A. Le Gal, H. Glenat, D. Itskhokine, Arc deposited TiAlN selective absorber for high temperature CSP applications, AIP Conference Proceedings. 1734 (2016) 030006. https://doi.org/10.1063/1.4949058.
[292] A. Soum‐Glaude, L.D. Giacomo, S. Quoizola, T. Laurent, G. Flamant, Selective Surfaces for Solar Thermal Energy Conversion in CSP: From Multilayers to Nanocomposites, in: Nanotechnology for Energy Sustainability, John Wiley & Sons, Ltd, 2017: pp. 231–248. https://doi.org/10.1002/9783527696109.ch10.
[293] M. Bichotte, T. Kämpfe, W. Iff, F. Celle, S. Reynaud, T. Pouit, A. Soum-Glaude, A. Le Gal, L. Dubost, Y. Jourlin, High efficiency concentrated solar power plant receivers using periodic microstructured absorbing layers, Solar Energy Materials and Solar Cells. 160 (2017) 328–334. https://doi.org/10.1016/j.solmat.2016.10.027.
[294] A. Soum-Glaude, I. Bousquet, M. Bichotte, S. Quoizola, L. Thomas, G. Flamant, Optical Characterization and Modeling of Coatings Intended as High Temperature Solar Selective Absorbers, Energy Procedia. 49 (2014) 530–537. https://doi.org/10.1016/j.egypro.2014.03.057.

230
[295] M. Bichotte, Réalisation d’un absorbeur solaire sélectif pour centrale CSP associant dépôt en couches minces et texturation de surface, These de doctorat, Lyon, 2017. https://www.theses.fr/2017LYSES013 (accessed May 26, 2021).
[296] Energy - Ireis. https://www.ireis.fr/en/energy.html (accessed October 15, 2020). [297] The NanoPlaST project, ANR NanoPlaST. https://nanoplast-project.cnrs.fr/ (accessed
December 9, 2020). [298] W. Münz, Titanium aluminum nitride films: A new alternative to TiN coatings, Journal of
Vacuum Science & Technology A. 4 (1986) 2717–2725. https://doi.org/10.1116/1.573713. [299] Industrial deposition of binary, ternary, and quaternary nitrides of titanium, zirconium, and
aluminum: Journal of Vacuum Science & Technology A: Vol 5, No 4. https://avs.scitation.org/doi/abs/10.1116/1.574948 (accessed December 4, 2020).
[300] Oxidation of metastable single‐phase polycrystalline Ti0.5Al0.5N films: Kinetics and mechanisms: Journal of Applied Physics: Vol 67, No 3. https://aip.scitation.org/doi/abs/10.1063/1.345664 (accessed December 4, 2020).
[301] High-temperature oxidation of ion-plated TiN and TiAlN films | SpringerLink. https://link.springer.com/article/10.1557/JMR.1993.1093 (accessed December 4, 2020).
[302] Y.K. Lee, K.M. Latt, T. Osipowicz, C. Sher-Yi, Study of diffusion barrier properties of ternary alloy (TixAlyNz) in Cu/TixAlyNz/SiO2/Si thin film structure, Materials Science in Semiconductor Processing. 3 (2000) 191–194. https://doi.org/10.1016/S1369-8001(00)00031-7.
[303] M.Y. Kwak, D.H. Shin, T.W. Kang, K.N. Kim, Characteristics of TiN barrier layer against Cu diffusion, Thin Solid Films. 339 (1999) 290–293. https://doi.org/10.1016/S0040-6090(98)01074-8.
[304] A. Schüler, V. Thommen, P. Reimann, P. Oelhafen, G. Francz, T. Zehnder, M. Düggelin, D. Mathys, R. Guggenheim, Structural and optical properties of titanium aluminum nitride films (Ti1−xAlxN), Journal of Vacuum Science & Technology A. 19 (2001) 922–929. https://doi.org/10.1116/1.1359532.
[305] K. Niranjan, P. Kondaiah, A. Biswas, V.P. Kumar, G. Srinivas, H.C. Barshilia, Spectrally Selective Solar Absorber Coating of W/WAlSiN/SiON/SiO2 with Enhanced Absorption through Gradation of Optical Constants: Validation by Simulation, Coatings. 11 (2021) 334. https://doi.org/10.3390/coatings11030334.
[306] Air-oxidation of nano-multilayered CrAlSiN thin films between 800 and 1000 °C - ScienceDirect, (). https://www.sciencedirect.com/science/article/pii/S0257897208009857?casa_token=j-QG7wAc8A8AAAAA:4YDuzqayHDbRPYi5k0MGuXfhY5P9z9Rngk0CVhp5DG69Q3NXL8ERw2fzGocW1VMNo72r5piQUw (accessed December 10, 2020).
[307] R.J. Lad, Multifunctional Silicon Aluminum Oxynitride (SiAlON) Ceramic Coatings for High Temperature Applications, MAINE UNIV AT ORONO LAB FOR SURFACE SCIENCE AND TECHNOLOGY, 2005. https://apps.dtic.mil/sti/citations/ADA444413 (accessed March 22, 2021).
[308] C.M. Lampert, Coatings for enhanced photothermal energy collection II. Non-selective and energy control films, Solar Energy Materials. 2 (1979) 1–17. https://doi.org/10.1016/0165-1633(79)90026-1.
[309] S. Zhao, E. Wäckelgård, Optimization of solar absorbing three-layer coatings, Solar Energy Materials and Solar Cells. 90 (2006) 243–261. https://doi.org/10.1016/j.solmat.2005.03.009.
[310] S. Meziani, A. Moussi, L. Mahiou, R. Outemzabet, Effect of thermal annealing on double anti reflection coating SiNx/SiO2, in: 2015 3rd International Renewable and Sustainable Energy Conference (IRSEC), 2015: pp. 1–5. https://doi.org/10.1109/IRSEC.2015.7454971.
[311] Magnetron sputtering facility - CSIR - NAL. https://www.nal.res.in/en/facilities/magnetron-sputtering-facility (accessed October 19, 2020).
[312] A. Fernández-García, F. Sutter, L. Martínez-Arcos, C. Sansom, F. Wolfertstetter, C. Delord, Equipment and methods for measuring reflectance of concentrating solar reflector materials, Solar Energy Materials and Solar Cells. 167 (2017) 28–52. https://doi.org/10.1016/j.solmat.2017.03.036.

231
[313] A. Soum-Glaude, Analyses expérimentales et simulation numérique d’un procédé PACVD pour le dépôt de couches minces à vocation mécanique, These de doctorat, Perpignan, 2006. https://www.theses.fr/2006PERP0760 (accessed March 22, 2021).
[314] K. Niranjan, A. Soum-Glaude, A. Carling-Plaza, S. Bysakh, S. John, H.C. Barshilia, Extremely high temperature stable nanometric scale multilayer spectrally selective absorber coating: Emissivity measurements at elevated temperatures and a comprehensive study on ageing mechanism, Solar Energy Materials and Solar Cells. 221 (2021) 110905. https://doi.org/10.1016/j.solmat.2020.110905.
[315] A. Boubault, B. Claudet, O. Faugeroux, G. Olalde, Accelerated Aging of a Solar Absorber Material Subjected to Highly Concentrated Solar Flux, Energy Procedia. 49 (2014) 1673–1681. https://doi.org/10.1016/j.egypro.2014.03.176.
[316] Y. Lalau, Etude du comportement thermomécanique de matériaux céramiques sous irradiation solaire concentrée : développement expérimental et modélisation, These de doctorat, Perpignan, 2017. http://www.theses.fr/2017PERP0061 (accessed July 15, 2020).
[317] R. Reoyo-Prats, Etude du vieillissement de récepteurs solaires : estimation de propriétés thermophysiques par méthode photothermique associée aux outils issus de l’intelligence artificielle, These de doctorat, Perpignan, 2020. http://www.theses.fr/2020PERP0017 (accessed January 25, 2021).
[318] R. Reoyo-Prats, A. Carling Plaza, O. Faugeroux, B. Claudet, A. Soum-Glaude, C. Hildebrandt, Y. Binyamin, A. Agüero, T. Meißner, Accelerated aging of absorber coatings for CSP receivers under real high solar flux – Evolution of their optical properties, Solar Energy Materials and Solar Cells. 193 (2019) 92–100. https://doi.org/10.1016/j.solmat.2018.12.030.
[319] J. Gum, Guide to the expression of uncertainty in measurement - Part 6: Developing and using measurement models, JCGM GUM-6:2020, 103.
[320] A. Salles, Etude du vieillissement thermique des materiaux absorbeurs pour les centrales solaires à concentration, Technical Intership PROMES-CNRS, IUT Mesures Physiques Montpellier-Sète, 2017.
[321] G. Scarel, J.-S. Na, G.N. Parsons, Angular behavior of the Berreman effect investigated in uniform Al2O3 layers formed by atomic layer deposition, J. Phys.: Condens. Matter. 22 (2010) 155401. https://doi.org/10.1088/0953-8984/22/15/155401.
[322] S. Raju, K. Sivasubramanian, R. Divakar, G. Panneerselvam, A. Banerjee, E. Mohandas, M.P. Antony, Thermal expansion studies on Inconel-600® by high temperature X-ray diffraction, Journal of Nuclear Materials. 325 (2004) 18–25. https://doi.org/10.1016/j.jnucmat.2003.10.007.
[323] Y. Okada, Y. Tokumaru, Precise determination of lattice parameter and thermal expansion coefficient of silicon between 300 and 1500 K, Journal of Applied Physics. 56 (1984) 314–320. https://doi.org/10.1063/1.333965.
[324] P.H. Richter, Estimating Errors in Least-Squares Fitting, 31. [325] P. Panjan, B. Navinšek, M. Čekada, A. Zalar, Oxidation behaviour of TiAlN coatings sputtered at
low temperature, Vacuum. 53 (1999) 127–131. https://doi.org/10.1016/S0042-207X(98)00407-2. [326] J.-L. Huang, B.-Y. Shew, Effects of Aluminum Concentration on the Oxidation Behaviors of
Reactively Sputtered TiAlN Films, Journal of the American Ceramic Society. 82 (1999) 696–704. https://doi.org/10.1111/j.1151-2916.1999.tb01819.x.
[327] M. Arntzen, S. Dreyer, J. Specht, T. Kuckelkorn, M. Schmidt, A. Sauerborn, Accelerated Ageing Tests on Schott PTR 70 HCE, (2011).
[328] J.P. Wang, B. Yuan, J. Wang, Y. Luo, Activation Energy Measurement of Cu/SS-AlN/SiAlOx Solar Selective Absorbing Coating, Materials Science Forum. 743–744 (2013) 870–877. https://doi.org/10.4028/www.scientific.net/MSF.743-744.870.
[329] R. Reoyo-Prats, A. Carling Plaza, O. Faugeroux, B. Claudet, A. Soum-Glaude, C. Hildebrandt, Y. Binyamin, A. Agüero, T. Meißner, Accelerated aging of absorber coatings for CSP receivers under real high solar flux – Evolution of their optical properties, Solar Energy Materials and Solar Cells. 193 (2019) 92–100. https://doi.org/10.1016/j.solmat.2018.12.030.
232
[330] K. Niranjan, A. Carling Plaza, T. Grifo, M. Bordas, A. Soum-Glaude, H.C. Barshilia, Performance evaluation and durability studies of W/WAlSiN/SiON/SiO2 based spectrally selective solar absorber coating for high-temperature applications: A comprehensive study on thermal and solar accelerated ageing, Solar Energy. 227 (2021) 457–467. https://doi.org/10.1016/j.solener.2021.09.026.
[331] B. Rousseau, J.F. Brun, D. Meneses, P. Echegut, Temperature Measurement: Christiansen Wavelength and Blackbody Reference, International Journal of Thermophysics. 26 (2005) 1277–1286. https://doi.org/10.1007/s10765-005-6726-4.
[332] D. Ngoue, (Nano)composites en revêtement déposés par technologie plasma pour la conversion de l’énergie solaire, These de doctorat, Perpignan, 2021. http://theses.fr/2021PERP0011 (accessed October 8, 2021).
[333] M. Bordas, Study of optical properties and aging of absorptive coatings for receivers of thermodynamic solar power plants, End-of-study internship report, Université de Perpignan, 2021.
[334] D. Hernandez, A. Netchaieff, A. Stein, True temperature measurement on metallic surfaces using a two-color pyroreflectometer method, Review of Scientific Instruments. 80 (2009) 094903. https://doi.org/10.1063/1.3208011.
[335] D.R. Lide, ed., CRC Handbook of Chemistry and Physics, 84th ed., CRC Press, 2004.

233
Annexes

234

235
1. SAAF set-up: estimation of the homogenized solar flux received by
the sample
The incoming radiation in the SAAF is adjusted by the aperture of the shutters, which varies from 0 to
100%. The shutter aperture is controlled by an external voltage V between -5 and 5 Volts. This voltage
is converted to a range from 0 to 1 with Eq.(36), to obtain the aperture percentage AS.
𝐴𝑆 = −0.1 · 𝑉 + 0.5 (36)
To calculate the output homogenized flux at the exit of the kaleidoscope placed at the focal of the
parabola, calorimetric measurements were carried out in 2017. They consisted in placing a calorimeter
at the exit of the kaleidoscope to measure the output flux at different shutter apertures (Figure 172).
Figure 172. Sample irradiation vs shutter opening for DNI = 1000 W/m²
The results were interpolated to obtain a fitting function. This function is used to establish the aperture
command needed to obtain the desired solar flux on the tested sample, placed at the output of the
kaleidoscope. The output flux after the kaleidoscope is represented by Eq.(37) vs. the shutters aperture
AS, corrected with the value of Direct Normal Irradiance (DNI) during the experiment. The parameters
obtained from Figure 172 are: a0 = -21.444, a1 = 270.60, a2 = 1102.57, a3 = -337.58.
𝛷 (𝑘𝑊/𝑚2) = (𝐷𝑁𝐼
1000) · (𝑎0 + 𝑎1𝐴𝑆 + 𝑎2𝐴𝑆
2 + 𝑎3𝐴𝑆3) (37)
2. SAAF set-up: pyrometry measurements
In SAAF experimental set-up, the temperature of the surface of the sample exposed to the
homogenized concentrated solar flux is measured by a pyrometer. The chosen pyrometer is an Optris
CTlaser G5H equipped with CF4 optics. It allows the measurement of temperature between 250°C and
1650°C and has a spectral response in a reduced range between 4.8 and 5.2 µm (see Chapter 3 section
3.2.2.1.5, p.112). It is thus considered as monochromatic at 5 µm.
2.1. Temperature estimation
The estimation of temperature is based on Planck’s law of blackbody (BB) radiation (Eq.(38)), which
relates the spectral irradiance (radiant exitance) of a blackbody 𝑀𝜆0(𝜆, 𝑇) to its temperature T.
𝑀𝜆0(𝜆, 𝑇)𝐵𝐵 =
2𝜋ℎ𝑐2
𝜆5 ∙ (𝑒ℎ𝑐
𝜆𝑘𝐵𝑇 − 1)
=𝐶1
𝜆5 ∙ (𝑒𝐶2𝜆𝑇 − 1)
(38)
𝐶1 = 2πℎ𝑐2 = 3.742 ⋅ 10−16 𝑊 ∙ 𝑚−2 ; 𝐶2 =ℎ𝑐
𝑘𝐵= 1.44 ⋅ 10−2 𝑚 ∙ 𝐾

236
The spectral emittance 𝜀𝜆(𝜆, 𝑇) of a sample at temperature T is defined as the ratio between the
spectral irradiance 𝑀𝜆0(𝜆, 𝑇)𝑠𝑎𝑚𝑝𝑙𝑒 emitted by the sample, and the spectral irradiance 𝑀𝜆
0(𝜆, 𝑇)𝐵𝐵
emitted by a blackbody at the same temperature (Eq.(39)).
𝜀(𝜆, 𝑇) ≡𝑀𝜆
0(𝜆, 𝑇)𝑠𝑎𝑚𝑝𝑙𝑒
𝑀𝜆0(𝜆, 𝑇)𝐵𝐵
(39)
The pyrometer detects 𝑀𝜆0(𝜆, 𝑇)𝑠𝑎𝑚𝑝𝑙𝑒 at 5 µm. The knowledge of the sample spectral emittance
𝜀𝜆(𝜆, 𝑇) at 5 µm gives direct access to the sample temperature T using Eq.(40) derived from combining
Eq.(38) and Eq.(39), with = 5 µm.
𝑇 = −𝐶2
𝜆∙ 𝑙𝑛 (
𝐶1 ∙ 𝜀𝜆(𝜆, 𝑇)
λ5 ⋅ 𝑀𝜆0(𝜆, 𝑇)𝑠𝑎𝑚𝑝𝑙𝑒
+ 1) (40)
Thus, the pyrometer calculates the temperature of the sample surface knowing the emittance of said
surface, and an emittance value must be input into the device before the measurements. The “real”
spectral emittance of the sample at 5 µm can be deduced from its spectral reflectance (measured with
SOC-100 reflectometer at room temperature before SAAF experiment), using Eq.(41). If this value is
used as input, the pyrometer can directly estimate the sample temperature from Eq.(40).
𝐸(𝜆, 𝜃, 𝑇) = 1 − 𝑅(𝜆, 𝜃, 𝑇) (41)
However this method can be inconvenient, as the emittance input value needs to be changed each
time a new sample is tested. Also, the sample emittance may evolve during the experiment during
aging, leading to inaccurate temperature estimation.
It is therefore more convenient to use instead a constant approximative emittance value 𝜀𝜆app(𝜆, 𝑇) as
input for all samples of the same type (e.g. 0.3 for TiAlN absorbers), then later deduce the sample real
temperature Treal by applying a correction to the temperature profile Tapp recorded by the pyrometer.
This correction considers the real emittance 𝜀𝜆real(𝜆, 𝑇) of the given sample measured before the aging
test, or the emittance measured after the test if it is very different from its initial value.
By design, the sample irradiance 𝑀𝜆0(𝜆, 𝑇)𝑠𝑎𝑚𝑝𝑙𝑒 detected by the pyrometer is the same, whatever the
input value of emittance. Therefore, from Eq.(38) and (39), Eq.(42) is deduced.
𝑀𝜆0(𝜆, 𝑇)𝑠𝑎𝑚𝑝𝑙𝑒 = 𝜀𝜆
app(𝜆, 𝑇) ∙𝐶1
𝜆5 ∙ (𝑒𝐶2
𝜆𝑇𝑎𝑝𝑝 − 1)
= 𝜀𝜆real(𝜆, 𝑇) ∙
𝐶1
𝜆5 ∙ (𝑒𝐶2
𝜆𝑇𝑟𝑒𝑎𝑙 − 1)
(42)
A temperature correction can be deduced from Eq.(42), as given by Eq.(43).
𝑇𝑟𝑒𝑎𝑙 = [𝜆
𝐶2∙ 𝑙𝑛 (
𝜀𝜆real(𝜆, 𝑇)
𝜀𝜆app(𝜆, 𝑇)
) +1
𝑇𝑎𝑝𝑝]
−1
(43)
Such temperature correction is illustrated in Figure 173, where Treal of samples with real emittance
𝜀𝜆real(𝜆, 𝑇) between 0.10 and 0.20 is plotted for an approximative input emittance 𝜀𝜆
app(𝜆, 𝑇) = 0.15
and Tapp detected in the range of 200 to 600°C. At low temperatures, the approximative temperature
Tapp (x-axis) remains close to the real temperature Treal (y-axis), by 20 to 30°C. At high temperatures the
correction is indispensable, with a difference higher than 100°C between the approximative and real
temperature, for a difference of only 0.05 between approximative and real emittance.

237
Figure 173. Treal vs. Tapp at 𝜺𝝀
𝐚𝐩𝐩(𝝀, 𝑻) = 0.15 for different values of 𝜺𝝀𝐫𝐞𝐚𝐥(𝝀, 𝑻)
2.2. Pyrometer calibration
The pyrometer was calibrated in temperature using a blackbody SR-2 from ECI systems (Figure 174)
with = 0.99 ± 0.01. The temperature of the blackbody was varied from 250 to 1150°C with a step of
50°C. Table 46 shows the temperature read by the pyrometer with input emittance of 0.98. The
pyrometer gives accurate measurements, with maximum relative errors of 2-3% below 700°C.
Figure 174. Pyrometer calibration set-up
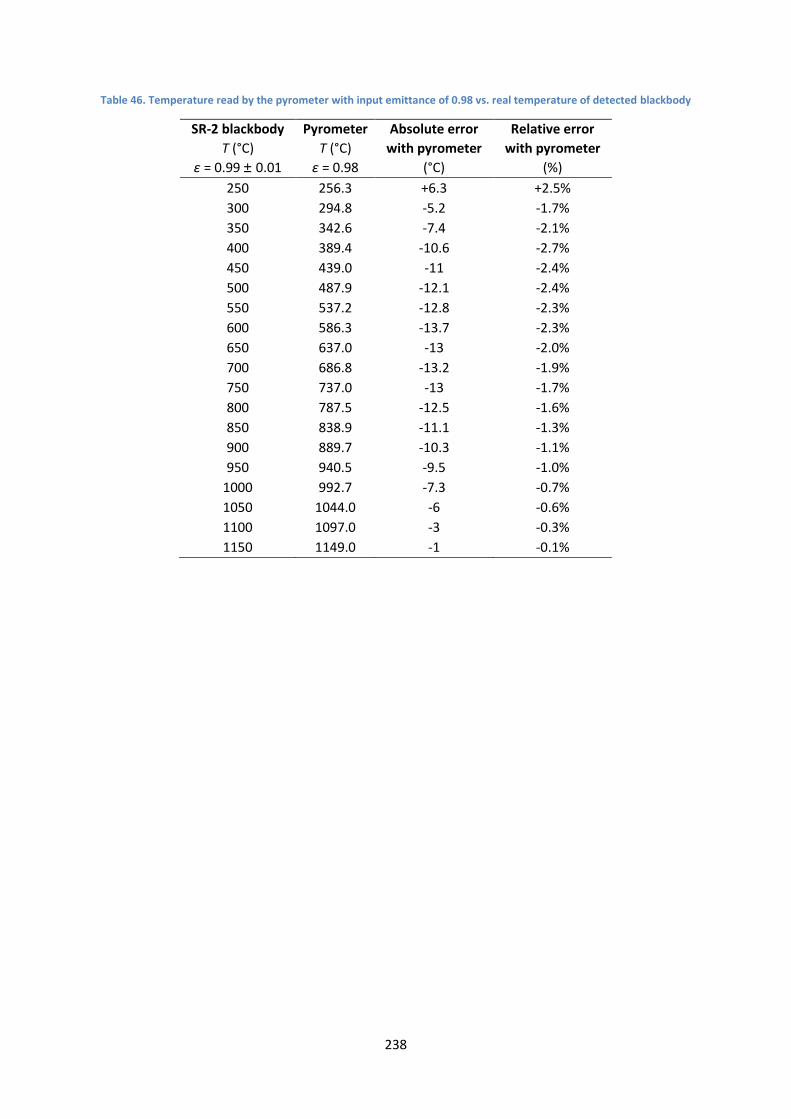
238
Table 46. Temperature read by the pyrometer with input emittance of 0.98 vs. real temperature of detected blackbody
SR-2 blackbody
T (°C)
Pyrometer
T (°C)
Absolute error
with pyrometer
(°C)
Relative error
with pyrometer
(%) ε = 0.99 ± 0.01 ε = 0.98
250 256.3 +6.3 +2.5%
300 294.8 -5.2 -1.7%
350 342.6 -7.4 -2.1%
400 389.4 -10.6 -2.7%
450 439.0 -11 -2.4%
500 487.9 -12.1 -2.4%
550 537.2 -12.8 -2.3%
600 586.3 -13.7 -2.3%
650 637.0 -13 -2.0%
700 686.8 -13.2 -1.9%
750 737.0 -13 -1.7%
800 787.5 -12.5 -1.6%
850 838.9 -11.1 -1.3%
900 889.7 -10.3 -1.1%
950 940.5 -9.5 -1.0%
1000 992.7 -7.3 -0.7%
1050 1044.0 -6 -0.6%
1100 1097.0 -3 -0.3%
1150 1149.0 -1 -0.1%

Abstract Concentrated solar power (CSP) plants provide renewable energy thanks to the concentration of solar
irradiation by mirrors upon a solar absorber, which converts it first into heat, enabling large-scale thermal
storage to mitigate solar intermittence, then into electricity. The lifetime over which performance is expected
to be maintained is typically 25 to 30 years for this technology. However, the latter operates under very
demanding conditions for materials (highly concentrated solar irradiance/high temperature combined with
oxidant/corrosive atmospheric conditions). The main component exposed to these harsh conditions is the
solar absorber, susceptible to high deterioration resulting in high sun-to-heat conversion losses. The solar
absorber is often covered with a selective absorber coating, to increase the absorption of solar radiation
(high solar absorptance) while reducing radiative thermal losses (low emittance). This solution is optically
efficient but requires complex multilayer coating architectures which may easily suffer degradations in CSP
conditions of use. It is therefore crucial to prove the durability of new solar absorber coating architectures
before they can be used in CSP installations. Aging tests must be applied to study their thermal stability,
reliability and potential service life. However, no standardized aging procedures for solar absorber coatings
exist today. This thesis work thus provides: i) a critical review of existing aging protocols and tools, and
identified aging phenomena; ii) a critical analysis of classical (purely thermal) and original (thermal +
concentrated solar) aging protocols based on their experimental application to three types of new selective
absorber coatings, using two unique aging tools including a solar furnace. The influence of the main sources
of degradation in real CSP operation (high temperature, high concentrated solar irradiation, slow/rapid
thermal cycling) is investigated and partly decorrelated, by following the evolution with aging of their optical
performance, surface state and chemical composition. This work analyses the pertinence of studied aging
protocols and tools, and proposes broadly applicable strategies for solar absorber coating developers.
Résumé Les centrales solaires à concentration (CSP) fournissent une énergie renouvelable grâce à la concentration
de l’irradiation solaire par des miroirs sur un absorbeur solaire, la convertissant en chaleur, stockable à
grande échelle pour s’affranchir de l’intermittence solaire, puis en électricité. La durée de vie durant laquelle
les performances doivent être maintenues est de 25 à 30 ans pour cette technologie. Cependant, cette
dernière opère dans des conditions très exigeantes pour les matériaux (forte concentration solaire/haute
température combinées à des atmosphères oxydantes/corrosives). Le composant principal exposé à ces
conditions sévères est l’absorbeur solaire. Il peut se détériorer et générer de fortes pertes optiques et
thermiques. Les absorbeurs solaires sont souvent recouverts d’un revêtement absorbeur sélectif augmentant
l’absorption du rayonnement solaire (forte absorptance solaire) et réduisant les pertes thermiques radiatives
(faible émittance). Cette solution très efficace optiquement nécessite des architectures multicouches
complexes, qui peuvent se dégrader en conditions d’usage CSP. Il est donc crucial de démontrer la durabilité
des nouveaux revêtements absorbeurs solaires sélectifs avant de les utiliser dans des installations CSP réelles.
Des tests de vieillissement doivent être appliqués pour étudier leur stabilité thermique, leur fiabilité et leur
durée de vie potentielle, mais il n’existe pas à ce jour de procédures de vieillissement standardisées pour les
revêtements absorbeurs solaires. Ainsi ce travail de thèse fournit : i) une revue critique des protocoles et
moyens de vieillissement existants, et des phénomènes de vieillissement identifiés ; ii) une analyse critique
de protocoles de vieillissement classiques (thermiques) et originaux (thermique + solaire concentré), basée
sur leur application expérimentale sur trois types de revêtements absorbeurs solaires sélectifs, grâce à deux
bancs de vieillissement très originaux dont un four solaire. L’influence des sources de dégradation en
conditions d’usage CSP (haute température, forte irradiation solaire concentrée, cyclage thermique lent et
rapide) est investiguée et partiellement décorrélée, grâce au suivi des performances optiques, de l’état de
surface et de la composition chimique des matériaux vieillis. Ce travail analyse la pertinence des protocoles
et moyens de vieillissement étudiés, et tente de proposer une stratégie de vieillissement applicable pour les
développeurs de revêtements absorbeurs solaires sélectifs.
Copyright © 2022 FDOKUMEN