Role of a simplified hydrological cycle and clouds in regulating the climate-biota system of...
15
Tellus (2009), 61B, 483–497 C 2008 The Authors Journal compilation C 2008 Blackwell Munksgaard Printed in Singapore. All rights reserved TELLUS Role of a simplified hydrological cycle and clouds in regulating the climate–biota system of Daisyworld By JUAN FERNANDO SALAZAR ∗ and G E R M ´ AN POVEDA, School of Geosciences and Environment, Universidad Nacional de Colombia, Medell´ ın, Colombia (Manuscript received 13 July 2007; in final form 18 November 2008) ABSTRACT The role of a simplified hydrological cycle and a physical representation of clouds is investigated in the Daisyworld model, subject to constant and variable solar forcing and varying cloud albedo and height. Under constant forcing, properties of the cloudy hydrologic cycle control the long-term system dynamics to non-oscillatory, oscillatory, abiotic or biotic states. In case of oscillatory solutions, their amplitude and periodicity are controlled by the net cooling or warming effects from clouds. Two conditions are considered under variable forcing—active or neutral—depending on the existence or not of biota–environment feedbacks. Temperature, cloudiness and hydrological variables are self- regulated in the active condition, whereas non-regulated in the neutral condition. Self-regulation is quantified through two measurements (luminosity range and total life), both of which can be larger in our model than in several other variants of Daisyworld, depending on cloud characteristics. The hydrological cycle and clouds can make the planet more habitable for life, independent of the capacity of the system for biological adaptation. Two hypotheses are put forward: (1) beneficial effects for life emerge from biota–clouds interactions, enhancing the global amount of life and extending the life span; and (ii) the existence of a maximum self-regulation capacity principle. 1. Introduction Gaia theory postulates that life and its environment evolve on Earth as a coupled self-regulated system that maintains the planet in an habitable state for life (Lovelock, 2003), and Daisyworld (DW) constitutes the scientific framework of Gaia theory (Watson and Lovelock, 1983; Lenton and Lovelock, 2001). Daisyworld is a zero-dimensional model of radiative bal- ance at a global scale, which represents an imaginary planet similar in size to Earth, rotating around a Sun, which acts as its energy source, ocean-devoid but containing enough water to sustain life and covered by white and black daisies, whose albe- dos are greater and lesser than bare ground, respectively. The fundamental idea on the functioning of DW refers to the es- tablishment of self-regulation of the system through feedbacks between biota and its environment. Even though some consider DW too a simple model to gain understanding of Earth’s climate system (Kirchner, 2002; Volk, 2002), it has inspired a number of variants together with analy- sis (Lenton and Lovelock, 2001 and references therein) and has included different kinds of biological dynamics as well as en- hanced biodiversity (Harding and Lovelock, 1996), ‘Darwinian ∗ Corresponding author. e-mail: [email protected] DOI: 10.1111/j.1600-0889.2008.00411.x Daisyworlds’ including adaptation and competence for multi- ple resources (Stocker, 1995; Robertson and Robinson, 1998; Cohen and Rich, 2000; Lenton and Lovelock, 2000), as well as different fertile ground colonization strategies by daisies (Seto and Akagi, 2005). Some other variants of DW use di- verse explicit representations of space (Von Bloh et al., 1997; Ackland et al., 2003; Adams et al., 2003). On the other hand, Nevison et al. (1999) modify the energy balance equation of the original DW to take account of the planetary heat capacity (de- tails are given in the following section). Results from DW-like models include the existence of chaotic dynamics (Zeng et al., 1992, 1990; Jarcourt and Raymond, 1992) and detailed mathe- matical elaborations on the biological and physical dynamics (Saunders, 1994; Weber, 2001; Sugimoto, 2002; Weber and Robinson, 2004). The hydrological cycle is a highly non-linear component of the climate system (Chahine, 1992; Pierrehumbert, 2002; Stephens et al., 2004), and vegetation plays a very important role in the dynamics of the planetary hydrological cycle and cli- mate through regulation of the planetary water, energy and car- bon budgets (Hutjes et al., 1998). In spite of the highly relevant role the hydrological cycle plays in climate models of diverse complexity (e.g. Chu and Ledley, 1995; Szilder and Lozowski, 1996), it has been largely ignored in models of DW, with few exceptions. Baldocchi et al. (2005) introduce a ‘wet/dry DW’ that considers the influence of vegetation (daisies) on the latent Tellus 61B (2009), 2 483 PUBLISHED BY THE INTERNATIONAL METEOROLOGICAL INSTITUTE IN STOCKHOLM SERIES B CHEMICAL AND PHYSICAL METEOROLOGY
-
Upload
independent -
Category
Documents
-
view
2 -
download
0
Transcript of Role of a simplified hydrological cycle and clouds in regulating the climate-biota system of...

Tellus (2009), 61B, 483–497 C© 2008 The AuthorsJournal compilation C© 2008 Blackwell Munksgaard
Printed in Singapore. All rights reserved
T E L L U S
Role of a simplified hydrological cycle and clouds inregulating the climate–biota system of Daisyworld
By JUA N FER NA N D O SA LA ZA R∗ and G ER M A N POV EDA , School of Geosciences and Environment,Universidad Nacional de Colombia, Medellın, Colombia
(Manuscript received 13 July 2007; in final form 18 November 2008)
A B S T R A C TThe role of a simplified hydrological cycle and a physical representation of clouds is investigated in the Daisyworldmodel, subject to constant and variable solar forcing and varying cloud albedo and height. Under constant forcing,properties of the cloudy hydrologic cycle control the long-term system dynamics to non-oscillatory, oscillatory, abioticor biotic states. In case of oscillatory solutions, their amplitude and periodicity are controlled by the net cooling orwarming effects from clouds. Two conditions are considered under variable forcing—active or neutral—dependingon the existence or not of biota–environment feedbacks. Temperature, cloudiness and hydrological variables are self-regulated in the active condition, whereas non-regulated in the neutral condition. Self-regulation is quantified throughtwo measurements (luminosity range and total life), both of which can be larger in our model than in several othervariants of Daisyworld, depending on cloud characteristics. The hydrological cycle and clouds can make the planetmore habitable for life, independent of the capacity of the system for biological adaptation. Two hypotheses are putforward: (1) beneficial effects for life emerge from biota–clouds interactions, enhancing the global amount of life andextending the life span; and (ii) the existence of a maximum self-regulation capacity principle.
1. Introduction
Gaia theory postulates that life and its environment evolveon Earth as a coupled self-regulated system that maintainsthe planet in an habitable state for life (Lovelock, 2003), andDaisyworld (DW) constitutes the scientific framework of Gaiatheory (Watson and Lovelock, 1983; Lenton and Lovelock,2001). Daisyworld is a zero-dimensional model of radiative bal-ance at a global scale, which represents an imaginary planetsimilar in size to Earth, rotating around a Sun, which acts asits energy source, ocean-devoid but containing enough water tosustain life and covered by white and black daisies, whose albe-dos are greater and lesser than bare ground, respectively. Thefundamental idea on the functioning of DW refers to the es-tablishment of self-regulation of the system through feedbacksbetween biota and its environment.
Even though some consider DW too a simple model to gainunderstanding of Earth’s climate system (Kirchner, 2002; Volk,2002), it has inspired a number of variants together with analy-sis (Lenton and Lovelock, 2001 and references therein) and hasincluded different kinds of biological dynamics as well as en-hanced biodiversity (Harding and Lovelock, 1996), ‘Darwinian
∗Corresponding author.e-mail: [email protected]: 10.1111/j.1600-0889.2008.00411.x
Daisyworlds’ including adaptation and competence for multi-ple resources (Stocker, 1995; Robertson and Robinson, 1998;Cohen and Rich, 2000; Lenton and Lovelock, 2000), as wellas different fertile ground colonization strategies by daisies(Seto and Akagi, 2005). Some other variants of DW use di-verse explicit representations of space (Von Bloh et al., 1997;Ackland et al., 2003; Adams et al., 2003). On the other hand,Nevison et al. (1999) modify the energy balance equation of theoriginal DW to take account of the planetary heat capacity (de-tails are given in the following section). Results from DW-likemodels include the existence of chaotic dynamics (Zeng et al.,1992, 1990; Jarcourt and Raymond, 1992) and detailed mathe-matical elaborations on the biological and physical dynamics(Saunders, 1994; Weber, 2001; Sugimoto, 2002; Weber andRobinson, 2004).
The hydrological cycle is a highly non-linear componentof the climate system (Chahine, 1992; Pierrehumbert, 2002;Stephens et al., 2004), and vegetation plays a very importantrole in the dynamics of the planetary hydrological cycle and cli-mate through regulation of the planetary water, energy and car-bon budgets (Hutjes et al., 1998). In spite of the highly relevantrole the hydrological cycle plays in climate models of diversecomplexity (e.g. Chu and Ledley, 1995; Szilder and Lozowski,1996), it has been largely ignored in models of DW, with fewexceptions. Baldocchi et al. (2005) introduce a ‘wet/dry DW’that considers the influence of vegetation (daisies) on the latent
Tellus 61B (2009), 2 483
P U B L I S H E D B Y T H E I N T E R N A T I O N A L M E T E O R O L O G I C A L I N S T I T U T E I N S T O C K H O L M
SERIES BCHEMICALAND PHYSICAL METEOROLOGY
484 J. F. SALAZAR AND G. POVEDA
heat flux exchange at the surface, but that fails to take intoaccount an explicit representation of either the hydrologicalcycle or of clouds. Nordstrom et al. (2005) construct a zero-dimensional Earth-like DW that becomes too complex so as toimpede comparisons.
This paper aims to investigate the role of simple albeit soundrepresentations of the hydrological cycle and clouds in a DWmodel, to further our understanding of the dynamics and self-regulation of the climate–biota system, while keeping the origi-nal spirit of DW as a parable with possible implications for theEarth’s system (Watson and Lovelock, 1983). Consequently, wedevelop and implement a DW model involving the dynamicsof a simplified hydrological cycle (via precipitation and evapo-transpiration) and the most relevant physical characteristics ofclouds and study its long-term climatic, hydrological and bioticdynamics. As such, our model is referred to as DAisy Worldwith HYdrological Cycle and Clouds (DAWHYC, hereafter).
2. Model description
Daisyworld is represented by a system of coupled ordinary non-linear differential equations that model the global radiative bal-ance and the dynamics of black and white daisies populations.The original DW (Watson and Lovelock, 1983) assumes an ex-act energy balance between the planetary net incident short-waveand outgoing long-wave radiations. Afterwards, Nevison et al.(1999) modified this assumption using a time rate of change forthe system’s internal energy as a function of the planetary meanheat capacity or thermal inertia, cp, such that
cpdT
dt= SL(1 − αs) − σT 4, (1)
where S is the present-day constant solar radiation flux reachingthe planet, L is a dimensionless measure of the Sun’s luminosityrelative to present conditions, α s is the average planetary surfacealbedo, σ is the Stefan–Boltzmann constant for black-body radi-ation and T is the average planetary temperature. The model ofNevison et al. (1999) (NGK99, hereafter) is completed with theoriginal equations of DW for the evolution of daisy populations,as well as for variations of the average planetary albedo and theinternal distribution of heat within the system, expressed as,
dai
dt= ai[(1 − aw − ab)βi − γ ], (2)
αs = (1 − aw − ab)αd + awαw + abαb, (3)
βi = max
[0 , 1 −
(Ti − Topt
17.5
)2], (4)
Ti = q(αs − αi) + T , (5)
where the subscripts, i = b, w, d refer to black daisies (b),white daisies (w) and bare soil (d), whose area fractions aredenoted by ab, aw, and ad, respectively. Likewise, their albedos
are denoted by αb, αw, and αd; whereas β b and βw denote thegrowth rate of black and white daisies, respectively. γ is themortality rate and Topt is the optimal growth temperature, whichare assumed equal for both types of daisies; Tb and Tw representlocal temperatures determining the growth rate of each daisies,and q is a coefficient that represents the energy flux among thevarious land cover types.
The DAWHYC introduces two fundamental modificationswith respect to NGK99, as follows: (1) clouds make up partof the planetary energy balance and (2) the hydrological cy-cle is involved through a simple representation of precipitationand evapotranspiration. As such, DAWHYC’s energy balanceequation is
cpdT
dt= SL(1 − αcac)(1 − αs) + σT 4
c εcac − σT 4εs, (6)
where cp, T , S, L and σ are defined as in eq. (1). Additionally,the following cloud characteristics are used: albedo (αc), tem-perature (Tc, assumed as a single value for the bottom of thecloud layer), emissivity (εc) and cloud cover area fraction (ac).Also, land surface albedo (α s) and emissivity (εs) are considered.Equation (6) expresses that the planetary surface receives energyfrom the Sun and from its atmosphere by virtue of the naturalgreenhouse effect. The DAWHYC assumes that the greenhouseeffect is solely due to the presence of water in the atmosphere,and also that water is always contributing to cloud formation. Todetermine Tc, it is necessary to assume a tropospheric tempera-ture lapse rate, � = −dT/dz, such that
Tc = T − zc�, (7)
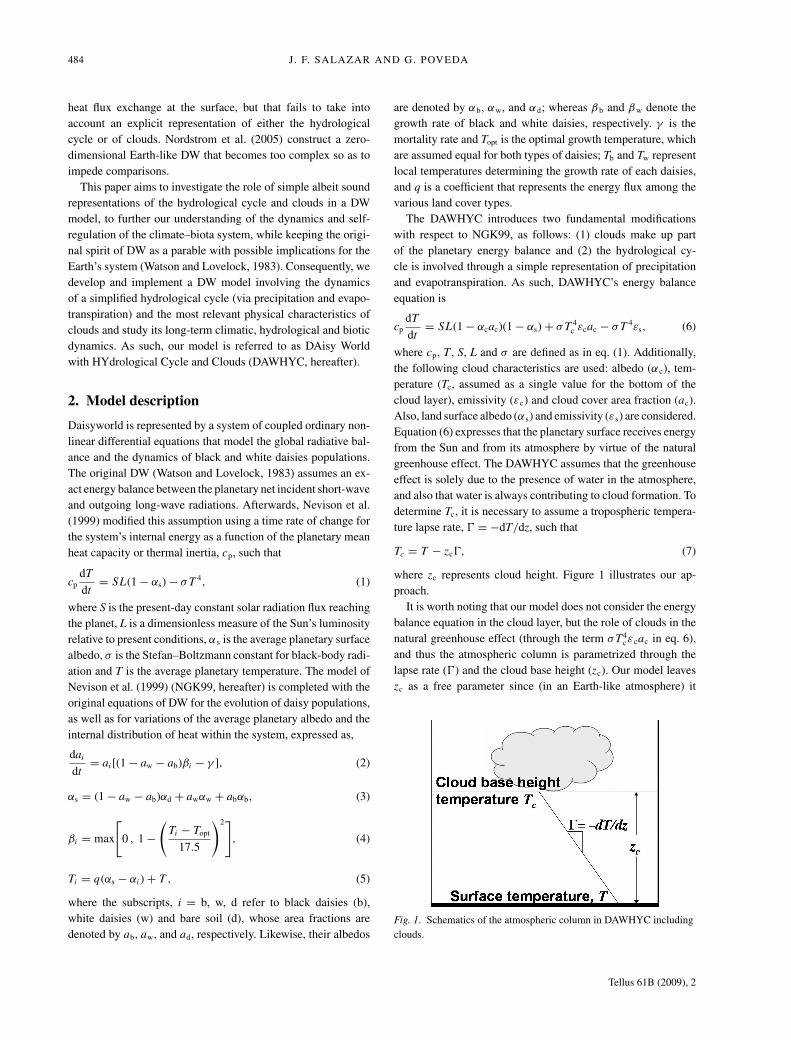
where zc represents cloud height. Figure 1 illustrates our ap-proach.
It is worth noting that our model does not consider the energybalance equation in the cloud layer, but the role of clouds in thenatural greenhouse effect (through the term σT4
cεcac in eq. 6),and thus the atmospheric column is parametrized through thelapse rate (�) and the cloud base height (zc). Our model leaveszc as a free parameter since (in an Earth-like atmosphere) it
Fig. 1. Schematics of the atmospheric column in DAWHYC includingclouds.
Tellus 61B (2009), 2
HYDROLOGICAL CYCLE AND CLOUDS IN DAISYWORLD 485
depends on the saturation conditions of the atmospheric column,and thus different saturation conditions give rise to differentvalues of zc. Note that the energy balance in the cloud layer isnot violated as it is controlled by changes in variables such as thesaturated lapse rate, the vertical depth of the cloud layer and itstemperature aloft, all of which are not prescribed in our model.Thus, we fix � and vary zc within a realistic range of values.We avoided an explicit computation of the atmospheric energybalance as it led to unrealistic temperature lapse rates (verifiedin experiments not shown here), unless the energetic role ofwater in the atmospheric column is taken into account. Such anexplicit representation would imply a complete reformulationof the model in terms of saturation conditions imposed by theClausius–Clapeyron equation, leading our model far beyond therealm of DW. We aim to keep our model simple enough toallow for comparisons with other variants of DW. This is whythe energy balance of the cloud layer is parametrized via eq. (7),which links both cloud and surface temperatures, while allowingalbedo, height and cloud cover area to vary independently.
The hydrological cycle is represented by,
dac
dt= E(t) − P (t), (8)
with,
E = (1 − ac)Ep, (9)
P = acPp, (10)
where Ep and Pp denote fractions, between 0 and 1, associatedwith cloud cover growth and demise rates, respectively. For thesake of simplicity, from eq. (9) onwards, we neglect the explicittime dependence representation of E(t) and P(t).
Under the assumption that all atmospheric water contributesto cloud formation, ac is a measure of the atmospheric water con-tent, and eq. (8) represents the mass conservation law, wherebyac is a time-varying quantity that depends on the difference be-tween inputs to, E = (1 − ac)Ep , and outputs from, P = acPp ,the control volume. Therefore, E and P can be qualitatively as-sociated with actual evapotranspiration and precipitation rates,respectively, given that both fluxes affect the rates of cloud covergrowth and demise rates, through changes in the atmosphericwater content. The form of (1 − ac)Ep aims to represent thedependence of actual evapotranspiration from two factors: the‘atmospheric available space’, or saturation degree of the at-mosphere, (1 − ac), and the available phase transition energy orpotential evapotranspiration, Ep . It is implicitly assumed that theplanetary surface is not water-limited, but energy-limited. Like-wise, precipitation rate, acPp , depends on both the atmosphericavailable moisture, or precipitable water, and Pp , which can beviewed as a ‘potential precipitation’. It represents all rainfall-producing processes, such as condensation and water dropletformation. As previously discussed, a further detailing of theseprocesses implies a dynamic representation of atmospheric wa-
ter and energy budgets, thus leading to a much more complicatedversion of the hydrological cycle. As is, DAWHYC involves theenergetic role of clouds and the dynamics of a simple albeitrealistic hydrological cycle.
Estimation of Ep and Pp will be based on simple hydrologicalprinciples and observations. For precipitation, we use a modifiedversion of the power law between average annual precipitationand cloudiness, found by Nordstrom et al. (2005) with data fromBeijing between 1951 and 1990 reported by Wang et al. (1993),
Pp = 1
Pmax
(ac
m
)1/n
, (11)
where m and n are estimated from observations. We fix n =0.1 after Nordstrom et al. (2005), and set m = 0.35 to repro-duce mean annual global precipitation (P ∼ 1000 mm yr−1)when cloud cover equals the annual global average (ac ∼ 0.7;Hartmann, 1994). We introduce Pmax (maximum possible pre-cipitation) to express precipitation as a dimensionless quantity.We assume that this value is reached when ac = 1.0, so thatPmax = 36 251 mm yr−1 is estimated from eq. (11) with Pp =1.0. Note that a maximum precipitation value of over 36 m yr−1
might be in excess of anywhere to be found on the Earth. Infact, the rainiest place on Earth is located on the Pacific coast ofColombia, exhibits mean annual rainfall rates of 12 700 mm yr−1
and some years like 1974 experiencing 26 m of rainfall (Povedaand Mesa, 2000)! However, note that the maximum precipitationvalue corresponds to a cloudiness of 100% (ac = 1.0), that is aplanet completely covered by clouds, which is also unlikely onEarth. Thus, Pmax, as well as ac = 1.0, should be understood astheoretical upper limits.
To relate Ep with surface temperature, T, we use a simplifiedversion of the Thornthwaite equation within the interval from277 to ∼313 K,
Ep = ETP/ETPmax, (12)
with
ETP = 192(10T /I )k, (13)
I = 12(T /5)1.5, (14)
k = 6.7 × 10⁻⁷I 3 − 7.7 × 10⁻⁵I 2 + 1.8 × 10⁻²I + 0.49,
(15)
assuming that temperature remains constant throughout the year.T is measured in ◦C, I is the annual caloric index and ETPmax
is the maximum possible potential evapotranspiration whichis assumed equal to Pmax. We define Ep = 0 if T ≤ 277 andEp = 1 if ETP ≥ ETPmax. The Thornthwaite equation is basedon the Gaian-like idea that evaporation is related to plant growthand growth to temperature (John Gash, personal communication,2007).
The formulation of DAWHYC is completed with eq. (2)–(5)from the original DW. Note that NGK99 is the particular case
Tellus 61B (2009), 2

486 J. F. SALAZAR AND G. POVEDA
of DAWHYC devoid of a hydrological cycle and clouds, that is,ac = P = E = 0.
3. Results
Two experiments are performed on DAWHYC. The first onestudies the influence of clouds on the planetary physical andbiological dynamics, under constant external solar forcing. Thesecond experiment studies the evolution of DAWHYC’s climate-biota system under increasing solar forcing, while consideringdiverse combinations of clouds characteristics. Table 1 showsthose parameters that are kept constant in both experiments.From those values it is worth noting that DAWHYC’s cp =3.0 × 10¹⁰ J m−2 K−1 is high in comparison with that of theEarth (the heat capacity per unit area of a 2.4-m ocean mixedlayer is about 1.0 × 10⁷ J m−2 K−1). However, we use thatvalue after Nevison et al. (1999) for the sake of comparison.Implications of the chosen value of cp are addressed in thediscussion section. Solutions were obtained using a fourth orderRunge–Kutta method, with time steps of 0.01 yr and solar forcingincrements of 0.004.
3.1. The influence of clouds under constant externalsolar forcing
The first experiment aims to study the equilibrium states of theclimatic, hydrological and biotic variables and their dependenceon the characteristics of clouds. These equilibrium states are ar-rived at by running the model during a time horizon of 10 000 yr,in which solar forcing remains equal to its present value(L = 1.0). Variables at equilibrium state are denoted with thesuperscript ‘eq’ (e.g. Teq). Results in Table 2 show the appear-
Table 1. DAWHYC parameters
Parameter Units Value Data source
cp J m−2 K−1 3.0 × 10¹⁰ (Nevison et al., 1999)S J m−2 yr−1 2.89 × 10¹⁰ (Nevison et al., 1999)σ J m−2 yr−1 K−4 1.79 (Nevison et al., 1999)αb dimensionless 0.25 (Nevison et al., 1999)αw dimensionless 0.75 (Nevison et al., 1999)αd dimensionless 0.50 (Nevison et al., 1999)εs dimensionless 1.0 fixedεn dimensionless 1.0 fixedγ dimensionless 0.3 (Nevison et al., 1999)q K 20 (Nevison et al., 1999)Topt K 295.5 (Nevison et al., 1999)� K km−1 6.5 (Hartmann, 1994)EVPmax mm yr−1 36251 estimatedPmax mm yr−1 36251 estimatedn dimensionless 0.10 (Nordstrom et al., 2005)m dimensionless 0.35 estimated
Table 2. Types of equilibrium states in DAWHYC with L = 1.0,depending on cloud albedo (αc) and height (zc)
αczc(km) 0.2 0.3 0.4 0.5 0.6 0.7 0.8 0.9
1 1+ 1+ 1+ 1+ 1+ 3− 6− 6−2 1+ 1+ 1+ 2+ 3− 6− 6− 6+3 1+ 1+ 2+ 3− 6− 6− 6+ 6+4 1+ 2+ 3− 6− 6− 6+ 6+ 4+5 2+ 2− 6− 6− 6− 6+ 6+ 4−6 2− 6− 6− 6− 6+ 6+ 5+ 4−7 6− 6− 6− 6+ 6+ 6+ 4+ 4−8 6− 6− 6− 6+ 6+ 6+ 4− 4−
Note: 1, abiotic; 2, only white daisies; 3, both daisies (aeqw � aeq
b ); 4,only black daisies; 5, both daisies (aeq
w aeqb ); 6, both daisies and
oscillations. Signs indicate whether mean temperature (T ) inDAWHYC is higher (+) or lower (−) than in NGK99.
ance of both steady non-oscillatory and oscillatory equilibriumstates, depending on the values of the cloud parameters αc andzc. We vary αc between 0.2 and 0.9, with increments of 0.1,and zc between 1 and 8 km, each 1 km, and considering allpossible combinations. Such ranges correspond to typical val-ues of the albedo of clouds on Earth (Fu, 2003) and troposphericheights which include low (<2 km), mid-level (2–7 km) and high(>7 km) clouds (Rangno, 2003).
Results summarized in Table 2 show that all equilibrium statescan be classified into six categories, depending on the character-istics of clouds. (1) A steady non-oscillatory abiotic state (aeq
b =aeq
w = 0) where the planet is too hot (Teq > 80 ◦C) to be habitablebecause of the strong greenhouse effect enhanced by clouds oflow albedo and height. (2) A steady non-oscillatory state whereonly white daisies survive in a not too hot planet warmed by agreenhouse effect due to clouds with low to middle height andalbedo. (3) A steady non-oscillatory state for both species ofdaises, whereby aeq
w � aeqb . (4) A steady non-oscillatory state
where only black daisies survive in a not too cold planet cooledby clouds with middle to high albedo and height, thus enhancingthe reflection of short-wave radiation to the space. (5) A steadynon-oscillatory state for both species of daises, whereby aeq
w aeq
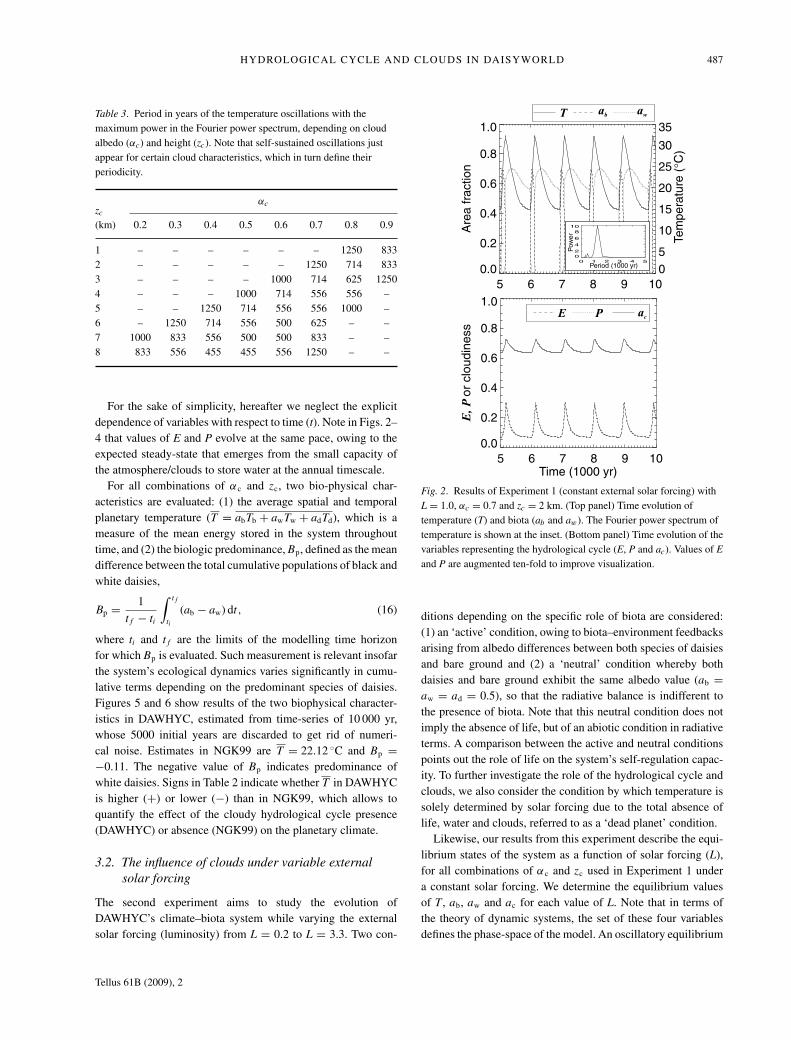
b . Finally, (6) a self-sustained oscillatory equilibrium state inthe dynamics of area fractions of black daisies (ab(t)), whitedaisies (aw(t)), cloudiness (ac(t)), temperature (T(t)), evapotran-spiration (E(t)) and precipitation (P(t)). This latter equilibriumstate points out a remarkable result from DAWHYC: the ampli-tude and periodicity of self-sustained oscillations are stronglycontrolled by the clouds’ characteristics. Table 3 shows theperiod with the maximum power in the Fourier spectrum ofthe resulting temperature record. Figures 2–4 show different ex-amples of the identified self-sustained oscillations, with theircorresponding power spectrum at the inset.
Tellus 61B (2009), 2
HYDROLOGICAL CYCLE AND CLOUDS IN DAISYWORLD 487
Table 3. Period in years of the temperature oscillations with themaximum power in the Fourier power spectrum, depending on cloudalbedo (αc) and height (zc). Note that self-sustained oscillations justappear for certain cloud characteristics, which in turn define theirperiodicity.
αczc(km) 0.2 0.3 0.4 0.5 0.6 0.7 0.8 0.9
1 – – – – – – 1250 8332 – – – – – 1250 714 8333 – – – – 1000 714 625 12504 – – – 1000 714 556 556 –5 – – 1250 714 556 556 1000 –6 – 1250 714 556 500 625 – –7 1000 833 556 500 500 833 – –8 833 556 455 455 556 1250 – –
For the sake of simplicity, hereafter we neglect the explicitdependence of variables with respect to time (t). Note in Figs. 2–4 that values of E and P evolve at the same pace, owing to theexpected steady-state that emerges from the small capacity ofthe atmosphere/clouds to store water at the annual timescale.
For all combinations of αc and zc, two bio-physical char-acteristics are evaluated: (1) the average spatial and temporalplanetary temperature (T = abTb + awTw + adTd), which is ameasure of the mean energy stored in the system throughouttime, and (2) the biologic predominance, Bp, defined as the meandifference between the total cumulative populations of black andwhite daisies,
Bp = 1
tf − ti
∫ tf
ti
(ab − aw) dt, (16)
where ti and tf are the limits of the modelling time horizonfor which Bp is evaluated. Such measurement is relevant insofarthe system’s ecological dynamics varies significantly in cumu-lative terms depending on the predominant species of daisies.Figures 5 and 6 show results of the two biophysical character-istics in DAWHYC, estimated from time-series of 10 000 yr,whose 5000 initial years are discarded to get rid of numeri-cal noise. Estimates in NGK99 are T = 22.12 ◦C and Bp =−0.11. The negative value of Bp indicates predominance ofwhite daisies. Signs in Table 2 indicate whether T in DAWHYCis higher (+) or lower (−) than in NGK99, which allows toquantify the effect of the cloudy hydrological cycle presence(DAWHYC) or absence (NGK99) on the planetary climate.
3.2. The influence of clouds under variable externalsolar forcing
The second experiment aims to study the evolution ofDAWHYC’s climate–biota system while varying the externalsolar forcing (luminosity) from L = 0.2 to L = 3.3. Two con-
5 6 7 8 9 10
0.0
0.2
0.4
0.6
0.8
1.0
Are
afr
actio
n
0
5
10
15
20
25
30
35
Te
mp
era
ture
(°C
)
5 6 7 8 9 10Time (1000 yr)
0.0
0.2
0.4
0.6
0.8
1.0acE P
T ab aw
E,P
or
clo
udin
ess
0 1 2 3 4 5
0
2
4
6
8
10
Period (1000 yr)
Pow
er
Fig. 2. Results of Experiment 1 (constant external solar forcing) withL = 1.0, αc = 0.7 and zc = 2 km. (Top panel) Time evolution oftemperature (T) and biota (ab and aw). The Fourier power spectrum oftemperature is shown at the inset. (Bottom panel) Time evolution of thevariables representing the hydrological cycle (E, P and ac). Values of E
and P are augmented ten-fold to improve visualization.
ditions depending on the specific role of biota are considered:(1) an ‘active’ condition, owing to biota–environment feedbacksarising from albedo differences between both species of daisiesand bare ground and (2) a ‘neutral’ condition whereby bothdaisies and bare ground exhibit the same albedo value (ab =aw = ad = 0.5), so that the radiative balance is indifferent tothe presence of biota. Note that this neutral condition does notimply the absence of life, but of an abiotic condition in radiativeterms. A comparison between the active and neutral conditionspoints out the role of life on the system’s self-regulation capac-ity. To further investigate the role of the hydrological cycle andclouds, we also consider the condition by which temperature issolely determined by solar forcing due to the total absence oflife, water and clouds, referred to as a ‘dead planet’ condition.
Likewise, our results from this experiment describe the equi-librium states of the system as a function of solar forcing (L),for all combinations of αc and zc used in Experiment 1 undera constant solar forcing. We determine the equilibrium valuesof T , ab, aw and ac for each value of L. Note that in terms ofthe theory of dynamic systems, the set of these four variablesdefines the phase-space of the model. An oscillatory equilibrium
Tellus 61B (2009), 2

488 J. F. SALAZAR AND G. POVEDA
5 6 7 8 9 10
0.0
0.2
0.4
0.6
0.8
1.0A
rea
fra
ctio
n
0
5
10
15
20
25
30
35
Te
mp
era
ture
(°C
)
5 6 7 8 9 10Time (1000 yr)
0.0
0.2
0.4
0.6
0.8
1.0acE P
T ab awE
,Por
clo
udin
ess
Pow
er
Period (1000 yr)0 1 2 3 4 5
0
2
4
6
8
10
Fig. 3. Same as Fig. 2 with zc = 4 km.
state can be described by average and extreme values. Likewise,equilibrium states are obtained from time series of 10 000 yr,whose initial 5000 yr are discarded to get rid of numerical noise.Figure 7 shows the dynamics of temperature (T), area fractionsof daisies (ab and aw) and cloudiness (ac). The correspondingfigures (not shown) for evapotranspiration (E) and precipitation(P) are quite similar to that of ac. Similar results were found fordifferent combinations of αc and zc.
Two measures were introduced by Lenton and Lovelock(2001) to quantify DW’s self-regulation capacity. The first oneis the ‘luminosity range’, LR, defined as the difference betweenthe maximum (LM) and minimum (Lm) luminosity by which theplanet is habitable. And the second one is the ‘total life’, (V T),defined as the total amount of life present in DW over the wholeluminosity range, estimated by integration over all populations(average area in DAWHYC) and for the full range of luminos-ity values. The higher the values of both measures, the higherthe system’s self-regulation capacity. Values of Lm, LM, LR andV T are reported by Lenton and Lovelock (2001) for differentvariants of DW.
The DAWHYC’s equilibrium values of Lm, LM, LR andV T depend on the combination of cloud characteristics (αc
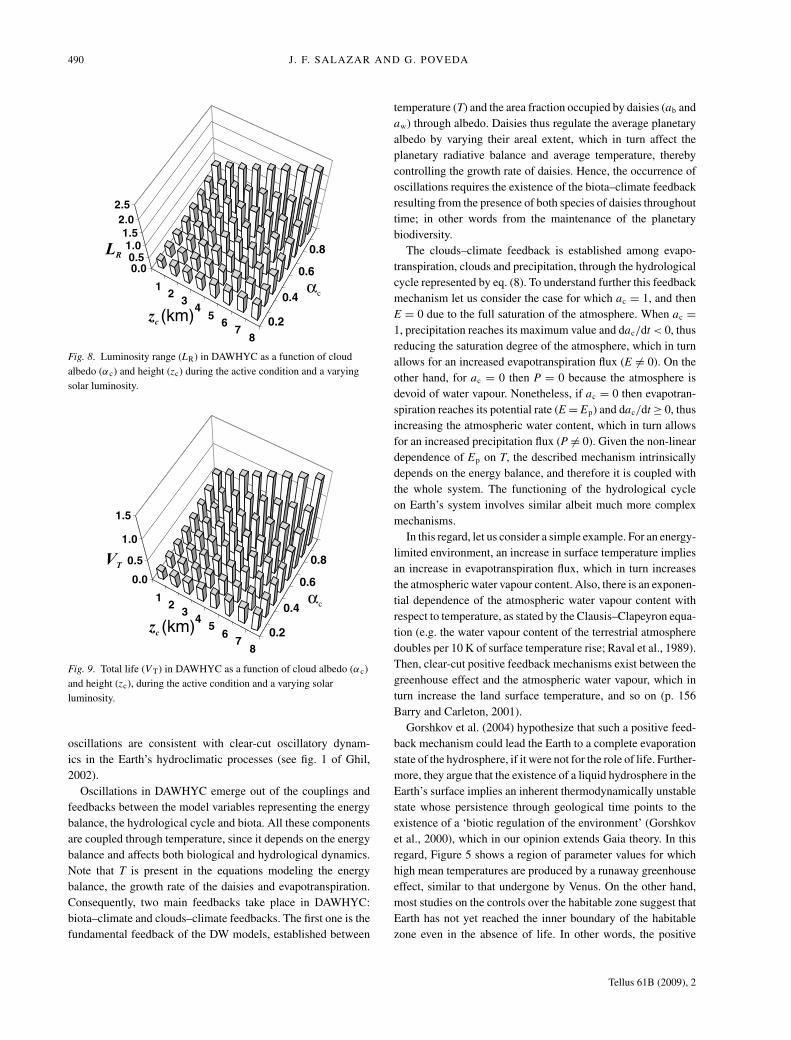
and zc), as well as on the biological condition type (ac-tive or neutral). Figures 8 and 9 show estimates of LR andV T for the active condition. Extreme and average values ofLR, V T, Lm and LM during DAWHYC’s active condition
5 6 7 8 9 10
0.0
0.2
0.4
0.6
0.8
1.0
Are
afr
actio
n
0
5
10
15
20
25
30
35
Te
mp
era
ture
(°C
)
5 6 7 8 9 10Time (1000 yr)
0.0
0.2
0.4
0.6
0.8
1.0acE P
T ab aw
E,P
or
clo
udin
ess
0 1 2 3 4 5
0
2
4
6
8
10
Pow
er
Period (1000 yr)
Fig. 4. Same as Fig. 2 with zc = 8 km.
12
34
56
78
C 1
0
30
60
90
zc (km)
T (°C)
0.2
0.4
0.6
0.8
c
To, max
Fig. 5. Results of experiment 1 with L = 1.0. Average temperature (T )in equilibrium in DAWHYC as a function of cloud albedo (αc) andheight (zc). The arrow indicates T o,max = 24.92 ◦C, which correspondsto the maximum average temperature for which self-sustainedoscillations occur.
are LR,max = 2.32, LR,min = 0.36, LR = 0.89, VT,max = 1.449,
VT,min = 0.227, V T = 0.584, Lm,min = 0.30, Lm,max = 0.94,
LM,max = 3.26, LM,min = 0.66. All maximum values of LR, V T,Lm and LM correspond to αc = 0.9 and zc = 8.0 km (coldestclouds), and all minimum values occur for αc = 0.2 and zc =1.0 km (warmest clouds). Note that Lm is the minimum lumi-nosity value required for the appearance of life in DAWHYC,
Tellus 61B (2009), 2
HYDROLOGICAL CYCLE AND CLOUDS IN DAISYWORLD 489
12
34
56
78
C 1
0.00.2
0.40.6
0.8
1.0
BP
0.2
0.4
0.6
0.8
c
zc (km)
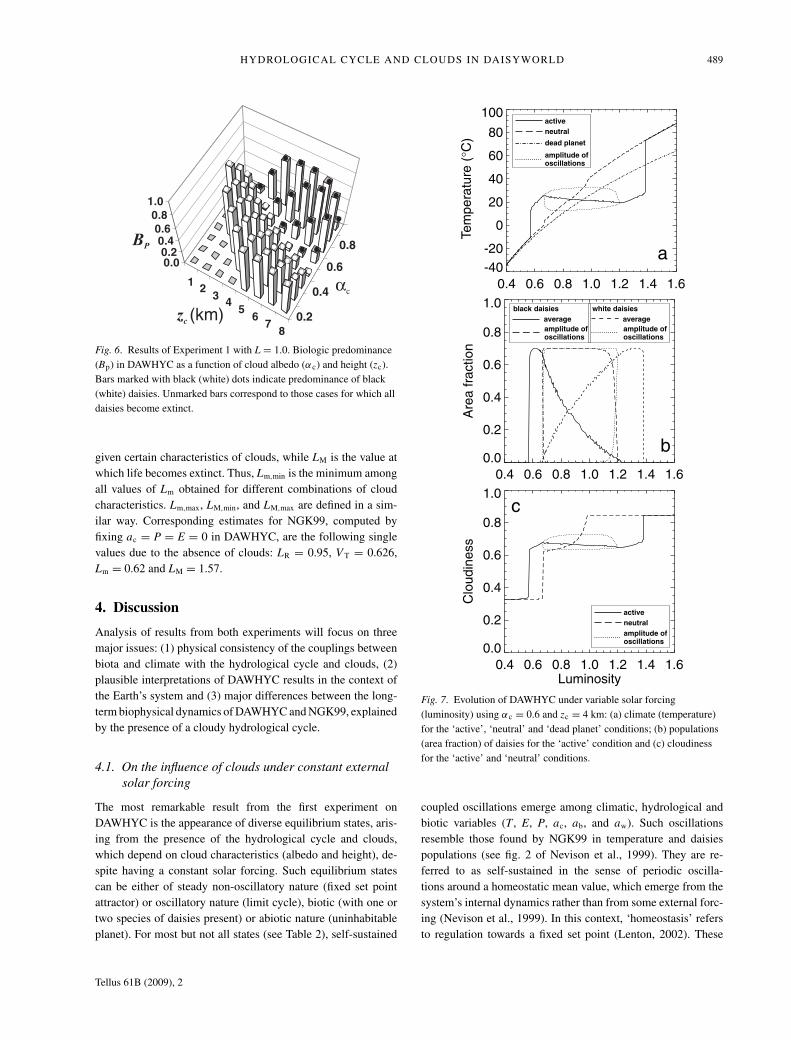
Fig. 6. Results of Experiment 1 with L = 1.0. Biologic predominance(Bp) in DAWHYC as a function of cloud albedo (αc) and height (zc).Bars marked with black (white) dots indicate predominance of black(white) daisies. Unmarked bars correspond to those cases for which alldaisies become extinct.
given certain characteristics of clouds, while LM is the value atwhich life becomes extinct. Thus, Lm,min is the minimum amongall values of Lm obtained for different combinations of cloudcharacteristics. Lm,max, LM,min, and LM,max are defined in a sim-ilar way. Corresponding estimates for NGK99, computed byfixing ac = P = E = 0 in DAWHYC, are the following singlevalues due to the absence of clouds: LR = 0.95, V T = 0.626,Lm = 0.62 and LM = 1.57.
4. Discussion
Analysis of results from both experiments will focus on threemajor issues: (1) physical consistency of the couplings betweenbiota and climate with the hydrological cycle and clouds, (2)plausible interpretations of DAWHYC results in the context ofthe Earth’s system and (3) major differences between the long-term biophysical dynamics of DAWHYC and NGK99, explainedby the presence of a cloudy hydrological cycle.
4.1. On the influence of clouds under constant externalsolar forcing
The most remarkable result from the first experiment onDAWHYC is the appearance of diverse equilibrium states, aris-ing from the presence of the hydrological cycle and clouds,which depend on cloud characteristics (albedo and height), de-spite having a constant solar forcing. Such equilibrium statescan be either of steady non-oscillatory nature (fixed set pointattractor) or oscillatory nature (limit cycle), biotic (with one ortwo species of daisies present) or abiotic nature (uninhabitableplanet). For most but not all states (see Table 2), self-sustained
active
neutral
amplitude ofoscillations
dead planet
0.4 0.6 0.8 1.0 1.2 1.4 1.6
-40
-20
0
20
40
60
80
100
Tem
pera
ture
(°C
)
black daisies
amplitude ofoscillations
average
white daisies
amplitude ofoscillations
average
0.4 0.6 0.8 1.0 1.2 1.4 1.6
0.0
0.2
0.4
0.6
0.8
1.0
Are
afr
actio
n
active
neutral
amplitude ofoscillations
0.4 0.6 0.8 1.0 1.2 1.4 1.6Luminosity
0.0
0.2
0.4
0.6
0.8
1.0
Clo
udin
ess
a
b
c
Fig. 7. Evolution of DAWHYC under variable solar forcing(luminosity) using αc = 0.6 and zc = 4 km: (a) climate (temperature)for the ‘active’, ‘neutral’ and ‘dead planet’ conditions; (b) populations(area fraction) of daisies for the ‘active’ condition and (c) cloudinessfor the ‘active’ and ‘neutral’ conditions.
coupled oscillations emerge among climatic, hydrological andbiotic variables (T , E, P, ac, ab, and aw). Such oscillationsresemble those found by NGK99 in temperature and daisiespopulations (see fig. 2 of Nevison et al., 1999). They are re-ferred to as self-sustained in the sense of periodic oscilla-tions around a homeostatic mean value, which emerge from thesystem’s internal dynamics rather than from some external forc-ing (Nevison et al., 1999). In this context, ‘homeostasis’ refersto regulation towards a fixed set point (Lenton, 2002). These
Tellus 61B (2009), 2
490 J. F. SALAZAR AND G. POVEDA
12
34
56
78
C 1
0.00.5
1.01.5
2.0
2.5
c
LR
0.2
0.4
0.6
0.8
zc (km)
Fig. 8. Luminosity range (LR) in DAWHYC as a function of cloudalbedo (αc) and height (zc) during the active condition and a varyingsolar luminosity.
12
34
56
78
C 1
0.0
0.5
1.0
1.5
c
0.2
0.4
0.6
0.8VT
zc (km)
Fig. 9. Total life (V T) in DAWHYC as a function of cloud albedo (αc)and height (zc), during the active condition and a varying solarluminosity.
oscillations are consistent with clear-cut oscillatory dynam-ics in the Earth’s hydroclimatic processes (see fig. 1 of Ghil,2002).
Oscillations in DAWHYC emerge out of the couplings andfeedbacks between the model variables representing the energybalance, the hydrological cycle and biota. All these componentsare coupled through temperature, since it depends on the energybalance and affects both biological and hydrological dynamics.Note that T is present in the equations modeling the energybalance, the growth rate of the daisies and evapotranspiration.Consequently, two main feedbacks take place in DAWHYC:biota–climate and clouds–climate feedbacks. The first one is thefundamental feedback of the DW models, established between
temperature (T) and the area fraction occupied by daisies (ab andaw) through albedo. Daisies thus regulate the average planetaryalbedo by varying their areal extent, which in turn affect theplanetary radiative balance and average temperature, therebycontrolling the growth rate of daisies. Hence, the occurrence ofoscillations requires the existence of the biota–climate feedbackresulting from the presence of both species of daisies throughouttime; in other words from the maintenance of the planetarybiodiversity.
The clouds–climate feedback is established among evapo-transpiration, clouds and precipitation, through the hydrologicalcycle represented by eq. (8). To understand further this feedbackmechanism let us consider the case for which ac = 1, and thenE = 0 due to the full saturation of the atmosphere. When ac =1, precipitation reaches its maximum value and dac/dt < 0, thusreducing the saturation degree of the atmosphere, which in turnallows for an increased evapotranspiration flux (E = 0). On theother hand, for ac = 0 then P = 0 because the atmosphere isdevoid of water vapour. Nonetheless, if ac = 0 then evapotran-spiration reaches its potential rate (E = Ep) and dac/dt ≥ 0, thusincreasing the atmospheric water content, which in turn allowsfor an increased precipitation flux (P = 0). Given the non-lineardependence of Ep on T, the described mechanism intrinsicallydepends on the energy balance, and therefore it is coupled withthe whole system. The functioning of the hydrological cycleon Earth’s system involves similar albeit much more complexmechanisms.
In this regard, let us consider a simple example. For an energy-limited environment, an increase in surface temperature impliesan increase in evapotranspiration flux, which in turn increasesthe atmospheric water vapour content. Also, there is an exponen-tial dependence of the atmospheric water vapour content withrespect to temperature, as stated by the Clausis–Clapeyron equa-tion (e.g. the water vapour content of the terrestrial atmospheredoubles per 10 K of surface temperature rise; Raval et al., 1989).Then, clear-cut positive feedback mechanisms exist between thegreenhouse effect and the atmospheric water vapour, which inturn increase the land surface temperature, and so on (p. 156Barry and Carleton, 2001).
Gorshkov et al. (2004) hypothesize that such a positive feed-back mechanism could lead the Earth to a complete evaporationstate of the hydrosphere, if it were not for the role of life. Further-more, they argue that the existence of a liquid hydrosphere in theEarth’s surface implies an inherent thermodynamically unstablestate whose persistence through geological time points to theexistence of a ‘biotic regulation of the environment’ (Gorshkovet al., 2000), which in our opinion extends Gaia theory. In thisregard, Figure 5 shows a region of parameter values for whichhigh mean temperatures are produced by a runaway greenhouseeffect, similar to that undergone by Venus. On the other hand,most studies on the controls over the habitable zone suggest thatEarth has not yet reached the inner boundary of the habitablezone even in the absence of life. In other words, the positive
Tellus 61B (2009), 2
HYDROLOGICAL CYCLE AND CLOUDS IN DAISYWORLD 491
feedback would not yet have reached runaway, even without life(Tim Lenton, personal communication, 2008).
The occurrence and nature of oscillations are controlled bythe planetary heat capacity and also by cloud albedo and height.An exhaustive identification and description of all of the possibleequilibrium states (whether oscillatory or not) requires studyingthe system’s non-linear dynamics, which goes much beyond thegoals of this work. However, our numerical results allow us toconclude on the roles of heat capacity and cloud characteristicson the identified oscillations, as follows.
A null heat capacity in DAWHYC cause the collapse of os-cillations for all combinations of cloud characteristics (1 ≤ zc ≤8 km, and 0.2 ≤ αc ≤ 0.9), as temperature tends to stabilizeat a fixed point rather than in a limit cycle. Mathematically, re-moval of the heat capacity substantially changes DAWHYC byeliminating the ordinary differential equation for T. Thus, forcp = 0, solutions for T are to be obtained from a fourth orderpolynomial function and the time rate of change of temperaturetends to infinity (dT/dt → ∞ as cp → 0, see eq. 6), which meansthat the planet instantly responds to solar forcing by changingits temperature.
Contrary to NGK99, a positive heat capacity value inDAWHYC is a necessary but not a sufficient condition for theoccurrence of oscillations. The DAWHYC shows that the hy-drological cycle and clouds can explain the occurrence of sixdifferent equilibrium states in the system (see Table 2), includ-ing oscillatory and non-oscillatory dynamics, for a fixed heatcapacity (similar to that in NGK99). This implies that the solepresence of cp > 0 does not necessarily cause the emergence ofself-sustained oscillations in DAWHYC, and that cloud charac-teristics strongly control the occurrence and nature of oscilla-tions.
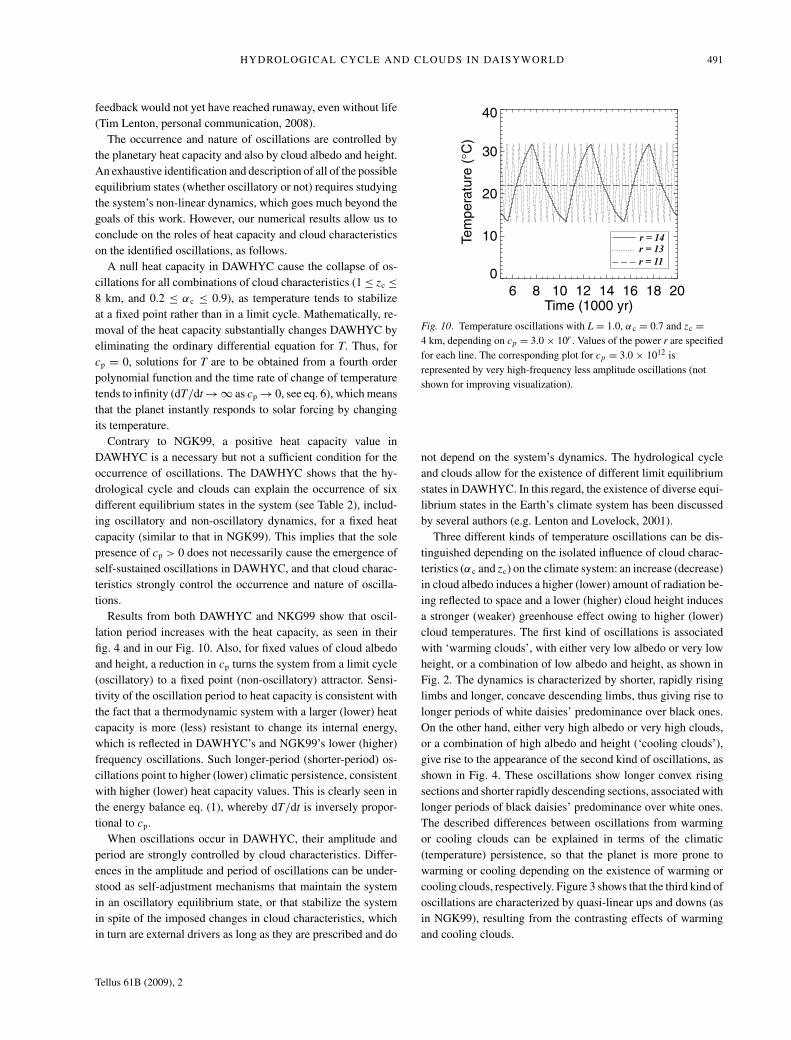
Results from both DAWHYC and NKG99 show that oscil-lation period increases with the heat capacity, as seen in theirfig. 4 and in our Fig. 10. Also, for fixed values of cloud albedoand height, a reduction in cp turns the system from a limit cycle(oscillatory) to a fixed point (non-oscillatory) attractor. Sensi-tivity of the oscillation period to heat capacity is consistent withthe fact that a thermodynamic system with a larger (lower) heatcapacity is more (less) resistant to change its internal energy,which is reflected in DAWHYC’s and NGK99’s lower (higher)frequency oscillations. Such longer-period (shorter-period) os-cillations point to higher (lower) climatic persistence, consistentwith higher (lower) heat capacity values. This is clearly seen inthe energy balance eq. (1), whereby dT/dt is inversely propor-tional to cp.
When oscillations occur in DAWHYC, their amplitude andperiod are strongly controlled by cloud characteristics. Differ-ences in the amplitude and period of oscillations can be under-stood as self-adjustment mechanisms that maintain the systemin an oscillatory equilibrium state, or that stabilize the systemin spite of the imposed changes in cloud characteristics, whichin turn are external drivers as long as they are prescribed and do
6 8 10 12 14 16 18 20Time (1000 yr)
0
10
20
30
40
Tem
pera
ture
(°C
)
r = 11
r = 14r = 13
Fig. 10. Temperature oscillations with L = 1.0, αc = 0.7 and zc =4 km, depending on cp = 3.0 × 10r . Values of the power r are specifiedfor each line. The corresponding plot for cp = 3.0 × 10¹² isrepresented by very high-frequency less amplitude oscillations (notshown for improving visualization).
not depend on the system’s dynamics. The hydrological cycleand clouds allow for the existence of different limit equilibriumstates in DAWHYC. In this regard, the existence of diverse equi-librium states in the Earth’s climate system has been discussedby several authors (e.g. Lenton and Lovelock, 2001).
Three different kinds of temperature oscillations can be dis-tinguished depending on the isolated influence of cloud charac-teristics (αc and zc) on the climate system: an increase (decrease)in cloud albedo induces a higher (lower) amount of radiation be-ing reflected to space and a lower (higher) cloud height inducesa stronger (weaker) greenhouse effect owing to higher (lower)cloud temperatures. The first kind of oscillations is associatedwith ‘warming clouds’, with either very low albedo or very lowheight, or a combination of low albedo and height, as shown inFig. 2. The dynamics is characterized by shorter, rapidly risinglimbs and longer, concave descending limbs, thus giving rise tolonger periods of white daisies’ predominance over black ones.On the other hand, either very high albedo or very high clouds,or a combination of high albedo and height (‘cooling clouds’),give rise to the appearance of the second kind of oscillations, asshown in Fig. 4. These oscillations show longer convex risingsections and shorter rapidly descending sections, associated withlonger periods of black daisies’ predominance over white ones.The described differences between oscillations from warmingor cooling clouds can be explained in terms of the climatic(temperature) persistence, so that the planet is more prone towarming or cooling depending on the existence of warming orcooling clouds, respectively. Figure 3 shows that the third kind ofoscillations are characterized by quasi-linear ups and downs (asin NGK99), resulting from the contrasting effects of warmingand cooling clouds.
Tellus 61B (2009), 2
492 J. F. SALAZAR AND G. POVEDA
Our distinction between ‘warming’ and ‘cooling’ clouds isbased upon the isolated influence of each parameter (αc andzc) on the climate system, so that warming (cooling) clouds donot imply higher (lower) planetary average temperature (as es-timated in Fig. 5), because this temperature, which representsclimate in DAWHYC, results from the non-linear interactionsamong all components of the climate system. The role of lifetends to counteract the warming and cooling effects from clouds.Such conclusion arises from the signs in Table 2. Whenever lifebecomes extinct at equilibrium state 1, the system’s response tothe presence of warming clouds always increases its tempera-ture beyond that without clouds (NGK99). If only one of thespecies survive, as in equilibrium states 2 and 4, the system’sresponse to the presence of warming (cooling) clouds tends towarm (cool) the planet more than in NGK99. In contrast, for theco-existence of both daisies species (equilibrium state 6), signsin Table 2 show that warming (cooling) clouds tend to produceoscillations around a lower (higher) mean temperature than thosein the cloud-lacking NGK99. This latter result points out a bi-ologically mediated counteraction resulting from the prescribedbiological advantage of black (white) daisies to proliferate un-der low (high) temperatures, as is generally assumed in DW andits variants, so that cooling (warming) clouds tends to favourblack (white) daisies, which in turn tend to warm (cool) the sur-face. Implications of this assumption are discussed in Lenton(2004) and Gorshkov et al. (2004). As a matter of fact, Fig. 5shows that the maximum average temperature for the occurrenceof self-sustained oscillations (T o,max = 24.92 ◦C), is associatedwith values of αc = 0.7 and zc = 8 km, which correspond to cool-ing clouds. Such maximum occurs because oscillations with thelargest predominance of black daisies (Bp,max = 0.56 in Fig. 6)occur for αc = 0.7 and zc = 8 km, which maximizes the warmingeffect from black daisies.
In summary, the net global effect from clouds in DAWHYCcan be either to cause warming or cooling (see signs in Table 2).These effects do not arise as a separate consequence of thegreenhouse effect and the reflection of short-wave radiation, butfrom the non-linear interactions between clouds and the rest ofthe climate system components. In the Earth’s system, it has beensuggested that the overall radiative influence of clouds leads tocooling the planet (Ramanathan et al., 1989).
Beyond the identified effects on climate dynamics (tempera-ture), the presence of the hydrological cycle and clouds controlthe biological dynamics. In NGK99, the maximum area frac-tion that can be occupied by each type of daisy is always 0.7,which corresponds to the system’s carrying capacity, estimatedas the maximum of the difference (1 − γ /βi), with βi = 1.0 andγ = 0.3 (Lenton and Lovelock, 2001). Such a constant value doesnot hold any longer in DAWHYC, even though the growth andmortality rates of daisies remain unchanged. For instance, forαc = 0.2 and zc = 7 km, the maximum area fraction occupied byblack daisies is about 0.4 at any time (oscillations not shown),as their growth rate is strongly restricted by the presence of very
dark clouds. This result can be interpreted in terms of an envi-ronmental constraint for life imposed by the combined role ofthe hydrological cycle and clouds. Thus, and opposed to NGK99and other variants of DW, the ecosystem’s carrying capacity ofDAWHYC is not solely determined by the maximum growthrate and the constant mortality rate of daisies, but it is also re-stricted by environmental conditions driven by the hydrologicalcycle and clouds. Clear-cut restrictions for life from environ-mental conditions do appear in the Earth’s climatic system (e.g.Budyko, 1974; Olff et al., 2002). Also, predominance of eitherspecies of daisies is sensitive to the presence of the hydrologicalcycle and clouds, as shown in Fig. 6. Therefore, changes in cloudalbedo and height within DAWHYC can significantly modify theecological dynamics. With regard to the Earth’s system, this canbe related to the fact that environmental conditions are determi-nant in establishing the predominance amongst species, and evenmore that the coupling between climate and ecosystem structureand function leads to complex behaviour (Sole and Bascompte,2006, p. 295).
To further elucidate and summarize the influence of the hydro-logical cycle and clouds on the climate–biota system dynamicsof DW (DAWHYC) under constant external solar forcing, let usmake the following considerations. The original DW assumes anexact balance between the system’s input and output radiation,which means that the internal energy of the system is kept con-stant, and that the system responds instantly to changes in theexternal forcing. Such an assumption is modified in NGK99 byintroducing the heat capacity (cp) to represent the temporal vari-ability of the system’s internal energy and its response. In thiscontext, the overall effect of the hydrological cycle and cloudson DAWHYC’s dynamics becomes clear-cut: the internal energyis affected through energy redistribution by clouds (warminggreenhouse effect and cooling by short-wave reflection), whichin turn depends on precipitation and evapotranspiration, as thesefluxes control the amount of clouds. Thus, DAWHYC’s dynam-ics is not only governed by the external forcing (as in DW) or bythe external forcing and heat capacity (as in NGK99), but alsoby the role of the hydrological cycle and clouds. The presence ofclouds modify the time rate of change of the system’s internal en-ergy, and thus the hydrological cycle operates as the mechanismwhereby cloud dynamics are coupled with the energy balance. Inthis manner, oscillations found in diverse variables of DAWHYCdepend on both the external forcing and the heat capacity, as inNGK99, but also on the hydrological cycle and clouds. Giventhat such oscillations correspond to possible equilibrium statesof the system, our previous conclusion allows for the occurrenceof diverse equilibrium states in DAWHYC, including those ofoscillatory and non-oscillatory nature, which in turn representdifferent physical and biological dynamics, even under constantvalues of solar luminosity or heat capacity. For those equilibriumstates of oscillatory nature, the presence of the hydrological cycleand the characteristics of clouds in DAWHYC strongly controlthe frequency and amplitude of oscillations, which means that
Tellus 61B (2009), 2
HYDROLOGICAL CYCLE AND CLOUDS IN DAISYWORLD 493
the cloudy hydrological cycle modifies the system’s response bycontrolling its internal energy, regardless of variations in solarexternal forcing and heat capacity.
4.2. On the influence of clouds under variable externalsolar forcing
The most remarkable result of the second experiment is themaintenance of the system’s self-regulation capacity in the pres-ence of an active cloudy hydrological cycle for a large rangeof solar luminosity values. Self-regulation goes beyond tem-perature and involves the hydrological cycle and clouds al-together. This is quite an interesting and novel result, sinceit allows us to extend the original DW idea of temperatureself-regulation to that of hydrological cycle and cloud self-regulation, in the average sense suggested by Jarcourt andRaymond (1992), depicted for temperature (Fig. 7a) and hy-drological cycle and clouds (Fig. 7c). It can be seen that for awide range of luminosity values, the corresponding attractorsare not fixed points, rather limit cycles translated into finite am-plitude oscillations around a mean state. Thus, temperature self-regulation (climate homeostasis), which constitutes an emer-gent property in DW and NGK99 (see their fig. 5), is extendedin DAWHYC to self-regulation of the hydrological cycle andclouds.
The extent to which the hydrological cycle influencesDAWHYC’s long-term dynamics depends on equilibrium val-ues of potential evapotranspiration and precipitation. Therefore,a detailed interpretation of Figs. 7a and c is in order. The solarforcing value (L, luminosity) acts as a control parameter of thesystem’s equilibrium states, which in turn are associated withvalues of equilibrium temperature (Teq). Let us focus the anal-ysis of Figures 7a and c to the case of neutral condition, toisolating the effects of the hydrological cycle, although theseeffects are also present during the active condition.
All the possible equilibrium states of potential evapotran-spiration and precipitation can be classified into three groups:Feq = 0, 0 < Feq < 1 and Feq = 1, where Feq represents either Eeq
p
or Peqp (at equilibrium). Each of these states are determined by
their physical constraints, for example, the condition that maxi-mum possible cloudiness is 100%, (recall how Pmax is estimatedin eq. 11), and that potential evapotranspiration (Ep) has lowerand upper limits determined by those temperatures for which Ep
reaches minimum (0 at T = 4 ◦C) or maximum (1 at T ∼ 40 ◦C)values. Therefore, three different ranges can be distinguishedfor the curves representing the equilibrium values of temper-ature (Teq) and cloudiness (aeq
c ) as functions of luminosity, asfollows:
(1) For L < ∼0.67, equilibrium states correspond to thosefor which Teq ≤ 4 ◦C, and potential evapotranspiration is null,(Ep = 0).
(2) For ∼0.67 < L < ∼0.98, equilibrium states correspond tothose for which 4 ◦C < Teq < ∼40 ◦C, which are precisely thosetemperature values for which equilibrium potential evapotran-spiration smoothly transits from Ep = 0 to 1. Such a transitionis characterized by a monotonous increase in the behavior ofthe variables representing the hydrological cycle and clouds (ac
shown in Fig. 7c; E and P not shown).(3) For L > ∼0.98, equilibrium states correspond to those
for which Teq > ∼40 ◦C, which in turn correspond to those forwhich Ep = 1.0 and Pp = 1.0.
Therefore, during the neutral condition, an increasingly activeand non-regulated (yet bounded) hydrological cycle arises as aconsequence of an increasing solar forcing value. In contrast,during the active condition, both the temperature and the hy-drological variables are self-regulated for a wide range of solarluminosity values as a result of biota-environment feedbacks.Note that for the ‘dead planet’ condition the transition describedin item (2) does not occur because of the absence of hydrologicalcycle and clouds. Moreover, note that differences between theneutral and dead planet conditions in Fig. 7a, are entirely due tothe presence of the hydrological cycle and clouds in the formerone.
For better grasping the roles of the hydrological cycle andclouds, self-regulation characteristics can be compared amongDAWHYC, NGK99 and other variants of DW. In terms of lu-minosity range and total life, the self-regulation capacity ofDAWHYC can be either stronger or weaker than NGK99’s,depending on cloud characteristics. Estimates of the luminosityrange and total life in DAWHYC during the active conditiondiffer from those values of different variants shown by Lentonand Lovelock (2001) (see their table 1). Such variants differfrom DAWHYC not only in their lack of the cloudy hydrolog-ical cycle, but also in those functions representing the energybalance and the growth rate of daises. Therefore, it is not possi-ble to determine the isolated role of the hydrological cycle andclouds in explaining the observed differences in LR and V T be-tween DAWHYC and other DWs. However, generally speaking,it is worth noting that the maximum luminosity range and totallife in DAWHYC (LR,max = 2.32 and V T,max = 1.449) are onlylower than LR and VT in the variant of ‘Extended albedo muta-tion’ (LR,max = 2.46 and V T,max = 1.712), developed by Lentonand Lovelock (2001). This variant involves an extended adapta-tion capacity responsible for high values of LR and V T. Giventhat such adaptation capacity is missing from DAWHYC, theappearance of larger values of LR and V T than almost all thoseidentified by Lenton and Lovelock (2001), points to DAWHYC’spotentially high self-regulation capacity increase owing to thecombined action of the hydrological cycle and clouds. There isno a priori reason for which one would expect such a wide rangeof habitability in DAWHYC as in the ‘extended albedo muta-tion’ model. That means that the dynamics of the hydrologicalcycle and clouds can make the planet more habitable for life,
Tellus 61B (2009), 2
494 J. F. SALAZAR AND G. POVEDA
independent of the capacity for biological adaptation. This is akey finding of DAWHYC.
Differences between DAWHYC and NGK99 also include theluminosity range limits (Lm and LM). Whereas in NGK99 daisesdo not survive outside the range 0.62 ≤ L ≤ 1.57, in DAWHYCthe span of life ranges from Lm,min = 0.30 to LM,max = 3.26,which means that under certain conditions set forth by cloudalbedo and height, the planet would be habitable for such a widerange of values of L. In all cases, both the total life and luminosityrange in DAWHYC are much larger during the active conditionthan during the neutral one (not shown), which highlights theimportance of life on the system’s self-regulation capacity.
Our results show that the presence of the hydrological cycleand clouds can either augment or diminish the planetary sys-tem’s self-regulation capacity, depending on cloud characteris-tics. Hydrological cycle, clouds and biota are mutually coupledin DAWHYC through temperature; yet there are no mechanismswhereby life could have an influence on, say, the characteris-tics of clouds. In the Earth’s system, these characteristics areinfluenced by biological processes. At this point, it is worthasking whether discernible relations between the hydrologicalcycle, clouds and life have evolved on Earth, and, if so, whethersuch interactions support Gaia theory, in the sense that feed-backs contribute favourably to the existence of life itself. Thisquestion can be approached from two viewpoints. First, it hasbeen thoroughly established that life on Earth affects the hy-drological cycle and clouds (e.g. Hutjes et al., 1998; Miller andRusell, 2004; Marzeion and Timmermann, 2005; Makarieva andGorshkov, 2007). Evapotranspiration becomes the most impor-tant mechanism by which biota influences the hydrological cycleand clouds, which in turn affect the atmospheric water and en-ergy budgets. Probably, the second major influence of biota onclouds results from the production of cloud condensation nuclei(CCN), which affect cloud’s formation and radiative properties(e.g. Shaw, 1983; Charlson et al., 1987; Andreae et al., 2004;Claeys et al., 2004; Meskhidze and Nenes, 2006; Vallina andSimo, 2007). Second, the existence of biota–clouds and/or biota–hydrological cycle (biota–environment) interactions, which giverise to ‘beneficial’ effects for life, and whether such interactionscould have been evolved through natural selection, is still an opendebate (e.g. Lenton, 1998, 2002, 2004; Betts 1999; Downing andZvirinsky, 1999; Kirchner, 2002, 2003; Volk 2002, 2003, 2004;Lenton and Wilkinson, 2003; Gorshkov et al., 2004; Wilkinson,2004). In light of these and inspired in our results, we proposetwo hypotheses, as discussed next.
First, under the Gaia theory and using the aforementionednotion of the ‘biotic regulation of the environment’ (Gorshkovet al., 2000), we propose that the influence of biota on cloudsis not inadvertent and therefore not merely the result of randomeffects: in the Earth’s system, the biota affects the formation andradiative properties of clouds, so that beneficial effects for lifeemerge from biota–clouds interactions, by enhancing the globalamount of life and extending the life span. A first observation
supporting this hypothesis might be the net cooling effect fromclouds (Ramanathan et al., 1989) in the face of global warm-ing. Several additional predictions and observations support theproposed hypothesis. For instance, Betts (1999) suggests the ex-istence of vegetation–climate feedbacks producing ‘beneficial’effects for life, by increasing continental precipitation, reduc-ing temperature extremes, increasing net primary productivityand increasing biota’s self-sustaining capacity. Also, Miller andRusell (2004) suggest that interactions between biota and thehydrological cycle improve the environmental conditions re-quired for the existence of vegetation in northern Africa. Al-though finding counter-examples might also be possible, it is atleast plausible to conjecture a Gaian-like coupling of the biota–clouds–hydrological cycle system.
Second, we hypothesize the existence of a maximum self-regulation capacity principle that acts on certain cloud charac-teristics, which are associated with environmental conditionsnecessary to sustain life (e.g. Kleidon, 2004). The net resultis to increase the occurrence of those combinations of cloudalbedo and height, which together produce a higher degree ofself-regulation. Were such a maximization principle to exist,then cloud albedo and height would be those which maximizethe luminosity range and total life. Different optimization prin-ciples have been studied in DW. Pujol (2002) assumes that thehorizontal heat transport in DW obeys the principle of maxi-mum entropy production (MEP) and finds that this assumptionincreases DW’s self-regulation capacity with respect to the orig-inal version. A similar, yet more general approach is used byToniazzo et al. (2005). They show that the applicability and con-sequences of MEP in regulating DW depends on factors such asthe number of co-existing species of daisies (two or more) andon the relation between the rate of change of daisy coverage (ad-justments) and heat fluxes. On the other hand, Ackland (2004),working with a 2-D DW, argues that the long-term dynamics ofDW is governed by a principle of ‘maximization of the amountof life’, rather than a MEP. In a much broader sense, Toniazzoet al. (2005) and Kleidon and Fraedrich (2005) connect the MEPprinciple with Gaia theory and show evidence that the outcomeof the coupled atmosphere–biosphere system may lead to en-vironmental homeostasis, under the assumption that biosphereadjusts to MEP when environmental conditions change.
5. Conclusions
We have constructed a DW model that involves a simplified hy-drological cycle and an explicit representation of clouds, both ofwhich play a decisive role in regulating the internal energy of thesystem. In a constant solar forcing and planetary specific heatscenario, the presence of the cloudy hydrological cycle gives riseto different equilibrium states of either a steady non-oscillatorynature (fixed point attractor) or oscillatory (limit cycles), biotic(housing one or two species of daisies) or abiotic (uninhabit-able planet). For most cases, the equilibrium state consists of
Tellus 61B (2009), 2
HYDROLOGICAL CYCLE AND CLOUDS IN DAISYWORLD 495
self-sustained oscillations in the dynamics of variables associ-ated with clouds and hydrological cycle, as well as in thoseassociated with biota and climate. The most relevant features ofthose oscillations can be summarized as follows: (1) they appearas an emergent property of the system’s coupled physical andbiological dynamics; (2) they reflect physically consistent cou-plings between the system components; and (3) they constitutea robust result in the sense that they appear for most combina-tions of cloud characteristics. Similar oscillations are found inNGK99, whose frequency is sensitive to changes in the plane-tary specific heat. Contrary to NGK99, cp > 0 is a necessarybut not sufficient condition for the occurrence of self-sustainedoscillations in DAWHYC. The hydrological cycle and clouds inDAWHYC produce different equilibrium states of oscillatory ornon-oscillatory nature, even when cp > 0. When oscillations oc-cur, their dynamics are consistent with those in the hydroclimaticand biological records on Earth. The identified equilibrium statesare associated with different conditions of habitability and bio-logical predominance, such that the cloudy hydrological cycleaffects the general ecological dynamics of DW.
One of DW’s fundamental results is the emergence of self-regulation arising from biota–environment feedbacks, in spite ofa variable energy input. It also holds for DAWHYC in an averagesense, as the long-term dynamics of the planetary temperatureoscillate around an average value. Moreover, DAWHYC’s self-regulation is also witnessed in the variables representing thehydrological cycle and clouds. The presence of life becomes anecessary condition for the system to maintain its self-regulationcapacity in light of changes of the external forcing (solar lumi-nosity). By the same token, the presence of both species of daisy,or maintenance of biodiversity, is also necessary for the occur-rence of self-sustained oscillations in constant solar luminosityscenarios. This latter result demonstrates the fundamental role oflife’s amount and diversity on DAWHYC’s self-regulation. Suchself-regulation is a consequence of both positive and negativefeedbacks, whose occurrence is another fundamental emergentfeature of DAWHYC.
Clouds play the dual role of either cooling or warmingDAWHYC. The net outcome depends on the balance betweenwarming from the greenhouse effect of water vapour and thecooling from albedo-mediated short-wave reflection. A similardichotomy is seen in the Earth’s system. Its definite long-termoutcome is still an unsettled matter (Washington, 1995), thusposing a fundamental question for the future Earth climate inlight of anthropogenic greenhouse warming.
The most important role that the hydrological cycle and cloudsplay is through reducing or augmenting the self-regulation ca-pacity of DAWHYC’s climate–biota system. A remarkable find-ing of this work is that the dynamics of the hydrological cycle andclouds can make the planet more habitable for life, independentof the capacity for biological adaptation. Whether the hydrolog-ical cycle and clouds increase or decrease the Earth’s systemself-regulation capacity is an open question. Also, whether the
evolution of the climate–biota system on Earth obeys some op-timization principle remains as an open question. If so, what issuch a principle, and does it act as a single principle throughouttime? Or rather does it evolve, say, with solar luminosity, andcould it be that multiple optimization principles act alternativelyor indeed even compete with one another. The DAWHYC con-stitutes a simple framework to explore possible answers to suchquestions regarding the Earth system. Although results from thetwo experiments performed on DAWHYC do not give us a sin-gle answer, for instance on the existence of a single specificoptimization principle, they do suggest that the hydrologicalcycle and clouds play decisive roles in controlling the Earthclimate system dynamics. In this regard, we conjectured thatbiota affects the formation and radiative properties of cloudsin the Earth’s system, so that beneficial effects for life emergefrom biota-clouds interactions, in terms of enhancing the globalamount of life and extending the span of life. Furthermore, wehypothesized the existence of a maximum self-regulation capac-ity principle acting on certain cloud characteristics, associatedwith environmental conditions necessary to sustain life. Resultsfrom DAWHYC cannot be conclusive about the Earth’s system,and therefore our hypotheses are proposed in the same spirit ofLenton and Lovelock (2001), for whom DW provides a modelfor answering what-if questions and to inspire multiple questionsregarding the Earth’s system.
6. Acknowledgments
We wish to thank V. K. Gupta, K. Nordstrom, P. Bunyard, O. J.Mesa, J. F. Jimenez, J. H. C. Gash, W. J. Shuttleworth, R. Avissar,P. R. Waylen, A. Nobre and B. Rodrıguez for valuable discus-sions and comments. We also thank T. Lenton, another anony-mous reviewer and the Editor for comments and suggestionsto improve early versions of the manuscript. J.F.S. wishes tothank A. M. Rendon for inspiring insights. G.P. wishes to thankCIRES (U. of Colorado, Boulder, CO, USA) and the Center forEcology and Hydrology (CEH, Wallingford, UK) for support-ing him as a visiting scientist. This work was supported byCOLCIENCIAS of Colombia through funding the GRECIAResearch Programme.
References
Ackland, G. 2004. Maximization principles and Daisyworld. J. Theor.Biol. 227, 121–128.
Ackland, G., Clark, M. and Lenton, T. 2003. Catastrophic desert forma-tion in Daisyworld. J. Theor. Biol. 223, 39–44.
Adams, B., Carr, J., Lenton, T. and White, A. 2003. One-dimensionalDaisyworld: spatial interactions and pattern formation. J. Theor. Biol.
223, 505–513.Andreae, M., Rosenfeld, D., Artaxo, P., Costa, A., Frank, G. and
co-authors. 2004. Smoking rain clouds over the Amazon. Science
303, 1337–1342.
Tellus 61B (2009), 2
496 J. F. SALAZAR AND G. POVEDA
Baldocchi, D. D., Krebs, T. and Lecrerc M. Y. 2004. ‘Wet/dry Daisy-world’: a conceptual tool for quantifying the spatial scaling of hetero-geneous landscapes and its impact on the subgrid variability of energyfluxes. Tellus 57B, 175–188.
Barry, R. G. and Carleton, A. M. 2001. Synoptic and Dynamic Clima-tology. Routledge, London, 608 pp.
Betts, R. 1999. Self-beneficial effects of vegetataion on climate in aocean-atmospehre general circulation model. Geophys. Res. Lett. 26,1457–1460.
Budyko, M. 1974. Climate and Life. Academic Press, New York.Chahine, M. 1992. The hydrological cycle and its influence on climate.
Nature 359, 373–380.Charlson, R. J., Lovelock, J., Andreae, M. O. and Warren, S. G. 1987.
Oceanic phytoplankton, atmospheric sulphur, cloud albedo and cli-mate. Nature 326, 655–661.
Chu, S. and Ledley, T. 1995. Hydrologic cycle parameterizationsfor energy balance climate models. J. Geophys. Res. 100, 16 289–16 304.
Claeys, M., Graham, B., Vas, G., Wang, W., Vermeylen, R. andco-authors. 2004. Formation of secondary organic aerosols throughphotooxidation of isoprene. Science 303, 1173–1176.
Cohen, J. and Rich, A. 2000. Interspecific competition affects tempera-ture stability in Daisyworld. Tellus 52B, 980–984.
Downing, K. and Zvirinsky, P. 1999. The simulated evolution of bio-chemical guilds: reconciling Gaia theory and natural selection. Artific.
Life 5, 291–318.Fu, Q. 2003. Cloud-radiative processes. In: Encyclopedia of Atmospheric
Sciences (eds. J. R. Holton, J. A. Curry, and J. A. Pyle). ElsevierSciences, London, 1871–1874.
Ghil, M. 2002. Natural climate variability. In: Encyclopedia of global
environmental change Volume 1 (eds. T. Munn, M. MacCraken andJ. Perry) John Wiley and Sons, Chichester, 544–549.
Gorshkov, V. G., Gorshkov, V. V. and Makarieva, A. M. 2000. Biotic
Regulation of the Environment. Springer, London.Gorshkov, V. G., Makarieva, A. M. and Gorshkov, V. V. 2004. Revis-
ing the fundamentals of ecological knowledge: the biota-environmentinteraction. Ecol. Complex. 1, 17–36
Harding, S. and Lovelock, J. 1996. Exploiter-mediated coexistence andfrecuency-dependant selection in a numerical model of biodiversity.J. Theor. Biol. 182, 109–116.
Hartmann, D. 1994. Global Physical Climatology. Academic Press,New York, 411 pp.
Hutjes, R., Kabat, P., Running, S., Shuttleworth, W., Field, C. andco-authors. 1998. Biospheric aspects of the hydrological cycle. J. Hy-
drol. 212–213, 1–21.Jarcourt, S. and Raymond, W. 1992. Comments on ‘Chaos in Daisy-
world’ by X. Zeng et al. Tellus 44B, 243–246.Kirchner, J. 2002. The Gaia Hypothesis: fact, theory and wishful think-
ing. Climat. Change 52, 391–408.Kirchner, J. 2003. The Gaia Hypothesis: conjectures and refutations.
Climat Change 58, 21–45.Kleidon, A. 2004. Beyond Gaia: thermodynamics of life and Earth sys-
tem functioning. J. Climat. Change 66, 271–319.Kleidon, A. and K. Fraedrich 2005. Biotic entropy production and
global atmosphere-biosphere interactions. In: Non-equilibrium Ther-modynamics and the Production of Entropy (eds. A. Kleidon and R.Lorentz). Springer, Berlin, Germany, 173–189.
Lenton, T. 1998. Gaia and natural selection. Nature 394, 439–447.Lenton, T. 2002. Testing Gaia: the effect of life on Earth’s habitability
and regulation. Climat. Change 52, 409–422.Lenton, T. 2004. Clarifying Gaia: regulation with or without natural
selection. In: Scientists Debate Gaia (eds. K. Schneider, J. Miller, E.Crist and P. Boston). MITPress, Boston, USA, 15–25.
Lenton, T. and Lovelock, J. 2000. Daisyworld is Darwinian: constrainson adaptation are important for planetary self-regulation. J. Theor.Biol. 206, 109–114.
Lenton, T. and Lovelock, J. 2001. Daisyworld revisited: quantifyingbiological effects on planetary self-regulation. Tellus 53B, 288–305.
Lenton, T. and Wilkinson, D. 2003. Developing the Gaia theory: a re-sponse to the criticisms of Kirchner and Volk. Climat. Change 58,1–12.
Lovelock, J. 2003. The living Earth. Nature 426, 769–770.Makarieva, J. and Gorshkov, A. 2007. Biotic pump of atmospheric mois-
ture as driver of the hydrological cycle on land. Hydrol. Earth Sys.Sci. Discuss. 3, 1–53.
Marzeion, B. and Timmermann, A. 2005. Biophysical feedbacks in thetropical Pacific. J. Climate 18, 58–70.
Meskhidze, N. and Nenes, A. 2006. Phytoplancton and cloudiness in theSouthern Ocean. Science 314, 1419–1423.
Miller, J. and Rusell, G. 2004. Modeling feedbacks between water andvegetation in the north African climate system. In: Scientists Debate
Gaia, (eds. K. Schneider, J. Miller, E. Crist and P. Boston), MITPress,Boston, USA, 297–305.
Nevison, C., Gupta, V. and Klinger, L. 1999. Self-sustained temperatureoscillations on Daisyworld. Tellus 51B, 806–814.
Nordstrom, K., Gupta, V. and Chase, T. 2005. Role of the hydrologicalcycle in regulating the planetary climate system of a simple nonlineardynamical model. Nonlinear Process. Geophys. 12, 741–753.
Olff, H., Ritchie, M. and Prins, H. 2002. Global environmental controlsof diversity in large herbivores. Nature 415, 901–904.
Pierrehumbert, R. 2002. The hydrologic cycle in deep-time climate prob-lems. Nature 419, 191–198.
Poveda, G. and Mesa, O. 2000. On the existence of Lloro (the rainiestlocality on Earth): enhanced ocean-atmosphere-land interaction by alow-level jet. Geophys. Res. Lett. 27, 1675–1678.
Pujol, T. 2002. The consequence of maximum thermodynamic efficiencyin Daisyworld. J. Theor. Biol. 217, 53–60.
Ramanathan, V., Cess, R. D., Harrison, E. F., Minnis, P., Barkstrom, B.R. and co-authors. 1989. Cloud radiative forcing and climate: resultsfrom the earth radiation budget experiment. Science 243, 57–63.
Rangno, A. L. 2003. Clouds classification. In: Encyclopedia of Atmo-
spheric Sciences (eds. J. R. Holton, J. A. Curry and J. A. Pyle).Elsevier Sciences, London, 467–475.
Raval, A., and Ramanathan, V. 1989. Observational determination of thegreenhouse effect. Nature 342, 758–761.
Robertson, D. and Robinson, J. 1998. Darwinian Daisyworld. J. Theor.Biol. 195, 129–134.
Saunders, P. 1994. Evolution without natural selection: further im-plications of the Daisyworld parable. J. Theor. Biol. 166, 365–373.
Seto, M. and Akagi, T. 2005. Daisyworld inhabited with daisies in-corporating a seedsize/number trade-off: the mechanism of negativefeedback on selection from a standpoint of the competition theory. J.
Theor. Biol. 234, 167–172.
Tellus 61B (2009), 2

HYDROLOGICAL CYCLE AND CLOUDS IN DAISYWORLD 497
Shaw, G. E. 1983. Bio-controlled thermostasis involving the sulfur cycle.Climat. Change 5, 297–303.
Sole, R. V. and Bascompte, J. 2006. Self-Organization in Complex
Ecosystems. Princeton University Press, Princeton.Stephens, G., Webster, P., Johnson, R., Engelen, R. and L’Ecuyer, T.
2004. Observational evidence for the mutual regulation of the tropicalhydrological cycle and tropical sea surface temperatures. J. Climate
17, 2213–2224.Stocker, S. 1995. Regarding mutations in Daisyworld models. J. Theor.
Biol. 175, 495–501.Sugimoto, T. 2002. Darwinian evolution does not rule out the Gaia
Hypothesis. J. Theor. Biol. 218, 447–455.Szilder, K. and Lozowski, E. 1996. The influence of greenhouse warming
on the atmospheric component of the hydrological cycle. Hydrol.Process. 10, 1317–1327.
Toniazzo, T., Lenton, T., Cox, P. and Gregory, J. 2005. Entropy andGaia: is there a link between MEP and self-regulation in the climatesystem?. In: Non-equilibrium Thermodynamics and the Production of
Entropy (eds. A. Kleidon and R. Lorentz). Springer, Berlin, Germany,224–241.
Vallina, S. M. and Simo, R. 2007. Re-visiting the CLAW hypothesis.Environ. Chem. 4, 384–387.
Volk, T. 2002. Toward a future for Gaia theory. Climat. Change 52,423–430.
Volk, T. 2003. Natural selection, Gaia, and inadvertent by-products.Climat. Change 58, 1–2.
Volk, T. 2004. Gaia is life in a wasteworld of by-products. In: Scientists
Debate Gaia (eds. K. Schneider, J. Miller, E. Crist and P. Boston),MIT Press, Boston, USA, 27–36.
Von Bloh, W., Block, A. and Schellnhuber, H. 1997. Self-stabilization ofthe biosphere under global change: a tutorial geophysical approach.Tellus 49B, 249–262.
Wang, W., Zhang, Q., Easterling, D. and Carl, T. 1993. Beijing cloudinesssince 1875. J. Climate 6, 1921–1927.
Washington, W. 1995. Climate-model responses to increased CO2 andother greenhouse gases. In: Climate System Modeling (ed. K. Tren-berth). Cambridge University Press, Cambridge, UK, 643–668.
Watson, A. and Lovelock, J. 1983. Biological homeostasis of the globalenvironment: the parable of Daisyworld. Tellus 35B, 284–289.
Weber, S. 2001. On homeostasis in Daisyworld. Climat. Change 48(2-3),465–485.
Weber, S. and Robinson, J. 2004. Daisyworld homeostasis and the EarthSystem. In: Scientists Debate Gaia (eds. K. Schneider, J. Miller, E.Crist and P. Boston), MIT Press, Boston, USA, 231–240.
Wilkinson, D. 2004. Homeostatic Gaia: an ecologist’s perspective onthe possibility of regulation. In: Scientists Debate Gaia (eds. K.Schneider, J. Miller, E. Crist and P. Boston). MIT Press, Boston,USA, 71–76.
Zeng, X., Pielke, R. and Eykholt, R. 1990. Chaos in Daisyworld. Tellus42B, 309–318.
Zeng, X., Pielke, R. and Eykholt, R. 1992. Reply to Jascourt andRaymond. Tellus 44B, 247–248.
Tellus 61B (2009), 2