Robust Smartphone App Identification Via Encrypted Network ...
16
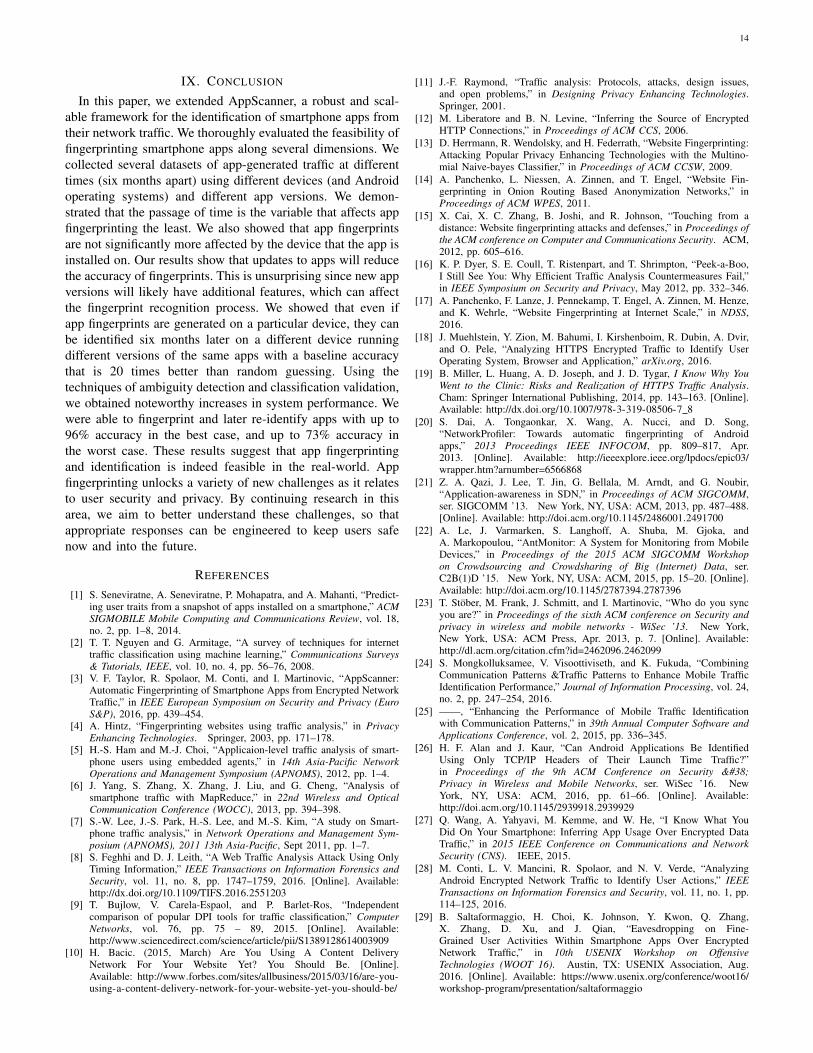
1 Robust Smartphone App Identification Via Encrypted Network Traffic Analysis Vincent F. Taylor, Riccardo Spolaor, Mauro Conti and Ivan Martinovic Abstract—The apps installed on a smartphone can reveal much information about a user, such as their medical conditions, sexual orientation, or religious beliefs. Additionally, the presence or absence of particular apps on a smartphone can inform an adversary who is intent on attacking the device. In this paper, we show that a passive eavesdropper can feasibly identify smartphone apps by fingerprinting the network traffic that they send. Although SSL/TLS hides the payload of packets, side- channel data such as packet size and direction is still leaked from encrypted connections. We use machine learning techniques to identify smartphone apps from this side-channel data. In addition to merely fingerprinting and identifying smartphone apps, we investigate how app fingerprints change over time, across devices and across different versions of apps. Additionally, we introduce strategies that enable our app classification system to identify and mitigate the effect of ambiguous traffic, i.e., traffic in common among apps such as advertisement traffic. We fully implemented a framework to fingerprint apps and ran a thorough set of experiments to assess its performance. We fingerprinted 110 of the most popular apps in the Google Play Store and were able to identify them six months later with up to 96% accuracy. Additionally, we show that app fingerprints persist to varying extents across devices and app versions. I. I NTRODUCTION Smartphone usage continues to increase dramatically as devices become more affordable and feature-rich. Apps are the main driver of this growth as they provide convenient access to attractive extra functionality. Many apps usually leverage internet access to provide this extra functionality and thus many apps generate network traffic. The combination of increased app usage coupled with app-generated network traffic makes the smartphone an attractive target for anyone seeking to uncover people’s app usage habits. Smartphone users typically install and use apps that are in line with their interests. Apps provide a broad spectrum of functionality including medical, finance, entertainment, and lifestyle services. As a result, the apps installed on typical smartphones may reveal sensitive information about a user [1]. This may include a user’s medical conditions, hobbies, and sexual/religious preferences. An adversary could also infer who a user banks with, what airline they usually fly on, and which company provides them insurance. This information may be particularly useful in “spear phishing” attacks. In addition to uncovering the aforementioned sensitive informa- tion, an adversary can also use app identification to enumerate V. F. Taylor and I. Martinovic are with the Department of Com- puter Science, University of Oxford, Oxford, United Kingdom. E-mail: [email protected] ; [email protected]. R. Spolaor and M. Conti are with the Department of Mathematics, University of Padua, Padua 35122, Italy. E-mail: [email protected] ; [email protected]. and exploit potentially vulnerable apps in an attempt to gain privileges on a smartphone. Network traffic fingerprinting is not a new area of research, and indeed the literature exemplifies techniques for network traffic classification on traditional computers [2]. On smart- phones, however, app fingerprinting and identification is frus- trated in several ways. Port-based fingerprinting fails because apps deliver their data predominantly using HTTP/HTTPS. Typical web page fingerprinting fails since apps usually send data back and forth using text formats such as XML and JSON, thus removing rich information (such as the number of files and file sizes) that aid web page classification. Additionally, many apps use content delivery networks (CDNs) and third- party services, thus eliminating domain name resolution or IP address lookup as a viable strategy. Observing domain name resolution or TLS handshakes also proves less useful due to the use of CDNs. Moreover, DNS and TLS exchanges may not be observed at all due to the use of client-side caching, or simply due to the mobile nature (i.e., transient connectivity) of smartphones. In this paper, we focus on understanding the extent to which smartphone apps can be fingerprinted and later identified by analysing the encrypted network traffic coming from them. We exploit the fact that while SSL/TLS protects the payload of a network connection, it fails to hide other coarse information such as packet lengths and direction. Additionally, we evaluate the robustness of our app fingerprinting framework by measuring how it is affected by different devices, different app versions, or the mere passage of time. App fingerprinting may be useful in a variety of scenarios: 1) An adversary in possession of exploits for particular apps may use app fingerprinting to identify these vulnerable apps on a network to narrow their list of target devices. 2) An adversary on the same Wi-Fi network as the victim could surreptitiously monitor the victim’s network traffic to identify what apps are installed on a device for the purposes of blackmail. 3) App fingerprinting in the current era of bring-your-own- device (BYOD) can provide valuable data about the types of apps and usage patterns of these apps within an organisation. 4) App fingerprinting can aid market research since app usage can be measured within a target population. In this paper we extend AppScanner, first presented by the authors in [3], along several important dimensions.
-
Upload
khangminh22 -
Category
Documents
-
view
2 -
download
0
Transcript of Robust Smartphone App Identification Via Encrypted Network ...

1
Robust Smartphone App Identification ViaEncrypted Network Traffic Analysis
Vincent F. Taylor, Riccardo Spolaor, Mauro Conti and Ivan Martinovic
Abstract—The apps installed on a smartphone can revealmuch information about a user, such as their medical conditions,sexual orientation, or religious beliefs. Additionally, the presenceor absence of particular apps on a smartphone can informan adversary who is intent on attacking the device. In thispaper, we show that a passive eavesdropper can feasibly identifysmartphone apps by fingerprinting the network traffic that theysend. Although SSL/TLS hides the payload of packets, side-channel data such as packet size and direction is still leaked fromencrypted connections. We use machine learning techniques toidentify smartphone apps from this side-channel data. In additionto merely fingerprinting and identifying smartphone apps, weinvestigate how app fingerprints change over time, across devicesand across different versions of apps. Additionally, we introducestrategies that enable our app classification system to identify andmitigate the effect of ambiguous traffic, i.e., traffic in commonamong apps such as advertisement traffic. We fully implementeda framework to fingerprint apps and ran a thorough set ofexperiments to assess its performance. We fingerprinted 110 ofthe most popular apps in the Google Play Store and were ableto identify them six months later with up to 96% accuracy.Additionally, we show that app fingerprints persist to varyingextents across devices and app versions.
I. INTRODUCTION
Smartphone usage continues to increase dramatically asdevices become more affordable and feature-rich. Apps arethe main driver of this growth as they provide convenientaccess to attractive extra functionality. Many apps usuallyleverage internet access to provide this extra functionality andthus many apps generate network traffic. The combinationof increased app usage coupled with app-generated networktraffic makes the smartphone an attractive target for anyoneseeking to uncover people’s app usage habits.
Smartphone users typically install and use apps that are inline with their interests. Apps provide a broad spectrum offunctionality including medical, finance, entertainment, andlifestyle services. As a result, the apps installed on typicalsmartphones may reveal sensitive information about a user [1].This may include a user’s medical conditions, hobbies, andsexual/religious preferences. An adversary could also inferwho a user banks with, what airline they usually fly on, andwhich company provides them insurance. This informationmay be particularly useful in “spear phishing” attacks. Inaddition to uncovering the aforementioned sensitive informa-tion, an adversary can also use app identification to enumerate
V. F. Taylor and I. Martinovic are with the Department of Com-puter Science, University of Oxford, Oxford, United Kingdom. E-mail:[email protected] ; [email protected].
R. Spolaor and M. Conti are with the Department of Mathematics,University of Padua, Padua 35122, Italy. E-mail: [email protected] ;[email protected].
and exploit potentially vulnerable apps in an attempt to gainprivileges on a smartphone.
Network traffic fingerprinting is not a new area of research,and indeed the literature exemplifies techniques for networktraffic classification on traditional computers [2]. On smart-phones, however, app fingerprinting and identification is frus-trated in several ways. Port-based fingerprinting fails becauseapps deliver their data predominantly using HTTP/HTTPS.Typical web page fingerprinting fails since apps usually senddata back and forth using text formats such as XML and JSON,thus removing rich information (such as the number of filesand file sizes) that aid web page classification. Additionally,many apps use content delivery networks (CDNs) and third-party services, thus eliminating domain name resolution or IPaddress lookup as a viable strategy. Observing domain nameresolution or TLS handshakes also proves less useful due tothe use of CDNs. Moreover, DNS and TLS exchanges maynot be observed at all due to the use of client-side caching, orsimply due to the mobile nature (i.e., transient connectivity)of smartphones.
In this paper, we focus on understanding the extent to whichsmartphone apps can be fingerprinted and later identified byanalysing the encrypted network traffic coming from them. Weexploit the fact that while SSL/TLS protects the payload of anetwork connection, it fails to hide other coarse informationsuch as packet lengths and direction. Additionally, weevaluate the robustness of our app fingerprinting frameworkby measuring how it is affected by different devices, differentapp versions, or the mere passage of time.
App fingerprinting may be useful in a variety of scenarios:
1) An adversary in possession of exploits for particular appsmay use app fingerprinting to identify these vulnerableapps on a network to narrow their list of target devices.
2) An adversary on the same Wi-Fi network as the victimcould surreptitiously monitor the victim’s network trafficto identify what apps are installed on a device for thepurposes of blackmail.
3) App fingerprinting in the current era of bring-your-own-device (BYOD) can provide valuable data about the typesof apps and usage patterns of these apps within anorganisation.
4) App fingerprinting can aid market research since appusage can be measured within a target population.
In this paper we extend AppScanner, first presented bythe authors in [3], along several important dimensions.

2
AppScanner is a highly-scalable and extensible frameworkfor the fingerprinting and identification of apps from theirnetwork traffic. The framework is encryption-agnostic, andonly analyses side-channel data, thus making it performwell whether the network traffic is encrypted. We make thefollowing additional contributions beyond the original paper:
1) An analysis of the robustness of app fingerprinting acrossdifferent devices and app versions. We also analyse thetime invariability of app fingerprints, by measuring howperformance is affected when attempting to identify appsusing fingerprints generated six months earlier.
2) Design and full implementation1 of an app classificationsystem incorporating a novel machine learning strategyto identify ambiguous network traffic, i.e., traffic that issimilar across apps.
3) Evidence that app fingerprints are time, app version, anddevice invariant to varying extents. This lends supportto the idea that app classification can be useful inreal-world settings.
The rest of the paper is organised as follows: Section IIdoes a survey of related work; Section III overviews how oursystem works at a high-level and explains key terminology;Section IV outlines our approach to identifying ambiguoustraffic; Section V overviews the datasets that were collected;Section VI comprehensively evaluates system performance;Section VII discusses ways of improving classifier accuracyusing post-processing strategies; Section VIII discusses ourresults; and finally Section IX concludes the paper.
II. RELATED WORK
Much work has been done on analysing traffic from work-stations and web browsers [4]. At first glance, fingerprintingsmartphone apps may seem to be a simple translation ofexisting work. While there are some similarities, there arenuances in the type of traffic sent by smartphones and the wayin which it is sent that makes traffic analysis on smartphonesdistinct from traffic analysis on traditional workstations [5]–[8]. We outline related work by first enumerating trafficanalysis approaches on workstations (Section II-A), and thenfocusing on traffic analysis on smartphones (Section II-B).
A. Traditional Traffic Analysis on Workstations
Traditional analysis approaches have relied on artefacts ofthe HTTP protocol to make fingerprinting easier. For example,when requesting a web page, a browser will usually fetch theHTML document and all corresponding resources identified bythe HTML code such as images, JavaScript and style-sheets.This simplifies the task of fingerprinting a web page since theattacker has a corpus of information (IP addresses, sizes offiles, number of files) about the various resources attachedto an individual document. If traffic is unencrypted, deeppacket inspection (DPI) can be useful for traffic classification.
1The code and datasets used for this paper are available athttps://github.com/vftaylor/appscanner.
Bujlow et al. [9] do an independent comparison of trafficclassification tools that leverage deep packet inspection (DPI).The authors found that a commercial tool gave the best per-formance, although open-source tools also gave high accuracy.However, DPI fails in the face of encryption and differentapproaches need to be taken when classifying encrypted traffic.
Many apps, for scalability, build their APIs on top of CDNssuch as Akamai or Amazon AWS [10]. This reduces (onaverage) the number of endpoints that apps communicate with.In the past, it may have been useful to look at the destinationIP address of some traffic and infer the app that was sendingthe traffic. With the advent of CDNs and standard web serviceAPIs, more apps are sending their traffic to similar endpoints,and this frustrates attempts to fingerprint app traffic based ondestination IP address only.
Several works considered strong adversaries (e.g., govern-ments) that may leverage traffic analysis to monitor useractivity. Those adversaries are able to capture the networktraffic flowing through communication links [11]. A pioneeringwork by Liberatore et al. in [12] showed the feasibility ofweb-page identification via encrypted HTTP traffic analysis.Subsequently, Hermann et al. [13] outperformed the afore-mentioned work by Liberatore et al. by presenting a methodthat relies on common text mining techniques performed overthe normalized frequency distribution of observable IP packetsizes. This method correctly classified some 97% of HTTPrequests. Panchenko et al. [14] proposed a system based onSupport Vector Machines (SVMs) that correctly identified webpages despite the use of onion routing anonymisation (e.g.,Tor). More recently, Cai et al. [15] and Dyer et al. [16]presented web-page fingerprinting attacks and discussed theireffectiveness despite traffic analysis countermeasures (e.g.,HTTPOS). In particular, Dyer et al. aimed to elude trafficanalysis countermeasures based on packet padding, proposinga technique that relies on per-direction bandwidth and durationof flows.
More recently still, Panchenko et al. [17] present a websitefingerprinting attack on Tor that outperforms related work(including their own earlier proposal) while requiring lesscomputational resources. Using SVMs as the classifiers, theyproposed a feature extraction technique that samples featuresstarting from a cumulative representation of a webpage’s net-work flow. Muehlstein et al. [18] show that HTTPS traffic canbe used to identify operating system, browser, and application.Similar to our work, the authors generate features using theconcept of an encrypted network traffic flow. Miller et al. [19]use traffic analysis to identify individual web pages withinwebsites with approximately 90% accuracy. However, the au-thors make two assumptions: (i) they rely on feature extractionusing whole network bursts (multiple flows), assuming all theflows in the same burst belong to the same webpage; and(ii) they can also rely on multiple bursts to build a websitegraph through an Hidden Markov Model (HMM). Theseassumptions, while reasonable for webpage fingerprinting,fail for mobile app fingerprinting. On smartphones, multipleapps can concurrently send network traffic and so a singleburst could contain flows generated by different apps. Duringclassifier training it is possible to identify which app generated

3
a network flow (even in the concurrent apps scenario) usingtechniques we later describe (Section III-B), but such flowlabelling is not possible during a real-world attack.
B. Traffic Analysis on Smartphones
In early work on the topic, Dai et al. [20] propose Net-workProfiler, an automated approach to profiling and identi-fying Android apps using dynamic methods. They use user-interface fuzzing (UI fuzzing) to automatically explore dif-ferent activities and functions within an app, while capturingand logging the resulting network traffic. The authors inspectHTTP payloads in their analysis and thus this technique onlyworks with unencrypted traffic. The authors did not have thefull ground truth of the traffic traces they were analysing,so it is difficult to systematically quantify how accurateNetworkProfiler was in terms of precision, recall, and overallaccuracy.
Qazi et al. [21] present Atlas, a framework for identifyingapps using network flows. Atlas uses crowdsourcing to obtainground truth. The authors tested their system on 40 Androidapplications and achieved an average performance of 94%.It however remains unclear whether Atlas maintains goodperformance as the number of apps to be classified increases.Le et al. [22] propose AntMonitor, a system that also usescrowdsourcing but for the fine-grained collection of networkdata from Android devices. In contrast, AppScanner does notleverage crowdsourcing approaches. Indeed, AppScanner isable to obtain perfect ground truth and does so in a scalableway using UI fuzzing (Section III-B).
Stober et al. [23] propose a scheme for identifying a mobiledevice using the characteristic traffic patterns it produces.The authors posit that 3G transmissions can be realisticallyintercepted and demodulated to obtain side channel infor-mation such as the amount of data and timing information.The authors leverage network bursts from which they extractfeatures since they cannot analyse the TCP payload directly.Using supervised learning, the authors build a model of thebackground traffic coming from devices. With their system,using approximately 15 minutes of captured traffic can resultin a classification accuracy of over 90%. A major drawbackwith this work is that the system needs six hours of trainingand 15 minutes of monitoring to achieve reliable fingerprintmatching.
Mongkolluksamee et al. [24] [25] use packet size distribu-tion and communication patterns for identifying mobile apptraffic. The authors achieve an F-score of approximately 95%.Unfortunately, they only consider five apps so it remainsunclear how scalable their approach is. The authors also fail tocollect perfect ground truth because their methodology callsfor running one app at a time on a device to reduce noiseinstead of more robust approaches (see Section III-B). Alanand Kaur [26] use TCP/IP headers for identifying apps. Theauthors identified apps with up to 88% accuracy using packetsize information from the first 64 packets generated upon applaunch. The authors found that performance decreases whentraining and testing devices are different. They also found thatperformance decreases only slightly when several days have
passed between training and testing. Complementary to this,we investigate the problem using all network traffic comingfrom apps. By collecting data over a period of six monthsinstead of several days, we show that traffic classification ismore severely impacted by time and that additional strategiesto improve performance need to be employed.
Wang et al. [27] propose a system for identifying smart-phone apps from encrypted 802.11 frames. They collect datafrom target apps by running them dynamically and trainingclassifiers with features from Layer 2 frames. The authorstest 13 arbitrarily chosen apps from eight distinct app storecategories and collect network traces for five minutes. Bytaking into account a larger set of apps, we show thatincreasing the number of apps negatively impacts classifieraccuracy. Wang et al. also fail to collect perfect ground truth.Indeed, our methodology minimises noise by running a singleapp at a time, and we still had to filter 13% of the trafficcollected because it was background traffic from other apps.AppScanner solves the aforementioned problems by using alarger sample of apps from a wider set of categories andcollecting network traffic for substantially more time.
Conti et al. [28] and Saltaformaggio et al. [29] identifyspecific actions that users are performing within their smart-phone apps. Due to similarity, we briefly describe the approachof Conti et al. The authors identify specific actions throughflow classification and supervised machine learning. Theirsystem works in the presence of encrypted connections sincethe authors only leverage coarse flow information such aspacket direction and size. AppScanner also leverages packetdirection and size, but more robust statistical features arederived from this raw packet data as shown in Section III-B.Conti et al. achieved more than 95% accuracy for most ofthe considered actions. Their work, however, suffers from itsspecificity in identifying discrete actions. By choosing specificactions within a limited group of apps, Conti et al. maybenefit from the more distinctive flows that are generated.Their system also does not scale well since a manual approachwas taken when choosing and fingerprinting actions. Indeed,the authors chose a small set of apps and a small subset ofactions within those apps to analyse.
Our prior work [3] improves on the weaknesses of the sys-tems described above. First, by leveraging only side-channelinformation, we are able to classify apps in the face ofencrypted network traffic. Additionally, our system is trainedand tested on 110 apps with traffic collected from each appfor 30 minutes. Due to the nature of our framework, appscan also be trained automatically, removing the need forhuman intervention. Our prior work is however limited inhandling ambiguous traffic. Ambiguous traffic, i.e., traffic thatis common among more than one apps, would negatively affectour previous system and cause poorer performance. Our priorwork also does not provide an understanding of the variabilityand longevity of app fingerprints. In this paper, we measurehow different devices, app versions, or the passage of timeaffects app fingerprinting.

4
III. SYSTEM OVERVIEW
As an overview, AppScanner fingerprints smartphone appsby using machine learning to understand the network trafficthat has been generated by them. Patterns in app-generatedtraffic, when later seen, are used to identify apps.
Unfortunately, apps sometimes have common traffic patternsbecause they share libraries, such as ad libraries, that generatesimilar traffic2 across distinct apps. This can frustrate attemptsat app classification using traffic analysis, since it may generatefalse positives. Thus, a strategy is needed to first identify trafficthat is shared among apps, so that it can be appropriatelylabelled before being passed to classifiers. We call trafficshared among apps ambiguous traffic and the remaining trafficdistinctive traffic.
In what follows, we introduce the concepts of burst andflow, which are central to our fingerprinting methodology:
Burst: A burst is the group of all network packets (irre-spective of source or destination address) occurring togetherthat satisfies the condition that the most recent packet occurswithin a threshold of time, the burst threshold, of the previouspacket. In other words, packets are grouped temporally and anew group is created only when no new packet has arrivedwithin the amount of time set as the burst threshold. This isvisually depicted as Traffic burstification in Fig. 1(c), where wecan see Burst A and Burst B separated by the burst threshold.We use the concept of a burst to logically divide the networktraffic into discrete, manageable portions, which can then befurther processed.
Flow: A flow is a sequence of packets (within a burst)with the same remote IP address. That is, within a flow,all packets will either be going to (or coming from) thesame remote IP address. A flow is not to be confused witha TCP session. A flow ends at the end of a burst, while aTCP session can span multiple bursts. Thus, flows typicallylast for a few seconds, while TCP sessions can continueindefinitely. AppScanner leverages flows instead of TCPsessions to achieve real-time/near-to-real-time classification.From Flow separation in Fig. 1(d), it can be seen that a burstmay contain one or more flows. Flows may overlap in aburst if a single app, App X, initiates TCP sessions in quicksuccession or if another app (e.g., App Y), happens to initiatea TCP session at the same time as App X.
Our app identification framework first elicits network trafficfrom an app, generates features from that traffic, trains classi-fiers using these features, and finally identifies apps when theclassifiers are later presented with unknown traffic.
A. Equipment Setup
The setup used to collect network traces from apps isdepicted as Equipment setup in Fig. 1(a). The workstation wasconfigured to forward traffic between the Wi-Fi access point(AP) and the Internet. To generate traffic from which to captureour training/testing data, we used scripts that communicated
2Traffic generated by third-party libraries will typically be common amongapps using that particular library.
Net
wor
k tr
ace
capt
ure
(b)
Time
Bytes Received
Bytes Transmitted
Tra
ffic
bu
rsti
fica
tio
n (c
)Fl
ow s
epar
atio
n (d
)C
lass
ifie
r tr
ain
ing
(f)
Trai
ned
cla
ssifi
ers
(g)
Burst Threshold
Burst A Burst B
Equi
pmen
t set
up (a
)
Wi-Fi AP
Scripts to simulate user input
Internet
ADB commands sent via USB
App X
App Y
Time
Bytes Received
Bytes Transmitted
Feature Space X
Fea
ture
Spa
ce Y
Class Boundary
Feature Extraction Classifier Training
Set
Flow B1
Flow A3 Flow B2Flow A2
Flow A1
Am
bigu
ity
dete
ctio
n (e
)
App X
App X
App X
App Y
App Y
Ambiguity Detection
Distinctive Flows
Ambiguous Flows
App X
Ambiguous
App X
Ambiguous
App Y
App X
App Y
Ambiguous
Fig. 1. High-level representation of classifier training, and a visualisationof bursts and flows within network traffic. (a) Equipment setup. (b) Networktrace capture. (c) Traffic burstification. (d) Flow separation. (e) Ambiguitydetection. (f) Classifier training. (g) Trained classifiers.

5
SOURCE_IP DEST_IP PROTO LEN
192.168.137.2 23.23.162.140 TCP 74
23.23.162.140 192.168.137.2 TCP 74
192.168.137.2 23.23.162.140 TCP 66
192.168.137.2 23.23.162.140 TLSv1 287
23.23.162.140 192.168.137.2 TCP 66
23.23.162.140 192.168.137.2 TLSv1 1078
23.23.162.140 192.168.137.2 TCP 1078
23.23.162.140 192.168.137.2 TCP 1078
23.23.162.140 192.168.137.2 TCP 1078
23.23.162.140 192.168.137.2 TCP 114
23.23.162.140 192.168.137.2 TCP 1078
23.23.162.140 192.168.137.2 TLSv1 796
Vectors comprised of statistical
features generated from
flows
Flow Pre-processor
Statistical Feature Extraction
[0.12, 0.76, 0.32, 0.1, 0.39, … , 0.88]
Variable Length Feature Vectors
Constant Length Feature Vectors
[74, -74, 66, 287, -66, -1078, … , -796]
Fig. 2. Generating features from flows for classifier training.
with the target smartphone via USB using the Android DebugBridge (ADB). These scripts were used to simulate useractions within apps and thus elicit network flows from theapps. This technique is called UI fuzzing.
The traffic generated by the smartphone was capturedand exported as network traffic dumps containing details ofcaptured packets. We collected packet details such as time,source address, destination address, source port, destinationport, packet size, protocol and TCP/IP flags. The payload foreach packet was also collected but was not used to providefeatures since it may or may not be encrypted. Althoughphysical hardware was used for network traffic generationand capturing, this process can be massively automated andparallelised by running apps within Android emulators onvirtual machines.
B. Fingerprint Making
There are several stages in the fingerprint making processas follows:
Network Trace Capture: Network traffic from apps waselicited automatically using UI fuzzing. UI fuzzing involvesusing scripts on a workstation to interact with the target devicethrough the Android Debug Bridge (ADB). User interfaceevents such as button presses, swipes, and keypresses aresent to apps in an automated fashion. These touchscreen inputevents cause the logic within apps to execute, thus generatingnetwork traffic.
We performed UI fuzzing on one app at a time to minimise‘noise’ (i.e., traffic generated simultaneously by other apps)in the network traces. Traffic from other apps or the Androidoperating system itself could interfere with and taint thefingerprint making process. To combat the problem of noise,the Network Log tool [30] was used to identify the appresponsible for each network flow. Using data from NetworkLog combined with a ‘demultiplexing’ script, all traffic thatdid not originate from the target app was removed from thetraffic dump for that app. In this way, and in contrast to relatedwork, we obtained perfect ground truth of what flows camefrom what app.
After data collection, the network traffic dumps werefiltered to include only TCP traffic that was error free. Forexample, we filtered to remove packet retransmissions that
were as a result of network errors.
Traffic Burstification and Flow Separation: The next stepwas to parse the network dumps to obtain network traf-fic bursts. Traffic was first discretized into bursts to obtainephemeral chunks of network traffic that could be sent imme-diately to the next stage of AppScanner for processing. Thisallows us to meet the design objective of real-time or nearreal-time classification of network traffic. Falaki et al. [31]observed that 95% of packets on smartphones “are receivedor transmitted within 4.5 seconds of the previous packet”.During our tests, we observed that setting the burst threshold toone second instead of 4.5 seconds only slightly increased thenumber of bursts seen in the network traces. This suggests thatnetwork performance (in terms of bandwidth and latency) hasimproved since the original study. For this reason, we optedto use a burst threshold of one second to favour more overallbursts and nearer-to-real-time performance. Bursts were sepa-rated into individual flows (as defined at the beginning of thissection and depicted in Fig. 2) using remote IP address. Weenforced a maximum flow length that would be considered bythe system. This is simply to ensure that abnormal traffic canbe safely ignored in the real-world.
It is important to note that while destination IP addresseswere used for flow separation, they were not leveragedto assist with app identification. We also opted not touse information gleaned from DNS queries or flows withunencrypted payloads. We took this design decision to avoidthe reliance on domain-specific knowledge that frequentlychanges, thus making our framework useful in the long term.
Ambiguity Detection: As mentioned at the beginning ofthis section, many apps have third-party libraries in common(especially ad libraries) and these libraries themselvesgenerate network traffic. Unfortunately, it is not possible todiscriminate traffic coming from libraries (as opposed to theapp that embeds the library) in a scalable way, i.e., without anintrusive approach such as reverse-engineering or modifyingapps. Indeed, as far as the operating system is concerned,apps and their bundled libraries are one entity within the sameprocess. Since network traffic generated by common librariesacross apps is similar, this will frustrate the fingerprintingprocess because classifiers will be given contradictory trainingexamples. This problem of ambiguous flows poses a challenge

6
Preliminary classifier
Accuracy
Dataset 1
Dataset 2
Preliminary Train ing Set
Preliminary Testing Set
Accuracy Reinforced classifier
Relabel Engine
Feedback
Reinforced Train ing Set Reinforced Testing Set
Fig. 3. Using reinforcement learning to obtain robustness against ambiguous flows.
to naive machine learning approaches. To mitigate negativeeffects, we introduce Ambiguity Detection as detailed inSection IV. Ambiguity detection uses simple reinforcementlearning techniques to identify similar flows coming fromdifferent apps. In the training phase, ambiguous flows aredetected and relabelled as belonging to the “ambiguous”class, so that the system is later able to properly identify andhandle them.
Classifier Training: Statistical features were generated fromflows and used to train classifiers. Statistical feature extractioninvolves deriving 54 statistical features from each flow asshown in Fig. 2. For each flow, three vectors are considered:size of incoming packets only, size of outgoing packets only,and size of both incoming and outgoing packets. For eachvector (3 in total), the following values were computed:minimum, maximum, mean, median absolute deviation,standard deviation, variance, skew, kurtosis, percentiles(from 10% to 90%), and the number of elements in theseries (18 in total). These statistical features are computedusing the Python pandas [32] library. Thus, arbitrary lengthflows are converted to feature vectors of length 54. Thesefeature vectors and their corresponding ground truth are usedas training examples.
C. App IdentificationUnknown flows are passed to the trained classifiers. Am-
biguous flows are identified and labelled as such, since theclassifiers were trained to understand ambiguous flows. Flowsthat are not labelled by the classifiers as ambiguous next gothrough classification validation as described in Section VII-B.The classification validation stage is crucial for one primaryreason. Machine learning algorithms will always attempt toplace an unlabelled example into the class it most closelyresembles, even if the match is not very good. Given thatour classifiers will never be trained with the universe of flowsfrom apps, it follows that there will be some flows presentedto AppScanner which are simply unknown or never-before-seen. If left unchecked, this can cause an undesirable increasein the false positive (FP) rate.
To counteract these problems, we leverage the predictionprobability metric (available in many classifiers) to understandhow certain the classifier is about each of its classifications.For example, if the classifier labelled an unknown sample ascom.facebook.katana, we would check its prediction proba-bility value for that classification to determine the classifier’s
confidence. If this value is below the classification validationthreshold, AppScanner will not make a pronouncement. How-ever, if this value exceeds the threshold, AppScanner wouldreport it as a match for that particular app. In Section VII,we discuss how varying this threshold impacts the precision,recall, and overall accuracy of AppScanner, as well as howthis affects the percentage of total flows that the classifiers areconfident enough to classify.
IV. AMBIGUITY DETECTION
The ambiguity detection phase aims to identify and relabelambiguous flows. This phase involves a reinforcement learningstrategy that is leveraged during classifier training. As outlinedin Fig. 3, classifier training is divided into two stages: thepreliminary classifier stage, and the reinforced classifier stage.
The main training set considered in the analysis is firstrandomly shuffled and divided into halves: the preliminarytraining set and the preliminary testing set. The preliminarytraining set is used to train the preliminary classifier. Thepreliminary testing set is used to measure the accuracy ofthe preliminary classifier, and as a basis for generating thetraining set for the reinforced classifier. In this way, wecan first identify which flows are incorrectly classified bythe preliminary classifier. We validated that these incorrectlylabelled flows are to a large extent library traffic, as expected.
The Relabel Engine leverages feedback on the accuracy ofthe preliminary classifier to identify ambiguous flows. Flows inthe preliminary testing set that are incorrectly classified are re-labelled as “ambiguous” by the Relabel Engine. On the otherhand, flows that are correctly classified by the preliminaryclassifier keep their original label (i.e., the app that generatedthem). This relabelled dataset is now used as the reinforcedtraining set and is passed to the reinforced classifier. Thereinforced classifier is thus equipped to identify ambiguousflows since it is trained with examples of ambiguous flows.
We emphasise to the reader that no flows from the pre-liminary training set are used in the reinforced training set.The preliminary classifier and the preliminary training setare only used as a means of identifying ambiguous flows sothat additional knowledge can be provided to the reinforcedclassifier.
V. DATASET COLLECTION
To test the performance of AppScanner, we considered arandom 110 of the 200 most popular free apps as listed by theGoogle Play Store. We chose the most popular apps because

7
TABLE IDESCRIPTIONS OF THE DEVICES, OPERATING SYSTEMS, NUMBER OF APPS, APP VERSIONS, AND TIME OF DATA COLLECTION FOR EACH DATASET USED.
Name Device Operating System Number of apps App versions Time of data collectionDataset-1 Motorola XT1039 Android 4.4.4 110 Latest versions as at T0 T0
Dataset-1a Motorola XT1039 Android 4.4.4 65 Latest versions as at T0 T0
Dataset-2 Motorola XT1039 Android 4.4.4 65 Latest versions as at T0 T0 + 6 monthsDataset-3 LG E960 Android 5.1.1 65 Latest versions as at T0 T0 + 6 monthsDataset-4 Motorola XT1039 Android 4.4.4 110 Latest versions as at T0 + 6 months T0 + 6 monthsDataset-4a Motorola XT1039 Android 4.4.4 65 Latest versions as at T0 + 6 months T0 + 6 monthsDataset-5 LG E960 Android 5.1.1 110 Latest versions as at T0 + 6 months T0 + 6 monthsDataset-5a LG E960 Android 5.1.1 65 Latest versions as at T0 + 6 months T0 + 6 months
they form a large part of the install-base of apps across theworld. Additionally, we chose free apps because free apps tendto be ad-supported and thus use ad libraries. There is a smallset of major ad libraries and thus ad libraries tend to be sharedacross apps. This suggests that free apps will be more likelyto generate ambiguous flows than paid apps. Being able toproperly fingerprint and identify free apps thus implies thatAppScanner is robust enough to handle paid apps as well.
Smartphones in our testbed were connected to the internetvia a Linksys E1700 Wi-Fi router/AP that had its internetconnection routed through a workstation. UI fuzzing was per-formed on each app for 30 minutes using the MonkeyRunnertool from the Android SDK. UI fuzzing simulated user actionsby invoking UI events such as touches, swipes, and buttonpresses. These UI events were generated randomly and sentto apps. It is worth noting that some apps presented loginscreens upon first launch. In such cases, we first manuallycreated accounts for those apps before logging in. We didthis to ensure that traffic generation using UI fuzzing wasnot hindered by a login screen. Greater coverage of all thenetwork flows in an app may theoretically be obtained byusing advanced UI fuzzing techniques provided by frameworkssuch as Dynodroid [33], or by recruiting human participants.However, we consider these approaches to be out of the scopeof our research.
A major contribution of this work is to understand howapp fingerprinting is affected by time, the device used, appversions, and combinations of these variables. For this reason,we collected several datasets as outlined in Table I. In whatfollows, we describe these datasets in detail.
The dataset we consider as our baseline is Dataset-1,which was collected using Device-A, a Motorola XT1039running Android version 4.4.4. This dataset contains networktraffic from 110 apps using the latest version of each app at thetime of initial data collection. We refer to this time of initialdata collection as T0. All other main datasets (Dataset-2to Dataset-5) were collected six months after T0, i.e., attime T0 + 6 months.Dataset-2 differs from Dataset-1 only by the time
of data collection. Dataset-2 contains data from only 65apps (instead of 110), because the remaining 45 apps refusedto run without being updated. We hereafter refer to the 65apps in Dataset-2 that ran without being updated as therun-without-update subset.Dataset-3 was collected using Device-B, an LG E960
running Android version 5.1.1. Dataset-3 also used the
0 500 1000 1500 2000 2500 3000
Number of flows per app
0.0
0.2
0.4
0.6
0.8
1.0
CD
F
Dataset-1Dataset-2Dataset-3Dataset-4Dataset-5
Fig. 4. CDF plot showing the number of flows per app in each dataset.
run-without-update subset.Dataset-4 and Dataset-5 were obtained by collecting
network traffic from the latest versions (at the time of datacollection six months after initial data collection) of theoriginal 110 apps and were collected using Device-A andDevice-B respectively.
Additionally, we consider variants of the datasets thathad 110 apps. These variants consider only apps in therun-without-update subset. We denote these dataset variantsas Dataset-1a, Dataset-4a, and Dataset-5a forDataset-1, Dataset-4 and Dataset-5, respectively.These datasets were generated in order to offer a balancedanalysis in the presence of datasets with less than 110 apps(i.e., Dataset-2 and Dataset-3).
Fig. 4 shows a cumulative distribution function (CDF) ofthe number of flows per app in each of the five main datasets.Using Dataset-1 as an example, an average of 1132 flowswere collected per app during UI fuzzing. In the same dataset,approximately 80% of apps had 500 or more flows. Otherdatasets contained fewer flows per app on average. Nonethe-less, recall that AppScanner identifies individual flows. Thus,even one flow is sufficient to successfully identify an app, ifthat flow is distinctive for that app.
VI. EVALUATION
In evaluating our system, we followed a two-step procedure.First, we report the results of a baseline evaluation of systemperformance using training and testing sets derived from singledatasets. Second, to obtain a more representative measurementof system performance, we performed a comprehensive suiteof tests (as outlined in Table III) using completely independenttraining and testing sets. Measurements were taken to under-stand how factors such as time, device (including operatingsystem), app version, and a combination of device and appversion affected performance.

8
We leveraged the scikit-learn [34] machine learning librariesto implement the classifiers in our framework. All classifierswere set to use default parameters. Random forest classifierswere chosen since they gave superior performance over sup-port vector machines (SVMs) in our previous work. Randomforest classifiers use aggregated decision trees which in turnreduce bias. Additionally, these classifiers are intrinsicallymulti-class classifiers, making them suitable for tasks such asapp classification. Moreover, random forest classifiers nativelygive the probability of belonging to a class, a feature we usein classification validation (Section VII-B). Although SVMscan handle multi-class problems and output the probability ofbelonging to a class, these features are not native to SVMs.
We highlight to the reader that any results reported inthis section should be considered as lower bounds of systemperformance. Indeed, the results presented in this sectionshow the performance of the system before any performance-enhancers, such as ambiguity detection and classification val-idation (Section VII), have been applied. The tests performedin this section are merely to assess default system performancebefore post-processing is applied.
For our baseline results, we split each dataset into a trainingset (75% of flows) and a testing set (25% of flows) and usedthem to train classifiers as detailed in Section III. Each test wasrun 50 times with randomly shuffled datasets and the resultswere averaged. We report the performance of our systemin Table II. Accuracy within datasets fell between 65.5%and 73.7%. These results are fairly good but may overestimatethe performance of the system. This is because the trainingand testing sets in each case were generated from one originaldataset.
In what follows, we do more robust measurements by usingcompletely independent datasets for training and testing tomake a more real-world assessment of system performance.Each test was run 50 times with randomly shuffled datasets andthe results averaged. The results in each case are summarisedin Table III.
A. Effect of Time
To measure the effect of time on classification performance,we trained a classifier with Dataset-1a and tested withDataset-2. This combination of training and testing sets as-sessed the effect of keeping device and app versions constant,but causing six months to pass between collection of data fortraining and testing. The overall accuracy for this test, calledthe TIME test, was 40.9% and was the highest performanceof our tests that used completely separate training and testingsets.
Among tests with completely independent training andtesting sets, TIME gave the highest performance. This resultis not surprising, since the app versions and device (includingoperating system version) were constant. The logic (app andoperating system) that generates traffic seems to generate thesame traffic even after some amount of time (in this casesix months) has elapsed. Since the underlying logic does notchange, it would be reasonable to expect app fingerprints toalso remain constant.
TABLE IIBASELINE PERFORMANCE OF APP CLASSIFICATION FOR EACH DATASET
WITHOUT ANY POST-PROCESSING TECHNIQUES APPLIED.
Dataset Precision(%) Recall(%) F1(%) Accuracy (%)Dataset-1 74.5 72.8 73.1 73.1Dataset-1a 74.4 73.2 73.4 73.7Dataset-2 68.8 67.6 67.7 65.5Dataset-3 71.3 69.5 69.8 70.4Dataset-4 68.6 66.6 66.9 67.4Dataset-4a 68.5 66.8 67.1 66.9Dataset-5 69.7 68.1 68.3 69.6Dataset-5a 67.7 65.5 66.0 67.5
B. Effect of a Different Device
To assess the impact of a different device on app classifica-tion we did three tests: D-110, D-110A, and D-65. D-110used Dataset-4 as a training set and Dataset-5 as atesting set. That is, we trained with 110 apps on one deviceand tested with the same 110 apps on a different device. Theoverall accuracy for D-110 was 37.6%. D-110A used therun-without-update subsets of the datasets used in D-110 andhad an overall accuracy of 37.7%. D-65 was conducted with atraining set of Dataset-2 and testing set of Dataset-3.That is, we trained with 65 apps on one device and testedwith 65 apps on another device. The overall accuracy forthis test was 39.6%. We note that this test, with 65 apps,gives performance comparable to the TIME test, which alsohad 65 apps. This insight suggests that device model andoperating system version does not have a significant effecton app fingerprinting performance.
C. Effect of Different App Versions
We carried out two tests to understand the impact that dif-ferent app versions had on app fingerprinting. V-LG involvedtraining with Dataset-3 and testing with Dataset-5a.For this test, the same device was used but with differentversions of the same apps. The overall accuracy of this testwas 30.3%. V-MG used a training set of Dataset-2 andtesting set of Dataset-4a. The overall accuracy for this testwas 32.7%. We note that the accuracy for both of these testswere fairly similar but markedly lower than the TIME, D-110or D-110A or D-65 tests. This insight suggests that changesin app versions affects the reliability of app fingerprinting. Webelieve that this phenomenon could be due to changes in appcode or logic that has direct consequences on the way that anapp generates network flows. Thus there is a need to keep appfingerprint databases up-to-date as app developers release newapp versions.
D. Effect of a Different Device and Different App Versions
A final two tests were conducted to measure the impactof changing both device and app versions. The first test,DV-110, used a training set of Dataset-1 and a testingset of Dataset-5, i.e., using a total of 110 apps. Thesecond test, DV-65, used a training set of Dataset-1aand testing set of Dataset-5a. These tests yielded overallaccuracies of 19.2% and 19.5% respectively. As expected from

9
TABLE IIISUMMARY OF THE COMPREHENSIVE SUITE OF TESTS USED TO MEASURE THE PERFORMANCE OF THE APP CLASSIFICATION SYSTEM. ALL TRAINING AND
TESTING SETS WERE COMPLETELY INDEPENDENT OF EACH OTHER. THE INDEPENDENT VARIABLES FOR EACH TEST ARE IDENTIFIED.
Test Name Training Set Testing Set Precision (%) Recall (%) F1 (%) Accuracy (%) Independent Variable AppsTIME Dataset-1a Dataset-2 44.5 43.1 42.6 40.9 Time 65D-110 Dataset-4 Dataset-5 40.9 36.6 36.3 37.6 Device 110D-110A Dataset-4a Dataset-5a 38.4 35.2 35.1 37.7 Device 65D-65 Dataset-2 Dataset-3 43.5 38.3 39.0 39.6 Device 65V-LG Dataset-3 Dataset-5a 33.0 31.0 30.0 30.3 App versions 65V-MG Dataset-2 Dataset-4a 34.8 32.1 32.1 32.7 App versions 65DV-110 Dataset-1 Dataset-5 23.3 19.5 19.3 19.2 Device & App versions 110DV-65 Dataset-1a Dataset-5a 22.3 19.7 19.3 19.5 Device & App versions 65
the results of our previous tests, changing both device andapp versions together more severely impacted classificationperformance. It is interesting to note, however, that the numberof apps in training and testing sets did not seem to impactoverall classification accuracy in a negative way under theseadverse conditions. This result lends support to the idea thatapp fingerprinting can be a scalable endeavour. We note thatdespite DV-110 and DV-65 having approximately half theaccuracy of the TIME test, they still perform approximately 20times better than pure random guessing.
VII. IMPROVING ACCURACY
Our results so far show the performance of AppScannerwithout any post-processing applied. Additionally, these re-sults simulate laboratory conditions since they are taken fromdatasets that have been filtered of noise (using NetworkLogas described in Section III-B). In this section, we look attwo post-processing strategies that have proven effective inimproving the accuracy of the system: ambiguity detectionand classification validation. Ambiguity detection is detailedin Section IV/VII-A and classification validation is discussedin Section VII-B. In general, both of these strategies aim toidentify network flows that are not reliable for app fingerprint-ing.
Also in the section, we analyse the impact of noise onclassification accuracy. Noise was filtered in our previoustests. While an attacker can easily filter noise during training,they are unable to filter noise during testing. Thus, weexamine the impact of noise using three (one laboratory andtwo real-world) experimental settings:
1) The noise-filtered setting removes all noise from trainingand testing sets using NetworkLog. This gives the perfor-mance of the system assuming that devices do not haveany network traffic being generated from non-app sources(such as the operating system).
2) The noise-ignored setting removes noise from the trainingsets, but leaves noise in the testing sets. This gives arealistic estimation of performance that might be expectedin a real-world attack scenario. This is because theattacker can remove noise from their training sets butis unable to remove noise during an attack.
3) The noise-managed setting goes a step further by ac-tually identifying and labelling noise in both trainingand testing sets. This allows the classifiers to understand
what network traffic coming from the Android operatingsystem itself looks like. Thus, classifiers are better able toidentify noise in the real-world, which further improvesaccuracy.
Unless otherwise stated, subsequent results are generated usingthe noise-managed experimental setting.
A. Ambiguity Detection
As mentioned in Section IV, many apps have traffic in com-mon and this can hinder app classification if left unhandled.Our reinforcement learning approach identifies and relabelsambiguous flows so that the classifiers have a model to identifythem. When measuring performance with ambiguity detectionin use, unknown flows that are labelled as ambiguous areomitted from calculations of classifier performance. That is,ambiguous flows are identified and ignored, and thus do notaffect the measurement of the performance of our system.
In what follows, we report on the improvements that can bemade by using our reinforcement learning approach to identifyambiguous traffic flows. Table IV shows the improvementin performance obtained by applying ambiguity detection asoutlined in Fig. 3. Additionally, the table shows the numberof flows in each testing set and the percentage of flows thatwere considered ambiguous. Each test used the training andtesting sets described in Table III but with varying noisehandling to provide results for each of the noise-filtered,noise-ignored, and noise-managed experimental settings. Forthese tests, reinforced classifiers are used so that ambiguoustraffic can be managed. Ambiguity detection was applied tothe training sets of these reinforced classifiers as detailed inSection IV. Each test was run 50 times with randomly shuffleddata and the results were averaged.
Reinforced classifiers received an approximately twofoldboost in overall accuracy. The most challenging tests, DV-110and DV-65 (using different physical devices, Android ver-sions, and app versions between training and testing sets),had the greatest percentage increases in performance and sawaccuracy more than double when using reinforced classifiers.For example, in DV-110, accuracy was increased from 19.2%to 41.0-46.3% using ambiguity detection. Improving perfor-mance using reinforced classifiers highlights the prevalenceof ambiguous flows in app traffic and reiterates the need forsystems that can address them.
Ambiguity detection improves accuracy at the expense ofthe number of flows that are classified by the system. In the

10
TABLE IVHOW THE REINFORCEMENT LEARNING STRATEGY IMPROVED CLASSIFIER PERFORMANCE FOR EACH OF THE TESTS THAT WERE CONDUCTED.
Test Name Noise filtered Noise ignored Noise managed Testing Set DetailsP(%) R(%) F1(%) A(%) P(%) R(%) F1(%) A(%) P(%) R(%) F1(%) A(%) #Flows %Ambiguous
TIME 66.9 66.4 65.7 72.9 61.4 65.3 61.9 64.5 66.4 65.3 64.6 74.8 54240 58.3D-110 62.2 57.2 56.3 66.2 56.1 56.9 53.0 55.4 59.5 53.5 53.0 64.7 73811 59.6D-110A 60.5 55.9 55.6 65.9 53.7 55.0 51.6 54.5 57.3 54.0 53.1 63.4 51995 60.4D-65 64.4 59.8 59.4 67.5 59.4 59.0 56.0 59.0 63.8 58.8 58.5 68.1 47018 58.6V-LG 47.8 47.3 44.6 52.8 41.4 46.6 41.4 43.9 44.7 45.6 42.5 54.5 51995 61.9V-MG 52.4 50.6 49.5 58.1 48.9 50.0 47.2 50.2 52.8 50.3 49.3 62.4 51731 61.8DV-110 37.0 35.0 33.2 41.0 32.8 34.8 31.0 32.4 35.0 33.7 32.0 46.3 73811 67.5DV-65 35.8 34.8 32.9 39.8 30.9 34.0 30.2 31.3 33.8 33.8 31.5 44.0 51995 67.2
0 200 400 600 800 1000 1200
Flows remaining after ambiguity detection
0.0
0.2
0.4
0.6
0.8
1.0
CD
F
TIMED-110D-65V-LGV-MGDV-110
Fig. 5. CDF plot showing the number of flows remaining per test afterambiguity detection was applied.
worst case, many apps would have all flows considered asambiguous, and thus could not be classified by the systemif ambiguity detection is used. Fig. 5 shows the number offlows per app that were considered to not be ambiguous flows.For clarity, we show results from only the noise-managedexperimental setting in this plot. Other settings gave similarplots. For additional clarity, we omit D-110A and DV-65since they are scaled-down versions of D-110 and DV-110respectively. For all tests except DV-110, all apps had someflows that were unambiguous, i.e., there were some flowsremaining for every app after ambiguity detection.
For test DV-110, there was one app that did not haveunambiguous flows. In order to identify this app, ambiguitydetection would have to be abandoned (at the expense ofsystem accuracy), or the app would have to be re-fingerprintedin an attempt to obtain additional flows that may be unam-biguous. There also remains the possibility that some appssimply cannot be identified by AppScanner because they donot generate unambiguous network flows at all. This is alimitation of app identification using network traffic analysis.
B. Classification Validation
Classification validation is another effective strategy thatcan be leveraged to improve app classification performance.Classifiers can be made to output their confidence whenlabelling and unknown example. In simple terms, a classifiermay be very confident about a classification if the classboundaries within its models are distinct, i.e., with sufficientseparation between classes. In other cases, this distinction maybe less clear.
By assessing the confidence that a classifier reports withits classification, a judgement can be made as to whether the
classification will be considered as valid by the system. We callthe cut-off for what is considered a valid classification the pre-diction probability threshold (PPT). A higher PPT will lead tomore conservative predictions, and thus higher accuracy, at theexpense of the number of flows with classifications consideredas valid. On the other hand, a lower PPT reduces accuracy butmaximises the number of flows with classifications consideredas valid. For a system concerned with accurate identificationof apps, false positives are usually undesirable and thus higherPPTs are likely to be suitable.
Classification validation reduces the number of flows thatare considered as being “correctly” classified, but it is im-portant to note that there is no inherent requirement to labelall unknown flows. Apps typically send tens or hundredsof flows per minute when they are being used, so thereremains significant opportunity to identify apps from theirmore distinctive flows. Thus, classification validation canbe an effective technique for improving app classificationperformance while incurring negligible drawback. In whatfollows, we report on the improvements provided by applyingclassification validation to our previously described reinforcedclassifiers.
Fig. 6 shows the improvement provided by classificationvalidation for the TIME, D-110, D-110A, and D-65 tests.We highlight some results by considering a PPT of 0.9.Fig. 6a shows that the TIME test had a preliminary accuracyof 74.8% which was improved to 96.5% using classificationvalidation. The results for the D-110 and D110-A testsare shown in Fig. 6b and 6c respectively. Overall accuracywas improved from 64.7% to 85.9% for test D-110 andfrom 63.4% to 85.5% for D-110A. The final test in thisgroup, D-65 saw accuracy go from 68.1% to 89.9% whenusing classification validation.
Fig. 7 shows the improvement provided by classificationvalidation for the V-LG, V-MG, DV-110, and DV-65 tests.Once again, we report our results considering a PPT of 0.9.Fig. 7a shows that classification validation improved accuracyfor the V-LG test from 54.5% to 83.9%. Fig. 7b shows theresults for the V-MG test, which is similar to V-LG but witha different device. Classification validation improved accuracyfrom 62.4% to 85.5% in this case.
Fig. 7c and 7d show the results for our most challengingtests: DV-110 and DV-65. Classification validation was ableto increase the accuracy of DV-110 from 46.3% to 76.7%.Likewise, for test DV-65, accuracy was increased from 44.0%

11
0.0 0.2 0.4 0.6 0.8 1.0
Prediction Probability Threshold
0
20
40
60
80
100
Cla
ssifie
r Perf
orm
ance
(%
)
PrecisionRecallAccuracyFlows classified
(a) Performance for the TIME test.
0.0 0.2 0.4 0.6 0.8 1.0
Prediction Probability Threshold
0
20
40
60
80
100
Cla
ssifie
r Perf
orm
ance
(%
)
PrecisionRecallAccuracyFlows classified
(b) Performance for the D-110 test.
0.0 0.2 0.4 0.6 0.8 1.0
Prediction Probability Threshold
0
20
40
60
80
100
Cla
ssifie
r Perf
orm
ance
(%
)
PrecisionRecallAccuracyFlows classified
(c) Performance for the D-110A test.
0.0 0.2 0.4 0.6 0.8 1.0
Prediction Probability Threshold
0
20
40
60
80
100
Cla
ssifie
r Perf
orm
ance
(%
)
PrecisionRecallAccuracyFlows classified
(d) Performance for the D-65 test.
Fig. 6. Performance of the reinforced classifiers on the TIME, D-110, D-110A, and D-65 tests.
to 73.5%. This demonstrates that classification validation canbe a useful tool to improve system performance under difficultconditions.
C. Considerations for Parameter TuningGiven that classification validation disregards some classi-
fier predictions if the classifier is not confident enough, it ispossible that setting the PPT too high will result in the systembeing no longer able to classify flows from a particular app.We measure the effect of classification validation and PPTson the number of apps the system is able to classify. Forbrevity, we show results for our tests with the best and worstbaseline performance, i.e., TIME and DV-110 respectively.Additionally, we show the different PPTs of 0.5, 0.7, and 0.9.These results are summarised in the CDF plots of Fig. 8.
In general, higher thresholds for PPT reduced the numberof flows that remained (and were correctly classified) afterclassification validation. Indeed, setting the PPT too high re-sulted in the system no longer being able to positively identifysome apps. At the extreme end, setting the PPT to 0.9 for theDV-110 test resulted in the system not being confident enoughto classify approximately half of the apps. We remind thereader, however, that DV-110 does not represent a real-worldattack scenario since the test uses outdated app signaturesfor some apps. The test more representative of a real-worldscenario, TIME, failed to identify 6 apps at a PPT of 0.9 andonly 2 apps at a PPT of 0.5. Thus classification validation,while useful, must be tuned only after understanding how thesystem performs for particular apps of interest.
As a further breakdown, Table V in the Appendix outlinesthe number of flows remaining (and correctly classified) ateach stage of classification for the D-110 and DV-110 tests.We show D-110 (instead of TIME as we have done so far)because it has all 110 apps like DV-110 does and gives similarperformance to TIME. From the table, some apps such asair.com.puffballsunited.escapingtheprisonpose a challenge for classification with our system, while oth-ers such as air.uk.co.bbc.android.mediaplayerare easily and accurately identified.
There is a trade-off between the number of apps that thesystem is able to classify and the overall accuracy that thesystem can identify apps with. Experimental settings shouldbe tuned according to the usage scenario of AppScanner. Moreapps can be detected with less accuracy, or less apps can bedetected with higher accuracy. An attacker can also tune hersystem using knowledge of how her apps of interest behavein the AppScanner system.
VIII. DISCUSSION
Smartphone app fingerprinting is challenging because of avariety of variables that are likely to change between finger-print building and final deployment. Such variables includedevice, operating system version, app version, and time. Anymismatch between variables during app fingerprinting and appidentification has the potential to reduce the performance ofour app classification system. To this end, we assessed how theaforementioned variables affected system performance. Apps

12
0.0 0.2 0.4 0.6 0.8 1.0
Prediction Probability Threshold
0
20
40
60
80
100
Cla
ssifie
r Perf
orm
ance
(%
)
PrecisionRecallAccuracyFlows classified
(a) Performance for the V-LG test.
0.0 0.2 0.4 0.6 0.8 1.0
Prediction Probability Threshold
0
20
40
60
80
100
Cla
ssifie
r Perf
orm
ance
(%
)
PrecisionRecallAccuracyFlows classified
(b) Performance for the V-MG test.
0.0 0.2 0.4 0.6 0.8 1.0
Prediction Probability Threshold
0
20
40
60
80
100
Cla
ssifie
r Perf
orm
ance
(%
) PrecisionRecallAccuracyFlows classified
(c) Performance for the DV-110 test.
0.0 0.2 0.4 0.6 0.8 1.0
Prediction Probability Threshold
0
20
40
60
80
100
Cla
ssifie
r Perf
orm
ance
(%
) PrecisionRecallAccuracyFlows classified
(d) Performance for the DV-65 test.
Fig. 7. Performance of the reinforced classifiers on the V-LG, V-MG, DV-110, and DV-65 tests.
0 200 400 600 800
Flows after ambiguity detection and classification validation
0.0
0.2
0.4
0.6
0.8
1.0
CD
F TIME (PPT=0.5)TIME (PPT=0.7)TIME (PPT=0.9)
(a) TIME test.
0 50 100 150 200 250 300 350 400 450
Flows after ambiguity detection and classification validation
0.0
0.2
0.4
0.6
0.8
1.0
CD
F DV-110 (PPT=0.5)DV-110 (PPT=0.7)DV-110 (PPT=0.9)
(b) DV-110 test.
Fig. 8. CDF plots showing the number of flows correctly classified per appafter ambiguity detection and classification validation.
were fingerprinted and later re-identified under a thoroughsuite of experimental settings.
In Table II, we report app classification performance whentraining and testing sets are generated from the same dataset.In the other tests, we used completely independent datasetsfor training and testing. System performance when usingindependent sets was seen to be notably lower than thebaseline experiments. This highlights the need for completely
independent training and testing sets if one wants to get a moreaccurate estimate of the performance of an app fingerprintingsystem.
Training with specific app versions and device with sixmonths between the collection of training and testing datahad the highest baseline accuracy. This suggests that time(at the six month timescale) introduces the least variancein app fingerprints. This insight suggests that although thecontent returned by the app’s servers may have changed, ourmodels are fairly resilient to those changes and still givegood performance. Our analysis on datasets collected usingdifferent devices (and operating system version) gave perfor-mance slightly lower than the previous test. This suggests thatdevice or operating system characteristics of different devicescan introduce some additional noise that affects classificationperformance to a small extent. Such reduction in performanceis expected, since apps are known to change their behaviourdepending on the version of Android operating system thatthey are run on. Additionally, differences in the operatingsystem itself may also contribute additional noise that affectsclassifier performance.
Fingerprinting a set of apps and identifying new versionsof the same apps incurred a further performance penalty.This phenomenon is not unexpected, since apps routinelyreceive changes to their logic during updates [35], which maycause changes in their network traffic flows. However, ourclassification system shows that it is able to cope with suchchanges to an extent. This, however, motivates the need to re-fingerprint apps whenever they are updated, but suggests that

13
old fingerprints may be useful, although presumably less soas apps receive more updates. Changing both device and appversions (and time) provided the greatest performance penaltyfor our classification system. This is an expected penalty sincetime, device, operating system version, and app versions haveall changed between training and testing. Even under thesemost severe of constraints, our classifier was able to achieve abaseline performance 20 times that of pure random guessing.
The majority of the performance hit appears to come fromso-called ambiguous flows. These flows are traffic that issimilar across apps and typically comes from third-partylibraries that are in common among apps. Such ambiguoustraffic frustrates naive machine learning approaches, since theclassifiers are given effectively the same training exampleswith different labels. Using a novel two-stage classificationstrategy with reinforcement learning, we were able to approx-imately double the baseline performance of our classifiers.Using the additional post-processing technique of classifica-tion validation, further accuracy could be extracted from thesystem, but at the expense of the number of flows that theclassifiers were able to give a confident enough prediction.We remind the reader here that in app classification there isno inherent requirement to label all network flows, but ratherto positively identify apps with high accuracy.
A. Comparison with Related Work
AppScanner works in the domain of fingerprinting networktraffic from smartphones and so a direct comparison to websitefingerprinting cannot be made. However, to motivate whydifferent approaches such as AppScanner need to be takenwhen fingerprint app traffic, we show how existing work onwebsite fingerprinting has reduced accuracy when run on apptraffic. For a comprehensive comparison, we used our best andworst performing datasets: TIME and DV-110.
In general, all approaches performed better in the TIMEtest (Fig. 9a) than in the DV-110 test (Fig. 9b). Panchenko etal. [14] performed best with F-measures of 36.9% and 11.4%respectively. AppScanner with no ambiguity detection outper-formed this work with 42.6% and 19.2% respectively. Addingambiguity detection and classification validation further im-proved the performance of AppScanner over related work.
B. Limitations
App identification is frustrated by a number of factors suchas “flow coverage”, changing app behaviour and ambiguousflows. Flow coverage refers to the fraction of the numberflows that are actually triggered during UI fuzzing to thetotal number of flows that can be made by an app. Indeed,UI fuzzing may not elicit all flows from an app. Gettingcomplete code coverage is a challenging task and even humanparticipants were seen to only obtain 60% code coverage [33]in apps through manual interaction.
Apps may also have different behaviour if they are run ata different time. This may be because the apps themselveshave been updated and now have a change in logic or the appsdownload (dynamic) configuration parameters from a server atruntime. Either of these possibilities may cause apps to have
0 10 20 30 40 50 60 70 80
Classifier Average F-measure macro (%)
Liberatore - NB (2006)
Liberatore - Jaccard (2006)
Herrmann - Pure (2009)
Herrmann - Cos (2009)
Herrmann - TF (2009)
Dyer - VNG++ (2012)
Panchenko (2011)
Panchenko (2016)
AppScanner - AD PPT=0.5
AppScanner - AD PPT=0.0
AppScanner - no AD
15.1
4.3
3.8
11.5
2.7
0.9
36.9
3.8
72.1
64.6
42.6
AppScannerWebpage fingerprinting
(a) Performance for the TIME test.
0 10 20 30 40
Classifier Average F-measure macro (%)
Liberatore - NB (2006)
Liberatore - Jaccard (2006)
Herrmann - Pure (2009)
Herrmann - Cos (2009)
Herrmann - TF (2009)
Dyer - VNG++ (2012)
Panchenko (2011)
Panchenko (2016)
AppScanner - AD PPT=0.5
AppScanner - AD PPT=0.0
AppScanner - no AD
2.9
2.1
0.5
1.9
0.3
0.6
11.4
2.2
38.4
32.0
19.3
AppScannerWebpage fingerprinting
(b) Performance for the DV-110 test.
Fig. 9. Comparison with related work for the TIME and DV-110 tests.AD = Ambiguity Detection and PPT = Prediction Probability Threshold.
different behaviour between training and testing. To mitigatethis, repeated and continuous profiling of apps is necessary.Fortunately, profiling can be automated using virtual devicesand UI fuzzing, obviating the need for physical hardware ormanual intervention.
Ambiguous traffic also poses a problem for app identifica-tion. It degrades classifier performance since classifiers maybe trained with conflicting data. Additionally, since there arefinitely many flows that an app can generate, it is conceivablethat more than one app will generate similar flows. Thus, anambiguity detection scheme is critical to identify the non-ambiguous, distinctive flows coming from apps. It may also bethe case that some apps simply do not generate non-ambiguousflows. In this case, other approaches will need to be taken foridentifying those apps as this is a fundamental limitation ofapp classification using network traffic analysis.
C. Countermeasures
Mitigating app identification through traffic analysis is acomplicated task. AppScanner uses coarse side-channel datafrom network traffic flows for feature generation. Thus, feasi-ble countermeasures will likely involve padding network flowssufficiently so that one app is no longer distinguishable fromanother. In theory, this approach can be useful for frustratingapp fingerprinting. In practice however, as argued by Dyer etal. [16], it is unlikely that bandwidth-efficient, general pur-pose mitigation strategies can provide the requisite protection.Moreover, this problem is complicated on smartphones (andother mobile devices) where battery power, bandwidth, anddata usage are bottlenecks. Indeed, these added bottlenecks onsmartphones makes efficient traffic analysis countermeasuresan open research problem.
14
IX. CONCLUSION
In this paper, we extended AppScanner, a robust and scal-able framework for the identification of smartphone apps fromtheir network traffic. We thoroughly evaluated the feasibility offingerprinting smartphone apps along several dimensions. Wecollected several datasets of app-generated traffic at differenttimes (six months apart) using different devices (and Androidoperating systems) and different app versions. We demon-strated that the passage of time is the variable that affects appfingerprinting the least. We also showed that app fingerprintsare not significantly more affected by the device that the app isinstalled on. Our results show that updates to apps will reducethe accuracy of fingerprints. This is unsurprising since new appversions will likely have additional features, which can affectthe fingerprint recognition process. We showed that even ifapp fingerprints are generated on a particular device, they canbe identified six months later on a different device runningdifferent versions of the same apps with a baseline accuracythat is 20 times better than random guessing. Using thetechniques of ambiguity detection and classification validation,we obtained noteworthy increases in system performance. Wewere able to fingerprint and later re-identify apps with up to96% accuracy in the best case, and up to 73% accuracy inthe worst case. These results suggest that app fingerprintingand identification is indeed feasible in the real-world. Appfingerprinting unlocks a variety of new challenges as it relatesto user security and privacy. By continuing research in thisarea, we aim to better understand these challenges, so thatappropriate responses can be engineered to keep users safenow and into the future.
REFERENCES
[1] S. Seneviratne, A. Seneviratne, P. Mohapatra, and A. Mahanti, “Predict-ing user traits from a snapshot of apps installed on a smartphone,” ACMSIGMOBILE Mobile Computing and Communications Review, vol. 18,no. 2, pp. 1–8, 2014.
[2] T. T. Nguyen and G. Armitage, “A survey of techniques for internettraffic classification using machine learning,” Communications Surveys& Tutorials, IEEE, vol. 10, no. 4, pp. 56–76, 2008.
[3] V. F. Taylor, R. Spolaor, M. Conti, and I. Martinovic, “AppScanner:Automatic Fingerprinting of Smartphone Apps from Encrypted NetworkTraffic,” in IEEE European Symposium on Security and Privacy (EuroS&P), 2016, pp. 439–454.
[4] A. Hintz, “Fingerprinting websites using traffic analysis,” in PrivacyEnhancing Technologies. Springer, 2003, pp. 171–178.
[5] H.-S. Ham and M.-J. Choi, “Applicaion-level traffic analysis of smart-phone users using embedded agents,” in 14th Asia-Pacific NetworkOperations and Management Symposium (APNOMS), 2012, pp. 1–4.
[6] J. Yang, S. Zhang, X. Zhang, J. Liu, and G. Cheng, “Analysis ofsmartphone traffic with MapReduce,” in 22nd Wireless and OpticalCommunication Conference (WOCC), 2013, pp. 394–398.
[7] S.-W. Lee, J.-S. Park, H.-S. Lee, and M.-S. Kim, “A study on Smart-phone traffic analysis,” in Network Operations and Management Sym-posium (APNOMS), 2011 13th Asia-Pacific, Sept 2011, pp. 1–7.
[8] S. Feghhi and D. J. Leith, “A Web Traffic Analysis Attack Using OnlyTiming Information,” IEEE Transactions on Information Forensics andSecurity, vol. 11, no. 8, pp. 1747–1759, 2016. [Online]. Available:http://dx.doi.org/10.1109/TIFS.2016.2551203
[9] T. Bujlow, V. Carela-Espaol, and P. Barlet-Ros, “Independentcomparison of popular DPI tools for traffic classification,” ComputerNetworks, vol. 76, pp. 75 – 89, 2015. [Online]. Available:http://www.sciencedirect.com/science/article/pii/S1389128614003909
[10] H. Bacic. (2015, March) Are You Using A Content DeliveryNetwork For Your Website Yet? You Should Be. [Online].Available: http://www.forbes.com/sites/allbusiness/2015/03/16/are-you-using-a-content-delivery-network-for-your-website-yet-you-should-be/
[11] J.-F. Raymond, “Traffic analysis: Protocols, attacks, design issues,and open problems,” in Designing Privacy Enhancing Technologies.Springer, 2001.
[12] M. Liberatore and B. N. Levine, “Inferring the Source of EncryptedHTTP Connections,” in Proceedings of ACM CCS, 2006.
[13] D. Herrmann, R. Wendolsky, and H. Federrath, “Website Fingerprinting:Attacking Popular Privacy Enhancing Technologies with the Multino-mial Naive-bayes Classifier,” in Proceedings of ACM CCSW, 2009.
[14] A. Panchenko, L. Niessen, A. Zinnen, and T. Engel, “Website Fin-gerprinting in Onion Routing Based Anonymization Networks,” inProceedings of ACM WPES, 2011.
[15] X. Cai, X. C. Zhang, B. Joshi, and R. Johnson, “Touching from adistance: Website fingerprinting attacks and defenses,” in Proceedings ofthe ACM conference on Computer and Communications Security. ACM,2012, pp. 605–616.
[16] K. P. Dyer, S. E. Coull, T. Ristenpart, and T. Shrimpton, “Peek-a-Boo,I Still See You: Why Efficient Traffic Analysis Countermeasures Fail,”in IEEE Symposium on Security and Privacy, May 2012, pp. 332–346.
[17] A. Panchenko, F. Lanze, J. Pennekamp, T. Engel, A. Zinnen, M. Henze,and K. Wehrle, “Website Fingerprinting at Internet Scale,” in NDSS,2016.
[18] J. Muehlstein, Y. Zion, M. Bahumi, I. Kirshenboim, R. Dubin, A. Dvir,and O. Pele, “Analyzing HTTPS Encrypted Traffic to Identify UserOperating System, Browser and Application,” arXiv.org, 2016.
[19] B. Miller, L. Huang, A. D. Joseph, and J. D. Tygar, I Know Why YouWent to the Clinic: Risks and Realization of HTTPS Traffic Analysis.Cham: Springer International Publishing, 2014, pp. 143–163. [Online].Available: http://dx.doi.org/10.1007/978-3-319-08506-7 8
[20] S. Dai, A. Tongaonkar, X. Wang, A. Nucci, and D. Song,“NetworkProfiler: Towards automatic fingerprinting of Androidapps,” 2013 Proceedings IEEE INFOCOM, pp. 809–817, Apr.2013. [Online]. Available: http://ieeexplore.ieee.org/lpdocs/epic03/wrapper.htm?arnumber=6566868
[21] Z. A. Qazi, J. Lee, T. Jin, G. Bellala, M. Arndt, and G. Noubir,“Application-awareness in SDN,” in Proceedings of ACM SIGCOMM,ser. SIGCOMM ’13. New York, NY, USA: ACM, 2013, pp. 487–488.[Online]. Available: http://doi.acm.org/10.1145/2486001.2491700
[22] A. Le, J. Varmarken, S. Langhoff, A. Shuba, M. Gjoka, andA. Markopoulou, “AntMonitor: A System for Monitoring from MobileDevices,” in Proceedings of the 2015 ACM SIGCOMM Workshopon Crowdsourcing and Crowdsharing of Big (Internet) Data, ser.C2B(1)D ’15. New York, NY, USA: ACM, 2015, pp. 15–20. [Online].Available: http://doi.acm.org/10.1145/2787394.2787396
[23] T. Stober, M. Frank, J. Schmitt, and I. Martinovic, “Who do you syncyou are?” in Proceedings of the sixth ACM conference on Security andprivacy in wireless and mobile networks - WiSec ’13. New York,New York, USA: ACM Press, Apr. 2013, p. 7. [Online]. Available:http://dl.acm.org/citation.cfm?id=2462096.2462099
[24] S. Mongkolluksamee, V. Visoottiviseth, and K. Fukuda, “CombiningCommunication Patterns &Traffic Patterns to Enhance Mobile TrafficIdentification Performance,” Journal of Information Processing, vol. 24,no. 2, pp. 247–254, 2016.
[25] ——, “Enhancing the Performance of Mobile Traffic Identificationwith Communication Patterns,” in 39th Annual Computer Software andApplications Conference, vol. 2, 2015, pp. 336–345.
[26] H. F. Alan and J. Kaur, “Can Android Applications Be IdentifiedUsing Only TCP/IP Headers of Their Launch Time Traffic?”in Proceedings of the 9th ACM Conference on Security &Privacy in Wireless and Mobile Networks, ser. WiSec ’16. NewYork, NY, USA: ACM, 2016, pp. 61–66. [Online]. Available:http://doi.acm.org/10.1145/2939918.2939929
[27] Q. Wang, A. Yahyavi, M. Kemme, and W. He, “I Know What YouDid On Your Smartphone: Inferring App Usage Over Encrypted DataTraffic,” in 2015 IEEE Conference on Communications and NetworkSecurity (CNS). IEEE, 2015.
[28] M. Conti, L. V. Mancini, R. Spolaor, and N. V. Verde, “AnalyzingAndroid Encrypted Network Traffic to Identify User Actions,” IEEETransactions on Information Forensics and Security, vol. 11, no. 1, pp.114–125, 2016.
[29] B. Saltaformaggio, H. Choi, K. Johnson, Y. Kwon, Q. Zhang,X. Zhang, D. Xu, and J. Qian, “Eavesdropping on Fine-Grained User Activities Within Smartphone Apps Over EncryptedNetwork Traffic,” in 10th USENIX Workshop on OffensiveTechnologies (WOOT 16). Austin, TX: USENIX Association, Aug.2016. [Online]. Available: https://www.usenix.org/conference/woot16/workshop-program/presentation/saltaformaggio

15
[30] Pragmatic Software, “Network Log,” April 2014.[Online]. Available: https://play.google.com/store/apps/details?id=com.googlecode.networklog
[31] H. Falaki, D. Lymberopoulos, R. Mahajan, S. Kandula, and D. Estrin,“A first look at traffic on smartphones,” in Proceedings of the 10thACM SIGCOMM conference on Internet measurement. ACM, 2010,pp. 281–287.
[32] W. McKinney, “Data Structures for Statistical Computing in Python,” inProceedings of the 9th Python in Science Conference, S. van der Waltand J. Millman, Eds., 2010, pp. 51 – 56.
[33] A. MacHiry, R. Tahiliani, and M. Naik, “Dynodroid: An input generationsystem for android apps,” in Proceedings of the 2013 9th Joint Meetingon Foundations of Software Engineering. ACM, 2013, pp. 224–234.
[34] L. Buitinck, G. Louppe, M. Blondel, F. Pedregosa, A. Mueller, O. Grisel,V. Niculae, P. Prettenhofer, A. Gramfort, J. Grobler, R. Layton, J. Van-derPlas, A. Joly, B. Holt, and G. Varoquaux, “API design for machinelearning software: experiences from the scikit-learn project,” in ECMLPKDD Workshop: Languages for Data Mining and Machine Learning,2013, pp. 108–122.
[35] V. F. Taylor and I. Martinovic, “To Update or Not to Update:Insights From a Two-Year Study of Android App Evolution,” inProceedings of the 2017 ACM Asia Conference on Computer andCommunications Security. ACM, 2017, pp. 45–57. [Online]. Available:http://doi.acm.org/10.1145/3052973.3052990
Vincent F. Taylor is a D.Phil. (Ph.D.) student in theDepartment of Computer Science, University of Ox-ford, United Kingdom. He is under the supervisionof Prof. Ivan Martinovic. Vincent’s main researchinterest is in improving the security and privacyimpact of smartphone apps. To this end, he hasdone several large-scale studies of app markets andsmartphone app traffic to transparently identify appswith security/privacy risks and suggest alternativesto make end-users safer. He has been a VisitingPh.D. Student at the University of Padua (2015) and
University of Cambridge (2016, 2017). Vincent is a Rhodes Scholar (Jamaicaand Magdalen, 2013) and holds Cisco CCENT/CCNA/CCNP certifications inRouting and Switching.
Riccardo Spolaor is a Ph.D. student in Brain, Mind,and Computer Science at the University of Padua,Italy. He obtained his Master’s Degree in ComputerScience in 2014 from the same university, with athesis about a smartphone privacy attack inferringuser actions via traffic analysis. In November 2014,he started his Ph.D. under the supervision of Prof.Mauro Conti. He has been Visiting Ph.D. Stu-dent at Radboud University (2015), Ruhr-UniversitatBochum (2016), and University of Oxford (2016,2017). His main research interests are privacy and
security issues on mobile devices. In particular, he applies machine learningtechniques to infer user information relying on side-channel analysis. Most ofthe research that he carried out up to now is about the application of machinelearning classifiers to network traffic and energy consumption traces.
Mauro Conti is an Associate Professor at theUniversity of Padua, Italy. He obtained his Ph.D.from Sapienza University of Rome, Italy, in 2009.After his Ph.D., he was a Post-Doc Researcher atVrije Universiteit Amsterdam, The Netherlands. In2011 he joined as Assistant Professor the Universityof Padua, where he became Associate Professor in2015. In 2017, he obtained the national habilitationas Full Professor for Computer Science and Com-puter Engineering. He has been Visiting Researcherat GMU (2008, 2016), UCLA (2010), UCI (2012,
2013, 2014, 2017), TU Darmstadt (2013), UF (2015), and FIU (2015, 2016).He has been awarded with a Marie Curie Fellowship (2012) by the EuropeanCommission, and with a Fellowship by the German DAAD (2013). His mainresearch interest is in the area of security and privacy. In this area, he publishedmore than 200 papers in topmost international peer-reviewed journals andconferences. He is Associate Editor for several journals, including IEEECommunications Surveys & Tutorials and IEEE Transactions on InformationForensics and Security. He was Program Chair for TRUST 2015, ICISS 2016,WiSec 2017, and General Chair for SecureComm 2012 and ACM SACMAT2013. He is a Senior Member of the IEEE.
Ivan Martinovic is an Associate Professor at theDepartment of Computer Science, University of Ox-ford. Before coming to Oxford he was a postdoctoralresearcher at the Security Research Lab, UC Berke-ley and at the Secure Computing and NetworkingCentre, UC Irvine. From 2009 until 2011 he enjoyeda Carl-Zeiss Foundation Fellowship and he was anassociate lecturer at TU Kaiserslautern, Germany. Heobtained his PhD from TU Kaiserslautern under su-pervision of Prof. Jens B. Schmitt and MSc from TUDarmstadt, Germany. Most of his research interests
are in the area of cyber-physical system security and network security. Someof his concrete research topics include authentication and intrusion detectionusing physical-layer information, traffic analysis, and the analysis of trade-offsbetween system/network security and performance. In this respect, Ivan workswith various technologies, such as software-defined radios, wireless sensors,and NFC/RFIDs. As another incarnation of cyber-physical security, he is alsointerested in behavioural biometrics and their applications, such as continuousauthentication using physiological signals captured by, e.g., eye-tracking andEEG devices. Previously, Ivan also worked on other non-functional aspectsof distributed systems like network performance (network calculus), resourcemanagement, and decentralized coordination in wireless networks.

16
APPENDIX
TABLE VTABLE GIVING DETAILS OF THE NUMBER OF FLOWS AT VARIOUS POINTS DURING APP CLASSIFICATION FOR THE D-110 AND DV-110 TESTS. FT =
NUMBER OF FLOWS IN THE TESTING SET FOR EACH APP, FA = NUMBER OF FLOWS AFTER AMBIGUITY DETECTION, F5 = NUMBER OF FLOWS CORRECTLYCLASSIFIED AT A PPT OF 0.5. FOR BREVITY, WE SHOW A PPT OF 0.5 SINCE IT IS AT THE HALFWAY POINT OF THE RANGE OF PPTS.
App package name D-110 DV-110 App package name D-110 DV-110FT FA F5 FT FA F5 FT FA F5 FT FA F5
air.com.puffballsunited.escapingtheprison 6 1 0 6 0 0 com.king.alphabettysaga 370 155 109 370 132 48air.ITVMobilePlayer 999 555 410 999 522 201 com.king.candycrushsaga 342 212 173 342 68 25air.uk.co.bbc.android.mediaplayer 140 140 140 140 140 140 com.king.candycrushsodasaga 576 502 366 576 345 290bbc.iplayer.android 695 135 17 695 329 35 com.king.farmheroessaga 101 17 0 101 34 0bbc.mobile.weather 572 219 109 572 512 0 com.lazyswipe 158 47 9 158 14 1com.adobe.air 207 95 57 207 80 45 com.leftover.CoinDozer 1809 447 118 1809 349 3com.airbnb.android 323 93 41 323 95 0 com.machinezone.gow 429 195 109 429 176 29com.amazon.kindle 790 335 142 790 373 198 com.meetup 376 82 0 376 92 6com.amazon.mShop.android.shopping 767 366 274 767 347 104 com.microsoft.office.outlook 526 234 86 526 121 26com.avast.android.mobilesecurity 387 41 0 387 111 0 com.miniclip.agar.io 1299 791 635 1299 723 372com.badoo.mobile 380 114 71 380 121 22 com.miniclip.eightballpool 407 165 47 407 131 28com.bigkraken.thelastwar 176 108 16 176 33 0 com.mixradio.droid 183 76 36 183 1 0com.BitofGame.MiniGolfRetro 119 111 111 119 114 111 com.mobilemotion.dubsmash 436 266 184 436 137 5com.booking 308 85 1 308 93 46 com.mobilityware.solitaire 534 231 11 534 100 2com.boombit.RunningCircles 995 472 59 995 241 66 com.myfitnesspal.android 1204 302 167 1204 222 25com.boombit.Spider 861 207 116 861 219 0 com.netflix.mediaclient 321 193 172 321 130 16com.bskyb.skygo 575 156 81 575 158 15 com.nordcurrent.canteenhd 680 304 175 680 329 47com.chatous.pointblank 82 23 4 82 21 0 com.northpark.drinkwater 948 323 224 948 402 223com.ciegames.RacingRivals 726 324 233 726 171 22 com.outfit7.mytalkingtomfree 1272 339 133 1272 453 251com.cleanmaster.mguard 878 233 102 878 251 24 com.outplayentertainment.bubbleblaze 1405 1147 920 1405 661 330com.cnn.mobile.android.phone 1277 508 251 1277 402 186 com.pinterest 2076 403 136 2076 265 7com.contextlogic.wish 251 66 42 251 65 30 com.playfirst.cookingdashx 503 356 216 503 282 153com.dictionary 1393 382 225 1393 237 6 com.prettysimple.criminalcaseandroid 297 194 70 297 112 52com.digidust.elokence.akinator.freemium 996 223 60 996 197 0 com.qihoo.security 783 162 38 783 131 0com.dropbox.android 261 80 51 261 54 18 com.robtopx.geometryjumplite 361 57 31 361 75 21com.ebay.mobile 643 131 50 643 187 45 com.rovio.angrybirds 283 105 34 283 140 111com.facebook.katana 357 125 35 357 106 37 com.runtastic.android 866 172 39 866 136 15com.facebook.orca 192 70 25 192 43 0 com.shazam.android 1169 288 93 1169 260 54com.fivestargames.slots 269 118 94 269 83 0 com.shpock.android 552 114 47 552 61 5com.fungames.flightpilot 737 401 346 737 352 127 com.skype.raider 740 423 353 740 222 157com.gameloft.android.ANMP.GloftDMHM 366 115 57 366 99 63 com.snapchat.android 271 36 26 271 128 65com.google.android.apps.inbox 356 46 9 356 39 0 com.soundcloud.android 439 100 27 439 80 7com.google.android.apps.maps 403 53 13 403 51 4 com.spotify.music 632 255 181 632 177 77com.google.android.apps.photos 146 78 64 146 32 0 com.supercell.boombeach 372 229 91 372 43 1com.google.android.apps.plus 184 12 1 184 10 0 com.supercell.clashofclans 265 203 124 265 44 21com.google.android.gm 172 25 2 172 13 0 com.surpax.ledflashlight.panel 527 92 29 527 89 9com.google.android.youtube 450 54 0 450 82 17 com.tayu.tau.pedometer 578 364 0 578 44 0com.google.earth 394 139 104 394 158 101 com.thetrainline 430 185 113 430 87 20com.groupon 530 180 57 530 76 0 com.tinder 10 1 0 10 3 0com.gumtree.android 535 159 91 535 122 37 com.tripadvisor.tripadvisor 16 4 0 16 3 0com.halfbrick.fruitninjafree 553 162 75 553 100 1 com.twitter.android 206 23 0 206 32 8com.hcg.cok.gp 796 360 180 796 275 123 com.umonistudio.tile 738 513 462 738 422 137com.iconology.comics 274 29 0 274 57 0 com.viber.voip 202 98 62 202 70 19com.igg.android.finalfable 558 351 233 558 243 183 com.whatsapp 98 61 25 98 25 0com.imangi.templerun2 211 53 7 211 45 18 com.yahoo.mobile.client.android.mail 521 116 83 521 83 20com.imdb.mobile 418 280 227 418 244 162 com.yodo1.crossyroad 1008 519 232 1008 370 58com.imo.android.imoim 169 36 10 169 46 12 com.zentertain.photoeditor 532 182 21 532 103 0com.instagram.android 391 161 116 391 111 57 hu.tonuzaba.android 393 180 68 393 86 66com.instagram.layout 40 36 0 40 1 0 info.androidz.horoscope 374 115 15 374 81 14com.itv.loveislandapp 692 338 286 692 227 76 kik.android 290 35 5 290 66 0com.jellybtn.cashkingmobile 1019 479 306 1019 316 170 me.pou.app 214 67 29 214 34 7com.joelapenna.foursquared 858 232 73 858 174 3 net.zedge.android 1159 210 61 1159 210 18com.joycity.warshipbattle 638 333 88 638 333 202 tv.twitch.android.app 1109 610 471 1109 534 259com.justeat.app.uk 385 135 27 385 83 0 uk.co.dominos.android 512 184 95 512 161 105com.kiloo.subwaysurf 884 217 111 884 241 44 uk.co.nationalrail.google 643 172 79 643 142 73