Robinson Sophie 6PS014 Dissertation(Single)
68
Sophie Laura Robinson 0908128 - 1 - Do Personality and Attribution Style affect Belief in Good Luck? Student Name: Sophie Robinson Student Number: 0908128 Project Supervisor: Dr. Niall Galbraith Degree: BSc Single Honours Psychology Date: April 2012 Word Count: 9,216
-
Upload
independent -
Category
Documents
-
view
0 -
download
0
Transcript of Robinson Sophie 6PS014 Dissertation(Single)

Sophie Laura Robinson 0908128 - 1 -
Do Personality and Attribution Style affect Belief in
Good Luck?
Student Name: Sophie Robinson
Student Number: 0908128
Project Supervisor: Dr. Niall Galbraith
Degree: BSc Single Honours Psychology
Date: April 2012
Word Count: 9,216

Sophie Laura Robinson 0908128 - 2 -
TABLE OF CONTENTS
Project title and Abstract Page 1 - 4
Introduction Page 5 - 18
Method
Design Page 19
Participants Page 19-20
Materials Page 20-22
Procedure Page 22-23
Results Page 24-26
Discussion Page 27-38
References Page 39-43
Appendices:
Appendix 1
Information sheet Page 44
Informed consent sheet Page 45
Copies of questionnaires Page 46-50
Debriefing sheet Page 51-52
RES20A form Page 53-55
Project management forms Page 56-58
Appendix 2
SPSS Output Page 59

Sophie Laura Robinson 0908128 - 3 -
ABSTRACT
The current study is investigating various individual difference factors that may predict
someone’s belief in good luck. More specifically, the relationships between the Five
Factor personality traits, attribution style, and belief in good luck will be measured;
with hope that if any trends emerge, these can be applied to adaptive treatments and
coping strategies for certain people who show particular traits. The research will also
be exploring the self-efficacy bias as one positive benefit for activating good luck to
improve performance. Existing research showing positive benefits of the use of good
luck is dominated by sport, business and gambling psychology areas with few studies
into positive uses in the general populations. Similar research can be found from
Damisch et al., (2010) who was also interested in the effect positive superstition could
have upon performance in various cognitive tasks. They found that various different
activations of superstition served to enhance performance in subsequent tasks. This
study was conducted with 103 participants from the University of Wolverhampton and
adult residents in the area who completed three questionnaires and a throwing task
which used a between groups design. Contrary to hypothesis a significant model
emerged using a backwards multiple regression analysis, which indicated 4.7% of the
variance in good luck belief, could be accounted for by low imagination. No further
significant effects were found yet some trends within data are consistent with previous
research and hypotheses. Limitations of this research and its implications are discussed
for theory, application, and future research.

Sophie Laura Robinson 0908128 - 4 -
Declaration
I hereby declare that the work submitted in this dissertation is the result of my own
investigation, except where otherwise stated.
Acknowledgements
I am grateful to my supervisor Dr. Niall Galbraith for his help and support during this
project. I would also like to express my sincere thanks to the technicians for their role
in this study. To all others who gave encouragement, thank you very much.

Sophie Laura Robinson 0908128 - 5 -
INTRODUCTION
Superstition
As the participants in this research are from the UK, superstition will be defined from
the Oxford Dictionaries (2011) ‘a widely held but irrational belief in supernatural
influence, especially as leading to good or bad luck, or a practice based on such a
belief.’ As can be seen by this definition and that of an American dictionary as
reported in Kramer & Block (2008), the consensus is that superstitions relate to luck as
the primary phenomenon of the ‘supernatural’. However, it can also be seen that
superstitions are defined as irrational despite evidence that some of the most successful
people in society believe in such superstitions (see Jahoda, 1969, for reviews).
Superstitions can be divided into cultural (lucky number 7 in the West) or personal
(adding lucky charms to a bracelet) or even rituals (a footballer touching the grass with
his left hand as he runs on the pitch), and all revolve around the basic idea of either
attracting good luck or warding away bad luck (Block & Kramer, 2009).
Superstitions have been created all over the world, yet these beliefs typically are
culturally anchored, and differ according to countries (Vyse, 1997). To illustrate, in
China and Taiwan the number four is considered unlucky (Lip, 1992), whereas in the
USA and UK the number thirteen is said to be generally an unlucky number.
Superstitions are learnt in the same way as stereotypes – through cultural socialisation
– and are similarly activated by environmental cues (Devine, 1989).
Tracing the origin of specific superstitions is difficult in some cases; however we now
know that certain observable phenomena became superstition because our ancestors
did not know the true cause and meaning of certain events (Benitez, 2000). Take for
example crows being an omen of death, yet science now shows crows were often
found on roofs of deceased peoples’ houses because they can smell decaying flesh, or
walking under a ladder bringing bad luck, as something could fall on you that was
balanced on a rung or you might knock the ladder over (Delacroix & Guillard, 2008).
Skinner (1948) demonstrated that idiosyncratic superstitions can be learnt through
conditioning with his intriguing pigeon experiment. Pigeons were presented at random
with food (reward), yet Skinner observed that whatever the pigeon was doing when
food was given (stimulus), it would keep repeating. The pigeons could have been
doing anything – standing on their left leg, tilting their head to the right, walking
backwards – whatever it was the pigeon repeated the action in hope of more food.
Although based upon observations from animals, similar behaviours have been
illustrated with humans too (discussed below), lending support for this explanation of
origin. Skinners’ findings led other researchers to suppose that humans can develop
personal superstitions in the same way through operant conditioning – that some
behaviour becomes related to the outcome of an event, which in reality is not a causal
link to the outcome. However, to the person displaying the behaviour, both cause and
effect are very real and related, which encompasses the definition of an irrational belief
in superstitions (Rotter, 1966; Darke & Freedman, 1997).
Belief in luck – good or bad – is widespread in Western and in Eastern cultures.
Perhaps two of the most prominent examples of this when Palazzolo (2005) reported

Sophie Laura Robinson 0908128 - 6 -
that the United States of America looses between $800 and $900 million in business
each Friday the thirteenth; and in China people are willing to pay and bid up to seven
times the country’s average annual income for a licence plate considered lucky:
APY888 (Yardley, 2006). Both examples highlight the extreme effects belief in luck
can have upon otherwise rational people and the lengths they are willing to go to in
order to either avoid bad luck or attract good luck (Malinowski, 1954; Darke &
Freedman, 1997). Literature in the area of luck upon marketing and business has
boomed in the past decade because of the economic implications of the research. Many
more interesting examples of the influence of believing in luck can be found in Tsang
(2004), Gunn (1997), and Simmons & Schindler (2003).
A philosophical theory as to why people believe in luck is the just-world hypothesis
(Lerner, 1965) which speculates that humans have a need to believe the world is fair
and just, meaning that people get what they deserve. This logic allows individuals to
act as though chance is a fallacy and all behaviour is direct causes and effects, in other
words, people deserve the luck they have. Lerner & Simmons’ (1966) early experiment
supports the notion that people behave consistently to this belief, though their
participants were only female. Since then however, research has begun to show that
certain types of people are more likely to hold this belief than others, such as those
who are more authoritarian and have an internal locus of control (see Rubin & Peplau,
1975 for reviews). This belief has also been demonstrated across cultures with few sex
differences (Furnham, 1993).
Illusory Control
Research is in agreement that generally the conditions under which people endorse
superstition are during times of uncertainty, and/or when experiencing psychological
stress (Keinan, 2002; Padgett & Jorgenson, 1982). Malinowski (1954) posited that
superstitions are used to counter the psychological anxiety caused by uncertainty. The
vast existing amount of cognitive research on luck has shown that belief in good luck
serves as a positive adaptation, for example, allowing the individual to feel that they
have a sense of control and are not merely passive in an otherwise ambiguous or
chance situation (e.g. Langer, 1975, 1977; Schippers & Van Lange, 2006; Damisch,
Stoberock & Mussweiler, 2010; Xu, Zwick & Schwartz, 2011). Langer & Roth
(1975), note that this effect, known as locus of control, is markedly true in situations
where chance can combine with skill; which can be seen of course in the sporting
world.
It has also already been established by Keinan (1994, 2002), and others, that people
turn to superstitions when they experience low levels of perceived control, perhaps
because reliance on superstition allows them to reassert their influence over the
outcome of an event (Whitson & Galinsky, 2008). Case, Fitness, Cairns & Stevenson
(2004) demonstrated that as an individual’s perceived likelihood of their failure
increased, so did their use of superstitious behaviours.
Consistent with the generally accepted finding, that low perceived control leads to
more superstitious behaviour, is work by Schippers & Van Lange (2006), who also
found the control effect to be true of top sportspersons. Whereby, if the competitor
they were against is as strong as they are (as likely to win) or stronger (more likely to
win) their superstitious behaviour would increase and also become more important to
the sportsperson. Schippers & Van Lange (2006) extended their research further by

Sophie Laura Robinson 0908128 - 7 -
investigating whether the superstitions observed by the sportspersons provided more
benefits than just allowing for a greater sense of control. Their research confirmed this
idea by illustrating that the superstitions served to minimise anxiety and promote the
focus necessary to perform well in competitive sports, in other words, the superstition
encouraged psychological well-being.
Their research was limited to team sportspersons which confines their findings to this
population, however as the types of superstitions reported by their participants did not
involve other teammates, it can be reasonably inferred that superstitions in
performance settings are largely individualised and idiosyncratic (Gmelch, 1971;
Albas & Albas, 1989; Rudski & Edwards, 2007; Delacroix & Guillard, 2008). In other
words, superstitions are likely to be personal whether performing in a team or as an
individual, as within football or snooker. These findings are in line with and support
the early theories of superstition development (Skinner, 1948, 1953; Malinowski,
1954) and also demonstrate the scope of superstitions people can hold.
Because of the obvious advantages to the use of good luck for people in competitive
spheres, the notion of luck on performance has been especially researched in the field
of sport and consequently has been a primary area of application for superstition
research. This is not surprising given that the reasons for which people are most likely
to engage in superstitions are found in such performance-related areas – sport and
business (Sarason, 1984). Moreover, the success of the influence of belief in good luck
on performance situations to date, demonstrates why students are a worthy population
of study, as they regularly encounter performance situations such as exams (Womack,
1992).

Sophie Laura Robinson 0908128 - 8 -
Darke & Freedman (1997) have shown that associating luck to one performance can
create expectations about luck that broaden from this isolated incident to subsequent
events that are unconnected. This finding is consistent with the notions that
superstitious behaviours are related in one’s mind to positive outcomes (Skinner, 1948;
1953), or at least to neutral ones if warding off bad luck, and hence people expect to
perform well again if the superstition is observed next time. Reinforcement and
associations explain this type of behaviour which allows people to continue to adhere
to such beliefs as luck because they can assign a cause to an event. This permits
organisation of the world into seemingly meaningful orders, which then allows for
predictions to be made based upon these orders (Lindeman & Aarino, 2007).
Dark & Freedman (1997) discovered an important finding when developing their
Belief in Good Luck questionnaire, which is consistent with the notion that people use
phenomenon such as luck to organise what is more rationally random chance
outcomes. They found that those people who had low belief scores did not all
necessarily disbelieve in good luck but rather, they thought that luck had a balance
where if they had been lucky one time, they would be unlucky the next. On the other
hand, those who scored highly tended to believe they could influence luck to be
positive more often than not. The former was governed the rational view of luck as
random, external and unreliable, and the latter was termed the irrational view as
influential, personal and stable.
Increased Self-Efficacy
Theoretically, good luck belief works to increase perceived locus of control by
boosting self-efficacy (Bandura, 1977). Research has demonstrated that carrying a
lucky charm or observing positive superstitions, serves to increase optimistic traits and
to reduce irrational beliefs of individuals who are depressed or anxious (Day &
Maltby, 2003; 2005; Damisch et al., 2010). Belief in good luck is thus related to, yet
distinct from, concepts that are allied with self-efficacy – hope and confidence (Darke
& Freedman, 1997).
Such findings are relevant to the proposed research as we are interested in establishing
whether those participants who believe most in good luck will perform better in the
experimental task. The experimental task element to this research aims to establish
whether those who show a stronger belief in good luck are more influenced by the
experimenter describing a ball as “lucky”, and hence perform better in a throwing
exercise. Research suggests that activating the good luck superstition often leads to
improved performance because this serves to boost self-efficacy (e.g. Damisch et al.,
2010), and sport psychology studies have demonstrated such research findings in real
life settings (Buhrmann & Zaugg, 1981).
It has been suggested from observations of different cultures, as with the Hua people
of New Guinea (Meigs, 1984), that there is a common belief that everything is
interconnected in the cosmos and one can influence seemingly unrelated things within
the universe to cause change in the future (Werner, 1948). This belief is the core
principal behind why and how lucky charms and luck-rituals are thought to work, by
influencing the cosmos to attract good luck to the beholder of the charm of ritual.
Sophie Laura Robinson 0908128 - 9 -
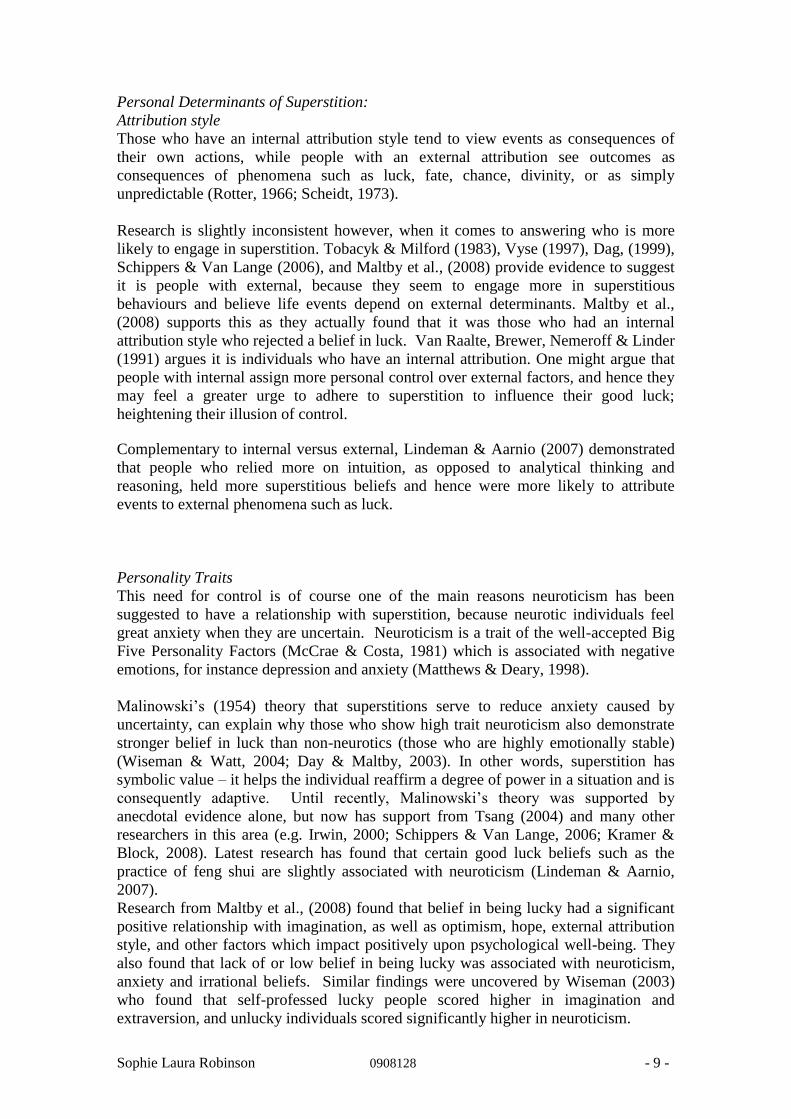
Personal Determinants of Superstition:
Attribution style
Those who have an internal attribution style tend to view events as consequences of
their own actions, while people with an external attribution see outcomes as
consequences of phenomena such as luck, fate, chance, divinity, or as simply
unpredictable (Rotter, 1966; Scheidt, 1973).
Research is slightly inconsistent however, when it comes to answering who is more
likely to engage in superstition. Tobacyk & Milford (1983), Vyse (1997), Dag, (1999),
Schippers & Van Lange (2006), and Maltby et al., (2008) provide evidence to suggest
it is people with external, because they seem to engage more in superstitious
behaviours and believe life events depend on external determinants. Maltby et al.,
(2008) supports this as they actually found that it was those who had an internal
attribution style who rejected a belief in luck. Van Raalte, Brewer, Nemeroff & Linder
(1991) argues it is individuals who have an internal attribution. One might argue that
people with internal assign more personal control over external factors, and hence they
may feel a greater urge to adhere to superstition to influence their good luck;
heightening their illusion of control.
Complementary to internal versus external, Lindeman & Aarnio (2007) demonstrated
that people who relied more on intuition, as opposed to analytical thinking and
reasoning, held more superstitious beliefs and hence were more likely to attribute
events to external phenomena such as luck.
Personality Traits
This need for control is of course one of the main reasons neuroticism has been
suggested to have a relationship with superstition, because neurotic individuals feel
great anxiety when they are uncertain. Neuroticism is a trait of the well-accepted Big
Five Personality Factors (McCrae & Costa, 1981) which is associated with negative
emotions, for instance depression and anxiety (Matthews & Deary, 1998).
Malinowski’s (1954) theory that superstitions serve to reduce anxiety caused by
uncertainty, can explain why those who show high trait neuroticism also demonstrate
stronger belief in luck than non-neurotics (those who are highly emotionally stable)
(Wiseman & Watt, 2004; Day & Maltby, 2003). In other words, superstition has
symbolic value – it helps the individual reaffirm a degree of power in a situation and is
consequently adaptive. Until recently, Malinowski’s theory was supported by
anecdotal evidence alone, but now has support from Tsang (2004) and many other
researchers in this area (e.g. Irwin, 2000; Schippers & Van Lange, 2006; Kramer &
Block, 2008). Latest research has found that certain good luck beliefs such as the
practice of feng shui are slightly associated with neuroticism (Lindeman & Aarnio,
2007).
Research from Maltby et al., (2008) found that belief in being lucky had a significant
positive relationship with imagination, as well as optimism, hope, external attribution
style, and other factors which impact positively upon psychological well-being. They
also found that lack of or low belief in being lucky was associated with neuroticism,
anxiety and irrational beliefs. Similar findings were uncovered by Wiseman (2003)
who found that self-professed lucky people scored higher in imagination and
extraversion, and unlucky individuals scored significantly higher in neuroticism.
Sophie Laura Robinson 0908128 - 10 -
Interestingly, Mowen & Carlson (2003) and others (Darke & Freedman, 1997; Chotai
& Wiseman, 2005) found that the demographics of age and education level, which
might be presumed to have a correlation with general superstitious belief, did not.
Accordingly, age is not a demographic the current research is going to request from
participants.
Psychological Benefits of Belief in Good Luck & Research Hypotheses
The positive inferences of good luck belief and finding out if there are particular
personality types of whom this may be of particular benefit to, is why this research is
focusing on good luck. Bad luck belief has been demonstrated to hinder psychological
well-being (i.e. Tobacyk & Shrader, 1991; Wolfradt, 1997, Maltby et al., 2008). Yet
good luck superstitions are not only adaptive (Wiseman, 2003; Chotai & Wiseman,
2005) but have also been shown to be much more prevalent than negative ones, despite
the bias in previous literature towards bad luck superstition (Albas & Albas, 1989;
Wiseman & Watt, 2004). Therefore, this is where the present researches focus rests.
The majority of the studies mentioned above with the exception of a few more recent
studies (e.g. Wiseman & Watt, 2004; Maltby et al., 2008), have used the Paranormal
Belief Scale (Tobacyk & Milford, 1983). The relevant sub-measure to this
questionnaire only measures negative superstition. In their studies, Wiseman & Watt
(2004) demonstrated how there is need to measure both positive and negative
superstition before insinuating that someone is superstitious per se. It is not logically
accurate to suggest someone is superstitious by observing their behaviour towards bad
luck alone and it has also been shown that believing one is lucky or unlucky are two
different constructs that attract different personalities (Wiseman, 2003; Maltby et al.,
2008). Thus, the current research is interested in only positive superstitions as an
extension to Wiseman & Watt’s (2004) observations of the bias in past literature in this
domain.
Further to this decision is the reasoning that the present research is influenced by the
Positive Psychology (Seligman & Csikszentmihalyi, 2000) movement. In line with this
and other research aforementioned, if the individual uses superstition to enhance
psychological well-being a positive use of superstition is assumed because of its ability
to regulate psychological tension, and therefore, must be granted more credit for
rationality (e.g. Miller & Taylor, 1995; Keinan, 2002; Chotai & Wiseman, 2005;
Schippers & Van Lange, 2006). However, the current study will not be using Wiseman
& Watt’s (2004) scale as it restrictively measures popular superstitious sayings alone
which are not representative of the range of idiosyncratic superstitions available as
evidenced above (Delacroix & Guillard, 2008). Darke & Freedman’s (1997) Belief in
Good Luck scale will be used for these reasons instead because it accounts for the need
to accommodate the personalisation aspect of good luck belief.
The present study was limited to defining superstition as “beliefs and/or practices that
have no religious nor scientific foundations and which lead people to think that certain
facts (external events or one’s own actions), or objects can bring good or bad luck, or
be signs announcing positive or negative consequences” (Delacroix & Guillard, 2008,
p. 1). Consistent with Delacroix & Guillard (2008) who sought to better define the
superstition construct, the present author also acknowledges that religion, astrology
and para-normality (supernatural beings, extra-terrestrials and spiritualism) are

Sophie Laura Robinson 0908128 - 11 -
separate to superstition because they have nothing to with luck, as are chance
(Wagenaar & Keren, 1988), fate and fortune (Darke & Freedman, 1997). However,
Delacroix & Guillard’s (2008) questionnaire will not be used either as they
acknowledge that it is still in its developmental infancy regards validity.
These decisions influence the areas this research will have implications in. The
domains any findings may have relevance to are counselling and clinical psychology,
because a model may emerge which suggests it could be beneficial for people of
certain personality or attribution types over others to encourage within themselves a
belief in good luck during certain situations, or to generally maximise their
psychological well-being.
Damisch et al.’s first experiment in 2010 has had the most influence on the design of
the current research. They demonstrated that activating good luck improves
performance. The current research would like to incorporate this effect to see whether
belief in good luck influences performance on a ball throwing task, either in a ‘good
luck’ or control condition, by linking the good luck concept to the ball used (Van
Raalet et al., 1991; Damisch et al., 2010). As a note of caution, according to Damisch
et al., (2010), activating superstition before performance has not been studied prior to
their research but the samples they used included less than 50 university students each
time, who were mostly female. No further details about the students were reported in
any of their four studies, whether participants knew they were partaking in a putting
task and had practice at this or not, or if they were in sporting majors. Hence there may
be possible confounding variables towards their small samples’ findings.
Literature suggests that females are more prone to believe in supernatural phenomena
than males (Emme, 1940; Vyse, 1997; Wolfradt, 1997; Randall & Desrosiers, 1980;
Dag, 1999), and are more inclined to endorse superstition. Therefore, it is hypothesised
that females will score higher than males in the experimental throwing task as they will
be more responsive to the ball when it is described as ‘lucky’.
So as not to provoke suspicion of the experimenter in the experimental condition (good
luck) when saying “…this ball has been said to be lucky by previous participants,” the
current research was titled as ‘An Investigation into the Relationship between
Personality and Attribution Style’. As with Damisch et al.’s (2010) study there was no
mention of luck specifically in the information sheet given to participants and good
luck belief was classed as an aspect of personality and not drawn attention to. The
throwing task was said to be a measure of hand-eye-coordination in relation to the
individual difference variables measured, so as not to reveal the true purpose of the
study, for then the throwing task would loose validity.
Most of past research in the area of superstition and personality has focused on the
neurotic trait and attribution style. The present study hopes to add to research which
helps correct this bias. Accordingly, the hypotheses are two-tailed for agreeableness
and conscientiousness because the author was unaware of existing literature which
might indicate a direction for these variables.
However, it is expected that belief in good luck will affect throwing-task score
positively, that is, as belief in good luck is activated within the good luck condition,
ball score will be higher for this group. It is predicted from existing research that

Sophie Laura Robinson 0908128 - 12 -
neuroticism, imagination, extroversion, being female and external attribution style will
be the strongest predictors of a participant’s belief in good luck because these factors
are more often connected to good luck belief and positive superstitions.

Sophie Laura Robinson 0908128 - 13 -
METHOD
Design
The first part to this study is a laboratory experiment which uses a between groups
design. The experimental group is condition 1 (luck), and condition 2 acts at the
control group (no luck). The dependent variable here is score on the ball throwing task
which is derived from the amount of times the participant manages to throw the ball
into the paper bin. Gender and luck condition will be included as factors, with belief
in good luck as a covariate, in a one-way analysis of covariance.
The second part of the study will employ a design consistent with a multiple linear
regression analysis. The predictor variables being attribution style: internal-personal,
external-other person, external-situational; personality factors: extroversion,
agreeableness, conscientiousness, neuroticism and imagination and belief in good luck
will be the dependent variable. Only complete sets of responses will be included. The
analyses will be performed with the statistical software SPSS for Windows Version 19
with significance set at 0.05.
Participants
An opportunity sample of 17 males and 86 females took part in the study. No age data
was collected however those under 17 years of age were not eligible to participate due
to the content of the scenarios in the ARAT questionnaire. It was decided that not all
the scenarios would have been applicable to young teenagers as the authors of the
ARAT only used university level participants themselves during its development.
The majority of participants were students from the University of Wolverhampton, and
of those that were not students, all lived in Wolverhampton.
Participants were randomly assigned to each group. Those who arrived as an odd
number were in the luck condition (1) and those who arrived as an even number were
in the no luck condition (2).
There was a reward offered for students of 0.5 course credits, as is part of a system in
place at the university, other participants acted as volunteers.
Materials
Participants were asked to complete three questionnaires. The first was the
Achievement and Relationships Attribution Task (ARAT) by Fornells-Ambrojo &
Garety (2009), a measure of attribution style using everyday life situations (see
Appendix p. 46). Attribution is measured by scoring responses to why the participant
thinks something happened as either internal-personal (oneself), external-personal
(another person), or external-situational (chance or circumstances).
For example, in question a1 the participant is asked at the end of the scenario, “What is
the reason for the success of your business?” An internal attribution of causality would
be ‘because of my hard work’. Other-person attribution would be indicated with an
answer similar to ‘because of my partners’ successful advertising’. For an external-

Sophie Laura Robinson 0908128 - 14 -
situational attribution the participant might give a response of ‘because it is the only
store for miles around’.
The generality of the scenarios asserts the tasks external validity. Construct validity
has been demonstrated by the questionnaires ability to complement existing knowledge
of the relationship between depression and attribution of events, as well as literature on
paranoia biases. Reliability assessment tests found this measure to be very good, with
an average for the scenarios of .83 Cohen’s kappa value (Fornells-Ambrojo & Garety,
2009, p. 97).
The second questionnaire was the Mini-International Personality Item Pool (Mini-
IPIP) by Donnellan, Oswald, Baird & Lucas (2006), which asked participants to rate
how much they agreed with twenty statements along a five-point likert scale, to assess
the Big Five personality factors (see Appendix p. 49). Validity of the scale has been
proven against other Big Five measures and its parent scale (International Personality
Item Pool – Five Factor Model by Goldberg, 1999) which uses fifty statements. Test-
retest studies reveal reliability which resembles the coefficients of the IPIP-FFM,
demonstrating alternate-form reliability.
Lastly, a sixteen-item, six-point likert scale questionnaire to measure beliefs about the
causal properties and stability of personal good luck is the original Belief in Good
Luck scale (BIGL) by Darke & Freedman (1997) (see Appendix p. 50). The scale
indicates that those who score low hold a more rational view of luck – in which luck is
random and unreliable or do not believe in it at all; whereas those who score highly
tend to hold a view of luck as personal, stable and controllable.
Belief in good luck using the questionnaire has been demonstrated to be distinct from
possible related constructs such as self-esteem, optimism and life-satisfaction, thus
showing discriminant validity. The questions have been shown by the authors to be
reliable measures of belief in good luck for at least two months after first taking the
questionnaire, indicating that belief in good luck is relatively stable over time.
The latter two questionnaires (Mini-IPIP, BIGL) were ideally short so as to improve
quality of responses from participants because the first questionnaire (ARAT) is fairly
lengthy. It has been warned that having too many long questionnaires may produce
transient measurement errors due to participant’s boredom and frustration with
answering so many questions in a limited time frame (Schmidt, Le & Ilies, 2003).
Other equipment used to supplement this study was a small, soft ball and a waste-
paper bin in which to throw the ball. A two metre marker was used to gauge where the
participant was to stand from in order to throw the ball into the bin.
Two rooms were required, one in which to give the standardised instructions and to
complete the questionnaires, and another room in which to privately conduct the ball-
task as well as issue the debriefing after active participation had finished.
Procedure
Participants are firstly given both the information sheet and informed consent form to
grant them the necessary knowledge so that they know what they would be required to
do and whether they would like take part (see Appendix p. 44, 45). In the event that

Sophie Laura Robinson 0908128 - 15 -
participants felt uncomfortable answering any questions, they were given the right to
withdraw without consequence at any time. If consented, one at a time, a participant
will be led into a private room with only the experimenter in which to complete the
ball-throwing task.
The participant will be assigned to a condition dependent upon which number they are.
This is determined as follows: the first participant will be in the luck condition, and so
will each odd numbered participant after that. The second participant will be in the no
luck condition and so will each even numbered participant after them.
The experimenter will direct the participant to stand on the marker and face the bin. In
the luck condition, the experimenter will tell the participant, “All I would like you to
do is to try to throw the ball in the bin 10 times. Other people have said this ball’s
lucky so see how you do. You have as much time as you like.”
For the no luck condition the experimenter will say to the participant, “All I would like
you to do is to try to throw the ball in the bin 10 times. You have as much time as you
like.”
The experimenter stands back to allow the participant to proceed with the task. Once
ten throws have been made, the participant is led back into the main room to fill out
the questionnaires in the order they are presented in the materials section. The
participant is also reminded to write their ball score at the end of the last questionnaire.
Once completed, the participant is thanked and asked to give their participant-pool
number if they wished to receive 0.5 course credits for taking part. A debriefing is
issued to the participant in private, so as not to collude other participants, and a sheet
given for them to read in order to fully explain and clarify to them what they have
done in this study (see Appendix p. 51).

Sophie Laura Robinson 0908128 - 16 -
RESULTS
Belief in Good Luck
An enter method, multiple linear regression analysis was computed to determine the
extent to which condition, gender and the six personality factors: Extroversion (E),
Agreeableness (A), Conscientiousness (C), Neuroticism (N), Imagination (I), and
Attribution Style (AS), could predict a person’s belief in good luck score. The alpha
level of 0.5 was used for all statistical tests. There were 103 participants in total, 51 in
the luck condition, and 52 in the no luck condition. As can be seen by the summary
statistics in Table 1, the sample presented a mostly internal attribution style which past
research suggests is less likely to be related to superstitious belief in comparison to
external attribution. The sample was also highly agreeable and relatively low in
neuroticism. Implications of the sample’s characteristics will be discussed.
Table 1: Participants’ descriptive statistics showing means and standard deviations
rounded to two decimal places.
Variable Mean Standard Deviation
Good Luck Belief 48.52 11.06
AS: Internal Attribution 5.61 2.09
AS: External Other Person 3.48 1.66
AS: External Situational 2.89 1.53
E 13.11 3.48
A 17.00 2.25
C 13.92 3.51
N 12.19 3.27
I 14.90 2.85
Using the enter method, a non-significant model emerged (F(10,92)=0.741; p =.684)
accounting for -2.6% of the variance. These variables were not collectively significant
predictors in this model. Data to illustrate each variable is shown in Table 2.

Sophie Laura Robinson 0908128 - 17 -
Table 2: Participants’ β, t and p values showing whether the ten variables predict belief
in good luck.
Predictor β t p
AS: Internal Personal -.185 -.116 .452
AS: External Other-person -.163 -.130 .908
AS: External Situational -.132 -.113 .897
E .068 .650 .517
A .044 .429 .669
C -.010 -.095 .925
N -.093 -.844 .401
I -.261 -2.434 .017*
Gender -.015 -.139 .890
Condition -.004 -.041 .967
Because all variables but Imagination *(p = < 0.05) were non-significant in this model,
a backward method, multiple linear regression analysis was conducted to see if a
significant model would emerge after the weaker predictor variables were removed.
The backward method produced a significant model (F(1,101)=6.058; p = .016)
accounting for 4.7% of the variance. This model contained only the imagination
variable: Beta = -.238, t = -2.461, p = .016. The inferential statistics here suggest that
as imagination decreases, belief in good luck increases, presenting a negative
regression slope. Such effects were not expected or predicted within the hypotheses.
Ball Task Score
A two-way between-subjects design analysis of covariance was calculated with the
factors of gender and luck condition (luck or non luck group) upon the dependent
variable of ball task score, to establish if performance differed between the two luck
conditions. Belief in good luck was included as a covariate.
There was no significant main effect revealed for the gender factor upon ball task score
(F(1,98)= 0.406, p = 0.525). There was also non-significance for the luck condition
factor upon ball task score (F(1,98)= 0.233, p = 0.631). Good luck belief also
produced a non-significant result (F(1,98)= 0.000, p = 0.982).
The interaction between luck condition and gender upon ball task score is non-
significant (F(1,98)= 2.335, p = 0.130). Data constituting to the breakdown of gender
differences can be seen in Table 3. The table shows that females who were in the luck
condition did score averagely higher on the ball task than no luck females and males in
both conditions. However the low numbers of males in the sample do not allow for
strong or reliable mean differences in order to reach significance.
Table 3: The numbers (N), means (M) and standard deviations (SD) of the ball task
score from each luck condition with further gender breakdown.
Gender
Condition Female Male
Luck: N = 51, M = 5.80, N = 46, M = 5.91, SD = N = 5, M = 4.80, SD =

Sophie Laura Robinson 0908128 - 18 -
SD = 1.63 1.66 0.84
No Luck: N = 52, M =
5.48, SD = 1.92
N = 40, M = 5.38, SD =
1.93
N = 12, M = 5.83, SD =
1.95
Results suggest that in this study, ball task score was not significantly affected by
belief in good luck, gender or by which of the luck conditions the participants were in,
therefore the null hypotheses are retained for these factors.

Sophie Laura Robinson 0908128 - 19 -
DISCUSSION
The present research examined whether personality and attribution style could predict
a person’s belief in good luck (BIGL); as well as whether belief in good luck could
indicate performance on a throwing task once good luck superstition had been
activated. The results provide some support for the hypotheses towards gender and
activating good luck superstition upon performance.
Imagination
All of the predictor variables together as a model failed to predict belief in good luck
within this sample. However, when the backwards method of regression analysis was
employed in order to find if any of the variables accounted for belief in good luck,
negative significance emerged from one variable - the imagination factor. The analysis
showed that as a persons Imagination trait lessened (that is according to McCrae &
Costa, 1987, people who are less open to experiences and show preference for
convention, traditional interests and straightforwardness), the greater their BIGL score
was. It seems to go against common sense to say that as a person’s imagination
increases, their belief in good luck declines. Research which might be able to explain
this unexpected finding was not available to the author. It would be unsafe to assume
upon this research alone that this is a truly significant finding and it is suggested
instead that this result is anomalous.
Reasoning for why this finding is considered to be anomalous is explainable by (a) its
contrast between existing research, which is inconsistent with the result that lower
imagination scores result in higher BIGL, (b) the bias observed within the sample, and
(c) cognitive explanations.

Sophie Laura Robinson 0908128 - 20 -
Maltby et al., (2008) whose sample consisted of over 200 UK participants with an
average age of 30.35 years, found significance between belief in being personally
lucky and imagination, and significance between belief in being unlucky and low
imagination. Given their seemingly representative and unbiased sample and given that
Wiseman (2003) also found such a relationship, it seems that the present researches
finding is an anomaly.
Supposing the finding of low imagination is a factor which can predict BIGL, the trait
would need to be examined alongside the concrete traits associated with strong belief
in luck like neuroticism and external attribution with different populations and cultures
(e.g. Day & Maltby, 2003; Wiseman & Watt, 2004; Schippers & Van Lange, 2006).
Doing so would help to ensure that what has been found in the present research is not a
result of the sample alone and is instead, a legitimate result that can be inferred across
other populations. Realistically, however, the imagination model only accounted for
4.7% of the variance in BIGL, which is minimal, and so the author is inclined to
assume this is one of those findings that are of anomalous significance.
If the significance of imagination is indeed an anomalous finding due to this sample’s
participants, the following would be worthy of note. The data were collected mostly
with psychology students from the University of Wolverhampton. One would expect
psychologists, or at least those interested in the analytical line of thought which
psychology lends its self to, to show high trait agreeableness (Tokar, Fischer & Subich,
1998; Osipow, Ashby & Wall, 2011). This is what was found as Table 1 shows.
Perhaps the analytical mind of the sample and the fact that they presented a mostly
internal attribution style biased the results, as these are two traits shown relatively
consistently to be opposed to superstition, whether positive or negative (Maltby, 2008).
Such a suggestion would be supported by research by Lindeman & Aarnio (2007).
An alternative explanation to why significance was not found between BIGL and the
predictor factors is partly explainable by cognitive research from Kramer & Block
(2008). A critical affect of belief in luck is that when a negative superstition is made
salient, a person is more likely to make risk-averse choices (Kramer & Block, 2008).
This effect has been demonstrated to be highly salient in non-conscious processing, up
to three times more so than conscious processing, which suggests that the influence of
superstition is largely unnoticed unless a conscious effort is made to adhere to a
superstition (e.g. choosing a lucky pen to take to a test). Of course this finding of is not
directly related to the current research as it is exploring only good luck, yet it is still of
some importance because it should be held in mind that participants might not be
consciously aware that they do in fact hold a belief in good luck, and they might not
realise when that belief influences decisions or actions that they make.
Neuroticism
Neuroticism was the 10th
factor to be removed from the regression analysis model. The
lowest displayed trait by the sample was neuroticism which, as the introduction shows,
is the one personality trait that has been linked the most consistently to the area of
superstitious belief in general. Yet this highly reported personality trait was not found
to predict belief in good luck in this sample and thus retains the null hypothesis.

Sophie Laura Robinson 0908128 - 21 -
Wiseman & Watt (2004) did not consistently find significance with this variable across
all studies and said that this seemed due to whether the beliefs measured were of
positive or negative luck. They found that highly neurotic individuals endorsed more
bad luck beliefs than those lower in the trait (Wiseman, 2003). Support comes from
Day & Maltby (2003) who also found correlations between depression and beliefs in
bad luck. This in turn complements Wiseman & Watt’s (2004) finding that people low
in life satisfaction endorsed more highly negative superstitions, compared to those with
high life satisfaction. Wiseman & Watt (2004) theorised that high trait neuroticism is
linked to belief in bad luck and since we were measuring good luck belief it may not
be out of the ordinary to find no significance in this context with neuroticism. A later
study by Maltby et al., (2008) also found this trend, with bad luck endorsement by
highly neurotic individuals being significantly associated to poor psychological well-
being (e.g. pessimism).
Attribution Style
The sample also had a much stronger bias towards an internal attribution style than
either of the external loci and significance was not found for this variable; again
retaining the null hypothesis. As highlighted in the introduction, research is relatively
consistent in reporting the significant relationship an external attribution style has upon
superstitious and luck belief, most likely because externals show more tension
compared to internals (e.g. Schippers & Van Lange, 2006). Yet internal attribution
style was also shown to be significantly related to absence of a belief in any luck
(Maltby et al., 2008).
Peltzer (2002) was interested in replicating existing paranormal belief and personality
research, among black South African students. His study examined the sub-scales
within the Paranormal Belief Scale (PDI) Tobacyk & Milford, 1983), big five
personality factors, attribution style, and religiosity. He found significance between
both external and internal attribution styles for the superstition sub-scale, although
heed that this only measures negative superstition (Wiseman & Watt, 2004). This
suggests that in some populations attribution style may not be as significant a predictor
to superstitious belief as Western-based research abovementioned leads us to believe.
Perhaps attribution style is not as relevant to good luck belief specifically as it can be
in superstition in general. Instead, an individual’s BIGL may be more influenced by
environmental factors, such as exposure to superstitious practice and parental beliefs
towards positive superstition (Emme, 1940).
Extroversion
The extraversion factor was the 9th
predictor variable removed from the regression
analysis, no significance was found for its ability to predict BIGL and so this does not
allow rejection of the null hypothesis for this trait. Maltby et al., (2008) discovered that
individuals low in extraversion had significant belief that they were unlucky, which is
complemented by the findings from Wiseman (2003). Peltzer (2002) though, found no
correlation between the PDI measure of superstition and extraversion but did with the
Psi sub-scale. This is logical given an extravert’s tendency to interact more with their
environment and hence believe they can directly affect things around them (McCrae &
Costa, 1987).

Sophie Laura Robinson 0908128 - 22 -
The present sample was quite highly extroverted and taking into account Peltzer’s
(2002), Wiseman (2003), and Maltby et al’s (2008) findings, this may suggest that
extroverts are likely to benefit from strategies that use good luck superstition to
improve performance and psychological well-being. Future research might expand
upon this speculation as in contrast; perhaps more introverted individuals would
benefit more from encouragement to utilise good luck rather than bad.
The discussion of the predictor variables above suggests that the nature of the
characteristics of the sample may be biased towards the opposite of any strong belief in
good luck, let alone superstition. The null hypotheses could not be rejected for the
variables of conscientiousness and agreeableness as no significance was found for
these traits. In spite of this, previous research which also included these personality
factors by Maltby et al., (2008) found non-significant correlations between them and
general belief in luck. This and the present researches findings might indicate these
two variables carry no bearing upon someone’s belief in good luck.
Ball-Throwing Task
The ball task experiment did not produce significant results with any of the variables;
however, the emerging trends within the data are in conformity with research which
explores self-efficacy (e.g. Tobacyk & Shrader, 1991) and gender (e.g. Wiseman &
Watt, 2004) with good luck. This lends some strength to the validity of the present
research. BIGL did not significantly affect a person’s ball task performance, that is, as
BIGL score increased task performance did not significantly improve. Interestingly
though, those in the luck condition (superstition activation) did perform slightly better
than those in the no-luck condition (no superstition activation). Support is thus
provided to theories and research which propose that activating good luck superstitious
belief triggers the self-efficacy bias, which serves to enhance performance (e.g.
Bandura, 1977; Damisch et al., 2010).
A theoretical explanation as to why this aspect did not reach significance could be due
to the way in which individual participants view the luck concept, bearing in mind it
has been shown to be distinct to chance (Wagenaar & Keren, 1998). If a participant
held the bias prior to entering the study that they were unlucky, the activation of the
positive superstition might have been void. That is, their belief that they are unlucky
might have been more powerful than the suggestion that they would perform well with
the ‘lucky ball’. Research has shown that those who believe themselves to be unlucky
have cognitive biases which lead them to be anxious and unconfident (Wolfradt, 1997;
Maltby et al., 2008). They also have been found to believe that luck is uncontrollable
and more like chance which is said to be uncontrollable, in comparison to those who
believe they are lucky and that they can influence luck favourably (Darke & Freedman,
1997; André, 2009).
Regards gender differences, no significance was found, yet trends within results are
also in-line with previous literature which suggests females would be more likely to
endorse superstition (e.g. Vyse, 1997). Females appeared to be more responsive in the
luck condition because they scored averagely higher than the males, suggesting that
females are more receptive to the benefits of good luck activation. Oddly, males
performed slightly better when in the no luck condition yet this was most likely an
unintentional bias due to the fact that the large majority of males were in the control

Sophie Laura Robinson 0908128 - 23 -
condition. A factor which may have contributed to this pattern of results and for why
these gender differences did not reach significance, was most likely because of the
very unequal gender split. There were far fewer males to females in both conditions
and so the trends were there, but there were probably not enough males to afford
significance to the results.
Limitations, Implications & Future Research
The sample was relatively small, due to the time constraints upon collecting data,
compared to prominent previous research in the area which has used samples much
larger than the present research (e.g. Darke & Freedman, 1997; Wiseman & Watt,
2004; Schippers & Van lange, 2006; Delacroix & Guillard, 2008). If this research were
to be conducted again with a different population it may be more beneficial to only
include the data of those participants who scored in say, the top 10 or 20 percent (as
Wiseman & Watt did in 2004 with one of their experiments) of the BIGL scale. This
would allow findings to be clearer in that they are the effects of people who believe
strongly in good luck. When time is not so constrained, it would also benefit to gather
data from a larger sample to conduct a more sound linear regression analysis with
(Brace, Kemp & Snelgar, 2003).
An obvious limitation of this research is that the findings cannot be generalised to the
overall population since the sample was dominated by psychology students, however,
the outcome can be used to inform and broaden future research in the area of good
luck.
Intriguing and unusual research from Chotai & Wiseman (2005), demonstrates
significance of factors which are unlikely to immediately spring to mind when thinking
what could influence someone’s belief in luck. Through their research into the
relationship between feeling lucky and month of birth, they showed that summer-born
individuals considered themselves to be significantly luckier than the winter-born. As
previously mentioned, they also demonstrated that belief in good luck had many
positive implications on psychological well-being; particularly for the summer-born,
such as being more imaginative, less neurotic and more extraverted compared to the
winter-born participants. They discuss why this may be in terms of brain biochemistry.
Thus, such research illustrates that there are numerous possible factors which
contribute to belief in good luck and to how strongly that person might believe in luck
in general. Maybe birth month would be a more universal predictor of belief in good
luck than the individual differences explored in the current research, because
collectively they failed to significantly predict BIGL within this sample.
Research was presented in the introduction which discussed the importance to
recognise that good luck is not restricted to popular sayings and that it can instead be
personalised to lucky charms and rituals. The method of activating positive
superstition in this research was externally, by the experimenter referring to a ball as
lucky. Perhaps BIGL would have had a stronger affect on the participants’ task
performance (lead to significance being reached in the luck condition), had they
actually seen the ball behaving in what could be called a lucky manner, rather than
solely taking the experimenters’ word.

Sophie Laura Robinson 0908128 - 24 -
For example, if participants had observed a few participants (or stooges) before them
perform really well on the throwing task they may have self inferred that the ball was
lucky and could have had this reaffirmed by a stooge when handing the ball to the
experimenter. The stooge might say something such as, “This seems to be a lucky ball
you know!” A design like this may be sounder for future research when attempting to
activate good luck beliefs, for if priming is obvious the positive effects of the
superstition activation have been shown to be reversed (Kramer & Block, 2008).
Perhaps the more an apparently lucky object seems personal, the better it would work
to act as a ‘lucky charm’, and hence activate the self-efficacy bias (Werner, 1948;
Damisch et al., 2010). Of course, in real life, superstitions are frequently activated
personally by the individual so that they become idiosyncratic (Schippers & Van
Lange, 2006), which can present a problem to research in the area demonstrating
external validity.
It is however, worth mentioning in defence of the throwing task used in this study, that
some participants in the luck condition did hand the ball back to the experimenter
exclaiming such things as “I think that really is a lucky ball!” when they performed
better than they thought, or “I think I’ve ran out of luck with it [the ball] now,” when
they did well and then lost their streak of consecutive successful throws. Such
statements demonstrate internal validity of the study but as discussed above, the design
could be improved for future research.
There were other observations made of participants which could have influenced
results. During the design of the study, care was taken to ensure that participants would
feel as comfortable and relaxed as possible, by such measures as only having the
experimenter and the participant present in the throwing task and allowing them as
much time as possible. Despite this and extra reassurance from the experimenter, some
first year university students appeared anxious. It is quite likely that their emotions had
an effect on their performance during the throwing task in a negative manner
(Rajkumar, Anilkumar & Pasodi, 2011).
As a matter of interest, if this study were to be replicated in a place known for
superstition, such as China or the Philippines (Simmons & Schindler, 2003; Tsang,
2004), perhaps a model would emerge which would successfully predict BIGL within
that culture. On the other hand, superstition is a very integral part of that culture so
perhaps a clear model would not emerge there due to the diversity between the people
who would endorse luck.
Findings from this study, and those which have informed this research, have lead to
speculation that it would be beneficial for future research to explore good and bad luck
within clinical samples, such as those who are depressed or suffering with an anxiety
disorder (Kring, Johnson, Davidson & Neale, 2010). This is because of research and
theories which suggest that those who are highly neurotic tend to endorse superstition
more, particularly negative superstition (e.g. Wiseman & Watt, 2004). As it is
therefore likely that such individuals already endorse negative superstition which may
add to poor psychological well-being (e.g. Wolfradt, 1997; Maltby et al., 2008),
perhaps development of strategies in which such people can use their beliefs positively
will aid in the development of coping strategies which can help to lessen the anxiety
and depression they may experience.

Sophie Laura Robinson 0908128 - 25 -
The findings from this sample did not suggest a strong model to explain the variance
of belief in good luck. The suggested association between the imagination trait and
belief in good luck appears anomalous because this finding conflicts with previous
research and is not found elsewhere in current literature. The findings do suggest that
females may be more likely to respond to and benefit from using positive superstition
to enhance psychological well-being and supports the theories and research which
demonstrates this positive effect (e.g. Malinowski, 1954, Bandura, 1977; Schippers &
Van Lange, 2006). Furthermore, this study does add to support for theories which
explain why we still have positive superstitions today via biases of self-efficacy and
illusory control as those in the luck condition did perform better than those who did
not have superstition activated (e.g. Langer & Roth, 1975; Damisch et al., 2010).
This study suggests that there is not necessarily one universal model which predicts
BIGL across populations and whom might benefit from using superstition to maximise
psychological well-being (e.g. Miller & Taylor, 1995; Day & Maltby 2003). Taking
into account previous literature, it appears that endorsing good luck can potentially be
beneficial to anyone, so long as they do believe in luck (Maltby et al., 2008). Practical
implications are that using good luck does have benefits and should be given credit
(i.e. not always viewed as an irrational belief) if use serves to improve performance
and well-being (Wiseman, 2003).
It does appear from the regression analysis that good luck is something people either
endorse or do not endorse and personality is not necessarily a concrete factor upon
which this endorsement is dependent upon. Overall, this study helps to fill gaps in the
literature and hopes to provide more footing towards the use of positive superstition
and good luck to improve psychological well-being in clinical and counselling
domains. Individual differences in good luck belief still need further investigation and
present findings ought to be confirmed across different populations.

Sophie Laura Robinson 0908128 - 26 -
REFERENCES
Albas, D. & Albas, C. (1989). Modern magic: The case of examinations. Sociological
Quarterly, 30, 603-613.
André, N. (2009). I am not a lucky person: An examination of the dimensionality of
beliefs about chance. Journal of Gambling Studies, 25(4), 473-487.
Bandura, A. (1977). Self-efficacy: Toward a unifying theory of behavioural change.
Psychological Review, 30, 603-613.
Benitez, A. (2000). Sheer Superstition: Outmanoeuvring Fate. Charlottesville:
Hampton Roads Publishing Company, Inc.
Block, L., & Kramer, T. (2009). The effect of superstitious beliefs on performance
expectations. Journal of the Academy of Marketing Science, 37, 161-169.
Brace, N., Kemp, R., & Snelgar, R. (2003). SPSS for Psychologists. (2nd
ed.). New
York: Palgrave Macmillan.
Buhrmann, H.G., & Zaugg, M.K. (1981). Superstitions among basketball players: An
investigation of various forms of superstitious beliefs and behaviour among
competitive basketballers at the junior high school to university level. Journal of Sport
Behaviour, 4, 163-174.
Case, T.I., Fitness, J., Cairns, D.R, & Stevenson, R.J. (2004). Coping with uncertainty:
Superstitious strategies and secondary control. Journal of Applied Social Psychology,
34, 848-871.
Chotai, J., & Wiseman, R. (2005). Born lucky? The relationship between feeling lucky
and month of birth. Personality and Individual Differences, 39, 1451-1460.
Dag, I. (1999). The relationships among paranormal beliefs, locus of control and
psychopathology in a Turkish college sample. Personality and Individual Differences,
26, 273-737.
Damisch, L., Stoberock, B., & Mussweiler, T. (2010). Keep your fingers crossed! How
superstition improves performance. Association for Psychological Science, 21(7)
1014-1020.
Darke, P., & Freedman, J. (1997). The Belief in Good Luck Scale. Journal of
Research in Personality, 31, 486-511.
Day, L., & Maltby, J. (2003). Belief in good luck and psychological well-being: the
mediating roles of optimism and irrational beliefs. Journal of Psychology, 137(1) 99-
110.
Day, L., & Maltby, J. (2005). “With good luck.” Belief in good luck and cognitive
planning. Personality and Individual Differences, 39, 1217-1226.

Sophie Laura Robinson 0908128 - 27 -
Delacroix, E., & Guillard, V. (2008). Understanding, defining and measuring the trait
of superstition. Paper presented at the 2008 conference of IAREP/SABE World
Meeting, Luiss, Rome, Italy.
Devine, P.G. (1989). Stereotypes and prejudice: their automatic and controlled
components. Journal of Personality and Social Psychology, 56, 5-18.
Donnellan, M., Oswald, F., Baird, B., & Lucas, R. (2006). The Mini-IPIP Scales: tiny-
yet-effective measures of the Big Five Factors of Personality. Psychological
Assessment, 18(2) 192-203.
Emme, E.E. (1940). Modification and origin of certain beliefs in superstition among 96
college students. Journal of Psychology: Interdisciplinary and Applied, 10, 279-291.
Fornells-Ambrojo, M., Garety, P. (2009). The development and validation of
the Achievement and Relationships Attribution Task (ARAT). Cognitive
Neuropsychiatry, 14(2) 87-109.
Furnham, A. (1993). Just world beliefs in twelve societies. Journal of Social
Psychology, 133(3), 317-329.
Gmelch, G. (1971). Baseball Magic. Society, 8(8), 39-41.
Gunn, E.P. (1997). You Say Your Office Has Negative Energy? Try Feng Shui!
Fortune, 136(6), 64.
Irwin, H.J. (2000). Belief in the paranormal and a sense of control over life. European
Journal of Parapsychology, 15, 68-78.
Jahoda, G. (1969). The Psychology of Superstition. London: Allen Lane/Penguin Press.
Keinan, G. (1994). Effects of stress and tolerance of ambiguity on magical
thinking. Journal of Personality and Social Psychology, 67, 48-55.
Keinan, G. (2002). The effects of stress and desire for control on superstitious
behaviour. Personality and Social Psychology Bulletin, 28, 102-8.
Kramer, T., & Block, L. (2008). Conscious and nonconscious components of
superstitious beliefs in judgment and decision making. Journal of Consumer Research,
34, 783-793.
Kring, A.M., Johnson, S.L., Davidson, G.C., & Neale, J.M. (2010). Abnormal
Psychology. (11th
ed.). Asia: John Wiley & Sons, Inc.
Langer, E.J. (1975). The illusion of control. Journal of Personality and Social
Psychology, 32, 311-328.
Langer, E. J. (1977). The psychology of chance. Journal for the Theory of Social
Behaviour, 7, 185-207.

Sophie Laura Robinson 0908128 - 28 -
Langer, E.J., & Roth, J. (1975). Heads I win, tails it’s chance: The illusion of control
as a function of the sequence of outcomes in a purely chance task. Journal of
Personality and Social Psychology, 32, 951-955.
Lerner, M.J. (1965). Evaluation of performance as a function of performer’s reward
and attractiveness. Journal of Personality and Social Psychology, 1, 355-360.
Lerner, M.J., & Simmons, C.H. (1966). Observer’s reaction to the “innocent victim”:
Compassion or rejection? Journal of Personality & Social Psychology, 4(2), 203-210.
Lindeman, M., & Aarnio, K. (2007). Superstitious, magical and paranormal beliefs: An
integrative model. Journal of Research in Personality, 41(4), 731-744.
Lip, E. (1992). Chinese Numbers: Significance, Symbolism and Traditions. Singapore:
Times Books International.
Malinowski, B. (1954). Magic, Science, and Religion. Garden City, New York:
Doubleday.
Matthews, B., & Deary, I.J. (1998). Personality traits. Cambridge, UK: Cambridge
University Press.
McCrae, R.R., & Costa, P.T. (1987). Validation of the five-factor model of personality
across instruments and observers. Journal of Personality and Social Psychology, 52,
81-90.
Meigs, A.S. (1984). Food, Sex and Pollution. A New Guinea Religion. New Jersey:
Rutgers University Press.
Miller, D.T., & Taylor, B.R. (1995). Counterfactual thought, regret and superstition:
How to avoid kicking yourself. In N.J. Roese, & J.M. Olson (Eds.), What might have
been: The social psychology of counterfactual thinking (pp. 305-331). Hillsdale, NJ:
Erlbaum.
Mowen, J.C., & Carlson, B. (2003). Exploring the antecedents and consumer
behaviour consequences of the trait of superstition. Psychology and Marketing, 20,
1045-1065.
Osipow, S.H., Ashby, J.D., & Wall, H.W. (2011). Personality types and vocational
choice: A test of Holland’s theory. The Personnel and Guidance Journal, 45(1), 37-42.
Padgett, V.R,. & Jorgenson, D.O. (1982). Superstition and economic threat: Germany
1918-1940. Personality and Social Psychology Bulletin, 8, 44-57.
Palazzolo, R. (2005). Is Friday the 13th
a Reason to Stay in Bed? Retrieved on March
22 from: http://abcnews.go.com/Health/story?id=751011&page=1#.T2uGGGHUP2s.
Peltzer, K. (2002). Paranormal beliefs and personality among black South African
students. Social Behaviour and Personality, 30(4), 391-398.

Sophie Laura Robinson 0908128 - 29 -
Rajkumar, M.S., Anilkumar E., & Pasodi, M.S. (2011). Anxiety and Performance.
International Journal of Health, Physical Education and Computer Science in Sports,
3(1), 47-50.
Randall, T.M., & Desrosiers, M. (1980). Measurement of supernatural belief: Sex
differences and locus of control. Journal of Personality Assessment, 44, 493-498.
Rotter, J.B. (1966). Generalized expectancies for internal versus external control of
reinforcement. Psychological Monographs, 80(609).
Rubin, Z., & Peplau, L.A. (1975). Who believes in a just world? Journal of Social
Sciences, 31(3), 65-89.
Rudski, J.M., & Edwards, A. (2007). Malinowski goes to college: Factors influencing
students’ use of ritual and superstition. Journal of General Psychology, 134(4), 389-
403.
Sarason, I.G. (1984). Stress, anxiety, and cognitive interference: Reactions to tests.
Journal of Personality and Social Psychology, 46, 929-938.
Scheidt, R.J. (1973). Belief in supernatural phenomena and locus of control.
Psychological Reports, 32, 1159-1162.
Schippers, M.C, & Van Lange, P.A.M. (2006). The psychological benefits of
superstitious rituals in top sport: A study among top sportspersons. Journal of Applied
Social Psychology, 36(10), 2532-2553.
Schmidt, F.L., Le, H., & Ilies, R. (2003). Beyond alpha: An empirical examination of
the effects of different sources of measurement error on reliability estimates for
measures of individual differences constructs. Psychological Methods, 8, 206-224.
Seligman, M. E.P., & Csikszentmihalyi, M. (2000). Positive Psychology: An
introduction. American Psychologist, 55(1), 5-14.
Simmons, L.C., & Schindler, R.M. (2003). Cultural superstitions and the price endings
used in Chinese advertising. Journal of International Marketing, 11, 101-111.
Skinner, B.F. (1948). Superstition in the pigeon. Journal of Experimental Psychology,
38, 168-172.
Skinner, B.F. (1953). Science and Human Behaviour. New York: Macmillan.
Superstition. (2011). In Concise Oxford English Dictionary (12th
ed.). Oxford, Great
Britain: Oxford University Press.
Tobacyk, J, & Milford, G. (1983). Belief in paranormal phenomena: Assessment
instrument development and implications for personality functioning. Journal of
Personality and Social Psychology, 44, 1029-1037.

Sophie Laura Robinson 0908128 - 30 -
Tobacyk, J., & Shrader, D. (1991). Superstition and self-efficacy. Psychological
Reports, 68, 1387-1388.
Tokar, D.M., Fischer, A.R., & Subich, L.M. (1998). Personality and vocational
behaviour: A selective review of the literature, 1993-1997. Journal of Vocational
Behaviour, 53(2), 115-153.
Tsang, E.W.K. (2004). Superstition and decision-making: Contradiction or
complement? Academy of Management Executive, 18(4), 92-104.
Van Raalte, J.L., Brewer, B.W., Nemeroff, C.J., & Linder, D.E. (1991). Chance
orientation and superstitious behaviour on the putting green. Journal of Sport
Behaviour, 14, 41-50.
Vyse, S.A. (1997). Believing in Magic: The Psychology of Superstition. New York:
Oxford University Press.
Wagenaar, W.A., & Keren, G.B. (1988). Chance and luck are not the same. Journal of
Behavioural Decision Making, 1, 65-75.
Werner, H. (1948). Comparative Psychology of Mental Development. New York:
International Universities Press.
Whitson, J.A., & Galinsky, A.D. (2008). Lacking control increases illusory pattern
perception. Science, 322, 115-117.
Wiseman, R. (2003). The luck factor: The scientific study of the lucky mind. London:
Arrow.
Wiseman, R., & Watt, C. (2004). Measuring superstitious belief: why lucky charms
matter. Personality and Individual Differences, 37, 1533-1541.
Wolfradt, U. (1997). Dissociative experiences, trait anxiety and paranormal beliefs.
Personality and Individual Differences, 23, 15-19.
Womack, M. (1992). Why athletes need ritual: A study of magic among professional
athletes. In S. Hoffman (Ed.), Sport and religion (pp. 191-202. Champaign, IL: Human
Kinetics.
Xu, A.J., Zwick, R., & Schwartz, N. (2011). Washing away your (good or bad) luck:
Physical cleansing affects rick-taking behaviour. Journal of Experimental Psychology,
141(1), 26-30.
Yardley, J. (2006). First Comes the Car, Then the $10,000 License Plate. Retrieved on
March 21 from:
http://www.nytimes.com/2006/07/05/world/asia/05china.html?_r=1&oref=slogin
Sophie Laura Robinson 0908128 - 31 -
APPENDICES
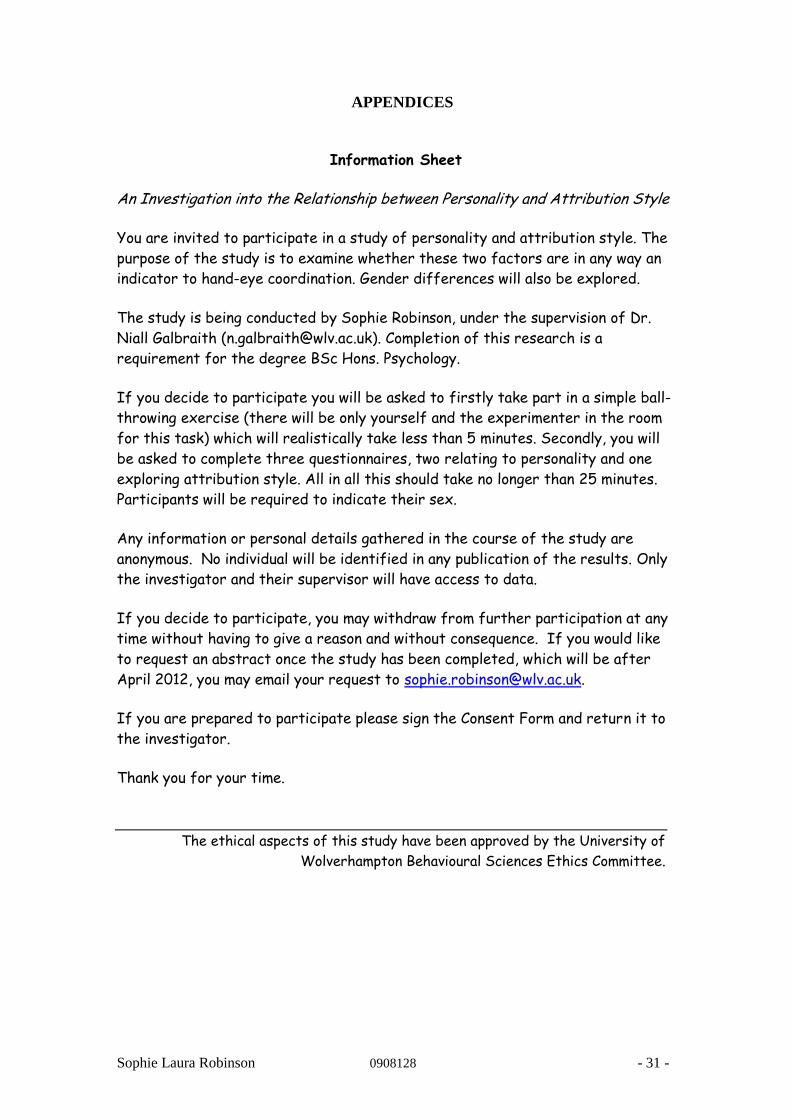
Information Sheet
An Investigation into the Relationship between Personality and Attribution Style
You are invited to participate in a study of personality and attribution style. The
purpose of the study is to examine whether these two factors are in any way an
indicator to hand-eye coordination. Gender differences will also be explored.
The study is being conducted by Sophie Robinson, under the supervision of Dr.
Niall Galbraith ([email protected]). Completion of this research is a
requirement for the degree BSc Hons. Psychology.
If you decide to participate you will be asked to firstly take part in a simple ball-
throwing exercise (there will be only yourself and the experimenter in the room
for this task) which will realistically take less than 5 minutes. Secondly, you will
be asked to complete three questionnaires, two relating to personality and one
exploring attribution style. All in all this should take no longer than 25 minutes.
Participants will be required to indicate their sex.
Any information or personal details gathered in the course of the study are
anonymous. No individual will be identified in any publication of the results. Only
the investigator and their supervisor will have access to data.
If you decide to participate, you may withdraw from further participation at any
time without having to give a reason and without consequence. If you would like
to request an abstract once the study has been completed, which will be after
April 2012, you may email your request to [email protected].
If you are prepared to participate please sign the Consent Form and return it to
the investigator.
Thank you for your time.
The ethical aspects of this study have been approved by the University of
Wolverhampton Behavioural Sciences Ethics Committee.

Sophie Laura Robinson 0908128 - 32 -
Informed Consent form
An investigation into the relationship between Personality and Attribution Style
I have read (or, where appropriate, have had read to me) and understand the information provided in the Information Sheet.
I understand that I will be asked to complete three questionnaires: two exploring personality and one to assess attribution style, which should take no longer than 20 minutes; and that I will provide information to the best accuracy of my knowledge. I understand that in the experimental task I am in no pressure to perform perfectly and that I can take my time. I understand that my identity will not be linked with my data, and that all information I provide will remain anonymous. Any questions I have asked have been answered to my satisfaction. I agree to participate in this research, knowing that I can withdraw from further participation in the research at any time without consequence. Participant’s Name: ____________________________________________________ (block letters) Participant’s Signature: _______________________ Date: ______________________

Sophie Laura Robinson 0908128 - 33 -
Achievement & Relationships Attribution Task (ARAT) Fornells-Ambrojo & Garety (2009)
INSTRUCTIONS: The stories below describe some everyday situations. Each of them is followed by a question. Please read the scenarios and answer the questions. Try to decide what the main cause
of the event described in each scenario was. Please write down your answers on the space provided. In some cases, it might be difficult to decide what the main explanation for the event is.
In those cases, please write down the causes in order of importance. Thank you for your co-operation
Story a1 You decide to open your own dry cleaning shop in a small but growing town. Your store will be the only one of its kind for miles around. In the first year of business, the town’s population doubles and your business prospers. Your business partner’s ad campaign is a big success and customers praise the quality of your work. Your sales exceed expectations. What is the reason for the success of your business?
Answer: …………………………………………………………………………………………………………..
Story b1 You have trouble finding work. Unemployment has risen lately. You’ve had difficulties with the management in the past because of tardiness and poor performance record. You have not applied for all the jobs in your field advertised because your neighbour is redecorating the flat and has been asking your help quite often this week. Why do you have trouble finding work?
Answer: …………………………………………………………………………………………………………..
Story b6 Recently, you haven’t done all the work that your boss expects from you. The boss begins to complain about your performance. The job is sometimes difficult for you because it’s quite technical and the hours are long. Also, you recently discover through the office grapevine that the boss’ nephew is very interested in your position. Why does your boss complain about your work performance?
Answer: …………………………………………………………………………………………………………..
Story a2 You take pride in your appearance, and make an effort to look your best for a dinner party. You notice that an old friend is sitting next to an argumentative couple and is pleased to move seats to talk. Your friend compliments you on your appearance. Later on the evening, this person annoys you by asking for a ride home. This is a great inconvenience because this person lives far away. Why do you receive a compliment from your old friend?
Answer: …………………………………………………………………………………………………………..
Story a6 You just got into the college you wanted to do your A levels. The competition to get into this college is usually very high because is the best in the area. However, this year there were fewer applicants because a new college just opened in the centre of town. You had very good grades in your GCSEs. During the admission interview you learnt that your previous tutor worked quite closely with one of the interviewers and recommended you personally.

Sophie Laura Robinson 0908128 - 34 -
Why do you get in the college?
Answer: …………………………………………………………………………………………………………..
Story b2 A neighbour mentions to you that their teenager has a drinking problem. You wonder if the neighbour is going to ask you for advice. This neighbour is an independent and headstrong person who rarely seeks advice from others. You do not ask the neighbour any specific questions about this matter because you are not very good at counselling people. This neighbour mentions that he is late for work and leaves without asking for your advice. Why doesn’t the neighbour ask you for advice?
Answer: …………………………………………………………………………………………………………..
Story b5 You take part in a debate at college. A student with a view opposite to yours starts presenting. As you listen to the speech, you notice that this individual is a very fluent and persuasive speaker. You have not had much time to prepare your own speech so your presentation turns out to be quite disorganised. You also have some problems making yourself heard because your microphone is making disturbing high pitch noises during your talk. After counting the votes it becomes clear the audience does not support your views. Why does the audience not support your views?
Answer: …………………………………………………………………………………………………………..
Story a3 You decide to throw a party at short notice. There has not been a party in your college for months and you know that a lot of your friends are dying to have one before the exam period starts. You book the top floor of a famous club. A friend of yours who is a well-known DJ agrees to play for the evening. Everybody seems to enjoy themselves. The dance floor is full until the end of the evening. Why is the party a success?
Answer: …………………………………………………………………………………………………………..
Story a5 You have recently received a salary increase at work. While you are a bit surprised by this since you had no prior notice about such a raise, you do feel that you have been a reliable worker. Indeed, other colleagues have received the annual rise. The day after your receive this news, a memo is sent from the boss to all workers indicating that in the last few months a number of employees have left the company. The company’s boss offers to be open to suggestions for improving job satisfaction. Why do you get a rise?
Answer: …………………………………………………………………………………………………………..
Story b3 You and a friend from college decide to go out to dinner. The evening starts out badly because you forget to make dinner reservations as arranged. You and your friend meet at the

Sophie Laura Robinson 0908128 - 35 -
restaurant. After an hour’s wait, there is still no table so you both decide to go elsewhere for a meal. The food and service turn out to be disappointing there, especially for your friend. During the dinner, your friend hassles you about how you were able to get such a high mark in your essay. The questioning indicates a hostile tone.
Why does your friend act hostilely toward you?
Answer: …………………………………………………………………………………………………………..
Story b4 You arrange to go to the cinema with someone you just met last week. You let the other person choose the film that turns out to be quite boring. After the cinema you go for a coffee. You don’t talk much because you are feeling tired. When the evening is over, this person tells you that she/he didn’t have a good time. Why does the date go badly?
Answer: …………………………………………………………………………………………………………..
Story a4 You take a course in English Literature because you like to write. Your first assignment involves writing a paper on a contemporary English author. You happen to have a newly published book discussing the style of this particular author in detail. You work hard on the paper and are quite pleased with the result. You hear from another student that the person doing the marking in this course is very generous. When the paper is returned you are happy to see that you have an excellent mark. Why do you receive an excellent grade?
Answer: …………………………………………………………………………………………………………..
GENDER (PLEASE CIRCLE): MALE / FEMALE

Sophie Laura Robinson 0908128 - 36 -
20-Item Mini-IPIP DONNELLAN, OSWALD, BAIRD, AND LUCAS (2006)
Below are some short statements. Please indicate the extent of your agreement with the statements by ticking one of the five responses to each question.
Thank you for your time.
(1)
Strongly
Disagree
(2)
Slightly
Disagree
(3)
Neutral
(4)
Slightly
Agree
(5)
Strongly
Agree
1) I am the life of the party
2) I sympathise with others’ feelings
3) I get chores done right away
4) I have frequent mood swings
5) I have a vivid imagination
6) I don’t talk a lot
7) I am not interested in other people’s problems
8) I often forget to put things back in their proper place
9) I am relaxed most of the time
10) I am not interested in abstract ideas
11) I talk to a lot of different people at parties
12) I feel others’ emotions
13) I like order
14) I get upset easily
15) I have difficulty understanding abstract ideas
16) I keep in the background
17) I am not really interested in others
18) I make a mess of things
19) I seldom feel blue
20) I do not have a good imagination

Sophie Laura Robinson 0908128 - 37 -
Belief in Good Luck DARKE AND FREEDMAN (1997)
Below are statements relating to luck. Please indicate the extent of your agreement with the statements by ticking one of the six responses to each question.
Thank you for your participation. (1)
Strongly Disagree
(2) Somewhat Disagree
(3) Slightly
Disagree
(4) Slightly Agree
(5) Somewhat
Agree
(6) Strongly Agree
a) Luck plays an important part in everyone’s life
b) Some people are consistently lucky, and others are unlucky
c) I consider myself to be a lucky person
d) I believe in luck
e) I often feel like it’s my lucky day
f) Nobody can win at games of chance in the long-run
g) I consistently have good luck
h) I tend to win games of chance
i) It’s a mistake to base any decisions on how lucky you feel
j) Luck works in my favour
k) I don’t mind leaving things to chance because I’m a lucky person
l) Even the things in life I can’t control tend to go my way because I’m lucky
m) I consider myself to be an unlucky person
n) There is such a thing as luck that favours some people, but not others
o) Luck is nothing more than random chance
p) Luck played a part in the ball-throwing exercise
Please Indicate your score in the Ball-throwing exercise:

Sophie Laura Robinson 0908128 - 38 -
Debriefing Sheet
An investigation into the relationship between Personality and Attribution Style
Thank you for your participation in this study. A main aim of the study was to examine whether personality and/or attribution style is related to belief in good luck, and the extent to which this belief affects performance.
We used a simple experiment in which to assess good luck belief on performance by either describing the ball as lucky or not. Participants will have been in one of these conditions for the ball-throwing task which was considered relatively easy and not reliant upon much external skill or knowledge. That is, that the task was more easily influenced by chance than sheer skill.
One of the reasons for studying belief in good luck is to find out whether there are any indicative traits for this belief, as this would then have benefits to the construction of coping mechanisms for people who express certain personality characteristics. Applications of this would be in a clinical and counselling setting.
We already know that people who demonstrate neuroticism on a Big Five measure, find the endorsement of good luck is helpful in making them more optimistic, but little to nothing is known about whether this would also be beneficial to any other personality traits. This knowledge could also help to explain why certain superstitious behaviours have persisted over time, such as the expression ‘knock-on-wood’.
Because external attributors have been found to have a higher belief in concepts such as luck, it may be the case that this is the dominant factor in determining whether someone would benefit from using good luck strategies in their daily life and it is not solely reliant upon personality characteristics.
So, in this study, after reading the information sheet and consent form, you were asked to try to throw the ball into the receptacle 10 times. Half of participants were told the ball is lucky in some way, and the other half receives no description of the ball. The study also wanted to find out if the people who express a strong belief in good luck are more likely to perform better when the ball is described as lucky. The reason for including the control condition of no description was to assess whether describing the ball as lucky made any difference to performance aside of factors such as personality.
It is expected that those who show traits of agreeableness and imagination will be more susceptible to the balls description as lucky. It may be the case that even if such people did not show direct belief in good luck, they are influenced by its mention in context-relevant situations. If this is so, then these people should perform better in the experimental task.
Your contributions to this study are hence very valuable and greatly appreciated. Your responses will be used to help answer the question of whether certain personality traits and attribution styles can be predictors of belief in good luck. This is a question that could greatly benefit those in therapeutic/rehabilitation settings.
If you would like to read a journal article on this general topic, please see:
Day, L., & Maltby, J. (2003) Belief in good luck and psychological well-being: the mediating role of optimism and irrational beliefs. Journal of Applied Social Psychology, 36, 99-110.
To remind you that your responses to all elements of this study are anonymous and confidential – no single responses will be identified in any publication of the results, and only averaged results will be reported.

Sophie Laura Robinson 0908128 - 39 -
Thank you for participating in this study, however, please do not show this debriefing sheet or discuss any aspect of the study with other students. For the study to work it is important that future participants do not have this information or any particular expectations.
If you would like more information, or have further questions about this study, then please feel free to contact Sophie Robinson at, [email protected], or Dr. Niall Galbraith ([email protected]).

Sophie Laura Robinson 0908128 - 40 -
RES 20A (October 2003)
Division of Psychology Ethics Committee: submission of project for approval
This form must be word processed – no handwritten forms can be considered
ALL sections of this form must be completed
No project may commence without authorisation from the Divisional and School
Ethics Committees
CATEGORY A PROJECTS:
There is no significant interference with participants’ physical or psychological
wellbeing. In detail:
• The research procedure is not likely to be stressful or distressing.
• The research materials are not of a sensitive, discriminatory or otherwise
inappropriate nature.
• The participants are not members of a vulnerable group, such as those with a
recognised clinical or psychological or similar condition.
• The research design is sufficiently well-grounded so that the participant’s time is not
wasted.
Projects involving access to confidential records may be considered Category A
provided that the investigator’s access to these is part of his/her normal professional
duties.
Category A projects will be approved by the Psychology Ethics Committee and
monitored by the School Ethics Committee. The School Ethics Committee will not
normally examine individual Category A projects but receives a record of projects that
have been approved at Divisional level.
Title of Project:
Personality and Attribution Style on Belief in Good Luck
Name of Supervisor:
(for all student projects)
Dr. Niall Galbraith
Name of Investigator(s): Sophie Laura Robinson
Location of Research:
(Module code, MPhil/PhD, Staff)
University of Wolverhampton, 6PS004
Qualifications/Expertise of the
investigator relevant to the
submission:
Level 6 psychology student
Participants: Please indicate the
population and number of
participants, the nature of the
participant group and how they
will be recruited.
128 participants is the aim for this research, according to the
highest result of a sample size calculation made using G*Power.
They will be of undergraduate nature in Wolverhampton
University, and recruited using a random opportunity sample.
Continued overleaf
Please attach the following and tick the box* provided to confirm that each has been included:
To be completed by SEC:
Date Received:
Project No:

Sophie Laura Robinson 0908128 - 41 -
*in the case of undergraduate projects, this should be done by supervisors to confirm that each part is properly
constituted Rationale for and expected outcomes of the study: The current study is investigating
various factors that affect or indicate someone’s belief in good luck. More specifically, the
relationships between personality, attribution style, and belief in good luck will be measured;
with hope that if any trends emerge, these can be applied to adaptive treatments and coping
strategies for certain ‘types’ of people. The vast existing amount of cognitive research regards
luck has shown that belief in good luck serves as a positive adaptation, for example, allowing
the individual to feel that they have a sense of control in an otherwise ambiguous situation
(Langer, 1977). This relates to our measure of attribution style by way of locus of control. It
has also already been established by Keinan (1994), and others, that people turn to
superstitions when they experience low levels of perceived control. An aim of this research is
to investigate whether certain people would benefit from use of good luck, as it may be that
more analytical people would not be affected by the use or notion of good luck, such as those
who are low on the openness/imagination trait.
Research has also demonstrated that carrying a lucky charm serves to increase the confidence,
optimism and hope of the individual in a performance related situation (Day & Maltby,
2003). This finding is also relevant to the proposed research as we are interested in
establishing whether those participants who believe most in good luck will perform better in
the experimental task. The experimental task element to this research aims to establish
whether those who show a stronger belief in good luck are more influenced by the
experimenter describing the ball as “lucky”, and hence perform better in the throwing
exercise as research suggests that activating the good luck superstition often leads to
improved performance because this serves to boost self-efficacy. The notion of luck on
performance has been especially researched in the area of sport, for example by Schippers &
Lange (2006).
Moreover, the success of the influence of belief in good luck on sport, demonstrates why
students are a worthy population of study, as they regularly encounter performance situations
such as exams (Womack, 1992).
Regards the personality element to the proposed research, past researchers have focused on
the neurotic trait (Wiseman & Watt, 2004; Day & Maltby, 2003) and established that high
neurotics endorse a stronger belief in luck than non-neurotics.
The positive inferences of good luck belief is why this research is not considering measuring
bad luck alongside, as it has been demonstrated to have no psychological benefits by a great
deal of research (Tobacyk & Shrader, 1991; Dag, 1999), and this study would like to find
those who might best benefit from endorsing the use of good luck.
This study aims to establish if personality variables or attribution style can indicate a belief in
good luck within the general population. The personality variables of particular interest in
this research are imagination, agreeableness and neuroticism. This research will have
implications in the areas of counselling and clinical psychology because it may be beneficial
for people of certain personality or attribution types to encourage within themselves a belief
in good luck during certain situations, or to generally maximise their psychological well-
being. It is predicted that those who highly show the trait of neuroticism, agreeableness,
imagination and/or attribute externally will show a higher belief in good luck. It is also
predicted that those who indicate a higher belief in good luck will perform better in the
experimental task when the ball is described as lucky.
Details of method: Materials: To conduct the study an Achievement and Relationships
Attribution Task, Mini International Personality Item Pool, and Belief in Good Luck
questionnaires will be used.
The validity of the BIGL Scale by Peter R. Drake and Jonathan L. Freedman is shown by the
fact that belief in good luck using the scale has been demonstrated to be distinct from possible
related constructs such as self-esteem, optimism and life-satisfaction. The questions have
been shown to be reliable measures of belief in luck for at least two months after first taking
the questionnaire, indicating that belief in good luck is relatively stable over time. To assess
how much participants believe luck played a role during the ball-throwing exercise, a
question to measure this has been added onto the questionnaire as question ‘p’. We also ask
them to write their score from the experimental exercise here.
The ARAT questionnaire essentially measures attribution style and was created by Miriam
Fornells-Ambrojo and Philippa A. Garety of University College London (2009). The

Sophie Laura Robinson 0908128 - 42 -
questions asked are of every-day situations which are likely to be encountered by most
people; this asserts the tasks face validity. The tasks have also been shown to complement
existing knowledge of the relationship between depression and attribution of events, as well
as literature on paranoia biases; which demonstrates internal validity. Previous tests to assess
reliability found this to be good to very good, with an average Cohen’s kappa value of .83.
The Mini-IPIP is a 20 item short version of the 50-item, 5 factor measure (IPIP-FFM).
Developed by Donnellan et. al. (2006), the scale has had validity proven against other Big
Five measures and its parent scale. Test-retest studies reveal that the IPIP’s reliability
resembles that of the coefficients of the IPIP-FFM.
The experimental task will require a soft, coloured ball and a receptacle in which to throw the
ball.
Design: The laboratory experiment is a between groups design, consisting of throwing a ball
into a receptacle 10 times. The experimental group is condition 1, and condition 2 is the
control group. Results from this task are analysed with the questionnaires using a multiple
linear regression design. In this design, belief in good luck is the dependent variable, and
agreeableness, imagination, neuroticism and external attribution are the predictor variables.
Procedure: From the random opportunity sample, participants will be given the information
sheet to read, then to sign the consent form if they wish to participate. Once this is done they
will be led to a private room. In condition 1; where the experimenter will tell them that they
are to attempt to throw “this lucky yellow ball, because other participants do well with this
ball” into he jar 10 times and remind them that they are under no time pressure to do so. The
control condition will be exactly the same, only the ball will not be described as lucky,
“please throw this ball”. After the experimental task, the participant will be led back into the
first room to complete the three questionnaires: Mini IPIP, BIGL, and ARAT. Answer sheets
to the questionnaires will be marked with a number starting from 1 for means of organisation,
but kept separately from the consent forms in order to preserve participant’s anonymity.
Determination of experimental condition will be as follows: those participants who are even
numbered will be in condition 1 - lucky, and those who are odd numbered will be in condition
2 - the control.
The standard demographic of gender will be asked so as to compare data to other research
and establish any trends. Participants have the right to withdraw up until their data is handed
in as the anonymity of it prevents participants from being identified.
Information sheet* and informed consent form for participants *to include appropriate safeguards for confidentiality and anonymity
Details of how information will be held and disposed of: Held for five years in the
supervisors sealed filing cabinet, to be shredded after these five years.
Details of if/how results will be fed back to participants: The information sheet holds an
email address that participants can request an abstract from if they wish.
Letters requesting, or granting, consent from any collaborating institutions NA
Letters requesting, or granting, consent from head teacher or parents or equivalent, if
participants are under the age of 16
NA
Is ethical approval required from any external body? NO
If yes, which committee?

Sophie Laura Robinson 0908128 - 43 -

Sophie Laura Robinson 0908128 - 44 -

Sophie Laura Robinson 0908128 - 45 -

Sophie Laura Robinson 0908128 - 46 -
REGRESSION
/DESCRIPTIVES MEAN STDDEV CORR SIG N
/MISSING LISTWISE
/STATISTICS COEFF OUTS R ANOVA COLLIN TOL
/CRITERIA=PIN(.05) POUT(.10)
/NOORIGIN
/DEPENDENT GoodLuckBelief
/METHOD=ENTER InternalAttribution OtherPersonAttribution ExternalAttribution Extroversion Agreeableness
Conscientiousness Neuroticism Imagination Gender Condition.
Regression
[DataSet1] C:\Users\Sophie\Documents\SPSSInc\GoodLuckResults1.sav
Descriptive Statistics
Mean Std. Deviation N
GoodLuckBelief 48.5243 11.05587 103
InternalAttribution 5.6117 2.09216 103
OtherPersonAttribution 3.4757 1.65591 103
ExternalAttribution 2.8932 1.52696 103
Extroversion 13.1068 3.47516 103
Agreeableness 17.0000 2.24918 103
Conscientiousness 13.9223 3.51102 103
Neuroticism 12.1942 3.26916 103
Imagination 14.9029 2.85092 103
Gender 1.1650 .37304 103
Condition 1.5049 .50242 103

Sophie Laura Robinson 0908128 - 47 -
Correlations
GoodLuck
Belief
InternalAttri
bution
OtherPerso
nAttribution
ExternalAtt
ribution
Extrovers
ion
Agreeabl
eness
Conscien
tiousnes
s
Neurotici
sm
Imaginati
on Gender
Conditio
n
Pearson
Correlati
on
GoodLuckBelief 1.000 .020 -.035 .005 .079 .000 .006 -.063 -.238 .010 .019
InternalAttribution .020 1.000 -.690 -.621 .011 -.058 .027 -.028 -.038 -.005 .114
OtherPersonAttribution -.035 -.690 1.000 -.135 -.046 .039 -.009 .124 .010 .094 -.103
ExternalAttribution .005 -.621 -.135 1.000 .039 .046 -.022 -.098 .061 -.089 -.031
Extroversion .079 .011 -.046 .039 1.000 -.019 .037 -.254 .045 .017 -.121
Agreeableness .000 -.058 .039 .046 -.019 1.000 .016 .049 .139 -.023 -.069
Conscientiousness .006 .027 -.009 -.022 .037 .016 1.000 -.109 -.001 -.267 .134
Neuroticism -.063 -.028 .124 -.098 -.254 .049 -.109 1.000 -.166 -.139 .023
Imagination -.238 -.038 .010 .061 .045 .139 -.001 -.166 1.000 -.049 -.157
Gender .010 -.005 .094 -.089 .017 -.023 -.267 -.139 -.049 1.000 .179
Condition .019 .114 -.103 -.031 -.121 -.069 .134 .023 -.157 .179 1.000
Sig. (1-
tailed)
GoodLuckBelief . .421 .364 .482 .213 .498 .476 .263 .008 .461 .425
InternalAttribution .421 . .000 .000 .455 .279 .395 .391 .353 .480 .126
OtherPersonAttribution .364 .000 . .087 .321 .346 .465 .106 .461 .173 .150
ExternalAttribution .482 .000 .087 . .347 .323 .414 .163 .271 .185 .377
Extroversion .213 .455 .321 .347 . .425 .356 .005 .327 .434 .112
Agreeableness .498 .279 .346 .323 .425 . .436 .310 .081 .407 .243
Conscientiousness .476 .395 .465 .414 .356 .436 . .137 .497 .003 .089
Neuroticism .263 .391 .106 .163 .005 .310 .137 . .047 .081 .408

Sophie Laura Robinson 0908128 - 48 -
Imagination .008 .353 .461 .271 .327 .081 .497 .047 . .310 .057
Gender .461 .480 .173 .185 .434 .407 .003 .081 .310 . .035
Condition .425 .126 .150 .377 .112 .243 .089 .408 .057 .035 .
N GoodLuckBelief 103 103 103 103 103 103 103 103 103 103 103
InternalAttribution 103 103 103 103 103 103 103 103 103 103 103
OtherPersonAttribution 103 103 103 103 103 103 103 103 103 103 103
ExternalAttribution 103 103 103 103 103 103 103 103 103 103 103
Extroversion 103 103 103 103 103 103 103 103 103 103 103
Agreeableness 103 103 103 103 103 103 103 103 103 103 103
Conscientiousness 103 103 103 103 103 103 103 103 103 103 103
Neuroticism 103 103 103 103 103 103 103 103 103 103 103
Imagination 103 103 103 103 103 103 103 103 103 103 103
Gender 103 103 103 103 103 103 103 103 103 103 103
Condition 103 103 103 103 103 103 103 103 103 103 103

Sophie Laura Robinson 0908128 - 49 -
Variables Entered/Removedb
Model Variables Entered
Variables
Removed Method
1 Condition, Neuroticism,
Agreeableness,
ExternalAttribution,
Conscientiousness,
OtherPersonAttribution,
Imagination,
Extroversion, Gender,
InternalAttribution
. Enter
a. All requested variables entered.
b. Dependent Variable: GoodLuckBelief
Model Summary
Model R R Square
Adjusted R
Square
Std. Error of the
Estimate
1 .273a .075 -.026 11.19913
a. Predictors: (Constant), Condition, Neuroticism, Agreeableness,
ExternalAttribution, Conscientiousness, OtherPersonAttribution,
Imagination, Extroversion, Gender, InternalAttribution
ANOVAb
Model Sum of Squares df Mean Square F Sig.
1 Regression 929.004 10 92.900 .741 .684a
Residual 11538.685 92 125.420
Total 12467.689 102
a. Predictors: (Constant), Condition, Neuroticism, Agreeableness, ExternalAttribution,
Conscientiousness, OtherPersonAttribution, Imagination, Extroversion, Gender,
InternalAttribution
b. Dependent Variable: GoodLuckBelief
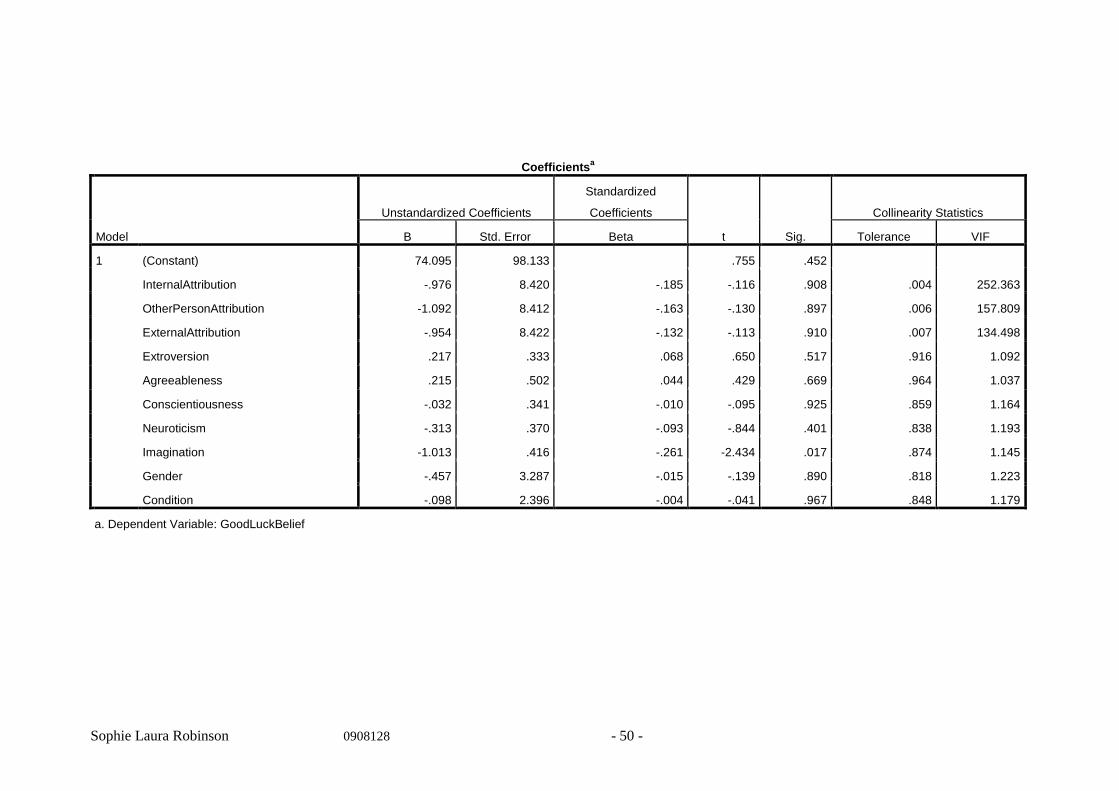
Sophie Laura Robinson 0908128 - 50 -
Coefficientsa
Model
Unstandardized Coefficients
Standardized
Coefficients
t Sig.
Collinearity Statistics
B Std. Error Beta Tolerance VIF
1 (Constant) 74.095 98.133 .755 .452
InternalAttribution -.976 8.420 -.185 -.116 .908 .004 252.363
OtherPersonAttribution -1.092 8.412 -.163 -.130 .897 .006 157.809
ExternalAttribution -.954 8.422 -.132 -.113 .910 .007 134.498
Extroversion .217 .333 .068 .650 .517 .916 1.092
Agreeableness .215 .502 .044 .429 .669 .964 1.037
Conscientiousness -.032 .341 -.010 -.095 .925 .859 1.164
Neuroticism -.313 .370 -.093 -.844 .401 .838 1.193
Imagination -1.013 .416 -.261 -2.434 .017 .874 1.145
Gender -.457 3.287 -.015 -.139 .890 .818 1.223
Condition -.098 2.396 -.004 -.041 .967 .848 1.179
a. Dependent Variable: GoodLuckBelief

Sophie Laura Robinson 0908128 - 51 -
Collinearity Diagnosticsa
M
od
el
Dim
ensi
on
Eigenval
ue
Conditio
n Index
Variance Proportions
(Constan
t)
InternalA
ttribution
OtherPerso
nAttribution
External
Attributio
n
Extrover
sion
Agreeablen
ess
Conscientio
usness
Neuroticis
m
Imaginati
on Gender
Conditio
n
1 1 10.080 1.000 .00 .00 .00 .00 .00 .00 .00 .00 .00 .00 .00
2 .294 5.851 .00 .00 .00 .00 .00 .00 .00 .00 .00 .00 .00
3 .230 6.618 .00 .00 .00 .00 .00 .00 .00 .00 .00 .00 .00
4 .107 9.713 .00 .00 .00 .00 .03 .00 .04 .01 .01 .31 .25
5 .096 10.244 .00 .00 .00 .00 .14 .00 .03 .09 .01 .18 .26
6 .077 11.441 .00 .00 .00 .00 .08 .00 .16 .33 .00 .04 .14
7 .049 14.382 .00 .00 .00 .00 .61 .01 .15 .10 .09 .07 .11
8 .037 16.437 .00 .00 .00 .00 .00 .01 .43 .07 .34 .24 .17
9 .019 23.251 .00 .00 .00 .00 .05 .44 .10 .24 .42 .08 .00
10 .011 30.910 .00 .01 .01 .01 .10 .54 .08 .14 .10 .08 .03
11 8.762E-5 339.185 1.00 .99 .98 .99 .00 .00 .00 .00 .04 .00 .02
a. Dependent Variable: GoodLuckBelief

Sophie Laura Robinson 0908128 - 52 -
REGRESSION
/DESCRIPTIVES MEAN STDDEV CORR SIG N
/MISSING LISTWISE
/STATISTICS COEFF OUTS R ANOVA COLLIN TOL CHANGE
/CRITERIA=PIN(.05) POUT(.10)
/NOORIGIN
/DEPENDENT GoodLuckBelief
/METHOD=BACKWARD InternalAttribution OtherPersonAttribution ExternalAttribution Extroversion Agreeableness
Conscientiousness Neuroticism Imagination Gender Condition.
Regression [DataSet1] C:\Users\Sophie\Documents\SPSSInc\GoodLuckResults1.sav
Descriptive Statistics
Mean Std. Deviation N
GoodLuckBelief 48.5243 11.05587 103
InternalAttribution 5.6117 2.09216 103
OtherPersonAttribution 3.4757 1.65591 103
ExternalAttribution 2.8932 1.52696 103
Extroversion 13.1068 3.47516 103
Agreeableness 17.0000 2.24918 103
Conscientiousness 13.9223 3.51102 103
Neuroticism 12.1942 3.26916 103
Imagination 14.9029 2.85092 103
Gender 1.1650 .37304 103
Condition 1.5049 .50242 103

Sophie Laura Robinson 0908128 - 53 -
Correlations
GoodLuck
Belief
InternalA
ttribution
OtherPer
sonAttrib
ution
External
Attributio
n
Extrover
sion
Agreeabl
eness
Conscien
tiousnes
s
Neurotici
sm Imagination Gender
Conditio
n
Pearson
Correlati
on
GoodLuckBelief 1.000 .020 -.035 .005 .079 .000 .006 -.063 -.238 .010 .019
InternalAttribution .020 1.000 -.690 -.621 .011 -.058 .027 -.028 -.038 -.005 .114
OtherPersonAttribution -.035 -.690 1.000 -.135 -.046 .039 -.009 .124 .010 .094 -.103
ExternalAttribution .005 -.621 -.135 1.000 .039 .046 -.022 -.098 .061 -.089 -.031
Extroversion .079 .011 -.046 .039 1.000 -.019 .037 -.254 .045 .017 -.121
Agreeableness .000 -.058 .039 .046 -.019 1.000 .016 .049 .139 -.023 -.069
Conscientiousness .006 .027 -.009 -.022 .037 .016 1.000 -.109 -.001 -.267 .134
Neuroticism -.063 -.028 .124 -.098 -.254 .049 -.109 1.000 -.166 -.139 .023
Imagination -.238 -.038 .010 .061 .045 .139 -.001 -.166 1.000 -.049 -.157
Gender .010 -.005 .094 -.089 .017 -.023 -.267 -.139 -.049 1.000 .179
Condition .019 .114 -.103 -.031 -.121 -.069 .134 .023 -.157 .179 1.000
Sig. (1-
tailed)
GoodLuckBelief . .421 .364 .482 .213 .498 .476 .263 .008 .461 .425
InternalAttribution .421 . .000 .000 .455 .279 .395 .391 .353 .480 .126
OtherPersonAttribution .364 .000 . .087 .321 .346 .465 .106 .461 .173 .150
ExternalAttribution .482 .000 .087 . .347 .323 .414 .163 .271 .185 .377
Extroversion .213 .455 .321 .347 . .425 .356 .005 .327 .434 .112
Agreeableness .498 .279 .346 .323 .425 . .436 .310 .081 .407 .243
Conscientiousness .476 .395 .465 .414 .356 .436 . .137 .497 .003 .089
Neuroticism .263 .391 .106 .163 .005 .310 .137 . .047 .081 .408

Sophie Laura Robinson 0908128 - 54 -
Imagination .008 .353 .461 .271 .327 .081 .497 .047 . .310 .057
Gender .461 .480 .173 .185 .434 .407 .003 .081 .310 . .035
Condition .425 .126 .150 .377 .112 .243 .089 .408 .057 .035 .
N GoodLuckBelief 103 103 103 103 103 103 103 103 103 103 103
InternalAttribution 103 103 103 103 103 103 103 103 103 103 103
OtherPersonAttribution 103 103 103 103 103 103 103 103 103 103 103
ExternalAttribution 103 103 103 103 103 103 103 103 103 103 103
Extroversion 103 103 103 103 103 103 103 103 103 103 103
Agreeableness 103 103 103 103 103 103 103 103 103 103 103
Conscientiousness 103 103 103 103 103 103 103 103 103 103 103
Neuroticism 103 103 103 103 103 103 103 103 103 103 103
Imagination 103 103 103 103 103 103 103 103 103 103 103
Gender 103 103 103 103 103 103 103 103 103 103 103
Condition 103 103 103 103 103 103 103 103 103 103 103

Sophie Laura Robinson 0908128 - 55 -
Variables Entered/Removedb
Model Variables Entered Variables Removed Method
1 Condition, Neuroticism,
Agreeableness,
ExternalAttribution,
Conscientiousness,
OtherPersonAttribution,
Imagination, Extroversion,
Gender, InternalAttribution
. Enter
2 . Condition Backward (criterion: Probability of F-
to-remove >= .100).
3 . Conscientiousness Backward (criterion: Probability of F-
to-remove >= .100).
4 . Gender Backward (criterion: Probability of F-
to-remove >= .100).
5 . ExternalAttribution Backward (criterion: Probability of F-
to-remove >= .100).
6 . InternalAttribution Backward (criterion: Probability of F-
to-remove >= .100).
7 . OtherPersonAttribution Backward (criterion: Probability of F-
to-remove >= .100).
8 . Agreeableness Backward (criterion: Probability of F-
to-remove >= .100).
9 . Extroversion Backward (criterion: Probability of F-
to-remove >= .100).
10 . Neuroticism Backward (criterion: Probability of F-
to-remove >= .100).
a. All requested variables entered.
b. Dependent Variable: GoodLuckBelief

Sophie Laura Robinson 0908128 - 56 -
Model Summary
Model R R
Square
Adjusted R
Square
Std. Error of
the Estimate
Change Statistics
R Square Change
F Change df1 df2
Sig. F Change
1 .273 .075 -.026 11.19913 .075 .741 10 92 .684
2 .273 .074 -.015 11.13886 .000 .002 1 92 .967
3 .273 .074 -.004 11.08011 .000 .011 1 93 .916
4 .272 .074 .006 11.02260 .000 .016 1 94 .899
5 .272 .074 .016 10.96622 .000 .021 1 95 .886
6 .272 .074 .026 10.90974 .000 .003 1 96 .954
7 .271 .074 .036 10.85614 .000 .039 1 97 .843
8 .268 .072 .044 10.81151 -.002 .188 1 98 .666
9 .260 .067 .049 10.78263 -.004 .466 1 99 .496
10 .238 .057 .047 10.79155 -.011 1.167 1 100 .283
a. Predictors: (Constant), Condition, Neuroticism, Agreeableness, ExternalAttribution, Conscientiousness, OtherPersonAttribution, Imagination, Extroversion, Gender,
InternalAttribution
b. Predictors: (Constant), Neuroticism, Agreeableness, ExternalAttribution, Conscientiousness, OtherPersonAttribution, Imagination, Extroversion, Gender, InternalAttribution
c. Predictors: (Constant), Neuroticism, Agreeableness, ExternalAttribution, OtherPersonAttribution, Imagination, Extroversion, Gender, InternalAttribution
d. Predictors: (Constant), Neuroticism, Agreeableness, ExternalAttribution, OtherPersonAttribution, Imagination, Extroversion, InternalAttribution
e. Predictors: (Constant), Neuroticism, Agreeableness, OtherPersonAttribution, Imagination, Extroversion, InternalAttribution
f. Predictors: (Constant), Neuroticism, Agreeableness, OtherPersonAttribution, Imagination, Extroversion
g. Predictors: (Constant), Neuroticism, Agreeableness, Imagination, Extroversion
h. Predictors: (Constant), Neuroticism, Imagination, Extroversion
i. Predictors: (Constant), Neuroticism, Imagination
j. Predictors: (Constant), Imagination

Sophie Laura Robinson 0908128 - 57 -
ANOVAk
Model Sum of Squares df
Mean Square F Sig.
1 Regression 929.004 10 92.900 .741 .684
Residual 11538.685 92 125.420
Total 12467.689 102
2 Regression 928.793 9 103.199 .832 .589
Residual 11538.896 93 124.074
Total 12467.689 102
3 Regression 927.410 8 115.926 .944 .484
Residual 11540.279 94 122.769
Total 12467.689 102
4 Regression 925.406 7 132.201 1.088 .377
Residual 11542.283 95 121.498
Total 12467.689 102
5 Regression 922.914 6 153.819 1.279 .274
Residual 11544.775 96 120.258
Total 12467.689 102
6 Regression 922.507 5 184.501 1.550 .182
Residual 11545.182 97 119.022
Total 12467.689 102
7 Regression 917.833 4 229.458 1.947 .109
Residual 11549.856 98 117.856
Total 12467.689 102
8 Regression 895.695 3 298.565 2.554 .060
Residual 11571.994 99 116.889
Total 12467.689 102
9 Regression 841.188 2 420.594 3.618 .030
Residual 11626.501 100 116.265
Total 12467.689 102
10 Regression 705.468 1 705.468 6.058 .016
Residual 11762.221 101 116.458
Total 12467.689 102
a. Predictors: (Constant), Condition, Neuroticism, Agreeableness, ExternalAttribution,
Conscientiousness, OtherPersonAttribution, Imagination, Extroversion, Gender, InternalAttribution
b. Predictors: (Constant), Neuroticism, Agreeableness, ExternalAttribution, Conscientiousness,
OtherPersonAttribution, Imagination, Extroversion, Gender, InternalAttribution
c. Predictors: (Constant), Neuroticism, Agreeableness, ExternalAttribution, OtherPersonAttribution,
Imagination, Extroversion, Gender, InternalAttribution
d. Predictors: (Constant), Neuroticism, Agreeableness, ExternalAttribution, OtherPersonAttribution,
Imagination, Extroversion, InternalAttribution
e. Predictors: (Constant), Neuroticism, Agreeableness, OtherPersonAttribution, Imagination,
Extroversion, InternalAttribution
f. Predictors: (Constant), Neuroticism, Agreeableness, OtherPersonAttribution, Imagination,
Extroversion

Sophie Laura Robinson 0908128 - 58 -
Coefficientsa
Model
Unstandardized
Coefficients
Standardized
Coefficients
t Sig.
Collinearity
Statistics
B
Std.
Error Beta Tolerance VIF
1 (Constant) 74.095 98.133 .755 .452
InternalAttribution -.976 8.420 -.185 -.116 .908 .004 252.363
OtherPersonAttribution -1.092 8.412 -.163 -.130 .897 .006 157.809
ExternalAttribution -.954 8.422 -.132 -.113 .910 .007 134.498
Extroversion .217 .333 .068 .650 .517 .916 1.092
Agreeableness .215 .502 .044 .429 .669 .964 1.037
Conscientiousness -.032 .341 -.010 -.095 .925 .859 1.164
Neuroticism -.313 .370 -.093 -.844 .401 .838 1.193
Imagination -1.013 .416 -.261 -2.434 .017 .874 1.145
Gender -.457 3.287 -.015 -.139 .890 .818 1.223
Condition -.098 2.396 -.004 -.041 .967 .848 1.179
2 (Constant) 74.648 96.680 .772 .442
InternalAttribution -1.036 8.246 -.196 -.126 .900 .004 244.652
OtherPersonAttribution -1.148 8.255 -.172 -.139 .890 .007 153.614
ExternalAttribution -1.014 8.249 -.140 -.123 .902 .008 130.435
Extroversion .219 .329 .069 .665 .508 .933 1.072
Agreeableness .216 .498 .044 .434 .665 .968 1.033
Conscientiousness -.035 .332 -.011 -.106 .916 .893 1.120
Neuroticism -.313 .368 -.093 -.851 .397 .840 1.191
Imagination -1.010 .408 -.260 -2.473 .015 .897 1.114
Gender -.487 3.185 -.016 -.153 .879 .862 1.160
3 (Constant) 74.861 96.150 .779 .438
InternalAttribution -1.113 8.170 -.211 -.136 .892 .004 242.718
OtherPersonAttribution -1.227 8.177 -.184 -.150 .881 .007 152.333
ExternalAttribution -1.086 8.177 -.150 -.133 .895 .008 129.534
Extroversion .219 .327 .069 .669 .505 .933 1.072
Agreeableness .215 .496 .044 .435 .665 .968 1.033
Neuroticism -.307 .361 -.091 -.850 .398 .863 1.158
Imagination -1.007 .405 -.260 -2.485 .015 .901 1.110
Gender -.386 3.020 -.013 -.128 .899 .948 1.055
4 (Constant) 75.238 95.606 .787 .433
InternalAttribution -1.197 8.101 -.227 -.148 .883 .004 241.148
OtherPersonAttribution -1.320 8.103 -.198 -.163 .871 .007 151.133
ExternalAttribution -1.162 8.114 -.160 -.143 .886 .008 128.857
Extroversion .219 .325 .069 .675 .501 .933 1.071

Sophie Laura Robinson 0908128 - 59 -
Agreeableness .216 .493 .044 .438 .662 .968 1.033
Neuroticism -.299 .354 -.088 -.845 .400 .889 1.124
Imagination -1.003 .402 -.259 -2.496 .014 .908 1.101
5 (Constant) 61.685 13.500 4.569 .000
InternalAttribution -.042 .721 -.008 -.058 .954 .518 1.929
OtherPersonAttribution -.167 .916 -.025 -.183 .856 .512 1.953
Extroversion .217 .323 .068 .673 .503 .935 1.069
Agreeableness .211 .490 .043 .432 .667 .973 1.028
Neuroticism -.300 .352 -.089 -.852 .396 .890 1.124
Imagination -1.015 .391 -.262 -2.596 .011 .949 1.053
6 (Constant) 61.309 11.791 5.199 .000
OtherPersonAttribution -.130 .658 -.020 -.198 .843 .983 1.018
Extroversion .217 .321 .068 .677 .500 .935 1.069
Agreeableness .213 .487 .043 .437 .663 .974 1.026
Neuroticism -.302 .349 -.089 -.863 .390 .895 1.118
Imagination -1.014 .389 -.262 -2.609 .011 .950 1.053
7 (Constant) 61.020 11.644 5.241 .000
Extroversion .218 .320 .069 .683 .496 .936 1.069
Agreeableness .210 .484 .043 .433 .666 .975 1.025
Neuroticism -.310 .345 -.092 -.897 .372 .907 1.102
Imagination -1.016 .387 -.262 -2.628 .010 .951 1.052
8 (Constant) 64.097 9.191 6.974 .000
Extroversion .217 .318 .068 .683 .496 .936 1.069
Neuroticism -.299 .343 -.088 -.872 .385 .912 1.097
Imagination -.991 .381 -.256 -2.603 .011 .972 1.028
9 (Constant) 67.652 7.555 8.955 .000
Neuroticism -.358 .331 -.106 -1.080 .283 .972 1.028
Imagination -.991 .380 -.255 -2.609 .010 .972 1.028
10 (Constant) 62.272 5.686 10.952 .000
Imagination -.922 .375 -.238 -2.461 .016 1.000 1.000
a. Dependent Variable: GoodLuckBelief

Sophie Laura Robinson 0908128 - 60 -
Collinearity Diagnosticsa
Model
Dimensio
n
Eigenval
ue
Condition
Index
Variance Proportions
(Constan
t)
InternalAt
tribution
OtherPer
sonAttrib
ution
ExternalAttr
ibution
Extrovers
ion
Agreeable
ness
Conscien
tiousness
Neuroticis
m
Imaginat
ion Gender
Conditio
n
1 1 10.080 1.000 .00 .00 .00 .00 .00 .00 .00 .00 .00 .00 .00
2 .294 5.851 .00 .00 .00 .00 .00 .00 .00 .00 .00 .00 .00
3 .230 6.618 .00 .00 .00 .00 .00 .00 .00 .00 .00 .00 .00
4 .107 9.713 .00 .00 .00 .00 .03 .00 .04 .01 .01 .31 .25
5 .096 10.244 .00 .00 .00 .00 .14 .00 .03 .09 .01 .18 .26
6 .077 11.441 .00 .00 .00 .00 .08 .00 .16 .33 .00 .04 .14
7 .049 14.382 .00 .00 .00 .00 .61 .01 .15 .10 .09 .07 .11
8 .037 16.437 .00 .00 .00 .00 .00 .01 .43 .07 .34 .24 .17
9 .019 23.251 .00 .00 .00 .00 .05 .44 .10 .24 .42 .08 .00
10 .011 30.910 .00 .01 .01 .01 .10 .54 .08 .14 .10 .08 .03
11 8.762E-5 339.185 1.00 .99 .98 .99 .00 .00 .00 .00 .04 .00 .02
2 1 9.173 1.000 .00 .00 .00 .00 .00 .00 .00 .00 .00 .00
2 .291 5.616 .00 .00 .00 .00 .00 .00 .00 .00 .00 .00
3 .229 6.323 .00 .00 .00 .00 .00 .00 .00 .00 .00 .00
4 .102 9.503 .00 .00 .00 .00 .00 .00 .08 .06 .00 .55
5 .081 10.614 .00 .00 .00 .00 .25 .00 .07 .34 .00 .03
6 .053 13.110 .00 .00 .00 .00 .52 .00 .37 .11 .00 .09
7 .041 14.983 .00 .00 .00 .00 .10 .01 .23 .09 .46 .09

Sophie Laura Robinson 0908128 - 61 -
8 .019 22.157 .00 .00 .00 .00 .05 .43 .12 .26 .42 .11
9 .011 29.071 .00 .01 .01 .01 .08 .55 .12 .15 .08 .12
10 8.959E-5 319.971 1.00 .99 .98 .99 .00 .00 .00 .00 .03 .00
3 1 8.234 1.000 .00 .00 .00 .00 .00 .00 .00 .00 .00
2 .290 5.329 .00 .00 .00 .00 .00 .00 .00 .00 .00
3 .229 5.993 .00 .00 .00 .00 .00 .00 .00 .00 .00
4 .094 9.351 .00 .00 .00 .00 .02 .00 .22 .00 .53
5 .075 10.471 .00 .00 .00 .00 .40 .00 .15 .01 .31
6 .045 13.582 .00 .00 .00 .00 .41 .01 .25 .31 .03
7 .021 19.952 .00 .00 .00 .00 .09 .24 .30 .60 .07
8 .012 26.394 .00 .01 .01 .01 .07 .74 .08 .05 .05
9 8.975E-5 302.893 1.00 .99 .99 .99 .00 .00 .00 .03 .00
4 1 7.322 1.000 .00 .00 .00 .00 .00 .00 .00 .00
2 .289 5.036 .00 .00 .00 .00 .00 .00 .00 .00
3 .228 5.668 .00 .00 .00 .00 .00 .00 .00 .00
4 .081 9.496 .00 .00 .00 .00 .33 .00 .38 .01
5 .045 12.694 .00 .00 .00 .00 .50 .01 .27 .25
6 .022 18.234 .00 .00 .00 .00 .11 .16 .29 .68
7 .012 24.377 .00 .01 .01 .01 .06 .83 .05 .02
8 8.994E-5 285.323 1.00 .99 .99 .99 .00 .00 .00 .03
5 1 6.547 1.000 .00 .00 .00 .00 .00 .00 .00
2 .259 5.028 .00 .10 .22 .00 .00 .00 .00
3 .084 8.845 .00 .02 .00 .34 .00 .34 .01
4 .046 11.937 .00 .10 .09 .47 .00 .36 .17

Sophie Laura Robinson 0908128 - 62 -
5 .040 12.834 .00 .54 .51 .01 .02 .06 .28
6 .019 18.523 .01 .04 .03 .05 .56 .13 .42
7 .005 35.381 .99 .20 .14 .13 .41 .11 .13
6 1 5.689 1.000 .00 .00 .00 .00 .00 .00
2 .159 5.976 .00 .93 .03 .00 .00 .01
3 .081 8.367 .00 .05 .27 .00 .43 .00
4 .045 11.264 .00 .00 .46 .02 .20 .33
5 .020 17.002 .02 .00 .07 .47 .20 .52
6 .006 29.940 .98 .01 .16 .51 .16 .14
7 1 4.846 1.000 .00 .00 .00 .00 .00
2 .084 7.617 .00 .31 .00 .40 .01
3 .045 10.392 .00 .46 .02 .21 .33
4 .020 15.679 .02 .07 .46 .21 .52
5 .006 27.543 .98 .15 .52 .17 .14
8 1 3.863 1.000 .00 .00 .00 .00
2 .083 6.804 .00 .30 .42 .01
3 .043 9.447 .00 .42 .16 .45
4 .010 19.797 1.00 .28 .42 .54
9 1 2.927 1.000 .00 .01 .00
2 .061 6.943 .01 .64 .21
3 .013 15.170 .99 .35 .79
10 1 1.982 1.000 .01 .01
2 .018 10.600 .99 .99
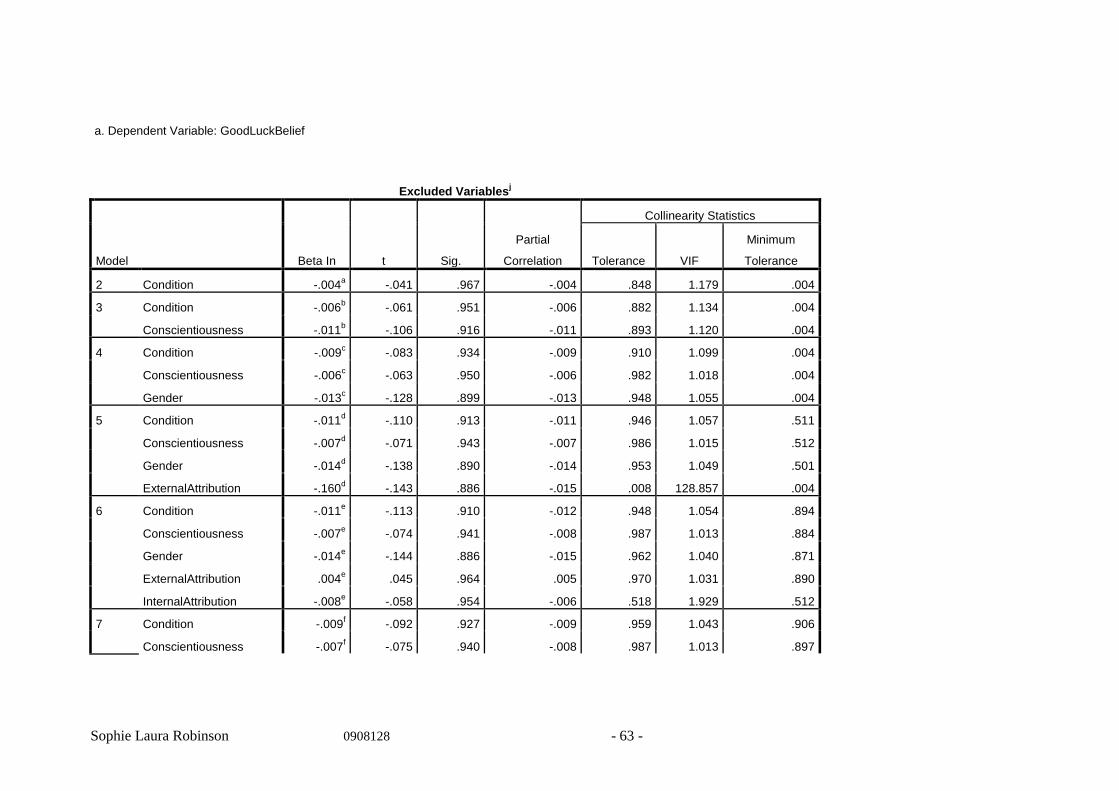
Sophie Laura Robinson 0908128 - 63 -
a. Dependent Variable: GoodLuckBelief
Excluded Variablesj
Model Beta In t Sig.
Partial
Correlation
Collinearity Statistics
Tolerance VIF
Minimum
Tolerance
2 Condition -.004a -.041 .967 -.004 .848 1.179 .004
3 Condition -.006b -.061 .951 -.006 .882 1.134 .004
Conscientiousness -.011b -.106 .916 -.011 .893 1.120 .004
4 Condition -.009c -.083 .934 -.009 .910 1.099 .004
Conscientiousness -.006c -.063 .950 -.006 .982 1.018 .004
Gender -.013c -.128 .899 -.013 .948 1.055 .004
5 Condition -.011d -.110 .913 -.011 .946 1.057 .511
Conscientiousness -.007d -.071 .943 -.007 .986 1.015 .512
Gender -.014d -.138 .890 -.014 .953 1.049 .501
ExternalAttribution -.160d -.143 .886 -.015 .008 128.857 .004
6 Condition -.011e -.113 .910 -.012 .948 1.054 .894
Conscientiousness -.007e -.074 .941 -.008 .987 1.013 .884
Gender -.014e -.144 .886 -.015 .962 1.040 .871
ExternalAttribution .004e .045 .964 .005 .970 1.031 .890
InternalAttribution -.008e -.058 .954 -.006 .518 1.929 .512
7 Condition -.009f -.092 .927 -.009 .959 1.043 .906
Conscientiousness -.007f -.075 .940 -.008 .987 1.013 .897

Sophie Laura Robinson 0908128 - 64 -
Gender -.016f -.167 .868 -.017 .975 1.026 .887
ExternalAttribution .007f .070 .944 .007 .986 1.014 .900
InternalAttribution .009f .095 .925 .010 .995 1.005 .906
OtherPersonAttribution -.020f -.198 .843 -.020 .983 1.018 .895
8 Condition -.011g -.114 .910 -.012 .961 1.040 .911
Conscientiousness -.006g -.064 .949 -.007 .988 1.012 .902
Gender -.017g -.170 .865 -.017 .975 1.026 .891
ExternalAttribution .009g .090 .929 .009 .988 1.012 .905
InternalAttribution .007g .073 .942 .007 .997 1.003 .911
OtherPersonAttribution -.018g -.186 .853 -.019 .983 1.017 .898
Agreeableness .043g .433 .666 .044 .975 1.025 .907
9 Condition -.019h -.195 .846 -.020 .975 1.025 .949
Conscientiousness -.006h -.058 .954 -.006 .988 1.012 .960
Gender -.018h -.184 .855 -.018 .975 1.025 .951
ExternalAttribution .010h .100 .921 .010 .988 1.012 .965
InternalAttribution .007h .076 .939 .008 .997 1.003 .971
OtherPersonAttribution -.019h -.197 .844 -.020 .984 1.017 .957
Agreeableness .042h .430 .668 .043 .975 1.025 .951
Extroversion .068h .683 .496 .068 .936 1.069 .912
10 Condition -.019i -.192 .848 -.019 .975 1.025 .975
Conscientiousness .006i .061 .951 .006 1.000 1.000 1.000
Gender -.002i -.021 .983 -.002 .998 1.002 .998
ExternalAttribution .019i .195 .845 .020 .996 1.004 .996
InternalAttribution .011i .113 .910 .011 .999 1.001 .999

Sophie Laura Robinson 0908128 - 65 -
OtherPersonAttribution -.032i -.333 .740 -.033 1.000 1.000 1.000
Agreeableness .034i .348 .728 .035 .981 1.020 .981
Extroversion .090i .932 .354 .093 .998 1.002 .998
Neuroticism -.106i -1.080 .283 -.107 .972 1.028 .972
a. Predictors in the Model: (Constant), Neuroticism, Agreeableness, ExternalAttribution, Conscientiousness, OtherPersonAttribution,
Imagination, Extroversion, Gender, InternalAttribution
b. Predictors in the Model: (Constant), Neuroticism, Agreeableness, ExternalAttribution, OtherPersonAttribution, Imagination,
Extroversion, Gender, InternalAttribution
c. Predictors in the Model: (Constant), Neuroticism, Agreeableness, ExternalAttribution, OtherPersonAttribution, Imagination,
Extroversion, InternalAttribution
d. Predictors in the Model: (Constant), Neuroticism, Agreeableness, OtherPersonAttribution, Imagination, Extroversion,
InternalAttribution
e. Predictors in the Model: (Constant), Neuroticism, Agreeableness, OtherPersonAttribution, Imagination, Extroversion
f. Predictors in the Model: (Constant), Neuroticism, Agreeableness, Imagination, Extroversion
g. Predictors in the Model: (Constant), Neuroticism, Imagination, Extroversion
h. Predictors in the Model: (Constant), Neuroticism, Imagination
i. Predictors in the Model: (Constant), Imagination
j. Dependent Variable: GoodLuckBelief

Sophie Laura Robinson 0908128 - 66 -
UNIANOVA BallTaskScore BY Condition Gender WITH GoodLuckBelief
/METHOD=SSTYPE(3)
/INTERCEPT=INCLUDE
/EMMEANS=TABLES(Condition) WITH(GoodLuckBelief=MEAN)
/EMMEANS=TABLES(OVERALL) WITH(GoodLuckBelief=MEAN)
/EMMEANS=TABLES(Gender) WITH(GoodLuckBelief=MEAN)
/EMMEANS=TABLES(Condition*Gender) WITH(GoodLuckBelief=MEAN)
/PRINT=ETASQ HOMOGENEITY
/CRITERIA=ALPHA(.05)
/DESIGN=GoodLuckBelief Condition Gender Condition*Gender.
Univariate Analysis of Variance
[DataSet1] E:\Uni\GoodLuckResults1.sav
Between-Subjects Factors
Value Label N
Condition 1.00 Luck 51
2.00 No Luck 52
Gender 1.00 Female 86
2.00 Male 17
Levene's Test of Equality of Error Variancesa
Dependent Variable:BallTaskScore
F df1 df2 Sig.
1.471 3 99 .227
Tests the null hypothesis that the error variance of the dependent variable is equal across groups.
a. Design: Intercept + GoodLuckBelief + Condition + Gender + Condition * Gender
Descriptive Statistics
Dependent Variable:BallTaskScore
Gender Condition Mean Std. Deviation N
Female Luck 5.9130 1.65766 46
No Luck 5.3750 1.93069 40
Total 5.6628 1.79941 86
Male Luck 4.8000 .83666 5
No Luck 5.8333 1.94625 12
Total 5.5294 1.73629 17
Total Luck 5.8039 1.62505 51
No Luck 5.4808 1.92497 52
Total 5.6408 1.78146 103

Sophie Laura Robinson 0908128 - 67 -
Tests of Between-Subjects Effects
Dependent Variable:BallTaskScore
Source
Type III Sum of
Squares df Mean Square F Sig. Partial Eta Squared
Corrected Model 10.216a 4 2.554 .798 .529 .032
Intercept 145.182 1 145.182 45.385 .000 .317
GoodLuckBelief .002 1 .002 .000 .982 .000
Condition .745 1 .745 .233 .631 .002
Gender 1.300 1 1.300 .406 .525 .004
Condition * Gender 7.471 1 7.471 2.335 .130 .023
Error 313.492 98 3.199
Total 3601.000 103
Corrected Total 323.709 102
a. R Squared = .032 (Adjusted R Squared = -.008)
*Nonparametric Tests: One Sample.
NPTESTS
/ONESAMPLE TEST (Condition InternalAttribution
OtherPersonAttribution ExternalAttribution Extroversion Agreeableness
Conscientiousness Neuroticism Imagination GoodLuckBelief
BallTaskScore Gender)
/MISSING SCOPE=ANALYSIS USERMISSING=EXCLUDE
/CRITERIA ALPHA=0.05 CILEVEL=95.
Nonparametric Tests
[DataSet1] E:\Uni\GoodLuckResults1.sav

Sophie Laura Robinson 0908128 - 68 -