AHens Arthur Robinson
69
1 -1- AHens Arthur Robinson 23 July 2009 Mr David Hatfiefd/Mr Simon M.rtch6lI DirectorProject Officer, Adjudications Australian Competition and Consumer Commission 23 Marcus Clarke Street Canberra ACT 2601 Dear Mr Hatfield and Mr Mitchell ABN 47 770 595 ;158 Led27 530 blliris Street Melbourne VIC 3000 Australia Comspondence GPO Box 1776Q Malburne VIC 3D01 Australia DX 30999 Melbourne www.aar.com.au Authorisation applications AS? 139 - A91 140 As you are aware, we act for Chevron Australia Pty Ltd, Chevron (TAPL) Pty Ltd, Mobil Australia ResourcesCompany Pty Limited and Shell Development(Australia) Pty Ltd (the Pardlcipants), who are joint ventwers in the Gorgon Gas Project (the Project). As foreshadowed in the submission filed in support of authorisation applicatiins.A91139 - A91140 an 20 May 2009, the Participantshave commissioned an economic report to model the public benefiis of the Project. The Participants are now able to provide the report prepared by AClL Tasman. The findings of the AClL Tasman repart will be discussed In the reply submission which the Parficipants intend to file with the ACCC by 31 July 2009. Yours sincerely Verity Qulnn Senior Associate [email protected] .au T +61 3 9613 8865 David Brewster Partner ' [email protected] T +61 3 961 3 8707 Our Ref 3061 59908:306155QO8 vaqm A0112892062~1 306155908 a.72009 Banglmk Baijin# Baijing IP Brlsbans Hanoi Ho Chi Mlnh Elty Hang Kong Jakarta Melbourne Pert h Phnm Psnh f'ad Momw Shanghai Singapore Sydney
-
Upload
khangminh22 -
Category
Documents
-
view
0 -
download
0
Transcript of AHens Arthur Robinson
1 -1- AHens Arthur Robinson
23 July 2009
Mr David Hatfiefd/Mr Simon M.rtch6lI DirectorProject Officer, Adjudications Australian Competition and Consumer Commission 23 Marcus Clarke Street Canberra ACT 2601
Dear Mr Hatfield and Mr Mitchell
ABN 47 770 595 ;158
Led27 530 blliris Street
Melbourne VIC 3000 Australia
Comspondence GPO Box 1776Q
Malburne VIC 3D01 Australia
DX 30999 Melbourne
www.aar.com.au
Authorisation applications AS? 139 - A91 140 As you are aware, we act for Chevron Australia Pty Ltd, Chevron (TAPL) Pty Ltd, Mobil Australia Resources Company Pty Limited and Shell Development (Australia) Pty Ltd (the Pardlcipants), who are joint ventwers in the Gorgon Gas Project (the Project).
As foreshadowed in the submission filed in support of authorisation applicatiins.A91139 - A91 140 an 20 May 2009, the Participants have commissioned an economic report to model the public benefiis of the Project. The Participants are now able to provide the report prepared by AClL Tasman.
The findings of the AClL Tasman repart will be discussed In the reply submission which the Parficipants intend to file with the ACCC by 31 July 2009.
Yours sincerely
Verity Qulnn Senior Associate [email protected] .au T +61 3 9613 8865
David Brewster Partner
' [email protected] T +61 3 961 3 8707
Our Ref 3061 59908:306155QO8
vaqm A01 12892062~1 306155908 a.72009
Banglmk Baijin# Baijing IP Brlsbans Hanoi Ho Chi Mlnh Elty Hang Kong Jakarta Melbourne Pert h Phnm Psnh f'ad Momw Shanghai Singapore Sydney
Gorgon domgas marketing
Assessment of the economic value of delays in achieving full
capacity
Prepored for Allens Arthur Robinson
July 2009
ACIL Tasman Economics Policy Strcteyy
Reliance and Disclaimer
The professional analysis and advice in this report has been prepared by ACLLTasman for the exclusive use of the parry or parries to whom it is addressed (the addressee) and for the purposes specified in it. This report is supplied in good faith and reflects the knowledge, expertise and experience of the consulunrs involx-ed. ACIL Tasman accepts no responsibilirp whatsoever for any loss occasioned by any person acring or refraining from action as a result of reliance o n the reporr, other than rhc addressee.
I n conducting the analysis in chis report ACIL Tasman has endeavoured to use what ic considers IS the best infomarion available a t che date of publicadon, including Gorgon Domesuc Gas Project informadon supplied by rhc addressee. Unless stated ochenvise, ACIL Tasman does not warrant rhe accuracy of any forecast or prediction in the report. ~Urhough ACIL Tasman esercises reasonable care when making forecasts o r predictions, factors in the process, such as future market behauiour, are inhecendy uncerrain and cannot be forecasc or prcdicted reliably.
ACIL Tasman shall nor be liable in respect of an!? claim arising out of the failure of a client investment ro perform to the advantage of rhe client o r to the advantage of the client ro the degree suggested o r assumed in any advice o r forecast givcn by ACIL Tasman.
AClL Tasman Pty Md AE3N 68 102 652 148 In ternet ~ w . a c i l t n s m ~ n . c o t n n a c ~
Meibcurne [Heat! Qfbfhce; lrvcl 6, 224-236 Qvccn Slrcer Mclboumc VIC 3000 Telephone (+GI 3) 9604 4400 Facs~mile (+GI 5) 9600 3155 Fmail Lu-
Darwirl Srute C I . Paspnlis Cenrrcpoint 48-50 Smith Srrecr Danvin XT 0600 GPO Box 908 Darwin S T 0801
Telephone (+61 8) 8943 0643 Facsimile (+61 8) 8941 0848 Ernail
For information on this report
Ec:sba?e lrrel 15.127 Creek S r m t Brisbanc QI.D 4000 GPO B o x 32 Brisbyre QL13 4001
Telcphonc (+61 7) 3001 8700 hcsimilc (+61 7) 5001 6799 Ernail
Per?!? Ccna Building C2. I I8 R+ihvay S~recr West Penh U'A 6005
Tclcphonc ( i61 8) 9449 9600 Facsimile (+bl 8) 9322 3955 Ernail
Please contact:
Paul B a l k Te lephone (07) 3009 87 1 5 Mobile 0404 822 31 7 Email &alfe@acilr~sn!;ln.com.au
Can5en.a lrvcl 1.33 fbnslie Place Cnnbcm City ACT 2600 GPO Box 1322 Canberra ACT 2601
Telephnne (+GI 2) 6103 8200 l-'ac'acsimilc (+61 2) GI03 8233 Fmdl ~ ~ n ~ m ; ~ n . r ~ ~ ~ n . ~
Sydney PO Box 1554 DoubleBay SS\V 1360
Telephone (+GI 2) 9389 7542 Facsim~lc (+GI 2) 8080 81 42 E m ~ l -~nan.cc>n>.a~
Richard Begley 08 6262 941 1 0402 113 483 ~ e v ~ a c i l t a s m a n . c o m . a u
.%k\ Gorgon domgas marketing
ACIL Tasman I <,..C"C l Pdi* - . ..
Contents 1 Introduction
1.1 Qualifications and experience
1.2 Scope of Assignment
1.3 This report
2 Summary of opinions
3 Background and methodology 3.1 The Gorgon Gas Project
3.1 . I The Greater Gorgon Area resource
3.1.2 Project challenges
3.2 Assessment meihodology
3.2.1 Scenario rationale
3.2.2 Top down and bottom up modelling
3.3 GMG Australia (C'uzMurk) modelling
3.4 Tusn~aj~ C/oba/ CGE modelling
3.4.2 Other assumptions
4 GasMark modelling results 4.1 Current Reserc-es Scenario Scr
4.2 Addiuonal Resenrw Discovery Scenario Set
4.3 L,fodelling Results - Current Resenres Sce~lario Set
4.4 hlodelling Results - Addiuonal Reserves Discover!. Scenario Set
5 Tasman Global modelling results 5.1 Measuring economic impacts
5.2 Results
5.2.1 Current Reserves Scenario Set
5.2.2 Additional Reserves Discover) Scenario Set
G Conclusion
A Cumculum Vitae
B GasMsrk model
C Tasmsn Global model and base case assumptions
Gorgon domgas marketing
AClL Tasman I<'.-, Pdy . :\ .
Llst of figures Figure 1 Location of the Gorgon Gas Project Figure 2 the Gorgon Gas Project domgas sales profile (Scenario 1) Figure 3 Anticipated Gorgon domgas sales under the different scenarios
and nameplate maximum capacity Figure 4 WA domestic gas demand assumptions
Figure 5 Illustrative scenario analysis using Tusman Global Figure G Western Australia total domestic gas consumption - Current
Reserves Scenario Set Figure 7 Western Australia domestic gas prices (delivered Kwinana) -
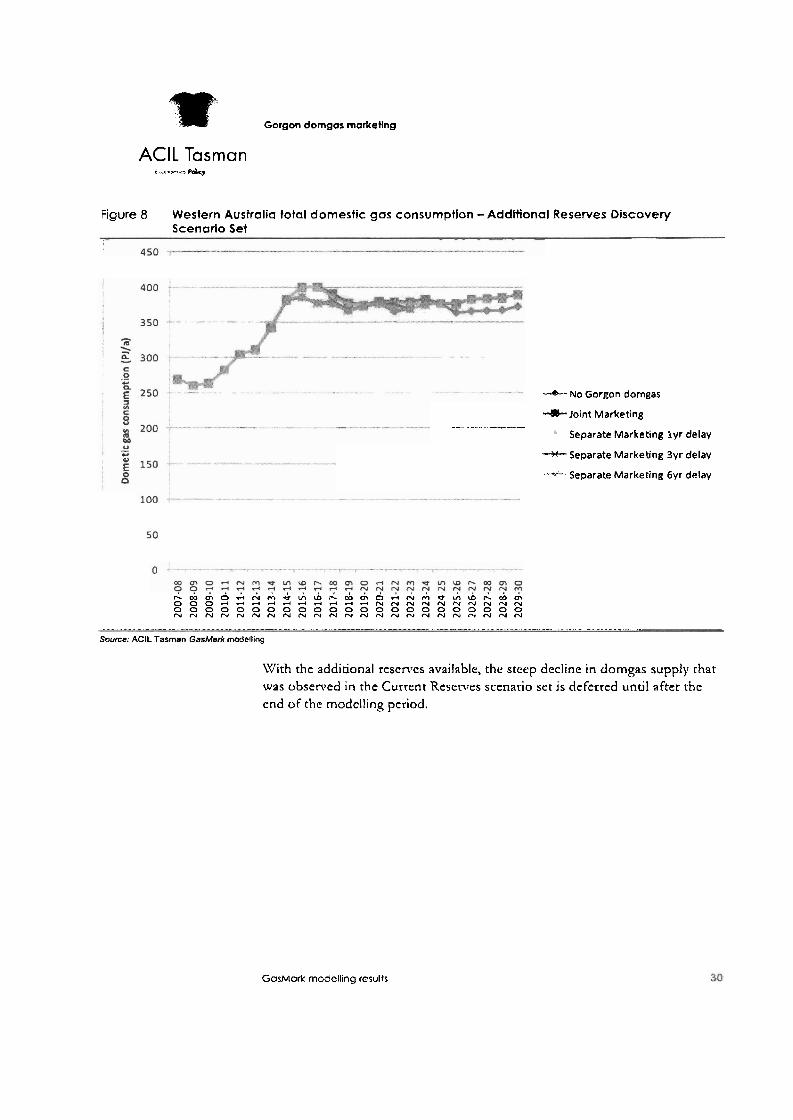
Current Reserves Scenario Set Figure 8 Western Australia total domestic gas consumption - Additional
Reserves Discovery Scenario Set Figure 9 Western Australia domestic gas prices (delivered Kwinana) -
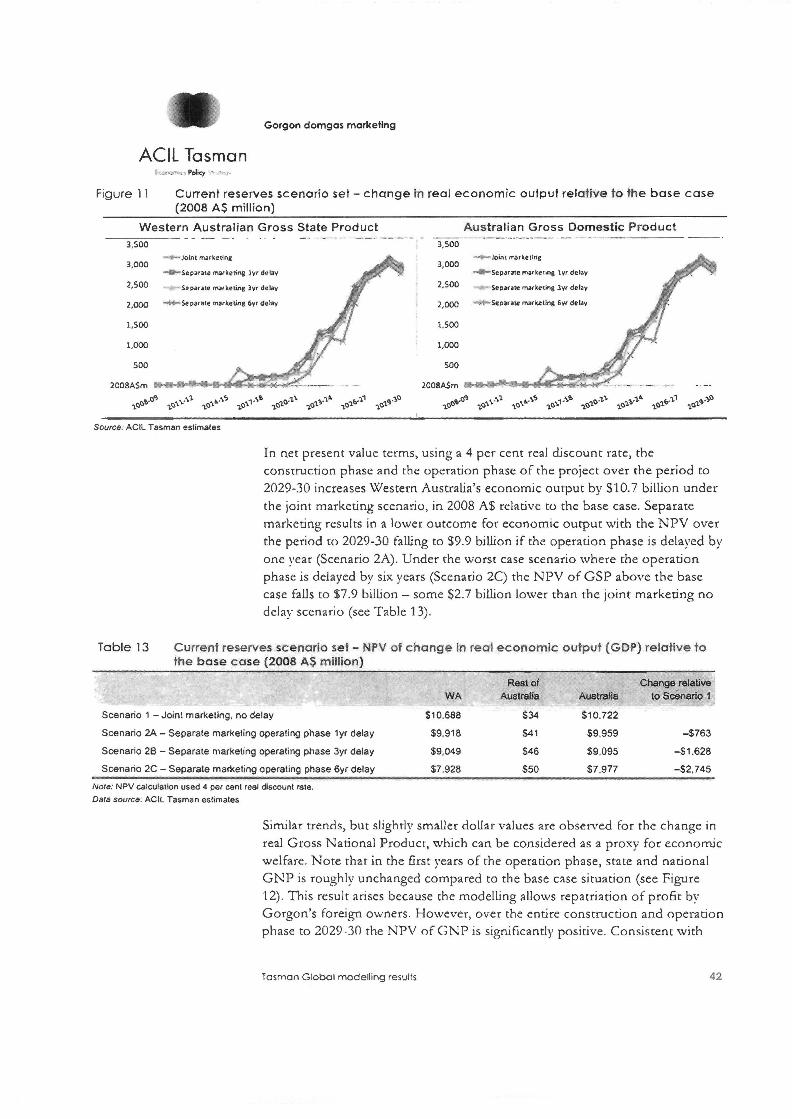
Additional Reserves Discovery Scenario Set Figure 10 Estimating the economic impact of a project or policy Figure 11 Current reserves scenario set - change in red economic output
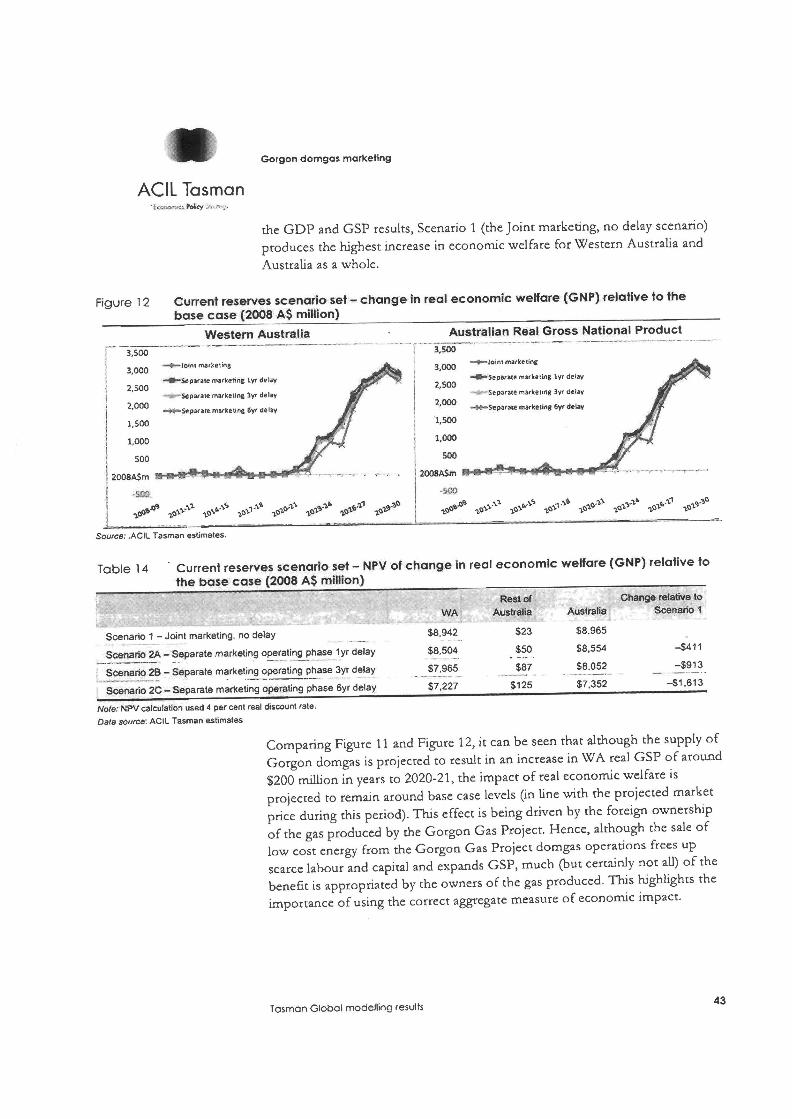
relative to the base case (2008 AS million) F i r e 12 Curxenc reserves scenario set - change in real economic welfarc
(GNP) relative to he base case (2008 AS million) Figure 15 Additional reserves discovery scenario set - change in real
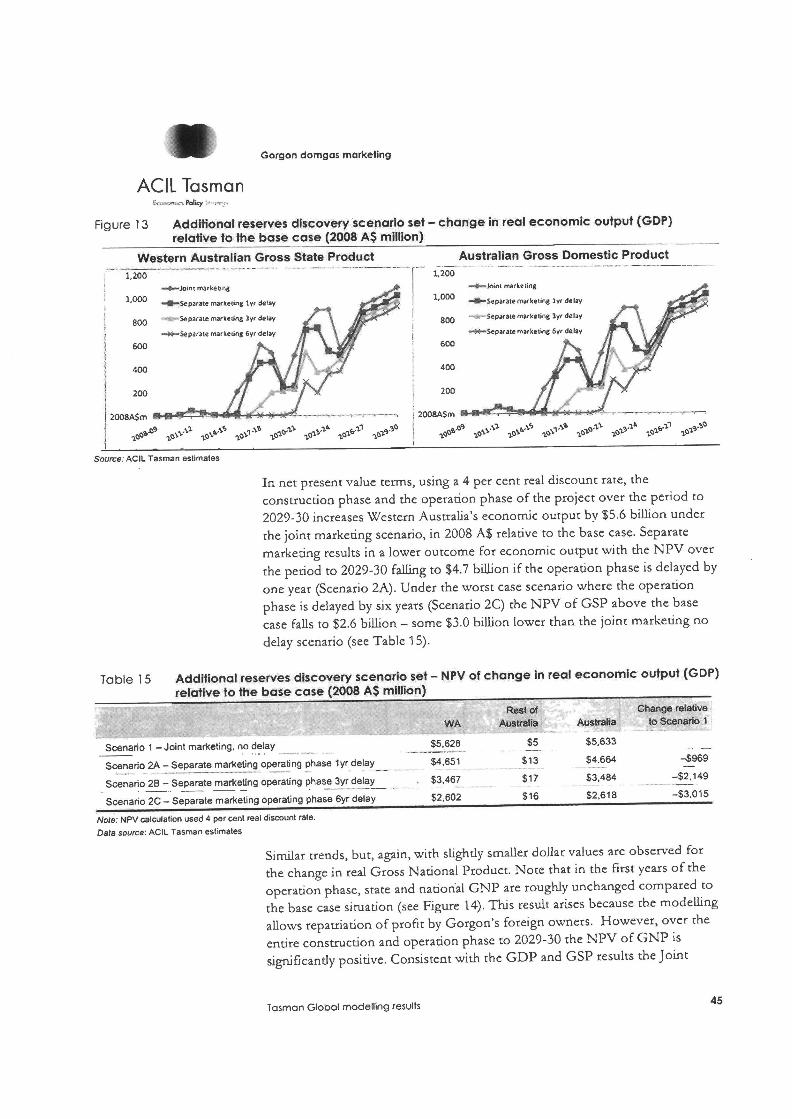
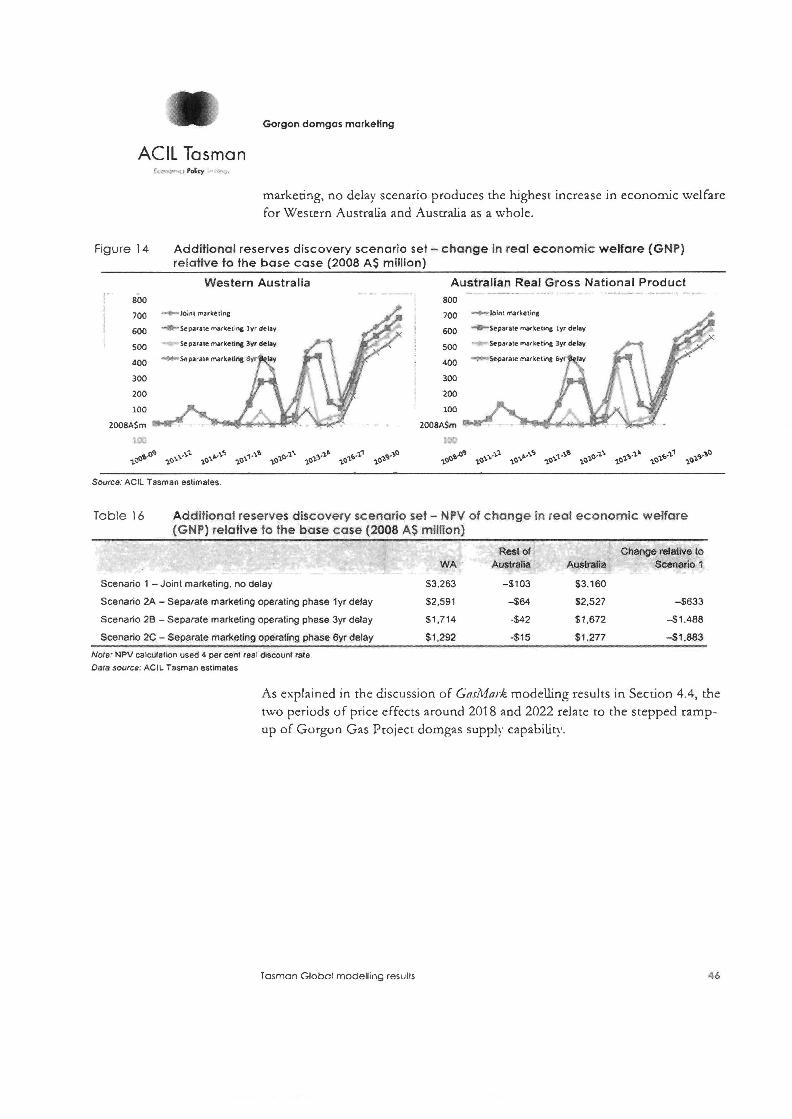
economic output (GDP) relative to the base case (2008 A$ million) Fiyre 14 Additional reserves discovery scenario set - change in real
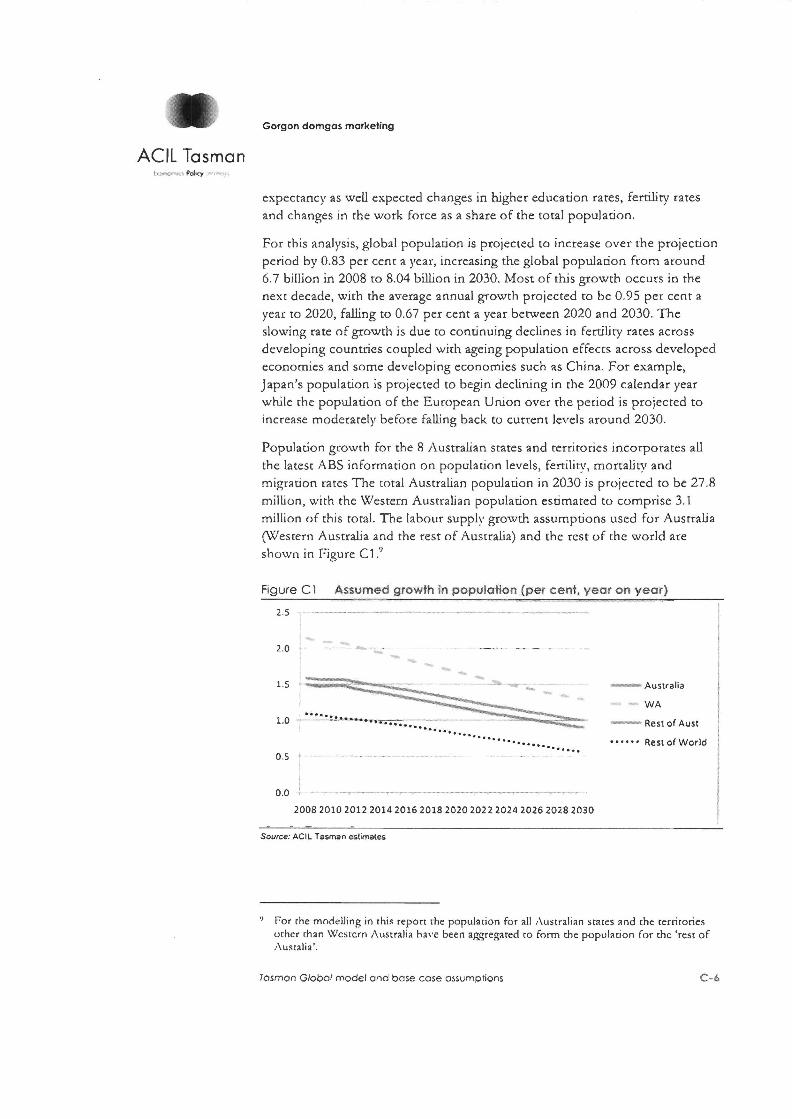
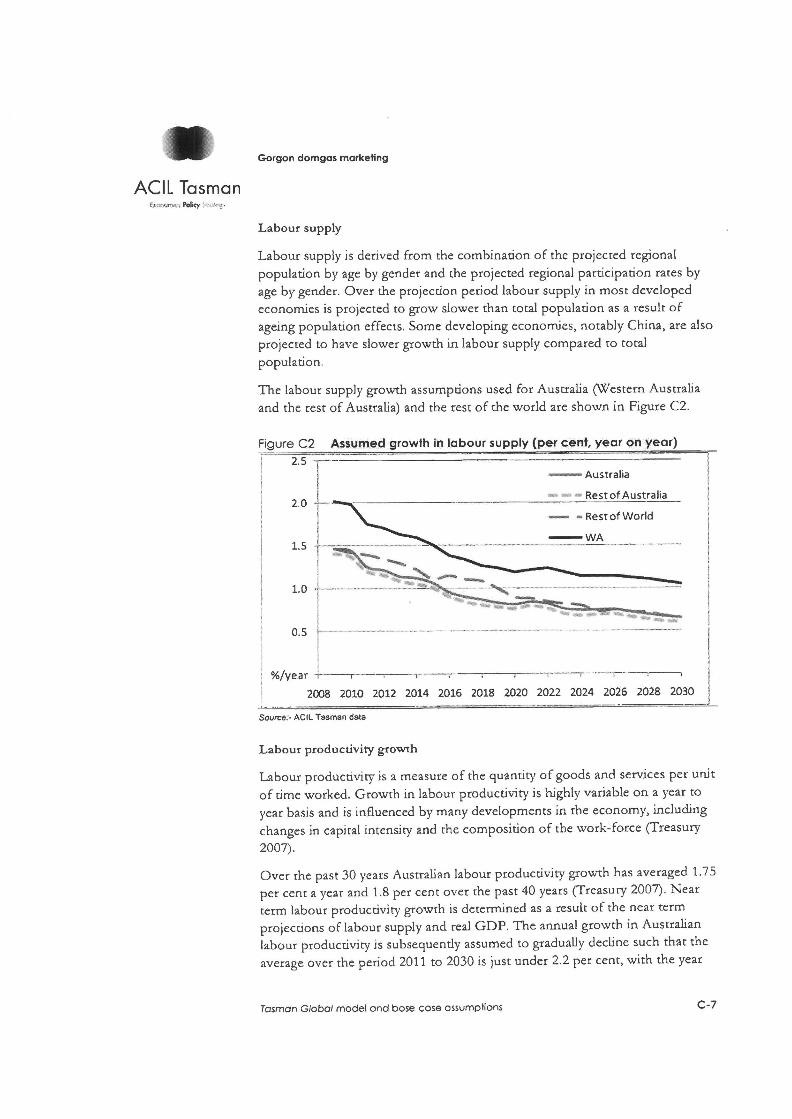
economic welfare (GNP) relative to the base case (2008 AS million) Fipre R1 Simplified example of market c q d b r i u m and settlement process Figure C1 Assumed growth in population (per cent, year on year) Figure C2 Assumed growth in labour supply (per cent, year on year)
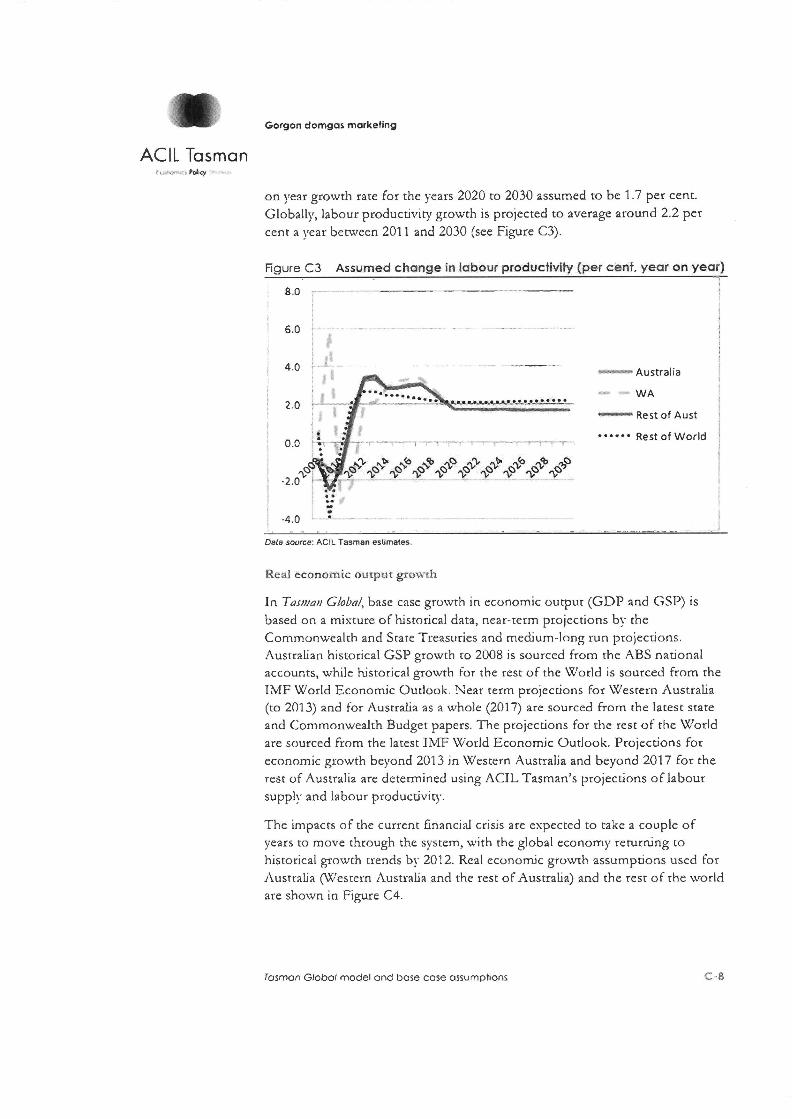
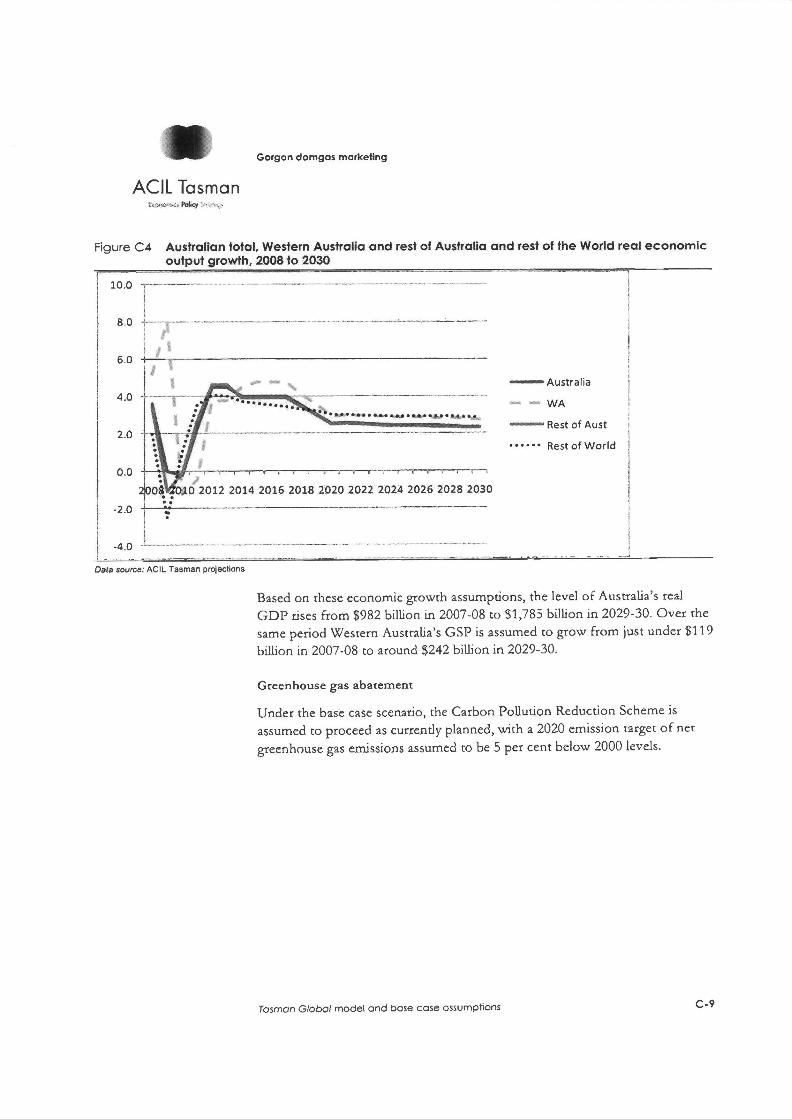
Figure C3 Assumed change in labour productivity (per cent, year on year) Fiyre C4 Aostralian total, Western Australia and rest of Australia and rest of
the World real economic output growth, 2008 10 2030
List of tables Table 1 Current reserves scenario set - NPV of change in real economic
welfare (GNP) relative to the base case (2008 AS million) Table 2 Additional reserves discovery scenario set - NPV of change in real
economic welfare (GNP) relative to the base case (2008 AS million)
Table 3 Expanded Gorgon Gas Project summary
Table 4 Indusay/Commodily aggregation used in CGE modelling Table 5 Modelled Wcstcrn Australia total domestic gas consumption
(PJ/a) - Current Reserves Scenario Set
Table 6 Domestic gas consumption differenrials (PJ/a) - Current Reserves Scenario Set
Table 7 Modelled Western Ausualia domestic gas prices ($/GJ, real 2009, delivered at Kwinana) - Current Reserves Scenario Set
Table 8 Modelled Western Ausualia domestic gas price differentials (S/GJ, real 2009, delivered at Kwinana) - Current Reserves Scenario Set
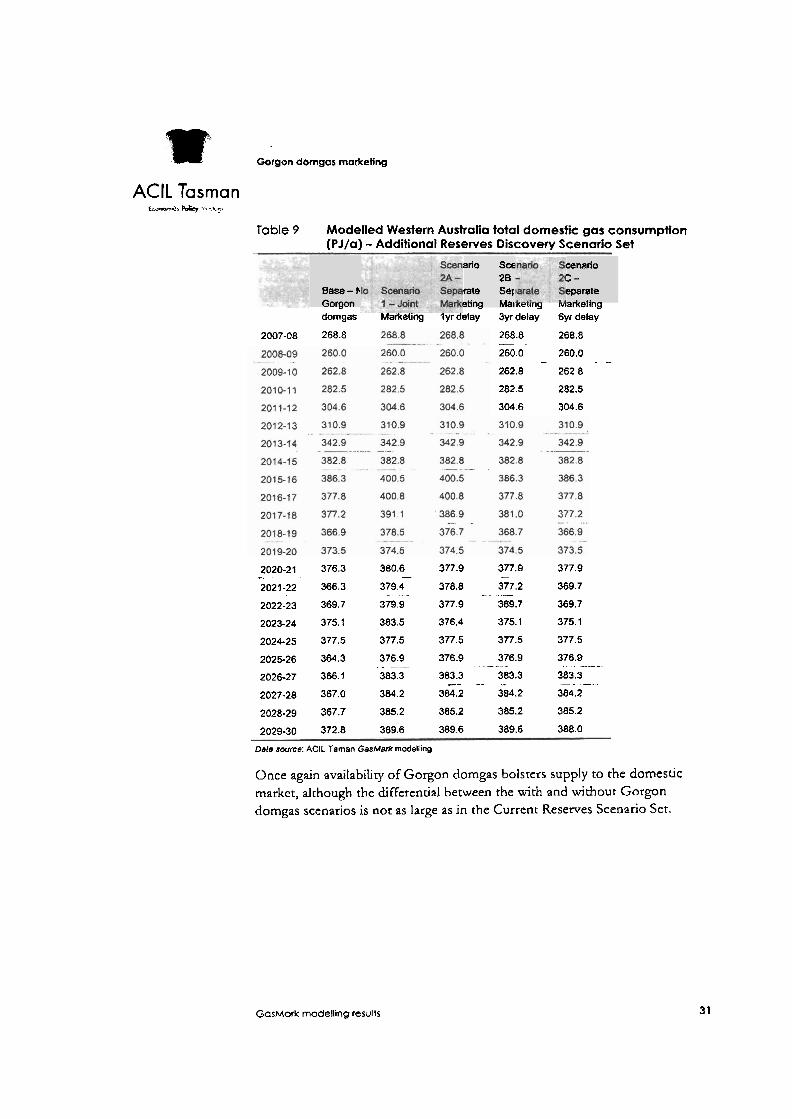
Table 9 Modelled Western Australia total domestic gas consumption @J/a) -Additional Reserves Discovery Scenario Set
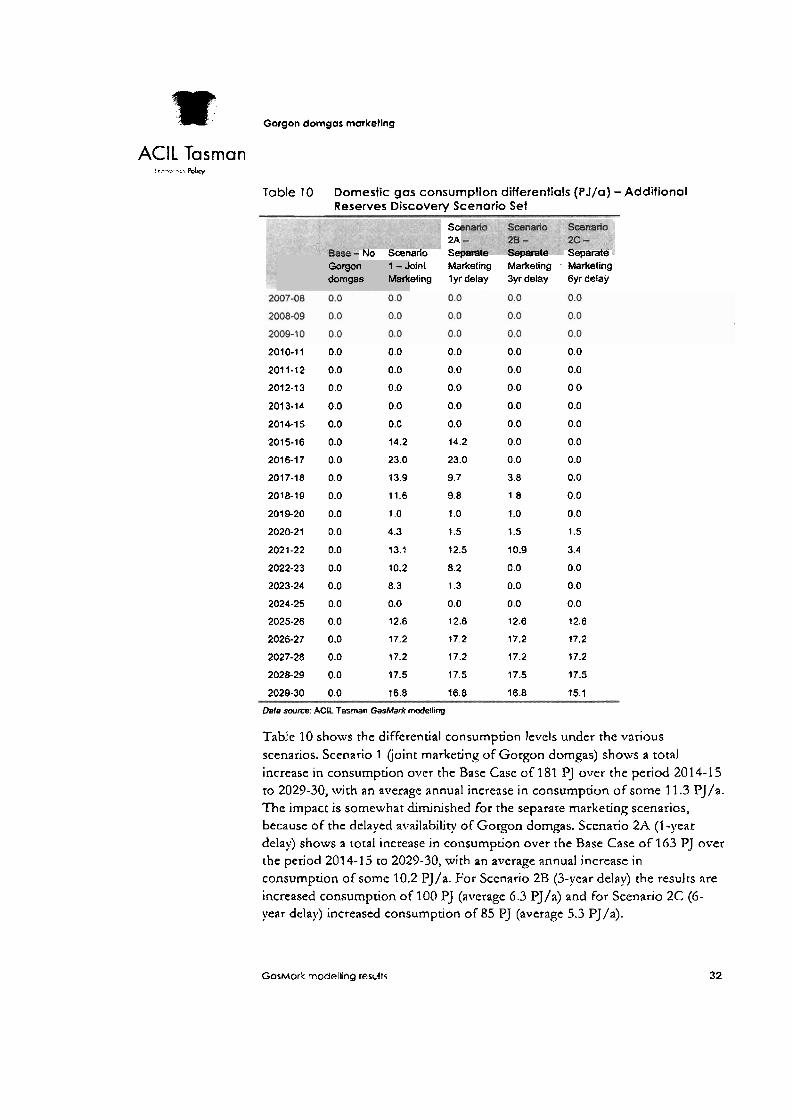
Table 10 Domestic gas consumption differentials @']/a) -Additional Reserves Discovery Scenario Set
ar Gorgon dorngas marketing
ACIL Tasman
Table 11 Modelled Western Australia domestic gas prices (O/GJ, real 2009, delivered at Kwinana) - Additional ~ e i e r u e s ~ i s c o v e j Scenario Set 34
Table 12 Modelled Western Australia domestic gas price differentials (%/GI, real 2009, delivered at Kwinana) - Additional Reserves Discovery Scenario Set 35
Table 13 Currcnt reserves scenario set - NPV of change in real economic output (GDP) relative to the base case (2008 AS million) 42
Tablc 14 Current reserves sccnario set - NPV of change in real economic welfare (GNP) relative to the base case (2008 AS million) 43
Table 13 Additional reserves discovery scenario set - NPV of change in real economic output (GDP) relative to the base case (2008 AS million) 45
Table 16 Additional reserves discovery scenario set - h T V of change in real economic welfare (GNP) relative to the base case (2008 AS million) 46
@m Gorgon domgas marketing
ACIL Tasman E ' Y m m x b Pdcy rtr:.
Introduction ACII- Tasman WAS commissioned by AUens Arthur Robinson to model and assess the benefits of the domestic gas (domgas) component of the Gorgon Gas Project.
1.1 Qualifications and experience
ACIL Tasman is one of the largest specialist economics and policy consultancies in Ausrralia. The firm has extensive expetience in the gas industry, both in Australia and internationally, This experience covers areas including policy development, marker analysis and the provision of economic and commercial advice to public and private sector clients. The firm's analytical and advisoy services to the gas industry encompass the encire supply chain - from gas producers, pipeline operators, gas distributors and retailers - to major customers such as power stations and industrial facilities, as well as investors, developers and financiers. ACIL Tasman is also experienced in the area of computable general equilibrium (CGE) modebng analysis. The firm maintains a comprehensive CGE model of Austraha and its innra-national and international trade reladonships.
The gas market rnicroeconornic analysis component of this report has been prepared by Paul Balfe, an Esecutive Director of ACIZ Tasman. Mr Balfe graduated from the University of Queensland (l3.S~. (Hons 1) in Geology and Mineralogy 1976; MBA 1988). He has more than 30 years experience working in the mining and energy sector in Australia as a geologist, government administrator and economics and policy consultant. He commenced his career working as a petroleum and coal geologist with the Geological Survey of Queensland. Subsequendy he held various managerial roles in energy resource development in the Queensland Department of Mines & Energy (QDME). In 1995 he left the position of Director of Energy in QDME to join ACIL Economics & Policy, a national firm with a substantial consulcancy practice in the area of energy markets and energy policy.
As the Executive Director responsible for ACIL Tasman's gas business, Mr Balfe has guided the development and commercialisadon of ACIL Tasman's GasMark model and its application to strategic and policy analysis throughout Australia and in New Zealand and South East Asia. He provides a range of analytical and advisor)) services to companies, government agencies and industry associations, paracularly in the gas, electricity and resources sector.
The Computable General Equilibrium (CGE) modelling of macroeconmoic impacts has been undertaken by Guy Jakeman, Senior Economic Consultant.
Introduction
"F Gorgon domgas marketing
ACll Tasman I. -+ah: Po*l . "
Mr Jakeman is a Senior Economic Consultant with ACIL Tasman and is a key member of ACIL Tasman's C G E rnodehng team. Prior to joining ACIL Tasman, he worked for the Australian Government at ABARE, where he was jointly responsible for the maintenance, derelopmenr and application of A B A E ' s C G E models.
Through his work at ABARE and ACIL Tasman, Mr Jakeman has underraken a variety of project economic impact assessments using C G E and input-output models. He has been extensively involved in modelling the economic implications of a wide range of domestic and internadonal policies (particularly energy and climate change policies). He is Aso extremely fanubar with the economics of a wide range of energy and energy efficiency technologies as well as a range of C G E models from the GTAP and ORANI families.
Mr Jakeman has a Bachelor of Science in Applied Mathematics and Statistics (First Class honours) from Grjffith University.
See Appendix A for detailed CVs.
1.2 Scope of Assignment
ACIL Tasman was engaged by NIens Arthur Robinson, acting for Mobil Australia Resources Company Pty Limited, Shell Development (Australia) Pty Lrd, Chevron Australia Pry Ltd, Chevron (TAPL) Pty Ltd (the Gorson domestic gas sellers) to:
model and assess the economic impacts and public benefits of the dornesuc gas component of the Gorgon Gas Project, comparing a situation where the Project does not proceed, against the following scenarios:
- proceeding on a joint marketing basis for a 12 year period - proceeding on a separate marketing basis (with variations of delays of
one, three and six years as the possible consequence separate marketing is likely to occasion), and
provide a report setting out such assessment.
The rcporr is intended to be provided to the Australian Competition and Consumer Commission (ACCC) as part of an authorisation application being submitted by the Gorgon domestic gas sellers.
1.3 This report
In this report we set out ACIL Tasman's views, as follows:
Chapter 2 provides a summary of our opinions and findings
Chapter 3 provides background on the Gorgon Gas Project and outlines rhe methodology used to undertake the assessment
lnlroduclion 2
rn Gorgon domgas marketlng
AClL Tasman C i a n . r . , PC&+ . r 7
Chapter 4 sets out the resulrs of our analysis of the different scenarios using the GMG Australia (GasMark) model of the Western Australian gas market to assess implications for gas supply, consumption and pricing.
Chapter 5 summarises the results of the 'Iusn~an GhMmodelling of the scenarios to assess their broader economic implications at a state and national level.
Chapter 6 provides a summary conclusion.
Introduction
w Gorgon domgas marketing
AClL Tasman f .,,-.<. PCly .
Summary of opinions For the purposes of assessing the impact of joint marketing versus separate marketing of Gorgon domgas, we considered two 'sets' o f scenarios. Each set reflected a possible future 'state o f the ~vorld' with regard to gas reserves in Western Australia:
a 'Currenr Reserves Scenario Set' - where gas reserves in Western Australia are constrained to current 50 per cent probability of exceedence (P50) estimates
an 'Additional Reserves Discovery Scenario Set' - where the currenr PSO gas reserves are increased by 50 per cent to reflect possible new discoveries of gas, o r additional new developments.
Each ser in turn was described by five possible scenarios which might reflect feasible outcomes consistent with the relevant gas reserves estimates:
a Base Case scenario- which did not include Gorgon domgas
'Scenario 1' - with joint marketing of Gorgon domgas and commencement of domgas sales in 201 5
'Scenario 2A' - with separate marketing of Gorgon domgas. leading to a delay o f one year in commencement of Gorgon domgas sales
'Scenario 2B' - with separate marketing of Gorgon dorngas, leading to a delay of three years in commencement of Gorgon domgas sales
'Scenario 2C'- with separate marketing of Gorgon domgas, leading to a delay of six years in commencement of Gorgon domgas sales.
The potential for delay in commencement of domgas sales under separate marketing reflects a number of issues, including diseconomies of scope. However the esact period of delay likely to occur is djFGcult to forecast. The choice of three delay scenarios For the scparate marketing ana.lysis - of one, three or sis year's delay - retlects this level of uncertainty and is designed to provide a ranged estimate of the porenrial impact o f a separate marketing requirement.
For each set of scenarios, modelling of the Western Australian gas market was conducted using AClL Tasman's 'bottom up' C;MGAus~'a/io (Gashlark) model -in order to determine equilibrium domgas prices and quandries in each year:
Under the Current Reserves Scenario Set, domgas consumption in Western Australia falls steeply from around 2021-22 in all scenarios, as field reserves constraints are encountered and as avail~ble gas supply is h e c t e d to meet LNG producaon commitments. Thc &Mark results also show that, while availabiliv of Gorgon domgzs does not enarely avoid this outcome, i t significantly mitigares the severin of the decline. Prices rise in real terms in
Summory of opinions 4
m Gorgon domgos marketing
AClL Tasman C c ~ l a r s .' '* ..
all scenarios, but the availability of Gorgon domgas significantly reduces the level of price rise.
Under the ‘Additional Reserves Discovery Scenario Set', the results again show that in all scenarios domgas consumption falls steeply as field reserves constraints are encountered and available gas supply is directed to meec LNG production commiunents. However the decline is now deferred by around ten years, to beyond 2029-30. Once again, availability of Gorgon domgas mitigates the severity of the decline, although the differential between the 'with' and 'without' Gorgon domgas scenarios is not as large as in the Current Reserves Scenario Set.
The GasMark price and quantity outputs were then used as inputs to ACIL Tasman's 'top down' Computable General Equilibrium (CGE) model of the Ausrraljan economy, Tostnun Global.
The key aggregate measure of economic impact is the extent to which the total wealth of the Australian economy has changed as a result of the Gorgon Gas Project domgas. Typically this is measured by real Gross National Product (GNP). In the T m a n Globa/framework, changes in real G N P are a measure of changes in aggregate economic welfare.
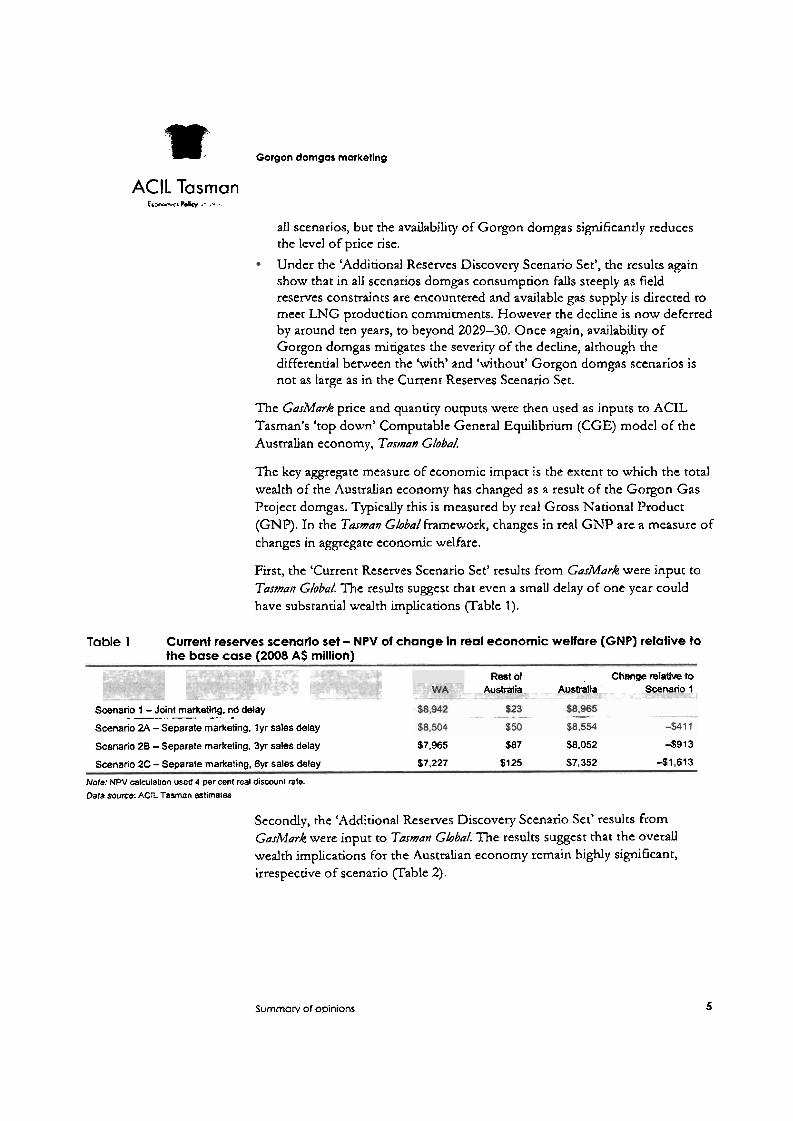
First, the 'Current Reserves Scenario Set' results from GasMurk were input to T a m G/obal. The results suggest that even a small delay of one year could have substantial wealth implications (Table 1).
Table 1 Current reserves scenario set - NPV of change in real economic welfare (GNP) relative to the base case (2008 A$ million)
Rest of Change m1aW to AustFalia Australia Scenario I
Scenario 1 - Joint maIketing. no tleiay - . --. - Scenario 2A - Separate marketing. 1yr sales delay
Scenario 28 - Separale marketing. 3yr sales delay $7,965 $87 $8.052 4 9 1 3
Scenario 2C -Separate marketing. 6yr sales delay $7,227 $125 $7,352 41,613
Note: NPV calculation used 4 per cent real discount rate. Data source: AClL Tasman gstimatns
Secondly, the 'Additional Reserves Discovery Scenario Set' results from GasA4ark were input to Tarman Global. The results suggest that the overall wealth implications for the Australian economy remain highly significant, irrespective of scenario (Table 2).
Summary of opinions 5

rn Gorgon domgas marketing
ACIL Tasman ..... . . P d e .
Table 2 Additional reserves discovery scenario set - NPV of change in real economic welfare (GNP) relative to the base case (2008 AS million)
Australia Change relalive to
Scenario 1
Scenario 1 -Joint marketing, no delay $3.263 -$I03 83.160
Scenario 2A - Separate marketing, lyr sales delay $2.591 5 6 4 $2,527 -5633
Scenario 28 -Separate marketing. 3yr sales delay S7.714 4 4 2 $1.672 4 1 . 4 8 8
Scenario 2G -Separate marketing, 6yr sales delay % 1.292 -515 61.277 -51,883
Note: W V calculation used 4 per cent real discount rate.
Dare swrce: ACIL Tasman estimates
In summary, we find chat the economic impacts of potential delays arising from separate marketing are large, with significant implications for the net economic welfare of Australia. This is reflected in the GNP ourcomes, which range between minus $41 1 million and minus 51,883 million dollars in hTet
Present Value (h'P\') terms, depending on scenario.
Surnmory 0 1 opinions 6
w+ Gorgon domgas rnorketing
AClL Tasman I-, vdii . 2 . i . .
3 Background and methodology 'Rus section sets out background information on the Gorgon Gas Project and its domgas proposal, as well as describing the methodology used in this assessment.
3.1 The Gorgon Gas Project
In September 2007, the State Environmenr Minister issued State environmental conditions for a two LNG train, 10 d o n ronnes per annum (mtpa) Gorgon Gas Project. In October 2007, the Federal Minister for the Envir~nment issued Australian government approval for the Project.
Given the Project's commercial imporrance to each of the Joint Venture Participants, the current high cost constmcdon environment and the need to be internationally competitive, the Joint Venrure Participants have been working ro ensure that the Gorgon resource is developed responsibly, effectively and efficiently.
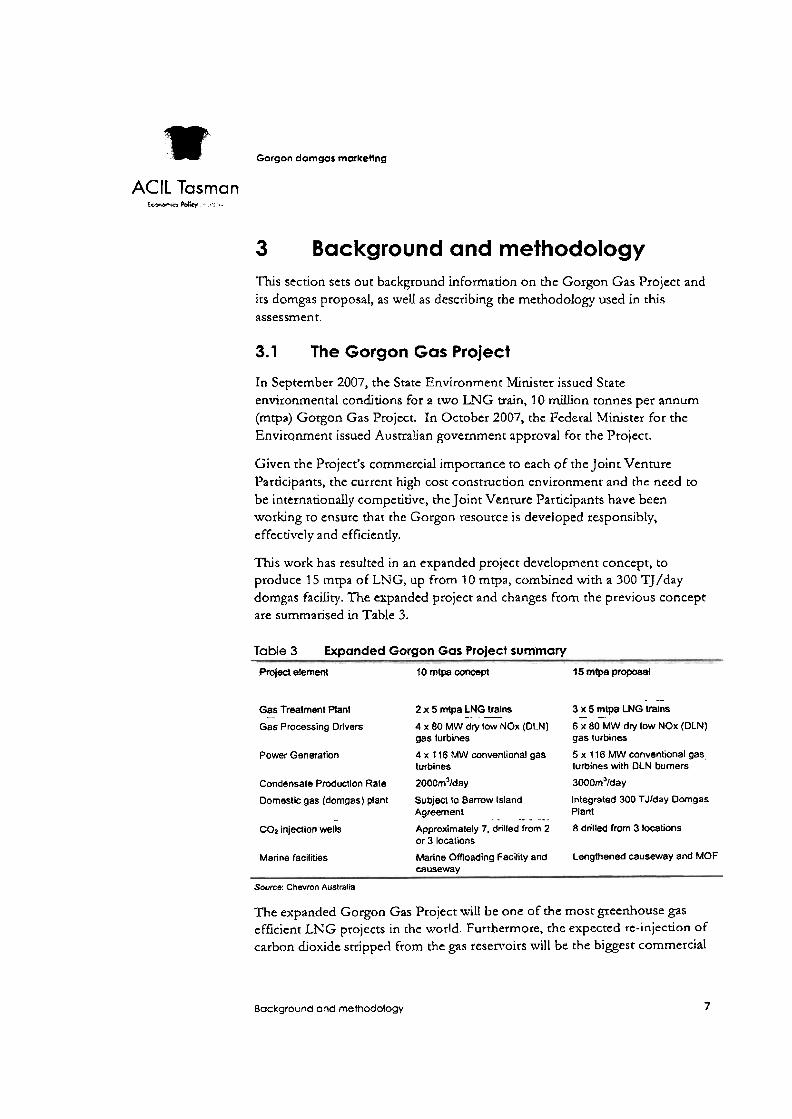
This work has resulted in an expanded project development concept, to produce 15 mtpa of LNG, up from 10 rntpa, combined with a 300 TJ/day domgas facility. The expanded project and changes from the previous concept are surnmarised in Table 3.
Table 3 Expanded Gorgon Gas Project summary
Projed element 10 mtpa concept 15 mtpa proposal
. - Gas Treetment Plant -- 2 x 5 mtpa LNG trains - - 3 x 5 mlpa LNG Wains - - Gas Processing Drivers 4 x 80 MW dry low NOx (DLN) 6 x 80 MW dry low NOx (DLN)
gas lurb~nes gas turbines
Power Generation 4 x 116 MW convenlional gas 5 x 116 MW convenlional gas, turbines turbines with DLN burners
Condensate Production Rate 2000m31day 3000mJ/day
Domeslic gas (domgas) plant Subject to Barrow Island Integrated 300 TJIday Dmgas Agreement Plant - . - - - -.
COz injection wells Approximately 7, drilled from 2 8 drilled from 3 locations or 3 locations
Marine facilities Marine Oftloading Facility and Lengthened causeway and MOF causeway
Source: Chevron Australia
The expanded Gorgon Gas Project will be one of the most greenhouse gas efficient LNG projects in the world. Furthermore, rhe expected re-injection of carbon dioxide stripped from the gas reservoirs will be the biggest commercial
Background and methodology 7
!m Gorgon domgas marketing
ACIL Tasman '.wJ~..L P o l y ". ,
application of its kind in the world, once proven to be commercially and technjcall!~ feasible.
3. I . 1 The Greater Gorgon Area resource
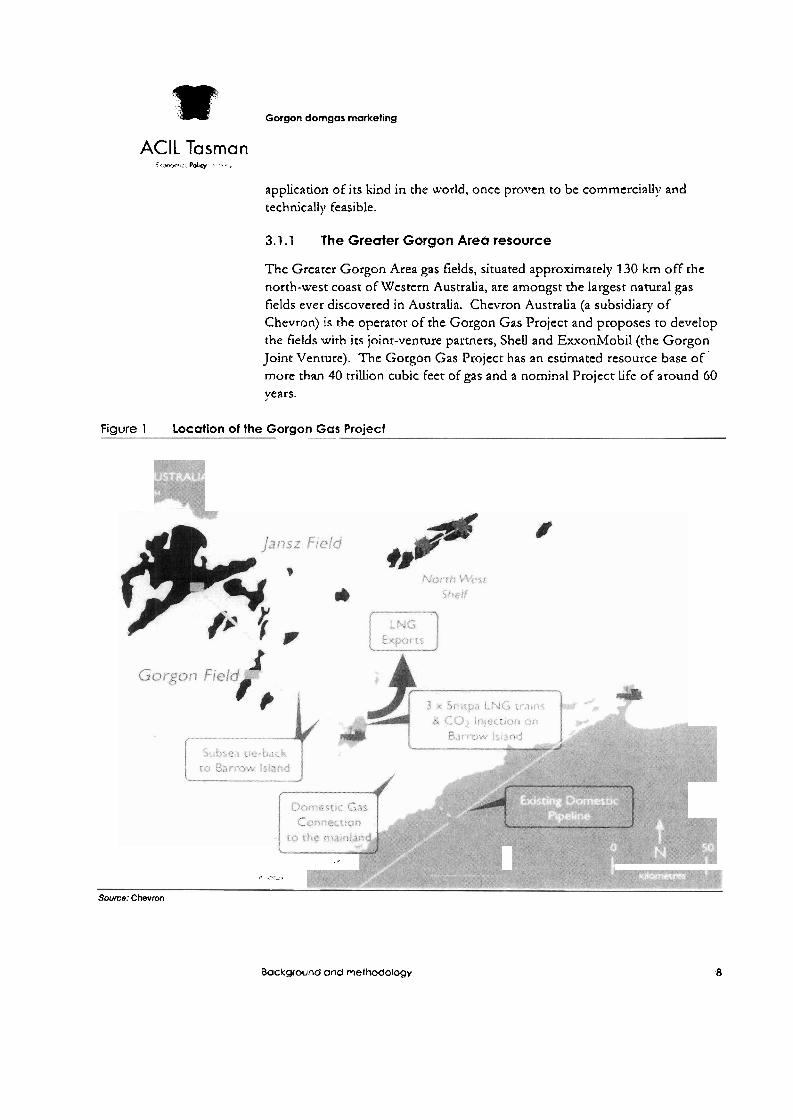
The Greater Gorgon Area gas fields, situated approximately 130 km off the north-west coast of Western Australia, are amongst the largest natural gas fields ever discovered in Australia. Chevron Australia (a subsidiary o f Chevron) is the operator of the Gorgon Gas Project and proposes to develop the fields with its joint-venture partners, SheU and ExxonMobil (the Gorgon Joint Venture). The Gorgon Gas Project has an estimated resource base of more than 40 trillion cubic feet of gas and a nominal Project life of around 60 years.
Figure 1 Location of the Gorgon Gas Project .-
.*
r r - l
Source: Chevmn
Bockground and me tho do log^ 8
w Gorgon domgas markenrig
AClL Tasman fcn'mcl* .- ;*..;.
The Greater Gorgon Area holds a sub-sea archipelago of gas fields located 1 200 liilometres north of Perrh off Australia's north-west coast. These fields, including Gorgon and Jansz, are located in Common.cvealth waters in water depths up to 1 350 metres and are about 70 krn to 130krn wesc of the nearest landfall at Barrow Island (Figure 1).
The Greater Gorgon Area gas fields are a world-class energy resource. Developing the resource is a matter of national importance as i t will secure Australia's position as a leading gas producer and provide a huge additional source of wealth and energy for the country and Western Australia.
Central to the commercial viability of the proposed Project is the establishment of an LNG and domgas processing facility on Barrow Island, which lies directly between the gas fields and the Australian mainland.
3.1.2 Project challenges
The Gorgon Gas Drojecr faces a number of technology challenges, but is aiming to be one of the mosr energy and greenhouse gas efficient plants in the world. The proposed CO, capme and storage project, which will help the Project meet this aim, will be the largest commercial application of this technology anywhere in the world.
Another challenge is producing gas from the remoteness of the Greater Gorgon Area which will require the use of innovative engineering approaches and have positive repercussions for other deepwater gas fields throughout Australia and the world. Gorgon wiU use an all sub-sea system to develop the fields to reduce the costs and the safety risks associated with offshore platforms. This will require one of the longest and deepest subsea field tie- backs to shore in the world, pushing further the current frontiers esrablished in deepwater locations around the world.
The Gorgon Joinr Venture brings a wealth of international and domestic experience in oil and gas processing and LYG operations covering al l aspects of the development, ranging from drilling to sub-sea producuon systems, offshore operations, gas plant operations, and product shipping. Between them, the Gorgon Joint Venture participants are involved in 12 other LNG projects that are currendy operational or under consrrucaon. About three-
oint ventures quarters of the world production of LNG is produced b) j involving participant companies from the Gorgon Joint Venture.
3.2 Assessment methodology
For the purposes of assessing the impact of joint versus separate marketing, we considered five scenarios:
Background and methodology
"1C Gorgon domgas marketing
ACIL Tasman ,,.s*" . . Pdy . . .
Base Case scenario - which did not include Gorgon domgas
'Scenario 1' - with joint marketing of dorngas
'Scenario 2A'- with separate marketing of domgas, Icadng to a delay of one year in commencement of domgas sales
'Scenario 2B' - with separate marketing of domgas, leading to a delay o f three years in commencement of domgas sdes
'Scenario 2C' - with separate marketing of domgas, leading to a delay o f six years in commencement of domgas sales.
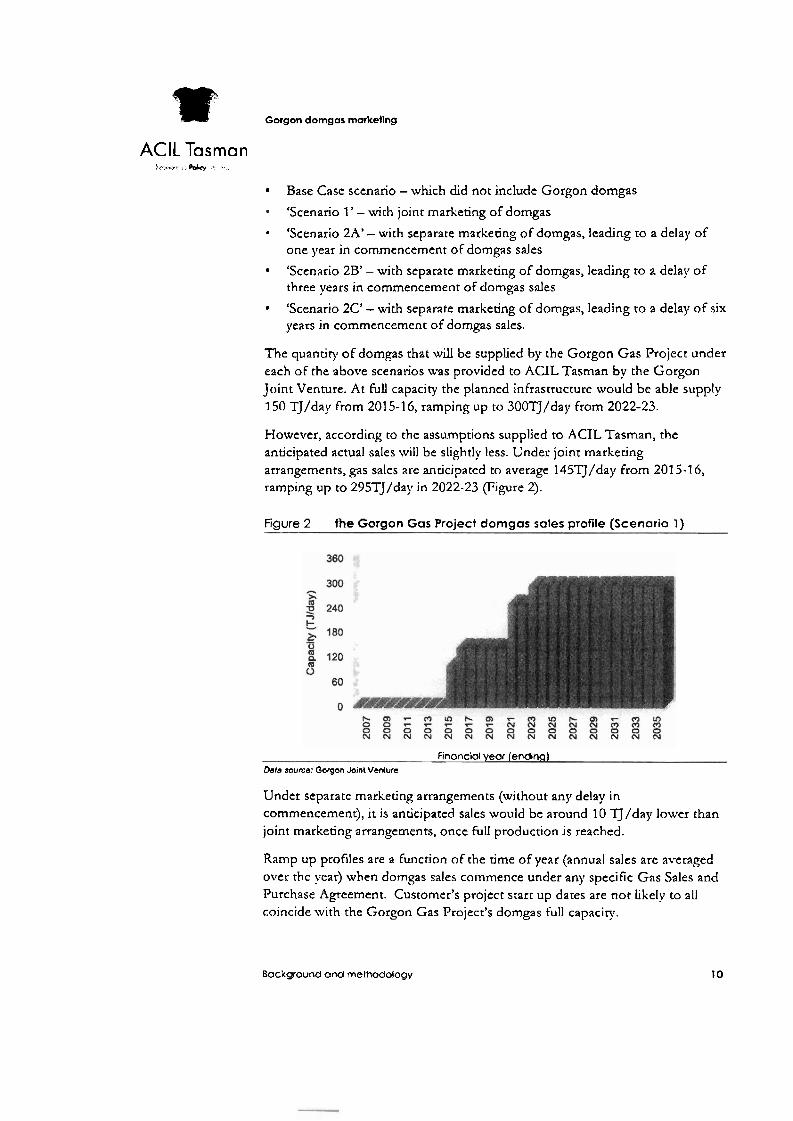
The quantiry ofdomgas that will be supplied by the Gorgon Gas Project under each of the above scenarios was provided to ACIL Tasman by the Gorgon Joint Venture. At full capacity the planned infrastructure would be able supply 150 TJ/day from 201 5-1 6, ramping up to 300TJ/day from 2022-23.
However, according to the assumptions supplied to ACTL Tasman, the anticipated actual sales will be slightly less. Under joinr marketing arrangements, ,gas sales are anticipated to average 1 451J/day from 201 5-1 6, ramping up to 295TJ/day in 2022-23 (Figure 2).
Figure 2 the Gorgon Gas Project domgas sates profile (Scenario 1)
Finonciol year (endinq) Defo source: Gorgon Joint Venture
Under separate marketing arrangements (without any delay in commencement), it is anticipated sales would be around 10 lJ/day lower than joint marketing arrangements, once full production is reached.
Ramp up profiles are a function of the rime of year (annual sales are averaged over rhe year) when domgas sales commence under any specific Gas Sales and Purchase Agreement. Customer's project start up dates are not likely to all coincide with the Gorgon Gas Project's domgas full capaciry.
Background and methodology 10
w Gorgon domgas marketing
AClL Tasman
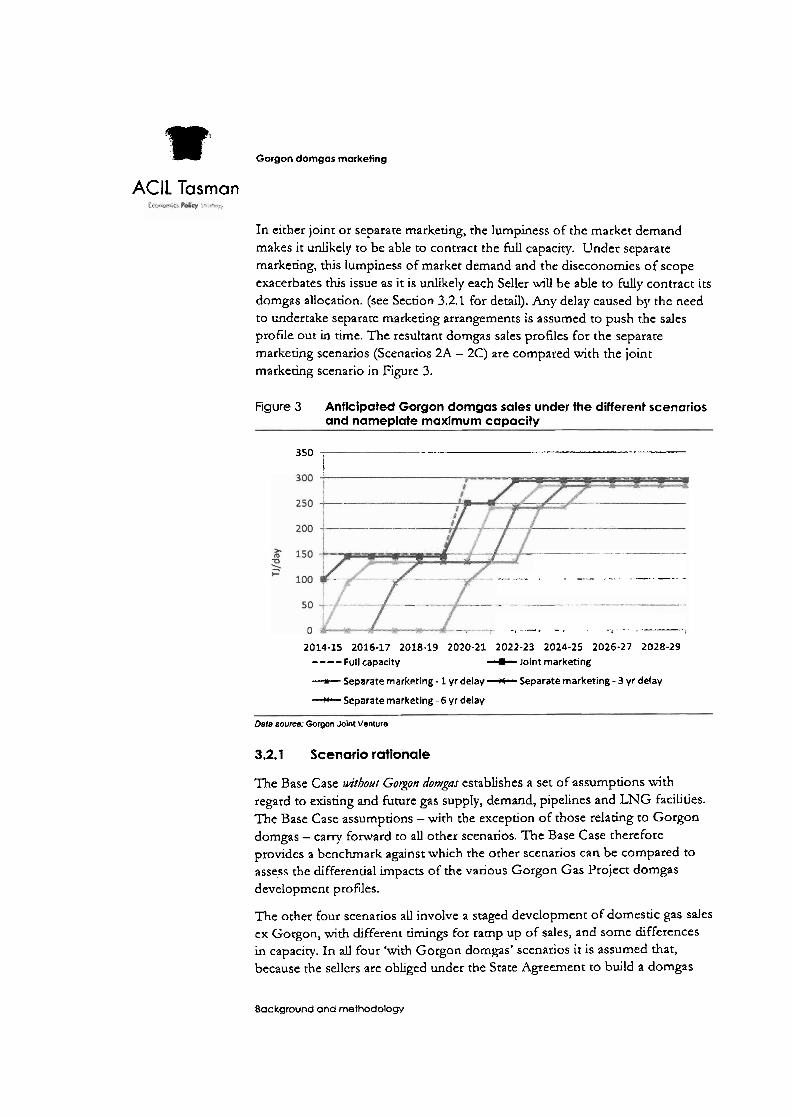
In either joint or separate marketing, the lumpiness of the market demand makes it unlikely to be able to contract the fulI capacity. Under separate marketing, thjs lumpiness of market demand and the diseconomies of scope exacerbates this issue as it is unlikely each Seller will be able to fully contract its domgas allocation. (see Section 3.2.1 For detail). Any delay caused by the need to undertake separate marketing arrangements is assumed to push the sales profie out in time. The resultant domgas sales profiles for the separate marketing scenarios (Scenarios 2A - 2C) are compared with the joint markedng scenario in Figure 3.
Figure 3 Aflticipated Gorgon domgas sales under the different scenarios and nameplate maximum capacity
350 -.--- - --- i
" . . .-. , .-..--.. -
, . , . . . . ^
2014-15 2016-17 2018-19 2020-21 2022-23 2024-25 2026-27 2028-29
----Full capacity +Joint marketing - Separate marketing - 1 yr delay --M- Separatemarketing - 3 yr delay
-+Separate marketing - 6 yr delay
Data sourced Gorgon Joint Venture
3.2.1 Scenario rationale
The Base Case wtbolut Gotxon domgas establishes a set of assumptions with regard to existing and future gas supply, demand, pipelines and LNG facilides. The Base Case assumptions - with the exception of those relating to Gorgon domgas - carry fonvard to all other scenarios. The Base Case therefore provides a benchmark against which the other scenarios can be compared to assess the differential impacts of the various Gorgon Gas Project domgas development profiles.
The other b u r scenarios all involve a staged development of domestic gas sales ex Gorgon, with different cimings for ramp up of sales, and some differences in capacity. In all four 'with Gorgon domgas' scenarios it is assumed that, because the sellers are obliged under the Srate Agreement to build a domgas
8ackground and methodology
"1 Gorgon domgas marketing
ACIL Tasman
project capable of delivering at least 300 TJ/day, that facility will be built by no later than 31 December 201 5 regardless of marketing arrangements. In aU four domgas cases, the capital expenditure profile for the domgas development will therefore be the same.
Under the joint marketing arrangement (Scenario 1) it is assumed that the Gorgon Gas Project offets domgas into the WA market from 2015. Under the separate marketing arrangement it is assumed thar there will be a significant delay in commencement of domgas sales, essentially lea\.ing the domgas investment idle. I t is df6cult co estimate exactly how long a requirement For separate marketing would delay the commencement of domgas supply (hence rhe three scenarios 2A, 2B and 2C with dfferent delay periods). However there are a number of reasons to expect that a delay would occur.
Under separate marketing scenarios, each o € the sellers needs to complete the follou~ing steps:
set up their own Marketing-Organisations and develop their own pro- forma Gas Sales and Purchase Agreements
agree to gas balancing arrangements in whatever form
market and sell their proportionate share of domgas, with buyers potendal.ly delaying any purchase commitment in an attempt ro secure 'a better deal'
seller's Customer(s) then must enter into their respective Shipper Contract with rhe Dampier Bunbury Pipeline (DBP), and potentially with Pilbara Energy Pipeline (T'EPL) o r Goldfields Gas Pipeline (GGP)
DBP then must expand ics transmission system - which requires a rninLnum 10 TJ/day demand aggregation before any
pipeline expansion commences
- a period of around 30 months then would pass before the expansion is
ready for service.
The potential for delay is apparent when consideration is given to the various reqwrements that would need co be met through the separare marketing efforts of the sellers before domgas delivery could commence. However the period of delay likely to occur is difficult to forecast, and cannot be estimated until marketing activities actually commence. The choice of three delay scenarios for the separare marketing analysis - of one, three or sis year's delay, rather rhan a single delay scenario - reflects this level of uncertainty and is designed to provide a ranged estimate of the porential impact of a separate marketing requirement.
As noted above, the rotal quantity able to be supplied from Gorgon domgas is assumed to be a Little lourer under the separate marketing arrangements (maximum sales rate of 285 TJ/d) compared with the joint marketing
Background and methodology
1Q Gorgon domgas marketlng
AClL Tasman [c-nr, *,>: in?
arrangements (maximum sales rate of 295 TJ/d). The rationale for this assumption is rhat with separate marketing each seller is likely to have an unmarketable remnant amount of gas after completing gas sales agreements for the majority of its entitlements. Joint marketing would effecdvely bring togerher these quantities creating a further marketable parcel and so reducing the total unmarketable remnant amount.
3.2.2 Top down and bottom up modelling
For each set of scenarios, modelling of the Western Australan gas market was conducted using AClL Tasman's 'bottom up' &Mark model, in order to determine equilibrium domgas prices and quanoties in each year.
The Gasi\4ark price outputs were then used as inputs to ACIL Tasman's 'top down' Computable General Equilibrium (CGE) model of the Australian economy, Tasman G/obnl, in order to assess the economy-wide impacts.
3.3 GMG Australia (GasMark) modelling
The GasMark model is a long range (20 ro 30 year) economic model rhat takes into account assumptions about gas supply (reserves, producdon rates, minimum selling prices), gas demand ac indvidual customer or customer group level (annual quantity, price tolerance) as well as esisting and possible future transmission pipelines (current capacity, future espansions, tariffs). Further details on the C;asMarR model are provided in Appendix B.
Ga~Mark is a partial spadal equilibrium model. The marker is represented by a collection of spatially related nodal objects (supply sources, demand points, LNG liquefaction and receiving facilities), connected via a nenvork of pipeline or LNG shipping elements.
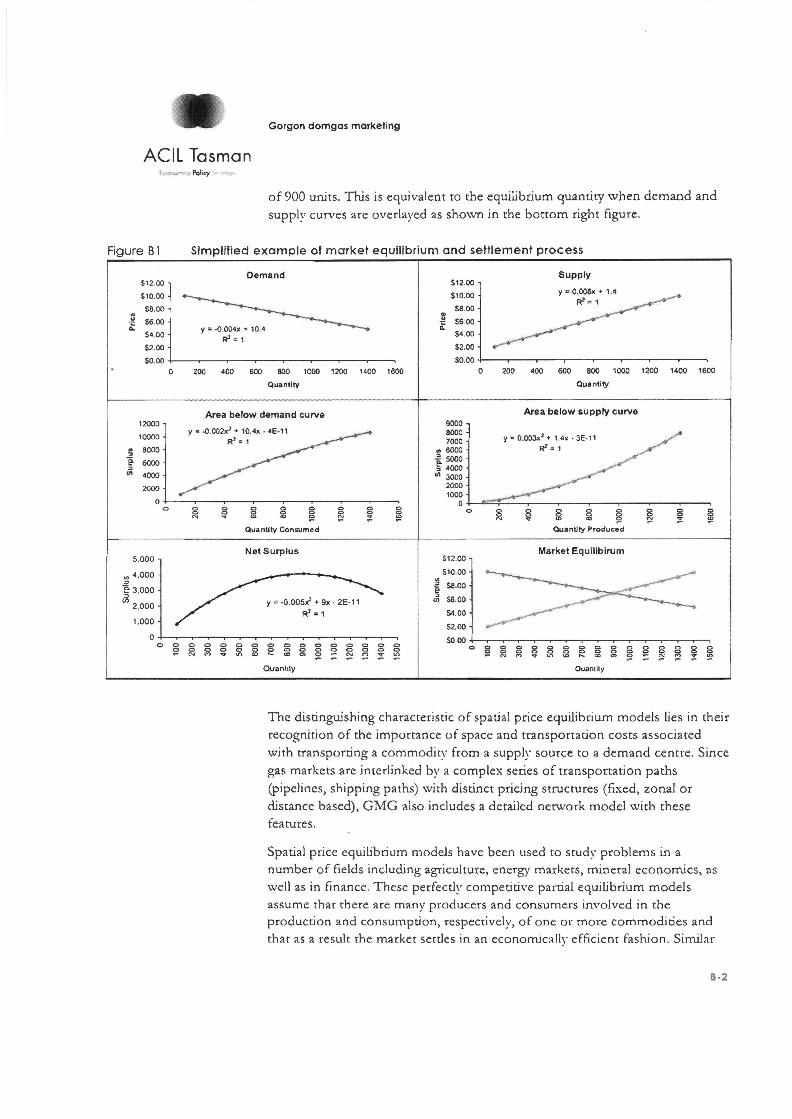
The equilibrium solution of the model is found through appljcauon of linear programming techniques which seek to maxirnise the sum of producer and consumer surplus across the entire market simultaneously. The solution results in an econornicallj~ efficient system where lower cost sources of supply are uulised before more expensive sources and end-users who have higher willingness to pay are served before those who are less wfing to pay. Through the process of masimising producer and consumer surplus, transportation costs are minimised and spatial arbitrage opportunides are eliminated. Each market is cleared with a single competitive price.
Data inputs
The inputs to GasMark can be categotised as follows:
Background and methodology
"gp. Gorgon domgas marketing
AClL Tasman
Exisdng and potential new sources of gas supply: characterised by assurnpuons about available reserves, production rates, production decline characteristics, and minimum price expectations of rhe producer.
Exisdng and potenrial new gas demand: demand may relate to a specific load such as a power station or fertiljser plant, or to a group or aggregation of customers. Loads are defined in terms of location, annual gas demand, p i ce tolerance and price elasticity of demand, and load factor.
Existing, new and expanded transmission pipeline capacity: pipelines are represented in terms of their geographic location, physical capacity, system ayerase load factor and tariffs.
Exisdng and potential new LNG facilities: LNG facilities include liquefaction plants, regasification (receivind terminals and assumptions regarding shipping costs and routes.
GnsMark assumptions - Demand
Domestic gas demand in Western Australia is represented in the model o n a 'bottom-up' basis, identieing major esisting gas users (for example, gas-fired power stations, mineral processing facilities, retail demand nodes) and potential new gas users (For example, new power stations and mining loads). Each existing and new entrant gas load is located spatially within the model by atrributing it to a defmed market location (for esample Perth, I<winana, Port FIedland). For each load, assumptions are made regarding the annual quantity o f gas sought by the load, the delivered price assumption associated with that level of demand, and the customer's price elasticit? of demand (that is, how much more or less gas the customer would take if the delivered price of gas to the customer was higher or lower than the assumed price tolerance).
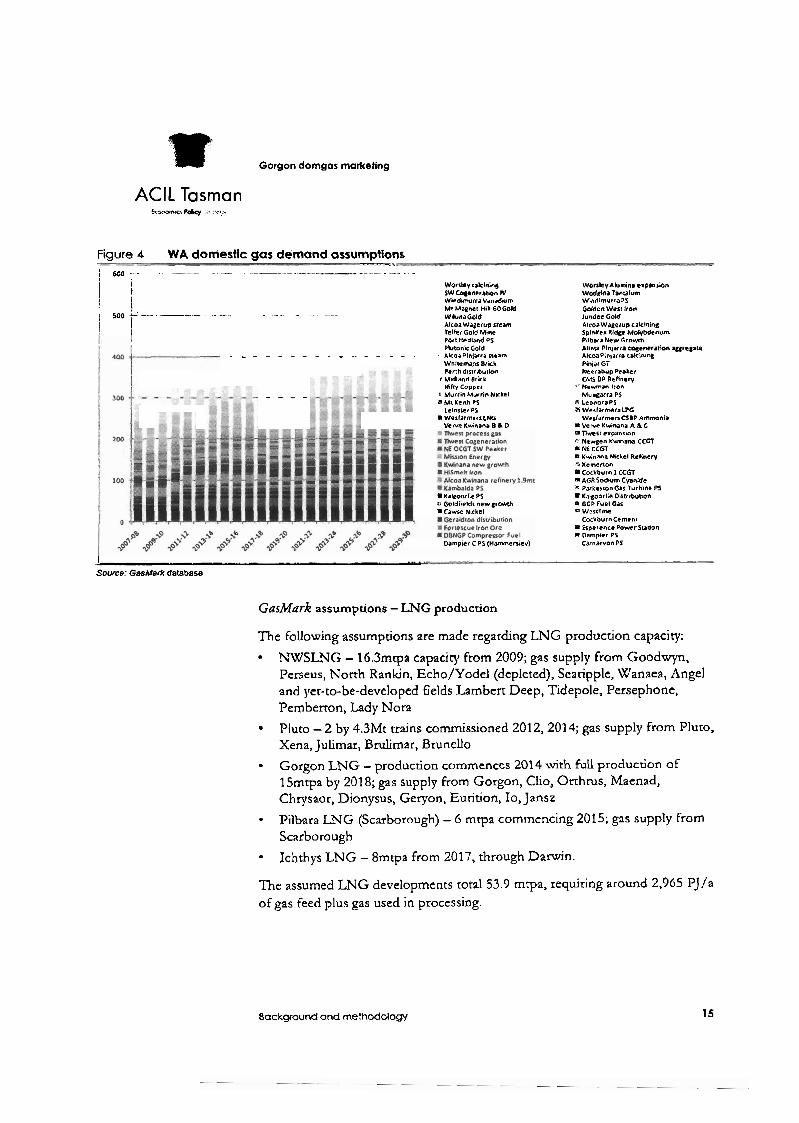
The domgas demand assumptions, which are the same for all scenarios, are illustrated in Figure 4. Demand in 2008 was estimated at about 323 PJ. As shown, it js assumed that demand will soften somewhat in 2009 and 201 0 reflecting the impacrs of the Global Financial Crisis but will then rise srrongly to 440 PJ/a by 2014-15. The forecast rate of growth will then slow with roral demand reaching 477 PJ/a by 2029-30.
Background ond mefhodology
llt Gorgon domaas marketing
ACIL Tasman tr-, Poky . rrc,..
Figure 4 WA domestic gas demand assumptions , ,. . -- 7,
j 600 - . - - - - --- . - " - Worslcycakinzng WonleyAClmn~ erprnrmn j 1 SW Cogenccralan N wcdgina Tanalum W~ndbmvrravanadam WtndmmurraPS
i . - . - - - - M Mane l n#l 60Cold Golden Well bon i 500 &-- -- - - - - - WtbnaGdd Jundee Gold 1 I Ncoa walerup u e m AlcoaWagerup caklnlng 1 Telkf Gold MIW SplnUex Ridge MoWdenum
Port nedbnd PS P#lbsraNew G r o h Pbtonk Gold Allnu Plnlarra cqcncralion ylre;ate - - - - - - - - - - - - - - - nlcar Plnwra scam AicoaPfn)a~(e cskinlnl Wnlwm&~r Bf rk Plnlaf GT Perrhdalr~bocbn NeerabupPenker
d Mldland Brrk CMS BP Reflnery *fry Copper N e w a n Iron - - - - I MY,(~ Murron Nuke1 Nungarra P$
S Mt Kenh PS 1 LfonoraPS Le8nlLCr PS V WealafNfsLPG WelfarmrrsCffi W e ~ l a r n n ~ U B P Ammnia V r ~ e Kvlnlna B h D m Vewr Kwtmna A & C
sa ilverr trpanrlon " Nawgen Kwmana CCGT m NE ccm I ? Kwnana Kemerlon Mckel Rehwrv
I Cockburn1 CCGl I. AGR Sodwrn Cvande "I PafkesmnGas Turbanc PS
KaCoortle PI KalgoorlieCmrrlueon bl Goldfields n e w ~ o w h I GGP Fuel Gar m C a w e N~ckel a Wertllme
CockburnCcmenl m Erparencr PowrSUdon r Darnpkr PS
Dampler C PS (Hanwncnley) Carnarvon PI
I , .... Source: GasMark database
GasMark assumptions - LNG production
The following assumptions are made regarding LNG production capacity:
NLVSLNG - 16.3mcpa capaciv from 2009; gas supply from Goodwyn, Perseus, North Rankin, Echo/Yodel (depleted), Searipple, \Xranaea, Angel and yet-to-be-developed fields Lambert Deep, Tidepole, Persephone, Pernberron, Lady Nora
Pluco - 2 by 4.3Mt trains commissioned 201 2,201 4; gas supply from Pluto, Xena, Julimar, BruLirnar, Brunello
Gorgon LNG - production commences 2014 with full production of 15mtpa by 201 8; gas supply from Gorgon, Clio, Orrhrus, Maenad, Chrysaor, Dion~rsus, Geryon, Eurition, 10, Jansz
Pilbara LNG (Scarborough) - 6 mtpa commencing 2015; gas supply from Scarborough
Ichthys LNG - 8mtpa from 2017, through Darwin.
The assumed LNG developments rota1 53.9 mpa, requiring around 2,965 PJ/a of gas feed plus gas used in processing.
Background ond methodology 15
I" Gorgon domgas marketing
ACIL Tasman :<$-->. , P d q *- .
GasMark assumptions - domgas supply
The following assumptions are made regardng domgas production capaciry. This represents the maximum capacity assumed to be available From each supply source; the actual capacicy may be lower if reserves constraints apply.
NWS domgas - GOOTJ/d capacity
Apache-operated John Brookes and Reindeer domgas projects - to 475 TJ/d aggregate capacity by 2012
Macedon domgas - 50 PJ/a capacity from 201 4
- with reserves of about 700PJ, Macedon experiences deliverability constrdnts from around 2024
Pluto domgas - 15MJ/d from 201 5, rising to 200 TJ/d from 201 8
- despatch is reserves limited
Gorgon domgas - Base Case with joint marketing
- first gas lOOTJ/d From 201 5 , rising to 275 TJ/d by 2023.
Scarborough domgas - 300TJ/d from mid-201 8
- production is reserves limiced.
We recognise that other potential LNG and domgas developments - such as the lvheatstone Project or the Browse LNG Development, o r alternative development of the resources identified above - are possible over the projection period. However, as we are interested in the relative deviations from the base case under joint marketing and separate marketing arrangements, the exact configura.tion of the base case is less imporrant. To confirm this inference, we test the sensitivity of the findings tn different base case scenarios (see Section 4.2).
3.4 Tasman GIobal CGE modelling
Tasman G'/obn/, ACIL Tasman's computable general equilibrium (CGE) model, was used to estimate the implications for the Western Australian and Australian economies of the domestic gas component of the Gorgon Gas Project.
Tusmn G'/oba/is an esrension of the Global Trade Analysis Project (GTAP) model constructed at the Centre for Global Trade ~lnalysis at Purdue University in the United States and its antecedents such as the Salter model. Ta.rman Grloba/builds on the GTAP model's equation structure and database by adding a range ofenhancements, including dynamics, detailed technology representation, greenhouse g2s emissions accounting, and the ability to model specific sub-regions of Australia, among others.
Bockground and merhodology
w Gorgon dorngos markeflng
AClL Tasman Lz<ncr*rr P& .+ F., ;,
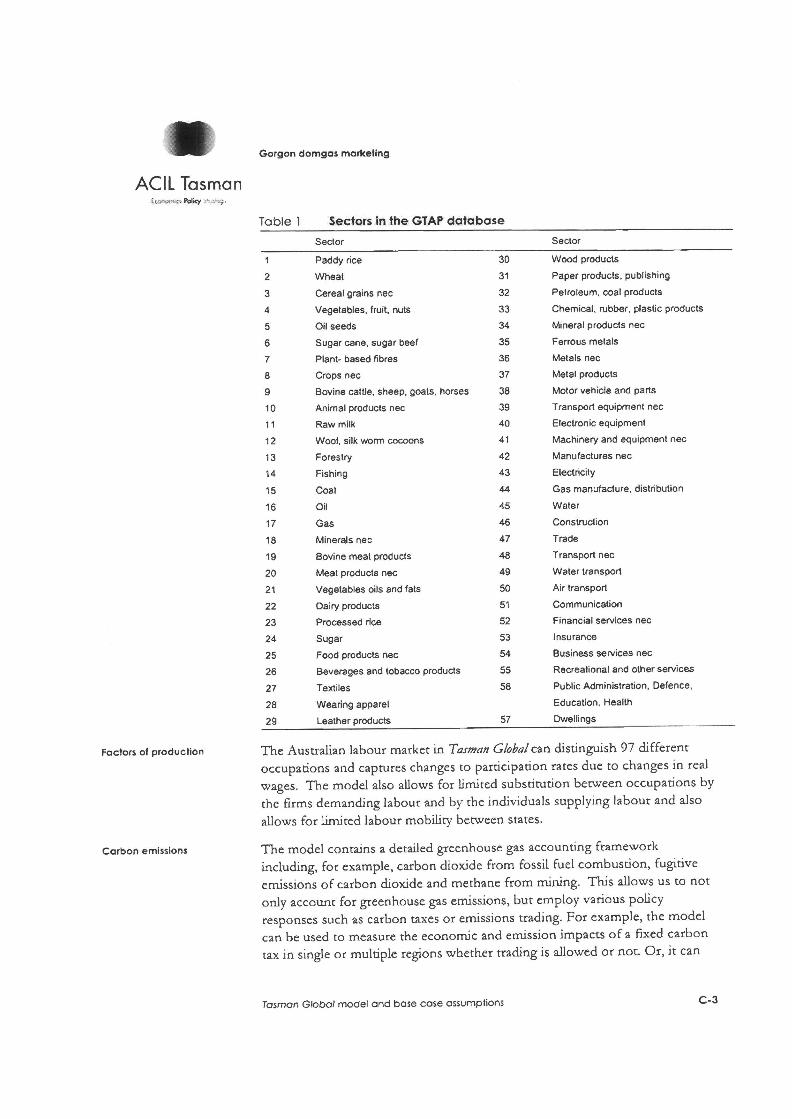
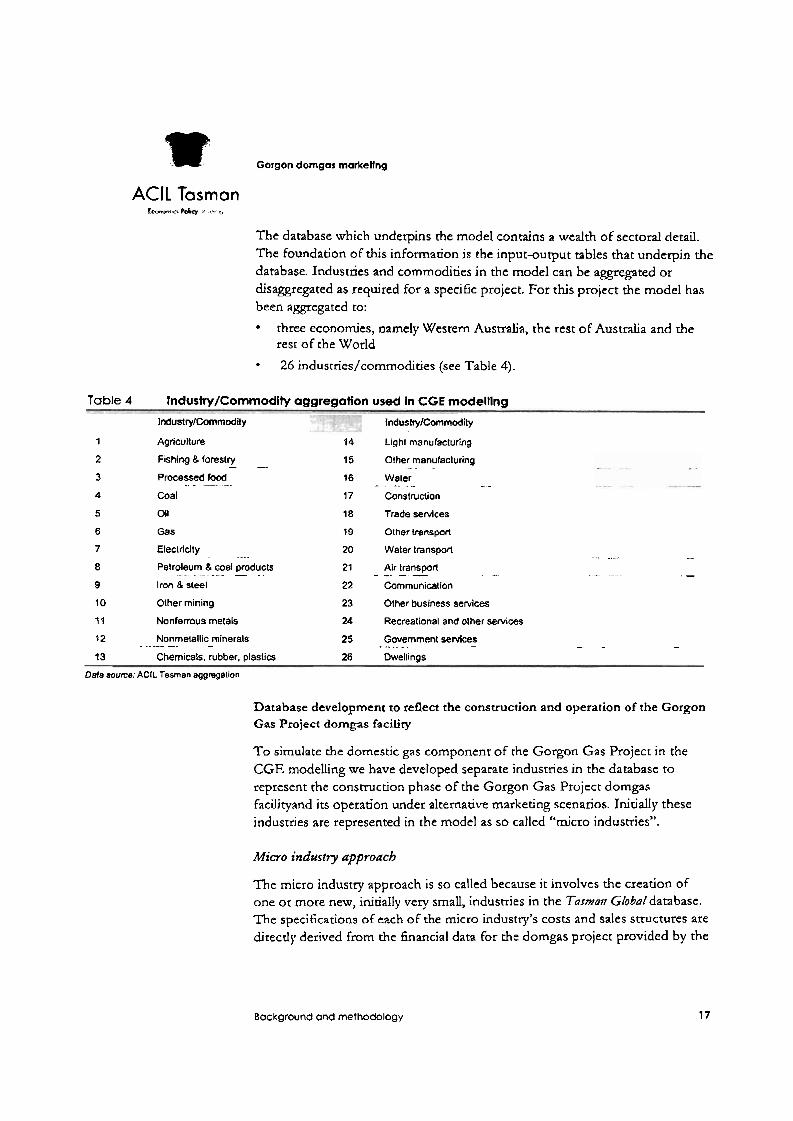
The database which underpins the model contains a wealth of sectoral detail. The foundation OF this information is the input-output tables that underpin the database. Industries and commodities in the model can be aggregated or disaggregated as required for a specific project. For this project the model has been aggregated to:
three economies, namely Western Australia, the rest of Australia and the rest of the World
26 industries/comrnodities (see Table 4).
Table 4 Industry/Commodity aggregation used In CGE modelling
IndustrylCommodiiy
1 Agriculture
2 Fishing 8 forestry - - 3 Processed food
-. - -" 4 Coal
IndustryICwnmodity
14 Light manufacturing
15 Other manufacturing
16 Water .. -. - - - 17 Construction
5 Oil 18 Trade services
6 Gas 19 Other lransport
7 Electricity 20 Water transporl . . . . . . . . . . ......- ......
8 Petroleum 8 coal products -.
21 Air transpofl ...-........... .. - - - - - ..... ... -. ...... . - 9 Iron 8 steel 22 Communicalion
10 Other mining 23 Other business services
11 Nonferrous metals 24 Recreational and other services
12 Nonmelallic minerals - -- -. 25 Government services - - - - - - -
13 Chemicals, rubber, plastics 28 Dwell~ngs
DM8 source: AClL Tasman aggregallon
Database development to reflect the construction and operation of the Gorgon Gas Project domgas facility
T o simulate the domestic gas component of the Gorgon Gas Project in the CGE modelling we have developed separate industries in the database to represent the construction phase of the Gorgon Gas Project dorngas facilityand its operation under alternative marketing scenarios. Initially these industries are represented in the model as so called "micro industries".
Micro indust y approach
The micro industry approach is so called because it involves the creation of one or more new, initially very small, industries in the Tasmun Globaldatabase. The specificauons of each O F the micro industry's costs and sales structures are ditecdy derived from the financial data for the dorngas project provided by the
Background and methodology 17
F" Gorgan damgas marketing
ACIL Tasman
Gorgon Joint Venture and from rhe &Mark modeling data.' At the outset, the new industries are necessarily very small so that their csistence in the Ta~tnan Globoldatabase does not affect the database balance o r the "budness- as-usual'' base case outcomes.
From out experience using the micro indusrry approach for project evaluadons is the most accurate way to capture the detailed economic linkages berween the Project and the other industries in the economy. Such an approach has evolved because each project is quite unique relative to the more aggregated industries in the Ta~mon Global database.
The business as usual base case
An important element of CGE analysis is the development of a business as usual base case. The base case developed for this project is a set of projections of key economic variables over the period to 2030. Once the base case has been developed it forms the basis against which rhe impact of a change in policy can be assessed.
For chis study the business as usual base case is rhe situarion where the domestic gas component of the GorLgon Gas Projecr does not proceed (the Base Case). This base case is then compared to the alternative policy scenarios:
the domestic gas component proceeds on a joint marketing basis (Scenario 1)
the domesdc gas component proceeds with the project partners undertaking separate marketing, which leads ro consequential delays in the commencement of domestic sales of Gorgon gas of:
- one year (Scenario 2A)
- three years (Scenario 2B)
- six years (Scenario 2C).
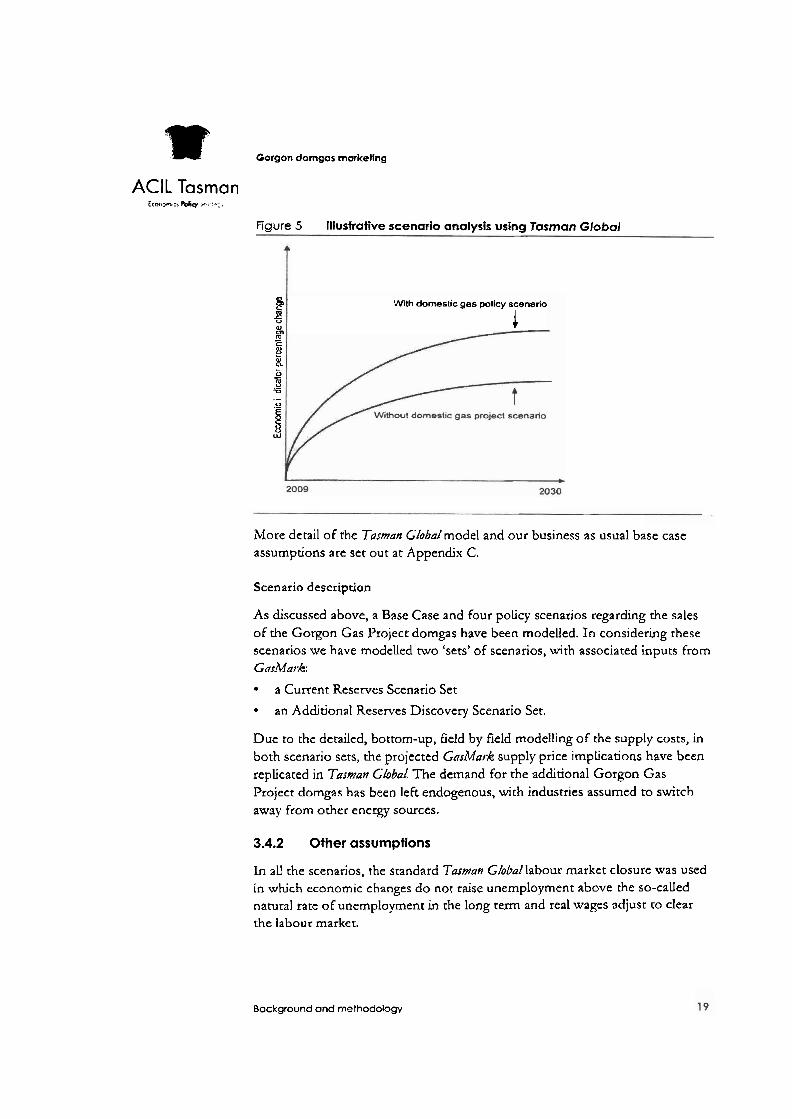
In CGE analysis the outcomes of rhe policy simulation modelled are reported as deviations from the business as usual base case (see F j p r c 5). To eliminate rhe impact of price movements in the results, economic variables such as the change Gross Domestic Product arc reported as deviations from their real rather than nominal values.
I ;\s previously nored, the marker price of rhc domgas sales under all sccnatios has been rakcn from rhc rcsulrs o f rhc GnA,lnrk modelling.
Background and methodology
'r* Gorgon domgas rnarketlng
AClL Tasman Z<an.n.<~ Pdii r- ..r..
Figure 5 lllusfrative scenario analysis using Tasman Global
0 a, Wth domestic gas policy scenario s r 0
m 0, m
1 E 5 a L
0
B = .- 0 .-
I W
More detail of rhe Tosman Global model and our business as usual base case assumptions are set out at Appendix C.
Scenario description
As discussed above, a Base Case and four policy scenarios regarding the sales of the Gorgon Gas Project dorngas have been modelled. In considering these scenarios we have modelled two 'sets' of scenarios, with associated inputs from GasMark
a Current Reserves Scenario Set
an Addjtional Reserves Discovery Scenario Set.
Due to the detailed, bottom-up, field by field modelling of the supply costs, in both scenario sets, the projected GasMark supply price implications have been replicated jn Tasman GhbaL The demand for the additional Gorgon Gas Project domgas has been left endogenous, with industries assumed to switch away from other energy sources.
3.4.2 Other assumptions
In all the scenarios, the standard Tmmun Globallabour market closure was used in which economic changes do not raise unemployment above the so-called natural rate of unemployment in the long term and real wages adjust to clear the labour market.
Bockground and methodology

w Gorgon domgas markellng
AClL Tasman : cs . rm. tPdcr . '
Under the base case scenario, the Carbon Pollution Reduction Scheme is assumed to proceed as currently planned, with a 2020 emission targer of net greenhouse %as emissions assumed to be 5 per cent below 2000 levels.
Bockground and methodology
Gorgon domgas marketing
ACIL Tasman Pdq : > ,,
GasMark modelling results Zn order to assess the potential impact of the Gorgon Gas Projecr domgas on gas consumption and market prices for gas in Western Australia, two sets of scenarios have been set up in the GajMnrk model:
Current Reserves Scenario Set
Additional Reserves Discovery Scenario Set.
4.1 Current Reserves Scenario Set
The first scenario set CCurrenr Reserves Scenario Set') assumes that the gas reserves available in each field are limited to the proven and probable (2P) reserves currently remaining in developed fields, plus P50 Contingenr Resources' in as-yet undeveloped fields, as set out in the latest official figures published by the Western Australian governmenr (Department of Mines &
Petroleum, 2009). According to rhese esumaces, the remaining 2P resources in developed fields stood at 21 ,I 92 PJ as a t end 2007 with adjustmenn for 2008 consumption, while the P50 contingent resources in undeveloped fields stood at some 115,500 PJ.
The GnsMmk model has been set up to honour reserves consttaints by limiting the annual rate of producdon for each field to 20 per cent of the remaining reserves. The model keeps track of remaining reserves for each field by depleting resenres each year to account for prior year production, and adding back any assumed additions rhrough new discoveries. For the "Current Reserves Scenatio Set" no additions to reserves have been assumed.
It also reflects the expectation that most new domgas projects will only be developed in conjuncuon with new LXG projects - urluch wdl require dedcation of reserves and production capacity as a pre-condition for financing. It assumes thac, since the LNG sales underpin new project development, available gas production must be allocated to LNG contract commitments.
Limiting the avatlable reserves and'resources to those already booked means that many of the existing and proposed gas supply sources experience reserves constraints within the modelling period, so that availability of domgas gas becomes restricted. As a result, domestic consumption falls steeply and prices rise rapidly as supply consuains. The gap between demand and consumptions means that a substantial level of unsatisfied demand emerges.
? T50' refers ro a 50 per cent Probability of Esceedance -which means rbar there is an equal probability of the acmal resource being higher rhan or lo\vcc than che estimate. Ir effectively represents the 'most likely' case based on existing evidence.
GosMork modelling results 21
r" Gorgon domgas marketing
AClL Tasman ' I . " - : : , . ... .
The Current Reserves Scenario Set includes the following five scenarios:
Base Case scenario- escluding Gorgon domgas * 'Scenario 1' - with joint marketing of domgas
'Scenario 2A' -with separate marketing of domgas, leading to a delay of one year in commencement of domgas sales
'Scenario 2B' - with separate marketing of domgas, leadng co a delay of three years in commencement of domgas sales
'Scenario 2C' - with separate marketing of domgas, leading to a delay of six years jn commencement of domgas sales.
4.2 Additional Reserves Discovery Scenario Set
It can be argued that relying solely on current book.ed reserves as a basis for future supply of domgas in Western Australia is unduly consenrative and that, given the histon; of ongoing reselves discovery it is reasonable to expect that substantial additions to reserves suitable for supply to rhe domesdc market will occur w i t h the modelling period..z
For this reason a second scenario set (the "Additional Reserves Discovery Scenario Set'') bas been developed that is the same in all respects as the "Current Reserves" Scenario Set except for an assumption that for each gas field addtional resources equal to 50 per cent of the current booked resenles/resources will be discovered. l X s in\~olves an assumption of discovery of a Further 10,600 PJ of resenyes in association with currentl!. developed fields, and a Further 58,000 PJ associated with currently undeveloped resources. The Additional Resenres Discoven! Scenario Set allows for the sensin\+ of the results to the supply of gas in the base case to be assessed.
The ~Idditional Resemes Discovery Scenario Set includes the same five scenarios as the Current Reserves Scenario Set, the only difference being the inclusion of the add~tional reserves discoveries:
Base Case scenario- excluding Gorgon domgas; 50 per cent additional resenes discoveries
'Scenario 1' -with joint marketing of domgas; 50 per cent additional reserves discoveries
The counter argument is that policy formulnted on che basis o f an ussu,np/io~t rhat additional rcsourccs w i l l bc discovered and de\-eloped ro suppl!. the Jonlestic gas marker involves a significant lcvcl o f risk that the assumed levcl o i incrcnicnrd resources u~ill nor emerjic, or \\.ill be uneconomic ro develop.
GosMork modelling results 22
r" Gorgon domgas marketing
AClL Tasman b<-4% Pdy rivt.
'Scenario 2A'-with separate markedng of domgas, leading co a delay of one year in commencement ofdomgas sales; 50 per cent addinonal reserves discoveries
'Scenario 2B' - with separace marketing of domgas, leading ro a delay of rhree years in commencement of domgas sales; 50 per cent addirional reserves cbscoveties
'Scenario 2C' - with separate markeong of dorngas, leading to a delay of six years in commencement of domgas sales; 50 per cent additional reserves discoveries.
4.3 Modelling Results - Current Reserves Scenario Set
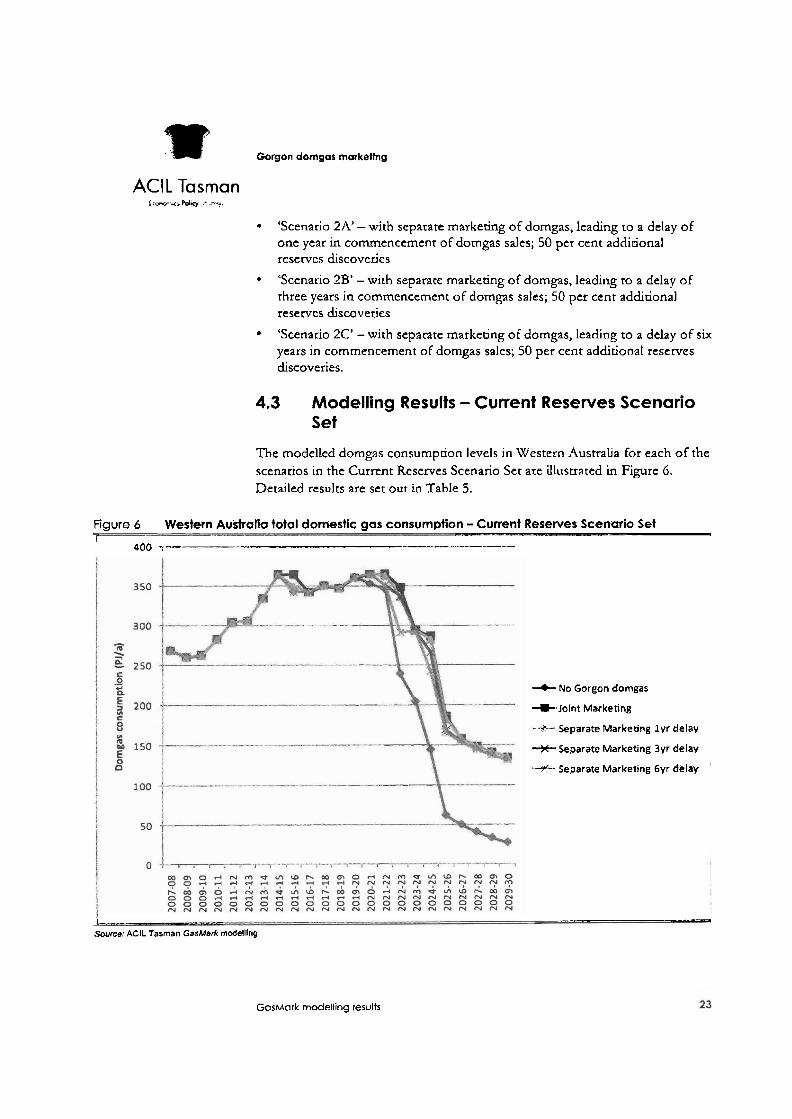
The modelled dorngas consumption levels in Western Australia for each of the scenarios in the Current Reserves Scenario Set are illustraced in Figure 6. Detailed resulcs are set out in Table 5.
Figure 6 Western Australia total domestic gas consumption - Current Reserves Scenario Set ? _I__-
. 400 7- A- ------A-
+ No Gorgon domgas
+Joint Marketing
-4 - Separate Marketing l y r delay
-+?-Separate Marketing 3yr delay
+ Separate Marketing 6yr delay
L._" a --.-- .......,-. -.---- --...-
Source! AClL Tasman GasMark modelling
GasMark modelling results
%C Gorgon domgas marketing
AClL Tasman ! **.llifwk-, .
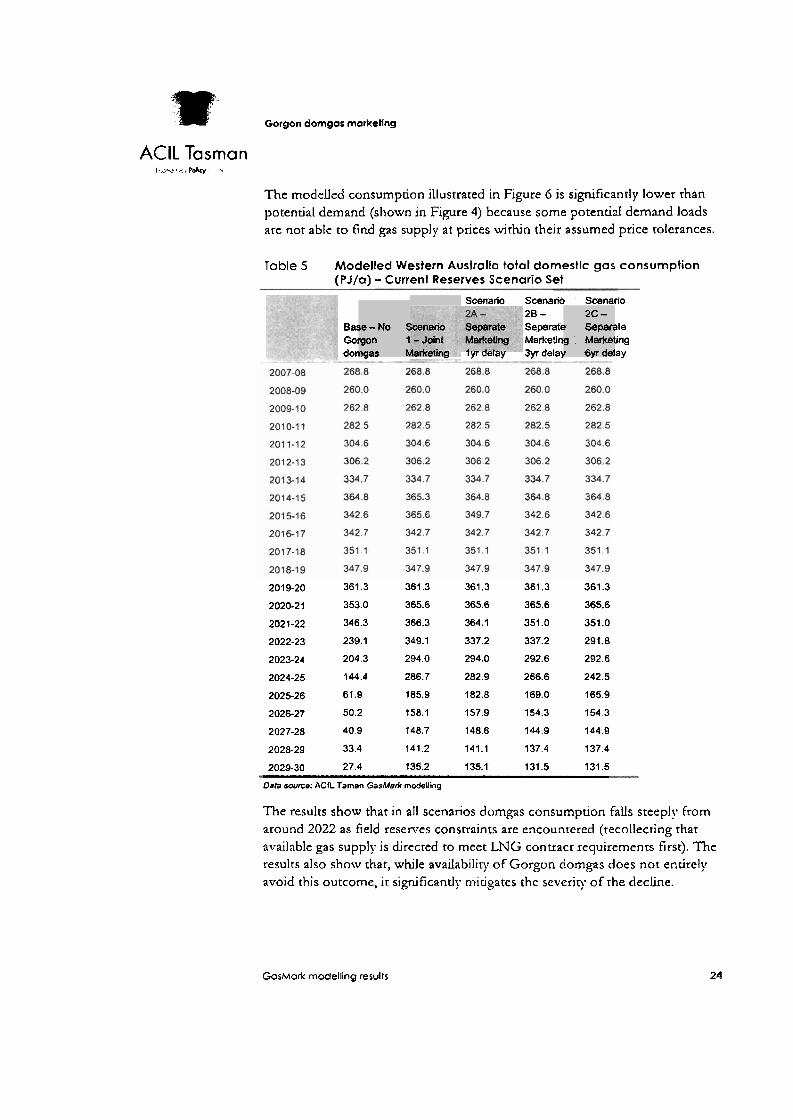
The modelled consumpdon illustrated in Figure 6 is significantly lower rhan potential demand (shown in Figure 4) because some potentizl demand loads are not able to find gas supply at prices within their assumed price tolerances.
Toble 5 Modelled Western Australia total domestic gas consumption (PJ/a) - Current Reserves Scenario Set
Scenario Scenario Scenario 28 -
Ba: Separate ~ l e Got Marketin ling don _ - iyr oetay 3yr dela) . ay
;e- No 6 rgon 1 naas A
2C - r Separz g Markel I 6vr del
201 9-20 361.3 361.3 361.3 361.3 361.3
2020-21 353.0 365.6 365.6 365.6 365.6
2021-22 346.3 366.3 364.1 351.0 351.0
2022-23 239.1 349.1 337.2 337.2 291.8
2023-24 204.3 294.0 294.0 292.6 292.6
2024-25 144.4 286.7 282.9 266.6 242.5
2025-26 61.9 185.9 182.8 169.0 165.9
2026-27 50.2 158.1 157.9 154.3 154.3
2027-28 40.9 148.7 148.6 144.9 144.9
2028-29 33.4 141.2 141.1 137.4 137.4
2029-30 27.4 f35.2 135.1 131.5 131.5
Data sowce: A C L Taman GasMark modelling
The results show thar in all scenarios domgas consumption falls steeply from around 2022 as field resenrcs constraints are encountered (recollecting that available gas supply is drecred ro meet LNG contract requiremenrs first). The results also show thar, while availability of Gorgon domgas does not entirely avoid this outcome, it si,pficantly mitigates the scverjy of the d e c h e .
GosMork modelling results 24
Gorgon domgas marketing
AClL Tasman f r o x n ~ r ,. rrqr.
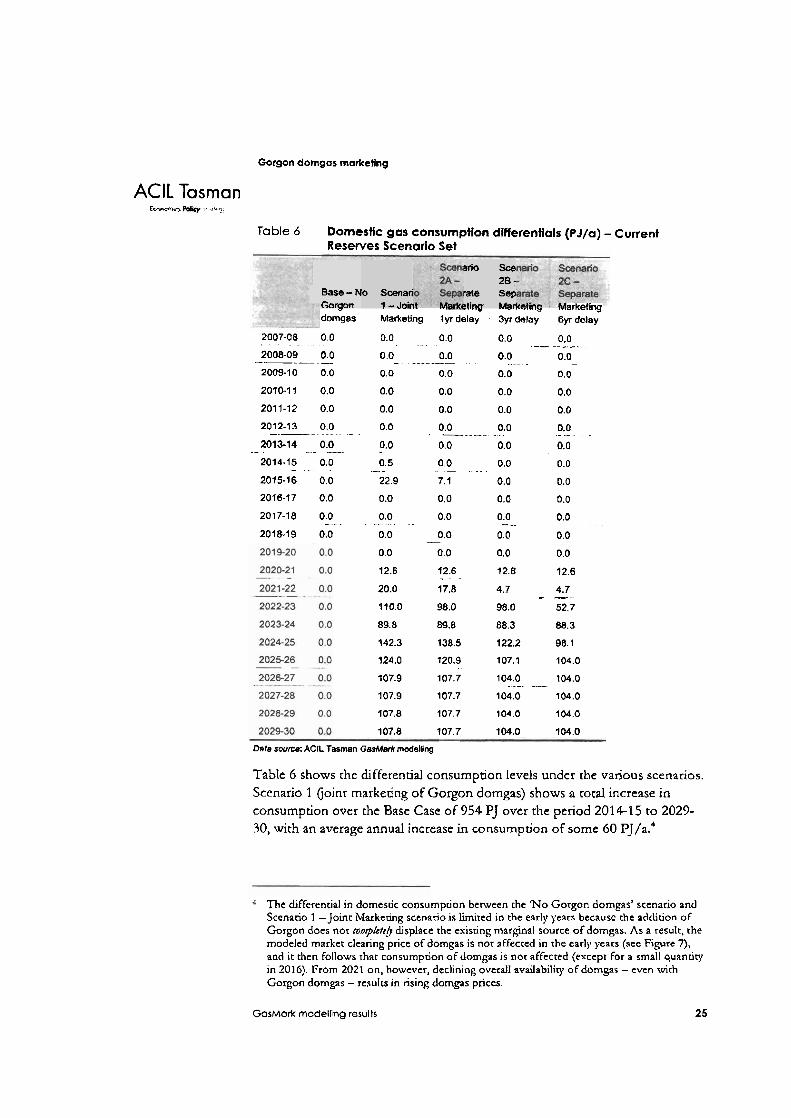
Table 6 Domestic gas consumptfon differentials (PJ/a) - Current Reserves Scenario Set
Base - N Gormn " domgas
2007-08 0 0
2008-09 0.0 - - - - - . -- 2009-10 0.0
201011 0.0
2011-12 0.0
2012-33 0 0 -.-A - .
2013-14 0.0 . . --- -. 2014-15 0.0 - . . 2015-16 0.0
2016-17 0.0
2017-18 0.0 - -. 2018-19 0.0
:o S w a n 1 - Jdr
nio Sce 28 -
'ate sep !linn Mar .-. ....... . . - . . . . . . .- ...-. .= ... arketing
Marketing lyr delay 3yr delay 6yr delay
0.0 0.0 0.0 0.0 .- . . . . . . . . . . . - - - - .- - . .
0.0 0.0 -. - - 0.0 0.0 ................. . . . ........ -
0.0 0.0 0.0 0.0
0.0 0.0 0.0 0.0
0.0 0.0 0.0 0.0
0.0 0.0 0.0 0.0 . ................. .- .- . - 0.0 0.0 0.0 0.0 - . . . . . . . . .
0.5 .- - 0.0 - 0.0 0.0 ... ..... 22.9 7.1 0.0 0.0
0.0 0.0 0.0 0.0
0.0 0.0 0.0 -- 0.0 . . . . . . . . . . . . . . . . .
0.0 0.0 0.0 0.0 - 0.0 0.0 0.0 0.0
12.6 12.6 12.6 12.6 - . 20.0 17.8 4.7 4.7 - -. ....
110.0 98.0 98.0 52.7
89.8 89.8 88.3 88.3
q42.3 138.5 122.2 98.1
124.0 120.9 107.1 104.0 .. 107.9 107.7
. ~
104.0 - 104.0 .... . .
107.9 107.7 104.0 104.0
107.8 107.7 104.0 104.0
107.8 107.7 104.0 104.0
Data s w m : AClL Tasman GatMark modelling
Table 6 shows [he dfferential consumption levels under the various scenarios. Scenario 1 Goinr marketing of Gorgon domgas) shows a toral increase in consumption over the Base Case of 954 PJ over the period 2014-1 5 to 2029- 30, with an average annual increase in consumption of some 60 P J / ~ . ~
The differential in domesuc consumpdon benveen the 'No Gorgon d o m p s ' scenario and Scenario 1 -Joint Markedng scenario is limited in the early years because the addition of Gorgon does not ronplettb displace the exisring nrarginal source of domgas. As a result, the modeled market clearing price of domgas is not affecred in the early years (see Figure 7), and it then follows rhat consumpdon of domg-as is nor affected (except for a small quanciqr in 2016). From 2021 on, however, declining overall availability of domgas - even urirh Gorgon domgas - results in rising domgas prices.
GosMork modelling results 25
w Gorgon domgas marketing
AClL Tasman
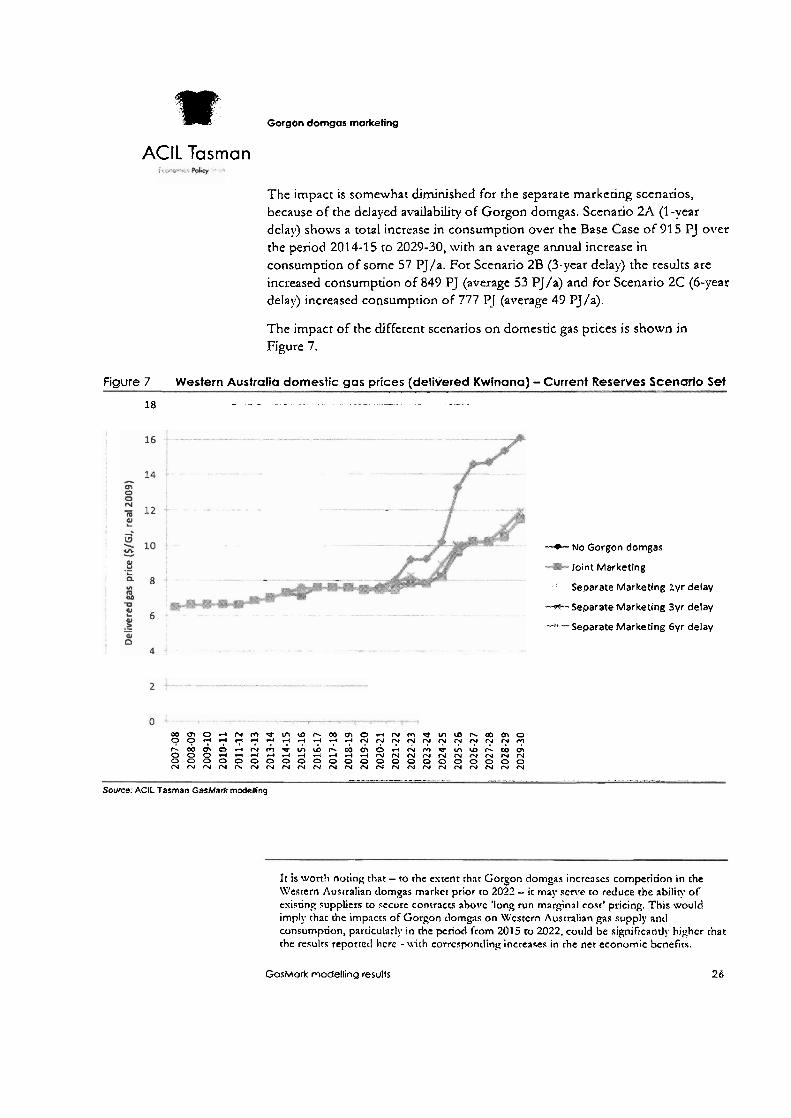
The impact is somewhat diminished for the separate marketing scenarios, because of the delayed availability of Gorgon domgas. Scenario 2A (1 -year delay) shows a total increase in consumption over the Base Case of 91 5 Pj over the period 201 4-1 5 to 2029-30, with an average annual increase in consumpdon of some 57 PJ/a. For Scenario 2B (3-year delay) the results are increased consumption of 849 PJ (average 53 PJ/a) and for Scenario 2C (6-year delay) increased consumption of 777 PJ (average 49 PJ/a).
The impact of the cliflerent scenarios on domestic gas prices is shown in Figure 7.
Figure 7 Western Australia domestic gas prices (delivered Kwfnana) -Current Reserves Scenario Set . . - -
18 - - - - - - - - - -
+No Gorgon domgas
Joint Marketing
Separate Marketing l y r delay
-Separate Marketing 3yr delay
--"*--Separate Marketing 6yr delay
w m o d ~ m e m ~ ~ a m o ~ ~ m ~ r n m ~ m m o 4 ' ? ' 7 ' 7 ? " ? ? ~ ? 7 ' ' 7 " " " " " " " N N " ? ~ W O O d N m W ~ W b W ~ O d N m U ~ W b W m 0 0 0 d - 4 d + 4 + 3 d d d N N N N N N N N N N 0 0 0 0 0 0 0 0 0 0 0 0 0 0 0 0 D 0 0 0 0 0 0 N N N N N N N N N N N N N N N N N N N N N N N
- . .- - " - . . " - A , - - -
Source. AClL Tasman GasMark modelltng
It is wort11 noring that - to the extent that Gorgon domgas incrcascs cornperition in the K"/csrern Aus~ralian tlomgas mnrkct prior to 2022 - i t may Renee co reduce rhe abiliry o f exisring suppliers to secure contracts abovc 'long run marginal cost' pricing. This would imply that the impacts of Gorgon clomgas on \Vcstcrn Australian gas supply ant1 consumpuon, paruculatl!~ in the period fcom 2015 to 2022. could be significandy highcr that rhr results reporrcil hcrc - uirh corrcspontling increases in rhe ner economic bcnefirs.
GosMork modelling results 25
w Gorgon domgas markeHng
AClL Tasman f%-%r P d i y . L..;.
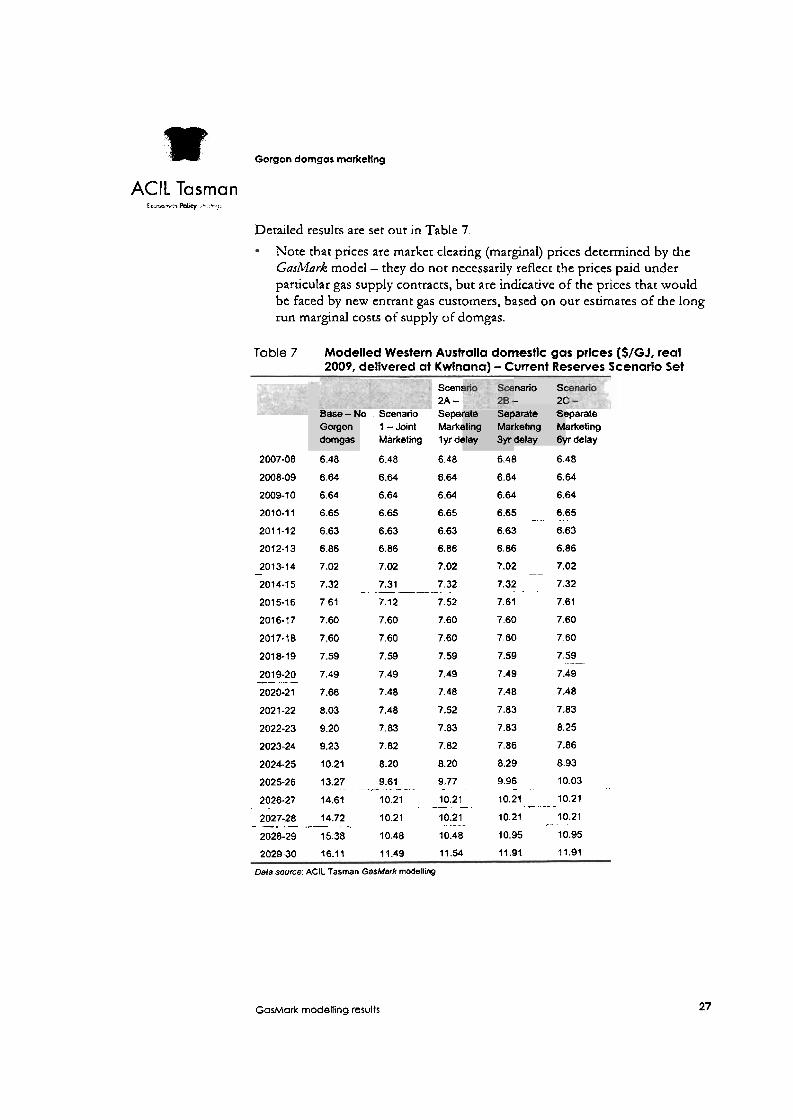
Derailed results are set out in Table 7.
Note that prices are marker clearing (marginal) prices determined by the GasMark model - they do not necessarily reflect the prices paid under particular gas supply contracts, but are indicative of the prices that would be faced by new entrant gas customers, based on our estimates of che long run margnal costs of supply of domgas.
Table 7 Modelled Western Australia domestic gas prices ($/GJ, real 2009, delivered at Kwinana) - Current Reserves Scenario Set
Sceni 2A -
lo Scenario Sepal 1 -Joint Markt Marketing 1 yr dc
Base - N Gorgon domgas
rate Sep >ling Mar ?lay 3yr
nario St 2(
a t e Sc keting M delay 6)
warate arketing tr delay
2007-08 6.48 6.48 6.48 6.48 6.48
2008-09 6.64 6.64 6.64 6.64 6.64
2009-10 6.64 6.64 6.64 6.64 6.64
2010-11 6.65 6.65 6.65 6.65 6.65 . - . . . . . . 2011-12 6.63 6.63 6.63 6.63 6.63
2012-13 6.86 6.86 6.86 6.86 6.86
2013-14 7.02 - 7.02 7.02 7.02 7.02
2014-15 7.32 7.31 7.32 - . . - .. ..... 7.32 .- - . 7.32
2015-16 761 7.12 7.52 7.61 7.61
2016-17 7.60 7.60 7.60 7.60 7.60
2017-18 7.60 7.60 7.60 7.60 7.60
2018-19 7.59 7.59 7.59 7.59 7.59
2019-20 7.49 - - - - 7.49 7.49 7.49 7.49 . . .....
2020-21 7.66 7.48 7.48 7.48 7.48
2021-22 8.03 7.48 7.52 7.83 7.83
2022-23 9.20 7.83 7.83 7.83 8.25
2023-24 9.23 7.82 7.82 7.86 7.86
202425 10.21 8.20 8.20 8.29 8.93
2025-26 13.27 9.61 -- - 9.77 ... - . . . . . . - . ....
9.96 - 10.03 -.
2026-27 14.61 10.21 10.21 . - . -. 10.21
. . - - .- - - - 10.21 . .
2027-28 14.72 10.21 10.21 10.21 10.21 ........ - -- . - .-- ............ ... 2028-29 15.38 10.48 10.48 10.95 10.95
2029 30 16.11 1 1.49 11.54 11.91 11.91
Data source: AClL Tasman GasMerh modelling
GasMark modelling results 27
m Gorgon domgas marketing
AClL Tasman :. - r c Wi-,
. L 8 -
jeparate Aarketing lyr delay
S" -
Separate Marketing 6yr delay
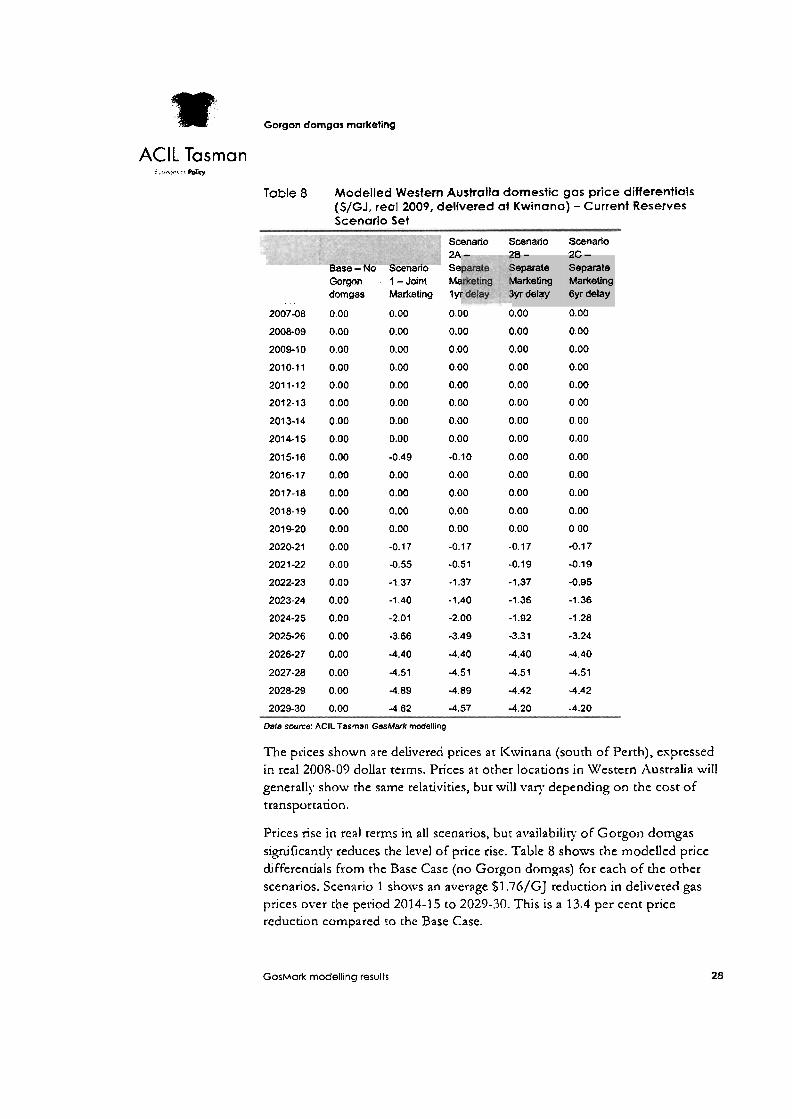
Table 8 Modelled Western Australia domestic gas price differentials ($/GJ, real 2009, delivered at Kwinana) - Current Reserves Scenario Set
Scenario Scenario Scenario 2A - 3 ~ - 3r-
~ a s e - N O scenano Se Gorgon . I -Joint Ma
. . . domgas Marketing l y r
2007-08 0.00 0.00 0.00 0.00 0.00
2008-09 0.00 0.00 0.00 0.00 0.00
200410 0.00 0.00 0.00 0.00 0.00
2010-11 0.00 0.00 0.00 0.00 0.00
2011-12 0.00 0.00 0.00 0.00 0.00
2012-13 0.00 0.00 0.00 0.00 0 0 0
2013-14 0.00 0.00 0.00 0.00 0.00
2014-15 0.00 0.00 0.00 0.00 0.00
2015-16 0.00 -0.49 -0.10 0.00 0.00
2016-17 0.00 3.00 0.00 0.00 0.00
2017-18 0.00 0.00 0.00 0.00 0.00
2018-19 0.00 0.00 0.00 0.00 0.00
2019-20 0.00 0.00 0.00 0.00 0.00
2020-21 0.00 -0.17 -0.17 -0.17 -0.1 7
2021-22 0.00 -0.55 -0.51 -0.19 -0.19
2022-23 0.00 -1.37 -1.37 -1.37 -0.95
2023-24 0.00 -1.40 -1.40 -1.36 -1.36
2024-25 0.00 -2.01 -2.00 -1.92 -1.28
2025-26 0.00 -3.66 -3.49 -3.31 -3.24
2026-27 0.00 -4.40 4.40 -4.40 4.40
2027-28 0.00 -4.51 -4.51 -4.51 4.51
2028-29 0.00 4.89 -4.89 -4.42 -4.42
2029-30 0.00 4.62 -4.57 -4.20 -4.20
Dala some: AClL Tasrnan GasMark modelling
The prices shown are delivered prices at I<winana (south of Perth), expressed in real 2008-09 dollar terms. Prices at other locations in Western Australia urill generally show the same relativities, bur will v a n depending on the cost of transportation.
Prices rise in real terms in all scenarios, but availability o f Gorgon domgas ~i~gnificantly reduces the level of price rise. Table 8 shows the modelled price &€ferentials from the Base Case (no Gorgon domgas) for each of the other scenarios. Scenario 1 shows an average $1.76/GJ reduction in delivered gas prices over the period 2014-15 to 2029-30. This is a 13.4 per cent price reduction compared to the Base Case.
GosMork modelling results 28
m Gorgon dorngos marketing
ACll Tasman E c m > * ; ..% r,
Again the impact is somewhat diminished for the separate marketing scenarios, because of the delayed availability of Gorgon domgas. Scenario 2A (1 -year delay) shows an average price reduction of %l.71/GJ (12.7 per cent below Base Case) over the period 2014-15 to 2029-30. Scenario 2B (3-year delay) results in an average price reduction of $1.62/GJ (12.1 per cent below Base Case) over a similar period, and Scenario 2C (6-year delay) an average price reduction of $1.55/GJ (1 1.4 per cent below Base Case).
The transient price impact in 2015-16 for Scenarios 1 and 3A is a result of supply from the initial tranche of Gorgon dorngas causing a swicch in the marginal source of supply in that year. Subsequently, domgas supply from Gorgon is insufficient to cause marginal supply switching until che expansion of domgas capacity in 2020-21. The major price differentials are then observed from 2021 -22 on as severe domgas deliverability constraints driven by declining resemes impact the marker.
4.4 Modelling Results - Additional Reserves Discovery Scenario Set
Tbe modelled domgas consumption levels in Wesrcm Australia for each of the scenarios in the Additional Reserves Discovery Scenario Set (with 50 per cent increase in available reserves) are illustrated in Figure 8. Detailed results are set out in Table 9.
GasMark modelling results
"31 Gorgon dorngos marketing
AClL Tasman f .ii.Y.?PdKy
Figure 8 W e s t e r n Australia total domestic g a s consumption -Additional Reserves Discovery Scenario Set
--r& No Gorgon domgas
--8-- Joint Marketing -- .-. ----. - Separate Marketing 3yr delay
"- Separate Marketing 3yr delay
I** Separate Marketing 6yr delay
h i Q d A A A i h d & & & o A A A & ~ & & m Q O O O d d d d d d d d d d N N N N N N N N N N 0 0 0 0 0 0 0 0 0 0 0 0 0 0 0 0 0 0 0 0 0 0 0 N N N N N N N N N N N N N N N N N N N N N N N
........................................ ............... -, . . . . . . . ... -........... . . . . . . .............................. -. . . . . . . . . . . . . . . . . . . . . . . . . . . . .
Source: AClL Tasman GasMark modelling
With the additional resenrcs available, the steep decline in domgas supp1y chat was obsenred in the Current Resenres scenario set j s deferred until after the end of the modelling period.
GasMork modelling results
m Gorgon domgas marketing
AClL Tasman C m s l pdcr >.' .**j.
Table 9 Modelled Western Australia total domestic gas consumption (PJ/a) - Additional Reserves Discovery Scenario Set
Base- b Gorclah - dmgas
2007-08 268.8
ario Srz 2 8 .
ate Ser ~tirw Ma1 -
Marketing lyr delay naong
3yr delay
268.8 - - 260.0 - 262.8
282.5
304.6
cenario m Y - eparate ,-a....:--
N l ~ l K W l t r l Q
6yr delay
268.8
260.0 . - 262.8
282.5
304.6
2020-21 376.3 380.6 377.9 377.9 - 377.9 - . - . - 2021-22 366.3 379.4 378.8 377.2
-. - - 369.7 ...... . . . . . . . .
2022-23 369.7 379.9 377.9 369.7 369.7
2023-24 375.1 383.5 376.4 375.1 375.1
2024-25 377.5 377.5 377.5 377.5 377.5
2025-26 364.3 376.9 376.9 376.9 .-
376.9 . . . ............ . . . . . ........ . - -
2026-27 366.1 383.3 383.3 383.3 383.3 -- -- -. - - . 2027-28 367.0 384.2 384.2 384.2 384.2
2028-29 367.7 385.2 385.2 385.2 385.2
202930 372.8 389.6 389.6 389.6 388.0
Data swne: AClL Taman GasMafk modelling
Once again availabiliry of Gorgon domgas bolsrers supply to the domestic market, although the differential between the with and without Gorgon domgas scenarios is not as large as in the Current Resenres Scenario Set.
GasMork modelling results 3 1
w Gorgon dorngas marketing
AClL Tasman ,< -;. ..Pelw
Toble 10 Domestic gas consumption differentials (PJ/a) -Additional Reserves Discovery Scenario Set
Sw 2A
No Scenario Sek -.-.- --,--.- separate oinl 114arketimg Marketing Marketing etlng lyr delay 3yr delay 6yr de!ay
..,--- '=orgo1 domga
1 I - J s Mark
2010-1 1 0.0 0.0 0.0 0.0 0.0
2011-12 0.0 0.0 0.0 0.0 0.0
2012-13 0.0 0.0 0.0 0.0 0 0
2013-14 0.0 0.0 0.0 0.0 0.0
2014-15 0.0 0.0 0.0 0.0 0.0
2015-16 0.0 14.2 14.2 0.0 0.0
2016-17 0.0 23.0 23.0 0.0 0.0
2017-18 0.0 13.9 9.7 3.8 0.0
2018-19 0.0 11.6 9.8 1.8 0.0
2019-20 0.0 1 .O 1 .O 1.0 0.0
2020-21 0.0 4.3 1.5 1 .5 1.5
2021-22 0.0 13.1 12.5 10.9 3.4
2022-23 0.0 10.2 8.2 0.0 0.0
2023-24 0.0 8.3 1.3 0.0 0.0
2024-25 0.0 0.0 0.0 0.0 0.0
2025-26 0.0 12.6 12.6 12.6 12.6
2026-27 0.0 17.2 17.2 17.2 17.2
2027-28 0.0 17.2 17.2 17.2 17.2
202829 0.0 17.5 17.5 17.5 17.5
2029-30 0.0 16.8 16.8 16.8 15.1
Data source: AClL Tasman GasMarh mocdling
Table 10 shows the differential consumption le.ilels under the various scenarios. Scenario 1 (joint marketing of Gorgon domgas) shows a total increase in consumption over the Base Case of 181 PJ over the period 2014-15 to 2029-30, with an average annual increase in consumption of some 11.3 PJ/a. The impact is somewhat diminished for the separate marketing scenarios, because of the delayed availability of Gorgon dorngas. Scenario 2A (1 -year delay) shows a total increase in consumption over the Base Case of 163 PJ over the period 2014-15 to 2029-30, with an average annual increase in consumption of some 10.2 PJ/a. For Sccnario 2B (3-year delay) the results are increased consumption of 100 PJ (average 6.3 PJ/a) and for Scenario 2C: (6- year delay) increased consumption of 85 PJ (average 5.3 PJ/a).
GosMork modelling results 32
Gorgon domgas marketing
AClL Tasman fkuama, * , ./..r.
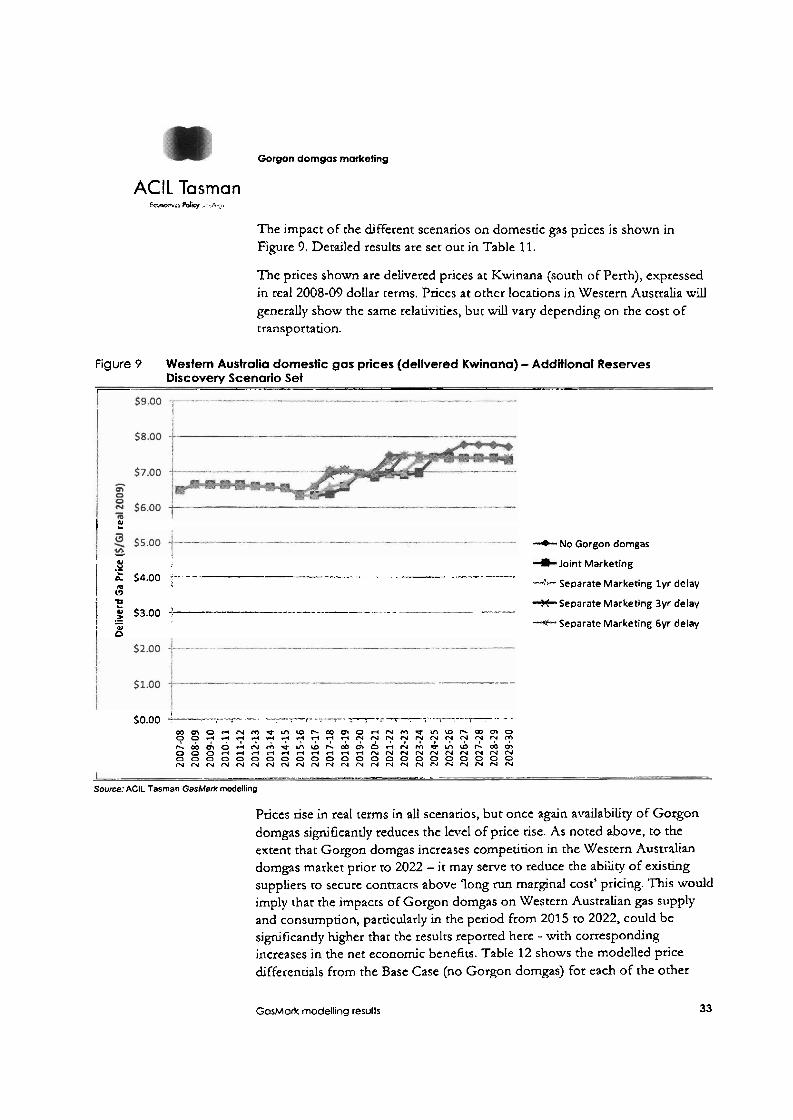
The impact of the different scenarios on domestic gas prices is shown in Figure 9. Detailed results are set our in Table 11.
The prices shown are delivered prices at Kwinana (sourh of Perch), expressed in real 2008-09 dollar terms. Prices at other locations in Western Australia will generally show the same relativities, bur will vary depending on the cost of transportation.
Figure 9 Western Australia domestic gas prices (delivered Kwinana) - Additional Reserves Discovery Scenario Set
7- ---. - " .--.
I ? ! -4- No Gorgon domgas
1 - I .g Joint Marketing
$4.00 .: .... -. ............. . -- ...... . -m=p- I :: t Separate Marketing l y r delay
j F - -- +Separate Marketing 3yr delay 53-00 A -- ---- - - - > I .- "1C-- Separate Marketing 6yr delay
i $
. . ................. ...- $0.00 _L_. ,_-..---,-.-....-..-l-,... - r-. . .- --. ..- . . , , . , a m o n ~ m e m ~ ~ m m O d ~ r n f m ~ ~ ~ m 0 0 0 4 4 4 4 * d 4 4 4 6 N N N N N N N N N N m
L i & d A A & & A & A A & o A A & & G & & w m 2 8 8 Z Z S S g Z S S Z Z 8 Z 8 8 2 Z G S 2 2 N N N N N N N N N N N N N N N N N N N N N N N
---.. ---.,~ ..,-. "..-,-- ---. - Source: AClL Tasman GasMark modelling
Prices rise in real terms in all scenarios, but once again availability OF Gorgon domgas significantly reduces the level of price rise. As noted above, to the extent that Gorgon domgas increases competition in the Western Australian domgas market prior ro 2022 - it may serve to reduce the ability of existing suppliers ro secure contracrs above long run marginal cost' pricing. This would imply that the impacts of Gorgon domgas on Western Australian gas supply and consumption, particularly in the period from 2015 to 2022, could be s i p i f cantly higher thar the results reported here - with corresponding increases in the net economic benefits. Table 12 shows the modelled price differentials from the Base Case (no Gorgon domgas) for each of the other
GosMork modelling results 33
It Gorgon domgos markefing
AClL Tasman 3 <m.bY.'*7< WV . ,. ,
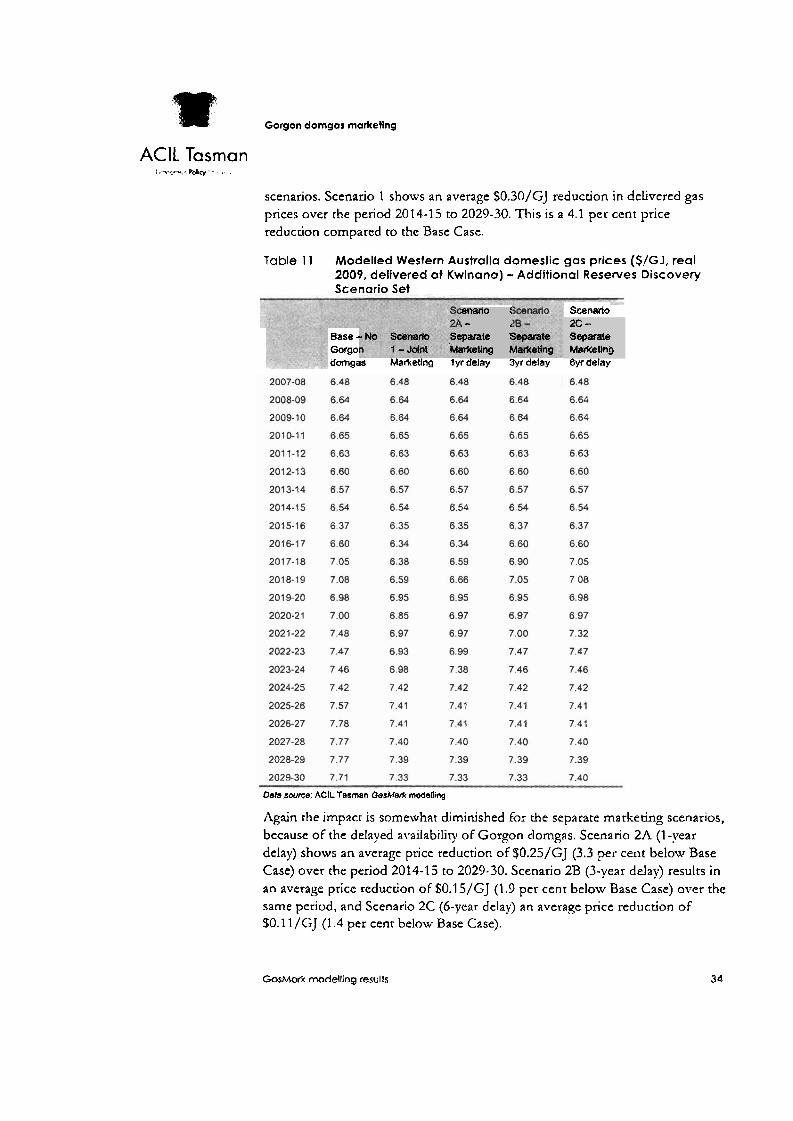
scenarios. Scenario 1 shows an average $0.30/GJ reduction in delivered gas prices over the period 2014-15 to 2029-30. T h i s is a 4.1 per cent price reducdon compared to the Base Case.
Table 1 1 Modelled Western Australia domestic gas prices ($/GJ, real 2009, delivered a t Kwinana) - Additional Reserves Discovery Scenario Set
enano : , - 1
'parate 5 ~tketing F
Scenario
Base - -go domgas Marketing lyr delay 3yr delay 6yr delay
2C - Separate Marketing
Data swrce: AClL Tasman GasMark modelling
Again the impact is somewhat diminished for the separate markeung scenarios, because of the delayed avaifabilit), of Gorgon domgas. Scenario 2A (I -year delay) shows an average price reduction of f0.25/GJ (3.3 per cent below Base Case) over che period 2014-1 5 to 2029-30. Scenario 2B (3-year delay) results in an average price reducuon of $0.1 5/GJ (1.9 per cenr below Base Case) over the same period, and Scenario 2C (6-year delay) an average price reduction of SO. I I /GJ (1.4 per cent below Base Case).
GasMark modelling results 34
rn Gorgon domgas marketlng
ACIL Tasman
Table 12 Modelled Western Australia domestic gas price differentials ($/GJ, real 2009, delivered at Kwinana) -Additional Reserves Discovery Scenario Set
cenario . - Base - NO Scenar - --,-.-.- ,,,,.,., ¶le
1 -Joint Marketing Marketing Marketing Marketing lyr delay 3yr delay 6yr delay
Gorgon dwngas
2009-10 0.00 0.00 0.00 0.00 0.00
2010-11 0.00 0.00 0.00 0.00 0.00
2011-12 0.00 0.00 0.00 0.00 0.00
2012-13 0.00 0.00 0.00 0.00 --
0.00 . . . . . . 2013-14 0.00 ...... - . . . . . . . . 0.00 0.00 0.00 0.00
,. -. 2014-15 0.00 0.00 0.00 0.00 0.00
2015-16 0.00 -0.02 -0.02 0.00 0.00
201&17 0.00 -0.26 -0.26 0.00 0.00
2017-18 0.00 -0.67 -0.46 .. -..- -0.15 - . - - 0.00
2018-19 0.00 . . -
-0.49 -0.42 ..--- .. -0.03 . . . . . . .
0.00
2019-20 0.00 , .
-0.03 -0.03 -0.03 ...- 0.00 . . . ........ ...
2020-21 0.00 .-- . -0.15 -0.03 -0.03 -0.03 . . . . . .
2021-22 0.00 -0.51 -0.51 -0.48 -0.16 -- - ...... 2022-23 0.00 -0.54 -0.48 0.00 0.00
2023-24 0.00 -0.48 -0.08 0.00 0.00
2024-25 0.00 0.00 0.00 0.00 0.00
2025-26 0.00 -0.15 -0.1 5 -0.15 .-.- ---- - -0.15 - -. 2026-27 0.00 - -0.37 -0.37
.... .. ..... -0.37
. . . . . . . . . -0.37 - . .
2027-28 0.00 -0.37 4.37 -0.37 -0.37
2028-29 0.00 -0.37 -0.37 -0.37 -0.37
2029-30 0.00 -0.38 -038 -0.38 -0.31
Data source: ACIL Tasman GasMark modelling
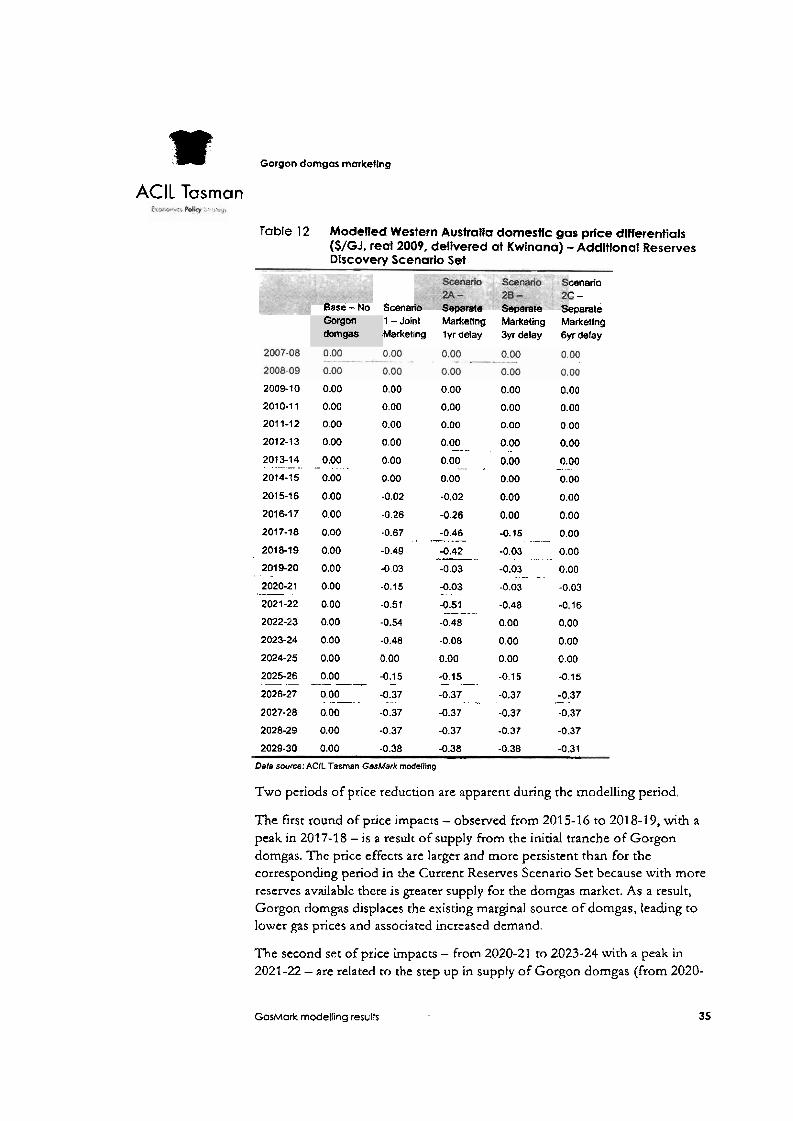
Two periods of price reduction are apparent during the modelling period,
The first round of price impacts - observed from 201 5-16 to 201 8- 19, with a peak in 2017-18 - is a result of supply from the initial tranche of Gorgon domgas. The price effects are larger and more persistent than For the correspondng period in the Current Reserves Scenario Set because with more reserves available there is greater supply for the domgas market. As a result, Gorgon domgas displaces rhe existing marginal source of domgas, leadrng to lower gas prices and associated increased demand.
The second set of price impacts - from 2020-21 to 2023-24 with a peak in
2021-22 - are related to the step up in supply of Gorgon domgas (from 2020-
GasMark modelling results 35

II Gorgon domgas marketing
AClL Tasman t , , .u-..- P d q
21 in Scenario 1, but delayed in the Scenario 2 varianrs - see Figure 2). The second round of price effects was not obsenrable in the Current Reserves Scenario Set, because jc was masked by rhe larger price impacts caused from 2021 -22 on by the earlier onset o f severe damgas deliverability consrraints.
GosMork modelling results
Gorgon domgas marketing
AClL Tasman Ec-7 Pdi .~-W.'J.
5 Tasmun Global modelling results In this Chapter we reporr on the broader economic impacts arising from potential timing differences for achieving domgas sales from the Gorgon Gas Project.
5.1 Measuring economic impacts
Before estimating the impact of joint versus separate marketing of the domesuc gas requitements associated with the Gorgon LNG project it is necessary to understand the possible range and types of economic impacts that will eventuate with and wirhout the domesuc gas supply. I t is also imporcant to determine the most appropriate measure of aggregate economic impact.
Fundamentally, although various aspects of the Gorgon domgas project - such as the number of jobs or the size of the investment expendirure - are of relevance to certain stakeholders, the key aggregate measure of the economic impact of the project is the extent to which the total wealth of the Ausuaban economy has changed as a result o f the Gorgon domgas project'. Typically this is measured by real GNP, although real GDP and consumer surplus (among others) can also be useful aggregate measu.res depending on the nature of the policy or project being analysed.' In the Taman Global framework, the change in real GNP is also a measure of the change in agqregate economic welfare7. In contrast, the change in GDP is a measure of rhe change in the output of the economy and doesn't include addidonal wealth effects associated with changes in terms of uade or foreign income transfers. (Real GNP in Tazmnn Globalis synonymous with real gross national disposable income, or RGNDI, reported by the ABS in the national accounts.)
j Analysis of my non-market impacrs (such as species losses, air qualiry changes, social justice implications erc) may also be relevant in assessing the full implications o f a projecr o r policy.
"ross Domescic Producr (GDP) and Gross Scare Producr (GSP) are the sum of the value added at every smge of producuon by aU the indusuies wirhin a country, plus a y e s less subsidies on producrs, in the period. This generates income in the period-that is, rhe compensadon of employees, tases on production and impons less subsidies, and gross operating surplus (or profirs).
Gross National Product (GNP). o n the orher hand, includes oer foreign income (rhc current accounr) rather than nct exports and imports (rhc balance of uade). This is cqujvdenr to adding ner fo re ip invesrmenr income to GDP (this footnote bnsed on rhe explanadon provided ar en.wikipedia.or~uiLi/Gross~domesucCprod~~~t#GDP~~~~GNP).
' More specifically, in Tm~nut~ G/oBa/, changes in real GNP are equivalenr to changes in equivalent variation (using the Slursky measure of income effects). See Pant (2007) for more d e d s .
Tosmon Global modelling results 37
%r Gorgon domgas marketing
AClL Tasman
The main factors that need to be considered when analysing the economic impacts of the Gorgon domgas project include:
The direct contribuuon to the economy as a result of the activioes associated with the project (including any indirect contribution through supply chain impacts)
Any crowding out implications as resources are potentially diverted from other productive activities to undertake the domgas project (including crowdng out of other energy industries due to fuel switching)
An!; productivity effects generated as a result of the project activities - including any allocative efficiency effects due to changes in the relative competitiveness of alternative technologies or industries
Any changes to the factors of production in the economy (such as increased average workforce participation rates as a result o f higher wages)
Any ~velfare implications associated with changes in terms of trade o r foreign income transfers
Figure 10 shows the components of total economic impact graphjcally. Some of these effects may be negligible or veqr sigruficant and an understanding of the relative maLgnitudc of the different effects is important.
Tosmon Globol modelling results
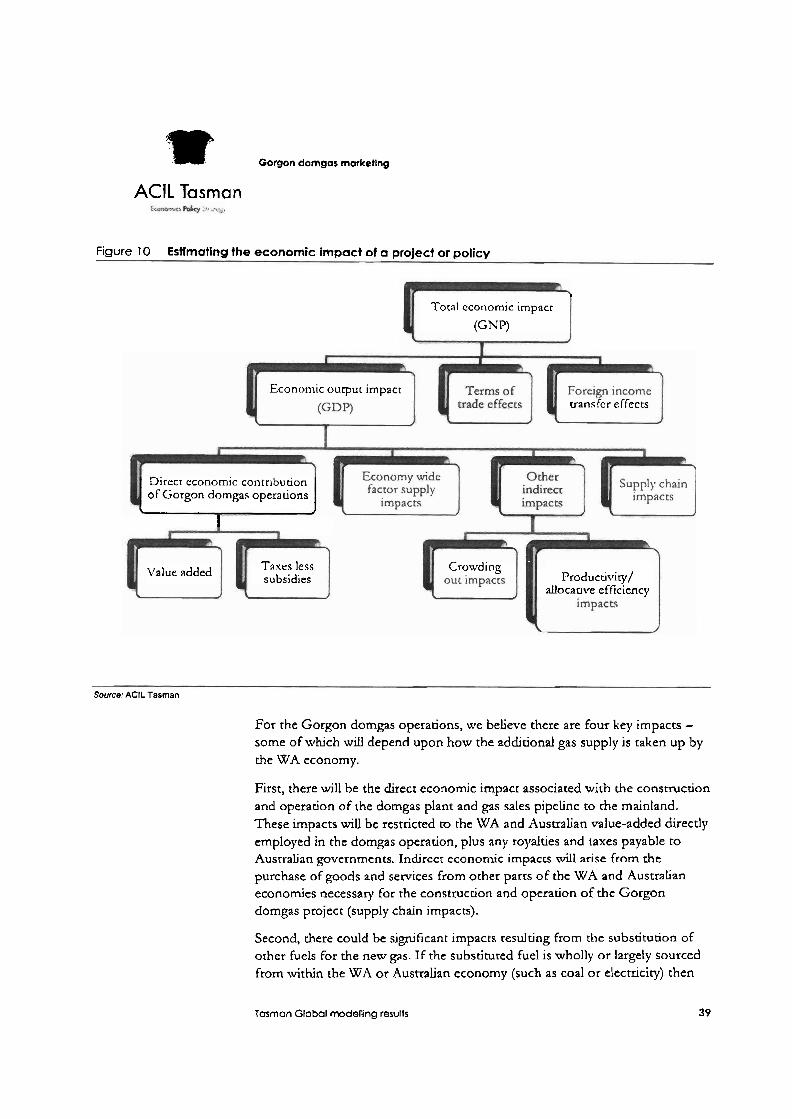
w Gorgon domgas marketing
AClL Tasman
Figure 10 Estimating the economic impact of a project or policy
1
Total economic impacr
(GNP)
Economic output lmpact uansfcr effects
Direct economic contrrbudon of Gorgon domgas operations
\ 2
1
Value added Taxes less subsidies
Crowding Productivity/
allocauve efficiency
Source: AClL Tasman
For the Gorgon domgas operadons, we believe there are four key impacts - some of wvhch wffl depend upon how the additional gas supply is taken up by the WA economy.
First, there will be the direct economic impact associated with the construcuon and operation of the domgas plant and gas sales pipeline to the mainland. These impacts will be restricted to the WA and Australian value-added directly employed in the domgas operation, plus any royalties and taxes payable to Australian governments. Indirect economic impacts will arise from rhe purchase of goods and services from other parts of the WA and Australian economics necessary for the construction and operation of the Gorgon domgas project (supply chain impacts).
Second, there could be sigmficant impacts resulting from the substitution of other fuels For the new gas. IF the substituted fuel is wholly or largely sourced from within the WA or Australian economy (such as coal or electricity) then
Tasmon Global modelling results 39
m Gorgon domgas marketing
ACIL Tasman
there will be crowdng out losses. If however the new gas supply substitutes for, say, imported petroleum products, then there will be real trade impacts and potential exchan'e;e rate and terms of trade implications.
Third, if the new gas supply enables the expansion of industries which are fundamentally reliant on gas as an input into production, then the overaU economy may expand as a constraint is telaxed (subject to the availability of other necessar?, inputs, such as labour and capital). This expansion is Likely to
also result in changes in real trade and potential exchange rate and terms of trade implications.
Fourth, given the relatively low operation and maintenance expenses, a large proportion of any future sales revenue will deliver returns to capital. Given the Gorgon operations are owned by foreign entities, there may be foreiLgn income transfers associated with repatriated profits.
5.2 Results
This section reports the general equilibrium inodelling results for the four alternacive marketing scenarios modelled under m o alternati\rc sets of scenarios as modelled by GasMark:
Current Reserves Scenario Set
Additional Reserves Discove~y Scenario Set
5.2.1 Cunent Reserves Scenario Sef
Welfare .and economic output
Changes in real G N P and real G D P relative to the no Gorgon dorngas base case have Lcen used to indicate the likely impact of the alternative marketing scenarios on Western Australia's and Australia's economic welfare and economic output. In all instances, in terms of Gross State Product and Gross Domestic Product the impact of bringing Gorgon dorngas to the Western Ausualian market has a positive i m p ~ c t on economic output for Western Australia and Australia as a whole. For example:
under Scenario 1 (joint marketing scenario) Western Aust~alia's Gross State Product is
-- 0.19 per cent higher than the base case in 2015-16 the first full year Gorgon domgas is sold in Western Australia
- 0.95 per cent higher than the base case in 2029-30
under Scenario 2A (separate marketing with one yefir operating phase delay scenario) Western Australia's Gross State Product is
losmon Globol modelling results 40
.m Gorgon domgas marketing
ACIL Tasman Erwc-o P d i .%4 r..
- 0.086 per cent higher than the base case in 2016-17 the first full year Gorgon domgas is sold in Western Australia
- 0.92 per cent higher than the base case in 2029-30
under Scenario 2B (separate marketing with three years de1ay)Western Australia's Gross State Product is - 0.080 per cent higher than the base case in 2018-19 the first full year
Gorgon domgas is sold in Western Australia - 0.90 per cent higher than the base case in 2029-30
under Scenario 2C (separate marketing with six years de1ay)Western Australia's Gross State Product is - 0.1 17 per cenr higher rhan the base case in 2021-22 the first full year
Gorgon domgas is sold in Western Austraha - 0.88 per cent higher than the base case in 2029-30.
Figure 1 I highlights that the impact on real economic output is largely experienced in Western Australia, with the change in total Australian real GDP being only marginally higher than the change in the state's real GSI'. The joint marketing of domgas (Scenario 1) produces the largest increase in economic output, with Scenario 2C (separate marketing with a six year delay) producing the smallest increase, relative to the no Gorgon domgas base case.
Comparing Figure 7 and Figure 11, it can be seen that in the years up to 2021 the sale of Gorgon dorngas under the Current Reserves Scenario set is not projected to result in a change in the market price bur is projected to increase WA real GSP by around 5200 million a year. Although some of this benefit is carrying over from increased investment in the earlier years, much of this benefit arises because the underlying production costs of supplying Gorgon domgas are less than the underlying production costs of the other energy sources that are being replaced - hence resulting in scarce labour and capital being freed up from the energy sector to other sectors of the economy.
Tasman Global modelling results