Rob Douma - Hanze
163
CLINICAL MUSCLE STRENGTH MEASUREMENTS: REFERENCE VALUES AND RELIABILITY Rob Douma
-
Upload
khangminh22 -
Category
Documents
-
view
0 -
download
0
Transcript of Rob Douma - Hanze

CLINICAL MUSCLE STRENGTH MEASUREMENTS: REFERENCE
VALUES AND RELIABILITY
CLINICA
L MU
SCLE STRENG
TH M
EASU
REMEN
TS; REFERENCE VALU
ES AND
RELIABILITYRob D
ouma Rob Douma

Clinical muscle strength measurements: reference
values and reliability
Rob Douma

The work presented in this thesis was performed at the Research Group Healthy
Ageing, Allied Health Care and Nursing, Hanze University of Applied Sciences,
Groningen, the Netherlands, at the Research Institute SHARE of the Groningen
Graduate School of Medical Sciences of the University Medical Center Groningen,
University of Groningen, the Netherlands.
ISBN: 978-94-6416-741-2
Photo Cover RJ
Phothographer Rob Douma
Cover Lay-out design: Publiss | www.publiss.nl
Print: Ridderprint | www.ridderprint.nl
© 2021 Rob Douma
All rights reserved. No parts of this publication may be reproduced, stored in a
retrieval system or transmitted in any form or by any means, without the prior
written permission of the copyright owner.

Clinical muscle strength measurements: reference values and reliability
Proefschrift
ter verkrijging van de graad van doctor aan de Rijksuniversiteit Groningen
op gezag van de rector magnificus prof. dr. C. Wijmenga
en volgens besluit van het College voor Promoties.
De openbare verdediging zal plaatsvinden op
maandag 18 oktober 2021 om 16.15 uur
door
Rob Kornelis Wijbo Douma
geboren op 18 juli 1960 te Groningen

PromotoresProf. dr. C.P. van der SchansProf. dr. P.U. Dijkstra
CopromotorDr. W.P. Krijnen
BeoordelingscommissieProf. dr. J.M. KlaaseProf. dr. J.H.P. HoudijkProf. dr. P.J. van der Wees

ParanimfenHans van de LeurTiesja van der Woude

Contents
Chapter 1 Introduction 9
Chapter 2 Reference values for isometric muscle strength among
workers for the Netherlands: a comparison of reference
values. (2014). Douma, K. W., Soer, R., Krijnen, W. P., Reneman,
M., & C. P. van der Schans. BMC Sports Science, Medicine and
Rehabilitation, 6(1), 10. https://doi.org/10.1186/2052-1847-6-
10
27
Chapter 3 Reference values for isometric muscle strength in children
for The Netherlands between 8 and 17 years of age. Douma,
K.W., Krijnen W. P., Slager G. E. C., & van der Schans, C. P.
Submitted
49
Chapter 4 Reliability of the Q Force; a mobile instrument for measuring
isometric Quadriceps muscle strength. (2016). Douma, K.
W., Regterschot, G. R., Krijnen W. P., Slager G. E., van der
Schans, C. P., & Zijlstra, W. BMC Sports Science, Medicine and
Rehabilitation, 19(8), 4. doi:10.1186/s13102-016-0029-x
69
Chapter 5 Are repeated strength measurements required older adults.
Douma, K.W., Slager, G. E. C., Krijnen, W. P., & C. P., van der
Schans. Submitted
89
Chapter 6 Measuring Quadriceps strength in adults with severe or
moderate intellectual and visual disabilities: feasibility and
reliability. (2018). Dijkhuizen, A., Douma, K. W., Krijnen, W.
P., van der Schans, C. P., & Waninge, A. Journal of Applied
Research in Intellectual Disabilities, 31(6), 1083-1090
103
Chapter 7 General discussion 123

Summary 138
Samenvatting 144
Dankwoord 151
Institute SHARE 157


Chapter 1
Introduction

Chapter 1
10
MusclesHuman muscle anatomy has inspired human imagination since ancient Greece in
art and religion or to create myths around conquerors. In the dark ages, anatomic
illustrations and drawings were unrealistic until the 13th century when human
dissection induced considerable transformation in depicting muscle anatomy (1). Later, Michelangelo (1475-1564) created artistic work with detailed muscle
contours that currently still appeals to the imagination. It is now known that the
human body consists of more than 600 muscles which determine up to 48% of
the body weight (2,3,4). Muscles consist of a contractile part that can shorten and
tendons that generally attach to bones. Contracting and relaxing muscles are the
motors that regulate posture and movement.
Muscle strength measurementMuscle properties include length, strength, and endurance. Muscle strength is
usually measured by means of a maximal resistance test of a specific muscle
or muscle group. Muscle strength measurements are an important part of the
physical assessment in physiotherapy for which valid and reliable instruments
and their corresponding protocols are a necessity to accurately assess and
quantify maximal muscle strength. Muscle strength measurements, in general,
demonstrate a broad range of inter and intra observer reliability; reliability
coefficients range between 0.60 and 0.99 depending on the instrument that is
used (4-18). Generally, muscle strength measurements are performed utilizing one
of the following tests methods: manual resistance tests, hand-held dynamometry,
instrument-held dynamometry, isokinetic instruments, and functional tests.
Manual Resistance Testing; The Medical Research Council ScaleOne of the first attempts to develop an instrument to quantify maximal muscle
strength resulted in the Medical Research Council (MRC) scale from 0 to 5, also
known as the Oxford Scale, was developed during the second world war to
quantify maximal muscle strength of injured soldiers (19). The procedure of the
MRC scale is very understandable. During this test, the tester requests the subject
to move the arm or leg with gravity eliminated (in a horizontal plane) or against
gravity, (in a vertical plane). The movement against gravity is performed without
manual resistance or with (moderate or strong) additional manual resistance of
the tester depending on the strength of the subject who is being tested (Figure 1).

Introduction
11
1
Figure 1, Shoulder abduction test for muscle strength using the MRC Scale
Although the definitions and execution of the MRC procedures are clear, the
MRC Scale has some important inadequacies. Firstly, the grade numbers 0 to 5
suggest a continuous scale with equal differences between the numbers (Table
1). However, the numbers represent grades that are ordered points on an ordinal
scale with substantial differences between points (20).
Table 1, The 6 grades, 0 to 5, of the MRC scale
MRC Grade Muscle action
0 No contraction.
1 Flicker or trace of contraction.
2 Active movement with gravity eliminated.
3 Active movement against gravity.
4 Active movement against gravity with resistance.
5 Normal Power
MRC; Medical Research Council
These grades may lead to unjust assumptions regarding the increase or decrease
of muscle strength. For example, an increase from MRC Grade 1 to MRC Grade 2
suggests the same improvement in strength as from MRC Grade 2 to MRC Grade 3. In
reality, however, the change in actual strength may substantially differ between the
grades (20).
Secondly, the grading of the results of strength measurements is ambiguous.
Grades 0 to 3 are easy to objectify and verify and have clear cut-off points,
however, the percentage of the maximal strength that is required is not (20). For

Chapter 1
12
instance, in Grade 3, the strength required to overcome gravity varies per muscle
group between 5% for knee extension and 20% for shoulder abduction (5) (Table
2). Grade 3 can be used as an indication for being able to overcome gravity
(functional criterion), however, it provides limited information about the actual
maximal strength of a muscle group.
Table 2, Examples of percentages of maximal strength required to overcome gravity MRC Grade 3 (5)
Muscle action Percentage of maximal strength
Shoulder abduction 20%
Elbow flexion 5%
Knee extension 5%
MRC; Medical Research Council
In particular, MRC Grade 4 represents a very wide range of muscle strength. It
spans from just over Grade 3 to just below normal strength (Grade 5). In fact, for
the Biceps brachii, it encompasses approximately 95% of the total range of muscle
strength. MRC Grade 4 in this case represents approximately 5% to 99% of its
maximal strength (5,20). Due to this wide range of especially MRC Grade 4, minimal
or even moderate changes in strength cannot be distinguished.
To increase precision in Grade 4, it is further subdivided into subgrades: 4-, 4 ,
and 4+, movement against gravity with slight, moderate, and strong resistance,
respectively (21). It remains overall, however, unclear how much resistance slight,
moderate, strong manual resistance, or normal strength is in order to differentiate
between MRC Grades 4 and 5. Therefore, due to inadequate description of the
limits between Grades 4 and 5, categorizing strength appears to rely largely on
the subjective interpretation of the tester instead of the actual muscle strength.
The strength of the Biceps brachii, for example, might increase by 50% or more
without noticing it when using the MRC Scale. The above makes Grade 4 overly
inaccurate and imprecise for clinical use. Additionally, the inadequacy of manual
muscle strength measurements themselves is that the judgment slight, moderate,
or strong manual resistance or normal strength may depend on the tester’s
maximal strength. A strong tester may easily quantify low normal strength as MRC
Grade 4- whereas less strong testers could quantify it as 4, 4+, or 5 (20). When taking
the deficiencies of the MRC Scale and manual muscle testing into account, the
usefulness of the MRC Scale in clinical practice is questionable.

Introduction
13
1Hand-Held DynamometryAn instrument that overcomes some of the disadvantages of the MRC scale is the
hand-held dynamometer; the first was introduced in 1798 by Regnier (22). Various
dynamometers have been developed since then (Figure 2). The first predecessor of
today’s hand-held dynamometers was designed in the 19th century by an American
neurologist, W.A. Hammond, and was constructed by a French instrument maker,
Mathieu, in 1868 (22-25).
Figure 2, Examples of hand-held dynamometers. On the left (Figure 2) is the Collins hand-held dynamometer from the mid-19th century and, on the right is a modern hand-held dynamometer.
Currently, hand-held dynamometers are small, digital, manageable, and relatively
inexpensive devices. One of the primary advantages of the hand-held dynamometer
is that, in contrast to the MRC Scale, it quantifies the delivered maximal strength
on a linear scale with equal intervals between numbers, and it does not depend of
the interpretation of the tester. When using hand-held dynamometer instruments,
muscle strength is generally expressed in Kilogram force (Kgf), Newton (N), or
Libra Pound (LB). Measurements are executed employing isometric contractions
(contractions without movement). The device is read when the resistance
generated by the tester equals the generated maximal muscle strength by the
subject tested which is a static situation. Two types of measurements are used,
i.e., the make and the break methods. In the make method, the maximal strength
is generated by the subject whereas, in the break method, the tester attempts to
“break through” the maximal strength of the subject (20,26).

Chapter 1
14
Figure 3, Position of the hand-held dynamometer during maximal strength measurement of flexion of the elbow
The measurement procedure is relatively simple and quick, taking one to three
minutes depending on the number of repetitions. During the measurement
procedure, the subject is kept in a standardized position, for example, lying supine;
the hand dynamometer is subsequently placed perpendicular on the distal end
of the body part to be tested, for example, on the distal radius when maximal
strength of the elbow flexors is tested; the test person then flexes the arm while
it is being held back by the tester (Figure 3). Generally, a hand-held dynamometry
has good reliability coefficients ranging between 0.70 and 0.99 (6-18,27).
A hand-held dynamometry, however, has some disadvantages. For example, the
maximal strength of the testers can be a source of error (12,28,29). The tester must
be able to overcome or at least withstand the maximal strength generated by
the subject in all cases in order to ensure that the contraction is isometric. When
testers lack enough strength, measurements become non valid. (28,29). This problem
becomes more significant when subjects are stronger, however, it is less relevant
in clinical practice when they have loss of muscle strength (28,29).
Another drawback is that it is not clear if the true maximal strength is ascertained
when using a single measurement. Subjects who are not familiar with this type
of testing may need to adjust to the testing procedures and may therefore not

Introduction
15
1perform maximally during the first or second measurement. In this case, additional
measurements could lead to familiarization with the process and consequently
lead to higher values and therefore a more precise measurement of the subject’s
maximal muscle strength (30).
Instrument Held DynamometersIn addition to hand-held dynamometers, other new instruments have also been
developed in which the force sensor or dynamometer is fixed in a metal frame
incorporated in a device such as the Quadriso tester, Q Force (Figure 5) or portable
dynamometer anchoring station (DAS) (31-35). The construction of these instruments
overcomes some of the inadequacies of a hand-held dynamometry caused by
the muscle strength of the tester. These instruments are quite often “one off”
instruments and are generally not freely available. They are similar to a hand-
held dynamometry measure on a continuous scale and use static contractions.
One of the main advantages of instrument-held dynamometers is that the force
sensor is held by the device instead of a tester as in hand-held dynamometry. The
tester as a source of error is consequently reduced in these instruments. Strength,
fixation capabilities, or experience of the tester do not influence the measurement
outcome. By fixating the sensor in the instrument, the maximal range of the
measurements is increased.
Figure 4, Example of a new “instrument-held” strength measurement instrument, the Q Force

Chapter 1
16
Isokinetic instrumentsOther instruments used to measure maximal strength are isokinetic dynamometers.
“Measurements performed with isokinetic instruments are, in contrast to hand-
held and instrument-held dynamometers, executed using dynamic contractions,
and the outcomes are expressed on a linear scale in and in Newton meter (Nm).
Isokinetic dynamometers were first developed in the 1960s. Similar to hand-
held dynamometers, the force sensor is held by the instrument itself. Isokinetic
instruments are very precise measurements and can detect smaller differences
in strength than other instruments (16,36-41). The device consists of a testing chair
on which the subject is placed securely using straps. Attached to the chair is a
solid frame in which the tested arm or leg is positioned and fixed (Figure 5). The
measurement part consists of an electromotor that rotates at a constant preset
speed and only allows the tested subject to move at the same speed, resulting in a
contraction with a constant speed, i.e., an isokinetic contraction.
Figure 5, Isokinetic instrument
During the procedure, the tested subject is instructed to maximally contract
and push against the lever. The position is illustrated in Figure 5 for Quadriceps
muscle strength testing. During the procedure, the force sensor in the isokinetic
instrument quantifies the generated strength by the subject. The device provides
measurements with extensive numeric and graphic information about, among
other things, the magnitude of the strength and coordination of the contraction.
This type of instrument possesses excellent reliability and is regarded as the gold
standard for muscle strength measurement (38,41,43,44).

Introduction
17
1Functional testsHealthy older adults normally rise from a chair approximately 40 to 60 times per
day (45,46). Doing so requires adequate muscle strength (46-50). Therefore, tests that
consist of movements closely related to such activities of daily living are used to
test functional muscle strength. Functional strength tests are testing the strength
of several specific muscle groups based on frequently executed daily activities
such as reaching, walking on heels or toes, rising from a chair, or climbing stairs. In
this way, it can be determined whether loss of strength impedes a certain function
in daily life.
Functional tests are probably easier to instruct and execute than isolated strength
measurements that require isolated coordinated movements because of the
strong relationship with activities of daily life. The subject’s cooperation that is
needed for functional tests is limited to executing familiar activities of daily living.
For example, an instruction such as: “stand up from the chair as often as you can
in one minute without using your hands” will suffice. Functional strength tests
generally demonstrate good reliability (51,52,53). Specific functional strength tests,
such as the Minimum Sit-to-Stand Height Test and the 30 seconds Chair Stand Test
(30sCS), are valid and reliable tests for determining functional Quadriceps muscle
strength in a general population and older adults. (54-57).
Functional muscle strength tests provide information about the capabilities to
perform a functional movement but do not provide information about isolated
muscle strength. Therefore, when it has been established that a function is
impeded, isolated muscle strength measurements are needed to determine the
extent of loss of strength and which specific muscle groups are affected. Although
functional tests are useable in the general population as well as in older adults
and patient groups (54,56,57,58), it is not clear if these tests can reliably and validly
measure strength in individuals with, for example, (severe) intellectual or visual
disability.
Reference values for muscle strengthOutcomes of strength measurements of affected muscles groups are only
meaningful if they can be compared to reference values. Several types of reference
values are used in clinical practice. 1) The affected side is compared with the
unaffected side since minor differences are generally ascertained between the left

Chapter 1
18
and right sides in healthy individuals. 2) Follow-up measurements are compared
with baseline measurements for changes over time. 3) A subject’s strength is
compared to reference values. 4) A subject’s strength is compared with results of
prediction equations based on gender, age weight and height (6,11).
Muscle strength reference values for adults that are currently used in the
Netherlands were actually obtained in the United States. (6) However, it is not
clear if reference values for muscle strength that are drawn from a population
in a specific country can be used for other populations or in other countries. For
example, it is not evident to what extent cultural backgrounds or geographical
differences influence muscle strength of the population. For example, in 2016,
approximately 12% of Americans cycled on a regular basis whereas, in the
Netherlands, 80% did so (59,60). Exercise such as cycling has a direct and distinct
positive effect on upper leg strength and leads to greater muscle strength.
Cultural related habits or lifestyles may potentially cause differences in maximal
muscle strength between countries. Reference values this strength can partly be
predicted from height, weight, gender, and age. Height and weight are positively
related while age is negatively related to muscle strength. Females are generally
less strong than males. In the last decades, especially body weight, one of the
major predictors of maximal strength, increased considerably in the Netherlands
and the entire western society (61-64). Reference values for muscle strength used in
the Netherlands for children were generated 20 years ago (65). It seems obvious
that, if predictors of maximal muscle strength change, reference values and the
equations for estimating muscle strength reference values also change. Using
unsuitable reference values may lead to unjust clinical decisions or unobtainable
and undesirable training goals.
Objective of the thesis The general objectives of this thesis were to provide reference values for muscle
strength and to determine the reliability of different muscle strength measurement
procedures.
Chapter 2 To put a subject’s muscle strength into perspective, it must be compared with
reference values of a population with similar characteristics. Furthermore, it is

Introduction
19
1not clear whether the muscle strength of a specific population can be generalized
to another population. It is unknown if it is influenced, for example, by the
geographical location or cultural background of this population. The objective
of chapter two, therefore, was to obtain references values for the population of
Dutch workers and compare these values with those drawn from a population in
the USA.
Chapter 3 Muscle strength can be partly predicted from age, weight, and gender. Weight of
children, however, has changed over the last decades. The objective of Chapter
3, therefore, was to generate reference values for muscle strength for children
between 8 to17 years of age for the Netherlands and determine if reference
values for muscle strength for children are time specific by comparing them
with previously reported Dutch reference values. An additional objective was to
determine the degree to which muscle strength can be predicted from weight,
height, gender, and age.
Chapter 4New instruments to measure muscle strength have been developed to compensate
for inadequacies of currently used instruments. Prior to use, it must be determined
whether the reliability is acceptable to be employed in clinical practice. The
objective of Chapter 4, therefore, was to determine the test-retest reliability of the
Q Force of a new machine-held device to measure muscle strength in older adults.
Chapter 5Muscle strength measurements in clinical practice in older adults are usually
executed on one measurement day using one to three repetitions. Generally
repeated measurements lead to higher reliability but also could cause fatigue,
reducing muscle strength. It is unclear what the effects are of repeated
measurements in older adults. The objective of Chapter 5, therefore, was to
analyze effects of repeated muscle strength measurements in older adults using
a hand-held dynamometer.

Chapter 1
20
Chapter 6Functional strength testing is used in the general population and for people with
an intellectual disability. However, it is not clear if these tests can be utilized for
people with severe intellectual and visual disabilities. The objective of Chapter 6,
therefore, was to determine the feasibility, learning period, and reliability of the
Minimum Sit-to-Stand Height Test, the Leg Extension Test, and the 30 seconds
Chair-Stand Test for persons with severe intellectual and visual disabilities and to
determine the association between the scores of these tests.
Chapter 7In Chapter 7, the results of the above-mentioned studies are summarized and
put in the perspective of physiotherapy practice. The strengths and limitations of
this thesis research are summarized and discussed and suggestions are made for
further research.

Introduction
21
1References 1. Gurunluoglu, R., Gurunluoglu, A., Williams, S. A., & Cavdar, S. (2013). The history and
illustration of anatomy in the Middle Ages. Journal of Medical Biography, 21(4), 219–229. https://doi.org/10.1177/0967772013479278
2. Kyle, U. G., Genton, L., Hans, D., Karsegard, V. L., Michel, J. P., Slosman, D. O., & Pichard, C. (2001). Total Body Mass, Fat Mass, Fat-Free Mass, and Skeletal Muscle in Older People: Cross-Sectional Differences in 60-Year-Old Persons. Journal of the American Geriatrics Society, 49(12), 1633–1640. https://doi.org/10.1111/j.1532-5415.2001.49272.x
3. Janssen, I., Heymsfield, S. B., Wang, Z. M., & Ross, R. (2000). Skeletal muscle mass and distribution in 468 men and women aged 18–88 yr. Journal of Applied Physiology, 89(1), 81–88. https://doi.org/10.1152/jappl.2000.89.1.81
4. Florence, J. M., Pandya, S., King, W. M., Robison, J. D., Baty, J., Miller, J. P., . . . Signore, L. C. (1992). Intrarater Reliability of Manual Muscle Test (Medical Research Council Scale) Grades in Duchenne’s Muscular Dystrophy. Physical Therapy, 72(2), 115–122. https://doi.org/10.1093/ptj/72.2.115
5. Ploeg, R. J. O., Oosterhuis, H. J. G. H., & Reuvekamp, J. (1984). Measuring muscle strength. Journal of Neurology, 231(4), 200–203. https://doi.org/10.1007/bf00313939
6. Bohannon, R. W. (1997). Reference values for extremity muscle strength obtained by hand-held dynamometry from adults aged 20 to 79 years. Archives of Physical Medicine and Rehabilitation, 78(1), 26–32. https://doi.org/10.1016/s0003-9993(97)90005-8
7. Bohannon, R. W., & Andrews, A. W. (1987). Interrater Reliability of Hand-Held Dynamometry. Physical Therapy, 67(6), 931–933. https://doi.org/10.1093/ptj/67.6.931
8. Dunn, J. C., & Iversen, M. D. (2003). Interrater Reliability of Knee Muscle Forces Obtained by Hand-held Dynamometer from Elderly Subjects with Degenerative Back Pain. Journal of Geriatric Physical Therapy, 26(3), 23–29. https://doi.org/10.1519/00139143-200312000-00004
9. Wang, C. Y., Olson, S. L., & Protas, E. J. (2002). Test-retest strength reliability: Hand-held dynamometry in community-dwelling elderly fallers. Archives of Physical Medicine and Rehabilitation, 83(6), 811–815. https://doi.org/10.1053/apmr.2002.32743
10. Roy, M. A. G., & Doherty, T. J. (2004). Reliability of Hand-Held Dynamometry in Assessment of Knee Extensor Strength After Hip Fracture. American Journal of Physical Medicine & Rehabilitation, 83(11), 813–818. https://doi.org/10.1097/01.phm.0000143405.17932.78
11. Bohannon, R. W. (1997). Discriminant Construct Validity of Hand-Held Dynamometry and Manual Muscle Testing in a Home Care Setting. Journal of Physical Therapy Science, 9(2), 57–61. https://doi.org/10.1589/jpts.9.57
12. Andrews, A. W., Thomas, M. W., & Bohannon, R. W. (1996). Normative Values for Isometric Muscle Force Measurements Obtained With Hand-held Dynamometers. Physical Therapy, 76(3), 248–259. https://doi.org/10.1093/ptj/76.3.248
13. Hébert, L. J., Maltais, D. B., Lepage, C., Saulnier, J., Crête, M., & Perron, M. (2011). Isometric Muscle Strength in Youth Assessed by Hand-held Dynamometry. Pediatric Physical Therapy, 23(3), 289–299. https://doi.org/10.1097/pep.0b013e318227ccff
14. Macfarlane, T. S., Larson, C. A., & Stiller, C. (2008). Lower Extremity Muscle Strength in 6- to 8-Year-Old Children Using Hand-Held Dynamometry. Pediatric Physical Therapy, 20(2), 128–136. https://doi.org/10.1097/pep.0b013e318172432d

Chapter 1
22
15. Kawaguchi, J. K., & Babcock, G. (2010). Validity and Reliability of Handheld Dynametric Strength Assessment of Hip Extensor and Abductor Muscles. Athletic Training & Sports Health Care, 2(1), 11–17. https://doi.org/10.3928/19425864-20101221-04
16. Pfister, P.D., De Bruin, E.D., Sterkele, I., Maurer, B., De Bie, R.A., & Knols, R.H. (2018). Manual muscle testing and hand-held dynamometry in people with inflammatory myopathy: An intra- and interrater reliability and validity study. PLoS ONE, 13(3), e0194531. https://doi.org/10.1371/journal.pone.0194531
17. O’Shea, S. D., Taylor, N. F., & Paratz, J. D. (2007). Measuring Muscle Strength for People With Chronic Obstructive Pulmonary Disease: Retest Reliability of Hand-Held Dynamometry. Archives of Physical Medicine and Rehabilitation, 88(1), 32–36. https://doi.org/10.1016/j.apmr.2006.10.002
18. Eek, M. N., Kroksmark, A.K., & Beckung, E. (2006). Isometric Muscle Torque in Children 5 to 15 Years of Age: Normative Data. Archives of Physical Medicine and Rehabilitation, 87(8), 1091–1099. https://doi.org/10.1016/j.apmr.2006.05.012
19. Aids to the Investigation of Peripheral Nerve Injuries. Medical Research Council: Nerve Injuries Research Committee. His Majesty’s Stationery Office: 1942; pp. 48 and 74 figures and 7 diagrams; with Aids to the Examination of the Peripheral Nervous System. (War Memorandum No. 7.)
20. O’Neill, S., Jaszczak, S. L.T., Steffensen, A. K. S., & Debrabant, B. (2017). Using 4+ to grade near-normal muscle strength does not improve agreement. Chiropractic & Manual Therapys, 25, 28. https://doi.org/10.1186/s12998-017-0159-6
21. Aids to the Investigation of Peripheral Nerve Injuries. Medical Research Council: Nerve Injuries Research Committee. His Majesty’s Stationery Office: 1975 (War Memorandum No. 45)
22. Nicolas, S., & Vobořil, D. (2017). The Collin dynamometer: History of the development of an instrument for measuring physical and mental strength. L’Année psychologique, 117(02), 173–219. https://doi.org/10.4074/s0003503317000495
23. Lanska, D. J. (1997). The role of technology in neurologic specialization in America. Neurology, 48(6), 1722–1728. https://doi.org/10.1212/wnl.48.6.1722
24. Lanska, D. J. (2011). The history of reflex hammers. Neurology, 76(14), 1221. https://doi.org/10.1212/01.wnl.0000396604.13575.a7
25. Lanska, D. J. (1990). The Suspension Therapy for Tabes Dorsalis. Archives of Neurology, 47(6), 701. https://doi.org/10.1001/archneur.1990.00530060115028
26. Bohannon, R. W. (1988). Make Tests and Break Tests of Elbow Flexor Muscle Strength. Physical Therapy, 68(2), 193–194. https://doi.org/10.1093/ptj/68.2.193
27. Stratford, P. W., & Balsor, B. E. (1994). A Comparison of Make and Break Tests Using a Hand-Held Dynamometer and the Kin-Com. Journal of Orthopaedic & Sports Physical Therapy, 19(1), 28–32. https://doi.org/10.2519/jospt.1994.19.1.28
28. Wikholm, J. B., & Bohannon, R. W. (1991). Hand-held Dynamometer Measurements: Tester Strength Makes a Difference. Journal of Orthopaedic & Sports Physical Therapy, 13(4), 191–198. https://doi.org/10.2519/jospt.1991.13.4.191
29. Stone, C. A., Nolan, B., Lawlor, P. G., & Kenny, R. A. (2011). Hand-held dynamometry: tester strength is paramount, even in frail populations. Journal of Rehabilitation Medicine, 43(9), 808–811. https://doi.org/10.2340/16501977-0860

Introduction
23
130. Jenkins, N. D. M., & Cramer, J. T. (2017). Reliability and Minimum Detectable Change for Common Clinical Physical Function Tests in Sarcopenic Men and Women. Journal of the American Geriatrics Society, 65(4), 839–846. https://doi.org/10.1111/jgs.14769
31. Scott, D. A., Bond, E. Q., Sisto, S. A., & Nadler, S. F. (2004). The intra- and interrater reliability of hip muscle strength assessments using a handheld versus a portable dynamometer anchoring station. Archives of Physical Medicine and Rehabilitation, 85(4), 598–603. https://doi.org/10.1016/j.apmr.2003.07.013
32. Sung, K.S., Yi, Y. G., & Shin, H. I. (2019). Reliability and validity of knee extensor strength measurements using a portable dynamometer anchoring system in a supine position. BMC Musculoskeletal Disorders, 20(1), 320. https://doi.org/10.1186/s12891-019-2703-0
33. Verkerke, G. J., Lemmink, K. A. P. M., Slagers, A. J., Westhoff, M. H., van Riet, G. A. J., & Rakhorst, G. (2003). Precision, comfort and mechanical performance of the Quadriso-tester, a quadriceps force measuring device. Medical and Biological Engineering and Computing, 41(3), 283–289. https://doi.org/10.1007/bf02348432
34. Ruschel, C., Haupenthal, A., Jacomel, G.F., Fontana, H.B., Santos, D.P., Scoz ,R.D., & Roesler, H. (2019). Validity and reliability of an instrumented leg-extension machine for measuring isometric muscle strength of the knee extensors. Journal of Sport Rehabilitation, 24(2), 2013-0122. https://doi.org 10.1123/jsr.2013-0122
35. Douma, K. W., Regterschot, G. R. H., Krijnen, W. P., Slager, G. E. C., van der Schans, C. P., & Zijlstra, W. (2016). Reliability of the Q Force; a mobile instrument for measuring isometric quadriceps muscle strength. BMC Sports Science, Medicine and Rehabilitation, 19 (8),1 https://doi.org/10.1186/s13102-016-0029-x
36. Deones, V. L., Wiley, S. C., & Worrell, T. (1994). Assessment of Quadriceps Muscle Performance by a Hand-Held Dynamometer and an Isokinetic Dynamometer. Journal of Orthopaedic & Sports Physical Therapy, 20(6), 296–301. https://doi.org/10.2519/jospt.1994.20.6.296
37. Valovich-mcLeod, T. C., Shultz, S. J., Gansneder, B. M., Perrin, D. H., & Drouin, J. M. (2004). Reliability and validity of the Biodex system 3 pro isokinetic dynamometer velocity, torque and position measurements. European Journal of Applied Physiology, 91(1), 22–29. https://doi.org/10.1007/s00421-003-0933-0
38. Chamorro, C., Armijo-Olivo, S., De La Fuente, C., Fuentes, J., & Javier Chirosa, L. (2017). Absolute reliability and concurrent validity of hand-held dynamometry and isokinetic dynamometry in the hip, knee and ankle joint: Systematic review and meta-analysis. Open Medicine, 12(1), 359–375. https://doi.org/10.1515/med-2017-0052
39. Reinking, M. F., Bockrath-Pugliese, K., Worrell, T., Kegerreis, R. L., Miller-Sayers, K., & Farr, J. (1996). Assessment of Quadriceps Muscle Performance by Hand-Held, Isometric, and Isokinetic Dynamometry in Patients With Knee Dysfunction. Journal of Orthopaedic & Sports Physical Therapy, 24(3), 154–159. https://doi.org/10.2519/jospt.1996.24.3.154
40. Claiborne, T. L., Timmons, M. K., & Pincivero, D. M. (2009). Test–retest reliability of cardinal plane isokinetic hip torque and EMG. Journal of Electromyography and Kinesiology, 19(5), 345–352. https://doi.org/10.1016/j.jelekin.2008.07.005
41. Stark, T., Walker, B., Phillips, J. K., Fejer, R., & Beck, R. (2011). Hand-held Dynamometry Correlation With the Gold Standard Isokinetic Dynamometry: A Systematic Review. Physical medicine & Rehabilitation, 3(5), 472–479. https://doi.org/10.1016/j.pmrj.2010.10.025

Chapter 1
24
42. Maffiuletti, N. A., Bizzini, M., Desbrosses, K., Babault, N., & Munzinger U. (2007). Reliability of knee extension and flexion measurements using the Con-Trex isokinetic dynamometer. Clinical Physiology and Functional Imaging, 27(6), 346–53. https://doi: 10.1111/j.1475-097X.2007.00758.x. PMID: 17944656.
43. Duarte, J. P., Valente-Dos-Santos, J., Coelho-E-Silva, M. J., Couto, P., Costa, D., Martinho, D., . . . Gonçalves, R. S. (2018). Reproducibility of isokinetic strength assessment of knee muscle actions in adult athletes: Torques and antagonist-agonist ratios derived at the same angle position. PloS one, 13(8), https://doi.org/10.1371/journal.pone.0202261
44. Muff, G., Dufour, S., Meyer, A., Severac, F., Favret, G. B., Lecocq, J., & Isner-Horobeti, M. E. (2016). Comparative assessment of knee extensor and flexor muscle strength measured using a hand-held vs. isokinetic dynamometer. Journal of Physical Therapy Science, 28(9), 2445–2451. https://doi.org/10.1589/jpts.28.2445
45. Bohannon, R. W., Barreca, S. R., Shove, M. E., Lambert, C., Masters, L. M., & Sigouin, C. S. (2008). Documentation of daily sit-to-stands performed by community-dwelling adults. Physiotherapy Theory and Practice, 24(6), 437–442. https://doi.org/10.1080/09593980802511813
46. Dall, P. M., & Kerr, A. (2010). Frequency of the sit to stand task: An observational study of free-living adults. Applied Ergonomics, 41(1), 58–61. https://doi.org/10.1016/j.apergo.2009.04.005
47. Bassey, E. J., Fiatarone, M. A., O’neill, E. F., Kelly, M., Evans, W. J., & Lipsitz, L. A. (1992). Leg extensor power and functional performance in very old men and women. Clinical Science, 82(3), 321–327. https://doi.org/10.1042/cs0820321
48. Brooks, S. V., & Faulkner, J. A. (1994). Skeletal muscle weakness in old age. Medicine & Science in Sports & Exercise, 26(4), 432-439. https://doi.org/10.1249/00005768-199404000-00006
49. Guralnik, J. M., Simonsick, E. M., Ferrucci, L., Glynn, R. J., Berkman, L. F., Blazer, D. G., . . . Wallace, R. B. (1994). A Short Physical Performance Battery Assessing Lower Extremity Function: Association With Self-Reported Disability and Prediction of Mortality and Nursing Home Admission. Journal of Gerontology, 49(2), 85–94. https://doi.org/10.1093/geronj/49.2.m85
50. Horlings, C. G. C., van Engelen, B. G. M., Allum, J. H. J., & Bloem, B. R. (2008). A weak balance: the contribution of muscle weakness to postural instability and falls. Nature Clinical Practice Neurology, 4(9), 504–515. https://doi.org/10.1038/ncpneuro0886
51. Tiedemann, A., Shimada, H., Sherrington, C., Murray, S., & Lord, S. (2008). The comparative ability of eight functional mobility tests for predicting falls in community dwelling older people. Age and Ageing, 37(4), 430–435. https://doi.org/10.1093/ageing/afn100
52. Bohannon, R. W. (2011). Test-Retest Reliability of the Five-Repetition Sit-to-Stand Test: A Systematic Review of the Literature Involving Adults. Journal of Strength & Conditioning Research, 25(11), 3205–3207. https://doi.org/10.1519/JSC.0b013e318234e59f
53. Luque-Siles, C., Gallego-Izquierdo, T., Jímenez-Rejano, J. J., de-la-Orden, S. G., Plaza-Manzano, G., López-Illescas-Ruizx, . . . Pecos-Martín, D. (2016). Reliability and minimal detectable change of three functional tests: Journal of Physical Therapy Science, 28(12), 3384–3389. https://doi.org/10.1589/jpts.28.3384

Introduction
25
154. Jones, C. J., Rikli, R. E., & Beam, W. C. (1999). A 30-s Chair-Stand Test as a Measure of Lower Body Strength in Community-Residing Older Adults. Research Quarterly for Exercise and Sport, 70(2), 113–119. https://doi.org/10.1080/02701367.1999.10608028
55. Rikli, R. E., & Jones, C.J., Senior fitness test manual. (2002). Choice Reviews Online, 39(06), 39–3447. https://doi.org/10.5860/choice.39-3447
56. Rikli, R. E., & Jones, C. J. (1999). Development and Validation of a Functional Fitness Test for Community-Residing Older Adults. Journal of Aging and Physical Activity, 7(2), 129–161. https://doi.org/10.1123/japa.7.2.129
57. Schurr, K., Sherrington, C., Wallbank, G., Pamphlett, P., & Olivetti, L. (2012). The minimum sit-to-stand height test: reliability, responsiveness and relationship to leg muscle strength. Clinical Rehabilitation, 26(7), 656–663. https://doi.org/10.1177/0269215511427323
58. Bohannon, R. W., Bubela, D. J., Magasi, S. R., & Gershon, R. C. (2011). Relative reliability of three objective tests of limb muscle strength. Isokinetics and Exercise Science, 19(2), 77–81. https://doi.org/10.3233/ies-2011-0400
59. Es, M., & Slütter, M. (2019, 24 April). Fietsen in cijfers. Fietsersbond. https://www.fietsersbond.nl/ons-werk/mobiliteit/fietsen-cijfers/
60. Lange, D. (2020, 3 December). Cycling - Statistics & Facts. Statista. https://www.statista.com/topics/1686/cycling/
61. National Institute of Diabetes and Digestive and Kidney Diseases. (2021, 11 January). Overweight & Obesity Statistics. https://www.niddk.nih.gov/health-information/health-statistics/overweight-obesity#prevalence
62. Hales, C. M. (2017, 1 Oktober). Prevalence of obesity among adults and youth: United States, 2015–2016. Welcome to CDC Stacks. https://stacks.cdc.gov/view/cdc/49223
63. Carreira, H., Pereira, M., Azevedo, A., & Lunet, N. (2012). Trends of BMI and prevalence of overweight and obesity in Portugal (1995–2005): A systematic review. Public health Nurse, 15(6), 972-981. doi:10.1017/S1368980012000559
64. Schönbeck, Y., Talma, H., van Dommelen, P., Bakker, B., Buitendijk, S. E., HiraSing, R. A., & van Buuren, S. (2011). Increase in Prevalence of Overweight in Dutch Children and Adolescents: A Comparison of Nationwide Growth Studies in 1980, 1997 and 2009. PLoS ONE, 6(11), e27608. https://doi.org/10.1371/journal.pone.0027608
65. Beenakker, E. A. C., van der Hoeven, J. H., Fock, J. M., & Maurits, N. M. (2001). Reference values of maximum isometric muscle force obtained in 270 children aged 4–16 years by hand-held dynamometry. Neuromuscular Disorders, 11(5), 441–446. https://doi.org/10.1016/s0960-8966(01)00193-6


Chapter 2
Reference values for isometric muscle strength among workers for
the Netherlands: a comparison of reference values
Douma, K. W., Soer, R., Krijnen, W. P., Reneman, M., & C. P. van der Schans. (2014). BMC Sports Science, Medicine and Rehabilitation, 6,(1), 10.
https://doi.org/10.1186/2052-1847-6-10

Chapter 2
28
AbstractBackground Muscle strength is important for daily life and sports and can be
measured with a hand-held dynamometer. Reference values are employed to
quantify a subject’s muscle strength. It is unclear whether reference values can
be generalized to other populations. Objectives in this study were; first to confirm
reliability of the utilization of hand-held dynamometers for isometric strength
measurement; second to determine reference values for a population of Dutch
workers; third to compare these values with those of a USA population.
Methods 462 Healthy working subjects (259 male, 203 female) were included in
this study. Their age ranged from 20 to 60 years with a mean ( SD) of 41 (11)
years. Muscle strength values from elbow flexion and extension, knee flexion and
extension, and shoulder abduction were measured with the break method using
a MicroFet 2 hand-held dynamometer. Reliability was analyzed by calculating
ICC’s and limits of agreement. Muscle strength expressed in Newton, means,
and confidence intervals were determined for males and females in age groups
ranging from twenty to sixty years old. Regression equations and explained
variances were calculated from weight, height, age, and gender. The mean values
and 95% CI were compared to the results from other studies.
Results Reliability was good; the ICCs ranged between 0.83 to 0.94. The explained
variance of the regression equations ranged from 0.25 to 0.51. Comparison of
data for the Dutch population mean muscle strength values with those from the
USA revealed important differences between muscle strength reference values for
the American and Dutch populations.
Conclusions Muscle strength measurements demonstrate a sound reliability.
Reference values and regressions equations are made available for the Dutch
population. Comparison with other studies indicates that reference values differ
between countries.

Reference values for isometric muscle strength among workers for the Netherlands
29
2
BackgroundMuscle strength is considered to be an important determinant for physical
performance, activities of daily living, and work or sport performance (1). Several
processes such as aging, development of pathological symptoms, or injury may
result in reduced muscle strength. Muscle strength can be quantified by several
viable instruments.
Precise measurements are feasible by employing hand-held dynamometers, which
allows muscle strength to be measured on a continuous scale. Several authors
have demonstrated in various settings that hand-held dynamometry is reliable
and the data valid for quantifying muscle strength. They ascertained an intraclass
correlation coefficient (ICC) of 0.8 or higher, indicating good sound reliability (2-11).
However, precise and reliable measurement outcomes are only meaningful if they
can be compared with unaffected muscle groups or, more precisely, with reference
values. For example, chronically ill patients may exhibit a bilateral decrease of
muscle strength, illustrating that the extent of the decline in a specific patient can
only be quantified if measured muscle strength values are compared with objective
reference values (8). However reference values are employed in generally every
type of physical examination and are often generated for a specific population.
For example, for six minutes walking or pulmonary function tests, reference
values are based on a population’s particular origin, and outcomes demonstrate
considerable mutual differences (10,11). Muscle strength values, however, are utilized
without taking into consideration ethnic, geographic, or cultural background. Until
now, reference values used in clinical practice and in research in the Netherlands
are based on populations in the USA. The consideration is justified if reference
values for the American population can be generalized to the Dutch population.
However, geographical location and cultural backgrounds vary considerably and,
therefore, this generalization may not be credible.
The first objective of this study was to confirm the reliability of the use of hand-
held dynamometers for isometric strength measurement; the second objective
was to determine references values for a population of Dutch workers; the third
objective was to compare these values with those of the USA population presented
in studies by Bohannon and Andrews (3,9). Comparison between reference values
for muscle strength has not been performed previously.

Chapter 2
30
MethodsDesignCross sectional study
SubjectsThe subjects were recruited via local press from different regions in the
Netherlands and had been employed in several fields, and had miscellaneous
physical workloads.
Inclusion criteria: Subjects had to be between 20 and 60 years of age and working
at least 20 hours per week. No absence from work due to illness for more than
2 weeks in the year prior to participation. Subjects were included after providing
informed consent and signing a statement of good health after meeting the criteria
of the Physical Activity Readiness Questionnaire (12,13). Exclusion criteria: Subjects
were excluded if systolic and diastolic blood pressures exceeded 159 mmHg and
100 mmHg, respectively, as described by the WHO, to prevent cardiovascular
injury (14), were absent from work in the last year as a result of a musculoskeletal
disorder, or presented co-morbidities relating to either the cardiovascular or
respiratory systems or otherwise did not meet the inclusion criteria. The Medical
Ethics Committee of the University Medical Center Groningen, the Netherlands,
approved the study protocol (METc 2005/198).
Measurement procedureThe subjects’ gender, age, hand dominance, height, weight, physical activity, and
Dictionary of Occupational Titles (DOT) level were recorded (15). The DOT level
describes the difficulty of comprehending, nature, tasks of specific types of work,
or specified occupational titles. The DOT is meant to match job requirements
and employees’ functional abilities and consists of five categories: sedentary,
light, medium, heavy, and very heavy. Maximal isometric voluntary contraction
(MVC) was measured with a MicroFet 2 hand-held dynamometer (Hogan Health
Industries, Inc. 8020 South 1300 West, West Jordan, USA). Three consecutive
measurements were performed with one minute intervals between contractions.
Isometric muscle strength from elbow flexion and extension, knee flexion and
extension, and shoulder abduction were measured. The protocol consisted of

Reference values for isometric muscle strength among workers for the Netherlands
31
2
one contraction for every individual muscle in the following sequence; 1 elbow
flexion, 2 elbow extension, 3 knee extension, 4 knee flexion, and 5 shoulder
abduction. This sequence was performed three times. Observers were allowed to
begin left or right according to their preference. Subjects were asked to gradually
increase their muscle strength to a maximum effort which would need to be
sustained for three seconds. The ‘break technique’ was employed whereby the
examiner overpowers the maximum effort of the patient, thereby producing a
measurement of eccentric muscle strength (16,17). The average muscle strength of
three repetitions was calculated to compensate for and minimize measurement
errors. Subjects were assessed by third or fourth year physiotherapy students
from the Hanze University of Applied Sciences Groningen, the Netherlands. An
experienced instructor trained the students prior to the tests. Students were
instructed to perform the break technique in the following manner. First, they
were instructed to ‘break through’ the subject’s muscle strength by countering
the strength employing a continuous, slow movement. Second, they were to
maintain their position and the patient’s position throughout the entire test.
Observers provided standardized encouragement. In the event that the observer
was unable to break through the patient’s generated strength, this was recorded
in the administration form, and that result was omitted from the data analysis.
Measurements were taken in a standardized and gravity neutral body position.
Measurement positions are described in Table 1 (Figures 1, 2 and 3).

Chapter 2
32
Tabl
e 1,
Des
crip
tion
of b
ody
posi
tions
dur
ing
mea
sure
me
Mus
cle
stre
ngth
/M
ovem
ent
Join
t/Li
mb
posi
tion
Loca
lizat
ion
HH
DPo
siti
on s
ubje
ctFi
xati
on s
ubje
ctPo
siti
on/F
ixat
ion
obse
rver
Elbo
w fl
exio
nN
eutr
al s
houl
der,
elbo
w fl
exed
90º
; up
per
arm
aga
inst
tr
unk
Just
pro
xim
al to
sty
loid
pr
oces
s of
rad
ius
Lyin
g su
pine
By b
ody
wei
ght;
feet
aga
inst
wal
lAl
ongs
ide
the
tabl
e an
d te
st s
ubje
ct,
lean
ing
back
war
d
Elbo
w e
xten
sion
Sam
e as
in fl
exio
nJu
st p
roxi
mal
to u
lnar
hea
dSa
me
as in
fle
xion
Sam
e as
in
flexi
onSa
me
as in
flex
ion
Knee
flex
ion
Hip
and
kne
e fle
xed
90º
Just
pro
xim
al to
cal
cane
usSi
ttin
g on
tabl
eBy
bod
y w
eigh
t an
d ac
tive
fixat
ion
whi
le
grip
ping
tabl
e
In fr
ont o
f tes
t sub
ject
; fe
et fi
xed
onto
tabl
e
Knee
ext
ensi
onSa
me
as in
flex
ion
Just
pro
xim
al to
talu
sSa
me
as in
fle
xion
By b
ody
wei
ght
and
activ
e fix
atio
n.
In fr
ont o
f tes
t sub
ject
; fix
ated
by
body
w
eigh
t, gr
ippi
ng ta
ble,
an
d pu
shin
g fo
rwar
d;
HH
D fi
xatio
n ag
ains
t up
per
leg
Shou
lder
abd
ucti
on90
º abd
uctio
n in
sh
ould
erJu
st p
roxi
mal
to la
tera
l ep
icon
dyle
Sitt
ing
on
exam
inat
ion
tabl
e or
cha
ir
Body
wei
ght
Behi
nd s
ubje
ct
HH
D, H
and-
held
dyn
amom
eter
.

Reference values for isometric muscle strength among workers for the Netherlands
33
2
Figure 1, Positions hand-held dynamometer. (a) elbow flexion, (b) elbow extension
Figure 2, Positions hand-held dynamometer. (a) Knee extension, (b) Knee flexion
Figure 3, Position hand-held dynamometer shoulder abduction.

Chapter 2
34
Statistical analysesAll data were analyzed with SPSS 14.0. To answer the primary objective of this study,
reliability of the three repeated measurements, the intraclass correlation coefficients
(ICC) two-way random effects model including lower and upper 95% confidence limits
(LCL and UCL), as well as the limits of agreement (LOA) were calculated (18). Limits of
agreement were collectively calculated for males and females and encompassing all
age groups and for each pair of repeated measurements [19]. ICCs were interpreted
as follows: ICC < 0.25 is low reliability; 0.25 < ICC < 50 moderate reliability; 50 < ICC <
75 good reliability and ICC > 0.75 is excellent reliability (19-21).
To address the second objective, reference values for muscle strength were
constructed by calculating means and standard deviations. Results were stratified
by age groups and gender. Differences between males and females were analyzed
utilizing independent samples t-tests. To investigate the degree to which muscle
strength is linearly related to, gender, weight, height and age, a linear regression
analysis was performed and the explained variance, (R2) was calculated. To answer
the third objective, comparisons between muscle strength outcomes of the
current study and two different studies, was performed by comparing the means
of the two other studies with our means and 95% confidence intervals (95% CI) (3,9) .
Results
SubjectsA sample of 462 healthy subjects (259 males and 203 females) was included in this study.
The subject and group characteristics are presented in Table 2.
ReliabilityCorrelations between the three measurements varied between 0.83 and 0.94, ICC
values varied between 0.83 and 0.92 and are presented in Table 3. Since the 95%
confidence intervals were small, it is relatively certain that the population values of
the coefficients are similar to the estimated values (17,19,21). All ICC values were higher
than 0.75, indicating good reproducibility for all ten muscle measurements (19,21).
The limits of agreement varied between 37.0 and 117.8 Newton. Elbow extension
left demonstrated a narrow 95% CI while knee extension right demonstrated a
wide 95% CI.

Reference values for isometric muscle strength among workers for the Netherlands
35
2
Tabl
e 2,
Cha
ract
eris
tics
of th
e po
pula
tion
stra
tified
by
age
grou
p an
d ge
nder
Mal
e
Age
grou
p20
-59
20-2
930
-39
40-4
950
-59
Age
41.7
(11)
25.2
(3)
33.6
(3)
44.9
(3)
54.1
(3)
Hei
ght
182.
1(8)
182.
0(8)
181.
4.6(
8)18
3.5(
8)18
1.2(
7)
Wei
ght
80.8
(12)
74.3
(10)
80.6
(13)
82.4
(10)
82.4
(14)
BMI
24.4
(4)
22.4
(3)
24.4
(4)
24.4
(3)
25.1
(4)
DO
T 1
18.9
10.0
22.0
25.4
15.4
DO
T 2
44.3
33.3
24.3
46.0
60.0
DO
T 3
22.9
43.3
34.1
12.7
16.9
DO
T 4
13.9
13.3
19.5
15.9
7.7
Fem
ale
Age
grou
p20
-59
20-2
930
-39
40-4
950
-59
Age
40.2
(10)
25.9
(3)
34.8
(3)
44.3
(3)
53.6
(3)
Hei
ght
170.
1(7)
172.
5(6)
170.
8(8)
170.
0(7)
167.
4(7)
Wei
ght
68.0
(11)
68.1
(13)
68.2
(9)
68.0
(11)
67.8
(12)
BMI
23.4
(3)
22.9
(4)
23.5
(3)
23.4
(3)
24.1
(4)
DO
T 1
21.2
14.0
21.1
12.7
43.6
DO
T 2
42.5
41.
933
.454
.033
.3
DO
T 3
35.3
44.2
45.5
30.2
23.1
DO
T 4
10
03.
10
Age,
Hei
ght,
Wei
ght a
nd B
MI e
xpre
ssed
in m
ean(
SD
) and
DO
T is
exp
ress
ed in
per
cent
age
of th
e po
pula
tion.
DO
T; D
ictio
nary
of O
ccup
atio
nal T
itles
. DO
T 1
= se
dent
ary,
DO
T 2
= lig
ht, D
OT
3 =
med
ium
, DO
T 4
= he
avy/
very
hea
vy.

Chapter 2
36
Table 3, Correlation between the three measurements, intraclass correlation coefficient, and limits of agreement for three repeated measurements
Muscle strength
Corr1-2
Corr1-3
Corr2-3
ICC LCL- UCL LOA1-2 LOA1-3 LOA2-3
Elbow flex. left 0.88 0.87 0.87 0.87 0.85 - 0.89
± 59.4 ± 61.6 ±61.0
Elbow flex. right
0.85 0.86 0.89 0.87 0.85 - 0.89
± 67.8 ± 66.8 ± 56.3
Elbow ext. left 0.89 0.85 0.88 0.88 0.86 - 0.89
± 42.8 ± 50.3 ±44.1
Elbow ext. right
0.91 0.91 0.93 0.92 0.90 - 0.93
± 37.0 ± 37.2 ±32.9
Knee flex. left 0.83 0.81 0.87 0.84 0.81 - 0.86
± 75.9 ± 82.5 ±68.8
Knee flex. right
0.87 0.82 0.88 0.86 0.83 - 0.88
± 69.8 ± 81.4 ±67.8
Knee ext. left 0.88 0.85 0.91 0.88 0.86 - 0.89
± 104.0 ±117.8 ±94.3
Knee ext. right.
0.91 0.90 0.94 0.92 0.90 - 0.93
± 96.3 ± 106.7 ± 80.2
Abduction left 0.83 0.80 0.87 0.83 0.80 - 0.86
± 55.2 ± 59.5 ±48.4
Abduction right
0.85 0.87 0.92 0.88 0.85 - 0.90
± 52.6 ± 46.5 ±37.3
Corr: Correlation, ICC: intraclass correlation coefficient, LCL: lower 95% confidence limit, UCL: upper 95% confidence limit, LOA: limits of agreement.
Reference valuesTables 4 and 5 illustrate the mean muscle strength values for reference values
from elbow flexion and extension, knee flexion and extension, and shoulder
abduction stratified by age groups, gender, and dominance. Regression equations
and explained variance are presented in Table 6. The explained variance varied
between 0.25 for knee extension right and 0.51 for elbow extension left.

Reference values for isometric muscle strength among workers for the Netherlands
37
2
Tabl
e 4
Dom
inan
t and
non
-dom
inan
t mus
cle
stre
ngth
mea
ns (S
D) p
er a
ge g
roup
for m
ales
Mal
eD
omin
ant
Non
dom
inan
t
Mus
cle
stre
ngth
Age
gro
upN
Mea
n(SD
) N
Mea
n (S
D)
Elbo
w fl
exio
n20
-29
4828
1(48
)48
261(
49)
30-3
951
273(
50)
5126
6(51
)
40-4
970
271(
59)
7026
1(51
)
50-5
959
259(
52)
5924
5(47
)
Elbo
w e
xten
sion
20-2
948
186(
38)
4818
2(37
)
30-3
951
183(
40)
5117
9(45
)
40-4
970
185(
46)
7017
9(44
)
50-5
959
181(
37)
5917
3(36
)
Knee
flex
ion
20-2
948
267(
57)
4825
2(52
)
30-3
951
262(
60)
5125
0(55
)
40-4
968
274(
77)
6926
3(77
)
50-5
959
242(
57)
5923
4(55
)
Knee
ext
ensi
on20
-29
47 3
79(1
05)
47 3
71(1
12)
30-3
951
351(
99)
51 3
41(1
01)
40-4
969
368
(114
)70
341
(107
)
50-5
959
337
(103
)57
335
(102
)
Scho
ulde
r ab
duct
ion
20-2
914
172(
48)
1417
3(35
)
30-3
926
181(
38)
2617
6(40
)
40-4
935
173(
43)
3517
7(40
)
50-5
937
178(
39)
3917
7(43
)
SD: s
tand
ard
devi
atio
n.

Chapter 2
38
Tabl
e 5,
Dom
inan
t and
non
-dom
inan
t mus
cle
stre
ngth
mea
ns (S
D) p
er a
ge g
roup
for f
emal
es
Fem
ale
Dom
inan
tN
on d
omin
ant
Mus
cle
stre
ngth
Age
gro
upN
Mea
n(SD
)N
Mea
n(SD
)
Elbo
w fl
exio
n20
-29
5119
1(30
)51
183(
30)
30-3
939
195(
34)
3918
6(35
)
40-4
966
191(
37)
6618
6(37
)
50-5
934
181(
29)
3416
6(22
)
Elbo
w e
xten
sion
20-2
951
132(
28)
5113
1(28
)
30-3
939
128(
24)
3912
5(26
)
40-4
966
131(
28)
6612
5(29
)
50-5
934
120(
20)
3411
8(27
)
Knee
flex
ion
20-2
951
198(
38)
5119
1(37
)
30-3
939
190(
41)
3918
8(35
)
40-4
966
190(
51)
6718
3(52
)
50-5
934
174(
42)
3416
9(45
)
Knee
ext
ensi
on20
-29
5126
1(80
)51
260(
75)
30-3
938
273(
87)
3926
4(88
)
40-4
966
262
(127
)67
245(
79)
50-5
934
244(
66)
3422
8(51
)
Scho
ulde
r ab
duct
ion
20-2
914
115(
19)
1412
4(23
)
30-3
922
116(
26)
2211
8(30
)
40-4
941
119(
28)
4111
8(26
)
50-5
915
114(
22)
1511
6(21
)
SD: s
tand
ard
devi
atio
n.
Tabl
e 6,
Reg
ress
ion
equa
tions
for c
alcu
latio
n of
refe
renc
e va
lues

Reference values for isometric muscle strength among workers for the Netherlands
39
2
Muscle strength Regression equations R2
Elbow flex. left -4.93+56.96*S - 0.64*A +0.89*W +0,89*H 0.51
Elbow flex. right 10.67+57.47*S -0.72*A +0.95*W +0.85*H 0.49
Elbow flex. left 23.85+36.56*S -0.50*A +1.07*W +0.29*H 0.44
Elbow flex. right 80.39+41.56*S -0.47*A +0.14*W +0.06*H 0.48
Knee flex. left 47.92+43.52*S -0.60*A +1.36*W +0.40*H 0.34
Knee flex. right 43.84+47.03*S -0.71*A +1.33*W +0.50*H 0.35
Knee ext. left -204.36+43.96*S -1.13*A +1.90*W +2.19*H 0.31
Knee ext. right -215.54+40.73*S -0.82*A +2.0*W +2.22*H 0.25
Shoulder abd. left -20.86+45.25*S -0.004*A +0.64*W +0.56*H 0.46
Shoulder abd. right 10.07+43.63*S -0.16*A +0.76*W +0.36*H 0.34
S, sex (1 for male, 0 for female); A, age; W, weight; H, height.
ComparisonMean muscle strength values and the 95% CI from the current study and mean
muscle strength values from studies by Bohannon and Andrews are presented in
Tables 7 and 8. Comparison of Dutch mean muscle strength values to those from
Bohannon and Andrews (3,9) revealed that a significant difference existed between
reference muscle strength values between different populations.

Chapter 2
40
Tabl
e 7,
Com
paris
on b
etw
een
the
curr
ent s
tudy
and
stu
dies
of B
ohan
non
(3) a
nd A
ndre
ws
(9) f
or m
ale
Mal
eD
omin
ant
Non
dom
inan
tM
uscl
e st
reng
thCu
rren
t st
udy
Boha
nnon
And
rew
sCu
rren
t st
udy
Boha
nnon
And
rew
s
Mea
n (9
5% C
I)M
ean
Mea
nM
ean
(95%
CI)
Mea
nM
ean
Elbo
w fl
exio
n
A
ge g
roup
20-
2928
1 (2
67-2
95)
285
-26
1 (2
47-2
76)
279
-
3
0-39
273
(259
-287
)26
9-
266
(252
-281
)28
1-
40-
4927
1 (2
58-2
86)
269
-26
1 (2
49-2
74)
270
-
5
0-59
259
(246
-272
)28
729
224
5 (2
32-2
57)
268
272
Elbo
w e
xten
sion
Age
gro
up
2
0-29
186
(175
-197
)24
4-
182
(171
-194
)24
5-
30-
3918
5 (1
72-1
94)
214
-17
9 (1
67-1
92)
231
-
4
0-49
185
(174
-196
)21
0-
179
(169
-190
)21
4-
50-
5918
1 (1
71-1
90)
197
188
173
(164
-182
)18
617
8Kn
ee e
xten
sion
Age
gro
up
2
0-29
379
(348
-409
)57
5-
371
(339
-404
)57
9-
30-
3935
1 (3
23-3
78)
573
-34
1 (3
12-3
69)
572
-
4
0-49
368
(341
-395
)58
3-
341
(315
-366
)58
9-
50-
5933
7 (3
10-3
63)
471
448
335
(308
-362
)46
843
9Sh
ould
er a
bduc
tion
Age
gro
up
2
0-29
172
(144
-200
)25
8-
173
(152
-193
)24
6-
30-
3918
1 (1
65-1
96)
249
-17
6 (1
59-1
92)
237
-
4
0-49
173
(158
-188
)24
6-
177
(163
-191
)24
4-
50-
5917
8 (1
65-1
91)
240
238
177
(163
-191
)22
322
2
Bold
pri
nted
num
bers
are
val
ues
outs
ide
the
95%
CI o
f thi
s st
udy.
Age
grou
ps a
re g
iven
in d
ecad
es in
yea
rs, M
uscl
e st
reng
th is
giv
en in
New
ton.

Reference values for isometric muscle strength among workers for the Netherlands
41
2
Tabl
e 8,
Com
pari
son
betw
een
the
pres
ent s
tudy
and
stu
dies
of B
ohan
non
(3) a
nd A
ndre
ws
(9) f
or fe
mal
e
Fem
ale
Dom
inan
tN
on d
omin
ant
Mus
cle
stre
ngth
Curr
ent
stud
yBo
hann
onA
ndre
ws
Curr
ent
stud
yBo
hann
onA
ndre
ws
Mea
n (9
5% C
I)M
ean
Mea
nM
ean
(95%
CI)
Mea
nM
ean
Elbo
w fl
exio
n
Age
gro
up
20-
2919
1 (1
82-1
99)
155
-18
3 (1
75-1
92)
151
-
30-
3919
5 (1
84-2
06)
164
-18
6 (1
75-1
98)
161
-
40-
4919
1 (1
82-1
99)
151
-18
6 (1
76-1
95)
157
-
50-
5918
1 (1
71-1
91)
155
167
166
(158
-174
)15
616
0
Elbo
w e
xten
sion
Age
gro
up
20-
2913
2 (1
24-1
39)
116
-13
1 (1
23-1
39)
115
-
3
0-39
128
(121
-135
)11
7-
125
(116
-133
)11
9-
40-
4913
1 (1
24-1
37)
110
-12
5 (1
18-1
32)
112
-
50-
5912
0 (1
13-1
27)
111
108
118
(109
-127
)10
710
4
Knee
ext
ensi
on
Age
grou
p
2
0-29
261
(234
-288
)46
7-
260
(238
-281
)46
6-
30-
3927
3 (2
44-3
02)
408
-26
4 (2
35-2
92)
411
-
4
0-49
262
(231
-293
)38
1-
245
(225
-265
)36
3-
50-
5924
4 (2
21-2
67)
335
298
230
(210
-246
)31
929
3Sh
ould
er a
bduc
tion
Age
grou
p
20-
2911
5 (1
04-1
27)
153
-12
4 (1
10-1
37)
135
-
3
0-39
116
(105
-128
)13
9-
118
(104
-131
)13
6-
40-
4911
9 (1
10-1
28)
139
-11
8 (1
09-1
26)
129
-
5
0-59
114
(110
-128
)13
713
511
6 (1
04-1
28)
135
124
Bold
prin
ted
num
bers
are
val
ues
outs
ide
the
95%
CI o
f thi
s st
udy.
Age
gro
ups
are
give
n in
dec
ades
in y
ears
, Mus
cle
stre
ngth
is g
iven
in N
ewto
n.

Chapter 2
42
Comparison indicates that, for males, mean muscle strength values of Bohannon
and Andrews were greater than those of the current study except for elbow
flexion of the dominant and non-dominant sides in which only the age group 50–
59 years exhibited greater values. For females, mean muscle strength values of
Bohannon and Andrews were lower for elbow flexion and extension than those
in the present study with the exception of elbow extension, non-dominant for age
group 30 to 39 (Bohannon) and 50 to 59 (Andrews) years. Shoulder abduction and
knee flexion and extension indicated greater values in the study of Bohannon and
Andrews, except for shoulder abduction of the non-dominant side with age group
20 to 29 years.
DiscussionReliability of muscle strength measurements with a hand-held dynamometer is
good to excellent. All ICC values exceeded 0.80, indicating good reliability for all
ten muscle measurements. These findings corroborate with those of Bohannon (5). Reference values for muscle strength for the Dutch working population
between 20 and 60 years of age are now made available. Reference values based
on age gender, weight and height can be calculated using regression equations.
Comparison of the Dutch mean muscle strength values to those published by
Bohannon and Andrews revealed significant differences between reference
values for muscle strength values between the assessed populations. Comparison
of reference values between populations have not been initiated previously.
Muscle strength measurements with a hand-held dynamometer exhibited a good
reliability as demonstrated by the ICCs. The LOA, however, vary substantially.
Muscle groups with a relatively low muscle strength demonstrated a small
range of the LOA while muscle with a greater muscle strength demonstrated a
larger range of the LOA, indicating that measurements of stronger muscles are
less precise. Though hand-held dynamometers have shown to be a reliable and
beneficial instrument for measuring muscle strength, a hand-held dynamometer
may possess some practical limitations. In subjects with high Quadriceps muscle
strength, it might be impossible to perform a correct measurement (12). During our
study, it was not possible to perform a correct measurement of the Quadriceps
muscle in six subjects due to high muscle strength as observers were not capable
of performing a correct break procedure. As reliability and validity may be affected

Reference values for isometric muscle strength among workers for the Netherlands
43
2
during these measurements, bias was likely present, which is the reason that
these results were omitted from the analysis. The influence of exclusion of these
data on reliability, regression formulas, and reference values is very limited due
to the considerable sample size. Provided that observers were able to properly
perform according to the protocol, the regressions formula for knee extension
might be only slightly changed. In our opinion, a hand-held dynamometer is
not suitable for measuring Quadriceps muscle strength in stronger subjects.
Reference values for muscle strength for the Dutch working population between
the ages of 20 and 60 years are now made available. Regression equations illustrate
that gender, weight, and height are of major influence on muscle strength.
The effect of age, however, is limited. In several of the regression analyses, the
effect of age was small, though significant, due to the considerable sample size.
Regression analysis demonstrated that the effect of aging for subjects aged 20–
60 years is larger for lower extremities than for upper extremities. These results
are predominantly consistent with previously reported results (3,9). Bohannon and
Andrews also reported that gender, age, height, and weight were predictors of
muscle strength and that age correlated significantly, though very limited, with
muscle strength. Comparison of the outcomes of our study to those earlier
exhibited an important difference between reference values. The differences in
upper extremity tests, however, were moderate in all cases, whereas most of
the lower extremity differences were considerable. For instance, differences in
muscle strength greater than 100 Newton for knee extension may have clinical
consequences as 100 Newton’s may be up to 42 percent of the maximum knee
extension strength in the Dutch female population. The observed differences,
however, exceed 100 Newton. This difference is all the more remarkable because,
in our study, we employed the break method while, in the studies of Bohannon
and Andrews, the make method was used. The break method leads to higher
levels in muscle strength measurements (16). The observed differences in the lower
extremity are relevant for clinical practice. These differences may probably cause
unattainable and/or undesirable training goals to be set and may result in undesired
side effects as these external reference values may be too high and, therefore,
not suitable for the Dutch population. However, reference values formulated for
the United States are, at this moment, utilized in clinical practice and research
in the Netherlands. The results of our study demonstrate that reference values
cannot simply be generalized to any country, geographical area, or population.
Chapter 2
44
Therefore, it is necessary to generate reference values for different countries or
geographical areas. For other physiological tests such as the six minutes walking
test reference values for specific geographic reference values are available and
indicate considerable differences (9). Although we did not assess cultural habits
or demographic aspects of populations, it is likely that the outcomes of muscle
strength measurements may be influenced by several such factors. Psychological
state or prior experiences related to exertion or physiological responses to
exercise, exertion, or pain might have influenced the outcomes (21) In addition,
body composition and weight are related to muscle strength as presented in the
regression equations. Another potential explanation for the differences between
our reference values and those previously reported by Andrews and Bohannon
is the difference in time periods. The reference values of Andrews and Bohannon
were determined in 1988 and ours in 2010. In approximately 20 years, some
characteristics such as BMI or physical activity level may have changed which may
affect references values.
Study limitationsIn our study, we tested the employed working population between the ages
of 20 and 60 years. Our study, therefore, only provides reference values and
comparisons for this group. Our study does not provide information regarding, for
example, unemployed businessmen or housekeepers. Another limitation in our
study is that observers were male and female. We did not register whether subjects
were tested by male or female observers. The outcomes of measurements may
be biased by the gender of the observer. Reliable muscle strength measurements,
appropriate and applicable reference values, and accurate knowledge of acquired
muscle strength in daily living facilitates formulating an effective and accurate
rehabilitation process with clear and realistic goals and objective effects. Although
reliable measurements of a person’s muscle strength are beneficial, no valid
procedures are currently available for translating isometric contractions or
reference values, for that matter, into function. Functional tests probably provide
an improved reflection of a subject’s functional muscle strength, capacity, or ability
for activities of daily living or work. Therefore the role of muscle strength should
be interpreted with caution and that other variables may also influence activities
of daily living. Additional studies are needed to define the specific role and the
amount of muscle strength required in activities of daily living.

Reference values for isometric muscle strength among workers for the Netherlands
45
2
ConclusionsMeasuring muscle strength by dynamometry is reliable and suitable for clinical
practice. Substantial differences exist for reference muscle strength values
between different populations. Reference values are specific for different regions
and cannot simply be generalized to other populations.

Chapter 2
46
References1. Morris, M. G., Dawes, H., Howells, K., Scot, O. M., & Cramp, M. (2008). Relationship
between muscle fatigue characteristics and markers of endurance performance. Journal of Sports Science and Medicine, 7(4), 31–436. https://www.ncbi.nlm.nih.gov/pmc/articles/PMC3761932/
2. Ploeg, R. J. O., Oosterhuis, H. J. G. H., & Reuvekamp, J. (1984). Measuring muscle strength. Journal of Neurology, 231(4), 200–203. https://doi.org/10.1007/bf00313939
3. Bohannon, R. W. (1997). Reference values for extremity muscle strength obtained by hand-held dynamometry from adults aged 20 to 79 years. Archives of Physical Medicine and Rehabilitation, 78(1), 26–32. https://doi.org/10.1016/s0003-9993(97)90005-8
4. Bohannon R.W., & Andrews A.,W. (1987). Interrater reliability of hand-held dynamometry. Physical Therapy, 67(6), 931–933. https://doi.org/10.1093/ptj/67.6.931
5. Dunn, J. C., & Iversen, M. D. (2003). Interrater Reliability of Knee Muscle Forces Obtained by Hand-held Dynamometer from Elderly Subjects with Degenerative Back Pain. Journal of Geriatric Physical Therapy, 26(3), 23–29. https://doi.org/10.1519/00139143-200312000-00004
6. Wang, C.Y., Olson, S. L., & Protas, E. J. (2002). Test-retest strength reliability: Hand-held dynamometry in community-dwelling elderly fallers. Archives of Physical Medicine and Rehabilitation, 83(6), 811–815. https://doi.org/10.1053/apmr.2002.32743
7. Roy, M. A. G., & Doherty, T. J. (2004). Reliability of Hand-Held Dynamometry in Assessment of Knee Extensor Strength After Hip Fracture. American Journal of Physical Medicine & Rehabilitation, 83(11), 813–818. https://doi.org/10.1097/01.phm.0000143405.17932.78
8. Bohannon, R. W. (1997). Discriminant Construct Validity of Hand-Held Dynamometry and Manual Muscle Testing in a Home Care Setting. Journal of Physical Therapy Science, 9(2), 57–61. https://doi.org/10.1589/jpts.9.57
9. Andrews, A. W., Thomas, M. W., & Bohannon, R. W. (1996). Normative Values for Isometric Muscle Force Measurements Obtained With Hand-held Dynamometers. Physical Therapy, 76(3), 248–259. https://doi.org/10.1093/ptj/76.3.248
10. Vaish, H., Ahmed, F., Singla, R., & Shukla, D. K. (2013). Reference equation for the 6-minute walk test in healthy North Indian adult males. The International Journal of Tuberculosis and Lung Disease, 17(5), 698–703. https://doi.org/10.5588/ijtld.12.0474
11. Fulambarker, A., Copur, A. S., Javeri, A., Jere, S., & Cohen, M. E. (2004). Reference Values for Pulmonary Function in Asian Indians Living in the United States. Chest, 126(4), 1225–1233. https://doi.org/10.1378/chest.126.4.1225
12. Conference on physical activity, fitness and health (1978). PAR-Q Validation Report. In British Columbia Ministry of Health, Champaign, IL: Human Kinetics.
13. Thomas, S., Reading, J., & Shephard, R. J. (1992). Revision of the physical activity readiness questionnaire (PAR-Q). Canadian journal of sport sciences, 17(4), 338–345
14. WHO. (1978, March). WHO Expert Committee on Arterial Hypertension & World Health Organization. (1978). Arterial hypertension: report of a WHO expert committee (meeting held in Geneva from 13 to 21 March 1978). World Health Organization. https://apps.who.int/iris/handle/10665/41632

Reference values for isometric muscle strength among workers for the Netherlands
47
2
15. US Department of Labor, Employment and Training Administration. (1991). Dictionary of Occupational Titles, 4th edition. Washington (DC): U.S. Government Printing Office
16. Burns, S. P., & Spanier, D. E. (2005). Break-Technique Handheld Dynamometry: Relation Between Angular Velocity and Strength Measurements. Archives of Physical Medicine and Rehabilitation, 86(7), 1420–1426. https://doi.org/10.1016/j.apmr.2004.12.041
17. Bohannon, R. W. (1988). Make Tests and Break Tests of Elbow Flexor Muscle Strength. Physical Therapy, 68(2), 193–194. https://doi.org/10.1093/ptj/68.2.193
18. Hayes, A. F., & Krippendorff, K. (2007). Answering the Call for a Standard Reliability Measure for Coding Data. Communication Methods and Measures, 1(1), 77–89. https://doi.org/10.1080/19312450709336664
19. McGraw, K. O., & Wong, S. P. (1996). Forming inferences about some intraclass correlation coefficients. Psychological Methods, 1(1), 30–46. https://doi.org/10.1037/1082-989x.1.1.30
20. Shrout, P. E., & Fleiss, J. L. (1979). Intraclass correlations: Uses in assessing rater reliability. Psychological Bulletin, 86(2), 420–428. https://doi.org/10.1037/0033-2909.86.2.420
21. Fleiss, J. L. (1999). Chapter 1: Reliability of measurements. Design and Analysis of Clinical Experiments, New York, Wiley
22. Hamilton, A. L., Killian, K. J., Summers, E., & Jones, N. L. (1996). Symptom Intensity and Subjective Limitation to Exercise in Patients With Cardiorespiratory Disorders. Chest, 110(5), 1255–1263. https://doi.org/10.1378/chest.110.5.1255


Chapter 3
Reference values for isometric muscle strength in children 8 to 17
years of age for the Netherlands
Douma, K. W., Krijnen, W. P., Slager, G. E. C., & van der Schans, C. P. submitted

Chapter 3
50
Abstract Background Several previous studies provided reference values for isometric
muscle strength for children. It is not clear if these reference values are currently
usable. The objective of this study was to determine reference values of isometric
muscle strength for children from 8 to 17 years of age and to compare these
with previously Dutch reported values and recently reported Chilean values.
A secondary objective was to predict muscle strength based on weight, height,
gender, and age.
Methods A sample of 1,252 subjects of which 594 were girls and 658 were boys,
mean (SD) age 13.0 (2.4) years, height 164.0 (13.7) cm and weight 53.9 (14.4)
kg participated in this study. Muscle strength of flexion and extension of knee
and elbow were measured bilaterally using a hand-held dynamometer. Muscle
strength was expressed in Newton and stratified by age. Regression equations
and explained variances were calculated from weight, height, gender, and age.
The mean values and 95% CI were compared to the results from previous studies.
Results The boys were generally stronger than the girls. In the regression
equations, length had a strong effect on elbow flexion strength whereas weight
had a strong effect on knee flexion and extension strength. The explained
variance (R2 adjusted) varied between 0.46 for left elbow extension to 0.66 for
right knee extension and left elbow flexion. Muscle strength in the current Dutch
study was lower in 29 of the 72 values compared to the prior Dutch study (2001)
The difference ranged from 1 Newton in elbow extension for girls 9 years of age
to 187 Newton for knee flexion for boys 16 years of age. Compared to a Chilean
study (2016), Dutch children were systematically stronger in all age and muscle
groups ranging from 15 Newtons in boys 11 years of age to 217 Newtons for knee
extension in boys 15 years of age.
Conclusion Reference values for strength are region and time specific and those
within specific geographical areas should be updated regularly. For modeling
reference values, weight, height, gender, and age should be included in the
regression equations.

Reference values for isometric muscle strength in children 8 to 17 years of age for the Netherlands
51
3
BackgroundThe most obvious benefit of strong, healthy muscles in children is the ability
to perform everyday activities such as playing and running. Muscle strength
provides self-sufficiency which contributes to a healthy lifestyle (1,2). Impaired
muscle strength is often ascertained in children with chronic diseases such as
cystic fibroses or after an injury and is one of the major factors contributing to
functional limitations (3,4,5,6). Strength training is therefore often used in training or
rehabilitation programs (5,7). To determine to what extent a child’s muscle strength
is impaired a comparison with accurate reference values is needed (8 9,10,12,13,15).
Reference values are obtained from large scale measurements among groups
stratified by age, height, and gender (8,9,10,11,12,13,14,) which are important to take into
account when predicting muscle strength (9,10,14,15,16). Reference values for muscle
strength in children have been provided in several countries (8,9,10,13,14,15).
It is not clear if reference values for muscle strength can be generalized to other
countries as historic, cultural, and anthropometric characteristics may differ
between countries (16,18). For example, the mean height of the Dutch male is 1.83
meters and 1.71 meters in Chile (17). Additionally, bodyweight has increased in
several countries over the last decades due to eating habits and inactive lifestyles (19,20,21,22,23,14,15). For example, in the Netherlands in 1980, 6% of boys and 11% of
the girls aged 8 to 17 years of age were overweight or obese whereas these
percentages had almost doubled in 2009 (25). In Dutch clinical settings, muscle
strength is evaluated based on reference values obtained in 2001(12). It is not
evident if muscle strength can still be predicted correctly when using previously
found regression equations. The objective of this study is to determine current
muscle strength reference values for children between 8 to 17 years of age and
to compare these with previously reported Dutch and Chilean reference values. A
secondary objective is to analyze to which degree muscle strength can predicted
statistically from weight, height, gender, and age.
MethodsDesignCross sectional study

Chapter 3
52
ParticipantsA convenience sample of subjects from various primary and high schools in
urban and rural areas in the north of the Netherlands participated in the study.
After permission from the executive board of the participating schools, children,
parents, and teachers were informed in writing and asked for permission to
participate in the study. The inclusion criteria were between 8 to 17 years of age
, good general health, and being mentally and physically capable of undergoing
the measurement. A good general health status was defined as a negative score
on the Physical Activity Readiness Questionnaire (PARQ) (26) and participation in
sport classes. For children younger than 12 years of age, parents were asked to
provide informed consent and, for those between 12 to 17 years of age, both the
children and the parents were asked to sign informed consent to participate in
the measurements and approve the anonymized use of the data for scientific
purposes. Muscle strength measurements were performed as an element during
sports and exercise classes and were supervised by the first author (KD).
The Medical Ethical Committee of the University Medical Center Groningen
exempted approval of the study protocol (M15.169717).
Measurement procedureThe participant’s weight, height, age, and gender were recorded. Weight was
measured with an analog Sega 750 weight scale and height with a stature meter
that was fixed on a wooden lath (Seca, gmbh & co Hammer Steindamm 3-25 22089
Hamburg, Germany). Maximal isometric muscle strength was measured with a
MicroFet 2 hand-held dynamometer (Hogan Health Industries, Inc. 8020 South
1300 West, West Jordan, USA). Four major muscle groups were tested in a fixed
sequence on the left and right side; elbow flexion, elbow extension, knee extension,
and knee flexion. Muscle strength was expressed in Newton and stratified by age
and gender. Participants were allowed to choose the side with which to begin.
After completing the measurements, the same sequence was repeated. The mean
of both measurements was used for further analysis for a more precise outcome.
Participants were instructed to maintain their body position throughout the entire
test (Table 1 and Figure 1). The break technique was applied to facilitate the
comparison of results with those of previous studies in the Netherlands and Chile (8,12). In the break method, the examiner overpowered the maximum generated

Reference values for isometric muscle strength in children 8 to 17 years of age for the Netherlands
53
3
force of the participant in order to reliably measure maximal isometric muscle
strength (27,28,29). Participants were instructed to gradually increase the force
to maximum effort in three seconds and to sustain this for two seconds. If the
observer could not break through the generated strength, this was noted on the
administration form and the data was omitted from the study. The participants
were measured by third year physiotherapy students from the Hanze University
of Applied Sciences Groningen, the Netherlands. All students had experience
with hand-held dynamometry but were additionally trained by an experienced
instructor (KD) prior to the actual testing. During measurements, standardized
encouragements were given. All measurements for this research were performed
within a two year period.
Table 1, Description of body positions during measurements
Muscle Action
Joint Position
Localization HHD*
Position Subject
Fixation Subject
Position/Fixation Examiner
Elbow flexion
Neutral shoulder, elbow flexed 90º; upper arm against trunk
Just proximal to styloid process of radius
Lying supine
By body weight; feet against wall
Alongside the table and test subject; leaning backward
Elbow extension
Same as in flexion
Just proximal to ulnar head
Same as in flexion
Same as in flexion
Same as in flexion
Knee flexion Hip and knee flexed 90º
Just proximal to calcaneus
Sitting on table
By body weight and active fixation while gripping table
In front of test subject; feet fixed onto table
Knee extension
Same as in flexion
Just proximal to the talis
Same as in flexion
By body weight and active fixation
In front of test subject; feet fixed onto table
*HHD, Hand-held dynamometer.

Chapter 3
54
Figure 1 illustrates the position of the hand-held dynamometer for the different
measurements.
Figure 1, Position of the hand-held dynamometer for elbow flexion and extension and knee extension and flexion.
Statistical analysesData were analyzed with the Statistical Package for the Social Sciences (SPSS)
version 23.0 and R version 3.2.0. Measurements were determined stratified for
age and gender group means and standard deviations of muscle strength. To
determine the reliability of the two series of measurements per participant, the
intra class correlations (ICC) (two-way random effects model, absolute agreement)
were calculated (30). Interpretation of the ICCs was as follows: ICC < 0.25 low;
0.25 < ICC < 50 moderate; 50 < ICC < 75 good; and ICC > 0.75 excellent reliability (31,32,33). Standard deviation of the mean differences (SDdifference) were determined
to calculate the limits of agreement (LOA), (30) (±1.96 * SDdifference). Linear regression
analyses were performed to statistically predict strength based on, weight, height
gender, and age. A difference in means and corresponding 95% confidence
intervals between current reference values and previously reported reference
values were calculated using a Confidence Interval Analysis (34).
Results
ParticipantsIn total, 1,252 healthy children (594 girls and 658 boys, mean (SD) age 13.2 (2.4),
mean (SD) height 164.0 (13.7) cm, mean (SD) weight 53.9 (14.4) kg, and mean

Reference values for isometric muscle strength in children 8 to 17 years of age for the Netherlands
55
3
(SD) BMI 19.6 (3.4)) participated. The data of two females and three males was
excluded from the analyses because the observer was unable to break through
the participant’s generated strength.
ReliabilityThe ICC coefficients ranged from 0.80 and 0.95. The LOA varied between 44 N for
right elbow extension to 101 N for right knee extension which corresponded with
21% and 36% of the mean measured values, respectively.
Reference valuesThe strength of elbow flexion varied from mean (SD) 115 (35) N for boys 8 years
of age to 280 (102) N for boys 17 years of age and from 115 (28) N for girls 9
years of age to 212 (40) N for girls 17 years of age (Table 2). The strength of elbow
extension varied from mean (SD) 91(18) N for boys 11 years of age to 166 (61) N
for boys 17 years of age and from 78(14) N for girls 10 years of age to 127 (31) N
for girls 17 years of age. Strength of knee flexion varied from mean (SD) 129 N
for boys 8 years of age to 257 (109) N for boys 17 years of age and from 113 (21)
N for girls 10 years of age to 222 (54) N for girls 17 years of age. The strength of
knee extension varied between mean (SD) 150 (40) N for boys 8 years of age to
393 (178) N for boys 17 years of age and from 113 (21) N for girls 10 years of age
to 222 (54) N for girls 17 years of age. Overall muscle strength increased with age
and the difference between boys and girls regarding muscle strength increased
from 14 years of age.

Chapter 3
56
Table 2, Mean (SD) muscle strength in Newton stratified by Side, Age and Gender
Muscle action N BoysLeft Mean (SD)
RightMean (SD)
N GirlsLeftMean (SD)
RightMean (SD)
Age 8 year
Elbow Flexion
Elbow Extension
Knee Flexion
Knee extension
18
115(35)
98(29)
129(28)
150(40)
117(32
98(20)
132(30)
156(37)
18
122(38)
98(35)
138(68)
171(69)
120(37)
101(32)
130(48)
164(70)
Age 9 year
Elbow Flexion
Elbow Extension
Knee Flexion
Knee extension
40
125(26)
98(18)
140(32)
164(36)
133(31)
95(19)
140(32)
165(37)
32
115(28)
93(19)
115(28)
153(30)
120(24)
92(19)
120(24)
157.(39)
Age 10 year
Elbow Flexion
Elbow Extension
Knee Flexion
Knee extension
52
128(20)
88(18)
130(29)
156(44)
131(28)
92(18)
133(28)
164(36)
40
117(25)
78(14)
113(21)
148(36)
121(25)
86(15)
114(25)
144(44)
Age 11 year
Elbow Flexion
Elbow Extension
Knee Flexion
Knee extension
32
139(24)
91(18)
136(47)
164(57)
149(26)
96(23)
137(49)
169(59)
34
145(23)
91(20)
121(24)
156(42)
144(41)
95(18)
119(31)
159(52)
Age 12 year
Elbow Flexion
Elbow Extension
Knee Flexion
Knee extension
90
163(43)
102(31)
160(44)
226(63)
172(47)
107(31)
167(46)
243(71)
65
161(45)
97(31)
154(54)
221(80)
163(47)
106(32)
154(48)
225(77)
Age 13 year
Elbow Flexion
Elbow Extension
Knee Flexion
Knee extension
99
196(38)
118(22)
184(46)
265(66)
206(38)
123(26)
199(54)
280(75)
96
182(84)
108(24)
181(41)
257(74)
188(36)
112(26)
184(41)
262(79)

Reference values for isometric muscle strength in children 8 to 17 years of age for the Netherlands
57
3
Muscle action N BoysLeft Mean (SD)
RightMean (SD)
N GirlsLeftMean (SD)
RightMean (SD)
Age 14 year
Elbow Flexion
Elbow Extension
Knee Flexion
Knee extension
105
209(54)
132(40)
193(53)
287(83)
218(60)
133(39)
206(57)
301(89)
104
183(47)
108(34)
191(57)
279(92)
189(49)
113(37)
195(56)
285(96)
SD = standard deviation.
Table 2, (continued) Mean (SD) muscle strength in Newton stratified by Side, Age and Gender
Muscle action
N BoysLeftMean (SD)
BoysRightMean (SD)
N GirlsLeftMean (SD)
GirlsRightMean (SD)
Age 15 year
Elbow Flexion
Elbow Extension
Knee Flexion
Knee extension
83
266(56)
175(39)
250(61)
355(95)
282(55)
178(39)
267(60)
373(96)
91
193(28)
116(27)
209(44)
304(77)
202(29)
118(26)
215(45)
318(74)
Age 16 year
Elbow Flexion
Elbow Extension
Knee Flexion
Knee extension
92
258(68)
161(52)
247)81)
379(107
267(76)
164(52)
251(86)
391(128)
65
185(60)
114(41)
186(67)
293(105)
193(63)
116(63)
195(70)
292(110)
Age 17 year
Elbow Flexion
Elbow Extension
Knee Flexion
Knee extension
39
263(92)
165(65)
249(103)
393(178)
-
280(102)
166(61)
257(109)
390(172)
-
45
207(36)
112(29)
222(54)
346(87)
-
212(40)
127(31)
220(54)
350(91)
-
SD = standard deviation.

Chapter 3
58
In the regression equations, to predict muscle strength, length had a strong effect
on elbow flexion strength whereas weight had a strong effect on knee flexion and
extension strength. The obtained regression equations are presented in Table 3.
The explained variance (R2 adjusted) ranged from 0.46 for elbow extension left to
0.66 for knee extension right and elbow flexion left.
Table 3, Regression equations to predict muscle strength based on side, gender, age, height and weight
Muscle actionEquations
R2 adj.
EFL -166.3 + (22.4*Gender) + (6.6*Age) + (1.1*Height) + (1.3*Weight) 0.66EFR -177.2 + (28.5*Gender) + (7.3*Age) + (1.2*Height) + (1.4*Weight) 0.65EEL -32.5 + (21.3*Gender) + (3.8*Age) + (0.2*Height) + (1.0*Weight) 0.46EER -28.4 + (20.8*Gender) + (3.5*Age) + (0.2*Height) + (1.0*Weight) 0.47KFL -71.4 + (12.9*Gender) + (5.7*Age) + (0.4*Height) + (2.0*Weight) 0.53KFR -78.5 + (20.9*Gender) + (7.5*Age) + (0.3*Height) + (2.0*Weight) 0.46KEL -159.8 + (18.0*Gender) + (15.9*Age) + (0.4*Height) + (2.7*Weight) 0.66KER -176.8 + (24.3*Gender) + (16.4*Age) + (0.4*Height) + (2.8*Weight) 0.56
EFL = Elbow flexion left, EFR = Elbow flexion right, EEL= Elbow extension left, EER = Elbow extension right, KFL = Knee flexion left, KFR = Knee flexion right, KEL = Knee extension left,
KER = Knee extension right, Gender: 1= boy, 0=girl, Age in years of age, Height in cm, Weight in kg, R2 Adj (Adjusted) = Explained variance.
Muscle strength in the current study was significantly less compared to the
previous Dutch study (12) in 29 out of 72 comparisons (Table 4). The differences
in means ranged from 1 N for elbow extension in girls 9 years of age to 187 N for
knee flexion in boys 16 years of age. The differences that were ascertained occur
more frequently and more pronounced in the lower extremity compared to the
upper extremity, 23 and 6 times, respectively, and are more frequently observed
in boys compared to girls 18 and 11 times, respectively. An analysis of confidence
intervals from the current and the recent Chilean study (8) revealed significant
differences for all muscles at all ages except elbow flexion in boys 8 years of age.
The observed differences between our means and the Chilean study ranged from
2 N for elbow flexion in boys 8 years of age to 225 N in knee extension in boys 15
years of age.

Reference values for isometric muscle strength in children 8 to 17 years of age for the Netherlands
59
3
Table 4a, Mean (SD) muscle strength values and the 95% CI of the difference in means for current study and those that of a previous Dutch study (10) and the Chilean study from (6) for boys
Muscle action
Previous DutchMean (SD)
Current-Previous95%CI ΔLCL UCL
Current Mean (SD)
Current- Chilean95%CI ΔLCL UCL
Chilean Mean (SD)
8 year
EF
EE
KF
KE
124(23
90(18)
185(20)
185(41)
-30 16
-7 23
-74 32
-60 2
117(31)
98(20)
132(29)
156(37)
-19 23
31 51
66 102
115(32)
57(11)
72(13)
9 year
EF
EE
KF
KE
134(24)
89(22)
195(40)
194(30)
-21 19
-6 20
-78 -31
-53 -5
133(31)
96(18)
140(32)
165(37)
45 77
15 35
52 90
72(16)
71(14)
94(19)
10 year
EF
EE
KF
KE
173(19)
120(18)
268(48)
267(47)
-60 -24
-40 - 9
-156 -113
-129 -77
131(27)
96(23)
133(27)
164(36)
57 83
25 47
33 67
61(11)
60(8)
114(11)
11year
EF
EE
KF
KE
153(30)
103(31)
218(64)
239(56)
-23 15
-25 11
-118 -44
-111 -29
149(25)
96(23)
137(48)
169(59)
57 81
3 25
15 69
80(13)
82(14)
127(19)
12 year
EF
EE
KF
KE
160(25)
104(31)
201(34)
225(43)
-20 44
-18 24
-65 -3
-30 66
172(47)
107(30)
167(46)
243(71)
67 113
7 37
74 144
82(15)
85(12)
134(27)
13 year
EF
EE
KF
KE
195(26)
128(42)
273(59)
296(70)
-9 34
-21 11
-106 -42
-61 29
207(37)
123(25)
199(53)
280(74)
89 127
18 44
81 157
99(22)
92(11)
161(41)

Chapter 3
60
Muscle action
Previous DutchMean (SD)
Current-Previous95%CI ΔLCL UCL
Current Mean (SD)
Current- Chilean95%CI ΔLCL UCL
Chilean Mean (SD)
14 year
EF
EE
KF
KE
253(50)
158(42)
307(64)
370(61)
-69 -1
-48 -2
-134 -68
-119 -19
218(59)
133(39)
206(56)
301(89)
83 129
1 33
72 142
112(30)
116(29)
194(32)
15 year
EF
EE
KF
KE
278(55)
175(46)
327(76)
362(76)
-29 39
-21 27
-98 -22
-46 68
283(55)
178(38)
267(59)
373(96)
156 210
51 89
170 264
100(17)
108(22)
148(38)
16 year
EF
EE
KF
KE
276(68)
182(64)
382(80)
396(90)
-56 30
-51 15
-185 -79
-84 -74
267(75)
116(41)
195(70)
292(110
95%CI Δ, 95% CI of the difference in means, EF, Elbow flexion, EE, Elbow extension, KF, Knee flexion, KE, Knee extension, LCL, lower confidence limit, UCL, upper confidence limit. Mean values are expressed in N. Significant differences are printed bold and italic.
Table 4b, Mean (SD) muscle strength values and the 95% CI of the difference in means for current study and those that of a previous Dutch study (10) and the Chilean study from (6) for girls
Muscle action
Previous DutchMean (SD)
Current-Previous95%CI ΔLCL UCL
Current Mean (SD)
Current-Chilean95%CI ΔLCL UCL
Chilean Mean (SD)
8 year
EF
EE
KF
KE
115(16)
82(10)
160(23)
166(30
-19 27
-1 39
-61 1
-47 43
120(36)
101(31)
130(47)
164(69)
51 95
35 73
69 144
47(27)
47(21)
64(27)

Reference values for isometric muscle strength in children 8 to 17 years of age for the Netherlands
61
3
Muscle action
Previous DutchMean (SD)
Current-Previous95%CI ΔLCL UCL
Current Mean (SD)
Current- Chilean95%CI ΔLCL UCL
Chilean Mean (SD)
9 year
EF
EE
KF
KE
125(28)
91(24)
180(54)
173(57
-23 15
-14 16
-84 -36
-47 15
121(26)
92(19)
120(23)
157(38)
47 69
23 39
48 80
63(10)
61 (9)
93(17)
10 year
EF
EE
KF
KE
134 21)
84(20)
175(29)
159(57)
-30 4
-1 23
-77 -43
-46 18
121(25)
95(17)
114(25)
145(44)
39 63
18 36
25 67
70(11)
67 (6)
99(16)
11year
EF
EE
KF
KE
172(25)
108(25)
246(52)
265(36)
-57 1
-27 1
-154 -100
-144 -71
144(41)
95(17)
119(31)
157(51)
48 86
18 36
25 75
77(17)
68(15)
107(26)
12 year
EF
EE
KF
KE
168(28)
117(24)
221(54)
250(71)
-34 24
-30 8
-99 -35
-74 24
163(47)
106(30)
154(48)
225(76)
59 103
12 40
79 150
82(7)
80(10)
111(11)
13 year
EF
EE
KF
KE
201(23)
118(26)
301(38)
346(49)
-35 9
-22 10
-142 -92
-132 -37
188(36)
112(25)
184(40)
261(78)
91 123
15 40
91 163
81(7)
84(13)
134(26)
14 year
EF
EE
KF
KE
193(32
129(33)
271(76)
280(69)
-41 33
-46 12
-120 -32
-68 70
189(49)
113(37)
195(56)
285(96)
86 124
16 44
83 155
84(13)
83(12)
166(23)

Chapter 3
62
Muscle action
Previous DutchMean (SD)
Current-Previous95%CI ΔLCL UCL
Current Mean (SD)
Current- Chilean95%CI ΔLCL UCL
Chilean Mean (SD)
15 year
EF
EE
KF
KE
198(48)
141(37)
282(61)
325(79
-16 24
-40 -6
-103 -31
-56 41
202(29)
118(26)
215(45)
317(74)
87 117
21 47
135 205
100(32)
84(19)
147(30)
16 year
EF
EE
KF
KE
215(30)
107(36)
336(57)
373(57)
-60 13
-17 35
-185 -97
-149 -13
164(51)
250(85)
391(128)
193(62)
95%CI Δ, 95% CI of the difference in means, EF, Elbow flexion, EE, Elbow extension, KF, Knee flexion, KE, Knee extension, LCL, lower confidence limit, UCL, upper confidence limit. Mean values are expressed in N. Significant differences are printed bold and italic.
DiscussionSignificant and considerable differences were found in the muscle strength
between our data and those from a previous Dutch (12) and Chilean study (8).
Compared to the previous Dutch study, children were less strong in 29 out 72
comparisons up to 187 N in knee flexion in boys 16 years of age. Compared to the
Chilean study, Dutch children, both boys and girls, were overall stronger.
Differences are probably related to the physical dimensions of the children since
there are substantial variances in mean weight and height between the groups
which are both important determinants for muscle strength (9,10,14,15,16). However,
other factors may also play a role such as cultural, ethnic, or geographical
differences. For example, in the Netherlands, 28% of Dutch children aged 12 to
17 met the recommended level of physical activity for youth in 2014 (20). In Great
Britain, 18% of the children between 5 to 15 years of age met the recommended
level for physical activity in 2013 (19). This difference in physical activity might
partially explain differences in strength but data about physical activity level in
Chilean children are unknown.

Reference values for isometric muscle strength in children 8 to 17 years of age for the Netherlands
63
3
Our findings show that reference values from one country cannot simply be
generalized to another country as they appear to be region specific. Additionally,
differences in inclusion and exclusion criteria may explain differences between
studies. Obese children were excluded in the Chilean study (8) while, in our study,
obesity was not an exclusion criterion in order to achieve a representative sample
of Dutch children.
The muscle strength, especially in the lower extremity, of the current study was
significantly less compared to the previous Dutch study (2001) (12). Prior to the
study, we expected to find greater muscle strength as the children participants
were, on average, heavier (current study mean (SD) weight 48.0 (8.8) kg; previous
Dutch study, 46.4 (6.2) kg). It can be assumed that supporting a heavier bodyweight
results in physiologic adaptations in the lower limb muscles with increased
muscle strength. The commonly seen increase in passive lifestyles (21,22,23,24,25) with
concomitant decreased physical activity might explain muscle strength in the
current population. These findings illustrate that reference values can only be
used for a limited time as they appear to be time-specific.
Hand-held dynamometry is a relatively inexpensive and a reliable instrument for
measuring muscle strength, however, it has some practical disadvantages. It is
sometimes impossible to break through a subject’s generated strength. This is
a commonly described phenomenon that might induce substantial error when
frequently observed. However, in our study, it occurred for only five of the 1252
participants (0.4%) and is probably of minor influence in clinical settings when
testing children with decreased muscle strength.
Study limitationsWe tested a convenience sample of children from schools that may not be
completely representative for all Dutch children. However, by including children
from urban and rural areas as well as from different socioeconomic backgrounds,
we assume that our sample is sufficiently representative. Since the majority of the
children in this study were Caucasian while a relatively small number of immigrant
children was included, the reference values obtained seem less representative for
the latter group.

Chapter 3
64
ConclusionReference values for muscle strength are made available for the present Dutch
population of children between 8 and 17 years of age. Reference values for muscle
strength are time and geographically specific. For adequate comparison, it is
necessary to regularly update reference values within a specific geographical area
due to changes in lifestyle and bodyweight.

Reference values for isometric muscle strength in children 8 to 17 years of age for the Netherlands
65
3
References1. Kumar, A. B. J., & Manjunatha, A. M. (2018). Elementary Physical Education Activity:
Building Relationship to Health and Solid Movements Approaches In Schools Children’S. International Journal of Physical Education & Sports Sciences, 13(1), 17–23. https://doi.org/10.29070/13/56092
2. Boreham, C., & Riddoch, C. (2001). The physical activity, fitness and health of children. Journal of Sports Sciences, 19(12), 915–929. https://doi.org/10.1080/026404101317108426
3. Givon, U. (2009). Muscle weakness in cerebral palsy. Acta Orthopaedica et Traumatologica Turcica, 43(2), 87–93. https://doi.org/10.3944/aott.2009.087
4. Troosters, T., Langer, D., Vrijsen, B., Segers, J., Wouters, K., Janssens, M., & Dupont, L. (2009). Skeletal muscle weakness, exercise tolerance and physical activity in adults with cystic fibrosis. European Respiratory Journal, 33(1), 99–106. https://doi.org/10.1183/09031936.00091607
5. Osadnik, C. R., Rodrigues, F. M. M., Camillo, C. A., Loeckx, M., Janssens, W., Dooms, C., & Troosters, T. (2015). Principles of Rehabilitation and Reactivation. Respiration, 89(1), 2–11. https://doi.org/10.1159/000370246
6. Nadollek, H., Brauer, S., & Isles, R. (2002). Outcomes after trans-tibial amputation: the relationship between quiet stance ability, strength of hip abductor muscles and gait. Physiotherapy Research International, 7(4), 203–214. https://doi.org/10.1002/pri.260
7. Daabis, R., Hassan, M., & Zidan, M. (2017). Endurance and strength training in pulmonary rehabilitation for COPD patients. Egyptian Journal of Chest Diseases and Tuberculosis, 66(2), 231–236. https://doi.org/10.1016/j.ejcdt.2016.07.003
8. Escobar, R. G., Munoz, K. T., Dominguez, A., Banados, P., & Bravo, M. J. (2016). Maximal isometric muscle strength values obtained By handheld dynamometry in children between 6 and 15 years of age. Muscle & Nerve, 55(1), 16–22. https://doi.org/10.1002/mus.25180
9. Douma, R. K. W., Soer, R., Krijnen, W. P., Reneman, M., & van der Schans, C. P. (2014). Reference values for isometric muscle force among workers for the Netherlands: a comparison of reference values. BMC Sports Science, Medicine and Rehabilitation, 6(1), 10. https://doi.org/10.1186/2052-1847-6-10
10. Bohannon, R. W. (1997). Reference values for extremity muscle strength obtained by hand-held dynamometry from adults aged 20 to 79 years. Archives of Physical Medicine and Rehabilitation, 78(1), 26–32. https://doi.org/10.1016/s0003-9993(97)90005-8
11. Andrews, A. W., Thomas, M. W., & Bohannon, R. W. (1996). Normative Values for Isometric Muscle Force Measurements Obtained With Hand-held Dynamometers. Physical Therapy, 76(3), 248–259. https://doi.org/10.1093/ptj/76.3.248
12. Beenakker, E. A. C., van der Hoeven, J. H., Fock, J. M., & Maurits, N. M. (2001). Reference values of maximum isometric muscle force obtained in 270 children aged 4–16 years by hand-held dynamometry. Neuromuscular Disorders, 11(5), 441–446. https://doi.org/10.1016/s0960-8966(01)00193-6
13. Macfarlane, T. S., Larson, C. A., & Stiller, C. (2008). Lower Extremity Muscle Strength in 6- to 8-Year-Old Children Using Hand-Held Dynamometry. Pediatric Physical Therapy, 20(2), 128–136. https://doi.org/10.1097/pep.0b013e318172432

Chapter 3
66
14. Eek, M. N., Kroksmark, A.-K., & Beckung, E. (2006). Isometric Muscle Torque in Children 5 to 15 Years of Age: Normative Data. Archives of Physical Medicine and Rehabilitation, 87(8), 1091–1099. https://doi.org/10.1016/j.apmr.2006.05.012
15. Bäckman E, Odenrick P, Henriksson KG, & Ledin T. (1989). Isometric muscle force and anthropometric values in normal children aged between 3.5 and 15 years. Scandinavian Journal of Rehabilitation Medicine, 21(2), 105-114
16. Elloumi, M., Makni, E., Ounis, O. B., Moalla, W., Zbidi, A., Zaoueli, M., & Tabka, Z. (2011). Six-minute walking test and the assessment of cardiorespiratory responses during weight-loss programmes in obese children. Physiotherapy Research International, 16(1), 32–42. https://doi.org/10.1002/pri.470
17. Wikipedia contributors. (2021, 10 april). Average human height by country. Wikipedia. https://en.wikipedia.org/wiki/Average_human_height_by_country
18. Grasgruber, P., Sebera, M., Hrazdíra, E., Cacek, J., & Kalina, T. (2016). Major correlates of male height: A study of 105 countries. Economics & Human Biology, 21, 172-195. https://doi.org/10.1016/j.ehb.2016.01.005
19. Prevalence of adults reaching the recommended physical activity, 2012, 2013 and 2014. (2016). United Kingdom of Great Britain and Northern Ireland physical activity factsheet. WHO, The Regional Office for Europe
20. Meeting the NNGB. Fitnorm and combined standards in 2014. (2014). National Institute for Public Health and the Environment. (in Dutch). https://www.euro.who.int/data/assets/pdf_file/0011/288119/NETHERLANDS-Physical-Activity-Factsheet.pdf?ua=1
21. Townsend N, Wickramasinghe K, Williams J, Bhatnagar, P., & Rayner, M. (2015). Physical Activity Statistics 2015. British Heart Foundation: London
22. Herman, K. M., Sabiston, C. M., Mathieu, M.-E., Tremblay, A., & Paradis, G. (2014). Sedentary behavior in a cohort of 8- to 10-year-old children at elevated risk of obesity. Preventive Medicine, 60, 115–120. https://doi.org/10.1016/j.ypmed.2013.12.029
23. Mitchell, J. A., Mattocks, C., Ness, A. R., Leary, S. D., Pate, R. R., Dowda, M., Blair, S. N., & Riddoch, C. (2009). Sedentary Behavior and Obesity in a Large Cohort of Children. Obesity, 17(8), 1596–1602. https://doi.org/10.1038/oby.2009.42
24. Livingstone, M. B. E. (2001). Childhood obesity in Europe: a growing concern. Public Health Nutrition, 4(1), 109–116. https://doi.org/10.1079/phn2000106
25. Schönbeck, Y., Talma, H., van Dommelen, P., Bakker, B., Buitendijk, S. E., HiraSing, R. A., & van Buuren, S. (2011). Increase in Prevalence of Overweight in Dutch Children and Adolescents: A Comparison of Nationwide Growth Studies in 1980, 1997 and 2009. PLoS ONE, 6(11), e27608. https://doi.org/10.1371/journal.pone.0027608
26. Thomas S, Reading J,& Shephard RJ.(1992). Revision of the Physical Activity Readiness Questionnaire (PAR-Q). Canadian Journal of Sport Science, 17(4), 338-345
27. Edwards, R. H. T., & Mcdonnell, M. (1974). Hand-held dynamometer for evaluating voluntary-muscle function. The Lancet, 2(7883), 757–758. https://doi.org/10.1016/s0140-6736(74)90947-7
28. Burns, S. P., & Spanier, D. E. (2005). Break-Technique Handheld Dynamometry: Relation Between Angular Velocity and Strength Measurements. Archives of Physical Medicine and Rehabilitation, 86(7), 1420–1426. https://doi.org/10.1016/j.apmr.2004.12.041

Reference values for isometric muscle strength in children 8 to 17 years of age for the Netherlands
67
3
29. Bohannon, R. W. (1988). Make Tests and Break Tests of Elbow Flexor Muscle Strength. Physical Therapy, 68(2), 193–194. https://doi.org/10.1093/ptj/68.2.193
30. Martin Bland, J., & Altman, D. G. (1986). statistical methods for assessing agreement between two methods of clinical measurement. The Lancet, 327(8476), 307–310. https://doi.org/10.1016/s0140-6736(86)90837-8
31. McGraw, K. O., & Wong, S. P. (1996). Forming inferences about some intraclass correlation coefficients. Psychological Methods, 1(1), 30–46. https://doi.org/10.1037/1082-989x.1.1.30
32. Shrout, P. E., & Fleiss, J. L. (1979). Intraclass correlations: Uses in assessing rater reliability. Psychological Bulletin, 86(2), 420–428. https://doi.org/10.1037/0033-2909.86.2.420
33. Fleiss, J. L. (1999). Reliability of measurements. Design and Analysis of Clinical Experiments. New York, Wiley
34. Confidence Interval Analysis (CIA). (1989). Microcomputer Program Manual and Disk Paperback. BMJ Books, London. ISBN: 0727902814


Chapter 4
Reliability of the Q Force; a mobile instrument for measuring isometric
Quadriceps muscle strength
Douma, K. W., Regterschot, G. R., Krijnen W. P., Slager G. E., van der Schans, C. P.,& Zijlstra, W. (2016). Reliability of the Q Force; a mobile instrument for
measuring isometric Quadriceps muscle strength. BMC Sports Science, Medicine and Rehabilitation, 19(8), 4. doi: 10.1186/s13102-016-0029-x

Chapter 4
70
AbstractBackground The ability to generate muscle strength is a pre-requisite for all human
movement. Decreased Quadriceps muscle strength is frequently observed in older
adults and is associated with a decreased performance and activity limitations.
To quantify the Quadriceps muscle strength and to monitor changes over time,
instruments and procedures with a sufficient adequate reliability are needed. The
Q Force is an innovative mobile instrument for measurement of isometric muscle
strength in various degrees of extension. Measurements between 110 and 130
degrees extension present the highest values and the strongest increase after
training.
The objective of this study is to determine the test-retest reliability of isometric
Quadriceps muscle strength measurements, in 110 degrees knee extension using
the Q Force in older adults.
Methods Forty-one healthy adults (mean (SD) age 81.9 (4.9) years, 13 males and 28,
females were included in the study. Isometric strength of the Quadriceps muscle
was assessed using the Q Force at 110 degrees knee extension. Participants were
measured on two occasions with a three to eight day interval between occasions.
Intraclass correlation coefficients (ICCs) and limits of agreement (LOA) were
calculated and t-tests were performed.
Results All ICCs were higher than 0.75. LOA for the peak torque, for the left side
were -18.6 N to 33.8 N and for the right side -9.2 N to 26.4 N. Small systematic and
significant differences in means were found between measurement occasions.
Conclusion The present study shows that the Q Force has excellent test-retest
reliability, but LOA are substantial. Since the Q Force is relatively cheap and mobile
it is suitable for application in various clinical settings, however, its capability
to detect changes in muscle force over time is limited but similar to existing
instruments.

Reliability of the Q Force; a mobile instrument for measuring isometric Quadriceps muscle strength
71
4
BackgroundMuscle strength is essential for all physical activities such as activities of daily
living, work, sports and maintaining posture (1,2,3,4). Reduced muscle strength is
frequently apparent in older people and creates a potential risk for a decline of
activities (1,2,3,4,5,6,7,8). Reduced muscle strength may induce balance deficits, increase
the risk of falling (3,4,5,6,7,8,9,10), and it predisposes for disability, premature nursing
home admission, and ultimately premature mortality (5,11). Functional walking tests
and rising form a chair, such as the timed up and go test, are used to predict the
occurrence of future falls. Retrospective studies have shown that these tests are
associated with a history of falls but the predictive capacity is limited (8,11,12).
The Quadriceps muscle is important due to its major contribution walking stairs,
rising from a chair, and walking (3,4,7). To quantify Quadriceps muscle strength and
to monitor changes over a period of time, muscle strength measurement with
sufficient reliability is required. Several methods to measure muscle strength are
available. The Medical Research Counsel Scale (MRC) is the most commonly and
clinically used scale. The MRC scale ranges from, 0 to 5. Unfortunately, this scale
is inaccurate and inefficient in detecting changes over a period of time (14,15,16,17,18).
MRC grade 4 covers a wide range from 5 up to 99 % of the generated strength (19).
More precise measurements are possible with hand-held dynamometry allowing
muscle strength to be measured on a continuous scale. Hand-held dynamometry
has been demonstrated to have good test retest reliability with intra class
correlation coefficients of 0.8 or higher (19, 20, 21,22). Measurements with a hand-held
dynamometer, are required to be performed in a joint position of 90 degrees
flexion (23,24,25). Joint positions other than 90 degrees flexion however, produced
greater maximal muscle strength values (26,27,28), as well as a greater sensitivity for
detecting changes over time (27). For the knee the highest values were recorded
using measurements at 110 and 130 degrees extension (28). Besides the joint
position, another limitation of hand-held dynamometry is the effect of the weight
and strength of the observer on outcomes. Stronger testers may obtain routinely
higher values (29,30,31). Fixation of healthy participants during measurement can be
more be difficult (22,23,32). Thus observer capacity may negatively influence reliability
and validity of muscle strength measurements using a hand-held dynamometer (22,23,32). An additional limitation in non-computerized type of muscle strength
measurements is that they do not provide insight in coordination, slope, and

Chapter 4
72
duration of the contraction. Whereas, sustainable and repetitive contractions are
required in sports, and activities of daily living.
Another type of measurement is isokinetic muscle strength measurement.
Isokinetic equipment is capable of measuring muscle strength in different body
positions and angles, presenting an abundance of graphical, numerical, and
derivative information which are considered to be the gold standard (33,34).
The Q Force chair has been recently developed as a successor of the Quadriso Tester (35) to measure isometric muscle strength of the Quadriceps muscle in different
joint angles. Advantages of the Q Force compared to other instrumentation is that
it is transportable and can be employed easily in a clinical setting. It provides,
similar to isokinetic instrumentation, relevant graphical and calculated numerical
information about the contraction besides measured peak values. Currently test-
retest reliability of the Q Force in older adults is unclear. Therefore the objective of
this study was to determine the test-retest reliability of isometric muscle strength
measurements with the Q Force in older adults.
MethodsThe Medical Ethics Committee of the University Hospital Groningen approved this
study (M11.110634).
ParticipantsInclusion criteria were, at least 70 years of age, being able to walk ≥10 meters
without support, rise from a chair without resources or assistance, absence of
cardiovascular/respiratory or neurological disorders, absence of comorbidity
or cognitive disorders that influence mobility, understanding, or execution of
measurements, no current or recent participation in exercise programs or any
other physical intervention, and no orthopedic surgery or stroke within the last six
months. Participants were included after providing and signing informed consent.
DesignReliability study.

Reliability of the Q Force; a mobile instrument for measuring isometric Quadriceps muscle strength
73
4
MeasurementsMuscle strength was assessed on two occasions within three to eight days. Four
trials were performed on each occasion at approximately the same time of the
day. If the participant was unable to perform four trials for any reason, fewer trials
were performed and used for analysis.
DeviceThe Q Force has been constructed for measuring isometric Quadriceps muscle
strength. It consists of a chair with an attached, adjustable fi xed leg brace at the
front. Three sensors are located in the brace to determine the generated force
(Newton), the angle between the horizontal chair surface and the brace and
the distance between the force transducer and the rotation axle of the brace
(millimeter). All three signals pass through an analog-digital converter, are read
and saved on a laptop.
Figure 1, Schematic view, Q Force
A = Back support, B = Seat, C = Fixed brace, D= Base, E= Astrolabe/Goniometer,
F = Force transducer, G= Distance transducer

Chapter 4
74
Figure 2, Side view of Q Force with fixed brace at the front
The chair incorporates a solid frame, base, back support, and a seat. Bars are
fitted at both sides of the seat for manual fixation. The height of the sitting
surface is fully adjustable. At the left and right bottom of the seat, in an anterior
posterior direction, rails are attached to which the brace is connected so that both
the left and right leg can be tested. The fixed brace consists of a fixed horizontal
and an adjustable distal component with a hinge in between. The brace can be
slide horizontally via rails. The brace is adjustable to fit the subject’s upper leg
dimensions enabling placing the rotation axis of the brace in the same position
as the rotation axis of the knee for that specific angle. (Fig 2) The measuring angle
of the fixed brace is adjustable between 90° flexion and 180° extension (= full
extension). The force transducer is covered with a pad to minimize pressure on the
subject’s lower leg. The position of the pad is adjustable in vertical and horizontal
directions in accordance with the subject’s dimensions.
Computer and Control
Hardware
The hardware consists of an analog-digital converter (ADC), a force, and a distance
and angle transducer. The ADC is a NI-9219 4Ch Universal Analog input module. As
an interface, the NI USB-9162 converter (National Instruments Corporation, Austin,
USA) is utilized for establishing a USB connection between the ADC and the laptop.
The force transducer is a LLB400 Loadcell which is capable of measuring force up
to 1100 Newton with a break load of 1650 Newton (Futek, Irvine). The distance

Reliability of the Q Force; a mobile instrument for measuring isometric Quadriceps muscle strength
75
4
transducer is a CLS1321 Linear potentiometer (Active Sensors Indianapolis). The
angle is measured by a single strike potentiometer.
Software
The accompanying software is developed by the ICT Software Development
Laboratory of the Faculty of Medical Sciences from the University of Groningen
and the University Medical Center Groningen in the Netherlands.
Outcome measuresDuring maximal isometric contraction, Peak Torque (PT) was measured and
Filtered Peak Torque (FPT), Median Peak Torque (MPT) and Average Plateau Peak
Torque (APT) were calculated.
PT is the actually measured peak value and is calculated as Fmax * r + fixation
torque, where Fmax is the registered maximal force, r is the distance between the
knee joint rotation point and the sensor on the lower leg and fixation torque is the
torque required keeping the lower leg stabilized against gravity. Arrow 2 in Figure
3 illustrates the PT value.
FTP is the APT of the sample that recorded the PT value (1) with the sample before
(-1) and the sample after (+1) this sample and is calculated as
FPT .
Arrow 1 and 3 in Figure 3 indicate FPT.
MPT is the median of the total torque above the level of 0.5 * PT. This is calculated
as: median total torque = median (total torque (a:b)) where a is the moment where
total torque is greater than 0.5 * PT for the first time, and b is the moment where
total torque is smaller than 0.5 * PT for the first time. Line a-b in Figure 3 represents
50 percent of the PT level. Line c-d represents the MPT. APT is the value above 50
percent of the PT level. It is the APT over the plateau phase. It is calculated as the
average (total torque (c:d)), where c is the initial sample following sample a when
the absolute difference with sample c -1 is less than 4 Nm. Sample d is the sample
following sample a where the absolute difference with sample d -1 is smaller
than 4 Newton meter (Nm). Point e in Figure 3 represents the first sample where
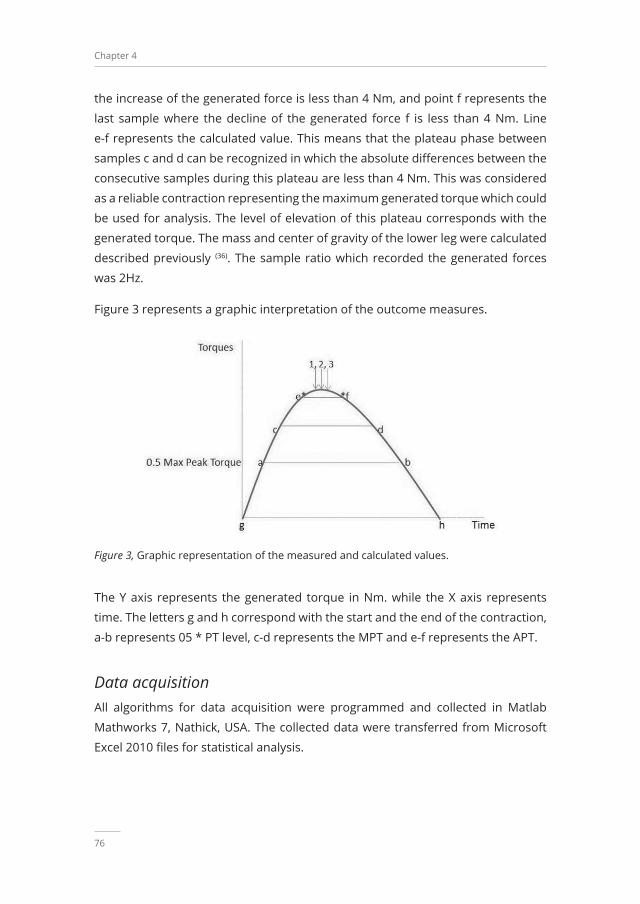
Chapter 4
76
the increase of the generated force is less than 4 Nm, and point f represents the
last sample where the decline of the generated force f is less than 4 Nm. Line
e-f represents the calculated value. This means that the plateau phase between
samples c and d can be recognized in which the absolute differences between the
consecutive samples during this plateau are less than 4 Nm. This was considered
as a reliable contraction representing the maximum generated torque which could
be used for analysis. The level of elevation of this plateau corresponds with the
generated torque. The mass and center of gravity of the lower leg were calculated
described previously (36). The sample ratio which recorded the generated forces
was 2Hz.
Figure 3 represents a graphic interpretation of the outcome measures.
Figure 3, Graphic representation of the measured and calculated values.
The Y axis represents the generated torque in Nm. while the X axis represents
time. The letters g and h correspond with the start and the end of the contraction,
a-b represents 05 * PT level, c-d represents the MPT and e-f represents the APT.
Data acquisitionAll algorithms for data acquisition were programmed and collected in Matlab
Mathworks 7, Nathick, USA. The collected data were transferred from Microsoft
Excel 2010 files for statistical analysis.

Reliability of the Q Force; a mobile instrument for measuring isometric Quadriceps muscle strength
77
4
Measurement procedureThe angle of the fixed leg brace was positioned at 110° extension and the subject
was subsequently positioned in the chair without back support and with the back
of their knee positioned against the seat. The lateral condyle of the femur was
aligned with the rotation point of the Q Force. The force transducer was positioned
3 centimeters above lateral malleolus. The tuberosity of the tibiae was aligned
with the sensor to prevent adduction, abduction, or rotation in the knee or hip
in the starting position. The computer program was initiated as the subject was
instructed to elevate the lower leg to minimize pressure on the force transducer
in order to calibrate the system. The distance between the transducer and the
rotation point was determined to calculate the generated torque and the average
knee angle. Additionally, the average distance from the rotation axle to the force
transducer was measured to determine whether the current angle was actually
110 degrees extension. Following the calibration, the actual measurements
began. The left leg was tested first. Participants were allowed to fixate themselves
to the sidebars using their hands. A 1 minute break was administered between the
successive trials. Following each trial, it was evaluated if the contraction had been
maximal by asking, “Was this a maximal effort?” If the contraction had not been
maximal, it was excluded.
Instruction of the participantThe participants were instructed as follows: “Extend your knee as forceful as
possible. I will measure the strength you will generate. You are allowed to fixate
yourself to the side bars using your hands. Each leg will be tested four times each
with a one minute break in between. I will encourage you and tell you when to
start and when to stop. The maximal contraction has to endure for three seconds.
Build up your contraction gradually and let go slowly.”
Statistical AnalysesAll data were analyzed with the statistical programming language string R version
3.1.2 2014. To determine reliability an intraclass correlation coefficient (ICC)
(two-way, absolute agreement) was calculated. Limits of agreement (LOA) were
calculated as ± 1.96 * SD of the mean difference (37). The LOA were calculated
for each pair of measurements and were interpreted with regard to the clinical
relevance to their size.

Chapter 4
78
Bland and Altman plots were constructed with the difference and the mean of two
measurements for each subject. Means, standard deviation, mean difference, and
standard deviations were calculated for descriptive purposes. The paired t-test
was used to analyze systematic differences between occasion 1 occasion 2. ICCs
were interpreted as follows: ICC<0.25 low; 0.25<ICC<0.50 moderate; 0.50<ICC<0.75
moderate to good; and ICC>0.75 is excellent reliability (38,39,40). A level of 0.05 was
considered significant.
ResultsParticipantsForty-one healthy adults (mean (SD) age 81.9 (4.9) years, mean (SD) body weight
78.5 (13.0) kg and mean (SD) body height 165.3 (5.8) cm) 13 males and 28 females
were included.
Outcome measuresTable 1, Mean (SD) of the measured and derivative values, intraclass correlation coefficients, the t-test outcomes and the LOA’s for the left and right leg
Value Occasion 1Mean (SD)
Occasion 2Mean (SD)
Diff.Mean (SD)
p Valuet-test
ICC LowerLOA
UpperLOA
LOA%Mean
PT 63.1 (27.2) 70.7 (29.2) 7.6 (13.4) 0.0078 0.89 -18.6 33.8 39.1
PT 66.1 (30.4) 74.8 (34.2) 8.6 (9.1) 0.0001 0.92 -9.2 26.4 25.1
FPT 62.5 (27.0) 70.2 (29.1) 7.7 (13.5) 0.0077 0.88 -18.8 34.2 39.9
FPT 65.6 (30.3) 74.0 (34.1) 8.4 (9.1) 0.0001 0.96 -9.4 26.2 25.5
MPT 58.5 (26.0) 66.4 (28.5) 7.9 (12.5) 0.0037 0.89 -16.6 32.4 39.2
MPT 62.0 (29.1) 69.9 (32.9) 7.9 (9.0) 0.0001 0.96 -9.7 25.5 26.7
APT 58.3 (26.2) 65.9 (28.8) 7.6 (12.9) 0.0058 0.80 17.6 32.8 38.7
APT 61.8 (29.6) 70.2 (33.5) 8.4 (9.1) 0.0001 0.96 -9.4 26.2 26.9
PTL; Peak Torque, FTP; Filtered Peak Torque, MPT; Median Peak Torque, APT; Average Plateau Peak Torque, expressed in Newton, Diff; Difference ICC; Intraclass Correlation Coefficient, LOA; Limit of Agreement, LOA is expressed as percentage of mean of occasion1 and occasion 2.
Torque values were significantly higher of the second occasion compared to the
first occasion (mean difference ranged from 7.6 to 8.6) (Table 1). ICCs were higher
for the right side than for the left but all ICCs were greater than 0.75. The LOA were
smaller for the right leg compared to the left and were relatively large, 17.6 to 26.5

Reliability of the Q Force; a mobile instrument for measuring isometric Quadriceps muscle strength
79
4
Newton, representing between 25.2% to 39.9% of the mean values of occasion 1
and occasion 2 (Figures 4 to 12).
Figures 4 through 11 present Bland and Altman plots of the limits of agreement
between occasion 1 and occasion 2 of the mean difference of the PT; the mean
MPT; the mean MPT; and the mean FPT of the left and right leg, respectively.
Figure 4, Limits of Agreement for meanPeak Torque measurements-left
Figure 5, Limits of Agreement for mean Median Peak Torque measurements-left
Figure 6, Limits of Agreement for meanPlateau Torque measurements left
Figure 7, Limits of Agreement for mean Filtered Peak Torque measurements left

Chapter 4
80
Figure 8, Limits of Agreement for mean Peak Torque measurements-right
Figure 9, Limits of Agreement for mean Median Peak Torque measurements-right
Figure 10, Limits of Agreement for mean Plateau Peak Torque measurements right
Figure 11, Limits of agreement for Filtered Peak Torque measurements right
The uninterrupted horizontal line was located above zero in all cases due to the
systematic difference between occasion 1 and occasion. The variation of all of the
measurements did not increase with increasing Q Force torque, and only minimal
outlying points were observed. The right leg measurements resulted in smaller
LOA than those for the left.
Reliability of the Q Force; a mobile instrument for measuring isometric Quadriceps muscle strength
81
4
Discussion Muscle strength measurements in elderly using the Q Force at 110 degrees
extension of the knee are reliable. ICCs exceed 0.75 which indicates excellent test-
retest reliability (38,39,40). However, the obtained LOA’s are substantial indicating
considerable variation in measurement results. The mean values at the second
measurement are significantly higher than those at the first measurement. ICCs
and LOA are consistently better for the right leg compared to the left. The ICCs
indicate that the measurements using the Q Force can be used on a group level (38,39,40). The encountered ICC coefficients are between 0.80 and 0.95 and are
consistent with ICCs found for other reliability studies regarding muscle strength
measurement (20,21,22,23,32,41,42,43,44). The ICCs for the outcome measures, PT, FPT, MPT
and APT were similar, indicating that reliability can be generalized over different
types of muscle strength measures. We measured muscle strength at 110
degrees knee extension. Studies based on different degrees of extension found
ICC coefficients between 0.87 and 0.99 and are in accordance with our findings (20,21,22,23,32,41,42,43,44). ICC coefficients provide information regarding reliability of the
instrument. The ICCs do not provide information on the magnitude of the intra
individual variation between observations (37). These intra individual variations
are expressed in LOA . In general variation in measurement results can be
influenced by several sources of variation such as the time of the day, type of
measurement, subject, observer, and protocol. The LOA we found are substantial
and vary between 15.7 and 23.6 Nm which corresponds to 22.5% and 36.0% of the
overall mean of the measurements in occasion 1 and 2. These outcomes indicate
that a true change, improvement or deterioration, can only be detected if it is at
least 22.5% in magnitude. Other studies with different type of instrumentation
and different populations found similar results (20,45). LOA for the right side were
smaller than on the left. This difference may be explained by right-side dominance
of the majority of a population is (46), indicating an increased neural drive to the
dominant right leg resulting in more consistent values.
Systematic differences were found between the first and second occasion.
Means in the second occasion were approximately 10% higher than in the first
occasion. Other studies using isokinetic devices or in pre trials prior to the actual
measurement also found systematic differences or a tendency to higher values
for the second measurement occasion(44,47,48,49,50,51). Several studies suggest that

Chapter 4
82
fear, a learning effect or increased muscle recruitment may be responsible for
these larger values (20,28,44,48,49,50,51).
Strength and weaknessesIn our study we tested a population of healthy older adults. It does not provide
information about reliability of measurements in for example chronically ill people
or healthy working adults. We did not register if people were left or right side
dominant, limiting the insight in the origin of the observed difference in ICC, LOA
between left and right side. We did not perform pre trials on occasion 1 which
might have contributed to the observed differences between the occasions.
Though strength measurements reflect the Quadriceps muscle force no valid
procedures are available translating muscle strength into function. Therefore
interpretation of strength measurement should be performed with caution.
ConclusionForce measurements in 110 degrees extension have excellent reliability, but
substantial LOA. The LOA indicate a limited capability to detect changes in muscle
strength over time. Since the Q Force is relatively cheap and mobile it seems
suitable for application in various clinical settings. Future studies should investigate
the degree in which its discriminative ability can be improved especially in older
adults.

Reliability of the Q Force; a mobile instrument for measuring isometric Quadriceps muscle strength
83
4
References1. Muehlbauer, T., Besemer, C., Wehrle, A., & Gollhofer, & A., Granacher, U. (2012).
Relationship between Strength, Power and Balance Performance in Seniors. Gerontology, 58(6), 504–512. https://doi.org/10.1159/000341614
2. Daubney, M. E., & Culham, E. G. (1999). Lower-Extremity Muscle Force and Balance Performance in Adults Aged 65 Years and Older. Physical Therapy, 79(12), 1177–1185. https://doi.org/10.1093/ptj/79.12.1177
3. Brooks, S. V., & Faulkner, J. A. (1994) Skeletal muscle weakness in old age; underlying mechanisms. Medicine & Science in Sports & Exercise, 26, (4), 432-439
4. Guralnik, J. M., Simonsick, E. M., Ferrucci, L., Glynn, R. J., Berkman, L. F., Blazer, D. G., . . .Wallace, R. B. (1994). A Short Physical Performance Battery Assessing Lower Extremity Function: Association With Self-Reported Disability and Prediction of Mortality and Nursing Home Admission. Journal of Gerontology, 49(2), 85–94. https://doi.org/10.1093/geronj/49.2.m85
5. Howe, T. E., Rochester, L., Neil, F., Skelton, D. A., & Ballinger, C. (2011). Exercise for improving balance in older people. Cochrane Database of Systematic Reviews, 9(11). https://doi.org/10.1002/14651858.cd004963.pub3
6. Ciciliot, S., Rossi, A. C., Dyar, K. A., Blaauw, B., & Schiaffino, S. (2013). Muscle type and fiber type specificity in muscle wasting. The International Journal of Biochemistry & Cell Biology, 45(10), 2191–2199. https://doi.org/10.1016/j.biocel.2013.05.016
7. Horlings, C. G. C., van Engelen, B. G. M., Allum, J. H. J., & Bloem, B. R. (2008). A weak balance: the contribution of muscle weakness to postural instability and falls. Nature Clinical Practice Neurology, 4(9), 504–515. https://doi.org/10.1038/ncpneuro0886
8. Zasadzka, E., Borowicz, A. M., Pawlaczyk, M., & Roszak, M. (2015). Assessment of the risk of falling with the use of timed up and go test in the elderly with lower extremity osteoarthritis. Clinical Interventions in Aging, 7(10)1289-98. https://doi.org/10.2147/cia.s86001
9. Cheng, Y. Y., Wei, S. H., Chen, P. Y., Tsai, M. W., Cheng, I. C., Liu, D. H., & Kao, C. L. (2014). Can sit-to-stand lower limb muscle power predict fall status? Gait & Posture, 40(3), 403–407. https://doi.org/10.1016/j.gaitpost.2014.05.064
10. Pijnappels, M., & Van der Burg, J. C. E., (2008). Identification of elderly fallers by muscle strength measures. European Journal of Applied Physiology, 102(5), 585-92. https://doi 10.1007/s00421-007-0613-6
11. Evans, D., Pester, J., Vera, L., Jeanmonod, D., & Jeanmonod, R. (2015). Elderly fall patients triaged to the trauma bay: age, injury patterns, and mortality risk. American Journal of Emergency Medicine, 11(33), 1635–1638
12. Beauchet, O., Fantino, B., Allali, G., Muir, S. W., Montero-Odasso, M., & Annweiler, C. (2011). Timed up and go test and risk of falls in older adults: A systematic review. The journal of nutrition, health & aging, 15(10), 933–938. https://doi.org/10.1007/s12603-011-0062-0
13. de Souza Moreira, B., Mourão Barroso, C., Cavalcanti Furtado, S. R., Sampaio, R. F., Drumond das Chagas e Vallone, M. L., & Kirkwood, R. N. (2014). Clinical Functional Tests Help Identify Elderly Women Highly Concerned About Falls. Experimental Aging Research, 41(1), 89–103. https://doi.org/10.1080/0361073x.2015.978214

Chapter 4
84
14. Rodnitzky, R. L. (1990). Quantification of neurologic deficit. Butterworth, Stoneham. https://doi.org/10.1002/mus.880130217
15. Beasley, W. C. (1956). Influence of Method on Estimates of Normal Knee Extensor Force among Normal and Postpolio Children. Physical Therapy, 36(1), 21–41. https://doi.org/10.1093/ptj/36.1.21
16. Ploeg, R. J. O., Oosterhuis, H. J. G. H., & Reuvekamp, J. (1984). Measuring muscle strength. Journal of Neurology, 231(4), 200–203. https://doi.org/10.1007/bf00313939
17. Schwartz, S., Cohen, M. E., Herbison, G. J., & Shah, A. (1992). Relationship between two measures of upper extremity strength: manual muscle test compared to hand-held myometry. Archives of Physical Medication and Rehabilitation, 73,11:1063-8
18. Mac Avoy, M. C., & Green, D. P. (2007). Critical Reappraisal of Medical Research Council Muscle Testing for Elbow Flexion. The Journal of Hand Surgery, 32(2), 149–153. https://doi.org/10.1016/j.jhsa.2006.10.020
19. Dunn, J. C., & Iversen, M. D. (2003). Interrater Reliability of Knee Muscle Forces Obtained by Hand-held Dynamometer from Elderly Subjects with Degenerative Back Pain. Journal of Geriatric Physical Therapy, 26(3), 23–29. https://doi.org/10.1519/00139143-200312000-00004
20. Wang, C. Y., Olson, S. L., & Protas, E. J. (2002). Test-retest strength reliability: Hand-held dynamometry in community-dwelling elderly fallers. Archives of Physical Medicine and Rehabilitation, 83(6), 811–815. https://doi.org/10.1053/apmr.2002.32743
21. Roy, M. A. G., & Doherty, T. J. (2004). Reliability of Hand-Held Dynamometry in Assessment of Knee Extensor Strength After Hip Fracture. American Journal of Physical Medicine and Rehabilitation, 83(11), 813–818. https://doi.org/10.1097/01.phm.0000143405.17932.78
22. Bohannon, R. W., & Andrews, A. W. (1987). Interrater Reliability of Hand-Held Dynamometry. Physical Therapy, 67(6), 931–933. https://doi.org/10.1093/ptj/67.6.931
23. Andrews, A. W., Thomas, M. W., & Bohannon, R. W. (1996). Normative Values for Isometric Muscle Force Measurements Obtained With Hand-held Dynamometers. Physical Therapy, 76(3), 248–259. https://doi.org/10.1093/ptj/76.3.248
24. Bohannon, R. W. (1993). Comparability of Force Measurements Obtained with Different Strain Gauge Hand-Held Dynamometers. Journal of Orthopaedic & Sports Physical Therapy, 18(4), 564–567. https://doi.org/10.2519/jospt.1993.18.4.564
25. Bohannon, R. W. (1993). Comparability of Force Measurements Obtained with Different Hand-Held Dynamometers from Older Adults. Isokinetics and Exercise Science, 3(3), 148–151. https://doi.org/10.3233/ies-1993-3304
26. Ullrich, B., & Brueggemann, G. (2008). Moment-Knee Angle Relation in Well Trained Athletes. International Journal of Sports Medicine, 29(08), 639–645. https://doi.org/10.1055/s-2007-989322
27. Sosnoff, J. J., Voudrie, S. J., & Ebersole, K. T. (2009). The Effect of Knee Joint Angle on Torque Control. Journal of Motor Behavior, 42(1), 5–10. https://doi.org/10.1080/00222890903269237
28. Narici, M. V., Hoppeler, H., Kayser, B., Landoni, L., Claassen, H., Gavardi, C., . . . Cerretelli, P. (1996). Human quadriceps cross-sectional area, torque and neural activation during 6 months strength training. Acta Physiologica Scandinavica, 157(2), 175–186. https://doi.org/10.1046/j.1365-201x.1996.483230000.x

Reliability of the Q Force; a mobile instrument for measuring isometric Quadriceps muscle strength
85
4
29. Wikholm, J. B., & Bohannon, R. W. (1991). Hand-held Dynamometer Measurements: Tester Strength Makes a Difference. Journal of Orthopaedic & Sports Physical Therapy, 13(4), 191–198. https://doi.org/10.2519/jospt.1991.13.4.191
30. Bohannon, R. W., & Wikholm, J. B. (1992). Measurements of Knee Extension Force Obtained by Two Examiners of Substantially Different Experience with a Hand-Held Dynamometer. Isokinetics and Exercise Science, 2(1), 5–8. https://doi.org/10.3233/ies-1992-2101
31. Stone, C. A., Nolan, B., Lawlor, P. G., & Kenny, R. A. (2011). Hand-held dynamometry: tester strength is paramount, even in frail populations. Journal of Rehabilitation Medicine, 43(9), 808–811. https://doi.org/10.2340/16501977-0860
32. Phillips, B. A., Lo, S. K., & Mastaglia, F. L. (2000). Muscle force measured using break testing with a hand-held myometer in normal subjects aged 20 to 69 years. Archives of Physical Medicine and Rehabilitation, 81(5), 653–661. https://doi.org/10.1053/mr.2000.4413
33. Valovich-mcLeod, T. C., Shultz, S. J., Gansneder, B. M., Perrin, D. H., & Drouin, J. M. (2004). Reliability and validity of the Biodex system 3 pro isokinetic dynamometer velocity, torque and position measurements. European Journal of Applied Physiology, 91(1), 22–29. https://doi.org/10.1007/s00421-003-0933-0
34. Stark, T., Walker, B., Phillips, J. K., Fejer, R., & Beck, R. (2011). Hand-held Dynamometry Correlation With the Gold Standard Isokinetic Dynamometry: A Systematic Review. PM&R, 3(5), 472–479. https://doi.org/10.1016/j.pmrj.2010.10.025
35. Verkerke, G. J., Lemmink, K. A. P. M., Slagers, A. J., Westhoff, M. H., van Riet, G. A. J., & Rakhorst, G. (2003). Precision, comfort and mechanical performance of the Quadriso-tester, a quadriceps force measuring device. Medical and Biological Engineering and Computing, 41(3), 283–289. https://doi.org/10.1007/bf02348432
36. Winter, D. A. (2009). Biomechanics and Motor Control of Human Movement. New York, Wiley
37. Martin Bland, J., & Altman, D. G. (1986). statistical methods for assessing agreement between two methods of clinical measurement. The Lancet, 327(8476), 307–310. https://doi.org/10.1016/s0140-6736(86)90837-8
38. McGraw, K. O., & Wong, S. P. (1996). Forming inferences about some intraclass correlation coefficients. Psychological Methods, 1(1), 30–46. https://doi.org/10.1037/1082-989x.1.1.30
39. Shrout, P. E., & Fleiss, J. L. (1979). Intraclass correlations: Uses in assessing rater reliability. Psychological Bulletin, 86(2), 420–428. https://doi.org/10.1037/0033-2909.86.2.420
40. Fleiss, J. L. (1999). Reliability of measurements. Design and Analysis of Clinical Experiments. New York, Wiley
41. Janssen, J. C., & Le-Ngoc, L. (2009). Intratester Reliability and Validity of Concentric Measurements Using a New Hand-Held Dynamometer. Archives of Physical Medicine and Rehabilitation, 90(9), 1541–1547. https://doi.org/10.1016/j.apmr.2009.02.021
42. Douma, R. K. W., Soer, R., Krijnen, W. P., Reneman, M., & van der Schans, C. P. (2014). Reference values for isometric muscle force among workers for the Netherlands: a comparison of reference values. BMC Sports Science, Medicine and Rehabilitation, 6(1), 10. https://doi.org/10.1186/2052-1847-6-10

Chapter 4
86
43. Reuter, S. E., Massy-Westropp, N., & Evans, A. M. (2011). Reliability and validity of indices of hand-grip strength and endurance. Australian Occupational Therapy Journal, 58(2), 82–87. https://doi.org/10.1111/j.1440-1630.2010.00888.x
44. Barden, H. L. H., Nott, M. T., Baguley, I. J., Heard, R., & Chapparo, C. (2012). Test-retest reliability of computerised hand dynamometry in adults with acquired brain injury. Australian Occupational Therapy Journal, 59(4), 319–327. https://doi.org/10.1111/j.1440-1630.2012.01016.x
45. Bardis, C., Kalamara, E., Loucaides, G., Michaelides, M., & Tsaklis, P. (2004). Intramachine and intermachine reproducibility of concentric performance: A study of the Con-Trex MJ and the Cybex Norm dynamometers. Isokinetics and Exercise Science, 12(2), 91–97. https://doi.org/10.3233/ies-2004-0155
46. Porac, C., Coren, S. (2012). Lateral Preferences and Human Behavior. New York Springer
47. O’Shea, S. D., Taylor, N. F., & Paratz, J. D. (2007). Measuring Muscle Strength for People With Chronic Obstructive Pulmonary Disease: Retest Reliability of Hand-Held Dynamometry. Archives of Physical Medicine and Rehabilitation, 88(1), 32–36. https://doi.org/10.1016/j.apmr.2006.10.002
48. Ritti-Dias, R. M., Basyches, M., Câmara, L., & Puech-Leao, P., Battistella, L., & Wolosker, N. (2010). Test-retest reliability of isokinetic strength and endurance tests in patients with intermittent claudication. Vascular Medicine, 15(4), 275–278. https://doi.org/10.1177/1358863x10371415
49. Scott, D. A., Bond, E. Q., Sisto, S. A., & Nadler, S. F. (2004). The intra- and interrater reliability of hip muscle strength assessments using a handheld versus a portable dynamometer anchoring station. Archives of Physical Medicine and Rehabilitation, 85(4), 598–603. https://doi.org/10.1016/j.apmr.2003.07.013
50. Almosnino, S., Stevenson, J. M., Bardana, D. D., Diaconescu, & E. D., Dvir, Z. (2012). Reproducibility of isokinetic knee eccentric and concentric strength indices in asymptomatic young adults. Physical Therapy in Sport, 13(3), 156–162. https://doi.org/10.1016/j.ptsp.2011.09.002
51. Wadsworth, C. T., Krishnan, R., Sear, M., Harrold, J., & Nielsen, D. H. (1987). Intrarater Reliability of Manual Muscle Testing and Hand-held Dynametric Muscle Testing. Physical Therapy, 67(9), 1342–1347. https://doi.org/10.1093/ptj/67.9.1342

Reliability of the Q Force; a mobile instrument for measuring isometric Quadriceps muscle strength
87
4


Chapter 5
Are repeated strength measurements required
for older adults?
K.W., Douma, Slager, G. E. C., W.P., Krijnen, & van der Schans, C. P.submitted

Chapter 5
90
AbstractBackground The strength of the Quadriceps muscle is important because it is
needed in many activities of daily living. Decreased Quadriceps muscle strength is
related to aging and may lead to an inability to perform activities of daily living. To
quantify decrease in Quadriceps muscle strength, it is important that Quadriceps
muscle strength can reliably and validly be measured. A commonly used
instrument to do so is the hand-held dynamometer. It possesses good reliability
and is relatively simple to use. In clinical practice, often three repetitions are used
to reliably measure Quadriceps muscle strength. Currently, it is unclear whether it
is necessary to conduct repeated measurements in older adults in order to obtain
reliable estimates of Quadriceps muscle strength outcomes. The objective of this
study was therefore to analyze outcomes of repeated Quadriceps muscle strength
measurements using a hand-held dynamometer in older adults.
Methods A sample of 44 individuals comprising 14 male and 30 female older adults
participated in the study. The mean (SD) age was 76.8 (7.4) years , bodyweight 79.5
(12.8) kg, and body height 167.3 (6.1) cm. Measurements were performed using
a MicroFet 2 hand-held dynamometer on four separate days (2-day intervals)
using three consecutive repetitions of the left and right Quadriceps muscle with
a 1-minute break in between at each repetition. A linear mixed-effects model
regression analysis was performed.
Results No significant effect for trials within days or between days was found. The
standard errors were similar between left and right side, ranging from 3 to 13 N.
Conclusion A single measurement is sufficient for assessing muscle strength in
groups of older adults.

Are repeated strength measurements required for older adults?
91
5
BackgroundMuscle strength is essential for all activities of daily living and is of special interest
in the chronically ill and the growing population of older adults with declining
muscle strength (1,2,3,4,5,6). The Quadriceps muscle is of special interest because it
is needed in many activities of daily living (6) . Decreased skeletal muscle strength
is related to aging and, at older ages, may lead to, for instance, an inability to
perform tasks of daily living and loss of individual independency (7,8,9). Quadriceps
muscle strength declines by 1.3 to 5.0 % per year after 70 years of age (10,11,12).
Decreased Quadriceps muscle strength in older adults leads to an increased risk
for falls (2,3,4,7) and, in combination with an increased susceptibility for fractures,
falls may lead to nursing home admittance or even premature death (8,12,13,14,15,16,17).
Muscle strength measurements enable quantifying the decline of muscle strength
with age or to evaluate the effectiveness of an exercise program for which several
instruments are available. A commonly used instrument to determine isometric
muscle strength is the hand-held dynamometer. It has good intra- and inter
observer reliability in various settings, is simple to use, small, and reasonably
inexpensive (18,19,20,21).
Muscle strength in clinical situations is frequently assessed on a single day with
measurements repeated three times (18,20,21,22,23,24,25. Studies that measured muscle
strength repeatedly within several measurement days show inconclusive results.
Some studies indicate similar outcomes (18,22,23,24,25), other studies found higher
outcomes (32,33,34,35,36,37), and one study ascertained lower outcomes on the second
measurement day (36). An increase in strength on the second measurement day
cannot be explained by a physiological training effect as the time span between
two measurement days was too brief. A learning effect may be present. Increased
test experience with muscle strength measurement may result in higher outcomes
of consecutive measurements within a single day or a second measurement day (1).
Currently, it is unclear whether it is necessary to conduct repeated measurements
in order to obtain a reliable muscle strength estimate.
The objective of this study was therefore to analyze outcomes in older adults
of repeated Quadriceps muscle strength measurements using a hand-held
dynamometer.

Chapter 5
92
MethodsStudy population A convenience single institution sample of older adults who live in a retirement
home in the city of Groningen, the Netherlands, participated in this study. Prior
to the study, the director of the retirement home was informed about the
objective and content of the study and asked for permission to perform it. After
permission, a selection of participants was made in consultation with supervisors
of the movement programs. Older adults who suffered from dementia or
cognitive disorders or severe osteoporosis that prevented them from adequate
muscle strength testing were not asked to participate in the study. The remaining
inhabitants of the retirement home were informed with a letter about the study.
One week later, they were personally asked to participate in the study by the
students of physiotherapy who performed the measurements. The Medical Ethical
Committee of the University Medical Center Groningen exempted approval of the
study protocol (M16.192575).
Inclusion and exclusion criteriaInclusion criteria were being able to walk 20 meters with or without resources and
rise from a chair without resources or assistance. Exclusion criteria were systolic
and diastolic blood pressures exceeding 159 and 100, respectively, surgery
procedures, cerebrovascular accidents in the past six months, blood coagulation
disorders, chronic prednisone use, cognitive disorders that affect mobility,
understanding or execution of the measurements, and a positive score on the
Physical Activity Readiness Questionnaire (PARQ).
Design
Repeated measurement study
Measurements were performed on four separate measurement days with
two days in between using three consecutive repetitions of the left and right
Quadriceps muscle with a 1-minute break in between repetition. The participants
were allowed to begin the test with the leg that they preferred. After finishing
three repetitions, the opposite leg was measured. The measurement instrument
was a MicroFet 2 hand-held dynamometer (Hoggan Health Industries, Inc. 8020
South 1300 West, West Jordan, UT, USA). Participants were seated on a chair

Are repeated strength measurements required for older adults?
93
5
without back support with hips and knees flexed 90 degrees. This position had
to be maintained during the measurement. The dynamometer was positioned
anteriorly on the most distal part of the tibia. (Figure 1) Participants were asked
to gradually increase their muscle strength to a maximum in three seconds. The
‘break technique’ was applied.
Instruction of the participants Participants were instructed as follows: “Sit straight on the chair with your knees
and hips flexed 90 degrees, maintain this position and extend your knee as
forceful as possible, and build up your contraction gradually in three seconds. I will
measure the strength you will generate. You can fixate yourself, using your hands.
I will encourage you and tell you when to stop.” Observers provided standardized
encouragement. Following each trial, it was evaluated if the contraction had been
maximal by asking, “Was this your maximal strength?”
Figure 1, Hand-held dynamometer positioned anteriorly on the most distal part of the tibia
Statistical analyses Data were analyzed with SPSS 23 and R 3.2.0.(38). The means, standard deviation,
and mean difference were calculated. A linear mixed-effects model regression
analysis with fixed and random person effects was used to analyze differences
between trials and measurement days.

Chapter 5
94
In the linear mixed-effects model, the measurement results from a participant are
decomposed as the sum of fixed and random effects. Time effects are treated as
fixed whereas intercept effects of participants are treated as random. The 95%
confidence intervals were calculated.
ResultsParticipantsA sample of 44 individuals comprised of 14 male and 30 female older adults
participated in the study. The mean (SD) age was 76.8 (7.4) years, bodyweight 79.5
(12.8) kg, and body height 167.3 (6.1) cm.
Outcome measures Measurement results are summarized in Table 1.
Table 1, Summary of results of measurements of Quadriceps muscle strength in older adults
Left RightDay Repetition n Mean SD DA Day Repetition n Mean SD DA1 1 44 176 84 187 1 1 44 196 88 198
2 44 191 90 2 44 197 813 44 196 89 3 44 200 86
Day Day2 1 44 195 80 190 2 1 44 206 85 200
2 41 180 72 2 41 191 733 41 196 74 3 41 293 74
Day Day3 1 41 193 82 193 3 1 41 205 78 206
2 41 197 75 2 41 206 833 41 189 72 3 41 207 80
Day Day4 1 41 197 85 196 4 1 41 203 84 207
2 41 197 77 2 41 209 973 41 196 80 3 41 210 93
Muscle strength of the right and left side stratified by repetition (1 to 3) for each measurement day (1 to 4), DA= day average, n = sample size, SD = standard deviation. Values are expressed in Newton.

Are repeated strength measurements required for older adults?
95
5
Outcomes differed between participants, however, within participants, muscle
strength was fairly stable between repetitions and days (Figures 3 and 4).
Figure 3, Individual data of each participant for the left leg. Colors and dots represent days and repetitions. On the Y-axis, the strength (Newton) for each participant is shown. The dots from left to right represent repetition 1 to 3. Blue represents day 1, purple is day 2, green is day 3, and red is day 4.
Figure 4, Individual data of each participant for the right leg. Colors and dots represent days and repetitions. On the Y-axis, the strength (Newton) for each participant is shown. The dots from left to right represent repetition 1 to 3. Blue represents day 1, purple is day 2, green is day 3, and red is day 4.

Chapter 5
96
No significant effect for repetitions within days was found (Table 2). A significant
increase (10.3 N) in Quadriceps muscle strength (right side) was determined
between day 1 and day 3 (p=0.036). No other significant effects of days were
ascertained. The standard errors were similar between the left and right sides,
ranging from 3 to 13 N.
Table 2, Results of linear mixed model analyses with fixed effects of days and between trials for the left and right leg.
Left leg Right legValues SE DF t-
valuep- value
Values SE DF t- value
p- value
Intercept 186.2 12.5 294 14.8 <0.001 Intercept 198.9 13.2 294 14.9 <.0001D2-D1 6.1 5.4 108 1.1 0.264 D2-D1 3.4 4.8 108 0.7 0.457D3-D1 9.0 5.4 108 1.6 0.098 D3-D1 10.3 4.8 108 2.1 0.036D4-D1 9.5 5.4 108 1.7 0.082 D4-D1 9.1 4.8 108 1.9 0.059R2-R1 0.2 3.2 294 -0.0 0.950 R2-R1 -1.0 2.8 294 -0.3 0.722R3-R1 3.1 3.2 294 0.9 0.332 R3-R1 1.4 2.8 294 0.5 0.614
SE; standard error, DF; degrees of freedom, *= statistically significant D; Day, R; repetition. The intercept is the reference for determining the effects for repetition, within days and the effect between days. *Reference category is day 1, repetition 1.
Discussion We found no meaningful changes in muscle strength between measurement
days and repetitions within measurement days. Overall, no increase in strength
after repeated testing was determined, with a single exception for the first
measurement for the right side on the third day. Our finding of no effect after
multiple measurements is in accordance with previous studies using hand-held
dynamometry (18,27,28,29,30,31,39,40,42). However, several studies employing machine held
devices found an increase on the second measurement day (33,35,37,41) whereas one
study ascertained a decrease on the second measurement day (37 ). The increase
found using machine-held devices suggests that these types of devices have a
slightly larger sensitivity compared to hand-held dynamometry and require more
practice from participants for them to be able to demonstrate their maximal muscle
strength. Closely related to this issue are the findings about the minimal detectable
change (MDC). For hand-held dynamometry, the MDC range between 17% and 57%
of the measured value (1,30,40,43) and, for machine-held equipment, the MDC ranges
between 14% and 24% of the measured value (36,45). These differences in MDC for
hand-held dynamometry are probably related to weight, strength, gender, and

Are repeated strength measurements required for older adults?
97
5
experience of the observer (26,29,43,45,46,47). However, also patient related factors such
as discomfort at the site of the sensor or variations in location of the sensor may
play a role (26,29,43,45,46,47). In the case of machine-held devices, the observer related
variation and location errors are probably smaller which leads to a less obtrusive
fixation and apparently a more sensitive and precise measurement. Although
we found no significant day effects, results of the measurements on day 2 to 4
were somewhat larger than on day 1. Further, we observed minimal differences
between days or repetitions in some individuals suggesting that a learning effect
might be present. For these participants, multiple measurements are beneficial
for obtaining a more valid outcome of muscle strength measurements.
Conclusion A single measurement is sufficient to quantify muscle strength at group level.
However, for individual measurements in a therapeutic setting where certainty
about changes is required, we advise the therapist to execute three repetitions on
a single measurement day.

Chapter 5
98
References1. Jenkins, N. D. M., & Cramer, J. T. (2017). Reliability and Minimum Detectable Change for
Common Clinical Physical Function Tests in Sarcopenic Men and Women. Journal of the American Geriatric Society, 65(4), 839-846. doi:10.1111/jgs.14769
2. Balogun, S., Winzenberg, T., Wills, K., Scott, D., Jones, G., Callisaya, M., & Aitken, D. (2018). Longitudinal associations between serum 25-hydroxyvitamin D, physical activity, knee pain and dysfunction and physiological falls risk in community-dwelling older adults. Experimental Gerontology, 104, 72–77. https://doi.org/10.1016/j.exger.2018.01.026
3. Bento, P. C. B., Pereira, G., Ugrinowitsch, C., & Rodacki, A. L. F. (2010). Peak torque and rate of torque development in elderly with and without fall history. Clinical Biomechanics, 25(5), 450–454. https://doi.org/10.1016/j.clinbiomech.2010.02.002
4. Hairi, N. N., Cumming, R. G., Naganathan, V., Handelsman, D. J., Le Couteur, D. G., Creasey, H., . . . Sambrook, P. N. (2010). Loss of Muscle Strength, Mass (Sarcopenia), and Quality (Specific Force) and Its Relationship with Functional Limitation and Physical Disability: The Concord Health and Ageing in Men Project. Journal of the American Geriatrics Society, 58(11), 2055–2062. https://doi.org/10.1111/j.1532-5415.2010.03145.x
5. Newman, A. B., Kupelian, V., Visser, M., Simonsick, E. M., Goodpaster, B. H., Kritchevsky, . . . Harris, T. B. (2006). Strength, But Not Muscle Mass, Is Associated With Mortality in the Health, Aging and Body Composition Study Cohort. The Journals of Gerontology Series A: Biological Sciences and Medical Sciences, 61(1), 72–77. https://doi.org/10.1093/gerona/61.1.72
6. Muehlbauer, T., Besemer, C., Wehrle, A., Gollhofer, A., & Granacher, U. (2012). Relationship between Strength, Power and Balance Performance in Seniors. Gerontology, 58(6), 504–512. https://doi.org/10.1159/000341614
7. Gadelha, A. B., Neri, S. G. R., Bottaro, M., & Lima, R. M. (2018). The relationship between muscle quality and incidence of falls in older community-dwelling women: An 18-month follow-up study. Experimental Gerontology, 110, 241–246. https://doi.org/10.1016/j.exger.2018.06.018
8. Rubenstein, L. Z. (2006). Falls in older people: epidemiology, risk factors and strategies for prevention. Age and Ageing, 35(2), 37– 41. https://doi.org/10.1093/ageing
9. Janssen, I., Heymsfield, S. B., & Ross, R. (2002). Low relative skeletal muscle mass (sarcopenia) in older persons is associated with functional impairment and physical disability. Journal of American Geriatric Society, 50(5), 889-896. doi:10.1046/j.1532-5415.2002.50216.x
10. von Haehling, S., Morley, J. E., & Anker, S. D. (2010). An overview of sarcopenia: facts and numbers on prevalence and clinical impact. Journal of Cachexia, Sarcopenia and Muscle, 1(2), 129–133. https://doi.org/10.1007/s13539-010-0014-2
11. Doherty, T. J. (2003) Invited review: Aging and sarcopenia. Journal of Applied Physiology, 95(4), 1717-1727. doi:10.1152/japplphysiol.00347.2003
12. Filippin, L. I., Teixeira, V. N., de O, da Silva, M. P. M., Miraglia, F., & da Silva F. S. (2015). Sarcopenia: a predictor of mortality and the need for early diagnosis and intervention. Aging Clinical Experimental Research, 27(3):249-254. doi:10.1007/s40520-014-0281-4

Are repeated strength measurements required for older adults?
99
5
13. Ahmadiahangar, A., Javadian, Y., Babaei, M., Heidari, B., Hosseini, S., & Aminzadeh, M. (2018). The role of Quadriceps muscle strength in the development of falls in the elderly people, a cross-sectional study. Chiropractic & Manual Therapies, 26(1), 1-6. doi:10.1186/s12998-018-0195-x
14. Gadelha, A. B., Neri, S. G. R., Oliveira, R. J., Bottaro, M., David, A. C., Vainshelboim, B., & Lima, R. M. (2018). Severity of sarcopenia is associated with postural balance and risk of falls in community-dwelling older women. Experimental Aging Research, 44(3), 258–269. https://doi.org/10.1080/0361073x.2018.1449591
15 Barbat-Artigas, S., Rolland, Y., Cesari, M., Abellan, Van Kan G., Vellas, B., & Aubertin-Leheudre, M. (2013). Clinical relevance of different muscle strength indexes and functional impairment in women aged 75 years and older. Journals Gerontology - Series A Biological Science and Medical Science, 68(7), 811-819. doi:10.1093/gerona/gls254
16. Swallow, E. B., Reyes, D., Hopkinson, N. S., Man, W. D. C., Porcher, R., Cetti, E., . . . Polkey, I. M. (2007). Quadriceps strength predicts mortality in patients with moderate to severe chronic obstructive pulmonary disease. Thorax, 62(2), 115-120. doi:10.1136/thx.2006.062026.
17. Guralnik, J. M., Simonsick, E. M., Ferrucci, L., Glynn, R. J., Berkman, L. F., Blazer, . . . Wallace, R. B. (1994). A Short Physical Performance Battery Assessing Lower Extremity Function: Association With Self-Reported Disability and Prediction of Mortality and Nursing Home Admission. Journal of Gerontology, 49(2), 85–94. https://doi.org/10.1093/geronj/49.2.m85
18. Douma, R. K. W., Soer, R., Krijnen, W. P., Reneman, M., & van der Schans, C. P. (2014). Reference values for isometric muscle force among workers for the Netherlands: a comparison of reference values. BMC Sports Science, Medicine and Rehabilitation, 6(1),10. https://doi.org/10.1186/2052-1847-6-10
19. Bohannon, R., W. (2012). Minimal detectable change of knee extension force measurements obtained by handheld dynamometry from older patients in 2 settings. Journal of Geriatric Physical Therapy, 35(2), 79-81. doi:10.1519/JPT.0b013e3182239f64
20. Beenhakker, E. A. C., van der Hoeven, J. H., Fock, J. M., & Maurits, N. M. (2001). Reference values of maximum isometric muscle force obtained in 270 children aged 4–16 years by hand-held dynamometry. Neuromuscular Disorders, 11(5), 441–446. https://doi.org/10.1016/s0960-8966(01)00193-6.
21. Ploeg, R. J. O., Oosterhuis, H. J. G. H., & Reuvekamp, J. (1984). Measuring muscle strength. Journal of Neurology, 231(4), 200–203. https://doi.org/10.1007/bf00313939
22. Andersen, L. B., & Henckel, P. (1987). Maximal voluntary isometric strength in Danish adolescents 16-19 years of age. European Journal of Applied Physiology and Occupational Physiology, 56(1), 83–89. https://doi.org/10.1007/bf00696381
23. Shah, S., Nahar, P., Vaidya, S., & Salvi, S. (2013). Upper limb muscle strength & endurance in chronic obstructive pulmonary disease. The Indian journal of medical research, 138(4), 492–496
24. Macfarlane, T. S., Larson, C. A., & Stiller, C. (2008). Lower Extremity Muscle Strength in 6- to 8-Year-Old Children Using Hand-Held Dynamometry. Pediatric Physical Therapy, 20(2), 128–136. https://doi.org/10.1097/pep.0b013e318172432d
25. Eek, M. N., Kroksmark, A.K., & Beckung, E. (2006). Isometric Muscle Torque in Children 5 to 15 Years of Age: Normative Data. Archives of Physical Medicine and Rehabilitation, 87(8), 1091–1099. https://doi.org/10.1016/j.apmr.2006.05.012

Chapter 5
100
26. Kelln, B, M., McKeon, P. O., Gontkof, L. M., & Hertel, J. (2008). Hand-held dynamometry: Reliability of lower extremity muscle testing in healthy, physically active, young adults. Journal of Sport. Rehabilitation, 17(2):160-170. doi:10.1123/jsr.17.2.160
27. Barden, H. L. H., Nott, M. T., Baguley, I. J., Heard, R., & Chapparo, C. (2012). Test-retest reliability of computerised hand dynamometry in adults with acquired brain injury. Australian Occupational Therapy Journal, 59(4), 319–327. https://doi.org/10.1111/j.1440-1630.2012.01016.x
28. Trudelle-Jackson, E., Jackson, A. W., Frankowski, C. M., Long, K. M., & Meske, N. B. (1994). Interdevice Reliability and Validity Assessment of the Nicholas Hand-Held Dynamometer. Journal of Orthopaedic & Sports Physical Therapy, 20(6), 302–306. https://doi.org/10.2519/jospt.1994.20.6.302
29. Scott, D. A., Bond, E. Q., Sisto, S. A., & Nadler, S. F. (2004). The intra- and interrater reliability of hip muscle strength assessments using a handheld versus a portable dynamometer anchoring station. Archives of Physical Medicine and Rehabilitation, 85(4), 598–603. https://doi.org/10.1016/j.apmr.2003.07.013
30. Pfister,P. D., De Bruin, E. D., Sterkele, I., Maurer, B., De Bie, R. A., & Knols, R. H. (2018). Manual muscle testing and hand-held dynamometry in people with inflammatory myopathy: An intra- and interrater reliability and validity study. Archives of Physical Medicine and Rehabilitation, 1–22. https://doi.org/10.1371/journal.pone.0194531
31. Crompton, J., Galea, M. P., & Phillips, B. (2007). Hand-held dynamometry for muscle strength measurement in children with cerebral palsy. Developmental Medicine & Child Neurology, 49(2), 106-111. doi:10.1111/j.1469-8749.2007.00106.x
32. Douma, K. W., Regterschot, G. R. H., Krijnen, W. P., Slager, G. E. C., van der Schans, C. P., & Zijlstra, W. (2016). Reliability of the Q Force; a mobile instrument for measuring isometric quadriceps muscle strength. BMC Sports Science, Medicine and Rehabilitation, 19(8), 4. https://doi.org/10.1186/s13102-016-0029-x
33. Ritti-Dias, R. M., Basyches, M., Câmara, L., Puech-Leao, P., Battistella, L., & Wolosker, N. (2010). Test-retest reliability of isokinetic strength and endurance tests in patients with intermittent claudication. Vascular Medicine, 15(4), 275–278. https://doi.org/10.1177/1358863x10371415
34. Kienbacher, T., Kollmitzer, J., Anders, P., Habenicht, R., Starek, C., Wolf, . . . Ebenbichler, G. (2016). Age-related test-retest reliability of isometric trunk torque measurements in patiens with chronic low back pain. Journal of Rehabilitation Medicine, 48(10), 893–902. https://doi.org/10.2340/16501977-2164
35. Sole, G., Hamrén, J., Milosavljevic, S., Nicholson, H., & Sullivan, S. J. (2017). Test-Retest Reliability of Isokinetic Knee Extension and Flexion. Archives of Physical Medicine and Rehabilitation, 88(5), 626-631. doi:10.1016/j.apmr.2007.02.006
36. Verkerke, G. J., Lemmink, K. A. P. M., Slagers, A. J., Westhoff, M. H., van Riet, G. A. J., & Rakhorst, G. (2003). Precision, comfort and mechanical performance of the Quadriso-tester, a quadriceps force measuring device. Medical and Biological Engineering and Computing, 41(3), 283–289. https://doi.org/10.1007/bf02348432
37. Almosnino, S., Stevenson, J. M., Bardana, D. D., Diaconescu, E. D., & Dvir, Z. (2012). Reproducibility of isokinetic knee eccentric and concentric strength indices in asymptomatic young adults. Physical Therapy in Sport, 13(3), 156–162. https://doi.org/10.1016/j.ptsp.2011.09.002

Are repeated strength measurements required for older adults?
101
5
38. R Core Team. (2018). A Language and Environment for Statistical Computing. R Core Team, R Foundation for Statistical Computing, Vienna, Austria
39. Moxley-Scarborough, D., Krebs, D. E., & Harris, B. A. (1999). Quadriceps muscle strength and dynamic stability in elderly persons. Gait and Posture, 10(1), 10-20. doi:10.1016/S0966-6362(99)00018-1
40. O’Shea, S. D., Taylor, N. F., & Paratz, J. D. (2007). Measuring Muscle Strength for People With Chronic Obstructive Pulmonary Disease: Retest Reliability of Hand-Held Dynamometry. Archives of Physical Medicine and Rehabilitation, 88(1), 32–36. https://doi.org/10.1016/j.apmr.2006.10.002
41. Maffiuletti, N. A., Bizzini, M., Desbrosses, K., Babault, N., & Munzinger, U. (2007). Reliability of knee extension and flexion measurements using the Con-Trex isokinetic dynamometer. Clinical Physiology and Functional Imaging, 27(6), 346–353. https://doi.org/10.1111/j.1475-097x.2007.00758.x
42. Wang, C. Y., Olson, S. L., & Protas, E. J. (2002). Test-retest strength reliability: hand-held dynamometry in community dwelling elderly fallers. Archives of Physical Medicine and Rehabilitation, 83(6), 811-815. doi: 10.1053/apmr.2002.32743
43. Bohannon, R. W. (2012). Minimal detectable change of knee extension force measurements obtained by handheld dynamometry from older patients in 2 settings. Journal of Geriatric Physical Therapy, 35(2), 79-81. doi:10.1519/JPT.0b013e3182239f64.
44. Kean, C. O., Birmingham, T. B., Garland, S. J., Bryant, D. M., & Giffin, J. R. (2010). Minimal detectable change in quadriceps strength and voluntary muscle activation in patients with knee osteoarthritis. Archive of Physical Medicine and Rehabilitation, 91(9), 1447-1451. doi:10.1016/j.apmr.2010.06.002
45. Wikholm, J. B., & Bohannon, R. W. (1991). Hand-held Dynamometer Measurements: Tester Strength Makes a Difference. Journal of Orthopaedic & Sports Physical Therapy, 13(4), 191–198. https://doi.org/10.2519/jospt.1991.13.4.191
46. Deones, V. L., Wiley, S. C., & Worrell, T. (1994). Assessment of Quadriceps Muscle Performance by a Hand-Held Dynamometer and an Isokinetic Dynamometer. Journal of Orthopaedic & Sports Physical Therapy, 20(6), 296–301. https://doi.org/10.2519/jospt.1994.20.6.296
47. Stone, C. A., Nolan, B., Lawlor, P. G., & Kenny, R. A. (2011). Hand-held dynamometry: tester strength is paramount, even in frail populations. Journal of Rehabilitation Medicine, 43(9), 808–811. https://doi.org/10.2340/16501977-0860


Chapter 6
Measuring Quadriceps muscle strength in adults with severe or moderate intellectual and visual
disabilities: feasibility and reliability
Dijkhuizen, A., Douma, K. W., Krijnen, W. P., van der Schans, C. P., & Waninge, A. (2018). Journal of Applied Research in Intellectual Disabilities, 31(6),1083-1090.
doi: 10.1111/jar.12468.

Chapter 6
104
AbstractBackground A feasible and reliable instrument to measure strength in persons
with severe intellectual and visual disabilities (SIVD) is lacking. The objective elders
overall objective of our study was to determine feasibility, learning period and
reliability of three strength tests.
Methods Twenty-nine participants with SIVD performed the Minimum Sit-to-
Stand Height test (MSST), the Leg Extension test (LET) and the 30 seconds Chair-
Stand Test (30sCST), once per week for 5 weeks. Feasibility was determined by
the percentage of successful measurements, learning effect by using paired t
test between two consecutive measurements, test–retest reliability by intraclass
correlation coefficient and Limits of Agreement and, correlations between the
different tests by Pearson correlations.
Results A sufficient feasibility and learning period of the tests was shown.
The methods had sufficient test–retest reliability and moderate-to-sufficient
correlations.
Conclusion The MSST, the LET, and the 30sCST are feasible tests for measuring
muscle strength in persons with SIVD, having sufficient test re-test reliability.

Measuring Quadriceps muscle strength in adults with severe or moderate intellectual and visual disabilities:
105
6
IntroductionMuscle strength contributes to mobility which impacts quality of life(1). The muscle
strength of lower limbs is important for ambulatory activities such as rising from
a chair, walking at an appropriate speed, and walking on stairs (2). Loss of muscle
strength may lead to a decrease of activities in daily living (ADL) (3). and worse
health-related quality of life (4). A weakness of the Quadriceps is a predictor of
mortality (5) as it is one of the first muscles that degenerates due to inactivity (6).
Muscle strength can be quantified by several reliable and valid tests that are
attuned for specific target populations. In various settings with adolescents to
older adults, with or without physical disabilities, it has been demonstrated that,
e.g., hand-held dynamometry (7,8,9,10) and the 1-repetition maximum (1RM) (11,12) are
reliable and valid methods quantifying muscle strength. The 1RM is considered to
be a reliable method for assessing leg muscle strength and its changes (13). The 30
seconds Chair-Stand test (30sCST) is a valid and reliable instrument in the general
population as well as in older adults (14) for measuring muscular endurance (15).
In addition, the 30sCST demonstrated a high validity for measuring Quadriceps
muscle strength (14). Related to the 30sCST is the Minimum- Sit-to- Stand Height
Test (MSST) which is used as a reliable functional instrument to measure strength
in lower limbs of older adults (16) and is an effective predictor for functional capacity (17).
For measuring muscle strength in persons with an intellectual disability (ID), a
hand-held dynamometry (16), the Jamar (18,19,20) (30sCST), and the 1RM (21) are used as
feasible and reliable instruments measuring muscle strength of Quadriceps muscle.
However, in persons with severe or profound ID, feasibility for measuring grip
strength (Jamar) is moderate to low (19). Therefore, this measurement instrument
does not seem to be feasible for people with severe intellectual and visual disability
(SIVD). Also, the hand-held dynamometry may not be applicable in persons with
a more severe intellectual disability. In addition, individuals experiencing SIVD
are physically weaker compared to persons with ID (22, 23). Persons with SIVD often
suffer from impaired health and physical fitness. Therefore, we expect persons
with SIVD to have low muscle strength like those individuals with ID, in particular
the Quadriceps muscle (24,25,26). However, until recently, a feasible and reliable
instrument to measure strength in persons with SIVD has been lacking.

Chapter 6
106
Difficulties in performing strength tests can be expected due to severe ID and
visual impairments. Also, the time frame in which persons with SIVD learn to
adequately perform a strength test is currently unknown. The 1RM leg extension
(LET) does seem to be an appropriate instrument to measure Quadriceps muscle
strength in persons with SIVD due to the availability of the equipment and because
this test requires a movement in one fixed direction for the execution of the test.
The 30sCST and the MSST seem to be suitable instruments to measure strength
and endurance in persons with SIVD due to their required functional movement
which also occurs frequently during daily life.
Only a small number of measuring instruments to measure Quadriceps muscle
strength, described in literature, seems feasible for persons with SIVD, specifically,
the MSST, the LET, and the 30sCST due to their functionality and participants’
required cognitive ability. Hence, we have formulated the following research
questions. What is the feasibility, learning period, and reliability of the MSST, LET,
and the 30sCSTT for persons with severe intellectual and visual disabilities? What
is the association between scores of these tests?
MethodsParticipantsParticipants were recruited from a residential facility in the Netherlands. Inclusion
criteria consisted of having a moderate to severe (ID) according to the ICD-10
(27), visual disabilities (‘severely partially sighted to blind’; WHO, 2010), and Levels
I and II on the Gross Motor Function Classification System (GMFCS) (28,29). After
obtaining written consent from the representatives of the participants, participants
were screened regarding support for participation from a physician specialized in
intellectual disabilities in collaboration with a health care psychologist. Individuals
classified within GMFCS Levels I or II were included as a sufficient balance and
mobility is required to perform the tests. The GMFCS (28,29) is a five-level system
utilized to classify the severity of motor disabilities in persons with intellectual
and physical disabilities. Individuals classified as Level I are generally capable of
walking without restrictions but tend to have limitations in advanced motor skills.
Persons classified as Level II are capable of walking with minimal restrictions but
do not spontaneously increase their speed while walking. Persons classified as

Measuring Quadriceps muscle strength in adults with severe or moderate intellectual and visual disabilities:
107
6
Level III are capable of walking only with the help of walking devices. The locomotor
skills of persons classified as GMFCS Levels IV or V are very limited; therefore, they
had to be excluded from the current study. Characteristics including gender, age,
level of ID, level of GMFCS, visual impairment, presence of a hearing impairment,
weight, and height were retrieved from the clients’ medical records. Data regarding
visual impairment were categorized as visual impairment or being blind. These
characteristics were determined and categorized by a physician specialized in
intellectual disabilities in collaboration with a health care psychologist.
Exclusion criteria consisted of mental or physical health issues that prevented
the client from participating such as psychoses, depression, or other severe
psychological problems such as behavioural and prolonged stress; somatic
diseases defined as chronic diseases and/or diseases that are not resolved in a
short period of time such as osteoarthritis, osteoporosis, pneumonia, and general
illness or fever; taking antibiotics, worsening of asthma or epilepsy as signified with
recent insult or epileptic fits, fresh wound(s)/bruise(s), or other factors causing
pain during movement, and finally, stress as evidenced by a participant’s behavior
shortly prior to the date of measurement.
Design This is a repeated measurements study to examine measurement properties of
three muscle strength measurements: The Minimum Sit-to-Stand Height Test
(MSST), the Leg Extension (LET), and the 30 seconds Chair-Stand (30sCST).
Participants performed the MSST, LET and 30sCST within one session once a week
for a period of five weeks. Prior to measuring, the test administrator completed a
checklist on all exclusion criteria. A test administrator and a gymnastics instructor
were present during the measurements. The latter was well informed on the
mental and physical limitations of each of the participants and was familiar to
the participants which facilitated the accuracy of the performance during testing
(30). The test administrator was a physical therapist or a bachelor student physical
therapy, familiar with the protocols of the strength tests. The tests were performed
in a fixed order whereby the 30sCST was measured first: the participant then
performed the LET; and, finally, the MSST. At least a one-minute pause was taken
between each performance of a test.
Chapter 6
108
Ethical statementThis study was performed in accordance with the guidelines of the Helsinki
Declaration (31). Dispensation was obtained from the legal Medical Ethics Committee (32). Because the participants were not able to, their legal representatives gave
informed consent. The measurements were performed in accordance with the
behavioral code section entitled ‘Resistance among people with an intellectual
disability in the framework of the Act Governing Medical-Scientific Research
Involving Humans’ (33). Consistent distress or unhappiness was interpreted as a
sign of a lack of assent, and further participation in the study was reconsidered.
Measurements Extra verbal instructions and encouragement were given to the participant during
the tests. Participants were also shown the expected movement and modelling
in order to ensure an accurate performance. This form of adapted guidance
was offered to maintain a minimal stress level for the participant because a
presence of SIVD and a possible additional hearing impairment make it difficult
or impossible for the participants to undergo measurements. If participants were
able to complete the tests according to the protocol, the test result was recorded
as ‘successfully performed’. When participants could not be present at time of
the measurements due to extenuating circumstances, ‘not present’ was recorded.
Measurements were defined as ‘not feasible’ if participants could not perform the
tests properly according to the protocol at the time of the measurements; e.g.,
when participants were unable to perform the test for cognitive reasons because
they did not understand the test; when participants wanted to get up/ raise by
using their hands or arms while performing the MSST and the 30sCST; and when
participants showed an incomplete lifting of the lower leg in the performance of
LET.
Minimum Sit-to-Stand Height Test (MSST)
The participant was asked to stand up from the lowest possible position to fully
upright without using his / her hands (without pushing off with arms/hands) or
widening their foot position outside the legs of the seat. This position was recorded
in centimeters. In order to rise from this deepest position, a special step less in-
depth-adjustable seat was developed. Below 18 cm, judo mats with a thickness

Measuring Quadriceps muscle strength in adults with severe or moderate intellectual and visual disabilities:
109
6
of 4 cm were used. This allowed the seat depth to be reduced to 16 cm, 12 cm,
8 cm, 4 cm to eventually be phased to 0 cm when standing up from the floor.
The minimum sit-to-stand height test has an excellent reliability (ICC 0.91 (95%
confidence interval) CI 0.81; 0.96) and moderate responsiveness for an inpatient
rehabilitation setting (16)
Leg Extension test (LET)
The participant sat on appropriate fitness equipment to perform maximum leg
extension. Before performing the test, the maximum achievable extension (range
of motion) was recorded. We then asked the participant to fully extend the leg
against the maximum achievable resistance. The LET is a feasible and reliable
instrument for measuring muscle strength of Quadriceps muscle in adults with
ID (21).
30 seconds Chair-Stand test (30sCST)
The participant sat in a firm chair that had no arms. We asked the participant
to correctly stand up (full stance) and sit down as often as possible within a 30
second time frame without using his/her hands (without pushing off with hands)
and, when possible, with arms crossed over chest /over each other. Testing
time (30 seconds) was recorded using a hand-held stopwatch. The number of
completed standing incidents (up–down) was recorded. The 30sCST is developed
in a population of older adults and is highly correlated with strength of the lower
limbs (14). The 30sCST is a valid and reliable instrument in the general population (14) to measure muscular endurance (15). Feasibility and test-retest reliability was
moderate to good in adults with ID (ICC of 0.72 for same-day interval and 0.65
for a two-week interval) (18,19). Reliability and validity of the 30sCST in the general
elderly population is good with high test-retest reliability (r = 0.89) (14,34). Test–retest
reliability of the 30sCST in older adults with ID is moderate ICC 0.72 (same-day
interval) and 0.65 (two-week interval) (18).
Data analysesData analyses were performed using the Statistical Package for the Social Sciences
(SPSS 22).

Chapter 6
110
FeasibilityThe number of unsuccessful measurements (not feasible) was compared with
the total number of measurements to derive the percentage of all successful
measurements in order to determine feasibility. Feasibility was considered to be
sufficient if the percentage of successful assessments exceeded 85% (33,36,37).
Learning periodThe difference scores between consecutive time points of MSST, LET and 30sCST
measurements was subjected to the Shapiro-Wilk and the Anderson-Darling
normality tests. To gain insight into the learning period for the MSST, LET, and
30sCST, we used the paired t-test and the Wilcoxon signed rank test to investigate
whether there was a difference in means between two consecutive measurements
over a period of five weeks. A non-significant difference was considered as the end
of the learning period for a particular instrument.
Test re-test reliabilityBetween Weeks 4 and 5, test-retest reliability was analyzed by an intra-class
correlation coefficient (ICC, one way random) for the MSST, LET, and 30sCST where
an ICC ≥ 0.75 was considered to be acceptable (38,39). An ICC <0.75 indicated poor or
moderate, 0.75 - 0.90 good, and > 0.90 very good reliability (40). For the reference
range of the differences between the two measurements of the MSST, LET, and
30sCST, the limits of agreement (LOA) were calculated as ±1.96 timed the SD of
the difference. The LOA is considered to be an indicator of test-retest reliability
expressed in units of the measurement instrument as well as in a percentage of
the mean of the first test (38). To assess test-retest reliability, the Standard Error of
Measurement (SEM) was calculated for the MSST, LET, and 30sCST. The Standard
Error of Measurement (SEM) represents the standard deviation of measurement
error (40). The SEM reflects the reliability of the response (40).
Association between MSST, LET and 30sCSTTo investigate the degree in which the MSST, LE, and 30sCST measure the same
construct, the Pearson correlations (two-tailed) were calculated for Week 5.
Correlations of 1.0-0.9 are indicated as nearly perfect, 0.9-0.7 very large, 0.7-0.5

Measuring Quadriceps muscle strength in adults with severe or moderate intellectual and visual disabilities:
111
6
large, 0.5-0.3 moderate, 0.3-0.1 small, and anything smaller than 0.1 trivial /very
small (41). We applied a principal components analysis (PCA) to the MSST, LET,
and 30sCST, to analyze the percentage of common variance between the three
measurements on the basis of their inter-correlations.
ResultsWritten consent was requested from the representatives of 75 candidates
whereby 44 agreed. Fifteen individuals were excluded for medical/behavioral
reasons. None of the participants were excluded from the study due to consistent
distress or unhappiness that was interpreted as a sign of a lack of consent. The 29
participants in this study comprise 16 males and 13 females. The mean (SD) age of
all of the participants was 38.7 (14.5) with a minimum age of 20 and a maximum
age of 63 (Table 1).
Table 1, Characteristics of the participants (N=29)
CharacteristicsGender, N (%)
Male
16 (55.2%)Age, Mean± SD 38.7 ±14.5
Intellectual disability, N (%)
Moderate
Severe
7 (24.1%)
22 (75.9%)GMFCS level, N (%)
Level I
Level II
25 (86.2%)
4 (13.8%)Visual Impairment, N (%)
(Severely) partially sighted
Blind
16 (55.2%)
13 (44.8%) Auditory Impairments, N (%)
Normal hearing
(Severely) hearing loss
Deaf
16 (55.2%)
11 (37.9%)
2 (6.9 %)Weight in kg, Mean ± SD 69.4 ±12.2Height in cm, Mean ± SD 167.4 ±12.8

Chapter 6
112
Feasibility The percentage of successfully performed MSST measures ranged between 86%
and 100%, for LET between 86% and 97%, and between 93% and 100% for 30sCST.
This indicates sufficient feasibility for the three different measurements.
Learning period The normality of the difference scores between consecutive time points of the
MSST, LET and, the 30sCST test, was rejected in all three tests. The parametric t-test
and the non-parametric Wilcoxon signed rank test gave comparable p-values.
Table 2 shows the mean (SEM) differences of the consecutive weeks, the t-values,
and the p-values corresponding to the paired differences in the mean. The size
of the differences in mean decreased for the sequential measurements. For the
MSST, a non-significant difference was determined between the measures of
Weeks 3 and 4. Regarding the 30sCST test, there was no significant difference
between measures Weeks 1 and 2 and, for the LET, a non-significant difference
was found between the measures of Weeks 4 and 5.
Test re-test reliability Table 2 summarizes the results of the (paired) t-tests and the Wilcoxon signed
rank tests, ICC analyses, the LOA, and the LOA as a percentage of the mean
between measurements of Weeks 4 and 5. Intra class correlation coefficients (one
way random) were very strong. The LOA, expressed as a percentage of the means
(LOA %), were ≤17.0 % for all three methods (MSST 6.7 %; LET 16.4 %; 30sCST 17.0
%). The standard error of measurement (SEM) was (0.12) for the MSST, (0.53) for
the LET, and (0.21) for the 30sCST.

Measuring Quadriceps muscle strength in adults with severe or moderate intellectual and visual disabilities:
113
6
Tabl
e 2,
(Pai
red)
t-te
sts
(mea
sure
men
ts 1
-5),
Wilc
oxon
sig
ned
rank
test
(mea
sure
men
ts 1
-5),
ICC
anal
yses
, the
LO
A an
d th
e LO
A as
a p
erce
ntag
e of
the
mea
n fo
r MSS
T, L
ET a
nd 3
0sCS
T (m
easu
rem
ents
4-5
).
MSS
T (c
m)
Mea
n D
iff (S
EM)
tp
valu
e t-
test
Wilc
oxon
ICC
95%
CI
LOA
LO
A a
s m
ean
%
MSS
T 1-
2 1.
6 (0
.63)
2.5
0.02
0 / 0
.024
MSS
T 2-
31.
4 (0
.47)
3.1
0.00
4 / 0
.004
MSS
T 3-
40.
69 (0
.38)
1.8
0.08
5 / 0
.090
MSS
T 4-
50.
00 (0
.12)
0.0
1.00
0 / 1
.000
0.99
9*0.
997
– 0.
999
1.16
6.
7
LET
(kg)
Mea
n D
iff (S
EM)
TP
valu
eIC
C95
% C
ILO
A
LOA
as
mea
n %
LET
1
-2-2
.7 (0
.67)
-4.0
0.00
1 / 0
.001
LET
2-3
-3.1
(0.7
95)
-3.8
0.00
1 / 0
.001
LET
3-4
-2.6
(0.9
4)-2
.80.
011
/ 0.0
04LE
T
4-
5 -0
.17
(0.5
3)-0
.30.
747
/ 0.4
840.
973*
0.
939
– 0.
989
5.09
16
.4
30sC
ST (n
o)M
ean
Diff
(SEM
)T
P va
lue
ICC
95%
CI
LOA
LO
A a
s m
ean
%30
sCST
1-2
-0.6
8 (0
.53)
-1.3
0.20
8 / 0
.199
30sC
ST 2
-3
-0.2
3 (0
.39)
-0.6
0.56
3 / 0
.582
30sC
ST 3
-4
-1.1
(0.2
95)
-3.8
0.00
1 / 0
.001
30sC
ST 4
-5
-0.1
5 (0
.21)
-0.8
0.46
1 / 0
.448
0.96
7*0.
927
– 0.
985
1.96
17
.0
MSS
T: M
inim
um S
it-to
-Sta
nd h
eigh
t tes
t in
cent
imet
ers
(cm
), LE
: Leg
Ext
ensi
on e
xpre
ssed
in k
ilogr
ams
(kg)
, 30s
CST:
30
seco
nds
Chai
r St
and
test
exp
ress
ed in
num
ber
of r
epet
ition
s (n
o), S
EM: S
tand
ard
erro
r of
mea
sure
men
t, Co
rrel
atio
n is
sig
nific
ant a
t the
0.0
1 le
vel (
1-ta
iled)
.*P
valu
e <0
.001

Chapter 6
114
Figu
re 1
, Box
plot
s M
SST
wee
k 1-
5
F
igur
e 2,
Box
plot
s LE
T w
eek
1-5
F
igur
e 3,
Box
plot
s 30
sCST
wee
k 1-
5

Measuring Quadriceps muscle strength in adults with severe or moderate intellectual and visual disabilities:
115
6
The Box-and-whiskers plots in Figures 1, 2, and 3 visualize the measurements
obtained for the MSST, LE, and 30sCST over a period of five weeks.
Association between MSST, LET and 30sCST
A Pearson Correlation was computed in order to assess the association between
the MSST, LET, and 30sCST for Week 5. The correlation between the MSST and
30sCST was large (MSST-30sCST r = -0.56, p= 0.004), moderate between MSST and
LET (MSST-LET r = -0.31, p= 0.165) and moderate between LET and 30sCST (LET-
30sCST r = 0.45, p= 0.031). The principal components analysis (PCA) of the MSST,
LET and, 30sCST, revealed that 62% of the variance is explained by the the first
principal component.
Discussion The results show sufficient feasibility for the MSST, LET, and the 30sCST with an
acceptable learning period of a maximum of five practice sessions for individuals
with SIVD. Test re-test reliability is very good for all three methods in persons with
SIVD. The correlation between the MSST, LET, and 30sCST ranges from moderate
to large, suggesting that these instruments measure a different construct.
Our results indicate a sufficient feasibility for the MSST (86%-100%), LET (86%
and 97%), and 30sCST (93%-100%) for persons with SIVD. The MSST is a feasible
instrument for persons experiencing SIVD possibly due to its required functional
movement which often occurs during daily life. Feasibility of the LET is sufficient
which may be explained by the fact that the required movement was in one fixed
direction. Our 30sCST feasibility percentage is considerably better compared to
that found by Hilgenkamp and colleagues who found 44% feasibility of the 30sCST
in older adults with ID (18). In Hilgenkamp’s study participants performed seven
different physical fitness tests including the 30sCST. In our study, extra verbal
instructions and encouragement were given to the participants during testing by
gymnastic instructors who also demonstrated the movement expected from the
participants. This additional guidance could possibly have improved the feasibility
of the tests in our study. In our study, persons with profound ID were excluded,
and the mean age of the participants was younger than in the study of Hilgenkamp (18).

Chapter 6
116
Our results show a non-significant difference between the measures of Weeks 3
and 4 for the MSST that may indicate a learning period of at least four practice
sessions, which is one week (one session) shorter compared to the learning
period of the LET. As for the 30sCST, a non-significant difference was noticeable
from the first measures which could indicate the absence of a learning period.
For persons with SIVD, the MSST, and the 30sCST appear to be easier to perform
than the LET possibly because of the required functional movement in both
measurements. The LET requires a coordinative difficult movement, and it is not
a functional test. Therefore, we already expected that the LET would be the most
difficult test to perform for those experiencing SIVD. The learning periods we
found were in accordance with those of other performance tests in persons with
SIVD, for example, five practice sessions were performed to become familiar with
a modified Berg Balance Scale (36). In another study of Waninge and colleagues in
which persons with SIVD performed the six minutes walking distance at relatively
short intervals, a learning period of two weeks was required (23). It is possible
that the learning period of the present study could be decreased if the training
sessions were planned closer to each other. The participants in our study seemed
to be capable of performing the 30sCST well with the given instructions and
guidance from the first measurement, which could indicate that persons with SIVD
can perform the 30sCST well without the need of a learning period. The possible
absence of a learning period for 30sCST seems to be in line with the findings of
Hilgenkamp who found no statistically significant learning effect in the test results
of 30sCST between their practice session and their first measurement (18). Also, the
means in our study are not less than those determined by Hilgenkamp (18).
Due to the limitations of persons with SIVD, it was necessary to adapt the guidance
of the participants during testing in the sense of some extra standardized verbal
instructions, encouragement, and demonstrating the expected movement
and modelling to the participant during the test in order to achieve optimal
performance. These additional instructions ensured that participants kept their
arms crossed over the chest during the performances of the MSST and the 30sCST.
Also, encouragement was provided by counting out loud while participants
performed the 30sCST to ensure that they did not stop prior to the end of the
30sCST. This support was also offered to maintain the most minimal stress level
as possible for the participant. In some cases, the test instructor indicated that

Measuring Quadriceps muscle strength in adults with severe or moderate intellectual and visual disabilities:
117
6
the limit had been reached concerning the mental capacity of the participant to
maintain a minimal stress level. To decrease the influence of differences in these
limits, the gymnastics instructors were all instructed in the same manner and were
well-informed of the test protocols prior to the measurement period.
The test re-test reliability for the MSST, the LET, and the 30sCST is very good in
persons experiencing SIVD. This accords with the findings of Schurr regarding the
MSST (16) and Hilgenkamp concerning 30sCST (18). Moreover, our results showed
that LOA, expressed as a percentage of the means, were less than or equal to
17% for all three methods. In general, higher LOA’s are found in performance
tests when compared to non- performance testing such as, for example, BMI
measurements. Our LOA’s are in line with the findings of Waninge who found a
sufficient test-retest reliability for the a Shuttle Run test (LOA% = 23%), and for
the 6Minute Walking Distance (LOA% = 30%) in persons with SIVD (23). Taking into
account the limited abilities of persons with SIVD to perform measurements, in
general, and the required level of intelligence, concentration, and coordination to
perform the MSST, the LET, and the 30sCST well, we consider the LOA expressed as
a percentage sufficient for these methods. Hence, we consider that the reliability
is sufficient for the MSST, LET, and 30sCST in persons with SIVD.
A significant correlation was determined between the MSST and the 30sCST, a
moderate correlation between the MSST and the LET, and a moderate correlation
between the LET and the 30sCST. It seems that our finding concerning the
correlation between LET and MSST is in line with findings of Schurr and colleagues
who ascertained that 8-17% of the variability in the MSST was explained by
the strength of the Quadriceps muscle (16). Apparently, performance of MSST is
influenced by factors other than knee extensor muscle strength (16). In our study, a
number of participants had achieved their maximum depth while performing the
MSST; however, they were able to repeat the test several times from this maximum
depth. This could indicate that the participant’s mobility or agility was the limiting
factor instead of muscle strength. It appears that all three methods actually
measure different aspects, e.g., the MSST for agility and strength, the LET for
strength, and the 30sCST for muscle endurance with which they could complement
one another. However, the PCA to the MSST, LET and, 30sCST, revealed that 62%
of the variance is common. Therefore, the first principal component (strength)
explains a relatively large amount of variance. Clinically, the tests seem to be

Chapter 6
118
partly complementary (a view sustained by our PCA). Therefore, we recommend
that when the Quadriceps muscle strength is the primary outcome for a training
program, then the LET test as a measuring instrument would be legitimate to
use in persons with SIVD. If, however, functional aspects such as measuring and
mapping the performance or level of ambulatory activities, are deemed important,
then the MSST (flexibility and strength) and / or 30sCST (muscle endurance and
strength) are of added value and therefore the tests might be used as a test-set to
gain insight into clients’ ambulatory abilities and their need for support.
A limitation of this study is that, due to the exclusion criteria implied by the research
question, only a rather small number of participants could be included. The
objective of the study was to explore if the tests developed for persons with SIVD,
would be feasible and reliable. In this study, the measurements were repeated
every week over a period of five weeks. This frequency per week was expected to
be too intensive for persons with profound intellectual disability. Therefore, they
were excluded implying a smaller sample size. Nevertheless, this study provides
extensive statistical analyses to firstly explore the feasibility and reliability of
the measurements and secondly to investigate the correlation between the
measurements, for persons with SIVD. A follow-up study should objective at
providing further evidence concerning the feasibility and reliability of the results in
a larger more heterogeneous group. Therefore, further research of the feasibility
and reliability in persons with less severe and more severe intellectual disabilities,
and both with and without additional visual impairment is recommended to be
able to better generalize the results for a broader target group.
In conclusion, the MSST, the LET, and the 30sCST are feasible methods with an
acceptable learning period and a sufficient test re-test reliability for persons with
SIVD.

Measuring Quadriceps muscle strength in adults with severe or moderate intellectual and visual disabilities:
119
6
References 1. Brooks, S. V., & Faulkner, J. A. (1994). Skeletal muscle weakness in old age; underlying
mechanisms. Medicine & science in sports & exercise, 26,(4), 32-439
2. Bassey, E. J., Fiatarone, M. A., O’Neill, E. F., Kelly, M., Evans, W. J., & Lipsitz, L. A. (1992). Leg extensor power and functional performance in very old men and women. Clinical Science (London), 82(3), 321-7. doi: 10.1042/cs0820321
3. Vinciguerra, M., Musaro, A., & Rosenthal, N. (2010). Regulation of muscle atrophy in aging and disease. Advances in Experimental Medicine and Biology, 694, 211-33. doi: 10.1007/978-1-4419-7002-2_15
4. Mostert, R., Goris, A., Weling-Scheepers, C., Wouters, E. F., & Schols, A. M. (2000). Tissue depletion and health related quality of life in patients with chronic obstructive pulmonary disease. Respiratory Medicine, 94(9), 859-67. doi: 10.1053/rmed.2000.0829
5. Newman, A. B., Kupelian, V., & Visser, M. (2006). Strength, but not muscle mass, is associated with mortality in the health, aging and body composition study cohort. Journals of Gerontology Series A, 61(1), 72-7. doi: 10.1093/gerona/61.1.72
6. Boonyarom, O., & Inui, K. (2006). Atrophy and hypertrophy of skeletal muscles: structural and functional aspects. Acta Physiologica, 188(2), 77-89. doi: 10.1111/j.1748-1716.2006.01613.x.
7. Bohannon, R. W., & Andrews, A. W. (1987). Interrater reliability of hand-held dynamometry. Physical Therapy, 67(6), 931-3. doi: 10.1093/ptj/67.6.931
8. Dunn, J. C., & Iversen, M. D. (2003). Interrater Reliability of Knee Muscle Forces Obtained by Hand-held Dynamometer from Elderly Subjects with Degenerative Back Pain. Journal of Geriatric Physical Therapy, 26(3), 23–29
9. Roy, M. A. G., & Doherty, T. J. (2004). Reliability of Hand-Held Dynamometry in assessment of knee extensor strength after hip fracture. American Journal of Physical Medicine & Rehabilitation, 83(11), 813-818. doi: 10.1097/01.phm.0000143405.17932.78
10. Stark, T., Walker, B., Phillips, J. K., Fejer, R., & Beck, R. (2011). Hand-held dynamometry correlation with the gold standard isokinetic dynamometry: a systematic review. PM & R: the journal of injury, function, and rehabilitation, 3(5), 472-9. doi: 10.1016/j.pmrj.2010.10.025
11. Faigenbaum, A. D., McFarland, J. E., Herman, R. E., Naclerio, F., Ratamess, N. A., Kang, J., & Myer, G. D. (2012). Reliability of the one-repetition-maximum power clean test in adolescent athletes. Journal of Strength and Conditioning Research, 26(2), 432-7. doi: 10.1519/JSC.0b013e318220db2c
12. Seo, D. I., Kim, E., Fahs, C. A., Rossow, L., Young, K., Ferguson, S. L., …So, W. Y. (2012). Reliability of the one-repetition maximum test based on muscle group and gender. Journal of Sports Science & Medicine, 11(2), 221-5
13. Verdijk, L. B., van Loon, L., Meijer, K., & Savelberg, H. H. (2009). One-repetition maximum strength test represents a valid means to assess leg strength in vivo in humans. Journal of Sports Sciences, 1,27(1), 59-68. doi: 10.1080/02640410802428089
14. Jones, C. J., Rikli, R. E., & Beam, W. C. (1999). A 30-s chair stand test as a measure of lower body strength in community-residing older adults. Research Quarterly for Exercise and Sport, 70(2), 113-9. doi: 10.1080/02701367.1999.10608028

Chapter 6
120
15. Rikli, R. E., & Jones, J. C. (2012). Senior Fitness Test Manual (Second edition). Illinois, Human Kinetics.
16. Schurr, K., Sherrington, C., Wallbank, G., Pamphlett, P., & Olivetti, L. (2012). The minimum sit-to-stand height test: Reliability, responsiveness and relationship to leg muscle strength. Clinical Rehabilitation, 26(7), 656-663. doi: 10.1177/0269215511427323
17. Rivera, J. A., Fried, L. P., Weiss, C. O., & Simonsick, E. M. (2008). At the tipping point: predicting severe mobility difficulty in vulnerable older women. Journal of the American Geriatrics Society, 56(8), 1417-23. doi: 10.1111/j.1532-5415.2008.01819. x
18. Hilgenkamp, T. I. M., van Wijck, R., & Evenhuis, H. M. (2012). Feasibility and reliability of physical fitness tests in older adults with intellectual disability: A pilot study. Journal of Intellectual & Developmental Disability, 37(2), 158–162 .doi: 10.3109/13668250.2012.681773
19. Hilgenkamp, T. I. M., van Wijck, R., & Evenhuis, H. M. (2013). Feasibility of Eight Physical Fitness Tests in 1,050 Older Adults with Intellectual Disability: Results of the Healthy Ageing with Intellectual Disabilities Study. Intellectual and Developmental Disabilities, 51(1), 33–47. doi: 10.1352/1934-9556-51.01.033
20. Carmeli, E., Imam, B., & Merrick, J. (2012). The relationship of pre-sarcopenia (low muscle mass) and sarcopenia (loss of muscle strength) with functional decline in individuals with intellectual disability (ID). Archives of Gerontology and Geriatrics, 55(1), 181-5. doi: 10.1016/j.archger.2011.06.032
21. Calders, P., Elmahgoub, S., Roman de Mettelinge, T., Van den Broeck, C., De Wandele, I., Rombaut, L., & Cambier, D. (2011). Effect of combined exercise training on physical and metabolic fitness in adults with intellectual disability: a controlled trial. Clinical Rehabilitation, 25(12), 1097-108. doi: 10.1177/0269215511407221
22. Waninge, A., Ligthart, K. A., Kramer, J., Hoeve, S., van der Schans, C. P., & Haisma, H. H. (2010). Measuring waist circumference in disabled adults. Research in Developmental Disabilities, 31(3), 839-47. doi: 10.1016/j.ridd.2010.02.009
23. Waninge, A., Evenhuis, I. J., van Wijck, R., & van der Schans, C. P. (2011c). Feasibility and Reliability of Two Different Walking Tests in People with Severe Intellectual and Sensory Disabilities. Journal of Applied Research in Intellectual Disabilities, 24(6), 518-527 10. https://doi.org/10.1111/j.1468-3148.2011.00632.x
24. Horvat, M., Croce, R., Pitetti, K. H., & Fernhall, B. (1999). Comparison of isokinetic peak force and work parameters in youth with and without mental retardation. Medicine and Science in Sports and Exercise, 31(8), 1190-5. doi: 10.1097/00005768-199908000-00017
25. Angelopoulou, N., Tsimaras, V., Christoulas, K., Kokaridas, D., & Mandroukas, K. (1999). Isokinetic knee muscle strength of individuals with mental retardation, a comparative study. Perceptual and Motor Skills, 88(3), 849-55. doi: 10.2466/pms.1999.88.3.849
26. Borji, R., Sahli, S., Zarrouk, N., Zghal, F., & Rebai, H. (2013). Neuromuscular fatigue during high-intensity intermittent exercise in individuals with intellectual disability. Research in Developmental Disabilities, 34(12), 4477-84. doi: 10.1016/j.ridd.2013.09.025
27. World Health Organization (WHO). International Statistical Classification of Diseases and Related Health Problems (ICD-10). 10th revision, Geneva, 2010

Measuring Quadriceps muscle strength in adults with severe or moderate intellectual and visual disabilities:
121
6
28. Palisano, R., Hanna, S. E., Rosenbaum, P. L., Rusell, D. J., Walter, S. D., Wood, E. P., & Galuppi, B. E. (2000). Validation of a model of Gross Motor Function for Children with Cerebral Palsy. Physical Therapy, 80(10), 974-85
29. Gorter, J. W. (2001). Gross Motor Function Classification System (Dutch translation), Utrecht: Revalidatiecentrum De Hoogstraat
30. Hale, L., Bray, A., & Littmann, A. (2007). Assessing the balance capacities of people with profound intellectual disabilities who have experienced a fall. Journal of Intellectual Disability Research, 51(4), 260-8. doi: 10.1111/j.1365-2788.2006.00873.x
31. World Medical Association Declaration of Helsinki, Ethical Principles for Medical Research Involving Human Subjects. Seoul, 2008
32. Medical Ethics Committee (2014/137) METcUMCG, Groningen, the Netherlands
33. Dutch Society for Doctors in the Care for people with an Intellectual Disability (NVAZ) (1999) Resistance among people with an intellectual disability in the framework of the Act Governing Medical-Scientific Research Involving Humans, behavioural code for doctors in the assessment of resistance among people with an intellectual disability
34. Jones, C. J., Rikli, R. E., & Beam, W. C. (1999). A 30-s chair stand test as a measure of lower body strength in community-residing older adults. Research Quarterly for Exercise and Sport, 70(2), 113-9. doi: 10.1080/02701367.1999.10608028
35 . Enkelaar, L., Smulders, E., van Schrojenstein Lantman-de Valk, H., Weerdesteyn, V., & Geurts, A. C. H. (2013). Clinical measures are feasible and sensitive to assess balance and gait capacities in older persons with mild to moderate Intellectual Disabilities. Research in developmental disabilities, 34 (1), 276–285. doi: 10.1016/j.ridd.2012.08.014
36. Waninge, A., van Wijck, R., Steenbergen, B., & van der Schans, C. P. (2011). Feasibility and reliability of the modified Berg Balance Scale in persons with severe intellectual and visual disabilities. Journal of Intellectual Disability Research, 55(3), 292-301. doi: 10.1111/j.1365-2788.2010.01358.x
37. Waninge, A., Rook, R. A., Dijkhuizen, A., Gielen, E., & van der Schans, C. P. (2011b). Feasibility, test-retest reliability, and interrater reliability of the Modified Ashworth Scale and Modified Tardieu Scale in persons with profound intellectual and multiple disabilities. Research in Developmental Disabilities, 32(2), 613-20. doi: 10.1016/j.ridd.2010.12.013
38. Bland, J. M., & Altman, D. G. (1986). Statistical methods for assessing agreement between two methods of clinical measurement. The Lancet, 8, 307-310
39. Lee, J., Koh, D., & Ong, C. N. (1989). Statistical evaluation of agreement between two methods for measuring a quantitative variable. Computers in Biology and Medicine, 19(1), 61-70. doi: 10.1016/0010-4825(89)90036-x
40. Portney, L. G., & Watkins, M. P. (2000). Foundations of clinical research (2nd edition). Upper Saddle River, Prentice-Hall Inc, New Jersey
41. Cohen, J. (1988). Statistical power analysis for the behavioral sciences (2nd edition). Lawrence Erlbaum, Mahwah


Chapter 7
General Discussion

Chapter 7
124
General DiscussionReference valuesGenerally, muscle strength values are compared with reference values without
taking ethnic, geographic, or cultural backgrounds into consideration. Reference
values used in the Netherlands for adults are based on populations in the USA
obtained 20 years ago. Reference values for children based on a Dutch population
are also 20 years old. In Chapter 2 and Chapter 3, reference values for muscle
strength for the Dutch adult population between 20 and 60 years of age and
for children between 8 and 18 years of age were generated using a hand-held
dynamometer. The obtained values of were stratified by age and gender and were
compared with those of the earlier Dutch and USA values.
AdultsMuscle strength was influenced by several participant characteristics. Regression
analyses indicated that weight, height, and male gender had a positive effect on
strength while increasing age and female gender had a negative effect; these
effects have also been found in other studies (1,2). The predictive value of the
characteristics was moderate to low. The comparison of muscle strength values
found in this thesis and those of the USA (2) revealed significant differences
between the two populations. The USA values were generally higher for the lower
extremity compared to the Dutch values for males and females. For males, values
for the upper extremity were similar between both groups, however, for Dutch
females, they were higher except for shoulder abduction. While reliability of the
measurements was excellent, the limits of agreements (LOA) were substantial and
intensified with increasing strength.
ChildrenSimilar to adults, muscle strength in children was also influenced by weight,
height, age, and gender as was found previously (1,2,3,4,5,6). Boys become stronger
than girls from 15 years of age, similar to what was found in other studies (5,6).
Particularly height had a strong effect on elbow flexion strength whereas weight
had a strong effect on knee flexion and extension strength. The predictive value
of the characteristics was moderate. In an earlier study in Dutch children, (6) higher

General Discussion
125
7
values were determined for 29 of the 72 outcomes while, in an earlier study in
Chilean children, (5) lower values were found for all ages. Similar to the results of
adults, measurements were reliable but LOA were quite substantial. The results of
Chapters 2 and 3 showed that reference values for muscle strength for adults and
children are region and time specific and should therefore be updated regularly
within specific geographical areas. Differences between the prior Dutch study (6) and the current study may be explained by less active lifestyles in the last 20
years (7,8). Differences between the Chilean and current study can be explained by
a substantially higher weight in the Dutch children.
The Q ForceIn Chapter 4, a new mobile instrument for measurement of the isometric
Quadriceps muscle was introduced, i.e., the Q Force. It was developed as an
alternative for non-mobile instrument-held, dynamometers and mobile hand-held
dynamometers. The objective was to develop a mobile instrument with improved
precision compared to existing instruments. It was designed to measure isometric
Quadriceps muscle strength in various degrees of extension and provides
numeral and graphic information about the generated strength and course of
the contraction. Measurements were reliable, however, the LOA were relatively
large. Measurements on the second day resulted in higher values than those on
the first day. Such an increase was also found in measurements performed with
instrument held dynamometers, suggesting a learning effect of the participants (9,10,11). The reliability of the Q Force was comparable with that of other instruments;
however, the weight and size of the Q Force limit its mobile applicability.
Repeated Quadriceps muscle strength measurements in older adultsIn Chapter 5, the effects of repeated muscle strength measurements were studied
in older adults. No significant effect for repetitions within days or between days
was found except for Quadriceps muscle strength (right side) between day
1 and day 3. Learning effects that were determined in Chapter 5 could not be
confirmed statistically. However, for the right leg, small, insignificant increases
in strength were ascertained between repetitions and between days. Hence, a
small learning effect might be present that could probably not be detected due

Chapter 7
126
to measurement variation. The outcomes of the left leg were fairly constant.
This left/right difference cannot be explained satisfactorily. Since the majority
of the people is right dominant, this learning effect can possibly be attributed to
improved coordination. A future study in a larger sample of older persons might
demonstrate a learning effect more clearly. The current findings, however, indicate
that a single measurement is sufficient for quantifying muscle strength groups for
older adults.
Quadriceps muscle strength measurements in adults with moderate or severe intellectual and visual disabilitiesIn Chapter 6, the feasibility, learning period, and reliability of three tests, the
Minimum Sit to Stand Test (MSST), Leg Extension Test (LET) and 30 Seconds Sit
to Stand Test (30sCST), was studied in subjects with severe intellectual and visual
disabilities (SIVD). All tests were feasible, the learning period was 0 to 5 weeks, and
reliability was excellent. Correlations between the tests were moderate indicating
that each test measured a different construct. Additionally, in this study, a learning
effect was present. The learning period up to 5 weeks and was considerably longer
than the 1 to 2 weeks found in the study of Chapters 4 and 5 but can possibly
be explained by the intellectual and motoric capacities of the tested population.
The results indicate that simple strength measurements are possible and reliable
in adults with severe intellectual and visual disabilities. The LOA were moderate
and varied between 6.7% of the measured value for the MSST and 17.0% for the
30sCST.
Reliability of strength measurementsOverall, the previous chapters showed that muscle strength can be measured
reliably on a group level. The explained variance of the regression analyses ranged
from 25-66% indicating that additional factors other than age, gender, weight,
and height play a role in statistically predicting muscle strength, for example, the
degree of physical activity during the day and the type of sport and/or hobby.
These factors might cause measurement variation since substantial LOA’s were
found in all studies. A variation in measurement results may be attributed to
variation in coordination or fatigue of the tested subject, fear of maximal effort,
learning effects, or variation of the tester in conducting the tests (12,13,14). The results

General Discussion
127
7
of Chapters 4 and 6 and, to a much lesser extent, Chapter 5, suggest a learning
effect. Taking the above into account, for a precise estimate of muscle strength
measurements on an individual level, they should be performed 3 times.
Strength and activities of daily lifeReference values allow clinicians to make informed decisions based on the
comparison. When an individual strength falls within the range of normal strength,
it might be assumed that this strength is sufficient for executing normal functions
at an acceptable level. To quickly determine if an individual’s strength falls within
the normal range and based on our studies, the app “MuscleNorm” has been
developed.
Figure1, MuscleNorm
In the app, the independent variables can be can be entered in the home screen,
the measured muscle can be selected, and the acquired values can be entered.
The app provides a graphic representation of the acquired value compared to
the mean predicted values and the 95% CI of the Dutch and/or USA reference
values. The app is available in the Google Play and Apple App store. It is possible,
however, that an individual with normal muscle strength perceives limitations in
activities of daily life. Bodyweight, coordination, endurance, or the desired level of

Chapter 7
128
activities may limit the performance of these activities in daily life. Hence, solely
taking muscle strength measurements does not provide sufficient information to
translate these simply into performance of activities of daily life. Functional tests
closely resembling movements executed during activities of daily living, such
as the 1-minute sit to stand test, may provide additional insight into functional
capacity. Additionally, a Functional Capacity Evaluation which that a battery of
tests, observations, and practical activities to evaluate an individual’s physical
ability to function in different areas may provide insight into the performance of
activities in daily life. Additionally, questionnaires can be used to gain insight into
perceived functional limitations. It is therefore recommended that physiotherapists
combine tests with functional tests and questionnaires in their assessment of
muscle strength.
Strength, weight, and functionMuscle strength, as already mentioned, cannot be translated directly into the
daily functioning of individuals since daily functioning is at least partly dependent
on body weight. Body weight is particularly important since it has increased
considerably in the Western world in the last decades. (8,9,10,11) Individuals with
the same Quadriceps muscle strength but with a different bodyweight may have
dissimilar functional capacity and may not even be able to perform the same
tasks. Maximum oxygen uptake (VO2 max) does take bodyweight into account as
it is expressed in milliliters per minute per kilogram uptake. This method provides
a more accurate representation of the capacity to perform activities in daily life
or sports as it relates to the uptake capacity to the bodyweight of the individual.
An indicator that takes strength and bodyweight into account seems a step forward
in determining the functionality of the available strength. A simple strength to
weight ratio relating Quadriceps muscle strength in Newton to bodyweight in kg
may provide such a type of information and is expressed as (15,16,17) in
terms of Newton strength per Kilogram bodyweight. Further research may focus
on this ratio to determine its usefulness in clinical decision making.
Strength and endurance This thesis focused on measuring maximal isometric strength. The majority of
activities of daily life require only a limited percentage of maximum available

General Discussion
129
7
strength, however, that amount must be repeatedly available. For example, for a
half hour of brisk walking, an individual takes about 3500 steps which means that
the muscles involved have to contract 3500 times, i.e., approximately two times
per second. This number of contractions requires muscular endurance. It might
be assumed that, if muscle strength is sufficient, then muscle endurance might
also be sufficient and, when muscle strength is reduced, then endurance will also
be reduced. However, muscle strength and muscle endurance do not decrease to
the same extent (18). Thus, muscle endurance may decrease unnoticed, resulting in
unexpected limited activities of daily life. It is therefore recommended to measure
both muscle strength and muscle endurance in frail people or subjects that have
limitations in activities of daily life.
Monitoring muscle strength In this thesis, muscle strength measurements were performed at a specific point
in time. Muscle strength is generally measured at the beginning and end of a
rehabilitation program to evaluate changes over time. With advancing age or in the
presence of a chronic disease monitoring, muscle strength is also important since
it may decline over time. Decreased muscle strength and endurance are directly
and strongly related to a reduction in activities of daily life and an increase in
falls (19,20,21). Several other health related factors are monitored regularly over time
such as blood pressure or bodyweight which are both predictors of cardiovascular
diseases, diabetes, and mortality. Considering this, muscle strength and endurance
should be monitored regularly over time also in older persons or the chronically ill.
Implications Clinically, muscle strength measurements begin with an assumed muscle
weakness in a patient based on patient history, questioning of the patient, clinical
intuition, and experience. Based on the previous, a hypothesis is subsequently
formulated. Physical testing confirms or rejects this hypothesis. The advantage
of an instrumental muscle strength measurement is that it provides objective
evidence and quantification of strength. Muscle strength measurements involve
two persons: the tester and the tested. Performing a clinical measurement involves
mastering the practical skill. The skills of muscle strength measurements using a
hand-held dynamometer is practiced sufficiently during the physiotherapy study.

Chapter 7
130
Starting professionals are therefore technically able to measure muscle strength
using a hand-held dynamometer. However, attention should also be paid to the
quality of the measurement and factors influencing the measurement outcome.
Was the contraction maximal? Was the measurement break or make performed
correctly without compensation of the participant? Additionally, it should be
evaluated whether the observed range of outcomes of repeated measurements
is in accordance with the expectation. If the range of outcomes in repeated
measurements is too wide, the measurement should be repeated with sufficient
recovery time between repetitions or at another measurement day in order to
prevent fatigue. Further, measurement results should be put into perspective, not
merely an evaluation relative to reference values but also with regard to perceived
limitations in activities of daily life. Taking these factors into account will help to
interpret outcomes of muscle strength measurements.
Living databasesReference values, as generated in this thesis, are utilized in databases for
comparison of outcomes of individual muscle strength measurements. These
reference values are often used for years. The values found in Chapters 2 and 3
differed from those that were previously determined suggesting that reference
values are valid for a certain period of time in a certain region. These values should
therefore be regularly adjusted on the basis of new measurements, so called
“living databases”. These databases should be updated with anthropometric data
and values obtained from measurements at work, in health monitoring projects
in adults, in movement programs for older persons, and in school health projects
for children. Statistical programs can continuously process the newly added
values in the database. In this way, reference values become a valid reflection of a
population in a certain time period.
Methodological considerationsIn this thesis, convenience sampling was applied, and samples were small relative
to the populations for which they were intended, possibly inducing some selection
bias. Therefore, the outcomes of the studies may not be representative for the
intended populations. However, the populations contributing to the references
values were drawn from different socio-economic backgrounds in the Netherlands,

General Discussion
131
7
both urban and rural. Reliability coefficients of the studies were similar to those
of other studies. We therefore assume no systematic deviations in the measured
values are present, and the reference values found in this thesis can be used
clinically (1,2,3,4). A comparison of strength values of this thesis with other studies is
difficult since strength, as shown, is time and region specific. Additionally, lifestyle,
activity levels, and body mass index change over time and differ per region (8).
The distribution of strength across age groups and the effects of age, gender,
height, and weight on strength are similar to other studies (1,2,3,4). Hence, strength
is time and region specific but characteristics of participants to predict strength
are similar.
Another factor that might have influenced the outcomes in Chapters 2 and 3
is the substantial number of physiotherapy students that acted as observers.
Several studies indicated that strength and weight of the observer and experience
of participant influence the outcomes of measurements (45,47). The large
number of observers and variation in strength and weight may have led to an
increase in measurement variation. Despite this variation, it is possible that an
underestimation of one observer might be compensated by an overestimation
of another observer and lead to a correct estimate of a group mean. Based on
the outcomes of this thesis, in particular the distribution of strength over the age
groups and similar influence of factors associated with strength, it is most likely
that the reference values presented are a valid reflection of the population for
which they are intended. The results of the studies can be used in clinical practice
because of the above.
In Chapter 4 and Chapter 5, a small convenience sample of healthy older adults
participated. Although a clear learning effect was found in Chapter 4 and not
in Chapter 5, it is unclear to what extent those results can be generalized to
populations other than the tested participants, e.g. older adults with a chronic
disease. It is plausible that learning effects differ between such sub-populations.
In Chapter 6, the feasibility, learning period, and reliability of three tests was
studied in a small sample of adults with severe intellectual and visual disabilities.
All tests proved to be feasible with an acceptable learning period and a sufficient
test retest reliability. However, results can be generalized to a limited extent
considering the small sample and the selection of participants. Confirming the

Chapter 7
132
results by comparing these with similar studies is not possible since this is the
first study to explore the feasibility and reliability of strength measurements for
persons with SIVD. Future studies with a larger sample should confirm the findings
of Chapter 6.
ConclusionsMuscle strength differs between regions and changes over time within the
same region when these are based on physical activity level, type of physical
activity, and food intake. Muscle strength can be measured reliably in different
populations, however, the LOA are substantial. Consequently, strength should
change considerably in order to be determined which causes decision making on
an individual level to become uncertain with respect to smaller differences.
Recommendations for further researchFuture research should focus on improving measurement precision by improving
protocols and/or observer quality, for example, by determining the influence of
skill or strength training of the observer on measurement variation; developing
a strength-to-bodyweight index for frail people and subjects with limitations in
activities of daily life; and developing early detection methods such as population
studies and screening programs to early detect decreased muscle strength.

General Discussion
133
7
References1. Bohannon, R. W. (1997) Reference values for extremity muscle strength obtained by
hand-held dynamometry from adults aged 20 to 79 years. Archives of Physical Medicine and Rehabilitation, 78(1), 26–32. https://doi.org/10.1016/s0003-9993(97)90005-8.
2. Andrews, A. W., Thomas, M. W., & Bohannon, R. W. (1996). Normative Values for Isometric Muscle Force Measurements Obtained With Hand-held Dynamometers. Physical Therapy, 76(3), 248–259. https://doi.org/10.1093/ptj/76.3.248
3. Eek, M. N., Kroksmark, A.K., & Beckung, E. (2006). Isometric Muscle Torque in Children 5 to 15 Years of Age: Normative Data. Archives of Physical Medicine and Rehabilitation, 87(8), 1091–1099. https://doi.org/10.1016/j.apmr.2006.05.012.
4. Macfarlane, T. S., Larson, C. A., & Stiller, C. (2008). Lower Extremity Muscle Strength in 6- to 8-Year-Old Children Using Hand-Held Dynamometry. Pediatric Physical Therapy, 20(2), 128–136. https://doi.org/10.1097/pep.0b013e318172432d
5. Escobar, R. G., Munoz, K. T., Dominguez, A., Banados, P., & Bravo, M. J. (2016). Maximal isometric muscle strength values obtained By handheld dynamometry in children between 6 and 15 years of age. Muscle & Nerve, 55(1), 16–22. https://doi.org/10.1002/mus.25180.
6. Beenhakker, E. A. C., van der Hoeven, J. H., Fock, J. M., & Maurits, N. M. (2001). Reference values of maximum isometric muscle force obtained in 270 children aged 4–16 years by hand-held dynamometry. Neuromuscular Disorders, 11(5), 441–446. https://doi.org/10.1016/s0960-8966(01)00193-6.
7. Al Hazzaa, H.M. (2004). Prevalence of physical inactivity in Saudi Arabia: a brief review. EMHJ - Eastern Mediterranean Health Journal, 10 (4-5), 663-670. https://apps.who.int/iris/handle/10665/119465
8. Schönbeck, Y., Talma, H., van Dommelen, P., Bakker, B., Buitendijk, S. E., HiraSing, R. A., & van Buuren, S. (2011). Increase in Prevalence of Overweight in Dutch Children and Adolescents: A Comparison of Nationwide Growth Studies in 1980, 1997 and 2009. PLoS ONE, 6(11), e27608. https://doi.org/10.1371/journal.pone.0027608.
9. World Health Organisation. (2020) Obesity and overweight. https://www.who.int/news-room/fact-sheets/detail/obesity-and-overweight
10. World Health Organization. (2021). Data and statistics. https://www.euro.who.int/en/health-topics/noncommunicable-diseases/obesity/data-and-statistics
11. Ogden, C. L., Carroll, M. D., Kit, B. K., & Flegal, K. M. (2012). Prevalence of Obesity and Trends in Body Mass Index Among US Children and Adolescents, 1999–2010. JAMA, 307(5), 483. https://doi.org/10.1001/jama.2012.40
12 . Kienbacher, T., Kollmitzer, J., Anders, P., Habenicht, R., Starek, C., Wolf, M., Paul, B., Mair, P., & Ebenbichler, G. (2016). Age-related test-retest reliability of isometric trunk torque measurements in patiens with chronic low back pain. Journal of Rehabilitation Medicine, 48(10), 893–902. https://doi.org/10.2340/16501977-2164
13. Ritti-Dias, R. M., Basyches, M., Câmara, L., Puech-Leao, P., Battistella, L., & Wolosker, N. (2010). Test-retest reliability of isokinetic strength and endurance tests in patients with intermittent claudication. Vascular Medicine, 15(4), 275–278. https://doi.org/10.1177/1358863x10371415

Chapter 7
134
14. Scott, D. A., Bond, E. Q., Sisto, S. A., & Nadler, S. F. (2004). The intra- and interrater reliability of hip muscle strength assessments using a handheld versus a portable dynamometer anchoring station. Archives of Physical Medicine and Rehabilitation, 85(4), 598–603. https://doi.org/10.1016/j.apmr.2003.07.013.
15. Stone, C. A., Nolan, B., Lawlor, P. G., & Kenny, R. A. (2011). Hand-held dynamometry: tester strength is paramount, even in frail populations. Journal of Rehabilitation Medicine, 43(9), 808–811. https://doi.org/10.2340/16501977-0860
16. Wikholm, J. B., & Bohannon, R. W. (1991). Hand-held Dynamometer Measurements: Tester Strength Makes a Difference. Journal of Orthopaedic & Sports Physical Therapy, 13(4), 191–198. https://doi.org/10.2519/jospt.1991.13.4.191
17. Jenkins, N. D. M., & Cramer, J. T. (2017). Reliability and Minimum Detectable Change for Common Clinical Physical Function Tests in Sarcopenic Men and Women. Journal of the American Geriatrics Society, 65(4), 839–846. https://doi.org/10.1111/jgs.14769.
18. Barbat-Artigas, S., Rolland, Y., Cesari, M., Abellan van Kan, G., Vellas, B., & Aubertin-Leheudre, M. (2012). Clinical Relevance of Different Muscle Strength Indexes and Functional Impairment in Women Aged 75 Years and Older. The Journals of Gerontology Series A: Biological Sciences and Medical Sciences, 68(7), 811–819. https://doi.org/10.1093/gerona/gls254
19. Ryder, J. W., Buxton, R. E., Goetchius, E., Scott-Pandorf, M., Hackney, K. J., Fiedler, J., Ploutz-Snyder, R. J., Bloomberg, J. J., & Ploutz-Snyder, L. L. (2012). Influence of muscle strength to weight ratio on functional task performance. European Journal of Applied Physiology, 113(4), 911–921. https://doi.org/10.1007/s00421-012-2500-z
20. Newman, A. B., Kupelian, V., Visser, M., Simonsick, E. M., Goodpaster, B. H., Kritchevsky, S. B., Tylavsky, F. A., Rubin, S. M., & Harris, T. B. (2006). Strength, But Not Muscle Mass, Is Associated With Mortality in the Health, Aging and Body Composition Study Cohort. The Journals of Gerontology Series A: Biological Sciences and Medical Sciences, 61(1), 72–77. https://doi.org/10.1093/gerona/61.1.72
21. Hasan, N. A. K. A. K., Kamal, H. M., & Hussein, Z. A. (2016). Relation between body mass index percentile and muscle strength and endurance. Egyptian Journal of Medical Human Genetics, 17(4), 367–372. https://doi.org/10.1016/j.ejmhg.2016.01.002
22. Scott, D., Stuart, A. L., Kay, D., Ebeling, P. R., Nicholson, G., & Sanders, K. M. (2014). Investigating the predictive ability of gait speed and quadriceps strength for incident falls in community-dwelling older women at high risk of fracture. Archives of Gerontology and Geriatrics, 58(3), 308–313. https://doi.org/10.1016/j.archger.2013.11.004
23. Muehlbauer, T., Besemer, C., Wehrle, A., Gollhofer, A., & Granacher, U. (2012). Relationship between Strength, Power and Balance Performance in Seniors. Gerontology, 58(6), 504–512. https://doi.org/10.1159/000341614
24. Daubney, M. E., & Culham, E. G. (1999). Lower-Extremity Muscle Force and Balance Performance in Adults Aged 65 Years and Older. Physical Therapy, 79(12), 1177–1185. https://doi.org/10.1093/ptj/79.12.1177

General Discussion
135
7


Summary

Summary
138
SummaryMuscle strength is an important determinant for physical performance in activities
of daily living, work, or sports. To determine if strength of an individual is normal or
has decreased, obtained values can be compared to reference values. Reference
values used in the Netherlands, however, were either obtained 20 years ago or
were from the USA. It is not clear if these values can be used in clinical practice or
can be generalized to other populations. In general, the current protocols used
to determine strength apply 1 to 3 measurements on a single day. It is not clear
how precise these protocols estimate maximum muscle strength. For example,
protocols using more repetitions could lead to higher outcomes due to learning
effects or to lower values due to fatigue. Muscle strength can be reliably and
precisely measured using hand-held dynamometry but variations in measurement
results within a person are substantial. Mobile instruments reducing that variation
are needed. Strength can be reliably measured in different populations and
settings, however, it is unclear if strength measurements are feasible and reliable
in individuals with severe intellectual and visual disabilities. In Chapter 1, the
topics of research of this thesis are introduced and the objectives are described.
As already described above, reference values for adults used in the Netherlands
were obtained 20 years ago in the USA. It is not clear if these values can still be
utilized in clinical practice or generalized to the Dutch population. The objectives as
described in Chapter 2 were to first determine reference values for a population of
Dutch workers; second, to compare these values with those of a USA population;
and, third, to analyze and confirm the reliability of hand-held dynamometers for
isometric strength measurements. In total, 462 healthy working subjects (259 male,
203 female) were included. Their age ranged from 20 to 60 years with a mean (SD)
of 41 (11) years. Muscle strength values from elbow flexion and extension, knee
flexion and extension, and shoulder abduction were obtained using a MicroFet
2 hand-held dynamometer. The break method was applied and measurements
were repeated three times in a single occasion. Muscle strength expressed in
Newton, means (SD), and confidence intervals were determined for males and
females in age groups ranging from twenty to sixty years old. Regression equations
and explained variances were calculated from weight, height, gender, and age.
The mean values and 95% CI were compared to the results from other studies.
Reliability was analyzed by calculating the intraclass correlation coefficients (ICC)

Summary
139
and limits of agreement (LOA).
The explained variance of the regression analyses ranged from 0.25 to 0.51.
The comparison of muscle strength data of the Dutch population with that of
the USA revealed important differences. Males in the USA studies possess more
strength than those of the current study except for elbow flexion, dominant
and non-dominant, in which only the age group 50–59 years exhibited greater
values. Females in the USA studies exhibit less strength in elbow flexion and
extension than those in the current study with the exception of elbow extension,
non-dominant for age group 30 to 39 and 50 to 59 years. However, strength of
shoulder abduction, knee flexion and extension indicated greater values in the
USA studies, except for shoulder abduction of the non-dominant side in age group
20 to 29 years.
Reliability was excellent, and the ICCs ranged between 0.83 to 0.94. The LOA
were substantial and ranged from 37.3 to 117.8 Newton. Based on this study,
reference values and regressions equations were made available. It is concluded
that reference values differ between the Netherlands and the USA. Additionally,
regression equations can only partly predict muscle strength.
Reference values for children used in the Netherlands were also obtained 20 years
ago. It is not clear if these reference values can still be used in clinical practice. It is
also not clear whether reference values drawn from the Dutch population can be
generalized to other populations. The objectives as described in Chapter 3 were to
first determine reference values for a population of children and compare those
with previously Dutch reported values and recently reported Chilean values; and,
second, to statistically predict muscle strength from weight, height, gender, and
age. In total 1,252 subjects, 594 and 658 boys, mean (SD) age 13.0 (2.4) years,
were included. Muscle strength values from elbow flexion and extension, knee
flexion and extension, and shoulder abduction were obtained using a MicroFet 2
hand-held dynamometer. The break method was applied and each measurement
was repeated three times. Muscle strength was expressed in Newton, means (SD)
and 95% confidence intervals were calculated for boys and girls ranging from 8
to 17 years stratified by age. Regression equations and explained variances were
calculated from weight, height, gender, and age. The mean values and 95% CI
were compared to the results from previous studies. Reliability was analyzed by

Summary
140
calculating the ICCs and LOA.
The explained variance (R2 adjusted) of the regression analyses ranged from 0.46
to 0.66. Muscle strength in the current Dutch study was lower in 29 of the 72
comparisons in relation to the results of the prior Dutch study published in 2001.
Differences ranged from 1 Newton in elbow extension for females of 9 years of
age of age to 187 Newton for knee flexion in boys 16 years of age. Compared to
a Chilean study published in 2016, Dutch children were systematically stronger
in all age and muscle groups ranging from 15 Newtons in boys 11 years of age to
217 Newtons for knee extension in boys 15 years of age. Reliability was excellent,
and the ICC coefficients ranged from 0.80 and 0.95. The LOA were substantial and
ranged from 44 Newton for right elbow extension to 101 Newton for right knee
extension which corresponded with 21% and 36% of the mean measured values,
respectively. Based on this study, reference values and regressions equations
were made available. It is concluded that reference values differ in time and
between countries. Additionally, regression equations can only partly predict
muscle strength.
Strength can be measured reliably using mobile instruments. However, instruments
which are more precise are required to reduce the LOA. The Q Force is a new
and innovative mobile instrument for measurement of the isometric muscle. The
objective as described in Chapter 4 was to determine the test-retest reliability of
isometric Quadriceps muscle strength measurements using the Q Force in older
adults. In total, 41 healthy older adults, 13 males and 28 females with a mean (SD)
age 81.9 (4.89) years, were included. The isometric strength of the Quadriceps
muscle was assessed using the Q Force at 110 degrees knee extension utilizing 4
repetitions on two occasions with a three to eight day interval between occasions.
Muscle strength was expressed in Newton meters (Nm) means (SD). T-tests were
performed to determine differences between measurement days. Reliability was
analyzed by calculating the ICCs and LOA.
Reliability was excellent since ICC coefficients were higher than 0.75. The LOA for
the peak torque for the left side were -18.6 Nm to 33.8 Nm and for the right side
-9.2 Nm to 26.4 Nm. Small systematic and significant differences in means were
ascertained between measurement occasions. It is concluded that the Q Force has
an excellent test-retest reliability, however, the LOA are substantial. Since the Q

Summary
141
Force is relatively inexpensive and mobile, it is suitable for application in various
clinical settings, however, its capability to detect changes in muscle force over time
is limited but similar to existing instruments.
Current protocols used to determine strength generally apply 1 to 3 measurements
on a single measurement day. It is not clear how precise these protocols estimate
maximum muscle strength. The objectives as described in Chapter 5 were to analyze
the outcomes for older adults of repeated Quadriceps strength measurements by
using a handheld dynamometer. In total, 44 older adults, 14 male and 30 female,
participated. Mean (SD) age was 76.8 (7.4) years, mean (SD) bodyweight was 79.5
(12.8) kg, and body height was 167.3 (6.1) cm. Measurements were performed
using a MicroFet 2 hand-held dynamometer on four separate days with a 2-day
interval. The break method was used employing three consecutive repetitions
of the left and right Quadriceps muscles with a 1-minute break in between each
repetition. Muscle strength expressed in Newton, means (SD). A linear mixed-
effects model regression analysis was performed.
Analysis of the results revealed no significant effects for repetitions within days
or between days. The standard errors were similar between the left and right
sides, ranging from 3 to 13 Newton. It is concluded that a single measurement is
sufficient to quantify muscle strength groups for older adults.
It has been demonstrated that strength can be reliably measured for adults
and children in various settings. However, a feasible and reliable instrument
to measure strength in persons with severe intellectual and visual disabilities
(SIVD) is lacking. The objectives as described in Chapter 6 were to first determine
feasibility of strength measurements; second, to analyze the learning period;
thirdly, to determine reliability of three methods of muscle strength testing; and,
fourthly, to analyze concurrent validity. In total, 29 participants with SIVD were
included and performed the Minimum Sit-to-Stand Height Test (MSST), the Leg
Extension Test (LET), and the 30 seconds Chair-Stand Test (30sCST) once per
week for 5 weeks. Feasibility was determined by the percentage of successful
measurements; the learning period was analyzed using a paired T test between
two consecutive measurements; test-retest reliability was analyzed using the ICCs
and LOA; and concurrent validity was analyzed using Pearson correlations. Results
showed sufficient feasibility for all test methods. The learning period ranged from

Summary
142
no learning period for the LET to 4 weeks for the MSST. Test-retest reliability was
sufficient. Correlations between test methods was moderate to sufficient. It was
concluded that the MSST, the LET, and the 30sCST are feasible tests for measuring
muscle strength in persons with SIVD and have sufficient test retest reliability.
The main findings of this thesis, the relevance of strength measurements, and
the relevance for clinical practice are discussed in the general discussion (Chapter
7). The strengths and weaknesses of the studies are examined, and directions
for further research are provided. The primary conclusions of this thesis are that
muscle strength appears to be time and region specific and should be regularly
and regionally updated; the Q Force possesses comparable reliability and LOA
compared to existing instruments; repeated measurements do not lead to a more
precise estimate of muscle strength in older adults; and strength measurements
are feasible and reliable in individuals with severe intellectual and visual
impairment within an acceptable learning period.

Summary
143

Samenvatting
144
Samenvatting Spierkracht is belangrijk voor alle menselijke fysieke activiteiten, in het dagelijkse
leven, sport en hobby. Om vast te stellen of spierkracht van iemand normaal of
verlaagd is dient de gemeten kracht worden vergeleken met referentiewaarden.
Voor een juiste vergelijking behoren deze referentiewaarden te zijn verkregen uit
een groep mensen met vergelijkbare eigenschappen als de onderzochte persoon.
Het is niet zeker of de referentiewaarden die momenteel in Nederland gebruikt
worden wel bruikbaar zijn voor de klinische praktijk. Ook is het niet duidelijk of
referentiewaarden van 20 jaar geleden nog actueel en bruikbaar zijn voor de
klinische praktijk in Nederland.
Een veel gebruikte methode om spierkracht te meten is hand-dynamometrie.
Met een hand-dynamometer, een klein en daardoor mobiel apparaatje met een
krachtsensor er in, wordt de geleverde spierkracht geregistreerd.
Figuur 1, Een handdynamometer
Hand-dynamometrie is een betrouwbare methode om spierkracht binnen een
groep mensen te bepalen. Dat wil zeggen dat de uitkomsten van herhaalde
metingen dicht bij elkaar liggen. De mate van betrouwbaarheid op groepsniveau
wordt uitgedrukt in een intraclass correlatiecoëfficiënt (ICC), waarbij 0 betekent dat
er geen betrouwbaarheid is en 1 betekent een maximale betrouwbaarheid (geen
variatie in resultaten bij herhaalde metingen). Hand-dynamometrie toegepast
om spierkracht te meten binnen 1 persoon is minder betrouwbaar omdat de
variatie in meetresultaten aanzienlijk is. Meetvariatie wordt uitgedrukt in de “
limits of agreement” (LOA). Voor spierkracht bepalingen op individueel niveau is
Samenvatting
145
er een behoefte aan meetinstrumenten die mobiel zijn en tevens een kleine intra
individuele variatie met zich mee brengen. Wanneer spierkracht worden gemeten,
door bijvoorbeeld een fysiotherapeut, dan bestaat het gebruikte protocol in de
meeste gevallen uit drie herhalingen die achtereen worden uitgevoerd, met 1
minuut pauze tussen de herhalingen. Het is echter niet duidelijk of dit protocol tot
een betrouwbare schatting leidt.
Over het algemeen kan spierkracht op groepsniveau betrouwbaar worden gemeten
bij gezonde individuen en bij individuen met aandoeningen in verschillende
settingen. Het is echter niet bekend of spierkracht betrouwbaar gemeten kan
worden bij personen die minder goed instrueerbaar zijn bijvoorbeeld met ernstige
intellectuele en visuele beperkingen.
In hoofdstuk 1 worden de onderzoeksthema’s van dit proefschrift geïntroduceerd
en worden de doelstellingen beschreven.
Zoals hierboven al beschreven zijn de referentiewaarden die in Nederland worden
gebruikt, enerzijds 20 jaar oud of gebaseerd op een populatie uit de VS. Het is
niet duidelijk of deze waarden nog steeds kunnen worden gebruikt in de klinische
praktijk of dat het mogelijk is de referentie waarden uit de VS te bruikbaar zijn
voor de Nederlandse populatie. De doelstellingen van de studie zoals beschreven
in hoofdstuk 2 waren, ten eerste; referentiewaarden voor werkende volwassenen
in Nederland bepalen, ten tweede; onderzoeken of de referentiewaarden uit
de VS overeenkomen met de huidige Nederlandse populatie, ten derde; de
betrouwbaarheid van krachtmetingen met behulp van hand-dynamometrie in de
onderzoekspopulatie te herbevestigen.
In totaal werden 462 gezonde werkende volwassenen onderzocht (259 mannen,
203 vrouwen). De spierkracht van de grote arm en beenspieren werd onderzocht
met een handdynamometer. De spierkracht werd uitgedrukt in Newton (N) met
3 herhalingen op 1 dag. De uitkomsten van de metingen van onze studie werden
vergeleken met die uit studies uit de VS. Daarnaast werd met behulp van ICC en
LOA geanalyseerd wat de betrouwbaarheid van en de variatie in meetresultaten
was
Op basis van de verrichte metingen zijn de referentiewaarden voor Nederlands
vastgesteld. Vergelijking van spierkrachtgegevens van onze studie met die van
Samenvatting
146
de VS bracht belangrijke verschillen aan het licht. Mannen in de studie uit de VS
waren over het algemeen sterker dan de mannen uit Nederland terwijl vrouwen
uit die studie VS over het algemeen minder sterk waren dan de vrouwen uit onze
studie. De betrouwbaarheid van de metingen was met ICC’s tussen 0,83 en 0,95
uitstekend. De intra-individuele variatie van de meetresultaten van varieerde
tussen 32 N (schouder abductie) en 117 N (knie extensie), hetgeen overeen komt
met 18 tot 31% van de gemeten kracht. Geconcludeerd werd dat spierkracht
regionaal/ nationaal bepaald is, referentiewaarden uit verschillende landen niet
onderling uitwisselbaar zijn en dat betrouwbaarheid van spierkrachtmetingen
goed is, maar de variatie binnen een persoon aanzienlijk is.
De referentiewaarden die in Nederland gebruikt worden om spierkracht van
kinderen mee te vergelijken zijn nu 20 jaar oud. Het is niet bekend of deze waarden
nu nog gebruikt kunnen worden in de klinische praktijk ook is niet bekend of de
nationale verschillen, gevonden bij volwassenen, ook aanwezig zijn bij kinderen.
De doelstellingen van de studie zoals beschreven hoofdstuk 3 waren ten eerste;
referentiewaarden voor spierkracht voor kinderen in Nederland bepalen,
ten tweede; de gevonden waarden vergelijken met eerder gerapporteerde
Nederlandse - en recent gerapporteerd Chileense referentiereferentiewaarden,
ten derde; de spierkracht statistisch te voorspellen op basis van leeftijd, lengte,
gewicht en geslacht.
In totaal werd de spierkracht van de grote arm en beenspieren van 1.252 kinderen,
594 meisjes en 658 jongens, variërend van 8 tot 18 jaar met behulp van de hand-
dynamometer onderzocht. De spierkracht werd gemeten met drie herhalingen op
1 dag en de spierkracht werd uitgedrukt in Newton.
Uit de analyses bleek dat de spierkracht van kinderen uit de huidige studie in 29
van 72 vergelijkingen statistisch significant lager was dan die uit de studie van 20
jaar geleden. Dit verschil op tot 187 N voor knie extensie voor jongens van 16 jaar.
In vergelijking met een Chileense studie uit 2016 bleken de Nederlandse kinderen
systematisch sterker in alle leeftijdsgroepen voor alle gemeten spiergroepen. De
verschillen liepen op tot meer dan 30% van de gemeten waarde bij jongens van
15 jaar. De betrouwbaarheid van de metingen was met ICC’s tussen 0,80 en 0,95
ook hier uitstekend, maar ook hier bleek de intra individuele variatie aanzienlijk,
variërend 44 N (elleboog extensie rechts) tot 101 N (knie extensie rechts) wat
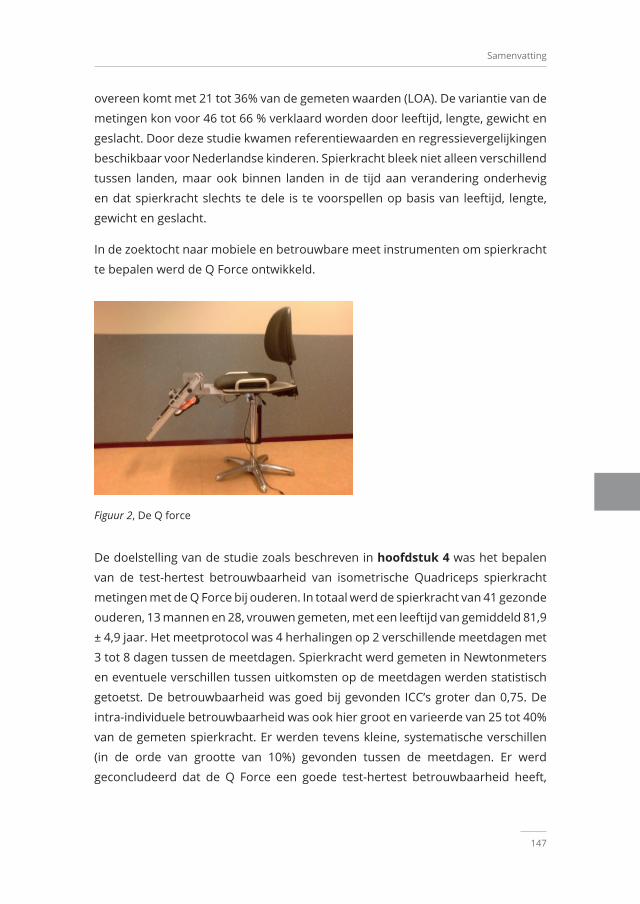
Samenvatting
147
overeen komt met 21 tot 36% van de gemeten waarden (LOA). De variantie van de
metingen kon voor 46 tot 66 % verklaard worden door leeftijd, lengte, gewicht en
geslacht. Door deze studie kwamen referentiewaarden en regressievergelijkingen
beschikbaar voor Nederlandse kinderen. Spierkracht bleek niet alleen verschillend
tussen landen, maar ook binnen landen in de tijd aan verandering onderhevig
en dat spierkracht slechts te dele is te voorspellen op basis van leeftijd, lengte,
gewicht en geslacht.
In de zoektocht naar mobiele en betrouwbare meet instrumenten om spierkracht
te bepalen werd de Q Force ontwikkeld.
Figuur 2, De Q force
De doelstelling van de studie zoals beschreven in hoofdstuk 4 was het bepalen
van de test-hertest betrouwbaarheid van isometrische Quadriceps spierkracht
metingen met de Q Force bij ouderen. In totaal werd de spierkracht van 41 gezonde
ouderen, 13 mannen en 28, vrouwen gemeten, met een leeftijd van gemiddeld 81,9
± 4,9 jaar. Het meetprotocol was 4 herhalingen op 2 verschillende meetdagen met
3 tot 8 dagen tussen de meetdagen. Spierkracht werd gemeten in Newtonmeters
en eventuele verschillen tussen uitkomsten op de meetdagen werden statistisch
getoetst. De betrouwbaarheid was goed bij gevonden ICC’s groter dan 0,75. De
intra-individuele betrouwbaarheid was ook hier groot en varieerde van 25 tot 40%
van de gemeten spierkracht. Er werden tevens kleine, systematische verschillen
(in de orde van grootte van 10%) gevonden tussen de meetdagen. Er werd
geconcludeerd dat de Q Force een goede test-hertest betrouwbaarheid heeft,

Samenvatting
148
maar dat ook hier weer de intra-individuele variatie aanzienlijk was. Omdat de
Q Force relatief goedkoop is lijkt deze geschikt voor toepassing in verschillende
klinische omgevingen. Het vermogen om veranderingen in spierkracht binnen een
individu in de loop van de tijd te detecteren is beperkt, maar dit is vergelijkbaar
met andere bestaande meetinstrumenten.
Zoals reeds beschreven bestaan protocollen die in de klinische praktijk gebruikt
worden om spierkracht te meten meestal uit 3 herhalingen op 1 meetdag. Het
is echter niet duidelijk hoe nauwkeurig deze protocollen zijn om de maximale
spierkracht te bepalen. Meetprotocollen met meer herhalingen zouden tot hogere
meetresultaten kunnen leiden door leereffecten, maar ook tot lagere resultaten
door vermoeidheid. De doelstelling zoals beschreven in hoofdstuk 5 was het
analyseren van de resultaten van herhaalde Quadriceps krachtmetingen bij
ouderen met behulp van een handheld dynamometer.
In totaal werden 44 ouderen, 14 mannen en 30 vrouwen onderzocht met
eengemiddelde (sd)leeftijd van 76,8 (7,4) jaar. De Quadricepskracht werd
onderzocht met 3 opeenvolgende herhalingen, op 4 afzonderlijke dagen met
een interval van 2 dagen. In de statistisch analyse werd een regressieanalyse
verricht. Daarnaast werd geanalyseerd of er een binnen meetdag effecten en of
een tussen meetdag effecten waren. Er bleken geen significante verschillen te zijn
binnen of tussen meetdagen. De standaard meetfouten waren links en rechts
vergelijkbaar en varieerden van 3 tot 13 N. Er werd geconcludeerd dat een enkele
meting voldoende is om spierkracht van de Quadriceps van oudere volwassenen
te bepalen op groepsniveau.
Kracht kan, zoals uit het bovenstaande al blijkt, betrouwbaar worden gemeten
bij volwassenen en kinderen in verschillende settingen. Spierkracht is ook
betrouwbaar te meten bij patiëntengroepen met diverse (chronische) pathologiën.
Het is echter niet duidelijk of spierkracht metingen haalbaar zijn en of deze
betrouwbaar zijn bij mensen met een ernstige intellectuele of visuele beperking
(EIVB). De doelstellingen zoals beschreven in hoofdstuk 6 waren, ten eerste; om
de haalbaarheid van krachtmetingen te bepalen bij mensen met EIVB, ten tweede;
de leerperiode hiervan te analyseren, ten derde; de betrouwbaarheid van drie
methoden voor spierkrachttesten te bepalen en ten vierde; te vergelijken in
hoeverre de testen dezelfde theoretische eigenschap meten.

Samenvatting
149
In totaal werden 29 mensen met EIVB onderzocht. De volgende testen werden
uitgevoerd; de Minimale Zit-tot-Sta Hoogte test (MSST), de Leg Extension test
(LET) en de 30 seconden Chair-Stand Test (30sCST). De testen werden 1 keer per
week gedurende 5 weken uitgevoerd. De haalbaarheid werd bepaald door het
percentage succesvolle metingen te registreren. De leerperiode werd geanalyseerd
door de uitkomsten van twee opeenvolgende weken met elkaar te vergelijken. De
test-hertest betrouwbaarheid werd geanalyseerd met behulp van ICC en LOA. De
associaties tussen de testen werd geanalyseerd met behulp van Pearson correlaties
(aantoonbare verbanden). De leerbaarheid periode van de testen varieerde van
geen (LET) tot 4 weken (MSST). De test-hertest betrouwbaarheid, was goed: ICC’s
varieerden van 0,96 tot 0,99. De intra individuele variatie (LOA) was met 17% van
de gemeten waardes aanzienlijk. De associaties tussen de testmethoden waren
laag. Geconcludeerd werd, dat de MSST, de LET en de 30sCST haalbare tests zijn
voor het meten van spierkracht bij personen met de EIVB, met voldoende test-
hertest betrouwbaarheid, maar de testen meten ieder wat anders.
De belangrijkste bevindingen van dit proefschrift, de relevantie van
krachtmetingen voor de klinische praktijk, worden besproken in de algemene
discussie (Hoofdstuk7). Daarnaast worden de sterke en zwakke punten van
de studies besproken en suggesties voor verder onderzoek worden gegeven.
De belangrijkste conclusies van dit proefschrift zijn: spierkracht is tijd- en land
specifiek en moet regelmatig, regionaal worden bijgewerkt; de betrouwbaarheid
van de Q Force is vergelijkbaar aan die van andere instrumenten; herhaalde
metingen leiden niet tot een nauwkeurigere meting van spierkracht bij oudere
volwassenen; en krachtmetingen zijn haalbaar en betrouwbaar bij personen met
ernstige intellectuele en visuele beperking binnen een aanvaardbare leerperiode


Dankwoord

Dankwoord
152
DankwoordHet laatste woord.. Graag wil ik iedereen bedanken, die op wat voor manier dan
ook, betrokken is geweest bij het tot stand komen van dit proefschrift, alsmede
iedereen die me heeft bijgestaan in het voltooien van dit proefschrift. Zonder
iemand tekort te willen doen, zou ik graag een aantal mensen in het bijzonder
willen bedanken.
Allereerst wil ik mijn begeleiders bedanken, mijn 1e promotor Prof. dr. C.P. van der
Schans, mijn 2e promotor Prof. Dr. P.U Dijkstra en copromotor Dr. W.P. Krijnen;
Kees, Prof. Dr. C.P. van der Schans, mijn 1e promotor. Ik ben erg blij dat je bij mijn
promotie aanwezig kunt zijn, na een wel even moeilijke als bijzondere periode.
We gaan al lang terug: het AZG, UMCG, de ALA en ERS congressen, jouw zeilboot
Serendipity, de “moedige mannentocht” op de Noordzee met motorpech, terwijl de
wind wegviel en natuurlijk de mannenweekenden. Dank voor je professionaliteit
om de afgelopen jaren werk en privé te scheiden. Het heeft al met al wel wat
langer geduurd dan we aanvankelijk dachten. Ik herinner me nog op de dijk op
Schiermonnikoog ,ergens in 2012, dat je zei: ”Rob, misschien moet jij ook maar
gaan promoveren.” Je hebt je in de afgelopen jaren vast nog wel eens achter je oren
gekrabd vanwege die woorden. Dank voor je ideeën en inzichten met betrekking
tot de relevantie van het onderwerp van mijn proefschrift, je accurate feedback,
heldere inzichten, humor en ook geduld, ook in tijden dat ik privé het één en ander
te verwerken had. Zonder jou als mijn promotor en initiator was mijn promotie
niet mogelijk geweest. Het bleek uiteindelijk een grote uitdaging voor me. Een
metafoor voor mijn promotietraject wat ik samen met je heb afgelegd doet me
denken aan het liedje van the Beatles: a long and winding road.
Wim, Dr. W.P Krijnen, mijn copromotor, zonder jou was mijn promotie niet
mogelijk geweest. Vanaf het eerste begin was je bij hierbij betrokken. Jou
inzichten, feedback en strenge statistische blik zijn bijzonder waardevol geweest.
Je hebt me in- en rondgeleid in de wereld van de statistiek. Regelmatig heb je me
op het goede spoor gezet als ik van het pad was geraakt. Je commentaar in de
manuscripten was fantastisch prikkelend, zoet en impliciet en waar nodig expliciet
en ongezouten. Het zette me altijd aan het denken. Ik ben je dankbaar voor de
creatieve en accurate statistische oplossingen, alsmede de wijze waarop je mij de
afgelopen jaren begeleid hebt.

Dankwoord
153
Pieter, Prof. Dr. P.U. Dijkstra, mijn tweede promotor. Het is toch wel bijzonder,
twee promotores te hebben die ik al zo lang ken uit de AZG, UMCG tijd. Ook
wij delen passie voor zeilen en hebben hier menig gesprek over gehad. Onze
samenwerking en daarmee jou bijdrage had een zorgelijke oorzaak. Je hebt in
het laatste deel van dit traject weer wind in mijn zeilen geblazen waardoor de
boot weer vaart gegeven werd. Vanwege onverwachte, ontwikkelingen heb ik nu 2
promotores. Dank je wel, dat je de begeleiding over wilde nemen, toen dat nodig
was en dank voor de manier waarop je dit gedaan hebt.
Naast de begeleiders wil ik ook mijn mede auteurs bedanken. Annemarie
Dijkhuizen, je bent mijn maatje: persoonlijk, als docent en als auteur. Ik ben
er trots op dat ik in een artikel van jou als tweede auteur sta. Wat hebben we
nagedacht, geworsteld, gelachen en veel van elkaar geleerd. Ook de pijn in mijn
rug herinner ik me nog bij aanvang van de eerste studie in jou promotie periode.
Dank voor alles.
Geranda Slager, wat een organisatorisch talent heb je. Wat jij heb geregeld voor het
meten van spierkracht bij schoolkinderen, scholen en het meten van spierkracht
bij ouderen, is heel bijzonder. Ook jouw inbreng is van bijzonder belang geweest
in 3 van de manuscripten van mijn promotie traject.
Remko Soer: dank voor alle metingen die je hebt verricht en voor je feedback
ten behoeve van de referentiewaarden voor spierkracht bij volwassen. Zonder jou
was dit manuscript niet tot stand gekomen.
Michiel Reneman: ook jij bedankt voor je waardevolle bijdrage en het spiegelen in
het manuscript met betrekking tot het ontwikkelen voor referentiewaarden voor
spierkracht bij volwassenen.
Wybren Zijlstra en Ruben Regterschot: dank voor het feit dat ik kon aanschuiven
in een deel van een ZonMw project: de Q Force, bij Bewegingswetenschappen van
de Rijksuniversiteit Groningen. Dank voor jullie waardevolle feedback en bijdrage
aan het manuscript van de Q Force.
Geen enkel manuscript was mogelijk zonder bijdrage van alle mensen die zich
hebben willen laten meten. Zonder jullie zou er geen letter op papier staan en zou
er niets van de grond zijn gekomen. Leerlingen van basisschool het Karrepad, de
Borgmanschool, de Haydnschool, van het Winklerprins College en het Maartens

Dankwoord
154
College. Ook de moedige ouderen van de verzorgingstehuizen als de Ebbingepoort
en de Heymanstichting: hartelijk dank voor jullie moeite, moed en inspanningen.
Dank ook aan leidinggevenden van de scholen en instituten die ons de gelegenheid
hebben gegeven om de metingen te verrichten.
Hartelijk dank studenten, en ook collegae Fysiotherapie van de Hanzehogeschool
Groningen: Zonder jullie zou er geen Newton op de hand-dynamometer staan.
Met hele meutes zijn we naar de verschillende scholen gegaan. Met soms wel 30
of 40 mensen tegelijk. Wat een organisatie was het en wat een avontuur. Dank
voor alle inspanningen. Samen waren jullie goed voor bijna 50.000 spierkracht
metingen. Een vlotte rekensom leert dat jullie ongeveer 12.500.00 Newton aan
spierkracht hebben tegengehouden tijdens alle metingen.
Hartelijk dank ook Jan Peter Landsman, teamleider Fysiotherapie, voor je steeds
positieve inbreng tijdens het hele project. En ja, de rust komt. Dank iedereen van
de app groep “E……”; Ron, Paul, Marie, Egbert, Harrie, Tim, Roland. Dank voor
ruggensteun, feedback, relativering, flauwe grappen, klappen, inhoudelijk- en
zinloze discussies.
Hartelijk dank, Willem de Kok, voor het rotsvaste vertrouwen en de altijd positieve
feedback.
Hartelijk dank Bernarda Mulder voor je juiste woorden op het juiste moment.
Beatrijs……… terugkijkend op het vele werk, plezier, ontwikkeling en de lange
adem: het allerbelangrijkste is de liefde binnen ons gezin en met jou, met een
glas wijn, zitten aan het eind van de steiger. Rob-Jan, door er te zijn, heb je alles
voor mij deze jaren in perspectief gezet; wat een kerel ben je. Lizelot en Lucija;
ook jullie hebben bijgedragen aan het besef dat liefde binnen het gezin het
allerbelangrijkste is.

Dankwoord
155


Research Institute SHARE
Research Institute SHARE
158
Research Institute SHAREThis thesis is published within the Research Institute SHARE (Science in Healthy
Ageing and healthcaRE) of the University Medical Center Groningen / University
of Groningen.
Further information regarding the institute and its research can be obtained from
our internet site: http://www.share.umcg.nl/
More recent theses can be found in the list below.(supervisors are between brackets)
2021
Akbari F Chronic pain in the context of the lives of dyads; cognitions, behaviors, and well-
being
(prof M Hagedoorn, prof R Sanderman, dr M Dehghani)
Hepping AMGrip on recovery after paediatric forearm fractures
(prof SK Bulstra, prof JHB Geertzen, dr M Stevens)
Beijers LParsing the heterogeneity of major depression
(prof RA Schoevers, dr KJ Wardenaar, dr HM van Loo)
Köhler TC Providing color to the pharmacy technician; a new profession within the pharmacy
team
(prof ADC Jaarsma, dr M Westerman)

Research Institute SHARE
159
Bunk SFFrontal brain functioning and pain; possible underlying mechanisms of increased
pain responses in age- and dementia-related cognitive impairment
(prof SU Zuidema, dr M Kunz)
Bosáková LBreaking the cycle of poverty; routes to counteract intergenerational transmission
of socioeconomic health differences
(prof SA Reijneveld, prof A Madarasová-Gecková)
Vendeloo SN vanOptimizing learning environments and resident well-being in postgraduate
medical education
(prof PLP Brand, prof SK Bulstra, dr CCPM Verheyen)
Sampurna MTAImproving the management of hyperbilirubinemia in a limited-resource area
(prof AF Bos, dr CV Hulzebos, dr PH Dijk, dr R Etika)
Siswanto JERetinopathy of prematurity; how to prevent retinopathy of prematurity in preterm
infants in Indonesia?
(prof AF Bos, prof A Adisasmita, dr PH Dijk)
Kaper MSImproving communication in healthcare for patients with low health literacy;
building competencies of health professionals and shifting towards health literacy
friendly organizations
(prof SA Reijneveld, prof AF de Winter)
Research Institute SHARE
160
Schuurmans JPopulation-based expanded carrier screening reporting couple results only: a
mixed methods approach
(prof IM van Langen, prof AM Lucassen, prof AV Ranchor, dr M Plantinga)
Vrijsen JTowards dementia risk reduction among individuals with a parental family history
of dementia
(dr N Smidt, prof SEJA de Rooij)
Dams ACAchilles tendon rupture; current clinical practice, imaging and outcome
(prof RL Diercks, prof J Zwerver, dr I van den Akker-Scheek, dr I Reininga)
Buitenhuis AHIt takes two: the role of a non-smoking partner in a quit attempt; a look at dyadic
planning and daily interactions
(prof M Hagedoorn, dr MA Tuinman)
Minh AMental health, education and work in Canada, the Netherlands, and the United
States; a comparative, life course investigation
(prof U Bültmann, dr CB McLeod, prof SA Reijneveld, dr M Guhn)
Marcus-Varwijk AEPerspectives on health and health promotion in community-dwelling older people;
a mixed-methods study
(prof JPJ Slaets, prof AV Ranchor, dr CHM Smits, dr TLS Visscher)

Research Institute SHARE
161
Bochane MIUniform screening for atypical language development in Dutch child health care
(prof CP van der Schans, prof SA Reijneveld, dr MR Luinge)
For earlier theses visit our website

Clinical Muscle Strength Measurements: Reference Values And Reliability